Embed Size (px)
Citation preview

3Q21 Supplemental Slides1
John McCallionChief Financial Officer
1 These slides highlight information in MetLife, Inc.'s earnings release, quarterly financial supplement and other prior public disclosures.

2
Table of contents
Topic Page No.
Net income (loss) to adjusted earnings 3
Actuarial assumption review 4
Adjusted earnings, ex. notable items, by segment 5
Group Benefits mortality 6
Variable investment income (VII) 7
Direct expense ratio 9
Value of new business 10
Cash & capital 11
Appendix 12

3
Net income (loss) to adjusted earnings
3Q21
(post-tax) $ in millions $ per share1
Net Income (Loss) $1,521 $1.77
Less:
Net Investment Gains (Losses) (66) (0.08)
Net Derivative Gains (Losses) (172) (0.20)
Investment Hedge Adjustments (180) (0.21)
Actuarial Assumption Review (76) (0.09)
Other (47) (0.05)
Adjusted Earnings $2,062 $2.39
Less Notable Item: Actuarial Assumption Review (140) (0.16)
Adjusted Earnings ex. Notable Item $2,202 $2.56
1 The per share data for each item is calculated on a standalone basis and may not sum to the total.

4
($ in millions - post-tax) Adjusted Earnings
Non-Adjusted Earnings Net Income
Asia ($79) — ($79)
Latin America (2) — (2)
EMEA (6) 4 (2)
MetLife Holdings (53) (80) (133)
Total ($140) ($76) ($216)
Total per share1 ($0.16) ($0.09) ($0.25)
3Q21 Actuarial Assumption Review
Impact by Segment Highlights• U.S. mean reversion interest rate
unchanged at 2.75%
• No long-term impact from COVID-19 assumed for mortality
• MLH: Refined variable annuity lapse rate assumptions
• Asia: Lowered earned rate assumption in Japan
1 The per share data for each item is calculated on a standalone basis and may not sum to the total.

5
($ in millions - post-tax) 3Q21 3Q20 % Change
% Change (Constant Rate) Highlights1
Group Benefits $111 $392 (72%) - Underwriting Margins; + Volume Growth; + Expense Margins
Retirement and Income Solutions 784 490 60% + Investment Margins; + Underwriting Margins; + Volume Growth
Property & Casualty2 — 18
U.S. 895 900 (1%)
Asia 648 493 31% 31% + Investment Margins; + Volume Growth; - Underwriting Margins
Latin America 31 48 (35%) (38%) - Underwriting Margins; + Investment Margins; + Expense Margins; + Taxes
EMEA 100 83 20% 20% + Volume Growth; + Underwriting Margins
MetLife Holdings 659 388 70% + Investment Margins; - Underwriting Margins
Corporate & Other (131) (131) - Taxes; + Net Investment Income
Adjusted Earnings ex. Notable Items $2,202 $1,781 24% 23%
Adjusted EPS ex. Notable Items $2.56 $1.95 31% 31%
Adjusted earnings, ex. notable items, by segment
1 To be discussed on MetLife, Inc.'s third quarter 2021 earnings conference call and audio webcast. 2 The Property & Casualty business was sold to Farmers Group, Inc. in April 2021.

6
Group Benefits underwriting impacted by COVID-19 mortality
1 Results are derived from insurance and non-administrative services-only contracts. 2 Excludes certain experience-rated contracts and includes accidental death and dismemberment. 3 COVID-19 reported deaths. 4 Includes claims that appear to be COVID-19 related, but were not specifically identified as COVID-19 on the death certificate.
Group Benefits Adjusted Earnings
106.3%
94.3%
106.2%
Ratio (as reported) Ratio ex. COVID-19
1Q 2021 2Q 2021 3Q 202185.0%
90.0%
95.0%
100.0%
105.0%
110.0%
3Q21 Group Life Mortality Ratio1,2 3Q21 Highlights
COVID-19 Impact to Adjusted Earnings (~$280M) (~$75M) (~$290M)
$93M $248M $111M
COVID-19 Impact on Ratio3
85-90% target range
~17 pts ~5 pts ~18 pts
• Higher frequency and severity due to greater percentage of COVID-19 deaths under age 65
• Additional 1 - 2% point impact from suspected COVID-19 related excess mortality4
• Year-to-date Group Benefits adjusted earnings of ~$450M despite COVID-19 claims
• 3Q21 Group Benefits adjusted PFOs of $5.5B, up 13% year-over-year

7
$652$778
$1,390
$1,202
$1,789
3Q20 4Q20 1Q21 2Q21 3Q21
1 Quarterly VII range of $300 million - $350 million, based on full year 2021 guidance range of $1.2 - $1.4 billion.
3Q21 VII driven by strong private equity returns
($ in millions - pre-tax)
Private Equity Other
Top end of quarterly range1

8
($ in millions - post-tax1) 1Q21 2Q21 3Q21
Group Benefits $11 $14 $17
Retirement and Income Solutions 390 351 449
U.S. 401 365 466
Asia 273 218 373
Latin America 17 22 22
EMEA — — —
MetLife Holdings 381 301 487
Corporate & Other 26 44 65
Total Variable Investment Income $1,098 $950 $1,413
1 Assumes a 21% tax rate.
VII by segment

9
11.4%
12.3%
12.0%
11.0%
11.4%
11.1%
3Q20 4Q20 2020 1Q21 2Q21 3Q21
1 Direct expense ratio, excluding total notable items related to direct expenses and pension risk transfers (PRT).
12.3% Target
Favorable 3Q21 direct expense ratio1 driven by adjusted PFO growth and ongoing discipline

10
Value of new business1
$2.9$3.1
$3.8 $3.8
$3.2
$1.0$1.3
$2.1$1.8 $1.9
Capital Deployed Value of New Business
2016 2017 2018 2019 2020
($ in billions)
IRR
Payback Period
15%
7 Years
15%
7 Years
17%
6 Years
14%
7 Years
14%
7 Years
1 Excludes the MetLife Holdings segment; Value of New Business (VNB) is the present value of future profits net of the cost of capital and time value of guarantees from new sales.

11
Holding Company Cash1
$7.8
$4.5
$6.5
$5.1
3Q20 4Q20 1Q21 2Q21 3Q21
Cash & capital
1 Includes cash and liquid assets at MetLife, Inc. and other holding companies at quarter-end. 2 Includes MetLife, Inc.'s principal U.S. insurance subsidiaries, excluding American Life Insurance Company and Metropolitan Property and Casualty Insurance Company for both periods. 3 Solvency ratio of MetLife's insurance subsidiary in Japan, which is calculated quarterly and does not reflect conditions and factors occurring after June 30, 2021.
$3.0B to $4.0B Cash Buffer
Capital
• $1.0B of share repurchases and ~$400M in common stock dividends paid in 3Q21
• $500M of long-term debt repayment in 3Q21
• Expected total U.S. Statutory Adjusted Capital2 of $19.7B at 9/30/21, up 16% from 12/31/20
• Japan Solvency Margin ratio3 of 960% at 6/30/21
$3.8
($ in billions)

Appendix

13
Cautionary Statement on Forward-Looking Statements
The forward-looking statements in this presentation, which contain words such as "anticipate,” “assume,” “believe,” “continue,” “could,” “estimate,” “expect,” “if,” “intend,” “likely,” “may,” “plan,” “potential,” “project,” “should,” “will,” and “would,” are based on assumptions and expectations that involve risks and uncertainties, including the “Risk Factors” MetLife, Inc. describes in its U.S. Securities and Exchange Commission filings. MetLife’s future results could differ, and it has no obligation to correct or update any of these statements.

14
Explanatory Note on Non-GAAP and Other Financial InformationAny references in this presentation (except in this Explanatory Note on Non-GAAP Financial Information and Reconciliations) to: Should be read as, respectively:(i) net income (loss); (i) net income (loss) available to MetLife, Inc.’s common shareholders;(ii) net income (loss) per share; (ii) net income (loss) available to MetLife, Inc.’s common shareholders per diluted
common share;(iii) adjusted earnings; and (iii) adjusted earnings available to common shareholders; and(iv) adjusted earnings per share. (iv) adjusted earnings available to common shareholders per diluted common share.
In this presentation, MetLife presents certain measures of its performance on a consolidated and segment basis that are not calculated in accordance with accounting principles generally accepted in the United States of America (GAAP). MetLife believes that these non-GAAP financial measures enhance the understanding for MetLife and its investors of MetLife's performance by highlighting the results of operations and the underlying profitability drivers of the business. Segment-specific financial measures are calculated using only the portion of consolidated results attributable to that specific segment.
The following non-GAAP financial measures should not be viewed as substitutes for the most directly comparable financial measures calculated in accordance with GAAP:
Non-GAAP financial measures:
Comparable GAAP financial measures:
(i) adjusted premiums, fees and other revenues; (i) premiums, fees and other revenues;(ii) adjusted premiums, fees and other revenues, excluding pension risk transfers (PRT); (ii) premiums, fees and other revenues;(iii) adjusted capitalization of deferred policy acquisition costs (DAC); (iii) capitalization of DAC;(iv) adjusted earnings available to common shareholders; (iv) net income (loss) available to MetLife, Inc.’s common shareholders;(v) adjusted earnings available to common shareholders, excluding total notable items; (v) net income (loss) available to MetLife, Inc.’s common shareholders;(vi) adjusted earnings available to common shareholders per diluted common share; (vi) net income (loss) available to MetLife, Inc.’s common shareholders per diluted
common share;(vii) adjusted earnings available to common shareholders, excluding total notable items, per
diluted common share;(vii) net income (loss) available to MetLife, Inc.’s common shareholders per diluted
common share;(viii) adjusted other expenses; (viii) other expenses;(ix) adjusted other expenses, net of adjusted capitalization of DAC; (ix) other expenses, net of capitalization of DAC; (x) adjusted other expenses, net of adjusted capitalization of DAC, excluding total notable
items related to adjusted other expenses; (x) other expenses, net of capitalization of DAC;
(xi) adjusted expense ratio; (xi) expense ratio;(xii) adjusted expense ratio, excluding total notable items related to adjusted other
expenses and PRT;(xii) expense ratio;
(xiii) direct expenses; (xiii) other expenses;(xiv) direct expenses, excluding total notable items related to direct expenses; (xiv) other expenses;
(xv) direct expense ratio; and (xv) expense ratio; and
(xvi) direct expense ratio, excluding total notable items related to direct expenses and PRT. (xvi) expense ratio.

15
Any of these financial measures shown on a constant currency basis reflect the impact of changes in foreign currency exchange rates and are calculated using the average foreign currency exchange rates for the most recent period and applied to the comparable prior period.
Reconciliations of these non-GAAP financial measures to the most directly comparable GAAP financial measures are included in this presentation and in this period’s quarterly financial supplement and earnings news release, which are available at www.metlife.com. Reconciliations of these non-GAAP measures to the most directly comparable GAAP measures are not accessible on a forward-looking basis because we believe it is not possible without unreasonable effort to provide other than a range of net investment gains and losses and net derivative gains and losses, which can fluctuate significantly within or outside the range and from period to period and may have a material impact on net income.
MetLife’s definitions of non-GAAP and other financial measures discussed in this presentation may differ from those used by other companies:
Adjusted earnings and related measures• adjusted earnings;• adjusted earnings available to common shareholders;• adjusted earnings available to common shareholders on a constant currency basis;• adjusted earnings available to common shareholders, excluding total notable items;• adjusted earnings available to common shareholders, excluding total notable items, on a constant currency basis;• adjusted earnings available to common shareholders per diluted common share; • adjusted earnings available to common shareholders on a constant currency basis per diluted common share;• adjusted earnings available to common shareholders, excluding total notable items per diluted common share; and• adjusted earnings available to common shareholders, excluding total notable items, on a constant currency basis per diluted common share.
These measures are used by management to evaluate performance and allocate resources. Consistent with GAAP guidance for segment reporting, adjusted earnings and components of, or other financial measures based on, adjusted earnings are also MetLife’s GAAP measures of segment performance. Adjusted earnings and other financial measures based on adjusted earnings are also the measures by which MetLife senior management’s and many other employees’ performance is evaluated for the purposes of determining their compensation under applicable compensation plans. Adjusted earnings and other financial measures based on adjusted earnings allow analysis of MetLife's performance relative to its business plan and facilitate comparisons to industry results. Adjusted earnings is defined as adjusted revenues less adjusted expenses, net of income tax. Adjusted loss is defined as negative adjusted earnings. Adjusted earnings available to common shareholders is defined as adjusted earnings less preferred stock dividends.
Adjusted revenues and adjusted expenses
These financial measures, along with the related adjusted premiums, fees and other revenues, focus on our primary businesses principally by excluding the impact of market volatility, which could distort trends, and revenues and costs related to non-core products and certain entities required to be consolidated under GAAP. Also, these measures exclude results of discontinued operations under GAAP and other businesses that have been or will be sold or exited by MetLife but do not meet the discontinued operations criteria under GAAP (Divested businesses). Divested businesses also include the net impact of transactions with exited businesses that have been eliminated in consolidation under GAAP and costs relating to businesses that have been or will be sold or exited by MetLife that do not meet the criteria to be included in results of discontinued operations under GAAP. Adjusted revenues also excludes net investment gains (losses) (NIGL) and net derivative gains (losses) (NDGL). Adjusted expenses also excludes goodwill impairments.
Explanatory Note on Non-GAAP and Other Financial Information (Continued)

16
Explanatory Note on Non-GAAP and Other Financial Information (Continued)
The following additional adjustments are made to revenues, in the line items indicated, in calculating adjusted revenues:
• Universal life and investment-type product policy fees excludes the amortization of unearned revenue related to NIGL and NDGL (Unearned revenue adjustments) and certain variable annuity guaranteed minimum income benefits (GMIB) fees (GMIB fees);
• Net investment income: (i) includes adjustments for earned income on derivatives and amortization of premium on derivatives that are hedges of investments or that are used to replicate certain investments, but do not qualify for hedge accounting treatment (Investment hedge adjustments), (ii) excludes post-tax adjusted earnings adjustments relating to insurance joint ventures accounted for under the equity method, (iii) excludes certain amounts related to contractholder-directed equity securities, (iv) excludes certain amounts related to securitization entities that are variable interest entities (VIEs) consolidated under GAAP and (v) includes distributions of profits from certain other limited partnership interests that were previously accounted for under the cost method, but are now accounted for at estimated fair value, where the change in estimated fair value is recognized in NIGL under GAAP; and
• Other revenues is adjusted for settlements of foreign currency earnings hedges and excludes fees received in association with services provided under transition service agreements (TSA fees).
The following additional adjustments are made to expenses, in the line items indicated, in calculating adjusted expenses:
• Policyholder benefits and claims and policyholder dividends excludes: (i) amortization of basis adjustments associated with de-designated fair value hedges of future policy benefits, (ii) changes in the policyholder dividend obligation related to NIGL and NDGL, (iii) inflation-indexed benefit adjustments associated with contracts backed by inflation-indexed investments and amounts associated with periodic crediting rate adjustments based on the total return of a contractually referenced pool of assets and other pass-through adjustments, (iv) benefits and hedging costs related to GMIBs (GMIB costs), and (v) market value adjustments associated with surrenders or terminations of contracts (Market value adjustments);
• Interest credited to policyholder account balances includes adjustments for earned income on derivatives and amortization of premium on derivatives that are hedges of policyholder account balances but do not qualify for hedge accounting treatment and excludes certain amounts related to net investment income earned on contractholder-directed equity securities;
• Amortization of DAC and value of business acquired (VOBA) excludes amounts related to: (i) NIGL and NDGL, (ii) GMIB fees and GMIB costs and (iii) Market value adjustments;• Amortization of negative VOBA excludes amounts related to Market value adjustments;• Interest expense on debt excludes certain amounts related to securitization entities that are VIEs consolidated under GAAP; and• Other expenses excludes: (i) noncontrolling interests, (ii) implementation of new insurance regulatory requirements costs (Regulatory implementation costs), and (iii) acquisition, integration and other costs. Other expenses includes TSA fees.
Adjusted earnings also excludes the recognition of certain contingent assets and liabilities that could not be recognized at acquisition or adjusted for during the measurement period under GAAP business combination accounting guidance.
The tax impact of the adjustments mentioned above are calculated net of the U.S. or foreign statutory tax rate, which could differ from MetLife's effective tax rate. Additionally, the provision for income tax (expense) benefit also includes the impact related to the timing of certain tax credits, as well as certain tax reforms.
In addition, adjusted earnings available to common shareholders excludes the impact of preferred stock redemption premium, which is reported as a reduction to net income (loss) available to MetLife, Inc.’s common shareholders.
Expense ratio, direct expense ratio, adjusted expense ratio and related measures: • Expense ratio: other expenses, net of capitalization of DAC, divided by premiums, fees and other revenues.• Direct expense ratio: adjusted direct expenses, divided by adjusted premiums, fees and other revenues.• Direct expense ratio, excluding total notable items related to direct expenses and PRT: adjusted direct expenses, excluding total notable items related to direct expenses, divided by adjusted premiums, fees and other revenues, excluding PRT.• Adjusted expense ratio: adjusted other expenses, net of adjusted capitalization of DAC, divided by adjusted premiums, fees and other revenues.• Adjusted expense ratio, excluding total notable items related to adjusted other expenses and PRT: adjusted other expenses, net of adjusted capitalization of DAC, excluding total notable items related to adjusted other expenses, divided by
adjusted premiums, fees and other revenues, excluding PRT.

17
Explanatory Note on Non-GAAP and Other Financial Information (Continued)
Statistical sales information:
• U.S.:◦ Group Benefits: calculated using 10% of single premium deposits and 100% of annualized full-year premiums and fees from recurring premium policy sales of all products.◦ Retirement and Income Solutions: calculated using 10% of single premium deposits and 100% of annualized full-year premiums and fees only from recurring premium policy sales of specialized benefit resources and corporate-
owned life insurance. • Latin America, Asia and EMEA: calculated using 10% of single-premium deposits (mainly from retirement products such as variable annuity, fixed annuity and pensions), 20% of single-premium deposits from credit insurance and 100%
of annualized full-year premiums and fees from recurring-premium policy sales of all products (mainly from risk and protection products such as individual life, accident & health and group).
Sales statistics do not correspond to revenues under GAAP, but are used as relevant measures of business activity.
The following additional information is relevant to an understanding of MetLife’s performance results and Outlook:
• Volume growth, as discussed in the context of business growth, is the period over period percentage change in adjusted earnings available to common shareholders attributable to adjusted premiums, fees and other revenues and assets under management levels, applying a model in which certain margins and factors are held constant. The most significant of such items are underwriting margins, investment margins, changes in equity market performance, expense margins and the impact of changes in foreign currency exchange rates.
• Notable items reflect the unexpected impact of events that affect MetLife’s results, but that were unknown and that MetLife could not anticipate when it devised its business plan. Notable items also include certain items regardless of the extent anticipated in the business plan, to help investors have a better understanding of MetLife's results and to evaluate and forecast those results. Notable items represent a positive (negative) impact to adjusted earnings available to common shareholders.

18
Reconciliation of Net Income (Loss) Available to MetLife, Inc.'s Common Shareholders to Adjusted Earnings Available to Common Shareholders
3Q21 3Q20
Earnings Per Weighted Average Common
Share Diluted1
Earnings Per Weighted Average Common
Share Diluted1
(In millions, except per share data)
Net Income (loss) available to MetLife, Inc.'s common shareholders $ 1,521 $ 1.77 $ 633 $ 0.69
Adjustments from net income (loss) available to MetLife, Inc.'s commonshareholders to adjusted earnings available to common shareholders:
Less: Net investment gains (losses) (84) (0.10) (20) (0.02) Less: Net derivative gains (losses) (218) (0.25) (581) (0.64) Less: Other adjustments to net income (loss) (333) (0.37) (522) (0.57) Less: Provision for income tax (expense) benefit 99 0.11 195 0.21 Add: Net income (loss) attributable to noncontrolling interests 5 0.01 3 — Add: Preferred stock redemption premium — — — —
Adjusted earnings available to common shareholders 2,062 2.39 1,578 1.73 Less: Total notable items (140) (0.16) (203) (0.22) Adjusted earnings available to common shareholders, excluding total notable items $ 2,202 $ 2.56 $ 1,781 $ 1.95
Adjusted earnings available to common shareholders on a constant currency basis $ 2,062 $ 2.39 $ 1,581 $ 1.73 Adjusted earnings available to common shareholders, excluding total notable items, on a
$ 2,202 $ 2.56 $ 1,784 $ 1.95 constant currency basis
Weighted average common shares outstanding - diluted 861.2 913.7
1Adjusted earnings available to common shareholders, excluding total notable items, per diluted common share is calculated on a standalone basis and may not equal (i) adjusted earnings available to common shareholders per diluted common share, less (ii) total notable items per diluted common share.
19
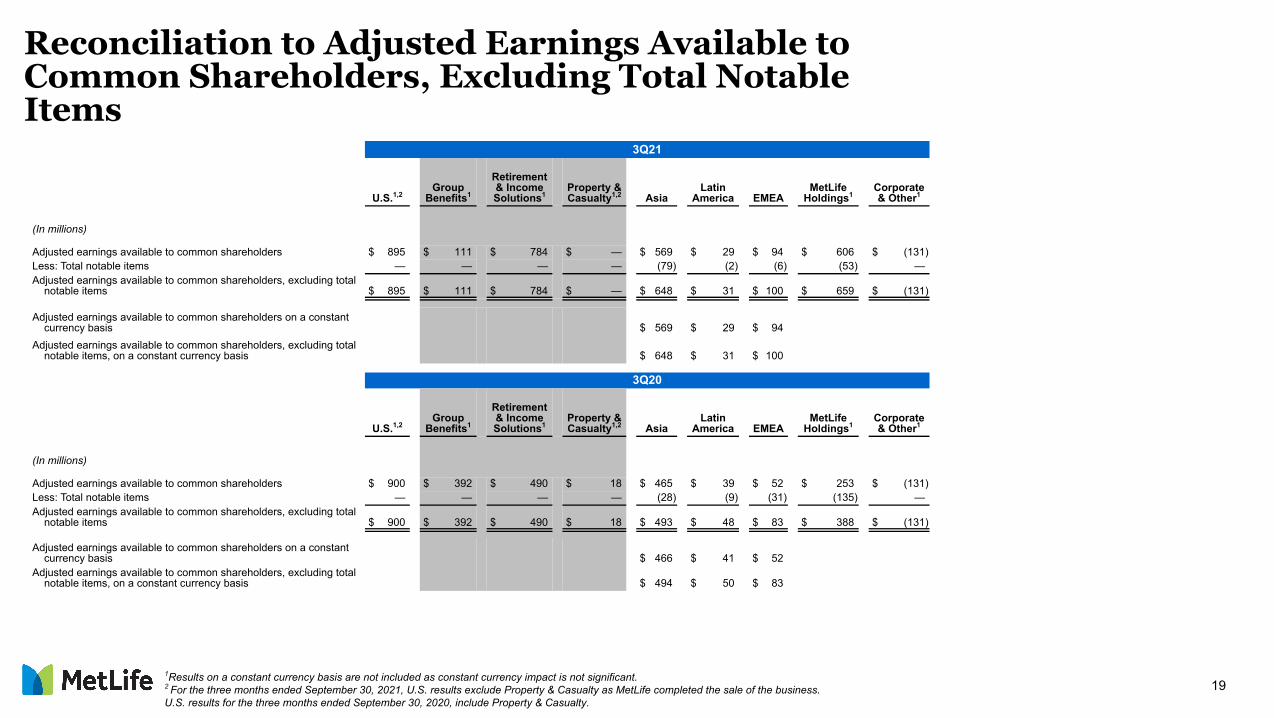
Reconciliation to Adjusted Earnings Available to Common Shareholders, Excluding Total Notable Items
3Q21
U.S.1,2Group
Benefits1
Retirement & Income Solutions1
Property & Casualty1,2 Asia
Latin America EMEA
MetLife Holdings1
Corporate & Other1
(In millions)
Adjusted earnings available to common shareholders $ 895 $ 111 $ 784 $ — $ 569 $ 29 $ 94 $ 606 $ (131) Less: Total notable items — — — — (79) (2) (6) (53) — Adjusted earnings available to common shareholders, excluding total notable items $ 895 $ 111 $ 784 $ — $ 648 $ 31 $ 100 $ 659 $ (131)
Adjusted earnings available to common shareholders on a constant currency basis $ 569 $ 29 $ 94 Adjusted earnings available to common shareholders, excluding total notable items, on a constant currency basis $ 648 $ 31 $ 100
3Q20
U.S.1,2Group
Benefits1
Retirement & Income Solutions1
Property & Casualty1,2 Asia
Latin America EMEA
MetLife Holdings1
Corporate & Other1
(In millions)
Adjusted earnings available to common shareholders $ 900 $ 392 $ 490 $ 18 $ 465 $ 39 $ 52 $ 253 $ (131) Less: Total notable items — — — — (28) (9) (31) (135) — Adjusted earnings available to common shareholders, excluding total notable items $ 900 $ 392 $ 490 $ 18 $ 493 $ 48 $ 83 $ 388 $ (131)
Adjusted earnings available to common shareholders on a constant currency basis $ 466 $ 41 $ 52 Adjusted earnings available to common shareholders, excluding total notable items, on a constant currency basis $ 494 $ 50 $ 83
1Results on a constant currency basis are not included as constant currency impact is not significant.2 For the three months ended September 30, 2021, U.S. results exclude Property & Casualty as MetLife completed the sale of the business.U.S. results for the three months ended September 30, 2020, include Property & Casualty.

20
Expense Detail and Ratios (In millions, except ratio data) 3Q20 4Q20 2020 1Q21 2Q21 3Q21
Reconciliation of Capitalization of DAC to Adjusted Capitalization of DACCapitalization of DAC $ (764) $ (804) $ (3,013) $ (775) $ (642) $ (635)
Less: Divested businesses — — (5) (89) — (15) Adjusted capitalization of DAC $ (764) $ (804) $ (3,008) $ (686) $ (642) $ (620)
Reconciliation of Other Expenses to Adjusted Other ExpensesOther expenses $ 2,954 $ 3,262 $ 12,135 $ 3,116 $ 2,768 $ 2,869
Less: Noncontrolling interests (4) (2) (16) (6) (6) (7) Less: Regulatory implementation costs 6 12 20 (3) 6 — Less: Acquisition, integration and other costs 7 29 42 4 4 2 Less: TSA fees 39 39 159 35 60 73 Less: Divested businesses 7 9 58 232 4 41
Adjusted other expenses $ 2,899 $ 3,175 $ 11,872 $ 2,854 $ 2,700 $ 2,760
Other Detail and Ratios Other expenses $ 2,954 $ 3,262 $ 12,135 $ 3,116 $ 2,768 $ 2,869
Capitalization of DAC (764) (804) (3,013) (775) (642) (635) Other expenses, net of capitalization of DAC $ 2,190 $ 2,458 $ 9,122 $ 2,341 $ 2,126 $ 2,234
Premiums, fees and other revenues $ 11,887 $ 15,772 $ 49,486 $ 12,349 $ 11,218 $ 11,639
Expense ratio 18.4 % 15.6 % 18.4 % 19.0 % 19.0 % 19.2 %
Direct expenses $ 1,288 $ 1,423 $ 5,342 $ 1,259 $ 1,188 $ 1,266 Less: Total notable items related to direct expenses — — — — (84) —
Direct expenses, excluding total notable items related to direct expenses $ 1,288 $ 1,423 $ 5,342 $ 1,259 $ 1,272 $ 1,266
Adjusted other expenses $ 2,899 $ 3,175 $ 11,872 $ 2,854 $ 2,700 $ 2,760 Adjusted capitalization of DAC (764) (804) (3,008) (686) (642) (620)
Adjusted other expenses, net of adjusted capitalization of DAC $ 2,135 $ 2,371 $ 8,864 $ 2,168 $ 2,058 $ 2,140 Less: Total notable items related to adjusted other expenses — — — — (84) —
Adjusted other expenses, net of adjusted capitalization of DAC, excluding total notable items related to adjusted other expenses $ 2,135 $ 2,371 $ 8,864 $ 2,168 $ 2,142 $ 2,140
Adjusted premiums, fees and other revenues $ 11,820 $ 15,700 $ 49,137 $ 11,413 $ 11,122 $ 11,419 Less: PRT 487 4,163 4,635 — (14) (24)
Adjusted premiums, fees and other revenues, excluding PRT $ 11,333 $ 11,537 $ 44,502 $ 11,413 $ 11,136 $ 11,443
Direct expense ratio 10.9 % 9.1 % 10.9 % 11.0 % 10.7 % 11.1 %Direct expense ratio, excluding total notable items related to direct expenses and PRT 11.4 % 12.3 % 12.0 % 11.0 % 11.4 % 11.1 %Adjusted expense ratio 18.1 % 15.1 % 18.0 % 19.0 % 18.5 % 18.7 %Adjusted expense ratio, excluding total notable items related to adjusted other expenses and PRT 18.8 % 20.6 % 19.9 % 19.0 % 19.2 % 18.7 %

21
Premiums, Fees and Other Revenues (In millions) 3Q20 4Q20 2020 1Q21 2Q21 3Q21
Total Company - Premiums, Fees and Other RevenuesPremiums, fees and other revenues $ 11,887 $ 15,772 $ 49,486 $ 12,349 $ 11,218 $ 11,639
Less: Unearned revenue adjustments 2 8 33 — 12 46
Less: GMIB fees 26 25 102 25 24 25
Less: Settlement of foreign currency earnings hedges — — — — — —
Less: TSA fees 39 39 159 35 60 73
Less: Divested businesses — — 55 876 — 76
Adjusted premiums, fees and other revenues $ 11,820 $ 15,700 $ 49,137 $ 11,413 $ 11,122 $ 11,419

22


![3Q21 [ENG] Results Presentation-Analyst](https://img.dokumen.tips/doc/110x75/62059ee21708c43c2d4570d9/3q21-eng-results-presentation-analyst.jpg)