Embed Size (px)
Citation preview
3D semantic interpretation for robot perception insideoffice environments
Levente Tamas a,n, Lucian Cosmin Goron b
a Robotics Research Group, Department of Automation, Technical University of Cluj-Napoca (UTCLUJ), Cluj-Napoca, Romaniab Computer Vision Group, Computer Aided Medical Procedures and Augmented Reality, Technical University of Munich (TUM), Munich, Germany
a r t i c l e i n f o
Article history:Received 21 May 2013Received in revised form3 November 2013Accepted 2 March 2014Available online 28 March 2014
Keywords:RoboticsPerceptionSegmentationRegistrationIndoor mapping
a b s t r a c t
Making sense out of human indoor environments is an essential feature for robots. The paper at handpresents a system for semantic interpretation of our surrounding indoor environments such as officesand kitchens. The perception and the interpretation of the measured data are essential tasks for anyintelligent system. There are different techniques for processing 3D point clouds. The majority of theminclude acquisition, iterative registration, segmentation, or classification stages. We describe a generic pipelinefor indoor data processing and semantic information extraction. The proposed pipeline is validated usingseveral data sets collected using different 3D sensing devices.
& 2014 Elsevier Ltd. All rights reserved.
1. Introduction
The 3D perception of the surrounding environment is still animportant research field for both the industrial and the researchcommunity. There are several potential applications for thisdomain, mainly from the fields of urban surveillance, path planningand cultural heritage conservation. Each individual applicationrequires a specific handling of the acquired data sets. Althoughcertain applications in the mobile robotics domain require real timedata processing, e.g. dynamic perception and planning, the post-processing of data is sufficient for our pipeline.
Several sensors can be used for the acquisition of data, such asstereo cameras, laser range finders, and the recent structured lightsensors. These devices have their own special characteristics in termsof precision, range and speed. Thus the way in which these sensorsare chosen depends on the specific requirements of the measure-ment problem to be solved (Scharstein and Szeliski, 2002).
Relatively large areas, such as indoor spaces for offices, requireseveral different measurements to be aligned in the same coordi-nate frame. This kind of problem is well studied in the 2D space,mainly in the image processing domain. Although these 2Dalgorithms can be adopted for the registration of 3D data, theyneed special adaptations. Also, characteristics such as range, noise,
and distribution have a large influence on the algorithms used for3D data processing, including the registration of point clouds.
Different algorithms can be used for iterative map registration,including keypoint and feature extractors, nonlinear correspon-dence estimators or odometry based approaches (Magnussonet al., 2007). Although the data merging can be performed basedonly on the odometry information, this kind of registration isprune to fail due to the error integration characteristics of theodometers (Kaushik et al., 2009). Hence a more robust methodis applied for the initial alignment phase based on an extractedkeypoint-feature data set proposed in the work Zhang et al.(2008). A similar version of this approach was adopted for theregistration stage in the paper at hand focusing on the iterativeregistration without explicitly making use of the loop closure data.Further on, for the different data sets, specific features and theircorrespondences among them are evaluated.
A certain environment is scanned from multiple viewpoints.These point clouds are then registered using an ICP-based algo-rithm applied in two stages: (i) initial alignment: only for filteredset of correspondences, usually a fast process; and (ii) refinedalignment: using the complete data sets, being a time consumingbut accurate variant. The assumption is that the registered cloud isnot axis aligned, thus having a random coordinate system. Sincethe approach relies on accurate alignment with real-world axes,this method transforms the cloud in two steps: (i) initial guess:using normals of dominant planes to compute the axes; and(ii) correct alignment: where basic features from indoor environ-ments are used to determine the final axes. During this process theplanar surfaces are segmented and the boundary points for each
Contents lists available at ScienceDirect
journal homepage: www.elsevier.com/locate/engappai
Engineering Applications of Artificial Intelligence
http://dx.doi.org/10.1016/j.engappai.2014.03.0010952-1976/& 2014 Elsevier Ltd. All rights reserved.
n Corresponding author. Tel.: þ40 264 401586; fax: þ40 264 599893.E-mail addresses: [email protected] (L. Tamas),
[email protected] (L. Cosmin Goron).URLS: http://rrg.utcluj.ro/ (L. Tamas),
http://ias.cs.tum.edu/people/goron (L. Cosmin Goron).
Engineering Applications of Artificial Intelligence 32 (2014) 76–87

plane are computed. Quadrilateral shapes are then fitted to eachset of boundaries. These shapes will tell us the positioning of wallsand components such as doors and windows. After inspecting thesizes of these rectangle-like shapes and determining the relation-ships between them, the method can start assigning a class orlabel to each point.
The main contributions presented in this paper are as follows:
� development of a robust framework for iterative map registra-tion based on the combination of different keypoint featurepairs from the main literature;
� validation of the iterative registration method on different datasets including indoor and outdoor variants;
� a straightforward and reliable method for estimating theprincipal axes of 3D complete indoor data sets;
� improved hierarchical model fitting by clustering the models’inliers, and retaining only consistent clusters as final models;
� a simple and reliable set of rules for labeling indoor compo-nents, without the use of any training classifiers;
� procedure for estimating quadrilateral-like forms, which areneeded for the proposed labeling process of 3D points.
2. Related work
The perception of environments is a current topic for severalresearch works especially in the field of robotics perception (Rusuand Cousins, 2011; Tamas and Goron, 2012; Nüchter and Hertzberg,2008). Furthermore, the data registration issues are treated indifferent works using various approaches, such as planar patchmatching (Pathak et al., 2010), keypoint-descriptor pairs for thedepth information (Rusu et al., 2010) and even heterogeneous datafusion including RGB data in the works (Kaushik et al., 2009; Tamasand Majdik, 2012).
A good example for creating the surrounding environmentis given in Kasinski and Skrzypczynski (2001). The authors areconcentrating on the distributed mapping of an environment,where the application is an industrial one, e.g. a shared floor ina warehouse. In comparison to ours – which is intended forunderstanding the human indoor environment, such as kitchens,offices, and hospitals – the application presented in Kasinski andSkrzypczynski (2001) is closer to business and enterprise.
Several research works deal with the estimation of the precision ofthe registered 3D maps. This is valid for both the loop closure basedmapping process (also referred as simultaneous mapping and locali-zation) (May et al., 2009; Strasdat, 2012) and the iterative registrationbased mapping (Magnusson et al., 2009; Hervier et al., 2012) withoutclosuring the loop during the mapping.
In Nüchter and Hertzberg (2008) the authors propose a so-calledscene interpretation method for labeling the walls, floor, and ceiling.This approach relies only on the segmentation of planar patches usingthe RANSAC (Random Sample Consensus) (Fischler and Bolles, 1981)algorithm. Further identification of indoor components is obtainedusing a rather complex recognition pipeline.
The authors in Rusu et al. (2008) presented an approach similar tothe one described in this paper in Section 4. They also use 2Dquadrilaterals to detect rectangular shapes, but under the assump-tion that the points are axes aligned (Rusu, 2009). Based on thisassumption the reasoning about the environment becomes moreaccessible. Also, from the article it was understood that the so-calledcuboid fitting was applied only for that particular kitchen data sets.
With regard to door detection, some very interesting work hasbeen done, such as Murillo et al. (2008) where authors use computervision to classify pixels using a somehow smaller set of classes thanthe one presented in this work. Although the results look good, the
performance can be easily affected by changing light conditions. Alsoby using only image processing, robotic applications which require3D information cannot be supported. Another work on door detec-tion is Morisset et al. (2009) where the developed system isaccurately detecting and opening doors. Unfortunately, the authorshave applied it only on doors and handles that are conform to ADA(American Disability Act) U.S. law, thus suggesting that the systemmight not comply for other types of doors.
In addition, there was very little to be found on indoor windowdetection, this application being more common for outdoorprocessing of buildings. Nevertheless in Tuttas and Stilla (2011) amethod is presented for detecting windows from outdoor scans,using indoor points. The authors also rely on the detection ofdominant planes, which is being considered most representative.Using the indoor points, meaning the points which lie inside thebuildings, and which were obtained by the laser beam goingthrough the windows into the building, the authors estimate thepositions of windows.
In Silva et al. (2012) the authors give an extensive overviewover the latest applications in the area of intelligent homes, suchas child and elderly care, surveillance, and even the optimizationof energy usage. Although the applications summarized in Silvaet al. (2012) are relevant to the applied engineering field, roboticapplications are underrepresented in this work. We believe that“smart homes” should also incorporate “smart agents”, such aspersonal and service robots, which can interact autonomouslywith the environment (Papadakis, 2013).
3. 3D scan registration
Several range scans are necessary in order to build a 3D elevationmap of the environment. To use these scans as a coherent data set,they have to be unified in a common coordinate frame. Unless theposition and the orientation of the mapping robot are accuratelyknown, the range scan registration needs to be done using specializedalgorithms (Nagatani et al., 2009). Since in our case the robot positioncould not be determined with a sufficient accuracy between themeasurement steps, the registration algorithms were employed forcreating the elevation maps (Tamas and Goron, 2012).
The problem addressed in this section deals with an iterativescan registration without explicitly requiring or performing theloop closure. Similar benchmarking and approaches were testedfor fusing different additional sensors in the work of Hervier et al.(2012), or dealing with normal based information registration pre-sented in Magnusson et al. (2009).
3.1. Data acquisition
There are several possibilities to acquire 3D information fromthe surrounding environment. The measurement methods can bedivided into 3 major categories based on the applied sensor andsensing technology: stereo vision (with two or more cameras)(Morisset et al., 2009), active triangulation (Ohno et al., 2010) andtime of flight measurements. One of the most precise time of flightmeasurement systems is based on the laser scanners; however it isthe most expensive one. A cheaper variant is the stereo camera,with less precision in the depth estimations or the structural lightapproaches (Khoshelham and Elberink, 2012).
In our experiments the data sets were recorded at normal lightconditions for spaces ranging between a few cm and 80 m. Thescanning of the environment with a custom 3D laser scannermounted on the P3-AT mobile robot was performed in a stop–scan–go fashion. The core part of the 3D scanner is a Sick LMS200planar scanner augmented with an additional mechanical part in
L. Tamas, L. Cosmin Goron / Engineering Applications of Artificial Intelligence 32 (2014) 76–87 77
order to gain the third degree of freedom for the data (Tamas andGoron, 2012). A single scan takes up to 60 s depending on theused sensor configuration. The resolution of the used custom 3Dscanner was 0.251 in yaw and 0.51 for the tilting while the depthabsolute error was less than 1 cm. All the measured data wasintegrated in the ROS1 environment where each logging wastimestamped for an easier off-line processing (Goron et al., 2010).
3.2. ICP-based registration
The registration problem can also be viewed as the optimiza-tion of a cost function describing the quality of alignment betweendifferent scans. The algorithm determines the rigid transformationwhich minimizes this cost function (Surmann et al., 2001).The type of algorithm applied for the frame alignment stronglydepends on the measured data set type. For the 3D laser scans theIterative Closest Point (ICP) and derivatives are popular in the fieldof robotics (Besl and McKay, 1992; Nuechter, 2009; Pathak et al.,2010). The ICP computes the rigid transformation which minimizesthe distance among two point sets by associating a point from oneframe to the closest point in the target frame. The transformationbetween two independently acquired sets of 3D points consists oftwo components, a rotation R and translation t. Correspondencepoints are iteratively searched from the model set of points M(with jMj ¼Nm) in the data set D (with jDj ¼Nd). In case of a validcorrespondence we need the transformations R and t whichminimize the distance between the two points as follows:
EðR; tÞ ¼ ∑Nm
i ¼ 1∑Nd
j ¼ 1wi;j‖mi�ðRdjþtÞ‖2 ð1Þ
where wi;j is assigned 1 if a valid correspondence is found betweenthe ith point from M denoted with mi and the jth point from Ddenoted with dj.
Different variants were developed in order to increase therobustness and the performance of the algorithm especially forcomputing the rotational transformation term, which introducesa non-linear term in the minimization problem. A comprehensiveoverview and a qualitative evaluation of different approaches forthe registration problem can be found in Salvi et al. (2007).
A common approach for boosting the ICP robustness is theaugmentation of the points with additional features such as pointcolor, geometric features and point histograms (Sharp et al., 2002).This transposes the optimization problem in a higher orderdimensional space search. These features are usually computedonly for a certain subset of interest points from the original pointcloud, i.e. keypoints in order to reduce the computational effortand enhance robustness.
The use of keypoints is to enable the efficient comparison betweendifferent data regions. Our approach for the data registration is basedon the correspondence estimation for the extracted keypoint features.
3.3. 3D keypoints and descriptors
There are several possibilities for extracting interest points anddescriptors from 2D images including the popular SIFT (ScaleInvariant Feature Transform) (Lowe, 2004) or the SURF (SpeededUp Robust Features) (Bay et al., 2008) features. Unfortunately,these rely on local gradients from a unique orientation andtherefore are not directly applicable for our approach with 3Ddata, however some concepts may be inherited from the 2Ddomain.
In this paper the Normal Aligned Radial Feature (NARF) (Stederet al., 2010) keypoints were adopted for the extraction of interest
points from range images. This type of keypoint takes into accountthe information about the borders and surfaces, ensures thedetection from different perspectives and the stability for thedescriptor computation. The most important parameter for theNARF extraction is the support size, i.e. the diameter of the spherein which the interest point characteristics are determined (Stederet al., 2011). In our case several values for this parameter weretested in order to gain a sufficient number of keypoints fordifferent types of data sets. After the selection of keypoints wascompleted, the specific properties are determined, i.e. the descrip-tors for the set of extracted keypoints.
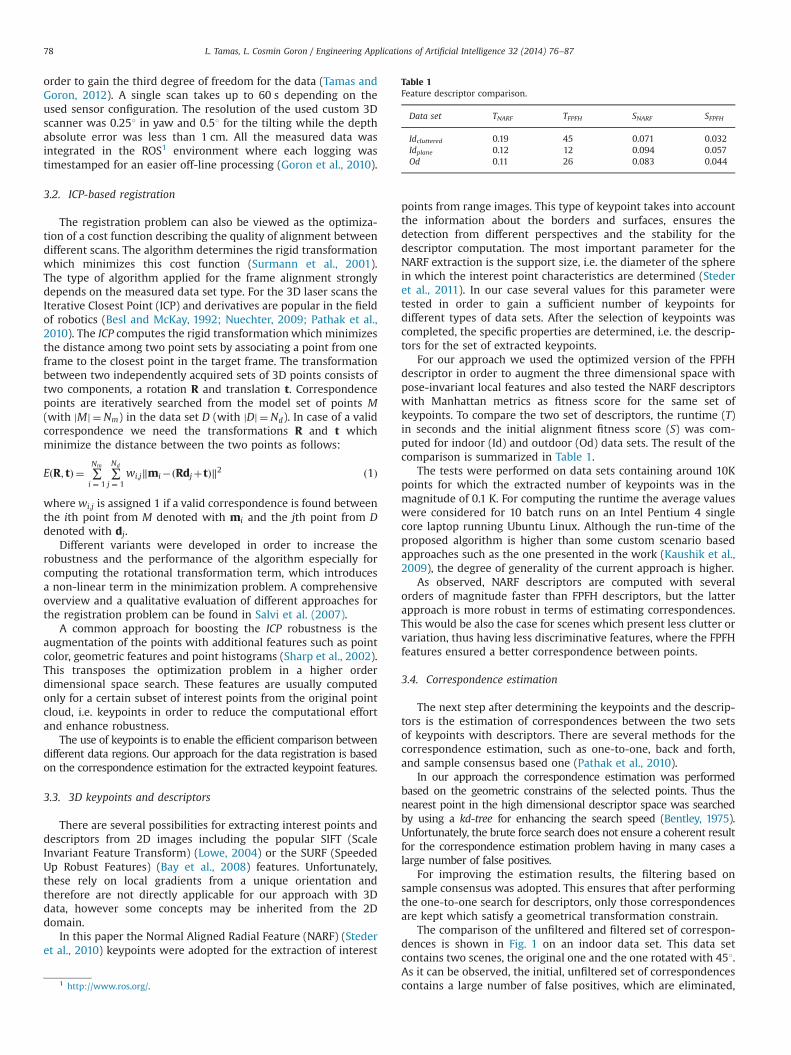
For our approach we used the optimized version of the FPFHdescriptor in order to augment the three dimensional space withpose-invariant local features and also tested the NARF descriptorswith Manhattan metrics as fitness score for the same set ofkeypoints. To compare the two set of descriptors, the runtime (T)in seconds and the initial alignment fitness score (S) was com-puted for indoor (Id) and outdoor (Od) data sets. The result of thecomparison is summarized in Table 1.
The tests were performed on data sets containing around 10Kpoints for which the extracted number of keypoints was in themagnitude of 0.1 K. For computing the runtime the average valueswere considered for 10 batch runs on an Intel Pentium 4 singlecore laptop running Ubuntu Linux. Although the run-time of theproposed algorithm is higher than some custom scenario basedapproaches such as the one presented in the work (Kaushik et al.,2009), the degree of generality of the current approach is higher.
As observed, NARF descriptors are computed with severalorders of magnitude faster than FPFH descriptors, but the latterapproach is more robust in terms of estimating correspondences.This would be also the case for scenes which present less clutter orvariation, thus having less discriminative features, where the FPFHfeatures ensured a better correspondence between points.
3.4. Correspondence estimation
The next step after determining the keypoints and the descrip-tors is the estimation of correspondences between the two setsof keypoints with descriptors. There are several methods for thecorrespondence estimation, such as one-to-one, back and forth,and sample consensus based one (Pathak et al., 2010).
In our approach the correspondence estimation was performedbased on the geometric constrains of the selected points. Thus thenearest point in the high dimensional descriptor space was searchedby using a kd-tree for enhancing the search speed (Bentley, 1975).Unfortunately, the brute force search does not ensure a coherent resultfor the correspondence estimation problem having in many cases alarge number of false positives.
For improving the estimation results, the filtering based onsample consensus was adopted. This ensures that after performingthe one-to-one search for descriptors, only those correspondencesare kept which satisfy a geometrical transformation constrain.
The comparison of the unfiltered and filtered set of correspon-dences is shown in Fig. 1 on an indoor data set. This data setcontains two scenes, the original one and the one rotated with 451.As it can be observed, the initial, unfiltered set of correspondencescontains a large number of false positives, which are eliminated,
Table 1Feature descriptor comparison.
Data set TNARF TFPFH SNARF SFPFH
Idcluttered 0.19 45 0.071 0.032Idplane 0.12 12 0.094 0.057Od 0.11 26 0.083 0.044
1 http://www.ros.org/.
L. Tamas, L. Cosmin Goron / Engineering Applications of Artificial Intelligence 32 (2014) 76–8778
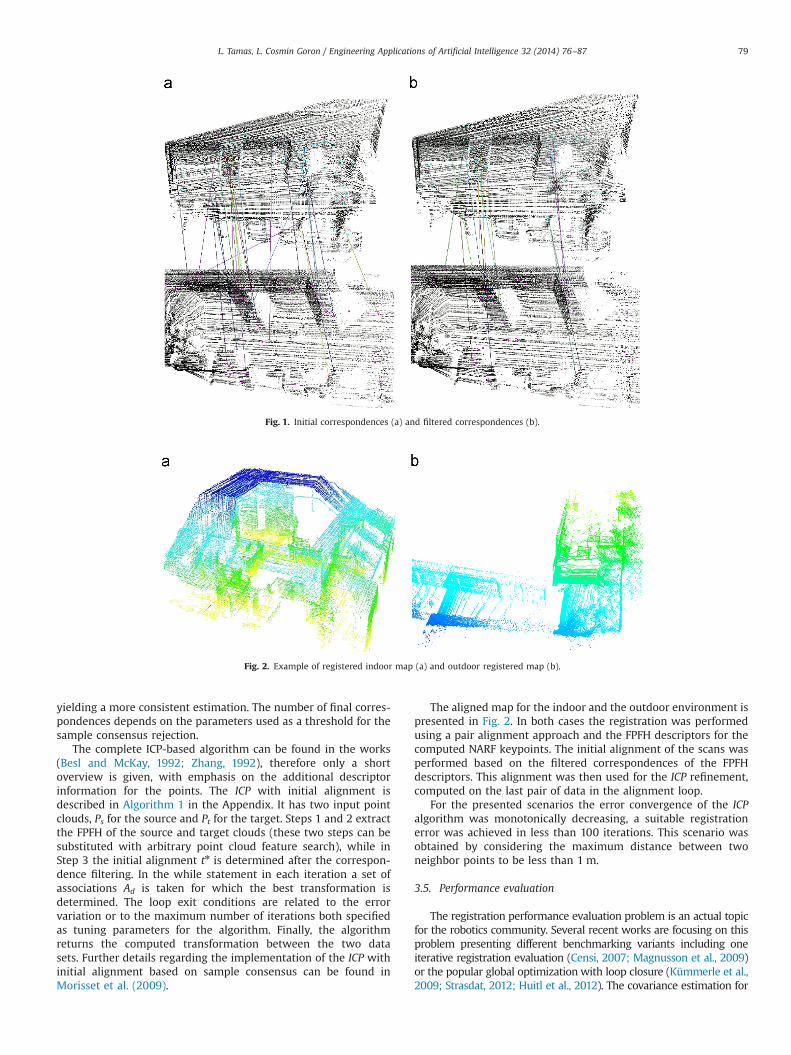
yielding a more consistent estimation. The number of final corres-pondences depends on the parameters used as a threshold for thesample consensus rejection.
The complete ICP-based algorithm can be found in the works(Besl and McKay, 1992; Zhang, 1992), therefore only a shortoverview is given, with emphasis on the additional descriptorinformation for the points. The ICP with initial alignment isdescribed in Algorithm 1 in the Appendix. It has two input pointclouds, Ps for the source and Pt for the target. Steps 1 and 2 extractthe FPFH of the source and target clouds (these two steps can besubstituted with arbitrary point cloud feature search), while inStep 3 the initial alignment tn is determined after the correspon-dence filtering. In the while statement in each iteration a set ofassociations Ad is taken for which the best transformation isdetermined. The loop exit conditions are related to the errorvariation or to the maximum number of iterations both specifiedas tuning parameters for the algorithm. Finally, the algorithmreturns the computed transformation between the two datasets. Further details regarding the implementation of the ICP withinitial alignment based on sample consensus can be found inMorisset et al. (2009).
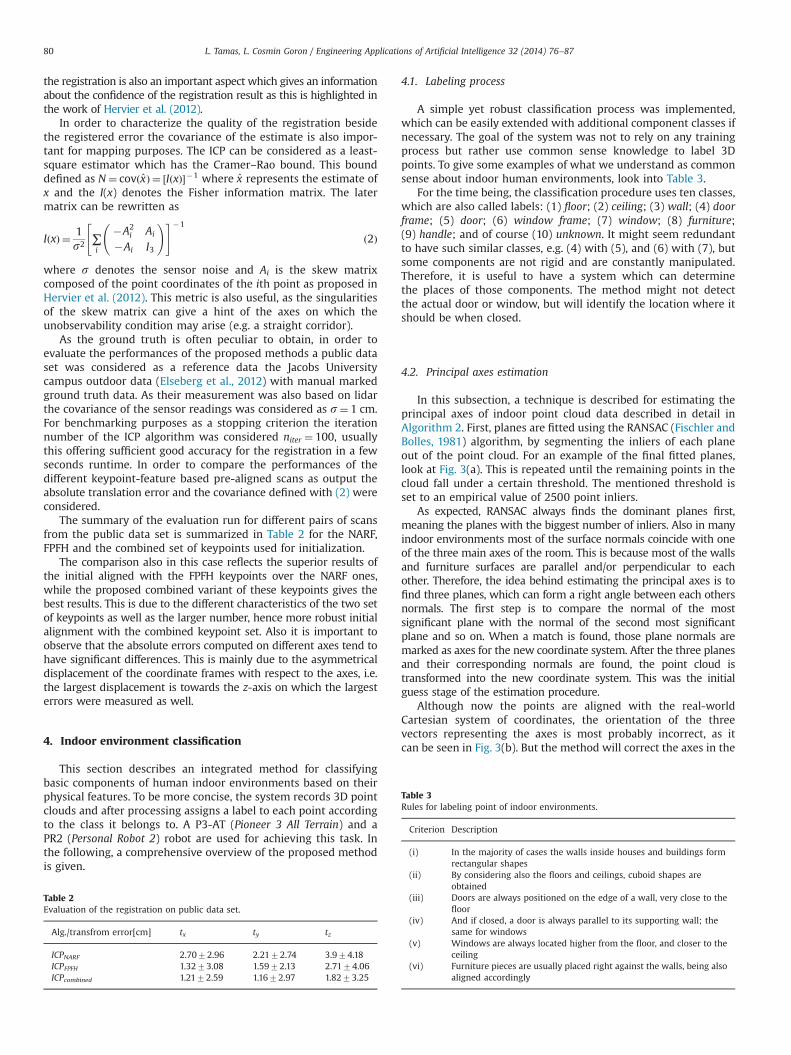
The aligned map for the indoor and the outdoor environment ispresented in Fig. 2. In both cases the registration was performedusing a pair alignment approach and the FPFH descriptors for thecomputed NARF keypoints. The initial alignment of the scans wasperformed based on the filtered correspondences of the FPFHdescriptors. This alignment was then used for the ICP refinement,computed on the last pair of data in the alignment loop.
For the presented scenarios the error convergence of the ICPalgorithm was monotonically decreasing, a suitable registrationerror was achieved in less than 100 iterations. This scenario wasobtained by considering the maximum distance between twoneighbor points to be less than 1 m.
3.5. Performance evaluation
The registration performance evaluation problem is an actual topicfor the robotics community. Several recent works are focusing on thisproblem presenting different benchmarking variants including oneiterative registration evaluation (Censi, 2007; Magnusson et al., 2009)or the popular global optimization with loop closure (Kümmerle et al.,2009; Strasdat, 2012; Huitl et al., 2012). The covariance estimation for
Fig. 1. Initial correspondences (a) and filtered correspondences (b).
Fig. 2. Example of registered indoor map (a) and outdoor registered map (b).
L. Tamas, L. Cosmin Goron / Engineering Applications of Artificial Intelligence 32 (2014) 76–87 79
the registration is also an important aspect which gives an informationabout the confidence of the registration result as this is highlighted inthe work of Hervier et al. (2012).
In order to characterize the quality of the registration besidethe registered error the covariance of the estimate is also impor-tant for mapping purposes. The ICP can be considered as a least-square estimator which has the Cramer–Rao bound. This bounddefined as N¼ covðx̂Þ ¼ ½IðxÞ��1 where x̂ represents the estimate ofx and the I(x) denotes the Fisher information matrix. The latermatrix can be rewritten as
IðxÞ ¼ 1s2 ∑
i
�A2i Ai
�Ai I3
!" #�1
ð2Þ
where s denotes the sensor noise and Ai is the skew matrixcomposed of the point coordinates of the ith point as proposed inHervier et al. (2012). This metric is also useful, as the singularitiesof the skew matrix can give a hint of the axes on which theunobservability condition may arise (e.g. a straight corridor).
As the ground truth is often peculiar to obtain, in order toevaluate the performances of the proposed methods a public dataset was considered as a reference data the Jacobs Universitycampus outdoor data (Elseberg et al., 2012) with manual markedground truth data. As their measurement was also based on lidarthe covariance of the sensor readings was considered as s¼ 1 cm.For benchmarking purposes as a stopping criterion the iterationnumber of the ICP algorithm was considered niter ¼ 100, usuallythis offering sufficient good accuracy for the registration in a fewseconds runtime. In order to compare the performances of thedifferent keypoint-feature based pre-aligned scans as output theabsolute translation error and the covariance defined with (2) wereconsidered.
The summary of the evaluation run for different pairs of scansfrom the public data set is summarized in Table 2 for the NARF,FPFH and the combined set of keypoints used for initialization.
The comparison also in this case reflects the superior results ofthe initial aligned with the FPFH keypoints over the NARF ones,while the proposed combined variant of these keypoints gives thebest results. This is due to the different characteristics of the two setof keypoints as well as the larger number, hence more robust initialalignment with the combined keypoint set. Also it is important toobserve that the absolute errors computed on different axes tend tohave significant differences. This is mainly due to the asymmetricaldisplacement of the coordinate frames with respect to the axes, i.e.the largest displacement is towards the z-axis on which the largesterrors were measured as well.
4. Indoor environment classification
This section describes an integrated method for classifyingbasic components of human indoor environments based on theirphysical features. To be more concise, the system records 3D pointclouds and after processing assigns a label to each point accordingto the class it belongs to. A P3-AT (Pioneer 3 All Terrain) and aPR2 (Personal Robot 2) robot are used for achieving this task. Inthe following, a comprehensive overview of the proposed methodis given.
4.1. Labeling process
A simple yet robust classification process was implemented,which can be easily extended with additional component classes ifnecessary. The goal of the system was not to rely on any trainingprocess but rather use common sense knowledge to label 3Dpoints. To give some examples of what we understand as commonsense about indoor human environments, look into Table 3.
For the time being, the classification procedure uses ten classes,which are also called labels: (1) floor; (2) ceiling; (3) wall; (4) doorframe; (5) door; (6) window frame; (7) window; (8) furniture;(9) handle; and of course (10) unknown. It might seem redundantto have such similar classes, e.g. (4) with (5), and (6) with (7), butsome components are not rigid and are constantly manipulated.Therefore, it is useful to have a system which can determinethe places of those components. The method might not detectthe actual door or window, but will identify the location where itshould be when closed.
4.2. Principal axes estimation
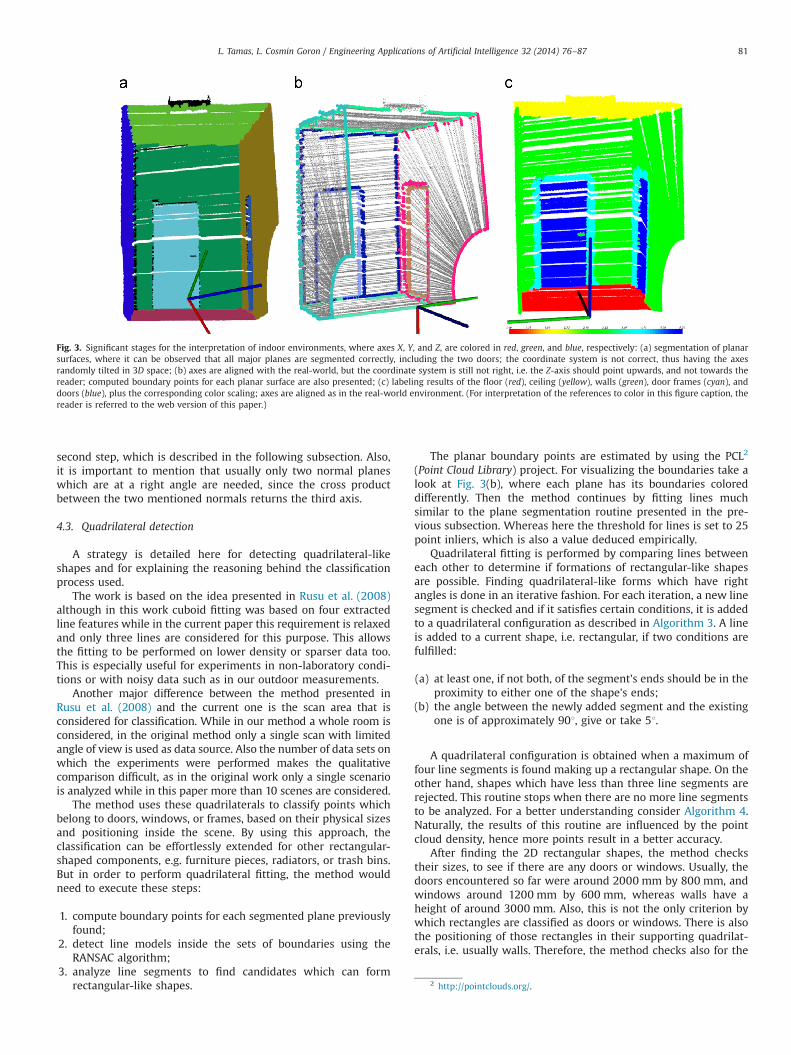
In this subsection, a technique is described for estimating theprincipal axes of indoor point cloud data described in detail inAlgorithm 2. First, planes are fitted using the RANSAC (Fischler andBolles, 1981) algorithm, by segmenting the inliers of each planeout of the point cloud. For an example of the final fitted planes,look at Fig. 3(a). This is repeated until the remaining points in thecloud fall under a certain threshold. The mentioned threshold isset to an empirical value of 2500 point inliers.
As expected, RANSAC always finds the dominant planes first,meaning the planes with the biggest number of inliers. Also in manyindoor environments most of the surface normals coincide with oneof the three main axes of the room. This is because most of the wallsand furniture surfaces are parallel and/or perpendicular to eachother. Therefore, the idea behind estimating the principal axes is tofind three planes, which can form a right angle between each othersnormals. The first step is to compare the normal of the mostsignificant plane with the normal of the second most significantplane and so on. When a match is found, those plane normals aremarked as axes for the new coordinate system. After the three planesand their corresponding normals are found, the point cloud istransformed into the new coordinate system. This was the initialguess stage of the estimation procedure.
Although now the points are aligned with the real-worldCartesian system of coordinates, the orientation of the threevectors representing the axes is most probably incorrect, as itcan be seen in Fig. 3(b). But the method will correct the axes in the
Table 2Evaluation of the registration on public data set.
Alg./transfrom error[cm] tx ty tz
ICPNARF 2.7072.96 2.2172.74 3.974.18ICPFPFH 1.3273.08 1.5972.13 2.7174.06ICPcombined 1.2172.59 1.1672.97 1.8273.25
Table 3Rules for labeling point of indoor environments.
Criterion Description
(i) In the majority of cases the walls inside houses and buildings formrectangular shapes
(ii) By considering also the floors and ceilings, cuboid shapes areobtained
(iii) Doors are always positioned on the edge of a wall, very close to thefloor
(iv) And if closed, a door is always parallel to its supporting wall; thesame for windows
(v) Windows are always located higher from the floor, and closer to theceiling
(vi) Furniture pieces are usually placed right against the walls, being alsoaligned accordingly
L. Tamas, L. Cosmin Goron / Engineering Applications of Artificial Intelligence 32 (2014) 76–8780
second step, which is described in the following subsection. Also,it is important to mention that usually only two normal planeswhich are at a right angle are needed, since the cross productbetween the two mentioned normals returns the third axis.
4.3. Quadrilateral detection
A strategy is detailed here for detecting quadrilateral-likeshapes and for explaining the reasoning behind the classificationprocess used.
The work is based on the idea presented in Rusu et al. (2008)although in this work cuboid fitting was based on four extractedline features while in the current paper this requirement is relaxedand only three lines are considered for this purpose. This allowsthe fitting to be performed on lower density or sparser data too.This is especially useful for experiments in non-laboratory condi-tions or with noisy data such as in our outdoor measurements.
Another major difference between the method presented inRusu et al. (2008) and the current one is the scan area that isconsidered for classification. While in our method a whole room isconsidered, in the original method only a single scan with limitedangle of view is used as data source. Also the number of data sets onwhich the experiments were performed makes the qualitativecomparison difficult, as in the original work only a single scenariois analyzed while in this paper more than 10 scenes are considered.
The method uses these quadrilaterals to classify points whichbelong to doors, windows, or frames, based on their physical sizesand positioning inside the scene. By using this approach, theclassification can be effortlessly extended for other rectangular-shaped components, e.g. furniture pieces, radiators, or trash bins.But in order to perform quadrilateral fitting, the method wouldneed to execute these steps:
1. compute boundary points for each segmented plane previouslyfound;
2. detect line models inside the sets of boundaries using theRANSAC algorithm;
3. analyze line segments to find candidates which can formrectangular-like shapes.
The planar boundary points are estimated by using the PCL2
(Point Cloud Library) project. For visualizing the boundaries take alook at Fig. 3(b), where each plane has its boundaries coloreddifferently. Then the method continues by fitting lines muchsimilar to the plane segmentation routine presented in the pre-vious subsection. Whereas here the threshold for lines is set to 25point inliers, which is also a value deduced empirically.
Quadrilateral fitting is performed by comparing lines betweeneach other to determine if formations of rectangular-like shapesare possible. Finding quadrilateral-like forms which have rightangles is done in an iterative fashion. For each iteration, a new linesegment is checked and if it satisfies certain conditions, it is addedto a quadrilateral configuration as described in Algorithm 3. A lineis added to a current shape, i.e. rectangular, if two conditions arefulfilled:
(a) at least one, if not both, of the segment's ends should be in theproximity to either one of the shape's ends;
(b) the angle between the newly added segment and the existingone is of approximately 901, give or take 51.
A quadrilateral configuration is obtained when a maximum offour line segments is found making up a rectangular shape. On theother hand, shapes which have less than three line segments arerejected. This routine stops when there are no more line segmentsto be analyzed. For a better understanding consider Algorithm 4.Naturally, the results of this routine are influenced by the pointcloud density, hence more points result in a better accuracy.
After finding the 2D rectangular shapes, the method checkstheir sizes, to see if there are any doors or windows. Usually, thedoors encountered so far were around 2000 mm by 800 mm, andwindows around 1200 mm by 600 mm, whereas walls have aheight of around 3000 mm. Also, this is not the only criterion bywhich rectangles are classified as doors or windows. There is alsothe positioning of those rectangles in their supporting quadrilat-erals, i.e. usually walls. Therefore, the method checks also for the
Fig. 3. Significant stages for the interpretation of indoor environments, where axes X, Y, and Z, are colored in red, green, and blue, respectively: (a) segmentation of planarsurfaces, where it can be observed that all major planes are segmented correctly, including the two doors; the coordinate system is not correct, thus having the axesrandomly tilted in 3D space; (b) axes are aligned with the real-world, but the coordinate system is still not right, i.e. the Z-axis should point upwards, and not towards thereader; computed boundary points for each planar surface are also presented; (c) labeling results of the floor (red), ceiling (yellow), walls (green), door frames (cyan), anddoors (blue), plus the corresponding color scaling; axes are aligned as in the real-world environment. (For interpretation of the references to color in this figure caption, thereader is referred to the web version of this paper.)
2 http://pointclouds.org/.
L. Tamas, L. Cosmin Goron / Engineering Applications of Artificial Intelligence 32 (2014) 76–87 81
relationships between rectangles, i.e. the relative position incomparison with one another. With the help of this information,the correct alignment of the coordinate system – see Fig. 3 – canbe detected.
As an example, think of a smaller rectangle, which is very closeto one of the edges of a bigger rectangle. If that smaller rectanglewithin the bigger rectangle has a size close to the system'sthresholds, then it can be asserted that the smaller rectangle is adoor, which lies on the floor, and that the Z-axis should beoriented upwards in the door's direction.
If the normal of the door is then considered, as for exampleY-axis, which is at a right angle with the newly found Z-axis, thecross product can be computed and the X-axis is obtained. The pointclouds are transformed according to the new axes, and the correc-tion of alignment has been fulfilled. Thus having the real-worldcoordinate system, the floor, ceiling, and walls can be determined, asshown in Fig. 3(c), by using a pass through filter along the Z-axis.
4.4. Detection of furniture
Our method is based not only on similar concept proposed inTuttas and Stilla (2011) but also incorporates constrains on theposition and size of the detected windows. Although windows andpictures may have the same silhouette, the way that they lay in thesupporting plane (i.e. the windows are embedded in the plane,while the pictures usually tumble out from the plane) makes themdistinguishable.
The number of furniture classified in the work (Rusu et al.,2008) is lower than that in the current work, the focus being in astatistical analysis of the proposed algorithms. The limitation ofthe current approach is related to the objects classes which wereconsidered at the design phase for the classifier.
The system extracts relevant planes from the registered pointcloud, categorizes them as doors or drawers, walls, floor, ceiling,and tables or other horizontal structures. This is achieved by first
locating the relevant planar structures, testing for the existence offixtures, and segmenting the different doors.
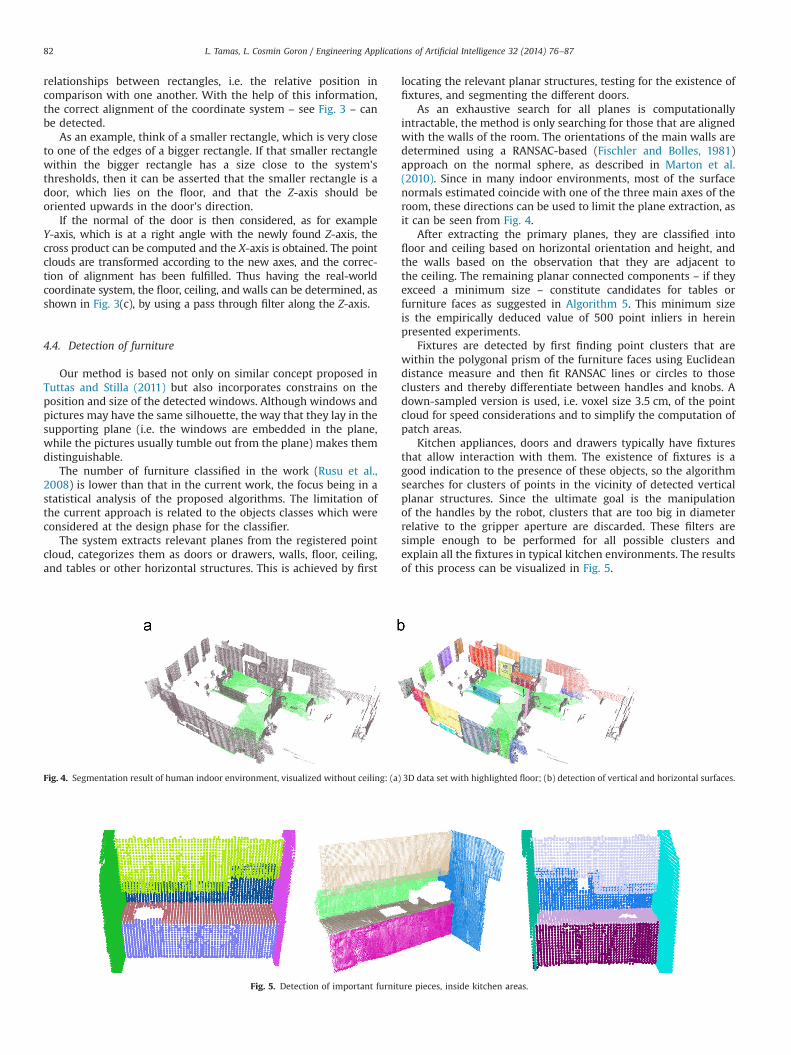
As an exhaustive search for all planes is computationallyintractable, the method is only searching for those that are alignedwith the walls of the room. The orientations of the main walls aredetermined using a RANSAC-based (Fischler and Bolles, 1981)approach on the normal sphere, as described in Marton et al.(2010). Since in many indoor environments, most of the surfacenormals estimated coincide with one of the three main axes of theroom, these directions can be used to limit the plane extraction, asit can be seen from Fig. 4.
After extracting the primary planes, they are classified intofloor and ceiling based on horizontal orientation and height, andthe walls based on the observation that they are adjacent tothe ceiling. The remaining planar connected components – if theyexceed a minimum size – constitute candidates for tables orfurniture faces as suggested in Algorithm 5. This minimum sizeis the empirically deduced value of 500 point inliers in hereinpresented experiments.
Fixtures are detected by first finding point clusters that arewithin the polygonal prism of the furniture faces using Euclideandistance measure and then fit RANSAC lines or circles to thoseclusters and thereby differentiate between handles and knobs. Adown-sampled version is used, i.e. voxel size 3.5 cm, of the pointcloud for speed considerations and to simplify the computation ofpatch areas.
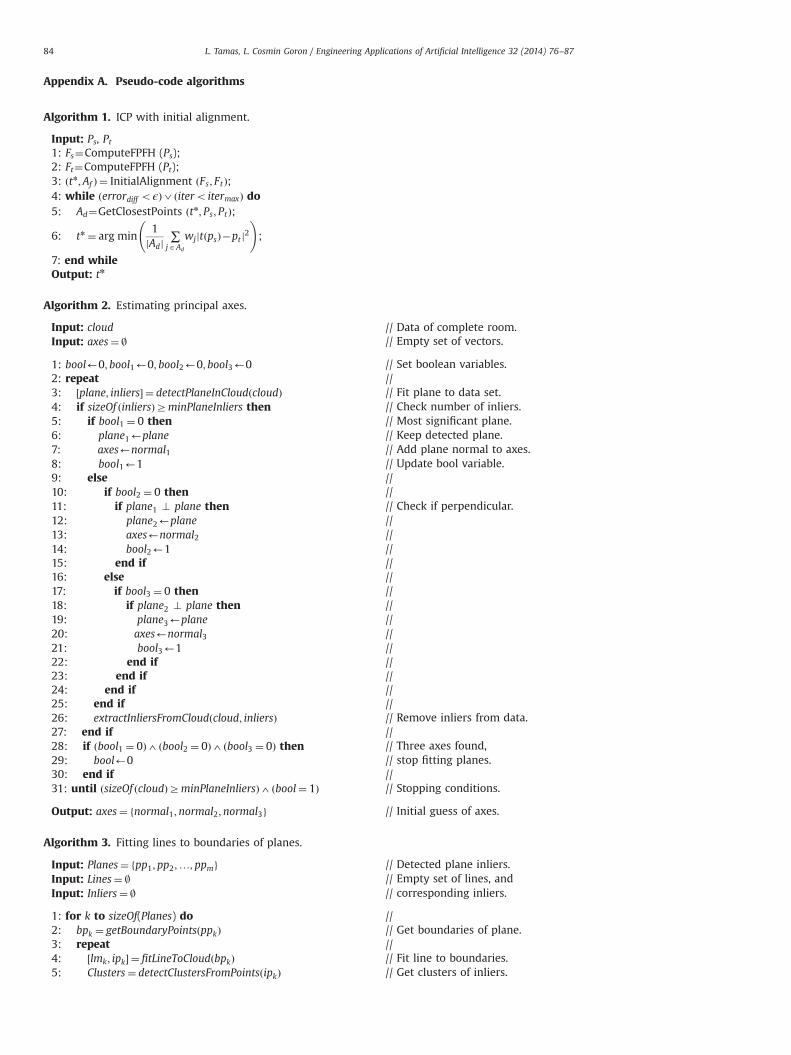
Kitchen appliances, doors and drawers typically have fixturesthat allow interaction with them. The existence of fixtures is agood indication to the presence of these objects, so the algorithmsearches for clusters of points in the vicinity of detected verticalplanar structures. Since the ultimate goal is the manipulationof the handles by the robot, clusters that are too big in diameterrelative to the gripper aperture are discarded. These filters aresimple enough to be performed for all possible clusters andexplain all the fixtures in typical kitchen environments. The resultsof this process can be visualized in Fig. 5.
Fig. 4. Segmentation result of human indoor environment, visualized without ceiling: (a) 3D data set with highlighted floor; (b) detection of vertical and horizontal surfaces.
Fig. 5. Detection of important furniture pieces, inside kitchen areas.
L. Tamas, L. Cosmin Goron / Engineering Applications of Artificial Intelligence 32 (2014) 76–8782
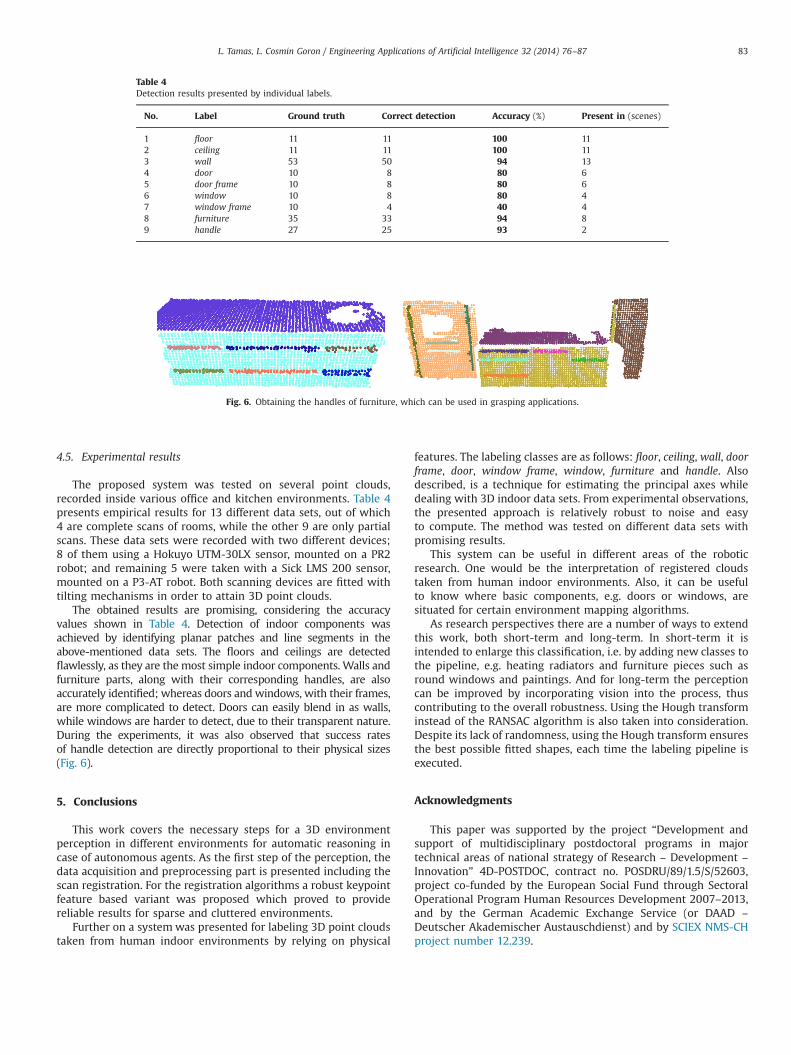
4.5. Experimental results
The proposed system was tested on several point clouds,recorded inside various office and kitchen environments. Table 4presents empirical results for 13 different data sets, out of which4 are complete scans of rooms, while the other 9 are only partialscans. These data sets were recorded with two different devices;8 of them using a Hokuyo UTM-30LX sensor, mounted on a PR2robot; and remaining 5 were taken with a Sick LMS 200 sensor,mounted on a P3-AT robot. Both scanning devices are fitted withtilting mechanisms in order to attain 3D point clouds.
The obtained results are promising, considering the accuracyvalues shown in Table 4. Detection of indoor components wasachieved by identifying planar patches and line segments in theabove-mentioned data sets. The floors and ceilings are detectedflawlessly, as they are the most simple indoor components. Walls andfurniture parts, along with their corresponding handles, are alsoaccurately identified; whereas doors and windows, with their frames,are more complicated to detect. Doors can easily blend in as walls,while windows are harder to detect, due to their transparent nature.During the experiments, it was also observed that success ratesof handle detection are directly proportional to their physical sizes(Fig. 6).
5. Conclusions
This work covers the necessary steps for a 3D environmentperception in different environments for automatic reasoning incase of autonomous agents. As the first step of the perception, thedata acquisition and preprocessing part is presented including thescan registration. For the registration algorithms a robust keypointfeature based variant was proposed which proved to providereliable results for sparse and cluttered environments.
Further on a system was presented for labeling 3D point cloudstaken from human indoor environments by relying on physical
features. The labeling classes are as follows: floor, ceiling, wall, doorframe, door, window frame, window, furniture and handle. Alsodescribed, is a technique for estimating the principal axes whiledealing with 3D indoor data sets. From experimental observations,the presented approach is relatively robust to noise and easyto compute. The method was tested on different data sets withpromising results.
This system can be useful in different areas of the roboticresearch. One would be the interpretation of registered cloudstaken from human indoor environments. Also, it can be usefulto know where basic components, e.g. doors or windows, aresituated for certain environment mapping algorithms.
As research perspectives there are a number of ways to extendthis work, both short-term and long-term. In short-term it isintended to enlarge this classification, i.e. by adding new classes tothe pipeline, e.g. heating radiators and furniture pieces such asround windows and paintings. And for long-term the perceptioncan be improved by incorporating vision into the process, thuscontributing to the overall robustness. Using the Hough transforminstead of the RANSAC algorithm is also taken into consideration.Despite its lack of randomness, using the Hough transform ensuresthe best possible fitted shapes, each time the labeling pipeline isexecuted.
Acknowledgments
This paper was supported by the project “Development andsupport of multidisciplinary postdoctoral programs in majortechnical areas of national strategy of Research – Development –Innovation” 4D-POSTDOC, contract no. POSDRU/89/1.5/S/52603,project co-funded by the European Social Fund through SectoralOperational Program Human Resources Development 2007–2013,and by the German Academic Exchange Service (or DAAD –
Deutscher Akademischer Austauschdienst) and by SCIEX NMS-CHproject number 12.239.
Table 4Detection results presented by individual labels.
No. Label Ground truth Correct detection Accuracy (%) Present in (scenes)
1 floor 11 11 100 112 ceiling 11 11 100 113 wall 53 50 94 134 door 10 8 80 65 door frame 10 8 80 66 window 10 8 80 47 window frame 10 4 40 48 furniture 35 33 94 89 handle 27 25 93 2
Fig. 6. Obtaining the handles of furniture, which can be used in grasping applications.
L. Tamas, L. Cosmin Goron / Engineering Applications of Artificial Intelligence 32 (2014) 76–87 83
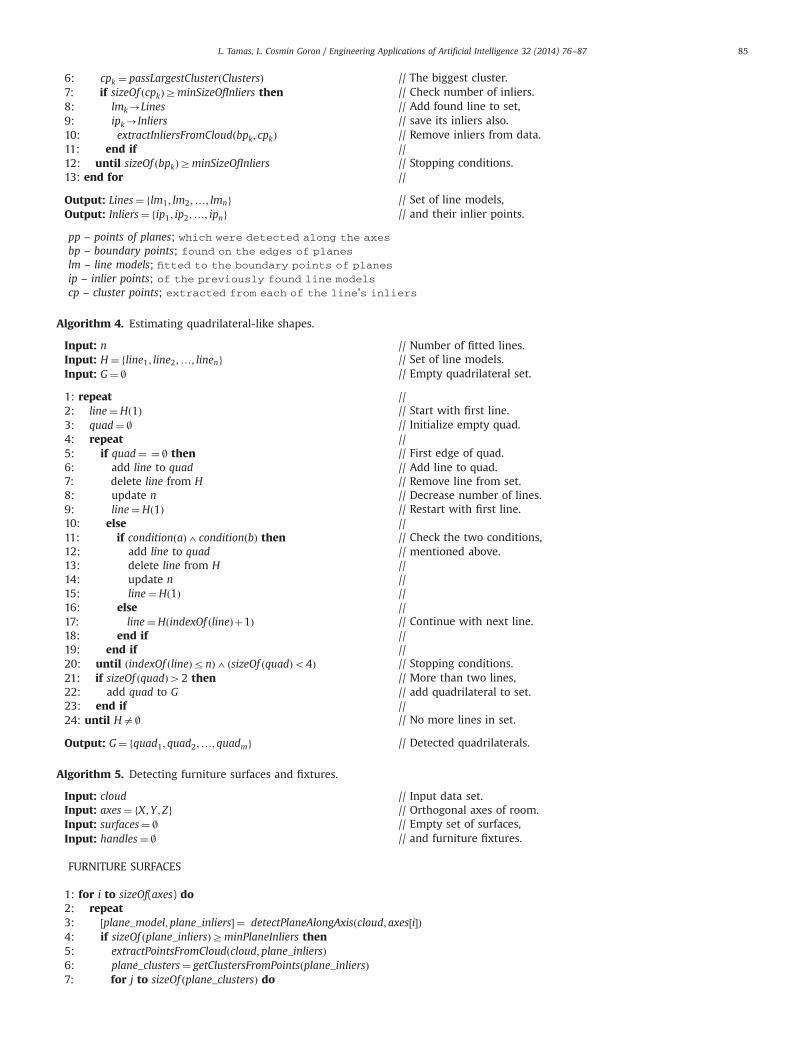
Appendix A. Pseudo-code algorithms
Algorithm 1. ICP with initial alignment.
Input: Ps, Pt1: Fs¼ComputeFPFH (Ps);2: Ft¼ComputeFPFH (Pt);3: ðtn;Af Þ ¼ InitialAlignment ðFs; FtÞ;4: while ðerrordiff oϵÞ3 ðitero itermaxÞ do5: Ad¼GetClosestPoints ðtn; Ps; PtÞ;
6: tn ¼ arg min1
jAdj∑
jAAd
wjjtðpsÞ�pt j2 !
;
7: end whileOutput: tn
Algorithm 2. Estimating principal axes.
Input: cloud // Data of complete room.Input: axes¼ | // Empty set of vectors.
1: bool’0; bool1’0; bool2’0; bool3’0 // Set boolean variables.2: repeat //3: ½plane; inliers� ¼ detectPlaneInCloudðcloudÞ // Fit plane to data set.4: if sizeOf ðinliersÞZminPlaneInliers then // Check number of inliers.5: if bool1 ¼ 0 then // Most significant plane.6: plane1’plane // Keep detected plane.7: axes’normal1 // Add plane normal to axes.8: bool1’1 // Update bool variable.9: else //10: if bool2 ¼ 0 then //11: if plane1 ? plane then // Check if perpendicular.12: plane2’plane //13: axes’normal2 //14: bool2’1 //15: end if //16: else //17: if bool3 ¼ 0 then //18: if plane2 ? plane then //19: plane3’plane //20: axes’normal3 //21: bool3’1 //22: end if //23: end if //24: end if //25: end if //26: extractInliersFromCloudðcloud; inliersÞ // Remove inliers from data.27: end if //28: if ðbool1 ¼ 0Þ4 ðbool2 ¼ 0Þ4ðbool3 ¼ 0Þ then // Three axes found,29: bool’0 // stop fitting planes.30: end if //31: until ðsizeOf ðcloudÞZminPlaneInliersÞ4 ðbool¼ 1Þ // Stopping conditions.
Output: axes¼ fnormal1;normal2;normal3g // Initial guess of axes.
Algorithm 3. Fitting lines to boundaries of planes.
Input: Planes¼ fpp1;pp2;…; ppmg // Detected plane inliers.Input: Lines¼ | // Empty set of lines, andInput: Inliers¼ | // corresponding inliers.
1: for k to sizeOf(Planes) do //2: bpk ¼ getBoundaryPointsðppkÞ // Get boundaries of plane.3: repeat //4: ½lmk; ipk� ¼ fitLineToCloudðbpkÞ // Fit line to boundaries.5: Clusters¼ detectClustersFromPointsðipkÞ // Get clusters of inliers.
L. Tamas, L. Cosmin Goron / Engineering Applications of Artificial Intelligence 32 (2014) 76–8784
6: cpk ¼ passLargestClusterðClustersÞ // The biggest cluster.7: if sizeOf ðcpkÞZminSizeOfInliers then // Check number of inliers.8: lmk-Lines // Add found line to set,9: ipk-Inliers // save its inliers also.10: extractInliersFromCloudðbpk; cpkÞ // Remove inliers from data.11: end if //12: until sizeOf ðbpkÞZminSizeOfInliers // Stopping conditions.13: end for //
Output: Lines¼ flm1; lm2;…; lmng // Set of line models,Output: Inliers¼ fip1; ip2;…; ipng // and their inlier points.
pp – points of planes; which were detected along the axes
bp – boundary points; found on the edges of planes
lm – line models; fitted to the boundary points of planes
ip – inlier points; of the previously found line models
cp – cluster points; extracted from each of the line's inliers
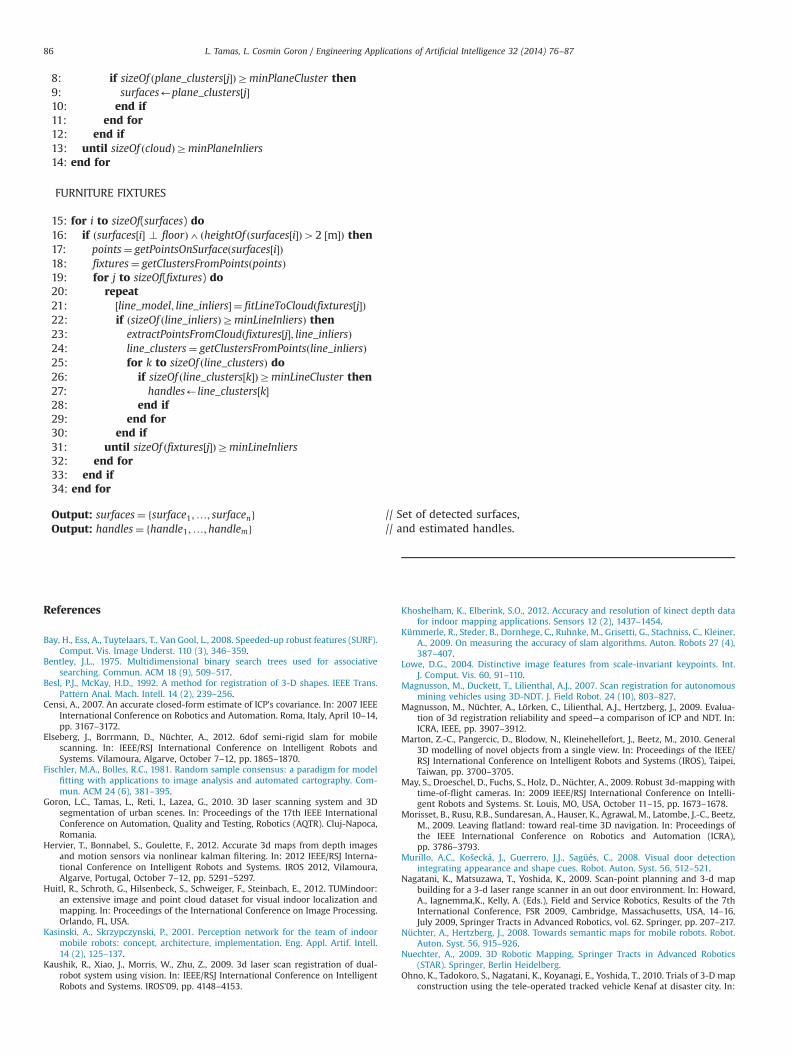
Algorithm 4. Estimating quadrilateral-like shapes.
Input: n // Number of fitted lines.Input: H ¼ fline1; line2;…; lineng // Set of line models.Input: G¼ | // Empty quadrilateral set.
1: repeat //2: line¼Hð1Þ // Start with first line.3: quad¼ | // Initialize empty quad.4: repeat //5: if quad¼ ¼ | then // First edge of quad.6: add line to quad // Add line to quad.7: delete line from H // Remove line from set.8: update n // Decrease number of lines.9: line¼Hð1Þ // Restart with first line.10: else //11: if conditionðaÞ4conditionðbÞ then // Check the two conditions,12: add line to quad // mentioned above.13: delete line from H //14: update n //15: line¼Hð1Þ //16: else //17: line¼HðindexOf ðlineÞþ1Þ // Continue with next line.18: end if //19: end if //20: until ðindexOf ðlineÞrnÞ4ðsizeOf ðquadÞo4Þ // Stopping conditions.21: if sizeOf ðquadÞ42 then // More than two lines,22: add quad to G // add quadrilateral to set.23: end if //24: until Ha| // No more lines in set.
Output: G¼ fquad1; quad2;…; quadmg // Detected quadrilaterals.
Algorithm 5. Detecting furniture surfaces and fixtures.
Input: cloud // Input data set.Input: axes¼ fX;Y ; Zg // Orthogonal axes of room.Input: surfaces¼ | // Empty set of surfaces,Input: handles¼ | // and furniture fixtures.
FURNITURE SURFACES
1: for i to sizeOf(axes) do2: repeat3: ½plane_model; plane_inliers� ¼ detectPlaneAlongAxisðcloud; axes½i�Þ4: if sizeOf ðplane_inliersÞZminPlaneInliers then5: extractPointsFromCloudðcloud; plane_inliersÞ6: plane_clusters¼ getClustersFromPointsðplane_inliersÞ7: for j to sizeOf ðplane_clustersÞ do
L. Tamas, L. Cosmin Goron / Engineering Applications of Artificial Intelligence 32 (2014) 76–87 85
8: if sizeOf ðplane_clusters½j�ÞZminPlaneCluster then9: surfaces’plane_clusters½j�10: end if11: end for12: end if13: until sizeOf ðcloudÞZminPlaneInliers14: end for
FURNITURE FIXTURES
15: for i to sizeOf(surfaces) do16: if ðsurfaces½i� ? floorÞ4 ðheightOf ðsurfaces½i�Þ42 ½m�Þ then17: points¼ getPointsOnSurfaceðsurfaces½i�Þ18: fixtures¼ getClustersFromPointsðpointsÞ19: for j to sizeOf(fixtures) do20: repeat21: ½line_model; line_inliers� ¼ fitLineToCloudðfixtures½j�Þ22: if ðsizeOf ðline_inliersÞZminLineInliersÞ then23: extractPointsFromCloudðfixtures½j�; line_inliersÞ24: line_clusters¼ getClustersFromPointsðline_inliersÞ25: for k to sizeOf ðline_clustersÞ do26: if sizeOf ðline_clusters½k�ÞZminLineCluster then27: handles’line_clusters½k�28: end if29: end for30: end if31: until sizeOf ðfixtures½j�ÞZminLineInliers32: end for33: end if34: end for
Output: surfaces¼ fsurface1;…; surfaceng // Set of detected surfaces,Output: handles¼ fhandle1;…;handlemg // and estimated handles.
References
Bay, H., Ess, A., Tuytelaars, T., Van Gool, L., 2008. Speeded-up robust features (SURF).Comput. Vis. Image Underst. 110 (3), 346–359.
Bentley, J.L., 1975. Multidimensional binary search trees used for associativesearching. Commun. ACM 18 (9), 509–517.
Besl, P.J., McKay, H.D., 1992. A method for registration of 3-D shapes. IEEE Trans.Pattern Anal. Mach. Intell. 14 (2), 239–256.
Censi, A., 2007. An accurate closed-form estimate of ICP's covariance. In: 2007 IEEEInternational Conference on Robotics and Automation. Roma, Italy, April 10–14,pp. 3167–3172.
Elseberg, J., Borrmann, D., Nüchter, A., 2012. 6dof semi-rigid slam for mobilescanning. In: IEEE/RSJ International Conference on Intelligent Robots andSystems. Vilamoura, Algarve, October 7–12, pp. 1865–1870.
Fischler, M.A., Bolles, R.C., 1981. Random sample consensus: a paradigm for modelfitting with applications to image analysis and automated cartography. Com-mun. ACM 24 (6), 381–395.
Goron, L.C., Tamas, L., Reti, I., Lazea, G., 2010. 3D laser scanning system and 3Dsegmentation of urban scenes. In: Proceedings of the 17th IEEE InternationalConference on Automation, Quality and Testing, Robotics (AQTR). Cluj-Napoca,Romania.
Hervier, T., Bonnabel, S., Goulette, F., 2012. Accurate 3d maps from depth imagesand motion sensors via nonlinear kalman filtering. In: 2012 IEEE/RSJ Interna-tional Conference on Intelligent Robots and Systems. IROS 2012, Vilamoura,Algarve, Portugal, October 7–12, pp. 5291–5297.
Huitl, R., Schroth, G., Hilsenbeck, S., Schweiger, F., Steinbach, E., 2012. TUMindoor:an extensive image and point cloud dataset for visual indoor localization andmapping. In: Proceedings of the International Conference on Image Processing.Orlando, FL, USA.
Kasinski, A., Skrzypczynski, P., 2001. Perception network for the team of indoormobile robots: concept, architecture, implementation. Eng. Appl. Artif. Intell.14 (2), 125–137.
Kaushik, R., Xiao, J., Morris, W., Zhu, Z., 2009. 3d laser scan registration of dual-robot system using vision. In: IEEE/RSJ International Conference on IntelligentRobots and Systems. IROS'09, pp. 4148–4153.
Khoshelham, K., Elberink, S.O., 2012. Accuracy and resolution of kinect depth datafor indoor mapping applications. Sensors 12 (2), 1437–1454.
Kümmerle, R., Steder, B., Dornhege, C., Ruhnke, M., Grisetti, G., Stachniss, C., Kleiner,A., 2009. On measuring the accuracy of slam algorithms. Auton. Robots 27 (4),387–407.
Lowe, D.G., 2004. Distinctive image features from scale-invariant keypoints. Int.J. Comput. Vis. 60, 91–110.
Magnusson, M., Duckett, T., Lilienthal, A.J., 2007. Scan registration for autonomousmining vehicles using 3D-NDT. J. Field Robot. 24 (10), 803–827.
Magnusson, M., Nüchter, A., Lörken, C., Lilienthal, A.J., Hertzberg, J., 2009. Evalua-tion of 3d registration reliability and speed—a comparison of ICP and NDT. In:ICRA, IEEE, pp. 3907–3912.
Marton, Z.-C., Pangercic, D., Blodow, N., Kleinehellefort, J., Beetz, M., 2010. General3D modelling of novel objects from a single view. In: Proceedings of the IEEE/RSJ International Conference on Intelligent Robots and Systems (IROS), Taipei,Taiwan, pp. 3700–3705.
May, S., Droeschel, D., Fuchs, S., Holz, D., Nüchter, A., 2009. Robust 3d-mapping withtime-of-flight cameras. In: 2009 IEEE/RSJ International Conference on Intelli-gent Robots and Systems. St. Louis, MO, USA, October 11–15, pp. 1673–1678.
Morisset, B., Rusu, R.B., Sundaresan, A., Hauser, K., Agrawal, M., Latombe, J.-C., Beetz,M., 2009. Leaving flatland: toward real-time 3D navigation. In: Proceedings ofthe IEEE International Conference on Robotics and Automation (ICRA),pp. 3786–3793.
Murillo, A.C., Košecká, J., Guerrero, J.J., Sagüés, C., 2008. Visual door detectionintegrating appearance and shape cues. Robot. Auton. Syst. 56, 512–521.
Nagatani, K., Matsuzawa, T., Yoshida, K., 2009. Scan-point planning and 3-d mapbuilding for a 3-d laser range scanner in an out door environment. In: Howard,A., Iagnemma,K., Kelly, A. (Eds.), Field and Service Robotics, Results of the 7thInternational Conference, FSR 2009, Cambridge, Massachusetts, USA, 14–16,July 2009, Springer Tracts in Advanced Robotics, vol. 62. Springer, pp. 207–217.
Nüchter, A., Hertzberg, J., 2008. Towards semantic maps for mobile robots. Robot.Auton. Syst. 56, 915–926.
Nuechter, A., 2009. 3D Robotic Mapping, Springer Tracts in Advanced Robotics(STAR). Springer, Berlin Heidelberg.
Ohno, K., Tadokoro, S., Nagatani, K., Koyanagi, E., Yoshida, T., 2010. Trials of 3-D mapconstruction using the tele-operated tracked vehicle Kenaf at disaster city. In:
L. Tamas, L. Cosmin Goron / Engineering Applications of Artificial Intelligence 32 (2014) 76–8786
International Conference on Robotics and Automation (ICRA), Anchorage, AK,USA, pp. 2864–2870.
Papadakis, P., 2013. Terrain traversability analysis methods for unmanned groundvehicles: a survey. Eng. Appl. Artif. Intell. 26 (4), 1373–1385.
Pathak, K., Birk, A., Vaskevicius, N., Poppinga, J., 2010. Fast registration based onnoisy planes with unknown correspondences for 3D mapping. IEEE Trans.Robot. 26, 424–441.
Rusu, R.B., 2009. Semantic 3D Object Maps for Everyday Manipulation in HumanLiving Environments (Ph.D. thesis).
Rusu, R.B., Cousins, S., 2011. 3D is here: Point Cloud Library (PCL). In: Proceedingsof the IEEE International Conference on Robotics and Automation (ICRA),Shanghai, China.
Rusu, R.B., Marton, Z.-C., Blodow, N., Dolha, M., Beetz, M., 2008. Towards 3D pointcloud based object maps for household environments. Robot. Auton. Syst. 56,927–941.
Rusu, R.B., Bradski, G., Thibaux, R., Hsu, J., 2010. Fast 3D recognition and pose usingthe viewpoint feature histogram. In: Proceedings of the 23rd IEEE InternationalConference on Intelligent Robots and Systems (IROS), Taipei, Taiwan.
Salvi, J., Matabosch, C., Fofi, D., Forest, J., 2007. A review of recent range imageregistration methods with accuracy evaluation. Image Vis. Comput. 25,578–596.
Scharstein, D., Szeliski, R., 2002. A taxonomy and evaluation of dense two-framestereo correspondence algorithms. Int. J. Comput. Vis. 47 (1–3), 7–42.
Sharp, G.C., Lee, S.W., Wehe, D.K., 2002. ICP registration using invariant features.IEEE Trans. Pattern Anal. Mach. Intell. 24 (1), 90–102.
Silva, L.C.D., Morikawa, C., Petra, I.M., 2012. State of the art of smart homes. Eng.Appl. Artif. Intell. 25 (7), 1313–1321.
Steder, B., Rusu, R.B., Konolige, K., Burgard, W., 2010. NARF: 3D range image featuresfor object recognition. In: Workshop at the IEEE/RSJ International Conferenceon Intelligent Robots and Systems (IROS), Taipei, Taiwan.
Steder, B., Rusu, R.B., Konolige, K., 2011. Point feature extraction on 3D range scanstaking into account object boundaries. In: Proceeding of the IEEE InternationalConference on Robotics and Automation. ICRA 2011, Shanghai, China, May 9–13,pp. 2601–2608.
Strasdat, H., 2012. Local Accuracy and Global Consistency for Efficient Visual SLAM(Ph.D. thesis).
Surmann, H., Lingemann, K., Nuchter, A., Hertzberg, J., 2001. A 3D Laser RangeFinder for Autonomous Mobile Robots, Seoul, South Korea, pp. 153–158.
Tamas, L., Goron, L.C., 2012. 3D map building with mobile robots. In: Proceedings of the20th Mediterranean Conference on Control and Automation (MED), Barcelona,Spain.
Tamas, L., Majdik, A., 2012. Heterogeneous feature based correspondence estimation.In: Proceedings of the IEEE International Conference on Multisensor Fusion andIntegration for Intelligent Systems (MFI), Hamburg, Germany, pp. 89–94.
Tuttas, S., Stilla, U., 2011. Window detection in sparse point clouds using indoorpoints. In: ISPRS Conference: Photogrammetric Image Analysis (PIA),vol. XXXVIII-3/W22, Munich, Germany.
Zhang, Z., 1992. Iterative Point Matching for Registration of Free-form Curves.Technical Report No. RR-1658.
Zhang, A., Hu, S., Chen, Y., Liu, H., Yang, F., Liu, J., 2008. Fast continuous 360 degreecolor 3D laser scanner. In: The International Archives of the Photogrammetry,Remote Sensing and Spatial Information Sciences, vol. 36, pp. 409–415.
L. Tamas, L. Cosmin Goron / Engineering Applications of Artificial Intelligence 32 (2014) 76–87 87