Embed Size (px)
Citation preview
21? /V8M
m. t-tinr
AN INVESTIGATION OF FACTORS AFFECTING
TEST EQUATING IN LATENT TRAIT THEORY
DISSERTATION
Presented to the Graduate Council of the
University of North Texas in Partial
Fulfillment of the Requirements
For the Degree of
DOCTOR OF PHILOSOPHY
By
Surintorn Suanthong, M.Ed.
Denton, Texas
August, 1998
Suanthong, Surintorn, An investigation of factors affectinp test equating in latent
trait theory. Doctor of Philosophy (Educational Research), August, 1998, 78 pp., 13
tables, 4 appendices, 30 references.
The study investigated five factors which can affect the equating of scores from
two tests onto a common score scale. The five factors studied were: (a) distribution type
(i.e., normal versus uniform); (b) standard deviation of item difficulties (i.e., .68, .95, .99);
(c) test length or number of test items (i.e., 50,100, 200); (d) number of common items
(i.e., 10,20,30); and (e) sample size (i.e., 100, 300, 500). The SIMTEST and BIGSTEPS
programs were used for the simulation and equating of4,860 test item data sets,
respectively, and were automated by using a QUICKBASIC program. Results from the
five-way fixed effects factorial analysis of variance indicated that there were three
statistically significant two-way interaction effects. The significant two-way interaction
effects were for common item length and test length, standard deviation of item difficulties
and distribution type, and standard deviation of item difficulties and sample size. The
number of common items had the most impact on test equating when interacting with test
length. The best combination of factors to consider when equating two tests appears to be
a uniform distribution type, .99 standard deviation of item difficulties, and a test length of
100 items, 20 common items, and a sample size of 100.

21? /V8M
m. t-tinr
AN INVESTIGATION OF FACTORS AFFECTING
TEST EQUATING IN LATENT TRAIT THEORY
DISSERTATION
Presented to the Graduate Council of the
University of North Texas in Partial
Fulfillment of the Requirements
For the Degree of
DOCTOR OF PHILOSOPHY
By
Surintorn Suanthong, M.Ed.
Denton, Texas
August, 1998

ACKNOWLEDGMENTS
The author has been guided and advised by Dr. Randall E. Schumacker on this
dissertation topic. Countless thanks to Dr. Schumacker for his crucial assistance,
motivation, and patience. Thanks to Dr. Michael Beyerlein, minor professor in
psychology, for his support and assistance. Thanks to Richard Herrington, doctoral
student in psychology, for assisting with the QuickBasic program in the data simulation
and data analysis portions of this study. I wish to thank my family in Thailand for their
support during my graduate program at UNT. Many thanks to my friends inside and
outside USA for their emotional support.
in
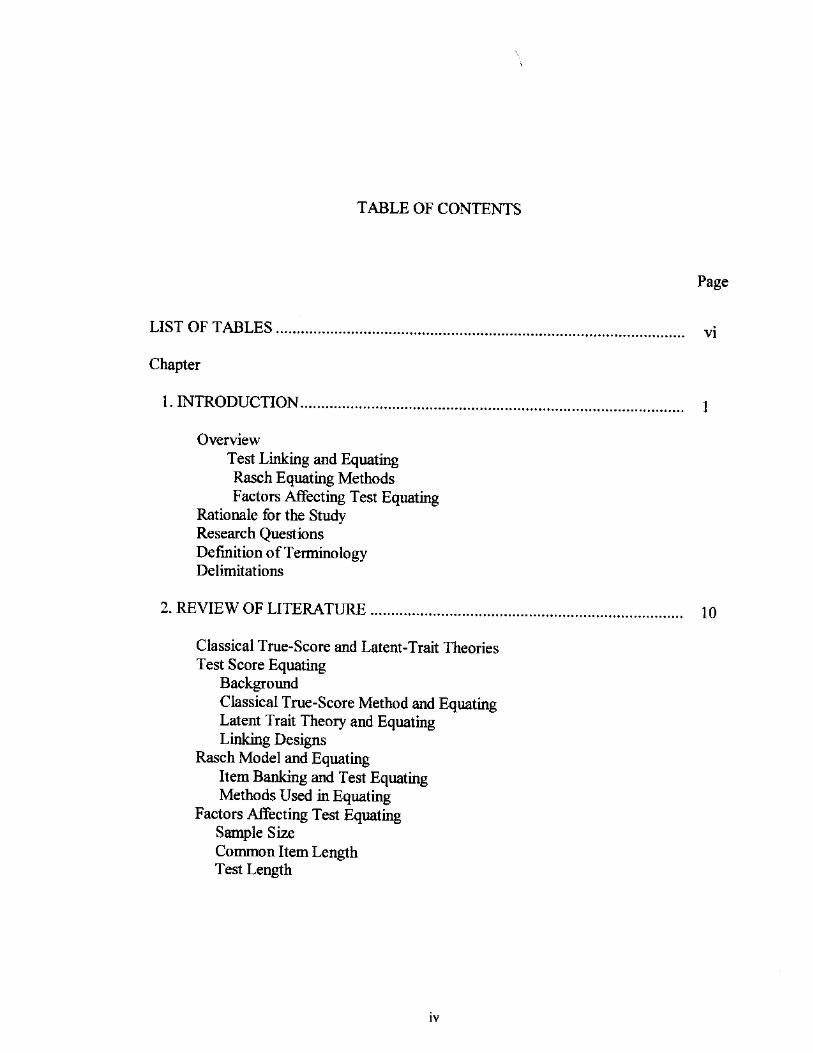
TABLE OF CONTENTS
Page
LIST OF TABLES v i
Chapter
1. INTRODUCTION j
Overview Test Linking and Equating Rasch Equating Methods Factors Affecting Test Equating
Rationale for the Study Research Questions Definition of Terminology Delimitations
2. REVIEW OF LITERATURE 10
Classical True-Score and Latent-Trait Theories Test Score Equating
Background Classical True-Score Method and Equating Latent Trait Theory and Equating Linking Designs
Rasch Model and Equating Item Banking and Test Equating Methods Used in Equating
Factors Affecting Test Equating Sample Size Common Item Length Test Length
IV

Page
3. METHODS AND PROCEDURES 25
Simulated Data Sets SIMTEST Program
Test Conditions Equating Procedure
BIGSTEPS Program QBASIC Program
Statistical Hypotheses Statistical Analyses
4. RESULTS 38
First Statistical Hypothesis Second Statistical Hypothesis
5. CONCLUSIONS AND RECOMMENDATIONS 57
Findings Effect Size Interpretation Test Equating Effectiveness Further Study
APPENDIX
A. SIMTEST Program (DATA SET 1) 61
B. Control and Data File 63
C. Anchor File 65
D. QuickBasic Program 67
REFERENCES 75

LIST OF TABLES
Page
Table
1. Test Conditions for Equated Tests with Normal Distribution 27
2. Test Conditions for Equated Tests with Uniform Distribution 30
3. Five-Way Fixed Effects Analysis of Variance on Person Measures 38
4. Simple Effects of Common Item Length and Test Length on Person Measures.. 41
5. Simple Effects of Standard Deviation of Item Difficulty and Distribution Type on Person Measures 42
6. Simple Effects of Standard Deviation of Item Difficulty and Sample Size on Person Measures 43
7. Pairwise Combinations for Common Item Length and Test Length Interaction.. 44
8. Tukey Q Statistical Values for Mean Pairwise Comparisons of Common Item Length and Test Length Interaction 45
9. Pairwise Combinations for Distribution Type and Standard Deviation of Item Difficulty Interaction 45
10. Tukey Q Statistical Values for Mean Pairwise Comparisons of Distribution Type and Standard Deviation of Item Difficulty Interaction 46
11. Pairwise Combinations for Standard Deviation of Item Difficulty and Sample Size Interaction
12. Tukey Q Statistical Values for Mean Pairwise Comparisons of Standard Deviation of Item Difficulty and Sample Size Interaction 48
13. Best Combination of Five Factors For Test Equating on Common Item Measures 49
VI

CHAPTER 1
INTRODUCTION
Overview
In recent years, the use of test equating has grown substantially. The literature and
practice reflects the variety of theoretical frameworks underlying the process of test
equating, including the factors studied herein that are involved in the actual equating of
test forms. Test equating is an essential technique when comparing scores from one test to
another. If two tests or other types of assessments do not satisfy the assumptions for
equating, then the scores are unfairly compared. An advantage of equated scores is that
they can be used interchangeably. Any use or interpretation justified for scores on Test X
is also justified for the equated scores from Test Y. However, if the test equating process
is done incorrectly, score interpretation is misleading. Consequently, test equating needs
to be better understood and correctly performed.
Test Linking and Equating
Test linking or equating is a term used primarily to refer to the creation of a
common score scale from scores obtained on two or more tests (Peterson, Kolen, &
Hoover, 1989; Kolen & Brennan, 1995). The word linking is a generic term that includes a
variety of approaches to make results of one assessment comparable to those of another.

There are a variety of other terms (e.g., anchoring, benchmarking, calibration
equating, prediction, scaling, statistical moderation, social purpose, verification, and
auditing) that have been used for this purpose (Linn, 1993). Some have well-established
technical requirements while others do not. In some cases, a single term may be used with
different meanings in different contexts.
The most apparent use for such methods is when alternate or parallel forms of a
test are created, although current uses permit the linking of a series of assessments to
performance standards (Wahman, 1997) or linking assessments across languages (Sireci,
1997). With increased demands for various types of assessments, test equating permits a
comparison of assessments from multiple sources by linking results from the distinct
assessments (e.g., the results from a state assessment and the results on a national or
international assessment). The degree to which desired interpretations and inferences are
justified, however, depends on the nature of the assessments being compared and the
ways in which the linkage occurs. Five different types of linking have been distinguished
and described by Mislevy (1992) and Linn (1993). The five types of linking are: (a)
equating, (b) calibration, (c) projection or prediction, (d) statistical moderation, and (e)
social moderation. Social moderation is the only one which uses a judgmental approach,
whereas the other types use statistical procedures to establish a link between score scales
on two or more tests.
Equating is a procedure used for removing the effects on test scores of differences
in average item difficulty levels and average item discrimination levels between two or
more forms of a test created to be equivalent. Equating can be horizontal (between tests

of equivalent difficulties and content) or vertical (between tests of intentionally different
difficulties). Most equating research has divided equating techniques into classical true
score theory (CRT) and item response theory (IRT).
The CRT methods have been described by Angoff (1984). The two most common
approaches are linear and equipercentile equating. In linear equating, equated raw scores
from two tests are based on equal standard scores. For equipercentile equating, equated
raw scores are based on equal percentile ranks from two tests; Items at the same
percentile level are used to combine scores. Both of these procedures depend upon
samples of persons with equal ability.
The IRT methods have been developed by Lord (1980) and Wright and Stone
(1979), to name only a few. In these methods, a mathematical relationship between
scores on tests is modeled. This relationship is based on estimates of item parameters
from two tests and the placement of these estimates on the same metric. In IRT methods,
horizontal and vertical equating are commonly used. Horizontal equating requires a
common metric from a pool of items or tests that measure students at the same age or
educational level, and who have a homogeneous ability distribution. Vertical equating
requires a common metric from a pool of items or tests that measure students at different
ages of educational levels, and who have a heterogeneous (very different) ability
distribution. Obviously, if every student could take every item there would be no need to
employ test equating. This is not always possible, especially when developing a common
mathematics scale for grades 1 to 8 that spans several years of instruction (Smith, 1992).

Rasch Equating Methods
The Rasch measurement model, which is a type of IRT method, is often used to
create item banks. Links of 10 to 20 common items are typically embedded in two
different tests. Each test is then administered to a separate group of persons. A person
doesn't need to take both tests. The persons' score on both tests can be computed by using
the set of common items.
Wright and Stone (1979) described the Rasch approach to test equating whereby a
set of common items is identified a priori. The calibrations of the items for each of the
two tests are computed, then the item calibration differences are averaged to create a
linking value for purposes of equating the two tests. This linking approach, however,
almost always involves excluding one or more items from the linking set to obtain a
defensible linking value. Ingebo (1997) recommended replicating the linking value by
creating a third "linking" test containing different linking items which is linked
independently with each of the two originally linked tests. This third test should be close in
mean difficulties to the other two tests. The sum of the links between the third test and the
two original tests can be compared to the direct link. As Wright and Stone (1979) pointed
out, in some cases the adequacy of the common item equating approach can be compared
by examining a plot of the item difficulties when not linked (reference scaled against when
linked (common item scale), assuming all subjects take all items on the tests.
Test equating with the Rasch model has used either common fljnlrinrt items or
Pe r s o n s t 0 P lace i t e m s from different tests and different calibrations onto a common metric
(Wright & Stone, 1979; Wright & Bell, 1984). Recent developments in Rasch calibration
or programs (Wright, Congdon, & Rossner, 1986) make it possible to exclude omitted
unadministered items from the calibration process and thus allow the calibration of
multiple forms on a common metric. Test equating using linking items is based on the
distribution fr ee property of the item difficulty estimation. The only difference between
two administrations of the same item should be local origin (sum of the item difficulties set
to zero) which must be specified in order to remove the indeterminacy of the logit scale in
any calibration. The effect of the difference in local origins is removed by ralcniqting the
difference in difficulties between the common (linking) items from two or more forms
(tests). A weighted or unweighted average of the differences may be used as the link or
shift constant necessary to place the items on a common metric. This step may be
accomplished with a single item. However, most researchers (Wright & Bell, 1984; Wright
& Masters, 1982; Wright & Stone, 1972) have recommended from 5 to 15 common items
to form the links. The larger the number of items the less likely it is that local measurement
disturbances will affect the link constant.
Factors Affecting Test Equating
The equating or linking of tests does not just involve the use of a statistical
formula. Ingebo (1997) has stated that one needs to consider the 5 C's: (a) clean, (b)
close, (c) consistent, (d) control, and (e) constant. Clean refers to data that is not plagued
by improper scoring, undesirable distractors, and off-target items. Basically, raw test
scores less than one-third of the possible score points should be dropped prior to equating.
Close refers to tests that have item difficulty ranges of+/-2.0 logits and a mean difficulty
difference of less than .3 logits. Linking tests that are too far apart is a common mistake. If

there is more than one logit difference in the mean difficulties between the two tests then
they are too far apart to yield a stable calibration onto a common scale. Cnnsktwn refers
to whether the test items measure the same variable. The number one rule given is that
approximately 40 items are needed on each test to adequately measure a variable.
Obviously, linking tests that measure different variables can cause items to be discordant.
Control refers to the selection of linking items that are representative of the other items on
the two tests that are being linked. Basically, linking items should be selected that are near
the center of mean difficulties for the two tests rather than at the extremes. Constant refers
to the stability or invariance of the value used to equate the two sets of test scores.
Angoff (1971) suggested that the common sample equating design, as opposed to
a randomly equivalent groups design, could be expected to mitigate the lack of equating
precision resulting from smaller samples for linear and equipercentile equating. The
reasonable sample size for Rasch model equating based on the suggestions of Wright and
Stone (1979) can start at 100 persons. Wright and Stone also recommended that at least
10 good common items would be enough to supervise validity of linking. Number of items
in each test may be another factor that will influence the quality of test equating. In
deciding how to evaluate link fit, we must also keep in mind that random uncertainty in
item difficulties of less than .3 logits has no practical bearing on person measurement
(Wright and Douglas, 1975). In general, the effect of these factors on equating test scores
is an important issue in measurement and statistical analyses of educational test data.
Rationale for the Study
One aspect of the equating process that has not been well developed or researched

or
is the investigation of factors affecting test equating. No research has specifically
examined all of the factors at the same time to evaluate how they interact together <
which combination of factors result in the best approach for the equating of test scores.
That is, which levels of these factors optimize equating of test scores. Poor equating
methods are capable of introducing more measurement error than it may remove.
Research Questions
It is hypothesized that an effective approach to test equating using common items
is achieved when considering a specific set (combination) of criteria (factors). This study
therefore investigated five factors that affect test equating. The two research questions
postulated for the study were:
(1) Do the five factors (distribution type, standard deviation of item difficulties,
number of test items, number of common items, and sample size) significantly
interact affecting test equating?
(2) What is the best combination of levels for these five factors when test
equating?
Definition of Terminology
The following terminology associated with test equating are defined below.
(1) Common items: Shared items appearing on both tests used in the calibrations.
(2) Common-item equating: Rasch model technique using common items as a
means of removing the local origins from the calibration of two or more tests.
(3) Common item scale: A score scale derived from two or more tests when scores
are linked using a shift constant derived from a set of common items.

(4) Common persons: Shared persons taking both tests and used in the
calibrations.
(-*) Common-person equating: Rasch model technique using common persons to
remove differences in the origin of scale from two or more tests.
(6) Classical true-score theory: Measurement model to explain the observed test
score as a true score plus error.
(7) Equating or linking: A procedure for removing, to a large extent, the effects on
test scores of differences in average item difficulties levels and average item discriminating
levels between two or more tests.
(8) Equipercentile equating: A procedure that equates raw scores on two tests
based on equal percentile ranks from two tests.
Horizontal equating: A procedure that converts raw scores to a common scale
when measuring the same attribute at the same educational level on two or more tests.
(10) Latent-trait theory: Measurement model(s) to explain the most important
aspect of test performance as described by an examinee's standing on one latent,
hypothetical and unobserved characteristic or trait.
(U) Reference scale: A score scale using all items from all persons on two or more
tests without linking.
0^) Shift constant or Shift link: The mean of the differences between the
difficulties of the paired calibrations of the common (linking) items.
03) Vertical equating: A procedure that converts raw scores to a common scale
when measuring the same attribute at different educational levels on two or more tests.

Delimitations
The present study investigates several selected factors which can affect the
equating of scores from two tests onto a common score scale (i.e., quality of test
equating). These factors are: (a) distribution type (i.e., normal and uniform); (b) standard
deviation of item difficulties (Le., .68, .95, .99); (c) test length or number of test items
(i.e., 50,100, 200); (d) number of common items (i.e., 10, 20, 30); and (e) sample size
(Le., 100, 300, 500). The results of equating two simulated tests are compared on each
factor. However, these factors have specific fixed levels that were selected because of the
literature review. This limits the generalizability of findings in this study to only these
factors and their specific levels.

CHAPTER 2
REVIEW OF LITERATURE
In the last decade, the body of literature pertaining to research in the area of test
equating has grown. This literature reflects a variety of theoretical frameworks underlying
the process of test equating including practical considerations involved in the actual
equating of test forms. From these research studies, two main approaches prevailed, those
b a s e d o n classical true-score theory (Brawi and Holland, 1982; Kolen and Brennan, 1987;
Woodruff 1989) and those based on latent-trait theory (Cook and Peterson, 1987;
Mislevy and Stocking, 1989; Wright and Bell, 1984; Wright and Stone, 1979). Several
studies have compared classical true-score and latent-trait equating methods (Kolen, 1981;
Kolen and Harris, 1990).
Classical True-Score and Latent-Trait Theories
Classical true-score theory involves assumptions about the probability that an
examinee with a certain true score, will have a particular observed score and measurement
error (X T + E, where X— observed test score, T— true score, E = measurement error).
Test scores are interpreted relative to the normal distribution and test setting (e.g., validity
and reliability of scores). The classical true-score theory reflects a score scale which
implies that a single standard error of measurement (SEM) is applied to each observed test
score (X +/- SEM). Binomial and Poisson scoring models are examples used in the
10

11
classical true-score theory.
In latent-trait theory, it is assumed that the most important aspect of test
performance is based on the difficulty, discrimination, and guessing characteristics of each
item an examinee answers. Additionally, a latent trait is defined as a single trait (e.g.
verbal ability) that is not directly measured, rather inferred from the test score. Latent-trait
models describe how a persons' ability is measured by performance on each test item.
Unlike test scores, calibrated person measures range from negative to positive infinity.
These calibrated person measures are then typically converted to an equal interval linear
continuous score scale. Normal-ogive and logistic scoring models are examples used in
the latent-trait theory.
Classical true-score and latent-trait theories differ in their conceptualization of a
persons' true score and measurement error, hence how an observed test score is calculated
and interpreted (Schumacker, 1998). Classical true-score theory produces different
reliability estimates based on the testing situation, hence separate sources of measurement
error (test-retest, parallel forms) applied to the interpretation of all of the observed test
scores. Latent trait theory produces a separate measurement error term for each person
based on their individual item responses, which is used to interpret the persons' ability or
score. Item calibration, selection, and weighting techniques in latent trait theory are
useful in the equating of two tests (Allen and Yen, 1979).

12
Test Score Equating
Background
The comparability of test scores across different tests measuring the same latent
ability is problematic. How can the scores be compared? This question is particularly
important when certification, selection, or pass-M decisions must be made. To compare
the scores obtained on tests X and Y, a common scale is necessary, hence equating must
be carried out. Through equating a correspondence between the scores on X and Y is
established, and the scores on test X is converted to the metric of test Y. Thus, an
examinee who obtains a score on test X has a converted score on test Y; this score is
comparable to the score of an examinee taking test Y. In making pass-fail, selection, or
certification decisions, the converted cut-off score may be used to make the appropriate
decision for examinees taking test Y.
Classical True-Score Method and Fqnatinp
Angofi (1971) and Kolen (1988) described classical true-score methods of
equating in detail. In general, the methods fell into two main categories that are
equipercentile equating and linear equating. Equipercentile equating is accomplished by
considering the scores on tests X and Y to be equivalent, if their respective percentile
ranks in any given group are equal. In linear equating, it is assumed that the scores on test
X and the scores on test Y are linearly related.
The assumption in linear equating is that the two test score distributions differ only
with respect to their means and standard deviations. Therefore, standard scores will be
equal in such cases. When this assumption is valid, linear equating becomes a special case

13
of equipercentile equating; otherwise, it may be considered an approximation to
equipercentile equating. Factors that might be taken into account for refining the linear
equating method are outliers and the unreliability of the test scores (Angoff, 1971).
Methods for linear equating have been described in detail by Gulliksen (1950) and Angoff
(1984). Both authors differentiate among several equating designs. These designs differ in
their use of random and nonrandom groups, and the administration of the same or
different tests to the groups.
Lord (1977, 1980) criticized test equating practices because it shouldn't matter
whet her a person takes test X or test Y. His notion of test equity was based on
generating randomly parallel tests. Randomly parallel tests are constructed by randomly
sampling items from a common domain or item pool (e.g., math items). In this instance,
one can assume that the tests are equal, thus no equating of scores should be required. In
addition to test equity, symmetry and invariance issues need to be considered. The
condition of symmetry dictates that equating should not depend on which test is used as
the reference test. For example, if a regression procedure is used to determine the
constants in the linear equating formula, the condition of symmetry may not be met.
Basically, the regression coefficients for predicting Y from X may be different from those
for predicting X from Y. The requirement of invariance is that the equating procedure
must be sample independent, however, most testing is sample dependent.
Equity, symmetry, and invariance are usually not met in classical true-score theory
because tests are not randomly parallel, order of testing is a factor, and testing is sample
dependent. The item response theory approach overcomes these problems. If item

14
response data fits the IRT model, then direct comparisons of the ability parameters for two
examinees who take different tests is made possible by the invariance property. In
addition, the calibrated item difficulties and order of item presentation permit separate
latent true score and measurement error values for each person, thus achieving symmetry
and sample independence.
Latent Trait Theory and Equating
According to item response theory, the ability parameter of an examinee is
invariant across subsets of items. This means that, apart from measurement error, ability
estimates will be invariant across subsets of items (or different tests). In addition to
offering sample-invariant equating results, IRT equating also has the potential of adding a
great deal of flexibility to the development of alternate forms of a test. The estimation of
item parameters and their placement on a common metric are significant issues. Alternate
forms can be created by selecting items in some fashion from a pool of calibrated items.
The equating itself is simply the process of computing test characteristic curves for each
form. Equated raw scores are based on the same degree of underlying ability. This means
that IRT equating is based on the properties of the items that comprise a test rather than
the distribution of total test scores, which is the case with equipercentile or linear
equating methods.
Lord (1975) found IRT methods of equating useful, especially in increasing the
stability of the scales near the extreme values and in reducing drift in equating chains of
several test forms. Kolen and Whitney (1981) found IRT equating with the one-parameter
Rasch model to be effective. Studies by Cook, Dunbar, and Eignor (1981), and by Cook

15
and Eignor (1985) found a high level of agreement among methods based on IRT and
classical true-score procedures, when certain assumptions were met. Several authors in
the special Journal of Educational Measurement, 1977, (Slinde and Linn, 1979) have
indicated that latent trait models offer a potentially good tool for solving many of the
difficult psychometric problems faced in testing (e.g., vertical equating, tailored or
adaptive testing, and criterion-referenced testing). Latent trait models result in objective
measurement, which consists of person-free test calibration and item-free person
measurement. Person-free test calibration refers to the estimation of item parameters that
are invariant for all groups of examinees. Item-free person measurement implies that
except for errors of measurement, the same ability estimates would be obtained for an
individual no matter which subset of calibrated items they took.
Linking Designs
In many equating designs, the interest is in placing the item parameter estimates
from two or more tests on a common scale. This placement enables comparison of the
difficulty levels of the tests and also facilitates the development of item banks (Vale,
1986). The four basic linking designs that permit the scaling of item parameters are the
following:
(!) Single-Group Design: Two tests are given to the same group of examinees.
This design may be impractical to implement because testing time will be too long.
Moreover, practice and fatigue effects (if the two tests are administered one after the
other) may have an effect on parameter estimation and, hence, on the linking results.
(2) Equivalent-Group Design: Two tests are given to equivalent, but not identical

16
groups of examinees, chosen randomly. This design is more practical and avoids practice
and fatigue effects.
(3) Anchor-Test Design: Two tests are given to two different groups of examinees,
with a set of common items on both tests. This design is feasible and frequently used. If
the common items are chosen properly, it avoids the problems in the single-group and
equivalent-group designs.
(4) Common-Person Design: Two tests are given to two groups of examinees,
with a common group of examinees taking both tests. Because the testing will be lengthy
for the common group, this design has the same drawbacks as the single-group design.
In the single-group or equivalent-group design, the latent-trait method can be used
to place the items on the same scale. In determining the scaling constants in the
equivalent-group design, matched pairs of ability values are needed. This, however,
presents a problem because the groups consist of different examinees. One possible way to
match examinees is to rank order the examinees in the two groups and to assume
examinees with the same rank are equivalent.
In the anchor-test design, the parameters, and hence their estimates (subject to
sampling fluctuations) are related linearly in the two tests. That is,
bYc= abxc+ P (1)
Syc = axc/a (2)
where byc and bxc are the difficulties of the common items embedded in tests Y and X,
respectively. Once the constants ct and P are determined, the item parameter estimates for

17
all items in test X may be placed on the same scale on test Y. The adjusted item
parameter estimates for the common items in test X will not be identical to the
corresponding item parameter estimates in test Y (because of estimation errors), hence
they should be averaged. Of the four basic linking designs, the anchor-test design is the
most widely used and better approach, but one must consider factors that could affect the
link constant used in equating two tests.
Rasch Model and Equating
The Rasch model is a one parameter latent trait model that assumes an underlying
ability on a linear continuous scale when the item response data fit the model (Mislevy,
1987). The use of a latent trait approach (where item difficulties are independent of the
distribution of person abilities in the sample and person abilities are independent of the
distribution of the item difficulties on the tests) influenced the selection of the Rasch
model for test equating in this study (Rasch, 1960).
In the Rasch model, the probability of a correct response to an item is given by:
P(l/, pn, Si,) = [ e((5n-8i) ] / [1+ e(pn'8i)] (3)
where p„ is the ability of person n and 5i is the difficulties of item i (Wright and Stone,
1979). Under the condition that the data fit the model, logit item difficulties are freed from
the distributional properties of the sample of persons taking the test.
Item Banking and Test Equating
The use of a common metric is necessary to compare results of examinees taking
different sets of items (tests). This may result from examinees taking different forms of a

18
test, computer adaptive testing, or the use of testlets. Item banking and test equating both
take items administered to different examinee groups and place the item difficulties on a
common metric. Item banking is undertaken to provide a calibrated item pool from which
tests can be constructed. Test equating is done after tests have been constructed to
provide a common scale for ability estimates from the two tests. Calibrated items banks
have a common logit metric, so developing item banks prior to test development is an
important method (Smith, 1992). The properties of the Rasch model make it possible to
do test equating when the data fit the measurement model. If Rasch model fit is not
addressed until after the tests are developed, there may be serious problems in test
equating. Consequently, it is useful to review procedures for both item banking and test
equating.
Methods Used in Equatinp
All Rasch measurement scales are interval and do not have an absolute true zero
point. Consequently, indeterminacy exists in each scale from the two tests that must be
removed in the calibration of items. To remove this scale indeterminacy, the scale is
centered such that the sum of the item difficulties is zero (Le., the scale is centered at the
average item difficulties for the test). Because two separate sets of items (tests) have a
different average item difficulty (origin), it is necessary to remove that difference from one
of the two test calibrations for a common score scale to exist. This can be accomplished
by using a common-person or common-item equating method. The common-item equating
approach is primarily used in practice.
Common-item equating. Common-item equating involves using common items to

19
remove the scale origins from the item calibrations of two tests. This is accomplished by
determining a link or shift constant value based on the difficulties of the common items
across the two tests. Wright and Stone (1979) and Wright and Bell (1984) have indicated
how link constants can be developed to maximize the number of items that can be
calibrated based upon a fixed calibration sample. The link or shift constant is used to
transfer the items from the second calibrated test onto the scale of the first calibrated test.
Rasch item fit statistics can identify common-item pairs that misfit, so a decision can be
made whether to include or exclude a common item from the calculation of the link (shift)
constant.
Given the development of Rasch calibration programs with missing data features,
such as BIGSCALE (Wright & Masters, 1982) and BIGSTEPS (Linacre & Wright,
1995); it is no longer necessary to link calibrated forms separately. The development of a
common metric can be accomplished in a single calibration by treating uncommon items
across the forms as missing data. This is similar to the PAIR estimation algorithm used by
Choppin (1968). The advantage of this method is that the UCON procedure in the Rasch
programs provides asymptotic standard errors of the item difficulty estimates, whereas the
PAIR procedure does not provide this information. The standard errors of estimate of the
item difficulties are very useful in assessing the fit of the link constant and in determining if
the items actually define a latent trait.
Anchoring. Using item difficulty values to anchor common items on two tests is a
second feature of the Rasch program that permits all test items to be placed on a common
scale. The BIGSTEPS program (Linacre & Wright, 1995) permits items to be anchored,

20
thus placing them onto a common scale. This is particularly useful in the case where new
items are to be calibrated into an existing item bank. A sample of calibrated items can be
administered along with new items and upon calibration the new items will be calibrated
onto the same scale as the item bank. The scale origin from the first calibration will be
transferred to the second calibration via the anchored item difficulties.
There are differences between the separate calibration common-item approach and
either the single calibration or the item anchoring approach. Smith and Kramer (1988)
have discussed some of these differences. The primary one is the detection and disposition
of misfitting common items. In the separate calibration approach misfitting common-item
pairs are easily identified and removed from the calculation of the shift constant. In the
common calibration and anchoring approaches the differences in difficulties of misfitting
common items pairs are distributed throughout the entire set of item difficulties as the
calibration program attempts to find the one set of item difficulties that will maximize the
probability of the data matrix. Misfitting item pairs may be detected by the fit statistics
available in the Rasch calibration program (Smith, Schumacker, & Bush, 1998).
In summary, the two methods adjust the scale origins of the tests differently. The
common-item equating approach computes a shift constant to adjust the scale origin from
one test to the other. The anchoring approach transfers the origin from the first test
calibration to the second test calibration based on the anchored item difficulties used in the
Rasch BIGSTEPS program.
The two methods also differ in how misfitting items are detected. Misfitting items
are easily detected in the common-item equating method by using a t-test:

21
ti = ( dij - djic) / 2 (se2jj + se^k)^ (4)
where
£ik = X(dij-dik)/n (5)
In the anchoring approach, the differences in difficulties of misfitting common item pairs
are distributed across the entire set of item difficulties as the calibration program finrk one
set of item difficulties that will maximize the probability of the data matrix. Misfitting item
pairs may be detected by the mean square fit statistics in the program; however, the power
to detect this type of misfit has yet to be investigated (Smith, 1992; Smith, Schumacker, &
Bush, 1998).
Factors Affecting Test Equating
Cook and Petersen (1987) have discussed how various equating methods are
affected by (a) sampling error, (b) sample characteristics, and (c) characteristics of anchor
test items. Unfortunately, the authors could not offer, as an outcome of their findings, a
universal procedure for obtaining accurate equating results. They have, however,
suggested some future research directions. They have agreed that there is a need for
simulation and empirical studies designed to evaluate the effectiveness of analytical
smoothing techniques for recovering the underlying distribution when sample size, test
length, and distributional shape are varied. Such research could lead to guidelines for
practitioners, and thus could help to eliminate some of the "subjectiveness" in
equipercentile and other types of equating decisions.
Studies have been reviewed that examine the question of whether an equating
transformation remains the same regardless of the group used to define it (Cook and

22
Petersen, 1987). The results of some studies suggested that this might not be a problem
for forms of a homogeneous test constructed to be similar in all respects. Results of other
studies indicated that examinees who took a test on different administration dates might
vary in systematic ways and thus affect equating results. Finally, studies, which examined
the characteristics of anchor test items, have been reviewed. It was concluded that
whenever groups differed in level and dispersion of ability, special care must be taken to
assure that the anchor test is a miniature of the total test to be equated. In addition, the
results of the IRT equating studies that examined the effect of number of linking items, the
size of the standard errors of estimation of the item parameters, and the type of scaling
procedure did not provide clear guidelines (Hillis, Subhiyah, & Hirsch, 1988).
Sample Size
Kolen and Whitney (1982) have drawn conclusions about the relative adequacy of
the equating methods, even though a small cross-validation sample was used with only one
test form. The researchers concluded that larger sample sizes or a modification of equating
methodologies would be necessary before the three-parameter or equipercentile methods
could be recommended for equating. The one-parameter (Rasch) equating method could
produce results as stable as those obtained using the linear method for equating
achievement tests, given sample sizes around 200 with the same examinees taking both
forms with similar difficulties. Kolen and Whitney also concluded that linear equating
might be the method of choice when small sample sizes are used for the horizontal
equating of achievement tests in a common sample equating design or in a randomly
equivalent group design.
23
Common Item Length
The traditional number of anchor items used in equating, developed by Angoffin
equating the College Board's Scholaristic Aptitude Tests (Donlon & Angoff, 1971), is 20
items or 20% of the number of items in the test, whichever is larger. In addition,
Wingersky and Lord (1984), Raju, Edwards, and Osberg (1983), and Raju, Bode, Larsen,
and Steinhaus (1986) have indicated that in using the three-parameter IRT model, as few
as 5 or 6 carefully chosen items might be sufficient. However, Hillis, Subiyah, and Hirsch
(1988) found that using the three-parameter model and the IRTCON procedure, 10
randomly chosen anchor items from an existing anchor of 30 was an adequate number, but
5 was not. These findings indicate that using the three-parameter IRTCON method of
equating, the designers of tests could reduce the number of anchor items. One advantage
of using a minimum number of anchor items is that repeating fewer items on one test form
to another enhances test security. These findings do not apply, however, to any other
method of equating. Therefore, the effective number of common or anchor items should
be investigated for other types of test equating.
Test Length
Large item banks are typically developed and administered in parts. For any type of
linking technique to be a meaningful tool for calibrating the items in the bank, the
parameters must be expressed on a common scale. In general, calibration and linking
should be done with tests having as many items in common as possible. For a fixed
number of available item administrations, it is better to give longer tests at the expense of
sample size (Vale, 1986). If, however, the examinee groups are large random samples
24
from a common population, the linking method is largely irrelevant; even so, longer tests
are still preferable to short tests because of improved calibration accuracy. However, a
study involving different test length, which may influence the quality of the common scale,
has never been done when equating with the Rasch model.
For the reasons outlined above, the present study investigated these factors
because they have been shown to affect the equating of scores from two tests onto a
common score scale. The five factors studied were: (a) distribution type (normal versus
uniform; (b) standard deviation of difficulties (.68, .95, and .99); (c) test length or number
of test items (50, 100, and 200); (d) number of common items used to link two tests (10,
20, and 30); and (e) sample size (100, 300, and 500).

CHAPTER 3
METHODS AND PROCEDURES
To illustrate the effects of the five factors on test equating, Rasch measurement
estimates and other statistical analyses were calculated using simulated data sets. Levels
of the five factors were also compared to determine which combinations of levels resulted
in the smallest shift constant (least amount of equating error) when equating scores from
two tests. An anchoring design was employed using two different simulated sets of test
data with a third simulated data set providing the common items for linking the two tests.
Simulated Data Sets
Simulated data were generated for each test using SIMTEST. a computer
program for simulating test data (Luppescu, 1992). The program used default options
except for the highlighted options that pertained to the factors investigated (Appendix A).
The standard deviation of item difficulties was set using the letter "S^ in the program to
enter the dispersion of the test item difficulty calibrations. If the difficulties were to be
distributed normally (set with the D option), the dispersion of the standard deviation of the
difficulties was set so that 95% of the difficulties were between -2S and +2S. If the
difficulty calibrations were to be set for a uniform distribution, the dispersion was set to
represent half the range; that is the calibration ranged between -S and +S. The default
25

26
value was 1.00. After entering D, either "U" for uniform distribution of the item
difficulties, or "N" for normal distribution was specified. The default was "N". The P
option was used to specify the number of persons. The default was 100. Similarly, the I
option was used to specify the number of items. The default was 25.
SIMTEST Program
The first set of the simulated data (DATA SET 1) had an average difficulty of .68,
a normal distribution of item difficulties, 40 items (named "testl.dat"), 10 common items
(named "commonl.dat"), and 100 persons taking the test. The other options remained the
same as the defaults. The simulation program is in Appendix A.
Test Conditions
The five factors yielded a 2 X 3 X 3 X 3 X 3 fixed effects factorial analysis of
variance design. The five factors and the specific levels for each were: (a) distribution
type (normal and uniform); (b) standard deviation of item difficulties (.68, .95, .99); (c)
test length or number of test items (50, 100,200); (d) number of common items or
common item length (10, 20, 30); and (e) sample size (100, 300, 500). The various
combinations of the levels for the five factors yielded 162 different test conditions. Table
1 lists the 81 test conditions for the equated tests given a normal distribution. Table 2 lists
the 81 test conditions for the equated tests given the uniform distribution. To meet sample
size and power requirements (Cohen, 1988), 30 equated tests generated from three
simulated data sets (Test A, Test B, and Test C used as common item set) were calculated
for each of the 162 test conditions resulting in a sample size of4, 860.

Table 1.
Test Conditions for Equated Tests with Normal Distribution
27
Test SD of Item Conditions Difficulties
Test Length Common Item Length
Sample
Test Condition 1 .68 50 10 100 Test Condition 2 .68 50 10 300 Test Condition 3 .68 50 10 500 Test Condition 4 .68 50 20 100 Test Condition 5 .68 50 20 300 Test Condition 6 .68 50 20 500 Test Condition 7 .68 50 30 100 Test Condition 8 .68 50 30 300 Test Condition 9 .68 50 30 500 Test Condition 10 .68 100 10 100 Test Condition 11 .68 100 10 300 Test Condition 12 .68 100 10 500 Test Condition 13 .68 100 20 100 Test Condition 14 .68 100 20 300 Test Condition 15 .68 100 20 500 Test Condition 16 .68 100 30 100 Test Condition 17 .68 100 30 300 Test Condition 18 .68 100 30 500 Test Condition 19 .68 200 10 100 Test Condition 20 .68 200 1 0 300 Test Condition 21 .68 200 10 500 Test Condition 22 .68 200 20 100 Test Condition 23 .68 200 20 300 Test Condition 24 .68 200 20 500 Test Condition 25 .68 200 30 100 Test Condition 26 .68 200 30 300 Test Condition 27 .68 200 30 500
(table continues)

Table 1. (continued)
28
Test SD of Item Conditions Difficulties
Test Length Common Item Length
Sample
Test Condition 28 .95 50 10 100 Test Condition 29 .95 50 10 300 Test Condition 30 .95 50 10 500 Test Condition 31 .95 50 20 100 Test Condition 32 .95 50 20 300 Test Condition 33 .95 50 20 500 Test Condition 34 .95 50 30 100 Test Condition 35 .95 50 30 300 Test Condition 36 .95 50 30 500 Test Condition 37 .95 100 10 100 Test Condition 38 .95 100 10 300 Test Condition 39 .95 100 10 500 Test Condition 40 .95 100 20 100 Test Condition 41 .95 100 20 300 Test Condition 42 .95 100 20 500 Test Condition 43 .95 100 30 100 Test Condition 44 .95 100 30 300 Test Condition 45 .95 100 30 500 Test Condition 46 .95 200 10 100 Test Condition 47 .95 200 10 300 Test Condition 48 .95 200 10 500 Test Condition 49 .95 200 20 100 Test Condition 50 .95 200 20 300 Test Condition 51 .95 200 20 500 Test Condition 52 .95 200 30 100 Test Condition 53 .95 200 30 300 Test Condition 54 .95 200 30 500
(table continues)

29
Table 1. (continued)
Test SD of Item Conditions Difficulties
Test Length Common Item Length
Sample
Test Condition 55 .99 50 10 100 Test Condition 56 .99 50 10 300 Test Condition 57 .99 50 10 500 Test Condition 58 .99 50 20 100 Test Condition 59 .99 50 20 300 Test Condition 60 .99 50 20 500 Test Condition 61 .99 50 30 100 Test Condition 62 .99 50 30 300 Test Condition 63 .99 50 30 500 Test Condition 64 .99 100 10 100 Test Condition 65 .99 100 10 300 Test Condition 66 .99 100 10 500 Test Condition 67 .99 100 20 100 Test Condition 68 .99 100 20 300 Test Condition 69 .99 100 20 500 Test Condition 70 .99 100 30 100 Test Condition 71 .99 100 30 300 Test Condition 72 .99 100 30 500 Test Condition 73 .99 200 10 100 Test Condition 74 .99 200 10 300 Test Condition 75 .99 200 10 500 Test Condition 76 .99 200 20 100 Test Condition 77 .99 200 20 300 Test Condition 78 .99 200 20 500 Test Condition 79 .99 200 30 100 Test Condition 80 .99 200 30 300 Test Condition 81 .99 200 30 500

30
Table 2.
Test Conditions for Equated Tests with Uniform Dktrihntinn
Test Conditions
SD of Item Difficulties
Test Condition 1 .68 Test Condition 2 .68 Test Condition 3 .68 Test Condition 4 .68
Test Condition 5 .68 Test Condition 6 .68
Test Condition 7 .68 Test Condition 8 .68
Test Condition 9 .68 Test Condition 10 .68
Test Condition 11 .68 Test Condition 12 .68 Test Condition 13 .68 Test Condition 14 .68 Test Condition 15 .68 Test Condition 16 .68 Test Condition 17 .68 Test Condition 18 .68
Test Condition 19 .68 Test Condition 20 .68 Test Condition 21 .68 Test Condition 22 .68 Test Condition 23 .68 Test Condition 24 .68 Test Condition 25 .68 Test Condition 26 .68 Test Condition 27 .68
Test Length Common Item Length
Sample Size
50 50 50 50 50 50 50 50 50 100 100 100 100 100 100 100 100 100 200 200 200 200 200 200 200 200 200
10 10 10 20 20 20 30 30 30 10 10 10 20 20 20 30 30 30 10 10 10 20 20 20 30 30 30
100 300 500 100 300 500 100 300 500 100 300 500 100 300 500 100 300 500 100 300 500 100 300 500 100 300 500
(table continues)

31
Table 2. (continued)
Test Conditions
SD of Item Difficulties
Test Length Common Item Length
Sample Size
Test Condition 28 .95 Test Condition 29 .95 Test Condition 30 .95 Test Condition 31 .95 Test Condition 32 .95 Test Condition 33 .95 Test Condition 34 .95 Test Condition 35 .95 Test Condition 36 .95 Test Condition 37 .95 Test Condition 38 .95 Test Condition 39 .95 Test Condition 40 .95 Test Condition 41 .95 Test Condition 42 .95 Test Condition 43 .95 Test Condition 44 .95 Test Condition 45 .95 Test Condition 46 .95 Test Condition 47 .95 Test Condition 48 .95 Test Condition 49 .95 Test Condition 50 .95 Test Condition 51 .95 Test Condition 52 .95 Test Condition 53 .95 Test Condition 54 .95
50 50 50 50 50 50 50 50 50 100 100 100 100 100 100 100 100 100 200 200 200 200 200 200 200 200 200
10
10
10
20 20 20 30 30 30 10
10
10
20 20 20 30 30 30 10
10
10
20 20 20 30 30 30
100 300 500 100 300 500 100 300 500 100 300 500 100 300 500 100 300 500 100 300 500 100 300 500 100 300 500
(table continues)

32
Table 2. (continued)
Test SD of Item Conditions Difficulties
Test Length Common Item Length
Sample Size
Test Condition 55 .99 50 10 100 Test Condition 56 .99 50 10 300 Test Condition 57 .99 50 10 500 Test Condition 58 .99 50 20 100 Test Condition 59 .99 50 20 300 Test Condition 60 .99 50 20 500 Test Condition 61 .99 50 30 100 Test Condition 62 .99 50 30 300 Test Condition 63 .99 50 30 500 Test Condition 64 .99 100 10 100 Test Condition 65 .99 100 10 300 Test Condition 66 .99 100 10 500 Test Condition 67 .99 100 20 100 Test Condition 68 .99 100 20 300 Test Condition 69 .99 100 20 500 Test Condition 70 .99 100 30 100 Test Condition 71 .99 100 30 300 Test Condition 72 .99 100 30 500 Test Condition 73 .99 200 10 100 Test Condition 74 .99 200 10 300 Test Condition 75 .99 200 10 500 Test Condition 76 .99 200 20 100 Test Condition 77 .99 200 20 300 Test Condition 78 .99 200 20 500 Test Condition 79 .99 200 30 100 Test Condition 80 .99 200 30 300 Test Condition 81 .99 200 30 500

33
Equating Procedure
BIGSTEPS Program
Rasch analysis is a method of obtaining objective, fundamental measures from
stochastic observations of ordered categorical responses. Georg Rasch, a Danish
mathematician, formulated this approach in 1953 to analyze responses to a series of
reading tests. BIGSTEPS implements Georg Rasch's formulation by means of an initial
estimate using PROX estimation followed by an iterative UCON estimation method.
The BIGSTEPS program was designed to construct Rasch calibrations from the
responses of a set of persons to a set of items. Responses may be recoded as letters or
integers, and each recoded response may be one or two characters long. Alphanumeric
characters not designed as legitimate responses are treated as missing data. The response
to an item may be dichotomous (right or wrong, yes or no), or may be on a rating scale
(good, better, best; disagree, neutral, agree; or may have "partial credit" or other
hierarchical structures). The items may all be grouped together or be grouped into subsets
of one or more items which share the same response structure.
The BIGSTEPS program is used to obtain an initial estimate for each person
measure, item calibration, and rating scale category step calibration, unless pre-
determined; "anchor" values are provided. This initial estimate from the PROX (normal
approximation) algorithm provides a rough convergence to the observed data pattern. The
UCON algorithm then iteratively obtains more exact estimates, standard errors and fit
statistics.

34
Measures are reported in logits (log-odds units) unless rescaled. Fit statistics are
reported as mean-square residuals, which have approximate chi-square distributions. The
measures are also reported in standardized form, N (0,1). Program output consists of a
variety of useful plots, graphs and tables suitable for input into written reports. The
statistics can also be written to data files for import into other software.
The output file from BIGSTEPS analysis provides the summary statistics tables. It
reports a logit score (MEASURE), which is the estimated measure (for persons) or
calibration (for items), and the standard error (ERRORS of the estimation. INFIT is an
information-weighted fit statistic, which is more sensitive to unexpected behavior affecting
responses to items near the person's ability level. OUTFIT is an outlier-sensitive fit
statistic, more sensitive to unexpected behavior by persons on items far from the person's
ability level. MNSQ is the mean-square infit or outfit statistic with expectation 1. Values
substantially below 1 indicate dependency in data; values substantially above 1 indicate
noise. ZSTD is the infit or outfit mean-square fit statistic standardized to approximate a
theoretical mean 0 and variance 1 distribution. RMSEis the root mean square standard
error computed over the persons or over the items.
Global fit statistics for the fit of the data to the Rasch model are reported. Since
the Rasch model is a measurement model rather than a statistical model, the model is
neither "accepted" nor "rejected" based on these statistics. These statistics are provided to
only determine how well the data fit the Rasch model. Statistical significance of the chi-
square value is used to test the hypothesis, "Do the data fit the model ?". Data that fit the

35
Rasch model reflect traditional notions of validity and reliability.
Control and data file. The control file, Test 1 .con, for the analysis of a test
containing 50 simulated items with each item scored dichotomously as 0, 1 is in
Appendix B. The person- id begins in column I and the item responses begin in column
13. No items are deleted, recoded, or anchored. The default tables appear in the output
file: TEST l.OUT. The BIGSTEPS program counts the number of data lines to determine
how many persons took the test.
^chor Be. The anchor file, EQUATE I.CON, for the analysis of a test containing
50 items with each item already scored dichotomously as 0, 1 is in Appendix C. The
person-id begins in column 1 and the item responses begin in column 13. The default
tables appear on the printout. The item Iogit measures for items 41 to 50 are used to link
the two tests. These items (items 41 to 50) are from the 10 common link items of the
second test used for equating scores to the first test.
QBASIC Program
The SIMTEST program and the BIGSTEPS program were run repeatedly via
program loops using QuickBasic (Hergert, 1990). The QBASIC program is in Appendix
D. Each of the 162 different test conditions contained 30 equated tests (each equated test
required the simulation of three data sets; Test A, Test B, and Test C used as common
item set) resulting in 4,860 equated tests.

36
Statistical Hypotheses
The first research question, Do the five factors (distribution type, standard
deviation of item difficulties, number of test items, number of common items, and sample
size) significantly interact affecting test equating?, can be tested by the following
interaction statistical hypothesis:
Ho : (aPy8s) iklma = 0 for all j, k, 1, m, and n
HA : (a|3y8s)
jklmn ̂ 0 for some j, k,l,m, and n
where a, p, y, 8, and e are the effects of the five factors in the interactions; and j, k, 1, m,
and n are indexes which delineate the different cell means of the five factors to be
compared on the person measures (Kirk,1995). In the absence of any interaction effects,
main effects for the five factors are interpreted.
The second research question, What is the best combination of levels for these five
factors when test equating?, can be tested by the following statistical hypothesis:
Ho : t p > t q for all ordered test conditions
HA : t p < t q for smallest ordered test condition
where indicates the 162 different test conditions that are to be compared. The
averaged t values for the 30 equated tests for a given test condition are compared across
all 162 test conditions on the item measures of the common items. The smallest averaged
t will indicate the best test condition (combination of factors) or the optimum test
condition when test equating in this simulated study.

37
Statistical Analyses
The first statistical hypothesis was tested using a five-way fixed effects analysis of
variance for significant interaction among levels of the five factors on the person measure
scores. The general linear model (GLM) procedure using the SAS statistical software
package (SAS, 1990) was used to test the five-way, four-way, three-way, and two-way
interaction effects among the five factors. Significant interaction effects were further
investigated using simple effects tests followed by Tukev's honestly significant difference
(HSD) pairwise comparisons.
The second statistical hypothesis was tested by comparing the averaged t values
for the 30 equated tests across all 162 test conditions. The averaged t indicates the mean
difference between common item link (shift) constants. Each item has a difficulty d, and a
standard error § from each of two independent calibrations. Thus, for each item i we have
(dii, sji) and (dl2, sl2). Since each pair of calibrations applies to one item, we expect the
two difficulties d;i and d,2, after a single translation necessary to establish an origin
common to both sets of items, to estimate the same difficulty 8,. We also expect the error
of these estimates to be estimated by sn and Sj2. This gives us a statistic for testing the
extent to which the two di's estimate the same 8,,
tjl2 = ( d i i - d (2 ) / ( S i i 2 + Sj22) 5 ( 6 )

CHAPTER 4
RESULTS
First Statistical Hypothesis
The first statistical hypothesis tested for interaction effects among the five factors,
which are distribution type, standard deviation of item difficulties, test length (number of
test items), number of common items (common item length), and sample size. The five-
way fixed effects analysis of variance procedure (SAS, 1990) tested for significant
interaction among cell means on the person measure scores among the five factors. The
results of this interaction analysis are reported in Table 3.
Table 3.
Five-Way Fixed Effects Analysis of Variance on Person Measures
Source df Eta-Squareda Power
Common Item 2
Length (CI)
SD 2
Distribution(D) 1
Sample Size (S) 2
Test Length (T) 2
105.989***
0.752***
0.066
6.176**
40.527***
0.043
0.0003
0.0001
0.0024
0.017
1.000
0.179
0.058
0.892
1.000
(table continues)
38

39
Table 3. (continued)
Eta-Squared8 Powerb Source df
CIxSD
CI xD
CI x S
CI x T
SDxD
SDxS
SDxT
D x S
D x T
S x T
C x S D x D
CIxSDxS
CIxSDxT
CI x D x S
CI x S x T
S D x D x S
CI x D x T
SD x D x T
8
8
4
8
4
4
4
1.094
1.353
0.342
4.892**
3.357*
3.099*
1.565
0.301
0.169
2.043
0.429
1.256
0.274
0.899
1.351
0.423
1.271
0.175
0.0008
0.0005
0.0003
0.0038
0.0013
0.0024
0.0013
0.0001
0.0001
0.0016
0.0001
0.002
0.0001
0.001
0.002
0.0001
0.001
0.0001
0.348
0.293
0.129
0.960
0.636
0.816
0.514
0.098
0.076
0.615
0.152
0.589
0.140
0.289
0.628
0.150
0.402
0.087
(table continues)

40
Table 3. (continued)
Source df F Eta-Squared8 Powerb
SD x S x T 8 1.578 0.003 0.711
D x S x T 4 2.073 0.002 0.622
CI x SD x Dx S 8 1.371 0.002 0.636
CIxSDxDxT 8 1.596 0.003 0.717
CI x SD x SxT 16 0.691 0.002 0.494
CI x D x S x T 8 1.199 0.002 0.565
S D x D x S x T 8 0.823 0.001 0.391
CI x SD x D x 16 0.920 0.003 0.650
S X T
Error 4698 (0.004124)
Note, The value enclosed in the parenthesis represents mean squared error for the foil five-
way factorial design; SD = standard deviation of item difficulties.
"Eta-Squared is the percentage of variance accounted for by the factors, which is used to
compute effect size.
''Power is the observed power computed using alpha = .05; The power can be increased by
increasing the sample size. For example, the power approaches 1.00 for all factors when
the cell size (n) = 60, but the eta-squared values do not change.
*E < .05. **p < .01. ***p < .001.

41
The five-way fixed effects analysis of variance findings indicated three statistically
significant two-way interactions for common item length and test length (CI x T), standard
deviation of item difficulties and distribution type (SD x D), and standard deviation of item
difficulties and sample size (SD x S). These interactions were further examined using
simple effects testing of one factor across levels of another factor. The results of the
simple effects test for common item length and test length are in Table 4.
Table 4.
Simple Effects of Common Item Length and Test Length on Person Measures
Source df F
Common Item Length (CI) 2 105.98***
Test Length (T) 2 40.52***
CI at T, (50) 2 33.405***
CI at T2 (100) 2 50.082***
CI at T3 (200) 2 32.275***
Tat CI, (10) 2 9.118***
T at CI2 (20) 2 32.617***
T at CI3 (30) 2 8.571***
Error 4843 (0.004125)
Note. ***p <.001.

42
Common item length across all levels of test length as well as test length across all levels
of common item length were significant.
The results of simple effects for the interaction of standard deviation of item
difficulties and distribution type are reported in Table 5.
Table 5.
Simple Effects of Standard Deviation of Ttem Difficulty and Distribution Type on Person
Measures
Source df F
Distribution Type (D) 1 0.066
Standard Deviation (SD) 2 0.752
D at SD, (.68) 1 0.090
D at SD2 (.95) 1 4.682*
D at SD3 (.99) 1 2.008
SD at Di (Normal) 2 1.661
SD at D2 (Uniform) 2 2.447
Error 4849 (0.004125)
Note. *p < .05.
The normal and uniform distribution types only interacted significantly at the .95 standard
deviation of item difficulties.

43
The results of the tests of simple effects of standard deviation of item difficulties
and sample size are reported in Table 6.
Table 6.
Simple Effects of Standard Deviation of Item Difficulty and Sample Size on Person
Measures
Source df F
Standard Deviation (SD) 2 0.752
Sample Size (S) 2 6.176**
SD at S, (100) 2 5.891**
SD at S2 (300) 2 0.985
SD at S3 (500) 2 0.074
S at SDi (.68) 2 0.108
S at SD2 (.95) 2 1.773
S at SD3 (.99) 2 10.493***
Error 4843 (0.004125)
Note. **2<.01. ***2<.001.
The standard deviation of item difficulties were significantly different for a sample size of
100 while sample size differences were noted for a standard deviation of item difficulties at
.99 only.

44
The results of the simple effects tests led to a further analysis of the all possible
mean pairwise comparisons for each of the two-way interaction efFects using the Tukey
honestly significant difference (HSD) test. Table 7 indicates the nine possible
combinations of the factor levels for the common item length and test length interaction.
Table 8 reports the Tukey Q statistical values for the mean pairwise comparisons of these
nine combinations which resulted in 36 mean pairwise comparison tests. Most pairwise
mean comparisons were statistically significant. Where lack of sufficient test length existed
(pairwise combinations 1,4, and 7; see Table 7), increasing the number of common items
did not overcome test items (test length).
Table 7.
Pairwise Combinations for Common Item Length and Test Length Interaction
Common Item Test Length (T)
Length (CI) ~50 100 200
_ _ _ _
20 4 5 6
30 7 8 9

45
Table 8.
Tukev 0 Statistical Values for Mean Pairwise Comparisons of Common Ttem T.enpth and
Test Length Interaction
Pairs 1 2 3 4 5 6 7 8 9
2 2.191
3 4.268 2.077 ***
4 -7.428 -9.618 -11.70 *** *** ***
5 -3.722 -5.912 -7.990 3.706 *** *** **
6 0.637 -1.554 -3.631 8.064 4.359 ** *** ***
7 -6.661 -8.852 -10.93 0.766 -2.939 -7.298 *** *** *** ***
8 -7.754 -9.945 -12.02 -0.327 -4.032 -8.391 *** *** *** ** ***
9 -3.751 -5.942 -8.019 3.677 -0.029 -4.388 ** *** ** *** **
Note. **j)<.01. ***2<.001.
Table 9 indicates the six possible combinations of the factor levels for the
distribution type and standard deviation of item difficulty interaction. Table 10 reports the
Tukey Q statistical values for the mean pairwise comparisons of these six combinations
which result in 15 mean pairwise comparison tests. There were no significant pairwise
mean differences found.

46
Table 9.
Pairwise Combinations for Distribution Type and Standard Deviation of Item Difficulty
Interaction
Distribution Type Standard Deviation (SD)
(D) .68 .95 .99
Normal 1 2 3
Uniform 4 5 6
Table 10.
Tukev O Statistical Values for Mean Pairwise Comparisons of Distribution Type and
Standard Deviation of Item Difficulty Interaction
Pairs 1 2 3 4
1
2 1.709
3 0.307 -1.402
4 0.300 -1.409 -0.007
5 -0.454 -2.163 -0.761 -0.754
6 1.723 0.015 1.416 1.423 2.177
Note. There are no significant pairwise mean differences.

47
Table 11 indicates the nine possible combinations of the factor levels for the standard
deviation of item difficulty and sample size interaction. Table 12 reports the Tukey Q
statistical values for the mean pairwise comparisons of these nine combinations which result
in 36 mean pairwise comparison tests. The .99 standard deviation of item difficulties at
sample sizes of 100 and 300 were significant.
Table 11.
Pairwise Combinations for Standard Deviation of Item Difficulty and Sample Si™
Interaction
Standard Deviation Sample Size
of Item Difficulty 100 300 500
~68 1 2 3
•95 4 5 6
.99 7 8 9

48
Table 12.
Tukev 0 Statistical Values for Mean Pairwise Comparisons of Standard Deviation nf
Item Difficulty and Sample Size Interaction
Pairs 1 2 3 4 5 6 7 8 9
1
2 0.341
3 -0.103 -0.444
4 1.396 1.054 1.499
5 0.497 0.156 0.600 -0.898
6 -0.486 -0.827 -0.383 -1.881 -0.983
7 3.412 * 3.071 3.515 * 2.017 2.915 3.898 **
8 -0.788 -1.130 -0.685 -2.184 -1.285 -0.302 -4.200 ***
9 -0.267 -0.608 -0.164 -1.663 -0.764 0.219 -3.679 ** 0.521
Note: * p < .05. ** g<.01. *** p<.001.
Second Statistical Hypothesis
The second statistical hypothesis was tested on the item measures (calibrations) by
comparing the averaged t values from 30 equated tests for each of the 162 test conditions.
This comparison suggests the best combination of the five factors for test equating. The
absolute values of the averaged t values on the common item measures were used to rank the
162 test conditions. The smallest averaged t value indicated the best combination of factors

49
for test equating (Uniform, .99 standard deviations of item difficulties, 100 items, 20 common
items, and a sample size of 100). The averaged t-values ranged from 0.0006 to 0.1921. The
rankings of the 162 test conditions are reported in Table 13.
Table 13.
Best Combination of Five Factors for Test Equating on Common Item Measures
Rank D SD 1 CI S Averaged t-value
1 Uniform .99 100 20 100 .0006
2 Normal .99 100 30 300 .0016
3 Uniform .68 50 20 100 .0019
4 Normal .68 100 20 300 .0026
5 Uniform .99 50 30 500 .0026
6 Uniform .95 200 20 500 .0035
7 Normal .99 100 20 500 .0036
8 Uniform .68 200 20 500 .0038
9 Uniform .99 50 30 300 .0039
10 Normal .99 200 20 100 .0040
11 Normal .99 50 30 500 .0045
12 Uniform .68 50 30 500 .0045
13 Uniform .95 200 20 300 .0057
14 Uniform .95 100 10 300 .0058
15 Normal .68 100 20 100 .0062
16 Normal .99 200 30 500 .0062
17 Uniform .99 50 10 300 .0073
(table continues)

50
Table 13. (continued)
Rank D SD 1 CI S Averaged t-value
18 Normal .68 200 30 300 .0075
19 Normal .95 50 10 100 .0077
20 Normal .99 200 20 500 .0077
21 Uniform .95 100 30 300 .0093
22 Uniform .99 200 30 500 .0096
23 Uniform .68 50 20 500 .0099
24 Normal .95 50 30 300 .0116
25 Normal .95 100 10 300 .0117
26 Uniform .68 100 30 300 .0118
27 Uniform .99 50 10 100 .0125
28 Normal .99 200 10 100 .0127
29 Uniform .68 100 10 100 .0127
30 Uniform .68 50 10 100 .0144
31 Normal .95 100 10 100 .0144
32 Uniform .99 200 20 300 .0146
33 Normal .99 50 20 500 .0148
34 Normal .95 200 30 500 .0150
35 Normal .95 50 20 500 .0151
36 Normal .95 200 10 300 .0152
37 Uniform .95 50 20 300 .0168
38 Normal .95 200 20 300 .0169
39 Uniform .68 100 20 100 .0170
40 Normal .99 200 10 500 .0178
(table continues)

51
Table 13. (continued)
Rank D SD 1 CI S Averaged t-value
41 Uniform .68 200 30 300 .0179
42 Normal .95 50 30 100 .0185
43 Uniform .99 50 20 100 .0193
44 Normal .68 100 30 500 .0201
45 Normal .99 100 30 500 .0209
46 Uniform .68 50 30 300 .0222
47 Normal .99 50 10 100 .0226
48 Uniform .99 50 20 500 .0228
49 Normal .95 100 20 500 .0229
50 Normal .99 50 30 100 .0235
51 Normal .95 50 20 100 .0240
52 Normal .99 50 10 300 .0240
53 Uniform .95 50 10 100 .0249
54 Normal .99 200 20 300 .0251
55 Normal .99 200 30 300 .0258
56 Normal .68 200 20 300 .0260
57 Uniform .99 200 30 300 .0263
58 Normal .68 100 10 500 .0273
59 Uniform .95 50 30 500 .0274
60 Normal .95 200 20 500 .0284
61 Uniform .68 50 10 300 .0284
62 Uniform .95 200 30 100 .0286
63 Normal .99 100 20 100 .0291
64 Uniform .68 100 30 500 .0295
(table continues)

52
Table 13. (continued)
Rank D SD 1 CI S Averaged t-value
65 Uniform .99 50 30 100 .0298
66 Normal .95 50 30 500 .0304
67 Normal .95 50 10 300 .0305
68 Uniform .68 100 20 300 .0315
69 Normal .99 200 30 100 .0320
70 Uniform .95 50 30 300 .0336
71 Normal .95 100 30 100 .0338
72 Uniform .68 100 10 500 .0341
73 Normal .99 50 20 300 .0345
74 Uniform .95 200 30 500 .0352
75 Normal .95 100 30 300 .0353
76 Uniform .68 100 10 300 .0354
77 Normal .68 50 20 100 .0374
78 Normal .99 100 30 100 .0391
79 Uniform .95 200 20 100 .0393
80 Normal .95 200 30 300 .0406
81 Uniform .95 50 10 300 .0407
82 Uniform .68 200 30 500 .0414
83 Normal .99 50 20 100 .0423
84 Uniform .99 200 10 300 .0432
85 Normal .68 100 20 500 .0435
86 Uniform .95 50 20 100 .0440
87 Uniform .68 50 30 100 .0442
88 Uniform .95 50 30 100 .0444
(table continues)

53
Table 13. (continued)
Rank D SD 1 CI S Averaged t-value
89 Uniform .95 100 20 500 .0446
90 Normal .68 50 10 100 .0448
91 Normal .95 200 10 100 .0456
92 Uniform .99 200 30 100 .0457
93 Uniform .68 50 20 300 .0470
94 Uniform .68 200 30 100 .0474
95 Uniform .99 100 10 300 .0477
96 Uniform .95 200 10 100 .0501
97 Uniform .68 200 10 500 .0502
98 Uniform .99 100 30 100 .0506
99 Normal .68 50 30 500 .0515
100 Uniform .68 200 10 300 .0539
101 Normal .95 200 20 100 .0543
102 Uniform .68 100 30 100 .0544
103 Normal .68 200 10 300 .0550
104 Uniform .99 100 30 300 .0551
105 Normal .95 100 30 500 .0558
106 Uniform .95 50 20 500 .0577
107 Normal .99 50 30 300 .0587
108 Uniform .99 50 20 300 .0600
109 Normal .68 100 10 100 .0601
110 Normal .68 200 30 500 .0615
111 Normal .99 50 10 500 .0621
112 Normal .99 200 10 300 .0631
(table continues)

54
Table 13. (continued)
Rank D SD 1 CI S Averaged t-value
113 Normal .68 50 30 100 .0634
114 Uniform .99 200 20 500 .0643
115 Normal .68 50 20 300 .0644
116 Normal .99 100 10 100 .0671
117 Uniform .68 200 20 100 .0698
118 Normal .99 100 20 300 .0703
119 Normal .95 100 10 500 .0712
120 Uniform .95 50 10 500 .0721
121 Uniform .99 100 10 500 .0737
122 Normal .95 100 20 300 .0744
123 Uniform .95 100 30 100 .0751
124 Uniform .99 100 20 300 .0756
125 Normal .68 200 10 100 .0765
126 Uniform .95 100 20 300 .0779
127 Normal .95 50 20 300 .0782
128 Uniform .95 100 20 100 .0791
129 Normal .68 50 20 500 .0836
130 Uniform .95 200 30 300 .0840
131 Uniform .95 100 10 500 .0845
132 Normal .68 50 30 300 .0882
133 Uniform .99 200 20 100 .0890
134 Normal .68 100 30 100 .0891
135 Uniform .99 200 10 100 .0893
136 Normal .68 100 30 300 .0903
(table continues)

55
Table 13. (continued)
Rank D SD I CI S Averaged t-value
137 Normal .68 100 10 300 .0914
138 Uniform .95 100 30 500 .0914
139 Normal .68 200 20 100 .0914
140 Uniform .95 200 10 500 .0945
141 Uniform .68 50 10 500 .0964
142 Uniform .68 200 20 300 .0999
143 Uniform .68 100 20 500 .1010
144 Normal .68 50 10 300 .1021
145 Uniform .99 100 20 500 .1027
146 Uniform .99 50 10 500 .1039
147 Normal .99 100 10 300 .1043
148 Uniform .95 100 10 100 .1122
149 Uniform .68 200 10 100 .1154
150 Normal .99 100 10 500 .1156
151 Normal .95 100 20 100 .1183
152 Uniform .99 200 10 500 .1207
153 Normal .95 200 10 500 .1215
154 Normal .95 200 30 100 .1321
155 Normal .68 50 10 500 .1354
156 Uniform .99 100 30 500 .1359
157 Normal .68 200 20 500 .1382
158 Uniform .99 100 10 100 .1552
159 Normal .95 50 10 500 .1658
160 Normal .68 200 10 500 .1708
(table continues)

56
Table 13. (continued)
Rank D SD 1 CI S Averaged t-value
161 Uniform .95 200 10 300 .1881
162 Normal .68 200 30 100 .1921
Note. The absolute values of the averaged t for 30 equated tests were used to rank the
162 test conditions.
D = distribution type (normal versus uniform), SD = standard deviation of item difficulties
(.68, .95, .99), T = test length (50, 100,200), CI = number of common items (10,20, 30),
S = sample size (100, 300, 500).

CHAPTER 5
CONCLUSIONS AND RECOMMENDATIONS
Findings
The study investigated two research questions. The first research question was:
Do the five factors (distribution type, standard deviation of item difficulties, test length or
number of test items, number of common items or common item length, and sample size)
significantly interact affecting test equating? A five-way fixed effects analysis of variance
indicated three statistically significant two-way interactions on the person measures for
common item length and test length (CI x T), standard deviation of item difficulties and
distribution type (SD x D), and standard deviation of item difficulties and sample size (SD
x S). These interactions were further examined using a simple effects test of one factor
across levels of another factor. The simple effects test indicated that: (1) all levels of
common item length were significant across all levels of test length and vice versa; (2)
both distribution types were significant at a standard deviation of item difficulties = .95
only; (3) all standard deviation of item difficulty levels were significant at a sample size of
100 only; and (4) all sample size levels were significant at a standard deviation of item
difficulties = .99. The Tukey Q statistical values for the mean pairwise comparisons of
each two-way interaction effect further indicated specific significant differences in
combinations of the factor levels.
57

58
The second research question was: What is the best combination of levels for these
five factors when test equating? Results indicated that a uniform distribution, a standard
deviation of item difficulty equaled to .99,100 items, 20 common items, and a sample size
of 100 yielded the smallest averaged t value for the common item measures. The averaged
t values ranged from .0006 to .1921. Therefore, this represents the best (optimum)
combination of the five factors for test equating for the present simulated study.
Effect Size Interpretation
The effect sizes (r|2 /1 - T}2) ranged from .001 to .004 for the interaction effects in
the five-way fixed effects analysis of variance. This implies that although three two-way
interactions were statistically significant, the magnitude of mean person measure
differences were of no practical importance. The effect sizes for common item length
(.043) and test length (.017) main effects were small. The common item length factor had
the highest effect size compared to other factors, thus it impacted test equating the most.
The important issue regarding these small effect sizes in the model is that small effect sizes
imply that the variability in the dependent variable (person measures) cannot be accounted
for above and beyond chance variation by levels of the factors. For example, knowing a
particular level of common item length, sample size, and test length, does not allow
variation to be explained much beyond sampling variability. The five factors accounted for
only 6.4% of the explained variation in the person measures. This would seem to imply
that the effectiveness of equating and the Rasch calibration technique are robust with
regard to variation in the population characteristics simulated.

59
Test Equating Effectiveness
The averaged t-values (averaged across the 30 replications of each test condition
combination) suggested that a uniform distribution, standard deviations of item difficulty
equal to .99, 100 items, 20 common items, and a sample size of 100 yielded the best
combination of the five factors for test equating. Wright and Stone (1979) found that 10
common items and a sample size of 100 were sufficient for test equating. The study
suggested that more common items (anchor items) and test items (test length) can lead to
better test equating. These findings appear to be consistent with the previous research
literature. For example, Angoff (1971) suggested that the number of anchor items used in
equating should be 20 or 20% of the number of items in the test, whichever is larger.
Hillis (1988) found that 25, 20, 15, or 10 anchor items provided effective test equating.
Ingebo (1997) elaborated the importance of having good common items when linking.
The findings in this study did not indicate much influence based on sample size, so a
sample size of 100 appears sufficient. In addition, Kolen and Whitney (1982) discussed
that larger sample sizes or a modification of equating methodologies would be necessary
before the three-parameter or equipercentile methods could be recommended for equating.
This does not appear to be the case for the Rasch model approach to test equating.
Further Study
The findings have shown that, in the present simulation, test equating with the
Rasch model is not significantly affected by the distribution type or by the standard
deviation of item difficulties. The three factors (common item length, test length, and

60
sample size) had the highest impact on test equating. This study, however, investigated the
influence of the five factors on the simulated data, which is not generalizable to other data
sets. Therefore, other types of factors that may potentially affect test equating should be
researched and investigated. For example, more complicated data with (extremely) skewed
distributions, a broader range of standard deviations, various proportions of common
items (anchor items) and test lengths, different sample sizes, and other possible
combinations of factors could be studied. Furthermore, further research on test equating
could consider other software programs for conducting simulations, equating, and
statistical analysis. Even though test equating using the Rasch model has been effectively
applied under various test conditions, other equating models should be studied; for
example, IRT with three parameters. Finally, a researcher should examine these factors
when using real data (test items).

APPENDIX A
SIMTEST PROGRAM (DATA SET 1)
61

62
Current Settings
Option Values are as Follows:
Output file:
Bias:
Number of biased items:
Std. dev. Of difficulties:
Distribution of difficulties:
Person count:
Item count:
Fraction of people with bias (%):
Mean of person measures:
Amount of startup reduction:
Pet. Of people w/ startup:
Slope parameter:
Maximum... minimum slope value:
Threshold for guessing:
Chance of guessing correctly (%):
Location of temporary files:
TEST1.DAT
1.00
5
.68 (.68, .95, or .99)
Normal (or Uniform)
100 (100, 300, or 500)
50 (50,100, or 200)
50%
0.00
0.00
0%
1.00
N/A
-1.00 e+200
50%
If these are ok, press < Return >
Otherwise press highlighted letter of the item to change, then press < Return >

APPENDIX B.
CONTROL AND DATA FILE
63

; This file is TEST1.C0N
64
&INST TITLE='Test 1 item analysis' NI=50 DATA=testl.dat ITEM1=13 NAME1=1 TABLES=11111111111111111111111 PERSON=Person ITEM=Math STBIAS=Y PFILE=testl.PF IFILE=testl .IF &END 1=1
2=2 3=3 4=4 5=5 6=6 7=7 8=8 9=9 10=10 11=11 12=12 13=13
: start of control variable instructions - at top of each printout page : number of items - name of data file : location of response to first item - start of person-id - output all tables - person label is Person - item label is Math - adjust for UCON estimation bias - also write person measures to a file - also write item calibration to a file - end of control variables - first item name
45=45 46=46 47=47 48=48 49=49 50=50 END NAMES
last, 5Cfh, item name signal end of item names

APPENDIX C.
ANCHOR FILE
65

66
; This file is EQUATE 1.CON &INST TITLE=lEquate 2 tests -10 Anchored items' NI=50 ITEM1=13 NAME1=1 PFILE=equate 1 .pf IFILE=equate 1 .if PERSON=PERSON ITEM=Math DAT Attest l.dat c= name of data file (anchoring test 2 to test 1) IAFILE=* <= list of items to be anchored (41 to 50) 41 -2.90 c= item 41 anchored at the measure of -2.90 (item difficulties) 42 -2.12 43 -.76 44-1.09 45 -.47 46 -.37 47 .09 48 .74 49 1.05 50 2.27 <= item 50 anchored at the measure of 2.27 (item difficulties)
&END 1 2 3 4 5 6 7 8 9 10
item names
47 48 49 50 END NAMES End of this file

APPENDIX D.
QUICKBASIC PROGRAM
67

68
DIM sd(3) DIM ssize(3) DIM ftestlen(3) DIM cilength(3) DIM linka(30) DIM linkc(30) DIM difflink(30) DIM linkaerr(30) DIM linkcerr(30) DIM resdiff(30) DIM stderres(30) DIM zscore(30) DIM tscore(30)
sd(l) = .68: sd(2) = .95: sd(3) = .99 ssize(l) = 100: ssize(2) = 300: ssize(3) = 500 ftestlen(l) = 50: ftestlen(2) = 100: ftestlen(3) = 200 cilength(l) = 10: cilength(2) = 20: cilength(3) = 30
A$ = "SIMTEST" B$ = "-H" Ca$ = "-OA" Cb$ = "-OB" Cc$ = "-OC" D$ = "-SO" Da$ = "-S0.68 " Db$ = "-S0.95 " Dc$ = "-S0.99" E$ = "-NO" f$ = "-DN" fb$ = "-DU" G$ = "-I" Ga$ = "-I40" Gb$ = "-I30" Gc$ = "-I20" Gd$ = "-I90" Ge$ = "-I80" Gf$ = "-I70" Gg$ = "-I190 " Gh$ = "-I180 " Gi$ = "-I170" h$ = "-P" Ha$ = "-P100" Hb$ = "-P300 " Hc$ = "-P500" i$ = "-F0" j$ = "-M1.0" k$ = "-G-" 1$ = "-A0.0" M$ = "-U0.0"

69
N$ = "-T-1E200" o$ = "-CO" P$ = "-L1.0 " Q$ = "-X2.0"
bigA$ = "&INST" bigB$ = "TITLE-item analysis'" bigC$ = "NI=" bigD$ = "DATA-1
bigE$ = "ITEM1=13" bigF$ = "TABLES=lllll 111111111111111 111" bigGS = "PERSON=Person" bigH$ = "ITEM = Math" bigl$ = "STBIAS = Y" bigJS = "PFILE=FILEOUT.PF" bigJaS = "PFILE=FILEOUT a.PF" bigK$ = "IFILE=FILEOUT.IF" bigKa$ = "IFILE=FILEOUT a.IF" bigL$ = "&END" bigM$ = "END NAMES" bigN$ = "IAFILE=*" bigO$ = "*" bigP$ = "NAME1=1"
OPEN "c:\NORMAL.MES" FOR APPEND AS #6 OPEN "c:\RANDNORM.NUM" FOR APPEND AS #7 OPEN "c:\COMNORM.LNK" FOR APPEND AS #8
FOR replicat = 1 TO 30 count = 0 FORh= 1 TO 3
FOR i =1 TO 3 FOR j = 1 TO 3
FORk = 1 TO 3 count = count + 1 OPEN "c:\simnorm.bat" FOR OUTPUT AS #1 FOR 1 = 1 TO 3
count$ = STR$(count) filel$ = RTRIM$(Ca$) + LTRIM$(".DAT ") file2$ = RTRIM$(Cb$) + LTRIM$(".DAT ") file3$ = RTRIM$(Cc$) + LTRIM$(".DAT ") IF 1 = 1 THEN itemlen = ftestlen(i) - cilength(j) IF 1 = 1 THEN C$ = filel $ IF 1 = 2 THEN itemlen = cilength(j) IF 1 = 2 THEN C$ = file2$ IF 1 = 3 THEN itemlen = ftestlen(i) - cilength(j) IF 1 = 3 THEN C$ = file3$ ITEMS = RTRIMS(GS) + LTRIM$(STR$(itemlen)) + "" samples = RTRIM$(h$) + LTRIM$(STR$(ssize(k))) + " " std$ = RTRIMS(DS) + LTRIM$(STR$(sd(h))) + ""

70
cmdlineS = A$ + B$ + C$ + std$ + E$ + f$ + ITEMS + sampleS + i$ + j$ + k$ +1$ + M$ + N$ + o$ + P$ +$Q
RANDOMIZE TIMER RNUMA$ = STR$(INT(RND * 10) + 1) RNUMBS = STR$(INT(RND * .59 * 100)) RNUMCS = STR$(INT(RND * .59 * 100)) RNUMDS = STR$(INT(RND * .59 * 100)) RNUMS = RTRIM$(RNUMA$) + + LTRIM$(RNUMB$) + + LTRIM$(RNUMC$) + +
LTRIM$(RNUMD$) PRINT #7, replicat, count, "NORMAL", sd(h), ftestlen(i), cilength(j), ssize(k), 1, RNUMS PRINT #1, "TIME H, RNUMS PRINT #1, cmdlineS NEXT 1
CLOSE #1
SHELL "c:\simnorm.bat"
OPEN "c:\a.dat" FOR INPUT AS #1 OPEN "c:\b.dat" FOR INPUT AS #2 OPEN "c:\c.dat" FOR INPUT AS #3 OPEN "c:\anew.dat" FOR OUTPUT AS #4 OPEN "c:\cnew.dat" FOR OUTPUT AS #5
WHILE NOT EOF(l) LINE INPUT #1,AFILE$ LINE INPUT #2, BFILES LINE INPUT #3, CFILES COMMS = RIGHT$(BFILE$, cilength(j)) NEWAS = RTRIMS(AFILES) + LTRIMS(COMMS) NEWCS = RTRIMS(CFILES) + LTRIMS(COMMS) PRINT #4, NEWAS PRINT #5, NEWCS
WEND
CLOSE #1 CLOSE #2 CLOSE #3 CLOSE #4 CLOSE #5
OPEN "c:\CONTROLl.CON" FOR OUTPUT AS #1
PRINT #1, bigAS PRINT #1, bigBS PRINT #1, RTRIMS(bigCS) + LTRIM$(STR$(ftestlen(i))) PRINT #1, RTRIM$("DATA=C") + LTRIMS("NEW.DAT") PRINT #1, bigES PRINT #1, bigPS PRINT #1, bigFS PRINT #1, bigGS

71
PRINT #1, bigHS PRINT #1, bigl$ PRINT #1, bigJ$ PRINT #1, bigKS PRINT #1, bigL$ PRINT #1, bigMS
CLOSE #1
OPEN "c:\CONTRL 1 A.CON" FOR OUTPUT AS #1
PRINT #1, bigA$
PRINT #1, bigB$ PRINT #1, RTRIM$(bigC$) + LTRIM$(STR$(ftestlen(i))) PRINT #1, RTRIM$("DATA=A") + LTRIM$("NEW.DAT") PRINT #1, bigE$ PRINT #1, bigP$ PRINT #1, bigF$ PRINT #1, bigG$ PRINT #1, bigHS PRINT #1, bigIS PRINT #1, bigJa$ PRINT #1, bigKaS PRINT #1, bigL$ PRINT #1, bigMS
CLOSE #1
SHELL "c:\bigsteps CONTROL1 .CON CONTROL1 .OUT < N.TXT" SHELL "c:\bigsteps CONTRL1 A.CON CONTRL1A.OUT < N.TXT"
OPEN "c:\FILEOUTa.IF" FOR INPUT AS #2 OPEN "c:\COMMONA.OUT" FOR OUTPUT AS #3 OPEN "c:\COMMONC.OUT" FOR OUTPUT AS #4
tlen = ftestlen(i) - cilength(j)
FOR linenum = 1 TO (tlen + 4) LINE INPUT #2, TEMPS
NEXT linenum
FOR linenum = 1 TO cilength(j) LINE INPUT #2, TEMPS ENTRYS = MID$(TEMP$, 1,6) MEASURES = MID$(TEMP$, 9, 7) ERRORS = MID$(TEMP$, 33,5) PRINT #3, ENTRYS, MEASURES, ERRORS
NEXT linenum
CLOSE #2

72
OPEN "c:\CONTROL2.CON" FOR OUTPUT AS #1
PRINT #1, bigA$ PRINT #1, bigB$ PRINT #1, RTRIM$(bigC$) + LTRIM$(STR$(ftestlen(i))) PRINT #1, bigE$ PRINT #1, bigP$ PRINT #1, bigJ$ PRINT #1, bigK$ PRINT #1, bigG$ PRINT #1, bigH$ PRINT #1, RTRIM$("DAT A=A") + LTRIM$(HNEW.DAT") PRINT #1, bigNS
OPEN "c:\FILEOUT-IF" FOR INPUT AS #2
tlen = ftestlen(i) - cilength(j)
FOR linenum = 1 TO (tlen + 4) LINE INPUT #2, TEMPS
NEXT linenum
FOR linenum = 1 TO cilength(j) LINE INPUT #2, TEMPS ENTRYS = MID$(TEMP$, 1,6) MEASURES = MIDS(TEMPS, 9, 7) ERRORS = MIDS(TEMPS, 33, 5) PRINT #1, ENTRYS, MEASURES PRINT #4, ENTRYS, MEASURES, ERRORS
NEXT linenum
CLOSE #2
PRINT #1, bigOS PRINT #l,bigL$ PRINT #1, bigMS
CLOSE #1 CLOSE #3 CLOSE #4
SHELL "c:\bigsteps CONTROL2.CON C0NTR0L2.0UT < N.TXT"
OPEN "c:\FILEOUT.PF" FOR INPUT AS #1 OPEN "c:\CONTROL2.out" FOR INPUT AS #2
WHILE NOT EOF(2) LINE INPUT #2, TEMPS

73
CHITEMP$ = MID$(TEMP$, 33,10) IF CHITEMPS = "CHI-SQUARE" THEN
LINE INPUT #2, TEMP$: LINE INPUT #2, TEMP$: LINE INPUT #2, TEMPS: LINE INPUT #2, TEMPS
CHI$ = MID$(TEMP$, 33,10) GOTO 10
END IF WEND
10 FOR linenum = 1 TO 4 LINE INPUT #1, TEMPS
NEXT linenum
FOR linenum = 1 TO ssize(k) LINE INPUT #1, TEMPS ENTRYS = MID$(TEMP$, 1,6) MEASURES = MID$(TEMP$, 9, 7) ERRORS = MID$(TEMP$, 33,5) PRINT #6, replicat, count, "NORMAL", sd(h), ftestlen(i), cilength(j), ssize(k), ENTRYS,
MEASURES, ERRORS, CHIS NEXT linenum CLOSE #1 CLOSE #2
OPEN "c:\COMMONA.OUT" FOR INPUT AS # 1 OPEN "c:\COMMONC.OUT" FOR INPUT AS #2
FOR linenum = 1 TO cilength(j) LINE INPUT #1, TEMPCOMAS LINE INPUT #2, TEMPCOMCS ITEMAS = MID$(TEMPCOMA$, 1,6): COMMONAS = MID$(TEMPCOMA$, 13, 8): ERRORAS
= MID$(TEMPCOMA$, 28,7) ITEMCS = MID$(TEMPCOMC$, 1,6): COMMONCS = MIDS(TEMPCOMC$, 13, 8): ERRORCS
= MID$(TEMPCOMC$, 28, 7) linka(linenum) = VAL(COMMONAS) linkc(linenum) = VAL(COMMONCS) linkaerr(linenum) = VAL(ERRORA$)
" linkcerr(linenum) = VAL(ERRORCS) NEXT linenum CLOSE #1 CLOSE #2
sum = 0 FOR linenum = 1 TO cilength(j)
difflink(linenum) = linkaOinenum) - linkc(linenum) stderres(linenum) = (linkaerr(linenum)A 2 + linkcerr(linenum)A 2)A .5 sum = difflink(linenum) + sum
NEXT linenum avgdiff = sum / cilength(j)

74
sum = 0 FOR linenum = 1 TO cilength(j)
ssdev = (difflink(linenum) - avgdiff)A 2 sum = ssdev + sum
NEXT linenum
sddiff = (sum / (cilength(j) - 1 ) ) A .5
sum = 0
FOR linenum = 1 TO cilength(j) zscore(linenum) = (difflink(linenum) - avgdiff) / (stderres(linenum)) sum = zscore(linenum) + sum
NEXT linenum avgz = sum / cilength(j) sum = 0 FOR linenum = 1 TO cilength(j)
tscore(linenum) = difflink(linenum) / stderres(linenum) sum = tscore(linenum) + sum
NEXT linenum avgt = sum / cilength(j)
sum = 0 FOR linenum = 1 TO cilength(j)
ssdev = (zscore(linenum) - avgz)A 2 sum = sum + ssdev
NEXT linenum
sdz = (sum / (cilengthQ - 1 ) ) A .5
sum = 0
FOR linenum = 1 TO cilengthQ ssdev = (tscore(linenum) - avgt)A 2 sum = sum + ssdev
NEXT linenum sdt = (sum / (cilength(j) - 1 ) ) A .5
PRINT #8, replicat, count, "NORMAL", sd(h), ftestlen(i), cilength(j), ssize(k), avgdiff, sddiff, avgz, sdz, avgt, sdt
CLOSE #1 CLOSE #2 NEXT k
NEXT j NEXT i
NEXT h NEXT replicat
CLOSE #6 CLOSE #7 CLOSE #8

REFERENCES
Allen, Mary J. & Yen, Wendy M. (1979). Introduction to measurement theory.
Belmont, CA: Wadsworth, Inc.
Angoff, W. H. (1971). Scales, norms, and equivalent scores. In R. L. Thorndike
(Ed.), Educational Measurement (2nd ed.). Washington, D.C.: American Council on
Education.
Cohen, J. (1988). Statistical power analysis for the behavioral sciences (2nd ed.).
New York: Academic Press.
Cook, L. L. & Petersen, N. S. (1987). Problems related to the use of conventional
and item response theory equating methods in less than optimal circumstances. Applied
Psychological Measurement. I l f3 \ 225-244.
Hergert, D. (1990). Microsoft Quick Basic: A Programmers Reference (1990).
Howard and Sams Publishing: Carmel, IN.
Hillis, J. R., Subhiyah, R. G., & Hirsch, T. M. (1988). Equating minimum-
competency tests: Comparisons of methods. Journal of Educational Measurement. 25GV
221-231.
Hinkle, D. E., Wiersma, W., & Jurs, S. G. (1994). Applied statistics for the
behavioral sciences (3rd ed.). Boston, MA: Houghton Mifflin Company.
Ingebo, G. (1997). Linking tests with the Rasch model. Rasch Measurement
Transactions. 1 lfl l . 549.
75

76
Kirk, R. E. (1995). Experimental design: Procedure for the behavioral sciences
(3rd ed.). Pacific Grove, CA: Brooks/Cole Publishing Company.
Kolen, M.J. & Brennan, R.L. (1995). Test Equating: Methods and Practices.
Springer Verlag: NY, NY.
Kolen, M. J. & Whitney, D. R. (1982). Comparison or four procedures for
equating the tests of general educational development. Journal of Educational
Measurement. 19(4). 279-293.
Linacre, J. M. & Wright, B. D. (1995). A user's guide to BIGSTEPS: Rasch-
Model computer program. Chicago: MESA Press.
Linn, R. L. (1993). Linking results of distinct assessments. Applied Measurement
in Education. 6(11 83-102.
Mislevy, R. J. (1992). Linking educational assessments: Concepts, issues, methods
and prospects. Princeton, NJ: Educational Testing Service, Policy Information Center.
Peterson, N. S., Kolen, M. J., & Hoover, H. D. (1989). Scaling norming, and
equating. In R. L. Linn (Eds.), Educational Measurement (3rd ed., pp. 221-262). New
York: Macmillan.
Rasch, G. (1960/1980). Probabilistic models for some intelligence and attainment
tests. Copenhagen: Danish institute for education research (Expanded edition). Chicago,
IL: University of Chicago Press.
SAS (1990). Statistical Analysis System. Cary, NC: SAS Institute Inc.
Schumacker, R. E. (1998). Comparing measurement theories. Paper Presented at

77
the American Educational Research Association. San Diego, CA.
Sireci, S. G. (1997). Problems and issues in linking assessments across languages.
Educational Measurement: Issues and Practices. 16(1). 12-19 & 29.
Skaggs, G. & Lissitz, R. W. (1986). An exploration of the robustness of four test
equating models. Applied Psychological Measurement. 10(3). 303-317.
Slinde J. A., & Linn R. L. (1979). The Rasch model, objective measurement,
equating, and robustness. Applied Psychological Measurement. 3(4). 437-452.
Smith, R. M. (1995). Applications of Rasch measurement: Item banking and test
equating. Chicago, IL: MESA Press.
Smith, R. M., & Kramer, G. A. (1992). A comparison of two methods of test
equating in the Rasch model. Educational and Psychological Measurement. 52. 835-847.
Smith, R. M., Schumacker, R. E., & Bush, M. J. (1998). Using item mean squares
to evaluate fit to the Rasch model. Journal of Outcome Measurement. 2(1). 66-78.
Vale, D. C. (1986). Linking item parameters onto a common scale. Applied
Psychological Measurement. 10(4). 333-344.
Waltman, K. K. (1997). Using performance standards to link statewide
achievement results to NAEP. Journal of Educational Measurement. 34(2). 101-121.
Wright, B. D., & Bell, S. R. (1984). Item banks: What, why, how. Journal of
Educational Measurement. 21. 331-345.
Wright, B. D., Congdon, R. T., & Rossner, M. (1986). MSCALE: A Rasch
program for rating scale analysis. Chicago: MESA Press.

78
Wright, B. D., & Masters, G. N. (1982). Rating scale analysis. Chicago: MESA
Press.
Wright, B. D., & Stone, M. H. (1979). Best test design: Rasch measurement.
Chicago, IL: MESA Press.