Embed Size (px)
Citation preview
EKONOMSKI ODNOSI S INOZEMSTVOM ECONOMIC RELATIONS WITH FOREIGN COUNTRIES
Statistički ljetopis 2006. Statistical Yearbook 361
21. EKONOMSKI ODNOSI S INOZEMSTVOM METODOLOŠKA OBJAŠNJENJA Podatke o robnoj razmjeni s inozemstvom prikazane u tablicama od 21-1. do 21-18. prikuplja Državni zavod za statistiku, a podaci o platnoj bilanci Republike Hrvatske, deviznim rezervama Hrvatske narodne banke, godišnjim i mjesečnim prosjecima srednjih deviznih tečajeva Hrvatske narodne banke, srednjim deviznim tečajevima Hrvatske narodne banke i o inozemnom dugu, prikazani u tablicama od 21-19. do 21-24., preuzeti su od Hrvatske narodne banke. Metodološka objašnjenja za tablice od 21-1. do 21-18. Izvori i metode prikupljanja podataka Do kraja 1999. izvori su podataka za statistiku robne razmjene s inozemstvom carinske deklaracije o izvozu i uvozu robe. Od 1. siječnja 2000. u primjeni je novi Carinski zakon (NN, br. 78/99., 94/99., 117/99., 73/00., 92/01. i 47/03.), kojim se propisuje uporaba nove carinske isprave – Jedinstvene carinske deklaracije. Sadržaj Jedinstvene carinske deklaracije prilagođen je njezinoj višestrukoj namjeni, tj. u nju se upisuju podaci koji su važni za postupak carinjenja te podaci za potrebe statistike i ostalih korisnika. Za prikupljanje i kontrolu ispravnosti jedinstvenih carinskih deklaracija odgovorna je Carinska uprava Republike Hrvatske, koja propisuje sadržaj, oblik, način ispunjavanja i način podnošenja Jedinstvenih carinskih deklaracija. Državni zavod za statistiku preuzima od Carinske uprave Republike Hrvatske kontrolirane Jedinstvene carinske deklaracije u obliku slogova na magnetnom mediju i dalje ih statistički obrađuje i objavljuje poštujući osnovne metodološke preporuke Statističkog ureda UN-a (International Trade Statistics, Concepts and Definitions; Series M, No. 52, Rev. 2., Statistical Office of the UN, New York, 1996.). Osim uvođenja novoga Carinskog zakona i nove carinske isprave u carinskom postupku, od 1. siječnja 2000. Državni zavod za statistiku promijenio je način statističke obrade podataka o izvozu i uvozu, prema kojem se u određenom mjesecu obrađuju samo one deklaracije koje imaju datum prihvaćanja (carinjenja) u carinarnici/ispostavi iz tog mjeseca. Radi usporedivosti, na isti način obrade revidirani su podaci od 1991. do 1999. Obuhvat Statistika robne razmjene s inozemstvom obuhvaća svu robu koja se izvozi iz zemlje odnosno uvozi u zemlju. Izvoz obuhvaća svu robu koja se izvozi iz Hrvatske, a potječe iz domaće proizvodnje ili unutarnjega robnog prometa. Uvoz obuhvaća svu robu koja je uvezena iz inozemstva radi potrošnje u zemlji ili radi unutarnje proizvodnje. Osim komercijalnih transakcija (uz naplatu), obuhvaćena je i roba čiji se promet, tj. izvoz i uvoz obavljaju bez plaćanja protuvrijednosti. Od 1990. u podatke o robnoj razmjeni s inozemstvom uključen je i izvoz i uvoz prema osnovi poslova oplemenjivanja (dorade, prerade i obrade), koji se uvođenjem novoga Carinskog zakona nazivaju unutarnjom i vanjskom proizvodnjom. Kod poslova unutarnje i vanjske proizvodnje prati se ukupna vrijednost robe u izvozu i u uvozu. Tako se npr. kod aktivnog prometa prati vrijednost materijala koji se uvozi na unutarnju proizvodnju odnosno puna vrijednost robe koja se izvozi nakon unutarnje proizvodnje (ovdje je uključena vrijednost uvezenog materijala, vrijednost domaćeg materijala i vrijednost domaćih usluga). Ovom statistikom nisu obuhvaćeni privremeni izvoz i uvoz robe kojase poslije vraća vlasniku u nepromijenjenu stanju, opskrba gorivom domaćih motornih vozila u inozemstvu i stranih u zemlji, opskrba naših diplomatskih predstavništava u inozemstvu, privremeni izvoz i uvoz radi popravaka, osobna prtljaga putnika i turističke pokretne stvari, reeksport (osim reeksporta radi oplemenjivanja) i komercijalni uzorci male vrijednosti. Metodološka objašnjenja
ECONOMIC RELATIONS WITH FOREIGN COUNTRIES
NOTES ON METHODOLOGY
Data on foreign trade, as shown in tables 21-1. – 21-18., are collected by the Central Bureau of Statistics, and data on the balance of payments of the Republic of Croatia, foreign exchange reserves of the Croatian National Bank, annual and monthly averages of foreign exchange rates of the Croatian National Bank, average foreign exchange rates of Croatian National Bank and foreign debt, as shown in tables 21-19. to 21-24., are taken over from the Croatian National Bank. Notes on Methodology for tables 21-1. to 21-18. Sources and methods of data collection Until the end of the year 1999, data sources for the foreign trade statistics were customs declarations on imports and exports of goods. Since 1 January 2000, the new Customs Law (NN, Nos. 78/99, 94/99, 117/99, 73/00, 92/01 and 47/03) has been in use in the Republic of Croatia, which introduces a new document – the Single Administrative Document. The content of the single administrative document is adjusted to its multiple uses, that is, it is filled in with data that are important for the process of customs clearance, as well as data needed by statisticians and other users. The Customs Administration of the Republic of Croatia is responsible for collection and control of the validity of single administrative documents. It also determines their content, form and how they are to be filled in and submitted. The Central Bureau of Statistics takes over from the Customs Administration of the Republic of Croatia reviewed single administrative documents in the form of magnetic data records, then performs further statistical analysis and publishes them according to the basic methodological recommendations of the Statistical Office of the UN (International Trade Statistics, Concepts and Definitions; Series M, No. 52, Rev. 2, Statistical Office of the UN, New York, 1996). Moreover, the approach to statistical data processing of exports andimports has been changed since 1 January 2000, by which only declarations approved on a particular day in a customs office/branch office during the reference month are processed. For the purpose of comparability, the data from 1991 to 1999 were revised in the same way. Coverage Statistics on foreign trade comprises all goods exported from or imported into the country, respectively. Exports comprises all goods exported from Croatia, which originate from domestic production or internal trade. Imports comprises all goods imported from abroad intended either for consumption or for inward processing. Besides commercial transactions (that includes charges), the statistics also comprises goods for which the trade, that is, exports and imports, is performed without the payment of the countervalue. Since 1990, data on foreign trade have included both imports and exports based on further processing (finishing, treatment and processing). After the implementation of the new Customs Law, this further processing is called inward and outward processing. In inward and outward processing, the total value of goods is monitored. Thus, in the case of an active transfer, the value of materials imported for inward processing, that is, the full value of goods exported after inward processing (including the value of imported material, the value of domestic material and the value of domestic services). This statistics does not include temporary export and import of goods that are returned to the owner in an unaltered state, fuel supply of domestic motor vehicles abroad and foreign motor vehicles in the country, supplying of our diplomatic missions abroad, temporary exports and imports for repair, personal luggage and tourist movables, re-export (except re-export for further processing) and commercial samples of small value. Notes on Methodology
EKONOMSKI ODNOSI S INOZEMSTVOM ECONOMIC RELATIONS WITH FOREIGN COUNTRIES
362 Statistički ljetopis 2006. Statistical Yearbook
Svi podaci o izvozu i uvozu izraženi su u vrijednostima. Vrijednost robe određena je na osnovi izvornih dokumenata poslovnih subjekata (ugovori, računi). Iskazuju se stvarno postignute vrijednosti u vrijeme kad su poslovi zaključeni (fakturne vrijednosti), koje se preračunavaju na paritet franko hrvatska granica. Izvozne vrijednosti obračunane su prema paritetu fob. To znači da se fakturna vrijednost umanjuje za transportne troškove i druge troškove od hrvatske granice do mjesta isporuke u inozemstvu, ako je ugovoreno da se roba isporučuje u inozemstvu. Ako je ugovoreno da se isporuka obavi u zemlji, fakturna vrijednost uvećava se za troškove nastale od mjesta isporuke do naše granice. Uvoz je obračunan prema paritetu cif. To znači da se fakturna vrijednost uvećava za troškove transporta i druge troškove od mjesta isporuke do hrvatske granice ako je ugovoreno da se roba isporučuje u inozemstvu. Ako je ugovoreno da se roba isporučuje u zemlji, fakturna se vrijednost umanjuje za troškove nastale od naše granice do mjesta isporuke u zemlji. Službeni podaci robne razmjene s inozemstvom od 1986. iskazuju se u nacionalnoj valuti i u američkim dolarima. Pritom se iznosi u stranim valutama preračunavaju u kune i američke dolare primjenom tekućih dnevnih tečajnih lista koje vrijede na dan carinjenja robe, tj. dana prihvaćanja Jedinstvene carinske deklaracije, a određuje ih Hrvatska narodna banka. Koristi se srednji valutni tečaj. Promjenu pariteta nacionalne valute po tekućim tečajnim listama za pojedina razdoblja prikazuje prosječno ostvareni tečaj američkog dolara u kunama u tim razdobljima. U pojedinim tablicama ukupno ne odgovara zbroju pojedinih stavki zbog zaokruživanja. Tablice 21-4. i 21-5. prikazuju podatke izvoza i uvoza po statističkim procedurama koje se dobivaju na osnovi kombinacija prethodnoga i zahtijevanoga carinskog postupka. Tablice 21-6. i 21-7. obrađuju izvoz i uvoz prema Međunarodnoj klasifikacijiekonomske namjene proizvoda (Classification by Broad Economic Categories– BEC). To je klasifikacija Ujedinjenih naroda utemeljena na Standardnojmeđunarodnoj trgovinskoj klasifikaciji, Rev. 3 (SMTK, Rev. 3). ProizvodiSMTK, Rev. 3, svrstavaju se u odgovarajuće skupine Međunarodneklasifikacije ekonomske namjene proizvoda (BEC) na osnovi svoje glavneekonomske namjene. Državni zavod za statistiku obrađuje podatke na osnovinavedene klasifikacije od 2000. Tablice 21-8. i 21-9. obrađuju izvoz i uvoz prema kriteriju GIG-a (Glavnihindustrijskih grupacija) tako da se obrađuju podaci za pet glavnih industrijskihgrupacija unutar područja Nacionalne klasifikacije djelatnosti 2002., premapretežnoj ekonomskoj namjeni konačne uporabe svih proizvoda unutar istihodjeljaka ili skupine. U tablicama 21-10. i 21-11. podaci o izvozu i uvozu iskazani su premaNacionalnoj klasifikaciji djelatnosti 2002., utemeljenoj na europskoj klasifikacijiNACE, Rev.1.1, koja je obvezatna za članice Europske unije (NN, 13/03.). Podaci po djelatnostima dobiveni su s pomoću korelacijskih tablica vezaizmeđu proizvoda Nomenklature carinske tarife i odgovarajućih razredaNacionalne klasifikacije djelatnosti 2002. Ti se podaci iskazuju premaproizvodnom načelu. Kod tog načela podaci i za izvoz i za uvoz dobivaju seprema djelatnosti koja proizvodi dotični proizvod, odnosno iz koje proizvodpotječe. Nomenklatura carinske tarife Republike Hrvatske usklađena je do razinešestomjesne šifre proizvoda s Harmoniziranim sustavom, do osmomjesne šifre s Kombiniranom nomenklaturom, a desetomjesna šifra proizvoda predstavlja nacionalnu razradu. Od 1. siječnja 2002. u prikupljanju podataka primjenjuje se Kombinirananomenklatura (NN, br. 113/01., 142/02., 184/03. i 165/04.), carinska istatistička klasifikacija proizvoda Europske unije, s daljom nacionalnomraščlambom. Prema odsjecima Kombinirane nomenklature prikazani su podaci u tablicama 21-12. do 21-15. Roba koja se pojavljuje u izvozu i uvozu u tablicama ovog ljetopisaklasificirana je prema Standardnoj međunarodnoj klasifikaciji (SMTK), koju
All the data on exports and imports are expressed in values. Value of goods is determined on the basis of original documents of business entities (contracts, accounts). The values expressed are real values achieved at the time deals were contracted (invoice values), which are then further recalculated into the free Croatian border parity. The export values are calculated on the basis of the free on board parity. It means that the invoice value is reduced for transportation and other costs incurred from the Croatian border to the place of delivery abroad, if it is agreed that goods are delivered abroad. If it is agreed for delivery to take place in the country (Croatia), the invoice value is increased by the costs incurred from the place of delivery in Croatia to the Croatian border. Import is calculated according to the CIF parity. It means that the invoice value is increased by transportation and other costs incurred from the place of delivery abroad to the Croatian border, if it is agreed that goods are delivered abroad. If it is agreed for delivery to take place in the country (Croatia), the invoice value is reduced for the costs incurred from the Croatian border to the place of delivery in Croatia. Since 1986, the official data on foreign trade have been expressed in the national currency and US dollars. The amounts expressed in foreign currency are converted into kuna and US dollars by use of current daily exchange rate lists, as determined by the Croatian National Bank, valid on the day customs duties are levied, that is, on the day when the single administrative document has been accepted. The average exchange rate is used. Changes of the parity of the national currency according to the exchange rate lists for certain periods is shown by the average exchange rate of the US dollar in kuna for these periods. In some tables the total may not equal the sum of separate items because of the rounding up of figures. Tables 21-4. and 21-5. show exports and imports data according to statistical procedures, which are obtained on the basis of the combination of previous and required customs procedure. In tables 21-6. and 21-7., data on exports and imports were processed according to the UN Classification by Broad Economic Categories (BEC). It is a UN classification based on the SITC Rev. 3. Goods classified in the SITC Rev. 3 are put into appropriate BEC groups on the grounds of their main intended use. The Central Bureau of Statistics has been processed data according to the BEC since 2000. In tables 21-8. and 21-9., exports and imports data are processed according to the MIG (Main Industrial Groupings). It means that only data for five main industrial groupings within sections of the National Classification of Activities, 2002 version, are processed according to the prevailing intended economic use of all products belonging to the same division or group. In tables 21-10. and 21-11. data on exports and imports are presented according to the NKD 2002. (NN, No. 13/03) based on the European classification NACE, Rev. 1.1, which is obligatory for all EU Member States. Data by activities are the result of correlation tables between the Nomenclature of Customs Tariffs and the corresponding NKD 2002. classes. These data are reported according to the type of activity. Data on exports and imports by type of activity are obtained according to the activity involved in the production of a certain product, that is, the one that product originates from. The Nomenclature of Customs Tariffs of the Republic of Croatia has been harmonised with the Harmonised system at a 6-digit level, with the Combined Nomenclature at a 8-digit level, while a national nomenclature has beenestablished at a 10-digit level. Since 1 January 2002 the Combined Nomenclature (NN, No. 113/01, 142/02, 184/03 and 165/04), the EU customs and statistical classification od products with further national breakdown has been used in data collection. Data have been presented in tables 21-12. to 21-15. according to the Combined Nomenclature sections. Goods listed under exports and imports in tables of this Yearbook are classified
EKONOMSKI ODNOSI S INOZEMSTVOM ECONOMIC RELATIONS WITH FOREIGN COUNTRIES
Statistički ljetopis 2006. Statistical Yearbook 363
donosi Statistički ured UN-a, a preuzeta je i primjenjuje se u Hrvatskoj od1953. Standardna međunarodna trgovinska klasifikacija koristi se uglavnom zastatističko agregirano iskazivanje i objavljivanje podataka o izvozu/uvozu robe. Za samo prikupljanje podataka o izvozu/uvozu robe i za deklariranje robe upostupku carinjenja rabi se Harmonizirani sustav nazivlja i brojčanogoznačavanja robe (HS) međunarodnog Savjeta za carinsku suradnju odnosnona njemu temeljena nacionalna Nomenklatura carinske tarife. Od 1. siječnja 1988. u primjeni je revidirana nomenklatura SMTK (Rev. 3), kojaje znatno razrađenija od prijašnjih te maksimalno usklađena i povezana sHarmoniziranim sustavom odnosno s Nomenklaturom carinske tarife. Izmjena Nomenklature carinske tarife utjecala je na način grupiranja podatakapo djelatnostima i SMTK jer se ta obilježja dobivaju razvrstavanjem proizvodaiz Nomenklature carinske tarife s pomoću korelacijskih tablica. Podaci o izvozu/uvozu iskazuju se prema zemljama namjene robe uizvozu i prema zemljama podrijetla robe u uvozu. To znači da se kodizvoza registrira zemlja u kojoj se roba troši ili dalje prerađuje, a kod uvozaona zemlja u kojoj je roba proizvodnjom ili doradom dovedena u stanje ukojem se uvozi. Kad zemlja namjene/podrijetla nije poznata, u izvozu seiskazuje zemlja kojoj je roba upućena, a kod uvoza zemlja iz koje je robadopremljena. Od 1. svibnja 2004. Europskoj je uniji pridruženo 10 novih zemalja članica: Cipar, Češka, Estonija, Letonija, Litva, Mađarska, Malta, Poljska, Slovačka iSlovenija. Podaci za županije Podaci po županijama dobiveni su na osnovi razvrstavanja poduzeća koja surealizirala izvoz i uvoz u onu županiju (općinu, grad) u kojoj su registriranaprema Registru poslovnih subjekata.
according to the Standard International Trade Classification (SITC), approvedby the Statistical Office of the UN, and implemented in Croatia since 1953. The Standard International Trade Classification is mainly used for statistical aggregated presentation and publishing of data on export/import of goods. For collecting data on export/import of goods and clearing goods through customs, the Harmonized Commodity Description and Coding System of the International Council for Customs Cooperation is referred to, and the national Nomenclature of Customs Tariffs based on it, respectively. Since 1 January 1988, a revised nomenclature of the Standard International Trade Classification (third revision) has been implemented, which is more complex from previous ones and maximally coordinated with the Harmonized System and the Nomenclature of Customs Tariffs. The change in the Nomenclature of Customs Tariffs has affected the grouping of data by activities and SITC, since these items result from the classification of products of the Nomenclature of Customs Tariffs by correlation tables. Data on imports and exports are reported according to the country of destination, in case of an export, and the country of origin, in case of an import. Thus, the country registered in case of an export is the one in which goods are consumed or further processed, and, in case of an import, it is the one where goods, through production or processing, achieved the condition they are in at the time of exports. When the country of destination/origin is not known, export shows the country goods are destined to, and import shows the one goods are coming from. Since 1 May 2004, The European Union has been enlarged with 10 new Member States: Cyprus, the Czech Republic, Estonia, Latvia, Lithuania, Hungary, Malta, Poland, Slovakia and Slovenia. Data on counties Data by counties were obtained on the basis of the breakdown of enterprises that realised exports and imports into a county (municipality, town/city) in which they are registered according to the Register of Business Entities.
Metodološka objašnjenja za tablice od 21-19. do 21-24. Izvori i metode prikupljanja podataka Platna bilanca Platna bilanca Republike Hrvatske (tablice 21-19.) sistematičan je prikaz vrijednosti ekonomskih transakcija hrvatskih rezidenata s inozemstvom u određenome vremenskom razdoblju. Sastavlja se u skladu s metodologijom koju je preporučio Međunarodni monetarni fond (Priručnik za sastavljanje platne bilance, 5. izdanje, 1993.). Tri su vrste izvora podataka za sastavljanje platne bilance: 1. izvješća državnih institucija (Državnog zavoda za statistiku i Hrvatskog zavoda za zdravstveno osiguranje), 2. specijalizirana izvješća Hrvatske narodne banke (o ostvarenome platnom prometu s inozemstvom, dužničkim odnosima s inozemstvom, monetarnoj statistici i međunarodnim pričuvama) te 3. procjene i statistička istraživanja koje provodi Hrvatska narodna banka. Platna bilanca Republike Hrvatske iskazuje se u tri valute: u euru (EUR), u američkom dolaru (USD) i kuni (HRK). U sva tri slučaja koriste se isti izvori podataka i primjenjuju se ista načela obuhvata transakcija i kompiliranja pojedinih stavki. Izvorni podaci iskazani su u raznim valutama pa vrijednost transakcija treba preračunati iz originalne valute u izvještajnu valutu upotrebom tečajeva s tečajnice Hrvatske narodne banke na jedan od sljedećih načina: − primjenom srednjih tečajeva na dan transakcije − primjenom prosječnih mjesečnih ili tromjesečnih srednjih tečajeva kada nije poznat datum transakcije − primjenom tečaja na kraju razdoblja za izračun promjene vrijednosti transakcija između dva razdoblja; iz stanja iskazanih na kraju razdoblja u originalnoj valuti izračunava se vrijednost promjene u originalnoj valuti, koja se primjenom prosječnoga srednjeg tečaja u promatranom razdoblju preračunava u vrijednost promjene u izvještajnoj valuti. Stavke platne bilance koje se odnose na izvoz i uvoz robe slažu se od
Notes on Methodology for tables 21-19. to 21-24. Sources and methods of data collection Balance of Payments The balance of payments of the Republic of Croatia (Table 21-19.) represents a systematic overview of the value of economic transactions performed by the Croatian residents with foreign countries within a particular period. It is compiled in accordance with the recommendations of the International Monetary Fund (Balance of Payments Manual, Fifth Edition, 1993). Data sources include: 1. reports of the government institutions (Central Bureau of Statistics and Croatian Institute for Health Insurance), 2. special reports of the Croatian National Bank (International Transaction Reporting System (ITRS), external debt relations, monetary statistics and reserve assets) and 3. estimates and statistical research carried out by the Croatian National Bank. Balance of payments of the Republic of Croatia data are reported in three currencies: in euro (EUR), US dollars (USD) and in domestic currency (HRK). In both cases, the same data sources are used and the same principles regarding the scope of transactions and the procedures for compiling particular items are applied. Since the original data are reported in different currencies, the transaction values are converted from the original currency into the reporting currency by applying the exchange rate from the CNB exchange rate list in one of the following manners: – by applying the midpoint exchange rate on the date of the transaction; – by applying the average monthly or quarterly midpoint exchange rate in the
case the transaction date is not available; – by applying the end-of-period exchange rate for the calculation of a change in the
transaction value between the two periods; the end-of-period balances reported in the original currency serve as a basis for calculating the change in the original currency value, which is converted, by applying the average midpoint exchange rate in the observed period, into the value of change in the reporting currency.
The Report of the Central Bureau of Statistics on merchandise foreign trade of
EKONOMSKI ODNOSI S INOZEMSTVOM ECONOMIC RELATIONS WITH FOREIGN COUNTRIES
364 Statistički ljetopis 2006. Statistical Yearbook
podataka Državnog zavoda za statistiku o ostvarenoj robnoj razmjeni Republike Hrvatske s inozemstvom. Ti se podaci u skladu s preporučenom metodologijom prilagođuju za obuhvat i klasifikaciju. U skladu s tom metodologijom, izvoz i uvoz robe iskazuju se u platnoj bilanci prema paritetu fob. Vrijednost izvoza prema tom paritetu već je sadržana u spomenutom izvješću DZS-a, dok se vrijednost uvoza prema paritetu fob procjenjuje uz pomoć istraživanja Hrvatske narodne banke koje se provodi na stratificiranom uzorku uvoznika, na osnovi čijih se rezultata procjenjuje udio usluga prijevoza i osiguranja za koji se umanjuje originalna vrijednost uvoza prema paritetu cif iz navedenog izvješća DZS-a. U razdoblju od 1993. do 2001. taj je udio iznosio 7,10% (procijenjen samo na uzorku najvećih i velikih uvoznika), dok od2002. iznosi 3,73%. U razdoblju od 1993. do 1996. vrijednost uvoza dopunjavala se procjenom uvoza u slobodne carinske zone, koji je od 1997. uključen u statistiku robne razmjene. Od 1996. izvoz i uvoz robe dopunjuju se podacima o popravcima robe i opskrbi brodova i zrakoplova u pomorskim i zračnim lukama. Osim toga, od 1999., na osnovi rezultata Istraživanja o potrošnji inozemnih putnika u Hrvatskoj i domaćih putnika u inozemstvu, stavka izvoza robe dopunjuje se procijenjenom vrijednošću robe prodane stranim putnicima i turistima i iznesene iz Republike Hrvatske, a stavka uvoza robe dopunjuje se procijenjenom vrijednošću robe koju su hrvatski građani osobno uvezli iz susjednih zemalja (troškovi za tzv. shopping). Na računu usluga zasebno se vode usluge prijevoza, putovanja – turizma i ostale usluge. Prihodi i rashodi s osnove usluga prijevoza su u razdoblju od 1993. do 1998. preuzimani iz evidencije platnog prometa s inozemstvom. Počevši od 1999., prihodi i rashodi s osnove prijevoza robe i putnika, kao i vrijednost pratećih usluga, koji zajedno čine ukupnu vrijednost tih usluga, sastavljaju se na osnovi rezultata Istraživanja o transakcijama povezanim s uslugama međunarodnog prijevoza, što ga provodi HNB. Zbog izrazito velike populacije cestovnih prijevoznika, prihodi i rashodi s osnove cestovnog prijevoza ne preuzimaju se iz tog istraživanja, nego se sastavljaju upotrebom podataka o ostvarenom platnom prometu s inozemstvom. Kod usluge prijevoza robe rashodi se dopunjuju dijelom troškova prijevoza i osiguranja koji se odnosi na uvoz robe koji pripada nerezidentima, a koji se procjenjuje na osnovi svođenja vrijednosti uvoza prema paritetu cif na vrijednost uvoza prema paritetu fob. Prihodi od usluga pruženih stranim putnicima i turistima, kao i rashodi koje su domaći putnici i turisti imali u inozemstvu prikazuju se na poziciji Putovanja –turizam. U razdoblju od 1993. do 1998. ta se pozicija procjenjivala upotrebom različitih izvora podataka koji nisu osiguravali potpuni obuhvat u skladu s preporučenom metodologijom, stoga je Hrvatska narodna banka od druge polovice 1998. počela provoditi Istraživanje o potrošnji inozemnih putnika u Hrvatskoj i domaćih putnika u inozemstvu i koristiti se njegovim rezultatima pri kompilaciji stavaka na poziciji Putovanja – turizam. Od početka 1999. rezultati tog istraživanja, koje se zasniva na anketiranju putnika (stratificirani uzorak) na graničnim prijelazima, kombiniraju se s podacima Ministarstva unutarnjih poslova o ukupnom broju stranih i domaćih putnika te s podacima o distribuciji stranih putnika prema državama iz priopćenja o turizmu Državnog zavoda za statistiku kako bi se procijenile odgovarajuće stavke platne bilance. Pozicija Ostale usluge sastavlja se upotrebom različitih izvora podataka: osim prihoda i rashoda koji se odnose na usluge osiguranja i komunikacijske usluge, koji se od 2001. utvrđuju uz pomoć specijaliziranih statističkih istraživanja HNB-a, vrijednosti svih ostalih usluga preuzimaju se iz statistike ostvarenoga platnog prometa s inozemstvom. Na računu dohotka transakcije se raspoređuju u četiri osnovne grupe. Stavka Naknade zaposlenima sastavlja se na osnovi ostvarenoga platnog prometa s inozemstvom. Dohoci od izravnih ulaganja, portfeljnih ulaganja odnosno ostalih ulaganja prikazuju se odvojeno. U okviru dohotka od izravnih ulaganja, koji se izračunava na osnovi Istraživanja Hrvatske narodne banke o izravnim i ostalim vlasničkim ulaganjima, posebno se iskazuje podatak o zadržanoj dobiti. Za razliku od podataka o dividendama, taj podatak ne postoji za razdoblje od 1993. do 1996. jer se onda nije posebno iskazivao. Na osnovi statističkih podataka o dužničkim odnosima s inozemstvom, počevši od 1997., dohodak od izravnih ulaganja uključuje i podatke o kamatama za kreditne odnose između vlasnički izravno povezanih rezidenata i nerezidenata. Dohodak od vlasničkih portfeljnih ulaganja sastavlja se na osnovi istog istraživanja, dok se podaci o dohotku od dužničkih portfeljnih ulaganja sastavljaju od 1999. na osnovi plaćenog dohotka iz evidencije kreditnih odnosa s inozemstvom, koja obuhvaća i plaćanja koja se odnose na dužničke
the Republic of Croatia represents the basic data source for the balance of payments items related to exports and imports. These data are adjusted, in accordance with the recommended compilation method, for coverage and classification. Accordingly, goods exports and imports in the balance of payments are reported at f.o.b. parity. The value of exports at this parity is already contained in the previously mentioned CBS Report, whereas the value of imports f.o.b. is estimated on the basis of research studies of the CNB on the stratified sample of importers. The resulting value serves as a basis for the estimate of the share of transportation and insurance services by which the original value of imports c.i.f., stated in the CBS Report, is reduced. In the 1993-2001 period, this share stood at 7.10% (estimated only on the basis of the largest and large exporters), while from 2002 on it has amounted to 3.73%. In the period from 1993 to 1996, the value of imports was modified by estimates of imports in duty free zones, which have been included in the merchandise trade statistics since 1997. Starting from 1996, goods exports and imports have been modified by the data on repairs on goods and goods procured in ports by carriers. In addition, since 1999, based on the Survey on Consumption of Foreign Travellers in Croatia and Domestic Travellers Abroad, the item of goods exports has been modified by the estimated value of goods sold to foreign travellers and tourists and taken out of the Republic of Croatia. The item of goods imports is adjusted for the estimated value of goods imported personally by the Croatian citizens from the neighbouring countries (shopping expenditures). Transportation, travel and other services are reported separately under service account. Income and expenditures on the basis of transportation, in the 1993-1998 period, were adopted from the ITRS. Starting from 1999, income and expenditures arising from transportation of goods and passengers, as well as the value of accompanying services, which together constitute the total value of these services, have been compiled on the basis of the results of the Research on transactions related to international transportation services, carried out by the CNB. Owing to an exceptionally large population of road carriers, income and expenditures on the basis of road transportation are not adopted from this research. They are compiled by using ITRS data. As regards transportation of goods, expenditures are supplemented by a portion of transportation and insurance costs related to imports of goods which belongs to non-residents and which is estimated by adjusting the value of imports at c.i.f. parity to the value of imports f.o.b. Income from services rendered to foreign travellers and tourists, as well as expenditures incurred by domestic travellers and tourists abroad are shown under the position Travel. In the 1993-1998 period, this position was assessed by using various data sources which did not provide for a full coverage in accordance with the recommended methodology. Accordingly, in the second half of 1998, the Croatian National Bank started to carry out the Survey on Consumption of Foreign Travellers in Croatia and Domestic Travellers Abroad and use its results for compiling the Travel position. Since early 1999, the results of this Survey, based on carrying out a survey of travellers (stratified sample) at border crossings, have been combined with the Ministry of the Interior data on total number of foreign and domestic travellers, along with the data on distribution of foreign travellers by countries contained in the CBS Report on tourism, in order to assess the corresponding balance of payment items. Other services position is complied by using different data sources: apart from income and expenditures related to insurance and communication services, which have been determined by the CNB special statistical research since 2001, the values of all other services are adopted from the ITRS. Transactions in the income account are classified into four main groups. Compensation of employees item is compiled on the basis of the ITRS. Income from direct investment, portfolio investment and other investment are reported separately. Data on reinvested earnings are reported separately, under direct investment income, calculated on the basis of the CNB Research on direct and other equity investment. In contrast to data on dividends, these data are not available for the 1993-1996 period, since at that time they were not reported separately. On the basis of statistical data on external debt relations, starting from 1997, income from direct investment includes data on interest arising from credit relations between residents and non-residents directly related through ownership. Income from equity portfolio investment is compiled on the basis of the same research, whereas data on debt portfolio investment income have been compiled since 1999, based on income reported in statistics on foreign credit relations, which also encompass payments related to debt securities owned by non-residents. Income from other investments includes all payments
EKONOMSKI ODNOSI S INOZEMSTVOM ECONOMIC RELATIONS WITH FOREIGN COUNTRIES
Statistički ljetopis 2006. Statistical Yearbook 365
vrijednosne papire u vlasništvu nerezidenata. Dohodak od ostalih ulaganja obuhvaća sva plaćanja i naplate kamata prema evidenciji kreditnih odnosa s inozemstvom. Tekući transferi odvojeno se prikazuju za sektor države i za ostale sektore. Evidencija platnog prometa s inozemstvom koristi se kao glavni izvor podataka o tekućim transferima za oba sektora. Osim poreza i trošarina, mirovina te novčanih pomoći i darova, koji su uključeni u tekuće transfere oba sektora, sektor države obuhvaća i podatke o međudržavnoj suradnji, a ostali sektori sadrže i podatke o radničkim doznakama. U tekuće se transfere kod sektora države također dodaju podaci o uvozu i izvozu robe bez plaćanja, koje dostavlja Državni zavod za statistiku. U razdoblju od 1993. do 1998. tekući transferi ostalih sektora obuhvaćali su i procjenu neregistriranih deviznih doznaka, koja je činila 15% pozitivne razlike između neklasificiranog priljeva i neklasificiranog odljeva sektora stanovništva. Od 1993. do drugog tromjesečja 1996. Hrvatska narodna banka procjenjivala je i dio odljeva s osnove tekućih transfera. Od 2002. priljevi i odljevi po tekućim transferima ostalih sektora dopunjuju se podacima specijaliziranoga statističkog istraživanja HNB-a o međunarodnim transakcijama povezanima s uslugama osiguranja. Kapitalni račun zasniva se na evidenciji platnog prometa s inozemstvom, i to na onom njegovu dijelu koji se odnosi na transfere iseljenika. Osim toga, u kapitalni račun uključuju se i transferi koji se ne mogu klasificirati u tekuće transfere, kao što su alokacija zlata bivše SFRJ ili ulaganja u prava i patente. Inozemna izravna ulaganja obuhvaćaju vlasnička ulaganja, zadržanu dobit i dužničke odnose između vlasnički povezanih rezidenata i nerezidenata. Izravna vlasnička ulaganja su kojima strani vlasnik stječe najmanje 10% udjela u temeljnom kapitalu trgovačkog društva, bez obzira na to je li riječ o ulaganju rezidenta u inozemstvo ili nerezidenta u hrvatske rezidente. Istraživanje Hrvatske narodne banke o inozemnim izravnim ulaganjima počelo je 1997.kada su poduzeća obuhvaćena istraživanjem dostavila i podatke o izravnim vlasničkim ulaganjima za razdoblje od 1993. do 1996. Za isto razdoblje ne postoje podaci o zadržanoj dobiti i ostalom kapitalu izravnih ulaganja u koji se klasificiraju svi dužnički odnosi između povezanih rezidenata i nerezidenata (osim za bankarski sektor) i koji su postali dostupni tek nakon početka provođenja spomenutog istraživanja. Od 1999. podaci o dužničkim odnosima unutar izravnih ulaganja prikupljaju se na osnovi evidencije dužničkih odnosa s inozemstvom. Podaci o portfeljnim vlasničkim ulaganjima prikupljaju se iz istog izvora kao i podaci o izravnim vlasničkim ulaganjima. Portfeljna dužnička ulaganja obuhvaćaju sva ulaganja u kratkoročne i dugoročne dužničke vrijednosne papire koja se ne mogu klasificirati u izravna ulaganja. U razdoblju od 1997. do 1998. ti su se podaci prikupljali istraživanjem Hrvatske narodne banke o izravnim i portfeljnim ulaganjima, dok se od 1999. koriste podaci o dužničkim odnosima s inozemstvom i podaci monetarne statistike za ulaganja banaka. Počevši od 2002., ta se pozicija sastavlja i za investicijske fondove, a od 2004. i za mirovinske fondove. Ostala ulaganja obuhvaćaju sva ostala nespomenuta dužnička ulaganja, osim ulaganja koja čine međunarodne pričuve. Ostala se ulaganja klasificiraju prema instrumentima, ročnosti i sektorima. Trgovinski krediti u razdoblju od 1996. do 2002. obuhvaćaju procjenu Hrvatske narodne banke za avansna plaćanja i odgode plaćanja koja je napravljena na osnovi uzorka najvećih i velikih uvoznika i izvoznika. Podaci o avansima procjenjuju se od 1996., dok se podaci o kratkoročnim odgodama plaćanja (najprije do 90 dana, zatim do 150 dana, a danas od 8 dana do 1 godine) prikupljaju od 1999. Od 2003. to je istraživanje zamijenjeno novim istraživanjem, a podatke za njega obvezna su dostavljati izabrana poduzeća bez obzira na svoju veličinu (stratificirani uzorak). Podaci o odgodama plaćanja s originalnim dospijećem dužim od godine dana preuzimaju se iz evidencije Hrvatske narodne banke o kreditnim odnosima s inozemstvom. Krediti koje su rezidenti odobrili nerezidentima, odnosno inozemni krediti kojima se koriste rezidenti, a odobrili su ih nerezidenti, a koji se ne mogu svrstati u izravna ulaganja ili u trgovinske kredite, svrstani su prema institucionalnim sektorima i ročnosti u odgovarajuće pozicije ostalih ulaganja. Izvor podataka tih pozicija jest evidencija Hrvatske narodne banke o kreditnim odnosima s inozemstvom. Pozicija valuta i depozita pokazuje potraživanja rezidenata od inozemstva za stranu efektivu i depozite koji se nalaze u stranim bankama, kao i obveze hrvatskih banaka za depozite u vlasništvu nerezidenata. Izvor podataka za sektore države i banaka jest monetarna statistika, iz koje se na osnovi podataka o stanjima i valutnoj strukturi inozemne aktive i pasive procjenjuju transakcije iz kojih je uklonjen utjecaj tečaja. U razdoblju od 1993. do 1998. podaci o potraživanjima ostalih sektora na ovoj poziciji kompilirali su se na osnovi procjene Hrvatske narodne banke koja se zasnivala na dijelu neto deviznog priljeva stanovništva koji nije klasificiran u tekuće transfere. Od 1999. ta
and collections of interest in accordance with the foreign credit relations statistics. Current transfers are reported separately for the general government sector and other sectors. The ITRS is used as the main data source on current transfers for both sectors. In addition to taxes and excise duties, pensions, monetary support and donations, which are included in current transfers of both sectors, the government sector also encompasses data on multilateral co-operation, whereas other sectors include data on workers’ remittances. Current transfers of the general government sector also include data on exports and imports of goods without a payment obligation, provided by the CBS. In the 1993-1998 period, current transfers of other sectors also encompassed an estimate of unregistered foreign currency remittances, which accounted for 15% of the positive difference between unclassified inflows and outflows of the household sector. From 1993 to the second quarter of 1996, the CNB also assessed a portion of the outflow based on current transfers. Since 2002, inflows and outflows based on current transfers of other sectors are supplemented by the data of the CNB special statistical research on international transactions related to insurance services. Capital account is compiled on the basis of the ITRS, particularly on their part related to transfers of migrants. In addition, capital account includes transfers that cannot be classified into current transfers, such as allocation of gold of the former SFRY or investments in patents and rights. Foreign direct investments include equity capital, reinvested earnings and debt relations between ownership-related residents and non-residents. Direct investments are investments whereby a foreign owner acquires a minimum of 10% interest in equity capital of a company, regardless of whether a resident invests abroad or a non-resident invests in Croatian residents. The CNB Research on foreign direct investments started in 1997 when companies included in the survey also delivered data on direct investments for the 1993-1996 period. For the same period, no data are available on reinvested earnings and other capital under direct investment position, where all debt relations between related residents and non-residents are classified (excluding the banking sector). Such data actually became available only after the stated research has been launched. Since 1999 data on debt relations within direct investments have been collected on the basis of external debt relations statistics. Data on equity portfolio investments are collected from the same data source as the data on direct investments. Debt portfolio investments include all investments in short-term and long-term debt securities that cannot be classified under direct investments. In the 1997-1998 period, these data were collected through the CNB Research on direct and portfolio investments, and since 1999 data on external debt relations and monetary statistics data for bank investment have been used. Starting from 2002 and 2004, this position has also been compiled for investment funds and pension funds, respectively. Other investment encompasses all other debt investments that have not been mentioned, apart from investment constituting reserve assets. Other investments are classified by instruments, maturity and sectors. Trade credits, in the 1996-2002 period, included the CNB estimates of advance payment and deferred payments, made on the basis of the sample of the largest and large importers and exporters. Data on advance payments have been estimated since 1996, while data on short-term deferred payments (first up to 90 days, then up to 150 days, and today from 8 days to 1 year) have been collected since 1999. In 2003 this research was replaced by a new one, where the selected companies, regardless of their size (stratified sample), are obliged to submit data. Data on deferred payments with the original maturity of more than one year are adopted from the CNB foreign credit relations statistics. Credits granted by residents to non-residents, i.e. foreign loans utilised by residents and granted by non-residents, which cannot be classified into direct investments or trade credits, are classified by the institutional sector and maturity under the corresponding positions of other investment. The CNB foreign credit relations statistics represent the data source for these positions. Currency and deposit position shows residents’ claims on foreign countries for foreign cash and deposits with foreign banks, as well as obligations of the Croatian banks for deposits owned by non-residents. Monetary statistics represent a data source for the general government sector and banks sector. Data on balance and currency structure of foreign assets and liabilities, contained in monetary statistics, are used to assess transactions from which the exchange rate effect was eliminated. In the 1993-1998 period, data on other sectors’ claims under this position were compiled on the basis of the CNB estimate of a portion of net foreign currency inflows of the household
EKONOMSKI ODNOSI S INOZEMSTVOM ECONOMIC RELATIONS WITH FOREIGN COUNTRIES
366 Statistički ljetopis 2006. Statistical Yearbook
pozicija sadrži samo podatke prema tromjesečnim podacima Banke za međunarodne namire, dok se podaci u četvrtom tromjesečju 2001. i prva dva tromjesečja 2002. odnose na efekt promjene valuta država članica EMU-a u euro. U razdoblju od 1993. do 1998. procjena transakcija u pozicijama međunarodnih pričuva napravljena je tako da su promjene u originalnim valutama pretvorene u dolare primjenom prosječnih mjesečnih tečajeva valuta sadržanih u pričuvama. Promjene salda međunarodnih pričuva od 1999. izračunavaju se na osnovi računovodstvenih podataka Hrvatske narodne banke. Međunarodne pričuve Hrvatske narodne banke i devizne pričuve poslovnih banaka Međunarodne pričuve Hrvatske narodne banke (tablica 21-20.) iskazuju se u skladu s Priručnikom za sastavljanje platne bilance (Međunarodni monetarni fond, 1993.) i uključuju ona potraživanja Hrvatske narodne banke od inozemstva koja se mogu koristiti za premošćivanje neusklađenosti međunarodnih plaćanja. Međunarodne pričuve sastoje se od posebnih prava vučenja, pričuvne pozicije u MMF-u, zlata, strane valute i depozita kod stranih banaka te obveznica i zadužnica. Devizne pričuve banaka uključuju stranu valutu i depozite domaćih banaka kod stranih banaka. Te su devizne pričuve dopunska rezerva likvidnosti za premošćivanje neusklađenosti međunarodnih plaćanja. Bruto inozemni dug prema domaćim sektorima Inozemni dug (tablica 21-23.) obuhvaća sve obveze rezidenata na osnovi: dužničkih vrijednosnih papira izdanih na inozemnim tržištima (po nominalnoj vrijednosti), kredita (uključujući repo ugovore) neovisno o ugovorenom dospijeću, depozita primljenih od stranih osoba te trgovinskih kredita primljenih od stranih osoba s ugovorenim dospijećem dužim od 180 dana (do 11. srpnja 2001. taj je rok iznosio 90 dana, a do 31. prosinca 2002. 150 dana). Struktura inozemnog duga prikazuje se po domaćim sektorima identično kao u financijskom računu platne bilance. Sektor država prikazuje inozemne dugove opće države, koja uključuje Republiku Hrvatsku, republičke fondove (uključujući Hrvatsku banku za obnovu i razvitak, Državnu agenciju za osiguranje štednih uloga i sanaciju banaka, Hrvatske ceste i Hrvatske autoceste) te lokalnu državu. Sektor središnja banka prikazuje dugove Hrvatske narodne banke. Sektor banke prikazuje dugove banaka. Ostali domaći sektori prikazuju dugove ostalih bankarskih institucija, nebankarskih financijskih institucija, trgovačkih društava, neprofitnih institucija i stanovništva, uključujući obrtnike. Izravna ulaganja prikazuju dužničke transakcije između kreditora i dužnika ostalih sektora, koji su međusobno vlasnički povezani (minimalni vlasnički ulog je 10%). Unutar svakoga sektora podaci se razvrstavaju prema ugovorenom dospijeću, na kratkoročne i dugoročne dugove, te prema dužničkom instrumentu na osnovi kojeg je nastala dužnička obveza. Pritom je ročnost instrumenata koji se uključuju u poziciju Gotovina i depoziti za sektor banaka raspoloživa od početka 2004. te se za ranija razdoblja ova pozicija u cijelosti iskazuje kao dugoročna. Stanje bruto inozemnog duga uključuje nepodmirene dospjele obveze s osnove glavnice i kamata, obračunane nedospjele kamate te buduće otplate glavnice. Stanja duga iskazuju se prema srednjem deviznom tečaju HNB-a na kraju razdoblja. Objavljeni podaci preliminarni su do objave konačnih podataka platne bilance za izvještajno tromjesečje. Bruto inozemni dug javnog sektora, privatnog sektora za koji jamči javni sektor i privatnog sektora za koji ne jamči javni sektor Tablica 21-24. prikazuje bruto inozemni dug strukturiran s obzirom na ulogu javnog sektora. Javni sektor pritom obuhvaća opću državu (koja uključuje Republiku Hrvatsku, republičke fondove i lokalnu državu), središnju banku te javna i mješovita poduzeća. Javna poduzeća su poduzeća u stopostotnom vlasništvu poslovnih
sector which is not classified under current transfers. Since 1999 this position has included only the data based on the Bank for International Settlement quarterly data, while data in the fourth quarter of 2001 and in the first two quarters of 2002 relate to the effect of the EMU countries’ currencies changeover to the euro. In the period from 1993 to 1998, the estimate of reserve assets transactions was made by converting the changes in the original currencies into the US dollars by applying the average monthly exchange rate of the currencies contained in the reserves. Since 1999 the changes in reserve assets balance have been calculated on the basis of the CNB accounting data. International Reserves and Banks’ Foreign Exchange Reserves The international reserves of the Croatian National Bank (Table 21-20.) are shown according to the methodology contained in the Balance of Payments Manual (International Monetary Fund, 1993), and include those foreign claims of the Croatian National Bank that can be used to bridge imbalances in international payments. International reserves include special drawing rights, reserve position in the International Monetary Fund, gold, foreign currency and deposits with foreign banks, as well as bonds and debt instruments. The foreign exchange reserves of banks include foreign currency and domestic banks’ deposits with foreign banks. These foreign exchange reserves represent an additional source of liquidity for bridging imbalances in international payments. Gross External Debt by Domestic Sectors External debt (Table 21-23.) is defined as the external debt liabilities of residents on the basis of debt securities issued in foreign markets (at face value), credits (repo agreements included) regardless of their contractual maturity, deposits of non-residents, and trade credits granted by non-residents with contractual maturity of more than 180 days (90 days up to 11 July 2001 and 150 days up to 31 December 2002). External debt by domestic sectors is shown in the same manner as in the Capital and Financial Account of the BOP. Item Government shows external debt of the general government, which includes the Republic of Croatia, central government funds (including the Croatian Bank for Reconstruction and Development, the State Agency for Deposit Insurance and Bank Rehabilitation, the Croatian Roads and the Croatian Highways), and local government. Item Croatian National Bank shows the central bank debts. Item Banks shows debts of banks. Item Other sectors shows debts of other banking institutions, non-banking financial institutions, enterprises, non-profit institutions and households, including craftsmen. Item Direct investment shows borrower –lender transactions of other sectors that are interrelated by ownership (borrower or lender owns more than 10 percent of the other). Each sector data are further shown by contractual maturity (short-term and long-term) and by debt instrument.. From the beginning of 2004, instruments included in item Currency and deposits (3. Banks) are reported in accordance with their maturity. Data for the previous periods are reported only on a long-term basis. Outstanding gross external debt includes principal and interest arrears, as well as accrual interest and future principal payments. Outstanding debt data are shown at the CNB’s midpoint exchange rate at the end of the period. Data are considered preliminary until after publication of the final BOP data for the reporting quarter. Public Sector Gross External Debt, and Publicly Guaranteed and Non-Publicly Guaranteed Private Sector Gross External Debt The gross external debt position presented in Table 21-24. highlights the role of the public sector. Public sector includes the general government (including the Republic of
EKONOMSKI ODNOSI S INOZEMSTVOM ECONOMIC RELATIONS WITH FOREIGN COUNTRIES
Statistički ljetopis 2006. Statistical Yearbook 367
subjekata iz javnog sektora. Mješovita poduzeća su poduzeća u kojima poslovni subjekt iz javnog sektora sudjeluje u vlasništvu mješovitog poduzeća s više od 50%. Bruto inozemni dug privatnog sektora za koji jamči javni sektor čine inozemni dugovi poslovnih subjekata koji nisu obuhvaćeni definicijom javnog sektora, a za koje je jamstvo izdao bilo koji poslovni subjekt iz javnog sektora. Bruto inozemni dug privatnog sektora za koji ne jamči javni sektor čine inozemni dugovi poslovnih subjekata koji nisu obuhvaćeni definicijom javnog sektora, a za koje ne postoji jamstvo javnog sektora. Vrednovanje pozicija provedeno je jednako kao u tablici 21-23.
STATISTIČKE PUBLIKACIJE Statistička izvješća 429 R; 469 R; 554 R; 588 R; 626 R; 674 R; 709 R; 746 R; 787 R; 825 R;861 R; 917 R; 943 R; 983 R; 1005 R; 1124 R; 1125 R; 1131 R; 1132 R;1159 R; 1160 R; 1192 R; 1193 R; 1225 R; 1226 R; 1261 R; 1262 R. Metodološke upute 45. Metodološki priručnik za statistiku robne razmjene s inozemstvom Studije i analize 34. Anđelko Pejić: Kretanje vanjskotrgovinske robne razmjene SR Hrvatske 1960 − 1968. 41. Ivan Kelebuh: Neke karakteristike vanjskotrgovačke razmjene prema zemljama razvijenosti od 1974. do prvog polugodišta 1976. 65. Anka Javor: Vanjskotrgovinska razmjena SR Hrvatske 1986. godine 96. Dubravka Drempetić, Darinka Grgurić, Anka Javor, Vesna Polančec: Zrcalna statistika robne razmjene s inozemstvom − Poljska i Jugoslavija, 2001., 2002. 101. Vesna Polančec i Darinka Grgurić: Zrcalna statistika robne razmjene Republike Hrvatske i Bugarske
R = Republika Hrvatska
Croatia, central government funds and local government), the central bank, public enterprises and mixed ownership companies. Public enterprises are defined as enterprises in 100% ownership of business entities from the public sector. Mixed ownership companies are defined as companies in which business entities from the public sector have a share larger than 50%. Publicly guaranteed private sector gross external debt is defined as the external debt liabilities of business entities not covered by the definition of the public sector, the servicing of which is guaranteed by a business entity from the public sector. Non-publicly guaranteed private sector gross external debt is defined as the external debt liabilities of business entities not covered by the definition of the public sector, the servicing of which is not guaranteed by the public sector. Items are valued in the same manner as in Table 21-23.
STATISTICAL PUBLICATIONS
Statistical Reports 429 R; 469 R; 554 R; 588 R; 626 R; 674 R; 709 R; 746 R; 787 R; 825 R;861 R; 917 R; 943 R; 983 R; 1005 R; 1124 R; 1125 R; 1131 R; 1132 R;1159 R; 1160 R; 1192 R; 1193 R; 1225 R; 1226 R; 1261 R; 1262 R. Methodologies 45. Methodological manual for the foreign trade in goods statistics Studies and analyses 34. Anđelko Pejić: Foreign Trade Goods Exchange Trends in SR Croatia, 1960 − 1968 41. Ivan Kelebuh: Some Characteristics of Foreign Trade Exchange with Developed Countries from 1974 to the First Half-year of 1976 65. Anka Javor: Foreign Trade Exchange of SR Croatia, 1986 96. Dubravka Drempetić, Darinka Grgurić, Anka Javor, Vesna Polančec: Mirror Statistics of Foreign Trade − Poland and Yugoslavia, 2001, 2002 101. Vesna Polančec and Darinka Grgurić: Mirror Statistics of the trade in goods between the Republic of Croatia and Bulgaria
R = the Republic of Croatia
EKONOMSKI ODNOSI S INOZEMSTVOM ECONOMIC RELATIONS WITH FOREIGN COUNTRIES
368 Statistički ljetopis 2006. Statistical Yearbook
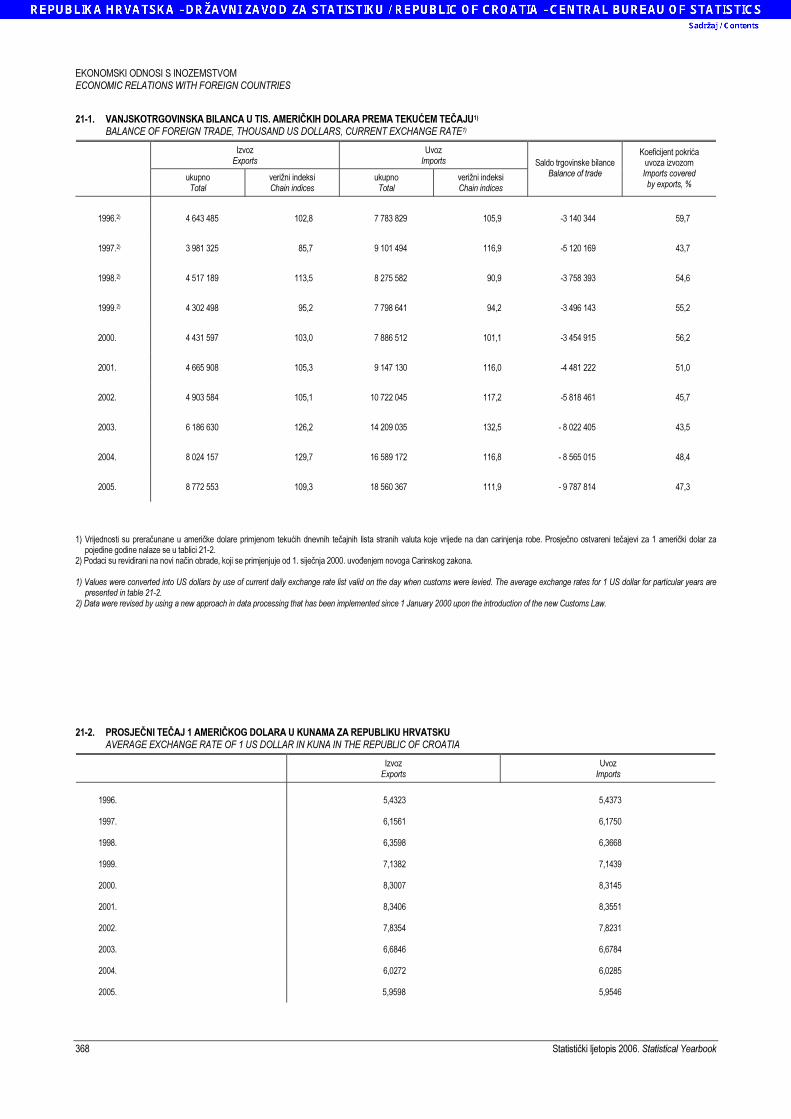
21-1. VANJSKOTRGOVINSKA BILANCA U TIS. AMERIČKIH DOLARA PREMA TEKUĆEM TEČAJU1) BALANCE OF FOREIGN TRADE, THOUSAND US DOLLARS, CURRENT EXCHANGE RATE1)
Izvoz Exports
Uvoz Imports
ukupno Total
verižni indeksi Chain indices
ukupno Total
verižni indeksi Chain indices
Saldo trgovinske bilance Balance of trade
Koeficijent pokrića uvoza izvozom Imports covered by exports, %
1996.2) 4 643 485 102,8 7 783 829 105,9 -3 140 344 59,7
1997.2) 3 981 325 85,7 9 101 494 116,9 -5 120 169 43,7
1998.2) 4 517 189 113,5 8 275 582 90,9 -3 758 393 54,6
1999.2) 4 302 498 95,2 7 798 641 94,2 -3 496 143 55,2
2000. 4 431 597 103,0 7 886 512 101,1 -3 454 915 56,2
2001. 4 665 908 105,3 9 147 130 116,0 -4 481 222 51,0
2002. 4 903 584 105,1 10 722 045 117,2 -5 818 461 45,7
2003. 6 186 630 126,2 14 209 035 132,5 - 8 022 405 43,5
2004. 8 024 157 129,7 16 589 172 116,8 - 8 565 015 48,4
2005. 8 772 553 109,3 18 560 367 111,9 - 9 787 814 47,3
1) Vrijednosti su preračunane u američke dolare primjenom tekućih dnevnih tečajnih lista stranih valuta koje vrijede na dan carinjenja robe. Prosječno ostvareni tečajevi za 1 američki dolar za
pojedine godine nalaze se u tablici 21-2. 2) Podaci su revidirani na novi način obrade, koji se primjenjuje od 1. siječnja 2000. uvođenjem novoga Carinskog zakona. 1) Values were converted into US dollars by use of current daily exchange rate list valid on the day when customs were levied. The average exchange rates for 1 US dollar for particular years are
presented in table 21-2. 2) Data were revised by using a new approach in data processing that has been implemented since 1 January 2000 upon the introduction of the new Customs Law. 21-2. PROSJEČNI TEČAJ 1 AMERIČKOG DOLARA U KUNAMA ZA REPUBLIKU HRVATSKU AVERAGE EXCHANGE RATE OF 1 US DOLLAR IN KUNA IN THE REPUBLIC OF CROATIA
Izvoz
Exports Uvoz
Imports
1996. 5,4323 5,4373
1997. 6,1561 6,1750
1998. 6,3598 6,3668
1999. 7,1382 7,1439
2000. 8,3007 8,3145
2001. 8,3406 8,3551
2002. 7,8354 7,8231
2003. 6,6846 6,6784
2004. 6,0272 6,0285
2005. 5,9598 5,9546
EKONOMSKI ODNOSI S INOZEMSTVOM ECONOMIC RELATIONS WITH FOREIGN COUNTRIES
Statistički ljetopis 2006. Statistical Yearbook 369
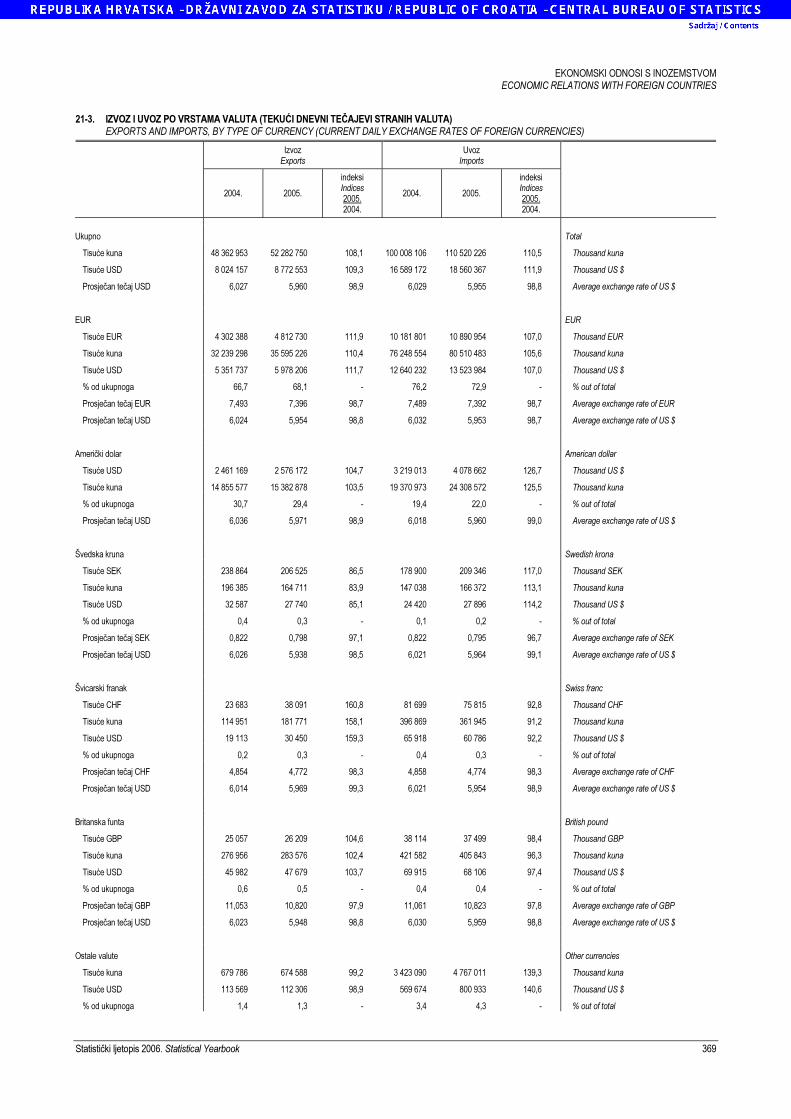
21-3. IZVOZ I UVOZ PO VRSTAMA VALUTA (TEKUĆI DNEVNI TEČAJEVI STRANIH VALUTA) EXPORTS AND IMPORTS, BY TYPE OF CURRENCY (CURRENT DAILY EXCHANGE RATES OF FOREIGN CURRENCIES)
Izvoz Exports
Uvoz Imports
2004. 2005.
indeksi Indices 2005. 2004.
2004. 2005.
indeksi Indices 2005. 2004.
Ukupno Total
Tisuće kuna 48 362 953 52 282 750 108,1 100 008 106 110 520 226 110,5 Thousand kuna
Tisuće USD 8 024 157 8 772 553 109,3 16 589 172 18 560 367 111,9 Thousand US $
Prosječan tečaj USD 6,027 5,960 98,9 6,029 5,955 98,8 Average exchange rate of US $
EUR EUR
Tisuće EUR 4 302 388 4 812 730 111,9 10 181 801 10 890 954 107,0 Thousand EUR
Tisuće kuna 32 239 298 35 595 226 110,4 76 248 554 80 510 483 105,6 Thousand kuna
Tisuće USD 5 351 737 5 978 206 111,7 12 640 232 13 523 984 107,0 Thousand US $
% od ukupnoga 66,7 68,1 - 76,2 72,9 - % out of total
Prosječan tečaj EUR 7,493 7,396 98,7 7,489 7,392 98,7 Average exchange rate of EUR
Prosječan tečaj USD 6,024 5,954 98,8 6,032 5,953 98,7 Average exchange rate of US $
Američki dolar American dollar
Tisuće USD 2 461 169 2 576 172 104,7 3 219 013 4 078 662 126,7 Thousand US $
Tisuće kuna 14 855 577 15 382 878 103,5 19 370 973 24 308 572 125,5 Thousand kuna
% od ukupnoga 30,7 29,4 - 19,4 22,0 - % out of total
Prosječan tečaj USD 6,036 5,971 98,9 6,018 5,960 99,0 Average exchange rate of US $
Švedska kruna Swedish krona
Tisuće SEK 238 864 206 525 86,5 178 900 209 346 117,0 Thousand SEK
Tisuće kuna 196 385 164 711 83,9 147 038 166 372 113,1 Thousand kuna
Tisuće USD 32 587 27 740 85,1 24 420 27 896 114,2 Thousand US $
% od ukupnoga 0,4 0,3 - 0,1 0,2 - % out of total
Prosječan tečaj SEK 0,822 0,798 97,1 0,822 0,795 96,7 Average exchange rate of SEK
Prosječan tečaj USD 6,026 5,938 98,5 6,021 5,964 99,1 Average exchange rate of US $
Švicarski franak Swiss franc
Tisuće CHF 23 683 38 091 160,8 81 699 75 815 92,8 Thousand CHF
Tisuće kuna 114 951 181 771 158,1 396 869 361 945 91,2 Thousand kuna
Tisuće USD 19 113 30 450 159,3 65 918 60 786 92,2 Thousand US $
% od ukupnoga 0,2 0,3 - 0,4 0,3 - % out of total
Prosječan tečaj CHF 4,854 4,772 98,3 4,858 4,774 98,3 Average exchange rate of CHF
Prosječan tečaj USD 6,014 5,969 99,3 6,021 5,954 98,9 Average exchange rate of US $
Britanska funta British pound
Tisuće GBP 25 057 26 209 104,6 38 114 37 499 98,4 Thousand GBP
Tisuće kuna 276 956 283 576 102,4 421 582 405 843 96,3 Thousand kuna
Tisuće USD 45 982 47 679 103,7 69 915 68 106 97,4 Thousand US $
% od ukupnoga 0,6 0,5 - 0,4 0,4 - % out of total
Prosječan tečaj GBP 11,053 10,820 97,9 11,061 10,823 97,8 Average exchange rate of GBP
Prosječan tečaj USD 6,023 5,948 98,8 6,030 5,959 98,8 Average exchange rate of US $
Ostale valute Other currencies
Tisuće kuna 679 786 674 588 99,2 3 423 090 4 767 011 139,3 Thousand kuna
Tisuće USD 113 569 112 306 98,9 569 674 800 933 140,6 Thousand US $
% od ukupnoga 1,4 1,3 - 3,4 4,3 - % out of total
EKONOMSKI ODNOSI S INOZEMSTVOM ECONOMIC RELATIONS WITH FOREIGN COUNTRIES
370 Statistički ljetopis 2006. Statistical Yearbook
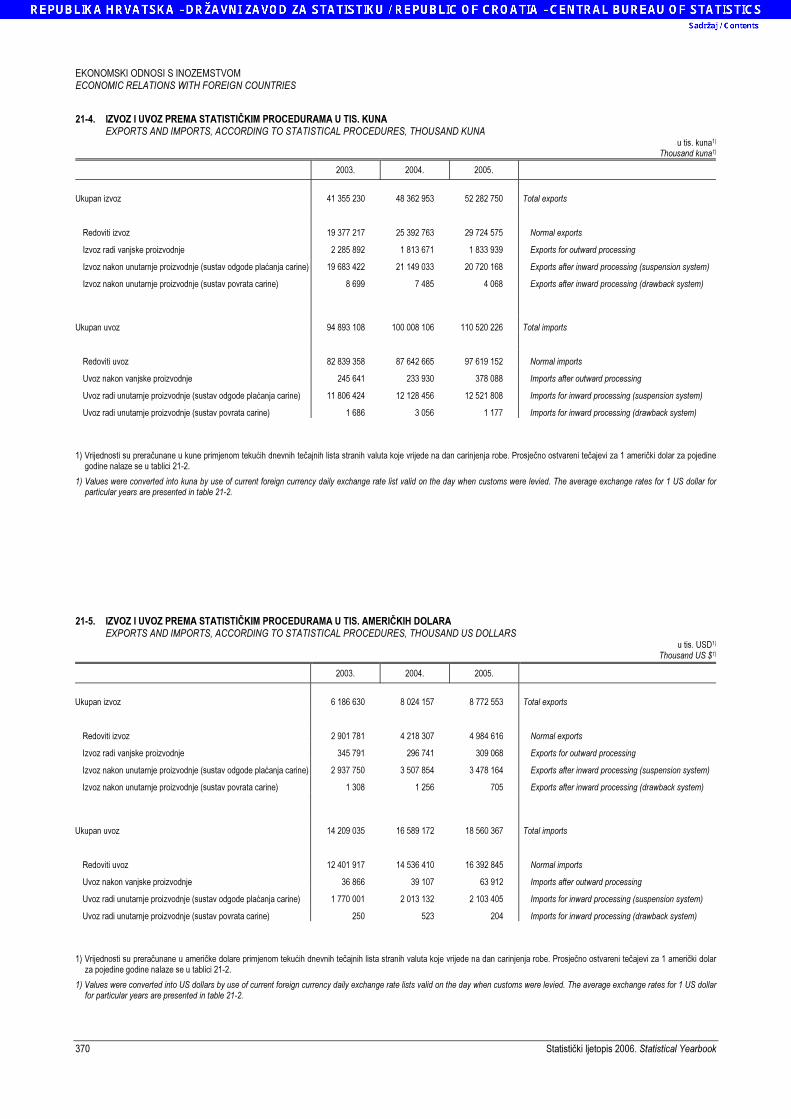
21-4. IZVOZ I UVOZ PREMA STATISTIČKIM PROCEDURAMA U TIS. KUNA EXPORTS AND IMPORTS, ACCORDING TO STATISTICAL PROCEDURES, THOUSAND KUNA
u tis. kuna1)
Thousand kuna1)
2003. 2004. 2005.
Ukupan izvoz 41 355 230 48 362 953 52 282 750 Total exports
Redoviti izvoz 19 377 217 25 392 763 29 724 575 Normal exports
Izvoz radi vanjske proizvodnje 2 285 892 1 813 671 1 833 939 Exports for outward processing
Izvoz nakon unutarnje proizvodnje (sustav odgode plaćanja carine) 19 683 422 21 149 033 20 720 168 Exports after inward processing (suspension system)
Izvoz nakon unutarnje proizvodnje (sustav povrata carine) 8 699 7 485 4 068 Exports after inward processing (drawback system)
Ukupan uvoz 94 893 108 100 008 106 110 520 226 Total imports
Redoviti uvoz 82 839 358 87 642 665 97 619 152 Normal imports
Uvoz nakon vanjske proizvodnje 245 641 233 930 378 088 Imports after outward processing
Uvoz radi unutarnje proizvodnje (sustav odgode plaćanja carine) 11 806 424 12 128 456 12 521 808 Imports for inward processing (suspension system)
Uvoz radi unutarnje proizvodnje (sustav povrata carine) 1 686 3 056 1 177 Imports for inward processing (drawback system) 1) Vrijednosti su preračunane u kune primjenom tekućih dnevnih tečajnih lista stranih valuta koje vrijede na dan carinjenja robe. Prosječno ostvareni tečajevi za 1 američki dolar za pojedine
godine nalaze se u tablici 21-2.
1) Values were converted into kuna by use of current foreign currency daily exchange rate list valid on the day when customs were levied. The average exchange rates for 1 US dollar for particular years are presented in table 21-2.
21-5. IZVOZ I UVOZ PREMA STATISTIČKIM PROCEDURAMA U TIS. AMERIČKIH DOLARA EXPORTS AND IMPORTS, ACCORDING TO STATISTICAL PROCEDURES, THOUSAND US DOLLARS
u tis. USD1)
Thousand US $1)
2003. 2004. 2005.
Ukupan izvoz 6 186 630 8 024 157 8 772 553 Total exports
Redoviti izvoz 2 901 781 4 218 307 4 984 616 Normal exports
Izvoz radi vanjske proizvodnje 345 791 296 741 309 068 Exports for outward processing
Izvoz nakon unutarnje proizvodnje (sustav odgode plaćanja carine) 2 937 750 3 507 854 3 478 164 Exports after inward processing (suspension system)
Izvoz nakon unutarnje proizvodnje (sustav povrata carine) 1 308 1 256 705 Exports after inward processing (drawback system)
Ukupan uvoz 14 209 035 16 589 172 18 560 367 Total imports
Redoviti uvoz 12 401 917 14 536 410 16 392 845 Normal imports
Uvoz nakon vanjske proizvodnje 36 866 39 107 63 912 Imports after outward processing
Uvoz radi unutarnje proizvodnje (sustav odgode plaćanja carine) 1 770 001 2 013 132 2 103 405 Imports for inward processing (suspension system)
Uvoz radi unutarnje proizvodnje (sustav povrata carine) 250 523 204 Imports for inward processing (drawback system) 1) Vrijednosti su preračunane u američke dolare primjenom tekućih dnevnih tečajnih lista stranih valuta koje vrijede na dan carinjenja robe. Prosječno ostvareni tečajevi za 1 američki dolar
za pojedine godine nalaze se u tablici 21-2.
1) Values were converted into US dollars by use of current foreign currency daily exchange rate lists valid on the day when customs were levied. The average exchange rates for 1 US dollar for particular years are presented in table 21-2.
EKONOMSKI ODNOSI S INOZEMSTVOM ECONOMIC RELATIONS WITH FOREIGN COUNTRIES
Statistički ljetopis 2006. Statistical Yearbook 371
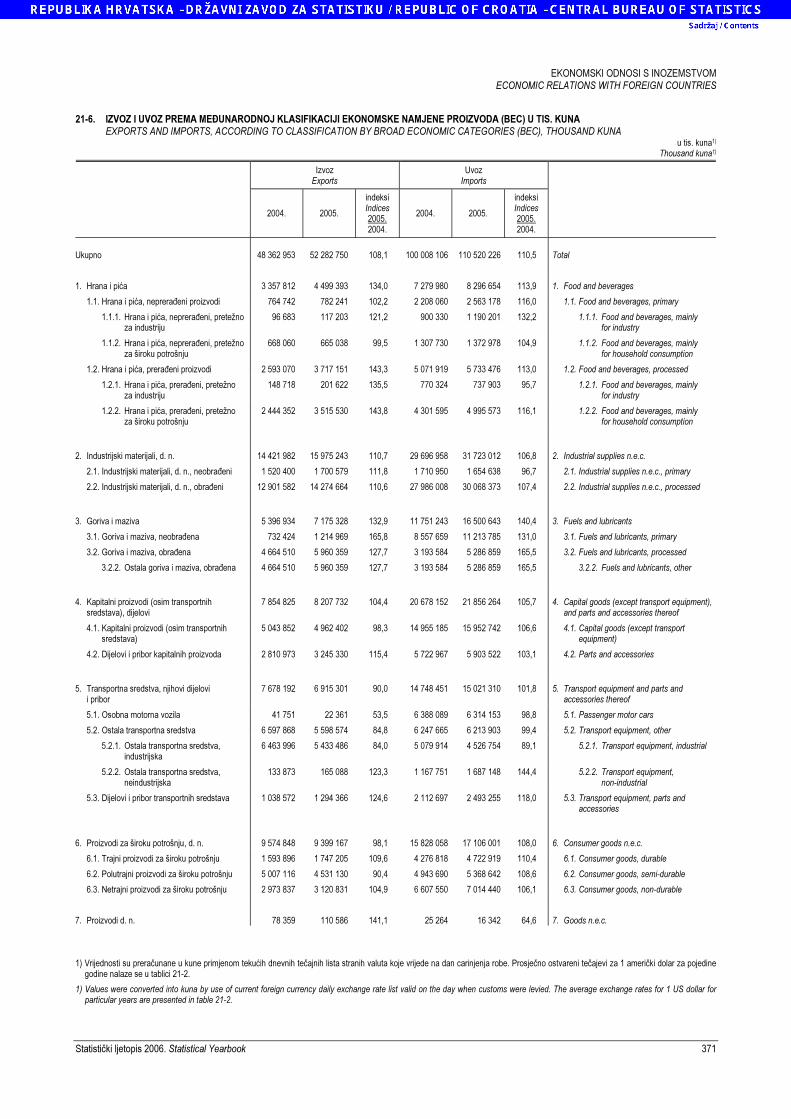
21-6. IZVOZ I UVOZ PREMA MEĐUNARODNOJ KLASIFIKACIJI EKONOMSKE NAMJENE PROIZVODA (BEC) U TIS. KUNA EXPORTS AND IMPORTS, ACCORDING TO CLASSIFICATION BY BROAD ECONOMIC CATEGORIES (BEC), THOUSAND KUNA
u tis. kuna1)
Thousand kuna1)
Izvoz Exports
Uvoz Imports
2004. 2005.
indeksi Indices 2005. 2004.
2004. 2005.
indeksi Indices 2005. 2004.
Ukupno 48 362 953 52 282 750 108,1 100 008 106 110 520 226 110,5 Total
1. Hrana i pića 3 357 812 4 499 393 134,0 7 279 980 8 296 654 113,9 1. Food and beverages
1.1. Hrana i pića, neprerađeni proizvodi 764 742 782 241 102,2 2 208 060 2 563 178 116,0 1.1. Food and beverages, primary
1.1.1. Hrana i pića, neprerađeni, pretežno za industriju
96 683 117 203 121,2 900 330 1 190 201 132,2 1.1.1. Food and beverages, mainly for industry
1.1.2. Hrana i pića, neprerađeni, pretežno za široku potrošnju
668 060 665 038 99,5 1 307 730 1 372 978 104,9 1.1.2. Food and beverages, mainly for household consumption
1.2. Hrana i pića, prerađeni proizvodi 2 593 070 3 717 151 143,3 5 071 919 5 733 476 113,0 1.2. Food and beverages, processed
1.2.1. Hrana i pića, prerađeni, pretežno za industriju
148 718 201 622 135,5 770 324 737 903 95,7 1.2.1. Food and beverages, mainly for industry
1.2.2. Hrana i pića, prerađeni, pretežno za široku potrošnju
2 444 352 3 515 530 143,8 4 301 595 4 995 573 116,1 1.2.2. Food and beverages, mainly for household consumption
2. Industrijski materijali, d. n. 14 421 982 15 975 243 110,7 29 696 958 31 723 012 106,8 2. Industrial supplies n.e.c.
2.1. Industrijski materijali, d. n., neobrađeni 1 520 400 1 700 579 111,8 1 710 950 1 654 638 96,7 2.1. Industrial supplies n.e.c., primary
2.2. Industrijski materijali, d. n., obrađeni 12 901 582 14 274 664 110,6 27 986 008 30 068 373 107,4 2.2. Industrial supplies n.e.c., processed
3. Goriva i maziva 5 396 934 7 175 328 132,9 11 751 243 16 500 643 140,4 3. Fuels and lubricants
3.1. Goriva i maziva, neobrađena 732 424 1 214 969 165,8 8 557 659 11 213 785 131,0 3.1. Fuels and lubricants, primary
3.2. Goriva i maziva, obrađena 4 664 510 5 960 359 127,7 3 193 584 5 286 859 165,5 3.2. Fuels and lubricants, processed
3.2.2. Ostala goriva i maziva, obrađena 4 664 510 5 960 359 127,7 3 193 584 5 286 859 165,5 3.2.2. Fuels and lubricants, other
4. Kapitalni proizvodi (osim transportnih sredstava), dijelovi
7 854 825 8 207 732 104,4 20 678 152 21 856 264 105,7 4. Capital goods (except transport equipment), and parts and accessories thereof
4.1. Kapitalni proizvodi (osim transportnih sredstava)
5 043 852 4 962 402 98,3 14 955 185 15 952 742 106,6 4.1. Capital goods (except transport equipment)
4.2. Dijelovi i pribor kapitalnih proizvoda 2 810 973 3 245 330 115,4 5 722 967 5 903 522 103,1 4.2. Parts and accessories
5. Transportna sredstva, njihovi dijelovi i pribor
7 678 192 6 915 301 90,0 14 748 451 15 021 310 101,8 5. Transport equipment and parts and accessories thereof
5.1. Osobna motorna vozila 41 751 22 361 53,5 6 388 089 6 314 153 98,8 5.1. Passenger motor cars
5.2. Ostala transportna sredstva 6 597 868 5 598 574 84,8 6 247 665 6 213 903 99,4 5.2. Transport equipment, other
5.2.1. Ostala transportna sredstva, industrijska
6 463 996 5 433 486 84,0 5 079 914 4 526 754 89,1 5.2.1. Transport equipment, industrial
5.2.2. Ostala transportna sredstva, neindustrijska
133 873 165 088 123,3 1 167 751 1 687 148 144,4 5.2.2. Transport equipment, non-industrial
5.3. Dijelovi i pribor transportnih sredstava 1 038 572 1 294 366 124,6 2 112 697 2 493 255 118,0 5.3. Transport equipment, parts and accessories
6. Proizvodi za široku potrošnju, d. n. 9 574 848 9 399 167 98,1 15 828 058 17 106 001 108,0 6. Consumer goods n.e.c.
6.1. Trajni proizvodi za široku potrošnju 1 593 896 1 747 205 109,6 4 276 818 4 722 919 110,4 6.1. Consumer goods, durable
6.2. Polutrajni proizvodi za široku potrošnju 5 007 116 4 531 130 90,4 4 943 690 5 368 642 108,6 6.2. Consumer goods, semi-durable
6.3. Netrajni proizvodi za široku potrošnju 2 973 837 3 120 831 104,9 6 607 550 7 014 440 106,1 6.3. Consumer goods, non-durable
7. Proizvodi d. n. 78 359 110 586 141,1 25 264 16 342 64,6 7. Goods n.e.c. 1) Vrijednosti su preračunane u kune primjenom tekućih dnevnih tečajnih lista stranih valuta koje vrijede na dan carinjenja robe. Prosječno ostvareni tečajevi za 1 američki dolar za pojedine
godine nalaze se u tablici 21-2.
1) Values were converted into kuna by use of current foreign currency daily exchange rate list valid on the day when customs were levied. The average exchange rates for 1 US dollar for particular years are presented in table 21-2.
EKONOMSKI ODNOSI S INOZEMSTVOM ECONOMIC RELATIONS WITH FOREIGN COUNTRIES
372 Statistički ljetopis 2006. Statistical Yearbook
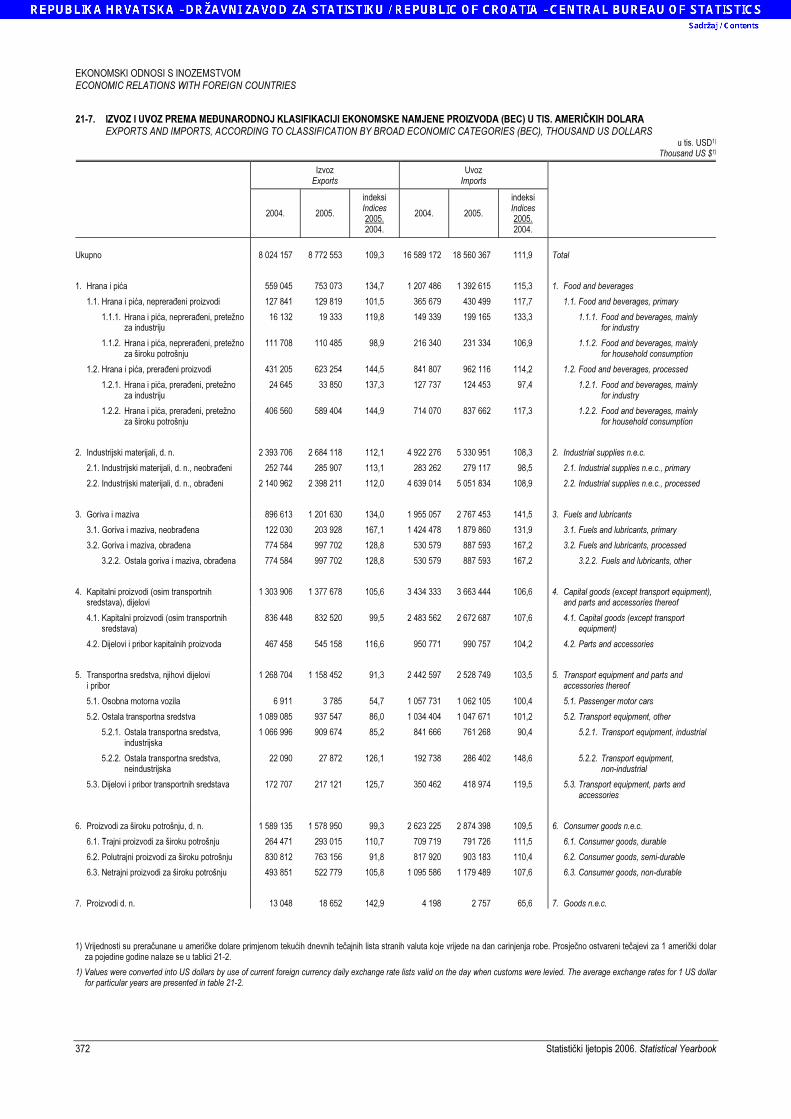
21-7. IZVOZ I UVOZ PREMA MEĐUNARODNOJ KLASIFIKACIJI EKONOMSKE NAMJENE PROIZVODA (BEC) U TIS. AMERIČKIH DOLARA EXPORTS AND IMPORTS, ACCORDING TO CLASSIFICATION BY BROAD ECONOMIC CATEGORIES (BEC), THOUSAND US DOLLARS
u tis. USD1)
Thousand US $1)
Izvoz Exports
Uvoz Imports
2004. 2005.
indeksi Indices 2005. 2004.
2004. 2005.
indeksi Indices 2005. 2004.
Ukupno 8 024 157 8 772 553 109,3 16 589 172 18 560 367 111,9 Total
1. Hrana i pića 559 045 753 073 134,7 1 207 486 1 392 615 115,3 1. Food and beverages
1.1. Hrana i pića, neprerađeni proizvodi 127 841 129 819 101,5 365 679 430 499 117,7 1.1. Food and beverages, primary
1.1.1. Hrana i pića, neprerađeni, pretežno za industriju
16 132 19 333 119,8 149 339 199 165 133,3 1.1.1. Food and beverages, mainly for industry
1.1.2. Hrana i pića, neprerađeni, pretežno za široku potrošnju
111 708 110 485 98,9 216 340 231 334 106,9 1.1.2. Food and beverages, mainly for household consumption
1.2. Hrana i pića, prerađeni proizvodi 431 205 623 254 144,5 841 807 962 116 114,2 1.2. Food and beverages, processed
1.2.1. Hrana i pića, prerađeni, pretežno za industriju
24 645 33 850 137,3 127 737 124 453 97,4 1.2.1. Food and beverages, mainly for industry
1.2.2. Hrana i pića, prerađeni, pretežno za široku potrošnju
406 560 589 404 144,9 714 070 837 662 117,3 1.2.2. Food and beverages, mainly for household consumption
2. Industrijski materijali, d. n. 2 393 706 2 684 118 112,1 4 922 276 5 330 951 108,3 2. Industrial supplies n.e.c.
2.1. Industrijski materijali, d. n., neobrađeni 252 744 285 907 113,1 283 262 279 117 98,5 2.1. Industrial supplies n.e.c., primary
2.2. Industrijski materijali, d. n., obrađeni 2 140 962 2 398 211 112,0 4 639 014 5 051 834 108,9 2.2. Industrial supplies n.e.c., processed
3. Goriva i maziva 896 613 1 201 630 134,0 1 955 057 2 767 453 141,5 3. Fuels and lubricants
3.1. Goriva i maziva, neobrađena 122 030 203 928 167,1 1 424 478 1 879 860 131,9 3.1. Fuels and lubricants, primary
3.2. Goriva i maziva, obrađena 774 584 997 702 128,8 530 579 887 593 167,2 3.2. Fuels and lubricants, processed
3.2.2. Ostala goriva i maziva, obrađena 774 584 997 702 128,8 530 579 887 593 167,2 3.2.2. Fuels and lubricants, other
4. Kapitalni proizvodi (osim transportnih sredstava), dijelovi
1 303 906 1 377 678 105,6 3 434 333 3 663 444 106,6 4. Capital goods (except transport equipment), and parts and accessories thereof
4.1. Kapitalni proizvodi (osim transportnih sredstava)
836 448 832 520 99,5 2 483 562 2 672 687 107,6 4.1. Capital goods (except transport equipment)
4.2. Dijelovi i pribor kapitalnih proizvoda 467 458 545 158 116,6 950 771 990 757 104,2 4.2. Parts and accessories
5. Transportna sredstva, njihovi dijelovi i pribor
1 268 704 1 158 452 91,3 2 442 597 2 528 749 103,5 5. Transport equipment and parts and accessories thereof
5.1. Osobna motorna vozila 6 911 3 785 54,7 1 057 731 1 062 105 100,4 5.1. Passenger motor cars
5.2. Ostala transportna sredstva 1 089 085 937 547 86,0 1 034 404 1 047 671 101,2 5.2. Transport equipment, other
5.2.1. Ostala transportna sredstva, industrijska
1 066 996 909 674 85,2 841 666 761 268 90,4 5.2.1. Transport equipment, industrial
5.2.2. Ostala transportna sredstva, neindustrijska
22 090 27 872 126,1 192 738 286 402 148,6 5.2.2. Transport equipment, non-industrial
5.3. Dijelovi i pribor transportnih sredstava 172 707 217 121 125,7 350 462 418 974 119,5 5.3. Transport equipment, parts and accessories
6. Proizvodi za široku potrošnju, d. n. 1 589 135 1 578 950 99,3 2 623 225 2 874 398 109,5 6. Consumer goods n.e.c.
6.1. Trajni proizvodi za široku potrošnju 264 471 293 015 110,7 709 719 791 726 111,5 6.1. Consumer goods, durable
6.2. Polutrajni proizvodi za široku potrošnju 830 812 763 156 91,8 817 920 903 183 110,4 6.2. Consumer goods, semi-durable
6.3. Netrajni proizvodi za široku potrošnju 493 851 522 779 105,8 1 095 586 1 179 489 107,6 6.3. Consumer goods, non-durable
7. Proizvodi d. n. 13 048 18 652 142,9 4 198 2 757 65,6 7. Goods n.e.c. 1) Vrijednosti su preračunane u američke dolare primjenom tekućih dnevnih tečajnih lista stranih valuta koje vrijede na dan carinjenja robe. Prosječno ostvareni tečajevi za 1 američki dolar
za pojedine godine nalaze se u tablici 21-2.
1) Values were converted into US dollars by use of current foreign currency daily exchange rate lists valid on the day when customs were levied. The average exchange rates for 1 US dollar for particular years are presented in table 21-2.
EKONOMSKI ODNOSI S INOZEMSTVOM ECONOMIC RELATIONS WITH FOREIGN COUNTRIES
Statistički ljetopis 2006. Statistical Yearbook 373
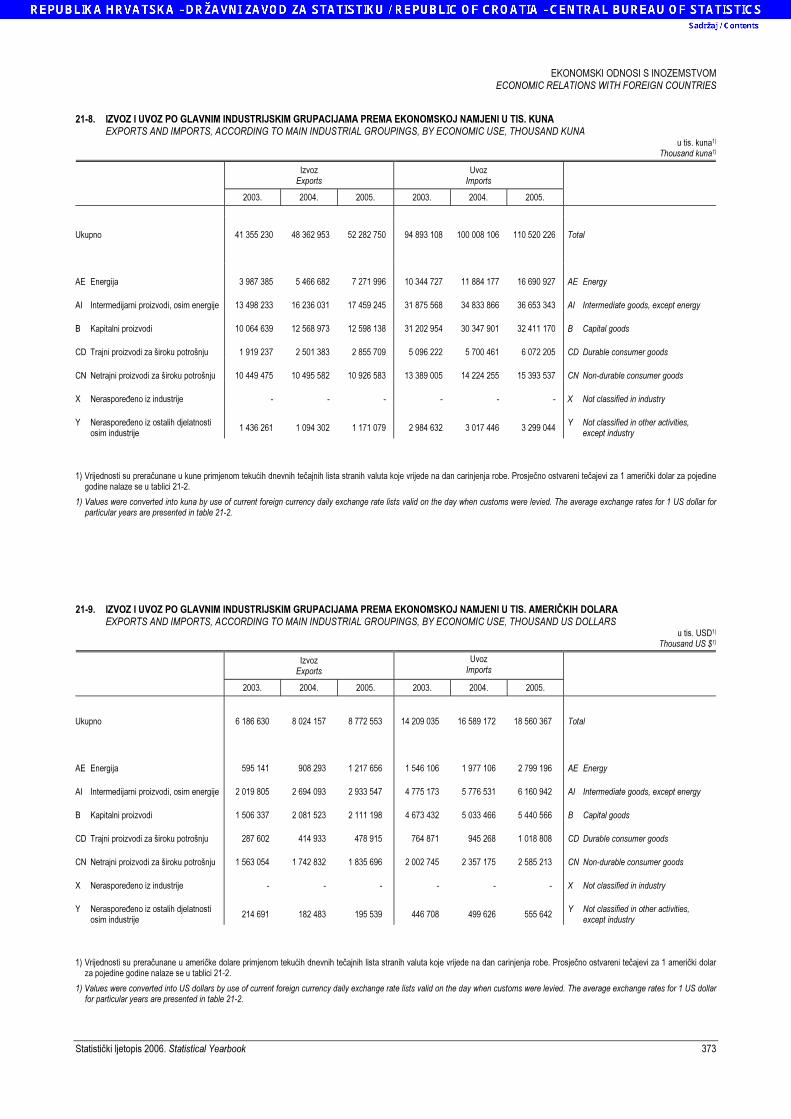
21-8. IZVOZ I UVOZ PO GLAVNIM INDUSTRIJSKIM GRUPACIJAMA PREMA EKONOMSKOJ NAMJENI U TIS. KUNA
EXPORTS AND IMPORTS, ACCORDING TO MAIN INDUSTRIAL GROUPINGS, BY ECONOMIC USE, THOUSAND KUNA
u tis. kuna1)
Thousand kuna1)
Izvoz Exports
Uvoz Imports
2003. 2004. 2005. 2003. 2004. 2005.
Ukupno 41 355 230 48 362 953 52 282 750 94 893 108 100 008 106 110 520 226 Total
AE Energija 3 987 385 5 466 682 7 271 996 10 344 727 11 884 177 16 690 927 AE Energy
AI Intermedijarni proizvodi, osim energije 13 498 233 16 236 031 17 459 245 31 875 568 34 833 866 36 653 343 AI Intermediate goods, except energy
B Kapitalni proizvodi 10 064 639 12 568 973 12 598 138 31 202 954 30 347 901 32 411 170 B Capital goods
CD Trajni proizvodi za široku potrošnju 1 919 237 2 501 383 2 855 709 5 096 222 5 700 461 6 072 205 CD Durable consumer goods
CN Netrajni proizvodi za široku potrošnju 10 449 475 10 495 582 10 926 583 13 389 005 14 224 255 15 393 537 CN Non-durable consumer goods
X Neraspoređeno iz industrije - - - - - - X Not classified in industry
Y Neraspoređeno iz ostalih djelatnosti osim industrije
1 436 261 1 094 302 1 171 079 2 984 632 3 017 446 3 299 044 Y Not classified in other activities, except industry
1) Vrijednosti su preračunane u kune primjenom tekućih dnevnih tečajnih lista stranih valuta koje vrijede na dan carinjenja robe. Prosječno ostvareni tečajevi za 1 američki dolar za pojedine
godine nalaze se u tablici 21-2.
1) Values were converted into kuna by use of current foreign currency daily exchange rate lists valid on the day when customs were levied. The average exchange rates for 1 US dollar for particular years are presented in table 21-2.
21-9. IZVOZ I UVOZ PO GLAVNIM INDUSTRIJSKIM GRUPACIJAMA PREMA EKONOMSKOJ NAMJENI U TIS. AMERIČKIH DOLARA EXPORTS AND IMPORTS, ACCORDING TO MAIN INDUSTRIAL GROUPINGS, BY ECONOMIC USE, THOUSAND US DOLLARS
u tis. USD1)
Thousand US $1)
Izvoz Exports
Uvoz Imports
2003. 2004. 2005. 2003. 2004. 2005.
Ukupno 6 186 630 8 024 157 8 772 553 14 209 035 16 589 172 18 560 367 Total
AE Energija 595 141 908 293 1 217 656 1 546 106 1 977 106 2 799 196 AE Energy
AI Intermedijarni proizvodi, osim energije 2 019 805 2 694 093 2 933 547 4 775 173 5 776 531 6 160 942 AI Intermediate goods, except energy
B Kapitalni proizvodi 1 506 337 2 081 523 2 111 198 4 673 432 5 033 466 5 440 566 B Capital goods
CD Trajni proizvodi za široku potrošnju 287 602 414 933 478 915 764 871 945 268 1 018 808 CD Durable consumer goods
CN Netrajni proizvodi za široku potrošnju 1 563 054 1 742 832 1 835 696 2 002 745 2 357 175 2 585 213 CN Non-durable consumer goods
X Neraspoređeno iz industrije - - - - - - X Not classified in industry
Y Neraspoređeno iz ostalih djelatnosti osim industrije
214 691 182 483 195 539 446 708 499 626 555 642 Y Not classified in other activities, except industry
1) Vrijednosti su preračunane u američke dolare primjenom tekućih dnevnih tečajnih lista stranih valuta koje vrijede na dan carinjenja robe. Prosječno ostvareni tečajevi za 1 američki dolar
za pojedine godine nalaze se u tablici 21-2.
1) Values were converted into US dollars by use of current foreign currency daily exchange rate lists valid on the day when customs were levied. The average exchange rates for 1 US dollar for particular years are presented in table 21-2.
EKONOMSKI ODNOSI S INOZEMSTVOM ECONOMIC RELATIONS WITH FOREIGN COUNTRIES
374 Statistički ljetopis 2006. Statistical Yearbook
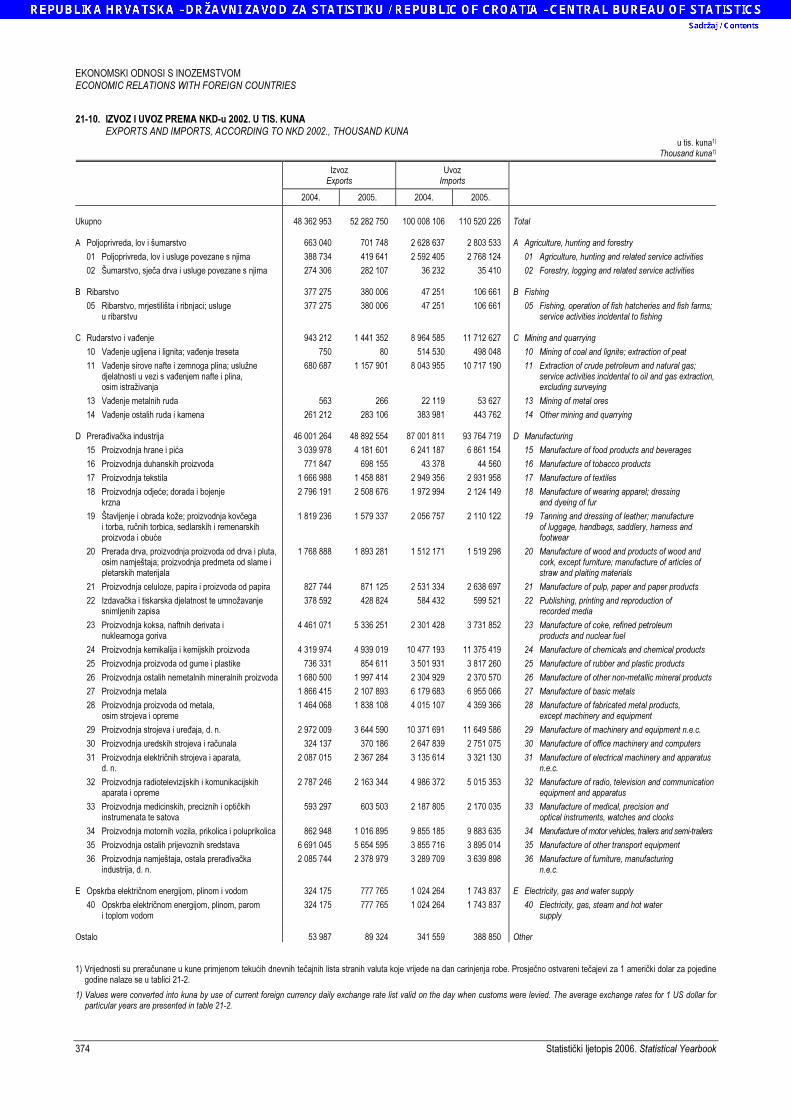
21-10. IZVOZ I UVOZ PREMA NKD-u 2002. U TIS. KUNA EXPORTS AND IMPORTS, ACCORDING TO NKD 2002., THOUSAND KUNA
u tis. kuna1)
Thousand kuna1)
Izvoz Exports
Uvoz Imports
2004. 2005. 2004. 2005.
Ukupno 48 362 953 52 282 750 100 008 106 110 520 226 Total
A Poljoprivreda, lov i šumarstvo 663 040 701 748 2 628 637 2 803 533 A Agriculture, hunting and forestry
01 Poljoprivreda, lov i usluge povezane s njima 388 734 419 641 2 592 405 2 768 124 01 Agriculture, hunting and related service activities
02 Šumarstvo, sječa drva i usluge povezane s njima 274 306 282 107 36 232 35 410 02 Forestry, logging and related service activities
B Ribarstvo 377 275 380 006 47 251 106 661 B Fishing
05 Ribarstvo, mrjestilišta i ribnjaci; usluge u ribarstvu
377 275 380 006 47 251 106 661 05 Fishing, operation of fish hatcheries and fish farms; service activities incidental to fishing
C Rudarstvo i vađenje 943 212 1 441 352 8 964 585 11 712 627 C Mining and quarrying
10 Vađenje ugljena i lignita; vađenje treseta 750 80 514 530 498 048 10 Mining of coal and lignite; extraction of peat
11 Vađenje sirove nafte i zemnoga plina; uslužne djelatnosti u vezi s vađenjem nafte i plina, osim istraživanja
680 687 1 157 901 8 043 955 10 717 190 11 Extraction of crude petroleum and natural gas; service activities incidental to oil and gas extraction, excluding surveying
13 Vađenje metalnih ruda 563 266 22 119 53 627 13 Mining of metal ores
14 Vađenje ostalih ruda i kamena 261 212 283 106 383 981 443 762 14 Other mining and quarrying
D Prerađivačka industrija 46 001 264 48 892 554 87 001 811 93 764 719 D Manufacturing
15 Proizvodnja hrane i pića 3 039 978 4 181 601 6 241 187 6 861 154 15 Manufacture of food products and beverages
16 Proizvodnja duhanskih proizvoda 771 847 698 155 43 378 44 560 16 Manufacture of tobacco products
17 Proizvodnja tekstila 1 666 988 1 458 881 2 949 356 2 931 958 17 Manufacture of textiles
18 Proizvodnja odjeće; dorada i bojenje krzna
2 796 191 2 508 676 1 972 994 2 124 149 18 Manufacture of wearing apparel; dressing and dyeing of fur
19 Štavljenje i obrada kože; proizvodnja kovčega i torba, ručnih torbica, sedlarskih i remenarskih proizvoda i obuće
1 819 236 1 579 337 2 056 757 2 110 122 19 Tanning and dressing of leather; manufacture of luggage, handbags, saddlery, harness and footwear
20 Prerada drva, proizvodnja proizvoda od drva i pluta, osim namještaja; proizvodnja predmeta od slame i pletarskih materijala
1 768 888 1 893 281 1 512 171 1 519 298 20 Manufacture of wood and products of wood and cork, except furniture; manufacture of articles of straw and plaiting materials
21 Proizvodnja celuloze, papira i proizvoda od papira 827 744 871 125 2 531 334 2 638 697 21 Manufacture of pulp, paper and paper products
22 Izdavačka i tiskarska djelatnost te umnožavanje snimljenih zapisa
378 592 428 824 584 432 599 521 22 Publishing, printing and reproduction of recorded media
23 Proizvodnja koksa, naftnih derivata i nuklearnoga goriva
4 461 071 5 336 251 2 301 428 3 731 852 23 Manufacture of coke, refined petroleum products and nuclear fuel
24 Proizvodnja kemikalija i kemijskih proizvoda 4 319 974 4 939 019 10 477 193 11 375 419 24 Manufacture of chemicals and chemical products
25 Proizvodnja proizvoda od gume i plastike 736 331 854 611 3 501 931 3 817 260 25 Manufacture of rubber and plastic products
26 Proizvodnja ostalih nemetalnih mineralnih proizvoda 1 680 500 1 997 414 2 304 929 2 370 570 26 Manufacture of other non-metallic mineral products
27 Proizvodnja metala 1 866 415 2 107 893 6 179 683 6 955 066 27 Manufacture of basic metals
28 Proizvodnja proizvoda od metala, osim strojeva i opreme
1 464 068 1 838 108 4 015 107 4 359 366 28 Manufacture of fabricated metal products, except machinery and equipment
29 Proizvodnja strojeva i uređaja, d. n. 2 972 009 3 644 590 10 371 691 11 649 586 29 Manufacture of machinery and equipment n.e.c.
30 Proizvodnja uredskih strojeva i računala 324 137 370 186 2 647 839 2 751 075 30 Manufacture of office machinery and computers
31 Proizvodnja električnih strojeva i aparata, d. n.
2 087 015 2 367 284 3 135 614 3 321 130 31 Manufacture of electrical machinery and apparatus n.e.c.
32 Proizvodnja radiotelevizijskih i komunikacijskih aparata i opreme
2 787 246 2 163 344 4 986 372 5 015 353 32 Manufacture of radio, television and communication equipment and apparatus
33 Proizvodnja medicinskih, preciznih i optičkih instrumenata te satova
593 297 603 503 2 187 805 2 170 035 33 Manufacture of medical, precision and optical instruments, watches and clocks
34 Proizvodnja motornih vozila, prikolica i poluprikolica 862 948 1 016 895 9 855 185 9 883 635 34 Manufacture of motor vehicles, trailers and semi-trailers
35 Proizvodnja ostalih prijevoznih sredstava 6 691 045 5 654 595 3 855 716 3 895 014 35 Manufacture of other transport equipment
36 Proizvodnja namještaja, ostala prerađivačka industrija, d. n.
2 085 744 2 378 979 3 289 709 3 639 898 36 Manufacture of furniture, manufacturing n.e.c.
E Opskrba električnom energijom, plinom i vodom 324 175 777 765 1 024 264 1 743 837 E Electricity, gas and water supply
40 Opskrba električnom energijom, plinom, parom i toplom vodom
324 175 777 765 1 024 264 1 743 837 40 Electricity, gas, steam and hot water supply
Ostalo 53 987 89 324 341 559 388 850 Other 1) Vrijednosti su preračunane u kune primjenom tekućih dnevnih tečajnih lista stranih valuta koje vrijede na dan carinjenja robe. Prosječno ostvareni tečajevi za 1 američki dolar za pojedine
godine nalaze se u tablici 21-2.
1) Values were converted into kuna by use of current foreign currency daily exchange rate list valid on the day when customs were levied. The average exchange rates for 1 US dollar for particular years are presented in table 21-2.
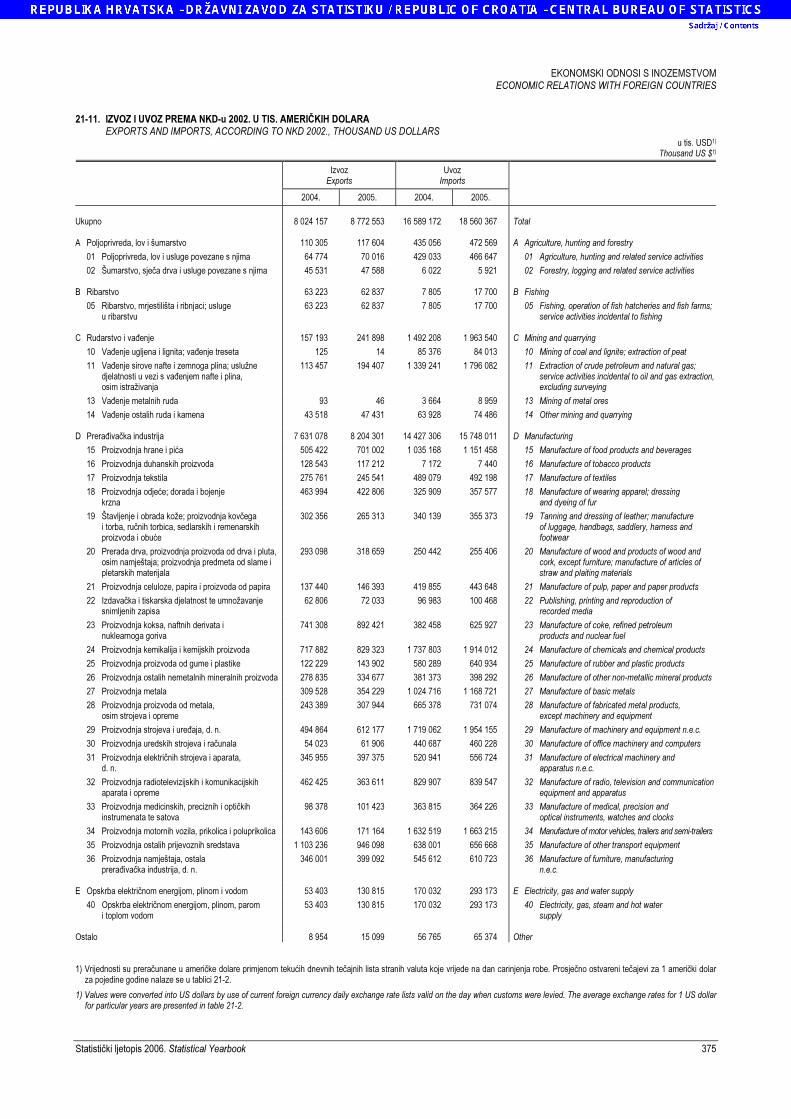
EKONOMSKI ODNOSI S INOZEMSTVOM ECONOMIC RELATIONS WITH FOREIGN COUNTRIES
Statistički ljetopis 2006. Statistical Yearbook 375
21-11. IZVOZ I UVOZ PREMA NKD-u 2002. U TIS. AMERIČKIH DOLARA EXPORTS AND IMPORTS, ACCORDING TO NKD 2002., THOUSAND US DOLLARS
u tis. USD1)
Thousand US $1)
Izvoz Exports
Uvoz Imports
2004. 2005. 2004. 2005.
Ukupno 8 024 157 8 772 553 16 589 172 18 560 367 Total
A Poljoprivreda, lov i šumarstvo 110 305 117 604 435 056 472 569 A Agriculture, hunting and forestry
01 Poljoprivreda, lov i usluge povezane s njima 64 774 70 016 429 033 466 647 01 Agriculture, hunting and related service activities
02 Šumarstvo, sječa drva i usluge povezane s njima 45 531 47 588 6 022 5 921 02 Forestry, logging and related service activities
B Ribarstvo 63 223 62 837 7 805 17 700 B Fishing
05 Ribarstvo, mrjestilišta i ribnjaci; usluge u ribarstvu
63 223 62 837 7 805 17 700 05 Fishing, operation of fish hatcheries and fish farms; service activities incidental to fishing
C Rudarstvo i vađenje 157 193 241 898 1 492 208 1 963 540 C Mining and quarrying
10 Vađenje ugljena i lignita; vađenje treseta 125 14 85 376 84 013 10 Mining of coal and lignite; extraction of peat
11 Vađenje sirove nafte i zemnoga plina; uslužne djelatnosti u vezi s vađenjem nafte i plina, osim istraživanja
113 457 194 407 1 339 241 1 796 082 11 Extraction of crude petroleum and natural gas; service activities incidental to oil and gas extraction, excluding surveying
13 Vađenje metalnih ruda 93 46 3 664 8 959 13 Mining of metal ores
14 Vađenje ostalih ruda i kamena 43 518 47 431 63 928 74 486 14 Other mining and quarrying
D Prerađivačka industrija 7 631 078 8 204 301 14 427 306 15 748 011 D Manufacturing
15 Proizvodnja hrane i pića 505 422 701 002 1 035 168 1 151 458 15 Manufacture of food products and beverages
16 Proizvodnja duhanskih proizvoda 128 543 117 212 7 172 7 440 16 Manufacture of tobacco products
17 Proizvodnja tekstila 275 761 245 541 489 079 492 198 17 Manufacture of textiles
18 Proizvodnja odjeće; dorada i bojenje krzna
463 994 422 806 325 909 357 577 18 Manufacture of wearing apparel; dressing and dyeing of fur
19 Štavljenje i obrada kože; proizvodnja kovčega i torba, ručnih torbica, sedlarskih i remenarskih proizvoda i obuće
302 356 265 313 340 139 355 373 19 Tanning and dressing of leather; manufacture of luggage, handbags, saddlery, harness and footwear
20 Prerada drva, proizvodnja proizvoda od drva i pluta, osim namještaja; proizvodnja predmeta od slame i pletarskih materijala
293 098 318 659 250 442 255 406 20 Manufacture of wood and products of wood and cork, except furniture; manufacture of articles of straw and plaiting materials
21 Proizvodnja celuloze, papira i proizvoda od papira 137 440 146 393 419 855 443 648 21 Manufacture of pulp, paper and paper products
22 Izdavačka i tiskarska djelatnost te umnožavanje snimljenih zapisa
62 806 72 033 96 983 100 468 22 Publishing, printing and reproduction of recorded media
23 Proizvodnja koksa, naftnih derivata i nuklearnoga goriva
741 308 892 421 382 458 625 927 23 Manufacture of coke, refined petroleum products and nuclear fuel
24 Proizvodnja kemikalija i kemijskih proizvoda 717 882 829 323 1 737 803 1 914 012 24 Manufacture of chemicals and chemical products
25 Proizvodnja proizvoda od gume i plastike 122 229 143 902 580 289 640 934 25 Manufacture of rubber and plastic products
26 Proizvodnja ostalih nemetalnih mineralnih proizvoda 278 835 334 677 381 373 398 292 26 Manufacture of other non-metallic mineral products
27 Proizvodnja metala 309 528 354 229 1 024 716 1 168 721 27 Manufacture of basic metals
28 Proizvodnja proizvoda od metala, osim strojeva i opreme
243 389 307 944 665 378 731 074 28 Manufacture of fabricated metal products, except machinery and equipment
29 Proizvodnja strojeva i uređaja, d. n. 494 864 612 177 1 719 062 1 954 155 29 Manufacture of machinery and equipment n.e.c.
30 Proizvodnja uredskih strojeva i računala 54 023 61 906 440 687 460 228 30 Manufacture of office machinery and computers
31 Proizvodnja električnih strojeva i aparata, d. n.
345 955 397 375 520 941 556 724 31 Manufacture of electrical machinery and apparatus n.e.c.
32 Proizvodnja radiotelevizijskih i komunikacijskih aparata i opreme
462 425 363 611 829 907 839 547 32 Manufacture of radio, television and communication equipment and apparatus
33 Proizvodnja medicinskih, preciznih i optičkih instrumenata te satova
98 378 101 423 363 815 364 226 33 Manufacture of medical, precision and optical instruments, watches and clocks
34 Proizvodnja motornih vozila, prikolica i poluprikolica 143 606 171 164 1 632 519 1 663 215 34 Manufacture of motor vehicles, trailers and semi-trailers
35 Proizvodnja ostalih prijevoznih sredstava 1 103 236 946 098 638 001 656 668 35 Manufacture of other transport equipment
36 Proizvodnja namještaja, ostala prerađivačka industrija, d. n.
346 001 399 092 545 612 610 723 36 Manufacture of furniture, manufacturing n.e.c.
E Opskrba električnom energijom, plinom i vodom 53 403 130 815 170 032 293 173 E Electricity, gas and water supply
40 Opskrba električnom energijom, plinom, parom i toplom vodom
53 403 130 815 170 032 293 173 40 Electricity, gas, steam and hot water supply
Ostalo 8 954 15 099 56 765 65 374 Other 1) Vrijednosti su preračunane u američke dolare primjenom tekućih dnevnih tečajnih lista stranih valuta koje vrijede na dan carinjenja robe. Prosječno ostvareni tečajevi za 1 američki dolar
za pojedine godine nalaze se u tablici 21-2.
1) Values were converted into US dollars by use of current foreign currency daily exchange rate lists valid on the day when customs were levied. The average exchange rates for 1 US dollar for particular years are presented in table 21-2.
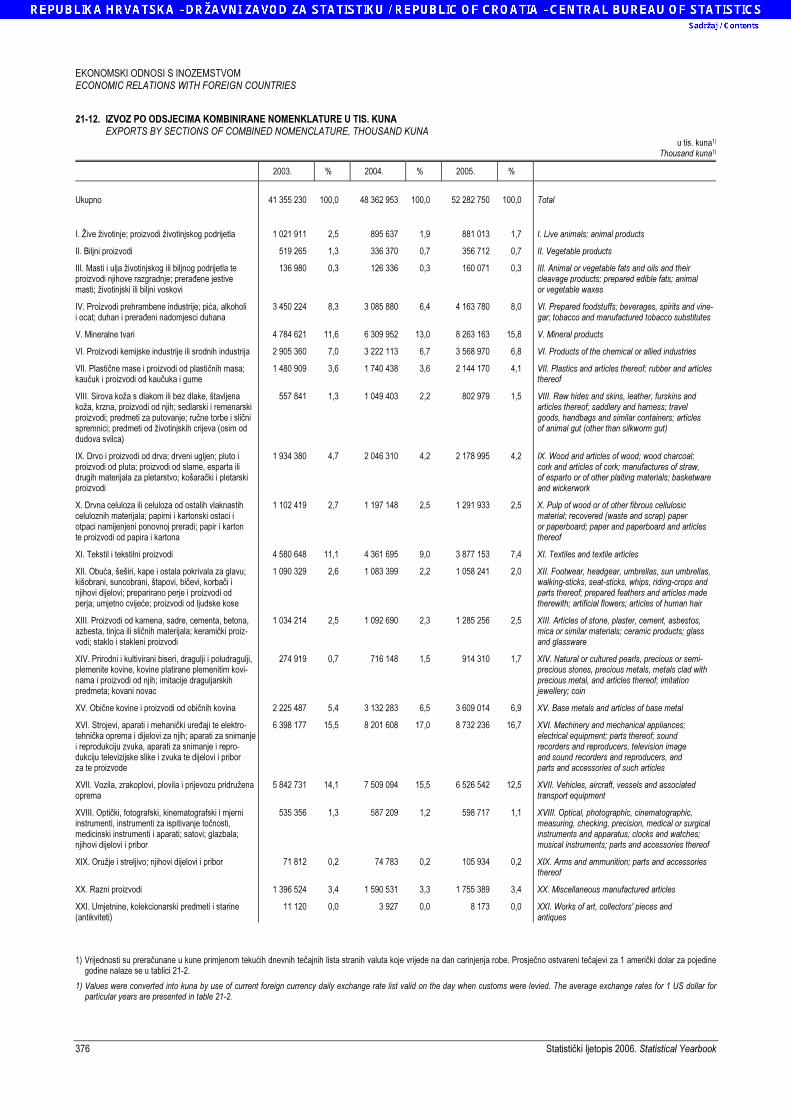
EKONOMSKI ODNOSI S INOZEMSTVOM ECONOMIC RELATIONS WITH FOREIGN COUNTRIES
376 Statistički ljetopis 2006. Statistical Yearbook
21-12. IZVOZ PO ODSJECIMA KOMBINIRANE NOMENKLATURE U TIS. KUNA
EXPORTS BY SECTIONS OF COMBINED NOMENCLATURE, THOUSAND KUNA
u tis. kuna1)
Thousand kuna1)
2003. % 2004. % 2005. %
Ukupno 41 355 230 100,0 48 362 953 100,0 52 282 750 100,0 Total
I. Žive životinje; proizvodi životinjskog podrijetla 1 021 911 2,5 895 637 1,9 881 013 1,7 I. Live animals; animal products
II. Biljni proizvodi 519 265 1,3 336 370 0,7 356 712 0,7 II. Vegetable products
III. Masti i ulja životinjskog ili biljnog podrijetla te proizvodi njihove razgradnje; prerađene jestive masti; životinjski ili biljni voskovi
136 980 0,3 126 336 0,3 160 071 0,3 III. Animal or vegetable fats and oils and their cleavage products; prepared edible fats; animal or vegetable waxes
IV. Proizvodi prehrambene industrije; pića, alkoholi i ocat; duhan i prerađeni nadomjesci duhana
3 450 224 8,3 3 085 880 6,4 4 163 780 8,0 VI. Prepared foodstuffs; beverages, spirits and vine-gar; tobacco and manufactured tobacco substitutes
V. Mineralne tvari 4 784 621 11,6 6 309 952 13,0 8 263 163 15,8 V. Mineral products
VI. Proizvodi kemijske industrije ili srodnih industrija 2 905 360 7,0 3 222 113 6,7 3 568 970 6,8 VI. Products of the chemical or allied industries
VII. Plastične mase i proizvodi od plastičnih masa; kaučuk i proizvodi od kaučuka i gume
1 480 909 3,6 1 740 438 3,6 2 144 170 4,1 VII. Plastics and articles thereof; rubber and articles thereof
VIII. Sirova koža s dlakom ili bez dlake, štavljena koža, krzna, proizvodi od njih; sedlarski i remenarski proizvodi; predmeti za putovanje; ručne torbe i slični spremnici; predmeti od životinjskih crijeva (osim od dudova svilca)
557 841 1,3 1 049 403 2,2 802 979 1,5 VIII. Raw hides and skins, leather, furskins and articles thereof; saddlery and harness; travel goods, handbags and similar containers; articles of animal gut (other than silkworm gut)
IX. Drvo i proizvodi od drva; drveni ugljen; pluto i proizvodi od pluta; proizvodi od slame, esparta ili drugih materijala za pletarstvo; košarački i pletarski proizvodi
1 934 380 4,7 2 046 310 4,2 2 178 995 4,2 IX. Wood and articles of wood; wood charcoal; cork and articles of cork; manufactures of straw, of esparto or of other plaiting materials; basketware and wickerwork
X. Drvna celuloza ili celuloza od ostalih vlaknastih celuloznih materijala; papirni i kartonski ostaci i otpaci namijenjeni ponovnoj preradi; papir i karton te proizvodi od papira i kartona
1 102 419 2,7 1 197 148 2,5 1 291 933 2,5 X. Pulp of wood or of other fibrous cellulosic material; recovered (waste and scrap) paper or paperboard; paper and paperboard and articles thereof
XI. Tekstil i tekstilni proizvodi 4 580 648 11,1 4 361 695 9,0 3 877 153 7,4 XI. Textiles and textile articles
XII. Obuća, šeširi, kape i ostala pokrivala za glavu; kišobrani, suncobrani, štapovi, bičevi, korbači i njihovi dijelovi; preparirano perje i proizvodi od perja; umjetno cvijeće; proizvodi od ljudske kose
1 090 329 2,6 1 083 399 2,2 1 058 241 2,0 XII. Footwear, headgear, umbrellas, sun umbrellas, walking-sticks, seat-sticks, whips, riding-crops and parts thereof; prepared feathers and articles made therewith; artificial flowers; articles of human hair
XIII. Proizvodi od kamena, sadre, cementa, betona, azbesta, tinjca ili sličnih materijala; keramički proiz-vodi; staklo i stakleni proizvodi
1 034 214 2,5 1 092 690 2,3 1 285 256 2,5 XIII. Articles of stone, plaster, cement, asbestos, mica or similar materials; ceramic products; glass and glassware
XIV. Prirodni i kultivirani biseri, dragulji i poludragulji, plemenite kovine, kovine platirane plemenitim kovi-nama i proizvodi od njih; imitacije draguljarskih predmeta; kovani novac
274 919 0,7 716 148 1,5 914 310 1,7 XIV. Natural or cultured pearls, precious or semi-precious stones, precious metals, metals clad with precious metal, and articles thereof; imitation jewellery; coin
XV. Obične kovine i proizvodi od običnih kovina 2 225 487 5,4 3 132 283 6,5 3 609 014 6,9 XV. Base metals and articles of base metal
XVI. Strojevi, aparati i mehanički uređaji te elektro-tehnička oprema i dijelovi za njih; aparati za snimanje i reprodukciju zvuka, aparati za snimanje i repro-dukciju televizijske slike i zvuka te dijelovi i pribor za te proizvode
6 398 177 15,5 8 201 608 17,0 8 732 236 16,7 XVI. Machinery and mechanical appliances; electrical equipment; parts thereof; sound recorders and reproducers, television image and sound recorders and reproducers, and parts and accessories of such articles
XVII. Vozila, zrakoplovi, plovila i prijevozu pridružena oprema
5 842 731 14,1 7 509 094 15,5 6 526 542 12,5 XVII. Vehicles, aircraft, vessels and associated transport equipment
XVIII. Optički, fotografski, kinematografski i mjerni instrumenti, instrumenti za ispitivanje točnosti, medicinski instrumenti i aparati; satovi; glazbala; njihovi dijelovi i pribor
535 356 1,3 587 209 1,2 598 717 1,1 XVIII. Optical, photographic, cinematographic, measuring, checking, precision, medical or surgical instruments and apparatus; clocks and watches; musical instruments; parts and accessories thereof
XIX. Oružje i streljivo; njihovi dijelovi i pribor 71 812 0,2 74 783 0,2 105 934 0,2 XIX. Arms and ammunition; parts and accessories thereof
XX. Razni proizvodi 1 396 524 3,4 1 590 531 3,3 1 755 389 3,4 XX. Miscellaneous manufactured articles
XXI. Umjetnine, kolekcionarski predmeti i starine (antikviteti)
11 120 0,0 3 927 0,0 8 173 0,0 XXI. Works of art, collectors' pieces and antiques
1) Vrijednosti su preračunane u kune primjenom tekućih dnevnih tečajnih lista stranih valuta koje vrijede na dan carinjenja robe. Prosječno ostvareni tečajevi za 1 američki dolar za pojedine
godine nalaze se u tablici 21-2.
1) Values were converted into kuna by use of current foreign currency daily exchange rate list valid on the day when customs were levied. The average exchange rates for 1 US dollar for particular years are presented in table 21-2.
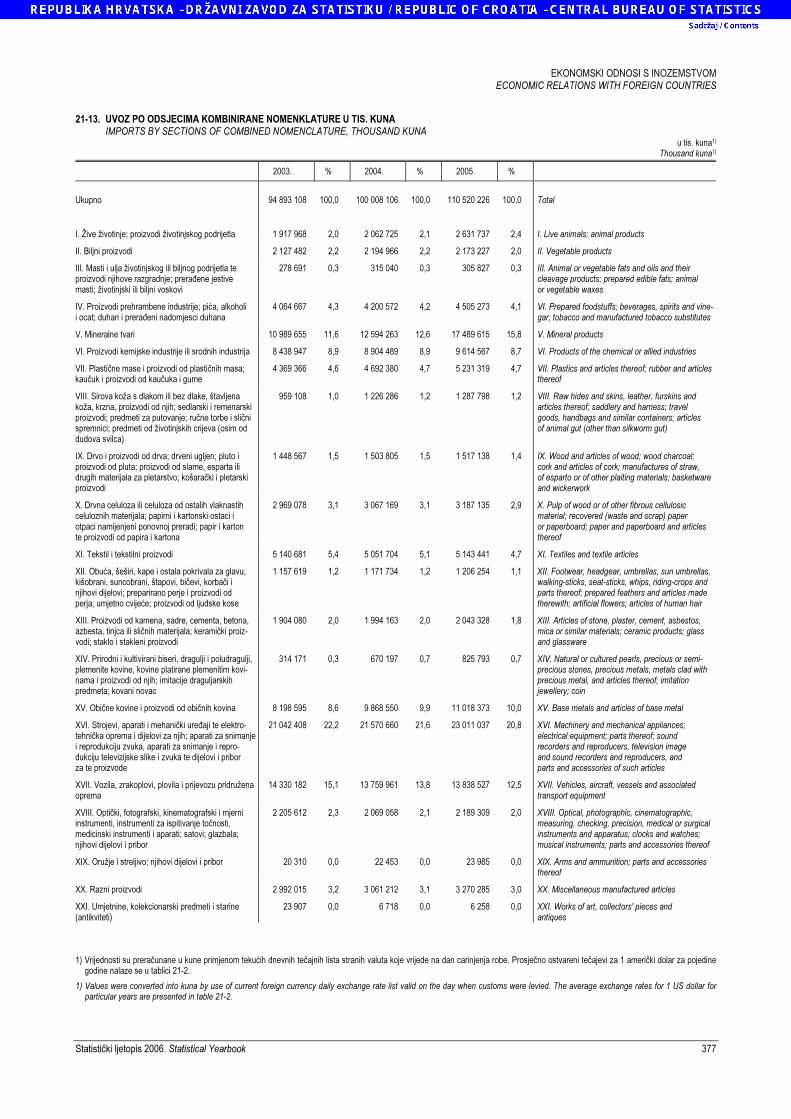
EKONOMSKI ODNOSI S INOZEMSTVOM ECONOMIC RELATIONS WITH FOREIGN COUNTRIES
Statistički ljetopis 2006. Statistical Yearbook 377
21-13. UVOZ PO ODSJECIMA KOMBINIRANE NOMENKLATURE U TIS. KUNA
IMPORTS BY SECTIONS OF COMBINED NOMENCLATURE, THOUSAND KUNA
u tis. kuna1)
Thousand kuna1)
2003. % 2004. % 2005. %
Ukupno 94 893 108 100,0 100 008 106 100,0 110 520 226 100,0 Total
I. Žive životinje; proizvodi životinjskog podrijetla 1 917 968 2,0 2 062 725 2,1 2 631 737 2,4 I. Live animals; animal products
II. Biljni proizvodi 2 127 482 2,2 2 194 966 2,2 2 173 227 2,0 II. Vegetable products
III. Masti i ulja životinjskog ili biljnog podrijetla te proizvodi njihove razgradnje; prerađene jestive masti; životinjski ili biljni voskovi
278 691 0,3 315 040 0,3 305 827 0,3 III. Animal or vegetable fats and oils and their cleavage products; prepared edible fats; animal or vegetable waxes
IV. Proizvodi prehrambene industrije; pića, alkoholi i ocat; duhan i prerađeni nadomjesci duhana
4 064 667 4,3 4 200 572 4,2 4 505 273 4,1 VI. Prepared foodstuffs; beverages, spirits and vine-gar; tobacco and manufactured tobacco substitutes
V. Mineralne tvari 10 989 655 11,6 12 594 263 12,6 17 489 615 15,8 V. Mineral products
VI. Proizvodi kemijske industrije ili srodnih industrija 8 438 947 8,9 8 904 489 8,9 9 614 567 8,7 VI. Products of the chemical or allied industries
VII. Plastične mase i proizvodi od plastičnih masa; kaučuk i proizvodi od kaučuka i gume
4 369 366 4,6 4 692 380 4,7 5 231 319 4,7 VII. Plastics and articles thereof; rubber and articles thereof
VIII. Sirova koža s dlakom ili bez dlake, štavljena koža, krzna, proizvodi od njih; sedlarski i remenarski proizvodi; predmeti za putovanje; ručne torbe i slični spremnici; predmeti od životinjskih crijeva (osim od dudova svilca)
959 108 1,0 1 226 286 1,2 1 287 798 1,2 VIII. Raw hides and skins, leather, furskins and articles thereof; saddlery and harness; travel goods, handbags and similar containers; articles of animal gut (other than silkworm gut)
IX. Drvo i proizvodi od drva; drveni ugljen; pluto i proizvodi od pluta; proizvodi od slame, esparta ili drugih materijala za pletarstvo; košarački i pletarski proizvodi
1 448 567 1,5 1 503 805 1,5 1 517 138 1,4 IX. Wood and articles of wood; wood charcoal; cork and articles of cork; manufactures of straw, of esparto or of other plaiting materials; basketware and wickerwork
X. Drvna celuloza ili celuloza od ostalih vlaknastih celuloznih materijala; papirni i kartonski ostaci i otpaci namijenjeni ponovnoj preradi; papir i karton te proizvodi od papira i kartona
2 969 078 3,1 3 067 169 3,1 3 187 135 2,9 X. Pulp of wood or of other fibrous cellulosic material; recovered (waste and scrap) paper or paperboard; paper and paperboard and articles thereof
XI. Tekstil i tekstilni proizvodi 5 140 681 5,4 5 051 704 5,1 5 143 441 4,7 XI. Textiles and textile articles
XII. Obuća, šeširi, kape i ostala pokrivala za glavu; kišobrani, suncobrani, štapovi, bičevi, korbači i njihovi dijelovi; preparirano perje i proizvodi od perja; umjetno cvijeće; proizvodi od ljudske kose
1 157 619 1,2 1 171 734 1,2 1 206 254 1,1 XII. Footwear, headgear, umbrellas, sun umbrellas, walking-sticks, seat-sticks, whips, riding-crops and parts thereof; prepared feathers and articles made therewith; artificial flowers; articles of human hair
XIII. Proizvodi od kamena, sadre, cementa, betona, azbesta, tinjca ili sličnih materijala; keramički proiz-vodi; staklo i stakleni proizvodi
1 904 080 2,0 1 994 163 2,0 2 043 328 1,8 XIII. Articles of stone, plaster, cement, asbestos, mica or similar materials; ceramic products; glass and glassware
XIV. Prirodni i kultivirani biseri, dragulji i poludragulji, plemenite kovine, kovine platirane plemenitim kovi-nama i proizvodi od njih; imitacije draguljarskih predmeta; kovani novac
314 171 0,3 670 197 0,7 825 793 0,7 XIV. Natural or cultured pearls, precious or semi-precious stones, precious metals, metals clad with precious metal, and articles thereof; imitation jewellery; coin
XV. Obične kovine i proizvodi od običnih kovina 8 198 595 8,6 9 868 550 9,9 11 018 373 10,0 XV. Base metals and articles of base metal
XVI. Strojevi, aparati i mehanički uređaji te elektro-tehnička oprema i dijelovi za njih; aparati za snimanje i reprodukciju zvuka, aparati za snimanje i repro-dukciju televizijske slike i zvuka te dijelovi i pribor za te proizvode
21 042 408 22,2 21 570 660 21,6 23 011 037 20,8 XVI. Machinery and mechanical appliances; electrical equipment; parts thereof; sound recorders and reproducers, television image and sound recorders and reproducers, and parts and accessories of such articles
XVII. Vozila, zrakoplovi, plovila i prijevozu pridružena oprema
14 330 182 15,1 13 759 961 13,8 13 838 527 12,5 XVII. Vehicles, aircraft, vessels and associated transport equipment
XVIII. Optički, fotografski, kinematografski i mjerni instrumenti, instrumenti za ispitivanje točnosti, medicinski instrumenti i aparati; satovi; glazbala; njihovi dijelovi i pribor
2 205 612 2,3 2 069 058 2,1 2 189 309 2,0 XVIII. Optical, photographic, cinematographic, measuring, checking, precision, medical or surgical instruments and apparatus; clocks and watches; musical instruments; parts and accessories thereof
XIX. Oružje i streljivo; njihovi dijelovi i pribor 20 310 0,0 22 453 0,0 23 985 0,0 XIX. Arms and ammunition; parts and accessories thereof
XX. Razni proizvodi 2 992 015 3,2 3 061 212 3,1 3 270 285 3,0 XX. Miscellaneous manufactured articles
XXI. Umjetnine, kolekcionarski predmeti i starine (antikviteti)
23 907 0,0 6 718 0,0 6 258 0,0 XXI. Works of art, collectors' pieces and antiques
1) Vrijednosti su preračunane u kune primjenom tekućih dnevnih tečajnih lista stranih valuta koje vrijede na dan carinjenja robe. Prosječno ostvareni tečajevi za 1 američki dolar za pojedine
godine nalaze se u tablici 21-2.
1) Values were converted into kuna by use of current foreign currency daily exchange rate list valid on the day when customs were levied. The average exchange rates for 1 US dollar for particular years are presented in table 21-2.
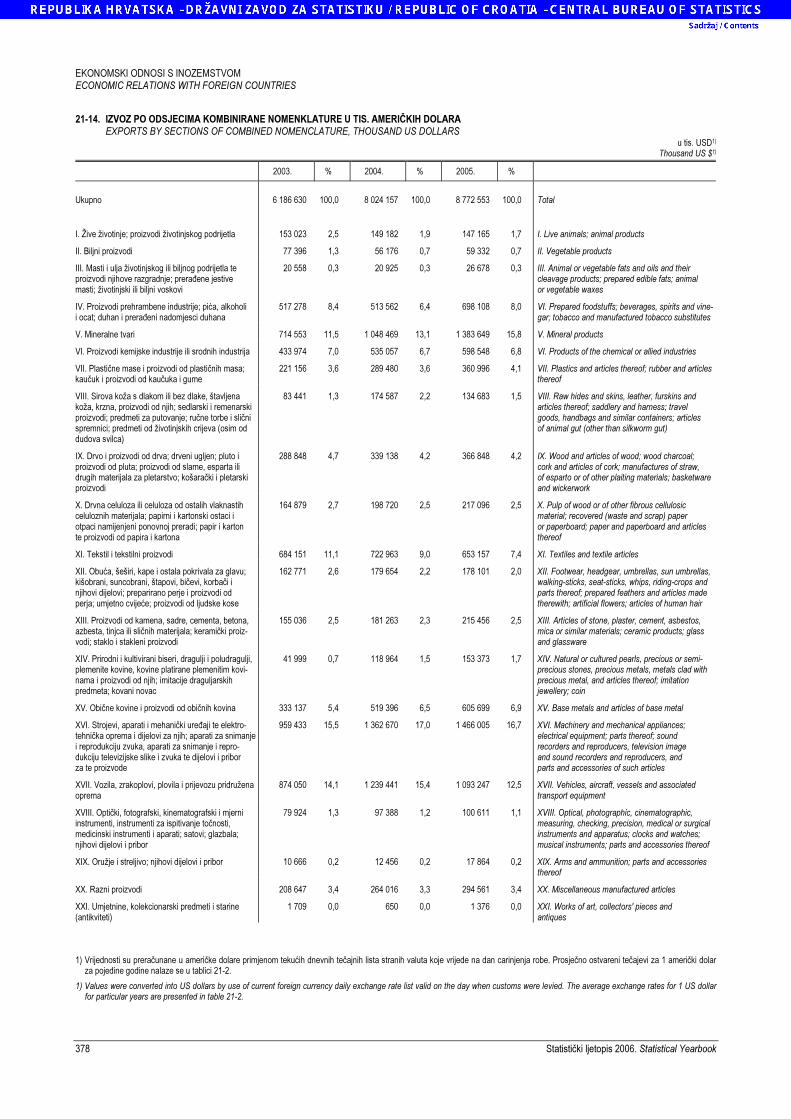
EKONOMSKI ODNOSI S INOZEMSTVOM ECONOMIC RELATIONS WITH FOREIGN COUNTRIES
378 Statistički ljetopis 2006. Statistical Yearbook
21-14. IZVOZ PO ODSJECIMA KOMBINIRANE NOMENKLATURE U TIS. AMERIČKIH DOLARA
EXPORTS BY SECTIONS OF COMBINED NOMENCLATURE, THOUSAND US DOLLARS
u tis. USD1)
Thousand US $1)
2003. % 2004. % 2005. %
Ukupno 6 186 630 100,0 8 024 157 100,0 8 772 553 100,0 Total
I. Žive životinje; proizvodi životinjskog podrijetla 153 023 2,5 149 182 1,9 147 165 1,7 I. Live animals; animal products
II. Biljni proizvodi 77 396 1,3 56 176 0,7 59 332 0,7 II. Vegetable products
III. Masti i ulja životinjskog ili biljnog podrijetla te proizvodi njihove razgradnje; prerađene jestive masti; životinjski ili biljni voskovi
20 558 0,3 20 925 0,3 26 678 0,3 III. Animal or vegetable fats and oils and their cleavage products; prepared edible fats; animal or vegetable waxes
IV. Proizvodi prehrambene industrije; pića, alkoholi i ocat; duhan i prerađeni nadomjesci duhana
517 278 8,4 513 562 6,4 698 108 8,0 VI. Prepared foodstuffs; beverages, spirits and vine-gar; tobacco and manufactured tobacco substitutes
V. Mineralne tvari 714 553 11,5 1 048 469 13,1 1 383 649 15,8 V. Mineral products
VI. Proizvodi kemijske industrije ili srodnih industrija 433 974 7,0 535 057 6,7 598 548 6,8 VI. Products of the chemical or allied industries
VII. Plastične mase i proizvodi od plastičnih masa; kaučuk i proizvodi od kaučuka i gume
221 156 3,6 289 480 3,6 360 996 4,1 VII. Plastics and articles thereof; rubber and articles thereof
VIII. Sirova koža s dlakom ili bez dlake, štavljena koža, krzna, proizvodi od njih; sedlarski i remenarski proizvodi; predmeti za putovanje; ručne torbe i slični spremnici; predmeti od životinjskih crijeva (osim od dudova svilca)
83 441 1,3 174 587 2,2 134 683 1,5 VIII. Raw hides and skins, leather, furskins and articles thereof; saddlery and harness; travel goods, handbags and similar containers; articles of animal gut (other than silkworm gut)
IX. Drvo i proizvodi od drva; drveni ugljen; pluto i proizvodi od pluta; proizvodi od slame, esparta ili drugih materijala za pletarstvo; košarački i pletarski proizvodi
288 848 4,7 339 138 4,2 366 848 4,2 IX. Wood and articles of wood; wood charcoal; cork and articles of cork; manufactures of straw, of esparto or of other plaiting materials; basketware and wickerwork
X. Drvna celuloza ili celuloza od ostalih vlaknastih celuloznih materijala; papirni i kartonski ostaci i otpaci namijenjeni ponovnoj preradi; papir i karton te proizvodi od papira i kartona
164 879 2,7 198 720 2,5 217 096 2,5 X. Pulp of wood or of other fibrous cellulosic material; recovered (waste and scrap) paper or paperboard; paper and paperboard and articles thereof
XI. Tekstil i tekstilni proizvodi 684 151 11,1 722 963 9,0 653 157 7,4 XI. Textiles and textile articles
XII. Obuća, šeširi, kape i ostala pokrivala za glavu; kišobrani, suncobrani, štapovi, bičevi, korbači i njihovi dijelovi; preparirano perje i proizvodi od perja; umjetno cvijeće; proizvodi od ljudske kose
162 771 2,6 179 654 2,2 178 101 2,0 XII. Footwear, headgear, umbrellas, sun umbrellas, walking-sticks, seat-sticks, whips, riding-crops and parts thereof; prepared feathers and articles made therewith; artificial flowers; articles of human hair
XIII. Proizvodi od kamena, sadre, cementa, betona, azbesta, tinjca ili sličnih materijala; keramički proiz-vodi; staklo i stakleni proizvodi
155 036 2,5 181 263 2,3 215 456 2,5 XIII. Articles of stone, plaster, cement, asbestos, mica or similar materials; ceramic products; glass and glassware
XIV. Prirodni i kultivirani biseri, dragulji i poludragulji, plemenite kovine, kovine platirane plemenitim kovi-nama i proizvodi od njih; imitacije draguljarskih predmeta; kovani novac
41 999 0,7 118 964 1,5 153 373 1,7 XIV. Natural or cultured pearls, precious or semi-precious stones, precious metals, metals clad with precious metal, and articles thereof; imitation jewellery; coin
XV. Obične kovine i proizvodi od običnih kovina 333 137 5,4 519 396 6,5 605 699 6,9 XV. Base metals and articles of base metal
XVI. Strojevi, aparati i mehanički uređaji te elektro-tehnička oprema i dijelovi za njih; aparati za snimanje i reprodukciju zvuka, aparati za snimanje i repro-dukciju televizijske slike i zvuka te dijelovi i pribor za te proizvode
959 433 15,5 1 362 670 17,0 1 466 005 16,7 XVI. Machinery and mechanical appliances; electrical equipment; parts thereof; sound recorders and reproducers, television image and sound recorders and reproducers, and parts and accessories of such articles
XVII. Vozila, zrakoplovi, plovila i prijevozu pridružena oprema
874 050 14,1 1 239 441 15,4 1 093 247 12,5 XVII. Vehicles, aircraft, vessels and associated transport equipment
XVIII. Optički, fotografski, kinematografski i mjerni instrumenti, instrumenti za ispitivanje točnosti, medicinski instrumenti i aparati; satovi; glazbala; njihovi dijelovi i pribor
79 924 1,3 97 388 1,2 100 611 1,1 XVIII. Optical, photographic, cinematographic, measuring, checking, precision, medical or surgical instruments and apparatus; clocks and watches; musical instruments; parts and accessories thereof
XIX. Oružje i streljivo; njihovi dijelovi i pribor 10 666 0,2 12 456 0,2 17 864 0,2 XIX. Arms and ammunition; parts and accessories thereof
XX. Razni proizvodi 208 647 3,4 264 016 3,3 294 561 3,4 XX. Miscellaneous manufactured articles
XXI. Umjetnine, kolekcionarski predmeti i starine (antikviteti)
1 709 0,0 650 0,0 1 376 0,0 XXI. Works of art, collectors' pieces and antiques
1) Vrijednosti su preračunane u američke dolare primjenom tekućih dnevnih tečajnih lista stranih valuta koje vrijede na dan carinjenja robe. Prosječno ostvareni tečajevi za 1 američki dolar
za pojedine godine nalaze se u tablici 21-2.
1) Values were converted into US dollars by use of current foreign currency daily exchange rate list valid on the day when customs were levied. The average exchange rates for 1 US dollar for particular years are presented in table 21-2.
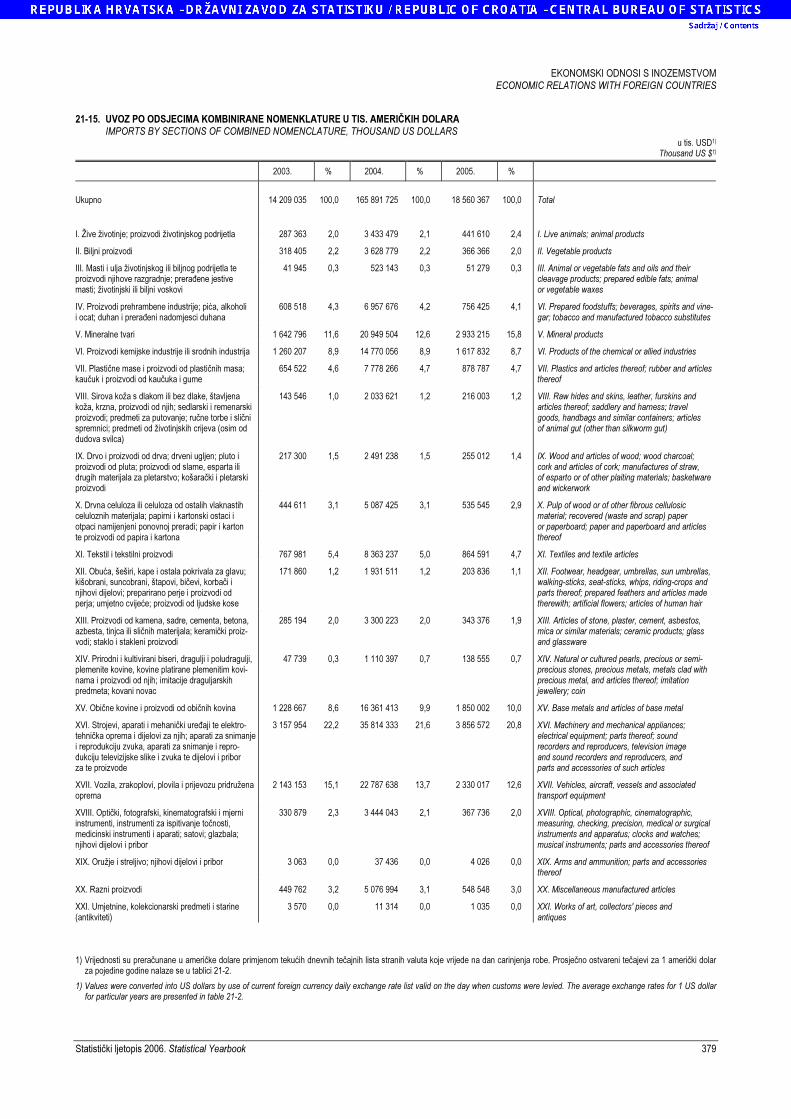
EKONOMSKI ODNOSI S INOZEMSTVOM ECONOMIC RELATIONS WITH FOREIGN COUNTRIES
Statistički ljetopis 2006. Statistical Yearbook 379
21-15. UVOZ PO ODSJECIMA KOMBINIRANE NOMENKLATURE U TIS. AMERIČKIH DOLARA
IMPORTS BY SECTIONS OF COMBINED NOMENCLATURE, THOUSAND US DOLLARS
u tis. USD1)
Thousand US $1)
2003. % 2004. % 2005. %
Ukupno 14 209 035 100,0 165 891 725 100,0 18 560 367 100,0 Total
I. Žive životinje; proizvodi životinjskog podrijetla 287 363 2,0 3 433 479 2,1 441 610 2,4 I. Live animals; animal products
II. Biljni proizvodi 318 405 2,2 3 628 779 2,2 366 366 2,0 II. Vegetable products
III. Masti i ulja životinjskog ili biljnog podrijetla te proizvodi njihove razgradnje; prerađene jestive masti; životinjski ili biljni voskovi
41 945 0,3 523 143 0,3 51 279 0,3 III. Animal or vegetable fats and oils and their cleavage products; prepared edible fats; animal or vegetable waxes
IV. Proizvodi prehrambene industrije; pića, alkoholi i ocat; duhan i prerađeni nadomjesci duhana
608 518 4,3 6 957 676 4,2 756 425 4,1 VI. Prepared foodstuffs; beverages, spirits and vine-gar; tobacco and manufactured tobacco substitutes
V. Mineralne tvari 1 642 796 11,6 20 949 504 12,6 2 933 215 15,8 V. Mineral products
VI. Proizvodi kemijske industrije ili srodnih industrija 1 260 207 8,9 14 770 056 8,9 1 617 832 8,7 VI. Products of the chemical or allied industries
VII. Plastične mase i proizvodi od plastičnih masa; kaučuk i proizvodi od kaučuka i gume
654 522 4,6 7 778 266 4,7 878 787 4,7 VII. Plastics and articles thereof; rubber and articles thereof
VIII. Sirova koža s dlakom ili bez dlake, štavljena koža, krzna, proizvodi od njih; sedlarski i remenarski proizvodi; predmeti za putovanje; ručne torbe i slični spremnici; predmeti od životinjskih crijeva (osim od dudova svilca)
143 546 1,0 2 033 621 1,2 216 003 1,2 VIII. Raw hides and skins, leather, furskins and articles thereof; saddlery and harness; travel goods, handbags and similar containers; articles of animal gut (other than silkworm gut)
IX. Drvo i proizvodi od drva; drveni ugljen; pluto i proizvodi od pluta; proizvodi od slame, esparta ili drugih materijala za pletarstvo; košarački i pletarski proizvodi
217 300 1,5 2 491 238 1,5 255 012 1,4 IX. Wood and articles of wood; wood charcoal; cork and articles of cork; manufactures of straw, of esparto or of other plaiting materials; basketware and wickerwork
X. Drvna celuloza ili celuloza od ostalih vlaknastih celuloznih materijala; papirni i kartonski ostaci i otpaci namijenjeni ponovnoj preradi; papir i karton te proizvodi od papira i kartona
444 611 3,1 5 087 425 3,1 535 545 2,9 X. Pulp of wood or of other fibrous cellulosic material; recovered (waste and scrap) paper or paperboard; paper and paperboard and articles thereof
XI. Tekstil i tekstilni proizvodi 767 981 5,4 8 363 237 5,0 864 591 4,7 XI. Textiles and textile articles
XII. Obuća, šeširi, kape i ostala pokrivala za glavu; kišobrani, suncobrani, štapovi, bičevi, korbači i njihovi dijelovi; preparirano perje i proizvodi od perja; umjetno cvijeće; proizvodi od ljudske kose
171 860 1,2 1 931 511 1,2 203 836 1,1 XII. Footwear, headgear, umbrellas, sun umbrellas, walking-sticks, seat-sticks, whips, riding-crops and parts thereof; prepared feathers and articles made therewith; artificial flowers; articles of human hair
XIII. Proizvodi od kamena, sadre, cementa, betona, azbesta, tinjca ili sličnih materijala; keramički proiz-vodi; staklo i stakleni proizvodi
285 194 2,0 3 300 223 2,0 343 376 1,9 XIII. Articles of stone, plaster, cement, asbestos, mica or similar materials; ceramic products; glass and glassware
XIV. Prirodni i kultivirani biseri, dragulji i poludragulji, plemenite kovine, kovine platirane plemenitim kovi-nama i proizvodi od njih; imitacije draguljarskih predmeta; kovani novac
47 739 0,3 1 110 397 0,7 138 555 0,7 XIV. Natural or cultured pearls, precious or semi-precious stones, precious metals, metals clad with precious metal, and articles thereof; imitation jewellery; coin
XV. Obične kovine i proizvodi od običnih kovina 1 228 667 8,6 16 361 413 9,9 1 850 002 10,0 XV. Base metals and articles of base metal
XVI. Strojevi, aparati i mehanički uređaji te elektro-tehnička oprema i dijelovi za njih; aparati za snimanje i reprodukciju zvuka, aparati za snimanje i repro-dukciju televizijske slike i zvuka te dijelovi i pribor za te proizvode
3 157 954 22,2 35 814 333 21,6 3 856 572 20,8 XVI. Machinery and mechanical appliances; electrical equipment; parts thereof; sound recorders and reproducers, television image and sound recorders and reproducers, and parts and accessories of such articles
XVII. Vozila, zrakoplovi, plovila i prijevozu pridružena oprema
2 143 153 15,1 22 787 638 13,7 2 330 017 12,6 XVII. Vehicles, aircraft, vessels and associated transport equipment
XVIII. Optički, fotografski, kinematografski i mjerni instrumenti, instrumenti za ispitivanje točnosti, medicinski instrumenti i aparati; satovi; glazbala; njihovi dijelovi i pribor
330 879 2,3 3 444 043 2,1 367 736 2,0 XVIII. Optical, photographic, cinematographic, measuring, checking, precision, medical or surgical instruments and apparatus; clocks and watches; musical instruments; parts and accessories thereof
XIX. Oružje i streljivo; njihovi dijelovi i pribor 3 063 0,0 37 436 0,0 4 026 0,0 XIX. Arms and ammunition; parts and accessories thereof
XX. Razni proizvodi 449 762 3,2 5 076 994 3,1 548 548 3,0 XX. Miscellaneous manufactured articles
XXI. Umjetnine, kolekcionarski predmeti i starine (antikviteti)
3 570 0,0 11 314 0,0 1 035 0,0 XXI. Works of art, collectors' pieces and antiques
1) Vrijednosti su preračunane u američke dolare primjenom tekućih dnevnih tečajnih lista stranih valuta koje vrijede na dan carinjenja robe. Prosječno ostvareni tečajevi za 1 američki dolar
za pojedine godine nalaze se u tablici 21-2.
1) Values were converted into US dollars by use of current foreign currency daily exchange rate list valid on the day when customs were levied. The average exchange rates for 1 US dollar for particular years are presented in table 21-2.
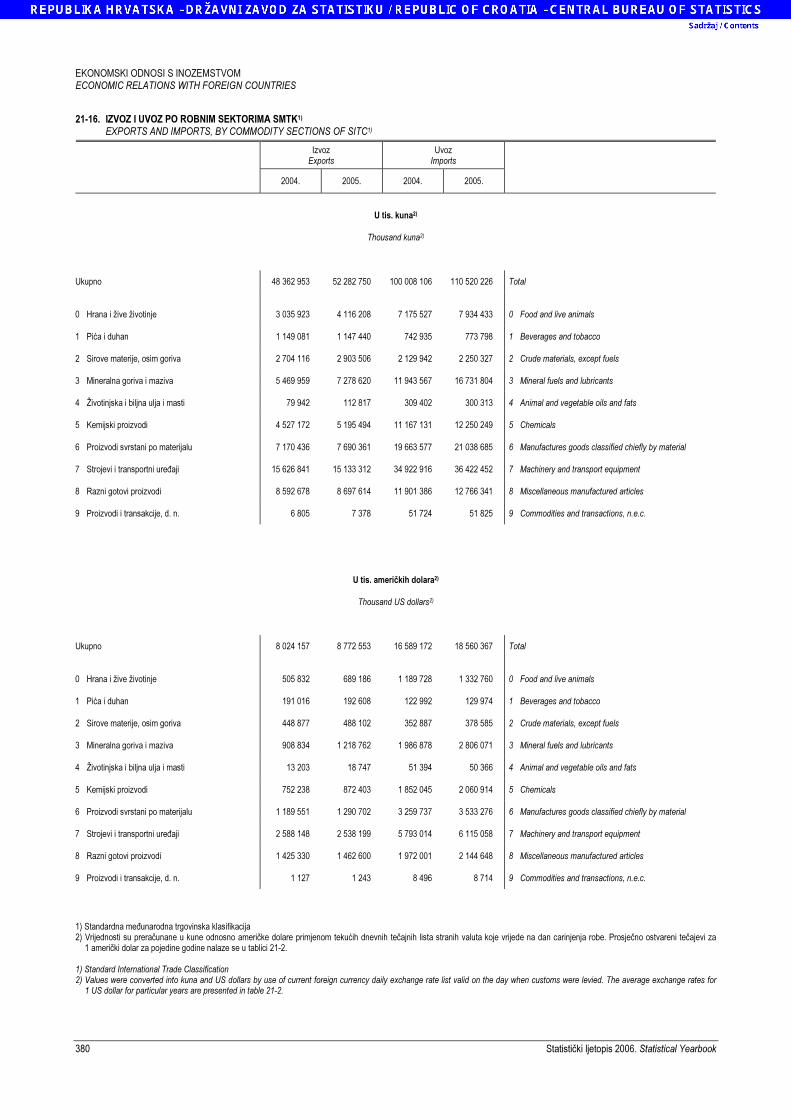
EKONOMSKI ODNOSI S INOZEMSTVOM ECONOMIC RELATIONS WITH FOREIGN COUNTRIES
380 Statistički ljetopis 2006. Statistical Yearbook
21-16. IZVOZ I UVOZ PO ROBNIM SEKTORIMA SMTK1) EXPORTS AND IMPORTS, BY COMMODITY SECTIONS OF SITC1)
Izvoz Exports
Uvoz Imports
2004. 2005. 2004. 2005.
U tis. kuna2)
Thousand kuna2)
Ukupno 48 362 953 52 282 750 100 008 106 110 520 226 Total
0 Hrana i žive životinje 3 035 923 4 116 208 7 175 527 7 934 433 0 Food and live animals
1 Pića i duhan 1 149 081 1 147 440 742 935 773 798 1 Beverages and tobacco
2 Sirove materije, osim goriva 2 704 116 2 903 506 2 129 942 2 250 327 2 Crude materials, except fuels
3 Mineralna goriva i maziva 5 469 959 7 278 620 11 943 567 16 731 804 3 Mineral fuels and lubricants
4 Životinjska i biljna ulja i masti 79 942 112 817 309 402 300 313 4 Animal and vegetable oils and fats
5 Kemijski proizvodi 4 527 172 5 195 494 11 167 131 12 250 249 5 Chemicals
6 Proizvodi svrstani po materijalu 7 170 436 7 690 361 19 663 577 21 038 685 6 Manufactures goods classified chiefly by material
7 Strojevi i transportni uređaji 15 626 841 15 133 312 34 922 916 36 422 452 7 Machinery and transport equipment
8 Razni gotovi proizvodi 8 592 678 8 697 614 11 901 386 12 766 341 8 Miscellaneous manufactured articles
9 Proizvodi i transakcije, d. n. 6 805 7 378 51 724 51 825 9 Commodities and transactions, n.e.c.
U tis. američkih dolara2)
Thousand US dollars2)
Ukupno 8 024 157 8 772 553 16 589 172 18 560 367 Total
0 Hrana i žive životinje 505 832 689 186 1 189 728 1 332 760 0 Food and live animals
1 Pića i duhan 191 016 192 608 122 992 129 974 1 Beverages and tobacco
2 Sirove materije, osim goriva 448 877 488 102 352 887 378 585 2 Crude materials, except fuels
3 Mineralna goriva i maziva 908 834 1 218 762 1 986 878 2 806 071 3 Mineral fuels and lubricants
4 Životinjska i biljna ulja i masti 13 203 18 747 51 394 50 366 4 Animal and vegetable oils and fats
5 Kemijski proizvodi 752 238 872 403 1 852 045 2 060 914 5 Chemicals
6 Proizvodi svrstani po materijalu 1 189 551 1 290 702 3 259 737 3 533 276 6 Manufactures goods classified chiefly by material
7 Strojevi i transportni uređaji 2 588 148 2 538 199 5 793 014 6 115 058 7 Machinery and transport equipment
8 Razni gotovi proizvodi 1 425 330 1 462 600 1 972 001 2 144 648 8 Miscellaneous manufactured articles
9 Proizvodi i transakcije, d. n. 1 127 1 243 8 496 8 714 9 Commodities and transactions, n.e.c.
1) Standardna međunarodna trgovinska klasifikacija 2) Vrijednosti su preračunane u kune odnosno američke dolare primjenom tekućih dnevnih tečajnih lista stranih valuta koje vrijede na dan carinjenja robe. Prosječno ostvareni tečajevi za
1 američki dolar za pojedine godine nalaze se u tablici 21-2. 1) Standard International Trade Classification 2) Values were converted into kuna and US dollars by use of current foreign currency daily exchange rate list valid on the day when customs were levied. The average exchange rates for
1 US dollar for particular years are presented in table 21-2.
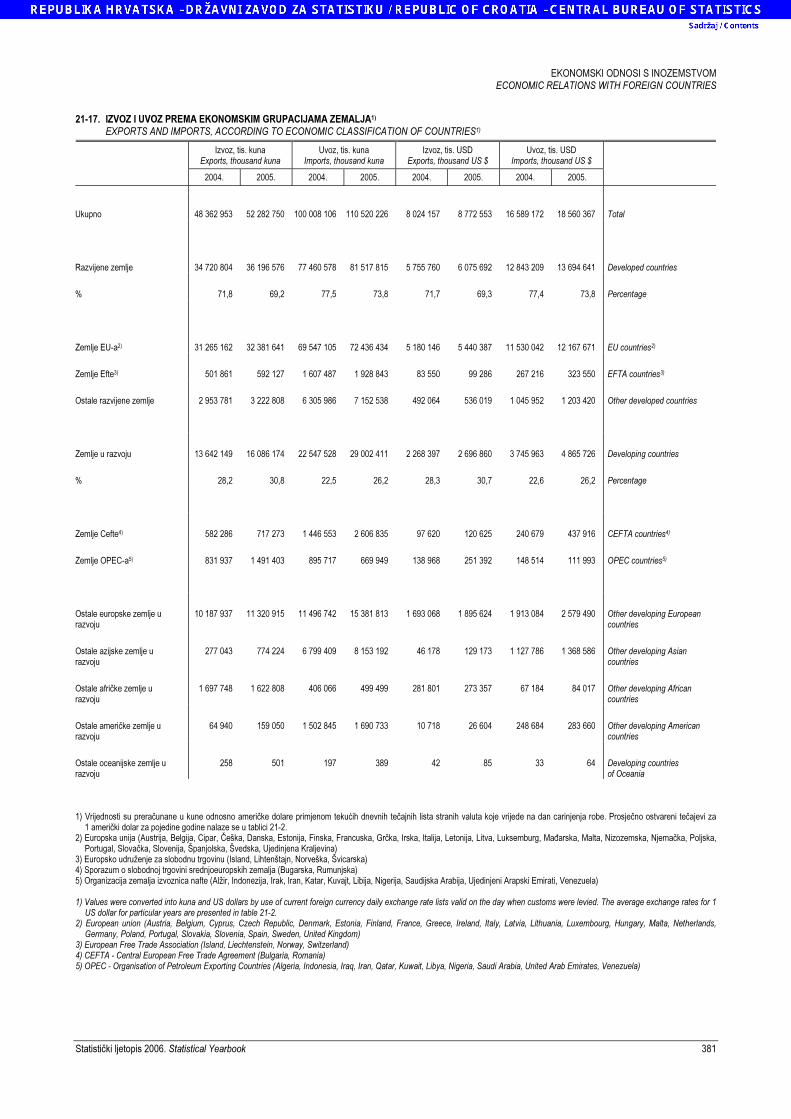
EKONOMSKI ODNOSI S INOZEMSTVOM ECONOMIC RELATIONS WITH FOREIGN COUNTRIES
Statistički ljetopis 2006. Statistical Yearbook 381
21-17. IZVOZ I UVOZ PREMA EKONOMSKIM GRUPACIJAMA ZEMALJA1) EXPORTS AND IMPORTS, ACCORDING TO ECONOMIC CLASSIFICATION OF COUNTRIES1)
Izvoz, tis. kuna Exports, thousand kuna
Uvoz, tis. kuna Imports, thousand kuna
Izvoz, tis. USD Exports, thousand US $
Uvoz, tis. USD Imports, thousand US $
2004. 2005. 2004. 2005. 2004. 2005. 2004. 2005.
Ukupno 48 362 953 52 282 750 100 008 106 110 520 226 8 024 157 8 772 553 16 589 172 18 560 367 Total
Razvijene zemlje 34 720 804 36 196 576 77 460 578 81 517 815 5 755 760 6 075 692 12 843 209 13 694 641 Developed countries
% 71,8 69,2 77,5 73,8 71,7 69,3 77,4 73,8 Percentage
Zemlje EU-a2) 31 265 162 32 381 641 69 547 105 72 436 434 5 180 146 5 440 387 11 530 042 12 167 671 EU countries2)
Zemlje Efte3) 501 861 592 127 1 607 487 1 928 843 83 550 99 286 267 216 323 550 EFTA countries3)
Ostale razvijene zemlje 2 953 781 3 222 808 6 305 986 7 152 538 492 064 536 019 1 045 952 1 203 420 Other developed countries
Zemlje u razvoju 13 642 149 16 086 174 22 547 528 29 002 411 2 268 397 2 696 860 3 745 963 4 865 726 Developing countries
% 28,2 30,8 22,5 26,2 28,3 30,7 22,6 26,2 Percentage
Zemlje Cefte4) 582 286 717 273 1 446 553 2 606 835 97 620 120 625 240 679 437 916 CEFTA countries4)
Zemlje OPEC-a5) 831 937 1 491 403 895 717 669 949 138 968 251 392 148 514 111 993 OPEC countries5)
Ostale europske zemlje u razvoju
10 187 937 11 320 915 11 496 742 15 381 813 1 693 068 1 895 624 1 913 084 2 579 490 Other developing European countries
Ostale azijske zemlje u razvoju
277 043 774 224 6 799 409 8 153 192 46 178 129 173 1 127 786 1 368 586 Other developing Asian countries
Ostale afričke zemlje u razvoju
1 697 748 1 622 808 406 066 499 499 281 801 273 357 67 184 84 017 Other developing African countries
Ostale američke zemlje u razvoju
64 940 159 050 1 502 845 1 690 733 10 718 26 604 248 684 283 660 Other developing American countries
Ostale oceanijske zemlje u razvoju
258 501 197 389 42 85 33 64 Developing countries of Oceania
1) Vrijednosti su preračunane u kune odnosno američke dolare primjenom tekućih dnevnih tečajnih lista stranih valuta koje vrijede na dan carinjenja robe. Prosječno ostvareni tečajevi za
1 američki dolar za pojedine godine nalaze se u tablici 21-2. 2) Europska unija (Austrija, Belgija, Cipar, Češka, Danska, Estonija, Finska, Francuska, Grčka, Irska, Italija, Letonija, Litva, Luksemburg, Mađarska, Malta, Nizozemska, Njemačka, Poljska,
Portugal, Slovačka, Slovenija, Španjolska, Švedska, Ujedinjena Kraljevina) 3) Europsko udruženje za slobodnu trgovinu (Island, Lihtenštajn, Norveška, Švicarska) 4) Sporazum o slobodnoj trgovini srednjoeuropskih zemalja (Bugarska, Rumunjska) 5) Organizacija zemalja izvoznica nafte (Alžir, Indonezija, Irak, Iran, Katar, Kuvajt, Libija, Nigerija, Saudijska Arabija, Ujedinjeni Arapski Emirati, Venezuela) 1) Values were converted into kuna and US dollars by use of current foreign currency daily exchange rate lists valid on the day when customs were levied. The average exchange rates for 1
US dollar for particular years are presented in table 21-2. 2) European union (Austria, Belgium, Cyprus, Czech Republic, Denmark, Estonia, Finland, France, Greece, Ireland, Italy, Latvia, Lithuania, Luxembourg, Hungary, Malta, Netherlands,
Germany, Poland, Portugal, Slovakia, Slovenia, Spain, Sweden, United Kingdom) 3) European Free Trade Association (Island, Liechtenstein, Norway, Switzerland) 4) CEFTA - Central European Free Trade Agreement (Bulgaria, Romania) 5) OPEC - Organisation of Petroleum Exporting Countries (Algeria, Indonesia, Iraq, Iran, Qatar, Kuwait, Libya, Nigeria, Saudi Arabia, United Arab Emirates, Venezuela)
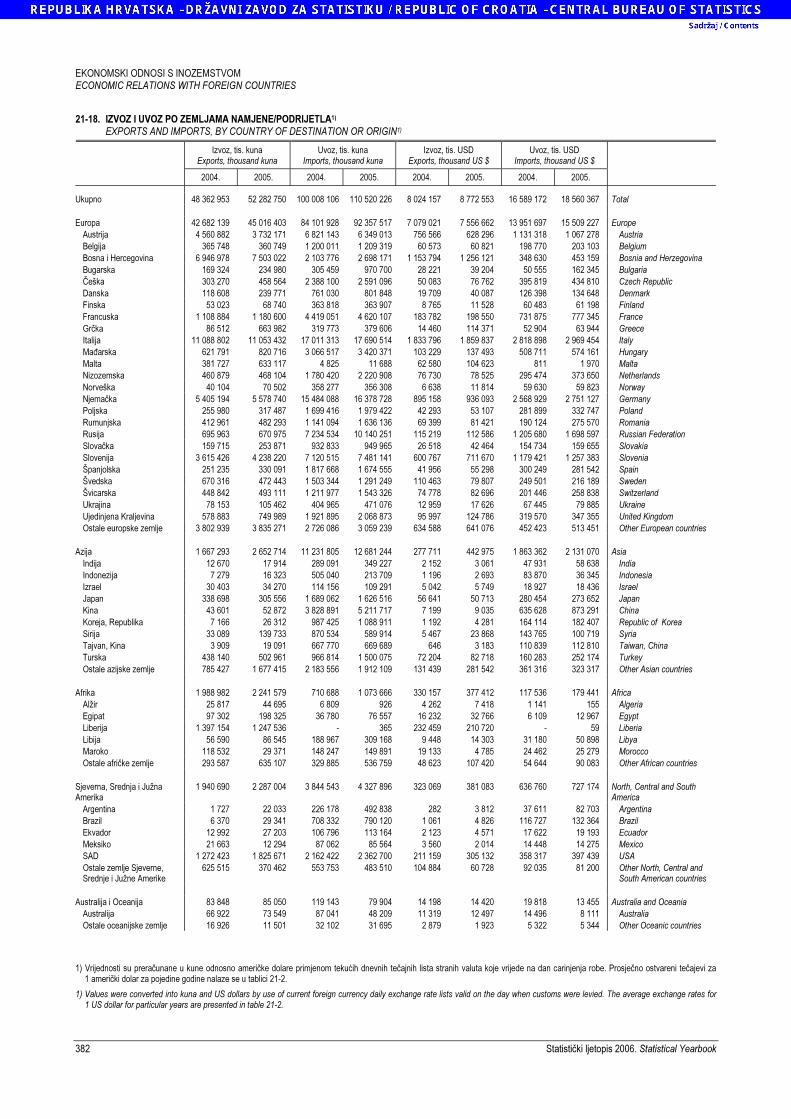
EKONOMSKI ODNOSI S INOZEMSTVOM ECONOMIC RELATIONS WITH FOREIGN COUNTRIES
382 Statistički ljetopis 2006. Statistical Yearbook
21-18. IZVOZ I UVOZ PO ZEMLJAMA NAMJENE/PODRIJETLA1) EXPORTS AND IMPORTS, BY COUNTRY OF DESTINATION OR ORIGIN1)
Izvoz, tis. kuna Exports, thousand kuna
Uvoz, tis. kuna Imports, thousand kuna
Izvoz, tis. USD Exports, thousand US $
Uvoz, tis. USD Imports, thousand US $
2004. 2005. 2004. 2005. 2004. 2005. 2004. 2005.
Ukupno 48 362 953 52 282 750 100 008 106 110 520 226 8 024 157 8 772 553 16 589 172 18 560 367 Total
Europa 42 682 139 45 016 403 84 101 928 92 357 517 7 079 021 7 556 662 13 951 697 15 509 227 Europe
Austrija 4 560 882 3 732 171 6 821 143 6 349 013 756 566 628 296 1 131 318 1 067 278 Austria
Belgija 365 748 360 749 1 200 011 1 209 319 60 573 60 821 198 770 203 103 Belgium
Bosna i Hercegovina 6 946 978 7 503 022 2 103 776 2 698 171 1 153 794 1 256 121 348 630 453 159 Bosnia and Herzegovina
Bugarska 169 324 234 980 305 459 970 700 28 221 39 204 50 555 162 345 Bulgaria
Češka 303 270 458 564 2 388 100 2 591 096 50 083 76 762 395 819 434 810 Czech Republic
Danska 118 608 239 771 761 030 801 848 19 709 40 087 126 398 134 648 Denmark
Finska 53 023 68 740 363 818 363 907 8 765 11 528 60 483 61 198 Finland
Francuska 1 108 884 1 180 600 4 419 051 4 620 107 183 782 198 550 731 875 777 345 France
Grčka 86 512 663 982 319 773 379 606 14 460 114 371 52 904 63 944 Greece
Italija 11 088 802 11 053 432 17 011 313 17 690 514 1 833 796 1 859 837 2 818 898 2 969 454 Italy
Mađarska 621 791 820 716 3 066 517 3 420 371 103 229 137 493 508 711 574 161 Hungary
Malta 381 727 633 117 4 825 11 688 62 580 104 623 811 1 970 Malta
Nizozemska 460 879 468 104 1 780 420 2 220 908 76 730 78 525 295 474 373 650 Netherlands
Norveška 40 104 70 502 358 277 356 308 6 638 11 814 59 630 59 823 Norway
Njemačka 5 405 194 5 578 740 15 484 088 16 378 728 895 158 936 093 2 568 929 2 751 127 Germany
Poljska 255 980 317 487 1 699 416 1 979 422 42 293 53 107 281 899 332 747 Poland
Rumunjska 412 961 482 293 1 141 094 1 636 136 69 399 81 421 190 124 275 570 Romania
Rusija 695 963 670 975 7 234 534 10 140 251 115 219 112 586 1 205 680 1 698 597 Russian Federation
Slovačka 159 715 253 871 932 833 949 965 26 518 42 464 154 734 159 655 Slovakia
Slovenija 3 615 426 4 238 220 7 120 515 7 481 141 600 767 711 670 1 179 421 1 257 383 Slovenia
Španjolska 251 235 330 091 1 817 668 1 674 555 41 956 55 298 300 249 281 542 Spain
Švedska 670 316 472 443 1 503 344 1 291 249 110 463 79 807 249 501 216 189 Sweden
Švicarska 448 842 493 111 1 211 977 1 543 326 74 778 82 696 201 446 258 838 Switzerland
Ukrajina 78 153 105 462 404 965 471 076 12 959 17 626 67 445 79 885 Ukraine
Ujedinjena Kraljevina 578 883 749 989 1 921 895 2 068 873 95 997 124 786 319 570 347 355 United Kingdom
Ostale europske zemlje 3 802 939 3 835 271 2 726 086 3 059 239 634 588 641 076 452 423 513 451 Other European countries
Azija 1 667 293 2 652 714 11 231 805 12 681 244 277 711 442 975 1 863 362 2 131 070 Asia
Indija 12 670 17 914 289 091 349 227 2 152 3 061 47 931 58 638 India
Indonezija 7 279 16 323 505 040 213 709 1 196 2 693 83 870 36 345 Indonesia
Izrael 30 403 34 270 114 156 109 291 5 042 5 749 18 927 18 436 Israel
Japan 338 698 305 556 1 689 062 1 626 516 56 641 50 713 280 454 273 652 Japan
Kina 43 601 52 872 3 828 891 5 211 717 7 199 9 035 635 628 873 291 China
Koreja, Republika 7 166 26 312 987 425 1 088 911 1 192 4 281 164 114 182 407 Republic of Korea
Sirija 33 089 139 733 870 534 589 914 5 467 23 868 143 765 100 719 Syria
Tajvan, Kina 3 909 19 091 667 770 669 689 646 3 183 110 839 112 810 Taiwan, China
Turska 438 140 502 961 966 814 1 500 075 72 204 82 718 160 283 252 174 Turkey
Ostale azijske zemlje 785 427 1 677 415 2 183 556 1 912 109 131 439 281 542 361 316 323 317 Other Asian countries
Afrika 1 988 982 2 241 579 710 688 1 073 666 330 157 377 412 117 536 179 441 Africa
Alžir 25 817 44 695 6 809 926 4 262 7 418 1 141 155 Algeria
Egipat 97 302 198 325 36 780 76 557 16 232 32 766 6 109 12 967 Egypt
Liberija 1 397 154 1 247 536 - 365 232 459 210 720 - 59 Liberia
Libija 56 590 86 545 188 967 309 168 9 448 14 303 31 180 50 898 Libya
Maroko 118 532 29 371 148 247 149 891 19 133 4 785 24 462 25 279 Morocco
Ostale afričke zemlje 293 587 635 107 329 885 536 759 48 623 107 420 54 644 90 083 Other African countries
Sjeverna, Srednja i Južna Amerika
1 940 690 2 287 004 3 844 543 4 327 896 323 069 381 083 636 760 727 174 North, Central and South America
Argentina 1 727 22 033 226 178 492 838 282 3 812 37 611 82 703 Argentina
Brazil 6 370 29 341 708 332 790 120 1 061 4 826 116 727 132 364 Brazil
Ekvador 12 992 27 203 106 796 113 164 2 123 4 571 17 622 19 193 Ecuador
Meksiko 21 663 12 294 87 062 85 564 3 560 2 014 14 448 14 275 Mexico
SAD 1 272 423 1 825 671 2 162 422 2 362 700 211 159 305 132 358 317 397 439 USA
Ostale zemlje Sjeverne, Srednje i Južne Amerike
625 515 370 462 553 753 483 510 104 884 60 728 92 035 81 200 Other North, Central and South American countries
Australija i Oceanija 83 848 85 050 119 143 79 904 14 198 14 420 19 818 13 455 Australia and Oceania
Australija 66 922 73 549 87 041 48 209 11 319 12 497 14 496 8 111 Australia
Ostale oceanijske zemlje 16 926 11 501 32 102 31 695 2 879 1 923 5 322 5 344 Other Oceanic countries 1) Vrijednosti su preračunane u kune odnosno američke dolare primjenom tekućih dnevnih tečajnih lista stranih valuta koje vrijede na dan carinjenja robe. Prosječno ostvareni tečajevi za
1 američki dolar za pojedine godine nalaze se u tablici 21-2.
1) Values were converted into kuna and US dollars by use of current foreign currency daily exchange rate lists valid on the day when customs were levied. The average exchange rates for 1 US dollar for particular years are presented in table 21-2.
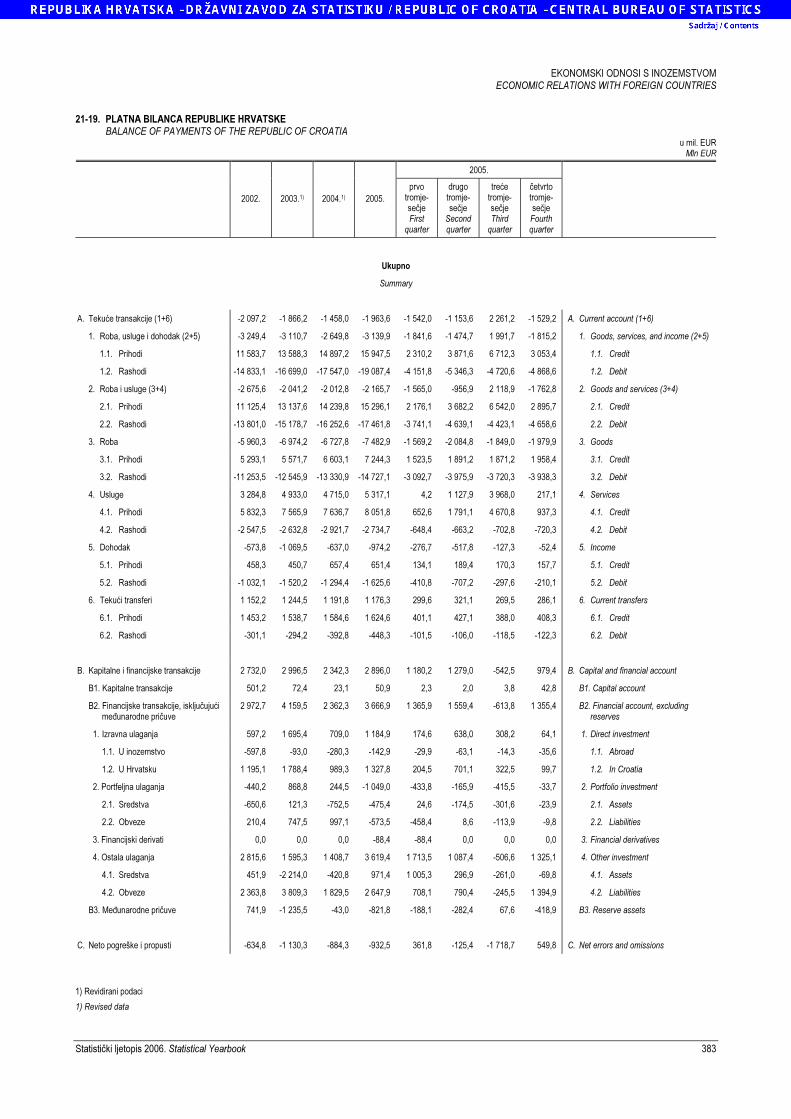
EKONOMSKI ODNOSI S INOZEMSTVOM ECONOMIC RELATIONS WITH FOREIGN COUNTRIES
Statistički ljetopis 2006. Statistical Yearbook 383
21-19. PLATNA BILANCA REPUBLIKE HRVATSKE BALANCE OF PAYMENTS OF THE REPUBLIC OF CROATIA
u mil. EUR Mln EUR
2005.
2002. 2003.1) 2004.1) 2005.
prvo tromje- sečje First
quarter
drugo tromje- sečje
Secondquarter
treće tromje- sečje Third
quarter
četvrto tromje- sečje
Fourth quarter
Ukupno
Summary
A. Tekuće transakcije (1+6) -2 097,2 -1 866,2 -1 458,0 -1 963,6 -1 542,0 -1 153,6 2 261,2 -1 529,2 A. Current account (1+6)
1. Roba, usluge i dohodak (2+5) -3 249,4 -3 110,7 -2 649,8 -3 139,9 -1 841,6 -1 474,7 1 991,7 -1 815,2 1. Goods, services, and income (2+5)
1.1. Prihodi 11 583,7 13 588,3 14 897,2 15 947,5 2 310,2 3 871,6 6 712,3 3 053,4 1.1. Credit
1.2. Rashodi -14 833,1 -16 699,0 -17 547,0 -19 087,4 -4 151,8 -5 346,3 -4 720,6 -4 868,6 1.2. Debit
2. Roba i usluge (3+4) -2 675,6 -2 041,2 -2 012,8 -2 165,7 -1 565,0 -956,9 2 118,9 -1 762,8 2. Goods and services (3+4)
2.1. Prihodi 11 125,4 13 137,6 14 239,8 15 296,1 2 176,1 3 682,2 6 542,0 2 895,7 2.1. Credit
2.2. Rashodi -13 801,0 -15 178,7 -16 252,6 -17 461,8 -3 741,1 -4 639,1 -4 423,1 -4 658,6 2.2. Debit
3. Roba -5 960,3 -6 974,2 -6 727,8 -7 482,9 -1 569,2 -2 084,8 -1 849,0 -1 979,9 3. Goods
3.1. Prihodi 5 293,1 5 571,7 6 603,1 7 244,3 1 523,5 1 891,2 1 871,2 1 958,4 3.1. Credit
3.2. Rashodi -11 253,5 -12 545,9 -13 330,9 -14 727,1 -3 092,7 -3 975,9 -3 720,3 -3 938,3 3.2. Debit
4. Usluge 3 284,8 4 933,0 4 715,0 5 317,1 4,2 1 127,9 3 968,0 217,1 4. Services
4.1. Prihodi 5 832,3 7 565,9 7 636,7 8 051,8 652,6 1 791,1 4 670,8 937,3 4.1. Credit
4.2. Rashodi -2 547,5 -2 632,8 -2 921,7 -2 734,7 -648,4 -663,2 -702,8 -720,3 4.2. Debit
5. Dohodak -573,8 -1 069,5 -637,0 -974,2 -276,7 -517,8 -127,3 -52,4 5. Income
5.1. Prihodi 458,3 450,7 657,4 651,4 134,1 189,4 170,3 157,7 5.1. Credit
5.2. Rashodi -1 032,1 -1 520,2 -1 294,4 -1 625,6 -410,8 -707,2 -297,6 -210,1 5.2. Debit
6. Tekući transferi 1 152,2 1 244,5 1 191,8 1 176,3 299,6 321,1 269,5 286,1 6. Current transfers
6.1. Prihodi 1 453,2 1 538,7 1 584,6 1 624,6 401,1 427,1 388,0 408,3 6.1. Credit
6.2. Rashodi -301,1 -294,2 -392,8 -448,3 -101,5 -106,0 -118,5 -122,3 6.2. Debit
B. Kapitalne i financijske transakcije 2 732,0 2 996,5 2 342,3 2 896,0 1 180,2 1 279,0 -542,5 979,4 B. Capital and financial account
B1. Kapitalne transakcije 501,2 72,4 23,1 50,9 2,3 2,0 3,8 42,8 B1. Capital account
B2. Financijske transakcije, isključujući međunarodne pričuve
2 972,7 4 159,5 2 362,3 3 666,9 1 365,9 1 559,4 -613,8 1 355,4 B2. Financial account, excluding reserves
1. Izravna ulaganja 597,2 1 695,4 709,0 1 184,9 174,6 638,0 308,2 64,1 1. Direct investment
1.1. U inozemstvo -597,8 -93,0 -280,3 -142,9 -29,9 -63,1 -14,3 -35,6 1.1. Abroad
1.2. U Hrvatsku 1 195,1 1 788,4 989,3 1 327,8 204,5 701,1 322,5 99,7 1.2. In Croatia
2. Portfeljna ulaganja -440,2 868,8 244,5 -1 049,0 -433,8 -165,9 -415,5 -33,7 2. Portfolio investment
2.1. Sredstva -650,6 121,3 -752,5 -475,4 24,6 -174,5 -301,6 -23,9 2.1. Assets
2.2. Obveze 210,4 747,5 997,1 -573,5 -458,4 8,6 -113,9 -9,8 2.2. Liabilities
3. Financijski derivati 0,0 0,0 0,0 -88,4 -88,4 0,0 0,0 0,0 3. Financial derivatives
4. Ostala ulaganja 2 815,6 1 595,3 1 408,7 3 619,4 1 713,5 1 087,4 -506,6 1 325,1 4. Other investment
4.1. Sredstva 451,9 -2 214,0 -420,8 971,4 1 005,3 296,9 -261,0 -69,8 4.1. Assets
4.2. Obveze 2 363,8 3 809,3 1 829,5 2 647,9 708,1 790,4 -245,5 1 394,9 4.2. Liabilities
B3. Međunarodne pričuve 741,9 -1 235,5 -43,0 -821,8 -188,1 -282,4 67,6 -418,9 B3. Reserve assets
C. Neto pogreške i propusti -634,8 -1 130,3 -884,3 -932,5 361,8 -125,4 -1 718,7 549,8 C. Net errors and omissions
1) Revidirani podaci
1) Revised data
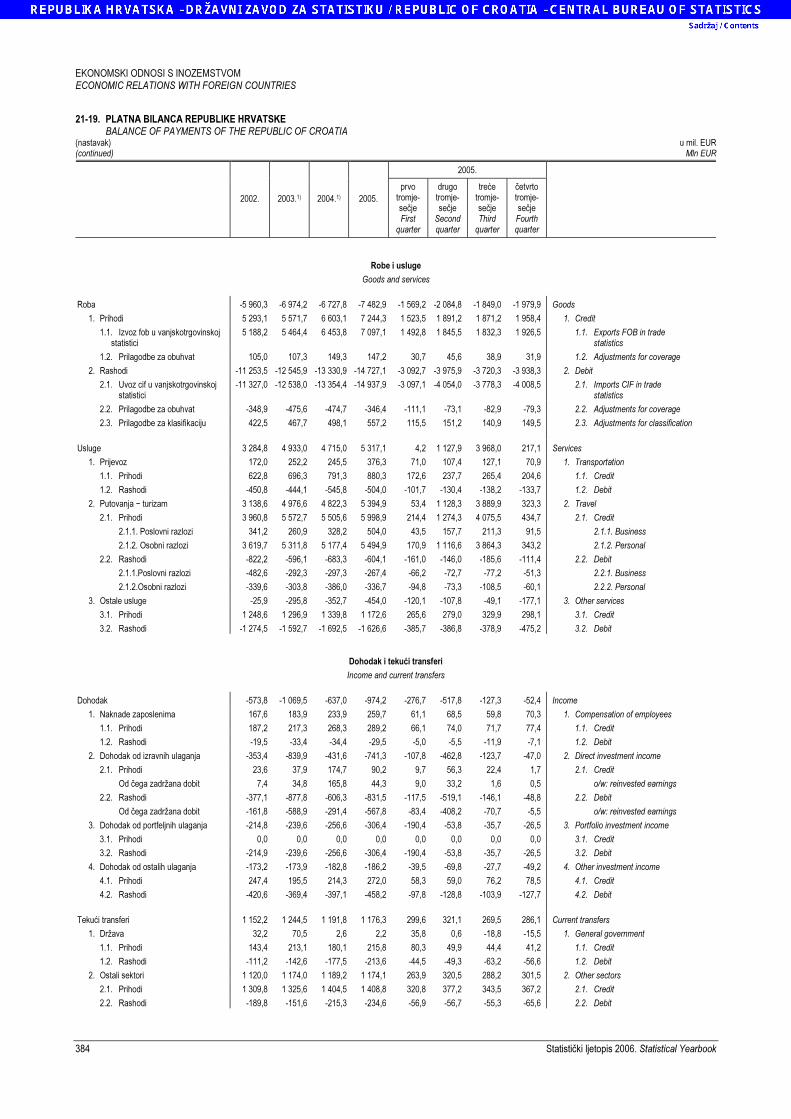
EKONOMSKI ODNOSI S INOZEMSTVOM ECONOMIC RELATIONS WITH FOREIGN COUNTRIES
384 Statistički ljetopis 2006. Statistical Yearbook
21-19. PLATNA BILANCA REPUBLIKE HRVATSKE BALANCE OF PAYMENTS OF THE REPUBLIC OF CROATIA (nastavak) u mil. EUR (continued) Mln EUR
2005.
2002. 2003.1) 2004.1) 2005.
prvo tromje-sečje First
quarter
drugo tromje-sečje
Secondquarter
treće tromje-sečje Third
quarter
četvrtotromje-sečje
Fourthquarter
Robe i usluge
Goods and services
Roba -5 960,3 -6 974,2 -6 727,8 -7 482,9 -1 569,2 -2 084,8 -1 849,0 -1 979,9 Goods
1. Prihodi 5 293,1 5 571,7 6 603,1 7 244,3 1 523,5 1 891,2 1 871,2 1 958,4 1. Credit
1.1. Izvoz fob u vanjskotrgovinskoj statistici
5 188,2 5 464,4 6 453,8 7 097,1 1 492,8 1 845,5 1 832,3 1 926,5 1.1. Exports FOB in trade statistics
1.2. Prilagodbe za obuhvat 105,0 107,3 149,3 147,2 30,7 45,6 38,9 31,9 1.2. Adjustments for coverage
2. Rashodi -11 253,5 -12 545,9 -13 330,9 -14 727,1 -3 092,7 -3 975,9 -3 720,3 -3 938,3 2. Debit
2.1. Uvoz cif u vanjskotrgovinskoj statistici
-11 327,0 -12 538,0 -13 354,4 -14 937,9 -3 097,1 -4 054,0 -3 778,3 -4 008,5 2.1. Imports CIF in trade statistics
2.2. Prilagodbe za obuhvat -348,9 -475,6 -474,7 -346,4 -111,1 -73,1 -82,9 -79,3 2.2. Adjustments for coverage
2.3. Prilagodbe za klasifikaciju 422,5 467,7 498,1 557,2 115,5 151,2 140,9 149,5 2.3. Adjustments for classification
Usluge 3 284,8 4 933,0 4 715,0 5 317,1 4,2 1 127,9 3 968,0 217,1 Services
1. Prijevoz 172,0 252,2 245,5 376,3 71,0 107,4 127,1 70,9 1. Transportation
1.1. Prihodi 622,8 696,3 791,3 880,3 172,6 237,7 265,4 204,6 1.1. Credit
1.2. Rashodi -450,8 -444,1 -545,8 -504,0 -101,7 -130,4 -138,2 -133,7 1.2. Debit
2. Putovanja − turizam 3 138,6 4 976,6 4 822,3 5 394,9 53,4 1 128,3 3 889,9 323,3 2. Travel
2.1. Prihodi 3 960,8 5 572,7 5 505,6 5 998,9 214,4 1 274,3 4 075,5 434,7 2.1. Credit
2.1.1. Poslovni razlozi 341,2 260,9 328,2 504,0 43,5 157,7 211,3 91,5 2.1.1. Business
2.1.2. Osobni razlozi 3 619,7 5 311,8 5 177,4 5 494,9 170,9 1 116,6 3 864,3 343,2 2.1.2. Personal
2.2. Rashodi -822,2 -596,1 -683,3 -604,1 -161,0 -146,0 -185,6 -111,4 2.2. Debit
2.1.1.Poslovni razlozi -482,6 -292,3 -297,3 -267,4 -66,2 -72,7 -77,2 -51,3 2.2.1. Business
2.1.2.Osobni razlozi -339,6 -303,8 -386,0 -336,7 -94,8 -73,3 -108,5 -60,1 2.2.2. Personal
3. Ostale usluge -25,9 -295,8 -352,7 -454,0 -120,1 -107,8 -49,1 -177,1 3. Other services
3.1. Prihodi 1 248,6 1 296,9 1 339,8 1 172,6 265,6 279,0 329,9 298,1 3.1. Credit
3.2. Rashodi -1 274,5 -1 592,7 -1 692,5 -1 626,6 -385,7 -386,8 -378,9 -475,2 3.2. Debit
Dohodak i tekući transferi
Income and current transfers
Dohodak -573,8 -1 069,5 -637,0 -974,2 -276,7 -517,8 -127,3 -52,4 Income
1. Naknade zaposlenima 167,6 183,9 233,9 259,7 61,1 68,5 59,8 70,3 1. Compensation of employees
1.1. Prihodi 187,2 217,3 268,3 289,2 66,1 74,0 71,7 77,4 1.1. Credit
1.2. Rashodi -19,5 -33,4 -34,4 -29,5 -5,0 -5,5 -11,9 -7,1 1.2. Debit
2. Dohodak od izravnih ulaganja -353,4 -839,9 -431,6 -741,3 -107,8 -462,8 -123,7 -47,0 2. Direct investment income
2.1. Prihodi 23,6 37,9 174,7 90,2 9,7 56,3 22,4 1,7 2.1. Credit
Od čega zadržana dobit 7,4 34,8 165,8 44,3 9,0 33,2 1,6 0,5 o/w: reinvested earnings
2.2. Rashodi -377,1 -877,8 -606,3 -831,5 -117,5 -519,1 -146,1 -48,8 2.2. Debit
Od čega zadržana dobit -161,8 -588,9 -291,4 -567,8 -83,4 -408,2 -70,7 -5,5 o/w: reinvested earnings
3. Dohodak od portfeljnih ulaganja -214,8 -239,6 -256,6 -306,4 -190,4 -53,8 -35,7 -26,5 3. Portfolio investment income
3.1. Prihodi 0,0 0,0 0,0 0,0 0,0 0,0 0,0 0,0 3.1. Credit
3.2. Rashodi -214,9 -239,6 -256,6 -306,4 -190,4 -53,8 -35,7 -26,5 3.2. Debit
4. Dohodak od ostalih ulaganja -173,2 -173,9 -182,8 -186,2 -39,5 -69,8 -27,7 -49,2 4. Other investment income
4.1. Prihodi 247,4 195,5 214,3 272,0 58,3 59,0 76,2 78,5 4.1. Credit
4.2. Rashodi -420,6 -369,4 -397,1 -458,2 -97,8 -128,8 -103,9 -127,7 4.2. Debit
Tekući transferi 1 152,2 1 244,5 1 191,8 1 176,3 299,6 321,1 269,5 286,1 Current transfers
1. Država 32,2 70,5 2,6 2,2 35,8 0,6 -18,8 -15,5 1. General government
1.1. Prihodi 143,4 213,1 180,1 215,8 80,3 49,9 44,4 41,2 1.1. Credit
1.2. Rashodi -111,2 -142,6 -177,5 -213,6 -44,5 -49,3 -63,2 -56,6 1.2. Debit
2. Ostali sektori 1 120,0 1 174,0 1 189,2 1 174,1 263,9 320,5 288,2 301,5 2. Other sectors
2.1. Prihodi 1 309,8 1 325,6 1 404,5 1 408,8 320,8 377,2 343,5 367,2 2.1. Credit
2.2. Rashodi -189,8 -151,6 -215,3 -234,6 -56,9 -56,7 -55,3 -65,6 2.2. Debit
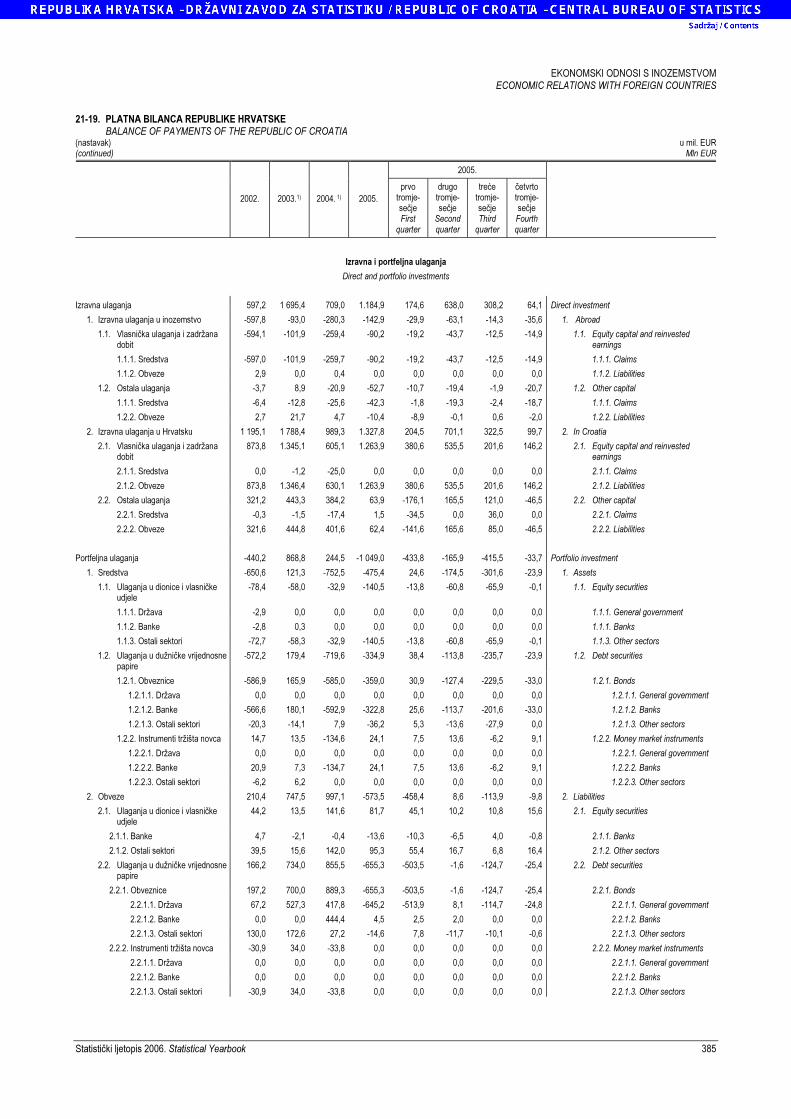
EKONOMSKI ODNOSI S INOZEMSTVOM ECONOMIC RELATIONS WITH FOREIGN COUNTRIES
Statistički ljetopis 2006. Statistical Yearbook 385
21-19. PLATNA BILANCA REPUBLIKE HRVATSKE BALANCE OF PAYMENTS OF THE REPUBLIC OF CROATIA (nastavak) u mil. EUR (continued) Mln EUR
2005.
2002. 2003.1) 2004. 1) 2005.
prvo tromje-sečje First
quarter
drugo tromje-sečje
Secondquarter
treće tromje-sečje Third
quarter
četvrtotromje-sečje
Fourthquarter
Izravna i portfeljna ulaganja
Direct and portfolio investments
Izravna ulaganja 597,2 1 695,4 709,0 1.184,9 174,6 638,0 308,2 64,1 Direct investment
1. Izravna ulaganja u inozemstvo -597,8 -93,0 -280,3 -142,9 -29,9 -63,1 -14,3 -35,6 1. Abroad
1.1. Vlasnička ulaganja i zadržana dobit
-594,1 -101,9 -259,4 -90,2 -19,2 -43,7 -12,5 -14,9 1.1. Equity capital and reinvested earnings
1.1.1. Sredstva -597,0 -101,9 -259,7 -90,2 -19,2 -43,7 -12,5 -14,9 1.1.1. Claims
1.1.2. Obveze 2,9 0,0 0,4 0,0 0,0 0,0 0,0 0,0 1.1.2. Liabilities
1.2. Ostala ulaganja -3,7 8,9 -20,9 -52,7 -10,7 -19,4 -1,9 -20,7 1.2. Other capital
1.1.1. Sredstva -6,4 -12,8 -25,6 -42,3 -1,8 -19,3 -2,4 -18,7 1.1.1. Claims
1.2.2. Obveze 2,7 21,7 4,7 -10,4 -8,9 -0,1 0,6 -2,0 1.2.2. Liabilities
2. Izravna ulaganja u Hrvatsku 1 195,1 1 788,4 989,3 1.327,8 204,5 701,1 322,5 99,7 2. In Croatia
2.1. Vlasnička ulaganja i zadržana dobit
873,8 1.345,1 605,1 1.263,9 380,6 535,5 201,6 146,2 2.1. Equity capital and reinvested earnings
2.1.1. Sredstva 0,0 -1,2 -25,0 0,0 0,0 0,0 0,0 0,0 2.1.1. Claims
2.1.2. Obveze 873,8 1.346,4 630,1 1.263,9 380,6 535,5 201,6 146,2 2.1.2. Liabilities
2.2. Ostala ulaganja 321,2 443,3 384,2 63,9 -176,1 165,5 121,0 -46,5 2.2. Other capital
2.2.1. Sredstva -0,3 -1,5 -17,4 1,5 -34,5 0,0 36,0 0,0 2.2.1. Claims
2.2.2. Obveze 321,6 444,8 401,6 62,4 -141,6 165,6 85,0 -46,5 2.2.2. Liabilities
Portfeljna ulaganja -440,2 868,8 244,5 -1 049,0 -433,8 -165,9 -415,5 -33,7 Portfolio investment
1. Sredstva -650,6 121,3 -752,5 -475,4 24,6 -174,5 -301,6 -23,9 1. Assets
1.1. Ulaganja u dionice i vlasničke udjele
-78,4 -58,0 -32,9 -140,5 -13,8 -60,8 -65,9 -0,1 1.1. Equity securities
1.1.1. Država -2,9 0,0 0,0 0,0 0,0 0,0 0,0 0,0 1.1.1. General government
1.1.2. Banke -2,8 0,3 0,0 0,0 0,0 0,0 0,0 0,0 1.1.1. Banks
1.1.3. Ostali sektori -72,7 -58,3 -32,9 -140,5 -13,8 -60,8 -65,9 -0,1 1.1.3. Other sectors
1.2. Ulaganja u dužničke vrijednosne papire
-572,2 179,4 -719,6 -334,9 38,4 -113,8 -235,7 -23,9 1.2. Debt securities
1.2.1. Obveznice -586,9 165,9 -585,0 -359,0 30,9 -127,4 -229,5 -33,0 1.2.1. Bonds
1.2.1.1. Država 0,0 0,0 0,0 0,0 0,0 0,0 0,0 0,0 1.2.1.1. General government
1.2.1.2. Banke -566,6 180,1 -592,9 -322,8 25,6 -113,7 -201,6 -33,0 1.2.1.2. Banks
1.2.1.3. Ostali sektori -20,3 -14,1 7,9 -36,2 5,3 -13,6 -27,9 0,0 1.2.1.3. Other sectors
1.2.2. Instrumenti tržišta novca 14,7 13,5 -134,6 24,1 7,5 13,6 -6,2 9,1 1.2.2. Money market instruments
1.2.2.1. Država 0,0 0,0 0,0 0,0 0,0 0,0 0,0 0,0 1.2.2.1. General government
1.2.2.2. Banke 20,9 7,3 -134,7 24,1 7,5 13,6 -6,2 9,1 1.2.2.2. Banks
1.2.2.3. Ostali sektori -6,2 6,2 0,0 0,0 0,0 0,0 0,0 0,0 1.2.2.3. Other sectors
2. Obveze 210,4 747,5 997,1 -573,5 -458,4 8,6 -113,9 -9,8 2. Liabilities
2.1. Ulaganja u dionice i vlasničke udjele
44,2 13,5 141,6 81,7 45,1 10,2 10,8 15,6 2.1. Equity securities
2.1.1. Banke 4,7 -2,1 -0,4 -13,6 -10,3 -6,5 4,0 -0,8 2.1.1. Banks
2.1.2. Ostali sektori 39,5 15,6 142,0 95,3 55,4 16,7 6,8 16,4 2.1.2. Other sectors
2.2. Ulaganja u dužničke vrijednosne papire
166,2 734,0 855,5 -655,3 -503,5 -1,6 -124,7 -25,4 2.2. Debt securities
2.2.1. Obveznice 197,2 700,0 889,3 -655,3 -503,5 -1,6 -124,7 -25,4 2.2.1. Bonds
2.2.1.1. Država 67,2 527,3 417,8 -645,2 -513,9 8,1 -114,7 -24,8 2.2.1.1. General government
2.2.1.2. Banke 0,0 0,0 444,4 4,5 2,5 2,0 0,0 0,0 2.2.1.2. Banks
2.2.1.3. Ostali sektori 130,0 172,6 27,2 -14,6 7,8 -11,7 -10,1 -0,6 2.2.1.3. Other sectors
2.2.2. Instrumenti tržišta novca -30,9 34,0 -33,8 0,0 0,0 0,0 0,0 0,0 2.2.2. Money market instruments
2.2.1.1. Država 0,0 0,0 0,0 0,0 0,0 0,0 0,0 0,0 2.2.1.1. General government
2.2.1.2. Banke 0,0 0,0 0,0 0,0 0,0 0,0 0,0 0,0 2.2.1.2. Banks
2.2.1.3. Ostali sektori -30,9 34,0 -33,8 0,0 0,0 0,0 0,0 0,0 2.2.1.3. Other sectors
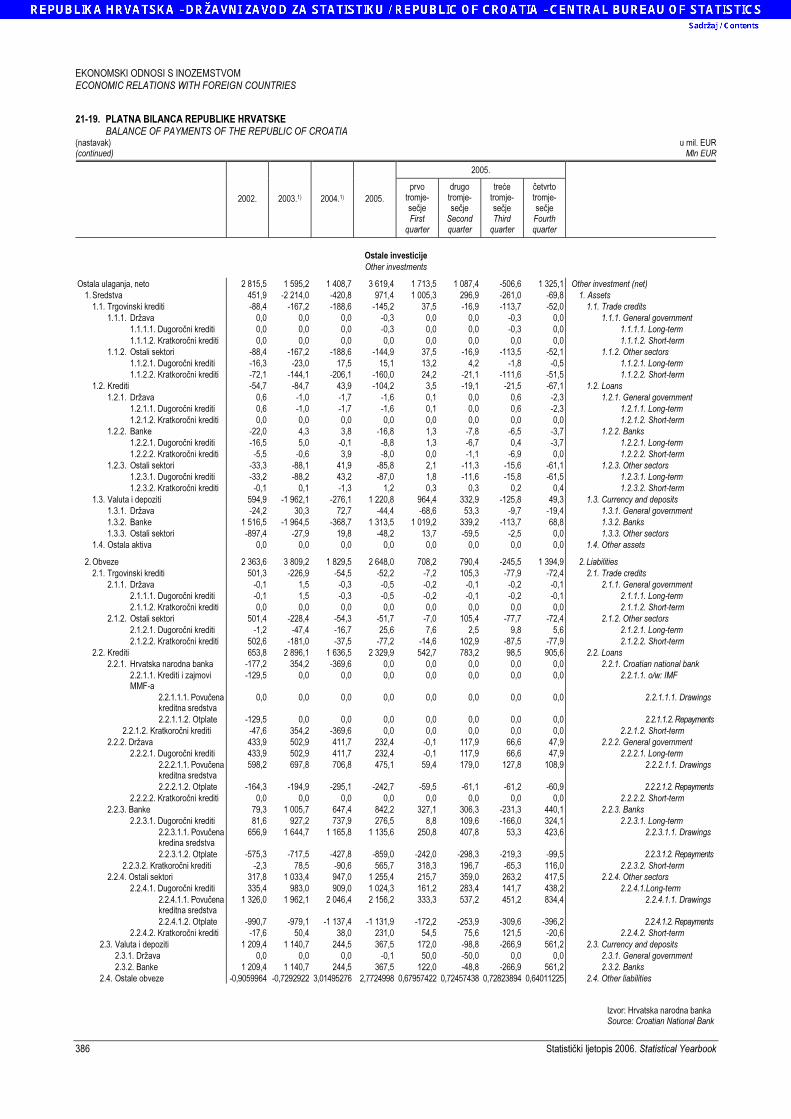
EKONOMSKI ODNOSI S INOZEMSTVOM ECONOMIC RELATIONS WITH FOREIGN COUNTRIES
386 Statistički ljetopis 2006. Statistical Yearbook
21-19. PLATNA BILANCA REPUBLIKE HRVATSKE BALANCE OF PAYMENTS OF THE REPUBLIC OF CROATIA (nastavak) u mil. EUR (continued) Mln EUR
2005.
2002. 2003.1) 2004.1) 2005.
prvo tromje- sečje First
quarter
drugo tromje- sečje
Secondquarter
treće tromje- sečje Third
quarter
četvrto tromje- sečje
Fourth quarter
Ostale investicije
Other investments
Ostala ulaganja, neto 2 815,5 1 595,2 1 408,7 3 619,4 1 713,5 1 087,4 -506,6 1 325,1 Other investment (net)
1. Sredstva 451,9 -2 214,0 -420,8 971,4 1 005,3 296,9 -261,0 -69,8 1. Assets
1.1. Trgovinski krediti -88,4 -167,2 -188,6 -145,2 37,5 -16,9 -113,7 -52,0 1.1. Trade credits
1.1.1. Država 0,0 0,0 0,0 -0,3 0,0 0,0 -0,3 0,0 1.1.1. General government
1.1.1.1. Dugoročni krediti 0,0 0,0 0,0 -0,3 0,0 0,0 -0,3 0,0 1.1.1.1. Long-term
1.1.1.2. Kratkoročni krediti 0,0 0,0 0,0 0,0 0,0 0,0 0,0 0,0 1.1.1.2. Short-term
1.1.2. Ostali sektori -88,4 -167,2 -188,6 -144,9 37,5 -16,9 -113,5 -52,1 1.1.2. Other sectors
1.1.2.1. Dugoročni krediti -16,3 -23,0 17,5 15,1 13,2 4,2 -1,8 -0,5 1.1.2.1. Long-term
1.1.2.2. Kratkoročni krediti -72,1 -144,1 -206,1 -160,0 24,2 -21,1 -111,6 -51,5 1.1.2.2. Short-term
1.2. Krediti -54,7 -84,7 43,9 -104,2 3,5 -19,1 -21,5 -67,1 1.2. Loans
1.2.1. Država 0,6 -1,0 -1,7 -1,6 0,1 0,0 0,6 -2,3 1.2.1. General government
1.2.1.1. Dugoročni krediti 0,6 -1,0 -1,7 -1,6 0,1 0,0 0,6 -2,3 1.2.1.1. Long-term
1.2.1.2. Kratkoročni krediti 0,0 0,0 0,0 0,0 0,0 0,0 0,0 0,0 1.2.1.2. Short-term
1.2.2. Banke -22,0 4,3 3,8 -16,8 1,3 -7,8 -6,5 -3,7 1.2.2. Banks
1.2.2.1. Dugoročni krediti -16,5 5,0 -0,1 -8,8 1,3 -6,7 0,4 -3,7 1.2.2.1. Long-term
1.2.2.2. Kratkoročni krediti -5,5 -0,6 3,9 -8,0 0,0 -1,1 -6,9 0,0 1.2.2.2. Short-term
1.2.3. Ostali sektori -33,3 -88,1 41,9 -85,8 2,1 -11,3 -15,6 -61,1 1.2.3. Other sectors
1.2.3.1. Dugoročni krediti -33,2 -88,2 43,2 -87,0 1,8 -11,6 -15,8 -61,5 1.2.3.1. Long-term
1.2.3.2. Kratkoročni krediti -0,1 0,1 -1,3 1,2 0,3 0,3 0,2 0,4 1.2.3.2. Short-term
1.3. Valuta i depoziti 594,9 -1 962,1 -276,1 1 220,8 964,4 332,9 -125,8 49,3 1.3. Currency and deposits
1.3.1. Država -24,2 30,3 72,7 -44,4 -68,6 53,3 -9,7 -19,4 1.3.1. General government
1.3.2. Banke 1 516,5 -1 964,5 -368,7 1 313,5 1 019,2 339,2 -113,7 68,8 1.3.2. Banks
1.3.3. Ostali sektori -897,4 -27,9 19,8 -48,2 13,7 -59,5 -2,5 0,0 1.3.3. Other sectors
1.4. Ostala aktiva 0,0 0,0 0,0 0,0 0,0 0,0 0,0 0,0 1.4. Other assets
2. Obveze 2 363,6 3 809,2 1 829,5 2 648,0 708,2 790,4 -245,5 1 394,9 2. Liabilities
2.1. Trgovinski krediti 501,3 -226,9 -54,5 -52,2 -7,2 105,3 -77,9 -72,4 2.1. Trade credits
2.1.1. Država -0,1 1,5 -0,3 -0,5 -0,2 -0,1 -0,2 -0,1 2.1.1. General government
2.1.1.1. Dugoročni krediti -0,1 1,5 -0,3 -0,5 -0,2 -0,1 -0,2 -0,1 2.1.1.1. Long-term
2.1.1.2. Kratkoročni krediti 0,0 0,0 0,0 0,0 0,0 0,0 0,0 0,0 2.1.1.2. Short-term
2.1.2. Ostali sektori 501,4 -228,4 -54,3 -51,7 -7,0 105,4 -77,7 -72,4 2.1.2. Other sectors
2.1.2.1. Dugoročni krediti -1,2 -47,4 -16,7 25,6 7,6 2,5 9,8 5,6 2.1.2.1. Long-term
2.1.2.2. Kratkoročni krediti 502,6 -181,0 -37,5 -77,2 -14,6 102,9 -87,5 -77,9 2.1.2.2. Short-term
2.2. Krediti 653,8 2 896,1 1 636,5 2 329,9 542,7 783,2 98,5 905,6 2.2. Loans
2.2.1. Hrvatska narodna banka -177,2 354,2 -369,6 0,0 0,0 0,0 0,0 0,0 2.2.1. Croatian national bank
2.2.1.1. Krediti i zajmovi MMF-a
-129,5 0,0 0,0 0,0 0,0 0,0 0,0 0,0 2.2.1.1. o/w: IMF
2.2.1.1.1. Povučena kreditna sredstva
0,0 0,0 0,0 0,0 0,0 0,0 0,0 0,0 2.2.1.1.1. Drawings
2.2.1.1.2. Otplate -129,5 0,0 0,0 0,0 0,0 0,0 0,0 0,0 2.2.1.1.2. Repayments
2.2.1.2. Kratkoročni krediti -47,6 354,2 -369,6 0,0 0,0 0,0 0,0 0,0 2.2.1.2. Short-term
2.2.2. Država 433,9 502,9 411,7 232,4 -0,1 117,9 66,6 47,9 2.2.2. General government
2.2.2.1. Dugoročni krediti 433,9 502,9 411,7 232,4 -0,1 117,9 66,6 47,9 2.2.2.1. Long-term
2.2.2.1.1. Povučena kreditna sredstva
598,2 697,8 706,8 475,1 59,4 179,0 127,8 108,9 2.2.2.1.1. Drawings
2.2.2.1.2. Otplate -164,3 -194,9 -295,1 -242,7 -59,5 -61,1 -61,2 -60,9 2.2.2.1.2. Repayments
2.2.2.2. Kratkoročni krediti 0,0 0,0 0,0 0,0 0,0 0,0 0,0 0,0 2.2.2.2. Short-term
2.2.3. Banke 79,3 1 005,7 647,4 842,2 327,1 306,3 -231,3 440,1 2.2.3. Banks
2.2.3.1. Dugoročni krediti 81,6 927,2 737,9 276,5 8,8 109,6 -166,0 324,1 2.2.3.1. Long-term
2.2.3.1.1. Povučena kredina sredstva
656,9 1 644,7 1 165,8 1 135,6 250,8 407,8 53,3 423,6 2.2.3.1.1. Drawings
2.2.3.1.2. Otplate -575,3 -717,5 -427,8 -859,0 -242,0 -298,3 -219,3 -99,5 2.2.3.1.2. Repayments
2.2.3.2. Kratkoročni krediti -2,3 78,5 -90,6 565,7 318,3 196,7 -65,3 116,0 2.2.3.2. Short-term
2.2.4. Ostali sektori 317,8 1 033,4 947,0 1 255,4 215,7 359,0 263,2 417,5 2.2.4. Other sectors
2.2.4.1. Dugoročni krediti 335,4 983,0 909,0 1 024,3 161,2 283,4 141,7 438,2 2.2.4.1.Long-term
2.2.4.1.1. Povučena kreditna sredstva
1 326,0 1 962,1 2 046,4 2 156,2 333,3 537,2 451,2 834,4 2.2.4.1.1. Drawings
2.2.4.1.2. Otplate -990,7 -979,1 -1 137,4 -1 131,9 -172,2 -253,9 -309,6 -396,2 2.2.4.1.2. Repayments
2.2.4.2. Kratkoročni krediti -17,6 50,4 38,0 231,0 54,5 75,6 121,5 -20,6 2.2.4.2. Short-term
2.3. Valuta i depoziti 1 209,4 1 140,7 244,5 367,5 172,0 -98,8 -266,9 561,2 2.3. Currency and deposits
2.3.1. Država 0,0 0,0 0,0 -0,1 50,0 -50,0 0,0 0,0 2.3.1. General government
2.3.2. Banke 1 209,4 1 140,7 244,5 367,5 122,0 -48,8 -266,9 561,2 2.3.2. Banks
2.4. Ostale obveze -0,9059964 -0,7292922 3,01495276 2,7724998 0,67957422 0,72457438 0,72823894 0,64011225 2.4. Other liabilities Izvor: Hrvatska narodna banka Source: Croatian National Bank
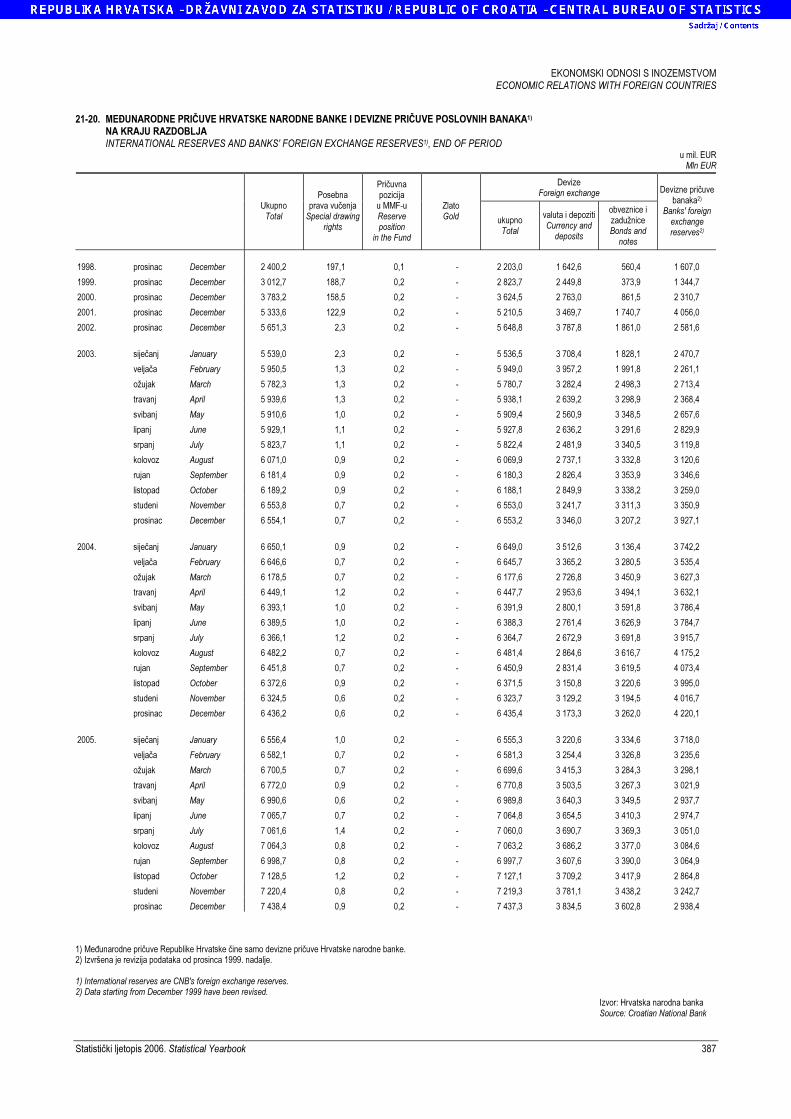
EKONOMSKI ODNOSI S INOZEMSTVOM ECONOMIC RELATIONS WITH FOREIGN COUNTRIES
Statistički ljetopis 2006. Statistical Yearbook 387
21-20. MEĐUNARODNE PRIČUVE HRVATSKE NARODNE BANKE I DEVIZNE PRIČUVE POSLOVNIH BANAKA1) NA KRAJU RAZDOBLJA INTERNATIONAL RESERVES AND BANKS' FOREIGN EXCHANGE RESERVES1), END OF PERIOD
u mil. EUR Mln EUR
Devize Foreign exchange
Ukupno
Total
Posebna prava vučenja
Special drawingrights
Pričuvna pozicija
u MMF-u Reserve position
in the Fund
Zlato Gold ukupno
Total
valuta i depoziti Currency and
deposits
obveznice i zadužnice Bonds and
notes
Devizne pričuvebanaka2)
Banks' foreignexchange reserves2)
1998. prosinac December 2 400,2 197,1 0,1 - 2 203,0 1 642,6 560,4 1 607,0
1999. prosinac December 3 012,7 188,7 0,2 - 2 823,7 2 449,8 373,9 1 344,7
2000. prosinac December 3 783,2 158,5 0,2 - 3 624,5 2 763,0 861,5 2 310,7
2001. prosinac December 5 333,6 122,9 0,2 - 5 210,5 3 469,7 1 740,7 4 056,0
2002. prosinac December 5 651,3 2,3 0,2 - 5 648,8 3 787,8 1 861,0 2 581,6
2003. siječanj January 5 539,0 2,3 0,2 - 5 536,5 3 708,4 1 828,1 2 470,7
veljača February 5 950,5 1,3 0,2 - 5 949,0 3 957,2 1 991,8 2 261,1
ožujak March 5 782,3 1,3 0,2 - 5 780,7 3 282,4 2 498,3 2 713,4
travanj April 5 939,6 1,3 0,2 - 5 938,1 2 639,2 3 298,9 2 368,4
svibanj May 5 910,6 1,0 0,2 - 5 909,4 2 560,9 3 348,5 2 657,6
lipanj June 5 929,1 1,1 0,2 - 5 927,8 2 636,2 3 291,6 2 829,9
srpanj July 5 823,7 1,1 0,2 - 5 822,4 2 481,9 3 340,5 3 119,8
kolovoz August 6 071,0 0,9 0,2 - 6 069,9 2 737,1 3 332,8 3 120,6
rujan September 6 181,4 0,9 0,2 - 6 180,3 2 826,4 3 353,9 3 346,6
listopad October 6 189,2 0,9 0,2 - 6 188,1 2 849,9 3 338,2 3 259,0
studeni November 6 553,8 0,7 0,2 - 6 553,0 3 241,7 3 311,3 3 350,9
prosinac December 6 554,1 0,7 0,2 - 6 553,2 3 346,0 3 207,2 3 927,1
2004. siječanj January 6 650,1 0,9 0,2 - 6 649,0 3 512,6 3 136,4 3 742,2
veljača February 6 646,6 0,7 0,2 - 6 645,7 3 365,2 3 280,5 3 535,4
ožujak March 6 178,5 0,7 0,2 - 6 177,6 2 726,8 3 450,9 3 627,3
travanj April 6 449,1 1,2 0,2 - 6 447,7 2 953,6 3 494,1 3 632,1
svibanj May 6 393,1 1,0 0,2 - 6 391,9 2 800,1 3 591,8 3 786,4
lipanj June 6 389,5 1,0 0,2 - 6 388,3 2 761,4 3 626,9 3 784,7
srpanj July 6 366,1 1,2 0,2 - 6 364,7 2 672,9 3 691,8 3 915,7
kolovoz August 6 482,2 0,7 0,2 - 6 481,4 2 864,6 3 616,7 4 175,2
rujan September 6 451,8 0,7 0,2 - 6 450,9 2 831,4 3 619,5 4 073,4
listopad October 6 372,6 0,9 0,2 - 6 371,5 3 150,8 3 220,6 3 995,0
studeni November 6 324,5 0,6 0,2 - 6 323,7 3 129,2 3 194,5 4 016,7
prosinac December 6 436,2 0,6 0,2 - 6 435,4 3 173,3 3 262,0 4 220,1
2005. siječanj January 6 556,4 1,0 0,2 - 6 555,3 3 220,6 3 334,6 3 718,0
veljača February 6 582,1 0,7 0,2 - 6 581,3 3 254,4 3 326,8 3 235,6
ožujak March 6 700,5 0,7 0,2 - 6 699,6 3 415,3 3 284,3 3 298,1
travanj April 6 772,0 0,9 0,2 - 6 770,8 3 503,5 3 267,3 3 021,9
svibanj May 6 990,6 0,6 0,2 - 6 989,8 3 640,3 3 349,5 2 937,7
lipanj June 7 065,7 0,7 0,2 - 7 064,8 3 654,5 3 410,3 2 974,7
srpanj July 7 061,6 1,4 0,2 - 7 060,0 3 690,7 3 369,3 3 051,0
kolovoz August 7 064,3 0,8 0,2 - 7 063,2 3 686,2 3 377,0 3 084,6
rujan September 6 998,7 0,8 0,2 - 6 997,7 3 607,6 3 390,0 3 064,9
listopad October 7 128,5 1,2 0,2 - 7 127,1 3 709,2 3 417,9 2 864,8
studeni November 7 220,4 0,8 0,2 - 7 219,3 3 781,1 3 438,2 3 242,7
prosinac December 7 438,4 0,9 0,2 - 7 437,3 3 834,5 3 602,8 2 938,4 1) Međunarodne pričuve Republike Hrvatske čine samo devizne pričuve Hrvatske narodne banke. 2) Izvršena je revizija podataka od prosinca 1999. nadalje. 1) International reserves are CNB's foreign exchange reserves. 2) Data starting from December 1999 have been revised. Izvor: Hrvatska narodna banka Source: Croatian National Bank
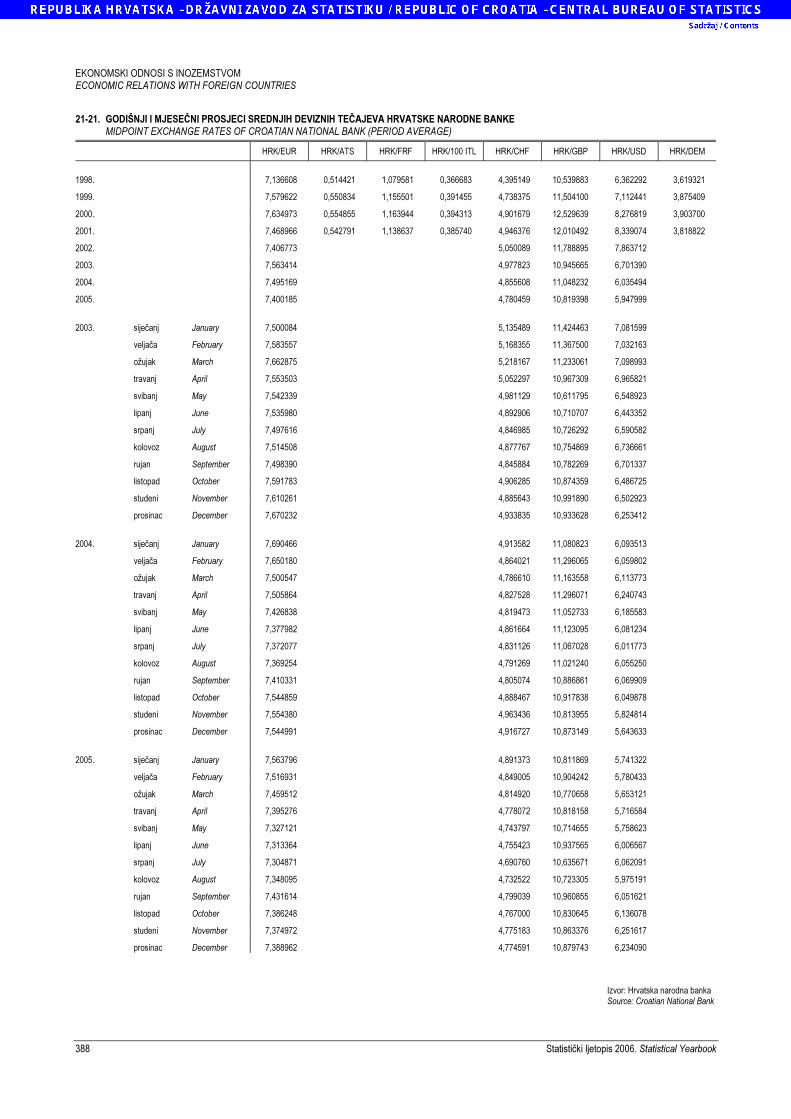
EKONOMSKI ODNOSI S INOZEMSTVOM ECONOMIC RELATIONS WITH FOREIGN COUNTRIES
388 Statistički ljetopis 2006. Statistical Yearbook
21-21. GODIŠNJI I MJESEČNI PROSJECI SREDNJIH DEVIZNIH TEČAJEVA HRVATSKE NARODNE BANKE MIDPOINT EXCHANGE RATES OF CROATIAN NATIONAL BANK (PERIOD AVERAGE)
HRK/EUR HRK/ATS HRK/FRF HRK/100 ITL HRK/CHF HRK/GBP HRK/USD HRK/DEM
1998. 7,136608 0,514421 1,079581 0,366683 4,395149 10,539883 6,362292 3,619321
1999. 7,579622 0,550834 1,155501 0,391455 4,738375 11,504100 7,112441 3,875409
2000. 7,634973 0,554855 1,163944 0,394313 4,901679 12,529639 8,276819 3,903700
2001. 7,468966 0,542791 1,138637 0,385740 4,946376 12,010492 8,339074 3,818822
2002. 7,406773 5,050089 11,788895 7,863712
2003. 7,563414 4,977823 10,945665 6,701390
2004. 7,495169 4,855608 11,048232 6,035494
2005. 7,400185 4,780459 10,819398 5,947999
2003. siječanj January 7,500084 5,135489 11,424463 7,081599
veljača February 7,583557 5,168355 11,367500 7,032163
ožujak March 7,662875 5,218167 11,233061 7,098993
travanj April 7,553503 5,052297 10,967309 6,965821
svibanj May 7,542339 4,981129 10,611795 6,548923
lipanj June 7,535980 4,892906 10,710707 6,443352
srpanj July 7,497616 4,846985 10,726292 6,590582
kolovoz August 7,514508 4,877767 10,754869 6,736661
rujan September 7,498390 4,845884 10,782269 6,701337
listopad October 7,591783 4,906285 10,874359 6,486725
studeni November 7,610261 4,885643 10,991890 6,502923
prosinac December 7,670232 4,933835 10,933628 6,253412
2004. siječanj January 7,690466 4,913582 11,080823 6,093513
veljača February 7,650180 4,864021 11,296065 6,059802
ožujak March 7,500547 4,786610 11,163558 6,113773
travanj April 7,505864 4,827528 11,296071 6,240743
svibanj May 7,426838 4,819473 11,052733 6,185583
lipanj June 7,377982 4,861664 11,123095 6,081234
srpanj July 7,372077 4,831126 11,067028 6,011773
kolovoz August 7,369254 4,791269 11,021240 6,055250
rujan September 7,410331 4,805074 10,886861 6,069909
listopad October 7,544859 4,888467 10,917838 6,049878
studeni November 7,554380 4,963436 10,813955 5,824814
prosinac December 7,544991 4,916727 10,873149 5,643633
2005. siječanj January 7,563796 4,891373 10,811869 5,741322
veljača February 7,516931 4,849005 10,904242 5,780433
ožujak March 7,459512 4,814920 10,770658 5,653121
travanj April 7,395276 4,778072 10,818158 5,716584
svibanj May 7,327121 4,743797 10,714655 5,758623
lipanj June 7,313364 4,755423 10,937565 6,006567
srpanj July 7,304871 4,690760 10,635671 6,062091
kolovoz August 7,348095 4,732522 10,723305 5,975191
rujan September 7,431614 4,799039 10,960855 6,051621
listopad October 7,386248 4,767000 10,830645 6,136078
studeni November 7,374972 4,775183 10,863376 6,251617
prosinac December 7,388962 4,774591 10,879743 6,234090 Izvor: Hrvatska narodna banka Source: Croatian National Bank
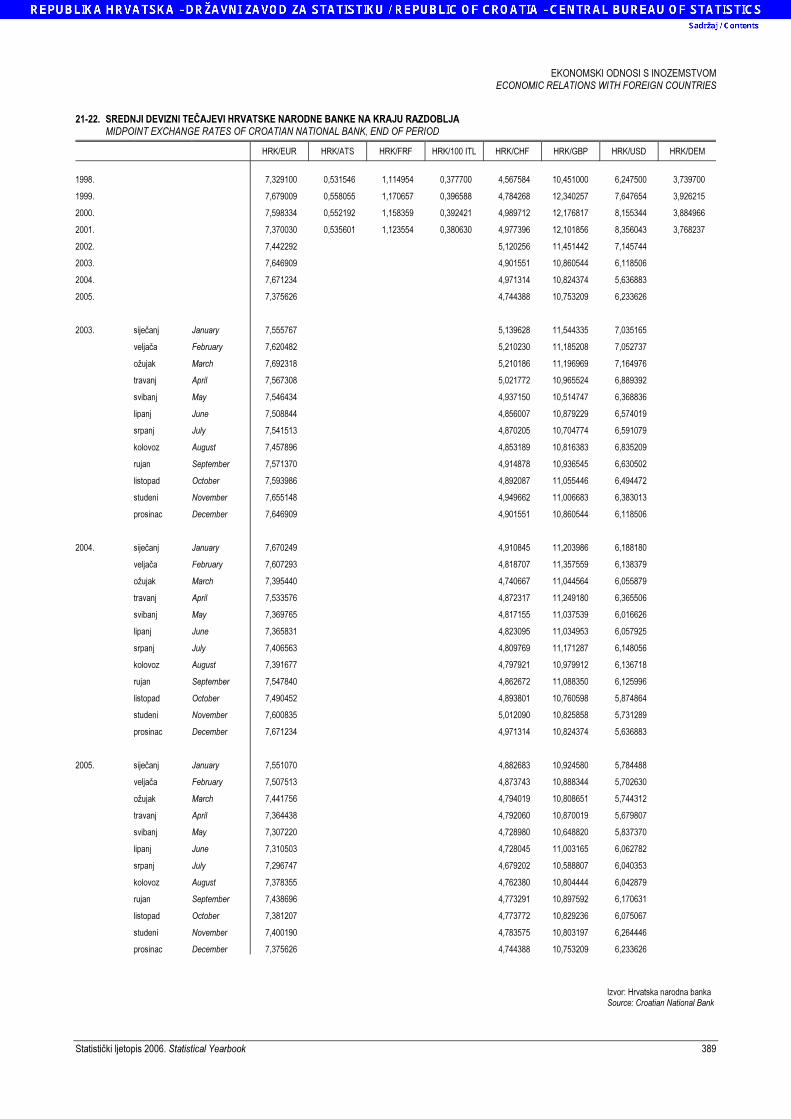
EKONOMSKI ODNOSI S INOZEMSTVOM ECONOMIC RELATIONS WITH FOREIGN COUNTRIES
Statistički ljetopis 2006. Statistical Yearbook 389
21-22. SREDNJI DEVIZNI TEČAJEVI HRVATSKE NARODNE BANKE NA KRAJU RAZDOBLJA MIDPOINT EXCHANGE RATES OF CROATIAN NATIONAL BANK, END OF PERIOD
HRK/EUR HRK/ATS HRK/FRF HRK/100 ITL HRK/CHF HRK/GBP HRK/USD HRK/DEM
1998. 7,329100 0,531546 1,114954 0,377700 4,567584 10,451000 6,247500 3,739700
1999. 7,679009 0,558055 1,170657 0,396588 4,784268 12,340257 7,647654 3,926215
2000. 7,598334 0,552192 1,158359 0,392421 4,989712 12,176817 8,155344 3,884966
2001. 7,370030 0,535601 1,123554 0,380630 4,977396 12,101856 8,356043 3,768237
2002. 7,442292 5,120256 11,451442 7,145744
2003. 7,646909 4,901551 10,860544 6,118506
2004. 7,671234 4,971314 10,824374 5,636883
2005. 7,375626 4,744388 10,753209 6,233626
2003. siječanj January 7,555767 5,139628 11,544335 7,035165
veljača February 7,620482 5,210230 11,185208 7,052737
ožujak March 7,692318 5,210186 11,196969 7,164976
travanj April 7,567308 5,021772 10,965524 6,889392
svibanj May 7,546434 4,937150 10,514747 6,368836
lipanj June 7,508844 4,856007 10,879229 6,574019
srpanj July 7,541513 4,870205 10,704774 6,591079
kolovoz August 7,457896 4,853189 10,816383 6,835209
rujan September 7,571370 4,914878 10,936545 6,630502
listopad October 7,593986 4,892087 11,055446 6,494472
studeni November 7,655148 4,949662 11,006683 6,383013
prosinac December 7,646909 4,901551 10,860544 6,118506
2004. siječanj January 7,670249 4,910845 11,203986 6,188180
veljača February 7,607293 4,818707 11,357559 6,138379
ožujak March 7,395440 4,740667 11,044564 6,055879
travanj April 7,533576 4,872317 11,249180 6,365506
svibanj May 7,369765 4,817155 11,037539 6,016626
lipanj June 7,365831 4,823095 11,034953 6,057925
srpanj July 7,406563 4,809769 11,171287 6,148056
kolovoz August 7,391677 4,797921 10,979912 6,136718
rujan September 7,547840 4,862672 11,088350 6,125996
listopad October 7,490452 4,893801 10,760598 5,874864
studeni November 7,600835 5,012090 10,825858 5,731289
prosinac December 7,671234 4,971314 10,824374 5,636883
2005. siječanj January 7,551070 4,882683 10,924580 5,784488
veljača February 7,507513 4,873743 10,888344 5,702630
ožujak March 7,441756 4,794019 10,808651 5,744312
travanj April 7,364438 4,792060 10,870019 5,679807
svibanj May 7,307220 4,728980 10,648820 5,837370
lipanj June 7,310503 4,728045 11,003165 6,062782
srpanj July 7,296747 4,679202 10,588807 6,040353
kolovoz August 7,378355 4,762380 10,804444 6,042879
rujan September 7,438696 4,773291 10,897592 6,170631
listopad October 7,381207 4,773772 10,829236 6,075067
studeni November 7,400190 4,783575 10,803197 6,264446
prosinac December 7,375626 4,744388 10,753209 6,233626 Izvor: Hrvatska narodna banka Source: Croatian National Bank
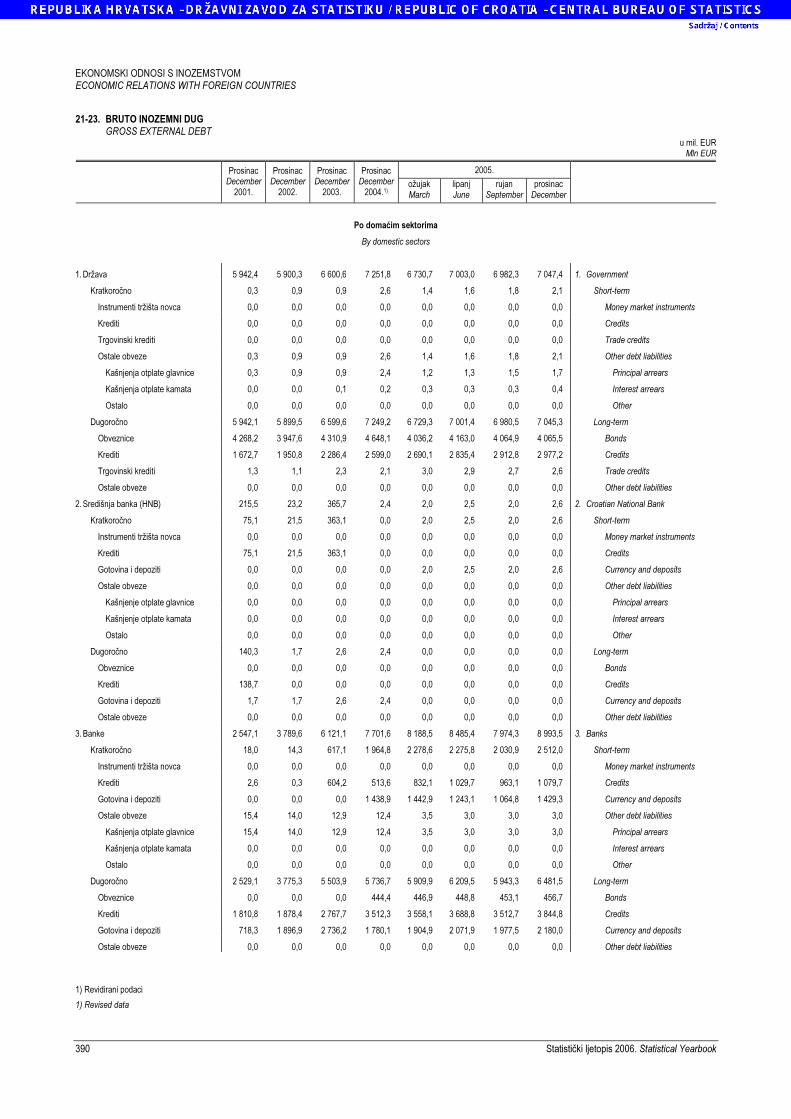
EKONOMSKI ODNOSI S INOZEMSTVOM ECONOMIC RELATIONS WITH FOREIGN COUNTRIES
390 Statistički ljetopis 2006. Statistical Yearbook
21-23. BRUTO INOZEMNI DUG GROSS EXTERNAL DEBT
u mil. EUR Mln EUR
2005.
Prosinac
December 2001.
Prosinac December
2002.
ProsinacDecember
2003.
ProsinacDecember
2004.1) ožujak March
lipanj June
rujan September
prosinac December
Po domaćim sektorima
By domestic sectors
1. Država 5 942,4 5 900,3 6 600,6 7 251,8 6 730,7 7 003,0 6 982,3 7 047,4 1. Government
Kratkoročno 0,3 0,9 0,9 2,6 1,4 1,6 1,8 2,1 Short-term
Instrumenti tržišta novca 0,0 0,0 0,0 0,0 0,0 0,0 0,0 0,0 Money market instruments
Krediti 0,0 0,0 0,0 0,0 0,0 0,0 0,0 0,0 Credits
Trgovinski krediti 0,0 0,0 0,0 0,0 0,0 0,0 0,0 0,0 Trade credits
Ostale obveze 0,3 0,9 0,9 2,6 1,4 1,6 1,8 2,1 Other debt liabilities
Kašnjenja otplate glavnice 0,3 0,9 0,9 2,4 1,2 1,3 1,5 1,7 Principal arrears
Kašnjenja otplate kamata 0,0 0,0 0,1 0,2 0,3 0,3 0,3 0,4 Interest arrears
Ostalo 0,0 0,0 0,0 0,0 0,0 0,0 0,0 0,0 Other
Dugoročno 5 942,1 5 899,5 6 599,6 7 249,2 6 729,3 7 001,4 6 980,5 7 045,3 Long-term
Obveznice 4 268,2 3 947,6 4 310,9 4 648,1 4 036,2 4 163,0 4 064,9 4 065,5 Bonds
Krediti 1 672,7 1 950,8 2 286,4 2 599,0 2 690,1 2 835,4 2 912,8 2 977,2 Credits
Trgovinski krediti 1,3 1,1 2,3 2,1 3,0 2,9 2,7 2,6 Trade credits
Ostale obveze 0,0 0,0 0,0 0,0 0,0 0,0 0,0 0,0 Other debt liabilities
2. Središnja banka (HNB) 215,5 23,2 365,7 2,4 2,0 2,5 2,0 2,6 2. Croatian National Bank
Kratkoročno 75,1 21,5 363,1 0,0 2,0 2,5 2,0 2,6 Short-term
Instrumenti tržišta novca 0,0 0,0 0,0 0,0 0,0 0,0 0,0 0,0 Money market instruments
Krediti 75,1 21,5 363,1 0,0 0,0 0,0 0,0 0,0 Credits
Gotovina i depoziti 0,0 0,0 0,0 0,0 2,0 2,5 2,0 2,6 Currency and deposits
Ostale obveze 0,0 0,0 0,0 0,0 0,0 0,0 0,0 0,0 Other debt liabilities
Kašnjenje otplate glavnice 0,0 0,0 0,0 0,0 0,0 0,0 0,0 0,0 Principal arrears
Kašnjenje otplate kamata 0,0 0,0 0,0 0,0 0,0 0,0 0,0 0,0 Interest arrears
Ostalo 0,0 0,0 0,0 0,0 0,0 0,0 0,0 0,0 Other
Dugoročno 140,3 1,7 2,6 2,4 0,0 0,0 0,0 0,0 Long-term
Obveznice 0,0 0,0 0,0 0,0 0,0 0,0 0,0 0,0 Bonds
Krediti 138,7 0,0 0,0 0,0 0,0 0,0 0,0 0,0 Credits
Gotovina i depoziti 1,7 1,7 2,6 2,4 0,0 0,0 0,0 0,0 Currency and deposits
Ostale obveze 0,0 0,0 0,0 0,0 0,0 0,0 0,0 0,0 Other debt liabilities
3. Banke 2 547,1 3 789,6 6 121,1 7 701,6 8 188,5 8 485,4 7 974,3 8 993,5 3. Banks
Kratkoročno 18,0 14,3 617,1 1 964,8 2 278,6 2 275,8 2 030,9 2 512,0 Short-term
Instrumenti tržišta novca 0,0 0,0 0,0 0,0 0,0 0,0 0,0 0,0 Money market instruments
Krediti 2,6 0,3 604,2 513,6 832,1 1 029,7 963,1 1 079,7 Credits
Gotovina i depoziti 0,0 0,0 0,0 1 438,9 1 442,9 1 243,1 1 064,8 1 429,3 Currency and deposits
Ostale obveze 15,4 14,0 12,9 12,4 3,5 3,0 3,0 3,0 Other debt liabilities
Kašnjenja otplate glavnice 15,4 14,0 12,9 12,4 3,5 3,0 3,0 3,0 Principal arrears
Kašnjenja otplate kamata 0,0 0,0 0,0 0,0 0,0 0,0 0,0 0,0 Interest arrears
Ostalo 0,0 0,0 0,0 0,0 0,0 0,0 0,0 0,0 Other
Dugoročno 2 529,1 3 775,3 5 503,9 5 736,7 5 909,9 6 209,5 5 943,3 6 481,5 Long-term
Obveznice 0,0 0,0 0,0 444,4 446,9 448,8 453,1 456,7 Bonds
Krediti 1 810,8 1 878,4 2 767,7 3 512,3 3 558,1 3 688,8 3 512,7 3 844,8 Credits
Gotovina i depoziti 718,3 1 896,9 2 736,2 1 780,1 1 904,9 2 071,9 1 977,5 2 180,0 Currency and deposits
Ostale obveze 0,0 0,0 0,0 0,0 0,0 0,0 0,0 0,0 Other debt liabilities 1) Revidirani podaci
1) Revised data
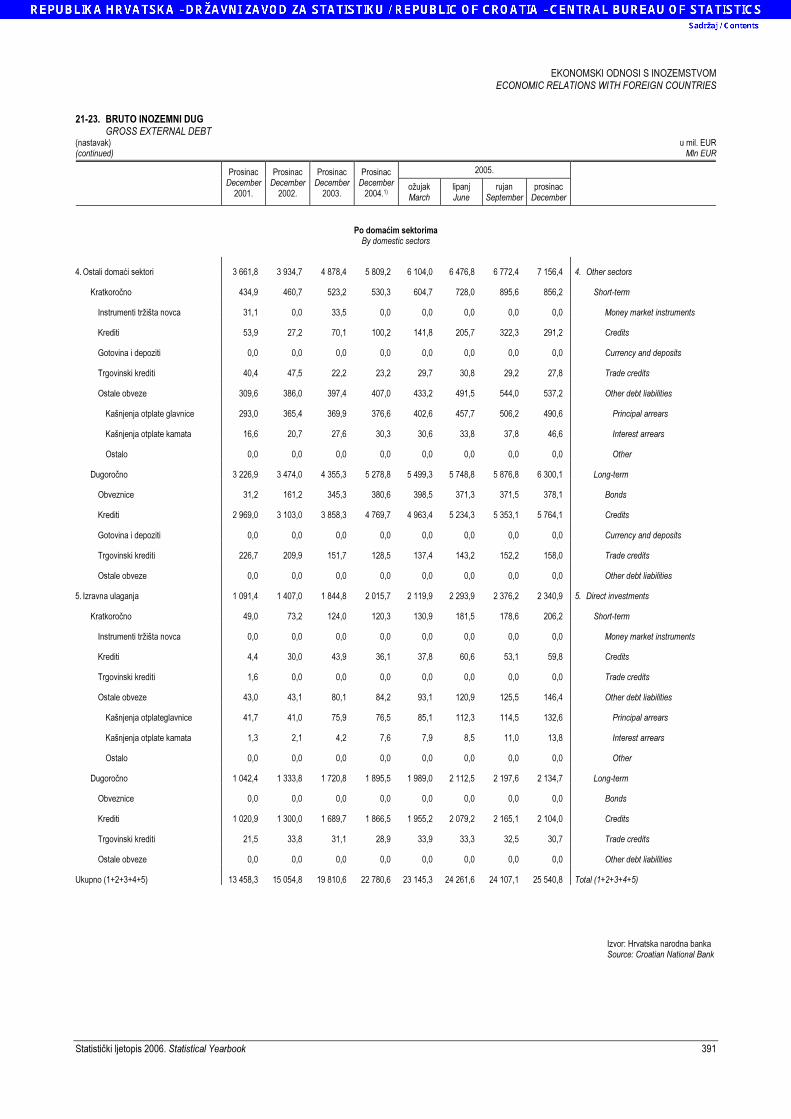
EKONOMSKI ODNOSI S INOZEMSTVOM ECONOMIC RELATIONS WITH FOREIGN COUNTRIES
Statistički ljetopis 2006. Statistical Yearbook 391
21-23. BRUTO INOZEMNI DUG GROSS EXTERNAL DEBT (nastavak) u mil. EUR (continued) Mln EUR
2005.
Prosinac
December 2001.
Prosinac December
2002.
ProsinacDecember
2003.
ProsinacDecember
2004.1) ožujak March
lipanj June
rujan September
prosinac December
Po domaćim sektorima By domestic sectors
4. Ostali domaći sektori 3 661,8 3 934,7 4 878,4 5 809,2 6 104,0 6 476,8 6 772,4 7 156,4 4. Other sectors
Kratkoročno 434,9 460,7 523,2 530,3 604,7 728,0 895,6 856,2 Short-term
Instrumenti tržišta novca 31,1 0,0 33,5 0,0 0,0 0,0 0,0 0,0 Money market instruments
Krediti 53,9 27,2 70,1 100,2 141,8 205,7 322,3 291,2 Credits
Gotovina i depoziti 0,0 0,0 0,0 0,0 0,0 0,0 0,0 0,0 Currency and deposits
Trgovinski krediti 40,4 47,5 22,2 23,2 29,7 30,8 29,2 27,8 Trade credits
Ostale obveze 309,6 386,0 397,4 407,0 433,2 491,5 544,0 537,2 Other debt liabilities
Kašnjenja otplate glavnice 293,0 365,4 369,9 376,6 402,6 457,7 506,2 490,6 Principal arrears
Kašnjenja otplate kamata 16,6 20,7 27,6 30,3 30,6 33,8 37,8 46,6 Interest arrears
Ostalo 0,0 0,0 0,0 0,0 0,0 0,0 0,0 0,0 Other
Dugoročno 3 226,9 3 474,0 4 355,3 5 278,8 5 499,3 5 748,8 5 876,8 6 300,1 Long-term
Obveznice 31,2 161,2 345,3 380,6 398,5 371,3 371,5 378,1 Bonds
Krediti 2 969,0 3 103,0 3 858,3 4 769,7 4 963,4 5 234,3 5 353,1 5 764,1 Credits
Gotovina i depoziti 0,0 0,0 0,0 0,0 0,0 0,0 0,0 0,0 Currency and deposits
Trgovinski krediti 226,7 209,9 151,7 128,5 137,4 143,2 152,2 158,0 Trade credits
Ostale obveze 0,0 0,0 0,0 0,0 0,0 0,0 0,0 0,0 Other debt liabilities
5. Izravna ulaganja 1 091,4 1 407,0 1 844,8 2 015,7 2 119,9 2 293,9 2 376,2 2 340,9 5. Direct investments
Kratkoročno 49,0 73,2 124,0 120,3 130,9 181,5 178,6 206,2 Short-term
Instrumenti tržišta novca 0,0 0,0 0,0 0,0 0,0 0,0 0,0 0,0 Money market instruments
Krediti 4,4 30,0 43,9 36,1 37,8 60,6 53,1 59,8 Credits
Trgovinski krediti 1,6 0,0 0,0 0,0 0,0 0,0 0,0 0,0 Trade credits
Ostale obveze 43,0 43,1 80,1 84,2 93,1 120,9 125,5 146,4 Other debt liabilities
Kašnjenja otplateglavnice 41,7 41,0 75,9 76,5 85,1 112,3 114,5 132,6 Principal arrears
Kašnjenja otplate kamata 1,3 2,1 4,2 7,6 7,9 8,5 11,0 13,8 Interest arrears
Ostalo 0,0 0,0 0,0 0,0 0,0 0,0 0,0 0,0 Other
Dugoročno 1 042,4 1 333,8 1 720,8 1 895,5 1 989,0 2 112,5 2 197,6 2 134,7 Long-term
Obveznice 0,0 0,0 0,0 0,0 0,0 0,0 0,0 0,0 Bonds
Krediti 1 020,9 1 300,0 1 689,7 1 866,5 1 955,2 2 079,2 2 165,1 2 104,0 Credits
Trgovinski krediti 21,5 33,8 31,1 28,9 33,9 33,3 32,5 30,7 Trade credits
Ostale obveze 0,0 0,0 0,0 0,0 0,0 0,0 0,0 0,0 Other debt liabilities
Ukupno (1+2+3+4+5) 13 458,3 15 054,8 19 810,6 22 780,6 23 145,3 24 261,6 24 107,1 25 540,8 Total (1+2+3+4+5) Izvor: Hrvatska narodna banka Source: Croatian National Bank
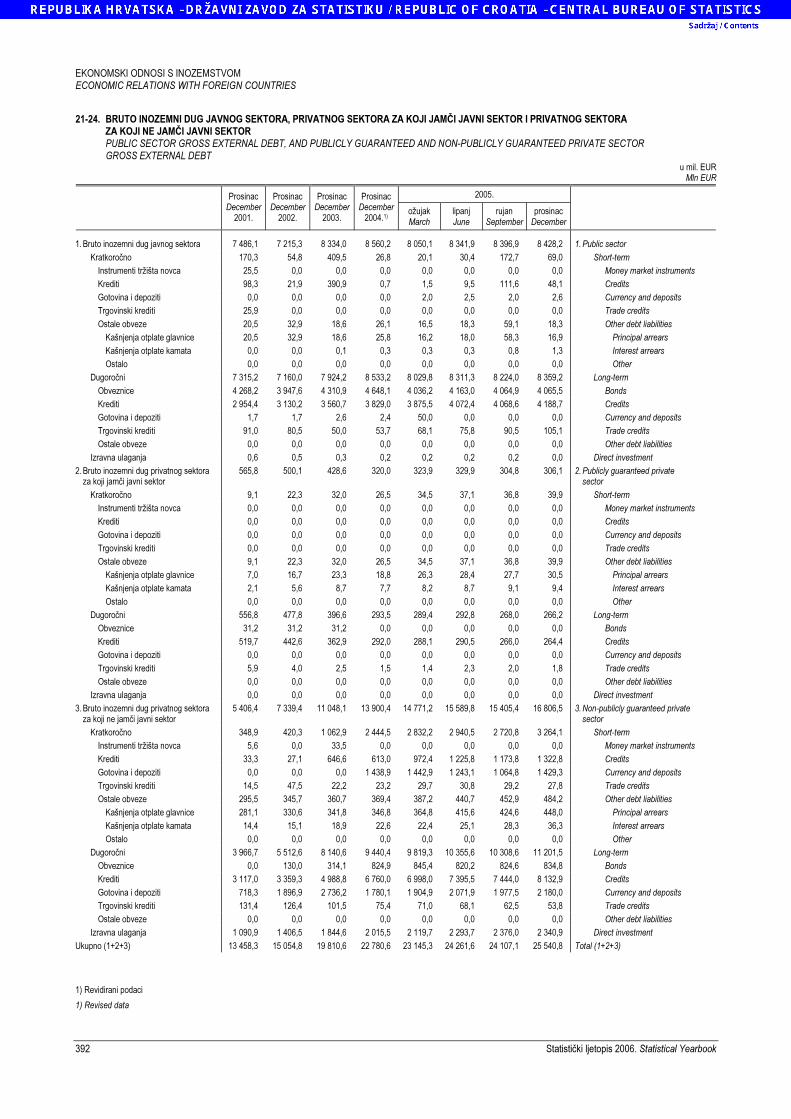
EKONOMSKI ODNOSI S INOZEMSTVOM ECONOMIC RELATIONS WITH FOREIGN COUNTRIES
392 Statistički ljetopis 2006. Statistical Yearbook
21-24. BRUTO INOZEMNI DUG JAVNOG SEKTORA, PRIVATNOG SEKTORA ZA KOJI JAMČI JAVNI SEKTOR I PRIVATNOG SEKTORA ZA KOJI NE JAMČI JAVNI SEKTOR PUBLIC SECTOR GROSS EXTERNAL DEBT, AND PUBLICLY GUARANTEED AND NON-PUBLICLY GUARANTEED PRIVATE SECTOR GROSS EXTERNAL DEBT
u mil. EUR Mln EUR
2005.
Prosinac
December 2001.
Prosinac December
2002.
ProsinacDecember
2003.
ProsinacDecember
2004.1) ožujak March
lipanj June
rujan September
prosinac December
1. Bruto inozemni dug javnog sektora 7 486,1 7 215,3 8 334,0 8 560,2 8 050,1 8 341,9 8 396,9 8 428,2 1. Public sector
Kratkoročno 170,3 54,8 409,5 26,8 20,1 30,4 172,7 69,0 Short-term
Instrumenti tržišta novca 25,5 0,0 0,0 0,0 0,0 0,0 0,0 0,0 Money market instruments
Krediti 98,3 21,9 390,9 0,7 1,5 9,5 111,6 48,1 Credits
Gotovina i depoziti 0,0 0,0 0,0 0,0 2,0 2,5 2,0 2,6 Currency and deposits
Trgovinski krediti 25,9 0,0 0,0 0,0 0,0 0,0 0,0 0,0 Trade credits
Ostale obveze 20,5 32,9 18,6 26,1 16,5 18,3 59,1 18,3 Other debt liabilities
Kašnjenja otplate glavnice 20,5 32,9 18,6 25,8 16,2 18,0 58,3 16,9 Principal arrears
Kašnjenja otplate kamata 0,0 0,0 0,1 0,3 0,3 0,3 0,8 1,3 Interest arrears
Ostalo 0,0 0,0 0,0 0,0 0,0 0,0 0,0 0,0 Other
Dugoročni 7 315,2 7 160,0 7 924,2 8 533,2 8 029,8 8 311,3 8 224,0 8 359,2 Long-term
Obveznice 4 268,2 3 947,6 4 310,9 4 648,1 4 036,2 4 163,0 4 064,9 4 065,5 Bonds
Krediti 2 954,4 3 130,2 3 560,7 3 829,0 3 875,5 4 072,4 4 068,6 4 188,7 Credits
Gotovina i depoziti 1,7 1,7 2,6 2,4 50,0 0,0 0,0 0,0 Currency and deposits
Trgovinski krediti 91,0 80,5 50,0 53,7 68,1 75,8 90,5 105,1 Trade credits
Ostale obveze 0,0 0,0 0,0 0,0 0,0 0,0 0,0 0,0 Other debt liabilities
Izravna ulaganja 0,6 0,5 0,3 0,2 0,2 0,2 0,2 0,0 Direct investment
2. Bruto inozemni dug privatnog sektora za koji jamči javni sektor
565,8 500,1 428,6 320,0 323,9 329,9 304,8 306,1 2. Publicly guaranteed private sector
Kratkoročno 9,1 22,3 32,0 26,5 34,5 37,1 36,8 39,9 Short-term
Instrumenti tržišta novca 0,0 0,0 0,0 0,0 0,0 0,0 0,0 0,0 Money market instruments
Krediti 0,0 0,0 0,0 0,0 0,0 0,0 0,0 0,0 Credits
Gotovina i depoziti 0,0 0,0 0,0 0,0 0,0 0,0 0,0 0,0 Currency and deposits
Trgovinski krediti 0,0 0,0 0,0 0,0 0,0 0,0 0,0 0,0 Trade credits
Ostale obveze 9,1 22,3 32,0 26,5 34,5 37,1 36,8 39,9 Other debt liabilities
Kašnjenja otplate glavnice 7,0 16,7 23,3 18,8 26,3 28,4 27,7 30,5 Principal arrears
Kašnjenja otplate kamata 2,1 5,6 8,7 7,7 8,2 8,7 9,1 9,4 Interest arrears
Ostalo 0,0 0,0 0,0 0,0 0,0 0,0 0,0 0,0 Other
Dugoročni 556,8 477,8 396,6 293,5 289,4 292,8 268,0 266,2 Long-term
Obveznice 31,2 31,2 31,2 0,0 0,0 0,0 0,0 0,0 Bonds
Krediti 519,7 442,6 362,9 292,0 288,1 290,5 266,0 264,4 Credits
Gotovina i depoziti 0,0 0,0 0,0 0,0 0,0 0,0 0,0 0,0 Currency and deposits
Trgovinski krediti 5,9 4,0 2,5 1,5 1,4 2,3 2,0 1,8 Trade credits
Ostale obveze 0,0 0,0 0,0 0,0 0,0 0,0 0,0 0,0 Other debt liabilities
Izravna ulaganja 0,0 0,0 0,0 0,0 0,0 0,0 0,0 0,0 Direct investment
3. Bruto inozemni dug privatnog sektora za koji ne jamči javni sektor
5 406,4 7 339,4 11 048,1 13 900,4 14 771,2 15 589,8 15 405,4 16 806,5 3. Non-publicly guaranteed private sector
Kratkoročno 348,9 420,3 1 062,9 2 444,5 2 832,2 2 940,5 2 720,8 3 264,1 Short-term
Instrumenti tržišta novca 5,6 0,0 33,5 0,0 0,0 0,0 0,0 0,0 Money market instruments
Krediti 33,3 27,1 646,6 613,0 972,4 1 225,8 1 173,8 1 322,8 Credits
Gotovina i depoziti 0,0 0,0 0,0 1 438,9 1 442,9 1 243,1 1 064,8 1 429,3 Currency and deposits
Trgovinski krediti 14,5 47,5 22,2 23,2 29,7 30,8 29,2 27,8 Trade credits
Ostale obveze 295,5 345,7 360,7 369,4 387,2 440,7 452,9 484,2 Other debt liabilities
Kašnjenja otplate glavnice 281,1 330,6 341,8 346,8 364,8 415,6 424,6 448,0 Principal arrears
Kašnjenja otplate kamata 14,4 15,1 18,9 22,6 22,4 25,1 28,3 36,3 Interest arrears
Ostalo 0,0 0,0 0,0 0,0 0,0 0,0 0,0 0,0 Other
Dugoročni 3 966,7 5 512,6 8 140,6 9 440,4 9 819,3 10 355,6 10 308,6 11 201,5 Long-term
Obveznice 0,0 130,0 314,1 824,9 845,4 820,2 824,6 834,8 Bonds
Krediti 3 117,0 3 359,3 4 988,8 6 760,0 6 998,0 7 395,5 7 444,0 8 132,9 Credits
Gotovina i depoziti 718,3 1 896,9 2 736,2 1 780,1 1 904,9 2 071,9 1 977,5 2 180,0 Currency and deposits
Trgovinski krediti 131,4 126,4 101,5 75,4 71,0 68,1 62,5 53,8 Trade credits
Ostale obveze 0,0 0,0 0,0 0,0 0,0 0,0 0,0 0,0 Other debt liabilities
Izravna ulaganja 1 090,9 1 406,5 1 844,6 2 015,5 2 119,7 2 293,7 2 376,0 2 340,9 Direct investment
Ukupno (1+2+3) 13 458,3 15 054,8 19 810,6 22 780,6 23 145,3 24 261,6 24 107,1 25 540,8 Total (1+2+3)
1) Revidirani podaci
1) Revised data
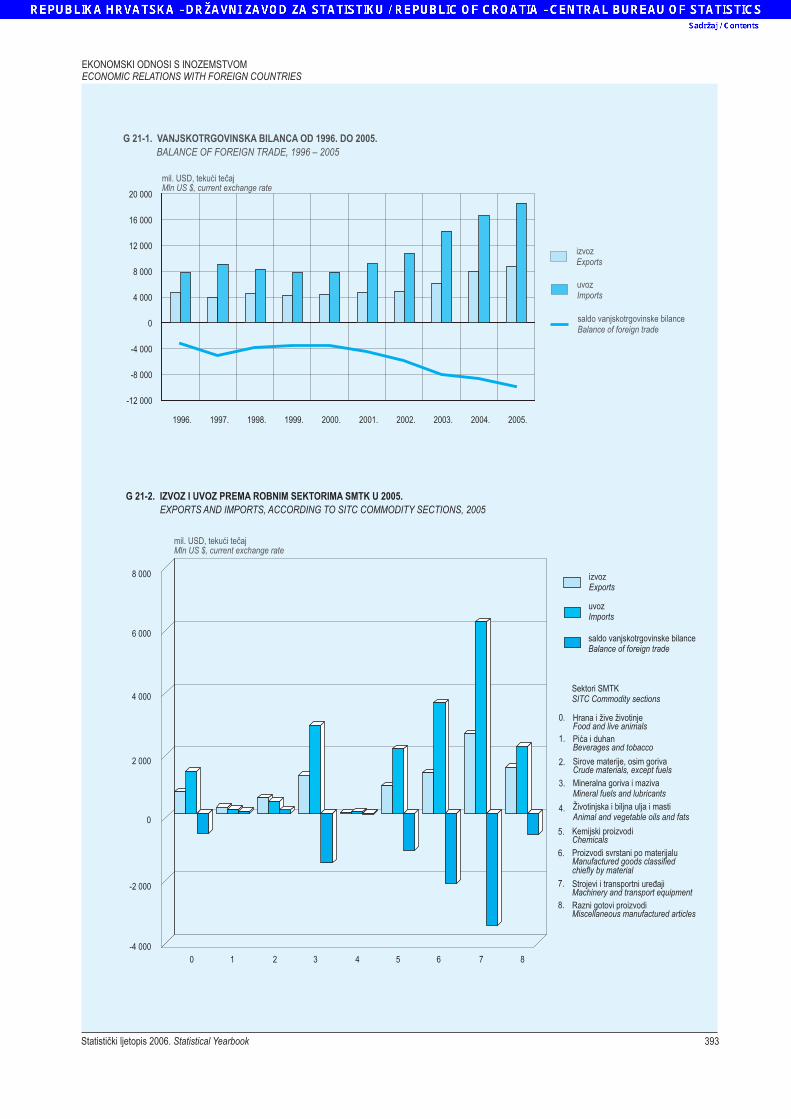
EKONOMSKI ODNOSI S INOZEMSTVOMECONOMIC RELATIONS WITH FOREIGN COUNTRIES
izvozExports
uvozImports
saldo vanjskotrgovinske bilanceBalance of foreign trade
mil. USD, teku i te ajć čMln US $, current exchange rate
G 21-1. VANJSKOTRGOVINSKA BILANCA OD 1996. DO 2005.BALANCE OF FOREIGN TRADE, 1996 – 2005
-12 000
-8 000
-4 000
0
4 000
8 000
12 000
16 000
20 000
1996. 1997. 1998. 1999. 2000. 2001. 2002. 2003. 2004. 2005.
Hrana i žive životinjeFood and live animalsPi a i duhanćBeverages and tobacco
Sirove materije, osim gorivaCrude materials, except fuels
Mineralna goriva i mazivaMineral fuels and lubricants
Životinjska i biljna ulja i mastiAnimal and vegetable oils and fats
0.
1.
2.
3.
4.
Sektori SMTKSITC Commodity sections
izvozExports
saldo vanjskotrgovinske bilanceBalance of foreign trade
uvozImports
-4 000
-2 000
0
2 000
4 000
6 000
8 000
0 1 2 3 4 5 6 7 8
G 21-2. IZVOZ I UVOZ PREMA ROBNIM SEKTORIMA SMTK U 2005.EXPORTS AND IMPORTS, ACCORDING TO SITC COMMODITY SECTIONS, 2005
mil. USD, teku i te ajć čMln US $, current exchange rate
Kemijski proizvodiChemicals
Proizvodi svrstani po materijaluManufactured goods classifiedchiefly by material
Strojevi i transportni ure ajiđMachinery and transport equipment
Razni gotovi proizvodiMiscellaneous manufactured articles
5.
6.
7.
8.
393Statistički ljetopis 2006. Statistical Yearbook
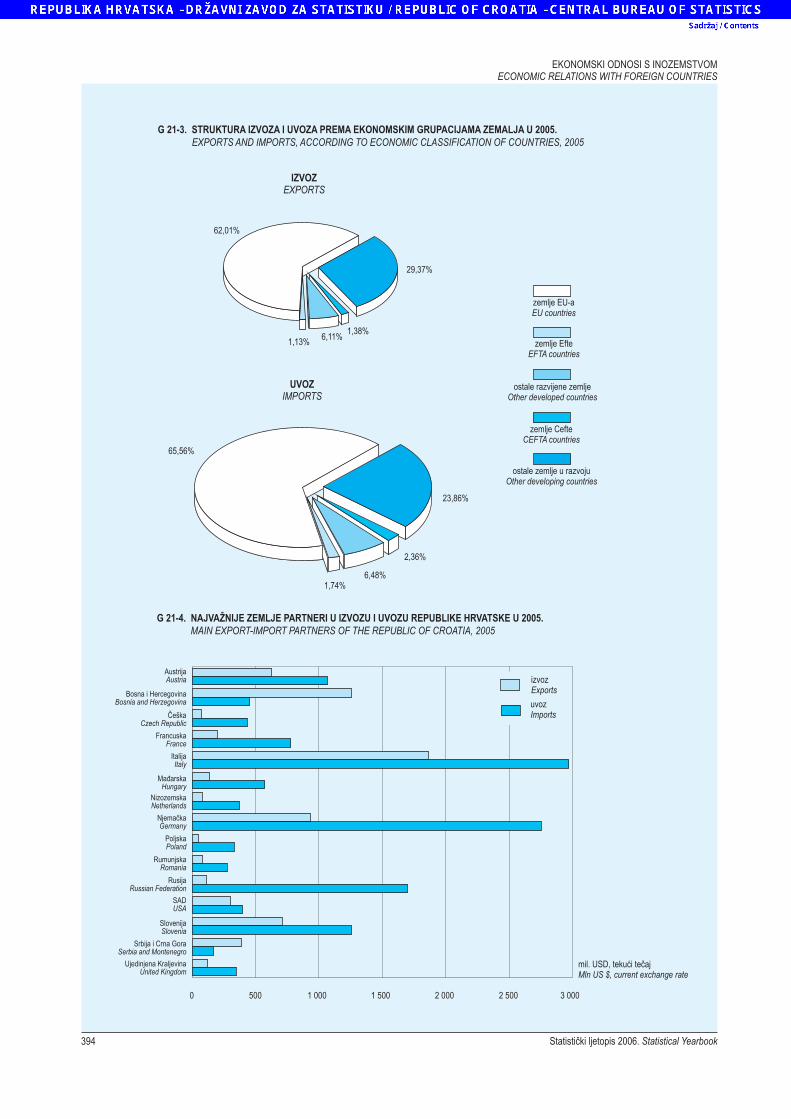
MAIN EXPORT-IMPORT PARTNERS OF THE REPUBLIC OF CROATIA, 2005
EKONOMSKI ODNOSI S INOZEMSTVOMECONOMIC RELATIONS WITH FOREIGN COUNTRIES
G 21-4. NAJVAŽNIJE ZEMLJE PARTNERI U IZVOZU I UVOZU REPUBLIKE HRVATSKE U 2005.
394 Statistički ljetopis 2006. Statistical Yearbook
G 21-3. STRUKTURA IZVOZA I UVOZA PREMA EKONOMSKIM GRUPACIJAMA ZEMALJA U 2005.EXPORTS AND IMPORTS, ACCORDING TO ECONOMIC CLASSIFICATION OF COUNTRIES, 2005
UVOZIMPORTS
IZVOZEXPORTS
zemlje EU-aEU countries
zemlje EfteEFTA countries
ostale razvijene zemljeOther developed countries
zemlje CefteCEFTA countries
ostale zemlje u razvojuOther developing countries
65,56%
1,74%6,48%
2,36%
23,86%
1,13% 6,11%1,38%
29,37%
62,01%
0 500 1 000 1 500 2 000 2 500 3 000
izvozExports
uvozImports
Srbija i Crna GoraSerbia and Montenegro
Bosna i HercegovinaBosnia and Herzegovina
ItalijaItaly
SlovenijaSlovenia
AustrijaAustria
RusijaRussian Federation
FrancuskaFrance
SADUSA
Ma arskađHungary
NizozemskaNetherlands
NjemačkaGermany
ČeškaCzech Republic
PoljskaPoland
RumunjskaRomania
Ujedinjena KraljevinaUnited Kingdom
mil. USD, teku i te ajć čMln US $, current exchange rate