Embed Size (px)
Citation preview

21st Century Community Learning Centers State Evaluation Implementation Report January – June 2003
Celeste Sturdevant Reed, Ph.D., Principal Investigator Laura V. Bates, M.A. Laurie A. Van Egeren, Ph.D., Principal Investigator Dwayne Baker, Ph.D. Christopher Dunbar, Ph.D. BetsAnn Smith, Ph.D. Francisco Villarruel, Ph.D. Tara Donohue Aisha Smith, M.A. Andrew Hahn

21st Century Community Learning Centers State Evaluation Implementation Report January – June 2003
Celeste Sturdevant Reed, Ph.D., Principal Investigator Laura V. Bates, M.A. Laurie A. Van Egeren, Ph.D., Principal Investigator University Outreach Partnerships
Dwayne Baker, Ph.D. Department of Community, Agriculture, Recreation and Resource Studies
Christopher Dunbar, Ph.D. BetsAnn Smith, Ph.D. Department of Educational Administration
Francisco Villarruel, Ph.D. Department of Family and Child Ecology
Tara Donohue Aisha Smith, M.A. H. Andrew Hahn
University Outreach & Engagement Michigan State University East Lansing
February 2004

University Outreach & Engagement Michigan State University
Kellogg Center, Garden Level East Lansing, Michigan 48824
Phone: (517) 353-8977 Fax: (517) 432-9541
Web: www.outreach.msu.edu
© 2004 Michigan State University. All rights reserved
The views expressed are solely those of the authors. For more information about this report, contact:
Celeste Sturdevant Reed, Ph.D. Outreach Partnerships
Michigan State University Kellogg Center, Garden Level East Lansing Michigan 48824
Email: [email protected] Phone: (517) 353-8977
Fax: (517) 432-9541 Web: www.outreach.msu.edu
Production Editor Linda Chapel Jackson
Funding This report was supported in part by a contract between the
Michigan Department of Education and University Outreach & Engagement, Michigan State University.
Michigan State University is an affirmative action,
equal opportunity institution.

Contents Contents.......................................................................................................................................... 1
1. Introduction................................................................................................................................ 1 21st Century Program History .................................................................................................................. 3 County and School District Characteristics .............................................................................................. 3
2. Grantee Profiles ......................................................................................................................... 7 Prior Support for OST Programming........................................................................................................ 7 Organizational Classification, Emphasis and Progress............................................................................. 9 Program Management and Staffing ........................................................................................................ 12 Communication and Coordination of Services ....................................................................................... 17 Program Elements ................................................................................................................................... 18 Student/Parent Recruitment and Participation ........................................................................................ 22 Summary ................................................................................................................................................. 25
3. Issues and Challenges.............................................................................................................. 27 The Influence of Key Contextual Factors ............................................................................................... 27 The Influence of Grantees’ Structures and Processes ............................................................................. 28 Academic Enrichment Choices............................................................................................................... 30 Program Sustainability............................................................................................................................ 31 Summary ................................................................................................................................................. 32
Appendices.................................................................................................................................... 35
Appendix A. Methods................................................................................................................... 37 Data Sources ........................................................................................................................................... 37
Appendix B. Grantees .................................................................................................................. 41
Appendix C. Data Tables ............................................................................................................. 47
Appendix D. Organization Structure and Process...................................................................... 49
References .................................................................................................................................... 51

Tables 1. January 2003 21st Century Grantees .................................................................................................................2 2. Percent of Grantees Reporting Specific Types of Relationships with Partners ................................................8 3. Prior OST Programming and School-Based Services for Students ..................................................................9 4. Grantees’ Self-Reported Progress toward Goal-related Objectives ................................................................11
5. Grantees’ Self-Reported Progress toward Grantee-Specific Objectives.........................................................11
6. Progress on Staffing of 21st Century Programs as of June 2003 ....................................................................13 7. Organizations Involved in Specific Types of Management ............................................................................15 8. Groups Participating in Program Decision-Making........................................................................................17
9. Program Categories and Activities .................................................................................................................20
B-1. Combined Federal and Michigan Department of Education Michigan 21st Century Grantees ..................41
C-1. County Economic Data...............................................................................................................................47 C-2. Family Data ................................................................................................................................................47
C-3. School District and School Data .................................................................................................................48
Figures
Figure 1. School Drop-Out Rates 2000-2001 .......................................................................................................7

1. Introduction This report describes the January through June, 2003, experiences of the first thirteen 21st Century Community Learning Centers (21st Century program grantees; see Table 1) selected by the Michigan Department of Education (MDE) through a competitive grant process. The 21st Century Community Learning Centers are funded with federal resources made available to states through Title IV, Part B, of the No Child Left Behind Act. During the initial six months, grantees undertook a variety of tasks, including relationship-building with their target schools, hiring staff, recruiting participants, and developing organizational structures to accommodate their specific situations. With the exception of two grantees who were already providing comparable activities at the time of funding, programs averaged 36 days of operation.
To provide background for these new programs, this section briefly traces the history of the federal 21st Century program; outlines the historic presence of out-of-school time (OST) programming in Michigan; and presents contextual information for the grantees, including general demographic and school-district data, as well as specific information on community, grantee and school experiences that made these grants possible.
Section 2, Grantees’ Profiles, summarizes grantees’ management structures, programs and participants.
Section 3 concludes with a discussion of issues arising from grantees’ early experiences.
Throughout this report the following terms are defined in this manner:
Grantee refers to the legally organized entity that received 21st Century funding, usually an educational district or, less often, a community-based organization.
•
•
•
Program refers to the curriculum and/or activities that grantees offer to improve students’ performance and parents’ skills.
Site refers to the locations where program activities are held; often, but not exclusively, these are schools.
The data summarized for this report were drawn from multiple sources: the grantees’ proposals; the Annual Progress Reports (APRs) submitted in June 2003; surveys completed by administrators (Survey No. 2, referred to as the Checklist), also submitted in June 2003; interviews conducted with grantees’ administrators; and various online data sources, including the 2000 Census and Kids Count. See Appendix A (methods) for the specific sources used in this report.
1

Table 1
January 2003 21st Century Grantees
Grantee County Target Schools Grades Served
in 2003 Coburn Elementary K-5 Dudley Elementary K-5 Urbandale Elementary K-5 Washington Elementary K-5
Battle Creek Public Schools Calhoun
Wilson Elementary K-5 Boys and Girls Club of Berrien Hull Middle School 6-8
Amble Elementary K-5* Hillsdale Elementary K-5 Harrison Middle 6-8
Clare-Gladwin Regional Education School District
Clare
Larson Elementary * Farwell Elementary K-4 Clare-Gladwin Regional
Education School District Clare
Farwell Middle School 5-8 Blackwell Elementary K-5 Burbank Elementary 6-8 Hamilton Elementary 1-5 Joy Middle School 6-8
Detroit Public Schools Wayne
Von Steuben Elementary K-5 Barbara Jordan Elementary K-5 Cerveny Middle School 6-8 Post Middle School 6-8 Rutherford Elementary 3-4
Detroit Public Schools Wayne
Winship Elementary K-5 Kaiser Elementary K-5 Edmondson Middle School 6-8
Eastern Michigan University Institute for Community and Regional Development
Washtenaw
Holmes Middle School 6-8 Longfellow Middle School 6-8 McKinley Middle School 6-8
Flint Community Schools Genesee
Whittier Middle School 6-8 Burton Middle School 6-8 Iroquois Middle School 7-8 Northeast Middle School 6-8 Riverside Middle School 6-8
Grand Rapids Public Schools Kent
Westwood Middle School 6-8 Barber Focus Elementary 4-6 Cortland Career Academy K-6 Henry Ford Academy K-6 Liberty Middle School 0
Highland Park Community Schools
Wayne
Highland Park Community High S
0 Center Academy 6-8 International Academy of Flint Genesee International Academy of Flint 6-8 Heavenrich Elementary 1-5 Martha Longstreet Elementary 1-5 Webber Elementary 1-5 Central Middle School 6-8
Saginaw Public Schools Saginaw
Webber Middle School 6-8 Starfish Family Services Wayne Inkster High School 9-12 * Amble Elementary served students in Spring 2003 but has closed; Larson Elementary will begin serving students in Fall 2003.
2

21st Century Program History
The programs authorized under Title IV, Part B, of the No Child Left Behind Act evolved from an earlier federal program of the same name. The 21st CCLC is the latest evolution of after-school programs that have a long history based in the community education movement. In fact, Flint, Michigan, is the birthplace of community education. The brainchild of Frank Manley, a Flint teacher, and funded by the C.S. Mott Foundation, the first after-school programs were established there in 1935 to provide health, recreation and adult education. During the succeeding decades the community school model developed and flourished in Flint and spread throughout the nation.
When originally authorized by Congress in 1996, the 21st Century Community Learning Centers program’s focus was on more efficiently using school resources and was designed to create “community learning centers” to open up schools for broader use by their communities (Gunderson, 2003). In 1998, under the Elementary and Secondary Education Act, the program was refined to encourage school-based academic and recreational activities after school and at other times when schools were not in regular session (U.S. Department of Education, 2003). These programs emphasized providing a safe place after school where children could continue to learn (de Kanter, Fiester, Lauland, & Romney, 1997).
With the advent of the Bush administration, the Elementary and Secondary Education Act (ESEA) was reauthorized as the No Child Left Behind Act of 2001. The new legislation stressed serving students who were academically at risk, requiring that programs focus on expanded educational enrichment opportunities for children attending low performing schools (No Child Left Behind Act of 2001). In addition, the Michigan Department of Education specified that each school for which services are provided must have at least 30% of its students qualifying for free or reduced lunch, an indicator of low family income.
Since 1999, when federal funding was first awarded to six rural and four urban school-communities, the grantees have increasingly represented urban school-communities, resulting in high concentrations of programs in the southern region of the state, where most urban areas are located. Of the 63 grantees funded through January 2003, only eight have been in communities north of Saginaw and only one grantee was in the Upper Peninsula. Appendix B provides an historical list of all funded sites, including both 2003 Cohort A, about which we report here, and 2003 Cohort B, subsequently funded in August 2003.
County and School District Characteristics
In this section, we identify a set of contextual factors including those demographic characteristics broadly shared by all people in the same geographic area that may present challenges for students’ academic and/or developmental success. We have chosen to highlight three factors—the economic characteristics of the region, family demographics, and school district attributes—that create pressure for the types of interventions that 21st Century programs offer.
3

Data are reported at the county and school district levels. The 13 grantees are geographically distributed in eight different counties and 11 school districts. Several grantees are located in the same county and thus share demographic attributes: Flint Community Schools and the International Academy of Flint are located in Genesee County; and Detroit Public Schools, Highland Park Community Schools and Starfish Family Services Center, serving Inkster Public Schools, are located in Wayne County. The Genesee county grantees are located in two different school districts: Flint Community Schools and Flint Public Schools (International Academy of Flint).
Economic Characteristics Poverty conditions exacerbate the many challenges inherent in daily living and these challenges can be experienced by families in both urban and rural areas. Wayne and Clare Counties share the distinction of being 2nd and 3rd, respectively (out of 83 counties) in the percent of the population age 18 or younger who live below the poverty level. Clare County’s 11.8% unemployment rate is over 1.5 times the state unemployment rate (7.2%). Further, all but one of the grantees’ counties equal or exceed the state unemployment rate1. Wayne County, at 16.1%, has twice the state rate (8.4%) of children with no parents in the workforce and only Kent and Washtenaw counties have rates below the state average (see Appendix C, Table C-1 for complete data).
Family Characteristics Two attributes of families are relevant for our purposes: 1) families as a locus for nurturance and 2) parents as models for the importance of educational achievement. High need parents are less able to nurture their children. Two situations may create pressure on parents. First, adults parenting alone are placed under more stress than those raising children together. In Michigan, 24.5% of children live in a single-parent household. This rate is exceeded in five of the eight counties served by grantees. In Genesee, Saginaw and Wayne counties, almost one third of children live in single-parent households.
Second, teen parents consistently experience greater difficulty in meeting life goals, such as education and self-sufficiency (Furstenberg, Brooks-Gunn, & Morgan, 1987). Among these counties, all but Washtenaw equal or exceed the state rate for teen births. Babies are born to teen mothers in Genesee and Wayne counties 1.5 times as frequently, and almost twice as often in Berrien and Calhoun counties, as the average for young women in Michigan.
A high school diploma is one indicator of the importance of education. Having a baby means dropping out of school for 80% of teenage mothers, and only 56% finally graduate from high school (Armstrong & Waszak, 1992). Among these eight counties, all but one exceeds the state high school drop out rate, 11.9%, for the percent of the population aged 25 or older with no diploma. Again, Clare and Wayne counties share the distinction of having the highest rates, 17.5% and 16.9%, respectively. While there are approaches that low-literacy parents can use to help their children with school work, such adults are at a disadvantage compared to those with greater skills. Among the counties with grantees, five of the seven have literacy rates lower than the state average of 13.7%, and Clare
1 Willow Run, the city encompassing Eastern Michigan University’s 21st Century grant, is an anomaly in Washtenaw County. For example, Willow Run has more families living below the poverty level than the rest of the county (17% vs. 11%) and Ypsilanti Township (Willow Run) has lower literacy rates than the county (38% vs. 20%).
4

County, at 5.5%, is almost 3 times lower. Table C-2 in Appendix C presents complete data.
School District Characteristics The federal legislation requires that 21st Century programs serve students in low performing school districts. One indicator of a low performing school is the high school drop out rate. In Michigan, 5.5% of high school students drop out before graduating. As the chart shows, among the high schools that these grantees’ students could be expected to attend, the drop out rate ranges from a low of 2% for the five host schools in the Clare-Gladwin Public School District to a high of 30.4% for the five host schools in the Highland Park Community School District (see Figure 1).
MDE added the criterion that school districts should have at least 30% of their students eligible for free or reduced fee lunches. The competition for 21st Century awards was such that not only did all funded grantees meet this criterion, but only two of the 43 host schools had fewer than half of their students eligible, and these had 38% of their students qualifying for free or reduced fee lunches. The average for grantees across multiple schools ranged from 61% to 86%, well exceeding the state average of 32%. A table of service sites by school district and their accompanying data can be found in Appendix C, Table C-3.
There are clear and compelling community conditions that demonstrate need for OST programs for students and their families. In the next section we profile the grantees, describing the community and school factors that support their initiatives, their programs, and their challenges.
5

Figure 1
School Drop-Out Rates 2000-2001
2 2.6 3.24.4
5.57.2
8.3 8.5 9.5
12.213.9
15.5
30.4
0
5
10
15
20
25
30
35
Clare-G
ladwin
Grand R
apids
Saginaw
Willow R
un
MICHIG
AN
Calhoun
Flint C
ommunity
Inkster
Flint P
ublic
Detroit P
ublic
Benton H
arbor
Flint C
ommunity
Highland Park
Lower than State State Average Higher than State
6

2. Grantee Profiles The first 13 Michigan Department of Education grant awards were made to 11 grantees in January 2003. Unless otherwise noted, all tables refer to these 11 organizations. In this section several topics are presented. First, prior support for OST programming and the goals of these funded programs are presented. Then we describe grantees’ initial program management and policy structures, the programs delivered, and the participation by students and their families the grantees have achieved. The section concludes with a synthesis of the grantees’ accomplishments. Data reported in this section come from three sources: grantees’ proposals, their Annual Performance Reports (APRs) and their Evaluation Survey Checklists No. 2.
Prior Support for OST Programming
Grantees might benefit from two types of support for out-of-school time (OST) programming: the support available in their surrounding community and the support available within the schools.
Community Support The grantees are similar in the substantial prior community support for OST programming they report. One indicator of community support for OST activities is the tangible evidence of a community emphasis on programming for youth. Almost all (10 out of 11) grantees report that “providing positive alternatives for youth is an active community priority” and most (9 out of 11) say that “OST programming was a pre-existing community priority.”
Several of the grantees’ communities have a history of OST programming. For example, Flint is the birthplace of community education, and youth programming has been in existence in Flint for over 60 years. More recently, the United Way of Genesee County (encompassing Flint) has provided leadership for a county-wide after-school initiative called “Bridges to the Future.” Efforts in the Grand Rapids community have resulted not only in the development of an explicit vision statement to promote youth access to quality learning programs, but also in their selection as one of eight cities to receive funds from the National League of Cities to examine Expanded Learning Opportunities. In recognition that ongoing support is necessary, the Detroit Positive Youth Development Consortium was formed to obtain funding for positive youth development activities held during the after school hours. In at least one community, Saginaw, there is the expectation that this 21st CCLC grant will have a reciprocal impact on the community. They reported that their grant was submitted in order to synchronize and organize community partnerships that will, in turn, improve the lives of children and their families.
7

Collaborators/Partners Partnerships are crucial to the success of these 21st Century programs; no single entity will be able to carry out the diverse goals defined by the grantees. While the existence of prior collaboration does not eliminate all challenges among partners, it can contribute to a faster start (Melaville, 1998; Walker, Grossman, & Raley, 2000). The following table provides a summary of the prior relationships with their partners reported by these 11 grantees.
Table 2
Percent of Grantees Reporting Specific Types of Relationships with Partners
Percent (number) of grantees Relationship reported
100% (11) Our grant partners have worked together on other efforts to promote positive youth development or family stability.
100% (11) Our grant partners and/or activity providers have already been delivering some of these services in other schools in the school district.
91% (10) Our grant partners/activity partners serve on community coalitions together.
82% (9)
Our grant partners and/or activity providers have already been delivering some of these services in one or more of the targeted CLC schools.
73% (8)
Our grant partners were already working together on a prior federally funded 21st CCLC effort.
64% (7) Our grant partners have worked together in the past to write other grants.
Source: 21st Century Community Learning Center Statewide Evaluation Survey Checklist No. 2 (June 3, 2003).
Most of the grant partners had substantial prior relationships that could be brought to this effort. In the original proposals, the collaborators named by grantees included an array of organizations:
Local schools (8 grantees) •
•
•
•
•
•
•
•
Youth development agencies (7 grantees)
Mental health/social service agencies (5 grantees)
Units of local government (5 grantees)
Other networks or councils (4 grantees)
Cultural groups (2 grantees)
Literacy organizations (2 grantees)
Parent groups (2 grantees)
In addition, collaborators/partners named by individual grantees included businesses, libraries, the United Way and other nonprofit organizations.
These partners perform many functions for 21st Century programs. At the level of 21st Century program management, all the grantees report that the school district is involved in 21st Century program management and approximately half (55%) report that youth development or human service organizations are involved. The other types of organizations—public organizations (i.e., units of local government), voluntary or civic organizations, and for profit organizations—may be involved in management at other
8

project levels (i.e., daily, site or activity management) or in activity delivery. The involvement of these partners is more fully discussed in later sections.
Educational System Support for OST Programming Either or both the school district and the individual target schools could be supportive of OST programming. Table 3 shows the frequency and percentages of grantees where the school district was already promoting OST programming or services. As can be seen below, most school districts were promoting OST programming for youth.
Table 3
Prior OST Programming and School-Based Services for Students
Percent (number) of grantees Type of programming/service
82% (9) The school district was already promoting OST programming for youth.
46% (5) The school district sponsored health and human services for youth and/or their families.
91% (10) The school/agency has some OST programming for youth in place.
Source: 21st Century Community Learning Center Statewide Evaluation Survey Checklist No. 2 (June 3, 2003).
School districts promoting OST programming supported a wide range of activities. Many of the activities involved academic enrichment such as tutoring or extended day opportunities. A few sites had specific homework programs and one program had been used at a site to improve MEAP scores.
Some of the school districts worked with outside collaborators to bring programs into the schools. Many of these collaborations have since been incorporated into the 21st Century programs. For instance, United Way has provided leadership through the community-wide Bridges to the Future initiative started in 1997. A different site had used programs initiated by Boy and Girl Scouts in the school system and continued this practice in their 21st Century program. In addition to the academic learning component, some of the sites offered sports and/or recreation programs. An overwhelming majority of the grantees (91%) answered that the school or agency had some OST programming for youth in place prior to receiving the state 21st Century funding.
School district sponsorships of health and human services for youth and/or their families existed but were not similarly universal. About half of the grantees reported that these services were provided by the school district.
Organizational Classification, Emphasis and Progress
Under the No Child Left Behind Act of 2001, eligible applicants include local education agencies (LEAs), defined as local school districts, intermediate school districts, and public school academies, as well as community-based and faith-based organizations. Thirteen awards were made to 11 grantees in January 2003. The classifications of grantees were as follows:
9

• Five local school districts (Battle Creek Public Schools, Detroit Public
Schools [two grants], Flint Community Schools, Grand Rapids Public Schools, Highland Park Public Schools and Saginaw Public Schools)
•
•
•
•
One intermediate school district (ISD; Clare-Gladwin Regional Educational School District [two grants])
One public school academy (International Academy of Flint)
One university (Institute for Community and Regional Development, Eastern Michigan University)
Two nonprofit organizations (Boys & Girls Club of Benton Harbor, Starfish Family Services [Inkster]).
The latter two categories represent alternative types of community-based organizations. These 11 grantees proposed to serve students and their families at 46 schools.
Grantees’ Objectives Grantees submitted proposals in which they committed to provide expanded academic enrichment opportunities for children who are attending low performing schools. In addition, they proposed to provide some combination of youth development activities, drug and violence prevention programs, technology education programs, art, music and recreation programs, counseling, and character education to enhance the academic components of the program. Services to families of enrolled students were also offered (i.e., improve academics, provided needed services to families, etc.).
Most grantees placed primary emphasis on their academic enrichment components and secondary emphasis on youth development activities; only two grantees rated youth development as the major focus of their program. One is a local affiliate of a national youth development organization; they were therefore acting in accord with their mission to focus on youth development activities first and academic enrichment second. The other grantee reported that this was an emphasis that their community identified for OST programming.
In their grant-level APR report, grantees reported on the progress made toward each of their objectives. For each grantee, the objectives were categorized2 in the five emphasis areas presented in Survey No. 2 (see Table 4).
The data provided in this table requires some interpretation. First, although grantees wrote objectives that they expected to accomplish over the life of their grants, in these first six months not every objective had associated actions. For example, the grantees’ APRs identified host schools where little or no programming took place. Second, the number of days grantees had available for programming toward their objectives ranged from 20-87, with an average of 44 days3. (Recall that the average number of days grantees offered programs was 36.) Therefore, the “progress toward” designation may
2 The categorization is based on a variable number of objectives per grantee. That is, one grantee may have had two objectives that were assigned to a category, while another grantee had six. Further, grantees committed to providing specific activities, but this was not consistently reflected in their objectives. For example, all grantees provided academic enrichment activities per reports elsewhere in the APR, but only some wrote objectives specifically targeting these activities. 3 In this calculation, the two Clare-Gladwin grants and the two Detroit grants were entered separately because there were differences in the number of days that each separate grant operated. The average is itself based on each grantee’s average days for the sites it operated.
10
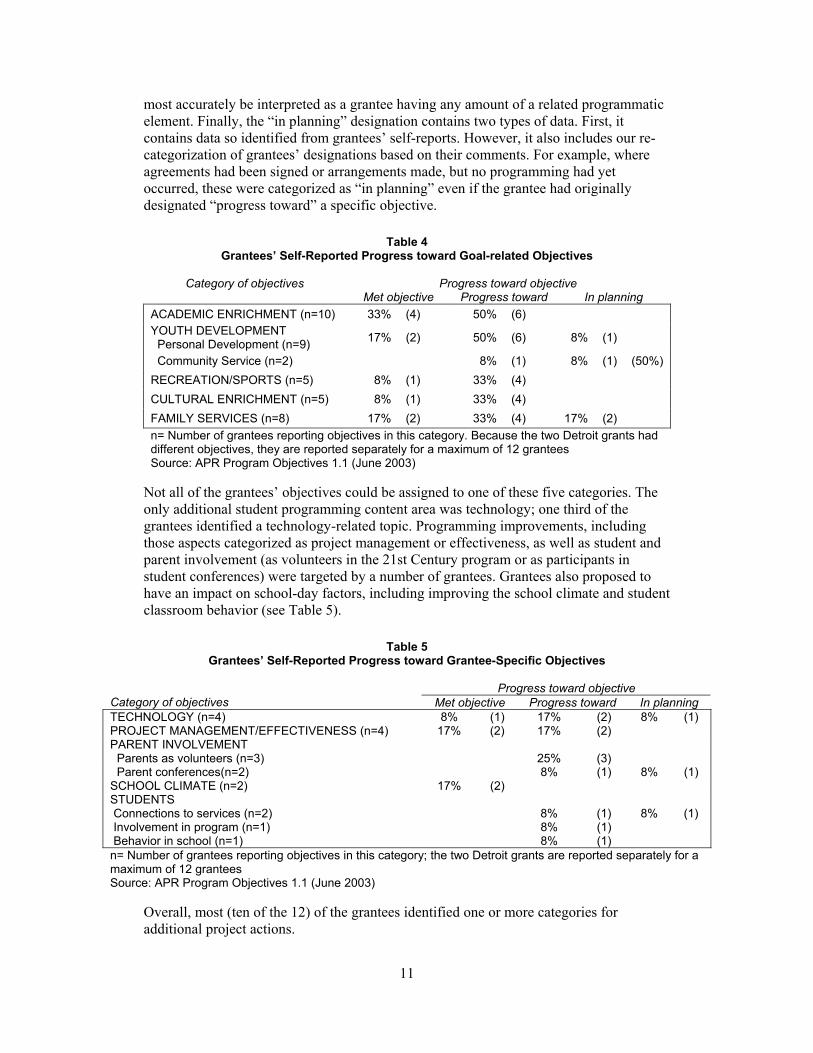
most accurately be interpreted as a grantee having any amount of a related programmatic element. Finally, the “in planning” designation contains two types of data. First, it contains data so identified from grantees’ self-reports. However, it also includes our re-categorization of grantees’ designations based on their comments. For example, where agreements had been signed or arrangements made, but no programming had yet occurred, these were categorized as “in planning” even if the grantee had originally designated “progress toward” a specific objective.
Table 4
Grantees’ Self-Reported Progress toward Goal-related Objectives
Progress toward objective Category of objectives Met objective Progress toward In planning
ACADEMIC ENRICHMENT (n=10) 33% (4) 50% (6) YOUTH DEVELOPMENT Personal Development (n=9) 17% (2) 50% (6) 8% (1)
Community Service (n=2) 8% (1) 8% (1) (50%) RECREATION/SPORTS (n=5) 8% (1) 33% (4) CULTURAL ENRICHMENT (n=5) 8% (1) 33% (4) FAMILY SERVICES (n=8) 17% (2) 33% (4) 17% (2) n= Number of grantees reporting objectives in this category. Because the two Detroit grants had different objectives, they are reported separately for a maximum of 12 grantees Source: APR Program Objectives 1.1 (June 2003)
Not all of the grantees’ objectives could be assigned to one of these five categories. The only additional student programming content area was technology; one third of the grantees identified a technology-related topic. Programming improvements, including those aspects categorized as project management or effectiveness, as well as student and parent involvement (as volunteers in the 21st Century program or as participants in student conferences) were targeted by a number of grantees. Grantees also proposed to have an impact on school-day factors, including improving the school climate and student classroom behavior (see Table 5).
Table 5
Grantees’ Self-Reported Progress toward Grantee-Specific Objectives
Progress toward objective Category of objectives Met objective Progress toward In planning TECHNOLOGY (n=4) 8% (1) 17% (2) 8% (1) PROJECT MANAGEMENT/EFFECTIVENESS (n=4) 17% (2) 17% (2) PARENT INVOLVEMENT Parents as volunteers (n=3)
25%
(3)
Parent conferences(n=2) 8% (1) 8% (1) SCHOOL CLIMATE (n=2) 17% (2) STUDENTS Connections to services (n=2)
8%
(1)
8%
(1) Involvement in program (n=1) 8% (1) Behavior in school (n=1) 8% (1) n= Number of grantees reporting objectives in this category; the two Detroit grants are reported separately for a maximum of 12 grantees Source: APR Program Objectives 1.1 (June 2003)
Overall, most (ten of the 12) of the grantees identified one or more categories for additional project actions.
11

Program Management and Staffing
Evidence is accumulating that quality OST opportunities matter (The Forum for Youth Investment, 2002). From a management perspective, effective program managers must continuously monitor program quality beginning in the earliest stages of implementation and use the results of these assessments to make timely adaptations that respond to problems identified or changes in the program context (Pane, Mulligan, Ginsburg, & Lauland, 1999). In addition, managers need to establish good communication among staff, schools, partners, participants and the community in order to build consensus, ensure program consistency, facilitate linkages to the school day and enlist community support for sustainability (Pane et al., 1999).
In these early months of program implementation, 21st Century grantees’ major tasks revolved around getting high quality programming “off the ground” and establishing lines of communication to facilitate cooperation and support among stakeholders. In this section, we discuss the accomplishments and challenges of the early implementation process and the progress that grantees have made in setting up processes for management, decision-making and communication among various stakeholders.
Well-qualified, trained program staff are an essential resource for quality programs, and recruitment and retention of qualified staff are ongoing responsibilities of program management (Hall et al., 2003). In addition, strong management can facilitate the development of an organizational structure to sustain high quality programming. In this section, we describe the progress that grantees have made in hiring and training quality staff and in implementing structures for program management and governance. These descriptions are based on information obtained from administrative staff of the eleven grantees.
In the first phase of program implementation, managers had several major tasks:
Hiring qualified staff •
•
•
Implementing initial and ongoing staff training
Implementing structures for program management and governance.
Staffing
Project Management Staff One key to success of after-school programs is selecting management staff who are able to perform the multiple roles of leader, mentor and manager (Fletcher, 2002). They must be able to blend divergent and sometimes conflicting perspectives in order to move the program toward a common vision.
In general, project management staff of the 21st Century programs include a director who reports to the grant fiscal agent and is responsible for overall project management, and site coordinators who report to the project director and are responsible for site-level management. Minimum qualifications for project directors varied from general “credentials and experience” related to management of educational or youth programs to more specific qualifications, such as a B.A. or M.A. and a minimum number of years of related experience. Some grantees preferred that site coordinators be certified teachers
12

and/or be working in the school district. However, for one grantee, the sites coordinators were simply one of the activity instructors at each site who was designated “lead.” All grantees reported that project management staff were completely “on board” by June 2003.
Table 6
Progress on Staffing of 21st Century Programs as of June 2003
Percent (number) of grantees
Type of staff Full staffing Partial staffing No staffing yet Project management 100% (11) 0% (0) 0% (0) Academic enrichment staff 73% (8) 27% (3) 0% (0)
Cultural enrichment staff 73% (8) 18% (2) 9% (1)
Youth development staff 82% (9) 18% (2) 0% (0) Family services staff 55% (6) 36% (4) 9% (1)
Administrative and support staff 82% (9) 18% (2) 0% (0) Source: 21st Century Community Learning Centers Statewide Evaluation Survey Checklist No. 2 (June 3, 2003).
Program Activity Staff A stable, well-qualified program staff is another critical factor in program quality (Hall et al., 2003; Pane et al., 1999). In high quality programs, activity staff have knowledge of positive youth development and experience working with school-age youth as well as skills in the particular activities or subject areas (Hall et al., 2003).
Academic Enrichment Staff Grantees varied in the qualifications they looked for in academic enrichment staff. Typically, at least some of the academic enrichment staff at each site were certified teachers. Only two sites reported having no teachers as academic enrichment staff. Most grantees used other staff in combination with teachers for academic enrichment. Other academic staff included paraprofessionals, college students, adult volunteers, and in one case, high school student aides. Eight of 11 grantees reported having hired a full complement of academic enrichment staff, while three grantees reported having partial staffing by June 2003 (see Table 6, above).
Other Enrichment Staff Qualifications for staff in other program areas varied widely, depending on the job and the grantee. Some grantees used teachers for other activities, but others looked for people who had an interest in and experience working with youth. Some required a minimum educational level of high school diploma or GED, and one grantee preferred an associate’s degree; others stated that they looked for persons of any educational level who had the ability to engage children. Program staff might be hired because they had a specific skill that was related to a program area, such as artistic ability for an arts program; others were sought out because they had a skill needed to address a characteristic of the student population, such as English as a Second Language teachers for a site serving many Spanish-speaking children. Two grantees specifically reported looking for people who had a “passion” for the work rather than those who wanted to earn some extra money. Many activities were run by community partners, and for those
13
components, staff qualifications depended on the personnel policies of the partner agency.
As shown previously in Table 6, most programs (82%) had a full complement of youth development staff, while 72% had completed hiring of cultural enrichment staff. Nine of the 11 grantees (82%) had a full complement of administrative/support staff. The family services programming area was the least developed component, with only 55% reporting having completed staffing in this area.
Challenges to Staffing Attracting and retaining qualified staff was a challenge for some grantees. Two grantees reported difficulty in recruiting staff whose ethnic composition closely matched that of their student population. One grantee responded to recruitment challenges by restructuring jobs to make them more attractive—combining duties to make more jobs full time, offering staff development opportunities, and involving staff in planning and evaluation. Another was exploring partnerships with universities to get student assistants as a lower cost staff alternative.
In a few instances, there were initial difficulties between grantees and their community partners stemming from differences in staff pay scales or qualifications or from disagreements as to who should control staffing. One grantee reported that use of community partners for many activities led to too much staff turnover. Grantees are resolving differences with partners by restructuring management responsibilities and/or developing partnerships with new agencies in their communities that can provide better or more consistent staffing.
Several grantees reported that hiring is not complete because some program components are still in development. As new components are developed, additional program and support staff will be hired.
A few grantees reported that difficulties in recruiting and hiring program staff delayed implementation of some program components. It is interesting to note that one grantee reported having attracted a large pool of qualified applicants, but hiring was delayed by the fact that the employer did not have an appropriate job classification.
Staff Training Having a well-qualified staff in place is a major step toward implementing a quality program. However, initial and ongoing staff training and coaching are essential to maintaining program quality (Fletcher, 2002), although it may be challenging to schedule training when so many staff are part-time. In the initial implementation stage, five of the 11 sites reported having specific and comprehensive training models currently in use, while the remaining six reported that they intend to do so in the future.
Content of staff training offered so far varied widely. Several grantees offered training in basic skills, such as CPR/first aid and medication administration or class management. Two grantees mentioned initial training focusing on communicating program goals and objectives and school district accountability standards and/or procedures. Other training centered around teaching techniques, such as tutoring or conflict resolution, or specific program curricula. One grantee mentioned plans to develop individualized staff development plans for each staff person.
14

Most said that staff training would begin in the summer or fall, when all staff are in place. One grantee said that high staff turnover among partner agencies delayed the implementation of the staff training plan.
Program Management and Governance Management refers to the process of scheduling and coordinating activities and monitoring daily operations. Governance includes policy decisions about activities to be offered, staffing patterns and sustainability plans (Walker, Grossman, Raley, Fellerath, & Holton, 2000). Strong management that supports clearly defined goals and objectives as well as procedures that protect children and staff is important to ensure program quality (Pane et al., 1999). Governance should facilitate the development of partnerships and collaborative relationships that lead to a shared vision while also insisting on accountability and feedback to improve performance. Involvement of families, school personnel and community partners in program management and governance are also indicators of program quality (Pane et al.). Grantees used a variety of structures for program management and governance.
Program Level Management Table 7 illustrates the organizations that are involved in management at the program and site level for the 11 grantees. For most grantees, the school district participated in overall management, and for about half, a community-based or non-profit organization shared this responsibility. Five grantees reported the involvement of other types of organizations at the program level of management.
Table 7
Organizations Involved in Specific Types of Management
Percent/number of grantees
Organization CLC
management Daily
operations Site level
management School district 91% (10) 45% (5) 27% (3) Local school 9% (1) 45% (5) 64% (7) Community-based or non-profit youth development or human service organization 55% (6) 55% (6) 55% (6)
Public organization 9% (1) 9% (1) 9% (1) College or university 9% (1) 9% (1) 9% (1) Voluntary or civic organization 9% (1) 0 0 For-profit organization 9% (1) 0 9% (1) Other 9% (1) 9% (1) 18% (2) Source: 21st Century Community Learning Center Statewide Evaluation Survey Checklist No. 2 (June 3, 2003).
Responsibility for daily operations at the program level were more evenly distributed between school districts and local schools, with five grantees reporting that school districts participated and five reporting that local schools participated. Six grantees reported that community-based or non-profit organizations helped manage daily operations, and three grantees reported the involvement of other types of organizations.
At the site level, management responsibilities were more frequently placed with the local school (7) than with the school district (3). Community-based or non-profit organizations
15

participated in management in six instances and five other organization types participated in site level management.
Management Structures Programs described different management structures. Several grantees reported that the project director or the director in consultation with district administrative personnel made most of the decisions about program management and daily operations. In other instances, site coordinators and/or community partners were involved in overall management and daily operations. (See Appendix D for the definitions of roles provided in the Checklist.)
At the site level, management structures were more diverse. A number of grantees reported having a site-level management team made up of project staff and teaching or administrative staff at the school, and in some instances, community partners contributed to the management team. One grantee had two management teams, one for operations and one for curriculum, while another grantee included parents and youth on the site level management team. For one grantee, each site was managed by a different community organization.
Management Challenges Several grantees reported that coordinating and learning to work with the schools or community partners was initially a challenge. In one case, strains in program management emerged because of differences in philosophy between the school district and the community partner. Daily communication with schools and partners was important for smooth running of programs. For example, one grantee mentioned that the ability of a site manager to put the school staff at ease facilitated smooth implementation. Two grantees had a change of leadership that delayed start up, and one grantee mentioned a need to continually review progress toward objectives in order to keep the program on track.
Program Governance Grantees had multiple avenues for obtaining input about program governance. Some had a collaborative body made up of community groups, partners, and participants that helped set policy, and others had an advisory committee that performed similar functions in an advisory rather than a decision-making capacity. Many had a management team that made decisions about daily operations or, in some cases, a leadership team that may have included youth. In addition, programs sometimes solicited input about program decisions directly from youth, adult participants, parents or others in the community. Eight grantees reported that in their program some of these roles are combined.
Table 8 indicates which individuals and groups participated in program decision-making for the 11 grantees. As this table illustrates, the project director and/or management team were involved in decision-making about policy and management at all levels, while the fiscal agent was more likely to participate in decisions about policy or overall management than about site-level management or daily operations. Site coordinators were more likely to participate in decisions about site-level management, although for about half the grantees they also participated in decisions at higher levels.
The collaborative body was most often involved in policy decisions but much less likely to participate in decision-making at other levels. Advisory committees and leadership teams participated with similar frequency at all levels of decision-making.
16

Table 8 Groups Participating in Program Decision-Making
Percent/number of grantees
Decision maker
Role exists at 21st Century
program Program
policy Program
management Daily operations Site
management Collaborative body 73% (8) 73% (8) 27% (3) 9% (1) 9% (1) Advisory committee 64% (7) 55% (6) 27% (3) 36% (4) 18% (2) Grant fiscal agent 91% (10) 64% (7) 55% (6) 27% (3) 27% (3) Management team 73% (8) 64% (7) 64% (7) 45% (5) 64% (7) Leadership team 64% (7) 55% (6) 45% (5) 27% (3) 27% (3) Project director 91% (10) 91% (10) 91% (10) 73% (8) 82% (9) Site coordinators 73% (8) 55% (6) 45% (5) 55% (6) 91% (10) Youth participants 27% (3) 0 0 9% (1) 27% (3) Adult participants 36% (4) 18% (2) 0 9% (1) 27% (3) Parents of youth 36% (4) 18% (2) 0 18% (2) 27% (3) Source: 21st Century Community Learning Center Statewide Evaluation Survey Checklist #2 (June 3, 2003).
Youth were involved in decision-making for only three grantees and adult participants and parents for four grantees. In no instance were youth involved in decisions about policy or overall management, but in two cases parents and adult participants contributed at the policy level. Although the majority of grantees had not yet developed processes for participant input into decision-making, where it occurred youth, parents and adult participants were most often involved in decision-making about site management or daily operations. Five grantees reported that parents participated in evaluation of program activities.
In summary, every grantee had a project director who was involved at all levels of decision making and a grant fiscal agent who participated to a lesser degree in program policy and management. Almost all had a collaborative body that was involved in policy making and a management team who were also involved policy making as well as program and site management. Site coordinators concentrated on site management. Those grantees who involved participants and parents did so almost exclusively at the site management level.
Communication and Coordination of Services
As mentioned earlier, good communication is essential to successful implementation and helps to build capacity to sustain programs over the long term. Communication should occur among program staff, between program staff and all stakeholders, including school leaders, parents, and community groups.
In the early implementation phase, grantees were faced with developing communication processes that would:
Facilitate communication among staff to ensure program consistency •
•
•
Foster links with the school day
Build community support for programs
17

Communication Among Program Staff Regular communication among program leaders and staff, including community partners, ensures that program vision, goals and objectives are shared among all staff and that professional development needs of staff are identified and met. Most grantees used staff meetings as the primary method of communication among program staff. Most often staff meetings were held at the site level, although some grantees had program level staff meetings less frequently. Most grantees held staff meetings on a weekly or monthly basis, but one grantee reported holding daily staff meetings. Other staff communication methods include e-mail, cell phones and written reports.
Communication between Program and School Good communication between program staff and school personnel, especially principals and teachers, can greatly facilitate program implementation and enhance chances of program success (Fletcher, 2002; Pane et al., 1999; Walker et al., 2000). Grantees reported that communication with the schools regarding management issues took place most frequently through communication between the principal and the site coordinator or program director. Another common communication method was to have program staff participate in school committees or sit on the school management team. In some cases, the principal or other school staff were included in the program management team.
Communication with the Community Communication with the larger community builds support for the vision of the program—in particular, for community investment in positive youth development as opposed to problem-focused youth programs (Hall et al., 2003). This support can help in participant recruitment and retention and is one step in building a plan for sustainability.
At this early stage of implementation, many grantees were just beginning to build structures for the systematic involvement of parents and families and for making plans for communicating with the broader public. As we saw in Table 8, so far only three grantees have included youth and parents in decision-making. However, additional sites report that they plan to involve students and parents more in the summer and/or fall. In a few cases, programs mentioned involving agency or school board members and members of the local business community on advisory or planning committees. Others are using community members including professionals and business leaders as program volunteers.
Program Elements The core of any effective OST program is high quality activities that support positive youth development and learning. In their review of current practices in OST programs, Hall and colleagues (2003) found a number of common features among effective programs. These features include activities that provide 1) challenging experiences, 2) a safe and caring environment, 3) clear rules, 4) high expectations, 5) positive relationships with adults and peers, 6) opportunities for choice and 7) contribution to the group and the community.
The grantees’ major early implementation task was to initiate programming that would engage youth participants and their families while achieving the intended outcomes. In particular, middle school sites identified issues with providing activities that “meet their
18

[students] interests or sparks their interests.” In this section we will review the progress to date and challenges grantees faced in starting program activities. Eight of the 11 had specific documents related to program elements. These data were supplemented with the information from the implementation checklists, administrator interviews and APRs.
Assessment of Participant Interests and Needs Program staff at most of the sites conducted some form of activity needs assessment among the children/youth they were trying to attract. However, the majority of the assessments appeared to be based on verbal interaction and typically focused on existing participants rather than youth attending the school who had not yet joined. All of the grantees identified input from children/youth as essential to providing attractive activities. They expressed a need to focus not only on academic needs but also on interesting, experiential activities that were either requested or designed by potential participants. Respondents made it clear that while structured learning environments were essential, it was important to also provide “fun and creative ways to enjoy” learning. Creating interesting activities for middle school students was identified as more difficult than for elementary school students.
Program Emphasis Grantees were asked to rate the relative emphasis they placed on each of the five main program components: (a) academic enrichment, (b) cultural enrichment, (c) youth development, (d) recreation/sports, and (e) family services. Academic enrichment received the most emphasis, with nine grantees ranking it first and two ranking it second in emphasis. Youth development ranked second, with two grantees ranking it first and four ranking it second. Recreation/sports was ranked third, followed by cultural enrichment and finally, family services. Grantees also reported the total number of hours of programming that were offered each week for various types of activities. At most sites, academic programming of various types was offered for more hours than any other type of activity. Academic activities were classified as homework help/ tutoring, reading/literacy, mathematics, and/or science. Most grantees offered more hours of homework help/tutoring and reading/literacy activities than of math or science programming. Homework help was offered at all sites by all but two grantees. Most grantees offered several types of academic activities, although one grantee offered only one hour per day of homework help/tutoring at one site. Another grantee offered no academic programming at all at one site; this was due to their inability to recruit partners and they expect to do so this fall.
Nine grantees also offered activities in technology, video, and media at some of their sites. While not technically an academic activity, these activities may relate closely to academic activities. Other program categories included arts/performing arts, sports/games, community services, culture/social studies, health/nutrition, youth development, and family services. See Table 9 for an illustrative list of activities mentioned by grantees. The number of programming hours that grantees devoted to the nonacademic activities varied widely. Sports/games were the second most emphasized for some grantees, while others offered more hours of youth development or arts/performing arts. A few grantees devoted a number of programming hours to health/nutrition activities. Many of the sites noted the value of partnering with other providers to deliver the widest spectrum of activities to participants.
19

Table 9
Program Categories and Activities
Category Activities Educational
Tutoring, LEGO (robotics), MEAP preparation, computer skills, internet, writing, reading, math, science
Language arts Creative writing, reading Creative arts
Drawing, painting, arts & crafts, photography, creative writing, computer graphics, cooking
Performing arts Dance, theater, music, cheer leading, flags Personal development
Self-esteem building, self awareness, personal hygiene, abstinence and pregnancy prevention, service learning activities, career development and/or exploration, life skills, conflict resolution, positive decision making, drug/alcohol awareness, counseling
Games Passive games Board games, computer games Cooperative games Double Dutch Competitive games Table air hockey, ping pong, kickball
Individual sports Inline skating, karate Team sports Basketball, volleyball, softball/baseball Field trips Museums, zoos, sporting events, bowling, libraries Special events Spring Fling, Octoberfest, weather & science fair, art fair/festival Clubs
Torch Club, Keystone Club, Boy/Girl Scouts, YMCA, youth councils, student clubs
• • •
Academic Enrichment
Approaches to Academic Enrichment A number of different approaches could have been used to deliver academic enrichment components. It was clear that each of the grantees was attempting to offer after-school academic enrichment opportunities. Almost all of the grantees offered some form of tutoring program. Most of the tutoring was either one-on-one or provided a very low participant-to-teacher ratio. The highest ratio was four to one.
Four grantees said that their primary academic enrichment components emphasized small-group instructions using different materials or processes that were employed in the school day, while two reported using small group or class instruction reinforcing the school day curricula. Two grantees said homework help was a primary strategy; in one case the homework help was initiated by the student and in the other, it was initiated by the classroom teacher (i.e., “Jim needs help with fractions…”).
Many creative strategies were employed to incorporate academic enrichment. Several sites provided field trips to museums and used this experience to reinforce reading, writing and arts. In some cases, these field trips also incorporated science and math into the experience.
Links to the School Day Curricula Over half of the sites indicated that they worked with principals and/or teachers to ensure that the academic enrichment activities were connected to the ongoing school curriculum. Respondents indicated that this required constant effort to ensure that communication took place. It was apparent from these administrators that consistent communication with
20

school personnel was essential in obtaining buy-in from the teachers and school administration.
All but one of the grantees reported that they were making informal contact with teachers about specific students, and in almost two thirds of these cases, they also formalized their contacts about specific students. Only three grantees had transformed these formal contacts into reporting structures for all of the 21st Century participants with their teachers. In two of the three instances, a ready explanation could be that these programs already had 21st Century programs in the school system. However, the third grantee, Clare-Gladwin, was not able to build on an already-in-place 21st Century program, although it did have an after school program at all of those schools, which may have facilitated the development of formalized program-school links. Structured linkages between the 21st Century program and the school may be an advanced step in the development of program organization, able to be well-implemented only after management of internal activities and processes are solidly in place.
Several different methods were used to link activities to school-day curricula. In a majority (nine) of the programs, classroom teachers participated in the 21st Century program and informally made connections with the school-day curriculum. In addition, nine grantees reported that 21st Century program components were designed to reinforce or extend classroom curricula. Thus far, only three grantees have trained program staff in instructional models used during the school day, but an additional five grantees planned to develop this strategy in the future.
It is too early in the implementation process to do any systematic analysis of program outcomes. However, anecdotally, over half of the respondents indicated that participants, parents, teachers and school administrators believed that participants’ performance in the classroom was enhanced as a result of the 21st Century program.
Youth Development Youth development activities ranked second in emphasis overall. However, among the 11 grantees, its importance ranged from first to fourth in program emphasis. Both grantees that placed primary emphasis on youth development had a history of youth development programming. One grantee is a community based organization whose five core programs are youth development focused. Another grantee reported that they were responding to the community’s wishes that children be offered a safe place where they could develop on a positive track. This community was engaged in a community-wide initiative for after-school programming with a youth development focus. Common activities characterized as youth development were character education, leadership development, life skills, drug and pregnancy prevention, and conflict resolution. Some incorporated community service into this component. A few grantees used a specific youth development curriculum. Some programs used community partners, such as the Girl Scouts or community health programs, to deliver youth development services.
Recreation and/or Sports Although no grantees ranked recreation/sports first in program emphasis, four grantees ranked it second. In a number of cases, grantees viewed recreation/sports as a recruiting tool or a reward rather than as a venue for achieving other program objectives. One grantee focused on team sports because there were no organized sports in the school itself. Another began a sports program first at one site because they had not yet been able
21

to secure the personnel to offer an academic program. One grantee mentioned the need to offer less popular team sports like volleyball, and others talked of offering recreational sports such as bowling and tennis or board games that could improve “academic” skills, such as chess. Some grantees had developed partnerships with agencies that had strong programs in sports and recreation, such as the Department of Parks and Recreation or the YMCA.
Cultural Enrichment Almost all of the grantees spoke of the importance of cultural enrichment activities. However, overall, it ranked fourth in program emphasis. Several grantees offered activities that were directly focused on this element. Other grantees implied that cultural enrichment was being incorporated throughout all of the activities. All grantees offered at least some programming in art, music, dance or theater at one or more sites; however for some grantees it was very minimal (less than two hours per week). Some grantees plan to develop this component more in the future but focused on getting the academic component up and running first.
Cultural enrichment was interpreted in two different ways by grantees. For one group of grantees, cultural enrichment referred to creative and performing arts, such as music, art, and theater. Another group of grantees approached cultural enrichment as identity development activities, such as learning about the cultural heritage of one’s self and others. One grantee suggested cultural enrichment activities must consider the context in which they are being delivered. This site coordinator suggested that it was important for participants to celebrate their own culture and to also explore the culture of others. This approach could also be classified as youth development, given the focus on identity development. In some cases, both interpretations were combined, as in the case of learning about the musical heritage of a specific culture. Nine grantees offered programming on cultural activities/social studies at one or more of their program sites.
Family Services Few sites offered programming that specifically targeted parents. Family programming at sites that did offer family services included visits to museums, sporting events or bowling. Several sites used parents as volunteers to supplement staff during field trips. One site provided access to a case manager for parents and their families. Nonetheless, several sites were either offering (or planning to offer) programs specifically for parents, such as career planning or adult education (e.g., G.E.D. preparation). Other grantees plan to offer parenting classes in the future.
Student/Parent Recruitment and Participation
Student Participation
Student Recruitment The majority of grantees began to make necessary contacts to recruit students to their programs. As reported in the first evaluation report describing baseline data for state
22

grantees, during the spring semester of 2003, 3,674 students and 292 adults attended a 21st Century site at least once. A majority of grantees served more than 50 students at their individual sites during the five-month start-up period, and more than a third of the grantees served over 100 students. Most students who participated in the programs were African American (74%) with a smaller percentage of white (18%) and Hispanic (5%) students and students of other racial groups (2%). While the ratio of African American students to other students is disproportionate, it is equal to their representation in the target schools. The 21st Century program serves predominately urban schools, and that fact is borne out by the racial make-up of its participants.
The target population for student recruitment varies by host school. Almost an equal number of grantees are based at elementary (n = 19) and middle schools (n = 21). Only one grantee serves high school students. Thus far, this grantee has served 11th and 12th graders, but plans to include 9th and 10th graders in the upcoming school year.
A number of grantees limited their recruiting efforts to students who have experienced low academic performance, have limited family support, and/or have an above-average potential for “at risk” behaviors. In these cases, other students may join but are not actively sought. A smaller number of programs recruit all students regardless of their academic performance. One grantee has reported that they are consciously trying to recruit students with satisfactory or better academic performance who can serve as role models for other students.
Grantees have implemented a variety of recruitment strategies. Teachers, school principals, program staff, and students and parents have all been used to gain access to the target populations. Recruitment strategies that grantees highlighted as “most successful” included:
Recruiting through school day activities, such as recruiting during lunch periods, having the site coordinator available during the school day, and having staff in the school talk about the program
•
•
•
•
•
•
Making participation easier, such as providing transportation
Hiring high quality and accessible staff who are “tuned in” to students of this age and stage of development
Holding school performances that showcase youth
Providing food as an incentive to attend recruitment activities
Designing programs specifically for parents
Word of mouth among the youth was also reported to be an invaluable recruiting method, but is likely to be dependent on qualities of the program. Finally, sites that had a positive relationship with school staff appeared to have fewer problems recruiting or retaining participants.
All grantees experienced difficulties with competing activities, including organized sports, organized school-sponsored activities, and caring for younger siblings. Grantees may also encounter students who would prefer to pursue their own interests rather than be limited to the activities offered by the program. To overcome obstacles of conflicting activities that hinder recruitment efforts, grantees have sought to tailor their activities to make them more appealing to youth. For example, two grantees conducted student evaluations to assist them in their programming efforts.
23

Student Roles The majority of the sites reported viewing students as participants rather than decision makers. However, students have limited choice as participants, and the choice strategies differ between academic and other activities. Only two grantees allowed students to independently decide in which academic activities to participate. In seven grantee programs, all enrolled students participate in the same academic activity. In five cases the activity is determined by the staff according to the youth’s age and in the other two cases youth have a say in deciding which academic activity the whole group will do. Youth development activities are more frequently determined by the age of the youth rather than student choice while youth are more often allowed to determine their own participation in cultural enrichment activities or recreation/sports. However, a number of the grantees (six) have the whole group do the same recreation/sport activity, determined either by the age of the youth (three) or by decision of the group (three).
Only two of the middle school sites had implemented youth councils or groups to allow the students to have voice and some ownership of the program. Previous research has discussed the benefits of allowing students to become active in program administration and governance (Horsch, Little, Smith, Goodyear, & Harris, 2002), and grantees may want to investigate these possibilities further in the future.
Parent Participation
Parent Recruitment Specific parent programming has yet to be implemented in the majority of sites. Some grantees that have not yet begun to implement their parent component cited barriers such as parents working or late program start-up as reasons for the delay. Administrators spoke about the challenges of involving parents in even basic elements of the program such as attending field trips and family nights and uniformly expressed the need to focus more attention on this component.
According to grantees, the most successful strategies have included focusing on the source of the recruitment message (their children, other parents, classroom teachers, site coordinators and activity leaders) and creating opportunities for fun or assistance (e.g., family nights showcasing their students, referrals for service).
Parent /Adult Involvement For these grantees, an important component of their 21st Century program is the involvement of parents. All of the grantees spoke about the necessity of involving parents on some level, whether as program participants or as contributors to decision making. Thus far, however, most grantees have viewed parental involvement solely in terms of programming.
Family programming has focused on involving parents in helping their child with homework, working with staff to identify a child’s learning needs, and participating in off-site activities such family activities and field trips. However, most grantees described plans to implement specific parent activities in the future. For example, the majority of grantees included parent education workshops in their proposals, although they have yet to implement this component. One grantee in particular has reported aiming to utilize a strength-based philosophy, by identifying family strengths and providing opportunities within the program to build on these characteristics. Finally, some grantees report that
24
partner agencies will be providing supplemental services to meet needs of their specific families and/or communities.
Currently, only one site has fully integrated parents into planning, implementation, participation and evaluation. This site has implemented a number of components that involve parents such as the Family Math and Literacy Program, How to Communicate with School and What Should I Ask at Parent/Teacher Conferences.
Summary We conclude this section with a review of the accomplishments reported by grantees. In the third and final section, these accomplishments are compared to a set of implementation questions presented to guide the formative evaluation.
Context •
−
−
−
•
•
•
•
•
•
Grantees had substantial prior community support.
There was community support for providing positive alternatives for youth and a history of OST programming.
The grant partners had worked together to promote positive youth development and/or the activity partners had already been delivering some services in the school district.
The school district was promoting and the school/agency had some OST programming in place.
The grantees were primarily educational entities (local school districts, intermediate school districts or public school academies) but did include three community-based organizations.
Program Management and Staffing All grantees had their full complement of project management staff and most had their youth development and administrative/support staff on board by June 2003.
Grantees experienced a number of staffing challenges and were working toward resolving them.
Generally, grantees planned on beginning their formal staff training in the summer or fall, when they were fully staffed.
The school districts were primarily involved in management at the CLC level and local schools were involved at the site level.
After the project director, decision makers most commonly involved in 21st Century programs were the collaborative body, management team, and site coordinators, although their roles differed. The collaborative body was predominantly involved in program policy, site coordinators in site management, and project directors and the management team at all levels of decision making.
25

Communication Communication among program staff occurred at weekly or monthly meetings held at the sites. Communication between program staff and the school was most frequently between the principal and the site coordinator or the program director. At this stage, little communication occurred with the broader community.
•
•
•
•
•
•
•
•
•
Program Elements Grantees rated the emphasis on program elements as follows: 1) academic enrichment; 2) youth development, 3) recreation/sports; 4) cultural enrichment; and 5) family services.
Grantees reported the best progress toward meeting their academic enrichment goals and the next best progress toward their youth development goals.
All grantees identified input from youth as essential to providing attractive activities, although most gathered this information verbally from students who were attending their programs.
Almost all of the grantees offered tutoring programs as a form of academic enrichment and almost all were making informal contacts with specific students’ teachers.
For the majority of the grantees, the academic enrichment program was informally linked to the school day via participation of classroom teachers in the OST program.
While recreation/sports programs did not receive the primary emphasis in any program, grantees named many different worthwhile functions performed for 21st Century programs including serving as a recruiting tool, a reward, a place-holder while academic program staff were recruited, and an academic enrichment activity.
Student/Parent Recruitment Prior academic performance was generally considered in recruitment to the 21st Century program. A greater number of the grantees reported limiting their recruitment efforts to students with a history of low academic performance, limited family support and/or above average potential for engaging in risky behaviors. A smaller number recruit all students without regard to their academic performance.
All of the grantees commented on the necessity of involving parents but thus far most have placed their limited efforts on programming.
26
3. Issues and Challenges
In the evaluation contract developed for the Michigan Department of Education, a set of implementation questions were posed to guide the formative evaluation. In this section, we will discuss selected questions based on the activities conducted and issues raised in this early implementation period.
What are the key contextual issues in the school, district and community that have an effect on the design and implementation of the 21st Century program?
•
•
•
•
•
•
•
•
•
What are the program’s organizational structure and processes, including staffing, management and decision-making, and how is implementation affected by them?
What services are delivered to program participants, and what is the relative emphasis on academic and youth development activities? What types of learning strategies are employed during academic activities?
We also discuss the grantees’ initial efforts that may contribute over time to the sustainability of these out-of-school time programs. Finally, we summarize this report with grantees’ early implementation successes and the challenges still to be addressed.
The Influence of Key Contextual Factors
We examined key contextual issues in the community, school district, and target schools that affected the design and implementation of the 21st Century program. The following commonalities were found that influenced grantees programming efforts:
The prevalence of risk characteristics, such as children living in poverty and percent of the population in the community over age 25 lacking a high school diploma
Community support for OST programming for youth
Former successful working relationships among grant partners
Earlier experiences of grant partners in delivering some component of the 21st Century program in the target schools
Experience among grant partners with a prior 21st Century grant
These factors affected the design and implementation of programs in the following ways:
A successful grant award. The combination of risk characteristics, especially the percent of students qualifying for free or reduced price lunches and community support for OST programming for youth, undoubtedly contributed to successful grant awards.
27

A faster start. Although not exclusively true, most grantees that had a prior 21st Century grant were able to convert their former relationships into a faster start with the new target schools than those who had not held such a grant.
•
•
•
•
•
•
The relative programming emphasis. The community priority placed on providing positive alternatives for youth resulted in one grantee giving the most emphasis to their youth development programming component rather than the more prevalent emphasis on academic enrichment by the majority of the grantees.
The identification of collaborators and/or organizations to deliver activities. For most grantees there was a high correspondence between organizations that had former successful working relationships and those identified to act in some grant capacity, such as serving as a site coordinator or providing an activity component. For example, two of the grantees that contracted with outside organizations to serve as coordinators had worked with one or more on a prior 21st Century grant. The roster of activity providers used by every grantee included some agencies with which there had been a prior working relationship.
The Influence of Grantees’ Structures and Processes
Organizational structures and processes, including management, staffing and decision making, also influenced grantees’ abilities to implement their programs as planned. There were three classes of negative impacts:
21st Century program instability
Delayed or deferred program/activity start
Partner tensions
The factors contributing to these results overlap, but each is addressed separately below.
Program Instability The organizational stability of public schools may be considerable when compared to other sectors, but they are still characterized by regular shifts in leadership and budget. Thus far, two grantees have had to manage changes arising as a result of leadership shifts in their school district or at a target school, and one grantee has persisted through multiple leadership changes at the intermediate school district level. One grantee reported:
…We spent the first three to five months really working to establish a partnership with the leadership of the school, particularly the principal and other key stakeholders around clarifying our goals and outreach to our parents and recruiting the kids…during that time frame, the principal resigned. We were trying to build some momentum and that happened. The school was obviously in transition, and it set us back slightly in terms of our relationship with the school.
28

In support of these comments, others’ experience has corroborated the importance of collaboration with the host school leaders, especially the principal, in developing a successful after-school program (NAESP, 1999).
School system budget strains have also had an impact on 21st Century programs. Already two sites will need to relocate because the buildings in which they are housed will be shut down. The students will most likely be transferred to the nearest 21st Century program.
It seems certain that grantees will regularly have to cope with shifts in administrative leadership and policy in their partner schools. These shifts will bring added strains to all school-based programs, but may be especially difficult for 21st Century grantees, whose success depends on the cooperation of so many partners.
Lack of a project director did not so much delay or defer the start-up of grantees’ programs, because some aspects of the programs rolled out nonetheless, but this absence did cause program instability. In several sites, the current program directors were not on board when the original proposals were written. One grantee that had a 21st Century program director on board (from a federally funded program still in operation) subsequently had to replace that person who left to take another job. Another grantee has had a particularly volatile experience with their director, having filled the job twice. Finally, a third grantee did not fill the director position until well into the programming year. In each of these instances, the absence of a director created a leadership void that others acting in their stead were not completely able to fill.
Delayed/Deferred Program Start Staffing difficulties at the site coordinator or activity leader levels were the primary reasons the start date was delayed or 21st Century program components or activities were deferred. The two grantees whose start dates were most delayed made strategic choices regarding the program components to offer and came to opposite solutions. One grantee opted to emphasize building school relationships rather than community relationships and focused on their academic enrichment components. The other grantee, for which both the project director and assistant director were replaced, opted to emphasize sports and recreation programs because these were the easiest to develop.
In the case of the latter grantee, the lack of leadership at the top had other programmatic consequences. Leadership turnover cascaded down such that they were unable hire site staff or develop the type of school-community relationships that would have facilitated academic enrichment or youth development programs. Generally, however, program delays arose because many positions provided only part-time employment, thus making it difficult to recruit and/or retain staff. In response, one grantee proposed to combine multiple duties into one job in order to create full-time employment. Another grantee was in negotiation to reduce the number of hours the site staff spent in their school-based day-time jobs so that they could work more hours for the center. Staff turnover with some community partners also created gaps and even waiting lists for 21st Century programs. Grantees will be addressing these situations by intensively recruiting more partners and more volunteers.
Partner Tensions As was to be expected, 21st Century programs did not always roll out smoothly. Even when grant partners had worked together previously, tensions sometimes arose. Most often these tensions were due to administrative issues. Differences in staff pay scales or
29
qualifications were a common source of pressure. Disagreements also arose when staffing was shared between or among agencies. Grantees resolved these differences through conversations and negotiations as well as restructuring management responsibilities.
Academic Enrichment Choices The grantees were mandated to provide support for students’ academic achievement, and most grantees reported placing their primary emphasis in this area. Tutoring was the main strategy used to provide academic support, although what is meant by “tutoring” does not appear to be conceptually or operationally the same among grantees. Words such as “tutoring,” “support” and “enrichment” appear to be used interchangeably, although these technically refer to distinct instructional strategies (i.e., individualized remediation, extended learning time, added study and challenge). It is also unclear whether “tutoring” means assisting students with tasks carried over from their school day or the delivery of a more autonomous tutoring program based in a particular discipline (e.g., literacy or mathematics) and/or on an instructional model.
We recognize that the grantees’ academic support activities in the first six months do not necessarily reflect full implementation of their programs. Further, the research basis for the effectiveness of tutoring is extremely uneven, particularly when it relies on generalized learning logics (“more time and personalized attention”) rather than training in explicit tutoring models and strategies (Allington, 2000; Elbaum, Hughes, Moody, & Vaughn, 2000; Newmann, Smith, Allensworth, & Bryk, 2002). However, this lack of clear purpose and strategy threatens to hamper the effectiveness of academic support efforts.
Those grantees who conceptualized academic enrichment as more than tutoring were responding to a fundamental challenge in OST, the desire to engage students in activities that are attractively different from their school day experiences while creating learning experiences that can measurably boost their academic performance. Developing high quality, effective academic enrichment programs requires staff to design unique tasks that are fun and appropriately challenge students (who are often in multi-age groups) to produce meaningful outcomes (e.g., stories, models, drawings, experiments). Three examples of academic enrichment programs, each staffed in a different way, are offered.
1) One grantee used the theme of “Hollywood Stars” throughout the summer. Each week, the groups would view a movie and then discuss how the movie related to their lives. When the theme of “heroes” was discussed, they went beyond traditional fictional heroes to also discuss local area heroes. In this way, the grantee attempted to engage the students through popular culture while also connecting the students to their community. One important goal was to provide reality-based role models for the students–accomplished individuals who have lived in their own community. In so doing, the staff hoped that students would see the importance of their own goal-setting, including the worth of staying in school.
2) One grantee established an elaborate partnership with a local public museum. Through the summer, the program participants’ worked on a project detailing the history of the area’s public school system. In visits to the museum, the students not only learned about the artifacts in the collection, but also about how a museum operates. Staff from all departments met with students to discuss their jobs, allowing students to explore various career options.
30

3) One grantee staffed the academic enrichment components using university
faculty members and college students who design and implement them. The science modules, for example, have been designed by a Stanford-trained researcher who nonetheless was excited about using chemistry in an applied way. The content in these modules is consciously integrated with the school-day curriculum through conversations between program staff with principals and teachers, since the latter are not formally involved in the 21st Century program.
Connecting these academic enrichment experiences to the learning objectives students are expected to master in school involves considerable dialogue and coordination. Overall, academic enrichment staff were in place and school personnel were linked to the after- school programs. As 21st Century programs move beyond this initial implementation period, we anticipate that the staff will formalize and systematize many of the informal arrangements that were developed to support students’ academic achievement.
Program Sustainability At this early stage of implementation, many grantees are just beginning to build structures that can contribute to sustainability. One of the initial findings from the national evaluation of the 21st Century programs was that programs were slow to begin planning for their sustainability post-federal funding (U.S. Department of Education, 2003). As Fletcher (2002) notes, programs that experience long-term success recognize that sustainability is primarily a local responsibility and accordingly plan for a significant local contribution to viability. Communicating with parents and other community groups can educate people about the program and build public support. This support can benefit the program—in participant recruitment and retention—as well as build a plan for sustainability. So far, only three grantees have included youth and parents in decision-making. However, most grantees planned to involve students and parents more in the summer and fall.
Nine of the 11 grantees report that issues of sustainability are already being discussed. Among the strategies under discussion are diversifying funding sources by applying for additional grants, seeking support from the business community, or integrating multiple funding streams for many school-based special programs under one umbrella. One grantee is planning to expand the volunteer base while two grantees plan to use free services of other community youth groups through the development of more partnerships. One grantee is considering generating revenue by instituting a summer sports league while another may charge for child care services. Two grantees participate in community-wide OST sustainability initiatives, and another has involved their board of directors and the community in developing a strategic plan for improving program quality, staff retention, resource development and public relations. These examples illustrate that a wide array of strategies can, and must, be employed to fit local circumstances.
31

Summary Early Successes
The 11 grantees funded to establish the first 13 MDE-funded 21st Century programs experienced many successes. Most grantees were generally satisfied with their progress to date despite various constraints they had experienced (hiring delays, different start dates, unique school circumstances, etc.). The following are highlights:
A broad array of community partners, drawn from local schools, youth development agencies, units of local government, cultural groups, literacy organizations, and parent groups, were involved in the 21st Century programs in a variety of capacities (policy-making, management, activity leadership).
•
•
•
•
•
•
•
•
Most grantees indicated that all administrative staff were on board as of June 2003, and they have been able to hire 70-80% of the activity staff in most programming areas.
Almost all grantees’ programs attracted students, and in at least one instance resulted in a waiting list.
Almost all grantees offered academic enrichment activities. Homework help was universally available among those who provided academic support services.
Almost all of the grantees report that they are making informal contact with teachers about specific students, and in two thirds of the cases they have also formalized their contacts about specific students.
All grantees could identify what had been their “most successful” strategy for recruiting youth. Most also had a successful strategy for parent recruitment as well, although this was almost universally an area grantees expected to improve.
Almost all of the grantees have some plan, if they have not already taken some action, for ensuring the sustainability of their programs.
The program components that grantees offered in the first months of their operation were based on their realistic appraisal of resources and opportunities. All grantees, however, expect to make program improvements—in the partnerships developed, components offered and/or participant recruitment—in the coming months.
Continuing Challenges These grantees all recognized that they had areas for improvement. Among the challenges acknowledged were the following:
The presence of other OST programs, such as those run by other organizations or by the school district, were cited as presenting challenges in the alignment of philosophy and/or the development of relationships between the pre-existing OST program and these 21st Century programs.
32

Differences in philosophy and approach were also routinely cited by grantees whose site coordination is being managed by two or more different community organizations.
•
•
•
•
•
•
•
No grantee reported a full complement of staff. Among those mentioned still to be recruited were volunteers/teachers/tutors for academic enrichment activities and community partners to provide additional sports/recreation or cultural enrichment activities.
While most grantees mentioned informal alignment between the school day and after-school curricula (usually through the participation of school-day teachers in the after-school program), no grantee mentioned systematic or formal methods in which such alignment was occurring.
While three grantees had formalized contacts with teachers and most mentioned informal contact about specific students, no formal or systematic approach was used to gain information or provide feedback about all 21st Century participants.
Cultural enrichment, parent involvement and/or programming, and—to some extent—sports and recreation activities were consistently less well-developed than grantees had proposed. It was the rare grantee who reported that the components enacted during this start-up period were done according to some predetermined plan.
Although one grantee reported waiting lists for some programs, most reported that they planned to improve their youth recruitment. This was the case for those trying to diversify their youth participation, and especially true for those trying to attract middle and high school students.
Few sites offered programming that specifically targeted parents, instead citing the most prevalent form of parents’ involvement as helping their own child with homework. All grantees named parent involvement and/or programming as an area for improvement.
Each of these challenges contains a suggestion for action, from “resolve differences” to “provide more parent programming,” and the grantees clearly reported their intention to do so. This report focuses on the first six months of implementation. Grantees had improvements underway, new partnerships to be developed over the summer, strategies for expanded recruitment in the fall, and plans for additional program components. The partnership that is being built among the grantees, their local evaluators, the state evaluators and the MDE creates the opportunity for data collection and feedback that—over time—will document further program accomplishments, provide information for program improvement, and report on youth outcomes.
33


Appendices Appendix A. Methods
Appendix B. Grantees
Appendix C. Data Tables
Appendix D. Organization Structure and Processes
35


Appendix A. Methods
Data Sources Data collected from five sources informed the implementation study:
1) A survey of grantee administrators
2) Individual interviews with grantee program directors
3) Existing documents such as grantee proposals and other local reports (identified from the survey of grantee administrators)
4) Annual Progress Review (APR) reports submitted as a semiyearly report to MDE
5) Secondary data such as 2000 census data
Implementation Survey Instrument A survey, completed by grantee program directors, was developed by the evaluation team to address key questions of the implementation study. Designed in the form of a checklist, the instrument could be transmitted electronically and filled out on the computer to facilitate data collection, or it could be printed out and returned by FAX. The checklist was designed to gather information on characteristics of program that may be related to implementation questions in the following areas:
Changes in key contextual issues in the school and community that may influence program implementation
•
•
•
•
•
•
•
•
•
Program structure and organization, including staffing, management and decision-making
Collaborative relationships between the program and community partners and the influence that these relationships have had on programming
Recruitment, training and retention of quality staff
Approaches to academic enrichment, methods of maintaining program consistency and linking the academic program to the school day
Approaches to youth development, sports/recreation, cultural enrichment, and other program activities
Progress in recruitment of targeted segments of the student population, challenges encountered and strategies employed
Level and type of parent participation and the factors that have enhanced or limited parent involvement
Successes and challenges encountered in the initial implementation phase and adaptations made
37

As of June 30, 2003, all checklists had been returned.
Individual Interviews An interview protocol was developed to follow up on information obtained from the checklist, existing documents, and APR and to obtain the latest information possible on summer plans. After reviewing all documents noted above, a one-hour telephone or in-person interview was conducted with each grantee program director for the following purposes:
Clarify picture of program structure and implementation drawn from review of program documents and survey data
•
•
•
•
•
•
•
•
•
•
•
•
•
•
Identify any additional written documents that may offer information about the program or the context in which it operates
Document changes that may have occurred since the APR and checklist were completed
Obtain information about the activities and characteristics of the summer program and planned changes for fall
Describe successes and challenges to date
Allow program directors the opportunity to highlight interesting or unique aspects of their program or any circumstances that will prove to be particular challenges to them
As of July 30, 2003, all program director interviews have been completed.
Existing Documents Grantees’ proposals were reviewed to gather information on the program context and proposed processes that grantees had outlined prior to implementation. In addition and as part of the checklist, grantees were asked to list supporting documents that would provide additional information about specific survey questions.
Annual Progress Report (APR) Each grantee also submitted the Annual Progress Review document. At the grantee level, information was collected on:
Progress toward stated program objectives
Challenges, lessons learned, and programming adjustments
Active community collaboration
Expenditures
Site-level information included:
Characteristics of the school
Staffing
Student characteristics and participation rates
Activities offered and hours of operation
38

Links to the school day •
As of June 30, 2003, all APRs had been submitted.
Secondary Data Data from the 2000 census, Kid’s Count, the Michigan Department of Education, and other secondary data sources are used to characterize the context in which each of the grantees’ programs function. Data will be used to identify the degree to which each community experiences poverty, crime, and indicators of health risk, as well as poor school performance and student achievement.
39


Appendix B. Grantees
Table B-1 Combined Federal and Michigan Department of Education Michigan 21st Century Grantees
County Year Grantee Schools
Alpena 2000 Alpena Public Schools Hinks Elementary Ella White Elementary ACES Academy High Alternative Education Adult Education and Community Education Thunder Bay Junior High
Allegan 2000 Holland-West Ottawa Saugatuck-Hamilton Community
Washington School Harbor Lights School Central Alternative School
Berrien 1998 Benton Harbor Public Schools Benton Harbor Area Schools 2003 (a) Boys & Girls Club of Benton Harbor Hull Middle School Calhoun 1999 Albion Public Schools Caldwell Elementary
Crowell Elementary Harrington Elementary
2001 Albion Public Schools Caldwell Elementary Crowell Elementary Harrington Elementary Albion Open Washington Gardner Middle School
2001
Battle Creek Public Schools
Ann J. Kellogg Elementary McKinley Elementary Post Elementary Roosevelt Elementary
2003 (a) Battle Creek Public Schools Coburn Elementary Dudley Elementary Urbandale Elementary Washington Elementary Wilson Elementary
2003 (b) Battle Creek Public Schools Chippewa 2001 Eastern Upper Peninsula
Intermediate School District Bahweting Public School Academy Brimley Area School Engadine Consolidated School Les Cheneaux Community School Mackinaw Island School Pickford School Rudyard High School Sault Ste. Marie High Sault Ste. Marie Middle Sault Ste. Marie Area Washington Elementary St. Ignace High/Middle Whitefish Township R.J. Wallis Elementary
41

County Year Grantee Schools
Rudyard Area School Clare 2003 (a) Clare-Gladwin RESD (Harrison) Amble Elementary
Hillside Elementary Larson Elementary Harrison Middle
2003 (a) Clare-Gladwin RESD (Farwell) Farwell Elementary Farwell Middle
Clinton 2000 Ovid-Else Area Schools No schools listed Genesee 1999 Flint Community Schools Holmes Middle
Longfellow Middle McKinley Middle Whittier Middle
2000 Flint Community Schools Bunche Elementary Carpenter Road Elementary Cummings Elementary DTM Elementary Eisenhower Elementary Homedale Elementary Summerfield Elementary Wilkins Elementary
2000 International Academy of Flint Center Academy International Academy
2003 (a) Flint Community Schools Holmes Middle Longfellow Middle McKinley Middle Whittier Middle
2003 (a) International Academy of Flint International Academy of Flint Center Academy
2003 (b) Academy of Flint Gladwin 2003 (b) Clare-Gladwin RESD Beaverton Grand Traverse 2001 Traverse City Area Public Schools Blair Elementary
Glenn Loomis School Interlochen Community Sabin Elementary Traverse Heights
2003 (b) Traverse City Area Public Schools Gratiot 2001 Alma Public Schools Hillcrest Elementary
Alma Middle School Alma High School
Hillsdale 1999 Hillsdale County Intermediate School District
Davis Area School Litchfield Community Reading Area School Camden-Frontier School Pittsford Area School Waldron Area School North Adams-Jerome School Jonesville Community
Houghton 2003 (b) B-H-K Child Development Board Ingham 2000 DeTour Area Schools No sites listed 2000 Lansing School District No sites listed 2001 New City Academy New City Academy
Francis Reh Public School Northridge Academy Northside Preparatory Tri-Valley Academy Walter French Academy William Abney Academy
2001 Lansing School District Center for Language, Culture, Communication, Art Gardner Middle
42

County Year Grantee Schools
Rich Middle Riddle Middle
Isabella 2001 Mt. Pleasant Public Schools Fancher Elementary Ganiard Elementary McGuire Elementary Pullen Elementary Vowels Elementary Rosebush Elementary Kinney Elementary West Intermediate Mt. Pleasant High School
Jackson 2001 Jackson Public Schools Allen Elementary McCulloch Elementary Northeast Elementary Wilson Elementary Amy Firth Middle Jackson High Tomlinson School
Kalamazoo 1999 School District of the City of Kalamazoo
Arcadia Elementary Milwood Elementary Northglade Elementary Lincoln Elementary Edison Elementary Woods Lake Elementary Northeastern Elementary South Middle Hillsdale Middle Milwood Middle
2003 (b) School District of the City of Kalamazoo
Kent 1998 Grand Rapids Public Schools Westwood Middle Riverside Middle Northeast Middle Westbridge Academy Iroquois Middle
Kent 2001 Grand Rapids Public Schools (no schools listed) 2003 (a) Grand Rapids Public Schools Burton Middle
Iroquois Middle Northeast Middle Riverside Middle Westwood Middle
2003 (b) Grand Rapids Public Schools Manistee 1999 Manistee County Schools
Management Cooperative Wellston, Brethren, Kaleva, Bear Lake, Great beginnings @ Bear Lake (infant pre-school), Great Beginnings @ Brethren (infant pre-school)
Macomb 1998 Armada Area Schools Armada Baldwin Cass City Detour Earhart Roscommon Jackson-Parkside KND Brethren Lansing Pelham
2000 Fitzgerald Public Schools Mound Park Elementary Schofield Elementary Westview Elementary Chatterton Middle
43
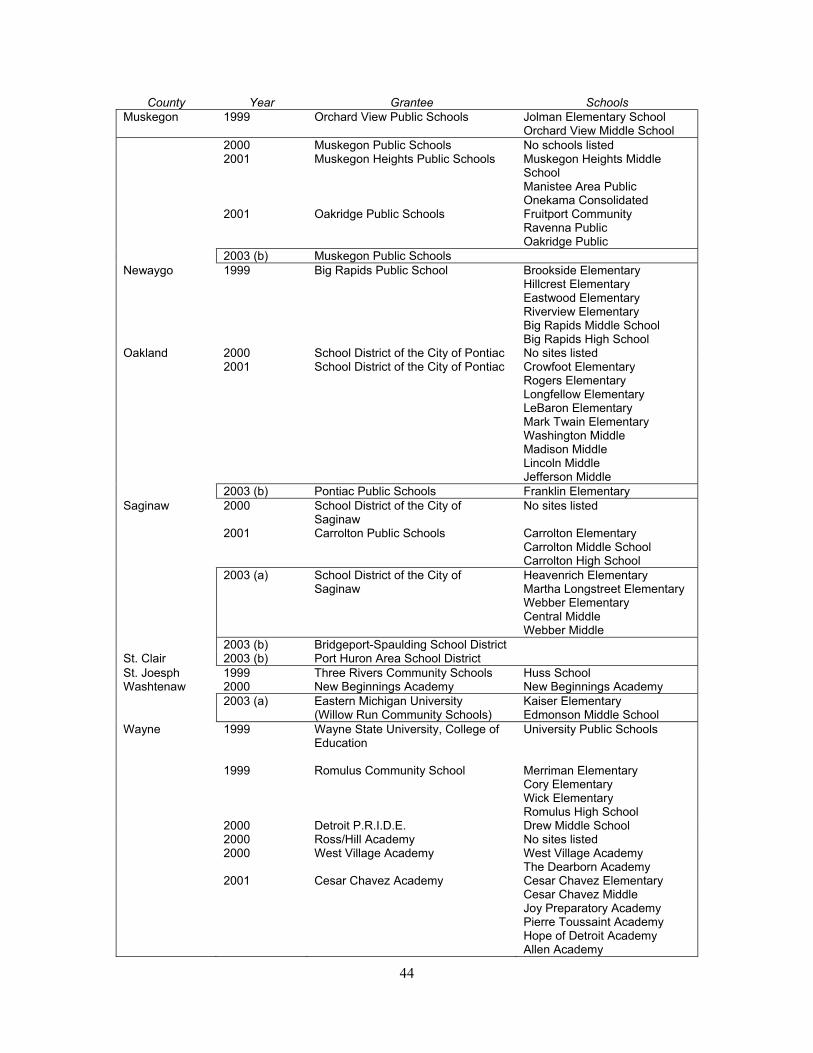
County Year Grantee Schools
Muskegon 1999 Orchard View Public Schools Jolman Elementary School Orchard View Middle School
2000 Muskegon Public Schools No schools listed 2001 Muskegon Heights Public Schools Muskegon Heights Middle
School Manistee Area Public Onekama Consolidated
2001 Oakridge Public Schools Fruitport Community Ravenna Public Oakridge Public
2003 (b) Muskegon Public Schools Newaygo 1999 Big Rapids Public School Brookside Elementary
Hillcrest Elementary Eastwood Elementary Riverview Elementary Big Rapids Middle School Big Rapids High School
Oakland 2000 School District of the City of Pontiac No sites listed 2001 School District of the City of Pontiac Crowfoot Elementary
Rogers Elementary Longfellow Elementary LeBaron Elementary Mark Twain Elementary Washington Middle Madison Middle Lincoln Middle Jefferson Middle
2003 (b) Pontiac Public Schools Franklin Elementary Saginaw 2000 School District of the City of
Saginaw No sites listed
2001 Carrolton Public Schools Carrolton Elementary Carrolton Middle School Carrolton High School
2003 (a) School District of the City of Saginaw
Heavenrich Elementary Martha Longstreet Elementary Webber Elementary Central Middle Webber Middle
2003 (b) Bridgeport-Spaulding School District St. Clair 2003 (b) Port Huron Area School District St. Joesph 1999 Three Rivers Community Schools Huss School Washtenaw 2000 New Beginnings Academy New Beginnings Academy 2003 (a)
Eastern Michigan University (Willow Run Community Schools)
Kaiser Elementary Edmonson Middle School
Wayne 1999 Wayne State University, College of Education
University Public Schools
1999 Romulus Community School Merriman Elementary Cory Elementary Wick Elementary Romulus High School
2000 Detroit P.R.I.D.E. Drew Middle School 2000 Ross/Hill Academy No sites listed 2000 West Village Academy West Village Academy
The Dearborn Academy 2001 Cesar Chavez Academy Cesar Chavez Elementary
Cesar Chavez Middle Joy Preparatory Academy Pierre Toussaint Academy Hope of Detroit Academy Allen Academy
44
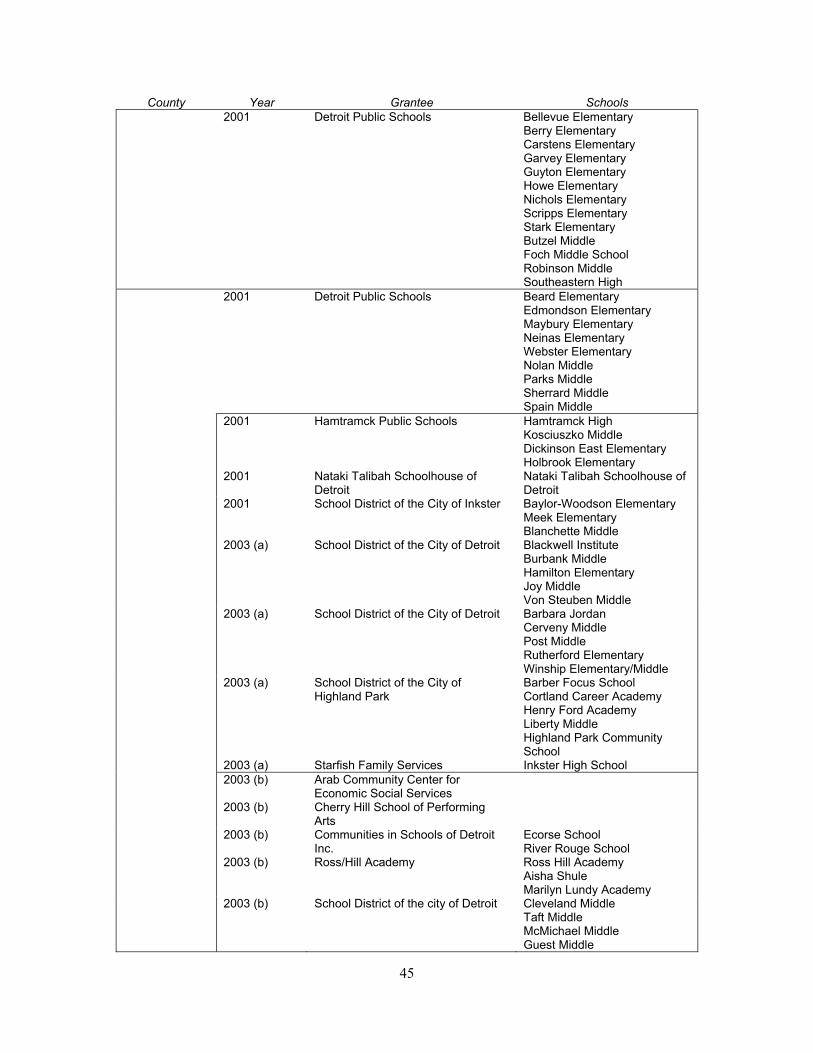
County Year Grantee Schools
2001 Detroit Public Schools Bellevue Elementary Berry Elementary Carstens Elementary Garvey Elementary Guyton Elementary Howe Elementary Nichols Elementary Scripps Elementary Stark Elementary Butzel Middle Foch Middle School Robinson Middle Southeastern High
2001 Detroit Public Schools Beard Elementary Edmondson Elementary Maybury Elementary Neinas Elementary Webster Elementary Nolan Middle Parks Middle Sherrard Middle Spain Middle
2001 Hamtramck Public Schools Hamtramck High Kosciuszko Middle Dickinson East Elementary Holbrook Elementary
2001 Nataki Talibah Schoolhouse of Detroit
Nataki Talibah Schoolhouse of Detroit
2001 School District of the City of Inkster Baylor-Woodson Elementary Meek Elementary Blanchette Middle
2003 (a) School District of the City of Detroit Blackwell Institute Burbank Middle Hamilton Elementary Joy Middle Von Steuben Middle
2003 (a) School District of the City of Detroit Barbara Jordan Cerveny Middle Post Middle Rutherford Elementary Winship Elementary/Middle
2003 (a) School District of the City of Highland Park
Barber Focus School Cortland Career Academy Henry Ford Academy Liberty Middle Highland Park Community School
2003 (a) Starfish Family Services Inkster High School 2003 (b) Arab Community Center for
Economic Social Services
2003 (b) Cherry Hill School of Performing Arts
2003 (b) Communities in Schools of Detroit Inc.
Ecorse School River Rouge School
2003 (b) Ross/Hill Academy Ross Hill Academy Aisha Shule Marilyn Lundy Academy
2003 (b) School District of the city of Detroit Cleveland Middle Taft Middle McMichael Middle Guest Middle
45

County Year Grantee Schools
Coffey Middle 2003 (b) School District of the City of Detroit Cadillac Elementary/Middle
Webber Elementary/Middle Drew Middle Beaubein Middle Phoenix Multicultural Academy
2003 (b) School District of the City of Detroit Brooks Middle Detroit Open School Ruddiman Middle Lessenger Middle Murphy Middle
2003 (b) School District of the City of Detroit McNair Technical Middle Farwell Middle Barbour Middle Nolan Middle Grant Elementary/Middle
2003 (b) School District of the City of Detroit Dewey Center University Public Miller Magnet Clippert Academy Longfellow Middle
2003 (b) School District of the City of Detroit Fine & Performing Arts Elmdale Conservatory’ Burroughs Middle Foch Middle Whitney Young
2003 (b) Starfish Family Services Westwood 2003 (b) University Preparatory Academy 2003 (b) West Village academy Van Buren 1998 Covert Public Schools Covert Middle School
Covert Area Schools 2000 Bangor Public School South Walnut School
Bangor School Key: (a) = January 2003 grantees; (b) = August 2003 grantees
46

Appendix C. Data Tables
Table C-1 County Economic Data
County
Rank for % of children <18 living in
poverty1 Unemployment
rate2
% No parents in
labor force3 MICHIGAN COMPARISON (1-83) 7.2 8.4
Berrien 17 6.9 8.3 Calhoun 33 7.8 8.2 Clare 3 11.8 9.1 Genesee 13 9.8 10.5 Kent 60 7.2 6.9 Saginaw 6 9.1 10.2 Washtenaw 68 2.9 5.9 Wayne 2 8.1 16.1 1 Kids Count & U.S. Census 2000 SF1 2 Michigan Department of Career Development 3 U.S. Census 2000 SF1 & SF3
Table C-2
Family Data
County
% Children living in a single parent
household1
Teen Birth Rate2
% Adults >age 25 with no high school diploma3
% Adult literacy rate4
MICHIGAN COMPARISON 24.5 22 11.9 13.7
Berrien 27.9 41 12.4 12.2 Calhoun 28.8 40 12.4 10.5 Clare 25.6 28 17.5 5.5 Genesee 32.8 32 12.9 10.5 Kent 22.4 28 10.8 17.5 Saginaw 31.7 28 13.3 10.5 Washtenaw 20.5 13 6.1 24.3 Wayne 31.7 31 16.9 10.9 1 U.S. Census 2000 SF1 & SF3 2 Michigan Department of Community Health – Vital Statistics, # of live births
per 1000 3 U.S. Census 2000 SF 3 4 U.S. Census 2000 SF 3
47

Table C-3
School District and School Data
District Drop-Out Rate1 School Free & Reduced
Lunch Rate2 MICHIGAN 5.5 .32
Coburn Elementary .77 Dudley Elementary .69 Urbandale Elementary .66 Washington Elementary .72
Battle Creek Public Schools 7.2
Wilson Elementary .87 Benton Harbor Public Schools
13.9 Hull Middle School .93
Farwell Elementary .65 Clare-Gladwin Public Schools
Farwell Middle .63 Amble Elementary .80 Hillside Elementary .76 Larson Elementary .51
Clare-Gladwin Public Schools
2.0
Harrison Middle .60 Barbara Jordon Elementary .54 Cerveny Middle .69 Post Middle .80 Rutherford Elementary .53 Winship Middle .51 Blackwell Institute .61 Burbank Middle .56 Hamilton Elementary .82 Joy Middle .67
Detroit Public Schools 12.2
Von Steuben Elementary .75 Holmes Middle School .71 Longfellow Middle .71
15.5
McKinley Middle .76
Flint Community Schools
8.3 Whittier Middle .70 International Academy of Flint .65 Flint Public Schools 9.5 Center Academy .85
2.3 Burton Middle School .95 2.7 Iroquois Middle .82 2.3 Northeast Middle .89 2.1 Riverside Middle .72
Grand Rapids Public Schools
3.7 Westwood Middle .75 Barber Focus School .84 Cortland Career Academy .95 Henry Ford Academy .87 Liberty Middle .74
Highland Park Community Schools
30.4
Highland Park Community High School
.63
Inkster Public Schools 8.5 Inkster High School .64 Heavenrich Elementary .84 Martha Longstreet Elementary
.81
Webber Elementary .88 Central Middle .91
Saginaw Public Schools 3.2
Webber Middle .87 Kaiser Elementary .86 Willow Run Community
Schools 4.4
Edmonson Middle School .62 1 Center for Educational Performance and Information, 2000-2001 2 Michigan Department of Education School Breakfast and Lunch Information by District and
Building – School Year 2002-2003 (October 2002 Data)
48

Appendix D. Organization Structure and Process
Your CLC is operating in a way that fits your circumstances. Please help us understand how your CLC is organized and how your programs are being implemented by answering the following questions.
DECISION MAKING. Many people are involved in making decisions in CLCs. Please indicate what structures and/or which people are currently involved in your decision-making processes. Here are the definitions we use for each:
Collaborative Body: A group formed to foster communication and recommend policy for the 21st CCLC. Often a broad-based group representing public and non-profit organizations, civic groups, volunteers, business, parents, etc. and composed of those who are funded and not funded under the grant.
Advisory Committee: A group composed of people able to offer advice on particular aspects of the program. It can be broad-based, or it can represent a single group, such as those organizations delivery services at the sites, parents, youth, or a mixture of these.
Grant Fiscal Agent: The administrator charged with the responsibility for accounting to MDE.
Management Team: A small group composed of the people with the responsibility for running daily operations.
Leadership Team: A small group composed of people with various roles in the program, including youth.
Project Director: The person in charge of the CLC grant; s/he may be called the manager or the coordinator.
Site Coordinator: The person in charge of the operations at a specific location, who may also do some of the programming.
Activity Leader: The person who delivers some service component, either in a group or 1-1; for example, teaches karate, is a mentor, leads a reading program. This person can be a paid staff person, a volunteer compensated by someone else (i.e., AmeriCorps volunteer), or an uncompensated volunteer (a community person).
49


References Allington, R. (2000) What really matters for struggling readers: Designing research-based programs. New York: Longman.
Armstrong, E., & Waszak, C. (1992). Teenage pregnancy and too-early parenting: Public costs and personal consequences. Washington, DC: Center for Population Options.
de Kanter, A., Fiester, L., Lauland, A., & Romney, V. (1997, July). Keeping schools open as community learning centers: Extending learning in a safe, drug-free environment before and after school. U.S. Department of Education. Retrieved from http://www.ed.gov/pubs/LearnCenters/index.html
Elbaum, B., Hughes, M. J., Moody, S. W., & Vaughn, S. (2000). How effective are one-to-one tutoring programs in reading for elementary students at risk for reading failure? A meta-analysis of the intervention research. Journal of Education Psychology, 92, 605-619.
Fletcher, A. J. (2002). Building exemplary programs: Nine keys to success. Sacramento, CA: California AfterSchool Partnership/California Department of Education, Governor’s Office for Education, Foundation Consortium Public/Private Partnership.
The Forum for Youth Investment. (2002). After-school research meets after-school policy (Policy Commentary No. 1). Washington, DC: The Forum for Youth Investment. Retrieved from www.forumforyouthinvestment.org/comment/ostpc1.pdf
Furstenberg, F. F., Brooks-Gunn, J., & Morgan, P. (1987). Adolescent mothers in later life. New York: Cambridge University Press.
Gunderson, S. (2003, June). Why, when, and how to use evaluation: Experts speak out. Issues and Opportunities in Out-of-School Time Evaluation, No. 5. Harvard Family Research Project. Retrieved from http://www.gse.harvard.edu/~hfrp/content/projects/afterschool/resources/issuebrief5.pdf
Hall, G., Yohalem, N., Tolman, J., & Wilson, A. (2003). How afterschool programs can most effectively promote positive youth development as a support to academic achievement. National Institute on Out-of-School Time. Retrieved from http://www.niost.org/WCW3.pdf
Horsch, K., Little, P., Smith, J. C., Goodyear, L., & Harris, E. (2002, February). Youth involvement in evaluation & research. Issues and Opportunities in Out-of-School Time Evaluation, No.1. Harvard Family Research Project. Retrieved from http://www.gse.harvard.edu/~hfrp/content/projects/afterschool/resources/issuebrief1.pdf
Melaville, A. (1998). Learning together: The developing field of school-community initiatives. Flint, MI: Mott Foundation.
Newmann, F. M., Smith, B., Allensworth, E., & Bryk, A. S. (2002). Instructional program coherence: What it is and why it should guide school improvement. Educational Evaluation and Policy Analysis, 23, 297-321.
51

52
No Child Left Behind Act of 2001 (Elementary and Secondary School Act, as amended, Title IV, Part B). Retrieved from http://www.ed.gov/programs/21stcclc/legislation.html
Pane, N., Mulligan, I., Ginsburg, A., & Lauland, A. (1999). A guide to continuous improvement management (CIM) for 21st Century Community Learning Centers. U.S. Department of Education. Retrieved from http://www.ed.gov/offices/OUS/PES/21cent/cim226.pdf
U.S. Department of Education, Office of the Under Secretary. (2003). When schools stay open late: The national evaluation of the 21st Century Community Learning Centers program, first year findings. Washington, DC: Author. Retrieved from http://www.ed.gov/pubs/21cent/firstyear.
Walker, K. E., Grossman, J. B., & Raley, R. (2000, December). Extended service schools: Putting programming in place. Public/Private Ventures. Retrieved from http://www.ppv.org/pdffiles/ess.pdf