Embed Size (px)
Citation preview

2020–21 AASA SUPERINTENDENT
SALARY & BENEFITS STUDY
Non-MEMBER VERSION
Christian Rogers Christopher H. Tienken, Ed.D.
Lavetta Ross, Ed.D. George J. Petersen, Ph.D.
DANIEL A. DOMENECH, AASA EXECUTIVE DIRECTOR
© AASA, THE SCHOOL SUPERINTENDENTS ASSOCIATION
January 2021

1
2020–21 AASA SUPERINTENDENT SALARY & BENEFITS STUDY
EXECUTIVE SUMMARY The 2020-21 AASA Superintendent Salary & Benefits Study marks the ninth consecutive edition of this study. The 2020-2021 version employed a slightly revised and updated survey instrument. The survey tracks the demographics, salary, benefits, and other elements of the employment agreements of school superintendents throughout the country. This year’s study is based on 1,518 responses. The survey was distributed online and relied on superintendents responding to 64 items with the understanding that the report of findings would contain no personally identifiable information. Therefore, readers must consider the data descriptive and not necessarily representative of all superintendents. The study is intended to provide superintendents with actionable information needed to negotiate and manage their compensation and benefits. Prior to the AASA efforts to study this topic, most school superintendents relied on the annual salary study sponsored by the Education Research Service (ERS) to benchmark their compensation and benefits. The closure of ERS nearly a decade ago created a void in data about superintendent salary and benefits. AASA responded to the need for data by developing a comprehensive study of the salary and benefits of school superintendents that far exceeded previous studies undertaken on this topic. AASA is particularly well suited for this task because it represents the vast majority of school superintendents in the country and has been most active in collecting and disseminating to its members critical data needed to inform superintendent decision making about a host of topics. AASA is committed to refining this work over time, thus maximizing the benefit to superintendents. The earlier editions of this study are available on the AASA website and provide valuable retrospective data (http://www.aasa.org/research.aspx). This work complements The American School Superintendent: 2020 Decennial Study edited by Professor Christopher H. Tienken, the AASA Research Professor in Residence and Associate Professor of Education Leadership, Management and Policy from Seton Hall University, sponsored by AASA in conjunction with Phi Delta Kappa. The official press release can found at: https://www.aasa.org/content.aspx?id=44397.

2
The complete book is published through Rowman and Littlefield: https://rowman.com/ISBN/9781475858471/The-American-Superintendent-2020-Decennial-Study In addition, there is an inevitable comparison between public and private sector CEOs. Useful in this discussion is the work of Economic Policy Institute in its analysis on private sector CEO compensation and its relationship to median employee pay: https://www.epi.org/publication/ceo-compensation-surged-14-in-2019-to-21-3-million-ceos-now-earn-320-times-as-much-as-a-typical-worker/#:~:text=In%202019%2C%20the%20ratio%20of,in%20the%20top%200.1%25. METHODOLOGY The research team was comprised of Christian Rogers, AASA legislative analyst; Dr. Christopher H. Tienken, AASA Research Professor in Residence and Associate Professor if Education Leadership, Management, and Policy; Dr. George J. Petersen, Professor and Founding Dean of the College of Education at Clemson University; and Dr. Lavetta Ross, quantitative research professor/adjunct, Monmouth University. Assistance was also provided by Robert S. McCord, AASA research consultant. The research was conducted under the direct supervision of Noelle Ellerson Ng, AASA Associate Executive Director, Policy and Advocacy. An extensive survey instrument was originally developed in 2012 with the assistance of Professors Theodore J. Kowalski (University of Dayton), I. Phillip Young (University of South Carolina), Terry Orr (Bank Street College) and Christopher C. Stream (University of Nevada, Las Vegas). The survey instrument was revised in June and July 2020 by the research team for the current edition of the study. The research team sent the revised instrument for peer review by eight superintendents:
• Dr. Burke Royster, Superintendent Greenville County Schools, Greenville, SC. • Dr. Lee D’Andrea, Superintendent (Retired), Anderson School District Four and
Pickens County School District, SC. • Dr. Holly Edds, Superintendent, Orcutt Union School District, Orcutt, CA. • Dr. Anne Hubbard, Superintendent, Hope Elementary School District, Santa
Barbara, CA. • Mrs. Susan Salucci, Assistant Superintendent of Human Resources, Orcutt Union
School District, Orcutt, CA. • Dr. Michael Lubelfeld, Superintendent of Schools, North Shore School District
112, Highland Park, IL. • Dr. Angelica M. Ramsey, Superintendent of Schools, Pleasant Valley School
District, Camarillo, CA. • Mr. Kenyon Kummings, Superintendent of Schools, Wildwood City School
District, NJ.

3
Further revisions were made to the survey instrument for clarity and to aid readability following the peer review. Using a commercially prepared mailing list of American public school superintendents, more than 8046 email invitations to participate were distributed during the months of October, November, and December 2020. State association executive directors were contacted to encourage their members to respond to the online survey. REPORT OF FINDINGS This report of findings is divided into 11 sections and relies solely on measures of central tendency for this analysis of the data collected. These data are generally disaggregated by gender, district enrollment, and racial/cultural group. As noted in previous reports, there are limitations on the proper use of the data. For example, when the responses for certain items are disaggregated by racial/cultural group, the number of responses may be insufficient to support decision making. Care should be exercised in drawing conclusions or inferences on this data element. In addition, some survey fatigue is commonly reported by superintendents and could have impacted the return rate, although the number of valid responses exceeded the 2019-2020 study by 100+. Superintendents are inundated with research requests resulting in selective participation in those studies seen as most important to the role of the superintendent or of benefit to their district. After each data display, the report authors have offered a general statement of findings. It is the intent of the authors to allow the readers the opportunity to disaggregate the data in a manner they find useful in working with their board of education. There were 1,518 responses to the survey. After carefully checking the data, responses from nine participants were omitted as the research team found them to be invalid because of issues such as unverifiable salary entries or too many questions that were not answers. The final sample size was 1,509. The nine omitted participant responses equated to 0.6% of the total responses; 99.4% of the sample was retained. The researcher did have to omit some incomplete responses to individual questions and participants themselves chose to omit some responses to specific questions. Those questions with the highest percentages of omitted responses centered on salary information for assistant/associate/deputy superintendent, high school principal, middle school principal, elementary school principal, and the starting salary for a first-year teacher with a BA. The salary responses for superintendents had the lowest percentage of omitted data (n=14, 0.9%), followed by elementary school principal salary

4
data (n=101, 7%), then high school principal salary data (n=138, 9%), and starting salary for a first-year teacher with a BA (n=140, 9.1%). The highest percentage of omitted data occurred for the assistant/associate/deputy superintendent (n=548, 36.7%). This is not uncommon because some school districts do not have such a position because of enrollment size or budget constraints. The second largest amount of data omitted was salary data for middle school principals (n=285, 18.7%). Again, this could be due to the configuration of some school districts, such as grades PreK-8 or PreK-6. In addition, some total percentages may total between 99.5% and 100.2% due to rounding. Having clearly identified the limitations inherent in a study of this magnitude, the report that follows is replete with important information that can prove very useful to superintendents. END NOTES: Many additional data elements were collected beyond those reported in this document. AASA members interested in investigating in greater depth an element of this study beyond those reported herein or are interested in offering suggestions for improvement of this research undertaking are invited to contact Noelle Ellerson Ng directly at AASA, The School Superintendents Association. Those citing the data presented herein and/or findings are asked to include acclamation of AASA. Requests to use the data from this study or those that preceded it should contact Noelle Ellerson Ng at AASA for details and requirements. Finally, AASA reserves all rights to the ownership and use of these data. Special thanks are extended to Christian Rogers for his expertise and tireless efforts to manage the nearly 70,000-cell spreadsheet containing the data collected in this study and to Maree Sneed of Hogan and Lovells for her ongoing advice and input. Christopher H. Tienken February 2021

5
LIST OF TABLES
Section #1: General Demographics of Respondents
Table 1.1 Respondents count by state (Q1) Table 1.2 Gender (Q61) and race/cultural group (Q60) Table 1.3 Gender (Q61) and district enrollment (Q2) Table 1.4 Gender (Q61) and district description (Q3) Table 1.5 Age (Q59) and gender (Q61) of superintendent Table 1.6 Years in your current position (Q5) and gender (Q61) Table 1.7 Gender (Q61) and longevity as superintendent (Q6) Table 1.8 Gender (Q61) and economic condition of district (Q14) Table 1.9 Racial/cultural group of superintendents (Q60) and district
enrollment (Q2) Table 1.10 Racial/cultural group (Q60) and description of school district (Q3) Table 1.11 Age (Q59) and racial/cultural group (Q60) Table 1.12 Racial/cultural group (Q60) and years in current position (Q5) Table 1.13 Racial/cultural group (Q60) and years as superintendent (Q6) Table 1.14 Racial/cultural group (Q60) and economic condition of district
(Q14)
Section #2: Salary
Table 2.1 Superintendent base salary 2020-2021(Q7) and enrollment (Q2) Table 2.2 Superintendent base salary (Q7) and gender (Q61) Table 2.3 Superintendent base salary (Q7) and racial/cultural group (Q60) Table 2.4A Associate superintendent base salary (Q8) and district enrollment
(Q2) Table 2.4B High school principal base salary (Q9) and district enrollment (Q2) Table 2.4C Middle school principal base salary (Q10) and district enrollment
(Q2) Table 2.4D Elementary school principal base salary (Q11) and district
enrollment (Q2) Table 2.4E Beginning teacher base salary (Q12) and district enrollment (Q2) Table 2.5 Ratio of median superintendent salary (Q7), starting teacher salary,
and district enrollment (Q2) 2020-2021
Section #3: Evaluation
Table 3.1A How often employment contract requires performance evaluation (Q42)

6
Table 3.1B How often employment contract requires performance evaluation (Q42) and gender (Q61)
Table 3.2A Does your employment contract specify the process, measures, and indicators to be used for your formal performance evaluation? (Q38)
Table 3.2B Does your employment contract specify the process, measures, and indicators to be used for your formal performance evaluation (Q38) and gender? (Q61)
Table 3.3 Is performance linked to objectives/goals from previous evaluations? (Q39)
Table 3.4 Does your employment contract specify the process, measures, and indicators to be used for your formal performance evaluation (Q38) and race/cultural group? (Q61)
Table 3.5 Is your formal performance evaluation linked to student outcomes/performance? (Q40)
Table 3.6 Is the outcome of your formal performance evaluation released to the public? (Q41)
Table 3.7A Gender (Q61) and employment agreement includes specific and detailed listing of duties and responsibilities (Q35)
Table 3.7B Gender (Q61) and formal performance evaluation linked to objectives or directions specified in previous year’s performance (Q39)
Table 3.7C Gender (Q61) and performance evaluation linked to student outcomes/performance (Q40)
Table 3.7D Gender (Q61) and formal performance evaluation made public (Q41)
Table 3.8A Racial/cultural group (Q60) and specific and detailed listing of duties and responsibilities (Q35)
Table 3.8B Racial/cultural group (Q60) and formal performance evaluation linked to objectives or directions specified in previous year’s performance (Q39)
Table 3.8C Racial/cultural group (Q60) and performance evaluation linked to student outcomes/performance (Q40)
Table 3.8D Racial/cultural group (Q60) and formal performance evaluation made public (Q41)
Table 3.9 Gender (Q61) and does your employment agreement include a specific and detailed process for handling complaints/criticisms (Q36)
Table 3.10 Racial/cultural group (Q60) and does your employment agreement include a specific and detailed process for handling complaints/criticisms (Q36)
Table 3.11 Gender (Q61) and does your employment agreement include a provision allowing the board to reassign you to another role in the

7
district? (Q37)
Section #4: Retirement Benefits
Table 4.1 Does the school district make a contribution to an annuity or private retirement account that you have? (Q49)
Table 4.2 Is your retirement plan/system contribution based on your salary? (Q47)
Table 4.3 Does the school district make a contribution to an annuity or private retirement account (Q49) and enrollment? (Q2)
Table 4.4 Does the school district make a contribution to an annuity or private retirement account (Q49) and race/cultural group? (Q60)
Table 4.5 Does the school district make a contribution to an annuity or private retirement account (Q49) and gender? (Q61)
Table 4.6 Does the school district make a contribution to an annuity or private retirement account (Q49) and current degree status? (Q62)
Section #5: Insurance Benefits
Table 5.1A What health insurance coverage do you receive in your employment agreement? (Q51)
Table 5.1B Coverage paid for family of superintendent (Q52) Table 5.2A District contribution to life insurance (Q50) and race/cultural
group (Q60) Table 5.2B District contribution to life insurance (Q50) and gender (Q61) Table 5.3A District contributes to post-retirement health insurance (Q53) Table 5.3B District contributes to post-retirement health insurance (Q53) and
enrollment (Q2) Table 5.3C Post-retirement health insurance (Q53) and gender (Q61) Table 5.3D Post-retirement health insurance (Q53) and race/cultural group
(Q60) Table 5.4 Percentage of retirement contribution paid by your district (Q48)
and race/cultural group (Q60). Table 5.5 Memberships paid for (Q54)
Section #6: Hire/Rehire; Retirement System Participation
Table 6.1A Have you been rehired for your present position as superintendent after retiring in the state system? (Q57)
Table 6.1B Have you been rehired for your present position as superintendent after retiring in the state system? (Q57) and gender (Q61)
Table 6.2 Are you drawing retirement from one state and working as a superintendent in another state? (Q58)
Table 6.3 Do you participate in a state retirement system? (Q44)

8
Table 6.4 How many years of participation in the state retirement program are required to vest? (Q45)
Table 6.5 Is there a maximum salary cap on the calculation of your state retirement benefits? (Q46)
Table 6.6 Is your retirement calculation based on your salary? (Q47) Table 6.7A Percentage of retirement contribution paid by your district (Q48)
and gender (Q61) Table 6.7B Percentage of retirement contribution paid by your district (Q48)
and race/cultural group (Q60)
Section #7: Miscellaneous Benefits
Table 7.1 Does the school district contribute to the premiums on a term insurance policy apart from the insurance benefits provided for all employees? (Q50)
Table 7.2A Gender (Q61) and days of sick leave (Q21) Table 7.2B Gender (Q61) and maximum sick leave accrual (Q22) Table 7.2C Cap on sick leave carryover (Q30) Table 7.3 Cap on vacation leave carryover (Q31)
Table 7.4A Gender (Q61) and vacation leave (Q23) Table 7.4B Gender (Q61) and vacation leave accrual (Q24) Table 7.5A Gender (Q61) and cap on vacation leave (Q31) Table 7.5B Gender (Q61) and cap on personal leave accrual (Q26) Table 7.5C Cap on personal leave carryover (Q32) Table 7.6 Gender (Q61) and upon departure from the district, how is sick
leave accrual handled? (Q27) Table 7.7 Gender (Q61) and upon departure from the district, how is
vacation leave accrual handled? (Q28) Table 7.8 Gender (Q61) and upon departure from the district, how is
personal leave accrual handled? (Q29) Table 7.9 Gender (Q61) and what is the term of your 2020–21 employment
contract? (Q15) Table 7.10 Gender (Q61) and does your present employment contract have an
incentive/performance clause (i.e., a defined provision providing for a reward for accomplishing a predetermined task or objective)? (Q11)
Table 7.11 Gender (Q61) and does your contract have a severance (buyout) clause? (Q18)
Table 7.12 Gender (Q61) and does your contract have a longevity clause (i.e., a lump sum payment you will receive for the number of years you remain in the position)? (Q20)

9
Table 7.13 Is your employment agreement base salary subject to a cap (Q33) and gender? (Q61)
Table 7.14A Gender (Q61) and evergreen (rollover) provision (Q17) Table 7.14B Gender (Q61) and indemnification/hold harmless (Q19) Table 7.15 Racial/cultural group (Q60) and what is the term of your 2020-2021
employment contract? (Q15) Table 7.16 Racial/cultural group (Q60) and does your present employment
contract have an incentive/performance clause (i.e., a defined provision providing for a reward for accomplishing a predetermined task or objective)? (Q17)
Table 7.17 Racial/cultural group (Q60) and does your contract have a severance (buyout) clause? (Q18)
Table 7.18 Racial/cultural group (Q60) and does your contract have a longevity clause (i.e., a lump sum payment you will receive for the number of years you remain in the position)? (Q20)
Table 7.19 Is there a cap on the number of sick days (Q30) and race/cultural group (Q60)
Table 7.20A Racial/cultural group (Q60) and evergreen (rollover) provision (Q17)
Table 7.20B Racial/cultural group (Q60) and indemnification/hold harmless (Q19)
Table 7.21 List of miscellaneous benefits reported by superintendents (Q43)
Section #8: Use of Legal Counsel
Table 8.1 Did the school district use legal counsel to assist in the development and/or negotiations of your contract? (Q56) and gender (Q61)
Table 8.2 Did the board use legal counsel in negotiating the employment agreement (Q56) and enrollment? (Q2)
Table 8.3 Did the board use legal counsel in negotiating the employment agreement (Q56) and race/cultural group? (Q60)
Table 8.4 Did the superintendent employ legal counsel to assist in the development and/or negotiations of your contract? (Q55) and gender (Q61)
Table 8.5 Did the superintendent use legal counsel in negotiating the employment agreement (Q55) and enrollment? (Q2)
Table 8.6 Did the superintendent use legal counsel in negotiating the employment agreement (Q55) and race and culture group? (Q60)
Section #9: Memberships
Table 9.1 AASA membership (Q63) Table 9.2 AASA membership (Q63) and gender (Q61)

10
Table 9.3 AASA membership (Q63) and race/cultural group (Q60)
Section #11: Survey Instrument

11
SECTION #1: GENERAL DEMOGRAPHICS OF RESPONDENTS
Table 1.1. Respondents count by state (Q1)
Findings: A total of 1,509 usable responses were received, representing an approximate 18.8% return rate. The total return compares favorably with previous editions of the study (2019-20 N=1,259, 2018-19, N=1,433, 2017-18 N=1,172 and 2016-17 N=1,392) A total of 48 states are represented with two participants from Canada and no participants from the District of Columbia, Hawaii or Delaware.
State Count %
Alabama 36 2.39%
Alaska 13 0.86%
Arizona 31 2.05%
Arkansas 15 0.99%
California 29 1.92%
Canada 2 0.13%
Colorado 13 0.86%
Connecticut 28 1.86%
Florida 3 0.20%
Georgia 32 2.12%
Idaho 17 1.13%
Illinois 103 6.83%
Indiana 109 7.22%
Iowa 46 3.05%
Kansas 25 1.66%
Kentucky 5 0.33%
Louisiana 1 0.07%
Maine 11 0.73%
Maryland 2 0.13%
Massachusetts 18 1.19%
Michigan 88 5.83%
Minnesota 70 4.64%
Mississippi 11 0.73%
Missouri 52 3.45%
Montana 17 1.13%
Nebraska 25 1.66%
State Count %
Nevada 7 0.46%
New Hampshire 11 0.73%
New Jersey 29 1.92%
New Mexico 19 1.26%
New York 137 9.08%
North Carolina 9 0.60%
North Dakota 8 0.53%
Ohio 54 3.58%
Oklahoma 24 1.59%
Omitted 37 2.45%
Oregon 14 0.93%
Pennsylvania 96 6.36%
Rhode Island 14 0.93%
South Carolina 11 0.73%
South Dakota 14 0.93%
Tennessee 25 1.66%
Texas 20 1.33%
Utah 4 0.27%
Vermont 8 0.53%
Virginia 21 1.39%
Washington 46 3.05%
West Virginia 3 0.20%
Wisconsin 80 5.30%
Wyoming 16 1.06%
Total 1509 100%

12
Table 1.2. Gender (Q61) and race/cultural group (Q60)
Male
Female Prefer not to respond
Omitted Total
White (Not Hispanic or
Latino)
1023 313 4 8 1348
75.9% 23.2% 0.3% 0.6% 100%
Black or African American 38
38 0 1 77
49.4% 49.4% 0.0% 1.3% 100%
Hispanic/Latinx 28
15 0 0 43
65.1%
34.9% 0.0% 0.0% 100%
Asian 5
2 0 0 7
71.4%
28.6% 0.0% 0.0% 100%
Native American or Native
Alaska
9
5 0 0 14
64.3%
35.7% 0.0% 0.0% 100%
Other 6
2 0 0 8
75.0%
25.0% 0.0% 0.0% 100%
Omitted 4
0 0 8 12
33.3%
0.0% 0.0% 66.7% 100%
Total
1113 375 4 17 1509
73.8% 24.9% 0.3% 1.1% 100%
Findings: No notable variance in superintendent identity when gender and race/cultural group are considered over the term of the studies while the under representation of some race/cultural groups is noted. Table 1.3. Gender (Q61) and district enrollment (Q2)
Enrollment Female Male Prefer not to
respond Omitted Grand Total
Fewer than 300 9 2.40% 40 3.59% 0 0% 0 0% 49 3.25%
300 to 999 75 20% 257 23.09% 1 25% 4 23.53% 337 22.33%
1,000 to 2,999 141 37.60% 391 35.13% 1 25% 7 41.18% 540 35.79%
3,000 to 4,999 57 15.20% 160 14.38% 1 25% 1 5.88% 219 14.51%
5,000 to 9,999 48 12.80% 144 12.94% 0 0% 3 17.65% 195 12.92%
10,000 to 24,999 38 10.13% 84 7.55% 1 25% 2 11.76% 125 8.28%
25,000 to 49,999 4 1.07% 19 1.71% 0 0% 0 0% 23 1.52%
50,000 to 99,999 3 0.80% 11 0.99% 0 0% 0 0% 14 0.93%
100,000 or more 0 0% 4 0.36% 0 0% 0 0% 4 0.27%
Omitted 0 0% 3 0.27% 0 0% 0 0% 3 0.20%
Grand Total 375 100% 1113 100% 4 100% 17 100% 1509 100%
Findings: Consistent with national school district enrollment data, the majority of superintendents responding to the survey are from small and intermediate size school

13
districts (300-4,999) with no recent appreciable difference by gender of superintendents serving in each enrollment band. Table 1.4. Gender (Q61) and district description (Q3)
School District
Description Female Male
Prefer not to respond
Omitted Total
Rural 235 62.67% 627 56.33% 2 50% 9 52.94% 873 57.85%
Suburban 123 32.80% 370 33.24% 2 50% 5 29.41% 500 33.13%
Urban 12 3.20% 116 10.42% 0 0% 3 17.65% 131 8.68%
Omitted 5 1.33% 0 0% 0 0% 0 0% 5 0.33%
Total 375 100% 1113 100% 4 100% 17 100% 1509 100%
Findings: When asked to identify the setting of their school district, nearly 53 percent of the respondents, regardless of gender, indicated that their district is best described as rural with almost 30 percent describing their district as suburban and 18 percent as urban. This is closely aligned with data from the National Center on Educational Statistics. Table 1.5. Age (Q59) and gender (Q61) of superintendent
Male Female Prefer not to respond Omitted Total
33 2 0 0 0 2
100% 0.0% 0.0% 0.0% 100%
34 2 0 0 0 2
100% 0.0% 0.0% 0.0% 100%
35 4 3 0 0 7
57.1% 42.9% 0.0% 0.0% 100%
36 3 0 0 0 3
100% 0.0% 0.0% 0.0% 100%
37 2 2 0 1 5
40.0% 40.0% 0.0% 20.0% 100%
38 17 1 0 0 18
94.4% 5.6% 0.0% 0.0% 100%
39 13 3 0 0 16
81.3% 18.8% 0.0% 0.0% 100%
40 18 4 0 0 22
81.8% 18.2% 0.0% 0.0% 100%
41 15 3 0 0 18
83.3% 16.7% 0.0% 0.0% 100%
42 19 6 0 0 25

14
76.0% 24.0% 0.0% 0.0% 100%
43 26 9 0 0 35
74.3% 25.7% 0.0% 0.0% 100%
44 30 7 0 0 37
81.1% 18.9% 0.0% 0.0% 100%
45 41 6 0 0 47
87.2% 12.8% 0.0% 0.0% 100%
46 40 18 0 0 58
69.0% 31.0% 0.0% 0.0% 100%
47 64 14 0 0 78
82.1% 17.9% 0.0% 0.0% 100%
48 67 15 0 0 82
81.7% 18.3% 0.0% 0.0% 100%
49 59 13 0 0 72
81.9% 18.1% 0.0% 0.0% 100%
50 70 14 0 1 85
82.4% 16.5% 0.0% 1.2% 100%
51 62 35 0 0 97
63.9% 36.1% 0.0% 0.0% 100%
52 74 26 2 0 102
72.5% 25.5% 2.0% 0.0% 100%
53 75 21 0 1 97
77.3% 21.6% 0.0% 1.0% 100%
54 52 18 0 0 70
74.3% 25.7% 0.0% 0.0% 100%
55 54 14 0 0 68
79.4% 20.6% 0.0% 0.0% 100%
56 34 20 0 0 54
63.0% 37.0% 0.0% 0.0% 100%
57 29 26 0 0 55
52.7% 47.3% 0.0% 0.0% 100%
58 29 20 0 0 49
59.2% 40.8% 0.0% 0.0% 100%
59 30 17 2 1 50
60.0% 34.0% 4.0% 2.0% 100%
60 36 9 0 0 45
80.0% 20.0% 0.0% 0.0% 100%
61 17 8 0 0 25
68.0% 32.0% 0.0% 0.0% 100%

15
62 18 8 0 0 26
69.2% 30.8% 0.0% 0.0% 100%
63 22 7 0 2 31
71.0% 22.6% 0.0% 6.5% 100%
64 13 6 0 1 20
65.0% 30.0% 0.0% 5.0% 100%
65 15 6 0 0 21
71.4% 28.6% 0.0% 0.0% 100%
66 11 2 0 0 13
84.6% 15.4% 0.0% 0.0% 100%
67 10 3 0 0 13
76.9% 23.1% 0.0% 0.0% 100%
68 3 3 0 0 6
50.0% 50.0% 0.0% 0.0% 100%
69 5 0 0 0 5
100% 0.0% 0.0% 0.0% 100%
70 9 0 0 0 9
100% 0.0% 0.0% 0.0% 100%
71 9 2 0 0 11
81.8% 18.2% 0.0% 0.0% 100%
72 3 0 0 0 3
100% 0.0% 0.0% 0.0% 100%
73 1 2 0 0 3
33.3% 66.7% 0.0% 0.0% 100%
74 2 1 0 0 3
66.7% 33.3% 0.0% 0.0% 100%
75 1 0 0 0 1
100% 0.0% 0.0% 0.0% 100%
Omitted 7 3 0 10 20
35.0% 15.0% 0.0% 50.0% 100%
Total 1113 375 4 17 1509
73.8% 24.9% 0.3% 1.1% 100%
Findings: Most superintendents report being in their late forties and early fifties with little variation in responses by gender.

16
Table 1.6. Years in your present position (Q5) and gender (Q61)
Years in Current Position
Female Male Prefer not to respond Omitted Grand Total
Less than 1 year
12 3.20% 167 15% 0 0% 3 17.65% 182 12.06%
1 - 5 years
205 54.67% 498 44.74% 2 50% 9 52.94% 714 47.32%
6-10 years
123 32.80% 286 25.70% 2 50% 5 29.41% 416 27.57%
11-15 years
35 9.33% 108 9.70% 0 0% 0 0% 143 9.48%
16-20 years
0 0% 31 2.79% 0 0% 0 0% 31 2.05%
21-25 years
0 0% 8 0.72% 0 0% 0 0% 8 0.53%
26-30 years
0 0% 5 0.45% 0 0% 0 0% 5 0.33%
31-35 years
0 0% 3 0.27% 0 0% 0 0% 3 0.20%
36-40 years
0 0% 1 0.09% 0 0% 0 0% 1 0.07%
40+ years
0 0% 1 0.09% 0 0% 0 0% 1 0.07%
Omitted 0 0% 5 0.45% 0 0% 0 0% 5 0.33%
Grand Total
375 100% 1113 100% 4 100% 17 100% 1509 100%
Findings: Most superintendents reported serving in their present position for less than five years, with just 13 percent serving more than ten years. This finding is consistent with previous findings. No appreciable difference is noted when service in present position is considered by gender.

17
Table 1.7. Gender (Q61) and longevity as superintendent (Q6)
Years of Experience
Female Male Prefer not to respond Omitted Total
Less than 1 year
0 0% 126 11.32% 0 0% 0 0% 126 8.35%
1 - 5 years 205 54.67% 309 27.76% 0 0% 0 0% 514 34.06%
6-10 years 122 32.53% 327 29.38% 2 50% 5 29.41% 456 30.22%
11-15 years
35 9.33% 203 18.24% 2 50% 9 52.94% 249 16.50%
16-20 years
0 0% 95 8.54% 0 0% 0 0% 95 6.30%
21-25 years
0 0% 41 3.68% 0 0% 0 0% 41 2.72%
26-30 years
3 0.80% 7 0.63% 0 0% 0 0% 10 0.66%
31-35 years
6 1.60% 0 0% 0 0% 0 0% 6 0.40%
36-40 years
3 0.80% 0 0% 0 0% 0 0% 3 0.20%
40+ years 1 0.27% 0 0% 0 0% 0 0% 1 0.07%
Omitted 0 0% 5 0.45% 0 0% 3 17.65% 8 0.53%
Total 375 100% 1113 100% 4 100% 17 100% 1509 100%
Findings: Male superintendents reported serving in the superintendency longer than females, although the longevity of female superintendents has increased substantially over the previous years of this study and The American School Superintendent: 2020 Decennial Study. Table 1.8. Gender (Q61) and economic condition of district (Q14)
Declining economic condition
Stable economic condition
Strong economic condition
Omitted Grand Total
Female 375 70% 0 0% 0 0% 0 0.0% 375 25%
Male 162 30% 833 100% 107 84% 11 100% 1113 74%
Prefer not to
respond 0 0% 0 0% 4 3% 0 0.0% 4 0%
Omitted 0 0% 0 0% 17 13% 0 0.0% 17 1%
Grand Total
537 100% 833 100% 128 100% 11 100% 1509 100%
Findings: In the 2019-20 report 32 percent of female superintendents described their districts as in declining economic condition along with 25.1 percent of male superintendents. The findings for this year’s investigation show a trend of more superintendents, male and female, feeling less optimistic about the economic stability of their districts.

18
Table 1.9. Racial/cultural group of superintendents (Q60) and district enrollment (Q2)
Enrollment
White (not Hispanic or
Latino) Other Omitted Total
Fewer than 300 45 3.34% 2 25% 0 0% 49 3.25%
300 to 999 302 22.40% 2 25% 2 16.67% 337 22.33%
1,000 to 2,999 476 35.31% 3 37.50% 4 33.33% 540 35.79%
3,000 to 4,999 192 14.24% 0 0% 2 16.67% 219 14.51%
5,000 to 9,999 180 13.35% 1 12.50% 2 16.67% 195 12.92%
10,000 to 24,999 112 8.31% 0 0% 2 16.67% 125 8.28%
25,000 to 49,999 20 1.48% 0 0% 0 0% 23 1.52%
50,000 to 99,999 14 1.04% 0 0% 0 0% 14 0.93%
100,000 or more 4 0.30% 0 0% 0 0% 4 0.27%
Omitted 3 0.22% 0 0% 0 0% 3 0.20%
Total 1348 100% 8 100% 12 100% 1509 100%
Findings: As previously reported, White (not Hispanic) superintendents represent the majority of superintendents responding to the study regardless of district size, which is consistent with the findings of The American School Superintendent: 2020 Decennial Study as well as findings from the 2019–2020 salary studies. Note: As indicated in the introduction, care should be exercised in drawing conclusions or inferences from the very small numbers of respondents in some of the racial/cultural groups, other than the fact that White (not Hispanic) superintendents are the largest group represented in the study. Other racial/cultural groups appear to be underrepresented in the superintendent ranks, especially when compared to the racial/cultural profile of American public school enrollment.

19
Table 1.10. Racial/cultural group (Q60) and description of school district (Q3)
Racial/ Cultural Group Rural Suburban Urban Omitted Total
Asian 2 0.23% 0 0% 0 0% 5 100% 7 0.46%
Black or African American
77 8.82% 0 0% 0 0% 0 0% 77 5.10%
Hispanic/Latinx 43 4.93% 0 0% 0 0% 0 0% 43 2.85%
Native American or Native Alaskan
14 1.60% 0 0% 0 0% 0 0% 14 0.93%
Other 8 0.92% 0 0% 0 0% 0 0% 8 0.53%
White (not Hispanic or Latino)
717 82.13% 500 100% 131 100% 0 0% 1348 89.33%
Omitted 12 1.37% 0 0% 0 0% 0 0% 12 0.80%
Total 873 100% 500 100% 131 100% 5 100% 1509 100%
Findings: Considering the small representation of some racial/cultural group respondents, it is difficult to draw conclusions from these data, although the absence of diversity in urban districts again represents an anomaly when one considers the diversity of the student population generally understood to be enrolled in many urban districts.

20
Table 1.11. Age (Q59) and racial/cultural group (Q60)
White (Not Hispanic or Latino)
Black or African American
Hispanic/ Latinx Asian
Native American or Native Alaska Other Omitted Total
33 Count 0 2 0 0 0 0 0 2
% 0.0% 100% 0.0% 0.0% 0.0% 0.0% 0.0% 100%
34 Count 2 0 0 0 0 0 0 2
% 100% 0.0% 0.0% 0.0% 0.0% 0.0% 0.0% 100%
35 Count 6 0 0 1 0 0 0 7
% 85.7% 0.0% 0.0% 14.3% 0.0% 0.0% 0.0% 100%
36 Count 3 0 0 0 0 0 0 3
% 100% 0.0% 0.0% 0.0% 0.0% 0.0% 0.0% 100%
37 Count 5 0 0 0 0 0 0 5
% 100% 0.0% 0.0% 0.0% 0.0% 0.0% 0.0% 100%
38 Count 18 0 0 0 0 0 0 18
% 100% 0.0% 0.0% 0.0% 0.0% 0.0% 0.0% 100%
39 Count 14 1 0 0 1 0 0 16
% 87.5% 6.3% 0.0% 0.0% 6.3% 0.0% 0.0% 100%
40 Count 20 1 1 0 0 0 0 22
% 90.9% 4.5% 4.5% 0.0% 0.0% 0.0% 0.0% 100%
41 Count 18 0 0 0 0 0 0 18
% 100% 0.0% 0.0% 0.0% 0.0% 0.0% 0.0% 100%
42 Count 24 1 0 0 0 0 0 25
% 96.0% 4.0% 0.0% 0.0% 0.0% 0.0% 0.0% 100%
43 Count 30 3 1 0 1 0 0 35
% 85.7% 8.6% 2.9% 0.0% 2.9% 0.0% 0.0% 100%
44 Count 32 3 1 0 0 1 0 37
% 86.5% 8.1% 2.7% 0.0% 0.0% 2.7% 0.0% 100%
45 Count 42 2 0 0 2 0 1 47
% 89.4% 4.3% 0.0% 0.0% 4.3% 0.0% 2.1% 100%
46 Count 52 3 1 0 1 1 0 58
% 89.7% 5.2% 1.7% 0.0% 1.7% 1.7% 0.0% 100%
47 Count 69 7 0 1 0 1 0 78
% 88.5% 9.0% 0.0% 1.3% 0.0% 1.3% 0.0% 100%
48 Count 74 3 5 0 0 0 0 82
% 90.2% 3.7% 6.1% 0.0% 0.0% 0.0% 0.0% 100%
49 Count 65 2 3 2 0 0 0 72
% 90.3% 2.8% 4.2% 2.8% 0.0% 0.0% 0.0% 100%
50 Count 76 4 4 0 0 1 0 85
% 89.4% 4.7% 4.7% 0.0% 0.0% 1.2% 0.0% 100%
51 Count 86 9 1 0 0 1 0 97
% 88.7% 9.3% 1.0% 0.0% 0.0% 1.0% 0.0% 100%
52 Count 89 6 5 0 2 0 0 102
% 87.3% 5.9% 4.9% 0.0% 2.0% 0.0% 0.0% 100%
53 Count 85 6 4 0 1 1 0 97
% 87.6% 6.2% 4.1% 0.0% 1.0% 1.0% 0.0% 100%
54 Count 60 6 4 0 0 0 0 70
% 85.7% 8.6% 5.7% 0.0% 0.0% 0.0% 0.0% 100%
55 Count 66 2 0 0 0 0 0 68
% 97.1% 2.9% 0.0% 0.0% 0.0% 0.0% 0.0% 100%
56 Count 50 0 2 0 2 0 0 54
% 92.6% 0.0% 3.7% 0.0% 3.7% 0.0% 0.0% 100%
57 Count 52 2 1 0 0 0 0 55

21
% 94.5% 3.6% 1.8% 0.0% 0.0% 0.0% 0.0% 100%
58 Count 41 3 3 0 1 1 0 49
% 83.7% 6.1% 6.1% 0.0% 2.0% 2.0% 0.0% 100%
59 Count 47 1 1 1 0 0 0 50
% 94.0% 2.0% 2.0% 2.0% 0.0% 0.0% 0.0% 100%
60 Count 44 1 0 0 0 0 0 45
% 97.8% 2.2% 0.0% 0.0% 0.0% 0.0% 0.0% 100%
61 Count 22 1 0 0 2 0 0 25
% 88.0% 4.0% 0.0% 0.0% 8.0% 0.0% 0.0% 100%
62 Count 24 0 1 0 0 0 1 26
% 92.3% 0.0% 3.8% 0.0% 0.0% 0.0% 3.8% 100%
63 Count 26 1 2 1 0 1 0 31
% 83.9% 3.2% 6.5% 3.2% 0.0% 3.2% 0.0% 100%
64 Count 18 1 1 0 0 0 0 20
% 90.0% 5.0% 5.0% 0.0% 0.0% 0.0% 0.0% 100%
65 Count 19 1 1 0 0 0 0 21
% 90.5% 4.8% 4.8% 0.0% 0.0% 0.0% 0.0% 100%
66 Count 11 2 0 0 0 0 0 13
% 84.6% 15.4% 0.0% 0.0% 0.0% 0.0% 0.0% 100%
67 Count 12 0 0 0 1 0 0 13
% 92.3% 0.0% 0.0% 0.0% 7.7% 0.0% 0.0% 100%
68 Count 4 2 0 0 0 0 0 6
% 66.7% 33.3% 0.0% 0.0% 0.0% 0.0% 0.0% 100%
69 Count 4 0 1 0 0 0 0 5
% 80.0% 0.0% 20.0% 0.0% 0.0% 0.0% 0.0% 100%
70 Count 9 0 0 0 0 0 0 9
% 100% 0.0% 0.0% 0.0% 0.0% 0.0% 0.0% 100%
71 Count 11 0 0 0 0 0 0 11
% 100% 0.0% 0.0% 0.0% 0.0% 0.0% 0.0% 100%
72 Count 3 0 0 0 0 0 0 3
% 100% 0.0% 0.0% 0.0% 0.0% 0.0% 0.0% 100%
73 Count 3 0 0 0 0 0 0 3
% 100% 0.0% 0.0% 0.0% 0.0% 0.0% 0.0% 100%
74 Count 2 1 0 0 0 0 0 3
% 66.7% 33.3% 0.0% 0.0% 0.0% 0.0% 0.0% 100%
75 Count 1 0 0 0 0 0 0 1
% 100% 0.0% 0.0% 0.0% 0.0% 0.0% 0.0% 100%
Omit Count 9 0 0 1 0 0 10 20
% 45.0% 0.0% 0.0% 5.0% 0.0% 0.0% 50.0% 100%
Total Count 1348 77 43 7 14 8 12 1509
% 89.3% 5.1% 2.8% 0.5% 0.9% 0.5% 0.8% 100%
Findings: Taking into consideration the small number of respondents from some racial/cultural groups, there was little variance in the range of the median age of superintendents.

22
Table 1.12. Racial/cultural group (Q60) and years in current position (Q5)
Years in Current Position
Asian Black or African
American Hispanic/Latinx
Native American or Native Alaskan
Less than 1 year 0 0% 0 0% 0 0% 0 0%
1 - 5 years 7 100% 77 100% 43 100% 14 100%
6-10 years 0 0% 0 0% 0 0% 0 0%
11-15 years 0 0% 0 0% 0 0% 0 0%
16-20 years 0 0% 0 0% 0 0% 0 0%
21-25 years 0 0% 0 0% 0 0% 0 0%
26-30 years 0 0% 0 0% 0 0% 0 0%
31-35 years 0 0% 0 0% 0 0% 0 0%
36-40 years 0 0% 0 0% 0 0% 0 0%
40+ years 0 0% 0 0% 0 0% 0 0%
Omitted 0 0% 0 0% 0 0% 0 0%
Total 7 100% 77 100% 43 100% 14 100%
Years in Current
Position Other
White (not Hispanic or Latino)
Omitted Total
Less than 1 year 0 0% 182 13.50% 0 0% 182 12.06%
1 - 5 years 8 100% 553 41.02% 12 100% 714 47.32%
6-10 years 0 0% 416 30.86% 0 0% 416 27.57%
11-15 years 0 0% 143 10.61% 0 0% 143 9.48%
16-20 years 0 0% 31 2.30% 0 0% 31 2.05%
21-25 years 0 0% 8 0.59% 0 0% 8 0.53%
26-30 years 0 0% 5 0.37% 0 0% 5 0.33%
31-35 years 0 0% 3 0.22% 0 0% 3 0.20%
36-40 years 0 0% 1 0.07% 0 0% 1 0.07%
40+ years 0 0% 1 0.07% 0 0% 1 0.07%
Omitted 0 0% 5 0.37% 0 0% 5 0.33%
Total 8 100% 1348 100% 12 100% 1509 100%

23
Findings: Given the small number of respondents from some racial/cultural groups, White (not Hispanic) superintendents have served longer in their current position than their counterparts from other racial/cultural groups. Table 1.13. Racial/cultural group (Q60) and years as superintendent (Q6)
Years of experience as a superintendent
Asian Black or African
American Hispanic/Latinx
Native American or Native Alaskan
Less than 1 year 0 0% 0 0% 0 0% 0 0%
1 - 5 years 7 100% 77 100% 43 100% 14 100%
6-10 years 0 0% 0 0% 0 0% 0 0%
11-15 years 0 0% 0 0% 0 0% 0 0%
16-20 years 0 0% 0 0% 0 0% 0 0%
21-25 years 0 0% 0 0% 0 0% 0 0%
26-30 years 0 0% 0 0% 0 0% 0 0%
31-35 years 0 0% 0 0% 0 0% 0 0%
36-40 years 0 0% 0 0% 0 0% 0 0%
40+ years 0 0% 0 0% 0 0% 0 0%
Omitted 0 0% 0 0% 0 0% 0 0%
Total 7 100% 77 100% 43 100% 14 100%
Years of
experience as a superintendent
Other White (not
Hispanic or Latino) Omitted Total
Less than 1 year 0 0% 126 9.35% 0 0% 126 8.35%
1 - 5 years 8 100% 353 26.19% 12 100% 514 34.06%
6-10 years 0 0% 456 33.83% 0 0% 456 30.22%
11-15 years 0 0% 249 18.47% 0 0% 249 16.50%
16-20 years 0 0% 95 7.05% 0 0% 95 6.30%
21-25 years 0 0% 41 3.04% 0 0% 41 2.72%
26-30 years 0 0% 10 0.74% 0 0% 10 0.66%
31-35 years 0 0% 6 0.45% 0 0% 6 0.40%
36-40 years 0 0% 3 0.22% 0 0% 3 0.20%
40+ years 0 0% 1 0.07% 0 0% 1 0.07%
Omitted 0 0% 8 0.59% 0 0% 8 0.53%

24
Total 8 100% 1348 100% 12 100% 1509 100%
Findings: While the numbers are too small for most racial/cultural groups to draw definitive conclusions, the evidence in this year’s investigation shows White (not Hispanic) superintendents have served longer in the superintendency than non-White superintendents. Table 1.14. Racial/cultural group (Q60) and economic condition of district (Q14)
Economic Condition
Asian Black or African
American Hispanic/Latinx
Native American or Native Alaskan
Declining economic condition
7 100% 77 100% 43 100% 14 100%
Stable economic condition
0 0% 0 0% 0 0% 0 0%
Strong economic condition
0 0% 0 0% 0 0% 0 0%
Omitted 0 0% 0 0% 0 0% 0 0%
Total 7 100% 77 100% 43 100% 14 100%
Economic Condition
Other White (not Hispanic
or Latino) Omitted Total
Declining economic condition
8 100% 376 27.89% 12 100% 537 35.59%
Stable economic condition
0 0% 833 61.80% 0 0% 833 55.20%
Strong economic condition
0 0% 128 9.50% 0 0% 128 8.48%
Omitted 0 0% 11 0.82% 0 0% 11 0.73%
Total 8 100% 1348 100% 12 100% 1509 100%
Findings: In the 2019-20 report, over one-fourth of superintendent respondents reported that their districts were in declining economic condition. The findings for this year’s investigation show a trend of more superintendents feeling less optimistic about the economic stability of their districts with over 35% indicating their districts to be in declining economic conditions and 55% indicating their districts to be in stable condition. Again, care should be taken with over-interpreting the data because of the limited number of minority superintendents responding to the survey.

25

26
SECTION #2: SALARY
Table 2.1. Superintendent base salary 2020-2021 (Q7) and enrollment (Q2)
Enrollment 25% Median 75% N
Fewer than 300 94000 108000 134000 49
300 to 999 112000 127460 145000 337
1,000 to 2,999 126759 143000 171000 540
3,000 to 4,999 149000 165500 194750 219
5,000 to 9,999 168750 192000 215943 195
10,000 to 24,999 181775 207000 236753 125
25,000 to 49,999 205000 240000 279000 23
50,000 to 99,999 192600 248000 305797 14
100,000 or more 164500 242500 331362 4
Omitted 140349 180698.5 191048 3
Findings: Consistent with previous years, salaries increase as district enrollment increases.
Table 2.2. Superintendent base salary (Q7) and gender (Q61)
Gender Minimum 25% Median 75% Maximum N
Female 65000 106275 127961 170000 223000 375
Male 102000 135000 157000 198950 345000 1113
Prefer not to respond
150000 150000 183471 183471 217350 4
Omitted 150000 150000 150000 216000 428000 17
Total 1509
Findings: There is a discernable difference in salaries by gender with males reporting higher base salaries.
27
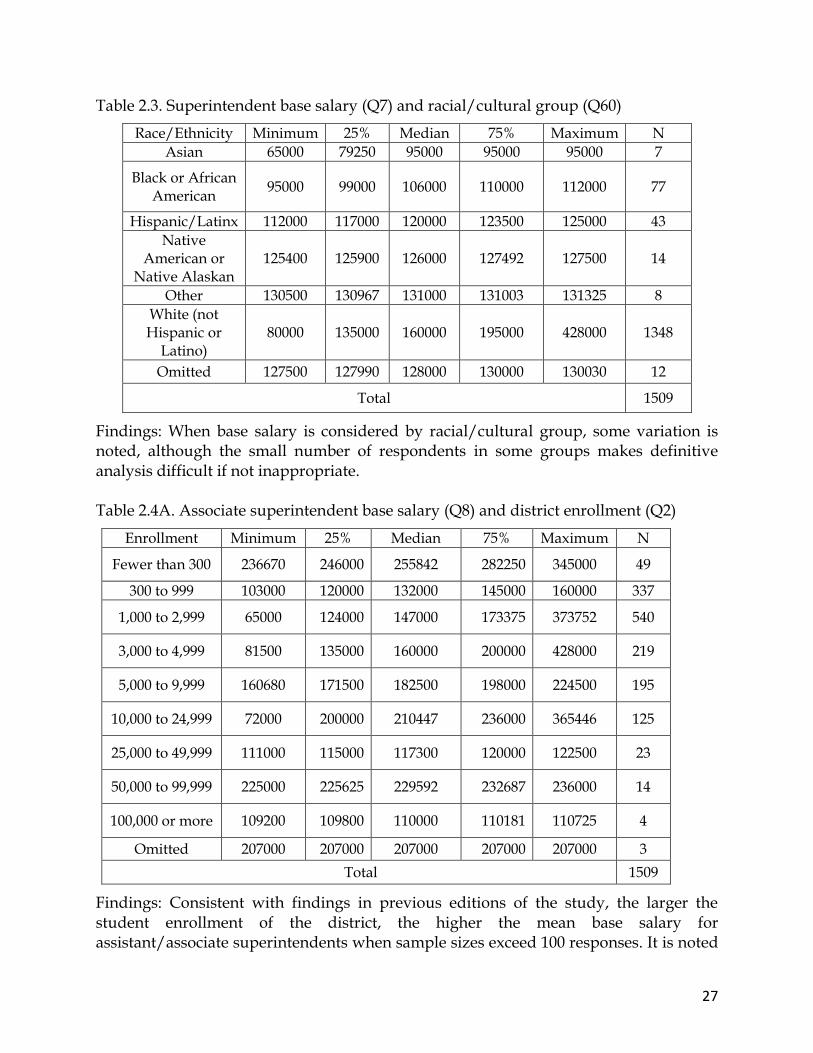
Table 2.3. Superintendent base salary (Q7) and racial/cultural group (Q60)
Race/Ethnicity Minimum 25% Median 75% Maximum N
Asian 65000 79250 95000 95000 95000 7
Black or African American
95000 99000 106000 110000 112000 77
Hispanic/Latinx 112000 117000 120000 123500 125000 43
Native American or
Native Alaskan 125400 125900 126000 127492 127500 14
Other 130500 130967 131000 131003 131325 8
White (not Hispanic or
Latino) 80000 135000 160000 195000 428000 1348
Omitted 127500 127990 128000 130000 130030 12
Total 1509
Findings: When base salary is considered by racial/cultural group, some variation is noted, although the small number of respondents in some groups makes definitive analysis difficult if not inappropriate. Table 2.4A. Associate superintendent base salary (Q8) and district enrollment (Q2)
Enrollment Minimum 25% Median 75% Maximum N
Fewer than 300 236670 246000 255842 282250 345000 49
300 to 999 103000 120000 132000 145000 160000 337
1,000 to 2,999 65000 124000 147000 173375 373752 540
3,000 to 4,999 81500 135000 160000 200000 428000 219
5,000 to 9,999 160680 171500 182500 198000 224500 195
10,000 to 24,999 72000 200000 210447 236000 365446 125
25,000 to 49,999 111000 115000 117300 120000 122500 23
50,000 to 99,999 225000 225625 229592 232687 236000 14
100,000 or more 109200 109800 110000 110181 110725 4
Omitted 207000 207000 207000 207000 207000 3
Total 1509
Findings: Consistent with findings in previous editions of the study, the larger the student enrollment of the district, the higher the mean base salary for assistant/associate superintendents when sample sizes exceed 100 responses. It is noted

28
that in districts with lower enrollments, these positions often do not exist. A modest but consistent increase in median salaries is seen over previous editions of this study. Table 2.4B. High school principal base salary (Q9) and district enrollment (Q2)
Enrollment Minimum 25% Median 75% Maximum Count
Fewer than 300 0 0 0 0 0 49
300 to 999 116000 121000 128601 136400 149000 337
1,000 to 2,999 55000 83000 90000 95000 100000 540
3,000 to 4,999 105060 110000 110000 115000 116000 219
5,000 to 9,999 149000 155000 160000 180000 208000 195
10,000 to 24,999 100000 100000 103000 104000 105000 125
25,000 to 49,999 105000 105000 105000 105000 105000 23
50,000 to 99,999 0 0 0 0 0 14
100,000 or more 105000 105000 105000 105000 105000 4
Omitted 0 0 0 0 0 3
Total 1509
Findings: The mean base salaries of high school principals are loosely related to district enrollment in some categories. Please note that there were no responses for the rows listed as 0. Table 2.4C. Middle school principal base salary (Q10) and district enrollment (Q2)
Enrollment Minimum 25% Median 75% Maximum N
Fewer than 300 0 0 0 0 0 49
300 to 999 119000 125000 135000 150000 230000 337
1,000 to 2,999 55000 80000 85000 90000 98000 540
3,000 to 4,999 105000 108000 110000 115000 119000 219
5,000 to 9,999 0 0 0 0 0 195
10,000 to 24,999 98000 100000 100000 100000 102087 125
25,000 to 49,999 103000 103519 104250 105000 105000 23
50,000 to 99,999 0 0 0 0 0 14
100,000 or more 103000 103000 103000 103000 103000 4
Omitted 0 0 0 0 0 3
Grand Total 1509
Findings: Similar to their high school counterparts, middle school principal base median salaries are loosely related to district enrollment and generally increase as district enrollment increases. Please note that there were no responses for the rows listed as 0.

29
Table 2.4D. Elementary school principal base salary (Q11) and district enrollment (Q2)
Enrollment Minimum 25% Median 75% Maximum N
Fewer than 300 55000 60000 65000 65000 67000 49
300 to 999 80000 82000 85000 88000 90000 337
1,000 to 2,999 105000 111000 120000 135000 205000 540
3,000 to 4,999 90000 92532 95000 97000 99048 219
5,000 to 9,999 70000 72000 75000 77000 80000 195
10,000 to 24,999 100000 100000 102000 102000 105000 125
25,000 to 49,999 99427 100000 100000 100000 100000 23
50,000 to 99,999 67000 68000 68000 68750 70000 14
100,000 or more 100000 100000 100000 100000 100000 4
Omitted 50000 50000 50000 52500 55000 3
Total 1509
Findings: Elementary school principals generally follow the same trend as their high school and middle school counterparts, although for the second time, their 2020 median base salary in the largest districts has crossed the $100,000 line. This trend has continued since the 2017 study. In this year’s investigation, this trend was also observed in medium and small sized districts. Table 2.4E. Beginning teacher base salary (Q12) and district enrollment (Q2)
Enrollment Minimum 25% Median 75% Maximum N
Fewer than 300 0 0 0 0 0 49
300 to 999 44000 45000 46400 48500 51000 337
1,000 to 2,999 24500 35319 37500 39000 40000 540
3,000 to 4,999 41334 42000 42138 43000 44000 219
5,000 to 9,999 51000 52413 54973 56826 95000 195
10,000 to 24,999 40000 40000 40150 41000 41000 125
25,000 to 49,999 41000 41000 41000 41000 41260 23
50,000 to 99,999 0 0 0 0 0 14
100,000 or more 41000 41000 41000 41000 41000 4
Omitted 0 0 0 0 0 3
Total 1509

30
Findings: There does not appear to be a relationship between district enrolment and beginning teacher salary. The highest median base salaries appear to be found in district with 5,000-9,999 students. Please note there were no responses for the rows listed as 0. Table 2.5. Ratio of median superintendent salary (Q7) starting teacher salary, and
district enrollment (Q2) 2020–2021
Enrollment Superintendent Median Salary Median
Beginning Teacher Median Base Salary
Ratio 2020-2021
Fewer than 300 108000 45000 1:2.4
300 to 999 127460 40000 1:3.2
1,000 to 2,999 143000 43000 1:3.3
3,000 to 4,999 165500 40000 1:4.1
5,000 to 9,999 192000 42000 1:4.5
10,000 to 24,999 207000 40000 1:5.1
25,000 to 49,999 240000 45000 1:5.3
50,000 to 99,999 248000 46500 1:5.3
100,000 or more 242500 45500 1:5.3
Omitted 180699 59000 1:3.6
Findings: The median entry-level salary of teachers is presented compared with the median salary of superintendents arrayed by district size. The data confirms that as the district enrollment increases so does the ratio of superintendent compensation. In addition, the ratio appeared to widen over the past six survey periods, regardless of district enrollment.

31
SECTION #3: EVALUATION
Table 3.1A. How often employment contract requires performance evaluation (Q42)
Frequency of Evaluation Number Percentage
Annually 1376 91.1%
Biennially 38 2.5%
Never 19 1.2%
Other 47 3.1
Omitted 8 0.5%
Total 1509
Findings: Over 90% of superintendents are evaluated annually. Table 3.1B. How often employment contract requires performance evaluation (Q42) and
gender (Q61)
Male Female Prefer not to
respond Omitted
Annually 1029 347 3 17 1396
73.7% 24.9% 0.2% 1.2% 100%
Biennially 29 9 0 0 38
76.3% 23.7% 0.0% 0.0% 100%
Never 12 7 1 0 20
60.0% 35.0% 5.0% 0.0% 100%
Other 36 11 0 0 47
76.6% 23.4% 0.0% 0.0% 100%
Omitted 7 1 0 0 8
87.5% 12.5% 0.0% 0.0% 100%
Total 1113 375 4 17 1509
73.8% 24.9% 0.3% 1.1% 100%
Findings: Gender is not related to frequency of evaluation.
32
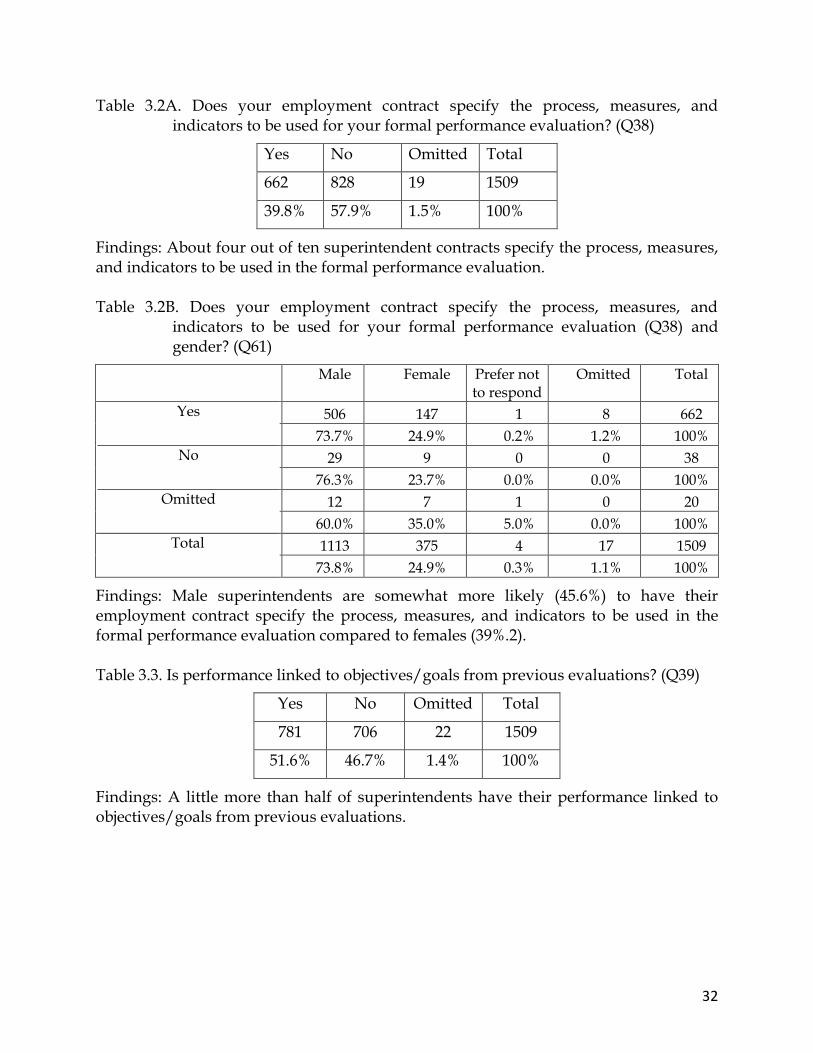
Table 3.2A. Does your employment contract specify the process, measures, and indicators to be used for your formal performance evaluation? (Q38)
Yes No Omitted Total
662 828 19 1509
39.8% 57.9% 1.5% 100%
Findings: About four out of ten superintendent contracts specify the process, measures, and indicators to be used in the formal performance evaluation. Table 3.2B. Does your employment contract specify the process, measures, and
indicators to be used for your formal performance evaluation (Q38) and gender? (Q61)
Male Female Prefer not to respond
Omitted Total
Yes 506 147 1 8 662
73.7% 24.9% 0.2% 1.2% 100%
No 29 9 0 0 38
76.3% 23.7% 0.0% 0.0% 100%
Omitted 12 7 1 0 20
60.0% 35.0% 5.0% 0.0% 100%
Total 1113 375 4 17 1509
73.8% 24.9% 0.3% 1.1% 100%
Findings: Male superintendents are somewhat more likely (45.6%) to have their employment contract specify the process, measures, and indicators to be used in the formal performance evaluation compared to females (39%.2). Table 3.3. Is performance linked to objectives/goals from previous evaluations? (Q39)
Yes No Omitted Total
781 706 22 1509
51.6% 46.7% 1.4% 100%
Findings: A little more than half of superintendents have their performance linked to objectives/goals from previous evaluations.

33
Table 3.4. Does your employment contract specify the process, measures, and indicators to be used for your formal performance evaluation (Q38) and race/cultural group? (Q61)
Yes No Omitted
White (Not Hispanic or Latino) 591 740 17 1348
43.8% 54.9% 1.3% 100%
Black or African American 27 49 1 77
35.1% 63.6% 1.3% 100%
Hispanic/Latinx 22 21 0 43
51.2% 48.8% 0.0% 100%
Asian 4 3 0 7
57.1% 42.9% 0.0% 100%
Native American or Native Alaska 6 7 1 14
42.9% 50.0% 7.1% 100%
Other 5 3 0 8
62.5% 37.5% 0.0% 100%
Omitted 7 5 0 12
58.3% 41.7% 0.0% 100%
Total 662 828 19 1509
43.9% 54.9% 1.3% 100%
Findings: Where numbers were sufficient, there was little difference between racial/cultural groups concerning the inclusion of directions or objectives from the previous year’s assessment in the superintendent’s performance assessment. Black superintendents were the least likely to have such a clause in their contract, but care should be taken to interpret the findings in light of a small sample size (n=77). Table 3.5. Is your formal performance evaluation linked to student outcomes
/performance? (Q40)
Yes No Omitted Total
637 851 21 1509
42.7% 57.1% 1.4% 100%
Findings: Almost 43% of superintendents had evaluations linked to student outcomes/performance in some way. Since 2015/2016, percentages have fluctuated but this year’s results are the highest observed in six years: 41.2%/36.7%/35.1%/34.1%

34
Table 3.6. Is the outcome of your formal performance evaluation released to the public? (Q41)
Yes No Omitted Total
602 885 22 1509
39.9% 58.6% 1.5% 100%
Findings: Almost 40% of superintendents had the outcomes of their formal evaluation released to the public. This represents an increase of approximately 6% compared to last year’s results. Table 3.7A. Gender (Q61) and employment agreement includes specific and detailed
listing of duties and responsibilities (Q35)
Male Female Prefer not to respond Omitted
Yes 552 201 2 13 768
71.9% 26.2% 0.3% 1.7% 100 %
No 549 173 2 4 728
75.4% 23.8% 0.3% 0.5% 100%
Omitted 12 1 0 0 13
92.3% 7.7% 0.0% 0.0% 100%
Total 1113 375 4 17 1509
73.8% 24.9% 0.3% 1.1% 100%
Findings: Approximately 50% of superintendents have a detailed agreement regarding duties and responsibilities in their employment contract. A slightly higher percentage of female superintendents than male superintendents have this provision. Table 3.7B. Gender (Q61) and formal performance evaluation linked to objectives or
directions specified in previous year’s performance (Q39)
Male Female Prefer not to respond Omitted Total
Yes 572 199 1 9 781
73.2% 25.5% 0.1% 1.2% 100%
No 525 170 3 8 706
74.4% 24.1% 0.4% 1.1% 100%
Omitted 16 6 0 0 22
72.7% 27.3% 0.0% 0.0% 100%
Total 1113 375 4 17 1509
73.8% 24.9% 0.3% 1.1% 100%
Findings: Gender is not a determining factor in whether the formal performance evaluation is linked to objectives or directions specified in previous year’s performance

35
Table 3.7C. Gender (Q61) and performance evaluation linked to student outcomes/ performance (Q40)
Findings: An equal percentage of males and females (approximately 43%) have performance evaluation linked to student outcomes/performance. Table 3.7D. Gender (Q61) and formal performance evaluation made public (Q41)
Male Female
Prefer not
to respond Omitted Total
Yes 429 166 0 7 602
71.3% 27.6% 0.0% 1.2% 100%
No 666 205 4 10 885
75.3% 23.2% 0.5% 1.1% 100%
Omitted 18 4 0 0 22
81.8% 18.2% 0.0% 0.0% 100%
Total 1113 375 4 17 1509
73.8% 24.9% 0.3% 1.1% 100%
Findings: When considered by gender, female superintendents (44.2%) are somewhat more likely to have their formal evaluation released to the public compared to male superintendents (38.5%).
Male Female Prefer not to respond Omitted Total
Yes 467 161 1 8 637
73.3% 25.3% 0.2% 1.3% 100%
No 628 211 3 9 851
73.8% 24.8% 0.4% 1.1% 100%
Omitted 18 3 0 0 21
85.7% 14.3% 0.0% 0.0% 100%
Total 1113 375 4 17 1509
73.8% 24.9% 0.3% 1.1% 100%

36
Table 3.8A. Racial/cultural group (Q60) and specific and detailed listing of duties and responsibilities (Q35)
Yes No Omitted Total
White (Not Hispanic or Latino) 688 649 11 1348
51.0% 48.1% 0.8% 100%
Black or African American 31 45 1 77
40.3% 58.4% 1.3% 100%
Hispanic/Latinx 19 23 1 43
44.2% 53.5% 2.3% 100%
Asian 5 2 0 7
71.4% 28.6% 0.0% 100%
Native American or Native Alaska 10 4 0 14
71.4% 28.6% 0.0% 100%
Other 7 1 0 8
87.5% 12.5% 0.0% 100%
Omitted 8 4 0 12
66.7% 33.3% 0.0% 100%
Total 768 728 13 1509
50.9% 48.2% 0.9% 100%
Findings: Black superintendents were less likely to have a specific and detailed listing of duties and responsibilities in their contract. However, the findings should be interpreted with caution given the small sample size of Black superintendents (n=77).

37
Table 3.8B. Racial/cultural group (Q60) and formal performance evaluation linked to objectives or directions specified in previous year’s performance (Q39)
Yes No Omitted Total
White (Not Hispanic or Latino) 693 636 19 1348
51.4% 47.2% 1.4% 100%
Black or African American 40 36 1 77
51.9% 46.8% 1.3% 100%
Hispanic/Latinx 26 17 0 43
60.5% 39.5% 0.0% 100%
Asian 3 4 0 7
42.9% 57.1% 0.0% 100%
Native American or Native Alaska 8 4 2 14
57.1% 28.6% 14.3% 100%
Other 6 2 0 8
75.0% 25.0% 0.0% 100%
Omitted 5 7 0 12
41.7% 58.3% 0.0% 100%
Total 781 706 22 1509
51.8% 46.8% 1.5% 100%
Findings: Where a sufficient number of respondents exist, there is little difference by racial/cultural group. Table 3.8C Racial/cultural group (Q60) and performance evaluation linked to student
outcomes/performance (Q40)
Yes No Omitted Total
White (Not Hispanic or Latino) 569 761 18 1348
42.2% 56.5% 1.3% 100%
Black or African American 33 43 1 77
42.9% 55.8% 1.3% 100%
Hispanic/Latinx 19 23 1 43
44.2% 53.5% 2.3% 100%
Asian 2 5 0 7
28.6% 71.4% 0.0% 100%
Native American or Native Alaska 5 8 1 14
35.7% 57.1% 7.1% 100%
Other 4 4 0 8
50.0% 50.0% 0.0% 100%
Omitted 5 7 0 12
41.7% 58.3% 0.0% 100%
Total 637 851 21 1509
42.2% 56.4% 1.4% 100%

38
Findings: Where a sufficient number of respondents exist, there is little difference by racial/cultural group in the percentage of superintendents whose performance evaluation is linked to student outcomes/performance. Table 3.8D. Racial/cultural group (Q60) and formal performance evaluation made
public (Q41)
Yes No Omitted Total
White (Not Hispanic or Latino)
525 803 20 1348
38.9% 59.6% 1.5% 100.0%
Black or African
American
34 42 1 77
44.2% 54.5% 1.3% 100.0%
Hispanic/Latinx 24 19 0 43
55.8% 44.2% 0.0% 100.0%
Asian 3 4 0 7
42.9% 57.1% 0.0% 100.0%
Native American or Native Alaska
7 6 1 14
50.0% 42.9% 7.1% 100.0%
Other 3 5 0 8
37.5% 62.5% 0.0% 100.0%
Omitted 6 6 0 12
50.0% 50.0% 0.0% 100.0%
Total 602 885 22 1509
39.9% 58.6% 1.5% 100.0%
Findings: Where a sufficient number of respondents exist, Black and Hispanic superintendents are slightly more likely to have their performance evaluation made public. However, readers should interpret this finding with caution given the small sample size of Black superintendents (n=77 & n=43). Table 3.9. Gender (Q61) and does your employment agreement include a specific and
detailed process for handling complaints/criticisms? (Q36)
Male Female Prefer not to
respond Omitted Total
Yes 289 81 0 2 372
77.7% 21.8% 0.0% 0.5% 100%
No 808 291 4 15 1118
72.3% 26.0% 0.4% 1.3% 100%
Omitted 16 3 0 0 19
84.2% 15.8% 0.0% 0.0% 100%
Total 1113 375 4 17 1509
73.8% 24.9% 0.3% 1.1% 100%

39
Findings: When considered by gender, female superintendents (21.6%) are slightly less likely to have their employment agreement include a specific and detailed process for handling complaints/criticisms compared to males (25.9%). Table 3.10. Racial/cultural group (Q60) and does your employment agreement include
a specific and detailed process for handling complaints/criticisms? (Q36)
Yes No Omitted
White (Not Hispanic or Latino) 329 1003 16 1348
24.4% 74.4% 1.2% 100%
Black or African American 22 54 1 77
28.6% 70.1% 1.3% 100%
Hispanic/Latinx 11 30 2 43
25.6% 69.8% 4.7% 100%
Asian 1 6 0 7
14.3% 85.7% 0.0% 100%
Native American or Native Alaska 4 10 0 14
28.6% 71.4% 0.0% 100%
Other 3 5 0 8
37.5% 62.5% 0.0% 100%
Omitted 2 10 0 12
16.7% 83.3% 0.0% 100%
Total 372 1118 19 1509
24.7% 74.1% 1.3% 100%
Findings: Where a sufficient number of respondents exist, there is little difference by race/cultural group. Table 3.11. Gender (Q61) and does your employment agreement include a provision
allowing the board to reassign you to another role in the district? (Q37)
Male Female Prefer not to respond Omitted Total
Yes 82 31 0 2 115
71.3% 27.0% 0.0% 1.7% 100%
No 1018 338 4 15 1375
74.0% 24.6% 0.3% 1.1% 100%
Omitted 13 6 0 0 19
68.4% 31.6% 0.0% 0.0% 100%
Total 1113 375 4 17 1509
73.8% 24.9% 0.3% 1.1% 100%
Findings: There is little difference, when considered by gender, in the percentage of superintendents who have a contract provision allowing the board to reassign them to another role in the district. Less than 10% of superintendents have this provision.

40

41
SECTION #4: RETIREMENT BENEFITS
Table 4.1. Does the school district make a contribution to an annuity or private
retirement account that you have? (Q49)
Yes No Omitted Total
663 824 22 1509
43.9% 54.6% 1.5% 100%
Findings: Approximately 44% of superintendents have a clause in their contract that includes a contribution to an annuity by the district. The percentage of superintendents with this benefit continues to increase compared to results in previous years. Table 4.2. Is your retirement plan/system contribution based on your salary? (Q47)
Frequency Percent
Yes 1407 93.2
No 53 3.5
The district does not
contribute
30 2.0
Omitted 19 1.3
Total 1509 100.0
Findings: More than 93% of superintendents indicated that their retirement contribution is based on annual salary.

42
Table 4.3. Does the school district make a contribution to an annuity or private retirement account (Q49) and enrollment? (Q2)
Yes less
than $1,000
Yes $1,001-
$5,000
Yes $5,001
- $10,000
Yes more
than
$10,000 No Omit Total
Enrollment Fewer than
300
2 5 7 3 32 0 49
4.1% 10.2% 14.3% 6.1% 65.3% 0.0% 100%
300-999 12 38 43 42 197 5 337
3.6% 11.3% 12.8% 12.5% 58.5% 1.5% 100%
1,000-2,999 10 95 79 64 283 9 540
1.9% 17.6% 14.6% 11.9% 52.4% 1.7% 100%
3,000-4,999 8 33 32 36 107 3 219
3.7% 15.1% 14.6% 16.4% 48.9% 1.4% 100%
5,000-9,999 1 35 27 18 111 3 195
0.5% 17.9% 13.8% 9.2% 56.9% 1.5% 100%
10,000-
24,999
4 18 14 21 66 2 125
3.2% 14.4% 11.2% 16.8% 52.8% 1.6% 100%
25,000-
49,999
0 4 2 3 14 0 23
0.0% 17.4% 8.7% 13.0% 60.9% 0.0% 100%
50,000-
99,999
0 2 0 1 11 0 14
0.0% 14.3% 0.0% 7.1% 78.6% 0.0% 100%
100,000-
more
0 1 1 1 1 0 4
0.0% 25.0% 25.0% 25.0% 25.0% 0.0% 100%
Omitted 0 0 1 0 2 0 3
0.0% 0.0% 33.3% 0.0% 66.7% 0.0% 100%
Total 37 231 206 189 824 22 1509
2.5% 15.3% 13.7% 12.5% 54.6% 1.5% 100%
Findings: Where a sufficient number of respondents exist, there is little difference, by enrollment, in the percentage of superintendents whose districts contribute to an annuity.

43
Table 4.4. Does the school district make a contribution to an annuity or private retirement account (Q49) and race/cultural group? (Q60)
Yes less than
$1,000
Yes $1,001-$5,000
Yes $5,001 - $10,000
Yes more than $10,000 No Omit Total
White (Not Hispanic or Latino)
35 220 183 167 733 10 1348
2.6% 16.3% 13.6% 12.4% 54.4% 0.7% 100%
Black or African American
1 7 14 13 39 3 77
1.3% 9.1% 18.2% 16.9% 50.6% 3.9% 100%
Hispanic /Latinx 1 1 3 4 33 1 43
2.3% 2.3% 7.0% 9.3% 76.7% 2.3% 100%
Asian 0 1 3 1 2 0 7
0.0% 14.3% 42.9% 14.3% 28.6% 0.0% 100%
Native American or Native Alaska
0 1 0 1 12 0 14
0.0% 7.1% 0.0% 7.1% 85.7% 0.0% 100%
Other 0 1 3 1 3 0 8
0.0% 2.5% 37.5% 12.5% 37.5% 0.0% 100%
Omitted 0 0 0 2 2 8 12
0.0% 0.0% 0.0% 16.7% 16.7% 66.7% 100%
Total 37 231 206 189 824 22 1509
2.5% 15.3% 13.7% 12.5% 54.6% 1.5% 100%
Findings: Where a sufficient number of respondents exist, there is little difference, by race or cultural group, in the percentage of superintendents whose districts contribute to an annuity. Table 4.5. Does the school district make a contribution to an annuity or private
retirement account (Q49) and gender? (Q61)
Male Female Prefer not to respond Omitted Total
Yes less than $1,000
23 14 0 0 37
62.2% 37.8% 0.0% 0.0% 100%
Yes $1,001-$5,000 170 58 0 3 231
73.6% 25.1% 0.0% 1.3% 100%
Yes $5,001 - $10,000
154 49 2 1 206
74.8% 23.8% 1.0% 0.5% 100%
Yes more than $10,000
156 33 0 0 189
82.5% 17.5% 0.0% 0.0% 100%
No 603 213 2 6 824
73.2% 25.8% 0.2% 0.7% 100%
Omit 7 8 0 7 22
31.8% 36.4% 0.0% 31.8% 100%
Total 1113 375 4 17 1509
73.8% 24.9% 0.3% 1.1% 100%

44
Findings: There is little difference, by gender, in the percentage of superintendents who have their district contribute to an annuity. The most common contribution is $1,000-$5,000 (15.1%), followed by $5,001-$10,000 (13.8%). Table 4.6. Does the school district make a contribution to an annuity or private
retirement account (Q49) and current degree status? (Q62)
Bachelor's Master's MBA Ed.
Specialist Ed.D. J.D. Ph.D. Other Omitted Total
Yes less than $1,000
0 11 1 7 15 0 2 1 0 37
0.0% 29.7% 2.7% 18.9% 40.5% 0.0% 5.4% 2.7% 0.0% 100%
Yes $1,001-$5,000
0 69 0 47 87 0 21 7 0 231
0.0% 29.9% 0.0% 20.3% 37.7% 0.0% 9.1% 3.0% 0.0% 100%
Yes $5,001 - $10,000
0 56 2 47 68 3 23 5 2 206
0.0% 27.2% 1.0% 22.8% 33.0% 1.5% 11.2% 2.4% 1.0% 100%
Yes more than $10,000
0 35 2 17 84 1 45 5 0 189
0.0% 18.5% 1.1% 9.0% 44.4% 0.5% 23.8% 2.6% 0.0% 100%
No 1 236 2 118 367 3 65 30 2 824
0.1% 28.6% 0.2% 14.3% 44.5% 0.4% 7.9% 3.6% 0.2% 100%
Omit 0 5 1 1 3 1 2 0 9 22
0.0% 22.7% 4.5% 4.5% 13.6% 4.5% 9.1% 0.0% 40.9% 100%
Total 1 412 8 237 624 8 158 48 13 1509
0.1% 27.3% 0.5% 15.7% 41.4% 0.5% 10.5% 3.2% 0.9% 100%
Findings: Overall, district contributions to an annuity was not influenced by degree status. However, superintendents with a Ph.D. were more frequently provided “more than 10,000” in contributions (28%) than those with an Ed.D. (13%) and an MA degree (8%).

45
SECTION #5: INSURANCE BENEFITS
Table 5.1A. What health insurance coverage do you receive in your employment agreement? (Q51)
Types of Health Insurance Paid by District for Superintendent
N %
Medical/Hospital 988 65.47%
Omitted 521 34.53%
Total 1509 100%
Findings: Medical/Hospital was the most common type of insurance included in the superintendent contract. Percentages have fluctuated between 65.5% and 79.1% since 2015-16. Table 5.1B. Coverage paid for family of superintendent (Q52)
Types of Health Insurance Paid by District for family of Superintendent
N %
Dental 721 47.78%
Omitted 788 52.22%
Total 1509 100%
Findings: Dental was the most common additional family coverage paid for by the district beyond basic Medical/Hospital coverage

46
Table 5.2A. District contribution to life insurance (Q50) and race/cultural group (Q60)
Yes No Omitted Total
White (Not Hispanic or Latino)
720 608 20 1348
53.4% 45.1% 1.5% 100%
Black or African American 39 34 4 77
50.6% 44.2% 5.2% 100%
Hispanic/Latinx 18 23 2 43
41.9% 53.5% 4.7% 100%
Asian 6 1 0 7
85.7% 14.3% 0.0% 100%
Native American or Native Alaska
10 4 0 14
71.4% 28.6% 0.0% 100%
Other 4 4 0 8
50.0% 50.0% 0.0% 100%
Omitted 2 2 8 12
16.7% 16.7% 66.7% 100%
Total 799 676 34 1509
52.9% 44.8% 2.3% 100%
Findings: Where a sufficient number of respondents exist, there is little difference, by race or cultural group, in the percentage of superintendents who have their district contribute to life insurance. Table 5.2B. District contribution to life insurance (Q50) and gender (Q61)
Male Female Prefer not to respond
Omitted Total
Yes 592 203 1 3 799
74.1% 25.4% 0.1% 0.4% 100%
No 503 164 3 6 676
74.4% 24.3% 0.4% 0.9% 100%
Omitted 18 8 0 8 34
52.9% 23.5% 0.0% 23.5% 100%
Total 1113 375 4 17 1509
73.8% 24.9% 0.3% 1.1% 100%
Findings: Approximately three of four superintendents have district contribution to life insurance, regardless of gender.

47
Table 5.3A. District contributes to post-retirement health insurance (Q53)
Yes No Omitted Total
530 953 26 1509
35.1% 63.1% 1.8% 100%
Findings: A little more than one-third (35.1%) of superintendents have the district contribute to post-retirement health insurance. Table 5.3B. District contributes to post-retirement health insurance (Q53) and
enrollment (Q2)
Yes No Omitted Total
Fewer than 300 17 31 1 49
34.7% 63.3% 2.0% 100%
300-999 107 221 9 337
31.8% 65.6% 2.7% 100%
1,000-2,999 198 335 7 540
36.7% 62.0% 1.3% 100%
3,000-4,999 84 133 2 219
38.4% 60.7% 0.9% 100%
5,000-9,999 68 124 3 195
34.9% 63.6% 1.5% 100%
10,000-24,999 39 83 3 125
31.2% 66.4% 2.4% 100%
25,000-49,999 11 12 0 23
47.8% 52.2% 0.0% 100%
50,000-99,999 2 12 0 14
14.3% 85.7% 0.0% 100%
100,000-more 3 1 0 4
75.0% 25.0% 0.0% 100%
Omitted 1 1 1 3
33.3% 33.3% 33.3% 100%
Total 530 953 26 1509
35.1% 63.2% 1.7% 100%

48
Findings: Where a sufficient number of respondents exist, there is little difference by district enrollment, in the percentage of superintendents who have their district contribute to post-retirement health insurance. Table 5.3C. Post-retirement health insurance (Q53) and gender (Q61)
Male Female Prefer not to respond
Omitted Total
Yes 394 129 2 5 530
74.3% 24.3% 0.4% 0.9% 100%
No 708 239 2 4 953
74.3% 25.1% 0.2% 0.4% 100%
Omitted 11 7 0 8 26
42.3% 26.9% 0.0% 30.8% 100%
Total 1113 375 4 17 1509
73.8% 24.9% 0.3% 1.1% 100%
Findings: There is almost no difference, by gender, in the percentage of superintendents who have their district contribute to post-retirement health insurance. Table 5.3D. Post-retirement health insurance (Q53) and race/cultural group (Q60)
Yes No Omitted Total
White (Not Hispanic or Latino) 481 852 15 1348
35.7% 63.2% 1.1% 100%
Black or African American 27 47 3 77
35.1% 61.0% 3.9% 100%
Hispanic/Latinx 14 29 0 43
32.6% 67.4% 0.0% 100%
Asian 1 6 0 7
14.3% 85.7% 0.0% 100%
Native American or Native Alaska 2 12 0 14
14.3% 85.7% 0.0% 100%
Other 3 5 0 8
37.5% 62.5% 0.0% 100%
Omitted 2 2 8 12
16.7% 16.7% 66.7% 100%
Total 530 953 26 1509

49
35.1% 63.2% 1.7% 100%
Findings: Where a sufficient number of respondents exist, there is little difference, by race or cultural group, in the percentage of superintendents who have their district contribute to post-retirement health insurance. Table 5.4. Percentage of retirement contribution paid by your district (Q48) and race/
cultural group (Q60)
0-10% 11-20%
21-30%
31-40%
41-50%
51-60%
61-70%
71-80%
81-90%
91-100%
Omit Total
White (Not Hispanic or
Latino)
427 219 69 51 149 44 14 10 16 287 62 1348
31.7% 16.2% 5.1% 3.8% 11.1% 3.3% 1.0% 0.7% 1.2% 21.3% 4.6% 100%
Black or African
American
31 11 5 1 3 2 3 0 1 15 5 77
40.3% 14.3% 6.5% 1.3% 3.9% 2.6% 3.9% 0.0% 1.3% 19.5% 6.5% 100%
Hispanic/
Latinx
12 7 5 3 6 2 1 0 0 5 2 43
27.9% 16.3% 11.6% 7.0% 14.0% 4.7% 2.3% 0.0% 0.0% 11.6% 4.7% 100%
Asian 1 2 0 0 0 2 0 0 0 2 0 7
14.3% 28.6% 0.0% 0.0% 0.0% 28.6% 0.0% 0.0% 0.0% 28.6% 0.0% 100%
Native American or Native
Alaska
2 3 1 1 3 0 0 0 1 3 0 14
14.3% 21.4% 7.1% 7.1% 21.4% 0.0% 0.0% 0.0% 7.1% 21.4% 0.0% 100%
Other 0 2 1 2 0 0 0 0 0 2 1 8
0.0% 25.0% 12.5% 25.0% 0.0% 0.0% 0.0% 0.0% 0.0% 25.0% 12.5% 100%
Omitted 1 0 0 1 1 0 0 0 0 0 9 12
8.3% 0.0% 0.0% 8.3% 8.3% 0.0% 0.0% 0.0% 0.0% 0.0% 75.0% 100%
Total 474 244 81 59 162 50 18 10 18 314 79 1509
31.4% 16.2% 5.4% 3.9% 10.7% 3.3% 1.2% 0.7% 1.2% 20.8% 5.2% 100%
Findings: Regardless of race or cultural group, superintendents will most commonly have up to 20% of their retirement contribution paid for by their district. Approximately one of five White (21.3%) and Black (19.5%) superintendents has 91-100% of their contributions paid for by the district.

50
Table 5.5. Memberships paid for (Q54)
Professional association membership due, paid by
the school district N %
Community organization (e.g., Rotary, Chamber of
Commerce) 880 58.3%
National Professional Organizations (e.g., AASA)
1382 91.5%
Regional Professional Organizations (e.g., state
association) 1427 94.5%
Omitted 838 18.51%
Respondents 1509 100%
Findings: More than 91% of respondents had their national professional organization memberships paid in their contracts and 94.5% had their regional professional organization memberships paid for by their district in their contracts. About 60% had local organization memberships paid in their contracts.

51
SECTION #6:
HIRE/REHIRE; RETIREMENT SYSTEM PARTICIPATION
Table 6.1A. Have you been rehired for your present position as superintendent after retiring in the state system? (Q57)
Yes No Omitted Total
94 1394 21 1509
6.2% 92.3% 1.5% 100%
Findings: Only 6.2% of superintendents have been rehired for their present position as superintendent after retiring in the state system. Table 6.1B. Have you been rehired for your present position as superintendent after
retiring in the state system (Q57) and gender?(Q61)
Findings: There was no difference between male (6.3%) and female superintendents (6.1%) being rehired for their present position after retiring. Table 6.2. Are you drawing retirement from one state and working as a superintendent
in another state? (Q58)
Percent Frequency
Yes 62 4.1
No 1427 94.6
Omitted 20 1.3
Total 1509 100.0
Findings: Only 4.1% of superintendents are drawing retirement in one state while working as a superintendent in another.
Male Female Prefer not to respond Omitted Total
Yes 70 23 0 1 94
No 1033 348 4 9 1394
Omitted 10 4 0 7 21
Total 1113 375 4 17 1509

52
Table 6.3. Do you participate in a state retirement system? (Q44)
Yes No Omitted Total
1478 18 13 1509
97.9% 1.2% 0.9% 100%
Findings: Almost all (97.9%) of superintendents participate in a state retirement system. Table 6.4. How many years of participation in the state retirement program are required
to vest? (Q45)
Frequency Percent
1 41 2.7
2 2 .1
3 36 2.4
4 16 1.1
5 445 29.5
6 8 .5
7 48 3.2
8 27 1.8
9 4 .3
10 or more 838 55.5
Omitted 44 2.9
Total 1509 100
Findings: Most superintendents need 10 or more years to vest (55.5.%). Five years was the second most common time period (29.5%). Table 6.5. Is there a maximum salary cap on the calculation of your state retirement
benefits? (Q46)
Frequency Percent
Yes 231 15.3
No 899 59.6
Not sure 359 23.8
Omitted 20 1.3
Total 1509 100
Findings: The majority of superintendents (59.6%) do not have a maximum salary cap on the calculation of their state retirement. Almost a quarter (23.8%) were not sure.

53
Table 6.6. Is your retirement calculation based on your salary? (Q47)
Percent Frequency
Yes 1407 93.2
No 53 3.5
The district does not 30 2.0
Omitted 19 1.3
Total 1509 100
Findings: Most superintendents (93.2%) have their retirement calculations based on salary. Table 6.7A. Percentage of retirement contribution paid by your district (Q48) and
gender (Q61)
Male Female Prefer not to
respond Omitted Total
0-10% 337 131 2 4 474
71.1% 27.6% 0.4% 0.8% 100%
11-20% 186 57 0 1 244
76.2% 23.4% 0.0% 0.4% 100%
21-30% 60 20 0 1 81
74.1% 24.7% 0.0% 1.2% 100%
31-40% 42 16 0 1 59
71.2% 27.1% 0.0% 1.7% 100%
41-50% 123 37 2 0 162
75.9% 22.8% 1.2% 0.0% 100%
51-60% 42 7 0 1 50
84.0% 14.0% 0.0% 2.0% 100%
61-70% 13 5 0 0 18
72.2% 27.8% 0.0% 0.0% 100%
71-80% 10 0 0 0 10
100% 0.0% 0.0% 0.0% 100%
81-90% 12 6 0 0 18
66.7% 33.3% 0.0% 0.0% 100%
91-100% 247 67 0 0 314
78.7% 21.3% 0.0% 0.0% 100%
Omitted 41 29 0 9 79
51.9% 36.7% 0.0% 11.4% 100%
Total 1113 375 4 17 1509
73.8% 24.9% 0.3% 1.1% 100%

54
Findings: There is no discernable difference by gender. The three most common percentages paid by the district were 0-10%, 91-100%, and 41-50%, respectively. Table 6.7B. Percentage of retirement contribution paid by your district (Q48) and
race/cultural group (Q60)
Total
0-10% 11-20% 21-30% 31-40% 41-50% 51-60% 61-70% 71-80% 81-90% 91-
100% Omitted
White (Not Hispanic or
Latino)
427 219 69 51 149 44 14 10 16 287 62 1348
31.7% 16.2% 5.1% 3.8% 11.1% 3.3% 1.0% 0.7% 1.2% 21.3% 4.6% 100%
Black or African
American
31 11 5 1 3 2 3 0 1 15 5 77
40.3% 14.3% 6.5% 1.3% 3.9% 2.6% 3.9% 0.0% 1.3% 19.5% 6.5% 100%
Hispanic/
Latinx
12 7 5 3 6 2 1 0 0 5 2 43
27.9% 16.3% 11.6% 7.0% 14.0% 4.7% 2.3% 0.0% 0.0% 11.6% 4.7% 100%
Asian 1 2 0 0 0 2 0 0 0 2 0 7
14.3% 28.6% 0.0% 0.0% 0.0% 28.6% 0.0% 0.0% 0.0% 28.6% 0.0% 100%
Native American or
Native Alaska
2 3 1 1 3 0 0 0 1 3 0 14
14.3% 21.4% 7.1% 7.1% 21.4% 0.0% 0.0% 0.0% 7.1% 21.4% 0.0% 100%
Other 0 2 1 2 0 0 0 0 0 2 1 8
0.0% 25.0% 12.5% 25.0% 0.0% 0.0% 0.0% 0.0% 0.0% 25.0% 12.5% 100%
Omitted 1 0 0 1 1 0 0 0 0 0 9 12
8.3% 0.0% 0.0% 8.3% 8.3% 0.0% 0.0% 0.0% 0.0% 0.0% 75.0% 100%
Total 474 244 81 59 162 50 18 10 18 314 79 1509
31.4% 16.2% 5.4% 3.9% 10.7% 3.3% 1.2% 0.7% 1.2% 20.8% 5.2% 100%
Findings: Where sufficient numbers of respondent superintendents exist, there are not noticeable differences viewed by racial/cultural group, regarding the percentage of retirement contribution paid by the district. 0-10% was the most frequent response.

55
SECTION #7: MISCELLANEOUS BENEFITS
Table 7.1. Does the school district contribute to the premiums on a term insurance policy apart from the insurance benefits provided for all employees? (Q50)
Yes No Omitted Total
799 676 34 1509
52.9% 44.7% 2.4% 100%
Findings: About 53% of districts contribute to premiums on term insurance apart from insurance benefits provided for all employees. Table 7.2A. Gender (Q61) and days of sick leave (Q21)
Days of sick leave Female Male Prefer not to respond Omitted Total
0-3 Days 7 1.87% 17 1.53% 0 0% 1 5.88% 25 1.66%
4-6 Days 6 1.60% 17 1.53% 0 0% 0 0% 23 1.52%
7-10 Days 50 13.33% 201 18.06% 2 50% 2 11.76% 255 16.90%
11-15 Days 233 62.13% 655 58.85% 1 25% 8 47.06% 897 59.44%
16-20 Days 48 12.80% 144 12.94% 1 25% 3 17.65% 196 12.99%
21-25 Days 13 3.47% 32 2.88% 0 0% 2 11.76% 47 3.11%
26+ Days 17 4.53% 37 3.32% 0 0% 1 5.88% 55 3.64%
Omitted 1 0.27% 10 0.90% 0 0% 0 0% 11 0.73%
Total 375 100% 1113 100% 4 100% 17 100% 1509 100%
Findings: The findings for days of sick leave demonstrate little difference by gender or year over year.

56
Table 7.2B. Gender (Q61) and maximum sick leave accrual (Q22)
Max Accrual for Sick Leave
Female Male Prefer not to respond
Omitted Total
0-25 Days 14 3.73% 51 4.58% 1 25% 0 0% 66 4.37%
26-50 Days
16 4.27% 72 6.47% 1 25% 2 11.76% 91 6.03%
51-75 Days
17 4.53% 58 5.21% 0 0% 0 0% 75 4.97%
76-100 Days
56 14.93% 136 12.22% 0 0% 2 11.76% 194 12.86%
101-150 Days
48 12.80% 160 14.38% 0 0% 1 5.88% 209 13.85%
151-200 Days
37 9.87% 126 11.32% 1 25% 2 11.76% 166 11%
200+ Days 183 48.80% 495 44.47% 1 25% 10 58.82% 689 45.66%
Omitted 4 1.07% 15 1.35% 0 0% 0 0% 19 1.26%
Total 375 100% 1113 100% 4 100% 17 100% 1509 100%
Findings: Regardless of gender, 200+ days of sick leave is most common among superintendents. Table 7.2C. Cap on sick leave carryover (Q30)
Cap on the number of sick days
Count %
No 1094 72%
Yes 401 27%
Omitted 14 1%
Total 1509 100%
Findings: Most superintendents (72%) do not have a cap on sick leave carryover. Table 7.3. Cap on vacation leave carryover (Q31)
Cap on the number of vacation days
Count %
No 274 18.16%
Yes 1221 80.91%
Omitted 14 0.93%
Total 1509 100%
Findings: Approximately 81% of superintendents have some type of cap on vacation leave carryover.

57
Table 7.4A. Gender (Q61) and days of vacation leave (Q23)
Days of vacation leave
Female Male Prefer not to
respond Omitted Total
0-3 Days 7 1.87% 22 1.98% 0 0% 1 5.88% 30 1.99%
4-6 Days 2 0.53% 5 0.45% 0 0% 0 0% 7 0.46%
7-10 Days
9 2.40% 67 6.02% 0 0% 1 5.88% 77 5.10%
11-15 Days
37 9.87% 140 12.58% 1 25% 1 5.88% 179 11.86%
16-20 Days
120 32% 352 31.63% 1 25% 7 41.18% 480 31.81%
21-25 Days
138 36.80% 353 31.72% 1 25% 6 35.29% 498 33%
26+ Days
61 16.27% 166 14.91% 1 25% 1 5.88% 229 15.18%
Omitted 1 0.27% 8 0.72% 0 0% 0 0% 9 0.60%
Total 375 100% 1113 100% 4 100% 17 100% 1509 100%
Findings: There are not significant differences in the days of vacation leave by gender. The most common number of days was 21-25, followed by 16-20. Table 7.4B. Gender (Q61) and vacation leave accrual (Q24)
Vacation leave
accrual
Female Male Prefer not to respond
Omitted Grand Total
0-25 Days
179 47.73% 538 48.34% 2 50% 11 64.71% 730 48.38%
26-50 Days
120 32% 355 31.90% 2 50% 2 11.76% 479 31.74%
51-75 Days
30 8% 74 6.65% 0 0% 2 11.76% 106 7.02%
76-100 Days
11 2.93% 30 2.70% 0 0% 0 0% 41 2.72%
101-150 Days
5 1.33% 19 1.71% 0 0% 2 11.76% 26 1.72%
151-200 Days
1 0.27% 14 1.26% 0 0% 0 0% 15 0.99%
200+ Days
25 6.67% 76 6.83% 0 0% 0 0% 101 6.69%
Omitted 4 1.07% 7 0.63% 0 0% 0 0% 11 0.73%
Grand Total
375 100% 1113 100% 4 100% 17 100% 1509 100%

58
Findings: Gender does not influence vacation leave accrual. Approximately 50% of superintendents accrue 0-25 days and 32% accrue 26-50 days. Table 7.5A. Gender (Q61) and cap on vacation leave (Q31)
Cap on Vacation
Leave Female Male
Prefer not to respond
Omitted Total
No 74 19.73% 196 17.61% 1 25% 3 17.65% 274 18.16%
Yes 300 80% 904 81.22% 3 75% 14 82.35% 1221 80.91%
Omitted 1 0.27% 13 1.17% 0 0% 0 0% 14 0.93%
Total 375 100% 1113 100% 4 100% 17 100% 1509 100%
Findings: There was no difference by gender. Approximately 80% of superintendents have a cap on vacation leave. Table 7.5B. Gender (Q61) and cap on personal leave accrual (Q26)
Maximum accrual of
personal leave
Female Male Prefer not to respond
Omitted Total
0-25 Days 321 85.60% 953 85.62% 3 75% 17 100% 1294 85.75%
26-50 Days 14 3.73% 35 3.14% 0 0% 0 0% 49 3.25%
51-75 Days 5 1.33% 10 0.90% 0 0% 0 0% 15 0.99%
76-100 Days 5 1.33% 12 1.08% 1 25% 0 0% 18 1.19%
101-150 Days 3 0.80% 9 0.81% 0 0% 0 0% 12 0.80%
151-200 Days 4 1.07% 6 0.54% 0 0% 0 0% 10 0.66%
200+ Days 19 5.07% 70 6.29% 0 0% 0 0% 89 5.90%
Omitted 4 1.07% 18 1.62% 0 0% 0 0% 22 1.46%
Total 375 100% 1113 100% 4 100% 17 100% 1509 100%
Findings: Gender was not related to caps on personal leave accrual. The most common cap was 0-25 days.

59
Table 7.5C. Cap on personal leave carryover (Q32)
Cap on personal leave carryover
Count N
No 403 26.71%
Yes 1069 70.84%
Omitted 37 2.45%
Total 1509 100%
Findings: Approximately 71% of superintendents have a cap on personal leave carryover. Table 7.6. Gender (Q61) and upon departure from the district, how is sick leave accrual
handled? (Q27)
Upon Departure Sick Leave
Accrual Female Male
Prefer not to respond
Omitted Total
Credited to retirement
82 21.87% 264 23.72% 0 0% 5 29.41% 351 23.26%
No payment for accrued
sick leave upon departure
113 30.13% 335 30.10% 3 75% 9 52.94% 460 30.48%
Payment calculated at a negotiated rate
below daily rate
97 25.87% 276 24.80% 0 0% 2 11.76% 375 24.85%
Payment calculated at
daily rate 79 21.07% 223 20.04% 1 25% 1 5.88% 304 20.15%
Omitted 4 1.07% 15 1.35% 0 0% 0 0% 19 1.26%
Total 375 100% 1113 100% 4 100% 17 100% 1509 100%
Findings: Sick leave accrual is not impacted by gender. No differences exist.

60
Table 7.7. Gender (Q61) and upon departure from the district, how is vacation leave accrual handled? (Q28)
Upon Departure
Vacation Leave Female Male
Prefer not to respond
Omitted Total
Credited to retirement
17 4.53% 46 4.13% 0 0% 1 5.88% 64 4.24%
No payment for accrued sick leave
upon departure
90 24% 289 25.97% 1 25% 6 35.29% 386 25.58%
Payment calculated at a
negotiated rate below daily rate
20 5.33% 78 7.01% 0 0% 1 5.88% 99 6.56%
Payment calculated at
daily rate
245 65.33% 684 61.46% 3 75% 9 52.94% 941 62.36%
Omitted 3 0.80% 16 1.44% 0 0% 0 0% 19 1.26%
Total 375 100% 1113 100% 4 100% 17 100% 1509 100%
Findings: Gender does not impact how vacation leave accrual is handled. It is calculated at a daily rate for approximately 62% of superintendents.

61
Table 7.8. Gender (Q61) and upon departure from the district, how is personal leave accrual handled? (Q29)
Upon Departure Personal
Leave
Female Male Prefer not to
respond Omitted Total
Credited to retirement
47 12.53% 157 14.11% 0 0% 4 23.53% 208 13.78%
No payment for accrued sick leave
upon departure
187 49.87% 567 50.94% 2 50% 10 58.82% 766 50.76%
Payment made
calculated at a negotiated rate below daily rate
35 9.33% 130 11.68% 0 0% 0 0% 165 10.93%
Payment made
calculated at daily rate
98 26.13% 229 20.58% 2 50% 3 17.65% 332 22%
Omitted 8 2.13% 30 2.70% 0 0% 0 0% 38 2.52%
Total 375 100% 1113 100% 4 100% 17 100% 1509 100%
Findings: There are not meaningful differences, based on gender, on how leave accrual is handled.

62
Table 7.9. Gender (Q61) and what is the term of your 2020–21 employment contract? (Q15)
Term of employment
contract
Female Male Prefer not to respond
Omitted Total
Less than 1 year
5 1.33% 22 1.98% 0 0% 1 5.88% 28 1.86%
1 year 24 6.40% 80 7.19% 0 0% 1 5.88% 105 6.96%
2 years 63 16.80% 198 17.79% 0 0% 3 17.65% 264 17.50%
3 years 163 43.47% 494 44.38% 3 75% 7 41.18% 667 44.20%
4 years 44 11.73% 114 10.24% 0 0% 4 23.53% 162 10.74%
5+ years 75 20% 200 17.97% 1 25% 1 5.88% 277 18.36%
Omitted 1 0.27% 5 0.45% 0 0% 0 0% 6 0.40%
Total 375 100% 1113 100% 4 100% 17 100% 1509 100%
Findings: Gender is not related to length of the employment contract. The most common contract lengths are three and five years. Table 7.10. Gender (Q61) and does your present employment contract have an
incentive/performance clause (i.e., a defined provision providing for a reward for accomplishing a predetermined task or objective)? (Q11)
Incentive Performance
Clause Female Male Prefer not to
respond Omitted Total
No 301 80.27% 917 82.39% 3 75% 13 76.47% 1234 81.78%
Yes 72 19.20% 186 16.71% 1 25% 4 23.53% 263 17.43%
Omitted 2 0.53% 10 0.90% 0 0% 0 0% 12 0.80%
Total 375 100% 1113 100% 4 100% 17 100% 1509 100%
Findings: There are no significant differences by gender. Approximately 19% of female superintendents and 16% of male superintendents have an incentive/performance clause (i.e., a defined provision providing for a reward for accomplishing a predetermined task or objective). Table 7.11. Gender (Q61) and does your contract have a severance (buyout) clause?
(Q18)
Buyout clause
Female Male Prefer not to
respond Omitted Total
No 247 65.87% 737 66.22% 4 100% 8 47.06% 996 66%
Yes 126 33.60% 365 32.79% 0 0% 9 52.94% 500 33.13%
Omitted 2 0.53% 11 0.99% 0 0% 0 0% 13 0.86%
Total 375 100% 1113 100% 4 100% 17 100% 1509 100%

63
Findings: Regardless of gender, approximately 33% of superintendents have a buyout clause. Table 7.12. Gender (Q61) and does your contract have a longevity clause (i.e., a lump
sum payment you will receive for the number of years you remain in the position)? (Q20)
Longevity Clause Female Male
Prefer not to respond Omitted Total
No 316 84.27% 957 85.98% 3 75% 17 100% 1293 85.69%
Yes 55 14.67% 140 12.58% 1 25% 0 0% 196 12.99%
Omitted 4 1.07% 16 1.44% 0 0% 0 0% 20 1.33%
Total 375 100% 1113 100% 4 100% 17 100% 1509 100%
Findings: Only 14.6% of female superintendents and 12.5% of male superintendents reported having a longevity clause. Table 7.13. Is your employment agreement base salary subject to a cap (Q33) and
gender? (Q61)
Salary Cap Female Male Prefer not to
respond Omitted Grand Total
No 339 90.40% 984 88.41% 4 100% 16 94.12% 1343 89%
Other 7 1.87% 9 0.81% 0 0% 0 0% 16 1.06%
Yes, based on district
policy, regulation, or practice
16 4.27% 47 4.22% 0 0% 0 0% 63 4.17%
Yes, based on state law
11 2.93% 59 5.30% 0 0% 1 5.88% 71 4.71%
Omitted 2 0.53% 14 1.26% 0 0% 0 0% 16 1.06%
Grand Total 375 100% 1113 100% 4 100% 17 100% 1509 100%
Findings: There is not a difference based on gender. Approximately 90% of all superintendents do not have a salary cap on their base salary. Table 7.14A. Gender (Q61) and evergreen (rollover) provision (Q17)
Rollover Clause
Female Male Prefer not to
respond Omitted Total
No 243 64.80% 770 69.18% 2 50% 11 64.71% 1026 67.99%
Yes 132 35.20% 332 29.83% 2 50% 5 29.41% 471 31.21%
Omitted 0 0% 11 0.99% 0 0% 1 5.88% 12 0.80%
Total 375 100% 1113 100% 4 100% 17 100% 1509 100%

64
Findings: Approximately 30% of male superintendents have a rollover provision compared to 35% of female superintendents.

65
Table 7.14B. Gender (Q61) and indemnification/hold harmless (Q19)
Indemnification/hold harmless
Female Male Prefer not to respond
Omitted Total
No 110 29.33% 305 27.40% 3 75% 5 29.41% 423 28.03%
Not necessary as it is already provided by
state law
85 22.67% 252 22.64% 0 0% 4 23.53% 341 22.60%
Yes 176 46.93% 535 48.07% 1 25% 8 47.06% 720 47.71%
Omitted 4 1.07% 21 1.89% 0 0% 0 0% 25 1.66%
Total 375 100% 1113 100% 4 100% 17 100% 1509 100%
Findings: There are no differences based on gender. About 47% of female superintendents and 48% of male superintendents reported having such a clause when not already provided by law. Table 7.15. Racial/cultural group (Q60) and what is the term of your 2020–21
employment contract? (Q15)
Racial/cultural group
Less than 1 year 1 year 2 years 3 years
Asian 0 0% 0 0% 0 0% 3 0.45%
Black or African American 0 0% 7 6.67% 11 4.17%
24 31 3.60%
Hispanic/Latinx 0 0% 5 4.76% 7 2.65% 25
58.1 3.75%
Native American or
Native Alaskan 1 3.57% 0 0% 0 0% 8 1.20%
Other 0 0% 0 0% 0 0% 2 0.30%
White (not Hispanic or
Latino) 26 92.86% 93 88.57% 246 93.18% 602 44.6 90.25%
Omitted 1 3.57% 0 0% 0 0% 3 0.45%
Total 28 100% 105 100% 264 100% 667 100%

66
4 years 5+ years Omitted Total
Asian 3 1.85% 1 0.36% 0 0% 7 0.46%
Black or African American
13 8.02% 21
27% 7.58% 1 16.67% 77 5.10%
Hispanic/Latinx 0 0% 6
14% 2.17% 0 0% 43 2.85%
Native American or
Native Alaskan 2 1.23% 2 0.72% 1 16.67% 14 0.93%
Other 1 0.62% 6 2.17% 0 0% 9 0.60%
White (not Hispanic or
Latino) 140 86.42%
236 17.5
85.20% 4 66.67% 1347 89.26%
Omitted 3 1.85% 5 1.81% 0 0% 12 0.80%
Total 162 100% 277 100% 6 100% 1509 100%
Findings: Discounting the small number of respondents by some racial/cultural groups, there is evidence of some variance in the term of employment agreements and racial/cultural group. However, regardless of race/cultural group, most superintendents reported having either a three-year or five-year contract. Table 7.16. Racial/cultural group (Q60) and does your present employment contract
have an incentive/performance clause (i.e., a defined provision providing for a reward for accomplishing a predetermined task or objective)? (Q17)
Race/cultural group
No Yes Omitted Total
Asian 7 0.57% 0 0% 0 0% 7 0.46%
Black or African American
67 5.43% 9 3.42% 1 8.33% 77 5.10%
Hispanic/Latinx 40 3.24% 3 1.14% 0 0% 43 2.85%
Native American or
Native Alaskan 11 0.89% 1 0.38% 2 16.67% 14 0.93%
Other 7 0.57% 2 0.76% 0 0% 9 0.60%
White (not Hispanic or
Latino) 1094 88.65% 244 92.78% 9 75% 1347 89.26%
Omitted 8 0.65% 4 1.52% 0 0% 12 0.80%
Total 1234 100% 263 100% 12 100% 1509 100%
Findings: The presence of incentive/performance clauses appear in approximately 17% of contracts, representing an increase over that reported in 2020 (10%). Care should be

67
exercised in interpreting the data by racial/cultural group when respondent numbers are small. Table 7.17. Racial/cultural group (Q60) and does your contract have a severance
(buyout) clause? (Q18)
Severance Clause
No Yes Omitted Total
Asian 5 0.50% 2 0.40% 0 0% 7 0.46%
Black or African American
43 4.32% 32 6.40% 2 15.38% 77 5.10%
Hispanic/Latinx 25 2.51% 18 3.60% 0 0% 43 2.85%
Native American or
Native Alaskan 4 0.40% 9 1.80% 1 7.69% 14 0.93%
Other 4 0.40% 5 1% 0 0% 9 0.60%
White (not Hispanic or
Latino) 910 91.37% 427 85.40% 10 76.92% 1347 89.26%
Omitted 5 0.50% 7 1.40% 0 0% 12 0.80%
Total 996 100% 500 100% 13 100% 1509 100%
Findings: Where sufficient numbers of respondent superintendents exist, Black and Hispanic/Latinx superintendents are more likely (approximately 41%) to have a buyout clause compared to White superintendents (31.7%). Overall, about one-third of superintendents have such a clause. Table 7.18. Racial/cultural group (Q60) and does your contract have a longevity clause
(i.e., a lump sum payment you will receive for the number of years you remain in the position)? (Q20)
Racial/cultural group No Yes Omitted Total
Asian 7 0.54% 0 0% 0 0% 7 0.46%
Black or African American
67 5.18% 9 4.59% 1 5% 77 5.10%
Hispanic/Latinx 36 2.78% 7 3.57% 0 0% 43 2.85%
Native American or Native Alaskan
8 0.62% 5 2.55% 1 5% 14 0.93%
Other 7 0.54% 2 1.02% 0 0% 9 0.60%
White (not Hispanic or Latino)
1159 89.64% 170 86.73% 18 90% 1347 89.26%
Omitted 9 0.70% 3 1.53% 0 0% 12 0.80%
Total 1293 100% 196 100% 20 100% 1509 100%
Findings: When respondent counts are sufficient, there is not a meaningful difference, regardless of race/cultural group, in the percentages of superintendents with longevity

68
clauses. Approximately 13% of superintendents have longevity clauses in their contracts. Table 7.19. Is there a cap on the number of sick days (Q30) and race/cultural group?
(Q60)
Cap on Sick Leave No Yes Omitted Total
Asian 5 0.46% 2 0.50% 0 0% 7 0.46%
Black or African American
61 5.58% 16 3.99% 0 0% 77 5.10%
Hispanic/Latinx 34 3.11% 9 2.24% 0 0% 43 2.85%
Native American or Native Alaskan
12 1.10% 2 0.50% 0 0% 14 0.93%
Other 8 0.73% 1 0.25% 0 0% 9 0.60%
White (not Hispanic or Latino)
962 87.93% 371 92.52% 14 100% 1347 89.26%
Omitted 12 1.10% 0 0% 0 0% 12 0.80%
Total 1094 100% 401 100% 14 100% 1509 100%
Findings: When data are aggregated, a lower percentage of non-White superintendents (20%) have a cap on sick days compared to White superintendents (27.8%). Table 7.20A. Racial/cultural group (Q60) and evergreen (rollover) provision (Q17)
No Yes Omitted Total
Asian 5 0.49% 2 0.42% 0 0% 7 0.46%
Black or African American
48 4.68% 28 5.94% 1 8.33% 77 5.10%
Hispanic/Latinx 37 3.61% 6 1.27% 0 0% 43 2.85%
Native American or
Native Alaskan 12 1.17% 2 0.42% 0 0% 14 0.93%
Other 8 0.78% 1 0.21% 0 0% 9 0.60%
White (not Hispanic or
Latino) 907 88.40% 429 91.08% 11 91.67% 1347 89.26%
Omitted 9 0.88% 3 0.64% 0 0% 12 0.80%
Total 1026 100% 471 100% 12 100% 1509 100%
Findings: Where sufficient numbers of respondent superintendents exist, there is not a meaningful difference in the percentages of superintendents with rollover clauses. About 31% of superintendents have rollover clauses included in their contracts.

69

70
Table 7.20B. Racial/cultural group (Q60) and indemnification/hold harmless (Q19)
Race/Cultural group
No
Not necessary as it is already provided by
state law
Yes Omitted Total
Asian 1 0.24% 0 0% 6 0.83% 0 0% 7 0.46%
Black or African American
18 4.26% 17 4.99% 40 5.56% 2 8% 77 5.10%
Hispanic/Latinx 10 2.36% 10 2.93% 21 2.92% 2 8% 43 2.85%
Native American or
Native Alaskan 4 0.95% 3 0.88% 5 0.69% 2 8% 14 0.93%
Other 1 0.24% 5 1.47% 3 0.42% 0 0% 9 0.60%
White (not Hispanic or
Latino) 386 91.25% 306 89.74% 636 88.33% 19 76% 1347 89.26%
Omitted 3 0.71% 0 0% 9 1.25% 0 0% 12 0.80%
Total 423 100% 341 100% 720 100% 25 100% 1509 100%
Findings: The inclusion of a hold harmless clause is not influenced by race/cultural group when respondent counts are sufficient. Overall, approximately 70% of superintendents have a hold harmless clause, either as a result of state law or a provision in their contract.

71
Table 7.21: List of miscellaneous benefits reported by superintendents (Q43)
Benefit Data
Count Percent
Deferred compensation (promise to pay you a specific amount at some later date)
699 46.3
Guaranteed vesting in a retirement plan 495 32.8
Whole life insurance (accumulates value for you) 810 53.6
Conference attendance with fees paid 1346 89.1
Support for a coach or mentor for the superintendent 181 11.9
Physical exam 536 35.4
Professional liability coverage in excess of any amount specified in state or local law
381 25.2
Tuition reimbursement 457 30.3
College savings plan 10 0.006
Provision allowing you to engage in outside consulting
553 36.6
Provision allowing you to engage in outside teaching 426 28.2
Cell phone or similar communications device 875 57.9
Computer (e.g., laptop) 887 58.7
District credit card 506 33.5

72
SECTION #8: USE OF LEGAL COUNSEL
Table 8.1. Did the school district use legal counsel to assist in the development and/or negotiations of your contract? (Q56) and gender (Q61)
Male Female Prefer not to respond
Omitted Total
Yes 718 258 2 4 982
73.1% 26.3% 0.2% 0.4% 100%
No 390 112 2 6 510
76.5% 22.0% 0.4% 1.2% 100%
Omitted 5 5 0 7 17
29.4% 29.4% 0.0% 41.2% 100%
Total 1113 375 4 17 1509
73.8% 24.9% 0.3% 1.1% 100%
Findings: There was not a significant difference, by gender, whether the board used legal counsel in contract negotiations (Male = 64.8% and Female = 69.7%)

73
Table 8.2. Did the board use legal counsel in negotiating the employment agreement (Q56) and enrollment? (Q2)
Yes No Omitted Total
Enrollment Fewer than 300
31 17 1 49
63.3% 34.7% 2.0% 100%
300-999 230 104 3 337
68.2% 30.9% 0.9% 100%
1,000-2,999 352 181 7 540
65.2% 33.5% 1.3% 100%
3,000-4,999 137 81 1 219
62.6% 37.0% 0.5% 100%
5,000-9,999 124 68 3 195
63.6% 34.9% 1.5% 100%
10,000-24,999
80 43 2 125
64.0% 34.4% 1.6% 100%
25,000-49,999
14 9 0 23
60.9% 39.1% 0.0% 100%
50,000-99,999
8 6 0 14
57.1% 42.9% 0.0% 100%
100,000-more
4 0 0 4
100% 0.0% 0.0% 100%
Omitted 2 1 0 3
66.7% 33.3% 0.0% 100%
Total 982 510 17 1509
65.1% 33.8% 1.1% 100%
Findings: Enrollment size did not have a significant relationship to whether a board utilized counsel in contract negotiations.
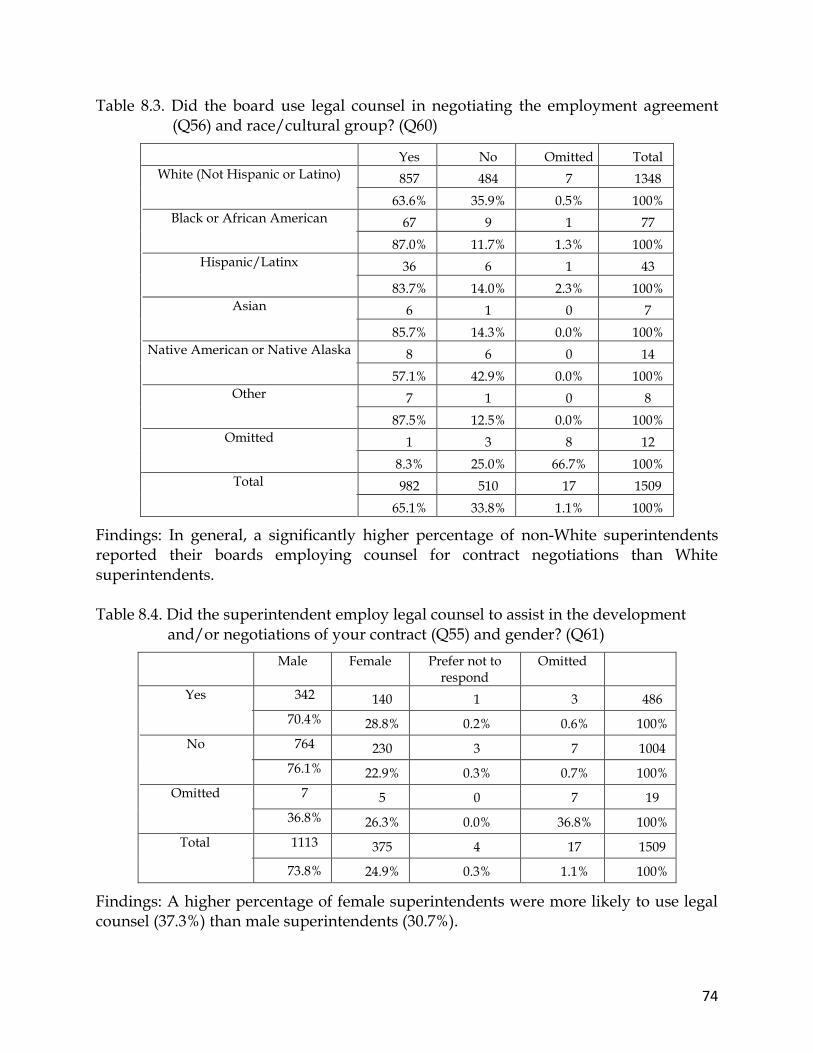
74
Table 8.3. Did the board use legal counsel in negotiating the employment agreement (Q56) and race/cultural group? (Q60)
Yes No Omitted Total
White (Not Hispanic or Latino) 857 484 7 1348
63.6% 35.9% 0.5% 100%
Black or African American 67 9 1 77
87.0% 11.7% 1.3% 100%
Hispanic/Latinx 36 6 1 43
83.7% 14.0% 2.3% 100%
Asian 6 1 0 7
85.7% 14.3% 0.0% 100%
Native American or Native Alaska 8 6 0 14
57.1% 42.9% 0.0% 100%
Other 7 1 0 8
87.5% 12.5% 0.0% 100%
Omitted 1 3 8 12
8.3% 25.0% 66.7% 100%
Total 982 510 17 1509
65.1% 33.8% 1.1% 100%
Findings: In general, a significantly higher percentage of non-White superintendents reported their boards employing counsel for contract negotiations than White superintendents. Table 8.4. Did the superintendent employ legal counsel to assist in the development
and/or negotiations of your contract (Q55) and gender? (Q61)
Male Female Prefer not to respond
Omitted
Yes 342 140 1 3 486
70.4% 28.8% 0.2% 0.6% 100%
No 764 230 3 7 1004
76.1% 22.9% 0.3% 0.7% 100%
Omitted 7 5 0 7 19
36.8% 26.3% 0.0% 36.8% 100%
Total 1113 375 4 17 1509
73.8% 24.9% 0.3% 1.1% 100%
Findings: A higher percentage of female superintendents were more likely to use legal counsel (37.3%) than male superintendents (30.7%).

75
Table 8.5. Did the superintendent use legal counsel in negotiating the employment agreement (Q55) and enrollment? (Q2)
Yes No Omitted Total
Enrollment Fewer than 300 18 31 0 49
36.7% 63.3% 0.0% 100%
300-999 119 214 4 337
35.3% 63.5% 1.2% 100%
1,000-2,999 163 370 7 540
30.2% 68.5% 1.3% 100%
3,000-4,999 65 153 1 219
29.7% 69.9% 0.5% 100%
5,000-9,999 69 122 4 195
35.4% 62.6% 2.1% 100%
10,000-24,999 36 86 3 125
28.8% 68.8% 2.4% 100%
25,000-49,999 10 13 0 23
43.5% 56.5% 0.0% 100%
50,000-99,999 4 10 0 14
28.6% 71.4% 0.0% 100%
100,000-more 2 2 0 4
50.0% 50.0% 0.0% 100%
Omitted 0 3 0 3
0.0% 100% 0.0% 100%
Total 486 1004 19 1509
32.2% 66.5% 1.3% 100%
Findings: On average, about 33% of superintendents employed legal counsel regardless of enrollment size. A larger percentage, 43.5%, of superintendents in districts with 25,000-49,000 students did employ counsel, but the results must be interpreted with caution as the sample size was only 23 respondents.

76
Table 8.6. Did the superintendent use legal counsel in negotiating the employment agreement (Q55) and race and cultural group? (Q60)
Yes No Omitted Total
White (Not Hispanic or Latino) 429 910 9 1348
31.8% 67.5% 0.7% 100%
Black or African American 27 49 1 77
35.1% 63.6% 1.3% 100%
Hispanic/Latinx 21 21 1 43
48.8% 48.8% 2.3% 100%
Asian 2 5 0 7
28.6% 71.4% 0.0% 100%
Native American or Native Alaska
2 12 0 14
14.3% 85.7% 0.0% 100%
other 4 4 0 8
50.0% 50.0% 0.0% 100%
Omitted 1 3 8 12
8.3% 25.0% 66.7% 100%
Total 486 1004 19 1509
32.2% 66.5% 1.3% 100%
Findings: A slightly lower percentage of White superintendents used legal counsel (31.8%) compared to non-White superintendents (36.8%).

77
SECTION #9: MEMBERSHIPS
Table 9.1. AASA membership (Q63)
Yes No Omitted Total
1404 83 22 1509
92.2% 5.3% 2.5% 100%
Findings: The majority of respondents were AASA members (92%) Table 9.2. AASA membership (Q63) and gender (Q61)
Male Female Prefer not to respond Omitted Total
Yes 1044 348 3 9 1404
74.4% 24.8% 0.2% 0.6% 100%
No 60 20 1 2 83
72.3% 24.1% 1.2% 2.4% 100%
Omitted 9 7 0 6 22
40.9% 31.8% 0.0% 27.3% 100%
Total 1113 375 4 17 1509
73.8% 24.9% 0.3% 1.1% 100%
Findings: Almost three quarters of responding members were male with approximately a quarter (24.8%) being female.

78
Table 9.3. AASA membership (Q63) and race/cultural group (Q60)
Yes No Omitted Total
White (Not Hispanic or Latino) 1261 76 11 1348
93.5% 5.6% 0.8% 100%
Black or African American 72 4 1 77
93.5% 5.2% 1.3% 100%
Hispanic/Latinx 38 3 2 43
88.4% 7.0% 4.7% 100%
Asian 7 0 0 7
100% 0.0% 0.0% 100%
Native American or Native Alaska
14 0 0 14
100% 0.0% 0.0% 100%
Other 8 0 0 8
100% 0.0% 0.0% 100%
Omitted 4 0 8 12
33.3% 0.0% 66.7% 100%
Total 1404 83 22 1509
93.0% 5.5% 1.5% 100%
Findings: Race/cultural background was not a significant determinant of membership.

79
SECTION #11: SURVEY INSTRUMENT REVISED: 8/31/2020
General Demographics
1. Name of state where your school district is located [Note: dropdown of all states]
2. 2020-21 District student enrollment
A. Fewer than 300 B. 300 to 999 C. 1,000 to 2,999 D. 3,000 to 4,999 E. 5,000 to 9,999 F. 10,000 to 24,999 G. 25,000 to 49,999 H. 50,000 to 99,999 I. 100,000 or more
3. My school district is best described as: (Select one option)
A. Rural B. Suburban C. Urban
4. As of Oct. 1, 2020, in your district, about what percent of students were in each of
the following categories: (Less than (or equal to) 5%, 6 to 15%, 16 to 25%, 26 to 50%, 51% or more) A. Racial/ethnic minority B. Eligible for free/reduced lunch C. Qualified for special education D. Immigrants/refugees E. English Language Learners F. Homeless
Profile - Superintendent
5. How many years have you been employed in your present position?
A. Less than 1 B. 1-5 years C. 6-10 years

80
D. 11-15 years E. 16-20 years F. 21-25 years G. 26-30 years H. 31-35 years I. 36-40 years J. 40+ years
6. How many years of experience do you have as a superintendent?
A. Less than 1 year B. 1 - 5 years C. 6-10 years D. 11-15 years E. 16-20 years F. 21-25 years G. 26-30 years H. 31-35 years I. 36-40 years J. 40+ years
7. Which of the following best describes your race/ethnicity?
A. Native American or Native Alaskan B. Asian C. Black or African-American D. Native Hawaiian or other Pacific Islander E. Hispanic/Latinx F. White G. Other
8. What is your gender?
A. Male B. Female C. Other/choose not to respond
9. What is your current degrees status?
A. Bachelor’s B. Master’s C. Ph.D. D. Ed.D. E. J.D. F. MBA G. Educational Specialist H. Other

81
10. What is your present (2020-2021) annual base salary? (Please use whole numbers
with no commas.) $_______________
Workforce Profile
11. What is the estimated average annual base salary for an
Associate/Assistant/Deputy superintendent position in your district? Answer:_______ N/A
12. What is the estimated average annual base salary for a high school principal
position in your district? Answer: _________ NA
13. What is the estimated average annual base salary for a middle school principal
position in your district? Answer: ________ NA
14. What is the estimated average annual base salary for an elementary school
principal position in your district? 15. What is the estimated average beginning base salary for a nine-month teacher
with a bachelor’s degree, no advanced degree, and no experience?
Fiscal Profile 13. What is your projected 2020-2021 per pupil expenditure from the general fund?
A. Less than $5,000 B. $5,000-7,500 C. $7,500-10,000 D. $10,000-12,500 E. $12,500-15,000 F. $15,000 +
14. What is your perception of the general economic condition in the area in which
the district is located? A. Strong economic condition B. Stable economic condition C. Declining economic condition

82
Contract Terms 15. What was the complete duration of your latest employment agreement?
A. Less than 1 year B. 1 year C. 2 years D. 3 years E. 4 years F. 5+ years
16. Does your present employment agreement have an incentive/performance
clause (i.e., a defined provision providing for a reward for accomplishing a predetermined task or objective)? A. Yes B. No
17. Does your present employment contact have a rollover (evergreen) provision
(meaning the contract automatically renews on a periodic basis)? A. Yes B. No
18. Does your employment agreement have a severance (buyout) clause?
A. Yes B. No
19. Does your employment agreement contain an indemnification/hold harmless
provision? A. Yes B. No C. Not necessary as it is already provided by state law
20. Does your employment agreement have a longevity clause (i.e., a lump sum
payment you will receive for the number of years you remain in the position)? A. Yes B. No
21. How many days of sick leave are you provided annually?
A. 0-3 Days B. 4-6 Days C. 7-10 Days D. 11-15 Days

83
E. 16-20 Days F. 21-25 Days G. 26+ Days
22. What is the maximum accrual of sick leave for all years of employment? A. 0-25 Days B. 26-50 Days C. 51-75 Days D. 76-100 Days E. 101-150 Days F. 151-200 Days G. 200+ Days
23. How many days of vacation leave are you provided annually?
A. 0-3 Days B. 4-6 Days C. 7-10 Days D. 11-15 Days E. 16-20 Days F. 21-25 Days G. 26+ Days
24. What is the maximum accrual of vacation leave for all years of employment?
A. 0-25 Days B. 26-50 Days C. 51-75 Days D. 76-100 Days E. 101-150 Days F. 151-200 Days G. 200+ Days
25. How many days of personal leave are you provided annually?
A. 0-3 Days B. 4-6 Days C. 7-10 Days D. 11-15 Days E. 16-20 Days F. 21-25 Days G. 26+ Days
26. What is the maximum accrual of personal leave for all years of employment?
A. 0-25 Days B. 26-50 Days C. 51-75 Days

84
D. 76-100 Days E. 101-150 Days F. 151-200 Days G. 200+ Days
27. Upon your departure from the school district, what is the primary way that sick leave accrual is handled? A. Credited to retirement B. Payment made to superintendent calculated at daily rate C. Payment made to superintendent calculated at a negotiated rate below daily rate D. No payment for accrued sick leave upon departure
28. Upon your departure from the school district, what is the primary way that
vacation leave accrual is handled? A. Credited to retirement B. Payment made to superintendent calculated at daily rate C. Payment made to superintendent calculated at a negotiated rate below daily rate D. No payment for accrued sick leave upon departure
29. Upon your departure from the school district, what is the primary way that personal leave accrual is handled? A. Credited to retirement B. Payment made to superintendent calculated at daily rate C. Payment made to superintendent calculated at a negotiated rate below daily rate D. No payment for accrued sick leave upon departure
30. Is there a cap on the number of sick leave days that can be carried over from one
year to the next year? A. Yes B. No
31. Is there a cap on the number of vacation leave days that can be carried over from
one year to the next year? A. Yes B. No
32. Is there a cap on the number of personal leave days that can be carried over from
one year to the next year? A. Yes B. No

85
33. Is your employment agreement base salary subject to a ‘cap’ imposed by any of
the following? (Select one option) A. Yes, based on state law B. Yes, based on district policy, regulation, or practice C. No D. Other
34. Does your employment agreement include a provision detailing how
communications between the board and superintendent are to occur? (e.g., from individual board members to the chair of the board to the superintendent) A. Yes B. No
35. Does your employment agreement include a specific and detailed listing of your
duties and responsibilities? A. Yes B. No
36. Does your employment agreement include a specific and detailed process for
handling complaints/criticisms? A. Yes B. No
37. Does your employment agreement include a provision allowing the board to
reassign you to another role in the district? A. Yes B. No
Performance Evaluation
38. Does your employment agreement specify the process, measures, and indicators
to be used for your formal performance evaluation? A. Yes B. No
39. Is your formal performance evaluation linked to objectives or directions specified
in the previous year’s performance? A. Yes B. No
40. Is your formal performance evaluation linked to student outcomes /
performance?

86
A. Yes B. No
41. Is the outcome of your formal performance evaluation made public?
A. Yes, by employment agreement B. Yes, by state law C. No
42. How frequently are you evaluated?
A. Annually B. Biennially (every 2 years) C. Never D. Other
Miscellaneous Benefits
43. Which of the following benefits are provided in your employment agreement?
(Mark all that apply) A. Deferred compensation (e.g., tax sheltered annuity) B. Guaranteed vesting in a retirement plan C. Life insurance (accumulates value for you) D. Conference attendance with fees paid E. Support for a coach or mentor for the superintendent F. Physical exam G. Professional liability coverage in excess of any amount specified in state or local law H. Tuition reimbursement I. College savings plan J. Provision allowing you to engage in outside consulting K. Provision allowing you to engage in outside teaching L. Smart phone or similar communications device M. Computer (e.g., laptop) N. District credit card O. District automobile P. Mileage reimbursement for travel around the district
44. Do you participate in a state retirement system?
A. Yes B. No
45. How many years of participation in the state retirement program are required to
vest? A. 1

87
B. 2 C. 3 D. 4 E. 5 F. 6 G. 7 H. 8 I. 9 J. 10 or more
46. Is there a maximum salary cap on the calculation of your state retirement
benefits? A. Yes B. No C. Not sure
47. Is your retirement plan/system contribution based on your salary?
A. Yes B. No C. The district does not contribute on my behalf to a retirement plan/system.
48. What portion of your state funded pension contribution is paid by the school
district? A. 0-24% B. 25-49% C. 50-74% D. 75-99%
49. Does the school district contribute to a tax-deferred annuity or private retirement
account on your behalf? A. Yes (Less than $1,000) B. Yes ($1,000 -$5.000) C. Yes ($5,001-$10,000) D. Yes (more than $10,000) E. No
50. Does the school district contribute to the premiums on a life insurance policy
apart from the insurance benefits provided for all employees? A. Yes B. No
51. What health insurance coverage do you receive in your employment agreement?
(Mark all that apply)

88
A. Medical/Hospital B. Dental C. Vision/Optical D. Disability
52. Coverage paid for family (Mark all that apply)
A. Medical/Hospital B. Dental C. Vision/Optical D. Disability
53. Do you receive any post-retirement health insurance coverage?
A. Yes B. No
54. Which of your professional association membership dues are paid by the school
district? A. Community organization (e.g., Rotary, Chamber of Commerce) B. Regional Professional Organizations (e.g., state association) C. National Professional Organizations (e.g., AASA)
Legal Counsel Use/Hire-Rehire 55. Did you employ legal counsel to assist in the development and/or negotiations
of your employment agreement? A. Yes B. No
56. Did the school district use legal counsel to assist in the development and/or
negotiations of your employment agreement? A. Yes B. No
57. Have you been rehired for your present position as superintendent after retiring
in the state system? A. Yes B. No
58. Are you drawing retirement from one state and working as a superintendent in
another state? A. Yes B. No

89
Personal Information 59. Your age:
________ [Note: Actual age asked for; not dropdown] 60. Your race/cultural group:
A. American Indian or Alaska native B. Asian C. Black or African American D. Hispanic or Latino E. Native Hawaiian or other Pacific Islander F. White (not Hispanic or Latino) G. Other H. Prefer not to answer
61. Your gender:
A. Male B. Female C. Prefer not to answer
62. What is your current degree status?
A. Bachelor’s B. Master’s C. MBA D. Ed. Specialist E. Ed.D. F. J.D. G. Ph.D. H. Other
63. Do you presently belong to AASA, The School Superintendents Association?
A. Yes B. No
64. One of the byproducts of this study is the collection and development of a bank
of contract clauses designed to assist other superintendents craft strong employment agreements with their school district. Please use the space below to provide the text of the strongest or most creative element of your negotiated agreement. The research team will then assemble and distribute a bank of these contract clauses that is edited to maintain absolute secrecy regarding the superintendent who provided the information.