Embed Size (px)
Citation preview

. . . . . . . . . . . . . . . . . . . . . . . . .
. . . . . . . . . . . . . . . . . . . . . . . . .
. . . . . . . . . . . . . . . . . . . . . . . . .
2017 Orders Received & Sales Investor Presentation, January 31, 2018
Dr. Norbert Klapper, Group CEO
Joris Gröflin, Group CFO
2017 Orders Received & Sales, January 31, 2018
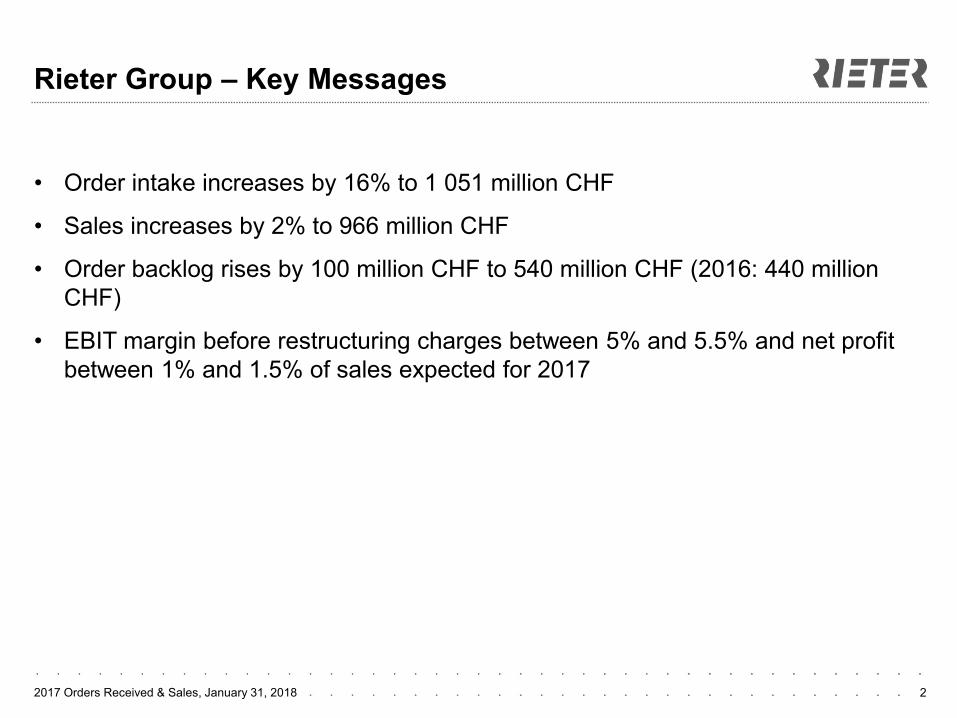
Rieter Group – Key Messages
2
• Order intake increases by 16% to 1 051 million CHF
• Sales increases by 2% to 966 million CHF
• Order backlog rises by 100 million CHF to 540 million CHF (2016: 440 million
CHF)
• EBIT margin before restructuring charges between 5% and 5.5% and net profit
between 1% and 1.5% of sales expected for 2017
2017 Orders Received & Sales, January 31, 2018 3
Agenda
1. Orders Received & Sales 2017 Joris Gröflin
2. Profit Outlook 2017 Dr. Norbert Klapper
. . . . .
. . . . .
. . . . .
. . . . .
. . . . .
. . . . .
. . . . .
. . . . .
. . . . .
2017 Orders Received & Sales, January 31, 2018 4
Order Intake by Business Group
553
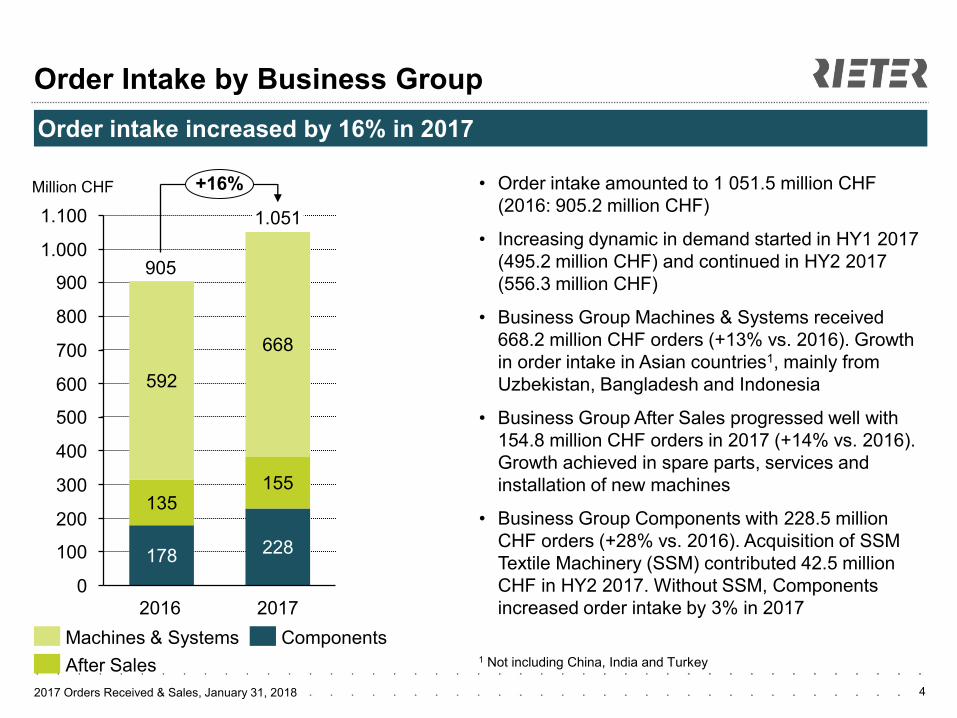
Order intake increased by 16% in 2017
222
• Order intake amounted to 1 051.5 million CHF
(2016: 905.2 million CHF)
• Increasing dynamic in demand started in HY1 2017
(495.2 million CHF) and continued in HY2 2017
(556.3 million CHF)
• Business Group Machines & Systems received
668.2 million CHF orders (+13% vs. 2016). Growth
in order intake in Asian countries1, mainly from
Uzbekistan, Bangladesh and Indonesia
• Business Group After Sales progressed well with
154.8 million CHF orders in 2017 (+14% vs. 2016).
Growth achieved in spare parts, services and
installation of new machines
• Business Group Components with 228.5 million
CHF orders (+28% vs. 2016). Acquisition of SSM
Textile Machinery (SSM) contributed 42.5 million
CHF in HY2 2017. Without SSM, Components
increased order intake by 3% in 2017
178 228
135 155
592
668
1.100
400
300
200
900
0
700
100
800
500
600
1.000
2016
905
1.051
2017
+16%
Machines & Systems
After Sales
Components
Million CHF
1 Not including China, India and Turkey
2017 Orders Received & Sales, January 31, 2018 5
Sales by Business Group
Million CHF
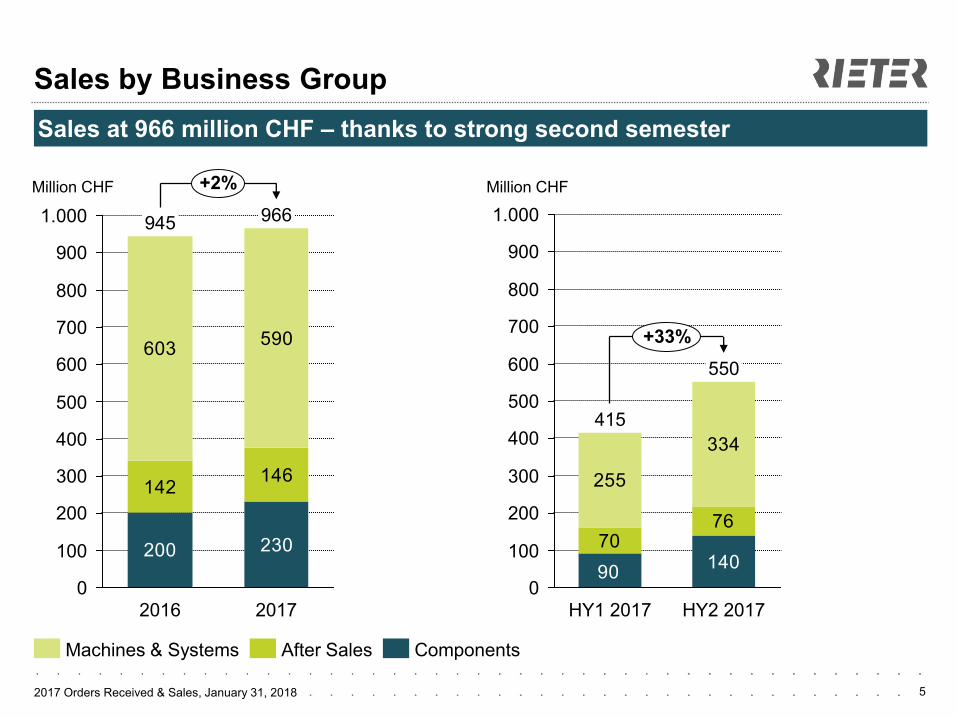
Sales at 966 million CHF ‒ thanks to strong second semester
200 230
142146
603590
1.000
900
800
700
600
500
400
300
200
100
0
+2%
2017
966
2016
945
After Sales Machines & Systems Components
14070
76
255
334
90
600
800
200
700
100
500
400
300
0
1.000
900
+33%
HY2 2017
550
HY1 2017
415
Million CHF
2017 Orders Received & Sales, January 31, 2018 6
Change in Sales and Currency Impact
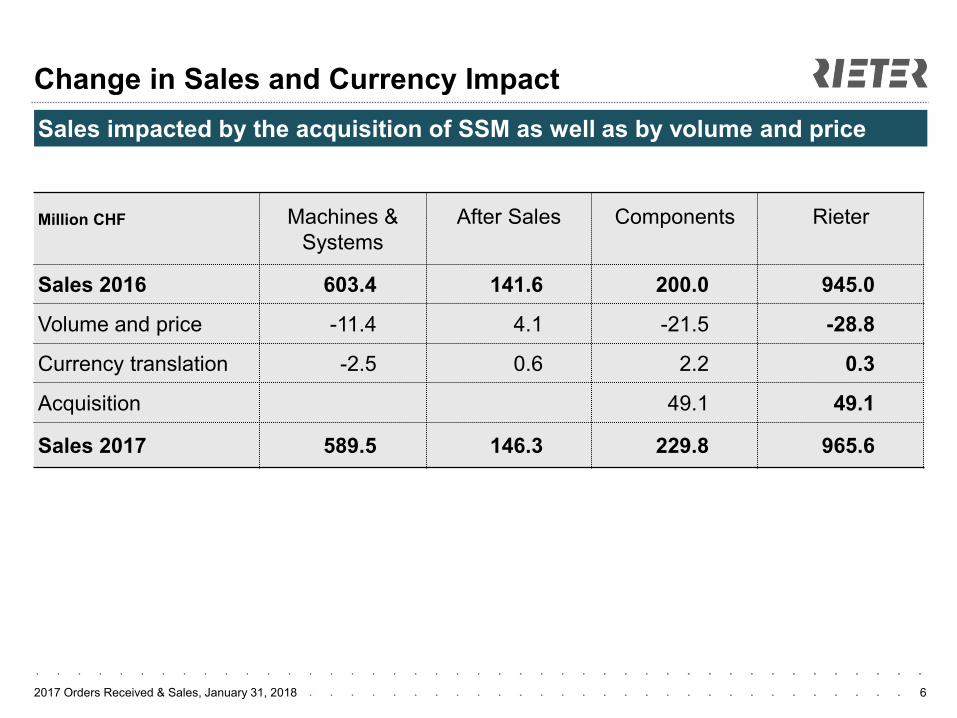
Sales impacted by the acquisition of SSM as well as by volume and price
Million CHF
Machines &
Systems
After Sales
Components
Rieter
Sales 2016 603.4 141.6 200.0 945.0
Volume and price -11.4 4.1 -21.5 -28.8
Currency translation -2.5 0.6 2.2 0.3
Acquisition 49.1 49.1
Sales 2017 589.5 146.3 229.8 965.6
2017 Orders Received & Sales, January 31, 2018 7
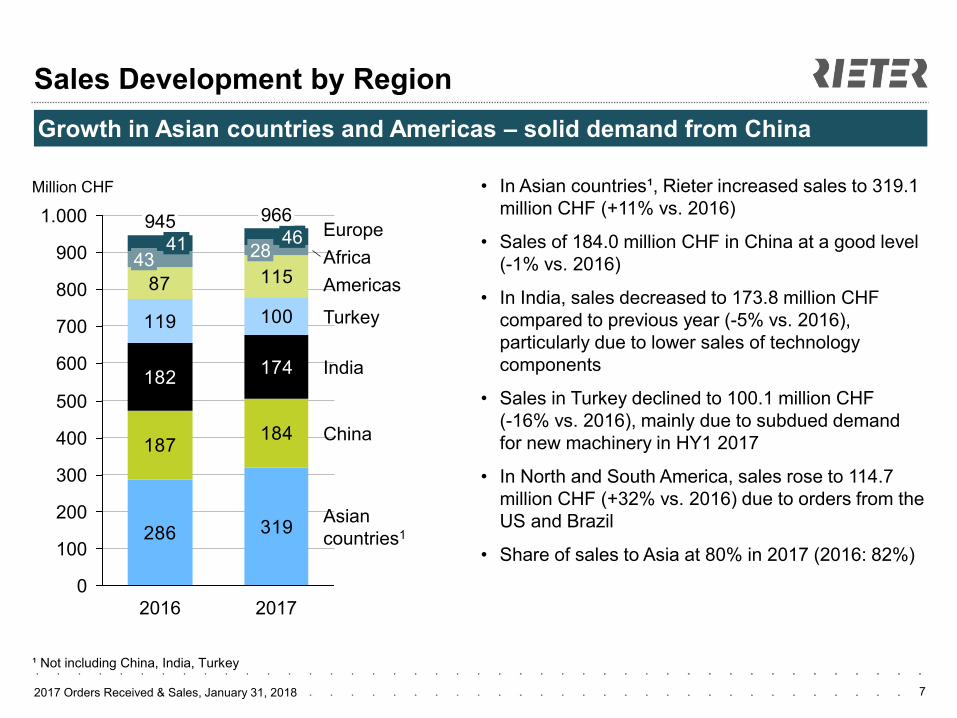
Sales Development by Region
Growth in Asian countries and Americas ‒ solid demand from China
286 319
187184
182174
119 100
87 115
1.000
700
600
200
400
0
300
100
900
800
500
2016
43 41
Africa
Europe
Asian
countries1
India
China
28
2017
Turkey
46 945 966
Americas
• In Asian countries¹, Rieter increased sales to 319.1
million CHF (+11% vs. 2016)
• Sales of 184.0 million CHF in China at a good level
(-1% vs. 2016)
• In India, sales decreased to 173.8 million CHF
compared to previous year (-5% vs. 2016),
particularly due to lower sales of technology
components
• Sales in Turkey declined to 100.1 million CHF
(-16% vs. 2016), mainly due to subdued demand
for new machinery in HY1 2017
• In North and South America, sales rose to 114.7
million CHF (+32% vs. 2016) due to orders from the
US and Brazil
• Share of sales to Asia at 80% in 2017 (2016: 82%)
Million CHF
¹ Not including China, India, Turkey
2017 Orders Received & Sales, January 31, 2018 8
Agenda
1. Orders Received & Sales 2017 Joris Gröflin
2. Profit Outlook 2017 Dr. Norbert Klapper
. . . . .
. . . . .
. . . . .
. . . . .
. . . . .
. . . . .
. . . . .
. . . . .
. . . . .
2017 Orders Received & Sales, January 31, 2018
Profit Outlook 2017
9
• Rieter expects to achieve an EBIT margin before restructuring charges between
5% and 5.5% and a net profit between 1% and 1.5% of sales in the 2017
financial year.
• Rieter’s full annual financial statements for 2017 and the annual report will be
published on March 13, 2018, at the results press conference and presentation
to analysts in Winterthur.
• The Annual General Meeting will be held on April 5, 2018.
2017 Orders Received & Sales, January 31, 2018 10
Deadline for proposals regarding the agenda
of the Annual General Meeting: February 22, 2018
Results press conference 2018: March 13, 2018
Annual General Meeting 2018: April 5, 2018
Semi-annual report 2018: July 19, 2018
Financial Calendar
2017 Orders Received & Sales, January 31, 2018
Disclaimer
11
Rieter is making great efforts to include accurate and up-to-date information in this document,
however we make no representations or warranties, expressed or implied, as to the accuracy or
completeness of the information provided in this document and we disclaim any liability
whatsoever for the use of it.
The information provided in this document is not intended nor may be construed as an offer or
solicitation for the purchase or disposal, trading or any transaction in any Rieter securities.
Investors must not rely on this information for investment decisions.
All statements in this report which do not reflect historical facts are forecasts for the future which
offer no guarantee whatsoever with respect to future performance; they embody risks and
uncertainties which include – but are not confined to – future global economic conditions,
exchange rates, legal provisions, market conditions, activities by competitors and other factors
outside the company's control.

2017 Orders Received & Sales, January 31, 2018 12
Appendix
. . . . .
. . . . .
. . . . .
. . . . .
. . . . .
. . . . .
. . . . .
. . . . .
. . . . .

2017 Orders Received & Sales, January 31, 2018 13
Values and Principles
2017 Orders Received & Sales, January 31, 2018
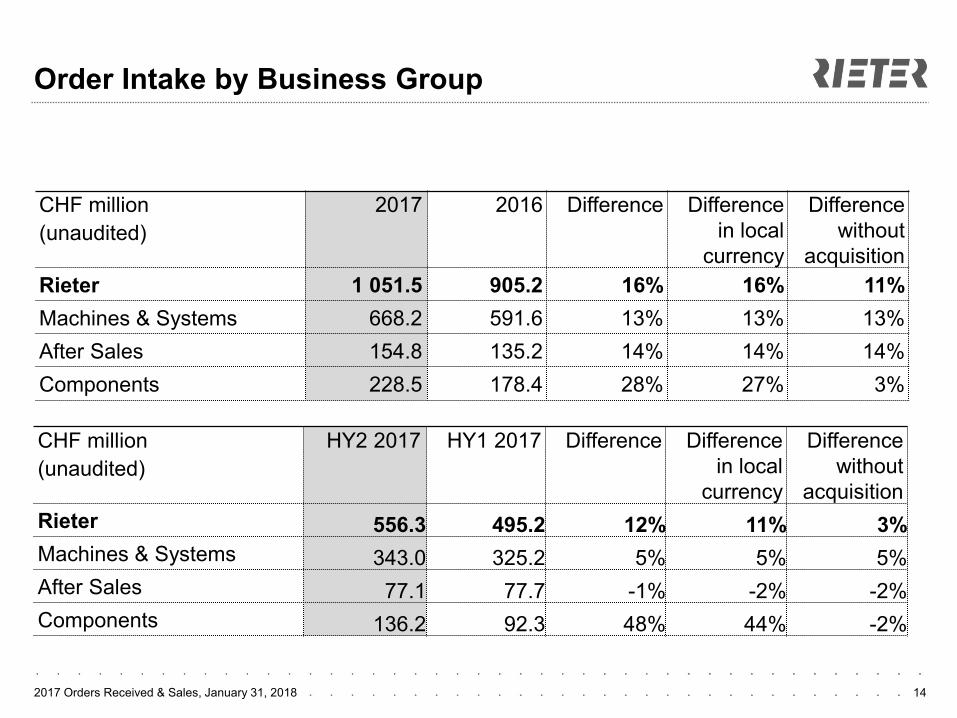
Order Intake by Business Group
14
CHF million
(unaudited)
2017
2016
Difference Difference
in local
currency
Difference
without
acquisition
Rieter 1 051.5 905.2 16% 16% 11%
Machines & Systems 668.2 591.6 13% 13% 13%
After Sales 154.8 135.2 14% 14% 14%
Components 228.5 178.4 28% 27% 3%
CHF million
(unaudited)
HY2 2017
HY1 2017
Difference Difference
in local
currency
Difference
without
acquisition
Rieter 556.3 495.2 12% 11% 3%
Machines & Systems 343.0 325.2 5% 5% 5%
After Sales 77.1 77.7 -1% -2% -2%
Components 136.2 92.3 48% 44% -2%
2017 Orders Received & Sales, January 31, 2018
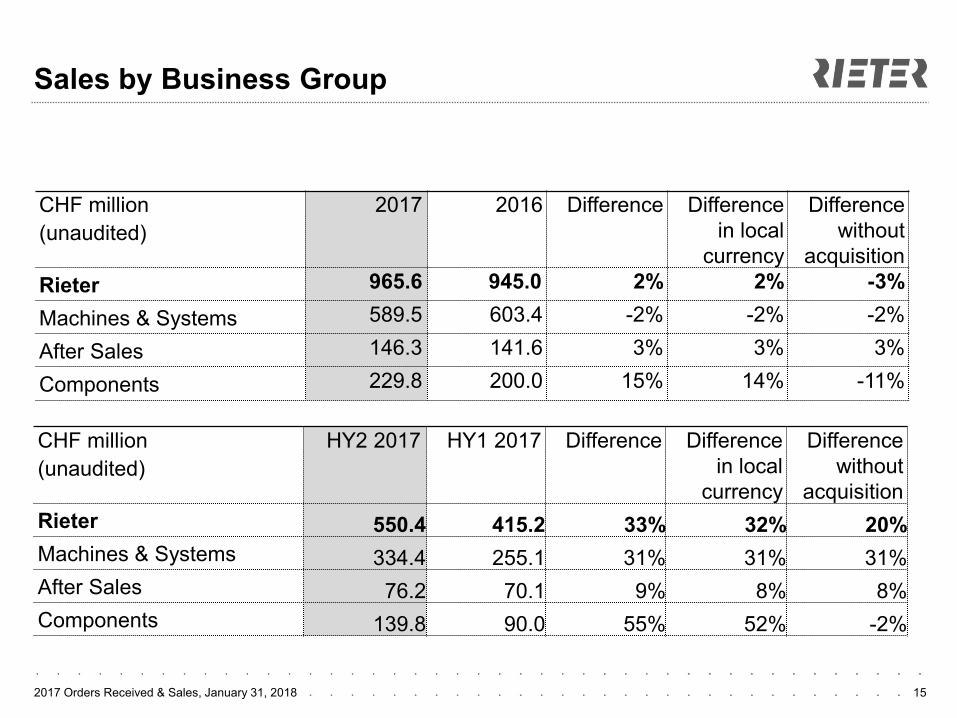
Sales by Business Group
15
CHF million
(unaudited)
2017
2016
Difference Difference
in local
currency
Difference
without
acquisition
Rieter 965.6 945.0 2% 2% -3%
Machines & Systems 589.5 603.4 -2% -2% -2%
After Sales 146.3 141.6 3% 3% 3%
Components 229.8 200.0 15% 14% -11%
CHF million
(unaudited)
HY2 2017
HY1 2017
Difference Difference
in local
currency
Difference
without
acquisition
Rieter 550.4 415.2 33% 32% 20%
Machines & Systems 334.4 255.1 31% 31% 31%
After Sales 76.2 70.1 9% 8% 8%
Components 139.8 90.0 55% 52% -2%
2017 Orders Received & Sales, January 31, 2018
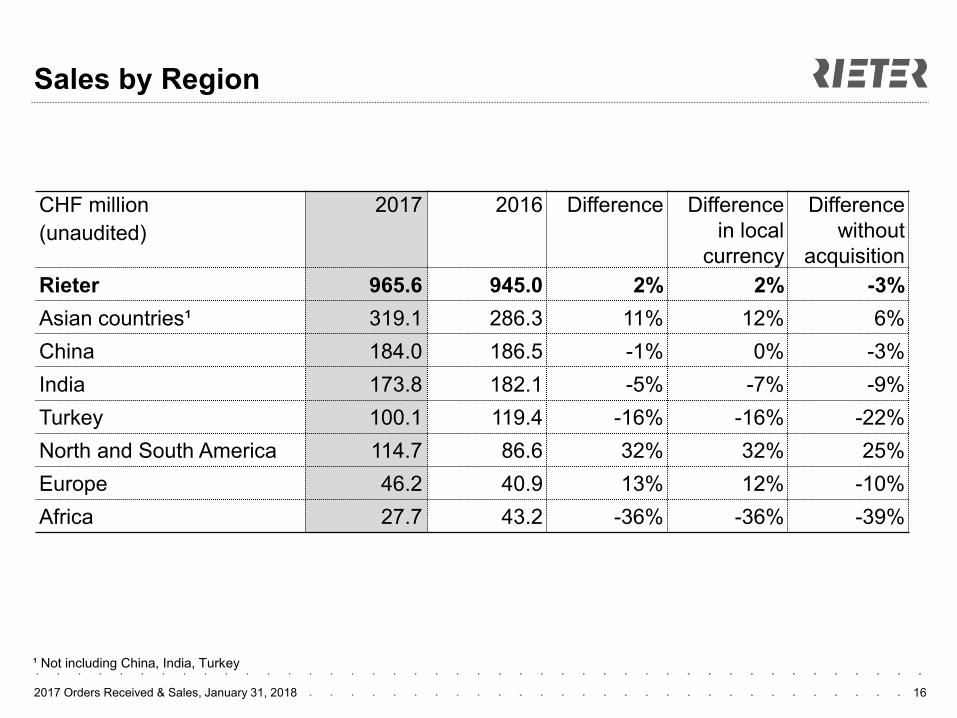
Sales by Region
16
CHF million
(unaudited)
2017
2016
Difference Difference
in local
currency
Difference
without
acquisition
Rieter 965.6 945.0 2% 2% -3%
Asian countries¹ 319.1 286.3 11% 12% 6%
China 184.0 186.5 -1% 0% -3%
India 173.8 182.1 -5% -7% -9%
Turkey 100.1 119.4 -16% -16% -22%
North and South America 114.7 86.6 32% 32% 25%
Europe 46.2 40.9 13% 12% -10%
Africa 27.7 43.2 -36% -36% -39%
¹ Not including China, India, Turkey
2017 Orders Received & Sales, January 31, 2018 17
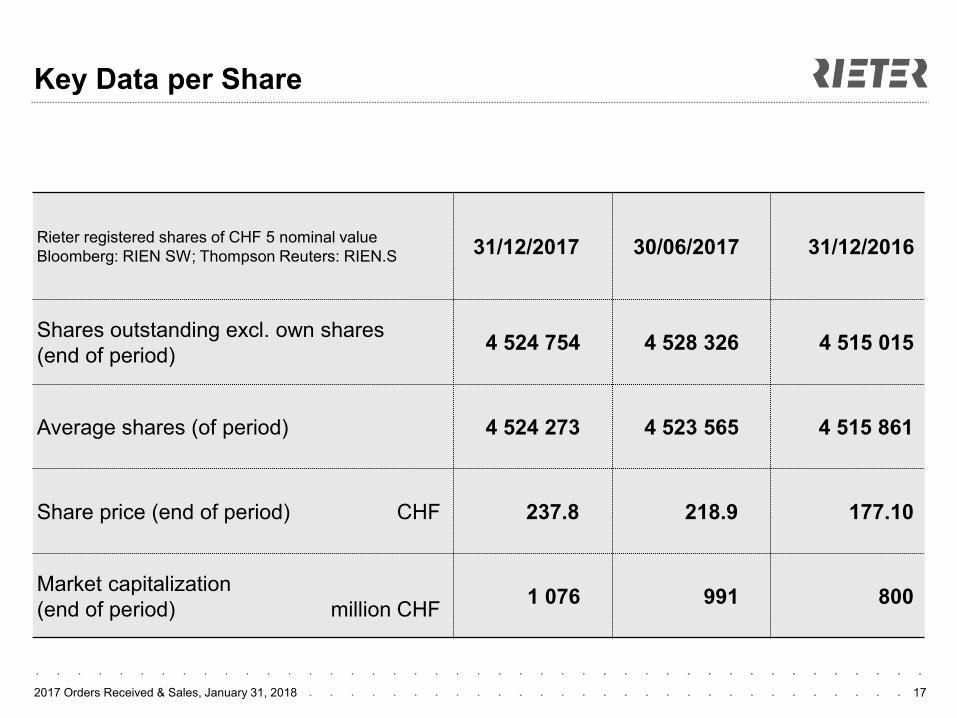
Rieter registered shares of CHF 5 nominal value
Bloomberg: RIEN SW; Thompson Reuters: RIEN.S 31/12/2017 30/06/2017 31/12/2016
Shares outstanding excl. own shares
(end of period) 4 524 754 4 528 326 4 515 015
Average shares (of period) 4 524 273 4 523 565 4 515 861
Share price (end of period) CHF 237.8 218.9 177.10
Market capitalization
(end of period) million CHF 1 076 991 800
Key Data per Share