Embed Size (px)
Citation preview
h i j k l m n v
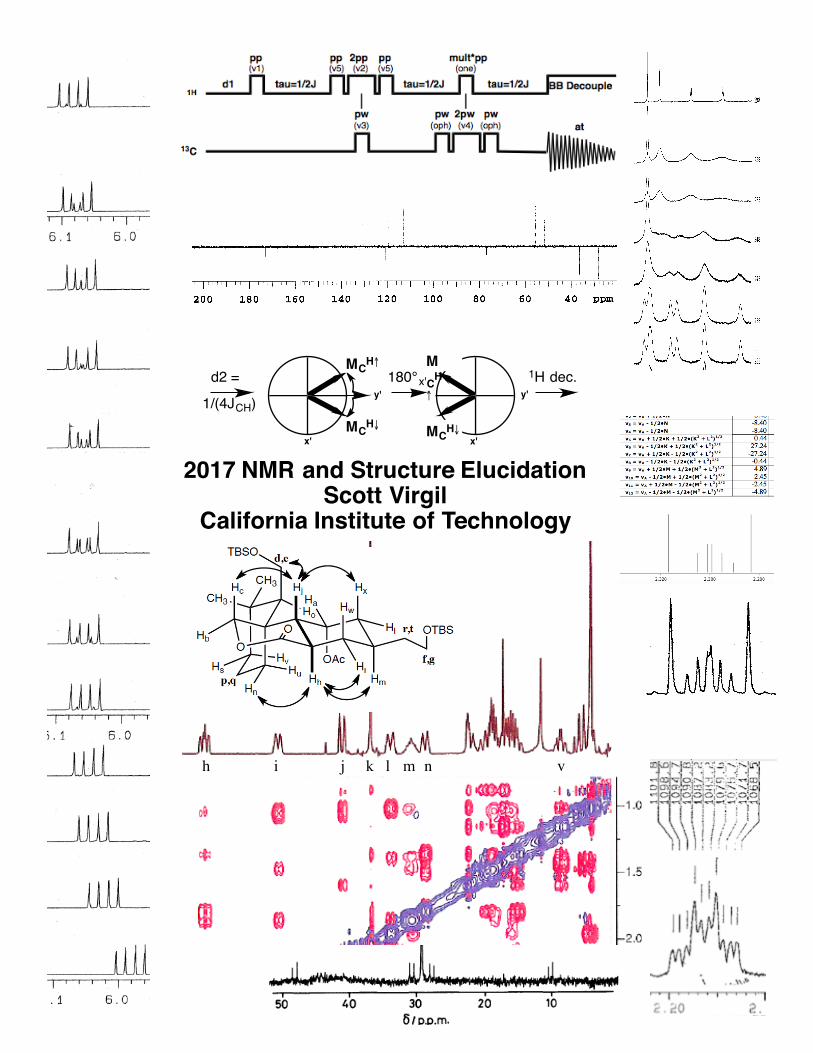
2017 NMR and Structure ElucidationScott Virgil
California Institute of Technology
x'
y'180°x' 1H dec.
MCH↑
MCH↓
y'
x'
MCH↑
MCH↓
d2 =
1/(4JCH)
2017 NMR and Structure Elucidation Scott Virgil
California Institute of Technology
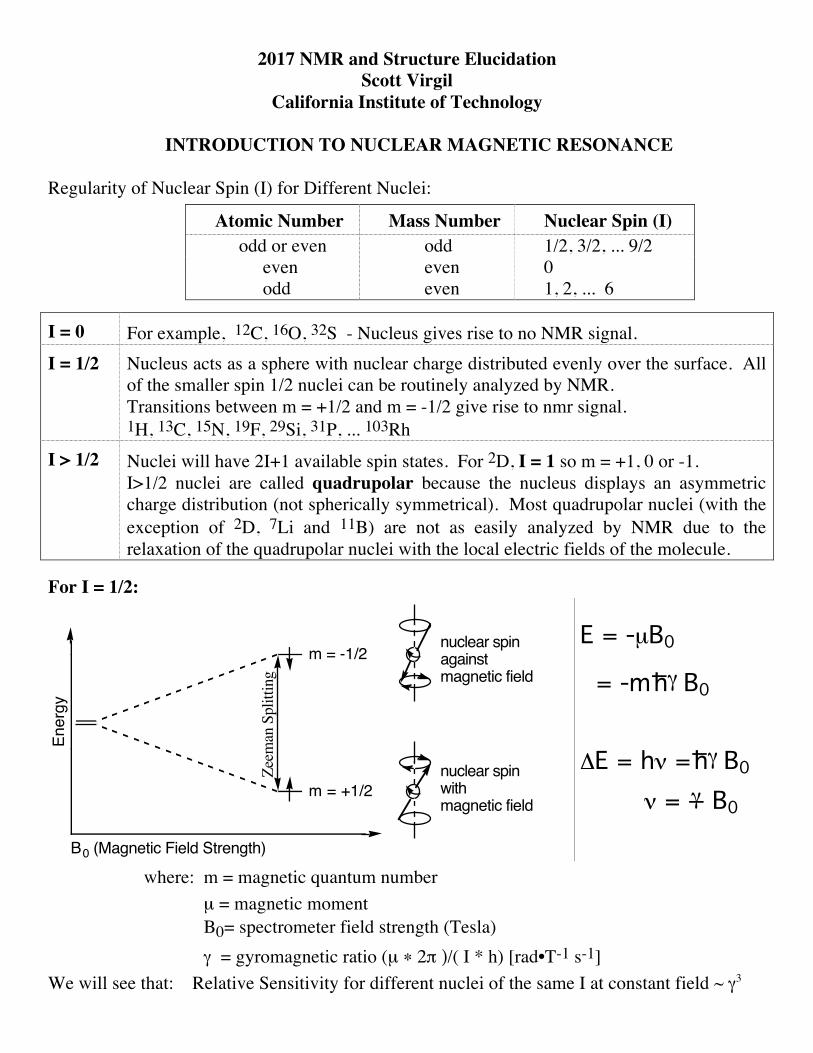
INTRODUCTION TO NUCLEAR MAGNETIC RESONANCE
Regularity of Nuclear Spin (I) for Different Nuclei:
Atomic Number Mass Number Nuclear Spin (I) odd or even odd 1/2, 3/2, ... 9/2
even even 0 odd even 1, 2, ... 6
I = 0 For example, 12C, 16O, 32S - Nucleus gives rise to no NMR signal. I = 1/2 Nucleus acts as a sphere with nuclear charge distributed evenly over the surface. All
of the smaller spin 1/2 nuclei can be routinely analyzed by NMR. Transitions between m = +1/2 and m = -1/2 give rise to nmr signal. 1H, 13C, 15N, 19F, 29Si, 31P, ... 103Rh
I > 1/2 Nuclei will have 2I+1 available spin states. For 2D, I = 1 so m = +1, 0 or -1. I>1/2 nuclei are called quadrupolar because the nucleus displays an asymmetric charge distribution (not spherically symmetrical). Most quadrupolar nuclei (with the exception of 2D, 7Li and 11B) are not as easily analyzed by NMR due to the relaxation of the quadrupolar nuclei with the local electric fields of the molecule.
For I = 1/2:
Ener
gy
B0 (Magnetic Field Strength)
Zeem
an S
plitt
ing
nuclear spinwithmagnetic field
nuclear spinagainstmagnetic field
m = +1/2
m = -1/2E = -µB0
= -m h_γ B0
ΔE = hν = h_γ B0
ν = γ_ B0
where: m = magnetic quantum number µ = magnetic moment B0= spectrometer field strength (Tesla) γ = gyromagnetic ratio (µ ∗ 2π )/( I * h) [rad•T-1 s-1]
We will see that: Relative Sensitivity for different nuclei of the same I at constant field ~ γ3

Table of Nuclear Properties of NMR Active Nuclei Isotope (%) (I) [Q] Magnetic
moment µ NMR freq.
@7.05T @11.75 T Rel. Sensitivity at constant field
free e- 1/2 1836 2 x 10⁵, 3 x 10⁵ MHz 2.84 x 10⁸ 1H 99.985 1/2 2.79278 300 MHz 500 MHz 1.000 2H 0.0156 1 [2.77 x 10 -3] 0.85742 46 MHz 76.8 MHz 0.0097 3H 0 1/2 2.9788 320 MHz 533 MHz 1.21
3He 0.00013 1/2 -2.1275 229 MHz 381 MHz 0.442 6Li 7.5 1 [4.6 x 10 -4] 0.8220 44.2 MHz 73.6 MHz 0.0085 7Li 92.5 3/2 [-4.2 x 10 -2] 3.2564 117 MHz 194 MHz 0.294 9Be 100 3/2 [2 x 10 -2] -1.1774 42.2 MHz 70.3 MHz 0.014 10B 18.83 3 [0.111] 1.8007 32.2 MHz 53.7 MHz 0.02 11B 81.17 3/2 [3.6 x 10 -2] 2.6885 96.3 MHz 160 MHz 0.165 13C 1.108 1/2 0.7024 75.4 MHz 125 MHz 0.0158 14N 99.64 1 [2 x 10 -2] 0.4036 21.7 MHz 36.1 MHz 0.0010 15N 0.36 1/2 -0.2831 30.4 MHz 50.7 MHz 0.0010 17O 0.037 5/2 [-4 x 10 -3] -1.8930 40.7MHz 67.8 MHz 0.029 19F 100 1/2 2.6273 282 MHz 470 MHz 0.833
23Na 100 3/2 [0.1] 2.216 79.3 MHz 132 MHz 0.093 25Mg 10.0 5/2 [ ] -0.8547 18 MHz 30.6 MHz 0.027 27Al 100 5/2 [0.149] 3.639 78 MHz 130 MHz 0.207 29Si 4.67 1/2 -0.5548 59.6 MHz 99.3 MHz 0.0078 31P 100 1/2 1.1317 122 MHz 203 MHz 0.0665 33S 0.74 3/2 [-6.4 x 10 -2] 0.6433 23 MHz 38 MHz 0.0023
35Cl 75.4 3/2 [-8.0 x 10 -2] 0.8218 29 MHz 49 MHz 0.0047 37Cl 24.6 3/2 [-6.2 x 10 -2] 0.6841 24.5 MHz 40.8 MHz 0.0027 39K 93.08 3/2 [ ] 0.3914 14 MHz 23 MHz 0.0005 40K 0.01 4 -1.298 17.4 MHz 29 MHz 0.0052 41K 6.91 3/2 [ ] 0.2149 7.7 MHz 12.8 MHz 8.4 x 10 -5 77Se 7.50 1/2 0.5333 57.3 MHz 95.5 MHz 0.0070 89Y 100 1/2 -0.1368 14.7 MHz 24.5 MHz 0.00011
103Rh 100 1/2 -0.0883 9.5 MHz 15.8 MHz 3.16 x 10 -5 107Ag 51.35 1/2 -0.1130 12.1 MHz 20.2 MHz 6.6 x 10 -5 109Ag 48.65 1/2 -0.1299 14.0 MHz 23.3 MHz 0.00010 111Cd 12.9 1/2 -0.5922 63.6 MHz 106 MHz 0.0095 113Cd 12.3 1/2 -0.6195 66.5 MHz 111 MHz 0.0109 115Sn 0.35 1/2 -0.9132 98.1 MHz 164 MHz 0.035 117Sn 7.67 1/2 -0.9949 107 MHz 178 MHz 0.045 119Sn 8.68 1/2 -1.0409 112 MHz 186 MHz 0.052 123Te 0.89 1/2 -0.7319 78.6 MHz 131 MHz 0.018 125Te 7.03 1/2 -0.8824 94.8 MHz 158 MHz 0.032 129Xe 26.24 1/2 -0.7726 83.0 MHz 138 MHz 0.0212
169Tm 100 1/2 -0.23 24.7 MHz 41.2 MHz 0.0005 171Yb 6.9 1/2 0.492 52.9 MHz 88.1 MHz 0.0055 183W 14.3 1/2 0.1172 12.6 MHz 21.0 MHz 7.4 x 10 -5 195Pt 33.7 1/2 0.6004 64.5 MHz 107 MHz 0.0994
199Hg 16.9 1/2 0.4993 53.6 MHz 89.4 MHz 0.0057 203Tl 29.50 1/2 1.6115 173 MHz 288 MHz 0.192 205Tl 70.50 1/2 1.6274 175 MHz 291 MHz 0.198 207Pb 22.1 1/2 0.5895 63.3 MHz 106 MHz 0.0094 239Pu 6.1 1/2 0.4

Behavior of Nuclear Spin in Magnetic Field
θ
spin axis of nucleus(θ = 54.7 ° for I = 1/2)
x
B1 pulse
rotating magneticfield imposed by B1 pulse
y
precessional orbit
B0 Caltech's Varian 40J. D. Roberts, 1954
Bruker 1000 MHz:
Consider a spinning nucleus oriented at an angle θ to the direction of the applied field (B0).The main field acts so as to decrease θ, but since the nucleus is spinning, the net result is the precession of the nuclear magnet about B0 with angular velocity ω0= γB0 = 2πν. ω0 is theLarmor Precession Frequency of the nucleus.
A transition from one nuclear spin state to the adjacent level may be induced by a magnetic field B1 rotating at the frequency ν and in phase with the precessing nucleus. The transmitter power (RF = radio frequency) of the spectrometer is applied at the frequency ν through a coil in the NMR probe to create the oscillating magnetic field B1.
RF
B0
- deliversB1 pulse
At 117,500 gauss (11.75 Tesla):
1H nuclei resonate at ν = (26.7519 x 10⁷ rad•T-1 s-1)(11.75 T)
2π = 500 MHz
13C nuclei resonate at ν = (6.7283 x 10⁷ rad•T-1 s-1)(11.75 T)
2π = 125 MHz

Spectral Positions of Common Nuclei at 7.05 T:
318
MH
z
300
MH
z
282
MH
z
121
MH
z
75 M
Hz
46 M
Hz
1H3H 31P 13C 2H11B
96 M
Hz
19F
If a 1H NMR spectrum is 20 inches wide (from 0 – 10 ppm) consider : 3H 1H 19F
2.5 miles 2.3 miles
200 inches20 inches
Boltzmann Populations of NMR Energy Levels
Ener
gy
B0 (Magnetic Field Strength)
ΔE=
hn=
diffe
renc
ein
Ene
rgy
nuclear spinwithmagnetic field
nuclear spinagainstmagnetic field
ΔE
= 0.
03 c
al/m
ole
50.001%
49.999%
Equilibrium Distribution of 1HNuclear Spins at 300 MHz and 25°C
Calculation of Energy Separation and Boltzmann Distribution:
For 1H at 300 MHz: ΔE = hν = (6.626 x 10⁻³⁴ J•s)(300 x 106 s-1)(6.02x 10²³)
4.184 J/cal =0.029 cal/mole
At 25 °C, No. in lower energy stateNo. in higher energy state = e(ΔE/kT)
= exp( (6.626 x 10⁻³⁴ J•s)(300 x 106 s-1)
(1.38 x 10⁻²³ J•K-1)(298K) ) = 50.0012%49.9988%

Pulse Fourier-Transform NMR
Dependence of signal on Pulse Width: As the duration of the B1 pulse (in µs) is increased, the signal increases as sin θ until θ = 90 ° (14 µs) , then decreases and disappears at θ = 180° (28 µs). Pulse angles beyond 180° produce negative peaks as the magnetization is initially generated along the -x axis.
pulse width (µs)
90°
180°
At Equilibrium: Boltzmann Populations of ↑ and ↓
• random phase distribution
• no signal observed at receiver
x
y
randomphase distribution50.001%
49.999%netmagnetizationvector
B0
After 90° Pulse: Equal populations of ↑ and ↓
• phase coherence
• signal generated at receiveroscillates at frequency ω0
x
y
phasecoherence
phasecoherence
50.000%
50.000%
netmagnetizationvector
90°w0receiver
transmitter
B0
After 180° Pulse: Inverted populations of ↑ and ↓
• random phase distribution
• no signal generated at receiver
x
y
randomphase distribution49.999%
50.001%
netmagnetizationvector
180°
B0
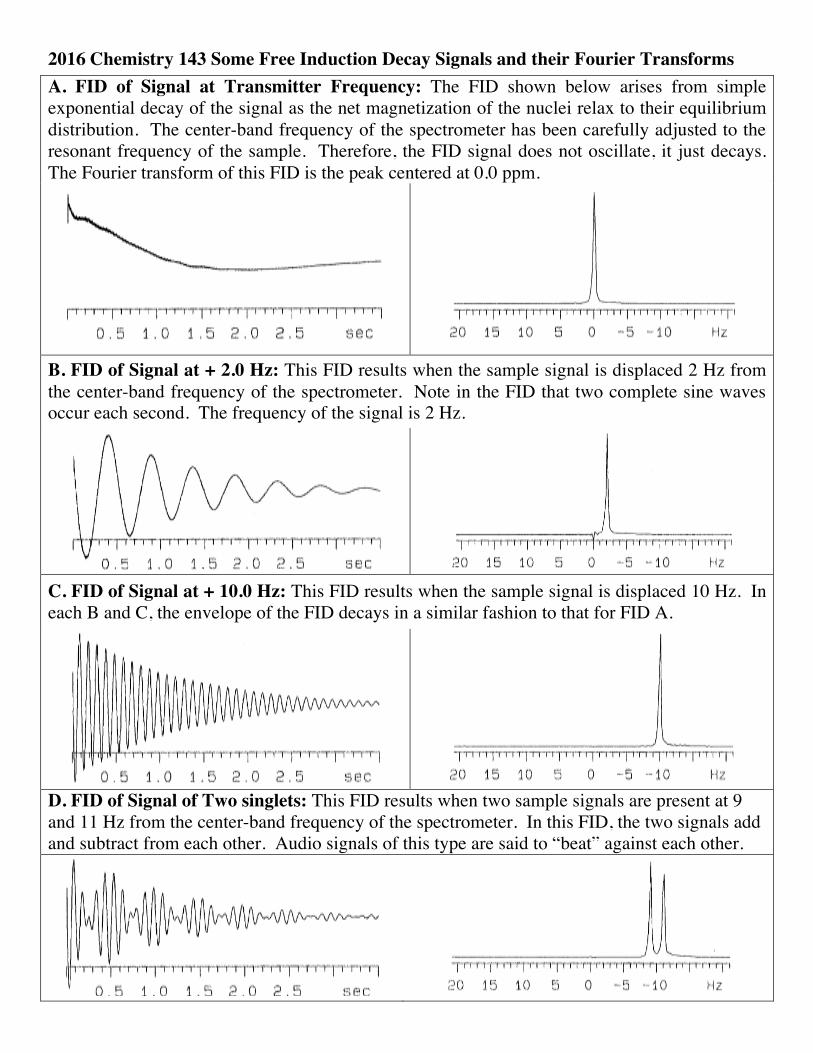
2016 Chemistry 143 Some Free Induction Decay Signals and their Fourier Transforms A. FID of Signal at Transmitter Frequency: The FID shown below arises from simple exponential decay of the signal as the net magnetization of the nuclei relax to their equilibrium distribution. The center-band frequency of the spectrometer has been carefully adjusted to the resonant frequency of the sample. Therefore, the FID signal does not oscillate, it just decays. The Fourier transform of this FID is the peak centered at 0.0 ppm.
B. FID of Signal at + 2.0 Hz: This FID results when the sample signal is displaced 2 Hz from the center-band frequency of the spectrometer. Note in the FID that two complete sine waves occur each second. The frequency of the signal is 2 Hz.
C. FID of Signal at + 10.0 Hz: This FID results when the sample signal is displaced 10 Hz. In each B and C, the envelope of the FID decays in a similar fashion to that for FID A.
D. FID of Signal of Two singlets: This FID results when two sample signals are present at 9 and 11 Hz from the center-band frequency of the spectrometer. In this FID, the two signals add and subtract from each other. Audio signals of this type are said to “beat” against each other.

2016 Chemistry 143 Some Free Induction Decay Signals and their Fourier Transforms E. “Clipped” FID: This FID results when the receiver gain is too high. The message “ADC overflow” indicates that the electronic signal has swamped the analog to digital converter. The resulting “clipped FID” is transformed to a spectrum with extraneous spikes as shown.
F. “Truncated” FID: This FID has been cut short before it has had time to completely relax. It is referred to as a “truncation error”. The resulting spectrum shows wiggles flanking the main peak. It can be seen as a combination of the desired signal and an FT of a “square wave”. Although faulty FIDs E and F are uncommon in 1D spectra, similar errors in 2D NMR acquisition can arise unexpectedly and are more difficult to see if you are not looking for them.

2016 Chemistry 143 Example Spectra – Isotopic Satellites and AMX 1HNMR (500 MHz, CDCl3) spectrum of CHCl3 + TMS showing 13C and 29Si satellites:
Appearance of 13C satellites on residual CHCl3 (vertical scale x 16):
1J13C-H = 3734.69 – 3525.50 = 209.2 Hz
1H - 12CCl3 singlet is almost exactly centered (+ 0.0026 ppm) between 1H - 13CCl3 satellites.
Appearance of 13C and 29Si satellites on Me4Si region (vertical scale x 16): 1J13C-H = 58.46 – (-59.77) = 118.2 Hz 2J29Si-H = 3.36 – (-3.36) = 6.7 Hz
Vinyl Bromide spectrum showing “AMX” spin system: Vinyl Bromide 1H NMR (500 MHz, CDCl3): 3JAM = 6.8 Hz 3JAX = 15.1 Hz 2JMX = 2.0 Hz
BrHM
HX
HAJAX
JMX
JAM

2016 Chemistry 143 Example Spectra – Examples of Complex Multiplets 1HNMR (500 MHz, D2O) spectrum Ephedrine showing Methyl “dq” pattern:
Spectrum of Ephedrine: • In D2O, NH and OH groups exchange with D.• J-coupling to quadrupolar N (I = 1) is notobserved.
CH3 (d) Ph
OHCH3NH
HaHb
(c) Jab = 4.2 Hz
Jbd = 6.5 Hz3Jab = 1411.54 – 1407.39 = 4.2 Hz 3Jbd = (1411.54 – 1392.01)/3 = 6.5 Hz
1HNMR (500 MHz, D2O) spectrum Ascorbic Acid showing ddd pattern: Ascorbic Acid (500 MHz, D2O): a 4.94 ppm (d, 1H, Jab = 1.8 Hz) b 4.05 ppm (ddd, Jab = 1.8, Jbc = 6.1, Jbd = 7.0) cd 4.94 ppm (m, 2H) O O
HO OH
Ha
HbHO
HO Hc
Hd

Cyclopropylaliphatic C-NHaliphatic C-OH
R - CH3R - CH2 - R
Ar - CHR2
C=C-CH2RC=C-CHR2CH3OR (Cl, Br)RCH2OR (Cl, Br)R2CHOR (Cl, Br)
ArCH2OR
Ar-OH
RC CH
Ar - CH3Ar - CH2R
C=C-CH3
Ar - CH2ClROCH2OR
C=CHAr-HNHCORCHORCOOH
0 -1123456789101112
CH3 - C - ORCH2 - C - OR2CH - C - O
1H NMR Chemical Shifts of Standard Organic Functional Groups
CH3C∫C
H
2.02.5 1.5 1.03.0 ppm3.54.0
1H NMR Chemical Shifts of CH3X compounds in CDCl3.(add 0.2 to 0.4 ppm for CH3CH2X)
O
CH3C
(=O
)CH 3
CH3P
h
CH3C
O2H
CH3
CH3O
CH3
CH3O
Ph
CH3B
r
CH3N
O2
CH3
CH3O
Ac
CH3I
CH3C
l
CH3O
C(=O
)Ph
CH3C
HO
CH3N
HC(=
O)C
H 3
CH3N
Me 2
CH3C
H 2R
CH3S
CH3
CH3C
H 2O
H
CH3O
H
CH3C
OCl
CH3C
N

Assignment of 13C NMR Signals
C N
0
C C
C O
150200
C C
50100 ppm
sp3 Carbons
4070 3090 50 080 20
OAc,OR,OAr
CH2X
NR2
ArCH2X,
C C
X = H, R =
E
C C,
Cl,NR2
60100
CHR
R2CHX
CMeR
SR, CN
CHR
O
NHAc, NR2
MeRC C-X
OAc,OR,OArR3CX R, H
R2C(
OM
e)2
OAc,OR,OAr
OAc,OR,OAr
NHAc, NR2
10
tBu
SR, CN
SROAc,OR,OAr E
RCH-E E
CH2
RCH2X(continued)
E
C(O)R
SR
iPr Et tBuCH2
R,PhX =
X =
X =
X =
X =
X =
X =
X =
0
0
0
0
0
0
0
0RCH2X
F
NHAc
ClNO2
H
H
BrCH
Cl3
CH3X
I
RCH(
OM
e)2
CH2(
OM
e)2
CH2C
l 2
CH2P
h 2
CN
BrX
R
CHPh
3
NH2OAc OR OH
CNBr
Cl
H
ON=O
Me
NMe 2
E
PMe 2
NMe 2
OM
e
OM
e
C X
CX
R,R
H
H YC
XRH Y
CXH
R YC
XR
C MeMe
ER,R
R,H
R,H H,H
H,CN
R,R R,H H,H
X,Y =
X,Y =
X,Y =
200
200
100
100
100
100
100
F OH
HNH2
SHCH
O
CN
NHAc
OAc
OH
H
Cl Iodo
BrNO2
120 100200 130150160170180190 140 110 90
NON
OMeN MeMe
N
130160200210 120150170
R-C N
180190
OX
CY
220 110
X=RY=R
X=RY=H
RCl
ROR
ORORO
R, N
R 2

What is Chemical Equivalence ? Two nuclei resonate at exactly the same frequency
!Chemical Equivalence by Symmetry (mirror plane or axis of symmetry) H
H
Br
BrH
HC2 axis
!Chemical Equivalence by Dynamic Exchange (the rate of rotation or inversion is fast relative to the “NMR timescale”) D
H
HHax
HHH
H
H
H
H
HHH
HH
HeqH H
H
H
H
H
H
kring-flip
! Accidental Equivalence – Two nuclei that are obviously different just happen to have exactly the same chemical shift under the experimental conditions.
The Substitution Test is used to distinguish: Homotopic Protons – always chemically equivalent (will always have the same chem. shift) Enantiotopic Protons – will also be chemically equivalent as long as they experience an achiral environment within the NMR tube (the NMR instrument is not chiral). If, however, a chiral additive is added to the NMR tube (for example, a chiral shift reagent), then enantiotopic protons may experience different environments and thus be observed to display chemical inequivalence. Diastereotopic Protons – are always considered to be chemically inequivalent. They may, of course, be observed to be accidentally equivalent.
Directions for the Substitution Test: Substitute each proton separately for the group X. The resulting structures are carefully compared and low energy molecular motion (such as rotation of single bonds) are allowed to occur: -> If the two structures are identical (superimposable) then the protons of the original structure are homotopic. -> If the two structures are enantiomers (non-superimposable mirror images) then the protons of the original structure are enantiotopic. -> If the two structures are diastereomers then the protons of the original structure are diastereotopic. Examples:
H OHHH
H H
HHHH
Br
BrH
H BrH
Br
HH
H
CH3 CHOCH2CH3
OCH2CH3
O
O
CH3
CH3
HCH3
HbHa
HaHb
homotopic
enantiotopic
homotopic
Diethyl Acetal(achiral)
homotopic
homotopicenantiotopic
Ha and Hb are diastereotopic.Jab = 9.4 Hz, J = 7.1 HzCH2CH3
CN
HcCH3
O
Ha
Hb
CH3(X)CH3
These two structures are diastereomers--> Methyl groups are diastereotopic (chemically inequivalent).Two doublets are observed.
CN
HcCH3
O
Ha
Hb
CH3CH3(X)
! Whenever you have a chiral center, all CH2’s are rigorously diastereotopic. (No matter how much you rotate the bond, you cannot put the two diastereotopic groups in the same overall environment.)
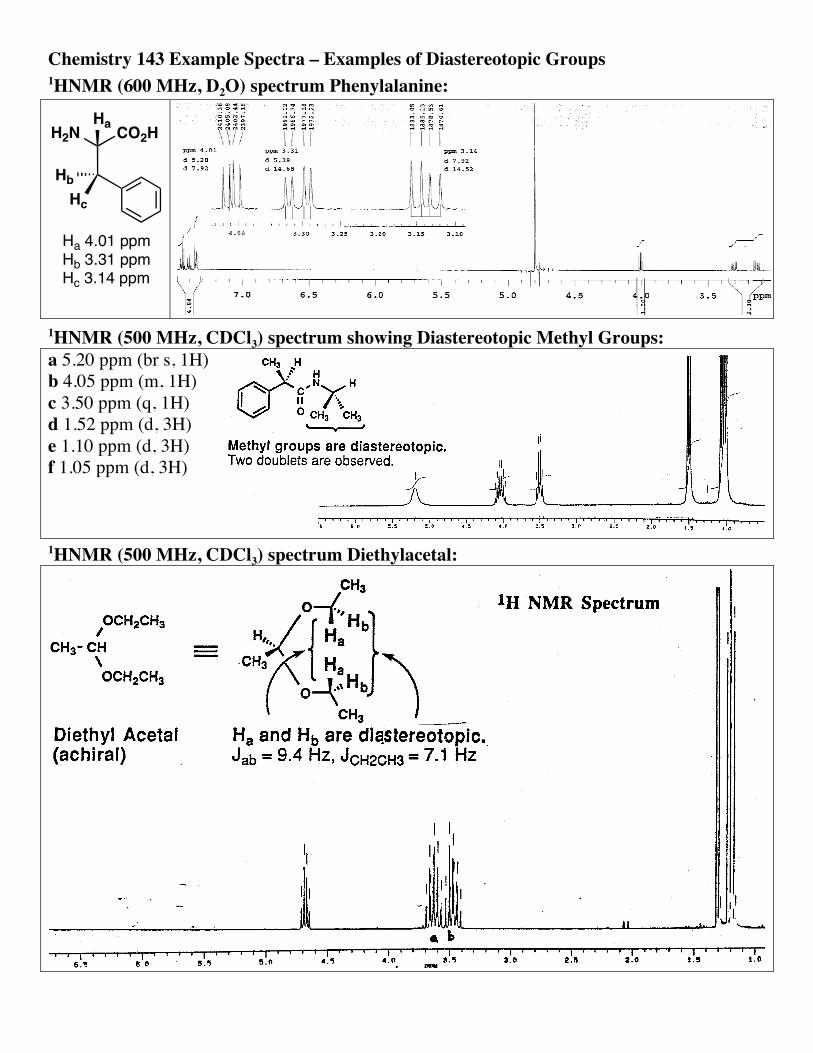
Chemistry 143 Example Spectra – Examples of Diastereotopic Groups 1HNMR (600 MHz, D2O) spectrum Phenylalanine:
HcHb
CO2HH2NHa
Ha 4.01 ppmHb 3.31 ppmHc 3.14 ppm
1HNMR (500 MHz, CDCl3) spectrum showing Diastereotopic Methyl Groups: a 5.20 ppm (br s, 1H) b 4.05 ppm (m, 1H) c 3.50 ppm (q, 1H) d 1.52 ppm (d, 3H) e 1.10 ppm (d, 3H) f 1.05 ppm (d, 3H)
1HNMR (500 MHz, CDCl3) spectrum Diethylacetal:
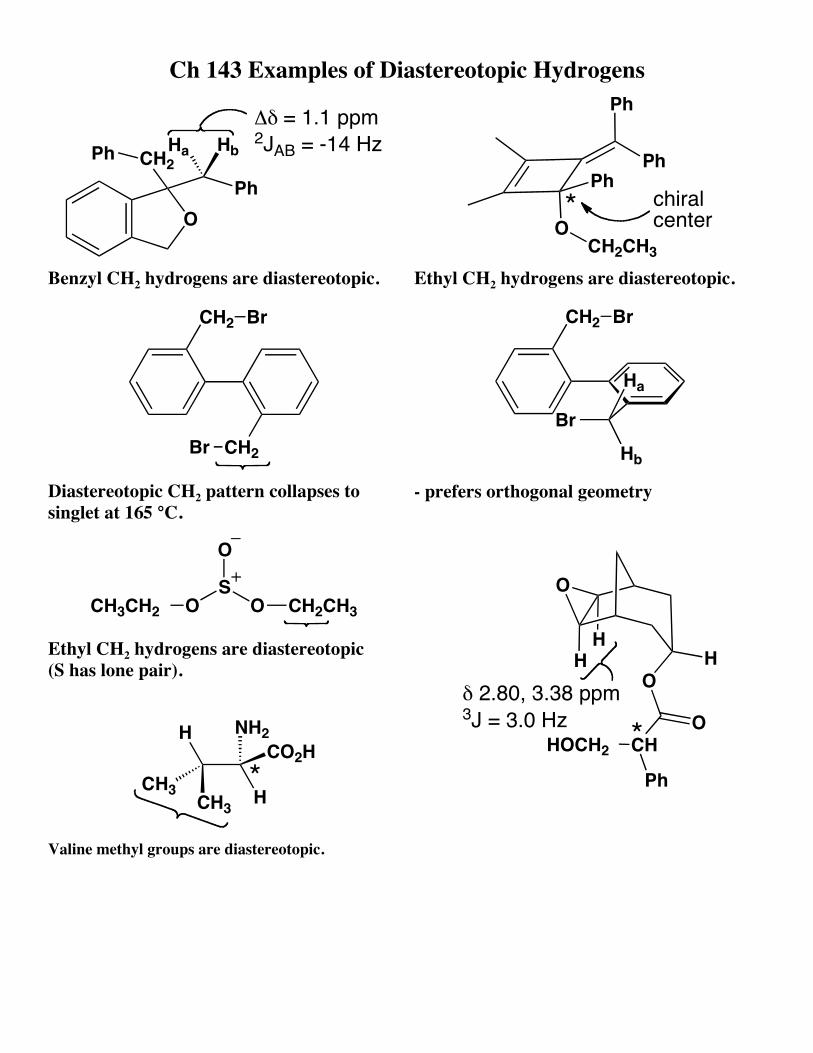
Ch 143 Examples of Diastereotopic Hydrogens
O
CH2Ph
Ph
Δδ = 1.1 ppm 2JAB = -14 HzHbHa
Benzyl CH2 hydrogens are diastereotopic.
Ph
PhPh
OCH2CH3
chiralcenter*
Ethyl CH2 hydrogens are diastereotopic.
CH2
CH2
Br
Br
Diastereotopic CH2 pattern collapses to singlet at 165 °C.
CH2 Br
Br
Ha
Hb- prefers orthogonal geometry
OS
O
O
CH2CH3CH3CH2
Ethyl CH2 hydrogens are diastereotopic (S has lone pair).
H
HCO2H
NH2
CH3CH3
*
Valine methyl groups are diastereotopic.
O
HH
O
O
H
CH
Ph
HOCH2
δ 2.80, 3.38 ppm3J = 3.0 Hz *

THE CHEMICAL SHIFT a) Inductive Effects arising from ElectronegativityElectronegative substituents withdraw electron density and therefore deshield the protons. The inductive effect falls off rapidly with distance (more intervening bonds).
Electronegativity
Chemical shift ofCH3–X relative tochemical shift ofCH4 C
NO
F
b) HybridizationCompare: CH3 CH3 CH2 CH2 HC CH
CH
HCH
sp3 C-H (1.0 ppm)
sp2 C-H (4.7 ppm)
sp C-H (2.1 ppm)
~sp2.5 C-H (0.2 ppm)
~sp2.5 C-H (4.0 ppm)
As the s character of the C atom of a C-H bond increases, the e- pair of the shared bond will be drawn more towards the C; and shielding of the H will be decreased. However, we will see that anisotropic effects also contribute.
c) Resonance Effects
O O
H
H (5.93)
(6.37)
O O
H
H (6.37)
(4.65)

d) Direct Electrostatic Effects and van der Waals Effects
HH HHO
(3.55)(0.88)
HH HO
(5.28)(0.60)(3.92) (4.25)Na+
S. Winstein, et. al. JACS 1965, 87, 5247.
e) Anisotropic Effects of Multiple Bonds
Acetylene:
B0
induced field generated bycirculation of π-electrons
CCH H
CCH H
B0
Shielding and Deshielding falls off rapidly with distance
Similar Effects for –CN group.
shielding region(induced fieldopposes B0)
CCH H
_+

Olefins: HCH3 CH3H
HHOOHH
(0.79) (0.70)
(3.53) (3.75)
CC
_ +
H
HH
H
+
_
B0
Carbonyl Compounds:
CH3
CH3 H
HO(2.12)
(1.91)
(9.8)
H
H H
OMeO(6.38)
(5.82)
H
H C
CH3(5.76)
(5.72)N(6.20)
OC
_ +R
R'
+
_
B0
Three Isomers:
O
HOMeO
OMeH O
OMeMeO
O H (7.34)
H
(7.87)
MeO
O H(8.20) OMeO

f) Long-Range Shielding Due to Interatomic Currents (Ring Currents)Circulation of e- over a number of atomic centers – these diamagnetic currents are most readily developed in large closed loops such an the π e- system of aromatic compounds.
HH
B0
Aromatic H’s at lower field position than vinyl H’s
C6H6 ~ 7.2 ppm vinyl H ~ 5 ppm
H’s over the plane of aromatic rings are shielded:
CH2
CH2
CH2CH2CH2
(0.51)
(1.08)(1.55)
(2.63)
(0.70)
H H
H
H
(6.55)
(7.10)
Me Me
Me
Me
(2.20) (1.90)

Further Examples of Aromatic Shielding and Deshielding:
H H
H
H
(6.55)
H
(7.20)
H
(7.46)
H
(7.80)H
(8.7)H
(10.3)
H
(8.00)
O HO
(9.20)
HO
(9.28)
HH(8.60)
H
(8.10)
(7.10)Me Me
Me
Me
(2.20) (1.90)
N
NN
N
HHH
H
(11.2)
(9.92)
(-4.40)
HH
H
H
(-0.51)(7.27 & 6.95) H
H(-0.51)
O

Example of Anisotropy in complex systems: Explain the acetate chemical shifts from the diacetate using stereochemical drawings to discuss anisotropy. Staurosporine: Wood, J. L. Stoltz, B. M.; Goodman, S. N. JACS 1996, 118, 10656-10657.
NN
OMe H
ROOR
R,R' = H Figure A.5.22R,R' = CH3CO Fig. A.5.25
Figure A.5.22 1H NMR (500 MHz, acetone-d6) of compound 184.
Figure A.5.25 1H NMR (500 MHz, CDCl3) of compound 182.
O
NN
CH3O
O
O
CH3H
O
CH3
H
H
Building a model, each nitrogen of the polycyclic aromatic system must be axial on the chair conformation of the six-membered ring pyran ring. The esters are attached, one axial and the other equatorial. The axial acetate will is oriented close to the face of the central benzene ring of the aromatic system. This causes the unusual upfield anisotropic shift to ~0.5 ppm for the methyl group of the axial acetate.

Shoolery’s Rules (Empirical Calculation/Estimation of Olefinic Chemical Shifts in δ)
C CH
C CH
δ = 5.25 + gem + cis + trans gemtrans
cis5.25 ppm (chemical shift of H for ethylene)
Substituent gem cis trans -H 0.00 0.00 0.00 -alkyl 0.45 -0.22 -0.28 -alkyl (cyclic) 0.69 -0.25 -0.28 -CH2OH 0.64 -0.01 -0.02 -CH2X (X = F, Cl, Br) 0.70 0.11 -0.04 -CH2NR2 0.58 -0.10 -0.08 -C=C 1.00 -0.09 -0.23 -CN 0.27 0.75 0.55 -COR 1.10 1.12 0.87 -CO2H 0.97 1.41 0.71 -CO2R 0.80 1.18 0.55 -CHO 1.02 0.95 1.17 -CONR2 1.37 0.98 0.46 -OR 1.22 -1.07 -1.21 -OCOR 2.11 -0.35 -0.64 -CH2Ar 1.05 -0.29 -0.32 -Cl 1.08 0.18 0.13 -NR2 0.80 -1.26 -1.21 -Ar 1.38 0.36 -0.07
( - sign indicates upfield shift)
Example: Calculation of δ olefinicH for Dihydropyran.
O H
H (4.65)
(6.37)
αΗ 5.25 +1.22 (gem -OR) -0.28 (trans –alkyl, cyclic) = 6.19 ppm
βΗ 5.25 +0.69 (gem -alkyl, cyclic) -1.21 (trans -OR) = 4.73 ppm


2016 Chemistry 143 - The Basic Strategy for Solving Small Molecules
Methods of Choice: Possible Challenges: 1. Unsaturation Number(2C+N-H-Cl+2)/2 =#db,rings
MS, Structure of starting material
(Equation assumes N,P are trivalent and S divalent)
2. Identify Unsaturated groups. 13C NMR, IR 3. Check for Symmetry. 13C NMR, 1H NMR Also check for purity and for rotamers
(e.g. BOC groups) 4. Solve 1H-1H Spin System. 1H NMR analysis Other spin ½ and spin 1 nuclei
Strong coupling (leaning) Diastereotopic H’s AA’XX’ and other higher order effects Bicyclic systems may have unexpected J values (small vicinal, large long-range)
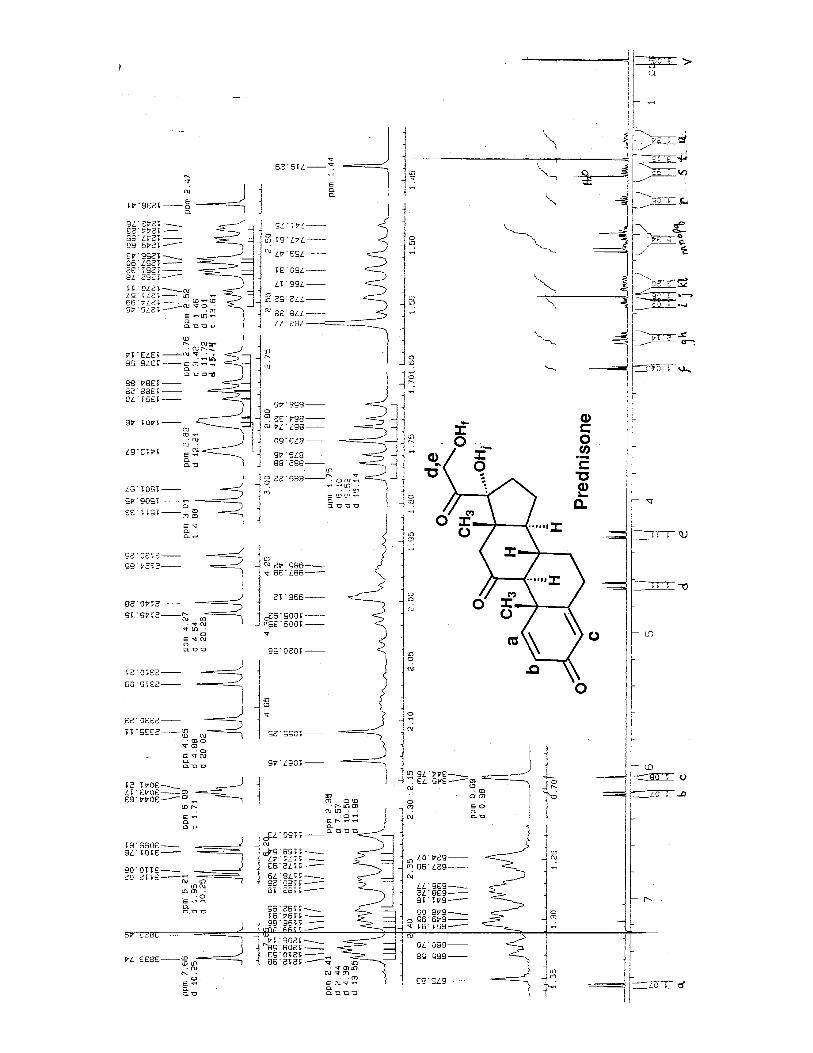
5. Analysis of Chemical Shifts. OH and NH groups Anisotropy effects
Example 1. Ester C8H13O2Cl (spectrum on previous page) 1. Unsaturation Number = (2*8 + 0 – 13 – 1 + 2 )/2 = 2 so there are two db or rings.2. Identify Unsaturated groups. In the 13C NMR, there appears to be one C=O lines and twodb region lines. We will have to verify that there is no symmetry in the next step, but it looks like there is one C=O and one C=C group. 3. Check for Symmetry. There are 8 carbons and 8 lines in the 13C NMR, therefore there is nosymmetry. All 13 Hydrogens can be found in the 1H NMR. 4. Solve 1H-1H Spin System. -> Learn to extract J values from multiplets.
peak at 5.15 is 2H
a δ 5.73 (1H, ddd, J = first J = (2880.59 – 2872.71) = 7.9 Hz second J = (2880.59 – 2870.09) = 10.5 Hz third J = (2872.71 – 2855.39) = 17.3 Hz Sum should = (2880.59 – 2845.42) = 35.2 (35.7)
b, c δ 5.10 – 5.16 (2H, m)
d δ 4.10 (q, 2H, J = 7.2 Hz)
e δ 3.59 (1H, dd, J = 5.2, 11.0 Hz)
(diastereotopic CH2 group)
f δ 3.52 (1H, dd, J = 6.3, 11.0 Hz)
triplet at 1.22 ppm
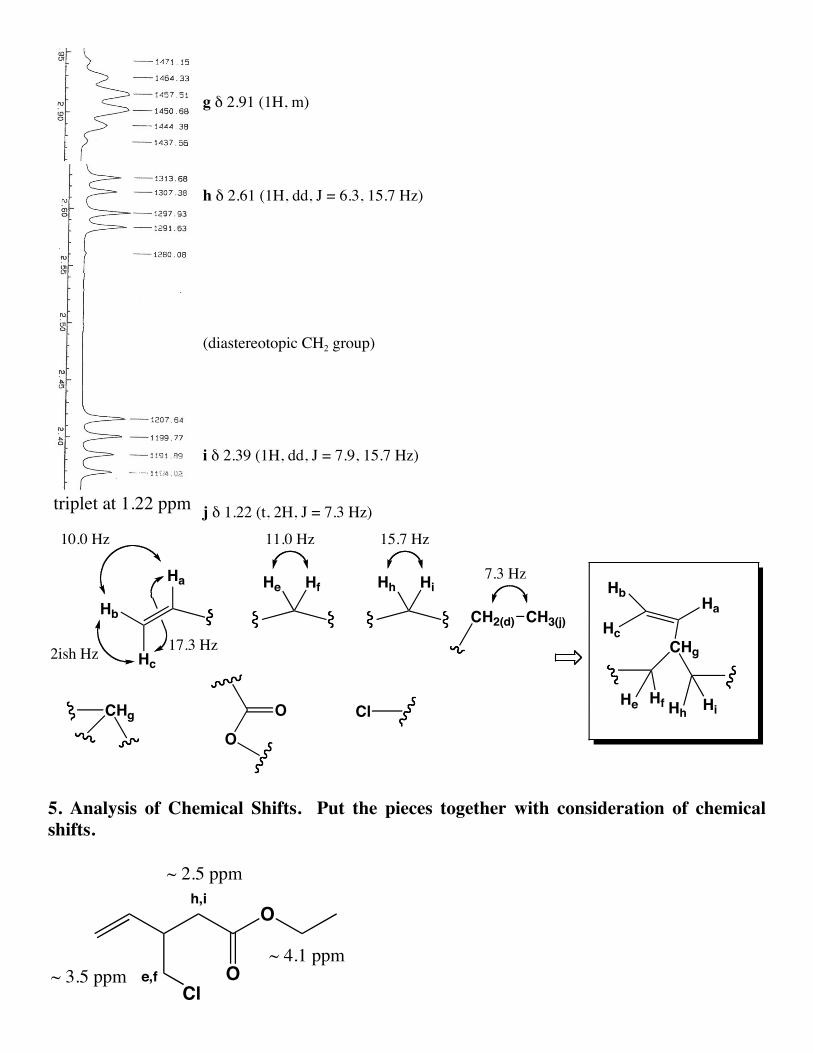
g δ 2.91 (1H, m)
h δ 2.61 (1H, dd, J = 6.3, 15.7 Hz)
(diastereotopic CH2 group)
i δ 2.39 (1H, dd, J = 7.9, 15.7 Hz)
j δ 1.22 (t, 2H, J = 7.3 Hz)
Ha
Hb
Hc
10.0 Hz
2ish Hz 17.3 Hz
He Hf Hh Hi
CH2(d) CH3(j)
OO
ClCHg
CHg
Ha
He Hf Hh Hi
Hb
Hc
11.0 Hz 15.7 Hz
7.3 Hz
5. Analysis of Chemical Shifts. Put the pieces together with consideration of chemicalshifts.
O
ClOe,f
h,i~ 2.5 ppm
~ 3.5 ppm~ 4.1 ppm

Example 2. Unknown C13H13NO2

Example 2. Unknown C13H13NO2

Example 2. Unknown Cyano Compound C13H13NO2 IR shows 2242 cm-1 (CN group) and 1741 cm-1 (C=O group). 1H NMR (500 MHz) and 13C (75 MHz). Step 1: Unsaturation # = (2*C-H+N+2)/2 = (26-13+1+2)/2 = 8 Step 2: In addition to C=O (168.8 ppm) and CN (120.8 ppm), three 13C resonances and four 1H are assigned to one Ar ring. One degree of unsaturation remains and is a ring. Step 3: Symmetry is apparent in the 13C NMR (9 lines = 13 C). So remaining 6 lines = 7C.
A
A3 lines = 6 C
BA ab c
d
4 lines
AA ab
2 lines
A
B6 lines
ab
4 lines
A
A
A
B
cd
6 lines
A
A3 lines
ab c
# Predicted 13C lines:
Step 4: 1H Spin System. We notice that the remaining symmetry shows up as two equivalent diastereotopic CH2 groups in the structure below:
c
d
e
a,b
f
4.30
3.72
3.56
7.29
1.30
q, 2H, J = 7.1 Hz
d, 2H, J = 16.1 Hz
d, 2H, J = 16.1 Hz
m, 4H
t, 3H, J = 7.1 Hz
two equivalentdiastereotopic methylenesO
O
CN
(c) (f)Hd
Hc
HcHd
Jgem = 16.1 Hz
Three interesting features of the spectra of this molecule: 1. If we had not realized that the unknown contained a cyano group,we would have counted four Ar carbons and probably thought it was para-disubstituted. 2. The two diastereotopic CH2 groups and the 1:3:3:1 ethyl quartetshow a peculiar similarity at first glance. This can be understood by the degree of leaning in an AB system (see Spin Coupling Chapter). 3. The four aromatic protons of a symmetrical ortho-disubstitutedbenzene derivative of this sort show a classic AA’BB’ pattern.