Embed Size (px)
Citation preview
Table of Contents
2017 Abortion Statistics
December 2018
HD0344P
2017 Abortion Statistics Pennsylvania Department of Health 1
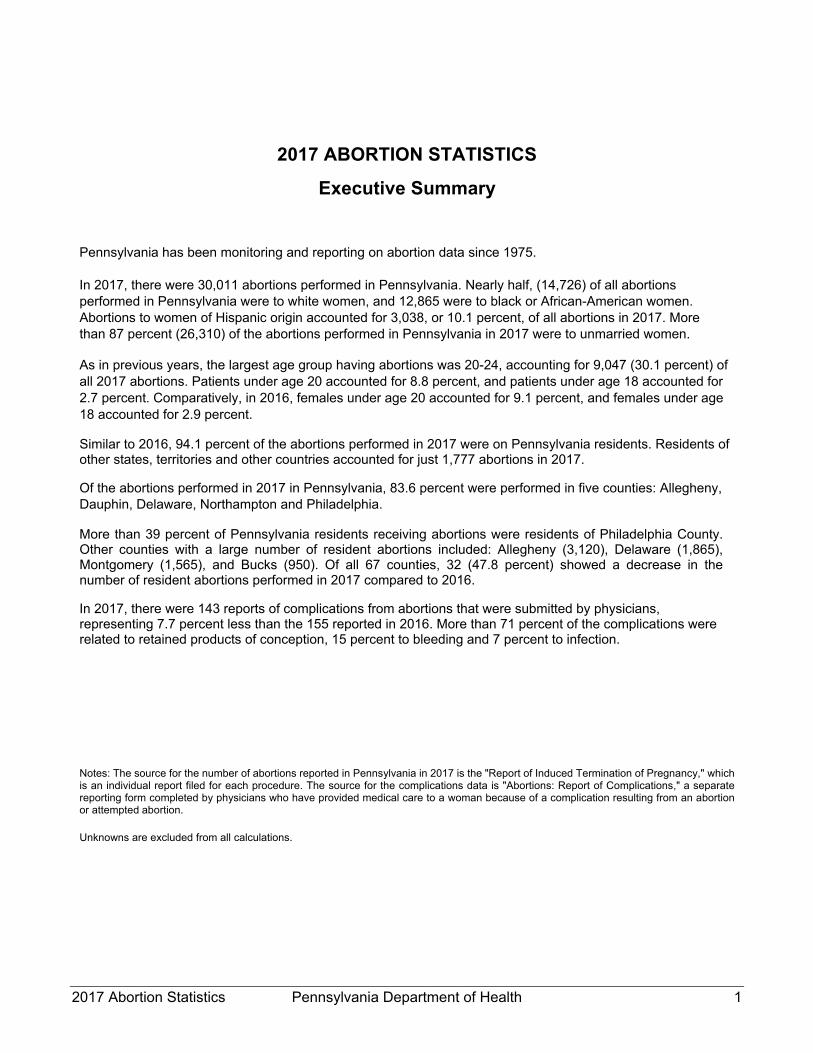
2017 ABORTION STATISTICS
Executive Summary
Pennsylvania has been monitoring and reporting on abortion data since 1975. In 2017, there were 30,011 abortions performed in Pennsylvania. Nearly half, (14,726) of all abortions performed in Pennsylvania were to white women, and 12,865 were to black or African-American women. Abortions to women of Hispanic origin accounted for 3,038, or 10.1 percent, of all abortions in 2017. More than 87 percent (26,310) of the abortions performed in Pennsylvania in 2017 were to unmarried women.
As in previous years, the largest age group having abortions was 20-24, accounting for 9,047 (30.1 percent) of all 2017 abortions. Patients under age 20 accounted for 8.8 percent, and patients under age 18 accounted for 2.7 percent. Comparatively, in 2016, females under age 20 accounted for 9.1 percent, and females under age 18 accounted for 2.9 percent.
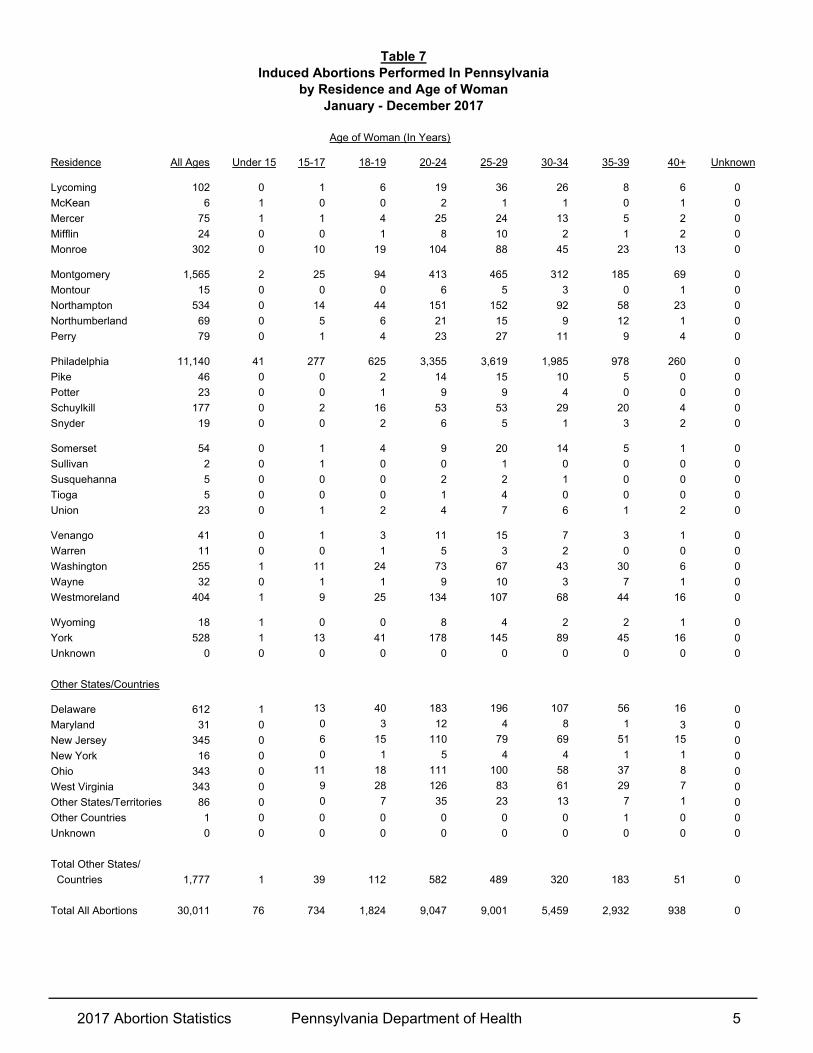
Similar to 2016, 94.1 percent of the abortions performed in 2017 were on Pennsylvania residents. Residents of other states, territories and other countries accounted for just 1,777 abortions in 2017.
Of the abortions performed in 2017 in Pennsylvania, 83.6 percent were performed in five counties: Allegheny, Dauphin, Delaware, Northampton and Philadelphia.
More than 39 percent of Pennsylvania residents receiving abortions were residents of Philadelphia County. Other counties with a large number of resident abortions included: Allegheny (3,120), Delaware (1,865), Montgomery (1,565), and Bucks (950). Of all 67 counties, 32 (47.8 percent) showed a decrease in the number of resident abortions performed in 2017 compared to 2016.
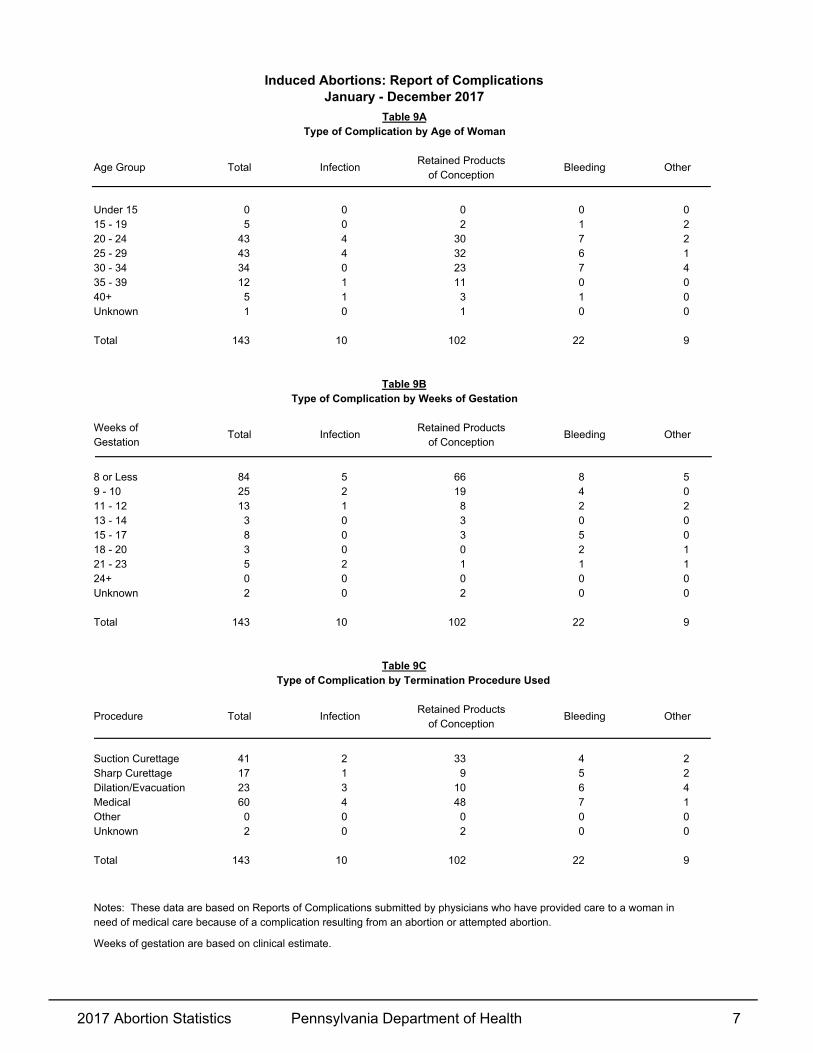
In 2017, there were 143 reports of complications from abortions that were submitted by physicians, representing 7.7 percent less than the 155 reported in 2016. More than 71 percent of the complications were related to retained products of conception, 15 percent to bleeding and 7 percent to infection.
Notes: The source for the number of abortions reported in Pennsylvania in 2017 is the "Report of Induced Termination of Pregnancy," which is an individual report filed for each procedure. The source for the complications data is "Abortions: Report of Complications," a separate reporting form completed by physicians who have provided medical care to a woman because of a complication resulting from an abortion or attempted abortion.
Unknowns are excluded from all calculations.
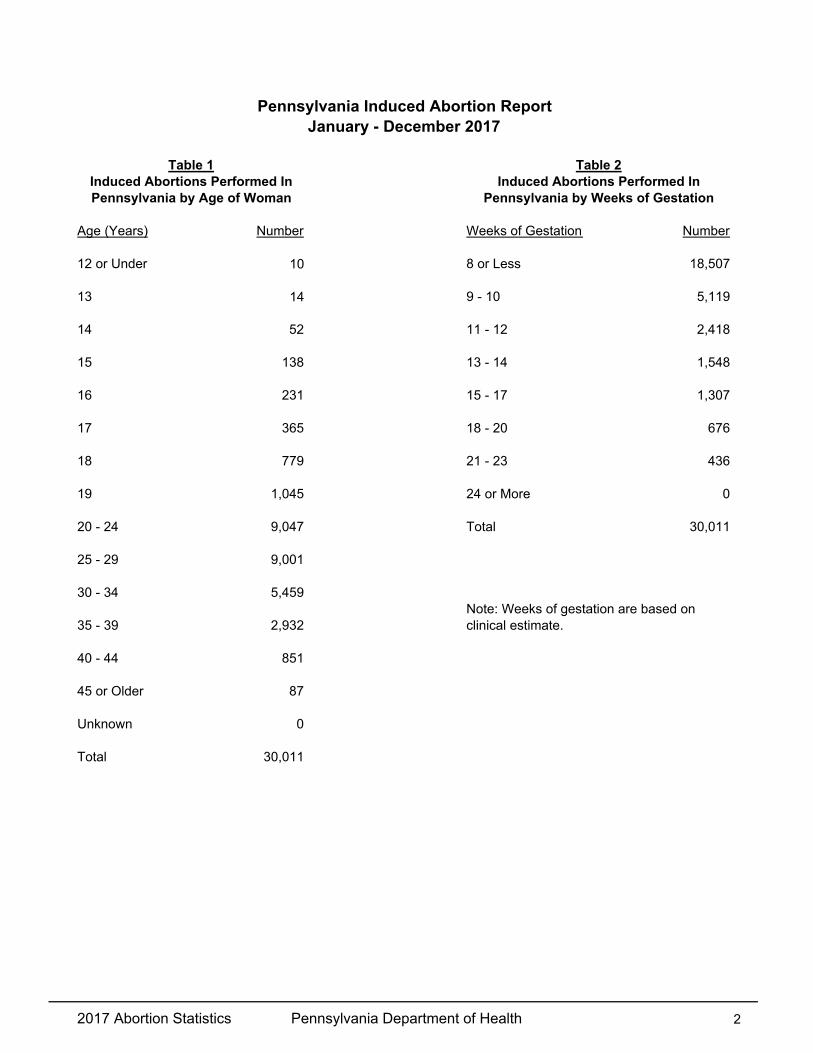
Age (Years) Number Weeks of Gestation Number
12 or Under 10 8 or Less 18,507
13 14 9 - 10 5,119
14 52 11 - 12 2,418
15 138 13 - 14 1,548
16 231 15 - 17 1,307
17 365 18 - 20 676
18 779 21 - 23 436
19 1,045 24 or More 0
20 - 24 9,047 Total 30,011
25 - 29 9,001
30 - 34 5,459Note: Weeks of gestation are based on
35 - 39 2,932 clinical estimate.
40 - 44 851
45 or Older 87
Unknown 0
Total 30,011
January - December 2017Pennsylvania Induced Abortion Report
Pennsylvania by Weeks of GestationInduced Abortions Performed In
Pennsylvania by Age of WomanInduced Abortions Performed In
Table 1 Table 2
2017 Abortion Statistics Pennsylvania Department of Health 2
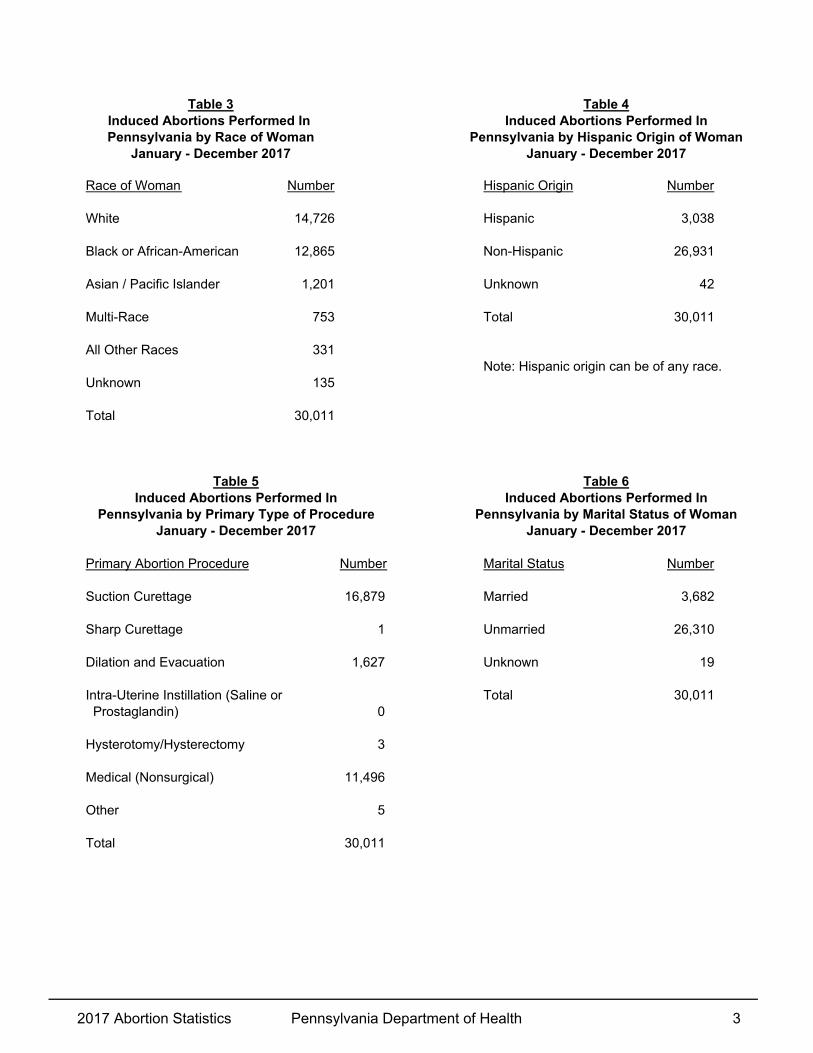
Race of Woman Number Hispanic Origin Number
White 14,726 Hispanic 3,038
Black or African-American 12,865 Non-Hispanic 26,931
Asian / Pacific Islander 1,201 Unknown 42
Multi-Race 753 Total 30,011
All Other Races 331Note: Hispanic origin can be of any race.
Unknown 135
Total 30,011
Primary Abortion Procedure Number Marital Status Number
Suction Curettage 16,879 Married 3,682
Sharp Curettage 1 Unmarried 26,310
Dilation and Evacuation 1,627 Unknown 19
Intra-Uterine Instillation (Saline or Total 30,011 Prostaglandin) 0
Hysterotomy/Hysterectomy 3
Medical (Nonsurgical) 11,496
Other 5
Total 30,011
January - December 2017Pennsylvania by Marital Status of Woman
Induced Abortions Performed In
January - December 2017Pennsylvania by Primary Type of Procedure
Induced Abortions Performed In
Table 3
Table 5
Table 4
Table 6
January - December 2017Pennsylvania by Hispanic Origin of Woman
Induced Abortions Performed In
January - December 2017Pennsylvania by Race of WomanInduced Abortions Performed In
2017 Abortion Statistics Pennsylvania Department of Health 3

Age of Woman (In Years)
Residence All Ages Under 15 15-17 18-19 20-24 25-29 30-34 35-39 40+ Unknown
Total Pennsylvania 28,234 75 695 1,712 8,465 8,512 5,139 2,749 887 0
Adams 62 0 1 6 23 16 11 3 2 0
Allegheny 3,120 10 100 173 920 954 562 301 100 0
Armstrong 51 0 1 3 19 13 9 4 2 0
Beaver 232 1 3 12 78 66 40 30 2 0
Bedford 20 0 1 1 7 4 7 0 0 0
Berks 796 0 26 57 247 232 128 81 25 0
Blair 105 0 2 10 29 25 30 9 0 0
Bradford 2 0 0 0 0 0 0 1 1 0
Bucks 950 2 22 60 268 238 198 121 41 0
Butler 158 0 5 8 49 54 13 18 11 0
Cambria 134 0 5 16 47 33 15 10 8 0
Cameron 5 0 0 0 1 0 2 2 0 0
Carbon 82 0 2 7 21 17 23 5 7 0
Centre 149 0 1 9 73 29 24 10 3 0
Chester 820 0 17 54 223 249 151 87 39 0
Clarion 29 0 1 5 10 8 3 1 1 0
Clearfield 54 1 3 2 13 14 13 6 2 0
Clinton 28 0 1 1 11 4 5 4 2 0
Columbia 64 0 0 7 30 18 8 1 0 0
Crawford 47 0 1 4 17 11 9 3 2 0
Cumberland 287 0 1 19 81 79 62 32 13 0
Dauphin 585 1 13 33 177 175 99 68 19 0
Delaware 1,865 4 40 101 549 508 401 194 68 0
Elk 24 0 0 0 10 10 2 1 1 0
Erie 184 0 7 14 47 62 27 21 6 0
Fayette 178 0 9 13 61 41 26 22 6 0
Forest 5 0 0 0 0 5 0 0 0 0
Franklin 24 0 1 3 5 6 5 3 1 0
Fulton 4 0 0 0 0 3 0 0 1 0
Greene 41 1 1 3 11 10 8 6 1 0
Huntingdon 21 0 0 4 5 7 2 1 2 0
Indiana 83 0 1 14 39 11 11 6 1 0
Jefferson 32 0 1 1 12 9 4 3 2 0
Juniata 15 0 0 1 6 4 3 1 0 0
Lackawanna 334 0 7 18 109 89 65 32 14 0
Lancaster 541 1 16 31 157 163 96 53 24 0
Lawrence 101 1 3 4 33 27 19 10 4 0
Lebanon 138 0 1 13 44 36 24 16 4 0
Lehigh 827 0 17 53 255 240 157 79 26 0
Luzerne 483 4 11 27 135 133 99 60 14 0
(Continued)
Table 7Induced Abortions Performed In Pennsylvania
by Residence and Age of WomanJanuary - December 2017
2017 Abortion Statistics Pennsylvania Department of Health 4
Age of Woman (In Years)
Residence All Ages Under 15 15-17 18-19 20-24 25-29 30-34 35-39 40+ Unknown
Lycoming 102 0 1 6 19 36 26 8 6 0
McKean 6 1 0 0 2 1 1 0 1 0
Mercer 75 1 1 4 25 24 13 5 2 0
Mifflin 24 0 0 1 8 10 2 1 2 0
Monroe 302 0 10 19 104 88 45 23 13 0
Montgomery 1,565 2 25 94 413 465 312 185 69 0
Montour 15 0 0 0 6 5 3 0 1 0
Northampton 534 0 14 44 151 152 92 58 23 0
Northumberland 69 0 5 6 21 15 9 12 1 0
Perry 79 0 1 4 23 27 11 9 4 0
Philadelphia 11,140 41 277 625 3,355 3,619 1,985 978 260 0
Pike 46 0 0 2 14 15 10 5 0 0
Potter 23 0 0 1 9 9 4 0 0 0
Schuylkill 177 0 2 16 53 53 29 20 4 0
Snyder 19 0 0 2 6 5 1 3 2 0
Somerset 54 0 1 4 9 20 14 5 1 0
Sullivan 2 0 1 0 0 1 0 0 0 0
Susquehanna 5 0 0 0 2 2 1 0 0 0
Tioga 5 0 0 0 1 4 0 0 0 0
Union 23 0 1 2 4 7 6 1 2 0
Venango 41 0 1 3 11 15 7 3 1 0
Warren 11 0 0 1 5 3 2 0 0 0
Washington 255 1 11 24 73 67 43 30 6 0
Wayne 32 0 1 1 9 10 3 7 1 0
Westmoreland 404 1 9 25 134 107 68 44 16 0
Wyoming 18 1 0 0 8 4 2 2 1 0
York 528 1 13 41 178 145 89 45 16 0
Unknown 0 0 0 0 0 0 0 0 0 0
Other States/Countries
Delaware 612 1 13 40 183 196 107 56 16 0
Maryland 31 0 0 3 12 4 8 1 3 0
New Jersey 345 0 6 15 110 79 69 51 15 0
New York 16 0 0 1 5 4 4 1 1 0
Ohio 343 0 11 18 111 100 58 37 8 0
West Virginia 343 0 9 28 126 83 61 29 7 0
Other States/Territories 86 0 0 7 35 23 13 7 1 0
Other Countries 1 0 0 0 0 0 0 1 0 0
Unknown 0 0 0 0 0 0 0 0 0 0
Total Other States/
Countries 1,777 1 39 112 582 489 320 183 51 0
Total All Abortions 30,011 76 734 1,824 9,047 9,001 5,459 2,932 938 0
Table 7Induced Abortions Performed In Pennsylvania
by Residence and Age of WomanJanuary - December 2017
2017 Abortion Statistics Pennsylvania Department of Health 5
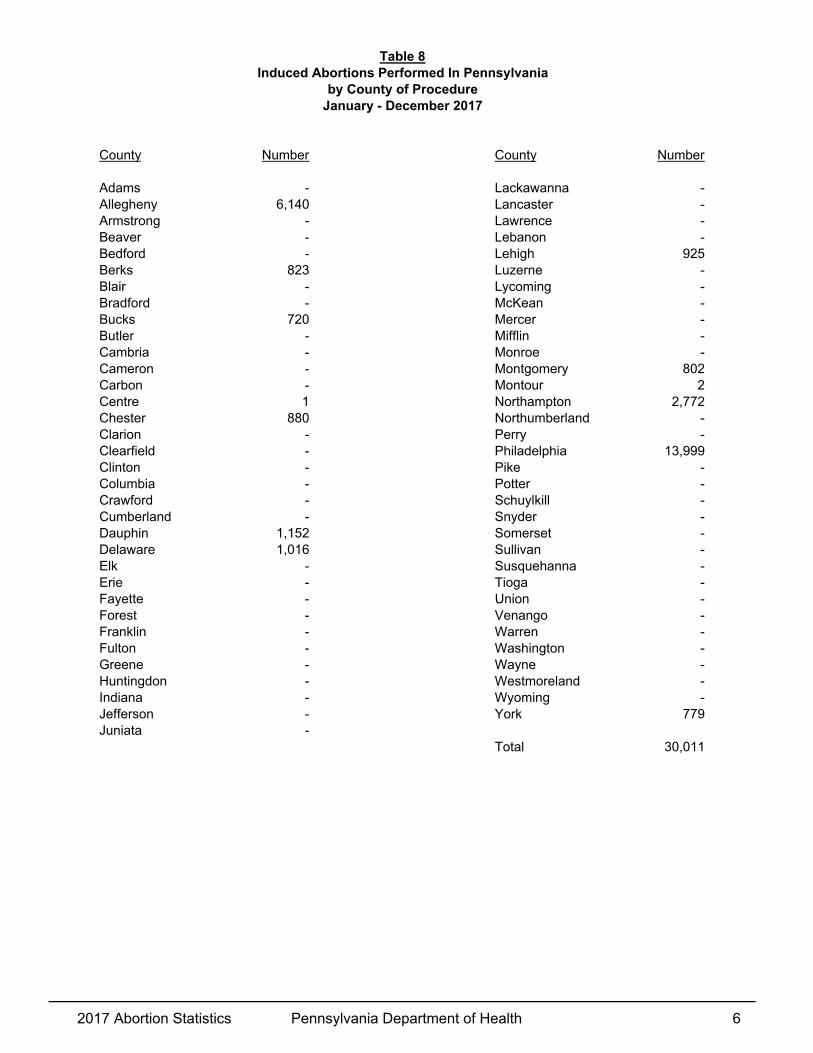
County Number County Number
Adams - Lackawanna -Allegheny 6,140 Lancaster -Armstrong - Lawrence -Beaver - Lebanon -Bedford - Lehigh 925Berks 823 Luzerne -Blair - Lycoming -Bradford - McKean -Bucks 720 Mercer -Butler - Mifflin -Cambria - Monroe -Cameron - Montgomery 802Carbon - Montour 2Centre 1 Northampton 2,772Chester 880 Northumberland -Clarion - Perry -Clearfield - Philadelphia 13,999Clinton - Pike -Columbia - Potter -Crawford - Schuylkill -Cumberland - Snyder -Dauphin 1,152 Somerset -Delaware 1,016 Sullivan -Elk - Susquehanna -Erie - Tioga -Fayette - Union -Forest - Venango -Franklin - Warren -Fulton - Washington -Greene - Wayne -Huntingdon - Westmoreland -Indiana - Wyoming -Jefferson - York 779Juniata -
Total 30,011
January - December 2017by County of Procedure
Induced Abortions Performed In PennsylvaniaTable 8
2017 Abortion Statistics Pennsylvania Department of Health 6
Retained Productsof Conception
Under 15 0 0 0 0 015 - 19 5 0 2 1 220 - 24 43 4 30 7 225 - 29 43 4 32 6 130 - 34 34 0 23 7 435 - 39 12 1 11 0 040+ 5 1 3 1 0Unknown 1 0 1 0 0
Total 143 10 102 22 9
Weeks of Retained ProductsGestation of Conception
8 or Less 84 5 66 8 59 - 10 25 2 19 4 011 - 12 13 1 8 2 213 - 14 3 0 3 0 015 - 17 8 0 3 5 018 - 20 3 0 0 2 121 - 23 5 2 1 1 124+ 0 0 0 0 0Unknown 2 0 2 0 0
Total 143 10 102 22 9
Retained Productsof Conception
Suction Curettage 41 2 33 4 2Sharp Curettage 17 1 9 5 2Dilation/Evacuation 23 3 10 6 4Medical 60 4 48 7 1Other 0 0 0 0 0Unknown 2 0 2 0 0
Total 143 10 102 22 9
Notes: These data are based on Reports of Complications submitted by physicians who have provided care to a woman inneed of medical care because of a complication resulting from an abortion or attempted abortion.
Weeks of gestation are based on clinical estimate.
January - December 2017Induced Abortions: Report of Complications
OtherBleedingInfectionTotalAge Group
Type of Complication by Age of WomanTable 9A
Table 9B
Table 9C
Type of Complication by Weeks of Gestation
Type of Complication by Termination Procedure Used
Total Infection Bleeding OtherProcedure
Total Infection Bleeding Other
2017 Abortion Statistics Pennsylvania Department of Health 7
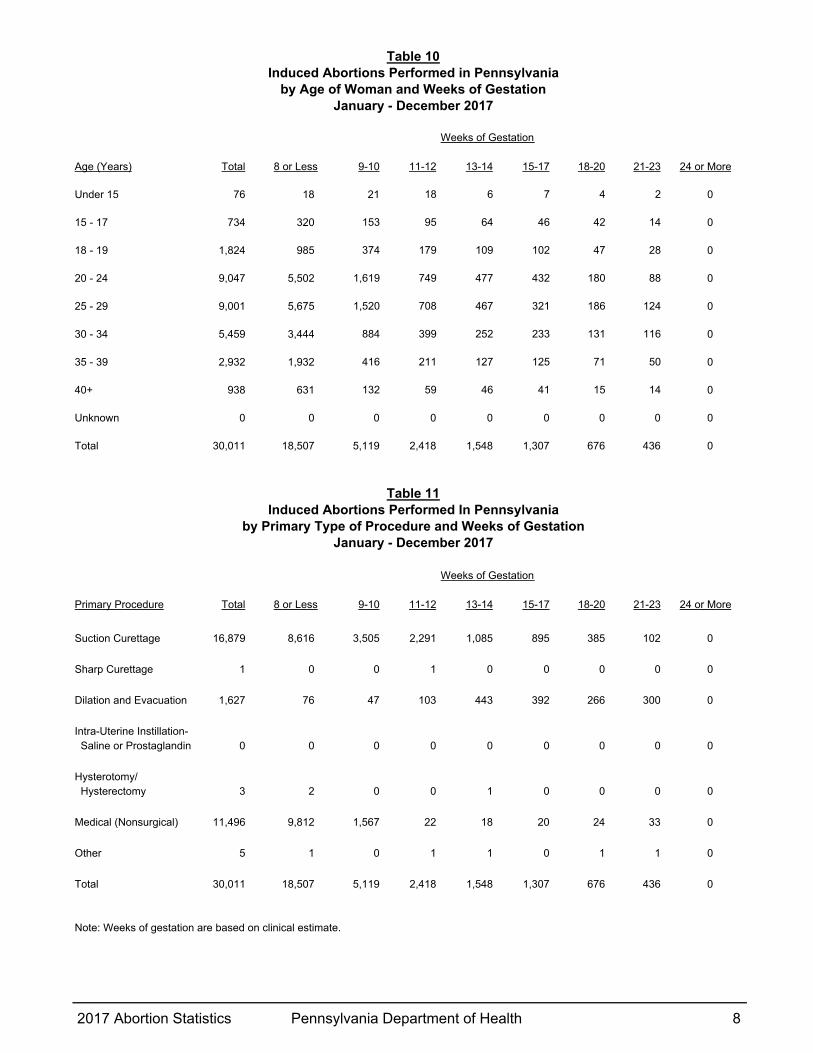
Weeks of Gestation
Age (Years) Total 8 or Less 9-10 11-12 13-14 15-17 18-20 21-23 24 or More
Under 15 76 18 21 18 6 7 4 2 0
15 - 17 734 320 153 95 64 46 42 14 0
18 - 19 1,824 985 374 179 109 102 47 28 0
20 - 24 9,047 5,502 1,619 749 477 432 180 88 0
25 - 29 9,001 5,675 1,520 708 467 321 186 124 0
30 - 34 5,459 3,444 884 399 252 233 131 116 0
35 - 39 2,932 1,932 416 211 127 125 71 50 0
40+ 938 631 132 59 46 41 15 14 0
Unknown 0 0 0 0 0 0 0 0 0
Total 30,011 18,507 5,119 2,418 1,548 1,307 676 436 0
Weeks of Gestation
Primary Procedure Total 8 or Less 9-10 11-12 13-14 15-17 18-20 21-23 24 or More
Suction Curettage 16,879 8,616 3,505 2,291 1,085 895 385 102 0
Sharp Curettage 1 0 0 1 0 0 0 0 0
Dilation and Evacuation 1,627 76 47 103 443 392 266 300 0
Intra-Uterine Instillation- Saline or Prostaglandin 0 0 0 0 0 0 0 0 0
Hysterotomy/ Hysterectomy 3 2 0 0 1 0 0 0 0
Medical (Nonsurgical) 11,496 9,812 1,567 22 18 20 24 33 0
Other 5 1 0 1 1 0 1 1 0
Total 30,011 18,507 5,119 2,418 1,548 1,307 676 436 0
Note: Weeks of gestation are based on clinical estimate.
January - December 2017by Primary Type of Procedure and Weeks of Gestation
Induced Abortions Performed In Pennsylvania
Table 10
Table 11
January - December 2017by Age of Woman and Weeks of Gestation
Induced Abortions Performed in Pennsylvania
2017 Abortion Statistics Pennsylvania Department of Health 8
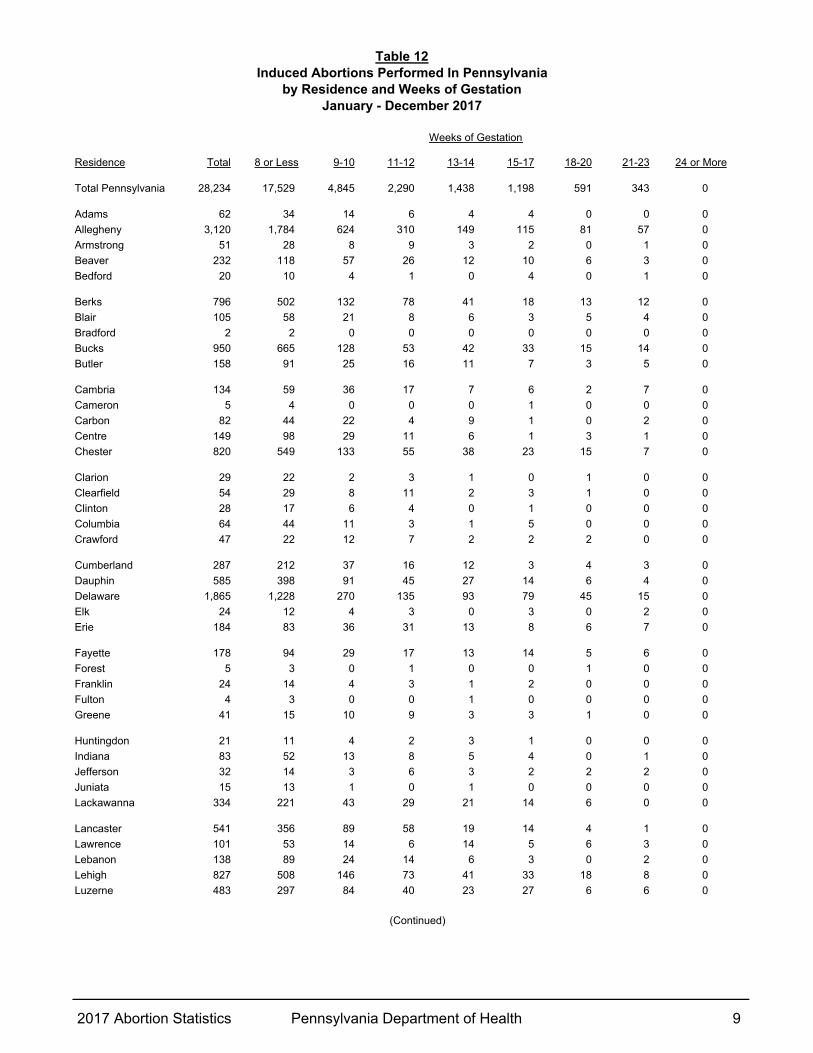
Weeks of Gestation
Residence Total 8 or Less 9-10 11-12 13-14 15-17 18-20 21-23 24 or More
Total Pennsylvania 28,234 17,529 4,845 2,290 1,438 1,198 591 343 0
Adams 62 34 14 6 4 4 0 0 0
Allegheny 3,120 1,784 624 310 149 115 81 57 0
Armstrong 51 28 8 9 3 2 0 1 0
Beaver 232 118 57 26 12 10 6 3 0
Bedford 20 10 4 1 0 4 0 1 0
Berks 796 502 132 78 41 18 13 12 0
Blair 105 58 21 8 6 3 5 4 0
Bradford 2 2 0 0 0 0 0 0 0
Bucks 950 665 128 53 42 33 15 14 0
Butler 158 91 25 16 11 7 3 5 0
Cambria 134 59 36 17 7 6 2 7 0
Cameron 5 4 0 0 0 1 0 0 0
Carbon 82 44 22 4 9 1 0 2 0
Centre 149 98 29 11 6 1 3 1 0
Chester 820 549 133 55 38 23 15 7 0
Clarion 29 22 2 3 1 0 1 0 0
Clearfield 54 29 8 11 2 3 1 0 0
Clinton 28 17 6 4 0 1 0 0 0
Columbia 64 44 11 3 1 5 0 0 0
Crawford 47 22 12 7 2 2 2 0 0
Cumberland 287 212 37 16 12 3 4 3 0
Dauphin 585 398 91 45 27 14 6 4 0
Delaware 1,865 1,228 270 135 93 79 45 15 0
Elk 24 12 4 3 0 3 0 2 0
Erie 184 83 36 31 13 8 6 7 0
Fayette 178 94 29 17 13 14 5 6 0
Forest 5 3 0 1 0 0 1 0 0
Franklin 24 14 4 3 1 2 0 0 0
Fulton 4 3 0 0 1 0 0 0 0
Greene 41 15 10 9 3 3 1 0 0
Huntingdon 21 11 4 2 3 1 0 0 0
Indiana 83 52 13 8 5 4 0 1 0
Jefferson 32 14 3 6 3 2 2 2 0
Juniata 15 13 1 0 1 0 0 0 0
Lackawanna 334 221 43 29 21 14 6 0 0
Lancaster 541 356 89 58 19 14 4 1 0
Lawrence 101 53 14 6 14 5 6 3 0
Lebanon 138 89 24 14 6 3 0 2 0
Lehigh 827 508 146 73 41 33 18 8 0
Luzerne 483 297 84 40 23 27 6 6 0
Table 12
(Continued)
January - December 2017by Residence and Weeks of Gestation
Induced Abortions Performed In Pennsylvania
2017 Abortion Statistics Pennsylvania Department of Health 9
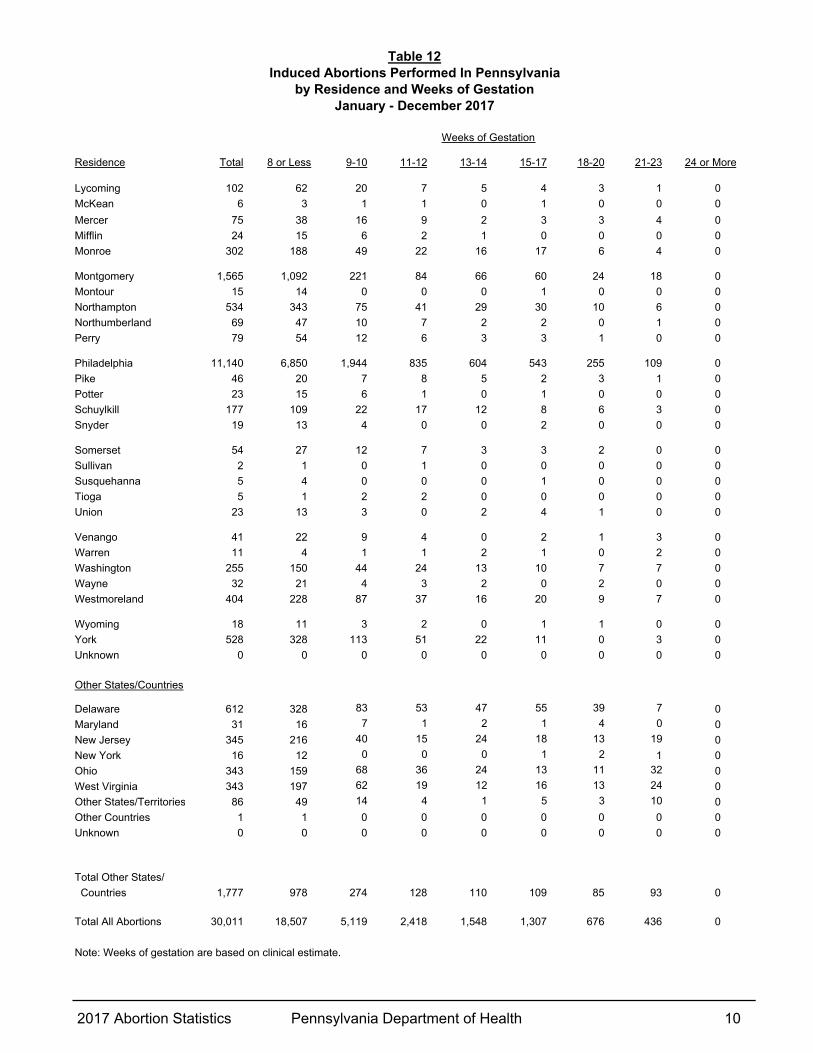
Weeks of Gestation
Residence Total 8 or Less 9-10 11-12 13-14 15-17 18-20 21-23 24 or More
Lycoming 102 62 20 7 5 4 3 1 0
McKean 6 3 1 1 0 1 0 0 0
Mercer 75 38 16 9 2 3 3 4 0
Mifflin 24 15 6 2 1 0 0 0 0
Monroe 302 188 49 22 16 17 6 4 0
Montgomery 1,565 1,092 221 84 66 60 24 18 0
Montour 15 14 0 0 0 1 0 0 0
Northampton 534 343 75 41 29 30 10 6 0
Northumberland 69 47 10 7 2 2 0 1 0
Perry 79 54 12 6 3 3 1 0 0
Philadelphia 11,140 6,850 1,944 835 604 543 255 109 0
Pike 46 20 7 8 5 2 3 1 0
Potter 23 15 6 1 0 1 0 0 0
Schuylkill 177 109 22 17 12 8 6 3 0
Snyder 19 13 4 0 0 2 0 0 0
Somerset 54 27 12 7 3 3 2 0 0
Sullivan 2 1 0 1 0 0 0 0 0
Susquehanna 5 4 0 0 0 1 0 0 0
Tioga 5 1 2 2 0 0 0 0 0
Union 23 13 3 0 2 4 1 0 0
Venango 41 22 9 4 0 2 1 3 0
Warren 11 4 1 1 2 1 0 2 0
Washington 255 150 44 24 13 10 7 7 0
Wayne 32 21 4 3 2 0 2 0 0
Westmoreland 404 228 87 37 16 20 9 7 0
Wyoming 18 11 3 2 0 1 1 0 0
York 528 328 113 51 22 11 0 3 0
Unknown 0 0 0 0 0 0 0 0 0
Other States/Countries
Delaware 612 328 83 53 47 55 39 7 0
Maryland 31 16 7 1 2 1 4 0 0
New Jersey 345 216 40 15 24 18 13 19 0
New York 16 12 0 0 0 1 2 1 0
Ohio 343 159 68 36 24 13 11 32 0
West Virginia 343 197 62 19 12 16 13 24 0
Other States/Territories 86 49 14 4 1 5 3 10 0
Other Countries 1 1 0 0 0 0 0 0 0
Unknown 0 0 0 0 0 0 0 0 0
Total Other States/
Countries 1,777 978 274 128 110 109 85 93 0
Total All Abortions 30,011 18,507 5,119 2,418 1,548 1,307 676 436 0
Note: Weeks of gestation are based on clinical estimate.
Induced Abortions Performed In Pennsylvaniaby Residence and Weeks of Gestation
January - December 2017
Table 12
2017 Abortion Statistics Pennsylvania Department of Health 10
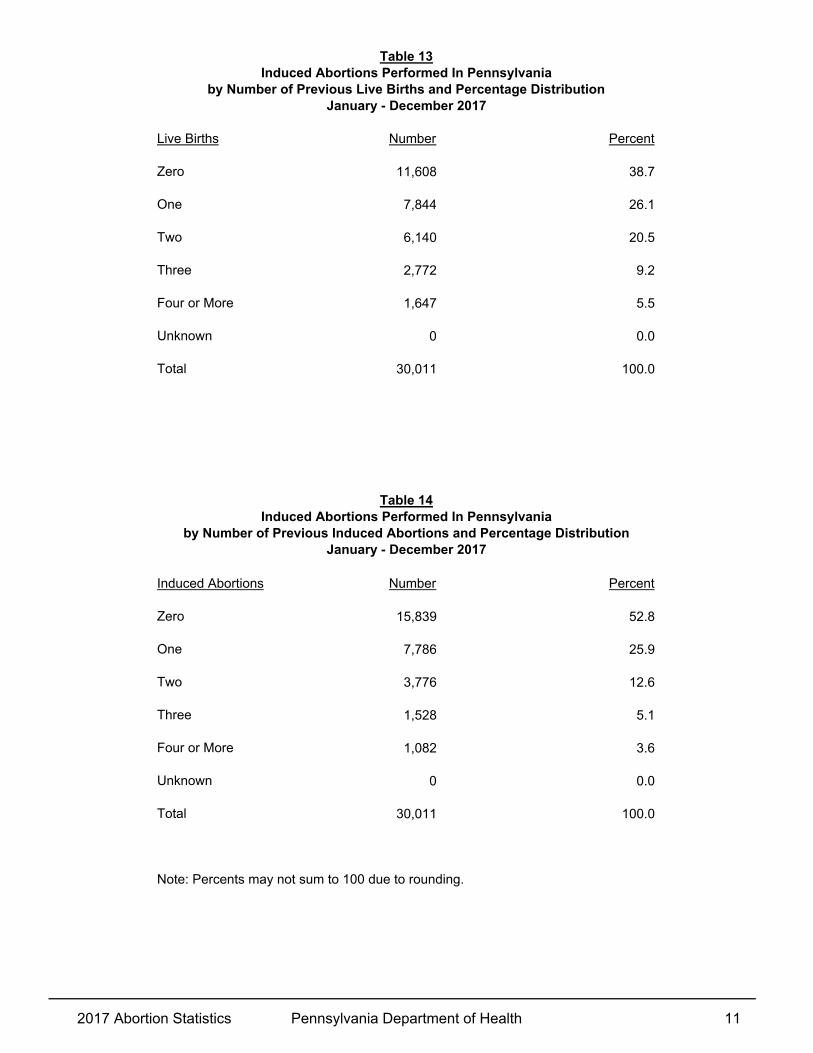
Live Births Number Percent
Zero 11,608 38.7
One 7,844 26.1
Two 6,140 20.5
Three 2,772 9.2
Four or More 1,647 5.5
Unknown 0 0.0
Total 30,011 100.0
Induced Abortions Number Percent
Zero 15,839 52.8
One 7,786 25.9
Two 3,776 12.6
Three 1,528 5.1
Four or More 1,082 3.6
Unknown 0 0.0
Total 30,011 100.0
Note: Percents may not sum to 100 due to rounding.
January - December 2017by Number of Previous Induced Abortions and Percentage Distribution
Induced Abortions Performed In Pennsylvania
Table 13
Table 14
Induced Abortions Performed In Pennsylvaniaby Number of Previous Live Births and Percentage Distribution
January - December 2017
2017 Abortion Statistics Pennsylvania Department of Health 11
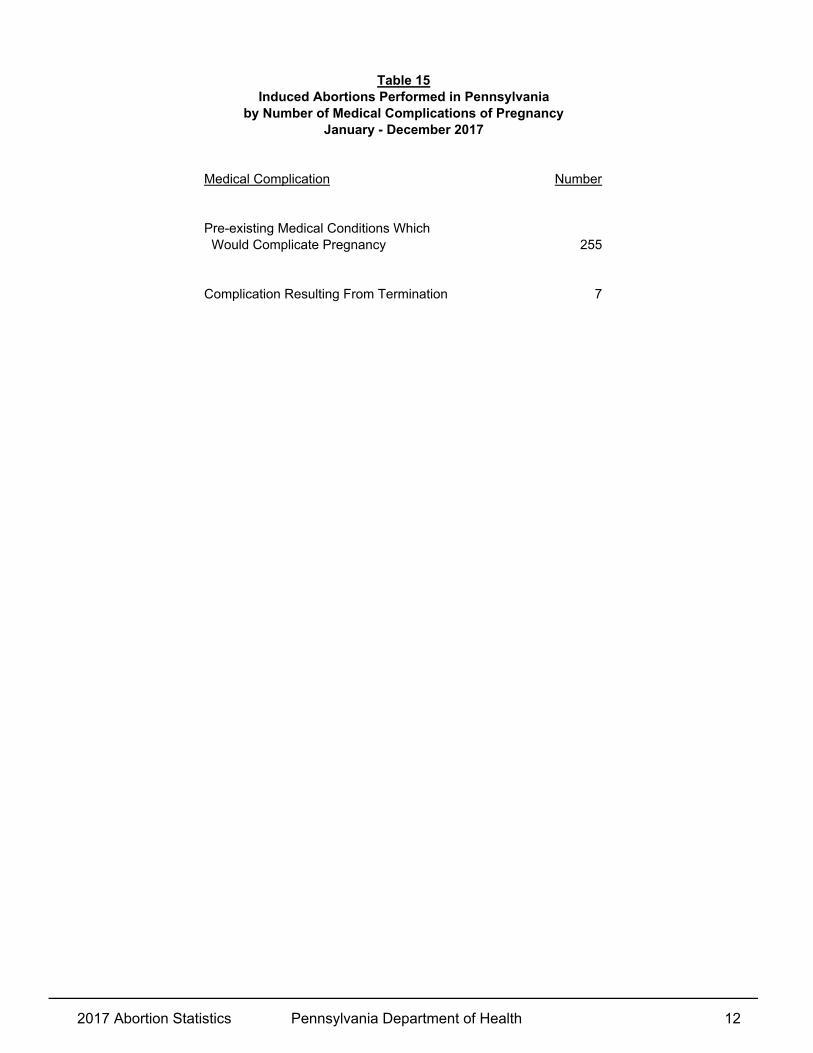
Medical Complication Number
Pre-existing Medical Conditions Which Would Complicate Pregnancy 255
Complication Resulting From Termination 7
January - December 2017by Number of Medical Complications of Pregnancy
Induced Abortions Performed in PennsylvaniaTable 15
2017 Abortion Statistics Pennsylvania Department of Health 12