Embed Size (px)
Citation preview
2 0 1 6 A N N U A L R E P O R T
2016A N N U A L R E P O R TF I E L D T O C O N S U M E R

2 0 1 6 A N N U A L R E P O R TF I E L D T O C O N S U M E R
2 0 1 6 A N N U A L R E P O R T | F I E L D T O C O N S U M E R
2 0 1 6 A N N U A L R E P O R TF I E L D T O C O N S U M E R
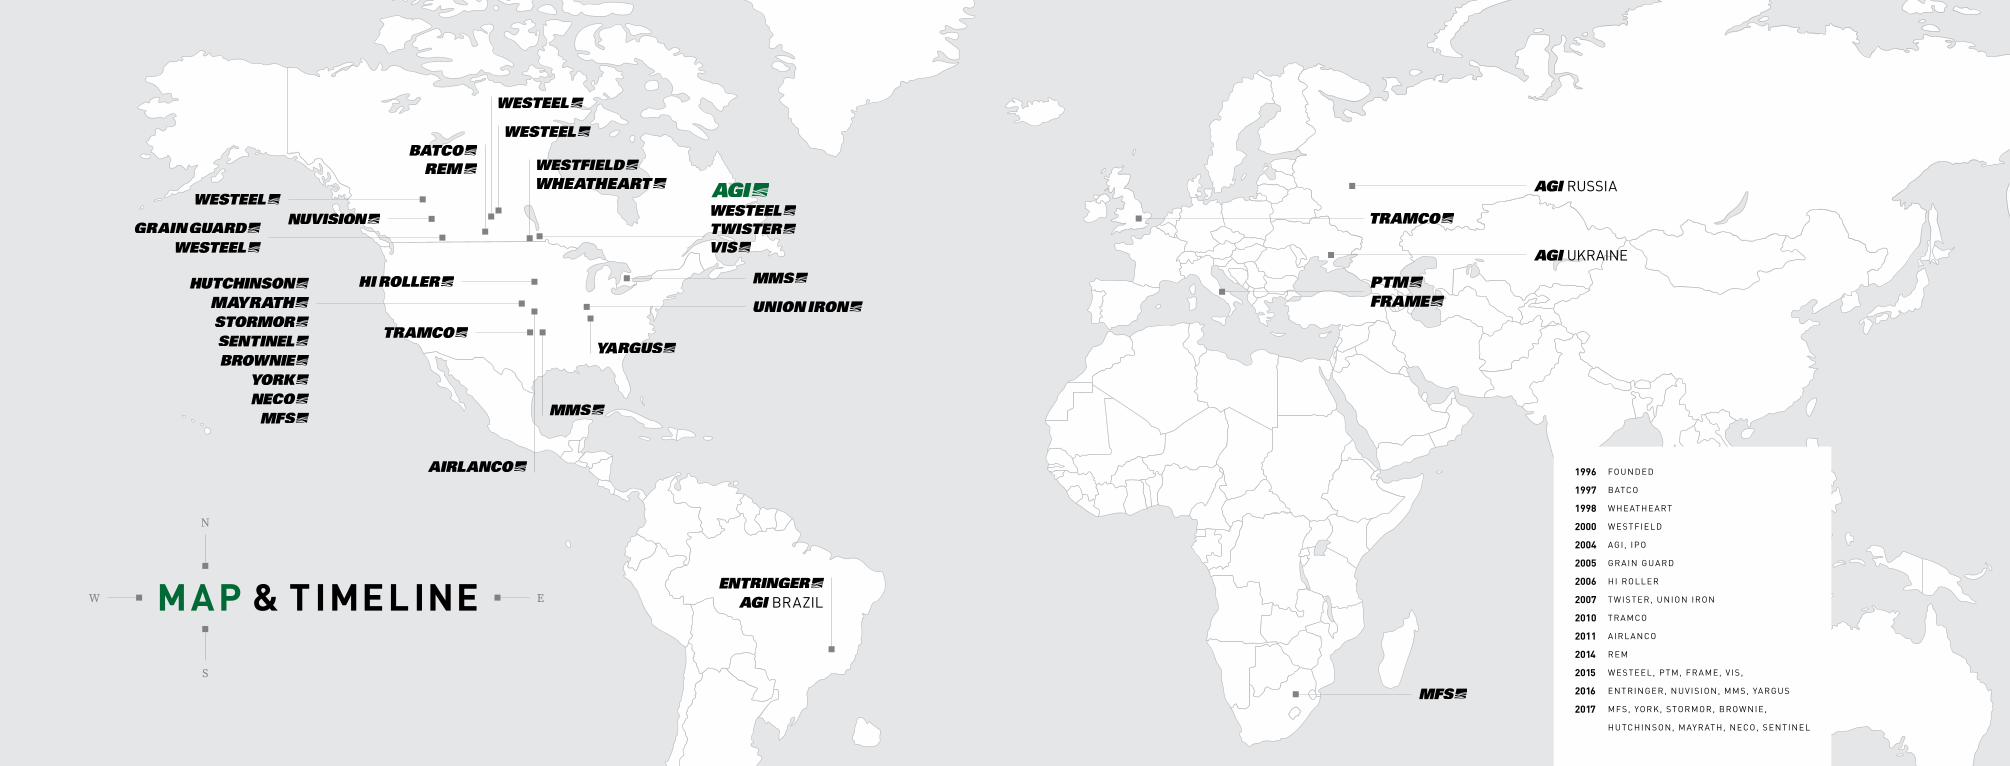
AGI BRAZIL
AGI RUSSIA
AGI UKRAINE
1996 FOUNDED
1997 BATCO
1998 WHEATHEART
2000 WESTFIELD
2004 AGI , IPO
2005 GRAIN GUARD
2006 HI ROLLER
2007 TWISTER, UNION IRON
2010 TRAMCO
2011 AIRLANCO
2014 REM
2015 WESTEEL, PTM, FRAME, V IS ,
2016 ENTRINGER, NUVIS ION, MMS, YARGUS
2017 MFS, YORK, STORMOR, BROWNIE,
HUTCHINSON, MAYRATH, NECO, SENTINEL
MAP & T IMEL INE
N
S
EW
2 0 1 6 A N N U A L R E P O R TF I E L D T O C O N S U M E RC E O M E S S A G E C E O M E S S A G E
CEO’S MESSAGE
05 06
2016 Annual Report: CEO Message
The AGI story is one of change and growth. 2016 marks 20 years of steady and consistent growth in product lines, geographies, capabilities, people, sales and profitability. 2016 was also a year of momentum. Our pace of change and growth increased significantly throughout the year as we completed five acquisitions, sold two non-core businesses, launched our largest organic growth project in Brazil, and adapted our global organization to accommodate our increased scale and velocity of change. All of this on top of a long list of other strategic projects completed throughout AGI.
Scale and velocity, two themes that resonated with us in 2016, two themes that ultimately resulted in record sales and adjusted EBITDA in all four quarters. Scale and velocity together create momentum which, of course, can be positive or negative. In 2016, the contribution from our teams created significant, positive, sustainable momentum across our entire business. The momentum created in 2016 is the result of the hard work of great people across AGI. Our team grew substantially in 2016 and we are very pleased and proud to welcome our new team members to the AGI family. It is ultimately this expanding group of dedicated AGI team members working on twenty-five production floors,
and the sales teams and functional support groups around the world that determine our success going forward, and are responsible for creating and maintaining our lasting momentum.
While we celebrated our 20-year anniversary in 2016, AGI became a public company in 2004 with an IPO share price of $10. Since that date, we have returned $338 million to our shareholders in dividends and substantially grown our book value and market value while fulfilling our objective to become a leading provider of equipment and services to grain producers, traders and processors. We have had steady growth in sales, growing from $63 million in 2004 to $532 million in 2016 resulting in a CAGR of almost 20% over the 12 years since our IPO. Our growth in net income and book value have grown less quickly, with CAGR’s of 8% and 9%, respectively, and our focus going forward is to smooth and increase both metrics. Our adjusted EBITDA number, a useful reflection of our core earning power, has grown at a 16% CAGR since 2004 to a record $100 million in 2016 – 30% higher than our previous record. These metrics are strong for a small company subject to both the normal growing pains as well as the nuances of being an agriculture company susceptible to swings in weather and the corresponding impact on our regional markets. Our urgency for change and growth is to minimize the impact of regional weather and
AGIFOU NDED I N 1996
AGI is a leading manufacturerof grain and fertilizer handling, storage and conditioningequipment. Our brands are amongst the most recognizedin global agriculture in both Commercial and Farm sectors.We have manufacturing facilities in Canada, the UnitedStates, the United Kingdom, Brazil, Italy and South Africa and distribute our products globally.
The AGI catalog includes food process and conveyance equipment, design, manufacturing, installation and maintenance. Our product catalog includes portable handling equipment (augers, belt conveyors, grain vacs), permanent handling systems (bucket elevators, enclosed belt conveyors, structural) and storage and conditioning systems (bins/silos, aeration and drying) that service the grain, fuel biomass and fertilizer industries for on-farm and commercial operations.
2 0 1 6 A N N U A L R E P O R TF I E L D T O C O N S U M E RC E O M E S S A G E C E O M E S S A G E07 08
crop events by having exposure to the total investment in the vast global agriculture infrastructure. We believe that our urgency to change and grow will allow us to sustain and improve our growth metrics.
We frequently use adjusted EBITDA in our reporting because, as mentioned, we believe it provides a useful representation of the core earning power of our business. I want to assure you that we are focused on core cash generation and use the adjusted numbers for perspective and to make comparisons between periods more relevant. Each year tends to have many moving pieces but FX has been a sizeable adjustment in many years as we account for hedging contracts and the impact of translation. These hedging contracts have been both positive and negative over the years however we had substantial FX hedging losses in 2015 and 2016 as the USD jumped to current levels from a band much closer to par when the hedges were put in place. We have made changes to our hedging policies to reduce the use of long dated forward positions and we expect to substantially reduce these FX adjustments going forward.
There has been some talk of stock based compensation throughout North American markets recently. Stock based compensation is a key part of our culture as we encourage everyone in our business to have a sense of ownership in our business. People fundamentally behave differently as owners. We include stock based compensation in our adjusted EBITDA to best reflect earnings power. While there are many moving pieces, our goal is to minimize the adjustments going forward, and, as always, we will include a table detailing our adjustments.
As of the end of 2016 we had twenty-five operating teams at the businesses within AGI. Our culture is based on decentralized leadership combined with a structure meant to encourage entrepreneurial management of our businesses. This culture and structure is only possible with great people and leaders across the twenty-five groups. In 2016, our leaders and employees did a fantastic job while dealing with a tough year in agriculture in many areas around the world. We had fantastic results from businesses in both our Farm and Commercial groups. Of course, there were some businesses that saw reductions in results due to the softness in the US farm market, however these businesses remained focused on customers, products and service and,
through disciplined management, dealt with season to season changes while also maintaining our long-term commitment to our markets and customers.
Toward the end of 2015, we formally reorganized our business to have a Farm group and a Commercial group. This structure is meant to be very simple, and is based on providing value to our customers. How and what we sell to grain producers on the Farm side is different than how we best serve our Commercial customers who are moving that grain from the farm gate to end markets. Each AGI group must focus on adding value for our customers. A very simple concept that is often so difficult to put in place and execute on in any business. We like simple, we like to add value, and we believe this structure had a material impact on building the momentum we saw in 2016 and will contribute significantly to our performance going forward.
All five of our 2016 acquisitions were on the Commercial side of our business, providing balance to the sizeable investment we made in Westeel in 2015, which resides in our Farm group. We made substantial progress in building our fertilizer equipment platform. The additions of NuVision, Mitchell Mill Systems (Mitchell), and Yargus transformed our capabilities in fertilizer markets, positioning AGI as the leading provider in North America with unique, turnkey, design, manufacture, build capabilities for fertilizer facilities in Canada. We now have industry leading technology and products for handling and blending fertilizer. Fertilizer is a planting story and grain is a harvesting story, the combination of the two intrinsically linked markets brings material diversification to our demand drivers and cash flow profile. We have enormous growth potential in the fertilizer space globally as grain producers adopt precision agriculture technologies which facilitate very sophisticated use of all inputs. We will continue to invest in this platform and grow from a predominantly North American base to a diversified global business. We were very lucky to have VIS, NuVision, Mitchell, and Yargus join AGI to form our fertilizer platform and we never forget the trust that the founders of these companies have placed in AGI to carry on the goals, culture and legacy of these businesses.
The other two 2016 acquisitions were international businesses that expanded our reach to new markets and customers globally. In early
2016, we purchased the remaining 49% of Frame to bring 100% of this business and team into AGI. Frame is a grain bin manufacturer based in Italy and through this business we are selling into over fifteen incremental countries. Frame has performed very well and is positioned to continue to grow as we combine our other product lines and utilize Italy as a hub for managing our growth into Europe, the Middle East, North Africa and Asia. We are also very excited about our entry into Brazil in 2016. We purchased a relatively small company that brought us new products and a team of people with expertise in this complicated market. Immediately after closing our deal with Entringer we started building a greenfield manufacturing facility as our base in Brazil. This facility has been coming together throughout 2016 and 2017 and is on track for our scheduled commissioning in the second half of 2017. We assembled a team from across our businesses to bring best practices and decades of experience to this ambitious project. This team has done a fantastic job to plan and execute this engineering intensive project and has positioned AGI for decades of growth and success in South America. Brazil has a massive corn and soybean crop that is growing every year and is placing enormous stress on the country’s logistics infrastructure, resulting in significant problems that start with crop losses in transport, cascade to long delays in delivering the crop to domestic and international customers, and result in lost revenue and profit for our customers. We believe that there is incredible opportunity for Brazil to invest in, modernize and expand the nation’s seed, fertilizer, grain, and feed infrastructure to eliminate losses and realize the full potential of this agriculture based country.
As we move into 2017, we are working to maintain and build on the positive momentum we have across AGI. We are making substantial investments in our people and structure in every region and business because we know that investing in our people always pays off. A major component of our investment is focused on recognizing the importance of engineering across everything we do as designers and manufacturers of the equipment that forms the critical global infrastructures that facilitate the daily, global flow of bulk agriculture products. Engineering is at the heart of AGI and we are investing in the people and structure to ensure that our experience and expertise is translated into the confidence and value that our customers require.
Lastly, we are excited about the enormous potential for continued growth in AGI. AGI has grown from a focus on portable grain handling equipment 20 years ago to now being active in fertilizer, seed, grain, feed and food processing equipment. We are building and executing on strategies to grow in all five of these segments to continue to diversify, stabilize and build on our momentum. We now define our addressable markets as “Field to Consumer” as our growth has linked and created opportunities from the nutrients plants require, the seed being planted, to the feed and food being consumed by animals and people. The equipment required to facilitate the handling, conveyance, storage, treating and processing of the millions of tons of seed, fertilizer and grain is truly enormous and forms the critical backbone of the global infrastructure required to feed the world’s population. This is a theme that we will speak to frequently going forward as we expand our horizons and pursue our core growth and diversification strategy.
On behalf of the entire AGI team and Board of Directors we thank you, our shareholders, for the continued support.
Tim Close, Director, President and Chief Executive Officer
2 0 1 6 A N N U A L R E P O R TF I E L D T O C O N S U M E RM A N A G E M E N T ’ S D I S C U S S I O N & A N A L Y S I S M A N A G E M E N T ’ S D I S C U S S I O N & A N A L Y S I S
MANAGEMENT’S DISCUSSION & ANALYSIS
This Management’s Discussion and Analysis (“MD&A”) should be read in conjunction with the audited consolidated comparative financial statements and accompanying notes of Ag Growth International Inc. (“AGI”, the “Company”, “we”, “our” or “us”) for the year ended December 31, 2016. Results are reported in Canadian dollars unless otherwise stated.
The financial information contained in this MD&A has been prepared in accordance with International Financial Reporting Standards (“IFRS”). All dollar amounts are expressed in Canadian currency, unless otherwise noted.
Throughout this MD&A references are made to “trade sales”, “EBITDA”, “adjusted EBITDA”, “gross margin”, “funds from operations”, “payout ratio”, “adjusted profit” and “diluted adjusted profit per share”. A description of these measures and their limitations are discussed below under “Non-IFRS Measures”.
This MD&A contains forward-looking information. Please refer to the cautionary language under the heading “Risks and Uncertainties” and “Forward-Looking Information” in this MD&A and in our most recently filed Annual Information Form.
SUMMARY OF RESULTS
A summary of our operating results can be found below. A more detailed narrative is included later in this MD&A under “Explanation of Operating Results”.
[thousands of dollars, other than per share data] Year Ended December 31
2016$
2015$
Trade sales (1)(2) 546,616 438,910
Adjusted EBITDA (1)(2)(3) 100,429 73,337
Adjusted EBITDA % (1)(4) 18.4% 16.7%
Profit (loss) 19,306 (25,229)
Diluted profit (loss) per share 1.29 (1.81)
Adjusted profit (1) 36,545 32,490
Diluted adjusted profit per share (1)(5) 2.44 2.33
(1) See “Non-IFRS Measures”.(2) See “Basis of Presentation”.(3) See “Adjusted EBITDA”.(4) Adjusted EBITDA as a percentage of Trade Sales.(5) See “Diluted profit per share and Diluted adjusted profit per share” below in Summary of Results.
09 10
2 0 1 6 A N N U A L R E P O R TF I E L D T O C O N S U M E R
Trade sales and adjusted EBITDA were at record levels in 2016 as AGI continued to diversify its geographic and end market exposure through strategic acquisitions in Canada, the U.S., Brazil and Europe. AGI’s increased market presence in North America and offshore allowed the Company to benefit from an active Canadian Farm market, robust North American demand for Commercial grain handling equipment and strong demand for grain storage in Europe, Middle East and Africa (“EMEA”). Adjusted EBITDA from divisions acquired in 2015 and 2016 was $39.1 million (2015 - $8.4 million). Excluding acquisitions, AGI’s adjusted EBITDA decreased 6% as strength in the North American Commercial market was offset by a soft U.S. Farm market and lower international Commercial project sales. Profit and profit per share increased significantly over 2015 due largely to the higher adjusted EBITDA, a smaller loss on foreign exchange and a $9.2 million unrealized gain on the Company’s equity compensation swap.
BASIS OF PRESENTATION
Trade sales and adjusted EBITDA in both 2015 and 2016 exclude the results of former AGI divisions Applegate and Mepu as a strategic review of these assets resulted in their sale in 2016. See “Disposition of Applegate and Mepu Operations”.
To allow for improved comparability between 2015 and 2016, certain metrics including trade sales and adjusted EBITDA have been presented both before and after results from acquisitions made in 2015 and 2016. See “Acquisitions”.
TRADE SALES (SEE “NON-IFRS MEASURES” AND “BASIS OF PRESENTATION”)
Trade sales in Canada, excluding acquisitions, increased over 2015 as a strong Canadian Farm market resulted in higher sales of grain handling and aeration equipment while sales of Commercial handling equipment benefited from an expanding commercial infrastructure in Canada. Total trade sales in Canada increased significantly over the prior year as demand for Westeel storage equipment returned to more traditional levels following the 2015 drought. In addition, AGI significantly increased its presence in the fertilizer sector in 2016 and trade sales reflect strong demand for the design, equipment fabrication and installation of fertilizer handling and storage facilities.
In the United States, trade sales excluding acquisitions were flat compared to 2015 as strong demand for Commercial grain handling equipment offset the impact of a soft U.S. Farm market. Sales of grain handling equipment into the U.S. Farm market declined for the second consecutive year however the pace of decline appears to be slowing and new orders in recent months may indicate a modest return in demand. The increase in U.S. sales from acquisitions primarily relate to higher sales of grain storage bins as well as sales of handling equipment and installation services in the food and fertilizer sectors.
[thousands of dollars] Year Ended December 31
2016$
2015$
Excluding acquisitions
Canada 87,708 77,112
US 187,925 188,154
International 35,034 84,979
SUBTOTAL EXCLUDING ACQUISITIONS 310,667 350,245
Acquisitions
Canada 150,443 60,834
US 18,718 6,087
International 66,788 21,744
SUBTOTAL ACQUISITIONS 235,949 88,665
TOTAL TRADE SALES 546,616 438,910
M A N A G E M E N T ’ S D I S C U S S I O N & A N A L Y S I S M A N A G E M E N T ’ S D I S C U S S I O N & A N A L Y S I S05 12
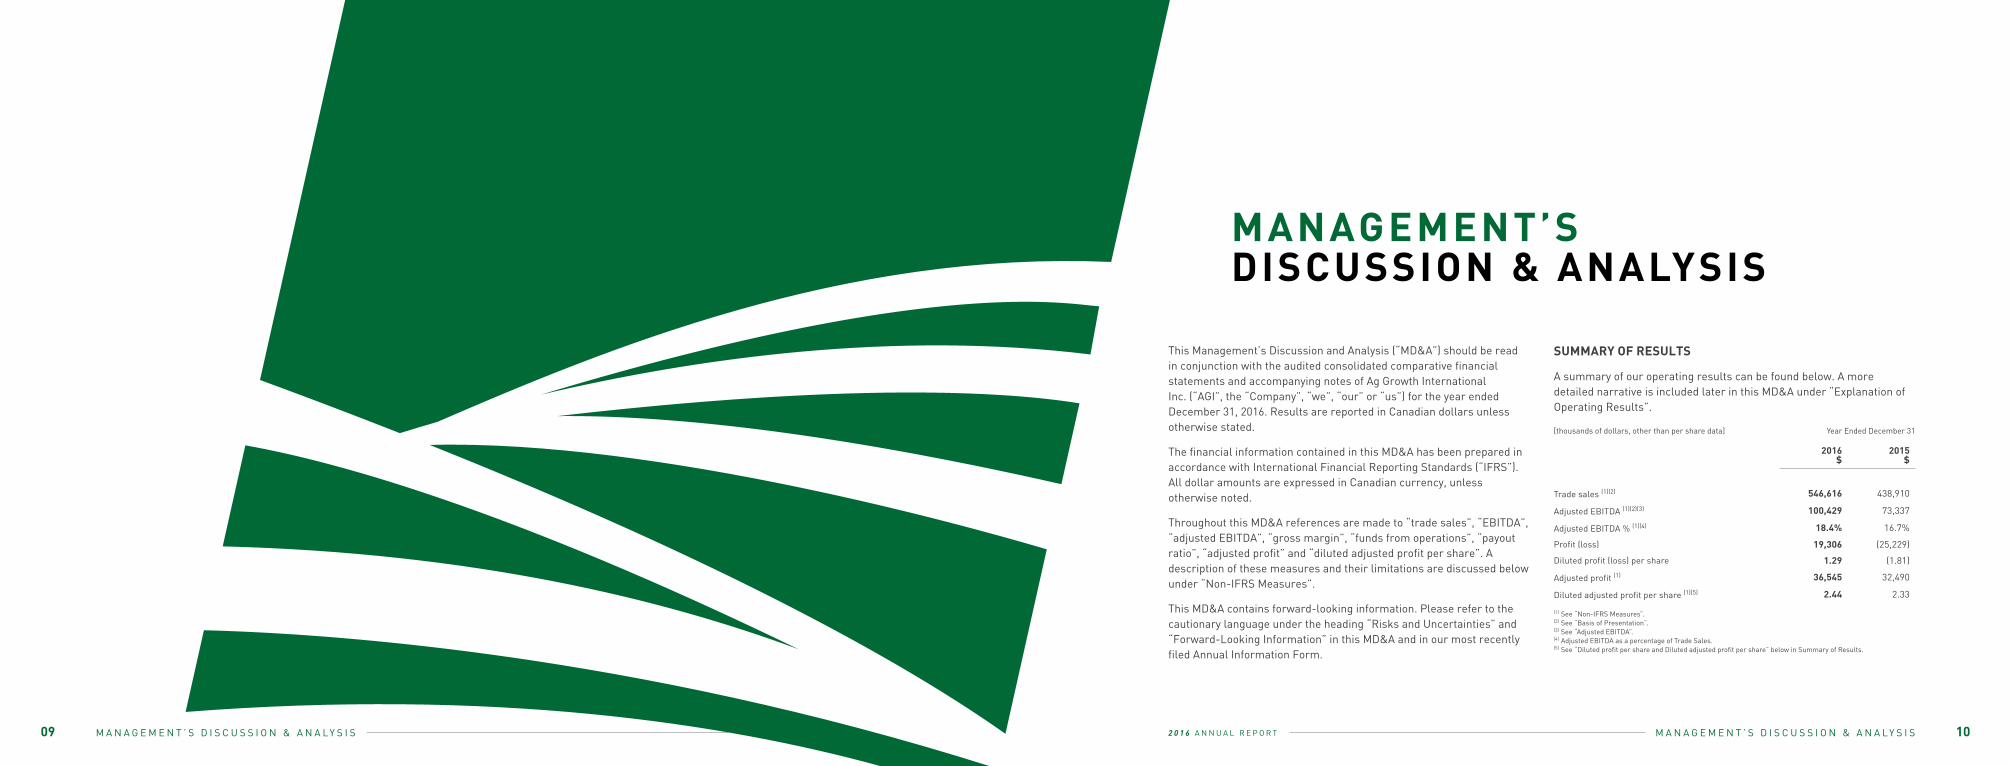
BATCO1997
Batco was established in 1992 and manufactures belt conveyors used in storage and handling of seed, grain and fertilizer. These conveyors areideal where gentle handling of the product is required. Batco also produces custom conveyor solutions.
2 0 1 6 A N N U A L R E P O R TF I E L D T O C O N S U M E RM A N A G E M E N T ’ S D I S C U S S I O N & A N A L Y S I S M A N A G E M E N T ’ S D I S C U S S I O N & A N A L Y S I S
AGI’s international sales, excluding acquisitions, decreased significantly against a strong 2015 comparative. Large project sales declined due to a lower backlog entering 2016 and because several customer commitments failed to materialize early enough to impact 2016 results. AGI’s international project backlog is currently well above that of the prior year due to recent project commitments. Total international sales in 2016 were roughly flat compared to the prior year as Frame product sales in EMEA and elsewhere offset lower revenue derived from large project sales.
See also “Outlook”.
GROSS MARGIN (SEE “NON-IFRS MEASURES” AND “BASIS OF PRESENTATION”)
Strong gross margins in 2016 were achieved despite a decrease in sales of higher margin Farm equipment. Efficient labour utilization, the procurement of steel in advance of steel price increases, the positive impact of a weaker Canadian dollar and strong Commercial operating margins all contributed. Gross margins from divisions acquired in 2015 and 2016 were slightly below longer term expectations due in part to compressed gross margins at Brazilian-based Entringer in the months following its acquisition that were subsequently addressed through improved pricing discipline and an increased focus on labour costs.
Year Ended December 31
2016%
2015%
AGI excluding acquisitions 39.7 36.5
Acquisitions 28.2 24.2
CONSOLIDATED 34.7 34.0
ADJUSTED EBITDA (SEE “NON-IFRS MEASURES” AND “BASIS OF PRESENTATION”)
Adjusted EBITDA increased significantly compared to 2015 due largely to strategic acquisitions in the grain and fertilizer equipment sectors in North America and overseas. Adjusted EBITDA benefited from a strong Canadian Farm market and robust North American demand for Commercial equipment, offset by weakness in the U.S. Farm market and a decrease in large international project sales. As a percentage of sales, adjusted EBITDA increased compared to 2015 as strong Commercial margins and results from acquisitions more than offset the impact of lower sales of high margin Farm handling equipment.
[thousands of dollars] Year Ended December 31
2016$
2015$
EBITDA (1) 83,663 28,396
Loss on foreign exchange (2) 14,070 31,322
Share Based Compensation 6,891 3,004
Cost (recovery) for related Assets under review (3) 122 (273)
Allowance for net Receivables (4) 682 2,280
Gain on Financial Instruments (5) (9,210) 0
M&A expenses 3,018 5,405
Contingent consideration (6) 1,307 0
(Gain) loss on sale of PP&E (114) 3,203
ADJUSTED EBITDA (1) 100,429 73,337
(1) See “Non-IFRS Measures”.(2) See “Impact of Foreign Exchange”.(3) See “Disposition of Applegate and Mepu Operations”.(4) In 2016 AGI cancelled a U.S. based distributor and recorded a net expense related to the fair value of inventory returned. In 2015 the Company recorded a provision related to the net balance owing from an international customer that related to sales invoiced primarily in 2013.(5) See “Equity Compensation Hedge”.(6) Non-cash expense related to the present value amortization of contingent consideration liabilities.
[thousands of dollars] Year Ended December 31
2016$
2015$
Excluding Acquisitions 61,323 64,927
Acquisitions 39,106 8,410
CONSOLIDATED 100,429 73,337
DILUTED PROFIT PER SHARE AND DILUTED ADJUSTED PROFIT PER SHARE
Diluted profit per share in 2016 was $1.29 (2015 – loss of $1.81). The significant increase is largely due to higher adjusted EBITDA, a smaller loss on foreign exchange and a $9.2 million unrealized gain on the Company’s equity compensation swap. Profit per share in 2015 and 2016 has been significantly impacted by the items below:
ACQUISITIONS
Yargus (November 21, 2016)
Yargus is a manufacturer of material handling equipment used primarily in commercial fertilizer applications. The acquisition of Yargus substantially expanded AGI’s North American fertilizer handling platform, both geographically and in terms of service offering. Yargus has a substantial presence in the U.S., as well as a growing international presence, both of which are highly complementary to AGI’s current material handling footprint. Yargus recently made substantial investments in plant, equipment, personnel, and product development,
[thousands of dollars] Year Ended December 31
2016$
2015$
Profit (loss) as reported 19,306 (25,229)
Diluted per share as reported 1.29 (1.81)
Loss on foreign exchange 14,070 31,322
Assets under review (353) 15,509
Asset Impairment 7,839 0
Allowance for net Receivables 682 2,280
M&A expenses 3,018 5,405
Contingent consideration expense 1,307 0
Gain on financial instruments (9,210) 0
Loss on sale of PP&E (114) 3,203
Adjusted profit (1) 36,545 32,490
Diluted adjusted profit per share (1) 2.44 2.33
(1) See “Non-IFRS Measures”.
13 14
2 0 1 6 A N N U A L R E P O R TF I E L D T O C O N S U M E RM A N A G E M E N T ’ S D I S C U S S I O N & A N A L Y S I S M A N A G E M E N T ’ S D I S C U S S I O N & A N A L Y S I S
and when combined with AGI’s existing divisions, is very well positioned to compete in both local and international markets. The purchase price for Yargus was U.S. $43.2 million, which included U.S. $5.2 million of debt related to its recent building expansion and investment in equipment that was required to drive Yargus’ next phase of growth. The transaction was completed at similar metrics to AGI’s recent North American acquisitions.
Mitchell Mill Systems (July 18, 2016)
Mitchell is a manufacturer of material handling equipment used in grain, fertilizer, animal feed, food processing, and industrial applications. Mitchell is recognized for its extensive design, fabrication and installation expertise and the company’s product offering includes conveyor systems, bucket elevators, screw conveyors, and drag conveyors. The transaction was completed at similar metrics to AGI’s recent North American acquisitions. The financial consideration is comprised of a fixed amount payable upon closing, and a contingent amount payable over three years based on the achievement of EBITDA targets. The amount payable upon close was funded from cash on hand and AGI’s revolving credit facility.
NuVision (April 1, 2016)
NuVision designs, manufactures, installs, and maintains fertilizer blending and handling facilities throughout Western Canada. The final purchase price will be based on five times NuVision’s average EBITDA for the financial years 2015, 2016, 2017 and 2018, with a maximum purchase price of $26 million. Terms of the transaction included payment of $12 million upon closing with additional amounts payable annually based on achieved EBITDA in 2016, 2017 and 2018. All payments under the agreement are payable 50% in cash and 50% in AGI equipment and the cash amount payable upon closing was funded from AGI’s cash balance.
Entringer (March 9, 2016)
Entringer is a Brazilian based manufacturer of grain bins, bucket elevators, dryers and cleaners. Founded in 1988 and strategically located in Brazil’s Sao Paulo province, Entringer provides AGI with a measured entry into the rapidly expanding agricultural sector in
Brazil. As expected, Last Twelve Months’ (“LTM”) EBITDA continues to be negative in part due to low gross margins in the months following acquisition that were subsequently addressed through improved pricing discipline and an increased focus on labour costs. The Company acquired Entringer for cash consideration of R$30 million. Subsequent to year-end, an agreement in principle has been reached with the vendors of Entringer that will modify the provisions of the share purchase agreement and, among other conditions, will eliminate the potential for an earn-out.
VIS (November 30, 2015)
VIS is a Winnipeg-based manufacturer of material handling equipment used in the fertilizer, feed and grain sectors. VIS provides AGI with new capability and experience in the planning, design and manufacture of high throughput industrial fertilizer handling equipment. AGI acquired VIS for cash consideration of $10.0 million and contingent consideration of $5.0 million. In the third quarter of 2016 the vendors of VIS joined AGI’s senior management team and the contingent consideration amount was guaranteed, and as at March 15, 2017 the balance has been paid in full. The purchase price was funded from AGI’s cash balance.
Westeel (May 20, 2015)
Westeel is Canada’s leading provider of grain storage solutions offering a wide range of on-farm and commercial products for the agricultural industry. The acquisition included Westeel’s foreign sales offices, its 100% interest in Italian subsidiary PTM Technology, a manufacturer of grain handling equipment, and its 51% interest in Frame, an Italian manufacturer of storage bins-. AGI acquired the 49% minority interest in Frame in the second quarter of 2016 for cash consideration €6.0 million.
The purchase price for Westeel was $205 million, net of cash acquired and a redundant manufacturing plant. The acquisition was financed through the issuance of common shares, convertible unsecured subordinated debentures and long-term debt.
15 06
WHEATHEART1998
Wheatheart was established in 1973 and offers an extensive line of portablegrain augers including specialized self-propelled options, grain-handlingaccessories, as well as industry leading fencing equipment.
2 0 1 6 A N N U A L R E P O R TF I E L D T O C O N S U M E R
IMPACT OF FOREIGN EXCHANGE
Sales and Adjusted EBITDA
AGI’s average rate of exchange for 2016 was $1.32 (2015 = $1.27). A lower Canadian dollar results in an increase in reported trade sales as U.S. dollar denominated sales are translated into Canadian dollars at a higher rate. Similarly, a lower Canadian dollar results in increased costs for U.S. dollar denominated inputs and SG&A expenses. In addition, a weaker Canadian dollar may result in higher input costs of certain Canadian dollar denominated inputs, including steel. On balance, adjusted EBITDA benefits from a weaker Canadian dollar.
Gains and Losses on Foreign Exchange
AGI has entered into forward foreign exchange contracts with the objective of partially mitigating exposure to currency fluctuations. In 2016, AGI realized losses on maturing foreign exchange contracts of $14.4 million (2015 - $15.3 million). Based on foreign exchange contracts outstanding at January 1, 2017, the Company does not expect to realize losses of a similar magnitude in 2017. The table below summarizes outstanding foreign exchange contracts. Currency fluctuations also result in non-cash gains or losses on foreign exchange. See “Financial Instruments – Foreign exchange contracts”.
FORWARD FOREIGN EXCHANGE CONTRACTS
SETTLEMENT DATES
FACE AMOUNT USD (000’s)
AVERAGE RATE CAD
CAD AMOUNT (000’s)
2017 – Q1 9,000 $1.25 11,216
CORPORATE OVERVIEW
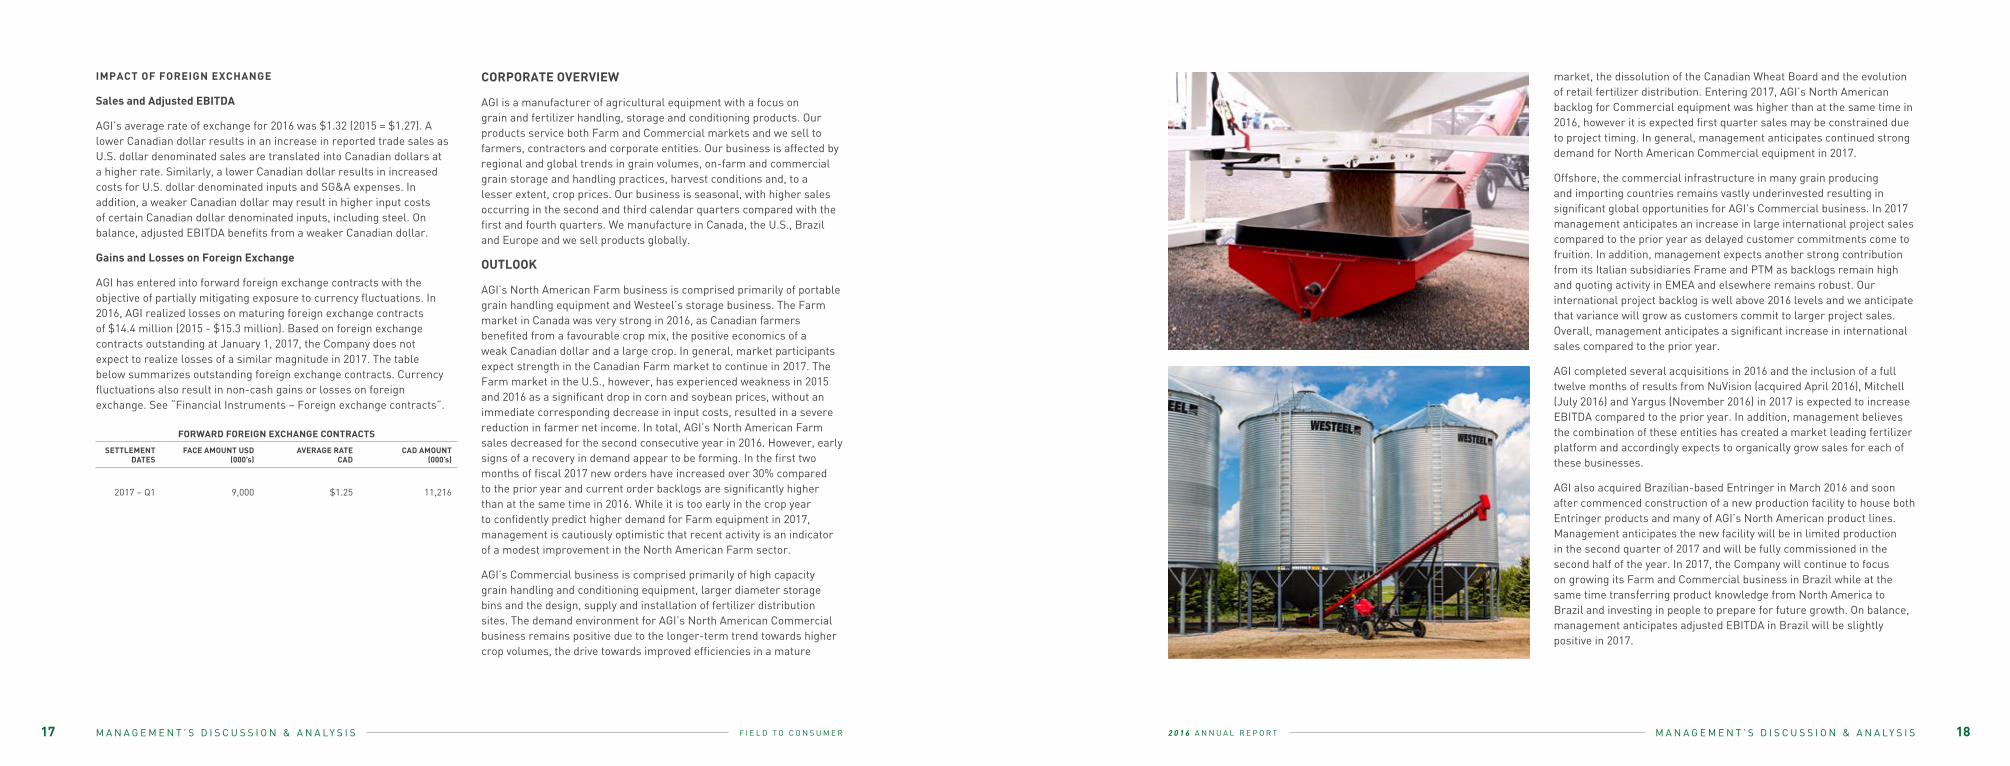
AGI is a manufacturer of agricultural equipment with a focus on grain and fertilizer handling, storage and conditioning products. Our products service both Farm and Commercial markets and we sell to farmers, contractors and corporate entities. Our business is affected by regional and global trends in grain volumes, on-farm and commercial grain storage and handling practices, harvest conditions and, to a lesser extent, crop prices. Our business is seasonal, with higher sales occurring in the second and third calendar quarters compared with the first and fourth quarters. We manufacture in Canada, the U.S., Brazil and Europe and we sell products globally.
OUTLOOK
AGI’s North American Farm business is comprised primarily of portable grain handling equipment and Westeel’s storage business. The Farm market in Canada was very strong in 2016, as Canadian farmers benefited from a favourable crop mix, the positive economics of a weak Canadian dollar and a large crop. In general, market participants expect strength in the Canadian Farm market to continue in 2017. The Farm market in the U.S., however, has experienced weakness in 2015 and 2016 as a significant drop in corn and soybean prices, without an immediate corresponding decrease in input costs, resulted in a severe reduction in farmer net income. In total, AGI’s North American Farm sales decreased for the second consecutive year in 2016. However, early signs of a recovery in demand appear to be forming. In the first two months of fiscal 2017 new orders have increased over 30% compared to the prior year and current order backlogs are significantly higher than at the same time in 2016. While it is too early in the crop year to confidently predict higher demand for Farm equipment in 2017, management is cautiously optimistic that recent activity is an indicator of a modest improvement in the North American Farm sector.
AGI’s Commercial business is comprised primarily of high capacity grain handling and conditioning equipment, larger diameter storage bins and the design, supply and installation of fertilizer distribution sites. The demand environment for AGI’s North American Commercial business remains positive due to the longer-term trend towards higher crop volumes, the drive towards improved efficiencies in a mature
market, the dissolution of the Canadian Wheat Board and the evolution of retail fertilizer distribution. Entering 2017, AGI’s North American backlog for Commercial equipment was higher than at the same time in 2016, however it is expected first quarter sales may be constrained due to project timing. In general, management anticipates continued strong demand for North American Commercial equipment in 2017.
Offshore, the commercial infrastructure in many grain producing and importing countries remains vastly underinvested resulting in significant global opportunities for AGI’s Commercial business. In 2017 management anticipates an increase in large international project sales compared to the prior year as delayed customer commitments come to fruition. In addition, management expects another strong contribution from its Italian subsidiaries Frame and PTM as backlogs remain high and quoting activity in EMEA and elsewhere remains robust. Our international project backlog is well above 2016 levels and we anticipate that variance will grow as customers commit to larger project sales. Overall, management anticipates a significant increase in international sales compared to the prior year.
AGI completed several acquisitions in 2016 and the inclusion of a full twelve months of results from NuVision (acquired April 2016), Mitchell (July 2016) and Yargus (November 2016) in 2017 is expected to increase EBITDA compared to the prior year. In addition, management believes the combination of these entities has created a market leading fertilizer platform and accordingly expects to organically grow sales for each of these businesses.
AGI also acquired Brazilian-based Entringer in March 2016 and soon after commenced construction of a new production facility to house both Entringer products and many of AGI’s North American product lines. Management anticipates the new facility will be in limited production in the second quarter of 2017 and will be fully commissioned in the second half of the year. In 2017, the Company will continue to focus on growing its Farm and Commercial business in Brazil while at the same time transferring product knowledge from North America to Brazil and investing in people to prepare for future growth. On balance, management anticipates adjusted EBITDA in Brazil will be slightly positive in 2017.
M A N A G E M E N T ’ S D I S C U S S I O N & A N A L Y S I S M A N A G E M E N T ’ S D I S C U S S I O N & A N A L Y S I S17 18
2 0 1 6 A N N U A L R E P O R TF I E L D T O C O N S U M E R
Demand in 2017 will be influenced by, among other factors, weather patterns, crop conditions and the timing of harvest and conditions during harvest. Changes in global macroeconomic factors as well as sociopolitical factors in certain local or regional markets and the availability of credit and export credit agency support in offshore markets also may influence sales, primarily of Commercial grain handling and storage products. Consistent with prior periods, Commercial sales are subject to the timing of customer commitment and delivery considerations. AGI’s financial results are impacted by the rate of exchange between the Canadian and U.S. dollars and a weaker Canadian dollar relative to its U.S. counterpart positively impacts profit and adjusted EBITDA. The Company has mitigated its exposure to higher input costs though procurement of steel at lower prices, sales price increases and limiting the length of time commercial quotes remain valid. However, AGI’s results in 2017 may be impacted by higher steel prices.
On balance, based on current conditions, management anticipates sales and adjusted EBITDA in 2017 will exceed 2016 results. Inclusion of a full twelve months of results from the 2016 acquisitions of NuVision, Mitchell and Yargus, and anticipated synergies derived from the creation of a market leading fertilizer platform, are expected to significantly contribute to sales and EBITDA in 2017. Positive conditions in Canada are expected to lead to robust demand for portable handling, aeration and storage equipment. In the U.S., management anticipates a modest increase in demand for Farm equipment as market conditions incrementally improve and farmers replace older equipment. Finally, international sales are expected to benefit from a higher opening backlog and increased large project sales.
DETAILED OPERATING RESULTS
DISPOSITION OF APPLEGATE AND MEPU OPERATIONS
A strategic review of the Applegate and Mepu operations commenced in 2015. As noted under “Basis of Presentation”, results from Mepu and Applegate have been removed from our calculation of Trade Sales and Adjusted EBITDA in both 2015 and 2016. In 2016, trade sales
[thousands of dollars] Year Ended December 31
2016$
2015$
Trade sales (1)(2) 546,616 438,910
Loss on FX (15,000) (24,795)
Sales (2) 531,616 414,115
Cost of inventories (2) 356,765 289,683
Depreciation / amortization (2) 13,667 10,166
Cost of sales (2) 370,432 299,849
General and administrative (2) 99,427 84,011
M&A expenses 3,018 5,405
Contingent consideration expense 1,307 0
Depreciation/ amortization (2) 8,317 6,351
Other operating (income) expenses (11,596) 308
Asset Impairment 7,839 0
Finance costs 24,025 18,490
Finance (income) expenses (968) 6,312
Profit (loss) before income taxes 29,815 (6,611)
Current income taxes 11,122 4,722
Deferred income taxes (260) (1,613)
Profit (loss) for the period from Continuing operations 18,953 (9,720)
Profit (loss) from discontinued Operations 353 (15,509)
Profit (loss) for the period 19,306 (25,229)
Profit per share
Basic 1.31 (1.81)
Diluted 1.29 (1.81)
(1) See “Non-IFRS Measures”.(2) See “Basis of Presentation”(3) See Disposition of Applegate and Mepu Operations
M A N A G E M E N T ’ S D I S C U S S I O N & A N A L Y S I S M A N A G E M E N T ’ S D I S C U S S I O N & A N A L Y S I S05 20
WESTFIELD2000
Established in 1950; today operating out of a 183,000 square-foot facility inRosenort, Manitoba, Westfield is the leading North American manufacturer of portable grain augers.
2 0 1 6 A N N U A L R E P O R TF I E L D T O C O N S U M E R
related to these operations totaled $15.5 million (2015 - $35.4 million) and adjusted EBITDA was negative $0.5 million (2015 – negative $0.7 million).
The sale of Mepu in June 2016 resulted in cash proceeds on closing of $3.1 million and receipt of an additional $3.1 million in the second half of 2016 upon collection of accounts receivable and receipt of the second and final payment for inventory. Terms of the sale included a note receivable of $0.8 million from the purchaser related to the building, repayable over ten years.
The sale of Applegate in August 2016 resulted in cash proceeds on closing of $4.1 million and receipt of an additional $1.4 million in the second half of 2016 upon collection of accounts receivable.
EBITDA AND ADJUSTED EBITDA RECONCILIATION
ASSETS AND LIABILITIES
EXPLANATION OF OPERATING RESULTS
TRADE SALES (SEE “NON-IFRS MEASURES” AND “BASIS OF PRESENTATION”)
CANADA
Trade sales in Canada, excluding acquisitions, increased over 2015 as a strong Canadian Farm market resulted in higher sales of grain handling and aeration equipment while sales of Commercial handling equipment benefited from an expanding commercial infrastructure in Canada. Total trade sales in Canada increased significantly over the prior year as demand for Westeel storage equipment returned to more traditional levels following the 2015 drought. In addition, AGI significantly increased
[thousands of dollars] Year Ended December 31
2016$
2015$
Profit (loss) from continuing operations before income taxes 29,815 (6,611)
Finance costs 24,025 18,490
Impairment of assets 7,839 0
Depreciation / amortization in cost of sales 13,667 10,166
Depreciation / amortization in SG&A expenses 8,317 6,351
EBITDA (1) 83,663 28,396
Loss on foreign exchange 14,070 31,322
Share based compensation 6,891 3,004
M&A expenses 3,018 5,405
Contingent consideration 1,307 0
Gain on financial instruments (9,210) 0
(Gain) loss on sale of property, plant & equipment (114) 3,203
Allowance for net Receivables 682 2,280
Recovery (cost) of related Assets under review 122 (273)
ADJUSTED EBITDA (1) 100,429 73,337
Adjusted EBITDA as a % of trade sales 18.4% 16.7%
(1) See “Non-IFRS Measures”.
[thousands of dollars]
DECEMBER 31,2016
$
DECEMBER 31,2015
$
Total assets 850,151 745,920
Total liabilities 605,587 510,765
[thousands of dollars] Year Ended December 31
2016$
2015$
Excluding acquisitions
Canada 87,708 77,112
US 187,925 188,154
International 35,034 84,979
SUBTOTAL EXCLUDING ACQUISITIONS 310,667 350,245
Acquisitions
Canada 150,443 60,834
US 18,718 6,087
International 66,788 21,744
SUBTOTAL ACQUISITIONS 235,949 88,665
TOTAL TRADE SALES 546,616 438,910
M A N A G E M E N T ’ S D I S C U S S I O N & A N A L Y S I S M A N A G E M E N T ’ S D I S C U S S I O N & A N A L Y S I S21 22

2 0 1 6 A N N U A L R E P O R TF I E L D T O C O N S U M E R
2 0 1 6 A N N U A L R E P O R TF I E L D T O C O N S U M E RM A N A G E M E N T ’ S D I S C U S S I O N & A N A L Y S I S M A N A G E M E N T ’ S D I S C U S S I O N & A N A L Y S I S
its presence in the fertilizer sector in 2016 and trade sales reflect strong demand for the design, equipment fabrication and installation of fertilizer handling and storage facilities.
UNITED STATES
In the United States, trade sales excluding acquisitions were flat compared to 2015 as strong demand for Commercial grain handling equipment offset the impact of a soft U.S. Farm market. Sales of grain handling equipment into the U.S. Farm market declined for the second consecutive year however the pace of decline appears to be slowing and new orders in recent months may indicate a modest return in demand. The increase in U.S. sales from acquisitions primarily relate to higher sales of grain storage bins as well as sales of handling equipment and installation services in the food and fertilizer sectors.
INTERNATIONAL
AGI’s international sales, excluding acquisitions, decreased significantly against a strong 2015 comparative. Large project sales declined due to a lower backlog entering 2016 and because several customer commitments failed to materialize early enough to impact 2016 results. AGI’s international project backlog is currently well above that of the prior year due to recent project commitments. Total international sales in 2016 were roughly flat compared to the prior year as Frame product sales in Europe, the Middle East and Africa (“EMEA”) and elsewhere offset lower revenue derived from large project sales.
GROSS MARGIN
Strong gross margins in 2016 were achieved despite a decrease in sales of higher margin Farm equipment. Efficient labour utilization, the procurement of steel in advance of steel price increases, the positive impact of a weaker Canadian dollar and strong Commercial operating margins all contributed. Gross margins from divisions acquired in 2015 and 2016 were slightly below longer term expectations due in part to compressed gross margins at Brazilian-based Entringer in the months following its acquisition that were subsequently addressed through improved pricing discipline and an increased focus on labour costs.
GENERAL AND ADMINISTRATIVE EXPENSES
SG&A expenses in 2016 were $112.1 million (2015 - $95.8 million). Excluding acquisitions made in 2015 and 2016, SG&A expenses were $72.8 million (2015 - $74.1 million). The decrease compared to 2015 is largely related to the items below:
• Third party commissions decreased $4.1 million compared to 2015 due to sales mix.
• Bad debt expense decreased $2.5 million largely because results in 2015 included a $2.9 million bad debt allowance for an international customer.
• Salaries and wages in 2016 increased $1.6 million due largely to the achievement of performance based bonuses.
• Share based compensation in 2016 increased $3.8 million due to the implementation of a new performance based plan that included a higher number of participants compared to the plan that expired at the end of 2015.
• The remaining variance resulted from several offsetting factors with no individual variance larger than $1.0 million.
2016%
2015%
AGI excluding acquisitions 39.7 36.5
Acquisitions 28.2 24.2
CONSOLIDATED 34.7 34.0
(1) See “Non-IFRS Measures”.(2) Excludes depreciation and amortization included in cost of sales.(3) See “Basis of Presentation”
Year Ended December 31
25 06
GRAIN GUARD2005
Grain Guard offers fans, aeration equipment, specialized ducting and lowtemperature heaters for all grain storage situations. Grain Guard provides proven solutions for natural air drying and conditioning of stored grain.

2 0 1 6 A N N U A L R E P O R TF I E L D T O C O N S U M E R
EBITDA AND ADJUSTED EBITDA
Adjusted EBITDA increased significantly compared to 2015 due largely to strategic acquisitions in the grain and fertilizer equipment sectors both in North America and overseas. Adjusted EBITDA benefited from a strong Canadian Farm market and robust North American demand for Commercial equipment, offset by continued weakness in the U.S. Farm market and a decrease in large international project sales. As a percentage of sales, adjusted EBITDA increased compared to 2015 as strong Commercial margins and results from acquisitions more than offset the impact of lower sales of high margin Farm handling equipment. The increase in EBITDA over 2015 was more significant due to a smaller loss on foreign exchange and a gain on an equity compensation derivative in 2016.
FINANCE COSTS
Finance costs in 2016 were $24.0 million (2015 – $18.5 million). The higher expense in 2016 relates primarily to financing the acquisition of Westeel in May 2015, partially through a convertible debenture issuance and through an increase in amounts drawn on the Company’s credit facility, as well as a debenture issuance in September 2015. Finance costs in both periods include non-cash interest related to convertible debenture accretion, the amortization of deferred finance costs related to the convertible debentures, stand-by fees and other sundry cash interest.
FINANCE EXPENSE
Finance expense in both periods relates primarily to non-cash gains and losses on the translation of the Company’s U.S. dollar denominated long-term debt at the rate of exchange in effect at the end of the quarter.
OTHER OPERATING EXPENSE (INCOME)
Other operating income in 2016 includes a gain on financial instruments of $9.2 million that was entered in 2016 (see “Equity Compensation Hedge”) and in 2016 the Company recorded a gain on the sale of property, plant & equipment and assets held for sale of $0.1 million (2015 – loss of $3.2 million).
DEPRECIATION AND AMORTIZATION
Depreciation of property, plant and equipment and amortization of intangible assets are categorized on the income statement in accordance with the function to which the underlying asset is related. The increase in 2016 primarily relates to acquisitions made in 2015 and 2016. Total depreciation and amortization is summarized below:
Depreciation
Amortization
CURRENT INCOME TAX EXPENSE
For the year ended December 31, 2016 the Company recorded current tax expense of $11.1 million (2015 – $4.7 million). Current tax expense relates primarily to Ag Growth U.S. and Italy subsidiaries.
[thousands of dollars] Year Ended December 31
2016$
2015$
EBITDA (1) 83,663 28,396
Adjusted EBITDA (1) 100,429 73,337
(1) See the EBITDA and adjusted EBITDA reconciliation table above, “Non-IFRS Measures” and “Basis of Presentation”.
[thousands of dollars] Year Ended December 31
2016$
2015$
Depreciation in cost of sales 10,019 7,621
Depreciation in G&A 904 567
Total Depreciation 10,923 8,188
[thousands of dollars] Year Ended December 31
2016$
2015$
Amortization in cost of sales 3,648 2,545
Amortization in G&A 7,413 5,784
Total Amortization 11,061 8,329
M A N A G E M E N T ’ S D I S C U S S I O N & A N A L Y S I S M A N A G E M E N T ’ S D I S C U S S I O N & A N A L Y S I S
DEFERRED INCOME TAX EXPENSE
For the year ended December 31, 2016, the Company recorded deferred tax recovery of ($0.3) million (2015 –$1.6 million). Deferred tax recovery in 2016 relates to the increase of deferred tax assets plus a decrease in deferred tax liabilities that related to recognition of temporary differences between the accounting and tax treatment of depreciable assets, intangible assets and convertible debentures.
Upon conversion to a corporation from an income trust in June 2009 (the “Conversion”) the Company received certain tax attributes that may be used to offset tax otherwise payable in Canada. The Company’s Canadian taxable income is based on the results of its divisions domiciled in Canada, including the corporate office, and realized gains or losses on foreign exchange. For the year ended December 31, 2016, the Company offset $0.5 million of Canadian tax otherwise payable (2015 - generated new net Canadian tax losses of ($0.7) million). Through the use of these attributes and since the date of Conversion a cumulative amount of $38.2 million has been utilized. Utilization of these tax attributes is recognized in deferred income tax expense on the Company’s income statement. As at December 31, 2016, the balance sheet asset related to these unused attributes was $16.8 million.
EFFECTIVE TAX RATE
The total tax percentage in 2015 and to a much lesser extent in 2016 was impacted by items that were expensed for accounting purposes but were not deductible for tax purposes. These include non-cash losses on foreign exchange. See “Diluted profit per share and Diluted adjusted profit per share”.
PROFIT (LOSS) AND DILUTED PROFIT (LOSS) PER SHARE AND ADJUSTED DILUTED PROFIT (LOSS) PER SHARE
In 2016 the Company reported profit of $19.3 million (2015 – loss of $25.2 million), basic profit per share of $1.31 (2015 – loss of $1.81) and a fully diluted profit per share of $1.29 (2015 – loss of $1.81).
A reconciliation of adjusted profit per share is below:
[thousands of dollars] Year Ended December 31
2016$
2015$
Current tax expense 11,122 4,722
Deferred tax expense (260) (1,613)
TOTAL TAX 10,862 3,109
Profit (loss) before taxes 30,168 (22,120)
Total tax % 36.0% (14.1%)
[thousands of dollars, other than per share data] Year Ended December 31
2016$
2015$
Profit as reported 19,306 (25,229)
Diluted profit per share as reported 1.29 (1.81)
Loss on foreign exchange 14,070 31,322
Assets under review (353) 15,509
Asset Impairment 7,839 0
M&A expenses 3,018 5,405
Contingent consideration expense 1,307 0
Gain on financial instruments (9,210) 0
Loss on sale of PP&E (114) 3,203
Allowance for net Receivables 682 2,280
Adjusted profit (1) 36,545 32,490
Diluted adjusted profit per share (1) 2.44 2.33
(1) See “Non-IFRS Measures”.
27 28
2 0 1 6 A N N U A L R E P O R TF I E L D T O C O N S U M E RM A N A G E M E N T ’ S D I S C U S S I O N & A N A L Y S I S M A N A G E M E N T ’ S D I S C U S S I O N & A N A L Y S I S
SELECTED ANNUAL INFORMATION
The following factors impact comparability between years in the table above:
• The acquisitions of Vis, Westeel, Entringer, NuVision, Mitchell and Yargus significantly impact information in the table above. See “Acquisitions”.
• Profit and profit per share were significantly impacted in 2015 by a $13.4 million impairment charge related to assets at the Company’s Applegate and Mepu divisions.
• Profit and profit per share in 2014 were significantly impacted by an expense of $16.9 million related to the Company’s agreement with the CRA regarding its conversion to a corporation.
• Sales, gain (loss) on foreign exchange, profit and profit per share are significantly impacted by the rate of exchange between the Canadian and U.S. dollars. The impact was most significant in 2015 and the second half of 2014 due to a rapid weakening of the Canadian dollar relative to its U.S. counterpart.
Twelve Months Ended December 31
2016$
2015$
2014(2)
$
Sales 531,616 414,115 400,145
EBITDA (1) 83,663 28,396 60,470
Adjusted EBITDA (1) 100,429 73,337 78,228
Profit (loss) from continuing operations 18,953 (9,720) 35,278
Basic profit (loss) per share from continuing operations 1.29 (0.70) 2.69
Fully diluted profit (loss) per share from continuing operations 1.27 (0.70) 2.64
Profit (loss) 19,306 (25,229) 4,100
Basic profit (loss) per share 1.31 (1.81) 0.31
Fully diluted profit (loss) per share 1.29 (1.81) 0.31
Funds from operations (1) 52,888 37,791 55,549
Payout ratio (1) 67% 89% 57%
Dividends declared per common share 2.40 2.40 2.40
Total assets 850,151 745,920 447,116
Total long-term liabilities 480,821 358,742 123,415
(1) See “Non-IFRS Measures”.(2) As reported other than items specifically noted with results from continuing operations.
[thousands of dollars, other than per share data]
QUARTERLY FINANCIAL INFORMATION
[thousands of dollars other than per share data and exchange rate]:
2016
FROM CONTINUING OPERATIONS TOTAL
AVG USD / CAD FX RATE SALES PROFIT BASIC PROFIT
PER SHAREDILUTED PROFIT
PER SHAREPROFIT BASIC PROFIT
PER SHAREDILUTED PROFIT
PER SHARE
Q1 1.38 111,723 6,257 $0.43 $0.42 5,697 $0.39 $0.38
Q2 1.29 140,837 4,245 $0.29 $0.28 5,285 $0.36 $0.35
Q3 1.34 158,680 12,952 $0.87 $0.84 13,034 $0.88 $0.85
Q4 1.32 120,376 (4,501) ($0.30) ($0.30) (4,710) ($0.32) ($0.32)
YTD 1.32 531,616 18,953 $1.29 $1.27 19,306 $1.31 $1.29
2015(1)
AVG USD / CAD EXCHANGE RATE
SALES PROFIT /(LOSS)
BASICPROFIT (LOSS)
PER SHARE
DILUTEDPROFIT (LOSS)
PER SHARE
Q1 1.23 87,259 (3,409) ($0.26) ($0.26)
Q2 1.24 122,396 8,173 $0.60 $0.58
Q3 1.30 125,590 (8,638) ($0.60) ($0.60)
Q4 1.33 114,239 (21,355) ($1.48) ($1.48)
YTD 1.27 449,484 (25,229) ($1.81) ($1.81)
(1) As reported.
29 30

2 0 1 6 A N N U A L R E P O R TF I E L D T O C O N S U M E R
The following factors impact the comparison between periods in the table above:
• AGI’s acquisition of Westeel (Q2 2015), VIS (Q4 2015), Entringer (Q1 2016), NuVision (Q2 2016), Mitchell (Q3 2016) and Yargus (Q4 2016) significantly impacts comparisons to prior periods of assets, liabilities and operating results. See “Acquisitions”.
• The loss and loss per share in the fourth quarter of 2015 was significantly impacted by an asset impairment charge of $13.4 million at the Mepu and Applegate divisions.
• The loss and loss per share in the fourth quarter of 2014 was significantly impacted by an expense of $16.9 million related to the Company’s agreement with the CRA regarding its conversion to a corporation.
• Sales, gain (loss) on foreign exchange, profit, and profit per share in all periods are impacted by the rate of exchange between the Canadian and U.S. dollars.
Interim period sales and profit historically reflect seasonality. The second and third quarters are typically the strongest primarily due to the timing of construction of commercial projects and higher in-season demand at the farm level. Due to the seasonality of AGI’s working capital movements, cash provided by operations will typically be highest in the fourth quarter. The seasonality of AGI’s business may be impacted by a number of factors including weather and the timing and quality of harvest in North America.
FOURTH QUARTER
TRADE SALES
Trade sales in Canada, excluding acquisitions, increased over 2015 as a strong Canadian Farm market resulted in higher sales of grain handling and aeration equipment. Total trade sales in Canada increased significantly over the prior year as demand for Westeel storage equipment returned to more traditional levels following the 2015 drought. In addition, AGI significantly increased its presence in the fertilizer sector in 2016.
In the United States, trade sales excluding acquisitions were flat compared to 2015 as strong demand for Commercial grain handling equipment offset the impact of a soft U.S. Farm market. The increase in U.S. sales from acquisitions are primarily the result of higher sales of grain storage bins as well as sales of handling equipment and installation services into the food and fertilizer sectors.
AGI’s international sales, excluding acquisitions, decreased significantly against a strong 2015 comparative. Large project sales declined as several customer commitments failed to materialize early enough to impact 2016 results. International trade sales from acquisitions decreased against a very strong 2015 comparative due largely to timing of Frame shipments.
[thousands of dollars] Three Months Ended December 31
2016$
2015$
Excluding acquisitions
Canada 17,592 13,039
US 40,840 41,789
International 5,925 19,139
SUBTOTAL EXCLUDING ACQUISITIONS 64,357 73,967
Acquisitions
Canada 36,805 21,944
US 9,293 829
International 15,975 18,028
SUBTOTAL ACQUISITIONS 62,073 40,801
TOTAL TRADE SALES 126,430 114,768
M A N A G E M E N T ’ S D I S C U S S I O N & A N A L Y S I S
Three Months Ended December 31
2016$
2015$
Trade sales (1) 126,430 114,768
Adjusted EBITDA (1) 18,226 14,068
Profit (loss) (4,710) (21,355)
Diluted profit (loss) per share ($0.32) ($1.48)
Adjusted profit (1) 4,440 3,546
Diluted adjusted profit per share (1) $0.30 $0.25
(1) See “Non-IFRS Measures”.
[thousands of dollars, other than per share data]
05 32
HI ROLLER2006
Hi Roller© manufactures a line of premier commercial enclosed, dust-tightand self reloading conveyors, designed for installation in grain handling facilities, soy and corn processing operations and industrial operations.
2 0 1 6 A N N U A L R E P O R TF I E L D T O C O N S U M E R
GROSS MARGIN
Gross margin as a percentage of sales for the three months ended December 31, 2016 was 34.0%, (2015 – 34.2%) and excluding acquisitions was 32.2% (2015 – 31.1%). Gross margin percentages remained healthy despite a decrease in sales of higher margin Farm equipment due to production efficiencies and Commercial product mix. Historically, gross margin percentages are lower in the fourth quarter of a fiscal year due to lower sales volumes and preseason sales discounts.
GENERAL AND ADMINISTRATIVE EXPENSES
For the three months ended December 31, 2016, general and administrative expenses, excluding acquisitions, were $20.0 million (2015 - $21.2 million). As a percentage of sales, general and administrative expenses in the fourth quarter of a fiscal year are generally higher than the annual percentage due to seasonally lower sales volumes. The decrease from 2015 is largely due to a $2.8 million decrease in third party commissions, primarily the result of sales mix, and a $0.9 million increase in share based compensation expense. The remaining variance resulted from several offsetting factors with no individual variance larger than $0.5 million.
ADJUSTED EBITDA AND PROFIT (LOSS)
Adjusted EBITDA for the three months ended December 31, 2016 was $18.2 million (2015 - $14.1 million). The increase from 2015 was primarily the result of contributions from acquisitions made in 2015 and 2016.
For the three months ended December 31, 2016, the Company reported a net loss of $4.7 million (2015 - $21.4 million), a basic net loss per
[thousands of dollars] Three months Ended December 31
2016$
2015$
ADJUSTED EBITDA
AGI, excluding acquisitions 10,541 10,191
Acquisitions 7,685 3,877
TOTAL $18,226 $14,068
share of $0.32 (2015 - $1.48), and a fully diluted net loss per share of $0.32 (2015 – $1.48). Profit per share in 2015 and 2016 has been significantly impacted by the items below:
LIQUIDITY AND CAPITAL RESOURCES
AGI’s financing requirements are subject to variations due to the seasonal and cyclical nature of its business. Our sales historically have been higher in the second and third calendar quarters compared with the first and fourth quarters and our cash flow has been lower in the first three quarters of each calendar year. Internally generated funds are supplemented when necessary from external sources, primarily the Credit Facility, to fund the Company’s working capital requirements, capital expenditures and dividends. The Company believes that the debt facilities and debentures described under “Capital Resources”, together with available cash and internally generated funds, are sufficient to support its working capital, capital expenditures, dividends and debt service requirements.
[thousands of dollars, other than per share data] Three Months Ended December 31
2016$
2015$
Profit (loss) as reported ($4,710) ($21,355)
Diluted profit (loss) per share as reported ($0.32) ($1.48)
Assets under Review 209 14,837
Loss on foreign exchange 6,932 9,034
Non- cash Asset impairment 5,526 0
M&A Activity 1,185 699
Contingent Consideration expense 367 0
Gain on financial Instruments (4,050) 0
(Gain) loss on sale of property, plant and equipment (1,701) 6
Allowance for bad debt 682 325
Adjusted profit (1) $4,440 $3,546
Diluted adjusted profit per share (1) $0.30 $0.25
(1) See “Non-IFRS Measures”.
CASH FLOW AND LIQUIDITY
[thousands of dollars] Year Ended December 31
2016$
2015$
Profit before income taxes from continuing operations 29,815 (6,611)
Add charges (deduct credits) to operations not requiring a current cash payment:
Depreciation/Amortization 21,984 16,517
Translation (gain) loss on FX (4,864) 30,360
Non-cash interest expense 4,363 3,090
Share based compensation 6,891 3,004
Defined benefit pension plan 208 272
Non-cash movement in derivative Instruments (9,210) 0
Non-cash Investment tax credit (68) (412)
Impairment charge 7,839 0
Dividends receivable on equity swap (100) 0
Dividends on share based compensation (55) (962)
Contingent Consideration (1,712) 0
Loss (gain) on sale of assets (114) 3,203
Cash provided by operations before non-cashworking capital changes and income taxes 54,977 48,461
Net change in non-cash working capital balances related to operations:
Accounts receivable 6,707 39,048
Inventory 6,753 8,291
Prepaid expenses (4,211) 2,076
Accounts payable (777) (23,571)
Customer deposits (7,871) 7,056
Provisions (862) 1,549
(261) 34,449
Income tax paid (9,720) (2,613)
Cash provided by operations (net of discontinued operations) 44,996 80,297
M A N A G E M E N T ’ S D I S C U S S I O N & A N A L Y S I S M A N A G E M E N T ’ S D I S C U S S I O N & A N A L Y S I S33 34
2 0 1 6 A N N U A L R E P O R TF I E L D T O C O N S U M E R
Cash provided by operations decreased compared to the prior year largely because of the collection in 2015 of insurance proceeds related to an amount receivable from an international customer in the amount of U.S. $19.1 million. In addition, cash provided by operations in 2015 benefited from higher customer deposits from international customers.
WORKING CAPITAL REQUIREMENTS
Interim period working capital requirements typically reflect the seasonality of the business. AGI’s collections of accounts receivable are weighted towards the third and fourth quarters. This collection pattern, combined with historically high sales in the third quarter that result from seasonality, typically lead to accounts receivable levels increasing throughout the year and peaking in the third quarter. Inventory levels typically increase in the first and second quarters and then begin to decline in the third or fourth quarter as sales levels exceed production. Requirements for 2017 are expected to be generally consistent with historical patterns however recent acquisitions have had the effect of increasing working capital requirements in Q4 and Q1. Growth in international business may result in an increase in the number of days accounts receivable remain outstanding and result in increased usage of working capital in certain quarters. Working capital may also be deployed to secure steel supply and pricing.
CAPITAL EXPENDITURES
Maintenance capital expenditures in 2016 were $3.8 million (0.7% of trade sales) compared to $2.3 million (0.5%) in 2015. Management generally anticipates maintenance capital expenditures in a fiscal year to approximate 1.0% - 1.5% of sales. Maintenance capital expenditures in 2016 relate primarily to purchases of manufacturing equipment and building repairs and were funded through cash on hand, bank indebtedness and cash from operations.
AGI defines maintenance capital expenditures as cash outlays required to maintain plant and equipment at current operating capacity and efficiency levels. Non-maintenance capital expenditures encompass other investments, including cash outlays required to increase operating capacity or improve operating efficiency. AGI had non-maintenance capital expenditures of $36.6 million in 2016 (2015 - $34.5 million). In 2016, non-maintenance capital expenditures relate primarily
to equipment purchases, facility upgrades and the construction of AGI’s production facility in Brazil. In 2016, a total of $25 million was expended on the Brazil facility and management estimates an additional $25 million will be required to complete the project. Non-maintenance capital expenditures in 2017 are expected to include the purchase of a currently rented manufacturing facility in Italy for $9 million as well as expenditures on warehousing and manufacturing equipment of approximately $15 million.
Maintenance and non-maintenance capital expenditures in 2017 are expected to be financed through bank indebtedness, cash on hand or through the Company’s credit facility (see “Capital Resources”).
CONTRACTUAL OBLIGATIONS
The 2013, 2014 and 2015 Debentures relate to the aggregate principal amount of the Debentures (see “Convertible Debentures” below) and long-term debt is comprised of a revolver facility, term debt and non-amortizing notes (see “Capital Resources”).
[thousands of dollars]
TOTAL 2017 2018 2019 2020 2021+
2013 Debentures 86,250 86,250
2014 Debentures 51,750 51,750
2015 Debentures 75,000 75,000
Long-term debt 208,989 110,422 98,567
Finance lease 1,732 353 1,046 142 130 61
Operating leases 8,291 2,221 1,769 1,256 917 2,128
Due to vendor 17,191 16,415 776
Contingentconsiderations 20,224 4,023 9,163 7,038
Purchase obligations (1) 16,442 16,442
Total obligations 485,869 39,454 98,228 170,608 76,047 101,532
(1) Net of deposit.
M A N A G E M E N T ’ S D I S C U S S I O N & A N A L Y S I S35 06
UNION IRON2007
Founded in 1852, Union Iron offers material handling and storage equipmentfor use in the commercial and industrial markets including: temporary grain storage, bucket elevators, drag conveyors and structural equipment. Union Iron’s HSI line offers capacities up to 250 mtph (10,000 bph) for large farms and small commercial/industrial facilities.
2 0 1 6 A N N U A L R E P O R TF I E L D T O C O N S U M E R
CAPITAL RESOURCES
CASH
The Company’s cash balance at December 31, 2016 was $2.8 million (2015 - $58.2 million). The decrease in cash is partially the result of a September 2015 debenture issuance that increased the company’s cash balance at December 31, 2015.
DEBT FACILITIES
The Company has a credit facility (the “Credit Facility”) with a syndicate of Canadian chartered banks that includes committed revolver facilities of $80.0 million and U.S. $68.0 million. The Company’s Term Loans A and B are with the same chartered banks with which it has the Credit Facility. Amounts drawn under the facility bear interest at LIBOR plus 1.50% to LIBOR plus 3.00%, prime plus 0.2% to prime plus 1.75%, BA plus 1.50% to BA plus 3.0%, or BA plus 2.50% per annum based on performance calculations. The Company has also issued US $25.0 million and CAD $25.0 million aggregate principal amount secured notes through a note purchase and private shelf agreement (the “Series B and Series C Notes”). The Series B and C Notes are non-amortizing.
[thousands of dollars]
CURRENCY MATURITY TOTAL FACILITY
(CAD)
AMOUNT DRAWN
INTEREST RATE (2)
Operating Facility CAD 2019 20,000 0 4.10%
Operating Facility USD 2019 9,390 0 5.00%
Revolver (1) CAD 2019 80,000 51,023 3.73%
USD Revolver USD 2019 91,304 9,399 4.50%
Term Loan A (1) CAD 2019 50,000 50,000 3.60%
Term Loan B (1) CAD 2022 40,000 40,000 4.32%
Series B Notes CAD 2025 25,000 25,000 4.44%
Series C Notes USD 2026 33,568 33,568 3.70%
TOTAL 349,262 208,990
(1) Interest rate fixed via interest rate swaps. See “Interest Rate Swaps”.(2) As at December 31, 2016.
AGI is subject to certain financial covenants, including a maximum leverage ratio and a minimum debt service ratio, and is in compliance with all financial covenants.
CONVERTIBLE DEBENTURES
Debentures (2013)
In December 2013 the Company issued $86.3 million aggregate principal amount of convertible unsecured subordinated debentures (the “2013 Debentures”) at a price of $1,000 per 2013 Debenture. The 2013 Debentures bear interest at an annual rate of 5.25% payable semi-annually on June 30 and December 31. Each 2013 Debenture is convertible into common shares of the Company at the option of the holder at a conversion price of $55.00 per common share. The maturity date of the 2013 Debentures is December 31, 2018.
On and after December 31, 2016 and prior to December 31, 2017, the 2013 Debentures may be redeemed, in whole or in part, at the option of the Company at a price equal to their principal amount plus accrued and unpaid interest, provided that the volume weighted average trading price of the common shares during the 20 consecutive trading days ending on the fifth trading day preceding the date on which the notice of redemption is given is not less than 125% of the conversion price. On and after December 31, 2017, the 2013 Debentures may be redeemed, in whole or in part, at the option of the Company at a price equal to their principal amount plus accrued and unpaid interest.
On redemption or at maturity, the Company may, at its option, subject to regulatory approval and provided that no event of default has occurred, elect to satisfy its obligation to pay the principal amount of the 2013 Debentures, in whole or in part, by issuing and delivering for each $100 due that number of freely tradeable common shares obtained by dividing $100 by 95% of the volume weighted average trading price of the common shares on the TSX for the 20 consecutive trading days ending on the fifth trading day preceding the date fixed for redemption or the maturity date, as the case may be. Any accrued and unpaid interest thereon will be paid in cash. The Company may also elect, subject to any required regulatory approval and provided that no event of default has occurred, to satisfy all or part of its obligation to pay interest on the 2013 Debentures by delivering sufficient freely tradeable
common shares to satisfy its interest obligation.
The 2013 Debentures trade on the TSX under the symbol AFN.DB.A.
Debentures (2014)
In December 2014 the Company issued $51.8 million aggregate principal amount of extendible convertible unsecured subordinated debentures (the “2014 Debentures”) at a price of $1,000 per 2014 Debenture. The 2014 Debentures bear interest at an annual rate of 5.25% payable semi-annually on June 30 and December 31. Each 2014 Debenture is convertible into common shares of the Company at the option of the holder at a conversion price of $65.57 per common share.
On and after December 31, 2017 and prior to December 31, 2018, the 2014 Debentures may be redeemed, in whole or in part, at the option of the Company at a price equal to their principal amount plus accrued and unpaid interest, provided that the volume weighted average trading price of the common shares during the 20 consecutive trading days ending on the fifth trading day preceding the date on which the notice of redemption is given is not less than 125% of the conversion price. On and after December 31, 2018, the 2014 Debentures may be redeemed, in whole or in part, at the option of the Company at a price equal to their principal amount plus accrued and unpaid interest.
On redemption or at maturity, the Company may, at its option, subject to regulatory approval and provided that no event of default has occurred, elect to satisfy its obligation to pay the principal amount of the 2014 Debentures, in whole or in part, by issuing and delivering for each $100 due that number of freely tradeable common shares obtained by dividing $100 by 95% of the volume weighted average trading price of the common shares on the TSX for the 20 consecutive trading days ending on the fifth trading day preceding the date fixed for redemption or the maturity date, as the case may be. Any accrued and unpaid interest thereon will be paid in cash. The Company may also elect, subject to any required regulatory approval and provided that no event of default has occurred, to satisfy all or part of its obligation to pay interest on the 2014 Debentures by delivering sufficient freely tradeable common shares to satisfy its interest obligation.
The 2014 Debentures trade on the TSX under the symbol AFN.DB.B.
M A N A G E M E N T ’ S D I S C U S S I O N & A N A L Y S I S M A N A G E M E N T ’ S D I S C U S S I O N & A N A L Y S I S37 38
2 0 1 6 A N N U A L R E P O R TF I E L D T O C O N S U M E R
Debentures (2015)
In September 2015 the Company issued $75 million aggregate principal amount of convertible unsecured subordinated debentures (the “2015 Debentures”) at a price of $1,000 per 2015 Debenture. The 2015 Debentures bear interest at an annual rate of 5.00% payable semi-annually on June 30 and December 31. Each 2015 Debenture is convertible into common shares of the Company at the option of the holder at a conversion price of $60.00 per common share. The maturity date of the 2015 Debentures is December 31, 2020.
On and after December 31, 2018 and prior to December 31, 2019, the 2019 Debentures may be redeemed, in whole or in part, at the option of the Company at a price equal to their principal amount plus accrued and unpaid interest, provided that the volume weighted average trading price of the common shares during the 20 consecutive trading days ending on the fifth trading day preceding the date on which the notice of redemption is given is not less than 125% of the conversion price. On and after December 31, 2019, the 2015 Debentures may be redeemed, in whole or in part, at the option of the Company at a price equal to their principal amount plus accrued and unpaid interest.
On redemption or at maturity, the Company may, at its option, subject to regulatory approval and provided that no event of default has occurred, elect to satisfy its obligation to pay the principal amount of the 2015 Debentures, in whole or in part, by issuing and delivering for each $100 due that number of freely tradeable common shares obtained by dividing $100 by 95% of the volume weighted average trading price of the common shares on the TSX for the 20 consecutive trading days ending on the fifth trading day preceding the date fixed for redemption or the maturity date, as the case may be. Any accrued and unpaid interest thereon will be paid in cash. The Company may also elect, subject to any required regulatory approval and provided that no event of default has occurred, to satisfy all or part of its obligation to pay interest on the 2015 Debentures by delivering sufficient freely tradeable common shares to satisfy its interest obligation.
The 2015 Debentures trade on the TSX under the symbol AFN.DB.C.
COMMON SHARES
The following number of common shares were issued and outstanding at the dates indicated:
A total of 915,000 common shares are available for issuance under the Company’s Equity Award Incentive Plan (the “EAIP”). As at December 31, 2016, a total of 321,000 restricted Share Awards (“RSUs”) have been granted and 213,000 remain outstanding. As at December 31, 2016, 367,131 performance Share Awards (“PSUs”) have been granted and 247,500 remain outstanding.
A total of 63,642 deferred grants of common shares have been granted under the Company’s Directors’ Deferred Compensation Plan and 18,436 common shares have been issued.
A total of 3,607,415 common shares are issuable on conversion of the outstanding 2013, 2014 and 2015 Debentures.
On February 15, 2017, the Company issued 1,150,000 common shares at a price of $55.10 per share to raise gross proceeds of approximately $63 million.
AGI’s common shares trade on the TSX under the symbol AFN.
DIVIDENDS
In 2016 AGI declared dividends to shareholders of $35.3 million (2015 - $33.6 million). AGI’s policy is to pay monthly dividends. The Company’s Board of Directors reviews financial performance and other factors
# COMMON SHARES
December 31, 2015 14,590,368
Shares issued under EAIP 47,269
Shares issued under DRIP 144,006
December 31, 2016 14,781,643
Share issuance in February 2017 1,150,000
Shares issued under DRIP in January and February 2017 14,669
MARCH 15, 2017 15,946,312
M A N A G E M E N T ’ S D I S C U S S I O N & A N A L Y S I S M A N A G E M E N T ’ S D I S C U S S I O N & A N A L Y S I S39 40

2 0 1 6 A N N U A L R E P O R TF I E L D T O C O N S U M E RM A N A G E M E N T ’ S D I S C U S S I O N & A N A L Y S I S M A N A G E M E N T ’ S D I S C U S S I O N & A N A L Y S I S41 42
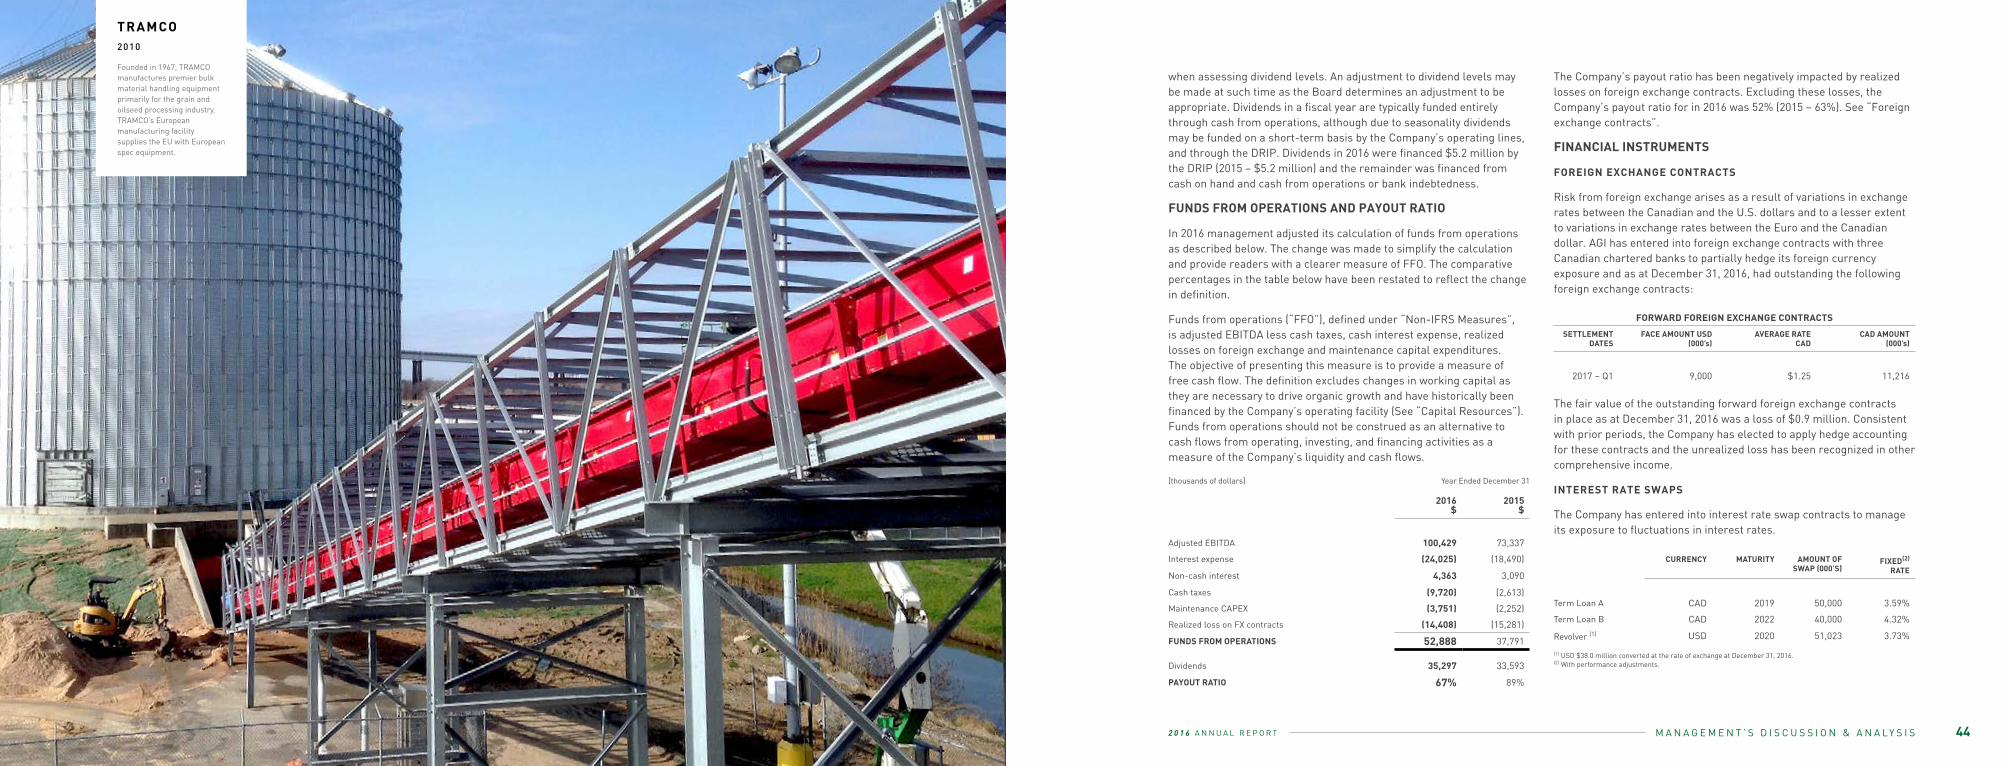
2 0 1 6 A N N U A L R E P O R TF I E L D T O C O N S U M E R
when assessing dividend levels. An adjustment to dividend levels may be made at such time as the Board determines an adjustment to be appropriate. Dividends in a fiscal year are typically funded entirely through cash from operations, although due to seasonality dividends may be funded on a short-term basis by the Company’s operating lines, and through the DRIP. Dividends in 2016 were financed $5.2 million by the DRIP (2015 – $5.2 million) and the remainder was financed from cash on hand and cash from operations or bank indebtedness.
FUNDS FROM OPERATIONS AND PAYOUT RATIO
In 2016 management adjusted its calculation of funds from operations as described below. The change was made to simplify the calculation and provide readers with a clearer measure of FFO. The comparative percentages in the table below have been restated to reflect the change in definition.
Funds from operations (“FFO”), defined under “Non-IFRS Measures”, is adjusted EBITDA less cash taxes, cash interest expense, realized losses on foreign exchange and maintenance capital expenditures. The objective of presenting this measure is to provide a measure of free cash flow. The definition excludes changes in working capital as they are necessary to drive organic growth and have historically been financed by the Company’s operating facility (See “Capital Resources”). Funds from operations should not be construed as an alternative to cash flows from operating, investing, and financing activities as a measure of the Company’s liquidity and cash flows.
The Company’s payout ratio has been negatively impacted by realized losses on foreign exchange contracts. Excluding these losses, the Company’s payout ratio for in 2016 was 52% (2015 – 63%). See “Foreign exchange contracts”.
FINANCIAL INSTRUMENTS
FOREIGN EXCHANGE CONTRACTS
Risk from foreign exchange arises as a result of variations in exchange rates between the Canadian and the U.S. dollars and to a lesser extent to variations in exchange rates between the Euro and the Canadian dollar. AGI has entered into foreign exchange contracts with three Canadian chartered banks to partially hedge its foreign currency exposure and as at December 31, 2016, had outstanding the following foreign exchange contracts:
The fair value of the outstanding forward foreign exchange contracts in place as at December 31, 2016 was a loss of $0.9 million. Consistent with prior periods, the Company has elected to apply hedge accounting for these contracts and the unrealized loss has been recognized in other comprehensive income.
INTEREST RATE SWAPS
The Company has entered into interest rate swap contracts to manage its exposure to fluctuations in interest rates.
FORWARD FOREIGN EXCHANGE CONTRACTS
SETTLEMENT DATES
FACE AMOUNT USD (000’s)
AVERAGE RATE CAD
CAD AMOUNT (000’s)
2017 – Q1 9,000 $1.25 11,216
CURRENCY MATURITY AMOUNT OFSWAP (000’S)
FIXED(2)
RATE
Term Loan A CAD 2019 50,000 3.59%
Term Loan B CAD 2022 40,000 4.32%
Revolver (1) USD 2020 51,023 3.73%
(1) USD $38.0 million converted at the rate of exchange at December 31, 2016.(2) With performance adjustments.
M A N A G E M E N T ’ S D I S C U S S I O N & A N A L Y S I S05 44
TRAMCO2010
Founded in 1967, TRAMCO manufactures premier bulk material handling equipment primarily for the grain and oilseed processing industry. TRAMCO’s European manufacturing facility supplies the EU with European spec equipment.
[thousands of dollars] Year Ended December 31
2016$
2015$
Adjusted EBITDA 100,429 73,337
Interest expense (24,025) (18,490)
Non-cash interest 4,363 3,090
Cash taxes (9,720) (2,613)
Maintenance CAPEX (3,751) (2,252)
Realized loss on FX contracts (14,408) (15,281)
FUNDS FROM OPERATIONS 52,888 37,791
Dividends 35,297 33,593
PAYOUT RATIO 67% 89%
2 0 1 6 A N N U A L R E P O R TF I E L D T O C O N S U M E R
The fair value of the interest rate swap contracts in place as at December 31, 2016 was a loss of $0.7 million. The Company has elected to apply hedge accounting for these contracts and the unrealized loss has been recognized in other comprehensive income.
EQUITY COMPENSATION HEDGE
On March 18, 2016, the Company entered an equity swap agreement with a financial institution to manage the cash flow exposure due to fluctuations in its share price related to the EAIP. Pursuant to this agreement, the financial institution has agreed to pay the Company the total return of the defined underlying common shares which includes both the dividend income they may generate and any capital appreciation. In return, the Company has agreed to pay the Counterparty a funding cost calculated daily based on floating rate option [CAD-BA-COOR] plus a spread of 2.0% and any administrative fees or expenses which are incurred by the counterparty directly. As at December 31, 2016, the equity swap agreement covered 500,000 common shares of the Company at a price of $34.10 and the agreement matures on March 22, 2019.
RELATED PARTIES
Burnet, Duckworth & Palmer LLP provides legal services to the Company and a Director of AGI is a partner of Burnet, Duckworth & Palmer LLP. The total cost of these legal services related to a debenture offering and general matters were $0.2 million during the year ended December 31, 2016 [2015 – $2.3 million], and $6,000 is included in accounts payable and accrued liabilities as at December 31, 2016. These transactions are measured at the exchange amount and were incurred during the normal course of business.
Salthammer Inc. provides consulting services to the Company and a Director of AGI is the owner of Salthammer Inc. The total cost of these consulting services related to an international plant expansion project were $48,000 during the year ended December 31, 2016 [2015 – nil] and $9,000 is included in accounts payable and accrued liabilities as at December 31, 2016.
CRITICAL ACCOUNTING ESTIMATES
The preparation of financial statements in conformity with IFRS requires management to make estimates and assumptions that affect the reported amounts of assets and liabilities and disclosure of contingent assets and liabilities at the date of the financial statements and the reported amount of revenues and expenses during the period. By their nature, these estimates are subject to a degree of uncertainty and are based on historical experience and trends in the industry. Management reviews these estimates on an ongoing basis. While management has applied judgment based on assumptions believed to be reasonable in the circumstances, actual results can vary from these assumptions. It is possible that materially different results would be reported using different assumptions.
AGI believes the accounting policies that are critical to its business relate to the use of estimates regarding the recoverability of accounts receivable and the valuation of inventory, intangibles, goodwill, convertible debentures and deferred income taxes. AGI’s accounting policies are described in the notes to its December 31, 2016 audited financial statements.
ALLOWANCE FOR DOUBTFUL ACCOUNTS
Due to the nature of AGI’s business and the credit terms it provides to its customers, estimates and judgments are inherent in the on-going assessment of the recoverability of accounts receivable. AGI maintains an allowance for doubtful accounts to reflect expected credit losses. A considerable amount of judgment is required to assess the ultimate realization of accounts receivable and these judgments must be continuously evaluated and updated. AGI is not able to predict changes in the financial conditions of its customers, and the Company’s judgment related to the recoverability of accounts receivable may be materially impacted if the financial condition of the Company’s customers deteriorates.
VALUATION OF INVENTORY
Assessments and judgments are inherent in the determination of the net realizable value of inventories. The cost of inventories may not be
fully recoverable if they are slow moving, damaged, obsolete, or if the selling price of the inventory is less than its cost. AGI regularly reviews its inventory quantities and reduces the cost attributed to inventory no longer deemed to be fully recoverable. Judgment related to the determination of net realizable value may be impacted by a number of factors including market conditions.
GOODWILL AND INTANGIBLE ASSETS
Assessments and judgments are inherent in the determination of the fair value of goodwill and intangible assets. Goodwill and indefinite life intangible assets are recorded at cost and finite life intangibles are recorded at cost less accumulated amortization. Goodwill and intangible assets are tested for impairment at least annually. Assessing goodwill and intangible assets for impairment requires considerable judgment and is based in part on current expectations regarding future performance. The classification of assets into cash generating units requires significant judgment and interpretations with respect to the integration between assets, the nature of products, the way in which management allocates resources and other relevant factors. Changes in circumstances including market conditions may materially impact the assessment of the fair value of goodwill and intangible assets.
DEFERRED INCOME TAXES
Deferred income taxes are calculated based on assumptions related to the future interpretation of tax legislation, future income tax rates, and future operating results, acquisitions and dispositions of assets and liabilities. AGI periodically reviews and adjusts its estimates and assumptions of income tax assets and liabilities as circumstances warrant. A significant change in any of the Company’s assumptions could materially affect AGI’s estimate of deferred tax assets and liabilities. See “Risks and Uncertainties – Income Tax Matters”.
FUTURE BENEFIT OF TAX-LOSS CARRYFORWARDS
AGI should only recognize the future benefit of tax-loss carryforwards where it is probable that sufficient future taxable income can be generated in order to fully utilize such losses and deductions. We are required to make significant estimates and assumptions regarding future revenues and profit, and our ability to implement certain tax
M A N A G E M E N T ’ S D I S C U S S I O N & A N A L Y S I S M A N A G E M E N T ’ S D I S C U S S I O N & A N A L Y S I S45 46
2 0 1 6 A N N U A L R E P O R TF I E L D T O C O N S U M E R
planning strategies, in order to assess the likelihood of utilizing such losses and deductions. These estimates and assumptions are subject to significant uncertainty and if changed could materially affect our assessment of the ability to fully realize the benefit of the deferred income tax assets. Deferred tax asset balances would be reduced and additional income tax expense recorded in the applicable accounting period in the event that circumstances change and we, based on revised estimates and assumptions, determined that it was no longer probable that those deferred tax assets would be fully realized. See “Risks and Uncertainties – Income Tax Matters”.
RETIREMENT BENEFITS
Provisions for defined benefit post-employment obligations are calculated by independent actuaries and reviewed by management. The principal actuarial assumptions and estimates are based on independent actuarial advice and include the discount rate and other factors.
RISKS AND UNCERTAINTIES
The risks and uncertainties described below are not the only risks and uncertainties we face. Additional risks and uncertainties not currently known to us or that we currently consider immaterial also may impair operations. If any of the following risks actually occur, our business, results of operations and financial condition, and the amount of cash available for dividends could be materially adversely affected. See also “Risks and Uncertainties” in AGI’s most recent Annual Information Form, which is available on SEDAR (www.sedar.com).
Industry Cyclicality and General Economic Conditions
Our success depends substantially on the health of the agricultural industry. The performance of the agricultural industry, including the grain handling, storage and conditioning business, is cyclical. Sales of agricultural equipment generally are related to the health of the agricultural industry, which is affected by farm income, farm input costs, debt levels and land values, all of which reflect levels of agricultural commodity prices, acreage planted, crop yields, agricultural product demand, including crops used as renewable energy sources such as ethanol, government policies and government
subsidies. Sales also are influenced by economic conditions, interest rate and exchange rate levels, and the availability of distributor and customer financing. Trends in the agricultural industry, such as farm consolidations, may affect the agricultural equipment market. In addition, weather conditions, such as floods, heat waves or droughts, can affect farmers’ buying decisions. Downturns in the agricultural industry due to these or other factors could vary by market and are likely to result in decreases in demand for agricultural equipment, which would adversely affect our sales, growth, results of operations and financial condition.
To the extent that the agricultural industry declines or experiences a downturn, this is likely to have a negative impact on the grain handling, storage and conditioning business, and the business of AGI. Among other things, the agricultural sector has in recent years benefited from an increase in crop production and investment in agricultural infrastructure including outside of North America.
To the extent crop production declines , economic conditions or sociopolitical factors result in a decrease in agricultural investment including in offshore markets, this is likely to have a negative impact on the agricultural industry in those markets and the business of AGI. In addition, if the ethanol industry declines or experiences a downturn, due to changes in governmental policies or otherwise, this is may have a negative impact on the demand for and prices of certain crops which may have a negative impact on the grain handling, storage and conditioning industry, and the business of AGI.
Future developments in the North American and global economies may negatively affect the demand for our products. Management cannot estimate the level of growth or contraction of the economy as a whole or of the economy of any particular region or market that we serve. Adverse changes in our financial condition and results of operations may occur as a result of negative economic conditions, declines in stock markets, contraction of credit availability, political instability or other factors affecting economic conditions generally.
Risk of Decreased Crop Yields
Decreased crop yields due to poor or unusual weather conditions, natural disasters or other factors are a significant risk affecting AGI.
Both reduced crop volumes and the accompanying decline in farm incomes can negatively affect demand for grain handling, storage and conditioning equipment. Poor or unusual weather conditions and natural disasters may be exacerbated by the effects of climate change.
Potential Volatility of Production Costs
Our products include various materials and components purchased from others, some or all of which may be subject to wide price variation. Consistent with industry practice, AGI seeks to manage its exposure to material and component price volatility by planning and negotiating significant purchases on an annual basis, and through the alignment of material input pricing with the terms of contractual sales commitments. AGI endeavours to pass through to customers, most, if not all, material and component price volatility. There can be no assurance, however, that industry conditions will allow AGI to continue to reduce its exposure to volatility of production costs by passing through price increases to its customers. A significant increase in the price of any component or material, such as steel, could adversely affect our profitability.
Foreign Exchange Risk
AGI’s consolidated financial statements are presented in Canadian dollars. AGI generates the majority of its sales in U.S. dollars and the remainder in Canadian dollars and other currencies including Euros, but a materially smaller proportion of its expenses are denominated in U.S. dollars and currencies other than the Canadian dollar. In addition, AGI denominates a portion of its long term borrowings in U.S. dollars as part of its foreign currency hedging strategy. Accordingly, fluctuations in the rate of exchange between the Canadian dollar and principally the U.S. dollar may significantly affect the Company’s financial results. If the Canadian dollar strengthens relative to the U.S. dollar, profit and adjusted EBITDA would decline whereas a weakening of the Canadian dollar relative to the U.S. dollar would increase profit and adjusted EBITDA. The Company regularly enters hedging arrangements as part of its foreign currency hedging strategy to partially mitigate the potential effect of fluctuating exchange rates. To the extent AGI enters into such hedging arrangements, it potentially foregoes the benefits that might result from a weakening of the Canadian dollar relative to the U.S. dollar or other currencies in which it generate sales and in
M A N A G E M E N T ’ S D I S C U S S I O N & A N A L Y S I S M A N A G E M E N T ’ S D I S C U S S I O N & A N A L Y S I S47 48
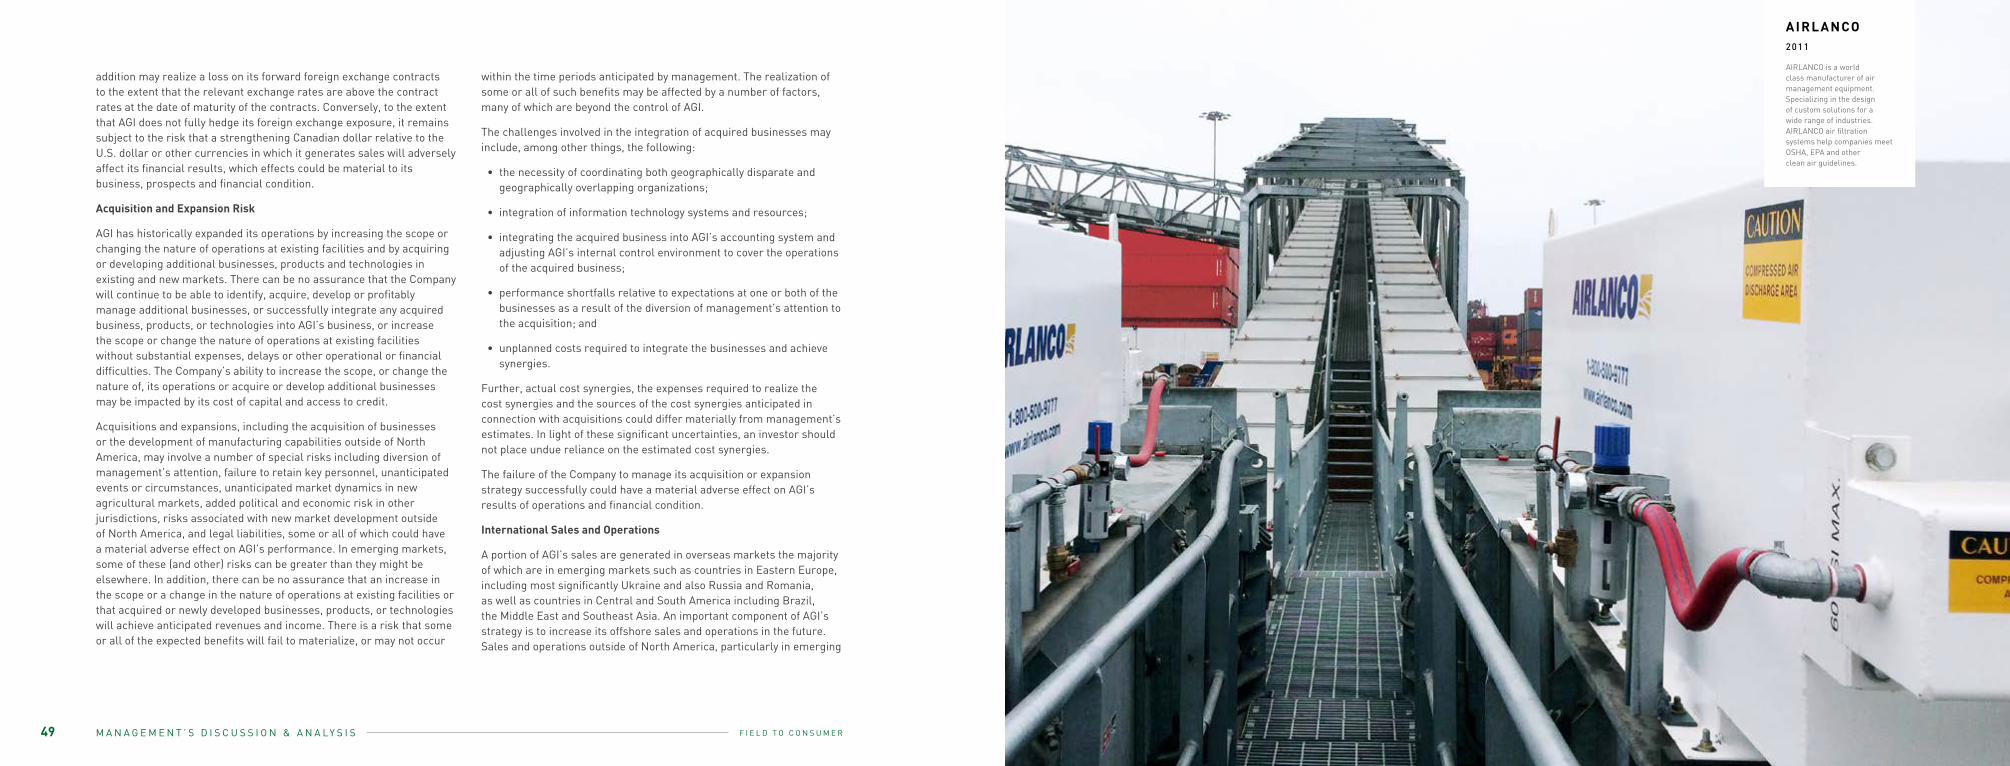
2 0 1 6 A N N U A L R E P O R TF I E L D T O C O N S U M E R
addition may realize a loss on its forward foreign exchange contracts to the extent that the relevant exchange rates are above the contract rates at the date of maturity of the contracts. Conversely, to the extent that AGI does not fully hedge its foreign exchange exposure, it remains subject to the risk that a strengthening Canadian dollar relative to the U.S. dollar or other currencies in which it generates sales will adversely affect its financial results, which effects could be material to its business, prospects and financial condition.
Acquisition and Expansion Risk
AGI has historically expanded its operations by increasing the scope or changing the nature of operations at existing facilities and by acquiring or developing additional businesses, products and technologies in existing and new markets. There can be no assurance that the Company will continue to be able to identify, acquire, develop or profitably manage additional businesses, or successfully integrate any acquired business, products, or technologies into AGI’s business, or increase the scope or change the nature of operations at existing facilities without substantial expenses, delays or other operational or financial difficulties. The Company’s ability to increase the scope, or change the nature of, its operations or acquire or develop additional businesses may be impacted by its cost of capital and access to credit.
Acquisitions and expansions, including the acquisition of businesses or the development of manufacturing capabilities outside of North America, may involve a number of special risks including diversion of management’s attention, failure to retain key personnel, unanticipated events or circumstances, unanticipated market dynamics in new agricultural markets, added political and economic risk in other jurisdictions, risks associated with new market development outside of North America, and legal liabilities, some or all of which could have a material adverse effect on AGI’s performance. In emerging markets, some of these (and other) risks can be greater than they might be elsewhere. In addition, there can be no assurance that an increase in the scope or a change in the nature of operations at existing facilities or that acquired or newly developed businesses, products, or technologies will achieve anticipated revenues and income. There is a risk that some or all of the expected benefits will fail to materialize, or may not occur
within the time periods anticipated by management. The realization of some or all of such benefits may be affected by a number of factors, many of which are beyond the control of AGI.
The challenges involved in the integration of acquired businesses may include, among other things, the following:
• the necessity of coordinating both geographically disparate and geographically overlapping organizations;
• integration of information technology systems and resources;
• integrating the acquired business into AGI’s accounting system and adjusting AGI’s internal control environment to cover the operations of the acquired business;
• performance shortfalls relative to expectations at one or both of the businesses as a result of the diversion of management’s attention to the acquisition; and
• unplanned costs required to integrate the businesses and achieve synergies.
Further, actual cost synergies, the expenses required to realize the cost synergies and the sources of the cost synergies anticipated in connection with acquisitions could differ materially from management’s estimates. In light of these significant uncertainties, an investor should not place undue reliance on the estimated cost synergies.
The failure of the Company to manage its acquisition or expansion strategy successfully could have a material adverse effect on AGI’s results of operations and financial condition.
International Sales and Operations
A portion of AGI’s sales are generated in overseas markets the majority of which are in emerging markets such as countries in Eastern Europe, including most significantly Ukraine and also Russia and Romania, as well as countries in Central and South America including Brazil, the Middle East and Southeast Asia. An important component of AGI’s strategy is to increase its offshore sales and operations in the future. Sales and operations outside of North America, particularly in emerging
M A N A G E M E N T ’ S D I S C U S S I O N & A N A L Y S I S M A N A G E M E N T ’ S D I S C U S S I O N & A N A L Y S I S49 06
AIRLANCO2011
AIRLANCO is a world class manufacturer of air management equipment.Specializing in the design of custom solutions for a wide range of industries. AIRLANCO air filtration systems help companies meet OSHA, EPA and otherclean air guidelines.
2 0 1 6 A N N U A L R E P O R TF I E L D T O C O N S U M E R
markets, are subject to various additional risks, including: currency exchange rate fluctuations; foreign economic conditions; trade barriers; competition with North American and international manufacturers and suppliers; exchange controls; restrictions on dividends and the repatriation of funds; national and regional labour strikes; political risks; limitations on foreign investment; sociopolitical instability; fraud; risk of trade embargoes and sanctions prohibiting sales to specific persons or countries; risks of increases in duties; taxes and changes in tax laws; expropriation of property, cancellation or modification of contract rights, unfavourable legal climate for the collection of unpaid accounts; unfavourable political or economic climate limiting or eliminating support from export credit agencies; changes in laws and policies governing operations of foreign-based companies; as well as risks of loss due to civil strife and acts of war.
There is no guarantee that one or more of these factors will not materially adversely affect AGI’s offshore sales and operations in the future, which could have a material adverse effect on AGI’s results of operations and financial condition.
There have also been instances of political turmoil and other instability in some of the countries in which AGI operates, including most recently in Ukraine, which has and is currently experiencing political changes, civil unrest and military action, which are contributing to significant economic uncertainty and volatility. AGI continues to closely monitor the political, economic and military situation in Ukraine, and will seek to take actions to mitigate its exposure to potential risk events. However, AGI has no way to predict outcome of the situation in Ukraine. Continued unrest, military activities, or broader-based trade sanctions or embargoes, should they be implemented, could have a material adverse effect on our sales in Ukraine and Russia and other countries in the region, and a material adverse effect on our sales, growth, results of operations and financial condition.
Potential Changes resulting from the 2016 U.S. Presidential Election
As a result of the 2016 U.S. presidential election and the related change in political agenda, coupled with the transition of administration, there is uncertainty as to the position the United States will take with respect to world affairs and events. This uncertainty may include issues such
as U.S. support for existing treaty and trade relationships with other countries, including Canada. In particular, increased protectionism in the U.S. and the proposal to implement a “border adjustment tax” that would result in unfavorable tax treatment for goods imported to the U.S. could, if implemented, have a significant impact on Canadian companies that export goods to the U.S. President Trump has also communicated his desire to renegotiate the terms of the North America Free Trade Agreement (“NAFTA”). Implementation by the U.S. of new legislative or regulatory regimes or revisions to NAFTA could impose additional costs on the Company, decrease U.S. demand for the Company’s products or otherwise negatively impact the Company, which may have a material adverse effect on the Company’s business, financial condition and operations.
Anti-Corruption Laws
The Company’s business practices must comply with the Corruption of Public Foreign Officials Act (Canada) and other applicable similar laws. These anti-corruption laws generally prohibit companies and their intermediaries from making improper payments or providing anything of value to improperly influence government officials or private individuals for the purpose of obtaining or retaining a business advantage regardless of whether those practices are legal or culturally expected in a particular jurisdiction. These risks can be more acute in emerging markets. Recently, there has been a substantial increase in the global enforcement of anti-corruption laws. If violations of these laws were to occur, they could subject us to fines and other penalties as well as increased compliance costs and could have an adverse effect on AGI’s reputation, business and results of operations and financial condition.
Agricultural Commodity Prices, International Trade and Political Uncertainty
Prices of agricultural commodities are influenced by a variety of unpredictable factors that are beyond the control of AGI, including weather, government (Canadian, United States and other) farm programs and policies, and changes in global demand or other economic factors. A decrease in agricultural commodity prices could negatively affect the agricultural sector, and the business of AGI. New
M A N A G E M E N T ’ S D I S C U S S I O N & A N A L Y S I S M A N A G E M E N T ’ S D I S C U S S I O N & A N A L Y S I S51 52
2 0 1 6 A N N U A L R E P O R TF I E L D T O C O N S U M E R
legislation or amendments to existing legislation, including the Energy Independence and Security Act in the U.S. of 2007 or the 2014 Farm Bill, may ultimately affect demand for the Company’s products. The world grain market is subject to numerous risks and uncertainties, including risks and uncertainties related to international trade and global political conditions.
Competition
AGI experiences competition in the markets in which it operates. Certain of AGI’s competitors have greater financial and capital resources than AGI. AGI could face increased competition from newly formed or emerging entities, as well as from established entities that choose to focus (or increase their existing focus) on AGI’s primary markets. As the grain handling, storage and conditioning equipment sector is fragmented, there is also a risk that a larger, formidable competitor may be created through a combination of one or more smaller competitors. AGI may also face potential competition from the emergence of new products or technology.
Seasonality of Business
The agricultural equipment business is highly seasonal, which causes our quarterly results and our cash flow to fluctuate during the year. Our sales historically have been higher in the second and third calendar quarters compared with the first and fourth quarters and our cash flow has been lower in the first three quarters of each calendar year, which may affect the ability of the Company to make cash dividends to shareholders, or the quantum of such dividends, if any. No assurance can be given that AGI’s credit facility will be sufficient to offset the seasonal variations in AGI’s cash flow.
Business Interruption
The operation of AGI’s manufacturing facilities are subject to a number of business interruption risks, including delays in obtaining production materials, plant shutdowns, labour disruptions and weather conditions/natural disasters. AGI may suffer damages associated with such events that it cannot insure against or which it may elect not to insure against because of high premium costs or other reasons. For instance, AGI’s Rosenort facility is located in an area that is often subject to widespread
flooding, and insurance coverage for this type of business interruption is limited. AGI is not able to predict the occurrence of business interruptions.
Litigation
In the ordinary course of its business, AGI may be party to various legal actions, the outcome of which cannot be predicted with certainty. One category of potential legal actions is product liability claims. Farming is an inherently dangerous occupation. Grain handling, storage and conditioning equipment used on farms or in commercial applications may result in product liability claims that require insuring of risk and management of the legal process.
Dependence on Key Personnel
AGI’s future business, financial condition, and operating results depend on the continued contributions of certain of AGI’s executive officers and other key management and personnel, certain of whom would be difficult to replace.
Labour Costs and Shortages
The success of AGI’s business depends on a large number of both hourly and salaried employees. Changes in the general conditions of the employment market could affect the ability of AGI to hire or retain staff at current wage levels. The occurrence of either of these events could have an adverse effect on the Company’s results of operations.
Distribution, Sales Representative and Supply Contracts
AGI typically does not enter into written agreements with its dealers, distributors or suppliers in North America. As a result, such parties may, without notice or penalty, terminate their relationship with AGI at any time. In addition, even if such parties should decide to continue their relationship with AGI, there can be no guarantee that the consideration or other terms of such contracts will continue on the same basis.
AGI often enters into supply agreements with customers outside of North America. These contracts may include penalties for non-performance including in relation to product quality, late delivery and in some cases project assembly services. In addition, contractual
commitments negotiated with foreign customers conducted in languages other than English may increase the likelihood of disputes with respect to agreed upon commitments. In the event AGI fails to perform to the standards of its contractual commitments, it could suffer a negative financial impact, which in some cases could be material.
Availability of Credit
AGI’s credit facility matures on May 19, 2019 and is renewable at the option of the lenders. There can be no guarantee the Company will be able to obtain alternate financing and no guarantee that future credit facilities will have the same terms and conditions as the existing facility. This may have an adverse effect on the Company, its ability to pay dividends and the market value of its Common Shares and other securities. In addition, the business of the Company may be adversely impacted in the event that the Company’s customers do not have access to sufficient financing to purchase AGI’s products and services. Sales related to the construction of commercial grain handling facilities, sales to developing markets, and sales to North American farmers may be negatively impacted.
Interest Rates
AGI’s term and operating credit facilities bear interest at rates that are in part dependent on performance based financial ratios. The Company’s cost of borrowing may be impacted to the extent that the ratio calculation results in an increase in the performance based component of the interest rate. To the extent that the Company has term and operating loans where the fluctuations in the cost of borrowing are not mitigated by interest rate swaps, the Company’s cost of borrowing may be impacted by fluctuations in market interest rates.
Operating Hazards
AGI’s revenue is dependent on the continued operation of its facilities. The operation of facilities involves risks, including the failure or substandard performance of equipment, natural disasters, suspension of operations and new governmental statutes, regulations, guidelines and policies. AGI’s operations are also subject to various hazards incidental to the production, use, handling, processing, storage and transportation of certain hazardous materials. These hazards can cause
fatal personal injury, severe damage to and destruction of property and equipment and environmental damage. There can be no assurance that as a result of past or future operations, there will not be claims of injury by employees or members of the public due to exposure, or alleged exposure, to these materials. There can be no assurance as to the actual amount of these liabilities or their timing.
Uninsured and Underinsured Losses
AGI uses its discretion in determining amounts, coverage limits and deductibility provisions of insurance, with a view to maintaining appropriate insurance coverage on its assets and operations at a commercially reasonable cost and on suitable terms. This may result in insurance coverage that, in the event of a substantial loss, would not be sufficient to pay the full current market value or current replacement cost of its assets or cover the cost of a particular claim.
AGI obtains insurance for certain of its accounts receivables outside of North America while assuming a percentage of the risk, most often 10% of the insured amount. In the event that AGI is unable to collect on its accounts receivables outside of North America, the Company will incur financial losses related to the uninsured portion.
Income Tax Matters
Income tax provisions, including current and deferred income tax assets and liabilities, and income tax filing positions require estimates and interpretations of income tax rules and regulations of the various jurisdictions in which AGI operates and judgments as to their interpretation and application to AGI’s specific situation. The amount and timing of reversals of temporary differences also depends on AGI’s future operating results, acquisitions and dispositions of assets and liabilities. The business and operations of AGI are complex and AGI has executed a number of significant financings, acquisitions, reorganizations and business combinations over the course of its history. The computation of income taxes payable as a result of these transactions involves many complex factors as well as AGI’s interpretation of and compliance with relevant tax legislation and regulations. While AGI believes that its’ existing and proposed tax filing positions are probable to be sustained, there are a number of existing
M A N A G E M E N T ’ S D I S C U S S I O N & A N A L Y S I S M A N A G E M E N T ’ S D I S C U S S I O N & A N A L Y S I S53 54
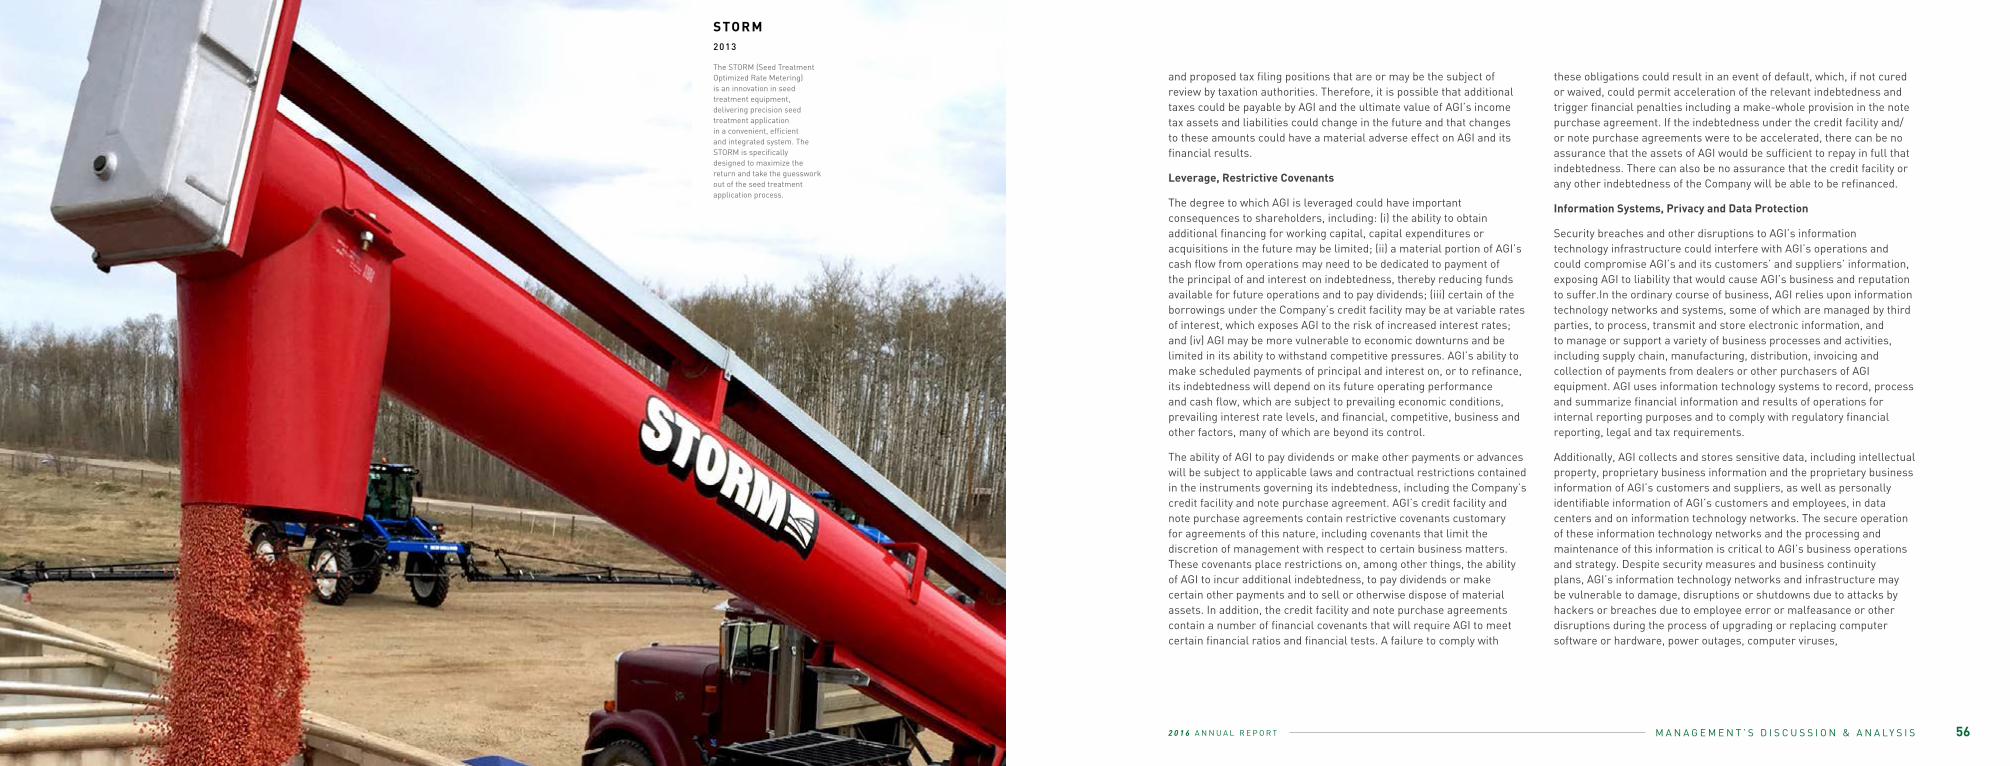
2 0 1 6 A N N U A L R E P O R TF I E L D T O C O N S U M E R
and proposed tax filing positions that are or may be the subject of review by taxation authorities. Therefore, it is possible that additional taxes could be payable by AGI and the ultimate value of AGI’s income tax assets and liabilities could change in the future and that changes to these amounts could have a material adverse effect on AGI and its financial results.
Leverage, Restrictive Covenants
The degree to which AGI is leveraged could have important consequences to shareholders, including: (i) the ability to obtain additional financing for working capital, capital expenditures or acquisitions in the future may be limited; (ii) a material portion of AGI’s cash flow from operations may need to be dedicated to payment of the principal of and interest on indebtedness, thereby reducing funds available for future operations and to pay dividends; (iii) certain of the borrowings under the Company’s credit facility may be at variable rates of interest, which exposes AGI to the risk of increased interest rates; and (iv) AGI may be more vulnerable to economic downturns and be limited in its ability to withstand competitive pressures. AGI’s ability to make scheduled payments of principal and interest on, or to refinance, its indebtedness will depend on its future operating performance and cash flow, which are subject to prevailing economic conditions, prevailing interest rate levels, and financial, competitive, business and other factors, many of which are beyond its control.
The ability of AGI to pay dividends or make other payments or advances will be subject to applicable laws and contractual restrictions contained in the instruments governing its indebtedness, including the Company’s credit facility and note purchase agreement. AGI’s credit facility and note purchase agreements contain restrictive covenants customary for agreements of this nature, including covenants that limit the discretion of management with respect to certain business matters. These covenants place restrictions on, among other things, the ability of AGI to incur additional indebtedness, to pay dividends or make certain other payments and to sell or otherwise dispose of material assets. In addition, the credit facility and note purchase agreements contain a number of financial covenants that will require AGI to meet certain financial ratios and financial tests. A failure to comply with
these obligations could result in an event of default, which, if not cured or waived, could permit acceleration of the relevant indebtedness and trigger financial penalties including a make-whole provision in the note purchase agreement. If the indebtedness under the credit facility and/or note purchase agreements were to be accelerated, there can be no assurance that the assets of AGI would be sufficient to repay in full that indebtedness. There can also be no assurance that the credit facility or any other indebtedness of the Company will be able to be refinanced.
Information Systems, Privacy and Data Protection
Security breaches and other disruptions to AGI’s information technology infrastructure could interfere with AGI’s operations and could compromise AGI’s and its customers’ and suppliers’ information, exposing AGI to liability that would cause AGI’s business and reputation to suffer.In the ordinary course of business, AGI relies upon information technology networks and systems, some of which are managed by third parties, to process, transmit and store electronic information, and to manage or support a variety of business processes and activities, including supply chain, manufacturing, distribution, invoicing and collection of payments from dealers or other purchasers of AGI equipment. AGI uses information technology systems to record, process and summarize financial information and results of operations for internal reporting purposes and to comply with regulatory financial reporting, legal and tax requirements.
Additionally, AGI collects and stores sensitive data, including intellectual property, proprietary business information and the proprietary business information of AGI’s customers and suppliers, as well as personally identifiable information of AGI’s customers and employees, in data centers and on information technology networks. The secure operation of these information technology networks and the processing and maintenance of this information is critical to AGI’s business operations and strategy. Despite security measures and business continuity plans, AGI’s information technology networks and infrastructure may be vulnerable to damage, disruptions or shutdowns due to attacks by hackers or breaches due to employee error or malfeasance or other disruptions during the process of upgrading or replacing computer software or hardware, power outages, computer viruses,
M A N A G E M E N T ’ S D I S C U S S I O N & A N A L Y S I S M A N A G E M E N T ’ S D I S C U S S I O N & A N A L Y S I S05 56
STORM2013
The STORM (Seed Treatment Optimized Rate Metering) is an innovation in seed treatment equipment, delivering precision seed treatment applicationin a convenient, efficient and integrated system. The STORM is specificallydesigned to maximize the return and take the guesswork out of the seed treatment application process.
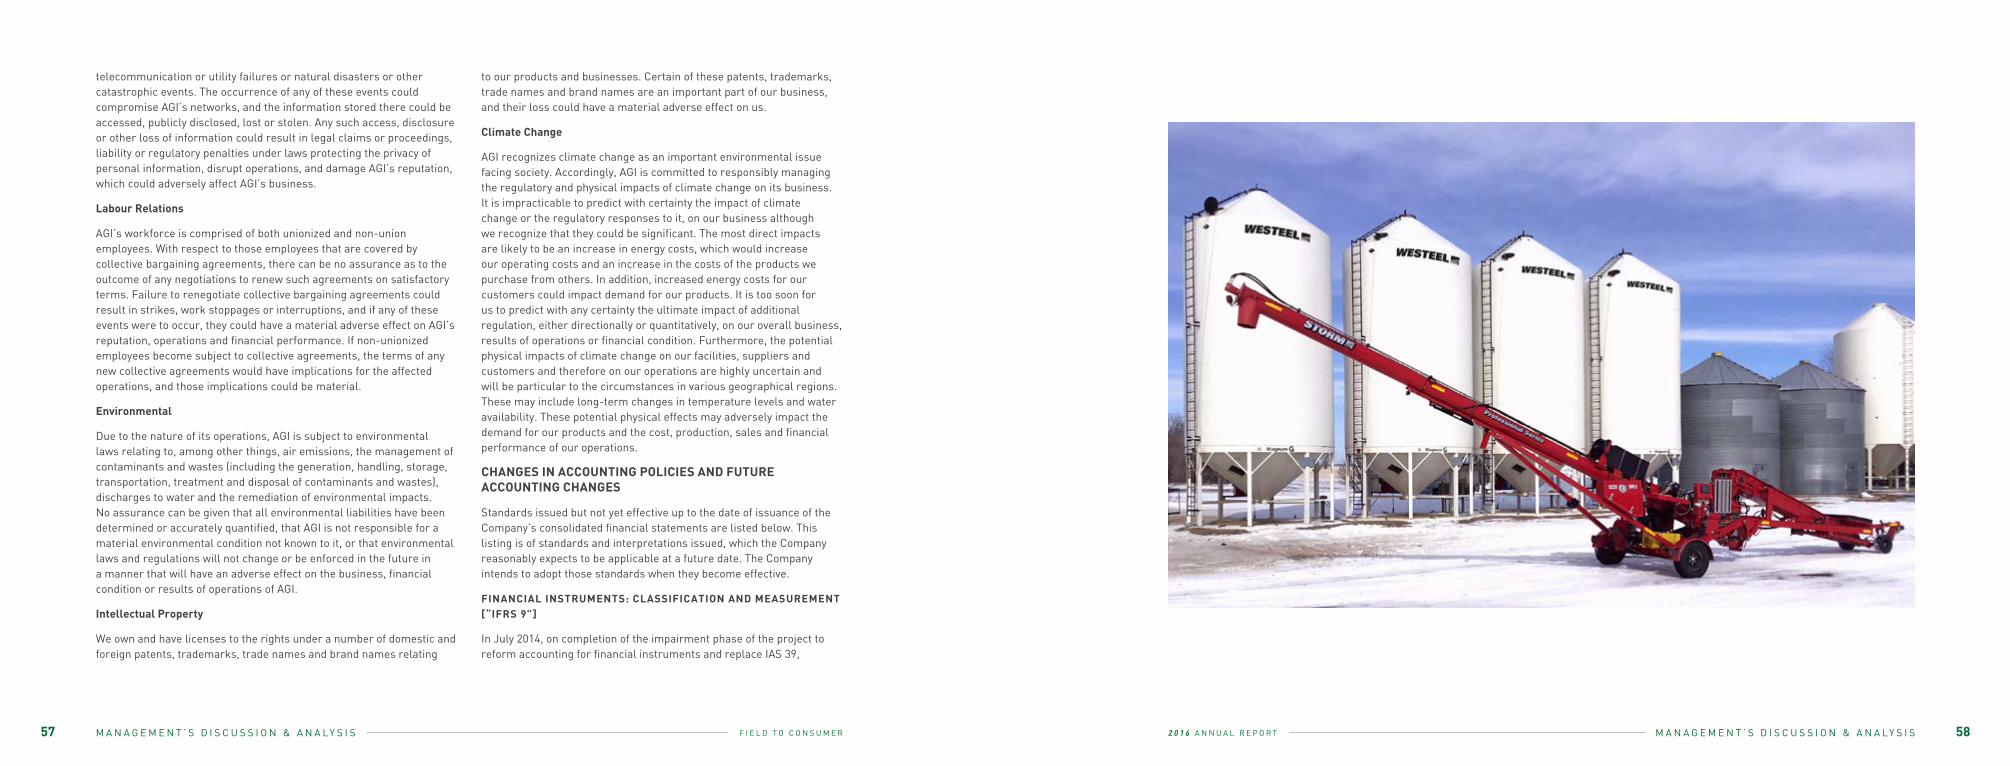
2 0 1 6 A N N U A L R E P O R TF I E L D T O C O N S U M E R
telecommunication or utility failures or natural disasters or other catastrophic events. The occurrence of any of these events could compromise AGI’s networks, and the information stored there could be accessed, publicly disclosed, lost or stolen. Any such access, disclosure or other loss of information could result in legal claims or proceedings, liability or regulatory penalties under laws protecting the privacy of personal information, disrupt operations, and damage AGI’s reputation, which could adversely affect AGI’s business.
Labour Relations
AGI’s workforce is comprised of both unionized and non-union employees. With respect to those employees that are covered by collective bargaining agreements, there can be no assurance as to the outcome of any negotiations to renew such agreements on satisfactory terms. Failure to renegotiate collective bargaining agreements could result in strikes, work stoppages or interruptions, and if any of these events were to occur, they could have a material adverse effect on AGI’s reputation, operations and financial performance. If non-unionized employees become subject to collective agreements, the terms of any new collective agreements would have implications for the affected operations, and those implications could be material.
Environmental
Due to the nature of its operations, AGI is subject to environmental laws relating to, among other things, air emissions, the management of contaminants and wastes (including the generation, handling, storage, transportation, treatment and disposal of contaminants and wastes), discharges to water and the remediation of environmental impacts. No assurance can be given that all environmental liabilities have been determined or accurately quantified, that AGI is not responsible for a material environmental condition not known to it, or that environmental laws and regulations will not change or be enforced in the future in a manner that will have an adverse effect on the business, financial condition or results of operations of AGI.
Intellectual Property
We own and have licenses to the rights under a number of domestic and foreign patents, trademarks, trade names and brand names relating
to our products and businesses. Certain of these patents, trademarks, trade names and brand names are an important part of our business, and their loss could have a material adverse effect on us.
Climate Change
AGI recognizes climate change as an important environmental issue facing society. Accordingly, AGI is committed to responsibly managing the regulatory and physical impacts of climate change on its business. It is impracticable to predict with certainty the impact of climate change or the regulatory responses to it, on our business although we recognize that they could be significant. The most direct impacts are likely to be an increase in energy costs, which would increase our operating costs and an increase in the costs of the products we purchase from others. In addition, increased energy costs for our customers could impact demand for our products. It is too soon for us to predict with any certainty the ultimate impact of additional regulation, either directionally or quantitatively, on our overall business, results of operations or financial condition. Furthermore, the potential physical impacts of climate change on our facilities, suppliers and customers and therefore on our operations are highly uncertain and will be particular to the circumstances in various geographical regions. These may include long-term changes in temperature levels and water availability. These potential physical effects may adversely impact the demand for our products and the cost, production, sales and financial performance of our operations.
CHANGES IN ACCOUNTING POLICIES AND FUTURE ACCOUNTING CHANGES
Standards issued but not yet effective up to the date of issuance of the Company’s consolidated financial statements are listed below. This listing is of standards and interpretations issued, which the Company reasonably expects to be applicable at a future date. The Company intends to adopt those standards when they become effective.
FINANCIAL INSTRUMENTS: CLASSIFICATION AND MEASUREMENT [“IFRS 9”]
In July 2014, on completion of the impairment phase of the project to reform accounting for financial instruments and replace IAS 39,
M A N A G E M E N T ’ S D I S C U S S I O N & A N A L Y S I S M A N A G E M E N T ’ S D I S C U S S I O N & A N A L Y S I S57 58

2 0 1 6 A N N U A L R E P O R TF I E L D T O C O N S U M E R
Financial Instruments: Recognition and Measurement, the IASB issued the final version of IFRS 9, Financial Instruments. IFRS 9 includes guidance on the classification and measurement of financial assets and financial liabilities, impairment of financial assets [i.e., recognition of credit losses], and a new hedge accounting model. Under the classification and measurement requirements for financial assets, financial assets must be classified and measured at either amortized cost or at FVTPL or through other comprehensive income, depending on the basis of the entity’s business model for managing the financial asset and the contractual cash flow characteristics of the financial asset. The classification requirements for financial liabilities are unchanged from IAS 39. IFRS 9 requirements address the problem of volatility in net earnings arising from an issuer choosing to measure certain liabilities at fair value and require that the portion of the change in fair value due to changes in the entity’s own credit risk be presented in other comprehensive income, rather than within net earnings. The new general hedge accounting model is intended to be simpler and more closely focused on how an entity manages its risks, replaces the IAS 39 effectiveness testing requirements with the principle of an economic relationship, and eliminates the requirement for retrospective assessment of hedge effectiveness. The new requirements for impairment of financial assets introduce an expected loss impairment model that requires more timely recognition of expected credit losses. IAS 39 impairment requirements are based on an incurred loss model where credit losses are not recognized until there is evidence of a trigger event. IFRS 9 is effective for annual periods beginning on or after January 1, 2018, with early application permitted. The Company is currently evaluating the impact of adopting this standard on its consolidated financial statements.
REVENUE FROM CONTRACTS WITH CUSTOMERS [“IFRS 15”]
IFRS 15, Revenue from Contracts with Customers, issued by the IASB in May 2014, is applicable to all revenue contracts and provides a model for the recognition and measurement of gains or losses from sales of some non-financial assets. The core principle is that revenue is recognized to depict the transfer of promised goods or services to customers in an amount that reflects the consideration to which the entity expects to be entitled in exchange for those goods or services.
The standard will also result in enhanced disclosures about revenue, provide guidance for transactions that were not previously addressed comprehensively [for example, service revenue and contract modifications] and improve guidance for multiple-element arrangements. IFRS 15 is effective for annual periods beginning on or after January 1, 2018, and is to be applied retrospectively, with earlier adoption permitted. Entities will transition following either a full or modified retrospective approach. The Company is currently evaluating the impact of the above standard on its consolidated financial statements.
LEASES [“IFRS 16”]
In January 2016, the IASB released IFRS 16, Leases, to replace the previous leases Standard, IAS 17, Leases, and related Interpretations. IFRS 16 sets out the principles for the recognition, measurement, presentation and disclosure of leases for both parties to a contract, the customer [lessee] and the supplier [lessor]. IFRS 16 eliminates the classification of leases as either operating leases or finance leases and introduces a single lessee accounting model. IFRS 16 also substantially carries forward the lessor accounting requirements. Accordingly, a lessor continues to classify its leases as operating lease or finance leases, and to account for those two types of leases differently.
IFRS 16 will be effective for the Company’s fiscal year beginning on January 1, 2019, with earlier application permitted only if the Company applies IFRS 15. The Company has not yet assessed the impact of the adoption of this standard on its consolidated financial statements.
SHARE-BASED PAYMENT [“IFRS 2”]
In June 2016, the IASB issued amendments to IFRS 2, Share-based Payment, clarifying how to account for certain types of share-based payment transactions. The amendments provide requirements on the accounting for the effects of vesting and non-vesting conditions on the measurement of cash-settled share-based payments, share-based payment transactions with a net settlement feature for withholding tax obligations and a modification to the terms and conditions of a share-based payment that changes the classification of the transaction from cash-settled to equity-settled. The amendments apply for annual
periods beginning on or after January 1, 2018. The Company is currently evaluating the impact of the amendments to IFRS 2 on its consolidated financial statements.
DISCLOSURE CONTROLS AND PROCEDURES AND INTERNAL CONTROLS
Disclosure controls and procedures are designed to provide reasonable assurance that all relevant information is gathered and reported to senior management, including AGI’s Chief Executive Officer and Chief Financial Officer, on a timely basis so that appropriate decisions can be made regarding public disclosure.
Management of AGI is responsible for designing internal controls over financial reporting for the Company as defined under National Instrument 52-109 issued by the Canadian Securities Administrators. Management has designed such internal controls over financial reporting, or caused them to be designed under their supervision, to provide reasonable assurance regarding the reliability of financial reporting and the preparation of the financial statements for external purposes in accordance with IFRS.
In 2016 AGI acquired Entringer, NuVision, Mitchell and Yargus. See “Acquisitions”. Management has not completed its review of internal controls over financial reporting or disclosure controls and procedures for these newly acquired operations. Since the acquisition occurred within 365 days of the end of the reporting period, management has limited the scope of design, and subsequent evaluation, of disclosure controls and procedures and internal controls over financial reporting to exclude controls, policies and procedures of this acquisition, as permitted under Section 3.3 of National Instrument 52-109 - Certification of Disclosure in Issuer’s Annual and Interim Filings. For the period covered by this MD&A, management has undertaken specific procedures to satisfy itself with respect to the accuracy and completeness of the financial information of Entringer, NuVision, Mitchell and Yargus. The following is the summary financial information pertaining to VIS, Entringer, NuVision and Mitchell that were included in AGI’s consolidated financial statements for the year December 31, 2016:
M A N A G E M E N T ’ S D I S C U S S I O N & A N A L Y S I S M A N A G E M E N T ’ S D I S C U S S I O N & A N A L Y S I S59 60
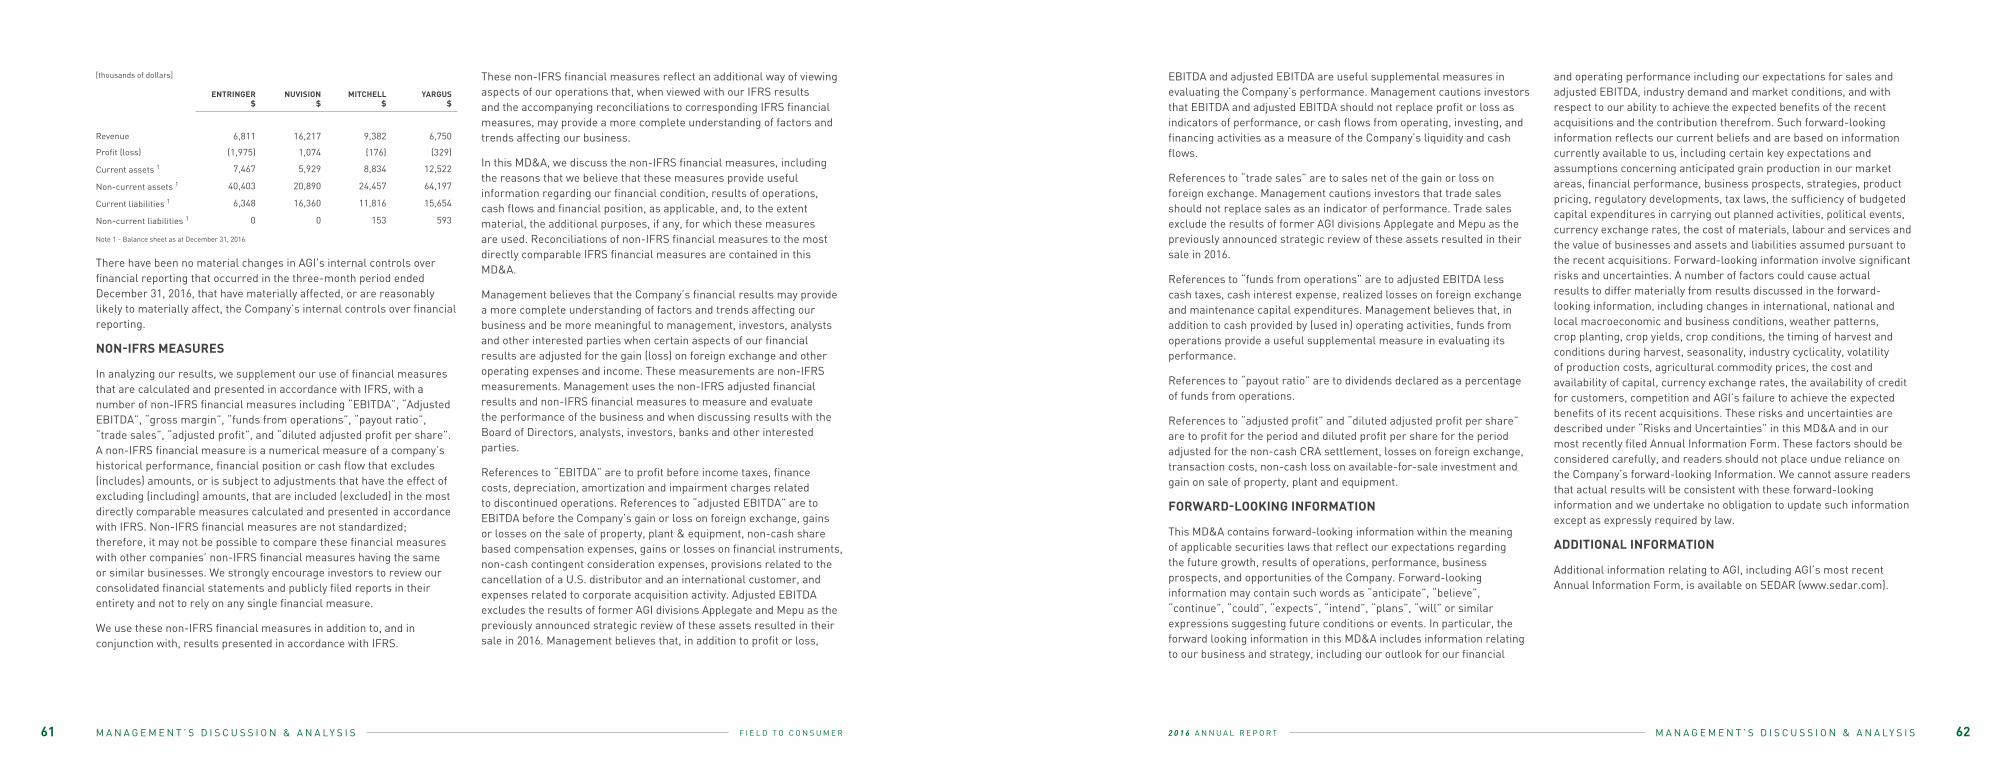
2 0 1 6 A N N U A L R E P O R TF I E L D T O C O N S U M E R
[thousands of dollars]
ENTRINGER$
NUVISION$
MITCHELL$
YARGUS$
Revenue 6,811 16,217 9,382 6,750
Profit (loss) (1,975) 1,074 (176) (329)
Current assets 1 7,467 5,929 8,834 12,522
Non-current assets 1 40,403 20,890 24,457 64,197
Current liabilities 1 6,348 16,360 11,816 15,654
Non-current liabilities 1 0 0 153 593
Note 1 - Balance sheet as at December 31, 2016
There have been no material changes in AGI’s internal controls over financial reporting that occurred in the three-month period ended December 31, 2016, that have materially affected, or are reasonably likely to materially affect, the Company’s internal controls over financial reporting.
NON-IFRS MEASURES
In analyzing our results, we supplement our use of financial measures that are calculated and presented in accordance with IFRS, with a number of non-IFRS financial measures including “EBITDA”, “Adjusted EBITDA”, “gross margin”, “funds from operations”, “payout ratio”, “trade sales”, “adjusted profit”, and “diluted adjusted profit per share”. A non-IFRS financial measure is a numerical measure of a company’s historical performance, financial position or cash flow that excludes (includes) amounts, or is subject to adjustments that have the effect of excluding (including) amounts, that are included (excluded) in the most directly comparable measures calculated and presented in accordance with IFRS. Non-IFRS financial measures are not standardized; therefore, it may not be possible to compare these financial measures with other companies’ non-IFRS financial measures having the same or similar businesses. We strongly encourage investors to review our consolidated financial statements and publicly filed reports in their entirety and not to rely on any single financial measure.
We use these non-IFRS financial measures in addition to, and in conjunction with, results presented in accordance with IFRS.
These non-IFRS financial measures reflect an additional way of viewing aspects of our operations that, when viewed with our IFRS results and the accompanying reconciliations to corresponding IFRS financial measures, may provide a more complete understanding of factors and trends affecting our business.
In this MD&A, we discuss the non-IFRS financial measures, including the reasons that we believe that these measures provide useful information regarding our financial condition, results of operations, cash flows and financial position, as applicable, and, to the extent material, the additional purposes, if any, for which these measures are used. Reconciliations of non-IFRS financial measures to the most directly comparable IFRS financial measures are contained in this MD&A.
Management believes that the Company’s financial results may provide a more complete understanding of factors and trends affecting our business and be more meaningful to management, investors, analysts and other interested parties when certain aspects of our financial results are adjusted for the gain (loss) on foreign exchange and other operating expenses and income. These measurements are non-IFRS measurements. Management uses the non-IFRS adjusted financial results and non-IFRS financial measures to measure and evaluate the performance of the business and when discussing results with the Board of Directors, analysts, investors, banks and other interested parties.
References to “EBITDA” are to profit before income taxes, finance costs, depreciation, amortization and impairment charges related to discontinued operations. References to “adjusted EBITDA” are to EBITDA before the Company’s gain or loss on foreign exchange, gains or losses on the sale of property, plant & equipment, non-cash share based compensation expenses, gains or losses on financial instruments, non-cash contingent consideration expenses, provisions related to the cancellation of a U.S. distributor and an international customer, and expenses related to corporate acquisition activity. Adjusted EBITDA excludes the results of former AGI divisions Applegate and Mepu as the previously announced strategic review of these assets resulted in their sale in 2016. Management believes that, in addition to profit or loss,
EBITDA and adjusted EBITDA are useful supplemental measures in evaluating the Company’s performance. Management cautions investors that EBITDA and adjusted EBITDA should not replace profit or loss as indicators of performance, or cash flows from operating, investing, and financing activities as a measure of the Company’s liquidity and cash flows.
References to “trade sales” are to sales net of the gain or loss on foreign exchange. Management cautions investors that trade sales should not replace sales as an indicator of performance. Trade sales exclude the results of former AGI divisions Applegate and Mepu as the previously announced strategic review of these assets resulted in their sale in 2016.
References to “funds from operations” are to adjusted EBITDA less cash taxes, cash interest expense, realized losses on foreign exchange and maintenance capital expenditures. Management believes that, in addition to cash provided by (used in) operating activities, funds from operations provide a useful supplemental measure in evaluating its performance.
References to “payout ratio” are to dividends declared as a percentage of funds from operations.
References to “adjusted profit” and “diluted adjusted profit per share” are to profit for the period and diluted profit per share for the period adjusted for the non-cash CRA settlement, losses on foreign exchange, transaction costs, non-cash loss on available-for-sale investment and gain on sale of property, plant and equipment.
FORWARD-LOOKING INFORMATION
This MD&A contains forward-looking information within the meaning of applicable securities laws that reflect our expectations regarding the future growth, results of operations, performance, business prospects, and opportunities of the Company. Forward-looking information may contain such words as “anticipate”, “believe”, “continue”, “could”, “expects”, “intend”, “plans”, “will” or similar expressions suggesting future conditions or events. In particular, the forward looking information in this MD&A includes information relating to our business and strategy, including our outlook for our financial
and operating performance including our expectations for sales and adjusted EBITDA, industry demand and market conditions, and with respect to our ability to achieve the expected benefits of the recent acquisitions and the contribution therefrom. Such forward-looking information reflects our current beliefs and are based on information currently available to us, including certain key expectations and assumptions concerning anticipated grain production in our market areas, financial performance, business prospects, strategies, product pricing, regulatory developments, tax laws, the sufficiency of budgeted capital expenditures in carrying out planned activities, political events, currency exchange rates, the cost of materials, labour and services and the value of businesses and assets and liabilities assumed pursuant to the recent acquisitions. Forward-looking information involve significant risks and uncertainties. A number of factors could cause actual results to differ materially from results discussed in the forward-looking information, including changes in international, national and local macroeconomic and business conditions, weather patterns, crop planting, crop yields, crop conditions, the timing of harvest and conditions during harvest, seasonality, industry cyclicality, volatility of production costs, agricultural commodity prices, the cost and availability of capital, currency exchange rates, the availability of credit for customers, competition and AGI’s failure to achieve the expected benefits of its recent acquisitions. These risks and uncertainties are described under “Risks and Uncertainties” in this MD&A and in our most recently filed Annual Information Form. These factors should be considered carefully, and readers should not place undue reliance on the Company’s forward-looking Information. We cannot assure readers that actual results will be consistent with these forward-looking information and we undertake no obligation to update such information except as expressly required by law.
ADDITIONAL INFORMATION
Additional information relating to AGI, including AGI’s most recent Annual Information Form, is available on SEDAR (www.sedar.com).
M A N A G E M E N T ’ S D I S C U S S I O N & A N A L Y S I S M A N A G E M E N T ’ S D I S C U S S I O N & A N A L Y S I S61 62
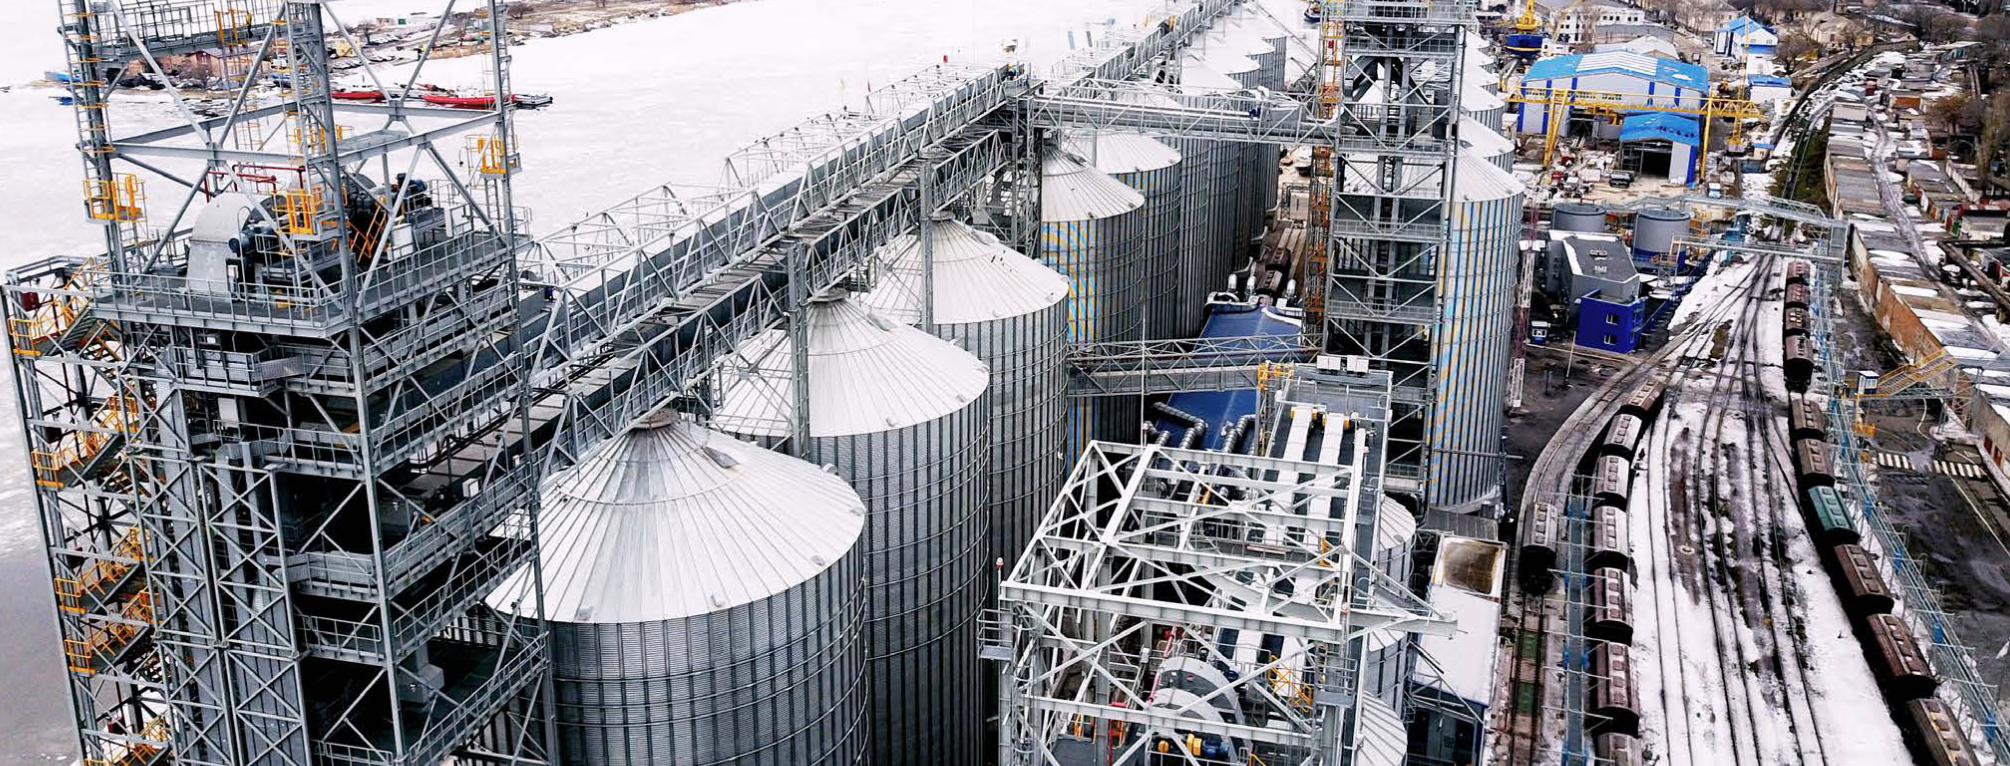
2 0 1 6 A N N U A L R E P O R TF I E L D T O C O N S U M E R
2 0 1 6 A N N U A L R E P O R TF I E L D T O C O N S U M E R
CONSOLIDATED FINANCIAL STATEMENTS
Ag growth international Inc. | December 31, 2016
To the Shareholders of Ag Growth International Inc.
We have audited the accompanying consolidated financial statements of Ag Growth International Inc., which comprise the consolidated statements of financial position as at December 31, 2016 and 2015, and the consolidated statements of income (loss), comprehensive income, changes in shareholders’ equity and cash flows for the years then ended, and a summary of significant accounting policies and other explanatory information.
MANAGEMENT’S RESPONSIBILITY FOR THE CONSOLIDATED FINANCIAL STATEMENTS
Management is responsible for the preparation and fair presentation of these consolidated financial statements in accordance with International Financial Reporting Standards, and for such internal control as management determines is necessary to enable the preparation of consolidated financial statements that are free from material misstatement, whether due to fraud or error.
AUDITORS’ RESPONSIBILITY
Our responsibility is to express an opinion on these consolidated financial statements based on our audits. We conducted our audits in accordance with Canadian generally accepted auditing standards. Those standards require that we comply with ethical requirements and plan and perform the audit to obtain reasonable assurance about whether the consolidated financial statements are free from material misstatement.
An audit involves performing procedures to obtain audit evidence about the amounts and disclosures in the consolidated financial statements. The procedures selected depend on the auditors’ judgment, including the assessment of the risks of material misstatement of the consolidated financial statements, whether due to fraud or error. In making those risk assessments, the auditors consider internal control relevant to the entity’s preparation and fair presentation of the consolidated financial statements in order to design audit procedures that are appropriate in the circumstances, but not for the purpose of expressing an opinion on the effectiveness of the entity’s internal control. An audit also includes evaluating the appropriateness
I N D E P E N D E N T A U D I T O R S ’ R E P O R T65 66I N D E P E N D E N T A U D I T O R S ’ R E P O R T
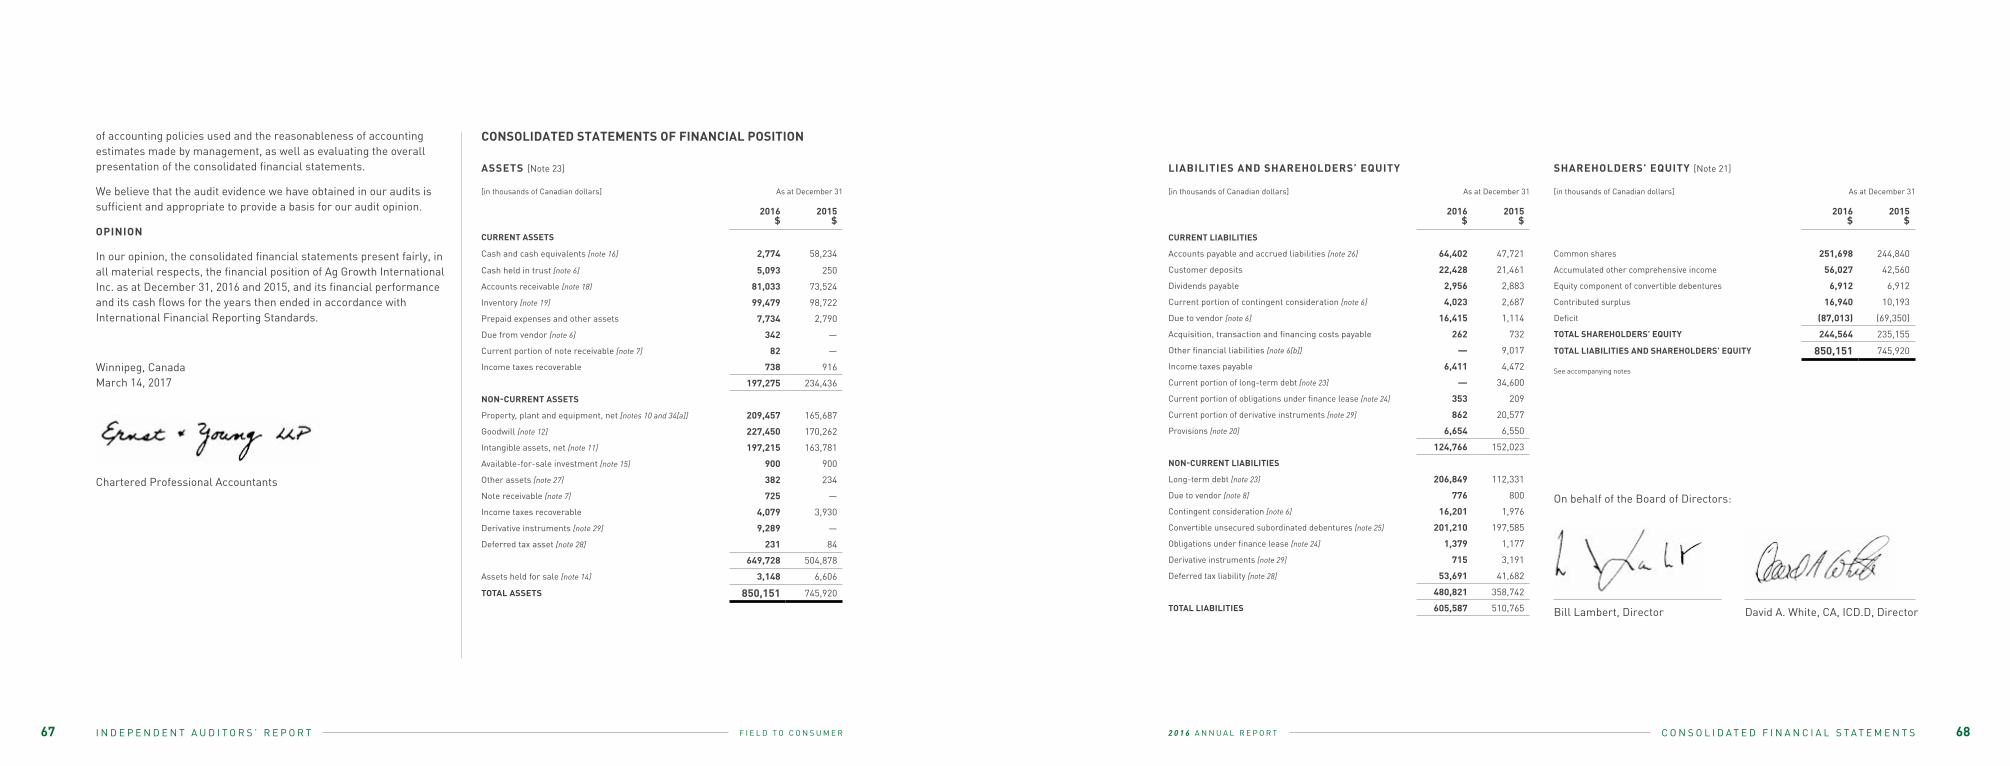
2 0 1 6 A N N U A L R E P O R TF I E L D T O C O N S U M E R
of accounting policies used and the reasonableness of accounting estimates made by management, as well as evaluating the overall presentation of the consolidated financial statements.
We believe that the audit evidence we have obtained in our audits is sufficient and appropriate to provide a basis for our audit opinion.
OPINION
In our opinion, the consolidated financial statements present fairly, in all material respects, the financial position of Ag Growth International Inc. as at December 31, 2016 and 2015, and its financial performance and its cash flows for the years then ended in accordance with International Financial Reporting Standards.
Winnipeg, Canada March 14, 2017
Chartered Professional Accountants
ASSETS [Note 23]
[in thousands of Canadian dollars] As at December 31
2016$
2015$
CURRENT ASSETS
Cash and cash equivalents [note 16] 2,774 58,234
Cash held in trust [note 6] 5,093 250
Accounts receivable [note 18] 81,033 73,524
Inventory [note 19] 99,479 98,722
Prepaid expenses and other assets 7,734 2,790
Due from vendor [note 6] 342 —
Current portion of note receivable [note 7] 82 —
Income taxes recoverable 738 916
197,275 234,436
NON-CURRENT ASSETS
Property, plant and equipment, net [notes 10 and 34[a]] 209,457 165,687
Goodwill [note 12] 227,450 170,262
Intangible assets, net [note 11] 197,215 163,781
Available-for-sale investment [note 15] 900 900
Other assets [note 27] 382 234
Note receivable [note 7] 725 —
Income taxes recoverable 4,079 3,930
Derivative instruments [note 29] 9,289 —
Deferred tax asset [note 28] 231 84
649,728 504,878
Assets held for sale [note 14] 3,148 6,606
TOTAL ASSETS 850,151 745,920
LIABILITIES AND SHAREHOLDERS’ EQUITY
2016$
2015$
CURRENT LIABILITIES
Accounts payable and accrued liabilities [note 26] 64,402 47,721
Customer deposits 22,428 21,461
Dividends payable 2,956 2,883
Current portion of contingent consideration [note 6] 4,023 2,687
Due to vendor [note 6] 16,415 1,114
Acquisition, transaction and financing costs payable 262 732
Other financial liabilities [note 6[b]] — 9,017
Income taxes payable 6,411 4,472
Current portion of long-term debt [note 23] — 34,600
Current portion of obligations under finance lease [note 24] 353 209
Current portion of derivative instruments [note 29] 862 20,577
Provisions [note 20] 6,654 6,550
124,766 152,023
NON-CURRENT LIABILITIES
Long-term debt [note 23] 206,849 112,331
Due to vendor [note 8] 776 800
Contingent consideration [note 6] 16,201 1,976
Convertible unsecured subordinated debentures [note 25] 201,210 197,585
Obligations under finance lease [note 24] 1,379 1,177
Derivative instruments [note 29] 715 3,191
Deferred tax liability [note 28] 53,691 41,682
480,821 358,742
TOTAL LIABILITIES 605,587 510,765
SHAREHOLDERS’ EQUITY [Note 21]
2016$
2015$
Common shares 251,698 244,840
Accumulated other comprehensive income 56,027 42,560
Equity component of convertible debentures 6,912 6,912
Contributed surplus 16,940 10,193
Deficit (87,013) (69,350)
TOTAL SHAREHOLDERS’ EQUITY 244,564 235,155
TOTAL LIABILITIES AND SHAREHOLDERS’ EQUITY 850,151 745,920
See accompanying notes
On behalf of the Board of Directors:
Bill Lambert, Director David A. White, CA, ICD.D, Director
CONSOLIDATED STATEMENTS OF FINANCIAL POSITION
[in thousands of Canadian dollars] As at December 31 [in thousands of Canadian dollars] As at December 31
C O N S O L I D A T E D F I N A N C I A L S T A T E M E N T S67 68I N D E P E N D E N T A U D I T O R S ’ R E P O R T
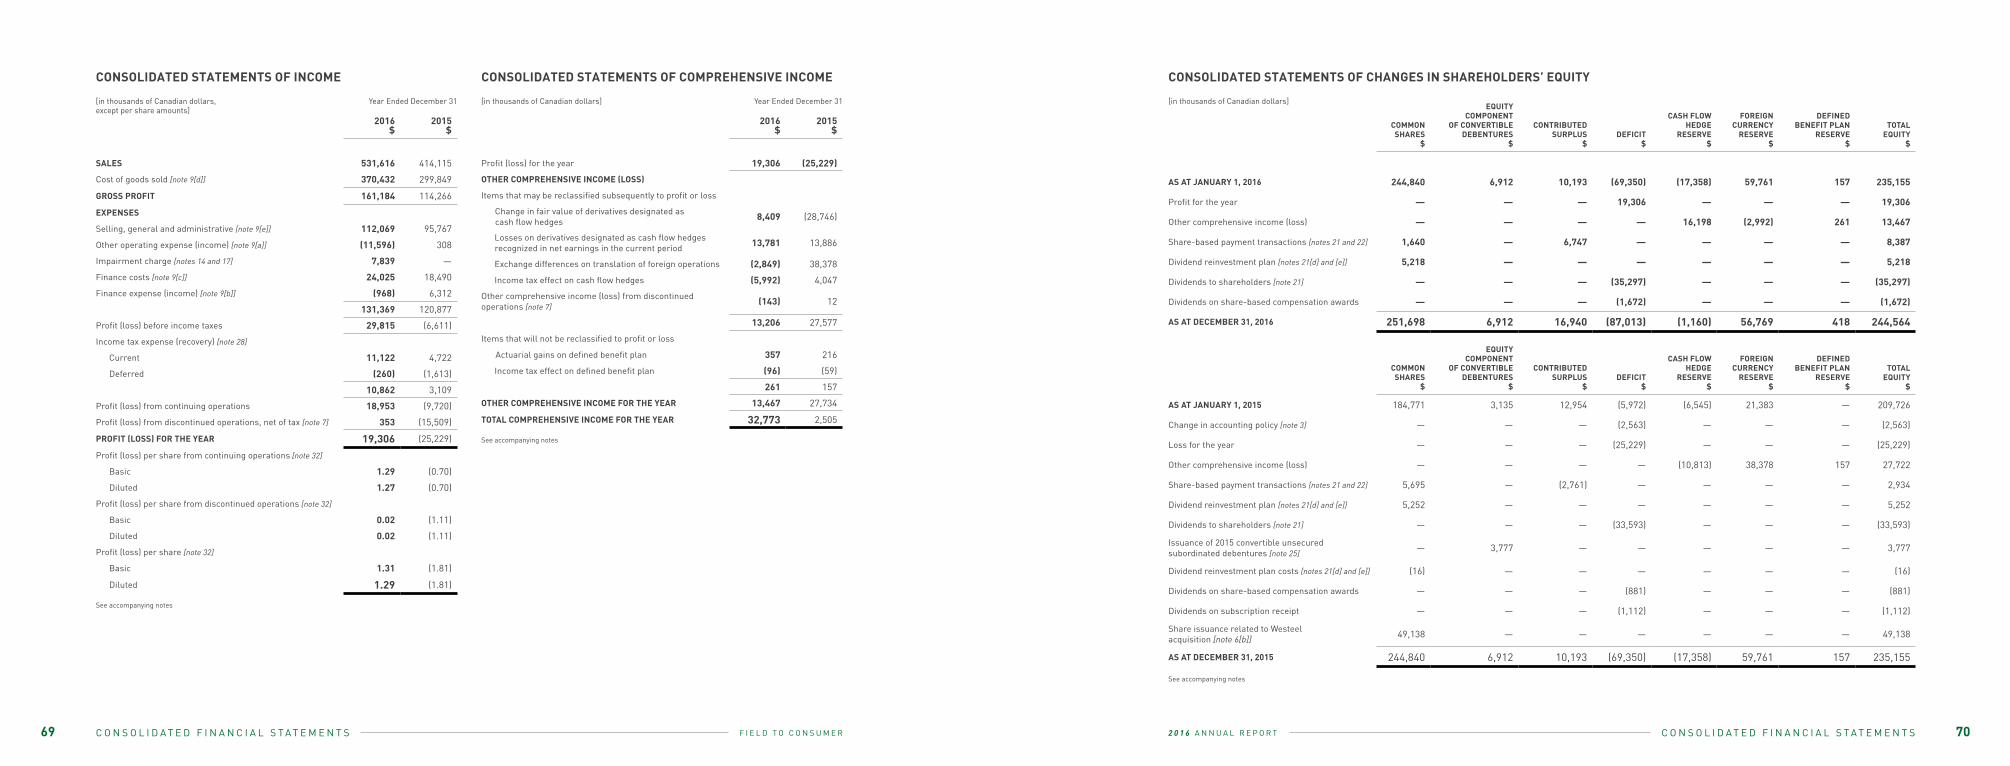
2 0 1 6 A N N U A L R E P O R TF I E L D T O C O N S U M E RC O N S O L I D A T E D F I N A N C I A L S T A T E M E N T S C O N S O L I D A T E D F I N A N C I A L S T A T E M E N T S
CONSOLIDATED STATEMENTS OF INCOME
[in thousands of Canadian dollars, except per share amounts]
Year Ended December 31
2016$
2015$
SALES 531,616 414,115
Cost of goods sold [note 9[d]] 370,432 299,849
GROSS PROFIT 161,184 114,266
EXPENSES
Selling, general and administrative [note 9[e]] 112,069 95,767
Other operating expense (income) [note 9[a]] (11,596) 308
Impairment charge [notes 14 and 17] 7,839 —
Finance costs [note 9[c]] 24,025 18,490
Finance expense (income) [note 9[b]] (968) 6,312
131,369 120,877
Profit (loss) before income taxes 29,815 (6,611)
Income tax expense (recovery) [note 28]
Current 11,122 4,722
Deferred (260) (1,613)
10,862 3,109
Profit (loss) from continuing operations 18,953 (9,720)
Profit (loss) from discontinued operations, net of tax [note 7] 353 (15,509)
PROFIT (LOSS) FOR THE YEAR 19,306 (25,229)
Profit (loss) per share from continuing operations [note 32]
Basic 1.29 (0.70)
Diluted 1.27 (0.70)
Profit (loss) per share from discontinued operations [note 32]
Basic 0.02 (1.11)
Diluted 0.02 (1.11)
Profit (loss) per share [note 32]
Basic 1.31 (1.81)
Diluted 1.29 (1.81)
See accompanying notes
CONSOLIDATED STATEMENTS OF COMPREHENSIVE INCOME
[in thousands of Canadian dollars] Year Ended December 31
2016$
2015$
Profit (loss) for the year 19,306 (25,229)
OTHER COMPREHENSIVE INCOME (LOSS)
Items that may be reclassified subsequently to profit or loss
Change in fair value of derivatives designated as cash flow hedges 8,409 (28,746)
Losses on derivatives designated as cash flow hedges recognized in net earnings in the current period 13,781 13,886
Exchange differences on translation of foreign operations (2,849) 38,378
Income tax effect on cash flow hedges (5,992) 4,047
Other comprehensive income (loss) from discontinued operations [note 7]
(143) 12
13,206 27,577
Items that will not be reclassified to profit or loss
Actuarial gains on defined benefit plan 357 216
Income tax effect on defined benefit plan (96) (59)
261 157
OTHER COMPREHENSIVE INCOME FOR THE YEAR 13,467 27,734
TOTAL COMPREHENSIVE INCOME FOR THE YEAR 32,773 2,505
See accompanying notes
CONSOLIDATED STATEMENTS OF CHANGES IN SHAREHOLDERS’ EQUITY
COMMON SHARES
$
EQUITYCOMPONENT
OF CONVERTIBLEDEBENTURES
$
CONTRIBUTEDSURPLUS
$DEFICIT
$
CASH FLOWHEDGE
RESERVE$
FOREIGNCURRENCY
RESERVE$
DEFINED BENEFIT PLAN
RESERVE$
TOTAL EQUITY
$
AS AT JANUARY 1, 2016 244,840 6,912 10,193 (69,350) (17,358) 59,761 157 235,155
Profit for the year — — — 19,306 — — — 19,306
Other comprehensive income (loss) — — — — 16,198 (2,992) 261 13,467
Share-based payment transactions [notes 21 and 22] 1,640 — 6,747 — — — — 8,387
Dividend reinvestment plan [notes 21[d] and [e]] 5,218 — — — — — — 5,218
Dividends to shareholders [note 21] — — — (35,297) — — — (35,297)
Dividends on share-based compensation awards — — — (1,672) — — — (1,672)
AS AT DECEMBER 31, 2016 251,698 6,912 16,940 (87,013) (1,160) 56,769 418 244,564
See accompanying notes
COMMON SHARES
$
EQUITYCOMPONENT
OF CONVERTIBLEDEBENTURES
$
CONTRIBUTEDSURPLUS
$DEFICIT
$
CASH FLOWHEDGE
RESERVE$
FOREIGNCURRENCY
RESERVE$
DEFINED BENEFIT PLAN
RESERVE$
TOTAL EQUITY
$
AS AT JANUARY 1, 2015 184,771 3,135 12,954 (5,972) (6,545) 21,383 — 209,726
Change in accounting policy [note 3] — — — (2,563) — — — (2,563)
Loss for the year — — — (25,229) — — — (25,229)
Other comprehensive income (loss) — — — — (10,813) 38,378 157 27,722
Share-based payment transactions [notes 21 and 22] 5,695 — (2,761) — — — — 2,934
Dividend reinvestment plan [notes 21[d] and [e]] 5,252 — — — — — — 5,252
Dividends to shareholders [note 21] — — — (33,593) — — — (33,593)
Issuance of 2015 convertible unsecured subordinated debentures [note 25]
— 3,777 — — — — — 3,777
Dividend reinvestment plan costs [notes 21[d] and [e]] (16) — — — — — — (16)
Dividends on share-based compensation awards — — — (881) — — — (881)
Dividends on subscription receipt — — — (1,112) — — — (1,112)
Share issuance related to Westeel acquisition [note 6[b]] 49,138 — — — — — — 49,138
AS AT DECEMBER 31, 2015 244,840 6,912 10,193 (69,350) (17,358) 59,761 157 235,155
[in thousands of Canadian dollars]
69 70
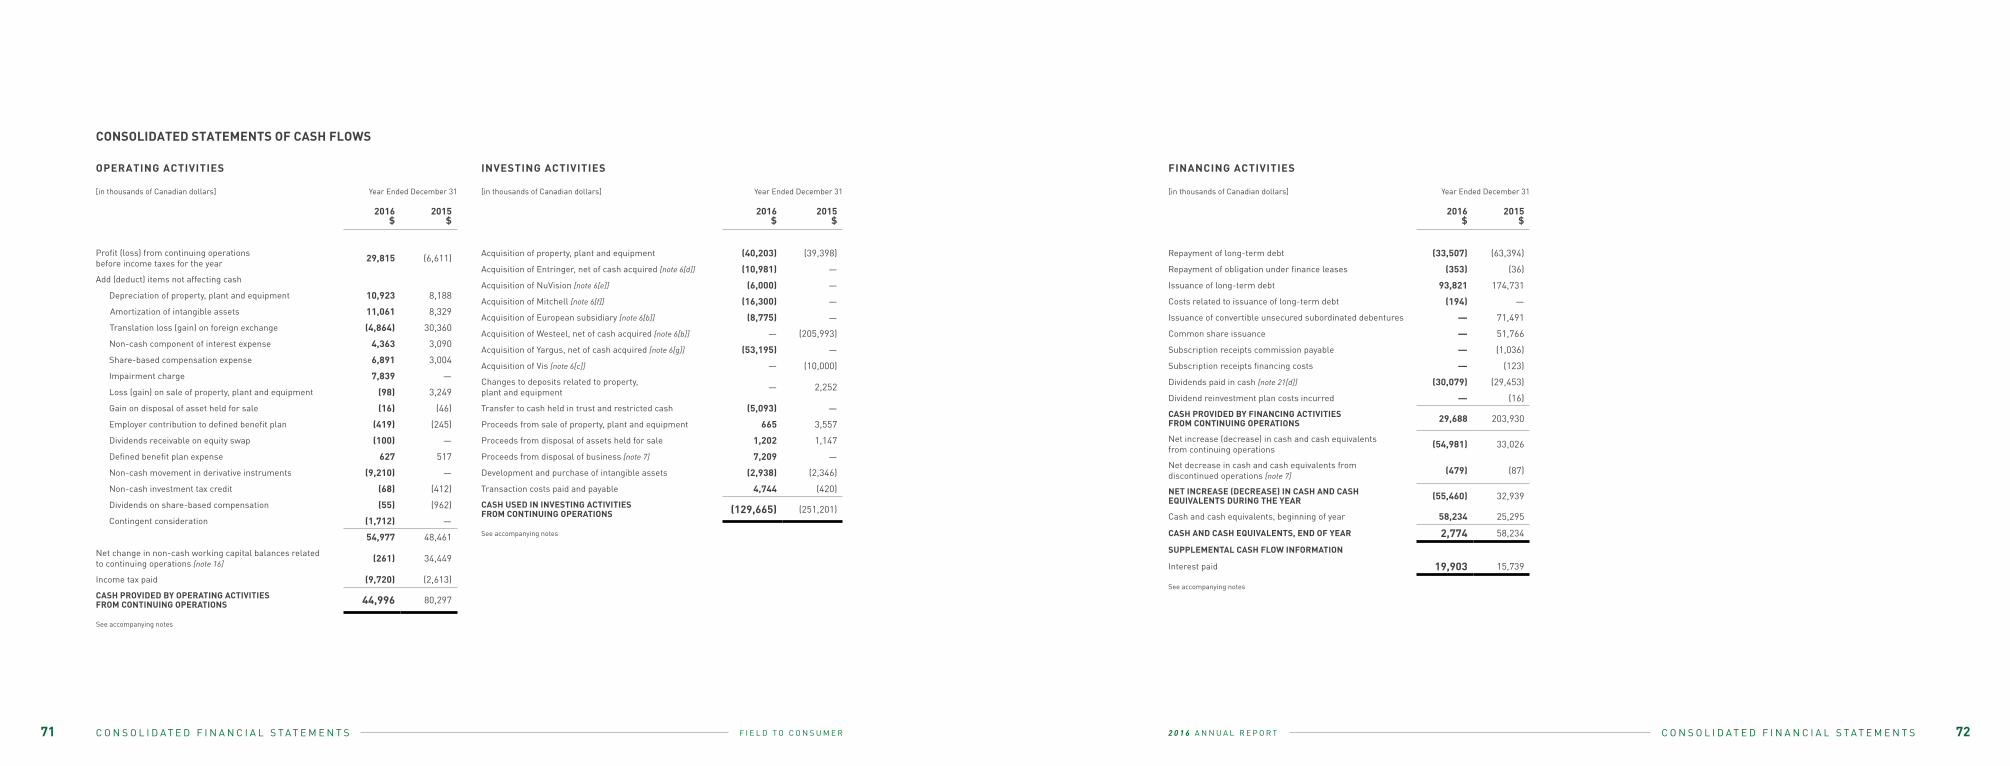
2 0 1 6 A N N U A L R E P O R TF I E L D T O C O N S U M E R C O N S O L I D A T E D F I N A N C I A L S T A T E M E N T S
OPERATING ACTIVITIES
[in thousands of Canadian dollars] Year Ended December 31
CONSOLIDATED STATEMENTS OF CASH FLOWS
2016$
2015$
Profit (loss) from continuing operations before income taxes for the year 29,815 (6,611)
Add (deduct) items not affecting cash
Depreciation of property, plant and equipment 10,923 8,188
Amortization of intangible assets 11,061 8,329
Translation loss (gain) on foreign exchange (4,864) 30,360
Non-cash component of interest expense 4,363 3,090
Share-based compensation expense 6,891 3,004
Impairment charge 7,839 —
Loss (gain) on sale of property, plant and equipment (98) 3,249
Gain on disposal of asset held for sale (16) (46)
Employer contribution to defined benefit plan (419) (245)
Dividends receivable on equity swap (100) —
Defined benefit plan expense 627 517
Non-cash movement in derivative instruments (9,210) —
Non-cash investment tax credit (68) (412)
Dividends on share-based compensation (55) (962)
Contingent consideration (1,712) —
54,977 48,461
Net change in non-cash working capital balances related to continuing operations [note 16]
(261) 34,449
Income tax paid (9,720) (2,613)
CASH PROVIDED BY OPERATING ACTIVITIES FROM CONTINUING OPERATIONS 44,996 80,297
[in thousands of Canadian dollars] Year Ended December 31
2016$
2015$
Acquisition of property, plant and equipment (40,203) (39,398)
Acquisition of Entringer, net of cash acquired [note 6[d]] (10,981) —
Acquisition of NuVision [note 6[e]] (6,000) —
Acquisition of Mitchell [note 6[f]] (16,300) —
Acquisition of European subsidiary [note 6[b]] (8,775) —
Acquisition of Westeel, net of cash acquired [note 6[b]] — (205,993)
Acquisition of Yargus, net of cash acquired [note 6[g]] (53,195) —
Acquisition of Vis [note 6[c]] — (10,000)
Changes to deposits related to property, plant and equipment — 2,252
Transfer to cash held in trust and restricted cash (5,093) —
Proceeds from sale of property, plant and equipment 665 3,557
Proceeds from disposal of assets held for sale 1,202 1,147
Proceeds from disposal of business [note 7] 7,209 —
Development and purchase of intangible assets (2,938) (2,346)
Transaction costs paid and payable 4,744 (420)
CASH USED IN INVESTING ACTIVITIES FROM CONTINUING OPERATIONS (129,665) (251,201)
INVESTING ACTIVITIES
[in thousands of Canadian dollars] Year Ended December 31
FINANCING ACTIVITIES
2016$
2015$
Repayment of long-term debt (33,507) (63,394)
Repayment of obligation under finance leases (353) (36)
Issuance of long-term debt 93,821 174,731
Costs related to issuance of long-term debt (194) —
Issuance of convertible unsecured subordinated debentures — 71,491
Common share issuance — 51,766
Subscription receipts commission payable — (1,036)
Subscription receipts financing costs — (123)
Dividends paid in cash [note 21[d]] (30,079) (29,453)
Dividend reinvestment plan costs incurred — (16)
CASH PROVIDED BY FINANCING ACTIVITIES FROM CONTINUING OPERATIONS 29,688 203,930
Net increase (decrease) in cash and cash equivalentsfrom continuing operations (54,981) 33,026
Net decrease in cash and cash equivalents from discontinued operations [note 7]
(479) (87)
NET INCREASE (DECREASE) IN CASH AND CASH EQUIVALENTS DURING THE YEAR (55,460) 32,939
Cash and cash equivalents, beginning of year 58,234 25,295
CASH AND CASH EQUIVALENTS, END OF YEAR 2,774 58,234
SUPPLEMENTAL CASH FLOW INFORMATION
Interest paid 19,903 15,739
See accompanying notes
See accompanying notes
See accompanying notes
71 72C O N S O L I D A T E D F I N A N C I A L S T A T E M E N T S
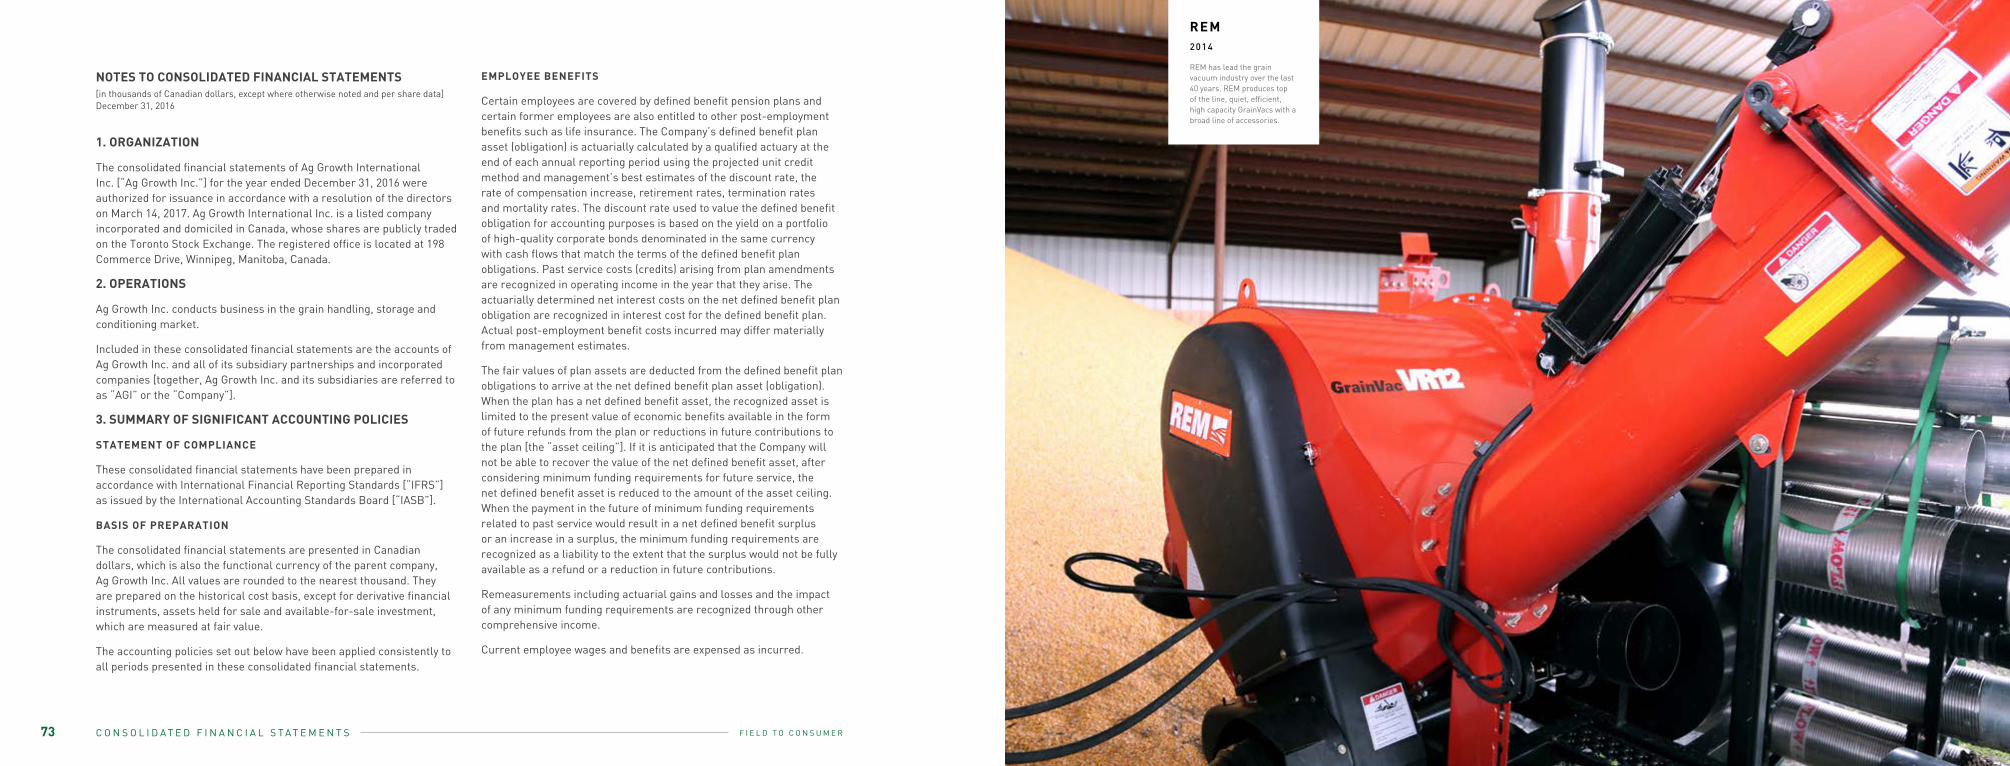
2 0 1 6 A N N U A L R E P O R TF I E L D T O C O N S U M E R C O N S O L I D A T E D F I N A N C I A L S T A T E M E N T S
1. ORGANIZATION
The consolidated financial statements of Ag Growth International Inc. [“Ag Growth Inc.”] for the year ended December 31, 2016 were authorized for issuance in accordance with a resolution of the directors on March 14, 2017. Ag Growth International Inc. is a listed company incorporated and domiciled in Canada, whose shares are publicly traded on the Toronto Stock Exchange. The registered office is located at 198 Commerce Drive, Winnipeg, Manitoba, Canada.
2. OPERATIONS
Ag Growth Inc. conducts business in the grain handling, storage and conditioning market.
Included in these consolidated financial statements are the accounts of Ag Growth Inc. and all of its subsidiary partnerships and incorporated companies [together, Ag Growth Inc. and its subsidiaries are referred to as “AGI” or the “Company”].
3. SUMMARY OF SIGNIFICANT ACCOUNTING POLICIES
STATEMENT OF COMPLIANCE
These consolidated financial statements have been prepared in accordance with International Financial Reporting Standards [“IFRS”] as issued by the International Accounting Standards Board [“IASB”].
BASIS OF PREPARATION
The consolidated financial statements are presented in Canadian dollars, which is also the functional currency of the parent company, Ag Growth Inc. All values are rounded to the nearest thousand. They are prepared on the historical cost basis, except for derivative financial instruments, assets held for sale and available-for-sale investment, which are measured at fair value.
The accounting policies set out below have been applied consistently to all periods presented in these consolidated financial statements.
EMPLOYEE BENEFITS
Certain employees are covered by defined benefit pension plans and certain former employees are also entitled to other post-employment benefits such as life insurance. The Company’s defined benefit plan asset (obligation) is actuarially calculated by a qualified actuary at the end of each annual reporting period using the projected unit credit method and management’s best estimates of the discount rate, the rate of compensation increase, retirement rates, termination rates and mortality rates. The discount rate used to value the defined benefit obligation for accounting purposes is based on the yield on a portfolio of high-quality corporate bonds denominated in the same currency with cash flows that match the terms of the defined benefit plan obligations. Past service costs (credits) arising from plan amendments are recognized in operating income in the year that they arise. The actuarially determined net interest costs on the net defined benefit plan obligation are recognized in interest cost for the defined benefit plan. Actual post-employment benefit costs incurred may differ materially from management estimates.
The fair values of plan assets are deducted from the defined benefit plan obligations to arrive at the net defined benefit plan asset (obligation). When the plan has a net defined benefit asset, the recognized asset is limited to the present value of economic benefits available in the form of future refunds from the plan or reductions in future contributions to the plan [the “asset ceiling”]. If it is anticipated that the Company will not be able to recover the value of the net defined benefit asset, after considering minimum funding requirements for future service, the net defined benefit asset is reduced to the amount of the asset ceiling. When the payment in the future of minimum funding requirements related to past service would result in a net defined benefit surplus or an increase in a surplus, the minimum funding requirements are recognized as a liability to the extent that the surplus would not be fully available as a refund or a reduction in future contributions.
Remeasurements including actuarial gains and losses and the impact of any minimum funding requirements are recognized through other comprehensive income.
Current employee wages and benefits are expensed as incurred.
NOTES TO CONSOLIDATED FINANCIAL STATEMENTS[in thousands of Canadian dollars, except where otherwise noted and per share data]December 31, 2016
73 06
REM2014
REM has lead the grain vacuum industry over the last 40 years. REM produces top of the line, quiet, efficient, high capacity GrainVacs with a broad line of accessories.
C O N S O L I D A T E D F I N A N C I A L S T A T E M E N T S
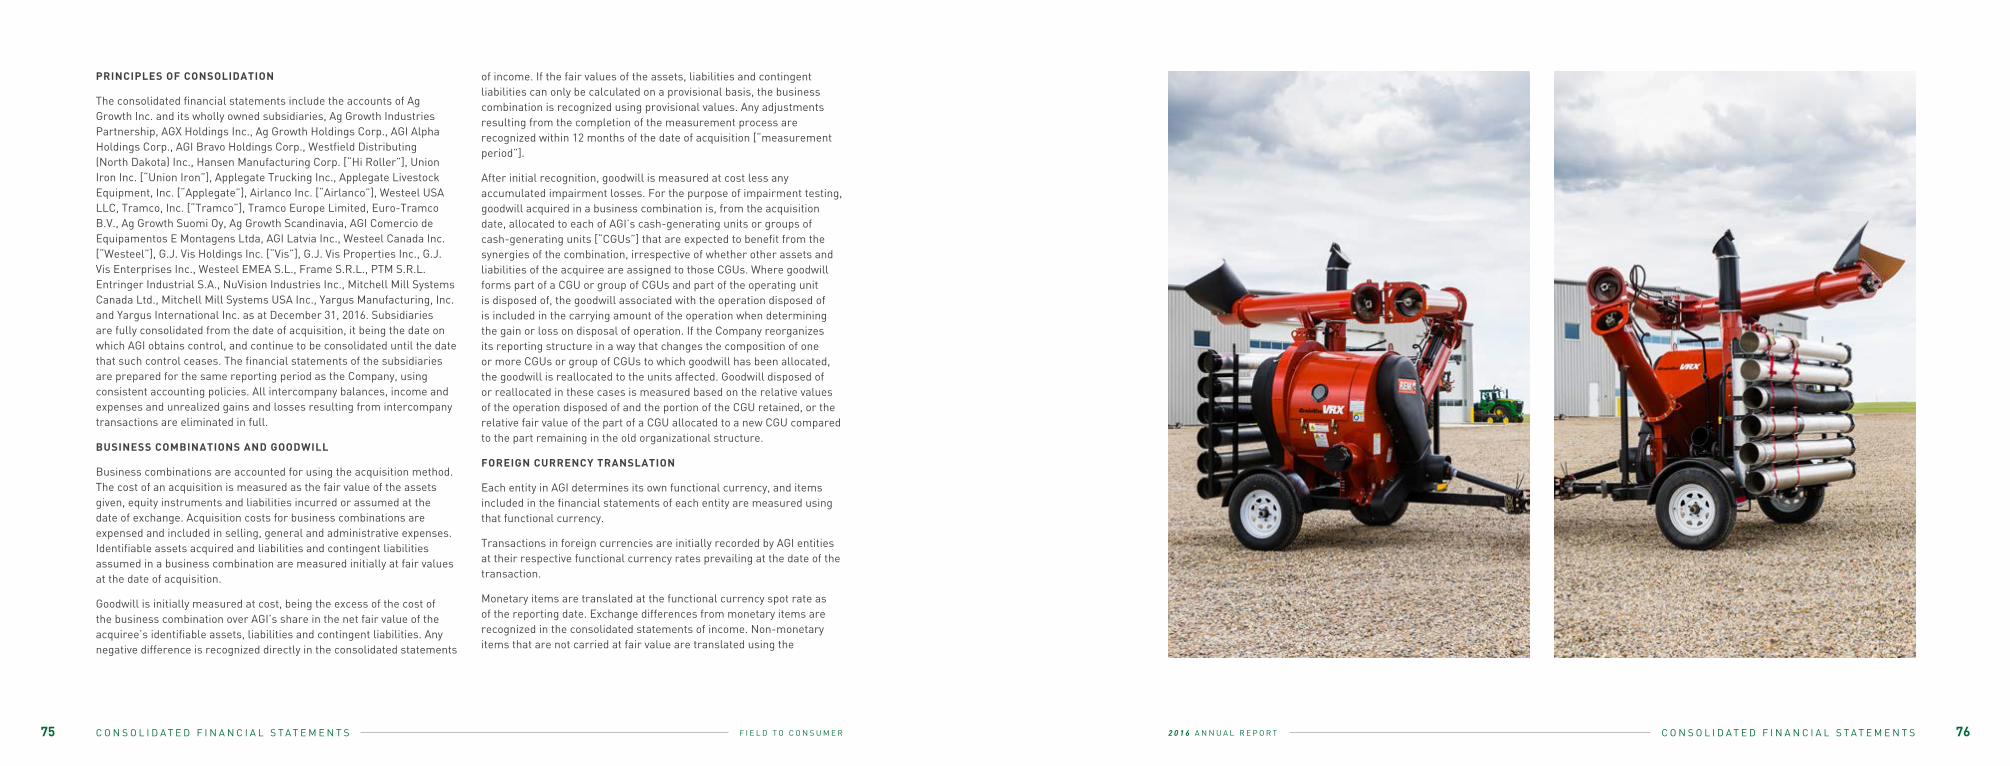
2 0 1 6 A N N U A L R E P O R TF I E L D T O C O N S U M E R C O N S O L I D A T E D F I N A N C I A L S T A T E M E N T S
PRINCIPLES OF CONSOLIDATION
The consolidated financial statements include the accounts of Ag Growth Inc. and its wholly owned subsidiaries, Ag Growth Industries Partnership, AGX Holdings Inc., Ag Growth Holdings Corp., AGI Alpha Holdings Corp., AGI Bravo Holdings Corp., Westfield Distributing (North Dakota) Inc., Hansen Manufacturing Corp. [“Hi Roller”], Union Iron Inc. [“Union Iron”], Applegate Trucking Inc., Applegate Livestock Equipment, Inc. [“Applegate”], Airlanco Inc. [“Airlanco”], Westeel USA LLC, Tramco, Inc. [“Tramco”], Tramco Europe Limited, Euro-Tramco B.V., Ag Growth Suomi Oy, Ag Growth Scandinavia, AGI Comercio de Equipamentos E Montagens Ltda, AGI Latvia Inc., Westeel Canada Inc. [“Westeel”], G.J. Vis Holdings Inc. [“Vis”], G.J. Vis Properties Inc., G.J. Vis Enterprises Inc., Westeel EMEA S.L., Frame S.R.L., PTM S.R.L. Entringer Industrial S.A., NuVision Industries Inc., Mitchell Mill Systems Canada Ltd., Mitchell Mill Systems USA Inc., Yargus Manufacturing, Inc. and Yargus International Inc. as at December 31, 2016. Subsidiaries are fully consolidated from the date of acquisition, it being the date on which AGI obtains control, and continue to be consolidated until the date that such control ceases. The financial statements of the subsidiaries are prepared for the same reporting period as the Company, using consistent accounting policies. All intercompany balances, income and expenses and unrealized gains and losses resulting from intercompany transactions are eliminated in full.
BUSINESS COMBINATIONS AND GOODWILL
Business combinations are accounted for using the acquisition method. The cost of an acquisition is measured as the fair value of the assets given, equity instruments and liabilities incurred or assumed at the date of exchange. Acquisition costs for business combinations are expensed and included in selling, general and administrative expenses. Identifiable assets acquired and liabilities and contingent liabilities assumed in a business combination are measured initially at fair values at the date of acquisition.
Goodwill is initially measured at cost, being the excess of the cost of the business combination over AGI’s share in the net fair value of the acquiree’s identifiable assets, liabilities and contingent liabilities. Any negative difference is recognized directly in the consolidated statements
of income. If the fair values of the assets, liabilities and contingent liabilities can only be calculated on a provisional basis, the business combination is recognized using provisional values. Any adjustments resulting from the completion of the measurement process are recognized within 12 months of the date of acquisition [“measurement period”].
After initial recognition, goodwill is measured at cost less any accumulated impairment losses. For the purpose of impairment testing, goodwill acquired in a business combination is, from the acquisition date, allocated to each of AGI’s cash-generating units or groups of cash-generating units [“CGUs”] that are expected to benefit from the synergies of the combination, irrespective of whether other assets and liabilities of the acquiree are assigned to those CGUs. Where goodwill forms part of a CGU or group of CGUs and part of the operating unit is disposed of, the goodwill associated with the operation disposed of is included in the carrying amount of the operation when determining the gain or loss on disposal of operation. If the Company reorganizes its reporting structure in a way that changes the composition of one or more CGUs or group of CGUs to which goodwill has been allocated, the goodwill is reallocated to the units affected. Goodwill disposed of or reallocated in these cases is measured based on the relative values of the operation disposed of and the portion of the CGU retained, or the relative fair value of the part of a CGU allocated to a new CGU compared to the part remaining in the old organizational structure.
FOREIGN CURRENCY TRANSLATION
Each entity in AGI determines its own functional currency, and items included in the financial statements of each entity are measured using that functional currency.
Transactions in foreign currencies are initially recorded by AGI entities at their respective functional currency rates prevailing at the date of the transaction.
Monetary items are translated at the functional currency spot rate as of the reporting date. Exchange differences from monetary items are recognized in the consolidated statements of income. Non-monetary items that are not carried at fair value are translated using the
75 76C O N S O L I D A T E D F I N A N C I A L S T A T E M E N T S
2 0 1 6 A N N U A L R E P O R TF I E L D T O C O N S U M E R C O N S O L I D A T E D F I N A N C I A L S T A T E M E N T S
exchange rates as at the dates of the initial transaction. Non-monetary items measured at fair value in a foreign currency are translated using the exchange rates at the date when the fair value is determined.
The assets and liabilities of foreign operations are translated into Canadian dollars at the rate of exchange prevailing at the reporting date and their consolidated statements of income are translated at the monthly rates of exchange. The exchange differences arising on the translation are recognized in other comprehensive income. On disposal of a foreign operation, the component of other comprehensive income relating to that particular foreign operation is recognized in the consolidated statements of income.
Any goodwill arising on the acquisition of a foreign operation and any fair value adjustments to the carrying amounts of assets and liabilities arising on the acquisition are treated as assets and liabilities of the foreign operation and translated at the rate of exchange prevailing at the reporting date.
PROPERTY, PLANT AND EQUIPMENT
Property, plant and equipment are stated at cost, net of any accumulated depreciation and any impairment losses determined. Cost includes the purchase price, any costs directly attributable to bringing the asset to the location and condition necessary and, where relevant, the present value of all dismantling and removal costs. Where major components of property, plant and equipment have different useful lives, the components are recognized and depreciated separately. AGI recognizes in the carrying amount of an item of property, plant and equipment the cost of replacing part of such an item when the cost is incurred and if it is probable that the future economic benefits embodied with the item can be reliably measured. All other repair and maintenance costs are recognized in the consolidated statements of income as an expense when incurred.
Depreciation is calculated on a straight-line basis over the estimated useful lives of the assets as follows:
Buildings and building components 20 – 60 years Manufacturing equipment 10 – 20 years Computer hardware 5 years Leasehold improvements Over the lease period Equipment under finance leases 10 years Furniture and fixtures 5 – 10 years Vehicles 4 – 16 years
An item of property, plant and equipment and any significant part initially recognized is derecognized upon disposal or when no future economic benefits are expected from its use or disposal. Any gain or loss arising on derecognition of the asset is included in the consolidated statements of income when the asset is derecognized.
The assets’ useful lives and methods of depreciation of assets are reviewed at each financial year-end, and adjusted prospectively, if appropriate. No depreciation is taken on construction in progress until the asset is placed in use. Amounts representing direct costs incurred for major overhauls are capitalized and depreciated over the estimated useful lives of the different components replaced.
LEASES
The determination of whether an arrangement is, or contains, a lease is based on whether fulfillment of the arrangement is dependent on the use of a specific asset or assets or the arrangement conveys a right to use the asset.
Finance leases, which transfer to AGI substantially all the risks and benefits incidental to ownership of the leased item, are capitalized at the commencement of the lease at the fair value of the leased property or, if lower, at the present value of the minimum lease payments. Lease payments are apportioned between finance charges and reduction of the lease liability so as to achieve a constant rate of interest on the remaining balance of the liability. Finance charges are recognized in finance costs in the consolidated statements of income.
Leased assets are depreciated over the useful life of the asset. However, if there is no reasonable certainty that AGI will obtain
ownership by the end of the lease term, the asset is depreciated over the shorter of the estimated useful life of the asset and the lease term.
Operating lease payments are recognized as an expense in the consolidated statements of income on a straight-line basis over the lease term.
BORROWING COSTS
Borrowing costs directly attributable to the acquisition, construction or production of an asset that necessarily takes a substantial period of time, which AGI considers to be 12 months or more, to get ready for its intended use or sale are capitalized as part of the cost of the respective assets. All other borrowing costs are expensed in the period they occur.
INTANGIBLE ASSETS
Intangible assets acquired separately are measured on initial recognition at cost. The cost of intangible assets acquired in a business combination is its fair value at the date of acquisition. Following initial recognition, intangible assets are carried at cost less any accumulated amortization and any accumulated impairment losses. The useful lives of intangible assets are assessed as either finite or indefinite. Intangible assets with finite useful lives are amortized over the useful economic life and assessed for impairment whenever there is an indication that the intangible asset may be impaired. The amortization method and amortization period of an intangible asset with a finite useful life are reviewed at least annually. Changes in the expected useful life or the expected pattern of consumption of future economic benefits embodied in the asset are accounted for by changing the amortization period or method, as appropriate, and are treated as changes in accounting estimates. The amortization expense on intangible assets with finite lives is recognized in the consolidated statements of income in the expense category consistent with the function of the intangible assets.
Intangible assets with indefinite useful lives, which include brand names, are not amortized, but are tested for impairment annually, either individually or at the CGU level. The assessment of indefinite life is reviewed annually to determine whether the indefinite life continues to be supportable. If not, the change in useful life from indefinite to finite is made on a prospective basis.
Internally generated intangible assets are capitalized when the product or process is technically and commercially feasible and AGI has sufficient resources to complete development. The cost of an internally generated intangible asset comprises all directly attributable costs necessary to create, produce and prepare the asset to be capable of operating in the manner intended by management. Expenditures incurred to develop new demos and prototypes are recorded at cost as internally generated intangible assets. Amortization of the internally generated intangible assets begins when the development is complete and the asset is available for use and it is amortized over the period of expected future benefit. Amortization is recorded in cost of goods sold. During the period of development, the asset is tested for impairment at least annually.
Finite-life intangible assets are amortized on a straight-line basis over the estimated useful lives of the related assets as follows:
Patents 4 – 10 years Distribution networks 8 – 25 years Demos and prototypes 3 – 15 years Order backlog 3 – 6 months Non-compete agreement 7 years Software 5 – 8 years
Gains or losses arising from derecognition of an intangible asset are measured as the difference between the net disposal proceeds and the carrying amount of the asset and are recognized in the consolidated statements of income when the asset is derecognized.
IMPAIRMENT OF NON-FINANCIAL ASSETS
AGI assesses at each reporting date whether there is an indication that an asset may be impaired. If such an indication exists, or when annual testing for an asset is required, AGI estimates the asset’s recoverable amount. The recoverable amount of goodwill as well as intangible assets not yet available for use is estimated at least annually on December 31. The recoverable amount is the higher of an asset’s or CGU group’s fair value less costs to sell and its value in use.
Value in use is determined by discounting estimated future cash flows using a pre-tax discount rate that reflects the current market assessment of the time value of money and the specific risks of the asset. In determining fair value less costs to sell, recent market
77 78C O N S O L I D A T E D F I N A N C I A L S T A T E M E N T S
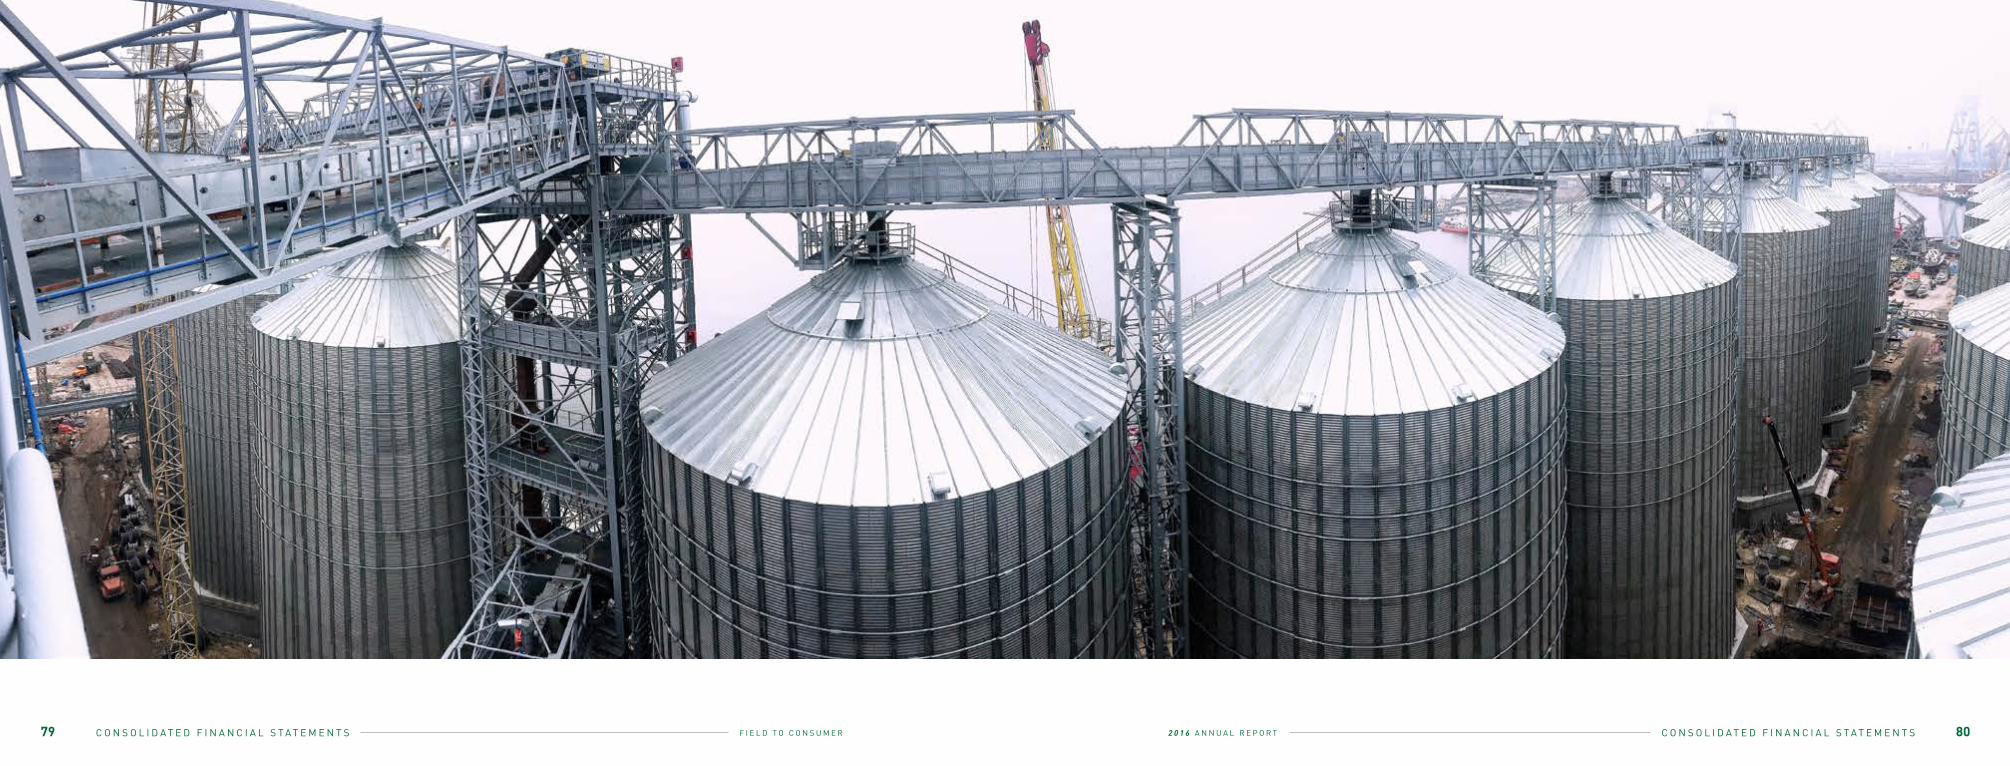
2 0 1 6 A N N U A L R E P O R TF I E L D T O C O N S U M E R C O N S O L I D A T E D F I N A N C I A L S T A T E M E N T S79 80C O N S O L I D A T E D F I N A N C I A L S T A T E M E N T S
2 0 1 6 A N N U A L R E P O R TF I E L D T O C O N S U M E R C O N S O L I D A T E D F I N A N C I A L S T A T E M E N T S
transactions are taken into account, if available. If no such transactions can be identified, an appropriate valuation model is used. The recoverable amount of assets that do not generate independent cash flows is determined based on the CGU group to which the asset belongs.
AGI bases its impairment calculation on detailed budgets and forecast calculations that are prepared separately for each of AGI’s CGU groups to which the individual assets are allocated. These budgets and forecast calculations generally cover a period of five years. For periods after five years, a terminal value approach is used.
An impairment loss is recognized in the consolidated statements of income if an asset’s carrying amount or that of the CGU group to which it is allocated is higher than its recoverable amount. Impairment losses of a CGU group are first charged against the carrying value of the goodwill balance included in the CGU group and then against the value of the other assets, in proportion to their carrying amount. In the consolidated statements of income, the impairment losses are recognized in those expense categories consistent with the function of the impaired asset.
For assets other than goodwill, an assessment is made at each reporting date as to whether there is any indication that previously recognized impairment losses may no longer exist or may have decreased. If such indication exists, AGI estimates the asset’s or CGU group’s recoverable amount. A previously recognized impairment loss is reversed only if there has been a change in the assumptions used to determine the asset’s recoverable amount since the last impairment loss was recognized. The reversal is limited so that the carrying amount of the asset does not exceed its recoverable amount, nor exceed the carrying amount that would have been determined, net of depreciation, had no impairment loss been recognized for the asset or CGU group in prior years. Such a reversal is recognized in the consolidated statements of income.
Goodwill is tested for impairment annually as at December 31 and when circumstances indicate that the carrying value may be impaired. Impairment is determined for goodwill by assessing the recoverable amount of each CGU group to which the goodwill relates. Where the recoverable amount of the CGU group is less than its carrying amount,
an impairment loss is recognized. Impairment losses relating to goodwill cannot be reversed in future periods.
Intangible assets with indefinite useful lives are tested for impairment annually as at December 31, either individually or at the CGU group level, as appropriate, and when circumstances indicate that the carrying value may be impaired.
CASH AND CASH EQUIVALENTS
All highly liquid temporary cash investments with an original maturity of three months or less when purchased are considered to be cash equivalents. For the purpose of the consolidated statements of cash flows, cash and cash equivalents consist of cash and money market funds, net of outstanding bank overdrafts.
INVENTORY
Inventory is comprised of raw materials and finished goods. Inventory is valued at the lower of cost and net realizable value, using a first-in, first-out basis. For finished goods, costs include all direct costs incurred in production, including direct labour and materials, freight, directly attributable manufacturing overhead costs based on normal operating capacity and property, plant and equipment depreciation.
Inventories are written down to net realizable value when the cost of inventories is estimated to be unrecoverable due to obsolescence, damage or declining selling prices. Net realizable value is the estimated selling price in the ordinary course of business, less estimated costs of completion and the estimated costs necessary to make the sale. When the circumstances that previously caused inventories to be written down below cost no longer exist, or when there is clear evidence of an increase in selling prices, the amount of the write-down previously recorded is reversed.
FINANCIAL INSTRUMENTS
Financial assets and liabilities
AGI classifies its financial assets as [i] financial assets at fair value through profit or loss, [ii] loans and receivables or [iii] available-for-sale, and its financial liabilities as either [i] financial liabilities at fair
value through profit or loss [“FVTPL”] or [ii] other financial liabilities. Derivatives are designated as hedging instruments in an effective hedge, as appropriate. Appropriate classification of financial assets and liabilities is determined at the time of initial recognition or when reclassified in the consolidated statements of financial position.
All financial instruments are recognized initially at fair value plus, in the case of investments and liabilities not at fair value through profit or loss, directly attributable transaction costs. Financial instruments are recognized on the trade date, which is the date on which AGI commits to purchase or sell the asset.
Financial assets at fair value through profit or loss
Financial assets at FVTPL include financial assets classified as held-for-trading and financial assets designated upon initial recognition at FVTPL. Financial assets are classified as held-for-trading if they are acquired for the purpose of selling or repurchasing in the near term. This category includes cash and cash equivalents and derivative financial instruments entered into that are not designated as hedging instruments in hedge relationships as defined by IAS 39.
Financial assets at FVTPL are carried in the consolidated statements of financial position at fair value with changes in the fair value recognized in finance income or finance costs in the consolidated statements of income.
AGI has currently not designated any financial assets upon initial recognition as FVTPL.
Derivatives embedded in host contracts are accounted for as separate derivatives and recorded at fair value if their economic characteristics and risks are not closely related to those of the host contracts and the host contracts are not held-for-trading. These embedded derivatives are measured at fair value with changes in fair value recognized in the consolidated statements of income. Reassessment only occurs if there is a change in the terms of the contract that significantly modifies the cash flows that would otherwise be required.
Loans and receivables
Loans and receivables are non-derivative financial assets with fixed or determinable payments that are not quoted in an active market. Assets in this category include receivables. Loans and receivables are initially recognized at fair value plus transaction costs. They are subsequently measured at amortized cost using the effective interest method less any impairment. The effective interest amortization is included in finance income in the consolidated statements of income. The losses arising from impairment are recognized in the consolidated statements of income in finance costs.
Available-for-sale financial investments
Available-for-sale financial investments include equity and debt securities. Equity investments classified as available-for-sale are those which are neither classified as held-for-trading nor designated at FVTPL. Debt securities in this category are those which are intended to be held for an indefinite period of time and which may be sold in response to needs for liquidity or in response to changes in the market conditions.
After initial measurement, available-for-sale financial investments are subsequently measured at fair value with unrealized gains or losses recognized as other comprehensive income in the available-for-sale reserve until the investment is derecognized, at which time the cumulative gain or loss is recognized in other operating income, or determined to be impaired, at which time the cumulative loss is reclassified to the consolidated statements of income and removed from the available-for-sale reserve.
For a financial asset reclassified out of the available-for-sale category, any previous gain or loss on that asset that has been recognized in equity is amortized to profit or loss over the remaining life of the investment using the effective interest method. Any difference between the new amortized cost and the expected cash flows is also amortized over the remaining life of the asset using the effective interest method. If the asset is subsequently determined to be impaired, then the amount recorded in equity is reclassified to the consolidated statements of income.
81 82C O N S O L I D A T E D F I N A N C I A L S T A T E M E N T S
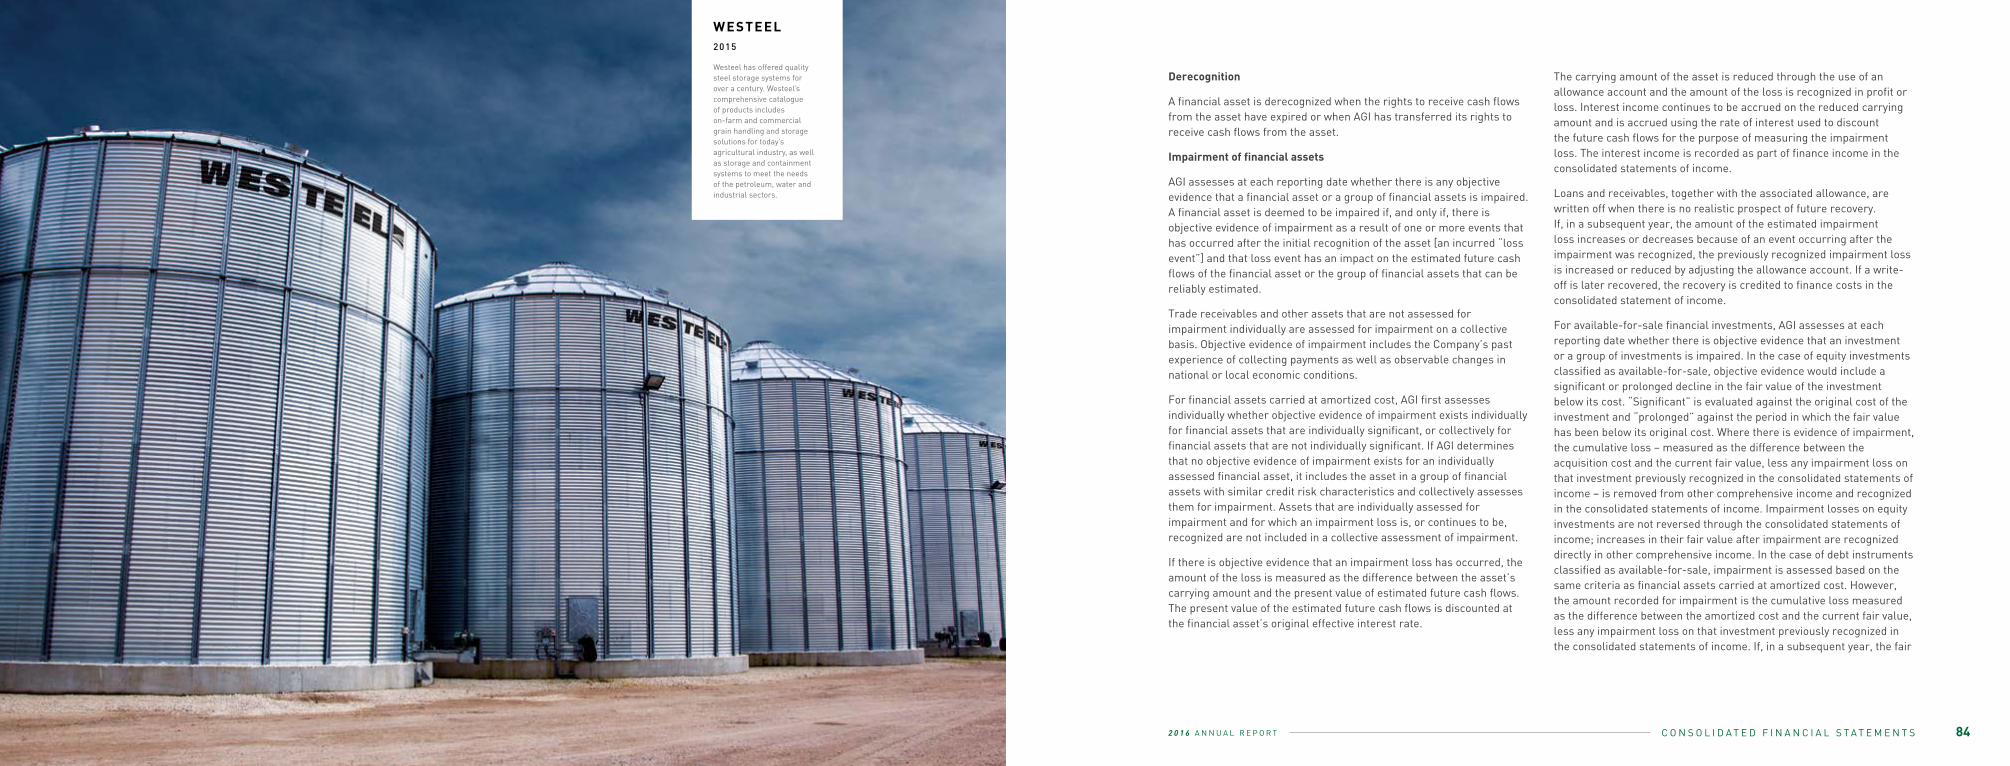
2 0 1 6 A N N U A L R E P O R TF I E L D T O C O N S U M E RC O N S O L I D A T E D F I N A N C I A L S T A T E M E N T S C O N S O L I D A T E D F I N A N C I A L S T A T E M E N T S
Derecognition
A financial asset is derecognized when the rights to receive cash flows from the asset have expired or when AGI has transferred its rights to receive cash flows from the asset.
Impairment of financial assets
AGI assesses at each reporting date whether there is any objective evidence that a financial asset or a group of financial assets is impaired. A financial asset is deemed to be impaired if, and only if, there is objective evidence of impairment as a result of one or more events that has occurred after the initial recognition of the asset [an incurred “loss event”] and that loss event has an impact on the estimated future cash flows of the financial asset or the group of financial assets that can be reliably estimated.
Trade receivables and other assets that are not assessed for impairment individually are assessed for impairment on a collective basis. Objective evidence of impairment includes the Company’s past experience of collecting payments as well as observable changes in national or local economic conditions.
For financial assets carried at amortized cost, AGI first assesses individually whether objective evidence of impairment exists individually for financial assets that are individually significant, or collectively for financial assets that are not individually significant. If AGI determines that no objective evidence of impairment exists for an individually assessed financial asset, it includes the asset in a group of financial assets with similar credit risk characteristics and collectively assesses them for impairment. Assets that are individually assessed for impairment and for which an impairment loss is, or continues to be, recognized are not included in a collective assessment of impairment.
If there is objective evidence that an impairment loss has occurred, the amount of the loss is measured as the difference between the asset’s carrying amount and the present value of estimated future cash flows. The present value of the estimated future cash flows is discounted at the financial asset’s original effective interest rate.
The carrying amount of the asset is reduced through the use of an allowance account and the amount of the loss is recognized in profit or loss. Interest income continues to be accrued on the reduced carrying amount and is accrued using the rate of interest used to discount the future cash flows for the purpose of measuring the impairment loss. The interest income is recorded as part of finance income in the consolidated statements of income.
Loans and receivables, together with the associated allowance, are written off when there is no realistic prospect of future recovery. If, in a subsequent year, the amount of the estimated impairment loss increases or decreases because of an event occurring after the impairment was recognized, the previously recognized impairment loss is increased or reduced by adjusting the allowance account. If a write-off is later recovered, the recovery is credited to finance costs in the consolidated statement of income.
For available-for-sale financial investments, AGI assesses at each reporting date whether there is objective evidence that an investment or a group of investments is impaired. In the case of equity investments classified as available-for-sale, objective evidence would include a significant or prolonged decline in the fair value of the investment below its cost. “Significant” is evaluated against the original cost of the investment and “prolonged” against the period in which the fair value has been below its original cost. Where there is evidence of impairment, the cumulative loss – measured as the difference between the acquisition cost and the current fair value, less any impairment loss on that investment previously recognized in the consolidated statements of income – is removed from other comprehensive income and recognized in the consolidated statements of income. Impairment losses on equity investments are not reversed through the consolidated statements of income; increases in their fair value after impairment are recognized directly in other comprehensive income. In the case of debt instruments classified as available-for-sale, impairment is assessed based on the same criteria as financial assets carried at amortized cost. However, the amount recorded for impairment is the cumulative loss measured as the difference between the amortized cost and the current fair value, less any impairment loss on that investment previously recognized in the consolidated statements of income. If, in a subsequent year, the fair
05 84
WESTEEL2015
Westeel has offered quality steel storage systems for over a century. Westeel’s comprehensive catalogue of products includes on-farm and commercial grain handling and storage solutions for today’s agricultural industry, as well as storage and containment systems to meet the needsof the petroleum, water and industrial sectors.

2 0 1 6 A N N U A L R E P O R TF I E L D T O C O N S U M E R C O N S O L I D A T E D F I N A N C I A L S T A T E M E N T S
value of a debt instrument increases and the increase can be objectively related to an event occurring after the impairment loss was recognized in the consolidated statements of income, the impairment loss is reversed through the consolidated statements of income.
Financial liabilities at FVTPL
Financial liabilities at FVTPL include financial liabilities held-for-trading and financial liabilities designated upon initial recognition at FVTPL. Financial liabilities are classified as held-for-trading if they are acquired for the purpose of selling in the near term. This category includes derivative financial instruments entered into by the Company that are not designated as hedging instruments in hedge relationships as defined by IAS 39.
Gains or losses on liabilities held-for-trading are recognized in the consolidated statements of income.
AGI has not designated any financial liabilities upon initial recognition as FVTPL.
OTHER FINANCIAL LIABILITIES
Financial liabilities are measured at amortized cost using the effective interest rate method. Financial liabilities include long-term debt issued, which is initially measured at fair value, which is the consideration received, net of transaction costs incurred, net of equity component. Transaction costs related to the long-term debt instruments are included in the value of the instruments and amortized using the effective interest rate method. The effective interest expense is included in finance costs in the consolidated statements of income.
Derecognition
A financial liability is derecognized when the obligation under the liability is discharged or cancelled or expires.
When an existing financial liability is replaced by another from the same lender on substantially different terms, or the terms of an existing liability are substantially modified, such an exchange or modification is treated as a derecognition of the original liability and the recognition of a new liability, and the difference in the respective carrying amounts is
recognized in the consolidated statements of income.
Interest income
For all financial instruments measured at amortized cost, interest income or expense is recorded using the effective interest method, which is the rate that exactly discounts the estimated future cash payments or receipts through the expected life of the financial instrument or a shorter period, where appropriate, to the net carrying amount of the financial asset or liability. Interest income is included in finance income in the consolidated statements of income.
DERIVATIVE INSTRUMENTS AND HEDGE ACCOUNTING
AGI uses derivative financial instruments such as forward currency contracts, interest rate swaps and equity swaps to hedge its foreign currency risk, interest rate risk and market risk. Such derivative financial instruments are initially recognized at fair value on the date on which a derivative contract is entered into and are subsequently remeasured at fair value. Derivatives are carried as financial assets when the fair value is positive and as financial liabilities when the fair value is negative.
AGI analyzes all of its contracts, of both a financial and non-financial nature, to identify the existence of any “embedded” derivatives. Embedded derivatives are accounted for separately from the host contract at the inception date when their risks and characteristics are not closely related to those of the host contracts and the host contracts are not carried at fair value.
Any gains or losses arising from changes in the fair value of derivatives are recorded directly in the consolidated statements of income, except for the effective portion of cash flow hedges, which is recognized in other comprehensive income.
For the purpose of hedge accounting, hedges are classified as cash flow hedges when hedging exposure to variability in cash flows that is either attributable to a particular risk associated with a recognized asset or liability or a highly probable forecast transaction or the foreign currency risk in an unrecognized firm commitment.
At the inception of a hedge relationship, AGI formally designates and documents the hedge relationship to which AGI wishes to apply hedge accounting and the risk management objective and strategy for undertaking the hedge. The documentation includes identification of the hedging instrument, the hedged item or transaction, the nature of the risk being hedged and how the entity will assess the effectiveness of changes in the hedging instrument’s fair value in offsetting the exposure to changes in the cash flows attributable to the hedged risk. Such hedges are expected to be highly effective in achieving offsetting changes in cash flows and are assessed on an ongoing basis to determine whether they have been highly effective throughout the financial reporting periods for which they were designated.
Hedges that meet the strict criteria for hedge accounting are accounted for as follows:
Cash flow hedges
The effective portion of the gain or loss on the hedging instrument is recognized directly as other comprehensive income in the cash flow hedge reserve, while any ineffective portion is recognized immediately in the consolidated statements of income in other operating income or expenses. Amounts recognized as other comprehensive income are transferred to the consolidated statements of income when the hedged transaction affects profit or loss, such as when the hedged financial income or financial expense is recognized or when a forecast sale occurs. Where the hedged item is the cost of a non-financial asset or non-financial liability, the amounts recognized as other comprehensive income are transferred to the initial carrying amount of the non-financial asset or liability.
If the forecast transaction or firm commitment is no longer expected to occur, the cumulative gain or loss previously recognized in equity is transferred to the consolidated statements of income. If the hedging instrument expires or is sold, terminated or exercised without replacement or rollover, or if its designation as a hedge is revoked, any cumulative gain or loss previously recognized in other comprehensive income remains in other comprehensive income until the forecast transaction or firm commitment affects profit or loss.
85 86C O N S O L I D A T E D F I N A N C I A L S T A T E M E N T S
2 0 1 6 A N N U A L R E P O R TF I E L D T O C O N S U M E R C O N S O L I D A T E D F I N A N C I A L S T A T E M E N T S
AGI uses primarily forward currency contracts as hedges of its exposure to foreign currency risk in forecast transactions and firm commitments.
OFFSETTING OF FINANCIAL INSTRUMENTS
Financial assets and financial liabilities are offset and the net amount reported in the consolidated statements of financial position if, and only if, there is a currently enforceable legal right to offset the recognized amounts and there is an intention to settle on a net basis, or to realize the assets and settle the liabilities simultaneously.
FAIR VALUE OF FINANCIAL INSTRUMENTS
Fair value is the estimated amount that AGI would pay or receive to dispose of these contracts in an arm’s length transaction between knowledgeable, willing parties who are under no compulsion to act. The fair value of financial instruments that are traded in active markets at each reporting date is determined by reference to quoted market prices, without any deduction for transaction costs.
For financial instruments not traded in an active market, the fair value is determined using appropriate valuation techniques that are recognized by market participants. Such techniques may include using recent arm’s length market transactions, reference to the current fair value of another instrument that is substantially the same, discounted cash flow analysis or other valuation models.
PROVISIONS
Provisions are recognized when AGI has a present obligation, legal or constructive, as a result of a past event, it is probable that an outflow of resources embodying economic benefits will be required to settle the obligation and a reliable estimate can be made of the amount of the obligation. Where AGI expects some or all of a provision to be reimbursed, for example under an insurance contract, the reimbursement is recognized as a separate asset but only when the reimbursement is virtually certain. The expense relating to any provision is presented in the consolidated statements of income, net of any reimbursement. If the effect of the time value of money is material, provisions are discounted using a current pre-tax rate that reflects, where appropriate, the risks specific to the liability. Where discounting
is used, the increase in the provision due to the passage of time is recognized as a finance cost.
Warranty provisions
Provisions for warranty-related costs are recognized when the product is sold or service provided. Initial recognition is based on historical experience.
PROFIT (LOSS) PER SHARE
The computation of profit (loss) per share is based on the weighted average number of shares outstanding during the period. Diluted profit (loss) per share is computed in a similar way to basic profit (loss) per share except that the weighted average shares outstanding are increased to include additional shares assuming the exercise of share options, share appreciation rights and convertible debt options, if dilutive.
REVENUE RECOGNITION
Revenue is recognized to the extent that it is probable that the economic benefits will flow to AGI and the revenue can be reliably measured, regardless of when the payment is being made. Revenue is measured at the fair value of the consideration received or receivable, taking into account contractually defined terms of payment and excluding taxes or duty. AGI assesses its revenue arrangements against specific criteria in order to determine if it is acting as principal or agent. With the exception of third-party services, AGI has concluded that it is acting as a principal in all of its revenue arrangements. The following specific recognition criteria must also be met before revenue is recognized:
Sale of goods
Revenue from the sale of goods is in general recognized when significant risks and rewards of ownership are transferred to the customer. AGI generally recognizes revenue when products are shipped, free on board shipping point; the customer takes ownership and assumes risk of loss; collection of the related receivable is probable; persuasive evidence of an arrangement exists; and the sales price is fixed or determinable. Customer deposits are recorded
as a current liability when cash is received from the customer and recognized as revenue at the time product is shipped, as noted above.
AGI applies layaway sales or bill and hold sales accounting in specific situations provided all appropriate conditions are met as of the reporting date.
Third-party services
AGI from time to time enters into arrangements with third-party providers to provide services for AGI’s customers. Where AGI acts as agent, the revenue and costs associated with these services are recorded on a net basis and disclosed under other operating income.
INCOME TAXES
AGI and its subsidiaries are generally taxable under the statutes of their country of incorporation.
Current income tax assets and liabilities for the current and prior period are measured at the amount expected to be recovered from or paid to the taxation authorities. The tax rates and tax laws used to compute the amount are those that are enacted or substantively enacted at the reporting date in the countries where AGI operates and generates taxable income. Current income tax relating to items recognized directly in equity is recognized in equity and not in the consolidated statements of income (loss). Management periodically evaluates positions taken in the tax returns with respect to situations in which applicable tax regulations are subject to interpretation and establishes provisions where appropriate.
AGI follows the liability method of accounting for deferred taxes. Under this method, income tax liabilities and assets are recognized for the estimated tax consequences attributable to the temporary differences between the carrying value of the assets and liabilities on the consolidated financial statements and their respective tax bases.
Deferred tax liabilities are recognized for all taxable temporary differences, except:
87 88C O N S O L I D A T E D F I N A N C I A L S T A T E M E N T S

2 0 1 6 A N N U A L R E P O R TF I E L D T O C O N S U M E R C O N S O L I D A T E D F I N A N C I A L S T A T E M E N T S
• Where the deferred tax liability arises from the initial recognition of goodwill or of an asset or liability in a transaction that is not a business combination and, at the time of the transaction, affects neither the accounting profit nor the taxable profit or loss.
• In respect of taxable temporary differences associated with investments in subsidiaries, where the timing of the reversal of the temporary differences can be controlled and it is probable that the temporary differences will not reverse in the foreseeable future.
Deferred tax assets are recognized for all deductible temporary differences, carryforward of unused tax losses, to the extent that it is probable that taxable profit will be available against which the deductible temporary differences and the carryforward of unused tax losses can be utilized.
The carrying amount of deferred tax assets is reviewed at each reporting date and reduced to the extent that it is no longer probable that sufficient taxable profit will be available to allow all or part of the deferred tax asset to be utilized. Unrecognized deferred tax assets are reassessed at each reporting date and are recognized to the extent that it has become probable that future taxable profits will allow the deferred tax asset to be recovered. Deferred tax assets and liabilities are measured at the tax rates that are expected to apply in the year when the asset is realized or the liability is settled, based on tax rates [and tax laws] that have been enacted or substantively enacted at the reporting date.
Deferred tax items are recognized in correlation to the underlying transaction either in the consolidated statements of income, other comprehensive income or directly in equity.
Deferred tax assets and deferred tax liabilities are offset if a legally enforceable right exists to offset current tax assets against current income tax liabilities and the deferred taxes relate to the same taxable entity and the same taxation authority.
Tax benefits acquired as part of a business combination, but not satisfying the criteria for separate recognition at that date, would be recognized subsequently if information about facts and circumstances changed. The adjustment would either be treated as a reduction to
goodwill if it occurred during the measurement period or in profit or loss, when it occurs subsequent to the measurement period.
Deferred taxes on indefinite-life intangible assets were previously measured on an “on sale” basis for tax purposes. During the year, the Company retroactively adopted the IFRIC decision to measure deferred taxes on these assets based on an income tax rate if recovered through use.
Sales tax
Revenue, expenses and assets are recognized net of the amount of sales tax, except where the sales tax incurred on a purchase of assets or services is not recoverable from the taxation authority, in which case the sales tax is recognized as part of the cost of acquisition of the asset or as part of the expense item as applicable and where receivables and payables are stated with the amount of sales tax included.
The net amount of sales tax recoverable from, or payable to, the taxation authority is included as part of receivables or payables in the consolidated statements of financial position.
SHARE-BASED COMPENSATION PLANS
Employees of AGI may receive remuneration in the form of share-based payment transactions, whereby employees render services and receive consideration in the form of equity instruments [equity-settled transactions, share award incentive plan and directors’ deferred compensation plan] or cash [cash-settled transactions]. In situations where equity instruments are issued and some or all of the goods or services received by the entity as consideration cannot be specifically identified, the unidentified goods or services received are measured as the difference between the fair value of the share-based payment transaction and the fair value of any identifiable goods or services received at the grant date and are capitalized or expensed as appropriate.
Equity-settled transactions
The cost of equity-settled transactions is recognized, together with a corresponding increase in other capital reserves, in equity, over the
89 06
PTM2015
Based in Italy, PTM Technology is a leader in the design and manufacturing of grain handling equipment, including chain or belt conveyors, bucket elevators and filters for intake pits. Its engineered designs can be customized to specific projects and PTM’s highly qualified engineershave the ability to incorporate its systems into existing project layouts.
C O N S O L I D A T E D F I N A N C I A L S T A T E M E N T S
2 0 1 6 A N N U A L R E P O R TF I E L D T O C O N S U M E R C O N S O L I D A T E D F I N A N C I A L S T A T E M E N T S
period in which the performance and/or service conditions are fulfilled.
The cumulative expense recognized for equity-settled transactions at each reporting date until the vesting period reflects the extent to which the vesting period has expired and AGI’s best estimate of the number of the shares that will ultimately vest. The expense or credit recognized for a period represents the movement in cumulative expense recognized as at the beginning and end of that period and is recognized in the consolidated statements of income in the respective function line. When options and other share-based compensation awards are exercised or exchanged, the amounts previously credited to contributed surplus are reversed and credited to shareholders’ equity. The amount of cash, if any, received from participants is also credited to shareholders’ equity.
Where the terms of an equity-settled transaction award are modified, the minimum expense recognized is the expense as if the terms had not been modified, if the original terms of the award are met. An additional expense is recognized for any modification that increases the total fair value of the share-based payment transaction, or is otherwise beneficial to the employee as measured at the date of modification.
Where an equity-settled award is cancelled, it is treated as if it vested on the date of cancellation and any expense not yet recognized for the award [being the total expense as calculated at the grant date] is recognized immediately. This includes any award where vesting conditions within the control of either the Company or the employee are not met. However, if a new award is substituted for the cancelled award, and designated as a replacement award on the date that it is granted, the cancelled and new awards are treated as if they were a modification of the original award.
The dilutive effect of outstanding options is reflected as additional share dilution in the computation of diluted earnings per share.
Cash-settled transactions
The cost of cash-settled transactions is measured initially at fair value at the grant date using the Black-Scholes model. This fair value is expensed over the period until the vesting date, with recognition of a corresponding liability. The liability is remeasured to fair value at each reporting date up to and including the settlement date, with changes in
fair value recognized in the consolidated statements of income in the line of the function the respective employee is engaged in.
POST-RETIREMENT BENEFIT PLANS
AGI contributes to retirement savings plans subject to maximum limits per employee. AGI accounts for such defined contributions as an expense in the period in which the contributions are required to be made.
RESEARCH AND DEVELOPMENT EXPENSES
Research expenses, net of related tax credits, are charged to the consolidated statements of income in the period they are incurred. Development costs are charged to operations in the period of the expenditure unless they satisfy the condition for recognition as an internally generated intangible asset.
GOVERNMENT GRANTS
Government grants are recognized at fair value where there is reasonable assurance that the grant will be received and all attaching conditions will be complied with. Where the grants relate to an asset, the fair value is credited to the cost of the asset and is released to the consolidated statements of income (loss) over the expected useful life in a consistent manner with the depreciation method for the relevant assets.
INVESTMENT TAX CREDITS
Federal and provincial investment tax credits are accounted for as a reduction of the cost of the related assets or expenditures in the year in which the credits are earned and when there is reasonable assurance that the credits can be used to recover taxes.
CHANGE IN ACCOUNTING POLICY
In November 2016, the IFRS interpretations Committee [“the Committee”] published a summary of its meeting discussion regarding a request to clarify how an entity determines the expected manner of recovery of an intangible asset with an indefinite useful life for the purposes of measuring deferred tax in accordance with IAS 12 Income
Taxes. Although the Committee decided not to add this issue to its agenda, the Committee noted that an intangible asset with an indefinite useful life is not a non-depreciable asset because a non-depreciable asset has an unlimited [or infinite] life, and that indefinite does not mean infinite. Consequently, the fact that an entity does not amortize an intangible asset with an indefinite useful life does not necessarily mean that the entity will recover the carrying amount of that asset only through sale and not through use. As such, the Company changed its accounting policy retrospectively for the accounting of deferred tax on intangible assets with indefinite useful lives to be in line with the Committee discussions.
The following table summarizes the impact of adopting this change of accounting policy retrospectively on the consolidated statements of financial position. The change of accounting policy did not have an impact on the previously reported consolidated statements of income or consolidated statements of cash flows.
4. SIGNIFICANT ACCOUNTING JUDGMENTS, ESTIMATES AND ASSUMPTIONS
The preparation of the consolidated financial statements requires management to make judgments, estimates and assumptions that affect the reported amounts of assets, liabilities, income, expenses and the disclosure of contingent liabilities. The estimates and related assumptions are based on previous experience and other factors considered reasonable under the circumstances, the results of which form the basis of making the assumptions about carrying values of assets and liabilities that are not readily apparent from other sources. However, uncertainty about these assumptions and estimates could result in outcomes that require a material adjustment to the carrying amount of the asset or liability affected in future periods.
The estimates and underlying assumptions are reviewed on an ongoing basis. Revisions to accounting estimates are recognized in the period in which the estimate is revised if the revision affects only that period, or in the period of the revision and future periods if the revision affects both current and future periods. The key assumptions concerning the future and other key sources of estimation uncertainty at the reporting date that have a significant risk of causing a material adjustment to the carrying amounts of assets and liabilities within the next financial year are described below.
IMPAIRMENT OF FINANCIAL ASSETS
Assessments about the recoverability of financial assets, including accounts receivable, require significant judgment in determining whether there is objective evidence that a loss event has occurred and estimates of the amount and timing of future cash flows. The Company maintains an allowance for doubtful accounts for estimated losses resulting from the inability to collect on its trade receivables. A portion of the Company’s sales are generated in overseas markets, a significant portion of which are in emerging markets such as countries in Eastern Europe. Emerging markets are subject to various additional risks, including currency exchange rate fluctuations, economic conditions and foreign business practices. One or more of these factors could have a material effect on the future collectability of such receivables. In assessing whether objective evidence of impairment exists at each reporting period the Company considers its past experience of collecting payments, historical loss experience, customer credit ratings and financial data as available, collateral on amounts owing including insurance coverage from export credit agencies, as well as observable changes in national or local economic conditions. Future collections of accounts receivable that differ from the Company’s current estimates would affect the results of the Company’s operations in future periods as well as the Company’s trade receivables and general and administrative expenses, and amounts may be material.
IMPAIRMENT OF NON-FINANCIAL ASSETS
AGI’s impairment test is based on value in use calculations that use a discounted cash flow model. The cash flows are derived from the forecast for the next five years and do not include restructuring
2016$
2015$
INCREASE (DECREASE)
Goodwill 997 6,181
Deferred income tax liabilities 977 8,744
Deficit — (2,563)
91 92C O N S O L I D A T E D F I N A N C I A L S T A T E M E N T S
2 0 1 6 A N N U A L R E P O R TF I E L D T O C O N S U M E R C O N S O L I D A T E D F I N A N C I A L S T A T E M E N T S
activities to which AGI has not yet committed or significant future investments that will enhance the asset’s performance of the CGU being tested. These calculations require the use of estimates and forecasts of future cash flows. Qualitative factors, including market presence and trends, strength of customer relationships, strength of local management, strength of debt and capital markets, and degree of variability in cash flows, as well as other factors, are considered when making assumptions with regard to future cash flows and the appropriate discount rate. The recoverable amount is most sensitive to the discount rate, as well as the forecasted margins and growth rate used for extrapolation purposes. A change in any of the significant assumptions or estimates used to evaluate goodwill and other non-financial assets could result in a material change to the results of operations. The key assumptions used to determine the recoverable amount for the different CGUs are further explained in note 13.
CGUs are defined as the lowest grouping of integrated assets that generate identifiable cash inflows that are largely independent of the cash inflows of other assets or groups of assets. The classification of assets into CGUs requires significant judgment and interpretations with respect to the integration between assets, the nature of products, the way in which management allocates resources and other relevant factors.
DEVELOPMENT COSTS
Development costs are capitalized in accordance with the accounting policy described in note 3. Initial capitalization of costs is based on management’s judgment that technical and economical feasibility is confirmed, usually when a project has reached a defined milestone according to an established project management model.
USEFUL LIVES OF KEY PROPERTY, PLANT AND EQUIPMENT AND INTANGIBLE ASSETS
The depreciation method and useful lives reflect the pattern in which management expects the asset’s future economic benefits to be consumed by AGI. Refer to note 3 for the estimated useful lives.
FAIR VALUE OF FINANCIAL INSTRUMENTS
Where the fair value of financial assets and financial liabilities recorded in the consolidated statements of financial position including the determination of the fair value of the Company’s available-for-sale asset cannot be derived from active markets, it is determined using valuation techniques including the discounted cash flow models. The inputs to these models are taken from observable markets where possible, but where this is not feasible, a degree of judgment is required in establishing fair values. The judgments include considerations of inputs such as liquidity risk, credit risk and volatility. Changes in assumptions about these factors could affect the reported fair value of financial instruments.
SHARE-BASED PAYMENTS
AGI measures the cost of equity-settled share-based payment transactions with employees by reference to the fair value of equity instruments at the grant date, whereas the fair value of cash-settled share-based payments is remeasured at every reporting date. Estimating fair value for share-based payments requires determining the most appropriate valuation model for a grant of these instruments, which is dependent on the terms and conditions of the grant. This also requires determining the most appropriate inputs to the valuation model including the expected life of the option, volatility and dividend yield.
INCOME TAXES
Uncertainties exist with respect to the interpretation of complex tax regulations, changes in tax laws and the amount and timing of future taxable income. Given the wide range of international business relationships and the long-term nature and complexity of existing contractual agreements, differences arising between the actual results and the assumptions made, or future changes to such assumptions, could necessitate future adjustments to taxable income and expenses already recorded. AGI establishes provisions, based on reasonable estimates, for possible consequences of audits by the tax authorities of the respective countries in which it operates. The amount of such provisions is based on various factors, such as experience of previous
93 94C O N S O L I D A T E D F I N A N C I A L S T A T E M E N T S
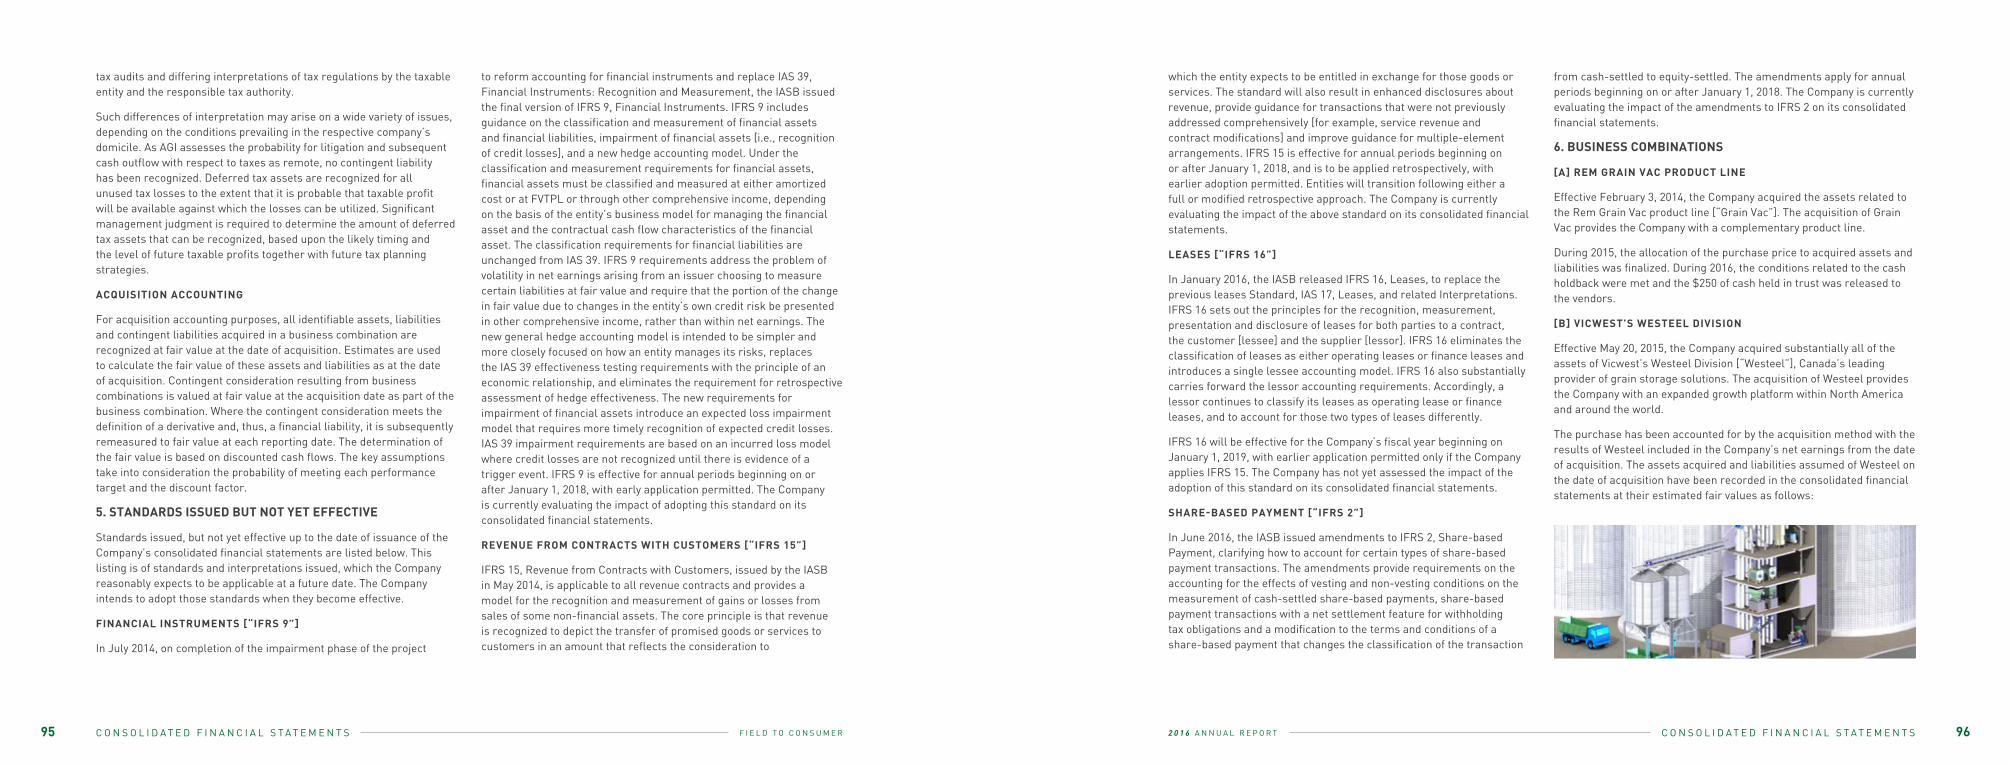
2 0 1 6 A N N U A L R E P O R TF I E L D T O C O N S U M E R C O N S O L I D A T E D F I N A N C I A L S T A T E M E N T S
tax audits and differing interpretations of tax regulations by the taxable entity and the responsible tax authority.
Such differences of interpretation may arise on a wide variety of issues, depending on the conditions prevailing in the respective company’s domicile. As AGI assesses the probability for litigation and subsequent cash outflow with respect to taxes as remote, no contingent liability has been recognized. Deferred tax assets are recognized for all unused tax losses to the extent that it is probable that taxable profit will be available against which the losses can be utilized. Significant management judgment is required to determine the amount of deferred tax assets that can be recognized, based upon the likely timing and the level of future taxable profits together with future tax planning strategies.
ACQUISITION ACCOUNTING
For acquisition accounting purposes, all identifiable assets, liabilities and contingent liabilities acquired in a business combination are recognized at fair value at the date of acquisition. Estimates are used to calculate the fair value of these assets and liabilities as at the date of acquisition. Contingent consideration resulting from business combinations is valued at fair value at the acquisition date as part of the business combination. Where the contingent consideration meets the definition of a derivative and, thus, a financial liability, it is subsequently remeasured to fair value at each reporting date. The determination of the fair value is based on discounted cash flows. The key assumptions take into consideration the probability of meeting each performance target and the discount factor.
5. STANDARDS ISSUED BUT NOT YET EFFECTIVE
Standards issued, but not yet effective up to the date of issuance of the Company’s consolidated financial statements are listed below. This listing is of standards and interpretations issued, which the Company reasonably expects to be applicable at a future date. The Company intends to adopt those standards when they become effective.
FINANCIAL INSTRUMENTS [“IFRS 9”]
In July 2014, on completion of the impairment phase of the project
to reform accounting for financial instruments and replace IAS 39, Financial Instruments: Recognition and Measurement, the IASB issued the final version of IFRS 9, Financial Instruments. IFRS 9 includes guidance on the classification and measurement of financial assets and financial liabilities, impairment of financial assets [i.e., recognition of credit losses], and a new hedge accounting model. Under the classification and measurement requirements for financial assets, financial assets must be classified and measured at either amortized cost or at FVTPL or through other comprehensive income, depending on the basis of the entity’s business model for managing the financial asset and the contractual cash flow characteristics of the financial asset. The classification requirements for financial liabilities are unchanged from IAS 39. IFRS 9 requirements address the problem of volatility in net earnings arising from an issuer choosing to measure certain liabilities at fair value and require that the portion of the change in fair value due to changes in the entity’s own credit risk be presented in other comprehensive income, rather than within net earnings. The new general hedge accounting model is intended to be simpler and more closely focused on how an entity manages its risks, replaces the IAS 39 effectiveness testing requirements with the principle of an economic relationship, and eliminates the requirement for retrospective assessment of hedge effectiveness. The new requirements for impairment of financial assets introduce an expected loss impairment model that requires more timely recognition of expected credit losses. IAS 39 impairment requirements are based on an incurred loss model where credit losses are not recognized until there is evidence of a trigger event. IFRS 9 is effective for annual periods beginning on or after January 1, 2018, with early application permitted. The Company is currently evaluating the impact of adopting this standard on its consolidated financial statements.
REVENUE FROM CONTRACTS WITH CUSTOMERS [“IFRS 15”]
IFRS 15, Revenue from Contracts with Customers, issued by the IASB in May 2014, is applicable to all revenue contracts and provides a model for the recognition and measurement of gains or losses from sales of some non-financial assets. The core principle is that revenue is recognized to depict the transfer of promised goods or services to customers in an amount that reflects the consideration to
which the entity expects to be entitled in exchange for those goods or services. The standard will also result in enhanced disclosures about revenue, provide guidance for transactions that were not previously addressed comprehensively [for example, service revenue and contract modifications] and improve guidance for multiple-element arrangements. IFRS 15 is effective for annual periods beginning on or after January 1, 2018, and is to be applied retrospectively, with earlier adoption permitted. Entities will transition following either a full or modified retrospective approach. The Company is currently evaluating the impact of the above standard on its consolidated financial statements.
LEASES [“IFRS 16”]
In January 2016, the IASB released IFRS 16, Leases, to replace the previous leases Standard, IAS 17, Leases, and related Interpretations. IFRS 16 sets out the principles for the recognition, measurement, presentation and disclosure of leases for both parties to a contract, the customer [lessee] and the supplier [lessor]. IFRS 16 eliminates the classification of leases as either operating leases or finance leases and introduces a single lessee accounting model. IFRS 16 also substantially carries forward the lessor accounting requirements. Accordingly, a lessor continues to classify its leases as operating lease or finance leases, and to account for those two types of leases differently.
IFRS 16 will be effective for the Company’s fiscal year beginning on January 1, 2019, with earlier application permitted only if the Company applies IFRS 15. The Company has not yet assessed the impact of the adoption of this standard on its consolidated financial statements.
SHARE-BASED PAYMENT [“IFRS 2”]
In June 2016, the IASB issued amendments to IFRS 2, Share-based Payment, clarifying how to account for certain types of share-based payment transactions. The amendments provide requirements on the accounting for the effects of vesting and non-vesting conditions on the measurement of cash-settled share-based payments, share-based payment transactions with a net settlement feature for withholding tax obligations and a modification to the terms and conditions of a share-based payment that changes the classification of the transaction
from cash-settled to equity-settled. The amendments apply for annual periods beginning on or after January 1, 2018. The Company is currently evaluating the impact of the amendments to IFRS 2 on its consolidated financial statements.
6. BUSINESS COMBINATIONS
[A] REM GRAIN VAC PRODUCT LINE
Effective February 3, 2014, the Company acquired the assets related to the Rem Grain Vac product line [“Grain Vac”]. The acquisition of Grain Vac provides the Company with a complementary product line.
During 2015, the allocation of the purchase price to acquired assets and liabilities was finalized. During 2016, the conditions related to the cash holdback were met and the $250 of cash held in trust was released to the vendors.
[B] VICWEST’S WESTEEL DIVISION
Effective May 20, 2015, the Company acquired substantially all of the assets of Vicwest’s Westeel Division [“Westeel”], Canada’s leading provider of grain storage solutions. The acquisition of Westeel provides the Company with an expanded growth platform within North America and around the world.
The purchase has been accounted for by the acquisition method with the results of Westeel included in the Company’s net earnings from the date of acquisition. The assets acquired and liabilities assumed of Westeel on the date of acquisition have been recorded in the consolidated financial statements at their estimated fair values as follows:
95 96C O N S O L I D A T E D F I N A N C I A L S T A T E M E N T S
2 0 1 6 A N N U A L R E P O R TF I E L D T O C O N S U M E R C O N S O L I D A T E D F I N A N C I A L S T A T E M E N T S
The goodwill of $87,083 comprises the value of the assembled workforce and other expected synergies arising from the acquisition.
The fair value of accounts receivable acquired is $22,281. This consists of the gross contractual value of $23,300, less the estimated amount not expected to be collected of $1,019.
In completing the measurement process, the estimated fair value of the land and building in Regina, Saskatchewan was decreased based on a more in-depth review of the condition of the property as at the date of acquisition. This has resulted in a decrease to property, plant and equipment and an increase in goodwill, each in the amount of $500 from the period previously reported. Also, a liability was identified that was not recorded at the acquisition date. This has resulted in an
increase to goodwill and accounts payable and accrued liabilities, each in the amount of $426. An additional deferred tax liability of $5,846 was recorded to reflect the deferred tax liability on indefinite lived intangible assets as if recovered through use based on the IFRIC decision in 2016.
Included in other liabilities was a put option liability that relates to Westeel’s European subsidiary. The put option held by the European subsidiary’s non-controlling shareholders provided them an option to put the remaining minority interest to the Company. Significant judgment was required to assess the date when the Company gained control over the European subsidiary and the Company determined that for the purposes of financial reporting such control was effective as at October 1, 2015. Factors relevant to this assessment included Board representation from the Company.
From the date of acquisition, Westeel contributed to the 2015 results $73,214 of revenue and $1,058 of net income. If the acquisition had taken place as at January 1, 2015, revenue from continuing operations in 2015 would have increased by an additional $60,806 and profit from continuing operations in 2015 would have increased by an additional $3,171.
The impacts on the cash flows on the acquisition of Westeel are as follows:
During the three-month period ended June 30, 2016, the allocation of the purchase price to acquired assets and liabilities was finalized.
Transaction costs related to the Westeel acquisition in the year ended December 31, 2016 were $88 [2015 – $3,455] and are included in selling, general and administrative expenses.
For the purposes of funding the purchase price, AGI issued $51.75
$
Cash and cash equivalents 13,183
Accounts receivable 22,281
Inventory 27,555
Prepaid expenses and other assets 868
Investment in European subsidiary 5,481
Property, plant and equipment 42,871
Intangible assets
Distribution network 37,600
Brand name 43,300
Order backlog 1,700
Goodwill 87,083
Other long-term assets 702
Accounts payable and accrued liabilities (22,358)
Customer deposits (709)
Provisions (1,172)
Income taxes payable (4,825)
Deferred tax liability (27,324)
Other liabilities (3,172)
Obligations under finance lease (1,422)
Purchase consideration 221,642 $
Purchase consideration 221,642
Less cash acquired (13,183)
Less cash acquired with European subsidiary (2,466)
Purchase consideration transferred 205,993
million subscription receipts [the “Subscription Receipts”] and $51.75 million aggregate principal amount extendible convertible unsecured subordinated debentures [note 25]. The remainder of the purchase price was funded by the Company through expanded credit facilities [note 23].
Upon the completion of the Westeel acquisition, the Subscription Receipt holders received one common share of AGI per Subscription Receipt.
The assets and liabilities of the European subsidiary on the date of control of October 1, 2015 were recorded in the consolidated financial statements at their estimated fair values:
The goodwill of $2,579 comprises the value of the assembled workforce and other expected synergies arising from the acquisition.
The fair value of the accounts receivable acquired is $3,417. This consists of the gross contractual value of $3,517, less the estimated amount not expected to be collected of $100.
In completing the measurement process, the Company identified certain non-refundable customer deposits recorded in the purchase price allocation. These deposits related to projects that were terminated prior
to acquisition and should not have been included in the allocation of the purchase price. This has resulted in a decrease in accounts payable and accrued liabilities and a decrease in goodwill, each in the amount of $1,129 from the period previously reported.
From the date of acquisition, the European subsidiary contributed to the 2015 results $14,098 of revenue and $1,217 of net income. If the acquisition had taken place as at January 1, 2015, revenue from continuing operations in 2015 would have increased by an additional $17,223 and profit from continuing operations in 2015 would have increased by an additional $157.
During the three-month period ended December 31, 2016, the allocation of the purchase price to acquired assets and liabilities was finalized.
There was no cash consideration exchanged at the date of control. The consideration given up or assumed consisted of the fair value of the previously held 51% interest in the European subsidiary and the recognition of a financial liability to acquire the remaining non-controlling interest based on the expected cash outflow which has been recorded as an other financial liability as at December 31, 2015. During the three-month period ended June 30, 2016, the Company acquired the remaining 49% of the European subsidiary for consideration of 6.0 million euros.
Transaction costs related to the European subsidiary acquisition in the year ended December 31, 2016 were $196 [2015 – $230] and are included in selling, general and administrative expenses.
[C] GJ VIS HOLDINGS INC. [“VIS”]
Effective November 30, 2015, the Company acquired 100% of the outstanding shares of Vis, a manufacturer of commercial fertilizer and feed handling equipment. The acquisition of Vis provides the Company with a new capability and experience in the planning, design and manufacture of high throughput industrial fertilizer handling equipment.
The purchase has been accounted for by the acquisition method with the results of Vis included in the Company’s net earnings from the date of acquisition. The assets and liabilities of Vis on the date of acquisition
$
Cash and cash equivalents 2,466
Accounts receivable 3,417
Inventory 8,803
Prepaid expenses and other assets 1,243
Deferred tax asset 48
Property, plant and equipment 228
Intangible assets
Distribution network 1,780
Brand name 1,929
Order backlog 806
Goodwill 2,579
Accounts payable and accrued liabilities (12,109)
Purchase consideration 11,190
97 98C O N S O L I D A T E D F I N A N C I A L S T A T E M E N T S
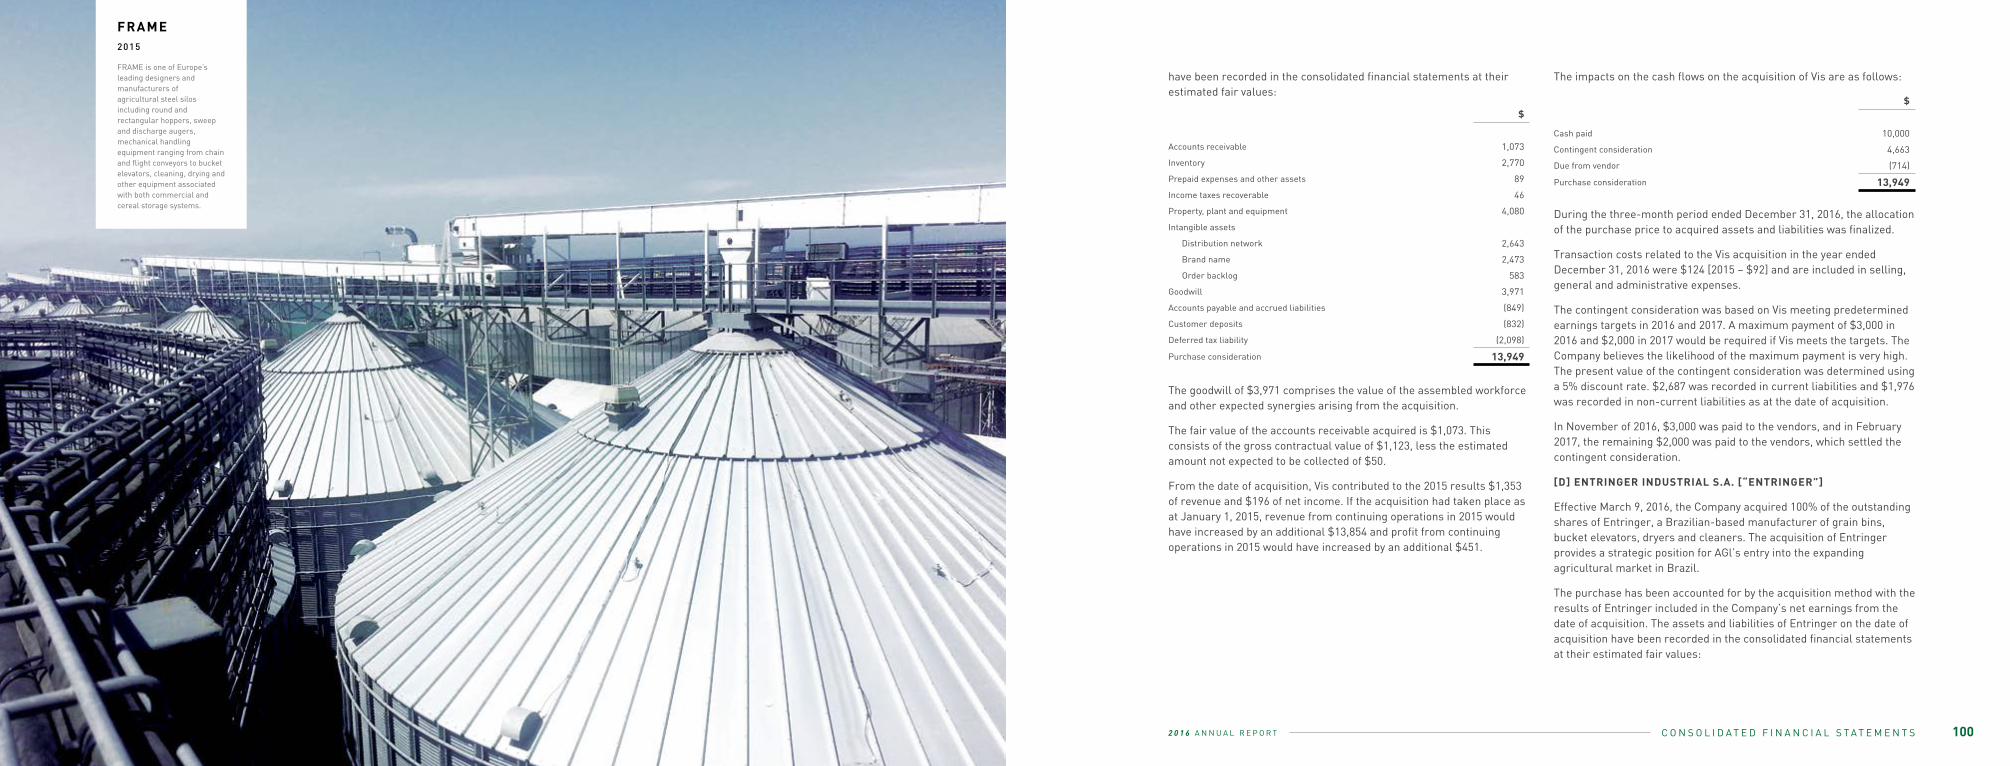
2 0 1 6 A N N U A L R E P O R TF I E L D T O C O N S U M E RC O N S O L I D A T E D F I N A N C I A L S T A T E M E N T S C O N S O L I D A T E D F I N A N C I A L S T A T E M E N T S
have been recorded in the consolidated financial statements at their estimated fair values:
The goodwill of $3,971 comprises the value of the assembled workforce and other expected synergies arising from the acquisition.
The fair value of the accounts receivable acquired is $1,073. This consists of the gross contractual value of $1,123, less the estimated amount not expected to be collected of $50.
From the date of acquisition, Vis contributed to the 2015 results $1,353 of revenue and $196 of net income. If the acquisition had taken place as at January 1, 2015, revenue from continuing operations in 2015 would have increased by an additional $13,854 and profit from continuing operations in 2015 would have increased by an additional $451.
The impacts on the cash flows on the acquisition of Vis are as follows:
During the three-month period ended December 31, 2016, the allocation of the purchase price to acquired assets and liabilities was finalized.
Transaction costs related to the Vis acquisition in the year ended December 31, 2016 were $124 [2015 – $92] and are included in selling, general and administrative expenses.
The contingent consideration was based on Vis meeting predetermined earnings targets in 2016 and 2017. A maximum payment of $3,000 in 2016 and $2,000 in 2017 would be required if Vis meets the targets. The Company believes the likelihood of the maximum payment is very high. The present value of the contingent consideration was determined using a 5% discount rate. $2,687 was recorded in current liabilities and $1,976 was recorded in non-current liabilities as at the date of acquisition.
In November of 2016, $3,000 was paid to the vendors, and in February 2017, the remaining $2,000 was paid to the vendors, which settled the contingent consideration.
[D] ENTRINGER INDUSTRIAL S.A. [“ENTRINGER”]
Effective March 9, 2016, the Company acquired 100% of the outstanding shares of Entringer, a Brazilian-based manufacturer of grain bins, bucket elevators, dryers and cleaners. The acquisition of Entringer provides a strategic position for AGl’s entry into the expanding agricultural market in Brazil.
The purchase has been accounted for by the acquisition method with the results of Entringer included in the Company’s net earnings from the date of acquisition. The assets and liabilities of Entringer on the date of acquisition have been recorded in the consolidated financial statements at their estimated fair values:
$
Accounts receivable 1,073
Inventory 2,770
Prepaid expenses and other assets 89
Income taxes recoverable 46
Property, plant and equipment 4,080
Intangible assets
Distribution network 2,643
Brand name 2,473
Order backlog 583
Goodwill 3,971
Accounts payable and accrued liabilities (849)
Customer deposits (832)
Deferred tax liability (2,098)
Purchase consideration 13,949
$
Cash paid 10,000
Contingent consideration 4,663
Due from vendor (714)
Purchase consideration 13,949
05 100
FRAME2015
FRAME is one of Europe’s leading designers and manufacturers ofagricultural steel silos including round and rectangular hoppers, sweep and discharge augers, mechanical handling equipment ranging from chain and flight conveyors to bucket elevators, cleaning, drying and other equipment associated with both commercial and cereal storage systems.
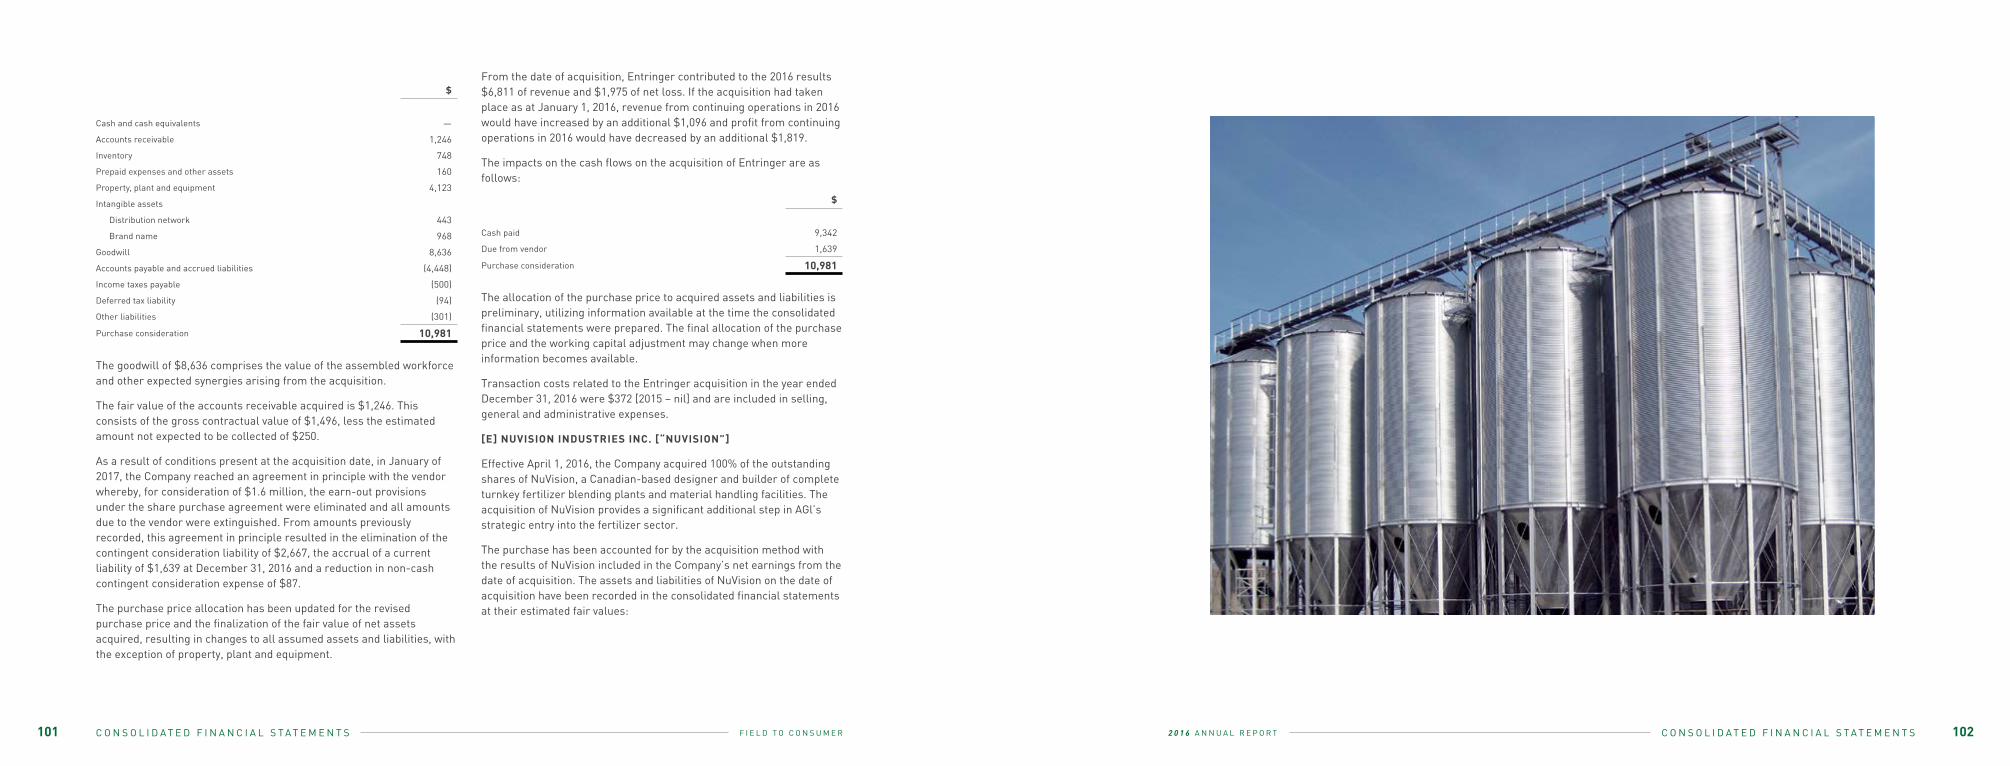
2 0 1 6 A N N U A L R E P O R TF I E L D T O C O N S U M E R C O N S O L I D A T E D F I N A N C I A L S T A T E M E N T S
$
Cash and cash equivalents —
Accounts receivable 1,246
Inventory 748
Prepaid expenses and other assets 160
Property, plant and equipment 4,123
Intangible assets
Distribution network 443
Brand name 968
Goodwill 8,636
Accounts payable and accrued liabilities (4,448)
Income taxes payable (500)
Deferred tax liability (94)
Other liabilities (301)
Purchase consideration 10,981
The goodwill of $8,636 comprises the value of the assembled workforce and other expected synergies arising from the acquisition.
The fair value of the accounts receivable acquired is $1,246. This consists of the gross contractual value of $1,496, less the estimated amount not expected to be collected of $250.
As a result of conditions present at the acquisition date, in January of 2017, the Company reached an agreement in principle with the vendor whereby, for consideration of $1.6 million, the earn-out provisions under the share purchase agreement were eliminated and all amounts due to the vendor were extinguished. From amounts previously recorded, this agreement in principle resulted in the elimination of the contingent consideration liability of $2,667, the accrual of a current liability of $1,639 at December 31, 2016 and a reduction in non-cash contingent consideration expense of $87.
The purchase price allocation has been updated for the revised purchase price and the finalization of the fair value of net assets acquired, resulting in changes to all assumed assets and liabilities, with the exception of property, plant and equipment.
From the date of acquisition, Entringer contributed to the 2016 results $6,811 of revenue and $1,975 of net loss. If the acquisition had taken place as at January 1, 2016, revenue from continuing operations in 2016 would have increased by an additional $1,096 and profit from continuing operations in 2016 would have decreased by an additional $1,819.
The impacts on the cash flows on the acquisition of Entringer are as follows:
The allocation of the purchase price to acquired assets and liabilities is preliminary, utilizing information available at the time the consolidated financial statements were prepared. The final allocation of the purchase price and the working capital adjustment may change when more information becomes available.
Transaction costs related to the Entringer acquisition in the year ended December 31, 2016 were $372 [2015 – nil] and are included in selling, general and administrative expenses.
[E] NUVISION INDUSTRIES INC. [“NUVISION”]
Effective April 1, 2016, the Company acquired 100% of the outstanding shares of NuVision, a Canadian-based designer and builder of complete turnkey fertilizer blending plants and material handling facilities. The acquisition of NuVision provides a significant additional step in AGl’s strategic entry into the fertilizer sector.
The purchase has been accounted for by the acquisition method with the results of NuVision included in the Company’s net earnings from the date of acquisition. The assets and liabilities of NuVision on the date of acquisition have been recorded in the consolidated financial statements at their estimated fair values:
$
Cash paid 9,342
Due from vendor 1,639
Purchase consideration 10,981
101 102C O N S O L I D A T E D F I N A N C I A L S T A T E M E N T S
2 0 1 6 A N N U A L R E P O R TF I E L D T O C O N S U M E R C O N S O L I D A T E D F I N A N C I A L S T A T E M E N T S
$
Cash 56
Accounts receivable 3,604
Inventory 1,205
Prepaid expenses and other assets 35
Property, plant and equipment 492
Intangible assets
Distribution network 6,408
Brand name 3,627
Order backlog 741
Goodwill 11,039
Accounts payable and accrued liabilities (2,665)
Customer deposits (1,476)
Income taxes payable (327)
Deferred tax liability (2,915)
Purchase consideration 19,824 The goodwill of $11,039 comprises the value of the assembled workforce and other expected synergies arising from the acquisition.
The fair value of the accounts receivable acquired is $3,604. This consists of the gross contractural value of $3,654, less the estimated amount not expected to be collected of $50.
During the measurement period, the Company identified certain customer deposits with a corresponding accounts receivable. As a result, both accounts receivable and customer deposits have been reduced by $785. The Company recorded a $398 decrease in amounts due from vendor with an offsetting increase to goodwill. As well, closing cash of $56 has been added to assets acquired by the Company, and a $74 liability was identified for third-party contract work that existed at the date of acquisition, each with one offsetting change to goodwill. There was an increase of $492 to deferred tax liabilities to reflect the increased tax rate associated with recovery of indefinite lived intangibles through use.
From the date of acquisition, NuVision contributed to the 2016 results $16,217 of revenue and $1,074 of net income. If the acquisition had taken place as at January 1, 2016, revenue from continuing operations in 2016 would have increased by an additional $4,380 and profit from continuing operations in 2016 would have increased by an additional $280.
The impacts on the cash flows on the acquisition of NuVision are as follows:
The allocation of the purchase price to acquired assets and liabilities is preliminary, utilizing information available at the time the consolidated financial statements were prepared. The final allocation of the purchase price and the working capital adjustment may change when more information becomes available.
Transaction costs related to the NuVision acquisition in the year ended December 31, 2016 were $105 [2015 – nil] and are included in selling, general and administrative expenses.
The contingent consideration is based on NuVision’s earnings in 2016, 2017 and 2018. Payments totalling $14 million between 2017 through 2019 would be required if NuVision meets the targets. The Company believes the likelihood of the maximum payment is moderate. The present value of the contingent consideration was determined using a 5% discount rate. $1,348 was recorded in current liabilities and $6,818 was recorded in non-current liabilities as at the date of acquisition.
$
Cash paid 6,000
Fair value of equipment to be provided to vendor 6,000
Contingent consideration 8,166
Due from vendor (342)
Purchase consideration 19,824
[F] MITCHELL MILL SYSTEMS CANADA LTD. AND MITCHELL MILL SYSTEMS USA
Effective July 18, 2016, the Company acquired 100% of the outstanding shares of Mitchell Mill Systems Canada Ltd., and its U.S. affiliate Mitchell Mill Systems USA [collectively, “Mitchell”]. Based in Canada with a second facility in the U.S., Mitchell manufactures handling equipment for grain, fertilizer, animal feed, food processing and industrial applications. The acquisition expands AGl’s commercial business into eastern Canada and the U.S. and also provides an expanded product offering.
The purchase has been accounted for by the acquisition method with the results of Mitchell included in the Company’s net earnings from the date of acquisition. The assets and liabilities of Mitchell on the date of acquisition have been recorded in the consolidated financial statements at their estimated fair values:
The goodwill of $7,806 comprises the value of the assembled workforce and other expected synergies arising from the acquisition.
The fair value of the accounts receivable acquired is $6,184. This consists of the gross contractual value of $6,259, less the estimated amount not expected to be collected of $75.
During the measurement period, a third-party valuation of the U.S. land and building was completed, resulting in an increase to property, plant and equipment of $610 with an offsetting decrease to goodwill. In addition, the estimated fair values of distribution network and order backlog were decreased by $99 and $997, respectively, based on a detailed review of the order backlog as at the acquisition date with offsetting increases to goodwill of $99 and $997, respectively. There was an increase to deferred tax liability of $412 to reflect an increase in the tax rate applied to indefinite lived intangibles.
From the date of acquisition, Mitchell contributed to the 2016 results $9,382 of revenue and $176 of net loss. If the acquisition had taken place as at January 1, 2016, revenue from continuing operations in 2016 would have increased by an additional $16,450 and profit from continuing operations in 2016 would have decreased by an additional $2,589.
The impacts on the cash flows on the acquisition of Mitchell are as follows:
The allocation of the purchase price to acquired assets and liabilities is preliminary, utilizing information available at the time the consolidated financial statements were prepared. The final allocation of the purchase price and the working capital adjustment may change when more information becomes available.
Transaction costs related to the Mitchell acquisition in the year ended December 31, 2016 were $182 [2015 – nil] and are included in selling, general and administrative expenses.
$
Accounts receivable 6,184
Inventory 3,319
Prepaid expenses and other assets 95
Property, plant and equipment 6,923
Intangible assets
Brand name 3,607
Distribution network 6,485
Order backlog 223
Goodwill 7,806
Accounts payable and accrued liabilities (2,077)
Customer deposits (1,340)
Income taxes payable (483)
Deferred tax liability (4,374)
Purchase consideration 26,368
$
Cash paid 16,300
Due to vendor 500
Contingent consideration 9,091
Working capital adjustment payable 477
Purchase consideration 26,368
103 104C O N S O L I D A T E D F I N A N C I A L S T A T E M E N T S

2 0 1 6 A N N U A L R E P O R TF I E L D T O C O N S U M E R C O N S O L I D A T E D F I N A N C I A L S T A T E M E N T S
The contingent consideration is based on Mitchell meeting predetermined earnings targets in 2017 through 2019. A maximum payment of $4,200 in 2017, $4,200 in 2018, and $4,800 in 2019 would be required if Mitchell meets the targets for a total of $13,200. The Company believes the likelihood of the maximum payment is moderate. The present value of the contingent consideration was determined using a 5% discount rate. $3,914 was recorded in current liabilities and $5,177 was recorded in non-current liabilities as at the date of acquisition.
[G] YARGUS MANUFACTURING INC.
Effective November 18, 2016, the Company acquired 100% of the outstanding shares of Yargus Manufacturing Inc. and selected assets of the real estate holding company Clark Center Properties Inc. [collectively “Yargus”]. Based in the U.S., Yargus manufactures handling equipment for grain, fertilizer, feed, food processing and industrial applications. The acquisition continues AGl’s commercial business expansion into the U.S. and also provides an expanded product offering.
The purchase has been accounted for by the acquisition method with the results of Yargus included in the Company’s net earnings from the date of acquisition. The assets and liabilities of Yargus on the date of acquisition have been recorded in the consolidated financial statements at their estimated fair values:
$
Accounts receivable 2,812
Inventory 7,226
Prepaid expenses and other assets 443
Property, plant and equipment 13,120
Intangible assets
Brand name 12,868
Distribution network 6,572
Order backlog 2,556
Goodwill 30,295
Bank indebtedness (91)
Accounts payable and accrued liabilities (8,389)
Customer deposits (5,595)
Deferred revenue (1,723)
Due to vendor (2,285)
Capital leases (597)
Notes payable (98)
Deferred tax liability 1,083
Purchase consideration 58,197
The goodwill of $30,295 comprises the value of the assembled workforce and other expected synergies arising from the acquisition.
The fair value of the accounts receivable acquired is $2,812. This consists of the gross contractual value of $4,164 less the estimated amount not expected to be collected of $1,352.
From the date of acquisition, Yargus contributed to the 2016 results $6,750 of revenue and $330 of net loss. If the acquisition had taken place as at January 1, 2016, revenue from continuing operations in 2016 would have increased by an additional $50,269 and profit from continuing operations in 2016 would have decreased by an additional $7,804.
The impacts on the cash flows on the acquisition of Yargus are as follows:
The allocation of the purchase price to acquired assets and liabilities is preliminary, utilizing information available at the time the consolidated financial statements were prepared. The final allocation of the purchase price and the working capital adjustment may change when more information becomes available.
Costs related to the Yargus acquisition in the year ended December 31, 2016 were $286 [2015 – nil] and are included in selling, general and administrative expenses.
7. DISCONTINUED OPERATIONS
During the second quarter of 2016, the Company entered into an agreement with Arskametalli Oy [“Arska”] to sell selected assets of its wholly owned subsidiary Mepu Oy [“Mepu”]. On June 15, 2016, the Company completed the sale and, after preliminary customary
adjustments and transactions costs, the Company recognized net cash proceeds on sale of $3,107. Final closing adjustments will be recognized as $290, which was received in the fourth quarter of 2016, and remaining proceeds of $798 will be received as 10 payments of $105 due annually beginning June of 2017. The present value of these 10 payments has been calculated to be $798.
During the third quarter of 2016, the Company entered into an agreement with Tarter Tube LLC [“Tarter”] to sell selected assets of its wholly owned subsidiaries Applegate Livestock Equipment Inc. and Applegate Trucking Inc. [collectively, “Applegate”]. On August 12, 2016, the Company completed the sale and, after preliminary customary adjustments and transaction costs, the Company recognized net cash proceeds on sale of $4,102.
The financial results attributable to Mepu and Applegate have been presented as discontinued operations.
The results of discontinued operations for the year ended December 31, 2016 are as follows:
CONSOLIDATED STATEMENTS OF INCOME (LOSS) FROM DISCONTINUED OPERATIONS
$
Purchase consideration 58,197
Add: bank indebtedness acquired 91
Less: cash held in trust (5,093)
Purchase consideration transferred 53,195
2016$
2015$
SALES 15,509 35,369
Cost of goods sold 13,158 30,596
GROSS PROFIT 2,351 4,773
EXPENSES
Selling, general and administrative 2,938 6,898
Other operating income (36) (55)
Impairment (recovery) (904) 13,439
1,998 20,282
PROFIT (LOSS) FROM DISCONTINUED OPERATIONS FOR THE YEAR 353 (15,509)
105 106C O N S O L I D A T E D F I N A N C I A L S T A T E M E N T S
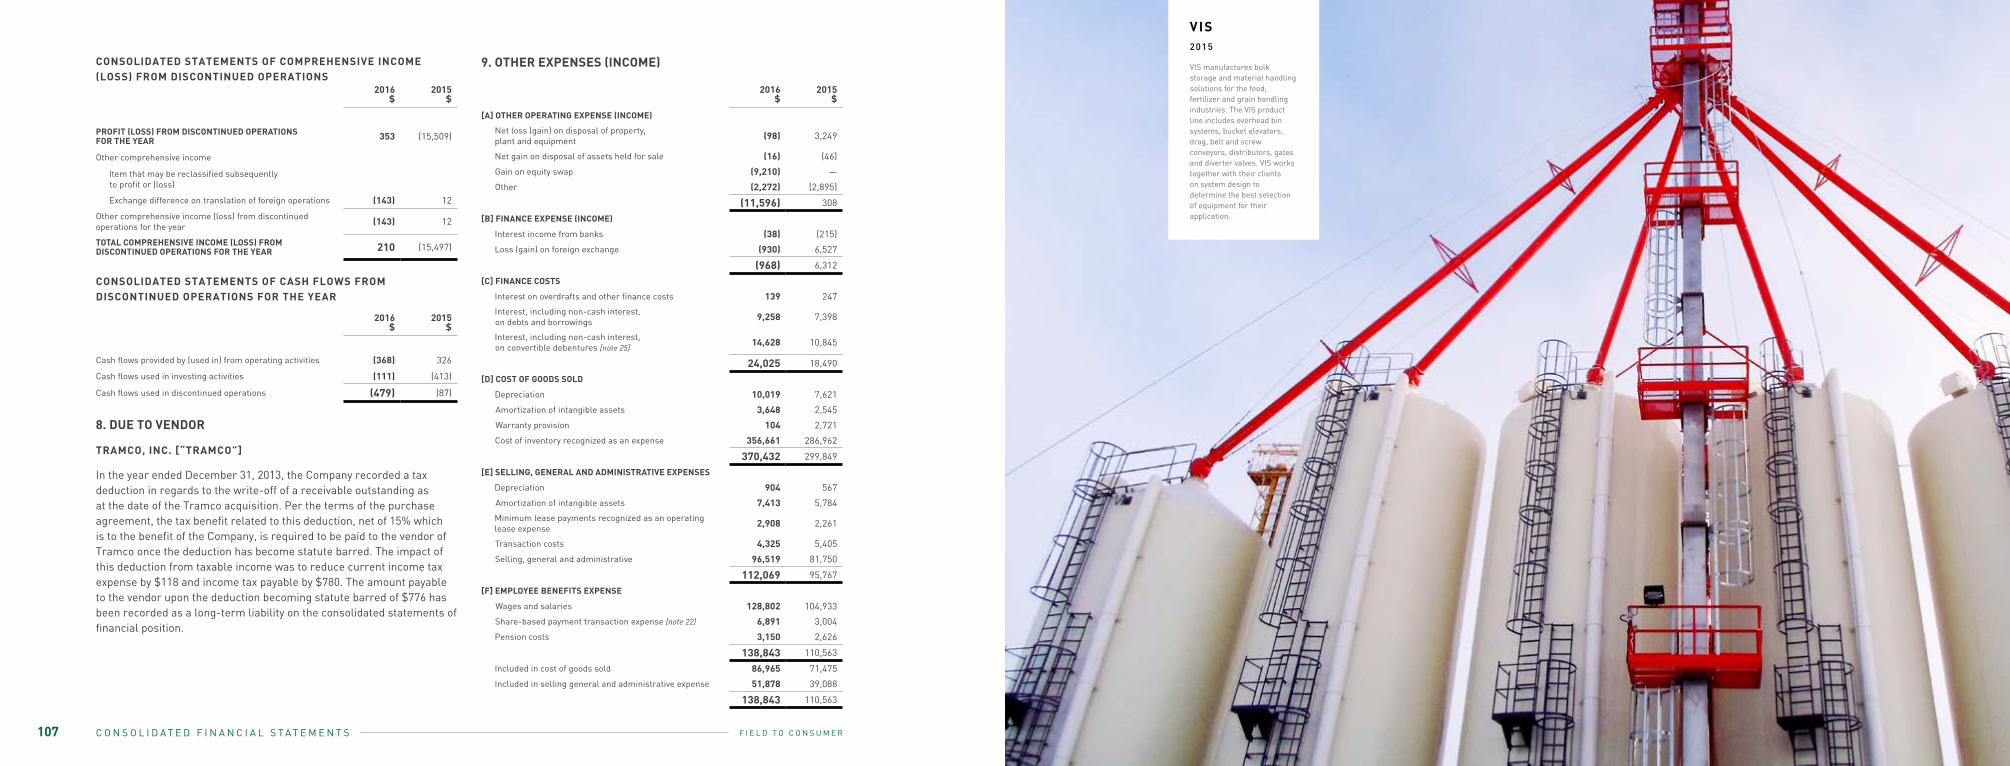
2 0 1 6 A N N U A L R E P O R TF I E L D T O C O N S U M E R C O N S O L I D A T E D F I N A N C I A L S T A T E M E N T S
8. DUE TO VENDOR
TRAMCO, INC. [“TRAMCO”]
In the year ended December 31, 2013, the Company recorded a tax deduction in regards to the write-off of a receivable outstanding as at the date of the Tramco acquisition. Per the terms of the purchase agreement, the tax benefit related to this deduction, net of 15% which is to the benefit of the Company, is required to be paid to the vendor of Tramco once the deduction has become statute barred. The impact of this deduction from taxable income was to reduce current income tax expense by $118 and income tax payable by $780. The amount payable to the vendor upon the deduction becoming statute barred of $776 has been recorded as a long-term liability on the consolidated statements of financial position.
9. OTHER EXPENSES (INCOME)CONSOLIDATED STATEMENTS OF COMPREHENSIVE INCOME (LOSS) FROM DISCONTINUED OPERATIONS
2016$
2015$
PROFIT (LOSS) FROM DISCONTINUED OPERATIONS FOR THE YEAR 353 (15,509)
Other comprehensive income
Item that may be reclassified subsequently to profit or (loss)
Exchange difference on translation of foreign operations (143) 12
Other comprehensive income (loss) from discontinued operations for the year (143) 12
TOTAL COMPREHENSIVE INCOME (LOSS) FROM DISCONTINUED OPERATIONS FOR THE YEAR 210 (15,497)
2016$
2015$
Cash flows provided by (used in) from operating activities (368) 326
Cash flows used in investing activities (111) (413)
Cash flows used in discontinued operations (479) (87)
CONSOLIDATED STATEMENTS OF CASH FLOWS FROM DISCONTINUED OPERATIONS FOR THE YEAR
2016$
2015$
[A] OTHER OPERATING EXPENSE (INCOME)
Net loss (gain) on disposal of property, plant and equipment (98) 3,249
Net gain on disposal of assets held for sale (16) (46)
Gain on equity swap (9,210) —
Other (2,272) (2,895)
(11,596) 308
[B] FINANCE EXPENSE (INCOME)
Interest income from banks (38) (215)
Loss (gain) on foreign exchange (930) 6,527
(968) 6,312
[C] FINANCE COSTS
Interest on overdrafts and other finance costs 139 247
Interest, including non-cash interest, on debts and borrowings 9,258 7,398
Interest, including non-cash interest, on convertible debentures [note 25]
14,628 10,845
24,025 18,490
[D] COST OF GOODS SOLD
Depreciation 10,019 7,621
Amortization of intangible assets 3,648 2,545
Warranty provision 104 2,721
Cost of inventory recognized as an expense 356,661 286,962
370,432 299,849
[E] SELLING, GENERAL AND ADMINISTRATIVE EXPENSES
Depreciation 904 567
Amortization of intangible assets 7,413 5,784
Minimum lease payments recognized as an operating lease expense 2,908 2,261
Transaction costs 4,325 5,405
Selling, general and administrative 96,519 81,750
112,069 95,767
[F] EMPLOYEE BENEFITS EXPENSE
Wages and salaries 128,802 104,933
Share-based payment transaction expense [note 22] 6,891 3,004
Pension costs 3,150 2,626
138,843 110,563
Included in cost of goods sold 86,965 71,475
Included in selling general and administrative expense 51,878 39,088
138,843 110,563
107 06
VIS2015
VIS manufactures bulk storage and material handling solutions for the feed, fertilizer and grain handling industries. The VIS product line includes overhead bin systems, bucket elevators, drag, belt and screw conveyors, distributors, gates and diverter valves. VIS works together with their clientson system design to determine the best selection of equipment for theirapplication.
C O N S O L I D A T E D F I N A N C I A L S T A T E M E N T S
2 0 1 6 A N N U A L R E P O R TF I E L D T O C O N S U M E R C O N S O L I D A T E D F I N A N C I A L S T A T E M E N T S
LAND$
GROUNDS$
BUILDINGS$
LEASEHOLDIMPROVEMENTS
$
FURNITUREAND FIXTURES
$VEHICLES
$
COMPUTERHARDWARE
$
MANUFACTURINGEQUIPMENT
$
CONSTRUCTIONIN PROGRESS
$TOTAL
$
COST
Balance, January 1, 2015 6,318 1,073 44,286 2,485 1,597 5,946 3,677 60,601 8,188 134,171
Additions 553 1,977 28,166 528 413 543 551 16,592 (9,677) 39,646
Acquisitions 10,867 176 17,869 62 387 1,166 79 17,069 4 47,679
Classification as held for sale (2,500) (338) (3,086) — — — (5) (190) — (6,119)
Disposals (2,264) — (4,638) (579) (72) (120) (42) (1,224) — (8,939)
Impairment [note 17] — — (3,111) — — — — (4,922) — (8,033)
Exchange differences 862 112 3,301 136 86 172 229 4,052 1,577 10,527
Balance, December 31, 2015 13,836 3,000 82,787 2,632 2,411 7,707 4,489 91,978 92 208,932
DEPRECIATION
Balance, January 1, 2015 — 406 5,653 869 843 3,692 2,454 20,642 — 34,559
Depreciation — 143 2,115 216 167 549 467 5,401 — 9,058
Classification as held for sale — (41) (528) — — — (5) (89) — (663)
Disposals — — (696) (578) (27) (102) (37) (657) — (2,097)
Exchange differences — 26 234 97 42 83 147 1,759 — 2,388
Balance, December 31, 2015 — 534 6,778 604 1,025 4,222 3,026 27,056 — 43,245
NET BOOK VALUE, JANUARY 1, 2015 6,318 667 38,633 1,616 754 2,254 1,223 39,959 8,188 99,612
NET BOOK VALUE, DECEMBER 31, 2015 13,836 2,466 76,009 2,028 1,386 3,485 1,463 64,922 92 165,687
10. PROPERTY, PLANT AND EQUIPMENT
LAND$
GROUNDS$
BUILDINGS$
LEASEHOLDIMPROVEMENTS
$
FURNITUREAND FIXTURES
$VEHICLES
$
COMPUTERHARDWARE
$
MANUFACTURINGEQUIPMENT
$
CONSTRUCTIONIN PROGRESS
$TOTAL
$
COST
Balance, January 1, 2016 13,836 3,000 82,787 2,632 2,411 7,707 4,489 91,978 92 208,932
Additions 582 365 907 89 154 1,356 780 4,207 31,762 40,203
Acquisitions 2,126 779 13,144 47 38 2,173 208 6,142 — 24,657
Disposals (87) — (53) (27) (19) (412) (140) (560) (189) (1,487)
Impairment [note 17] — — — — — — — (2,548) — (2,548)
Discontinued operations (412) (91) (3,082) — (135) (476) (480) (4,567) (52) (9,295)
Exchange differences 33 (40) (1,167) (17) (17) (19) (76) (2,354) (5) (3,662)
Balance, December 31, 2016 16,078 4,013 92,536 2,724 2,432 10,329 4,781 92,298 31,608 256,799
DEPRECIATION
Balance, January 1, 2016 — 534 6,778 604 1,025 4,222 3,026 27,056 — 43,245
Depreciation — 219 2,299 257 195 1,065 514 6,374 — 10,923
Disposals — — (49) (5) (5) (263) (94) (363) — (779)
Impairment [note 17] — — — — — — — (109) — (109)
Discontinued operations — (56) (866) — (108) (242) (373) (3,610) — (5,255)
Exchange differences — (9) (76) (3) (12) (33) (50) (500) — (683)
Balance, December 31, 2016 — 688 8,086 853 1,095 4,749 3,023 28,848 — 47,342
NET BOOK VALUE, JANUARY 1, 2016 13,836 2,466 76,009 2,028 1,386 3,485 1,463 64,922 92 165,687
NET BOOK VALUE, DECEMBER 31, 2016 16,078 3,325 84,450 1,871 1,337 5,580 1,758 63,450 31,608 209,457
109 110C O N S O L I D A T E D F I N A N C I A L S T A T E M E N T S
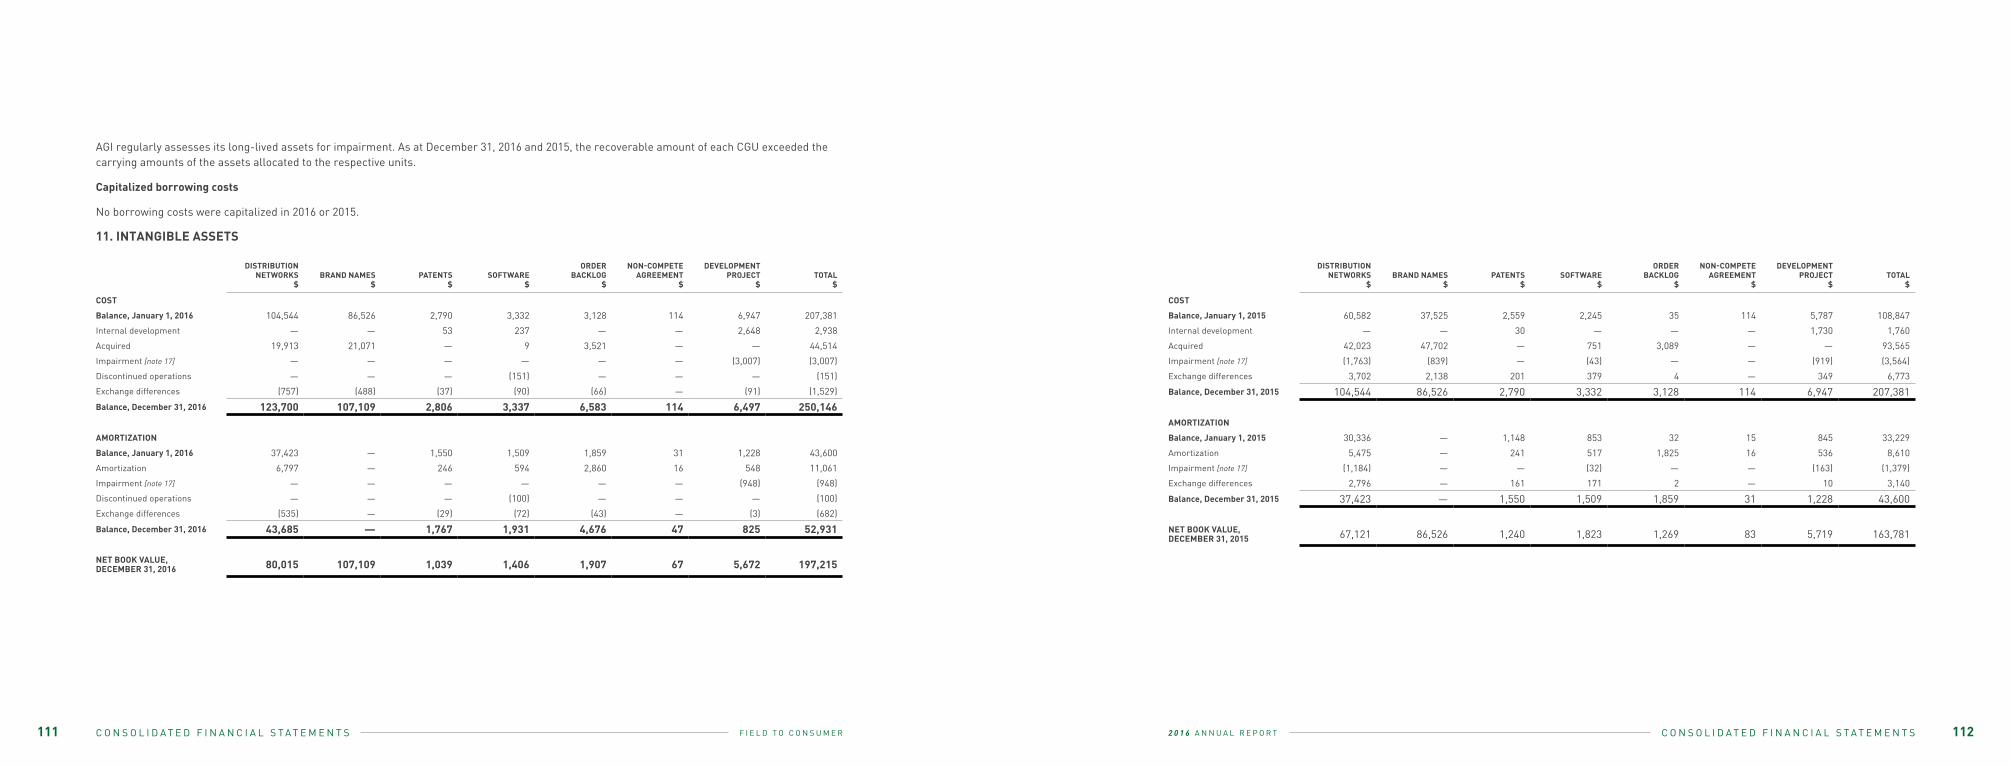
2 0 1 6 A N N U A L R E P O R TF I E L D T O C O N S U M E R C O N S O L I D A T E D F I N A N C I A L S T A T E M E N T S
AGI regularly assesses its long-lived assets for impairment. As at December 31, 2016 and 2015, the recoverable amount of each CGU exceeded the carrying amounts of the assets allocated to the respective units.
Capitalized borrowing costs
No borrowing costs were capitalized in 2016 or 2015.
11. INTANGIBLE ASSETS
DISTRIBUTIONNETWORKS
$BRAND NAMES
$PATENTS
$SOFTWARE
$
ORDERBACKLOG
$
NON-COMPETEAGREEMENT
$
DEVELOPMENTPROJECT
$TOTAL
$
COST
Balance, January 1, 2016 104,544 86,526 2,790 3,332 3,128 114 6,947 207,381
Internal development — — 53 237 — — 2,648 2,938
Acquired 19,913 21,071 — 9 3,521 — — 44,514
Impairment [note 17] — — — — — — (3,007) (3,007)
Discontinued operations — — — (151) — — — (151)
Exchange differences (757) (488) (37) (90) (66) — (91) (1,529)
Balance, December 31, 2016 123,700 107,109 2,806 3,337 6,583 114 6,497 250,146
AMORTIZATION
Balance, January 1, 2016 37,423 — 1,550 1,509 1,859 31 1,228 43,600
Amortization 6,797 — 246 594 2,860 16 548 11,061
Impairment [note 17] — — — — — — (948) (948)
Discontinued operations — — — (100) — — — (100)
Exchange differences (535) — (29) (72) (43) — (3) (682)
Balance, December 31, 2016 43,685 — 1,767 1,931 4,676 47 825 52,931
NET BOOK VALUE, DECEMBER 31, 2016 80,015 107,109 1,039 1,406 1,907 67 5,672 197,215
DISTRIBUTIONNETWORKS
$BRAND NAMES
$PATENTS
$SOFTWARE
$
ORDERBACKLOG
$
NON-COMPETEAGREEMENT
$
DEVELOPMENTPROJECT
$TOTAL
$
COST
Balance, January 1, 2015 60,582 37,525 2,559 2,245 35 114 5,787 108,847
Internal development — — 30 — — — 1,730 1,760
Acquired 42,023 47,702 — 751 3,089 — — 93,565
Impairment [note 17] (1,763) (839) — (43) — — (919) (3,564)
Exchange differences 3,702 2,138 201 379 4 — 349 6,773
Balance, December 31, 2015 104,544 86,526 2,790 3,332 3,128 114 6,947 207,381
AMORTIZATION
Balance, January 1, 2015 30,336 — 1,148 853 32 15 845 33,229
Amortization 5,475 — 241 517 1,825 16 536 8,610
Impairment [note 17] (1,184) — — (32) — — (163) (1,379)
Exchange differences 2,796 — 161 171 2 — 10 3,140
Balance, December 31, 2015 37,423 — 1,550 1,509 1,859 31 1,228 43,600
NET BOOK VALUE, DECEMBER 31, 2015 67,121 86,526 1,240 1,823 1,269 83 5,719 163,781
111 112C O N S O L I D A T E D F I N A N C I A L S T A T E M E N T S
2 0 1 6 A N N U A L R E P O R TF I E L D T O C O N S U M E R C O N S O L I D A T E D F I N A N C I A L S T A T E M E N T S
The Company is continuously working on research and development projects. Development costs capitalized include the development of new products and the development of new applications of existing products and prototypes. Research costs and development costs that are not eligible for capitalization have been expensed and are recognized in selling, general and administrative expenses.
Intangible assets include patents acquired through business combinations, which have a remaining life between two and nine years. All brand names with a carrying amount of $86,526 [2015 – $86,526] have been classified as indefinite-life intangible assets, as the Company expects to maintain these brand names and currently no end point of the useful lives of these brand names can be determined. The Company assesses the assumption of an indefinite useful life at least annually. For definite-life intangible assets, the Company assesses whether there are indicators of impairment at subsequent reporting dates as a triggering event for performing an impairment test.
Intangible assets and research and development expenses for the year ended December 31, 2016, are net of combined federal and provincial scientific research and experimental development [“SR&ED”] tax credits in the amounts of $35 and $106, respectively. A number of specific criteria must be met in order to qualify for federal and provincial SR&ED investment tax credits. As at December 31, 2016, the Company had federal investment tax credit carryforwards in the amount of $2,324 [2015 – $2,324], federal SR&ED investment tax credit carryforwards in the amount of $980 [2015 – $935], provincial SR&ED investment tax credit carryforwards in the amount of $287 [2015 – $232] and provincial manufacturing or processing tax credits in the amount of $448 [2015 – $439]; these began expiring in 2015.
Other significant intangible assets are goodwill [note 12] and the distribution network of the Company. The distribution network was acquired in past business combinations and reflects the Company’s dealer network in North America. The remaining amortization period for the distribution network ranges from 2 to 20 years.
The Company had no contractual commitments for the acquisition of intangible assets as of the reporting date.
12. GOODWILL
13. IMPAIRMENT TESTING
The Company performs its annual goodwill impairment test as at December 31. The recoverable amount of the Company’s group of CGUs has been determined based on value in use for the year ended December 31, 2016, using cash flow projections covering a five-year period. The various pre-tax discount rates applied to the cash flow projections are between 8.8% and 19.0% [2015 – 12.3% and 14.3%] and cash flows beyond the five-year period are extrapolated using a 3% growth rate [2015 – 3%], which is management’s estimate of long-term inflation and productivity growth in the industry and geographies in which it operates.
The Company’s group of CGUs and goodwill and indefinite-life intangible assets allocated thereto are as follows, which represents how goodwill and indefinite-life intangible assets are monitored by management:
2016$
2015$
BALANCE, BEGINNING OF YEAR 170,262 71,356
Acquisition [note 6] 57,472 93,745
Impairment [note 17] (67) (414)
Exchange differences (217) 5,575
BALANCE, END OF YEAR 227,450 170,262
2016$
2015$
Farm
Goodwill 130,371 127,964
Intangible assets with indefinite lives 69,302 68,502
Commercial
Goodwill 97,079 42,298
Intangible assets with indefinite lives 37,807 18,024
Total
Goodwill 227,450 170,262
Intangible assets with indefinite lives 107,109 86,526
113 114C O N S O L I D A T E D F I N A N C I A L S T A T E M E N T S
2 0 1 6 A N N U A L R E P O R TF I E L D T O C O N S U M E R C O N S O L I D A T E D F I N A N C I A L S T A T E M E N T S
KEY ASSUMPTIONS USED IN VALUATION CALCULATIONS
The calculation of value in use or fair value less cost to sell for all the CGUs or group of CGUs is most sensitive to the following assumptions:
• Gross margins;
• Discount rates;
• Market share during the budget period; and
• Growth rate used to extrapolate cash flows beyond the budget period.
Gross margins
Forecasted gross margins are based on actual gross margins achieved in the years preceding the forecast period. Margins are kept constant over the forecast period and the terminal period, unless management has started an efficiency improvement process.
Discount rates
Discount rates reflect the current market assessment of the risks specific to each CGU or group of CGUs. The discount rate was estimated based on the weighted average cost of capital for the industry. This rate was further adjusted to reflect the market assessment of any risk specific to the CGU or group of CGUs for which future estimates of cash flows have not been adjusted.
Market share assumptions
These assumptions are important because, as well as using industry data for growth rates [as noted below], management assesses how the CGU’s or group of CGUs position, relative to its competitors, might change over the forecast period.
Growth rate estimates
Rates are based on published research and are primarily derived from the long-term Consumer Price Index expectations for the markets in which AGI operates. Management considers the Consumer Price Index to be a conservative indicator of the long-term growth expectations for
the agricultural industry.
14. ASSETS HELD FOR SALE
In 2015, AGI acquired Westeel, which included land and building in Regina, Saskatchewan that met the definition of assets held for sale. The related carrying amount of $4,100 was recorded as assets held for sale. During 2016, the carrying amount of this land and building was reduced to $2,745.
In 2015, AGI transferred all production activities from its existing facility to a new facility, both located in Decatur, Illinois. AGI concluded that the grounds, building and selected equipment at the existing Decatur, Illinois facility met the definition of assets held for sale. The related carrying amount of $1,356 has been recorded as assets held for sale. During 2016, the carrying amount of this grounds, building and selected equipment was reduced to $403.
In 2015, the land and building of the Lethbridge facility included in assets held for sale were sold and the related carrying amount of $1,101 was removed from assets held for sale.
In 2016, land and building in Winnipeg, Manitoba included in assets held for sale were sold and the related carrying amount of $1,150 was removed from assets held for sale.
As at December 31, 2016, the land carrying value is $1,674 [2015 – $2,944] and the building carrying value is $1,474 [2015 – $3,662].
15. AVAILABLE-FOR-SALE INVESTMENT
In fiscal 2009, AGI invested in a privately held Canadian farming company [“Investco”]. AGI assesses at each reporting period whether there is any objective evidence that its investment is impaired.
16. CASH AND CASH EQUIVALENTS/CHANGES IN NON CASH WORKING CAPITAL
Cash and cash equivalents as at the date of the consolidated statements of financial position and for the purpose of the consolidated statements of cash flows relate to cash at banks and cash on hand. Cash at banks earns interest at floating rates based on daily bank deposit rates.
The change in the non-cash working capital balances related to continuing operations is calculated as follows:
17. IMPAIRMENT OF ASSETS
During 2015, AGI conducted a strategic review regarding operations in Union City, U.S. and Yläne, Finland. Management concluded that these operations were no longer strategically aligned with the business objectives of AGI and accordingly determined to exit the businesses by way of divestiture or disposal. As a result, the Company concluded that certain of the assets of these CGUs were impaired and incurred impairment charges of $13,439 during the fourth quarter of 2015 to reflect the fair value less costs to sell of these assets. These non-cash impairment charges were recorded to income. Management’s estimate of the recoverable amount of these assets was based on external information and observable conditions where possible, supplemented by internal analysis as required, which falls within Level 3 of the fair value hierarchy – refer to note 29[c] for further details related to the determination of fair value.
As at December 31, 2016, Mepu and Applegate have been classified as discontinued operations [note 7]. AGI completed the sale of Mepu on June 15, 2016 [note 7], and the sale of Applegate on August 12, 2016 [note 7], and accordingly Mepu and Applegate have been classified as discontinued operations. Based on the terms of the sale of Mepu, the final impairment amount was $5,228 and as a result, a reversal of the impairment charge of $1,373 was recorded in the year ended December 31, 2016. Based on the terms of the sale of Applegate, the final
2016$
2015$
Accounts receivable 6,707 39,048
Inventory 6,753 8,291
Prepaid expenses and other assets (4,211) 2,076
Accounts payable and accrued liabilities (777) (23,571)
Customer deposits (7,871) 7,056
Provisions (862) 1,549
(261) 34,449
115 116C O N S O L I D A T E D F I N A N C I A L S T A T E M E N T S
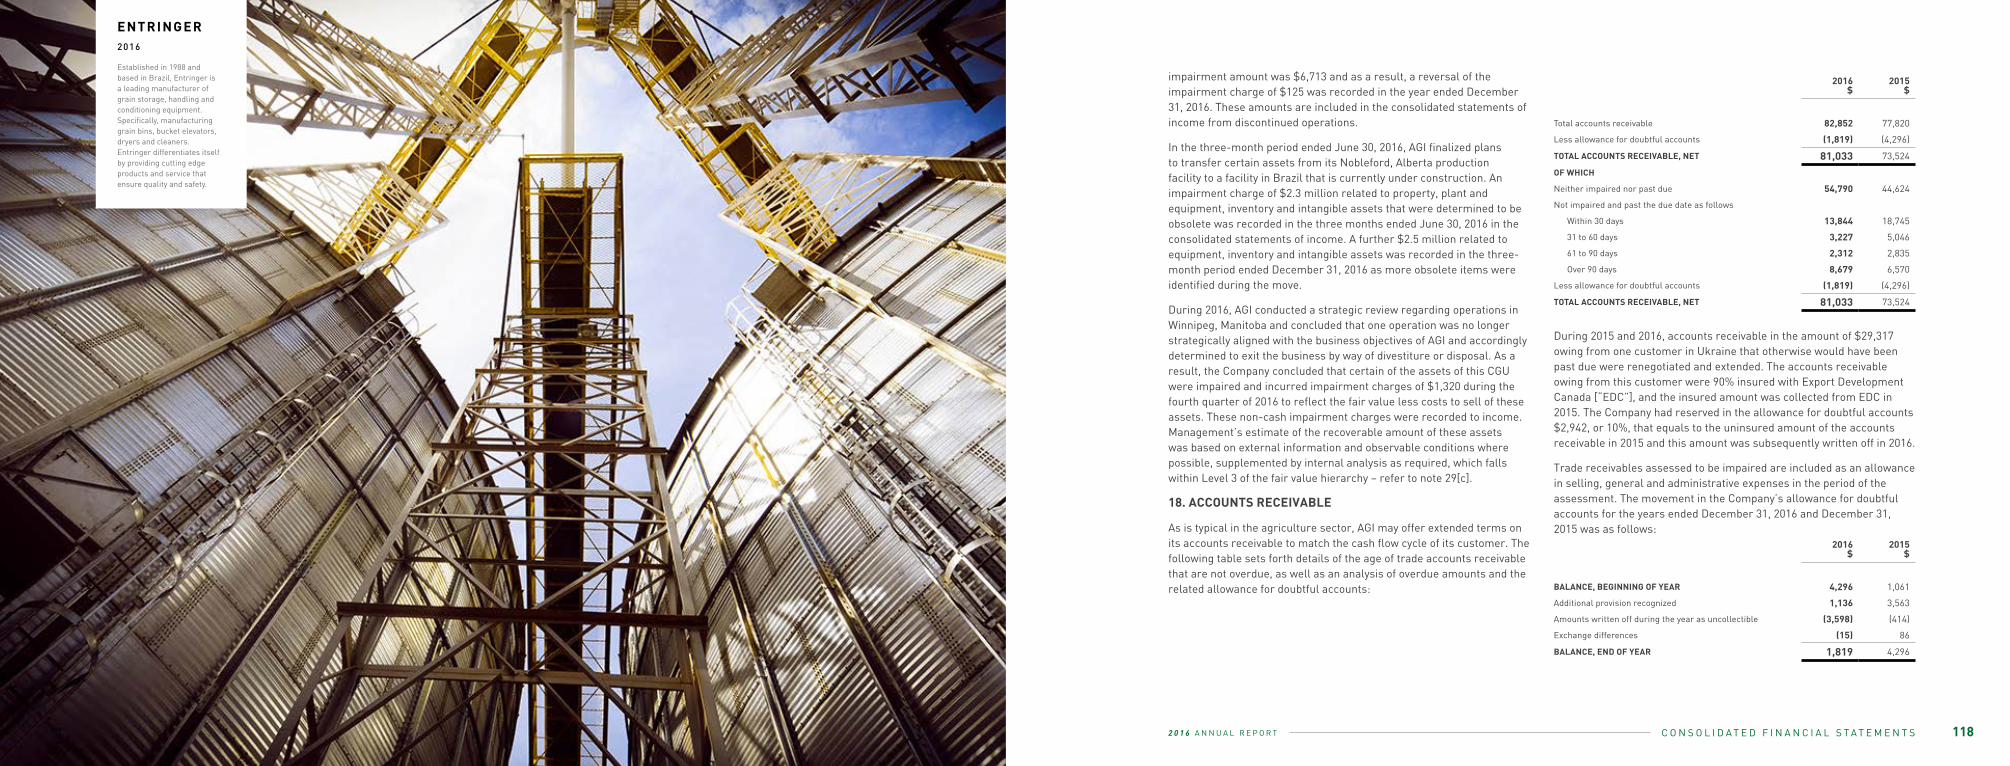
2 0 1 6 A N N U A L R E P O R TF I E L D T O C O N S U M E RC O N S O L I D A T E D F I N A N C I A L S T A T E M E N T S C O N S O L I D A T E D F I N A N C I A L S T A T E M E N T S
impairment amount was $6,713 and as a result, a reversal of the impairment charge of $125 was recorded in the year ended December 31, 2016. These amounts are included in the consolidated statements of income from discontinued operations.
In the three-month period ended June 30, 2016, AGI finalized plans to transfer certain assets from its Nobleford, Alberta production facility to a facility in Brazil that is currently under construction. An impairment charge of $2.3 million related to property, plant and equipment, inventory and intangible assets that were determined to be obsolete was recorded in the three months ended June 30, 2016 in the consolidated statements of income. A further $2.5 million related to equipment, inventory and intangible assets was recorded in the three-month period ended December 31, 2016 as more obsolete items were identified during the move.
During 2016, AGI conducted a strategic review regarding operations in Winnipeg, Manitoba and concluded that one operation was no longer strategically aligned with the business objectives of AGI and accordingly determined to exit the business by way of divestiture or disposal. As a result, the Company concluded that certain of the assets of this CGU were impaired and incurred impairment charges of $1,320 during the fourth quarter of 2016 to reflect the fair value less costs to sell of these assets. These non-cash impairment charges were recorded to income. Management’s estimate of the recoverable amount of these assets was based on external information and observable conditions where possible, supplemented by internal analysis as required, which falls within Level 3 of the fair value hierarchy – refer to note 29[c].
18. ACCOUNTS RECEIVABLE
As is typical in the agriculture sector, AGI may offer extended terms on its accounts receivable to match the cash flow cycle of its customer. The following table sets forth details of the age of trade accounts receivable that are not overdue, as well as an analysis of overdue amounts and the related allowance for doubtful accounts:
During 2015 and 2016, accounts receivable in the amount of $29,317 owing from one customer in Ukraine that otherwise would have been past due were renegotiated and extended. The accounts receivable owing from this customer were 90% insured with Export Development Canada [“EDC”], and the insured amount was collected from EDC in 2015. The Company had reserved in the allowance for doubtful accounts $2,942, or 10%, that equals to the uninsured amount of the accounts receivable in 2015 and this amount was subsequently written off in 2016.
Trade receivables assessed to be impaired are included as an allowance in selling, general and administrative expenses in the period of the assessment. The movement in the Company’s allowance for doubtful accounts for the years ended December 31, 2016 and December 31, 2015 was as follows:
2016$
2015$
Total accounts receivable 82,852 77,820
Less allowance for doubtful accounts (1,819) (4,296)
TOTAL ACCOUNTS RECEIVABLE, NET 81,033 73,524
OF WHICH
Neither impaired nor past due 54,790 44,624
Not impaired and past the due date as follows
Within 30 days 13,844 18,745
31 to 60 days 3,227 5,046
61 to 90 days 2,312 2,835
Over 90 days 8,679 6,570
Less allowance for doubtful accounts (1,819) (4,296)
TOTAL ACCOUNTS RECEIVABLE, NET 81,033 73,524
2016$
2015$
BALANCE, BEGINNING OF YEAR 4,296 1,061
Additional provision recognized 1,136 3,563
Amounts written off during the year as uncollectible (3,598) (414)
Exchange differences (15) 86
BALANCE, END OF YEAR 1,819 4,296
05 118
ENTRINGER2016
Established in 1988 and based in Brazil, Entringer is a leading manufacturer of grain storage, handling and conditioning equipment.Specifically, manufacturing grain bins, bucket elevators, dryers and cleaners.Entringer differentiates itself by providing cutting edge products and service that ensure quality and safety.
2 0 1 6 A N N U A L R E P O R TF I E L D T O C O N S U M E R C O N S O L I D A T E D F I N A N C I A L S T A T E M E N T S
19. INVENTORY
Inventory is recorded at the lower of cost and net realizable value.
During the year ended December 31, 2016, no provisions [2015 – nil] were expensed through cost of goods sold. There were no write-downs of finished goods and no reversals of write-downs during the year, with the exception of $1,218 related to the impairment of inventory from the Nobleford, Alberta facility and Winnipeg, Manitoba facility [note 17].
20. PROVISIONS
Provisions consist of the Company’s warranty provision. A provision is recognized for expected claims on products sold based on past experience of the level of repairs and returns. It is expected that most of these costs will be incurred in the next financial year. Assumptions used to calculate the provision for warranties were based on current sales levels and current information available about returns.
2016$
2015$
Raw materials 54,012 51,917
Finished goods 45,467 46,805
99,479 98,722
2016$
2015$
BALANCE, BEGINNING OF YEAR 6,550 3,829
Costs recognized 4,427 6,326
Change in reserve 180 2,580
Amounts charged against provision (4,503) (6,185)
BALANCE, END OF YEAR 6,654 6,550
21. EQUITY
[A] COMMON SHARES
AUTHORIZED Unlimited number of voting common shares without par value
ISSUED 14,781,643 common shares
[B] CONTRIBUTED SURPLUS
[C] ACCUMULATED OTHER COMPREHENSIVE INCOME
Accumulated other comprehensive income is comprised of the following:
Cash flow hedge reserve
The cash flow hedge reserve contains the effective portion of the cash flow hedge relationships incurred as at the reporting date.
Foreign currency translation reserve
The foreign currency translation reserve is used to record exchange differences arising from the translation of the financial statements of foreign subsidiaries. It is also used to record the effect of hedging net investments in foreign operations.
[D] DIVIDENDS PAID AND PROPOSED
In the year ended December 31, 2016, the Company declared dividends of $35,297 or $2.40 per common share [2015 – $33,593 or $2.40 per common share] and dividends on share compensation awards of $1,672 [2015 – $881]. In the year ended December 31, 2016, 144,006 common shares were issued to shareholders from treasury under the dividend reinvestment plan [the “DRIP”]. In the year ended December 31, 2016, dividends paid to shareholders were financed $30,079 [2015 – $28,341] from cash on hand and $5,218 [2015 – $5,252] by the DRIP.
AGI’s dividend policy is to pay cash dividends on or about the 15th of each month to shareholders of record on the last business day of the previous month. The Company’s current monthly dividend rate is $0.20 per common share. Subsequent to December 31, 2016, the Company declared dividends of $0.20 per common share with record dates of January 31 and February 28.
[E] DIVIDEND REINVESTMENT PLAN
On March 5, 2013, the Company announced the adoption of the DRIP. Eligible shareholders who elect to reinvest dividends under the DRIP will initially receive common shares issued from treasury at a discount of 4% from the market price of the common shares, with the market price being equal to the volume-weighted average trading price of the
SHARES#
AMOUNT$
Balance, January 1, 2015 13,165,627 184,771
Dividend reinvestment plan costs — (16)
Dividend reinvestment shares issued from treasury 132,165 5,252
Exercise of grants under DDCP [note 22[b]] 10,934 396
Settlement of 2012 EIAP obligation 163,678 5,162
Dividends on 2012 EIAP 5,914 137
Share issuance related to Westeel acquisition [note 6[b]] 1,112,050 49,138
Balance, December 31, 2015 14,590,368 244,840
Dividend reinvestment shares issued from treasury [note 21[e]]
144,006 5,218
Settlement of 2012 EIAP obligation 47,269 1,640
Balance, December 31, 2016 14,781,643 251,698
2016$
2015$
Balance, beginning of year 10,193 12,954
Equity-settled director compensation [note 22[b]] 375 268
Exercise of grants under DDCP — (396)
Dividends on 2012 EIAP 1,672 881
Settlement of 2012 EIAP dividends (293) (1,066)
Obligation under 2012 EIAP [note 22[a]] 6,517 2,736
Settlement of 2012 EIAP obligation (1,530) (5,184)
2015 convertible unsecured subordinated debentures 6 —
Balance, end of year 16,940 10,193
119 120C O N S O L I D A T E D F I N A N C I A L S T A T E M E N T S
2 0 1 6 A N N U A L R E P O R TF I E L D T O C O N S U M E R C O N S O L I D A T E D F I N A N C I A L S T A T E M E N T S
common shares on the Toronto Stock Exchange for the five trading days preceding the applicable dividend payment date. The Company incurred costs of nil [2015 – $16] with respect to administration of the DRIP.
[F] SHAREHOLDER PROTECTION RIGHTS PLAN
On December 20, 2010, the Company’s Board of Directors adopted a Shareholders’ Protection Rights Plan [the “Rights Plan”]. Specifically, the Board of Directors has implemented the Rights Plan by authorizing the issuance of one right [a “Right”] in respect of each common share [the “Common Shares”] of the Company. If a person or a Company, acting jointly or in concert, acquires [other than pursuant to an exemption available under the Rights Plan] beneficial ownership of 20% or more of the Common Shares, Rights [other than those held by such acquiring person, which will become void] will separate from the Common Shares and permit the holder thereof to purchase that number of Common Shares having an aggregate market price [as determined in accordance with the Rights Plan] on the date of consummation or occurrence of such acquisition of Common Shares equal to four times the exercise price of the Rights for an amount in cash equal to the exercise price. The exercise price of the Rights pursuant to the Rights Plan is $150 per Right.
[G] PREFERRED SHARES
On May 14, 2014, the shareholders of AGI approved the creation of two new classes of preferred shares, each issuable in one or more series without par value and each with such rights, restrictions, designations and provisions as the Company’s Board of Directors may, at any time from time to time determine, subject to an aggregate maximum number of authorized preferred shares. In particular, no preferred shares of either class may be issued if:
The aggregate number of preferred shares that would then be outstanding would exceed 50% of the aggregate number of common shares then outstanding; or
The maximum aggregate number of common shares into which all of the preferred shares then outstanding could be converted in accordance with their terms would exceed 20% of the aggregate number of common shares then outstanding; or
The aggregate number of votes, which the holders of all preferred shares then outstanding would be entitled to cast at any meeting of the shareholders of the Company [other than meetings at which only holders of preferred shares are entitled to vote], would exceed 20% of the aggregate number of votes, which the holders of all common shares then outstanding would be entitled to cast at any such meeting.
As at December 31, 2016 and December 31, 2015, no preferred shares were issued or outstanding.
22. SHARE-BASED COMPENSATION PLANS
[A] EQUITY INCENTIVE AWARD PLAN [“EIAP”]
The 2012 EIAP
On May 11, 2012, the shareholders of AGI approved an Equity Incentive Award Plan [the “2012 EIAP”], which authorizes the Board to grant Restricted Awards [“Restricted Awards”] and Performance Awards [“Performance Awards”] [collectively, the “Awards”] to persons who are officers, employees or consultants of the Company and its affiliates. Awards may not be granted to non-management Directors.
On May 5, 2016, the shareholders of AGI approved an amendment to the 2012 EIAP to increase the number of common shares available for issuance to 915,000. At the discretion of the Board, the 2012 EIAP provides for cumulative adjustments to the number of common shares to be issued pursuant to, or the value of, Awards on each date that dividends are paid on the common shares. The 2012 EIAP provides for accelerated vesting in the event of a change in control, retirement, death or termination without cause.
Each Restricted Award will entitle the holder to be issued the number of common shares designated in the Restricted Award with such common shares to be issued as to one-third on each of the third, fourth and fifth anniversary dates of the date of grant, subject to earlier vesting in certain events. The Company has an obligation to settle any amount payable in respect of a Restricted Award by common shares issued from treasury of the Company.
[i]
[ii]
[iii]
121 122C O N S O L I D A T E D F I N A N C I A L S T A T E M E N T S
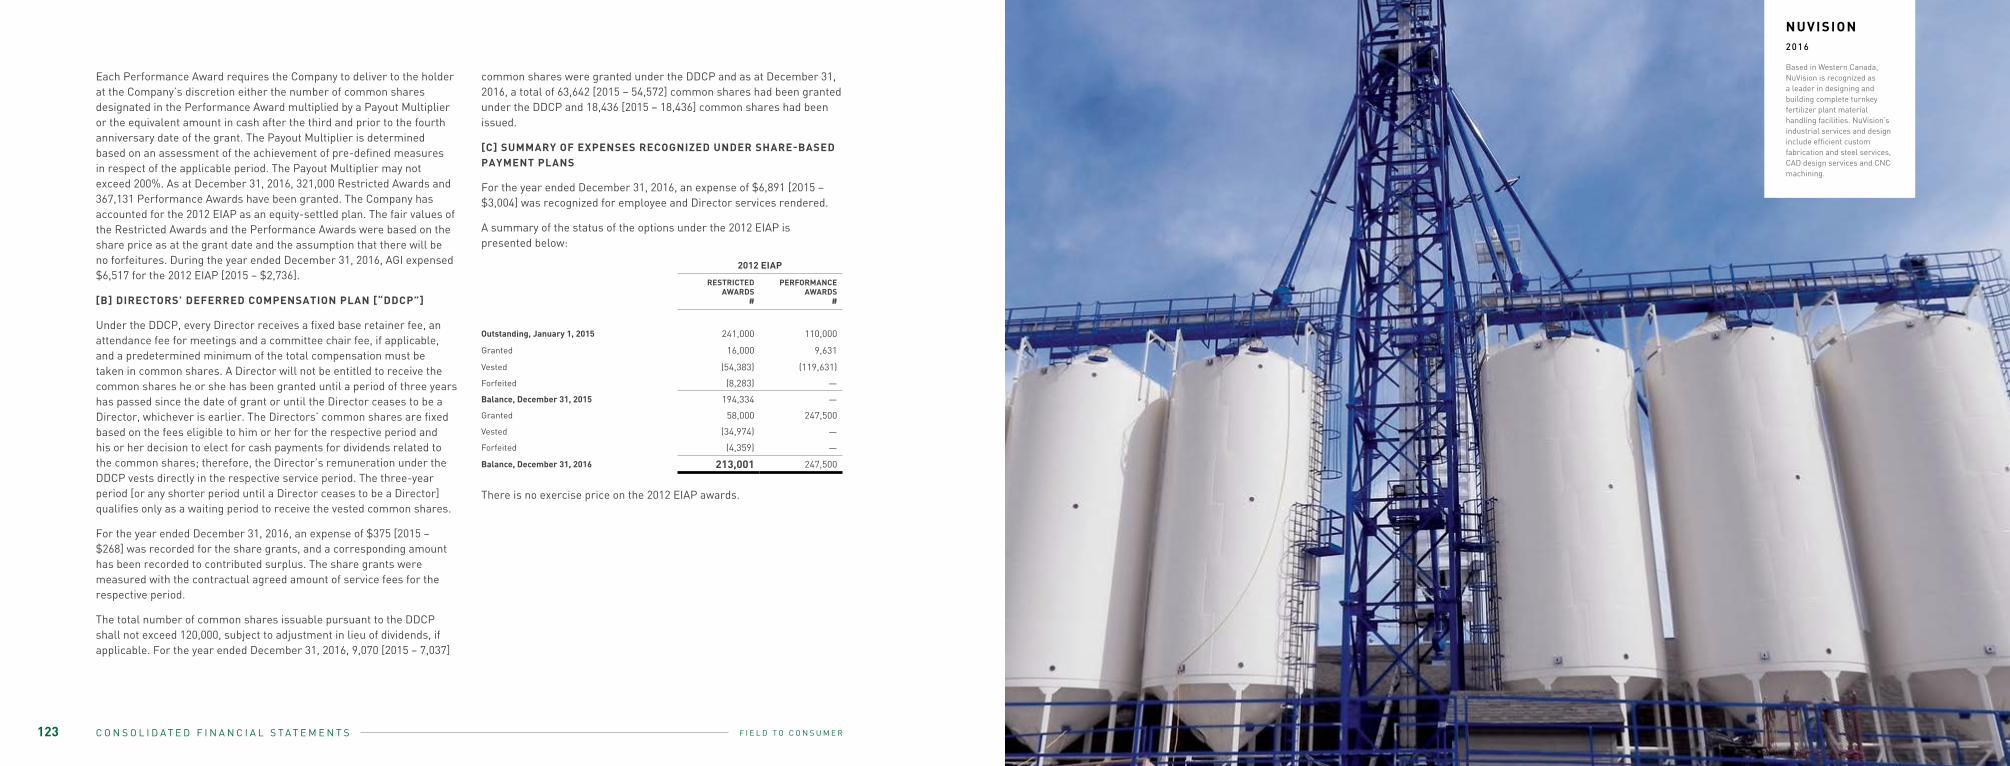
2 0 1 6 A N N U A L R E P O R TF I E L D T O C O N S U M E R C O N S O L I D A T E D F I N A N C I A L S T A T E M E N T S
Each Performance Award requires the Company to deliver to the holder at the Company’s discretion either the number of common shares designated in the Performance Award multiplied by a Payout Multiplier or the equivalent amount in cash after the third and prior to the fourth anniversary date of the grant. The Payout Multiplier is determined based on an assessment of the achievement of pre-defined measures in respect of the applicable period. The Payout Multiplier may not exceed 200%. As at December 31, 2016, 321,000 Restricted Awards and 367,131 Performance Awards have been granted. The Company has accounted for the 2012 EIAP as an equity-settled plan. The fair values of the Restricted Awards and the Performance Awards were based on the share price as at the grant date and the assumption that there will be no forfeitures. During the year ended December 31, 2016, AGI expensed $6,517 for the 2012 EIAP [2015 – $2,736].
[B] DIRECTORS’ DEFERRED COMPENSATION PLAN [“DDCP”]
Under the DDCP, every Director receives a fixed base retainer fee, an attendance fee for meetings and a committee chair fee, if applicable, and a predetermined minimum of the total compensation must be taken in common shares. A Director will not be entitled to receive the common shares he or she has been granted until a period of three years has passed since the date of grant or until the Director ceases to be a Director, whichever is earlier. The Directors’ common shares are fixed based on the fees eligible to him or her for the respective period and his or her decision to elect for cash payments for dividends related to the common shares; therefore, the Director’s remuneration under the DDCP vests directly in the respective service period. The three-year period [or any shorter period until a Director ceases to be a Director] qualifies only as a waiting period to receive the vested common shares.
For the year ended December 31, 2016, an expense of $375 [2015 – $268] was recorded for the share grants, and a corresponding amount has been recorded to contributed surplus. The share grants were measured with the contractual agreed amount of service fees for the respective period.
The total number of common shares issuable pursuant to the DDCP shall not exceed 120,000, subject to adjustment in lieu of dividends, if applicable. For the year ended December 31, 2016, 9,070 [2015 – 7,037]
common shares were granted under the DDCP and as at December 31, 2016, a total of 63,642 [2015 – 54,572] common shares had been granted under the DDCP and 18,436 [2015 – 18,436] common shares had been issued.
[C] SUMMARY OF EXPENSES RECOGNIZED UNDER SHARE-BASED PAYMENT PLANS
For the year ended December 31, 2016, an expense of $6,891 [2015 – $3,004] was recognized for employee and Director services rendered.
A summary of the status of the options under the 2012 EIAP is presented below:
There is no exercise price on the 2012 EIAP awards.
2012 EIAP
RESTRICTED AWARDS
#
PERFORMANCE AWARDS
#
Outstanding, January 1, 2015 241,000 110,000
Granted 16,000 9,631
Vested (54,383) (119,631)
Forfeited (8,283) —
Balance, December 31, 2015 194,334 —
Granted 58,000 247,500
Vested (34,974) —
Forfeited (4,359) —
Balance, December 31, 2016 213,001 247,500
123 06
NUVISION2016
Based in Western Canada, NuVision is recognized as a leader in designing and building complete turnkey fertilizer plant material handling facilities. NuVision’s industrial services and design include efficient custom fabrication and steel services, CAD design services and CNC machining.
C O N S O L I D A T E D F I N A N C I A L S T A T E M E N T S
2 0 1 6 A N N U A L R E P O R TF I E L D T O C O N S U M E R C O N S O L I D A T E D F I N A N C I A L S T A T E M E N T S
23. LONG-TERM DEBT INTEREST
RATE%
MATURITY DECEMBER 31,2016
$
DECEMBER 31,2015
$
CURRENT PORTION OF LONG-TERM DEBT
Series A secured notes [U.S. dollar denominated] 6.8 2016 — 34,600
TOTAL CURRENT LONG-TERM DEBT — 34,600
NON-CURRENT PORTION OF LONG-TERM DEBT
Series B secured notes 4.4 2025 25,000 25,000
Series C secured notes [U.S. dollar denominated] 3.7 2026 33,568 —
Term A secured loan 3.2 2019 50,000 50,000
Term B secured loan 3.4 2022 40,000 40,000
Revolver line 3.0 2019 51,023 —
U.S. revolver line 4.5 2019 9,399 —
208,990 115,000
Less deferred financing costs 2,141 2,669
TOTAL NON-CURRENT LONG-TERM DEBT 206,849 112,331
LONG-TERM DEBT 206,849 146,931
[A] BANK INDEBTEDNESS
AGI has operating facilities of $20.0 million and U.S. $7.0 million. The facilities bear interest at prime plus 0.2% to prime plus 1.8% per annum based on performance calculations.
Collateral for the operating facilities ranks pari passu with the Series A secured notes and includes a general security agreement over all assets, first position collateral mortgages on land and buildings, assignments of rents and leases and security agreements for patents and trademarks.
[B] LONG-TERM DEBT
The Series A secured notes were issued on October 29, 2009. The non-amortizing notes bear interest at 6.8% payable quarterly and mature on October 29, 2016. The Series A secured notes are denominated in U.S. dollars. Collateral for the Series A secured notes and term loans ranks pari passu and include a general security agreement over
all assets, first position collateral mortgages on land and buildings, assignments of rents and leases and security agreements for patents and trademarks. Upon maturity in October 2016, the Series A secured notes were refinanced with Series C secured notes from the same lender. Terms of the Series C secured notes are the same as the Series A secured notes other than the Series C secured notes bear interest at 3.7% and mature in October 2026.
The Series B secured notes were issued on May 22, 2015. The non-amortizing notes bear interest at 4.4% payable quarterly and mature on May 22, 2025. Collateral for the Series B secured notes and term loans ranks pari passu and include a general security agreement over all assets, first position collateral mortgages on land and buildings, assignments of rents and leases and security agreements for patents and trademarks.
The Term A secured loan was issued on May 20, 2015 and matures on May 19, 2019. The facilities bear interest at BA plus 1.5% to BA plus
3.0% per annum based on performance calculations. Interest on the non-amortizing loan has been fixed at 3.6% through an interest rate swap contract [note 29]. Collateral for the Term A loan and secured notes ranks pari passu and includes a general security agreement over all assets, first position collateral mortgages on land and buildings, assignments of rents and leases and security agreements for patents and trademarks.
The Term B secured loan was issued on May 20, 2015 and matures on May 19, 2022. The facilities bear interest at BA plus 2.5% per annum. Interest on the non-amortizing loan has been fixed at 4.3% through an interest rate swap contract [note 29]. Collateral for the Term B loan and secured notes ranks pari passu and includes a general security agreement over all assets, first position collateral mortgages on land and buildings, assignments of rents and leases and security agreements for patents and trademarks.
AGI has revolver facilities of $80 million and U.S. $68 million. The facilities bear interest at LIBOR plus 1.5% to LIBOR plus 3.0% and prime plus 0.2% to prime plus 1.8% per annum based on performance calculations. As at December 31, 2016, there was $60 million [2015 – nil] outstanding under these facilities. The facilities mature on May 19, 2019. Interest on the revolver line has been fixed at 3.7% through an interest rate swap contract [note 29]. Collateral for the revolving line ranks pari passu and includes a general security agreement over all assets, first position collateral mortgages on land and buildings, assignments of rents and leases and security agreements for patents and trademarks.
[C] COVENANTS
AGI is subject to certain financial covenants in its credit facility agreements that must be maintained to avoid acceleration of the termination of the agreement. The financial covenants require AGI to maintain a debt to earnings before interest, taxes, depreciation and amortization [“EBITDA”] ratio of less than 3.25 and to provide debt service coverage of a minimum of 1.0. The covenant calculations exclude the convertible unsecured subordinated debentures from the definition of debt. As at December 31, 2016 and December 31, 2015, AGI was in compliance with all financial covenants.
125 126C O N S O L I D A T E D F I N A N C I A L S T A T E M E N T S
2 0 1 6 A N N U A L R E P O R TF I E L D T O C O N S U M E R C O N S O L I D A T E D F I N A N C I A L S T A T E M E N T S
24. OBLIGATIONS UNDER FINANCE LEASE
[A] REAL ESTATE LEASE
The Company has a real estate lease that matures on March 1, 2018. The lease is denominated in euros and bears interest at Euribor plus 2%.
[B] EQUIPMENT LEASE
The Company has leases for material handling and production equipment that mature between 2020 and 2021. The leases are denominated in U.S. dollars and Brazilian real and bear interest at rates between 4.7% and 6.6%.
INTERESTRATE
%
MATURITY DECEMBER 31, 2016
$
DECEMBER 31, 2015
$
CURRENT PORTION OF OBLIGATIONS UNDER FINANCE LEASE
Real estate lease Euribor +2 2018 206 209
Equipment leases 4.7-6.6 2020-2021 147 —
TOTAL CURRENT OBLIGATION UNDER FINANCE LEASE 353 209
NON-CURRENT PORTION OF OBLIGATIONS UNDER FINANCE LEASE
Real estate lease Euribor +2 2018 904 1177
Equipment leases 4.7-6.6 2020-2021 475 —
TOTAL NON-CURRENT OBLIGATIONS UNDER FINANCE LEASE
1,379 1,177
OBLIGATIONS UNDER FINANCE LEASE 1,732 1,386
25. CONVERTIBLE UNSECURED SUBORDINATED DEBENTURES
2013 DEBENTURES
In December 2013, the Company issued $86.3 million aggregate principal amount of convertible unsecured subordinated debentures [the “2013 Debentures”] at a price of $1,000 per 2013 Debenture. The net proceeds of the offering, after payment of the underwriters’ fee of $3.5 million and expenses of the offering of $0.6 million, were approximately $82.2 million. The 2013 Debentures bear interest at an annual rate of 5.25% payable semi-annually on June 30 and December 31. The maturity date of the 2013 Debentures is December 31, 2018.
Each 2013 Debenture is convertible into common shares of the Company at the option of the holder at any time on the earlier of the maturity date and the date of redemption of the 2013 Debenture, at a conversion price of $55.00 per common share being a conversion rate of approximately 18.1818 common shares per $1,000 principal amount of 2013 Debentures. No conversion options were exercised during the year ended December 31, 2016 [year ended December 31, 2015 – nil]. As at December 31, 2016, AGI has reserved 1,568,182 common shares for issuance upon conversion of the 2013 Debentures.
The 2013 Debentures are not redeemable before December 31, 2016. On and after December 31, 2016 and prior to December 31, 2017, the 2013 Debentures may be redeemed, in whole or in part, at the option of the Company at a price equal to their principal amount plus accrued and unpaid interest, provided that the volume weighted average trading price of the common shares during the 20 consecutive trading days ending on the fifth trading day preceding the date on which the notice
2016$
2015$
Principal amount 213,000 213,000
Equity component (9,922) (9,922)
Accretion 4,039 2,193
Financing fees, net of amortization (5,907) (7,686)
CONVERTIBLE UNSECURED SUBORDINATED DEBENTURES 201,210 197,585
127 128C O N S O L I D A T E D F I N A N C I A L S T A T E M E N T S
2 0 1 6 A N N U A L R E P O R TF I E L D T O C O N S U M E R C O N S O L I D A T E D F I N A N C I A L S T A T E M E N T S
of redemption is given is not less than 125% of the conversion price. On and after December 31, 2017, the 2013 Debentures may be redeemed, in whole or in part, at the option of the Company at a price equal to their principal amount plus accrued and unpaid interest.
On redemption or at maturity, the Company may, at its option, elect to satisfy its obligation to pay the principal amount of the 2013 Debentures by issuing and delivering common shares. The Company may also elect to satisfy its obligations to pay interest on the 2013 Debentures by delivering common shares. The Company does not expect to exercise the option to satisfy its obligations to pay the principal amount or interest by delivering common shares. The number of any shares issued will be determined based on market prices at the time of issuance.
The Company presents and discloses its financial instruments in accordance with the substance of its contractual arrangement. Accordingly, upon issuance of the 2013 Debentures, the Company recorded a liability of $86,250, less related offering costs of $3,847. The liability component has been accreted using the effective interest rate method, and during the year ended December 31, 2016, the Company recorded accretion of $887 [2015 – $834], non-cash interest expense relating to financing costs of $761 [2015 – $715] and interest expense of $4,528 [2015 – $4,528]. The residual value assigned to the holder’s option to convert the 2013 Debentures to common shares in the total amount of $4,480 has been separated from the fair value of the liability and is included in shareholders’ equity, net of income taxes of $1,134 and its pro rata share of financing costs of $211.
2014 DEBENTURES
In December 2014, the Company issued $51.8 million aggregate principal amount of extendible convertible unsecured subordinated debentures [the “2014 Debentures”] at a price of $1,000 per 2014 Debenture. The 2014 Debentures bear interest at an annual rate of 5.25% payable semi-annually on June 30 and December 31. The maturity date of the 2014 Debentures is December 31, 2019.
Each 2014 Debenture is convertible into common shares of the Company at the option of the holder at any time on the earlier of the maturity date and the date of redemption of the 2014 Debenture, at a
conversion price of $65.57 per common share being a conversion rate of approximately 15.2509 common shares per $1,000 principal amount of 2014 Debentures. No conversion options were exercised during the year ended December 31, 2016 [year ended December 31, 2015 – nil]. As at December 31, 2016, AGI has reserved 789,233 common shares for issuance upon conversion of the 2014 Debentures.
The 2014 Debentures are not redeemable before December 31, 2017. On and after December 31, 2017 and prior to December 31, 2018, the 2014 Debentures may be redeemed, in whole or in part, at the option of the Company at a price equal to their principal amount plus accrued and unpaid interest, provided that the volume weighted average trading price of the common shares during the 20 consecutive trading days ending on the fifth trading day preceding the date on which the notice of redemption is given is not less than 125% of the conversion price. On and after December 31, 2018, the 2014 Debentures may be redeemed, in whole or in part, at the option of the Company at a price equal to their principal amount plus accrued and unpaid interest.
On redemption or at maturity, the Company may, at its option, elect to satisfy its obligation to pay the principal amount of the 2014 Debentures by issuing and delivering common shares. The Company may also elect to satisfy its obligation to pay interest on the 2014 Debentures by delivering sufficient common shares. The Company does not expect to exercise the option to satisfy its obligations to pay the principal amount or interest by delivering common shares. The number of shares issued will be determined based on market prices at the time of issuance.
The Company presents and discloses its financial instruments in accordance with the substance of its contractual arrangement. Accordingly, upon issuance of the 2014 Debentures, the Company recorded a liability of $51,750, less related offering costs of $2,663 and the estimated fair value of the holder’s conversion option. The liability component has been accreted using the effective interest rate method, and during the year ended December 31, 2016, the Company recorded accretion of $401 [2015 – $378], non-cash interest expense relating to financing costs of $465 [2015 – $436] and interest expense on the 5.25% coupon of $2,717 [2015 – $2,717]. The residual value assigned to the holder’s option to convert the 2014 Debentures to common shares in
the total amount of $2,165 has been separated from the fair value of the liability and is included in shareholders’ equity, net of income taxes of $557 and its pro rata share of financing costs of $111.
2015 DEBENTURES
In September 2015, the Company issued $75.0 million aggregate principal amount of convertible unsecured subordinated debentures [the “2015 Debentures”] at a price of $1,000 per 2015 Debenture. The 2015 Debentures bear interest at an annual rate of 5.00% payable semi-annually on June 30 and December 31. The maturity date of the 2015 Debentures is December 31, 2020.
Each 2015 Debenture is convertible into common shares of the Company at the option of the holder at any time on the earlier of the maturity date and the date of redemption of the 2015 Debenture, at a conversion price of $60.00 per common share being a conversion rate of approximately 16.6667 common shares per $1,000 principal amount of 2015 Debentures. No conversion options were exercised during the year ended December 31, 2016. As at December 31, 2016, AGI has reserved 1,250,000 common shares for issuance upon conversion of the 2015 Debentures.
The 2015 Debentures are not redeemable before December 31, 2018. On and after December 31, 2018 and prior to December 31, 2019, the 2015 Debentures may be redeemed, in whole or in part, at the option of the Company at a price equal to their principal amount plus accrued and unpaid interest, provided that the volume weighted average trading price of the common shares during the 20 consecutive trading days ending on the fifth trading day preceding the date on which the notice of redemption is given is not less than 125% of the conversion price. On and after December 31, 2018, the 2015 Debentures may be redeemed, in whole or in part, at the option of the Company at a price equal to their principal amount plus accrued and unpaid interest.
On redemption or at maturity, the Company may, at its option, elect to satisfy its obligation to pay the principal amount of the 2015 Debentures by issuing and delivering common shares. The Company may also elect to satisfy its obligation to pay interest on the 2015 Debentures by delivering sufficient common shares. The Company does not expect to
exercise the option to satisfy its obligations to pay the principal amount or interest by delivering common shares. The number of shares issued will be determined based on market prices at the time of issuance.
The Company presents and discloses its financial instruments in accordance with the substance of its contractual arrangement. Accordingly, upon issuance of the 2015 Debentures, the Company recorded a liability of $75,000, less related offering costs of $3,509 and the estimated fair value of the holder’s conversion option. The liability component has been accreted using the effective interest rate method, and during the year ended December 31, 2016, the Company recorded accretion of $558 [2015 – $138], non-cash interest expense relating to financing costs of $568 [2015 – $147] and interest expense on the 5.00% coupon of $3,750 [2015 – $1,006]. The residual value assigned to the holder’s option to convert the 2015 Debentures to common shares in the total amount of $3,277 has been separated from the fair value of the liability and is included in shareholders’ equity, net of income taxes of $835 and its pro rata share of financing costs of $162.
26. ACCOUNTS PAYABLE AND ACCRUED LIABILITIES
Trade payables and other payables are non-interest bearing and are normally settled on 30- or 60 day terms. Personnel-related accrued liabilities include primarily vacation accruals, bonus accruals and overtime benefits. For explanations on the Company’s credit risk management processes, refer to note 29.
27. RETIREMENT BENEFIT PLANS
AGI contributes to group retirement savings plans subject to maximum limits per employee. The expense recorded during the year ended
2016$
2015$
Trade payables 34,978 22,603
Other payables 10,667 9,882
Personnel-related accrued liabilities 15,409 13,812
Accrued outstanding service invoices 3,348 1,424
64,402 47,721
129 130C O N S O L I D A T E D F I N A N C I A L S T A T E M E N T S
2 0 1 6 A N N U A L R E P O R TF I E L D T O C O N S U M E RC O N S O L I D A T E D F I N A N C I A L S T A T E M E N T S C O N S O L I D A T E D F I N A N C I A L S T A T E M E N T S
2 0 1 6 A N N U A L R E P O R TF I E L D T O C O N S U M E R C O N S O L I D A T E D F I N A N C I A L S T A T E M E N T S
December 31, 2016 was $3,150 [2015 – $2,626]. AGI expects to contribute $3,400 for the year ending December 31, 2017.
On May 20, 2015, AGI acquired Westeel [note 6[b]]. Included in the acquisition was a defined benefit plan. For the purposes of the following discussion, beginning of period is defined as May 20, 2015.
The Company has a defined benefit plan providing pension benefits to certain of its union employees and former employees. The Company operates the defined benefit pension plan in Canada. The plan is a flat-dollar defined benefit pension plan, which provides clearly defined benefits to members based on negotiated benefit rates and years of credited service. Responsibility for the governance of the plan and overseeing the plan including investment policy and performance lie with the Pension and Investment Committee. The Company has set up a pension committee to assist in the management of the plan and has also appointed experienced, independent professional experts such as investment managers and actuaries.
The Company’s defined benefit pension plan will measure the respective accrued benefit obligation and the fair value of plan assets at December 31 of each year. Actuarial valuations are performed annually or triennially as required. The Company’s registered defined benefit plan was last valued on December 31, 2016. The present value of the defined obligation, and the related current service cost and past service cost, were measured using the Unit Credit Method.
The liabilities were revalued at December 31, 2016. We have used the same methods and assumptions used at December 31, 2015 for the purpose of estimating the liabilities at December 31, 2016. The following assumptions were used to determine the periodic pension expense and the net present value of the accrued pension obligations:
2016%
2015%
Expected long-term rate of return on plan assets 3.95 4.00
Discount rate on benefit costs 3.95 4.00
Discount rate on accrued pension and post-employment obligations 3.95 4.00
Rate of compensation increases n/a n/a
The weighted average duration of the defined benefit obligation as of December 31, 2016 is 17.0 years [December 31, 2015 – 16.8 years]. Compensation increases were not included in the valuation of the accrued pension obligation because the accrued benefit is not a function of salary. All members receive a fixed benefit rate monthly for each year of credited service. This same benefit rate is received by all plan members regardless of salary level.
The following table outlines the key assumptions for 2016 and the sensitivity of changes in each of these assumptions on the defined benefit plan obligation. The sensitivity analysis is hypothetical and should be used with caution. The sensitivities of each key assumption have been calculated independently of any changes in other key assumptions. Actual experience may result in changes in a number of key assumptions simultaneously. Changes in one factor may result in changes in another, which could amplify or reduce the impact of such assumptions.
The net expense of $627 [2015 – $517] for the year is included in cost of sales and an expense of nil [2015 – nil] for the year is included in selling, general and administrative expense in the consolidated statements of income.
INCREASE INASSUMPTION
$
DECREASE INASSUMPTION
$
Impact of 0.5% increase/decrease in discount rate assumption (996) 1,122
Impact of 1 year increase/decrease in life expectancy assumption 342 (351)
Information about the Company’s defined benefit pension plan, in aggregate, is as follows:
The net accrued benefit asset of $382 [2015 – $234] is included in other assets in non-current assets.
The major categories of plan assets for each category are as follows:
2016$
2015$
PLAN ASSETS
Fair value of plan assets, beginning of year 12,446 12,562
Interest income on plan assets 499 298
Actual return on plan assets 378 (387)
Employer contributions 419 245
Benefits paid (727) (272)
FAIR VALUE OF PLAN ASSETS, END OF YEAR 13,015 12,446
ACCRUED BENEFIT OBLIGATION
Accrued benefit obligation, beginning of year 12,212 11,860
Current service cost 621 504
Interest cost 505 311
Actuarial gains from changes in financial assumptions 105 —
Actuarial gains from experience adjustments (83) (191)
Benefits paid (727) (272)
ACCRUED BENEFIT OBLIGATION, END OF YEAR 12,633 12,212
NET ACCRUED BENEFIT ASSET 382 234
DECEMBER 31, 2016 DECEMBER 31, 2015
$ % $ %
Canadian equity securities 3,930 30.2 3,684 29.6
U.S. equity securities 2,252 17.3 2,178 17.5
International equity securities 2,265 17.4 2,191 17.6
Fixed-income securities 4,568 35.1 4,393 35.3
13,015 100.0 12,446 100.0
Management’s assessment of the expected returns is based on historical return trends and analysts’ predictions of the market for the asset over the life of the related obligation. The actual return on plan assets was a gain of $378 [2015 – loss of $387].
All equity and debt securities are valued based on quoted prices in active markets for identical assets or liabilities or based on inputs other than quoted prices in active markets that are observable for the asset or liability, either directly [i.e., as prices] or indirectly [i.e., derived from prices].
The Company’s asset allocation reflects a balance of fixed-income investments, which are sensitive to interest rates, and equities, which are expected to provide higher returns and inflation-sensitive returns over the long term. The Company’s targeted asset allocations are actively monitored and adjusted to align the asset mix with the liability profile of the plan.
The Company expects to make contributions of $235 [2016 – $468] to the defined benefit plan in 2017. The actual amount paid may vary from the estimate based on actuarial valuations being completed, investment performance, volatility in discount rates, regulatory requirements and other factors.
Through its defined benefit plan, the Company is exposed to a number of risks, the most significant of which are detailed below:
Asset volatility
The plan liability is calculated using a discount rate set with reference to corporate bond yields; if plan assets under-perform this yield, this will create a deficit. The plan holds a significant proportion of equities, which are expected to outperform corporate bonds in the long-term while contributing volatility and risk in the short-term.
However, the Company believes that due to the long-term nature of the plan liabilities and the strength of the supporting group, a level of continuing equity investment is an appropriate element of the Company’s long-term strategy to manage the plan efficiently.
133 134C O N S O L I D A T E D F I N A N C I A L S T A T E M E N T S
2 0 1 6 A N N U A L R E P O R TF I E L D T O C O N S U M E RC O N S O L I D A T E D F I N A N C I A L S T A T E M E N T S C O N S O L I D A T E D F I N A N C I A L S T A T E M E N T S
Change in fixed-income security yields
A decrease in corporate fixed-income security yields will increase plan liabilities, although this will be partially offset by an increase in the value of the plan’s fixed-income security holdings.
Life expectancy
The plan’s obligation is to provide benefits for the life of the member, so increases in life expectancy will result in an increase in the plan’s liability.
28. INCOME TAXES
The major components of income tax expense for the years ended December 31, 2016 and 2015 are as follows:
CONSOLIDATED STATEMENTS OF INCOME
2016$
2015$
CURRENT TAX EXPENSE
Current income tax charge 11,122 4,722
DEFERRED TAX RECOVERY
Origination and reversal of temporary differences (260) (1,613)
INCOME TAX EXPENSE REPORTED IN THE CONSOLIDATED STATEMENTS OF INCOME 10,862 3,109
CONSOLIDATED STATEMENTS OF COMPREHENSIVE INCOME
2016$
2015$
DEFERRED TAX RELATED TO ITEMS CHARGED OR CREDITED DIRECTLY TO OTHER COMPREHENSIVE INCOME DURING THE PERIOD
Unrealized gain (loss) on derivatives 5,992 (4,047)
Defined benefit plan reserve 96 59
Exchange differences on translation of foreign operations (268) 1,895
INCOME TAX CREDITED DIRECTLY TO OTHER COMPREHENSIVE INCOME 5,820 (2,093)
The reconciliation between tax expense and the product of accounting profit multiplied by the Company’s domestic tax rate for the years ended December 31, 2016 and 2015 is as follows:
2016$
2015$
ACCOUNTING PROFIT (LOSS) BEFORE INCOME TAX 30,168 (22,120)
At the Company’s statutory income tax rate of 27%[2015 – 26.80%] 8,145 (5,928)
Tax rate changes (481) (9)
Additional deductions allowed in a foreign jurisdiction (600) (259)
Tax losses not recognized as a deferred tax asset 1,413 1,984
Withholding tax on dividend — 1,652
Foreign rate differential 1,517 897
Non-deductible SAIP expense 536 608
State income tax, net of federal tax benefit 496 251
Unrealized foreign exchange loss (gain) (776) 3,519
Impairment of goodwill 18 —
Permanent differences and others 594 394
AT THE EFFECTIVE INCOME TAX RATE 36.09% [2015 – (14.05%)] 10,862 3,109
05 136
MMS2016
Founded in 1978, Mitchell Mill Systems manufactures equipment for use in feed, grain, pet food, fish food, fertilizer, seed cleaning and industrial facilities. Additionally, Mitchell fabricates its own line of material handlingequipment and specialty systems using light and heavy gauge, mild and stainless steel materials.
2 0 1 6 A N N U A L R E P O R TF I E L D T O C O N S U M E R C O N S O L I D A T E D F I N A N C I A L S T A T E M E N T S
The tax effects of temporary differences that give rise to significant portions of the deferred tax assets and deferred tax liabilities are presented below:
CONSOLIDATED STATEMENTS OF
FINANCIAL POSITION
CONSOLIDATED STATEMENTS OF
INCOME
2016$
2015$
2016$
2015$
Inventories (90) (90) — 2
Property, plant and equipment and other assets (21,567) (21,115) (1,189) 932
Intangible assets (45,638) (41,577) (1,621) 366
Deferred financing costs (747) (611) 136 350
Accruals and long-term provisions 4,106 4,238 1,057 (1,727)
Tax loss carryforwards expiringbetween 2020 to 2035 1,364 1,614 250 (1,062)
Investment tax credits (627) (627) — 9
Canadian exploration expenses 13,143 13,218 75 734
Capitalized development expenditures (1,046) (1,060) (14) 155
Convertible debentures (1,588) (2,087) (499) (273)
SAIP liability 1,223 82 (1,141) 796
Equity swap (2,418) — 2,418 —
Other comprehensive income 425 6,417 — —
Exchange difference on translation of foreign operations — — 268 (1,895)
DEFERRED TAX EXPENSE (260) (1,613)
NET DEFERRED TAX LIABILITIES (53,460) (41,598)
REFLECTED IN THE STATEMENTS OF FINANCIAL POSITION AS FOLLOWS
Deferred tax asset 231 84
Deferred tax liability (53,691) (41,682)
DEFERRED TAX LIABILITIES, NET (53,460) (41,598)
RECONCILIATION OF DEFERRED TAX LIABILITIES, NET
The ultimate realization of deferred tax assets is dependent upon the generation of future taxable income during the periods in which these temporary differences and loss carryforwards become deductible. Based on the analysis of taxable temporary differences and future taxable income, management of the Company is of the opinion that there is convincing evidence available for the probable realization of all deductible temporary differences of the Company’s tax entities incurred, other than temporary differences in its Finnish operations of 5,913 euros [2015 – 6,283 euros] and its Brazilian operations of 14,179 BRL [2015 – 2,764]. Accordingly, the Company has recorded a deferred tax asset for all other deductible temporary differences as at December 31, 2016 and as at December 31, 2015.
Included in the current year’s income tax expense was nil [2015 – $1,652] withholding tax paid on the repatriation of surplus from a subsidiary. As at December 31, 2016, there was no recognized deferred tax liability [2015 – nil] for taxes that would be payable on the unremitted earnings of certain of the Company’s subsidiaries. The Company has determined that undistributed profits of its subsidiaries will not be distributed in the foreseeable future. The temporary differences associated with investments in subsidiaries, for which a deferred tax asset has not been recognized, aggregate to $622 [2015 – $622].
2016$
2015$
BALANCE, BEGINNING OF YEAR (41,598) (12,072)
Deferred tax recovery during the year recognized in profit or loss 260 1,613
Deferred tax liability related to change in accounting policy [note 3]
(977) (8,744)
Deferred tax liability setup on business acquisition (5,325) (23,103)
Deferred tax expense during the period recognized in shareholders’ equity — (1,385)
Deferred tax recovery (expense) during the period recognized in other comprehensive income (5,820) 2,093
BALANCE, END OF YEAR (53,460) (41,598)
Income tax provisions, including current and deferred income tax assets and liabilities, and income tax filing positions require estimates and interpretations of federal and provincial income tax rules and regulations, and judgments as to their interpretation and application to AGI’s specific situation. The amount and timing of reversals of temporary differences will also depend on AGI’s future operating results, acquisitions and dispositions of assets and liabilities. The business and operations of AGI are complex, and AGI has executed a number of significant financings, acquisitions, reorganizations and business combinations over the course of its history. The computation of income taxes payable as a result of these transactions involves many complex factors, as well as AGI’s interpretation of and compliance with relevant tax legislation and regulations. While AGI believes that its tax filing positions are probable to be sustained, there are a number of tax filing positions that may be the subject of review by taxation authorities. Therefore, it is possible that additional taxes could be payable by AGI, and the ultimate value of AGI’s income tax assets and liabilities could change in the future, and that changes to these amounts could have a material effect on these consolidated financial statements.
There are no income tax consequences to the Company attached to the payment of dividends in either 2016 or 2015 by the Company to its shareholders.
29. FINANCIAL INSTRUMENTS AND FINANCIAL RISK MANAGEMENT
[A] MANAGEMENT OF RISKS ARISING FROM FINANCIAL INSTRUMENTS
AGI’s principal financial liabilities, other than derivatives, comprise loans and borrowings and trade and other payables. The main purpose of these financial liabilities is to finance the Company’s operations and to provide guarantees to support its operations. The Company has deposits, trade and other receivables and cash and short-term deposits that are derived directly from its operations. The Company also holds an available-for-sale investment and enters into derivative transactions.
The Company’s activities expose it to a variety of financial risks: market risk [including foreign exchange risk and interest rate risk],
credit risk and liquidity risk. The Company’s overall risk management program focuses on the unpredictability of financial markets and seeks to minimize potential adverse effects on the Company’s financial performance. The Company uses derivative financial instruments to mitigate certain risk exposures. The Company does not purchase any derivative financial instruments for speculative purposes. Risk management is the responsibility of the corporate finance function, which has the appropriate skills, experience and supervision. The Company’s domestic and foreign operations, along with the corporate finance function identify, evaluate and, where appropriate, mitigate financial risks. Material risks are monitored and are regularly discussed with the Audit Committee of the Board of Directors. The Audit Committee reviews and monitors the Company’s financial risk-taking activities and the policies and procedures that were implemented to ensure that financial risks are identified, measured and managed in accordance with Company policies.
The risks associated with the Company’s financial instruments are as follows:
MARKET RISK
Market risk is the risk that the fair value of future cash flows of a financial instrument will fluctuate because of changes in market prices. Components of market risk to which AGI is exposed are discussed below. Financial instruments affected by market risk include trade accounts receivable and payable, available-for-sale investments and derivative financial instruments.
The sensitivity analyses in the following sections relate to the position as at December 31, 2016 and December 31, 2015.
The sensitivity analyses have been prepared on the basis that the amount of net debt, the ratio of fixed to floating interest rates of the debt and derivatives and the proportion of financial instruments in foreign currencies are all constant. The analyses exclude the impact of movements in market variables on the carrying value of provisions and on the non-financial assets and liabilities of foreign operations.
The following assumptions have been made in calculating the sensitivity analyses:
137 138C O N S O L I D A T E D F I N A N C I A L S T A T E M E N T S
2 0 1 6 A N N U A L R E P O R TF I E L D T O C O N S U M E R C O N S O L I D A T E D F I N A N C I A L S T A T E M E N T S
• The consolidated statements of financial position sensitivity relates to derivatives.
• The sensitivity of the relevant consolidated statements of income item is the effect of the assumed changes in respective market risks. This is based on the financial assets and financial liabilities held at December 31, 2016 and December 31, 2015, including the effect of hedge accounting.
• The sensitivity of equity is calculated by considering the effect of any associated cash flow hedges at December 31, 2016 for the effects of the assumed underlying changes.
FOREIGN CURRENCY RISK
The objective of the Company’s foreign exchange risk management activities is to minimize transaction exposures and the resulting volatility of the Company’s earnings, subject to liquidity restrictions, by entering into foreign exchange forward contracts. Foreign currency risk is created by fluctuations in the fair value or cash flows of financial instruments due to changes in foreign exchange rates and exposure.
A significant part of the Company’s sales are transacted in U.S. dollars and euros and as a result, fluctuations in the rate of exchange between the U.S. dollar, the euro and Canadian dollar can have a significant effect on the Company’s cash flows and reported results. To mitigate exposure to the fluctuating rate of exchange, AGI enters into foreign exchange forward contracts and denominates a portion of its debt in U.S. dollars. As at December 31, 2016, AGI’s U.S. dollar denominated debt totalled $43.0 million [2015 – $34.6 million] and the Company has entered into the following foreign exchange forward contracts to sell U.S. dollars in order to hedge its foreign exchange risk on revenue:
SETTLEMENT DATESFACE VALUE
U.S. $AVERAGE RATE
CDN $
January – February 2017 9,000 1.25
The Company enters into foreign exchange forward contracts to mitigate foreign currency risk relating to certain cash flow exposures. The hedged transactions are expected to occur within a maximum 24 month period. The Company’s foreign exchange forward contracts reduce the Company’s risk from exchange movements because gains and losses on such contracts offset gains and losses on transactions being hedged. The Company’s exposure to foreign currency changes for all other currencies is not material.
AGI’s sales denominated in U.S. dollars for the year ended December 31, 2016 were U.S. $199 million, and the total of its cost of goods sold and its selling, general and administrative expenses denominated in that currency was U.S. $129 million. Accordingly, a 10% increase or decrease in the value of the U.S. dollar relative to its Canadian counterpart would result in a $19.9 million increase or decrease in sales and a total increase or decrease of $12.9 million in its cost of goods sold and its selling, general and administrative expenses. In relation to AGI’s foreign exchange hedging contracts, a 10% increase or decrease in the value of the U.S. dollar relative to its Canadian counterpart would result in a $13.3 million increase or decrease in the foreign exchange gain and a $1.2 million increase or decrease to other comprehensive income.
The counterparties to the contracts are three multinational commercial banks and therefore credit risk of counterparty non-performance is remote. Realized gains or losses are included in net earnings, and for the year ended December 31, 2016, the Company realized a loss on its foreign exchange contracts of $14.4 million [2015 – loss of $15.3 million].
The open foreign exchange forward contracts as at December 31, 2016 are as follows:
The open foreign exchange forward contracts as at December 31, 2015 are as follows:
The terms of the foreign exchange forward contracts have been negotiated to match the terms of the commitments. There were no highly probable transactions for which hedge accounting has been claimed that have not occurred and there was no significant element of hedge ineffectiveness requiring recognition in the consolidated statements of income.
During 2016, a loss of nil [2015 – $1,317] arising from hedge ineffectiveness was recorded through net earnings in foreign exchange loss (gain). The cash flow hedges of the expected future sales were assessed to be highly effective and a net unrealized loss of $862, with a deferred tax asset of $425 relating to the hedging instruments, is included in accumulated other comprehensive income.
INTEREST RATE RISK
Interest rate risk is the risk that the fair value or future cash flows of a financial instrument will fluctuate because of changes in market interest rates. Furthermore, as AGI regularly reviews the denomination of its borrowings, the Company is subject to changes in interest rates that are linked to the currency of denomination of the debt. AGI’s Series A secured notes, Series B secured notes, Series C secured notes and convertible unsecured subordinated debentures outstanding at December 31, 2016 and December 31, 2015 are at a fixed rate of interest.
INTEREST RATE SWAP CONTRACTS
The Company enters into interest rate swap contracts to manage its exposure to fluctuations in interest rates on its core borrowings. Through these contracts, the Company agreed to receive interest based
NOTIONAL CANADIAN DOLLAR EQUIVALENT
NOTIONAL AMOUNT OF
CURRENCY SOLD$
CONTRACT AMOUNT
$
CDN $ EQUIVALENT
$
UNREALIZED GAIN (LOSS)
$
U.S. dollar contracts 9,000 1.2462 11,216 (862)
NOTIONAL CANADIAN DOLLAR EQUIVALENT
NOTIONAL AMOUNT OF
CURRENCY SOLD$
CONTRACT AMOUNT
$
CDN $ EQUIVALENT
$
UNREALIZED GAIN (LOSS)
$
U.S. dollar contracts 109,500 1.1827 129,509 (21,767)
139 140C O N S O L I D A T E D F I N A N C I A L S T A T E M E N T S

2 0 1 6 A N N U A L R E P O R TF I E L D T O C O N S U M E R
on the variable rates from the counterparty and pay interest based on fixed rates between 3.6% and 4.32%. The notional amounts are $141,023 in aggregate, resetting the last business day of each month. The contracts expire between May 2019 and May 2022.
The interest rate swap contracts are derivative financial instruments designated as a cash flow hedges and changes in the fair value were recognized as a component of other comprehensive income to the extent that it has been assessed to be effective.
The open interest rate swap contracts as at December 31, 2016 are as follows:
The open interest rate swap contracts as at December 31, 2015 are as follows:
The amount of loss recorded in other comprehensive income during the year ended December 31, 2016 was $1,286 [2015 – $2,001].
EQUITY SWAP
On March 18, 2016, the Company entered into an equity swap agreement with a financial institution to manage the cash flow exposure due to fluctuations in its share price related to the EIAP.
Pursuant to this agreement, the counterparty has agreed to pay the Company the total return of the defined underlying common shares, which includes both the dividend income they may generate and any capital appreciation. In return, the Company has agreed to pay the
Counterparty a funding cost calculated daily based on floating rate option [CAD-BA-COOR] plus a spread of 2.0% and any administrative fees or expenses that are incurred by the Counterparty directly.
As at December 31, 2016, the equity swap agreement covered 500,000 common shares of the Company at a price of $34.10, and the agreement matures on March 22, 2019.
As at December 31, 2016, the unrealized gain on the equity swap was $9,289 and in the year ended December 31, 2016, the Company has recorded a gain in the consolidated statements of income of $9,210 [2015 – nil].
CREDIT RISK
Credit risk is the risk that a customer will fail to perform an obligation or fail to pay amounts due, causing a financial loss. A substantial portion of AGI’s accounts receivable are with customers in the agriculture industry and are subject to normal industry credit risks. A portion of the Company’s sales and related accounts receivable are also generated from transactions with customers in overseas markets, several of which are in emerging markets such as countries in Eastern Europe. It is often common business practice for international customers to pay invoices over an extended period of time. Accounts receivable is subject to credit risk exposure and the carrying values reflect management’s assessment of the associated maximum exposure to such credit risk. The Company regularly monitors customers for changes in credit risk. The Company’s credit exposure is mitigated through the use of credit practices that limit transactions according to the customer’s credit quality and due to the accounts receivable being spread over a large number of customers. Trade receivables from international customers are often insured for events of non-payment through third-party export insurance. In cases where the credit quality of a customer does not meet the Company’s requirements, a cash deposit or letter of credit is received before goods are shipped.
Assessments about the recoverability of financial assets, including accounts receivable, require significant judgment in determining whether there is objective evidence that a loss event has occurred and estimates of the amount and timing of future cash flows. The Company
NOTIONAL AMOUNT
$
CONTRACT RATE
%
UNREALIZED GAIN (LOSS)
$
Canadian dollar contracts 90,000 3.6-4.3 (1,078)U.S. dollar contracts 38,000 3.8 363
NOTIONAL AMOUNT
$
CONTRACT RATE
%
UNREALIZED GAIN (LOSS)
$
Canadian dollar contracts 90,000 3.8-4.3 (2,001)
C O N S O L I D A T E D F I N A N C I A L S T A T E M E N T S141 06
YARGUS2016
Founded in 1968, Yargus produces custom blending and conveying equipment for industrial and fertilizer applications in a variety of capacities. The Yargus equipment line includes premium batch blending and material handling for dry materials including declining weight systems, taperedvertical blenders, rotary drum blenders, towers, bucket elevators and multiple conveying options. The Yargus in-house automation andengineering team are continually updating its extensive product linein order to meet the needs of the industry internationally.
C O N S O L I D A T E D F I N A N C I A L S T A T E M E N T S

2 0 1 6 A N N U A L R E P O R TF I E L D T O C O N S U M E R
DECEMBER 31, 2016 TOTAL$
0 - 6 MONTHS$
6 - 12 MONTHS$
12 - 24 MONTHS$
2 - 4 YEARS$
AFTER 4 YEARS$
Trade payables and provisions 71,056 71,056 — — — —
Dividends payable 2,956 2,956 — — — —
Due to vendor 16,415 16,415 — — — —
Acquisition, transaction and financing costs payable 262 262 — — — —
Contingent consideration 21,202 4,015 — 9,190 7,997 —
Term debt 249,858 4,099 4,099 8,199 120,298 113,163
Convertible unsecured subordinated debentures [includes interest] 245,208 5,498 5,498 97,245 136,967 —
TOTAL FINANCIAL LIABILITY PAYMENTS 609,657 104,301 9,597 114,634 265,262 113,163
DECEMBER 31, 2015 TOTAL$
0 - 6 MONTHS$
6 - 12 MONTHS$
12 - 24 MONTHS$
2 - 4 YEARS$
AFTER 4 YEARS$
Trade payables and provisions 54,271 54,271 — — — —
Dividends payable 2,883 2,883 — — — —
Due to vendor 1,114 1,114 — — — —
Acquisition, transaction and financing costs payable 732 732 — — — —
Contingent consideration 5,000 — 3,000 2,000 — —
Other financial liabilities 9,017 — 9,017 — — —
Term debt 176,975 37,906 2,914 4,260 57,499 74,396
Convertible unsecured subordinated debentures [includes interest] 256,203 5,498 5,498 10,995 155,462 78,750
TOTAL FINANCIAL LIABILITY PAYMENTS 506,195 102,404 20,429 17,255 212,961 153,146
maintains an allowance for doubtful accounts for estimated losses resulting from the inability to collect on its trade receivables, which is netted against the accounts receivable on the consolidated statements of financial position. Emerging markets are subject to various additional risks including currency exchange rate fluctuations, foreign economic conditions and foreign business practices. One or more of these factors could have a material effect on the future collectability of such receivables. In assessing whether objective evidence of impairment exists at each reporting period the Company considers its past experience of collecting payments, historical loss experience, customer credit ratings and financial data as available, collateral on amounts owing including insurance coverage from export credit agencies, as well as observable changes in national or local economic conditions.
The requirement for an impairment provision is analyzed at each reporting date on an individual basis for major customers. Additionally, a large number of minor receivables are grouped into homogeneous groups and assessed for impairment collectively.
The Company does not believe that any single customer group represents a significant concentration of credit risk.
LIQUIDITY RISK
Liquidity risk is the risk that AGI will encounter difficulties in meeting its financial liability obligations. AGI manages its liquidity risk through cash and debt management. In managing liquidity risk, AGI has access to committed short- and long-term debt facilities as well as to equity markets, the availability of which is dependent on market conditions. AGI believes it has sufficient funding through the use of these facilities to meet foreseeable borrowing requirements.
The tables below summarize the undiscounted contractual payments of the Company’s financial liabilities as at December 31, 2016 and 2015:
C O N S O L I D A T E D F I N A N C I A L S T A T E M E N T S143 144C O N S O L I D A T E D F I N A N C I A L S T A T E M E N T S
2 0 1 6 A N N U A L R E P O R TF I E L D T O C O N S U M E R
[B] FAIR VALUE
Set out below is a comparison by class of the carrying amounts and fair value of the Company’s financial instruments that are carried in the consolidated financial statements:
2016 2015
CARRYING AMOUNT$
FAIR VALUE$
CARRYING AMOUNT$
FAIR VALUE$
FINANCIAL ASSETS
Loans and receivables
Cash and cash equivalents 2,774 2,774 58,234 58,234
Cash held in trust 5,093 5,093 250 250
Accounts receivable 81,033 81,033 73,524 73,524
Due from vendor 342 342 — —
Derivative instruments 9,289 9,289 — —
Available-for-sale investment 900 900 900 900
Note receivable 807 807 — —
FINANCIAL LIABILITIES
Other financial liabilities
Interest-bearing loans and borrowings 208,581 208,916 148,317 148,531
Trade payables and provisions 71,056 71,056 54,271 54,271
Dividends payable 2,956 2,956 2,883 2,883
Due to vendor 16,415 16,415 1,114 1,114
Acquisition, transaction and financing costs payable 262 262 732 732
Contingent consideration 20,224 20,224 4,663 4,663
Other financial liabilities — — 9,017 9,017
Derivative instruments 1,577 1,577 23,768 23,768
Convertible unsecured subordinated debentures 201,210 198,150 197,585 185,414
The fair value of the financial assets and liabilities are included at the amount at which the instrument could be exchanged in a current transaction between willing parties, other than in a forced or liquidation sale.
The following methods and assumptions were used to estimate the fair values:
• Cash and cash equivalents, cash held in trust, restricted cash, accounts receivable, dividends payable, acquisition, transaction and financing costs payable, accounts payable and accrued liabilities, due to vendor, contingent consideration and other liabilities approximate their carrying amounts largely due to the short-term maturities of these instruments.
• The fair value of unquoted instruments and loans from banks is estimated by discounting future cash flows using rates currently available for debt on similar terms, credit risk and remaining maturities.
• The Company enters into derivative financial instruments with financial institutions with investment grade credit ratings. Derivatives valued using valuation techniques with market observable inputs are mainly foreign exchange forward contracts. The most frequently applied valuation techniques include forward pricing, using present value calculations. The models incorporate various inputs including the credit quality of counterparties and foreign exchange spot and forward rates.
• AGI includes its available-for-sale investment, which is in a private company, in Level 3 of the fair value hierarchy as it trades infrequently and has little price transparency. AGI reviews the fair value of this investment at each reporting period and when recent arm’s length market transactions are not available, management’s estimate of fair value is determined using a market approach based on external information and observable conditions where possible, supplemented by internal analysis as required.
[C] FAIR VALUE [“FV”] HIERARCHY
AGI uses the following hierarchy for determining and disclosing the fair value of financial instruments by valuation technique:
C O N S O L I D A T E D F I N A N C I A L S T A T E M E N T S145 146C O N S O L I D A T E D F I N A N C I A L S T A T E M E N T S
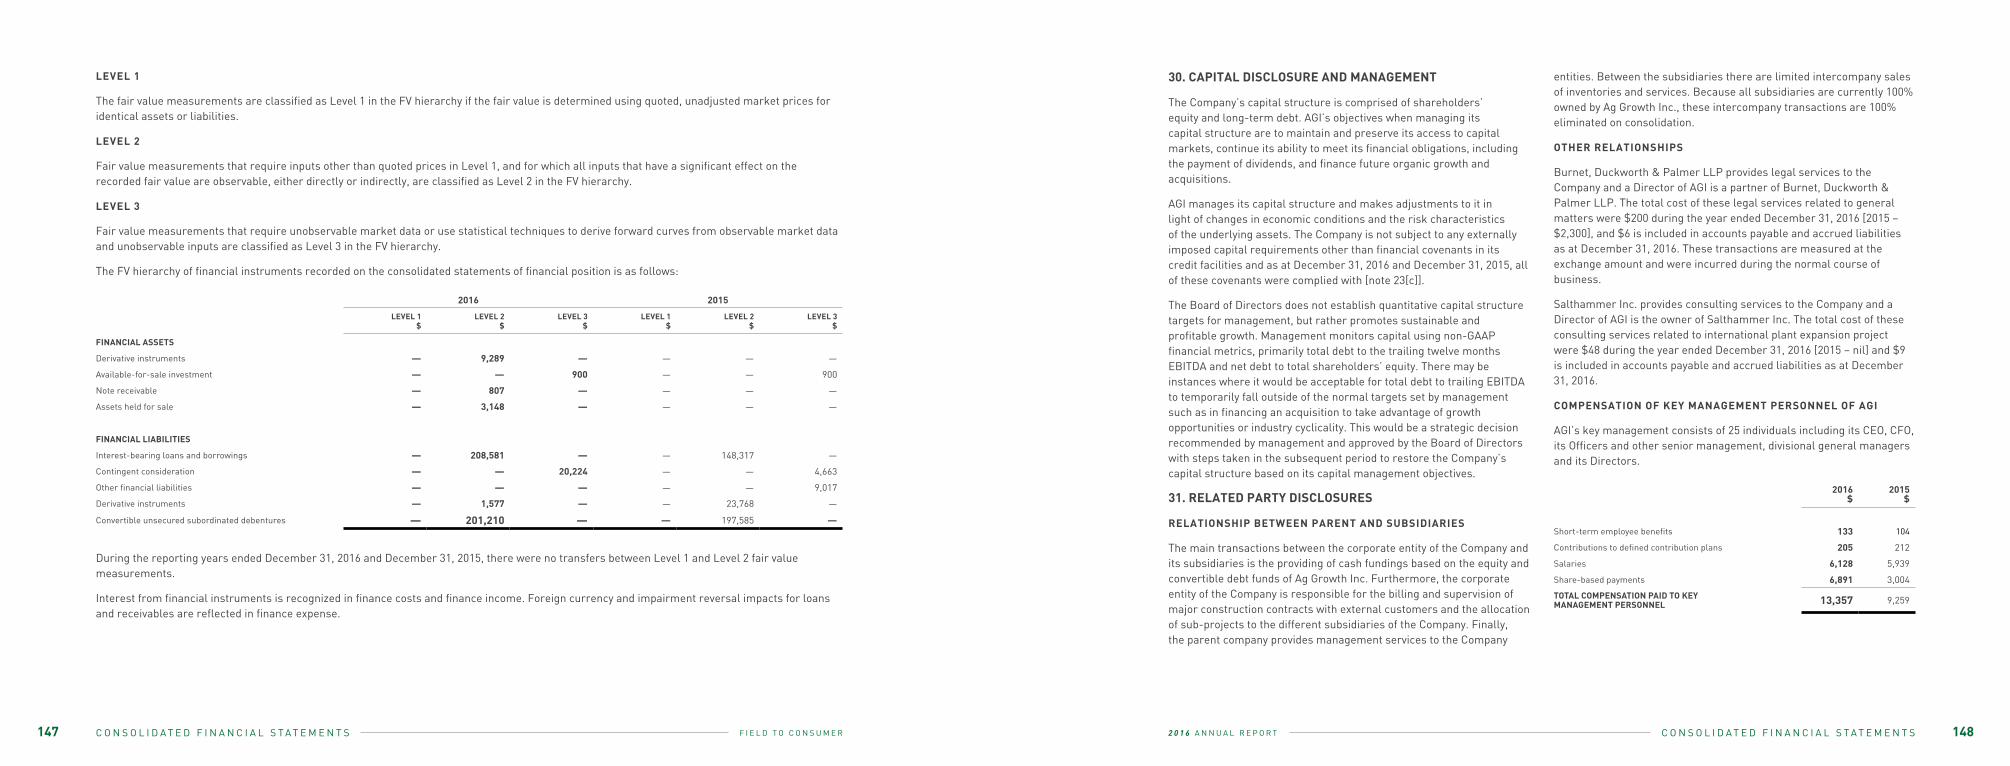
2 0 1 6 A N N U A L R E P O R TF I E L D T O C O N S U M E R
LEVEL 1
The fair value measurements are classified as Level 1 in the FV hierarchy if the fair value is determined using quoted, unadjusted market prices for identical assets or liabilities.
LEVEL 2
Fair value measurements that require inputs other than quoted prices in Level 1, and for which all inputs that have a significant effect on the recorded fair value are observable, either directly or indirectly, are classified as Level 2 in the FV hierarchy.
LEVEL 3
Fair value measurements that require unobservable market data or use statistical techniques to derive forward curves from observable market data and unobservable inputs are classified as Level 3 in the FV hierarchy.
The FV hierarchy of financial instruments recorded on the consolidated statements of financial position is as follows:
During the reporting years ended December 31, 2016 and December 31, 2015, there were no transfers between Level 1 and Level 2 fair value measurements.
Interest from financial instruments is recognized in finance costs and finance income. Foreign currency and impairment reversal impacts for loans and receivables are reflected in finance expense.
2016 2015
LEVEL 1$
LEVEL 2$
LEVEL 3$
LEVEL 1$
LEVEL 2$
LEVEL 3$
FINANCIAL ASSETS
Derivative instruments — 9,289 — — — —
Available-for-sale investment — — 900 — — 900
Note receivable — 807 — — — —
Assets held for sale — 3,148 — — — —
FINANCIAL LIABILITIES
Interest-bearing loans and borrowings — 208,581 — — 148,317 —
Contingent consideration — — 20,224 — — 4,663
Other financial liabilities — — — — — 9,017
Derivative instruments — 1,577 — — 23,768 —
Convertible unsecured subordinated debentures — 201,210 — — 197,585 —
30. CAPITAL DISCLOSURE AND MANAGEMENT
The Company’s capital structure is comprised of shareholders’ equity and long-term debt. AGI’s objectives when managing its capital structure are to maintain and preserve its access to capital markets, continue its ability to meet its financial obligations, including the payment of dividends, and finance future organic growth and acquisitions.
AGI manages its capital structure and makes adjustments to it in light of changes in economic conditions and the risk characteristics of the underlying assets. The Company is not subject to any externally imposed capital requirements other than financial covenants in its credit facilities and as at December 31, 2016 and December 31, 2015, all of these covenants were complied with [note 23[c]].
The Board of Directors does not establish quantitative capital structure targets for management, but rather promotes sustainable and profitable growth. Management monitors capital using non-GAAP financial metrics, primarily total debt to the trailing twelve months EBITDA and net debt to total shareholders’ equity. There may be instances where it would be acceptable for total debt to trailing EBITDA to temporarily fall outside of the normal targets set by management such as in financing an acquisition to take advantage of growth opportunities or industry cyclicality. This would be a strategic decision recommended by management and approved by the Board of Directors with steps taken in the subsequent period to restore the Company’s capital structure based on its capital management objectives.
31. RELATED PARTY DISCLOSURES
RELATIONSHIP BETWEEN PARENT AND SUBSIDIARIES
The main transactions between the corporate entity of the Company and its subsidiaries is the providing of cash fundings based on the equity and convertible debt funds of Ag Growth Inc. Furthermore, the corporate entity of the Company is responsible for the billing and supervision of major construction contracts with external customers and the allocation of sub-projects to the different subsidiaries of the Company. Finally, the parent company provides management services to the Company
entities. Between the subsidiaries there are limited intercompany sales of inventories and services. Because all subsidiaries are currently 100% owned by Ag Growth Inc., these intercompany transactions are 100% eliminated on consolidation.
OTHER RELATIONSHIPS
Burnet, Duckworth & Palmer LLP provides legal services to the Company and a Director of AGI is a partner of Burnet, Duckworth & Palmer LLP. The total cost of these legal services related to general matters were $200 during the year ended December 31, 2016 [2015 – $2,300], and $6 is included in accounts payable and accrued liabilities as at December 31, 2016. These transactions are measured at the exchange amount and were incurred during the normal course of business.
Salthammer Inc. provides consulting services to the Company and a Director of AGI is the owner of Salthammer Inc. The total cost of these consulting services related to international plant expansion project were $48 during the year ended December 31, 2016 [2015 – nil] and $9 is included in accounts payable and accrued liabilities as at December 31, 2016.
COMPENSATION OF KEY MANAGEMENT PERSONNEL OF AGI
AGI’s key management consists of 25 individuals including its CEO, CFO, its Officers and other senior management, divisional general managers and its Directors.
2016$
2015$
Short-term employee benefits 133 104
Contributions to defined contribution plans 205 212
Salaries 6,128 5,939
Share-based payments 6,891 3,004
TOTAL COMPENSATION PAID TO KEY MANAGEMENT PERSONNEL 13,357 9,259
C O N S O L I D A T E D F I N A N C I A L S T A T E M E N T S147 148C O N S O L I D A T E D F I N A N C I A L S T A T E M E N T S
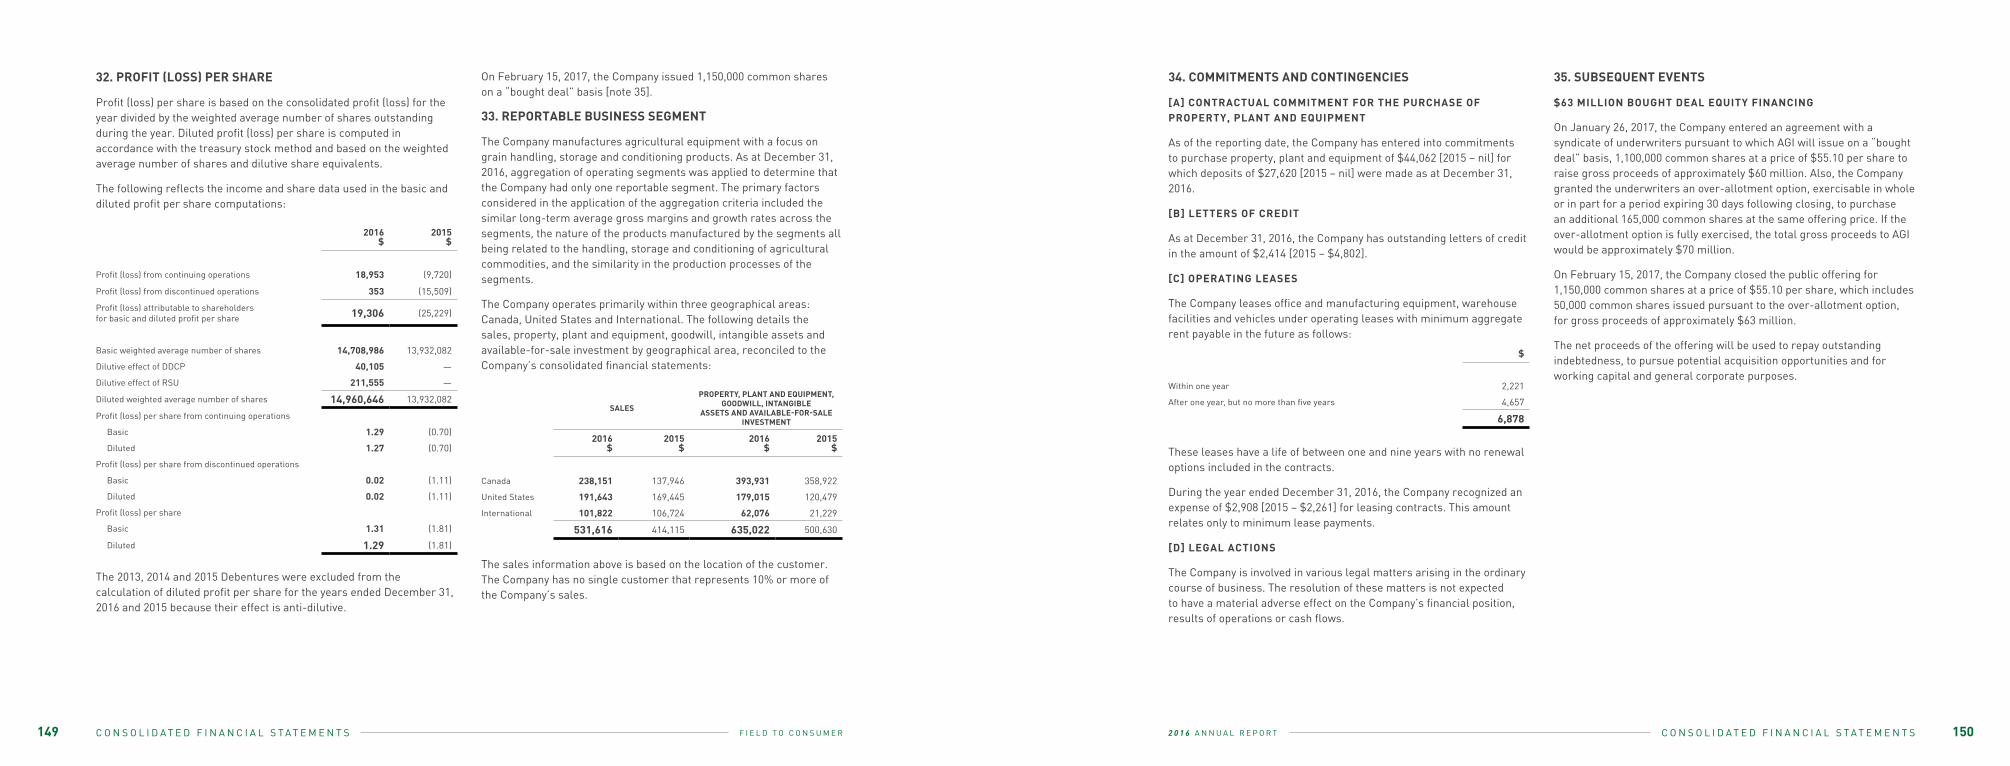
2 0 1 6 A N N U A L R E P O R TF I E L D T O C O N S U M E R
32. PROFIT (LOSS) PER SHARE
Profit (loss) per share is based on the consolidated profit (loss) for the year divided by the weighted average number of shares outstanding during the year. Diluted profit (loss) per share is computed in accordance with the treasury stock method and based on the weighted average number of shares and dilutive share equivalents.
The following reflects the income and share data used in the basic and diluted profit per share computations:
The 2013, 2014 and 2015 Debentures were excluded from the calculation of diluted profit per share for the years ended December 31, 2016 and 2015 because their effect is anti-dilutive.
On February 15, 2017, the Company issued 1,150,000 common shares on a “bought deal” basis [note 35].
33. REPORTABLE BUSINESS SEGMENT
The Company manufactures agricultural equipment with a focus on grain handling, storage and conditioning products. As at December 31, 2016, aggregation of operating segments was applied to determine that the Company had only one reportable segment. The primary factors considered in the application of the aggregation criteria included the similar long-term average gross margins and growth rates across the segments, the nature of the products manufactured by the segments all being related to the handling, storage and conditioning of agricultural commodities, and the similarity in the production processes of the segments.
The Company operates primarily within three geographical areas: Canada, United States and International. The following details the sales, property, plant and equipment, goodwill, intangible assets and available-for-sale investment by geographical area, reconciled to the Company’s consolidated financial statements:
The sales information above is based on the location of the customer. The Company has no single customer that represents 10% or more of the Company’s sales.
2016$
2015$
Profit (loss) from continuing operations 18,953 (9,720)
Profit (loss) from discontinued operations 353 (15,509)
Profit (loss) attributable to shareholders for basic and diluted profit per share 19,306 (25,229)
Basic weighted average number of shares 14,708,986 13,932,082
Dilutive effect of DDCP 40,105 —
Dilutive effect of RSU 211,555 —
Diluted weighted average number of shares 14,960,646 13,932,082
Profit (loss) per share from continuing operations
Basic 1.29 (0.70)
Diluted 1.27 (0.70)
Profit (loss) per share from discontinued operations
Basic 0.02 (1.11)
Diluted 0.02 (1.11)
Profit (loss) per share
Basic 1.31 (1.81)
Diluted 1.29 (1.81)
SALES
PROPERTY, PLANT AND EQUIPMENT, GOODWILL, INTANGIBLE
ASSETS AND AVAILABLE-FOR-SALE INVESTMENT
2016$
2015$
2016$
2015$
Canada 238,151 137,946 393,931 358,922
United States 191,643 169,445 179,015 120,479
International 101,822 106,724 62,076 21,229
531,616 414,115 635,022 500,630
34. COMMITMENTS AND CONTINGENCIES
[A] CONTRACTUAL COMMITMENT FOR THE PURCHASE OF PROPERTY, PLANT AND EQUIPMENT
As of the reporting date, the Company has entered into commitments to purchase property, plant and equipment of $44,062 [2015 – nil] for which deposits of $27,620 [2015 – nil] were made as at December 31, 2016.
[B] LETTERS OF CREDIT
As at December 31, 2016, the Company has outstanding letters of credit in the amount of $2,414 [2015 – $4,802].
[C] OPERATING LEASES
The Company leases office and manufacturing equipment, warehouse facilities and vehicles under operating leases with minimum aggregate rent payable in the future as follows:
These leases have a life of between one and nine years with no renewal options included in the contracts.
During the year ended December 31, 2016, the Company recognized an expense of $2,908 [2015 – $2,261] for leasing contracts. This amount relates only to minimum lease payments.
[D] LEGAL ACTIONS
The Company is involved in various legal matters arising in the ordinary course of business. The resolution of these matters is not expected to have a material adverse effect on the Company’s financial position, results of operations or cash flows.
35. SUBSEQUENT EVENTS
$63 MILLION BOUGHT DEAL EQUITY FINANCING
On January 26, 2017, the Company entered an agreement with a syndicate of underwriters pursuant to which AGI will issue on a “bought deal” basis, 1,100,000 common shares at a price of $55.10 per share to raise gross proceeds of approximately $60 million. Also, the Company granted the underwriters an over-allotment option, exercisable in whole or in part for a period expiring 30 days following closing, to purchase an additional 165,000 common shares at the same offering price. If the over-allotment option is fully exercised, the total gross proceeds to AGI would be approximately $70 million.
On February 15, 2017, the Company closed the public offering for 1,150,000 common shares at a price of $55.10 per share, which includes 50,000 common shares issued pursuant to the over-allotment option, for gross proceeds of approximately $63 million.
The net proceeds of the offering will be used to repay outstanding indebtedness, to pursue potential acquisition opportunities and for working capital and general corporate purposes.
$
Within one year 2,221
After one year, but no more than five years 4,657
6,878
C O N S O L I D A T E D F I N A N C I A L S T A T E M E N T S149 150C O N S O L I D A T E D F I N A N C I A L S T A T E M E N T S
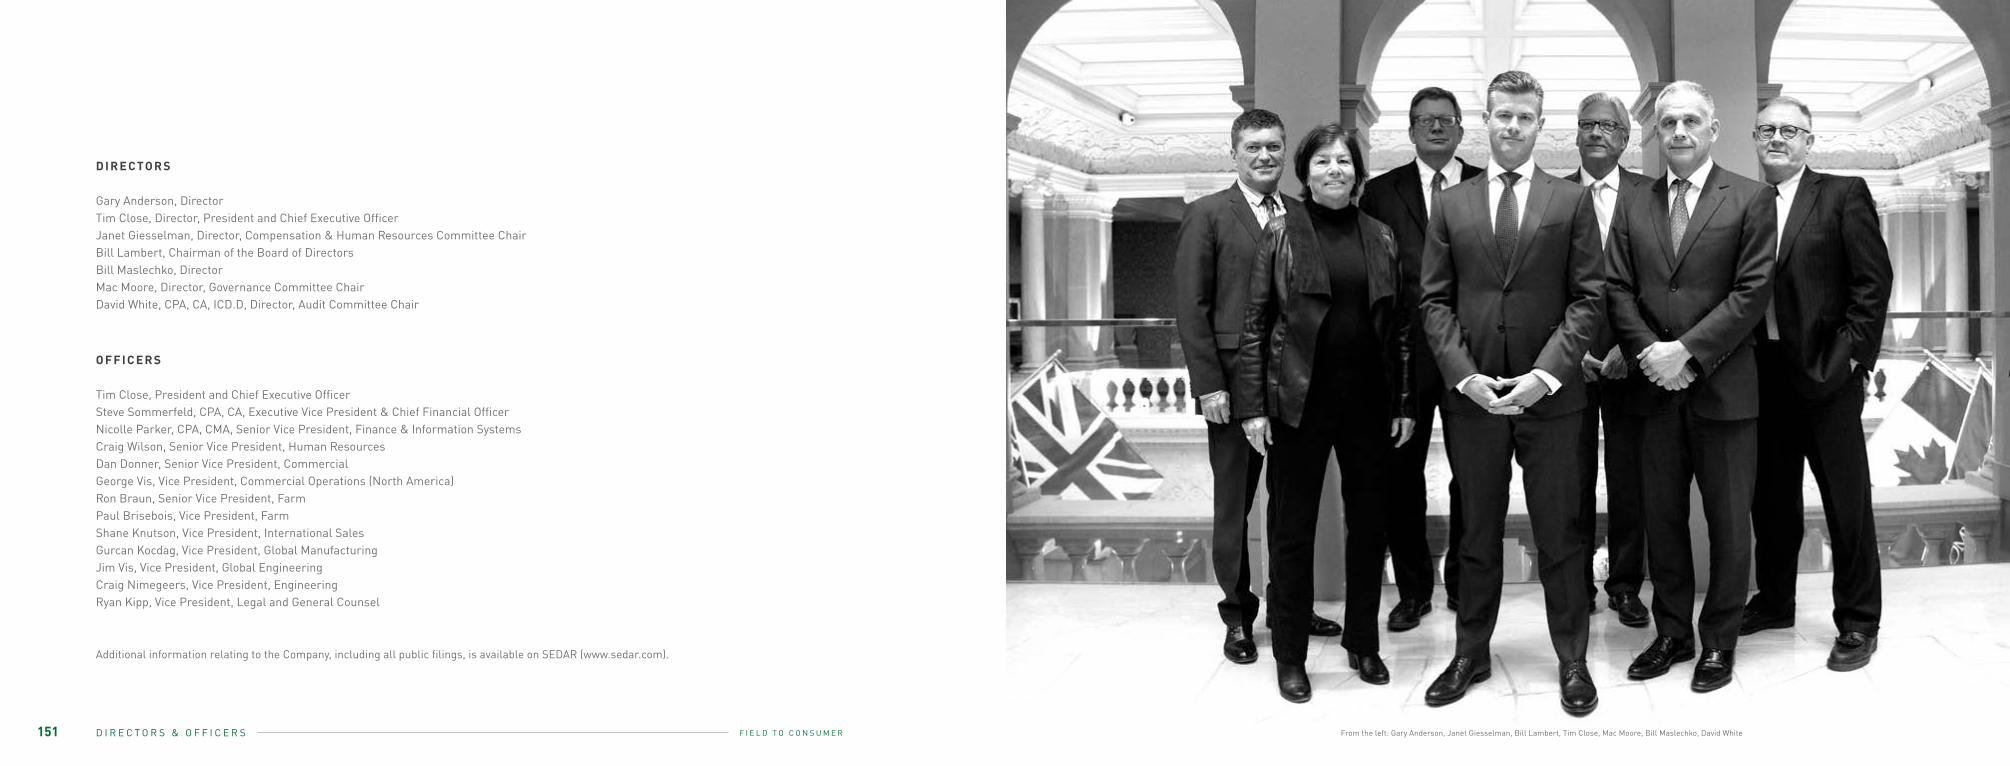
2 0 1 6 A N N U A L R E P O R TF I E L D T O C O N S U M E R
D I R E CTO R S
Gary Anderson, DirectorTim Close, Director, President and Chief Executive OfficerJanet Giesselman, Director, Compensation & Human Resources Committee ChairBill Lambert, Chairman of the Board of DirectorsBill Maslechko, DirectorMac Moore, Director, Governance Committee ChairDavid White, CPA, CA, ICD.D, Director, Audit Committee Chair
Additional information relating to the Company, including all public filings, is available on SEDAR (www.sedar.com).
D I R E C T O R S & O F F I C E R S151 06C O N S O L I D A T E D F I N A N C I A L S T A T E M E N T SFrom the left: Gary Anderson, Janet Giesselman, Bill Lambert, Tim Close, Mac Moore, Bill Maslechko, David White
O F F I C E R S
Tim Close, President and Chief Executive OfficerSteve Sommerfeld, CPA, CA, Executive Vice President & Chief Financial OfficerNicolle Parker, CPA, CMA, Senior Vice President, Finance & Information SystemsCraig Wilson, Senior Vice President, Human ResourcesDan Donner, Senior Vice President, CommercialGeorge Vis, Vice President, Commercial Operations (North America)Ron Braun, Senior Vice President, FarmPaul Brisebois, Vice President, FarmShane Knutson, Vice President, International SalesGurcan Kocdag, Vice President, Global ManufacturingJim Vis, Vice President, Global EngineeringCraig Nimegeers, Vice President, EngineeringRyan Kipp, Vice President, Legal and General Counsel

2 0 1 6 A N N U A L R E P O R TF I E L D T O C O N S U M E R


![thetrove.is [multi]/6th Edition...RTG —5-(7)— Initiative Intentbns Movement perception Stealth RIG 5(6) .2 ATT Agi Agi Agi Agi Agi Cha Cha 10 12(13) 14(15) 12(13) 14(1S) 4 A A](https://img.dokumen.tips/doc/110x75/60bfa9da6453b801736552d8/multi6th-edition-rtg-a5-7a-initiative-intentbns-movement-perception.jpg)