Embed Size (px)
Citation preview
Final Report
2016 Minneapolis Residential Solid
Waste Composition Analysis and
Recycling Program Evaluation Project I.D.: 16H010
Prepared for
Hennepin County
Minneapolis, Minnesota
September 2016
GRG Analysis

2016 Minneapolis Residential Solid Waste Composition
Analysis And Recycling Program Evaluation:
Final Report
Project ID: 16H010
Prepared for
Hennepin County
Hennepin County Public Works Hennepin County Environment and Energy Department
701 Fourth Ave S, Suite 700 Minneapolis, MN 55415
Prepared by
Foth Infrastructure & Environment, LLC
Together with
MSW Consultants, Inc.
And
Louis Berger and Associates
September 2016
Copyright©, Foth Infrastructure & Environment, LLC 2016 Eagle Point II • 8550 Hudson Blvd. North, Suite 105 • Lake Elmo, MN 55042 • (651) 288-8550 • Fax: (651) 288-8551 � www.foth.com
REUSE OF DOCUMENTS This document has been developed for a specific application and not for general use; therefore, it may not be used without
the written approval of Foth. Unapproved use is at the sole responsibility of the unauthorized user.

i X:\FOTH\IE\Hennepin Co ES MN\16H010-00\10000 Reports\R - Hennepin County Final Report.docx
2016 Minneapolis Residential Solid Waste Composition Analysis
And Recycling Program Evaluation: Final Report
Contents
Page Executive Summary ....................................................................................................................... iii Definitions ................................................................................................................................. ix Abbreviations/Acronyms ............................................................................................................... xi 1 Introduction .............................................................................................................................1
1.1 Purpose of County Study .................................................................................................1 1.2 Steps in the Study Design ................................................................................................2
1.2.1 Request for Proposals (RFP) ..............................................................................2 1.2.2 Waste Sort Design Plan .....................................................................................2 1.2.3 Waste Sort Operations .......................................................................................4 1.2.5 Remaining Sections of the Final Report ............................................................6
2 Sort Report Highlights .............................................................................................................7 3 Description of Recycling Services Available ........................................................................14 4 Analysis of Recycling Performance by Waste Load Area and Citywide ..............................16 5 Analysis of Demographic / Socioeconomic Factors Affecting Recycling Participation ......19 6 Feasibility of Minneapolis Residential Recycling Programs Meeting a 75 Percent
Recycling Rate .......................................................................................................................21 6.1 State and County Recycling Rate Goals ........................................................................21 6.2 The “Evolving Ton” of Residential Recyclables ..........................................................22 6.3 Minneapolis Recycling Rates ........................................................................................23 6.4 2015 Recycling Rate and Capture Rate .........................................................................23 6.5 Maximum Theoretical Recycling Rate ..........................................................................24 6.6 Maximum Achievable Recycling Rate ..........................................................................25 6.7 Residential Organics Recycling ....................................................................................29 6.8 Participation Rates .........................................................................................................30 6.9 Drop-Off Programs ........................................................................................................30 6.10 Total Recycling vs. Residential Recycling ....................................................................31 6.11 Best Opportunities to Recycle More Materials .............................................................31 6.12 Market Development .....................................................................................................32
7 Conclusions and Recommendations ......................................................................................33 7.1 Study Conclusions .........................................................................................................33 7.2 Recommendations for future analysis and programs ....................................................34
ii
Tables
Table 1-1 Primary Sort Categories and Recycling Methods ..................................................4 Table 1-2 Plastic Subsort Categories ......................................................................................5 Table 1-3 Additional Subsort Categories ................................................................................5 Table 4-1 2015 Waste Generation and Recycling Rates by Waste Load Area ....................16 Table 5-1 Demographic Characteristics of Waste Load Areas .............................................19 Table 6-1 MPCA’s Metropolitan Solid Waste Management Policy Plan MSW
Management System Objectives ...................................................................................21 Table 6-2 Capture Rates of Materials Needed To Achieve “Maximum Achievable
Recycling Rate” .............................................................................................................25 Table 6-3 Individual Commodity Capture Rate Assumptions Used to Calculate the
“Maximum Achievable” Recycling Rate ......................................................................26
Figures
Figure ES-1 Ten Most Prevalent Materials in the Citywide Solid Waste As Disposed ....... iv Figure ES-2 Capture Rates of Recyclable Commodities ........................................................v Figure ES-3 Strengths and Opportunities for Diversion of Materials .................................. vi Figure ES-4 Current and Maximum Achievable Capture Rates By Commodity ................ vii Figure 1-1 Waste Load Areas .................................................................................................3 Figure 2-1 Top Ten (10) Most Prevalent Materials ................................................................7 Figure 2-2 Capture Rates of Recyclable Commodities...........................................................8 Figure 2-3 Retail Origin of Plastic Containers .....................................................................10 Figure 2-4 Retail Origins of Non-Container Rigid Plastics ..................................................10 Figure 2-5 Retail Origins of Plastic Films in Sorted Waste..................................................11 Figure 2-6 Retail Origins of “Other Paper” ..........................................................................12 Figure 2-7 Composition of Compostable Materials.............................................................12 Figure 2-8 Composition of Textiles .....................................................................................13 Figure 4-1 Composition of Waste by Waste Load Area .......................................................17 Figure 4-2 Recycling and Other Diversion Options .............................................................18 Figure 6-1 Change in Paper and Packaging: 1990-2012 ......................................................22
iii
2016 Final Report
Executive Summary
The State of Minnesota established a recycling rate goal of 75 percent by 2030 for Twin Cities Metropolitan Counties. Hennepin County has encouraged expansion of existing recycling programs and created new ones in an effort to make progress toward that goal. Continued progress will require a detailed understanding of what is in the trash and what can realistically be recovered. The City of Minneapolis is a good place to begin this inquiry. The City has a mature residential recycling program with comprehensive services. It recently rolled out a curbside organics program and has initiated a process to move the City toward zero waste. To assist the City of Minneapolis and to inform program development throughout the County, Hennepin County sought to collect detailed data and perform objective analyses by conducting a waste composition study. The Study evaluated only the residential solid waste and recycling program in Minneapolis. Foth Infrastructure & Environment, LLC, with sub-consultants MSW Consultants, Louis Berger and Associates and GRG Analysis, contracted with the County to perform the study. Objectives of the Study included:
♦ To measure the amount of recyclable and compostable materials in the residential solid waste stream. The focus was on recyclability/compostability, not solely material type.
♦ To address the challenges of recycling more by exploring what is and isn’t currently recyclable, what markets and programs need to be developed, how many people can be expected to participate and how much will those people actually recycle or set out for collection.
♦ To specifically address the feasibility of the City residential solid waste and recycling program attaining the 75 percent State recycling goal.
♦ To examine residential solid waste and recycling performance in a unique way by analyzing the results in three different Minneapolis neighborhoods with different demographic and socioeconomic characteristics.
♦ To document what was in the trash through primary and secondary sort categories supported by photographs and accompanying notes.
The waste sort took place at the Hennepin Energy Recovery Center (HERC), 505 6th Avenue North, Minneapolis, MN 55405 May 8 through May 14, 2016. Three loads of trash from separate Waste Load Areas (WLAs) were selected by the County in consultation with the City. Each load represented approximately four hundred single family dwellings. A detailed description of the Study design, operations and data is found in the separate report, “City of
Minneapolis Residential Waste Characterization Study and Recycling Analysis” (Sort Report) by MSW Consultants produced for Hennepin County.
iv
There were three tables to sort the waste, each with a particular role and layout:
♦ The main sort table was where the entire sample was first emptied and sorted into approximately 55 categories.
♦ The plastic subsort table received plastic containers, rigid plastics and film plastics to be sorted into sub categories.
♦ The other subsort table received the remainder of materials requiring subsorting including HHW, electronics including CRTs, textiles other than clothing, and non-recyclable paper.
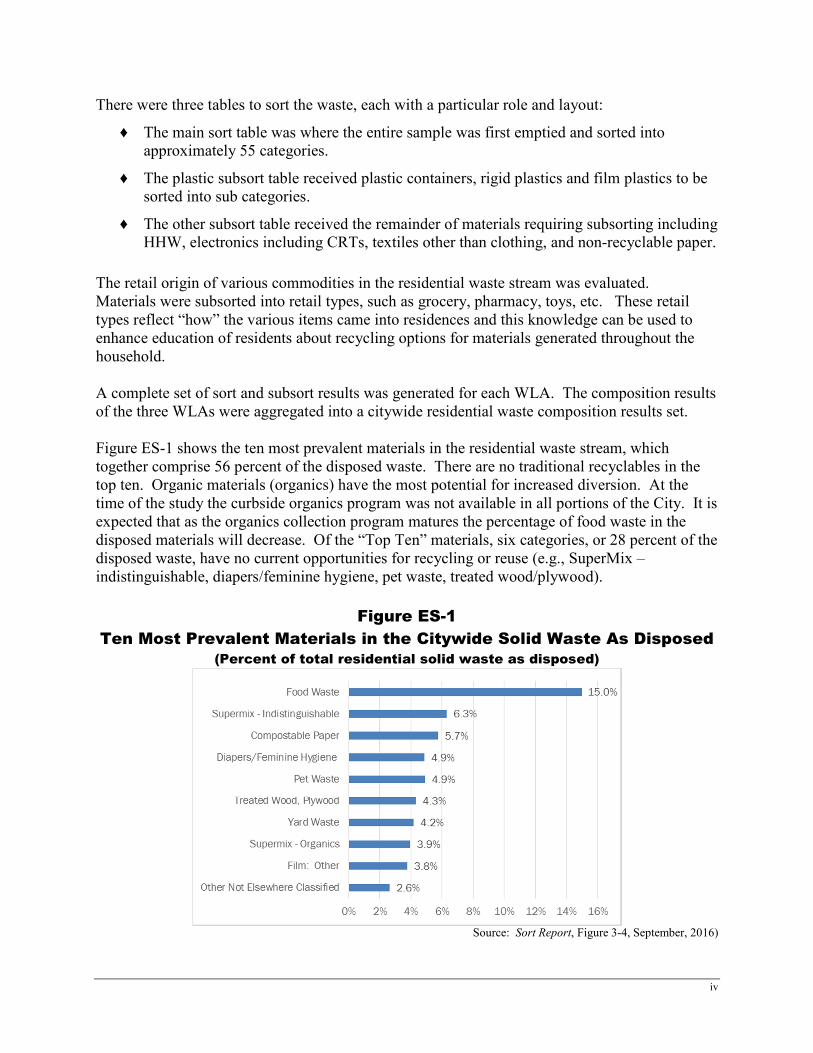
The retail origin of various commodities in the residential waste stream was evaluated. Materials were subsorted into retail types, such as grocery, pharmacy, toys, etc. These retail types reflect “how” the various items came into residences and this knowledge can be used to enhance education of residents about recycling options for materials generated throughout the household. A complete set of sort and subsort results was generated for each WLA. The composition results of the three WLAs were aggregated into a citywide residential waste composition results set. Figure ES-1 shows the ten most prevalent materials in the residential waste stream, which together comprise 56 percent of the disposed waste. There are no traditional recyclables in the top ten. Organic materials (organics) have the most potential for increased diversion. At the time of the study the curbside organics program was not available in all portions of the City. It is expected that as the organics collection program matures the percentage of food waste in the disposed materials will decrease. Of the “Top Ten” materials, six categories, or 28 percent of the disposed waste, have no current opportunities for recycling or reuse (e.g., SuperMix –indistinguishable, diapers/feminine hygiene, pet waste, treated wood/plywood).
Figure ES-1
Ten Most Prevalent Materials in the Citywide Solid Waste As Disposed
(Percent of total residential solid waste as disposed)
Source: Sort Report, Figure 3-4, September, 2016)
X:\FOTH\IE\Hennepin Co ES MN\16H010-00\10000 Reports\R - Hennepin County Final Report.docx v
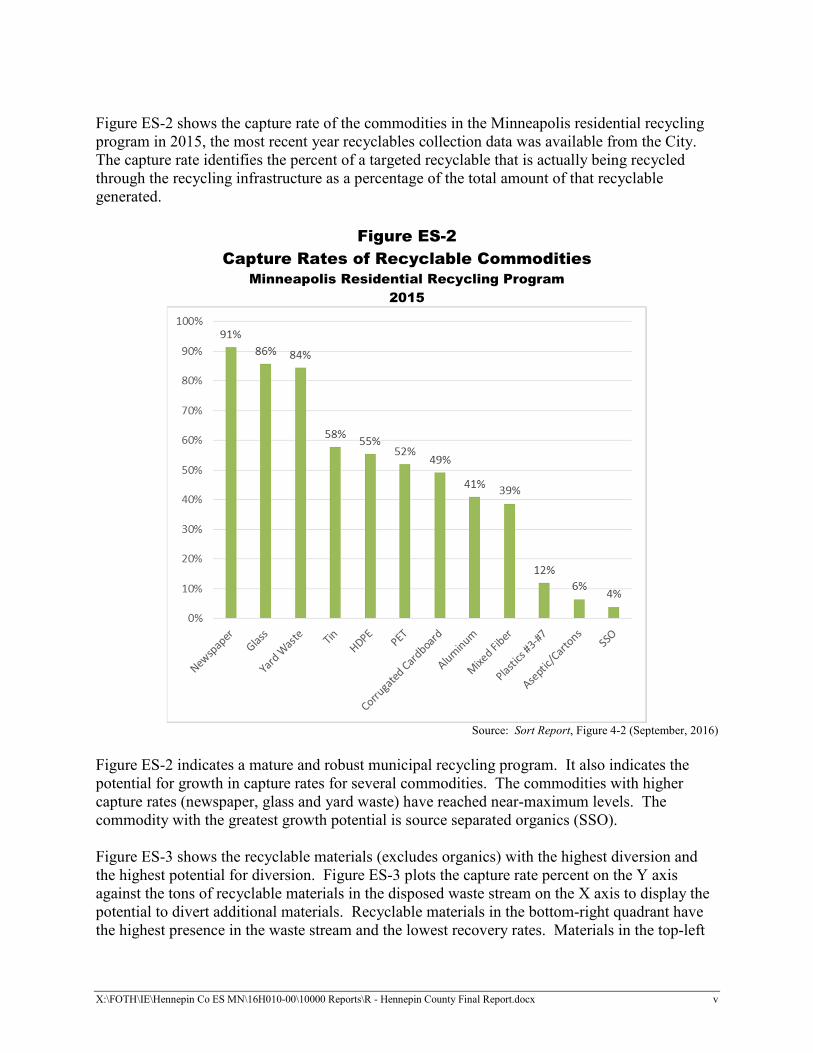
Figure ES-2 shows the capture rate of the commodities in the Minneapolis residential recycling program in 2015, the most recent year recyclables collection data was available from the City. The capture rate identifies the percent of a targeted recyclable that is actually being recycled through the recycling infrastructure as a percentage of the total amount of that recyclable generated.
Figure ES-2
Capture Rates of Recyclable Commodities
Minneapolis Residential Recycling Program
2015
Source: Sort Report, Figure 4-2 (September, 2016)
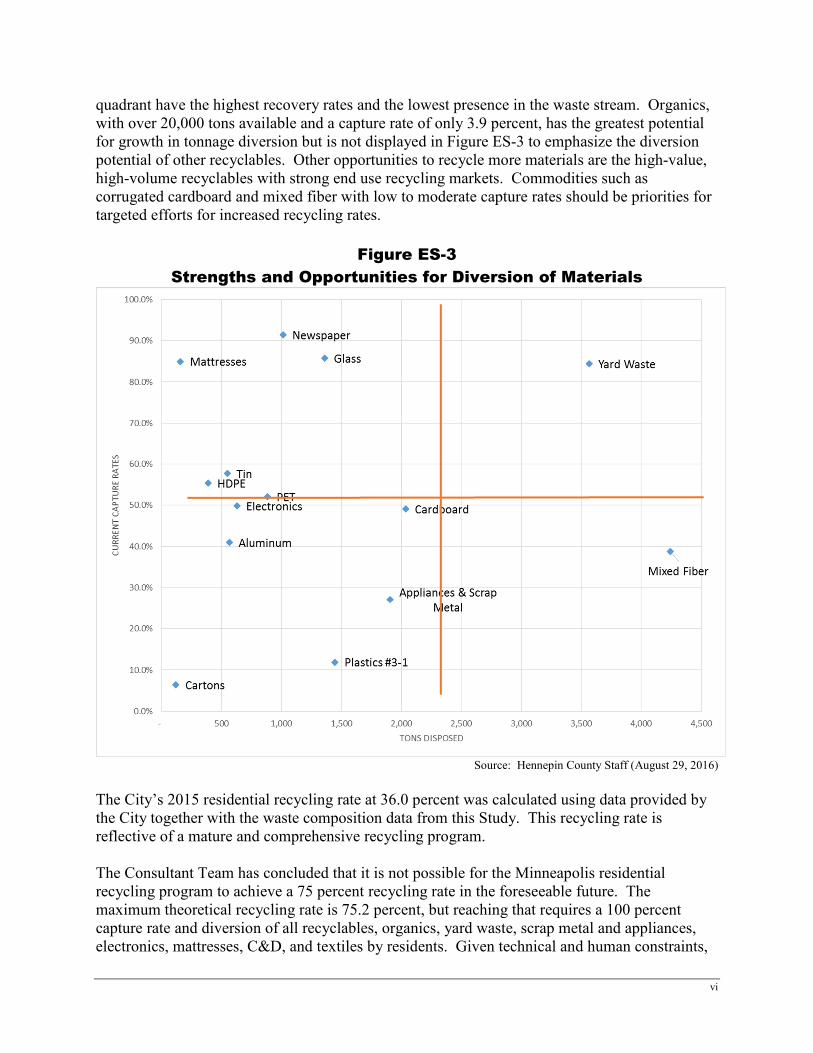
Figure ES-2 indicates a mature and robust municipal recycling program. It also indicates the potential for growth in capture rates for several commodities. The commodities with higher capture rates (newspaper, glass and yard waste) have reached near-maximum levels. The commodity with the greatest growth potential is source separated organics (SSO). Figure ES-3 shows the recyclable materials (excludes organics) with the highest diversion and the highest potential for diversion. Figure ES-3 plots the capture rate percent on the Y axis against the tons of recyclable materials in the disposed waste stream on the X axis to display the potential to divert additional materials. Recyclable materials in the bottom-right quadrant have the highest presence in the waste stream and the lowest recovery rates. Materials in the top-left
vi
quadrant have the highest recovery rates and the lowest presence in the waste stream. Organics, with over 20,000 tons available and a capture rate of only 3.9 percent, has the greatest potential for growth in tonnage diversion but is not displayed in Figure ES-3 to emphasize the diversion potential of other recyclables. Other opportunities to recycle more materials are the high-value, high-volume recyclables with strong end use recycling markets. Commodities such as corrugated cardboard and mixed fiber with low to moderate capture rates should be priorities for targeted efforts for increased recycling rates.
Figure ES-3
Strengths and Opportunities for Diversion of Materials
Source: Hennepin County Staff (August 29, 2016)
The City’s 2015 residential recycling rate at 36.0 percent was calculated using data provided by the City together with the waste composition data from this Study. This recycling rate is reflective of a mature and comprehensive recycling program. The Consultant Team has concluded that it is not possible for the Minneapolis residential recycling program to achieve a 75 percent recycling rate in the foreseeable future. The maximum theoretical recycling rate is 75.2 percent, but reaching that requires a 100 percent capture rate and diversion of all recyclables, organics, yard waste, scrap metal and appliances, electronics, mattresses, C&D, and textiles by residents. Given technical and human constraints,
X:\FOTH\IE\Hennepin Co ES MN\16H010-00\10000 Reports\R - Hennepin County Final Report.docx vii
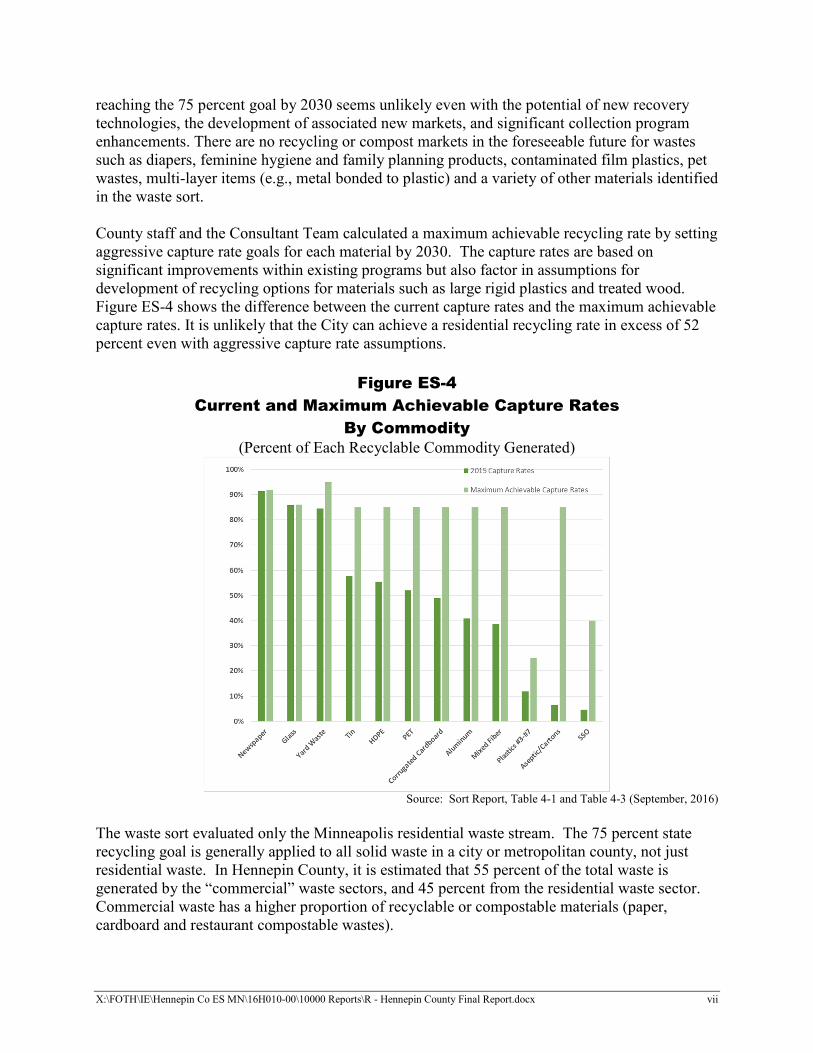
reaching the 75 percent goal by 2030 seems unlikely even with the potential of new recovery technologies, the development of associated new markets, and significant collection program enhancements. There are no recycling or compost markets in the foreseeable future for wastes such as diapers, feminine hygiene and family planning products, contaminated film plastics, pet wastes, multi-layer items (e.g., metal bonded to plastic) and a variety of other materials identified in the waste sort. County staff and the Consultant Team calculated a maximum achievable recycling rate by setting aggressive capture rate goals for each material by 2030. The capture rates are based on significant improvements within existing programs but also factor in assumptions for development of recycling options for materials such as large rigid plastics and treated wood. Figure ES-4 shows the difference between the current capture rates and the maximum achievable capture rates. It is unlikely that the City can achieve a residential recycling rate in excess of 52 percent even with aggressive capture rate assumptions.
Figure ES-4
Current and Maximum Achievable Capture Rates
By Commodity
(Percent of Each Recyclable Commodity Generated)
Source: Sort Report, Table 4-1 and Table 4-3 (September, 2016)
The waste sort evaluated only the Minneapolis residential waste stream. The 75 percent state recycling goal is generally applied to all solid waste in a city or metropolitan county, not just residential waste. In Hennepin County, it is estimated that 55 percent of the total waste is generated by the “commercial” waste sectors, and 45 percent from the residential waste sector. Commercial waste has a higher proportion of recyclable or compostable materials (paper, cardboard and restaurant compostable wastes).
viii
The Study identified the retail origins of various commodities in the residential waste stream, reflecting “how” the various items came into residences. The vast majority of plastic containers of several resin types were associated with grocery purchases. Almost 50 percent of the compostable paper in the waste was associated with grocery or food uses. Slightly less than 20 percent of the film plastic sorted was recyclable in take-back programs. The majority of the film plastics sorted have no recycling or diversion opportunities except waste-to-energy such as HERC. These film plastics are likely to be disposed either by reason of contamination, multi-layer construction or lack or processing capacity or infrastructure. About 50 percent of the non-recyclable paper in the waste was also non-compostable. It was often difficult to distinguish recyclable or compostable papers from non-recyclable or compostable materials. Developing education programs to teach the public the subtle distinctions that insure compostability or recyclability will be challenging. The three WLAs had a range of demographic and neighborhood characteristics, including median age, average income, percent of home ownership, length of time in the residence, language spoken, household size, percent vacant properties, etc. Differences in waste generation and recycling diversion were noted to track with some demographic and neighborhood differences. Although multiple factors influence waste generation and recycling behaviors, the WLA with the highest rental rate had the lowest recycling rate and the WLA with the highest median income had the highest recycling rate. Language in the residence did not appear to affect recycling behavior, possibly because the City has education programs available in several languages and formats. Current trends in consumer product packaging and information/media industries have led to a decline in recyclable materials as a percent by weight in the waste stream. This phenomenon, known as the evolving ton of recyclables, will continue to put significant downward pressure on maximum theoretical recycling rates. Opportunities to divert materials from the waste stream do, however, exist. The materials below should be the focus of diversion efforts to make progress toward the state’s weight-based recycling rate goal.
1. Organics
2. Mixed fiber and cardboard
3. C&D
4. Textiles
ix
2016 Final Report
Definitions
Capture Rate Calculated percentage of a targeted recyclable that is actually being recycled through the available recycling infrastructure ( “captured” in the City’s recycling programs and other collection systems). Calculated by dividing the amount of targeted recycling materials actually recycled divided by the amount of targeted recycling materials recycled plus the amount of recycling materials generated. Also known as “Recovery Rate”.
Compostables Organic recyclables and yard waste.
Contaminants as Collected
Non-targeted items collected in the City’s single-stream curbside recycling programs that are not recyclable. These contaminants are feedstock “inputs” to the MRF, but are defined separately in this report from “processing residuals” which are rejected waste “outputs” from the MRF. Therefore, contaminants as collected contribute to processing residuals but are not synonymous.
Diversion Rate The total percent of materials recycled and composted divided by the total amount of solid waste generated (diverted plus material disposed).
Final Report This report authored primarily by Foth.
Organic Recyclables, Organics
Food waste and non-recyclable paper targeted by the City of Minneapolis for their curbside or drop-off organics recycling programs; not including yard wastes. Sometimes referred to as “Source separated organics” (SSO).
Other Recycling Materials
These are potentially recyclable materials not collected as part of the City’s curbside collection programs.
Other Divertible Materials
Other recoverable items collected by the City’s other separate collection programs such as mattresses and large item pickups (appliances, furniture, large scrap metal, etc.)
Other Waste Solid Waste that has no feasible recycling or diversion outlet now or in the foreseeable future.
Processing Residuals Rejected waste that is disposed and not recycled as an output from MRF processing operations. Processing residuals are affected by contaminants as collected, but are not synonymous. Processing residuals are also affected by MRF equipment, design and operation.
Project The full Minneapolis waste composition analysis and recycling program evaluation project for Hennepin County including both the MSW Consultants’ Sort Report and this Final Report.
Recyclables Traditional curbside materials (e.g., glass, paper, plastics, etc.) targeted by the City of Minneapolis for their curbside recycling program; not including organics or yard waste.
x
Recycling Separation, collection and processing of both traditional recyclables and organic recyclables. Also has the meaning prescribed in Minnesota statutes and in the Hennepin County Solid Waste Management Master Plan.
Recycling Rate The percentage of all residential solid waste generated that is ultimately diverted through processing of recyclable or compostable material
Residential Solid Waste
All mixed municipal solid waste generated from residents served by the City of Minneapolis solid waste system, including recyclables, organics, yard waste and large item/bulky waste.
Single-stream Recycling Collection
The City’s curbside collection and processing system for traditional recyclables whereby all targeted materials (paper, cans, glass, plastics, etc.) are sorted by residents and placed into the recycling cart. This excludes organics and yard waste by definition.
Sort Report The separate report by MSW Consultants (City of Minneapolis
Residential Waste Characterization Study and Recycling Analysis) prepared for Hennepin County (September 2, 2016) which documents all of the detailed technical findings, calculations, and statistical analyses of the waste composition sort.
Study This entire project, including both the Sort Report and this Final
Report.
Voucher Program City of Minneapolis program which provides eligible residents with “vouchers” to redeem at no additional cost for disposal or recycling of C&D materials and residential solid waste at the South Transfer Station.
Waste-to-Energy Resource recovery facilities that process and/or combust waste (e.g., MMSW) into a form of energy.
xi
2016 Final Report
Abbreviations/Acronyms
CDs Compact discs
C&D Construction & demolition
CRT Cathode ray tube
DU Dwelling unit. Generally equates to one household. Total dwelling units served includes all households citywide or in the Waste Load Area if included in the City’s residential solid waste and recycling program (regardless if the household set out materials on any given collection day).
Foth Foth Infrastructure & Environment, LLC
HERC Hennepin Energy Resource Center in Minneapolis
HDPE High-density polyethylene
HHW Household hazardous waste
ID Identification
lbs Pounds
lbs/DU/week Pounds per dwelling unit per week
MMSW Mixed municipal solid waste
MPCA Minnesota Pollution Control Agency
MRF Material recovery facility
MSW Consultants MidAtlantic Solid Waste Consultants
OCC Old corrugated cardboard
PET Polyethylene terephthalate
PP Polypropylene
SSO Source separated organics (as defined by the City of Minneapolis’ organics recycling program), including food waste and non-recyclable paper but not including yard waste. Also referred to as “Organics” or “Organic recycling materials”.
WLA Refers to the geographic collection areas of the truck loads sampled within this Study. The waste load area does not imply a reference to a Minneapolis Neighborhood.

Foth Infrastructure & Environment, LLC • 1
1 Introduction
1.1 Purpose of County Study
The State of Minnesota established a recycling rate goal of 75 percent by 2030 for Metropolitan Counties.1 Hennepin County (“County”) has expanded existing recycling programs and created new ones in partnerships with cities in an effort to make progress toward that goal. In 2015 the County’s total recycling rate was 44 percent and the residential recycling rate in the City of Minneapolis, the largest city in the County, was 36 percent. A successful recycling system depends on individuals changing their behaviors, collection of available recyclable materials, sorting in the MRF and healthy markets for materials. Efforts to increase recycling are challenged by current market trends, the “evolving ton” of residential recyclables, and hard-to-recycle items. As the County confronted these challenges, it sought to develop solutions via objective data and analyses obtained in a unique waste compostion study (waste sort). The goals of this Project differed from traditional waste composition studies in several ways. This Study:
♦ Focused on recyclability of materials, not only material type;
♦ Specifically addressed the 75 percent State recycling goal, including a technical analysis of the feasibility of the City of Minneapolis attaining this recycling rate in its residential curbside recycling programs;
♦ Looked at residential solid waste in a new way, by exploring the results in three neighborhoods with different characteristics in terms of waste generation, recycling performance and socioeconomic factors;
♦ Addressed the challenges of recycling more by exploring what is and isn’t currently recyclable, what markets and programs need to be developed to increase recycling, how many people can be expected to participate in recycling programs and how much will those people actually recycle or set out for collection; and,
♦ Documented what is in the trash through primary and secondary (“retail”) sort categories supported by photographs and accompanying notes.
This Study evaluated only the residential recycling program in Minneapolis and did not include commercial waste such as industrial, institutional or other business solid waste generation and recycling efforts. The County estimates that 45 percent of the total County solid waste stream comes from the residential waste component, and 55 percent of the waste is attributed to the commercial waste component. The 75 percent State recycling goal is generally applied to the total waste stream from both the residential and commercial sectors.
Foth Infrastructure & Environment, LLC • 2
1.2 Steps in the Study Design
1.2.1 Request for Proposals (RFP)
The County issued an RFP to pre-qualified consultants on February 16, 2016. The Scope of Work requested in the RFP included:
♦ Proposing and implementing methodologies that meet the goals of the Study. The methodologies used by the Consultant Team followed the County’s guidelines regarding sampling methodology from three distinct Waste Load Areas, waste sort design, material categories, secondary sort categories, and report deliverables;
♦ Sorting, and fully characterizing the waste including a secondary sort of materials which included sorting by material type into sub-categories (“retail” subcategories). The Sort
Report included detailed descriptive notes and photographs of the sort operations, findings, and any anomalies;
♦ Compiling the waste sample and sort data results using standard and commonly accepted statistical practices; and,
♦ Generating a Sort Report and this Final Report.
Foth Infrastructure & Environment, LLC (“Foth”); along with sub-consultants MSW Consultants, Louis Berger and Associates and GRG Analysis were successful in contracting with the County for the Study.
1.2.2 Waste Sort Design Plan
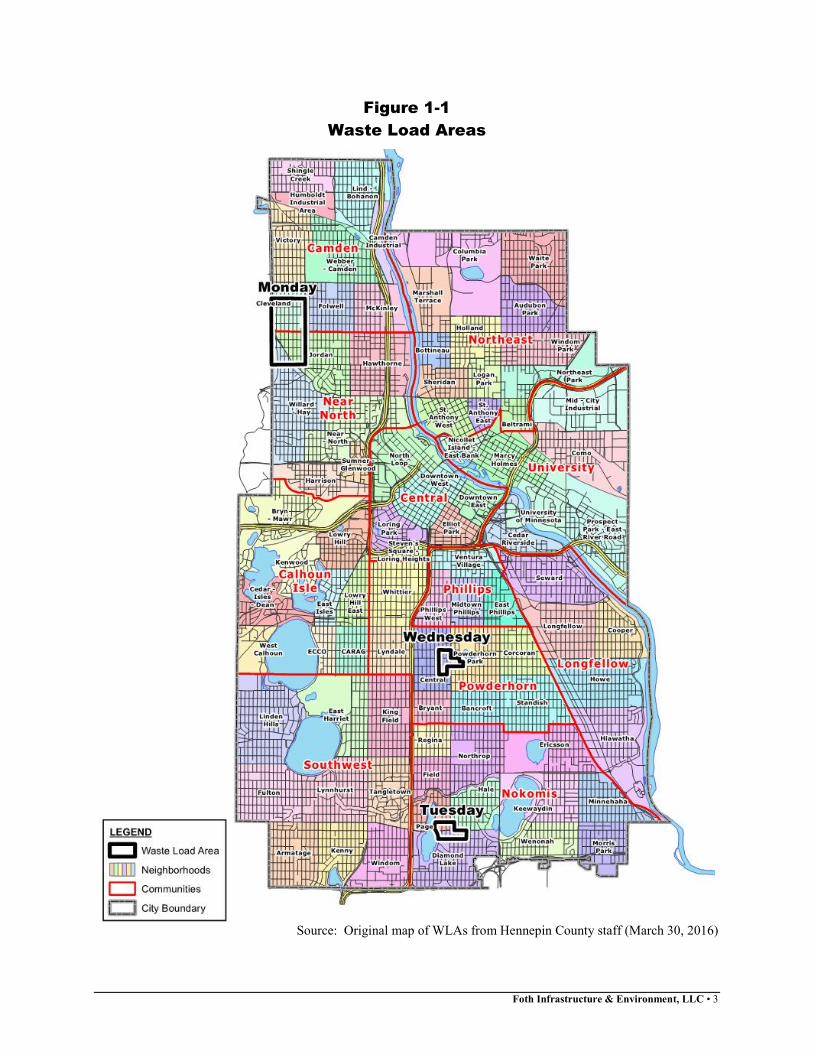
The waste sort took place at the Hennepin Energy Recovery Center (HERC), 505 6th Avenue North, Minneapolis, MN 55405 from May 8 through May 14, 2016. Three (3) loads of residential trash from Minneapolis single family dwellings, defined as having one (1) to four (4) units per building, were sorted. The three (3) loads of trash representing three (3) different Waste Load Areas (WLAs) of the City (see Figure 1-1) were selected by the County in consultation with the City. Each load represented approximately four hundred (400) households per load. A detailed description of the waste sort design and operations is found in Section 2, Study Design and Methodology, of the companion report, “City of Minneapolis Residential Waste
Characterization Study and Recycling Analysis” (“Sort Report”), by MSW Consultants produced for Hennepin County.
Foth Infrastructure & Environment, LLC • 3
Figure 1-1
Waste Load Areas
Source: Original map of WLAs from Hennepin County staff (March 30, 2016)
Foth Infrastructure & Environment, LLC • 4
1.2.3 Waste Sort Operations
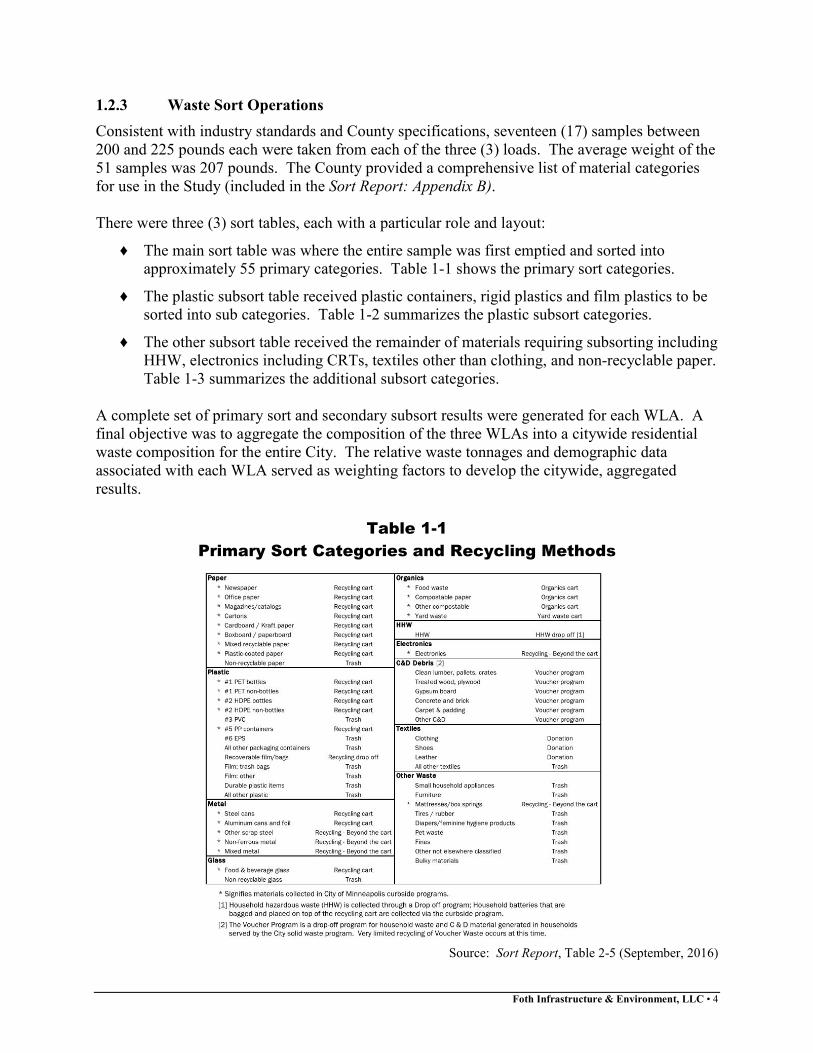
Consistent with industry standards and County specifications, seventeen (17) samples between 200 and 225 pounds each were taken from each of the three (3) loads. The average weight of the 51 samples was 207 pounds. The County provided a comprehensive list of material categories for use in the Study (included in the Sort Report: Appendix B). There were three (3) sort tables, each with a particular role and layout:
♦ The main sort table was where the entire sample was first emptied and sorted into approximately 55 primary categories. Table 1-1 shows the primary sort categories.
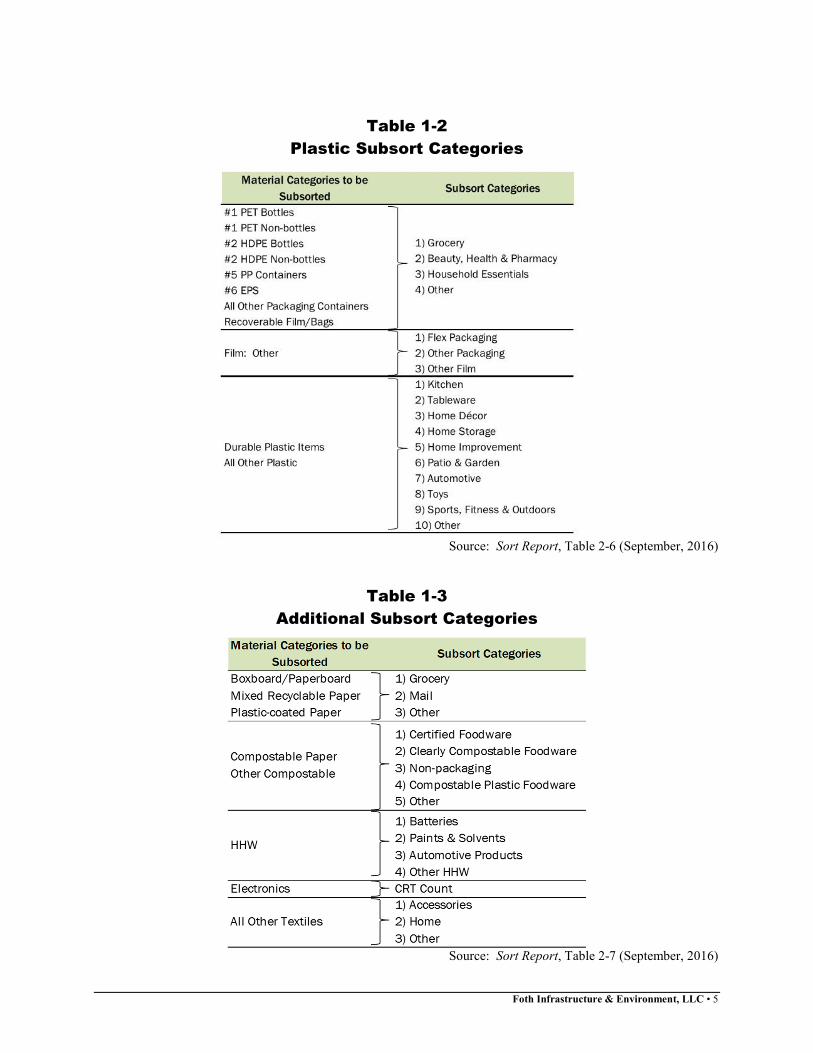
♦ The plastic subsort table received plastic containers, rigid plastics and film plastics to be sorted into sub categories. Table 1-2 summarizes the plastic subsort categories.
♦ The other subsort table received the remainder of materials requiring subsorting including HHW, electronics including CRTs, textiles other than clothing, and non-recyclable paper. Table 1-3 summarizes the additional subsort categories.
A complete set of primary sort and secondary subsort results were generated for each WLA. A final objective was to aggregate the composition of the three WLAs into a citywide residential waste composition for the entire City. The relative waste tonnages and demographic data associated with each WLA served as weighting factors to develop the citywide, aggregated results.
Table 1-1
Primary Sort Categories and Recycling Methods
Source: Sort Report, Table 2-5 (September, 2016)
Foth Infrastructure & Environment, LLC • 5
Table 1-2
Plastic Subsort Categories
Source: Sort Report, Table 2-6 (September, 2016)
Table 1-3
Additional Subsort Categories
Source: Sort Report, Table 2-7 (September, 2016)
Foth Infrastructure & Environment, LLC • 6
1.2.4 Sort Report by MSW Consultants
An overview and highlights of the waste sort results at the citywide level are contained in Section 2 of this Final Report. Section 3 of the Sort Report on “Waste Composition” also contains detailed information, with graphs and figures, of the characteristics of the waste from each Waste Load Area. Section 4 of the Sort Report, “Recycling Analysis,” contains the Minneapolis residential recycling rates and capture rates. Section 4 of the Sort Report also presents the “Maximum Theoretical Recycling Rate,” which assumes “perfect” capture of all possible recyclables and the “Maximum Achievable Recycling Rate,” which was determined by projecting aggressive capture rates by commodity. The “Maximum Theoretical Recycling Rate” assumes that every Minneapolis resident perfectly sorts their recyclables, yard waste, and compostable organics for collection. This “Maximum Theoretical Recycling Rate” also assumes that no recyclables are used to contain pet wastes or kitchen grease, for example and that every recyclable and compostable item is clean and free of contamination. The “Maximum Achievable Recycling Rate” assumes aggressive capture rates for each commodity that could realistically be achieved by 2030, given what we know today about waste generation, resident behaviors and recycling infrastructure. These capture rates were determined by County staff and the Consultant Team through an analysis of each commodity’s limitations. Current capture rates were used as the basis for future capture rates. This “Maximum Achievable Recycling Rate” also considered the maximum, realistic amount of recycling at drop-off centers for items not collected curbside. For example, it is assumed that film packaging (plastic grocery bags and other recyclable household film plastics) would continue to be returned to retail stores for recycling at increasing amounts each year through 2030. The “Maximum Achievable Recycling Rate” also recognizes the limitations of human recycling behaviors: perfect sorting of all recyclables, all the time, by all residents is not realistic. Finally, some commodities lack end markets and therefore may not be recycled even though they are targeted for collection by the City.
1.2.5 Remaining Sections of the Final Report
Section 2 of the Final Report presents highlights of the Sort Report, including selected graphs from the Sort Report showing citywide results. Section 3 of the Final Report describes the current recycling services available to Minneapolis residential customers. Sections 4, 5 and 6 of the Final Report present detailed analyses of the data from both the individual WLAs and citywide perspectives. Section 7 of the Final Report presents the Conclusions and Recommendations of the Study.
Foth Infrastructure & Environment, LLC • 7
2 Sort Report Highlights
This Report Section highlights data and conclusions found in the Sort Report by MSW Consultants where full data sets, tables and graphs can be found. Data specific to the Waste Load Areas is contained in the Sort Report and will be discussed later in Section 6 in this Final
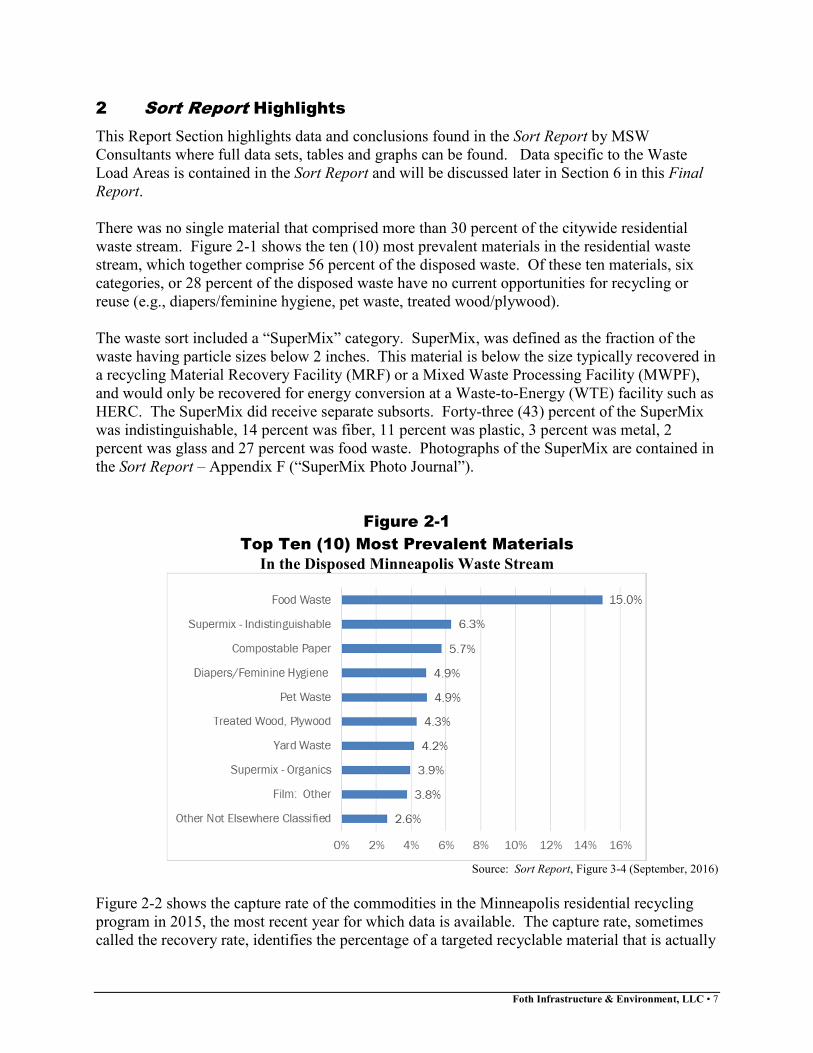
Report. There was no single material that comprised more than 30 percent of the citywide residential waste stream. Figure 2-1 shows the ten (10) most prevalent materials in the residential waste stream, which together comprise 56 percent of the disposed waste. Of these ten materials, six categories, or 28 percent of the disposed waste have no current opportunities for recycling or reuse (e.g., diapers/feminine hygiene, pet waste, treated wood/plywood). The waste sort included a “SuperMix” category. SuperMix, was defined as the fraction of the waste having particle sizes below 2 inches. This material is below the size typically recovered in a recycling Material Recovery Facility (MRF) or a Mixed Waste Processing Facility (MWPF), and would only be recovered for energy conversion at a Waste-to-Energy (WTE) facility such as HERC. The SuperMix did receive separate subsorts. Forty-three (43) percent of the SuperMix was indistinguishable, 14 percent was fiber, 11 percent was plastic, 3 percent was metal, 2 percent was glass and 27 percent was food waste. Photographs of the SuperMix are contained in the Sort Report – Appendix F (“SuperMix Photo Journal”).
Figure 2-1
Top Ten (10) Most Prevalent Materials
In the Disposed Minneapolis Waste Stream
Source: Sort Report, Figure 3-4 (September, 2016)
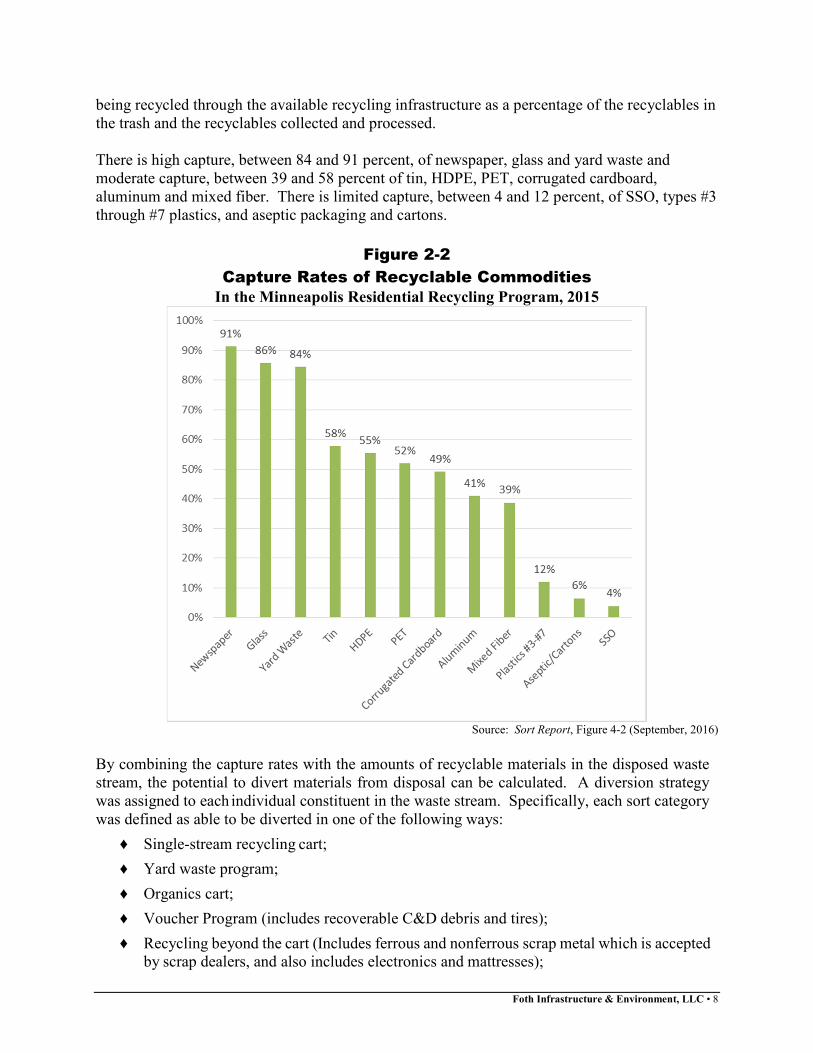
Figure 2-2 shows the capture rate of the commodities in the Minneapolis residential recycling program in 2015, the most recent year for which data is available. The capture rate, sometimes called the recovery rate, identifies the percentage of a targeted recyclable material that is actually
Foth Infrastructure & Environment, LLC • 8
being recycled through the available recycling infrastructure as a percentage of the recyclables in the trash and the recyclables collected and processed. There is high capture, between 84 and 91 percent, of newspaper, glass and yard waste and moderate capture, between 39 and 58 percent of tin, HDPE, PET, corrugated cardboard, aluminum and mixed fiber. There is limited capture, between 4 and 12 percent, of SSO, types #3 through #7 plastics, and aseptic packaging and cartons.
Figure 2-2
Capture Rates of Recyclable Commodities
In the Minneapolis Residential Recycling Program, 2015
Source: Sort Report, Figure 4-2 (September, 2016)
By combining the capture rates with the amounts of recyclable materials in the disposed waste stream, the potential to divert materials from disposal can be calculated. A diversion strategy was assigned to each individual constituent in the waste stream. Specifically, each sort category was defined as able to be diverted in one of the following ways:
♦ Single-stream recycling cart;
♦ Yard waste program;
♦ Organics cart;
♦ Voucher Program (includes recoverable C&D debris and tires);
♦ Recycling beyond the cart (Includes ferrous and nonferrous scrap metal which is accepted by scrap dealers, and also includes electronics and mattresses);
Foth Infrastructure & Environment, LLC • 9
♦ Recycling drop-off centers (Includes clean plastic film bags);
♦ Donation options (includes clothing, shoes, leathers and textiles); and
♦ Disposal (trash).
A primary objective of the Study was to determine the maximum achievable amount of recycling for the Minneapolis residential waste stream. The recycling rate is the percentage of all waste generated that is diverted through recycling. The City’s 2015 residential recycling rate calculated in the Sort Report was 36.0 percent.
Even if residents practice “perfect” recycling using available programs, about 25 percent of the waste stream has no diversion options and would continue to be disposed as trash. There are no recycling or compost markets in the foreseeable future for wastes such as diapers, feminine hygiene and sexual safety products, contaminated film plastics, heavily coated papers, pet wastes, multi-layer items (e.g., metal bonded to plastic) and a variety of other materials identified in the waste sort.
The Sort Report concludes that it is unlikely that the City can achieve a residential recycling rate in excess of 52 percent even with aggressive capture rate assumptions. Given technical constraints associated with the maximum theoretical recycling rate, a 75 percent goal seems unlikely in the foreseeable future even with the potential of significant new recovery technologies and development of associated markets.
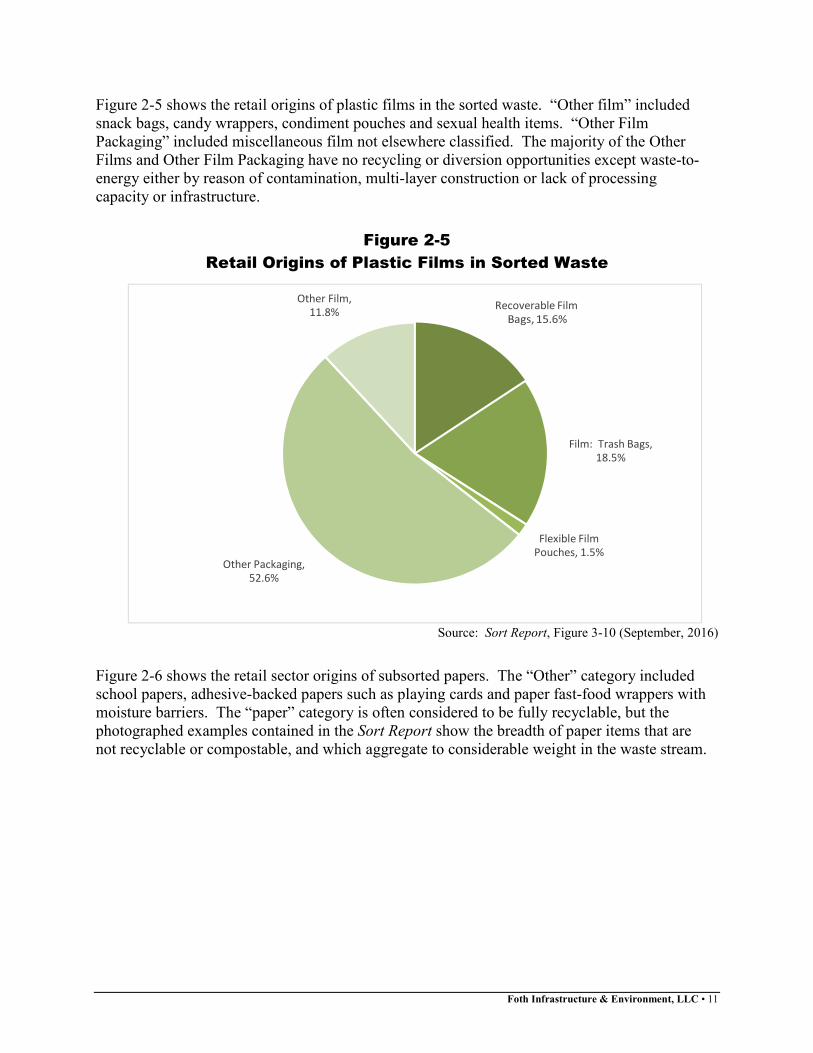
The Study was unique in that the retail origin of various commodities in the residential waste stream was evaluated. Beyond the sorting of materials into the various primary waste or recycling categories, several materials were subsorted into four retail types. These retail types reflect “how” the various items came into residences. Figure 2-3 shows the retail categories of origin for plastic containers. The vast majority of plastic containers of several resin types were associated with grocery purchases. Figure 2-4 shows the retail origins of the non-container rigid plastics. Examples of “other” non-container rigid plastics, the most common category, include CDs and their cases or “jump drives” for computers.
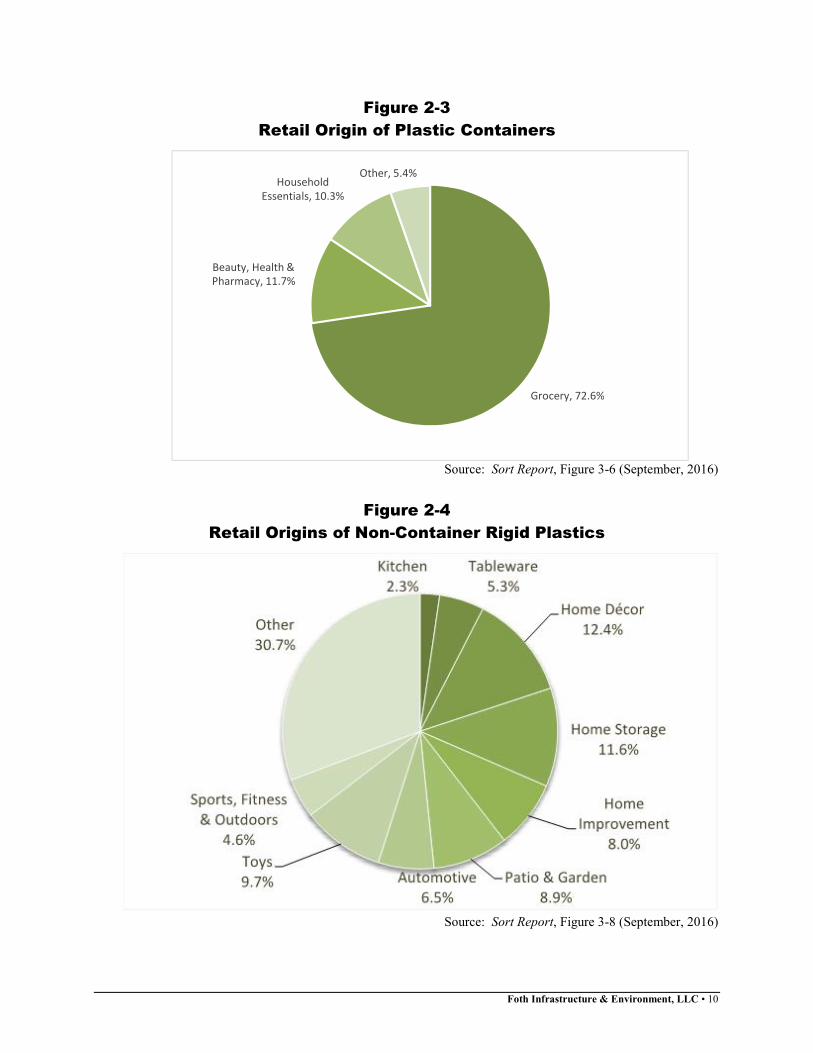
Foth Infrastructure & Environment, LLC • 10
Figure 2-3
Retail Origin of Plastic Containers
Source: Sort Report, Figure 3-6 (September, 2016)
Figure 2-4
Retail Origins of Non-Container Rigid Plastics
Source: Sort Report, Figure 3-8 (September, 2016)
Household
Essentials, 10.3%
Other, 5.4%
Beauty, Health &
Pharmacy, 11.7%
Grocery, 72.6%
Foth Infrastructure & Environment, LLC • 11
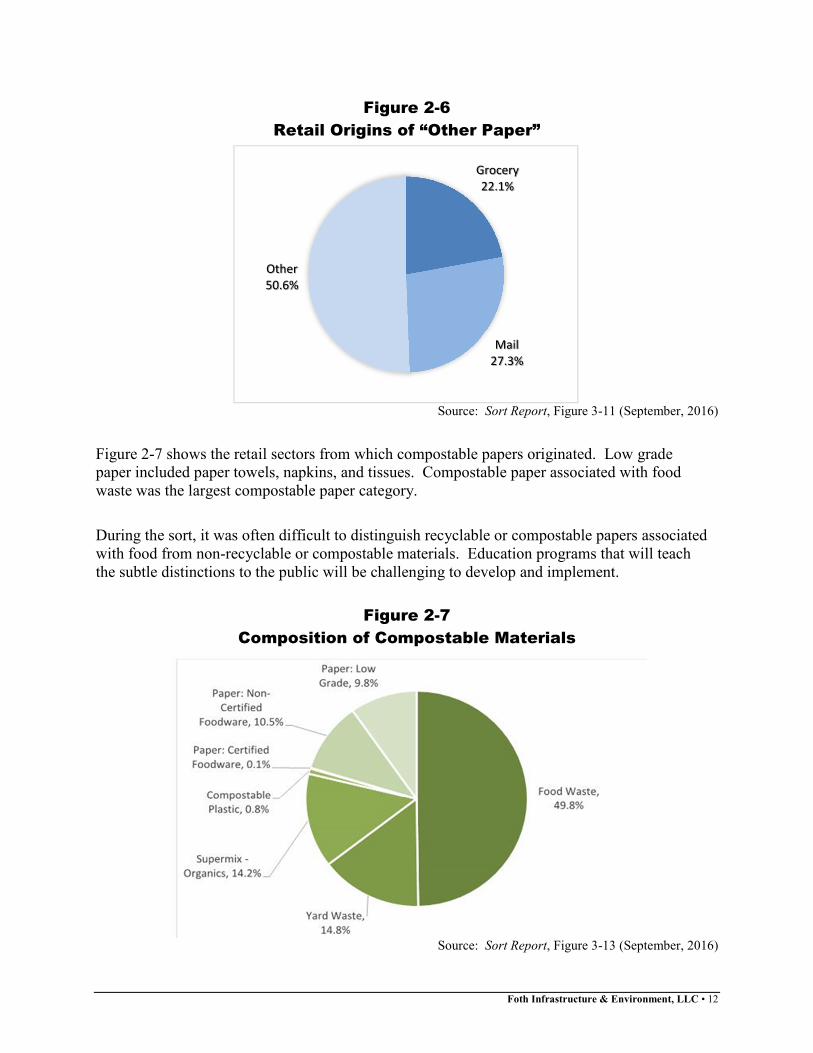
Figure 2-5 shows the retail origins of plastic films in the sorted waste. “Other film” included snack bags, candy wrappers, condiment pouches and sexual health items. “Other Film Packaging” included miscellaneous film not elsewhere classified. The majority of the Other Films and Other Film Packaging have no recycling or diversion opportunities except waste-to-energy either by reason of contamination, multi-layer construction or lack of processing capacity or infrastructure.
Figure 2-5
Retail Origins of Plastic Films in Sorted Waste
Source: Sort Report, Figure 3-10 (September, 2016)
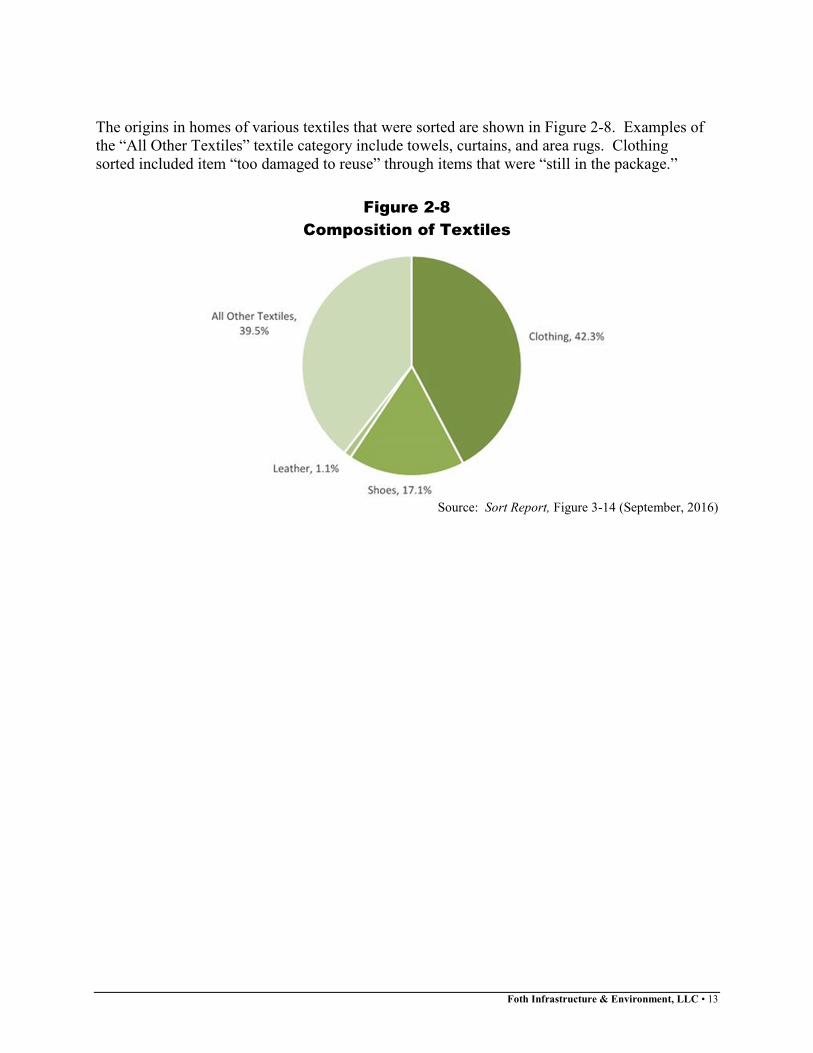
Figure 2-6 shows the retail sector origins of subsorted papers. The “Other” category included school papers, adhesive-backed papers such as playing cards and paper fast-food wrappers with moisture barriers. The “paper” category is often considered to be fully recyclable, but the photographed examples contained in the Sort Report show the breadth of paper items that are not recyclable or compostable, and which aggregate to considerable weight in the waste stream.
Other Film,
11.8% Recoverable Film
Film: Trash Bags,
18.5%
Other Packaging,
52.6%
Flexible Film
Pouches, 1.5%
Foth Infrastructure & Environment, LLC • 12
Figure 2-6
Retail Origins of “Other Paper”
Source: Sort Report, Figure 3-11 (September, 2016)
Figure 2-7 shows the retail sectors from which compostable papers originated. Low grade paper included paper towels, napkins, and tissues. Compostable paper associated with food waste was the largest compostable paper category.
During the sort, it was often difficult to distinguish recyclable or compostable papers associated with food from non-recyclable or compostable materials. Education programs that will teach the subtle distinctions to the public will be challenging to develop and implement.
Figure 2-7
Composition of Compostable Materials
Source: Sort Report, Figure 3-13 (September, 2016)
Grocery
22.1%
27.3%
Other
50.6%
Foth Infrastructure & Environment, LLC • 13
The origins in homes of various textiles that were sorted are shown in Figure 2-8. Examples of the “All Other Textiles” textile category include towels, curtains, and area rugs. Clothing sorted included item “too damaged to reuse” through items that were “still in the package.”
Figure 2-8
Composition of Textiles
Source: Sort Report, Figure 3-14 (September, 2016)
Foth Infrastructure & Environment, LLC • 14
3 Description of Recycling Services Available
The City of Minneapolis has a mature curbside recycling program. The first curbside recycling collection began in 1982, and the program has been continuously expanded and improved by increasing the frequency of collection and the materials accepted. Yard waste collection and composting began in 1988, appliance and large item collection and recycling began in 1990, and collection and recycling of computers and other electronic items began in 1997. Variable rate billing, a “pay as you throw” variation, began in 1995 to encourage diversion of materials from the waste stream. A pilot program with Hennepin County for collection of organic materials (organics) from schools was begun in 2003, and pilot programs for residential collection of organics in the City began in 2007. Single stream recycling began in 2012 and a city-wide roll-out of residential organics collection was completed in 20162. The “traditional” recyclables collected in the biweekly single-stream curbside program include3:
♦ Newspapers;
♦ Metal cans, cardboard cans;
♦ Glass bottles, jars, jugs, cups and containers;
♦ Clear packaging from toys and electronics;
♦ Plastic bottles;
♦ Magazines;
♦ Household batteries;
♦ Phone books;
♦ Office paper;
♦ Dry-food boxboard; and,
♦ Corrugated cardboard. According to the City’s Solid Waste & Recycling program web page, approximately 90% of the households served by the Minneapolis single-stream recycling collection services participate in the curbside recycling program.4 Residents are also encouraged to drop off plastic bags at retail locations and donate usable goods to friends or charitable organizations. Residential organics recycling includes the collection of fruits, vegetables, bones, meat, breads, eggshells, non-recyclable and food-soiled paper, and more for composting. Although there is no additional charge to participate, residents must sign up for the program. Participants receive a separate cart for weekly collection of organics. Approximately 37 percent of the City’s residents have signed up for the program as of July 2016.5 Yard wastes are not allowed in the organics cart, and are collected for recycling/composting weekly, April through November. Beginning with the 2012 yard waste season, Minneapolis banned the collection of plastic yard waste bags and residents set out yard wastes in compostable plastic bags, Kraft paper bags, or reusable containers. Brush, including small branches that are less than 3 inches in diameter and less than 3 feet long are collected with the yard waste. There
Foth Infrastructure & Environment, LLC • 15
is no additional charge for yard waste collection. The City has arranged for distribution of finished compost from the yard waste collection program to the many community gardens in the City. Backyard composting and “grass-cycling” (use of mulching mowers to leave grass clippings on the lawn as a soil amendment) are also encouraged by the City.6 As part of the residential solid waste program, non-burnable, recyclable items (e.g., major appliances, items that are more than 50% metal, computers and televisions, lawn furniture and mowers, and hide-a-beds and mattresses) are collected biweekly on the next business day after recycling pickup. Hazardous materials (e.g., capacitors and resistors, motor fluids) are removed and properly disposed and the metals are recycled. There is no additional charge for this service.7 The City offers a Voucher Program to residential customers. Six (6) cleanup vouchers per year for disposal of excess garbage, appliances, or construction and demolition debris and two (2) tire vouchers per year for tire disposal of up to eight (8) tires per voucher are available at no additional charge. Voucher material must be taken to the South Transfer Station. Appliances and tires are recycled. Concrete and rock are taken to the City’s crushing facility for use as recycled aggregate in road construction projects.8 The City encourages Away From Home recycling by providing traditional recycling and organics containers to organizers of events and residents. The City has assisted activities such as the Basilica Block Party and the Aquatennial to be “zero waste” events since 2008 and residents often obtain containers to make graduation parties and weddings zero waste celebrations. The City includes processing, delivery and pick-up in the container rental fees.9
Foth Infrastructure & Environment, LLC • 16
4 Analysis of Recycling Performance by Waste Load Area and
Citywide
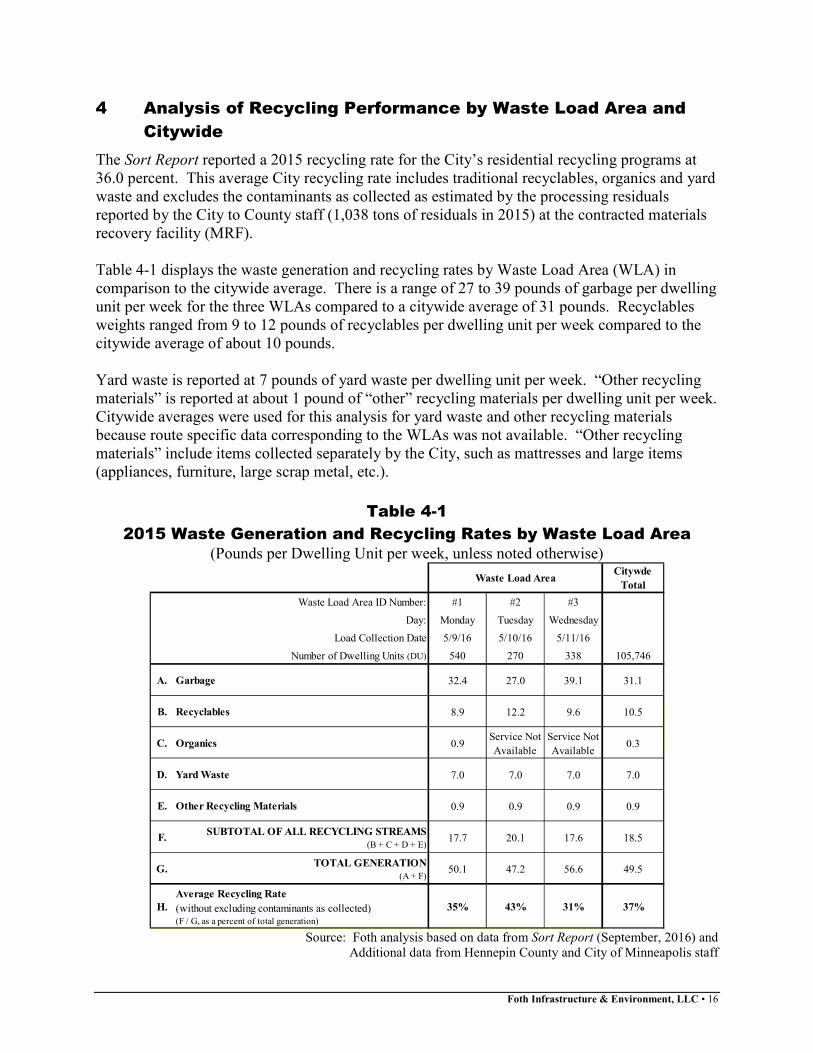
The Sort Report reported a 2015 recycling rate for the City’s residential recycling programs at 36.0 percent. This average City recycling rate includes traditional recyclables, organics and yard waste and excludes the contaminants as collected as estimated by the processing residuals reported by the City to County staff (1,038 tons of residuals in 2015) at the contracted materials recovery facility (MRF). Table 4-1 displays the waste generation and recycling rates by Waste Load Area (WLA) in comparison to the citywide average. There is a range of 27 to 39 pounds of garbage per dwelling unit per week for the three WLAs compared to a citywide average of 31 pounds. Recyclables weights ranged from 9 to 12 pounds of recyclables per dwelling unit per week compared to the citywide average of about 10 pounds. Yard waste is reported at 7 pounds of yard waste per dwelling unit per week. “Other recycling materials” is reported at about 1 pound of “other” recycling materials per dwelling unit per week. Citywide averages were used for this analysis for yard waste and other recycling materials because route specific data corresponding to the WLAs was not available. “Other recycling materials” include items collected separately by the City, such as mattresses and large items (appliances, furniture, large scrap metal, etc.).
Table 4-1
2015 Waste Generation and Recycling Rates by Waste Load Area
(Pounds per Dwelling Unit per week, unless noted otherwise)
Source: Foth analysis based on data from Sort Report (September, 2016) and
Additional data from Hennepin County and City of Minneapolis staff
Citywde
Total
Waste Load Area ID Number: #1 #2 #3
Day: Monday Tuesday Wednesday
Load Collection Date 5/9/16 5/10/16 5/11/16
Number of Dwelling Units (DU) 540 270 338 105,746
A. Garbage 32.4 27.0 39.1 31.1
B. Recyclables 8.9 12.2 9.6 10.5
C. Organics 0.9Service Not
Available
Service Not
Available0.3
D. Yard Waste 7.0 7.0 7.0 7.0
E. Other Recycling Materials 0.9 0.9 0.9 0.9
F.SUBTOTAL OF ALL RECYCLING STREAMS
(B + C + D + E)17.7 20.1 17.6 18.5
G.TOTAL GENERATION
(A + F)50.1 47.2 56.6 49.5
H.
Average Recycling Rate
(without excluding contaminants as collected) (F / G, as a percent of total generation)
35% 43% 31% 37%
Waste Load Area
Foth Infrastructure & Environment, LLC • 17
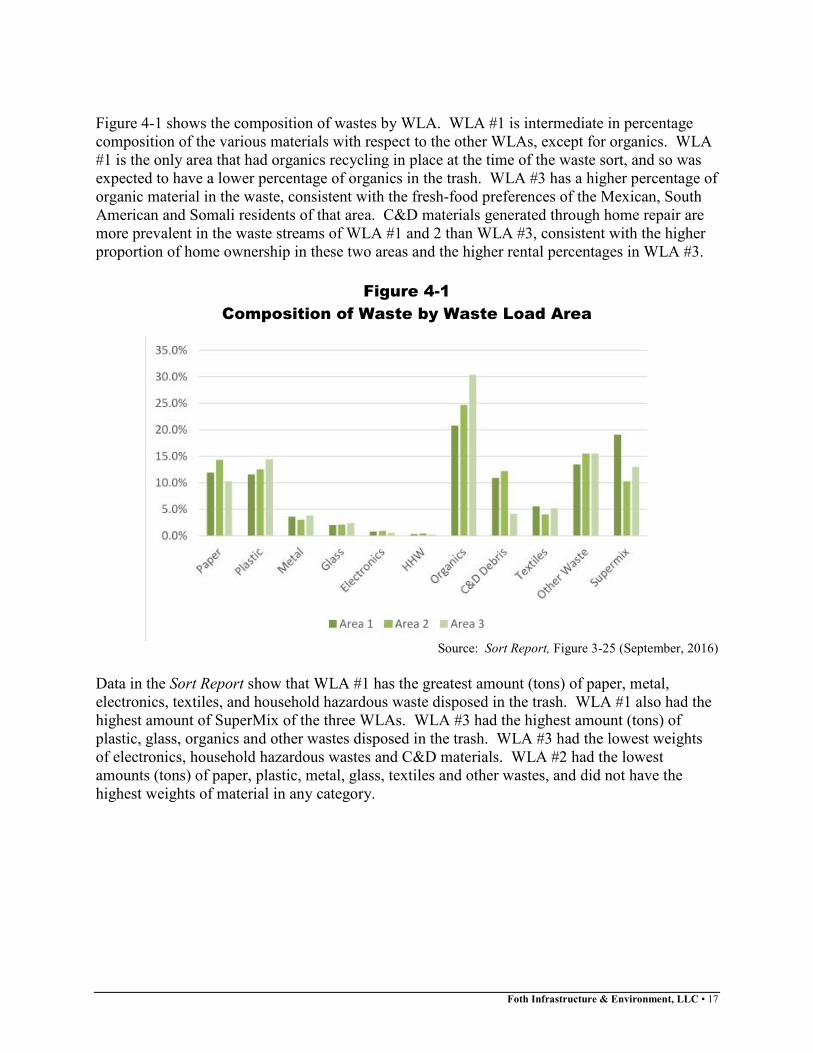
Figure 4-1 shows the composition of wastes by WLA. WLA #1 is intermediate in percentage composition of the various materials with respect to the other WLAs, except for organics. WLA #1 is the only area that had organics recycling in place at the time of the waste sort, and so was expected to have a lower percentage of organics in the trash. WLA #3 has a higher percentage of organic material in the waste, consistent with the fresh-food preferences of the Mexican, South American and Somali residents of that area. C&D materials generated through home repair are more prevalent in the waste streams of WLA #1 and 2 than WLA #3, consistent with the higher proportion of home ownership in these two areas and the higher rental percentages in WLA #3.
Figure 4-1
Composition of Waste by Waste Load Area
Source: Sort Report, Figure 3-25 (September, 2016)
Data in the Sort Report show that WLA #1 has the greatest amount (tons) of paper, metal, electronics, textiles, and household hazardous waste disposed in the trash. WLA #1 also had the highest amount of SuperMix of the three WLAs. WLA #3 had the highest amount (tons) of plastic, glass, organics and other wastes disposed in the trash. WLA #3 had the lowest weights of electronics, household hazardous wastes and C&D materials. WLA #2 had the lowest amounts (tons) of paper, plastic, metal, glass, textiles and other wastes, and did not have the highest weights of material in any category.
Foth Infrastructure & Environment, LLC • 18
Figure 4-2
Recycling and Other Diversion Options
Source: Sort Report, Figure 3-5 (September, 2016)
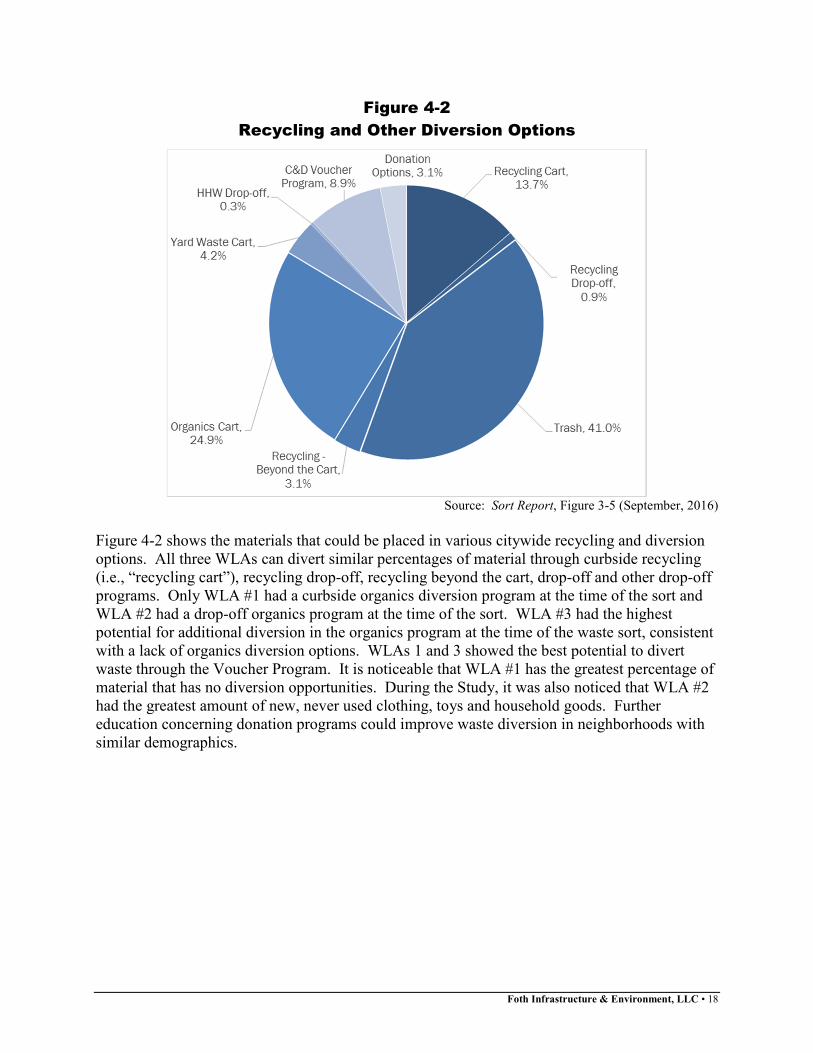
Figure 4-2 shows the materials that could be placed in various citywide recycling and diversion options. All three WLAs can divert similar percentages of material through curbside recycling (i.e., “recycling cart”), recycling drop-off, recycling beyond the cart, drop-off and other drop-off programs. Only WLA #1 had a curbside organics diversion program at the time of the sort and WLA #2 had a drop-off organics program at the time of the sort. WLA #3 had the highest potential for additional diversion in the organics program at the time of the waste sort, consistent with a lack of organics diversion options. WLAs 1 and 3 showed the best potential to divert waste through the Voucher Program. It is noticeable that WLA #1 has the greatest percentage of material that has no diversion opportunities. During the Study, it was also noticed that WLA #2 had the greatest amount of new, never used clothing, toys and household goods. Further education concerning donation programs could improve waste diversion in neighborhoods with similar demographics.
Foth Infrastructure & Environment, LLC • 19
5 Analysis of Demographic / Socioeconomic Factors Affecting
Recycling Participation
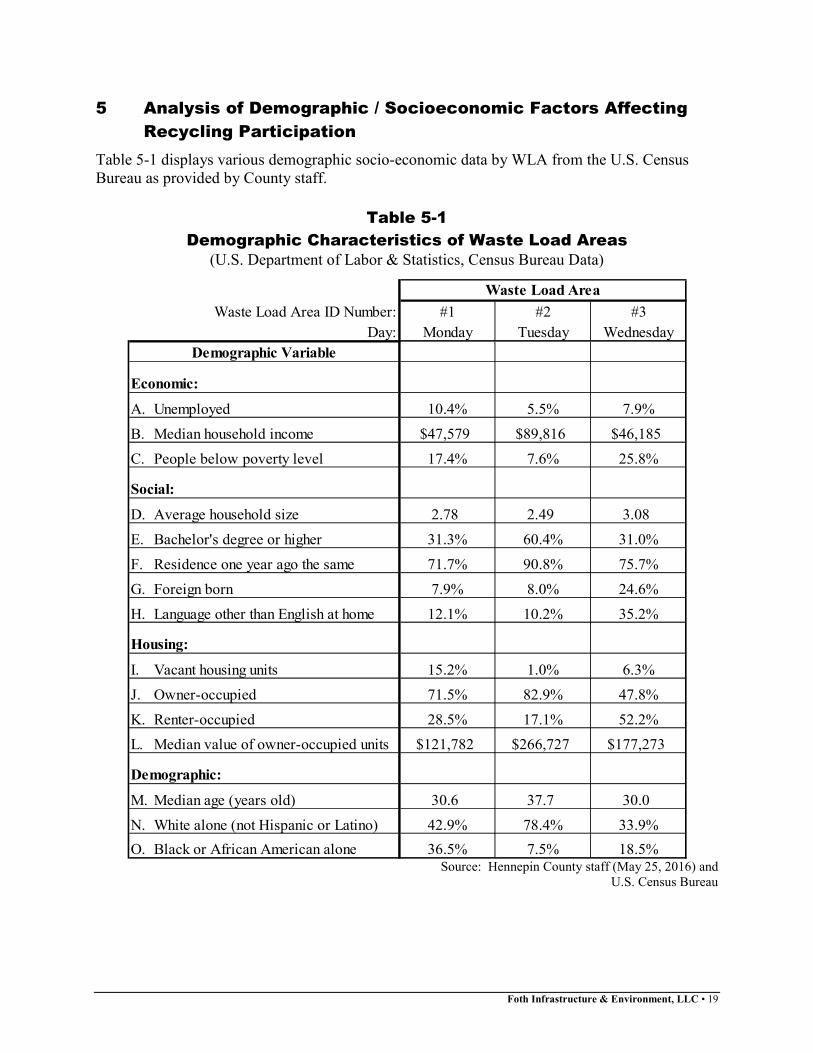
Table 5-1 displays various demographic socio-economic data by WLA from the U.S. Census Bureau as provided by County staff.
Table 5-1
Demographic Characteristics of Waste Load Areas
(U.S. Department of Labor & Statistics, Census Bureau Data)
Source: Hennepin County staff (May 25, 2016) and U.S. Census Bureau
Waste Load Area ID Number: #1 #2 #3
Day: Monday Tuesday Wednesday
Economic:
A. Unemployed 10.4% 5.5% 7.9%
B. Median household income $47,579 $89,816 $46,185
C. People below poverty level 17.4% 7.6% 25.8%
Social:
D. Average household size 2.78 2.49 3.08
E. Bachelor's degree or higher 31.3% 60.4% 31.0%
F. Residence one year ago the same 71.7% 90.8% 75.7%
G. Foreign born 7.9% 8.0% 24.6%
H. Language other than English at home 12.1% 10.2% 35.2%
Housing:
I. Vacant housing units 15.2% 1.0% 6.3%
J. Owner-occupied 71.5% 82.9% 47.8%
K. Renter-occupied 28.5% 17.1% 52.2%
L. Median value of owner-occupied units $121,782 $266,727 $177,273
Demographic:
M. Median age (years old) 30.6 37.7 30.0
N. White alone (not Hispanic or Latino) 42.9% 78.4% 33.9%
O. Black or African American alone 36.5% 7.5% 18.5%
Waste Load Area
Demographic Variable
Foth Infrastructure & Environment, LLC • 20
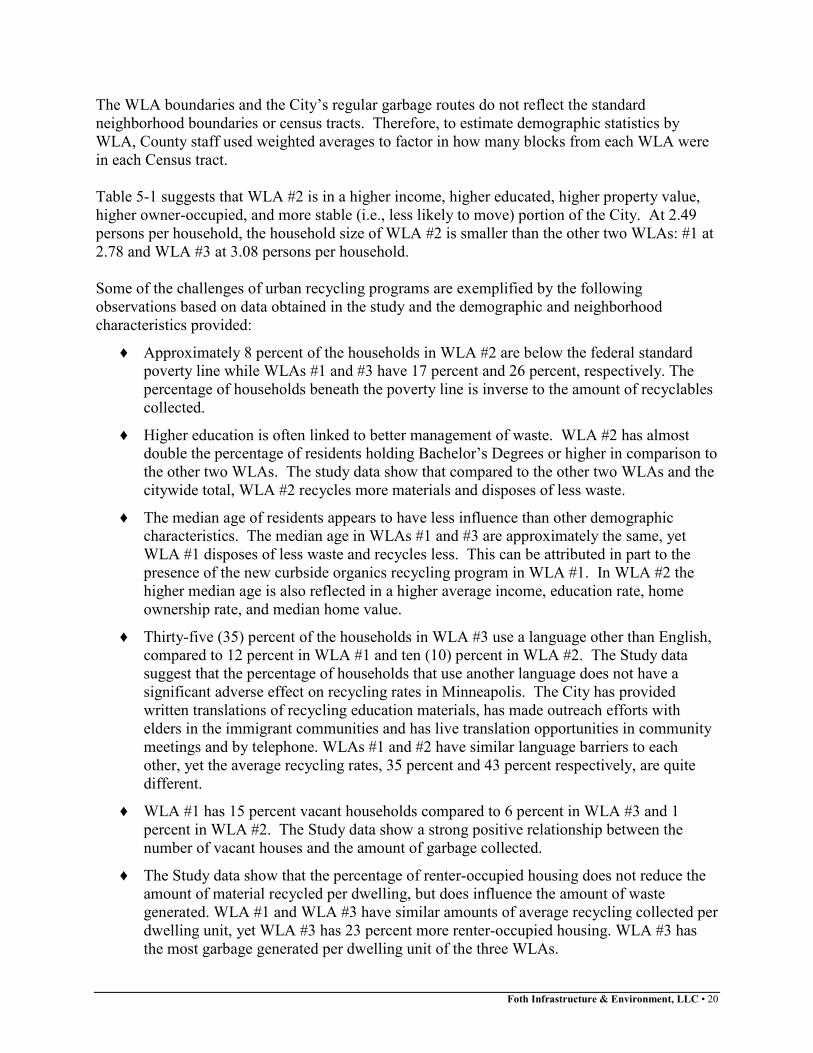
The WLA boundaries and the City’s regular garbage routes do not reflect the standard neighborhood boundaries or census tracts. Therefore, to estimate demographic statistics by WLA, County staff used weighted averages to factor in how many blocks from each WLA were in each Census tract. Table 5-1 suggests that WLA #2 is in a higher income, higher educated, higher property value, higher owner-occupied, and more stable (i.e., less likely to move) portion of the City. At 2.49 persons per household, the household size of WLA #2 is smaller than the other two WLAs: #1 at 2.78 and WLA #3 at 3.08 persons per household. Some of the challenges of urban recycling programs are exemplified by the following observations based on data obtained in the study and the demographic and neighborhood characteristics provided:
♦ Approximately 8 percent of the households in WLA #2 are below the federal standard poverty line while WLAs #1 and #3 have 17 percent and 26 percent, respectively. The percentage of households beneath the poverty line is inverse to the amount of recyclables collected.
♦ Higher education is often linked to better management of waste. WLA #2 has almost double the percentage of residents holding Bachelor’s Degrees or higher in comparison to the other two WLAs. The study data show that compared to the other two WLAs and the citywide total, WLA #2 recycles more materials and disposes of less waste.
♦ The median age of residents appears to have less influence than other demographic characteristics. The median age in WLAs #1 and #3 are approximately the same, yet WLA #1 disposes of less waste and recycles less. This can be attributed in part to the presence of the new curbside organics recycling program in WLA #1. In WLA #2 the higher median age is also reflected in a higher average income, education rate, home ownership rate, and median home value.
♦ Thirty-five (35) percent of the households in WLA #3 use a language other than English, compared to 12 percent in WLA #1 and ten (10) percent in WLA #2. The Study data suggest that the percentage of households that use another language does not have a significant adverse effect on recycling rates in Minneapolis. The City has provided written translations of recycling education materials, has made outreach efforts with elders in the immigrant communities and has live translation opportunities in community meetings and by telephone. WLAs #1 and #2 have similar language barriers to each other, yet the average recycling rates, 35 percent and 43 percent respectively, are quite different.
♦ WLA #1 has 15 percent vacant households compared to 6 percent in WLA #3 and 1 percent in WLA #2. The Study data show a strong positive relationship between the number of vacant houses and the amount of garbage collected.
♦ The Study data show that the percentage of renter-occupied housing does not reduce the amount of material recycled per dwelling, but does influence the amount of waste generated. WLA #1 and WLA #3 have similar amounts of average recycling collected per dwelling unit, yet WLA #3 has 23 percent more renter-occupied housing. WLA #3 has the most garbage generated per dwelling unit of the three WLAs.
Foth Infrastructure & Environment, LLC • 21
6 Feasibility of Minneapolis Residential Recycling Programs
Meeting a 75 Percent Recycling Rate
6.1 State and County Recycling Rate Goals
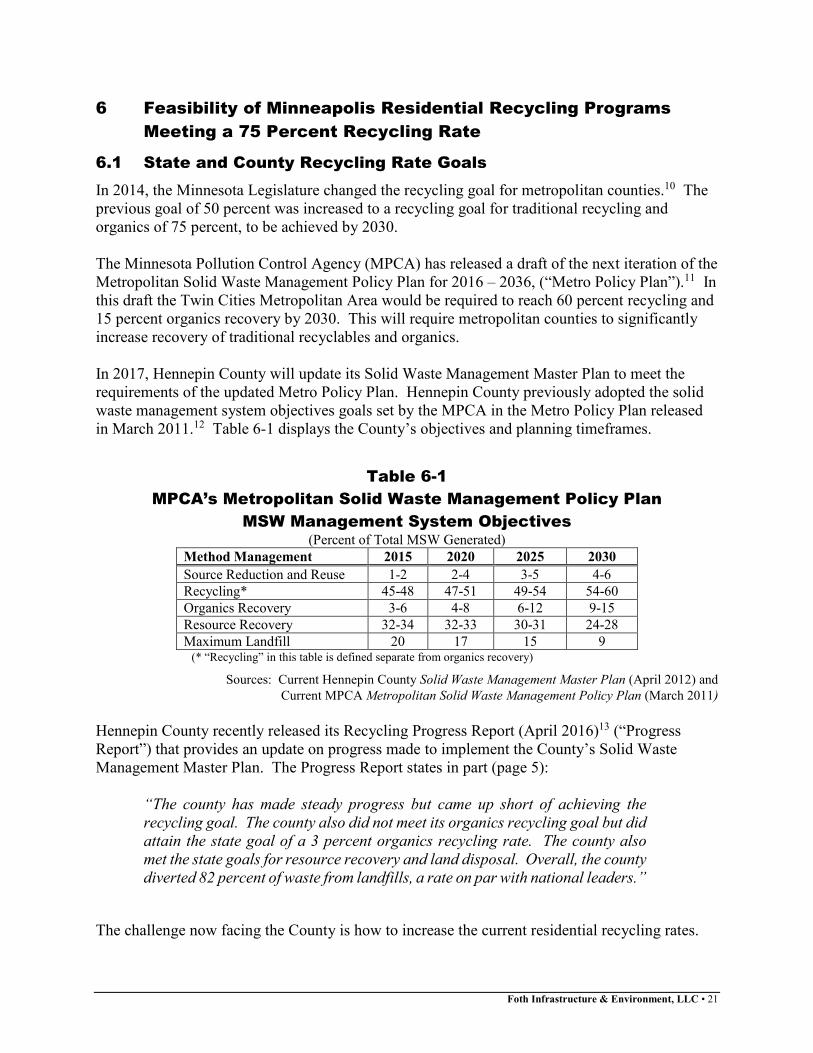
In 2014, the Minnesota Legislature changed the recycling goal for metropolitan counties.10 The previous goal of 50 percent was increased to a recycling goal for traditional recycling and organics of 75 percent, to be achieved by 2030. The Minnesota Pollution Control Agency (MPCA) has released a draft of the next iteration of the Metropolitan Solid Waste Management Policy Plan for 2016 – 2036, (“Metro Policy Plan”).11 In this draft the Twin Cities Metropolitan Area would be required to reach 60 percent recycling and 15 percent organics recovery by 2030. This will require metropolitan counties to significantly increase recovery of traditional recyclables and organics. In 2017, Hennepin County will update its Solid Waste Management Master Plan to meet the requirements of the updated Metro Policy Plan. Hennepin County previously adopted the solid waste management system objectives goals set by the MPCA in the Metro Policy Plan released in March 2011.12 Table 6-1 displays the County’s objectives and planning timeframes.
Table 6-1
MPCA’s Metropolitan Solid Waste Management Policy Plan
MSW Management System Objectives (Percent of Total MSW Generated)
Method Management 2015 2020 2025 2030
Source Reduction and Reuse 1-2 2-4 3-5 4-6
Recycling* 45-48 47-51 49-54 54-60
Organics Recovery 3-6 4-8 6-12 9-15
Resource Recovery 32-34 32-33 30-31 24-28
Maximum Landfill 20 17 15 9 (* “Recycling” in this table is defined separate from organics recovery)
Sources: Current Hennepin County Solid Waste Management Master Plan (April 2012) and
Current MPCA Metropolitan Solid Waste Management Policy Plan (March 2011)
Hennepin County recently released its Recycling Progress Report (April 2016)13 (“Progress Report”) that provides an update on progress made to implement the County’s Solid Waste Management Master Plan. The Progress Report states in part (page 5):
“The county has made steady progress but came up short of achieving the
recycling goal. The county also did not meet its organics recycling goal but did
attain the state goal of a 3 percent organics recycling rate. The county also
met the state goals for resource recovery and land disposal. Overall, the county
diverted 82 percent of waste from landfills, a rate on par with national leaders.”
The challenge now facing the County is how to increase the current residential recycling rates.
Foth Infrastructure & Environment, LLC • 22
6.2 The “Evolving Ton” of Residential Recyclables
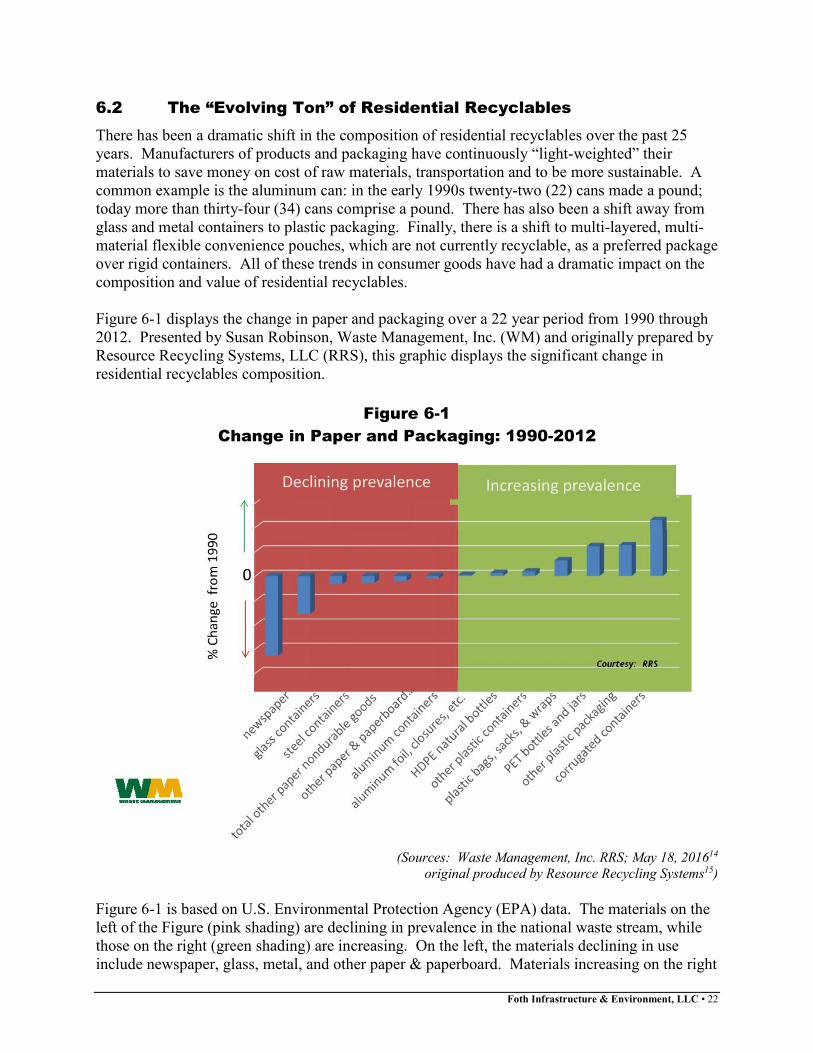
There has been a dramatic shift in the composition of residential recyclables over the past 25 years. Manufacturers of products and packaging have continuously “light-weighted” their materials to save money on cost of raw materials, transportation and to be more sustainable. A common example is the aluminum can: in the early 1990s twenty-two (22) cans made a pound; today more than thirty-four (34) cans comprise a pound. There has also been a shift away from glass and metal containers to plastic packaging. Finally, there is a shift to multi-layered, multi-material flexible convenience pouches, which are not currently recyclable, as a preferred package over rigid containers. All of these trends in consumer goods have had a dramatic impact on the composition and value of residential recyclables. Figure 6-1 displays the change in paper and packaging over a 22 year period from 1990 through 2012. Presented by Susan Robinson, Waste Management, Inc. (WM) and originally prepared by Resource Recycling Systems, LLC (RRS), this graphic displays the significant change in residential recyclables composition.
Figure 6-1
Change in Paper and Packaging: 1990-2012
(Sources: Waste Management, Inc. RRS; May 18, 201614
original produced by Resource Recycling Systems15)
Figure 6-1 is based on U.S. Environmental Protection Agency (EPA) data. The materials on the left of the Figure (pink shading) are declining in prevalence in the national waste stream, while those on the right (green shading) are increasing. On the left, the materials declining in use include newspaper, glass, metal, and other paper & paperboard. Materials increasing on the right
Foth Infrastructure & Environment, LLC • 23
include plastic packaging types that have been light-weighted, except for old corrugated cardboard containers (OCC). OCC has been increasing significantly in part due to the “Amazon Effect” of increased on-line ordering and direct delivery instead of brick and mortar shopping. Susan Robinson also presented information on the level of contaminants in the recycling stream as collected.16 She stated that the WM MRF in Minneapolis, which processes material from a wide geographic area, has less processing residuals compared to WM’s national average of all of their MRFs. The quality of recyclables as collected is very important to minimize generation of processing residuals waste at MRFs. Through enhanced public education, cities can help their MRF contractors better manage contaminants as collected in the recycling stream. In order to sustain residential recycling programs in the long term, it is important for recycling professionals to better understand the types and amounts of contaminants collected in the recycling streams, both traditional recyclables and compostable materials. Hennepin County could continue to provide technical assistance to its cities that require composition studies as part of their revenue sharing contract provisions, including measurement of contaminants as collected. Use of recyclables and MMSW composition studies, including estimates of commodity-by-commodity capture rates, could be considered as an additional method of measuring recycling program performance into the future. This type of in-depth and accurate data will better inform county and municipal staff in developing plans for recycling system improvements.
6.3 Minneapolis Recycling Rates
A primary objective of the Study was to determine the maximum achievable recycling rate within the Minneapolis residential waste stream. This section provides an evaluation of the State’s 75 percent recycling goal with respect to residential recycling rates in Minneapolis and the feasibility of the City achieving a 75 percent residential recycling rate. The Sort Report
presented the results of the estimated recycling rates calculated for the City of Minneapolis under three scenarios:
1. “Current” recycling rate in 2015 = 36.0 percent of total residential solid waste generated (Table 4-1 from the Sort Report).
2. “Maximum theoretical” recycling rate = 75.2 percent of residential MSW if all of the following materials achieve a 100 percent capture rate: recyclables, organics, yard waste, scrap metal and appliances, electronics, mattresses, C&D, and textiles (Table 4-2 from the Sort Report).
3. “Maximum achievable” recycling rate = 51.3 percent with aggressive capture rates for each commodity textiles (Table 4-3 from the Sort Report).
6.4 2015 Recycling Rate and Capture Rate
The Sort Report documents the City’s 2015 residential recycling rate of 36.0 percent based on the waste composition work from this Study and 2015 recycling data from the City. This recycling rate is reflective of a mature and comprehensive recycling program. The recycling rate of 36.0 percent omits the contaminants collected from the City’s single-stream recycling routes. Contaminants comprise 3.8 percent of total single-stream recyclables as reported by the
Foth Infrastructure & Environment, LLC • 24
MRF contractor to City staff. The annual waste streams data is posted by the City on its “Solid Waste & Recycling Statistics” web page.17 As shown in Figure 2-3, the Minneapolis 2015 residential capture rate of single-stream recyclables and compostables is 53.7 percent of the total amount of these materials generated in the residential program. Different from the recycling rate, the capture rate measures the percent of residential recyclables targeted by the City that are collected in the recycling and organics programs as a percentage of all recyclables generated. Recycling rates measure the percent of recyclables as a percentage of all of the residential solid waste generated. Minneapolis is achieving capture rates in excess of 50 percent for traditional fiber and container recyclables and for some individual commodities the capture rate exceeds 80 percent.
6.5 Maximum Theoretical Recycling Rate
In the Sort Report the “maximum theoretical” residential recycling rate was estimated at 75.2 percent of total residential solid waste generated. This maximum theoretical recycling rate assumes “perfect” capture of all targeted recyclables and compostable materials and development of markets for materials not currently recycled. The maximum theoretical recycling rate assumes that every Minneapolis resident served in the City’s recycling program perfectly separates all of their eligible recyclables and compostable items. For example, this theoretical recycling rate assumes that residents do not use newspaper as pet bedding or tin cans to contain bacon grease. Items included in the maximum theoretical scenario include all recyclables including (but not limited to): paper, containers, yard waste, food waste/other compostable organics, mattresses, appliances, scrap metal, electronics, textiles, tires, wood, carpet, and other C&D debris targeted for recovery by the City’s recycling program. This maximum theoretical recycling rate assumes that the recyclable and compostable items are 100 percent clean and free of contamination when they are placed for curbside collection. It also assumes that the City and their recycling contractors will have sustainable end markets for all of these commodities. Several of these materials do not currently have recycling end markets or energy recovery options and must be disposed in landfills (e.g., treated wood, gypsum board, film plastics sorted from MRFs, etc.). Other assumptions of the maximum theoretical recycling rate include:
♦ Every Minneapolis resident stores all of their clean film plastic bags, until they can transport these materials to appropriate drop-off locations for recycling;
♦ Minneapolis residents separate, store and set out their electronics, tires, and mattresses and
other “large items” for set out and the City’s programs recover and recycle 100 percent of
those items;
♦ Minneapolis residents set out all scrap metal in the City’s large item program or accumulate all of their scrap metal for delivery to local scrap dealers and the weight of the materials is reported to the City;
♦ All residential households undergoing construction or renovation projects utilize the Voucher Program system for all of their C&D debris and the City is able to develop/find markets for all of these materials; and,
Foth Infrastructure & Environment, LLC • 25
♦ All households donate their used clothing, shoes and leather items, these items are all in good enough condition to be reused via available charity and thrift store avenues and the weight of the materials is reported to the City.
While instructive from an academic perspective, the maximum theoretical recycling rate is not achievable. In practice, humans do not achieve “perfect” recycling.
6.6 Maximum Achievable Recycling Rate
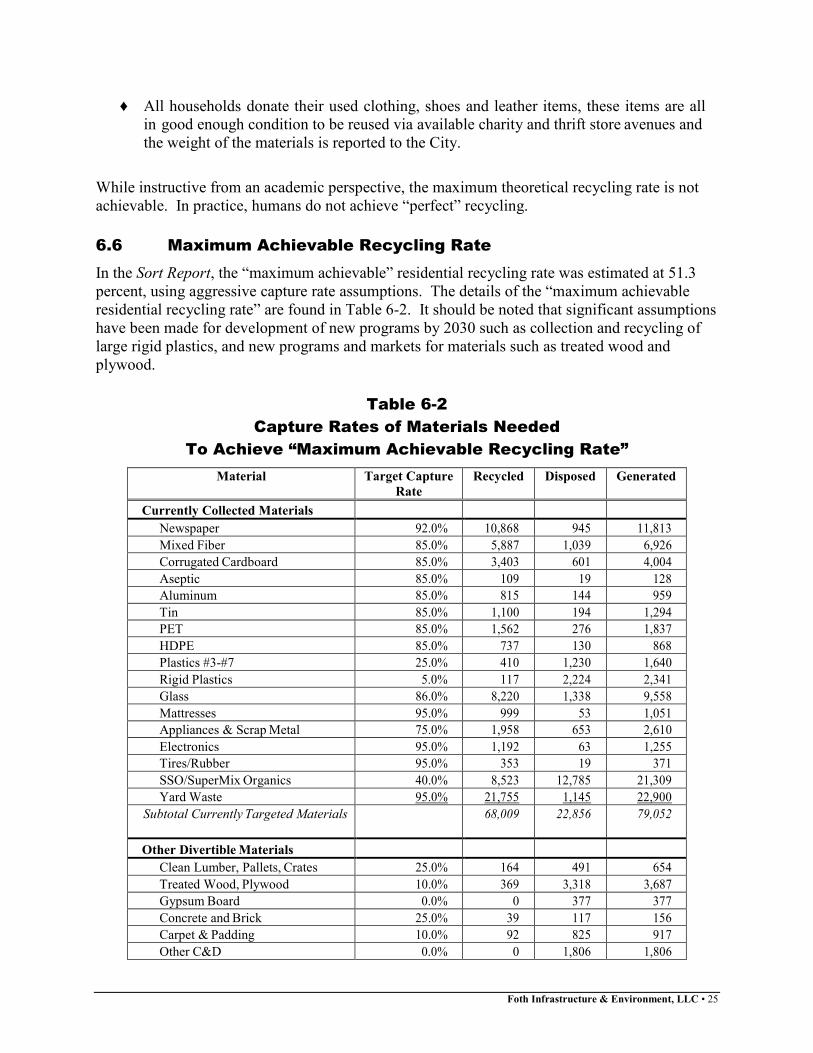
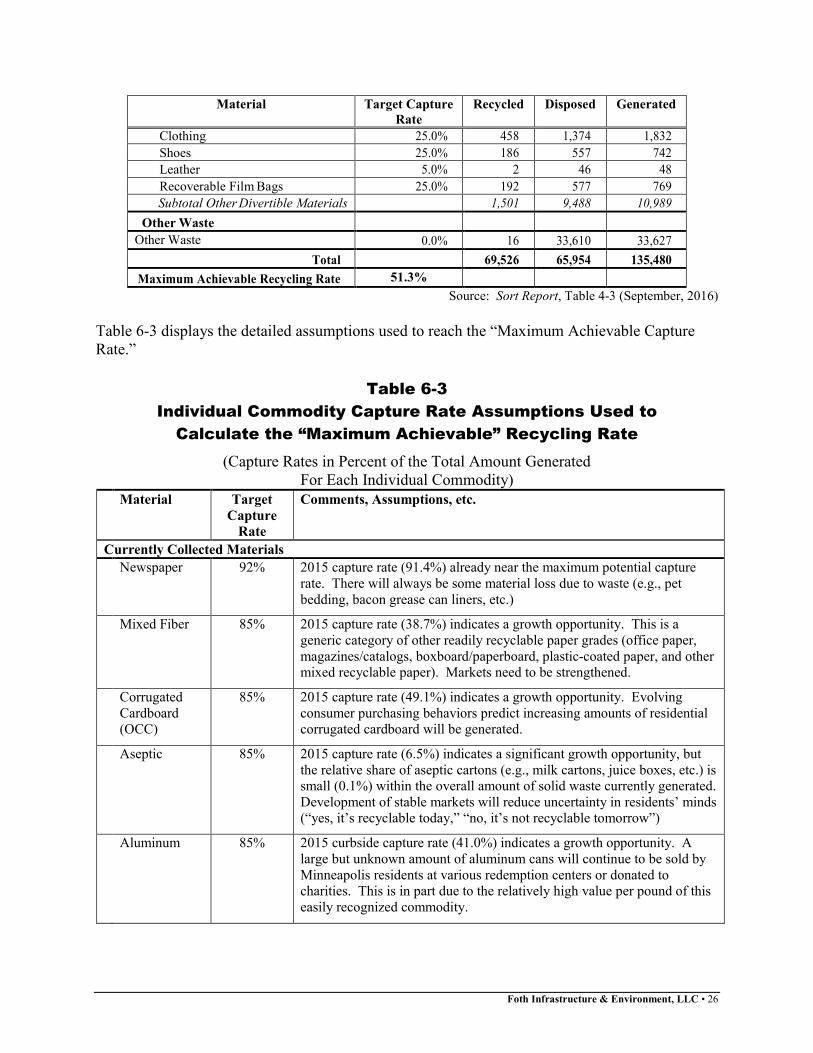
In the Sort Report, the “maximum achievable” residential recycling rate was estimated at 51.3 percent, using aggressive capture rate assumptions. The details of the “maximum achievable residential recycling rate” are found in Table 6-2. It should be noted that significant assumptions have been made for development of new programs by 2030 such as collection and recycling of large rigid plastics, and new programs and markets for materials such as treated wood and plywood.
Table 6-2
Capture Rates of Materials Needed
To Achieve “Maximum Achievable Recycling Rate”
Material Target Capture
Rate
Recycled Disposed Generated
Currently Collected Materials
Newspaper 92.0% 10,868 945 11,813
Mixed Fiber 85.0% 5,887 1,039 6,926
Corrugated Cardboard 85.0% 3,403 601 4,004
Aseptic 85.0% 109 19 128
Aluminum 85.0% 815 144 959
Tin 85.0% 1,100 194 1,294
PET 85.0% 1,562 276 1,837
HDPE 85.0% 737 130 868
Plastics #3-#7 25.0% 410 1,230 1,640
Rigid Plastics 5.0% 117 2,224 2,341
Glass 86.0% 8,220 1,338 9,558
Mattresses 95.0% 999 53 1,051
Appliances & Scrap Metal 75.0% 1,958 653 2,610
Electronics 95.0% 1,192 63 1,255
Tires/Rubber 95.0% 353 19 371
SSO/SuperMix Organics 40.0% 8,523 12,785 21,309
Yard Waste 95.0% 21,755 1,145 22,900
Subtotal Currently Targeted Materials 68,009 22,856 79,052
Other Divertible Materials
Clean Lumber, Pallets, Crates 25.0% 164 491 654
Treated Wood, Plywood 10.0% 369 3,318 3,687
Gypsum Board 0.0% 0 377 377
Concrete and Brick 25.0% 39 117 156
Carpet & Padding 10.0% 92 825 917
Other C&D 0.0% 0 1,806 1,806
Foth Infrastructure & Environment, LLC • 26
Material Target Capture
Rate
Recycled Disposed Generated
Clothing 25.0% 458 1,374 1,832
Shoes 25.0% 186 557 742
Leather 5.0% 2 46 48
Recoverable Film Bags 25.0% 192 577 769
Subtotal Other Divertible Materials 1,501 9,488 10,989
Other Waste
Other Waste 0.0% 16 33,610 33,627
Total 69,526 65,954 135,480
Maximum Achievable Recycling Rate 51.3%
Source: Sort Report, Table 4-3 (September, 2016)
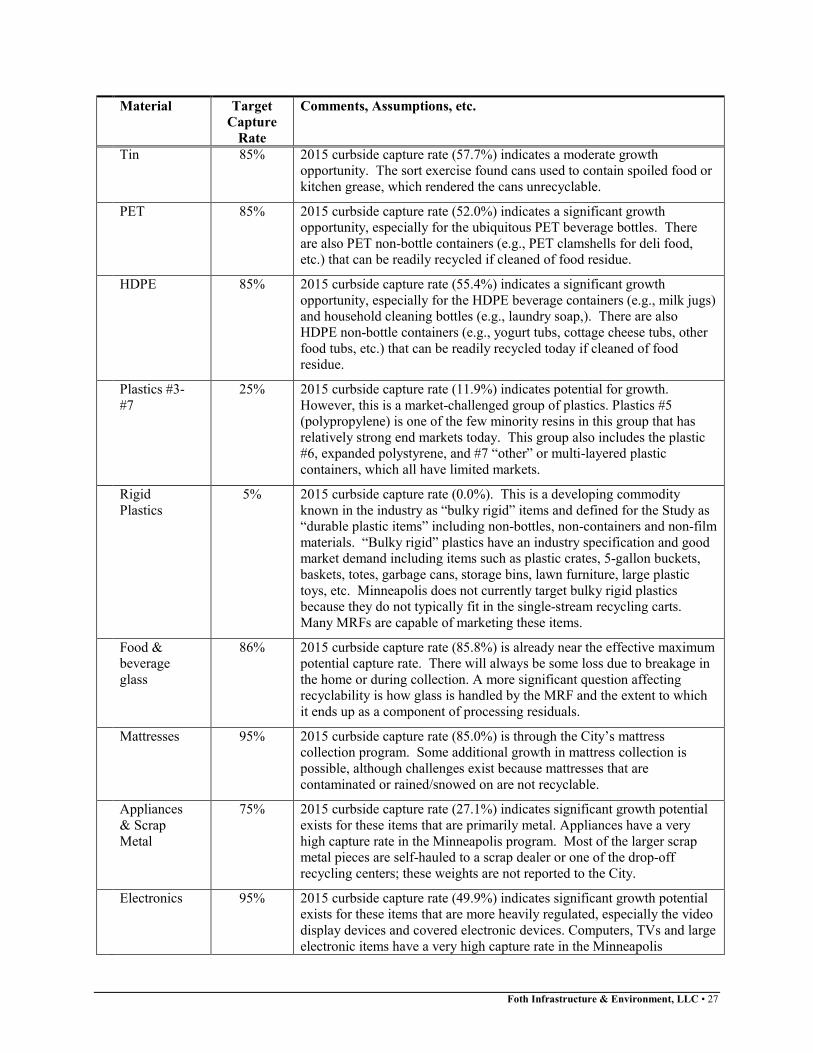
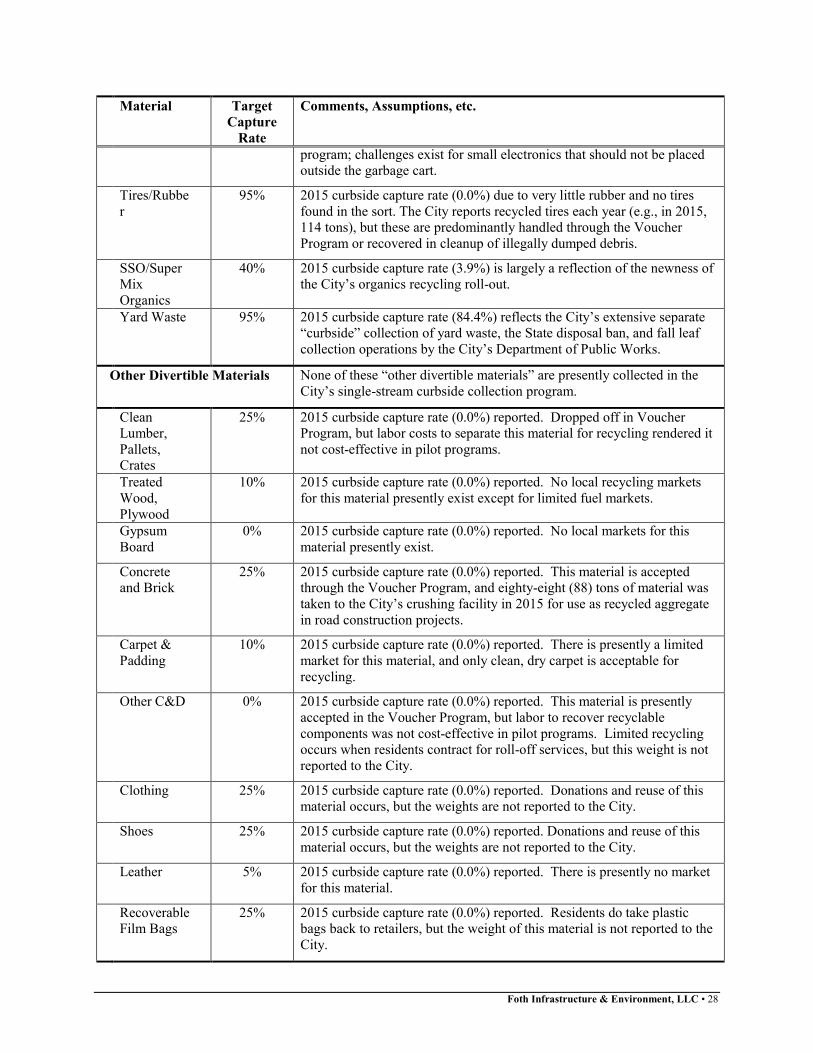
Table 6-3 displays the detailed assumptions used to reach the “Maximum Achievable Capture Rate.”
Table 6-3
Individual Commodity Capture Rate Assumptions Used to
Calculate the “Maximum Achievable” Recycling Rate
(Capture Rates in Percent of the Total Amount Generated For Each Individual Commodity)
Material Target
Capture
Rate
Comments, Assumptions, etc.
Currently Collected Materials
Newspaper 92% 2015 capture rate (91.4%) already near the maximum potential capture rate. There will always be some material loss due to waste (e.g., pet bedding, bacon grease can liners, etc.)
Mixed Fiber 85% 2015 capture rate (38.7%) indicates a growth opportunity. This is a generic category of other readily recyclable paper grades (office paper, magazines/catalogs, boxboard/paperboard, plastic-coated paper, and other mixed recyclable paper). Markets need to be strengthened.
Corrugated Cardboard (OCC)
85% 2015 capture rate (49.1%) indicates a growth opportunity. Evolving consumer purchasing behaviors predict increasing amounts of residential corrugated cardboard will be generated.
Aseptic 85% 2015 capture rate (6.5%) indicates a significant growth opportunity, but the relative share of aseptic cartons (e.g., milk cartons, juice boxes, etc.) is small (0.1%) within the overall amount of solid waste currently generated. Development of stable markets will reduce uncertainty in residents’ minds (“yes, it’s recyclable today,” “no, it’s not recyclable tomorrow”)
Aluminum 85% 2015 curbside capture rate (41.0%) indicates a growth opportunity. A large but unknown amount of aluminum cans will continue to be sold by Minneapolis residents at various redemption centers or donated to charities. This is in part due to the relatively high value per pound of this easily recognized commodity.
Foth Infrastructure & Environment, LLC • 27
Material Target
Capture
Rate
Comments, Assumptions, etc.
Tin 85% 2015 curbside capture rate (57.7%) indicates a moderate growth opportunity. The sort exercise found cans used to contain spoiled food or kitchen grease, which rendered the cans unrecyclable.
PET 85% 2015 curbside capture rate (52.0%) indicates a significant growth opportunity, especially for the ubiquitous PET beverage bottles. There are also PET non-bottle containers (e.g., PET clamshells for deli food, etc.) that can be readily recycled if cleaned of food residue.
HDPE 85% 2015 curbside capture rate (55.4%) indicates a significant growth opportunity, especially for the HDPE beverage containers (e.g., milk jugs) and household cleaning bottles (e.g., laundry soap,). There are also HDPE non-bottle containers (e.g., yogurt tubs, cottage cheese tubs, other food tubs, etc.) that can be readily recycled today if cleaned of food residue.
Plastics #3-#7
25% 2015 curbside capture rate (11.9%) indicates potential for growth. However, this is a market-challenged group of plastics. Plastics #5 (polypropylene) is one of the few minority resins in this group that has relatively strong end markets today. This group also includes the plastic #6, expanded polystyrene, and #7 “other” or multi-layered plastic containers, which all have limited markets.
Rigid Plastics
5% 2015 curbside capture rate (0.0%). This is a developing commodity known in the industry as “bulky rigid” items and defined for the Study as “durable plastic items” including non-bottles, non-containers and non-film materials. “Bulky rigid” plastics have an industry specification and good market demand including items such as plastic crates, 5-gallon buckets, baskets, totes, garbage cans, storage bins, lawn furniture, large plastic toys, etc. Minneapolis does not currently target bulky rigid plastics because they do not typically fit in the single-stream recycling carts. Many MRFs are capable of marketing these items.
Food & beverage glass
86% 2015 curbside capture rate (85.8%) is already near the effective maximum potential capture rate. There will always be some loss due to breakage in the home or during collection. A more significant question affecting recyclability is how glass is handled by the MRF and the extent to which it ends up as a component of processing residuals.
Mattresses 95% 2015 curbside capture rate (85.0%) is through the City’s mattress collection program. Some additional growth in mattress collection is possible, although challenges exist because mattresses that are contaminated or rained/snowed on are not recyclable.
Appliances & Scrap Metal
75% 2015 curbside capture rate (27.1%) indicates significant growth potential exists for these items that are primarily metal. Appliances have a very high capture rate in the Minneapolis program. Most of the larger scrap metal pieces are self-hauled to a scrap dealer or one of the drop-off recycling centers; these weights are not reported to the City.
Electronics 95% 2015 curbside capture rate (49.9%) indicates significant growth potential exists for these items that are more heavily regulated, especially the video display devices and covered electronic devices. Computers, TVs and large electronic items have a very high capture rate in the Minneapolis
Foth Infrastructure & Environment, LLC • 28
Material Target
Capture
Rate
Comments, Assumptions, etc.
program; challenges exist for small electronics that should not be placed outside the garbage cart.
Tires/Rubber
95% 2015 curbside capture rate (0.0%) due to very little rubber and no tires found in the sort. The City reports recycled tires each year (e.g., in 2015, 114 tons), but these are predominantly handled through the Voucher Program or recovered in cleanup of illegally dumped debris.
SSO/SuperMix Organics
40% 2015 curbside capture rate (3.9%) is largely a reflection of the newness of the City’s organics recycling roll-out.
Yard Waste 95% 2015 curbside capture rate (84.4%) reflects the City’s extensive separate “curbside” collection of yard waste, the State disposal ban, and fall leaf collection operations by the City’s Department of Public Works.
Other Divertible Materials None of these “other divertible materials” are presently collected in the City’s single-stream curbside collection program.
Clean Lumber, Pallets, Crates
25% 2015 curbside capture rate (0.0%) reported. Dropped off in Voucher Program, but labor costs to separate this material for recycling rendered it not cost-effective in pilot programs.
Treated Wood, Plywood
10% 2015 curbside capture rate (0.0%) reported. No local recycling markets for this material presently exist except for limited fuel markets.
Gypsum Board
0% 2015 curbside capture rate (0.0%) reported. No local markets for this material presently exist.
Concrete and Brick
25% 2015 curbside capture rate (0.0%) reported. This material is accepted through the Voucher Program, and eighty-eight (88) tons of material was taken to the City’s crushing facility in 2015 for use as recycled aggregate in road construction projects.
Carpet & Padding
10% 2015 curbside capture rate (0.0%) reported. There is presently a limited market for this material, and only clean, dry carpet is acceptable for recycling.
Other C&D 0% 2015 curbside capture rate (0.0%) reported. This material is presently accepted in the Voucher Program, but labor to recover recyclable components was not cost-effective in pilot programs. Limited recycling occurs when residents contract for roll-off services, but this weight is not reported to the City.
Clothing 25% 2015 curbside capture rate (0.0%) reported. Donations and reuse of this material occurs, but the weights are not reported to the City.
Shoes 25% 2015 curbside capture rate (0.0%) reported. Donations and reuse of this material occurs, but the weights are not reported to the City.
Leather 5% 2015 curbside capture rate (0.0%) reported. There is presently no market for this material.
Recoverable Film Bags
25% 2015 curbside capture rate (0.0%) reported. Residents do take plastic bags back to retailers, but the weight of this material is not reported to the City.
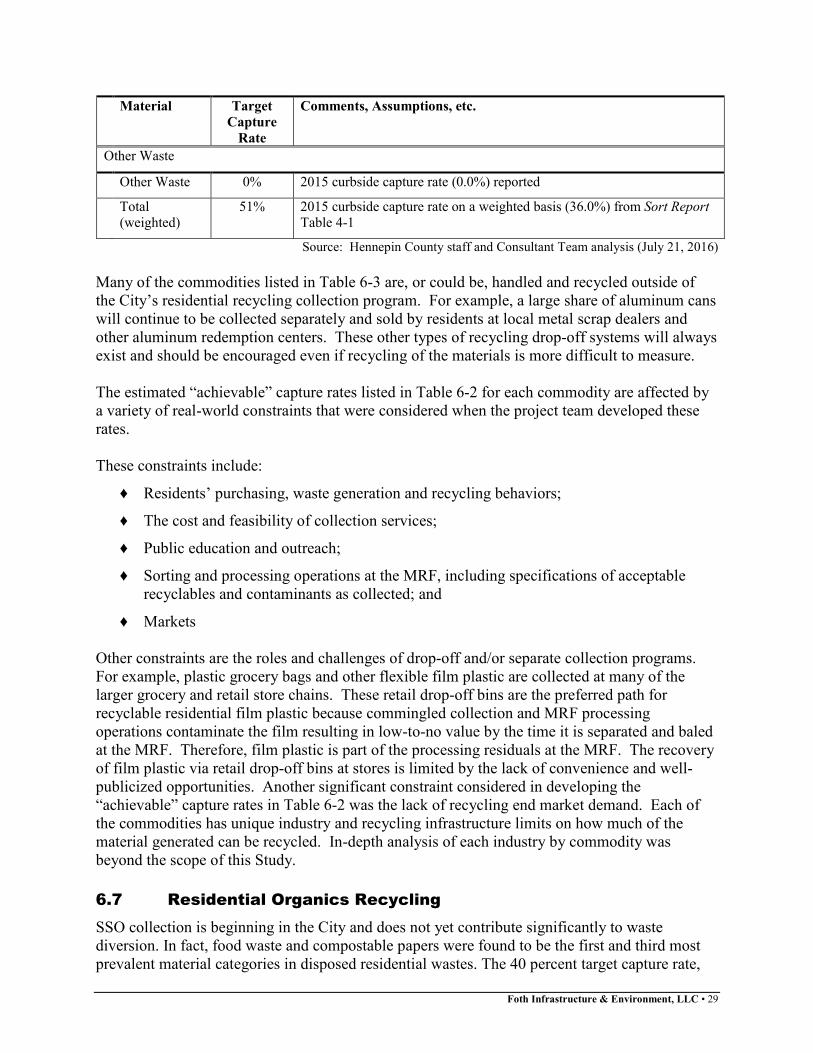
Foth Infrastructure & Environment, LLC • 29
Material Target
Capture
Rate
Comments, Assumptions, etc.
Other Waste
Other Waste 0% 2015 curbside capture rate (0.0%) reported
Total (weighted)
51% 2015 curbside capture rate on a weighted basis (36.0%) from Sort Report
Table 4-1
Source: Hennepin County staff and Consultant Team analysis (July 21, 2016)
Many of the commodities listed in Table 6-3 are, or could be, handled and recycled outside of the City’s residential recycling collection program. For example, a large share of aluminum cans will continue to be collected separately and sold by residents at local metal scrap dealers and other aluminum redemption centers. These other types of recycling drop-off systems will always exist and should be encouraged even if recycling of the materials is more difficult to measure. The estimated “achievable” capture rates listed in Table 6-2 for each commodity are affected by a variety of real-world constraints that were considered when the project team developed these rates. These constraints include:
♦ Residents’ purchasing, waste generation and recycling behaviors;
♦ The cost and feasibility of collection services;
♦ Public education and outreach;
♦ Sorting and processing operations at the MRF, including specifications of acceptable recyclables and contaminants as collected; and
♦ Markets Other constraints are the roles and challenges of drop-off and/or separate collection programs. For example, plastic grocery bags and other flexible film plastic are collected at many of the larger grocery and retail store chains. These retail drop-off bins are the preferred path for recyclable residential film plastic because commingled collection and MRF processing operations contaminate the film resulting in low-to-no value by the time it is separated and baled at the MRF. Therefore, film plastic is part of the processing residuals at the MRF. The recovery of film plastic via retail drop-off bins at stores is limited by the lack of convenience and well-publicized opportunities. Another significant constraint considered in developing the “achievable” capture rates in Table 6-2 was the lack of recycling end market demand. Each of the commodities has unique industry and recycling infrastructure limits on how much of the material generated can be recycled. In-depth analysis of each industry by commodity was beyond the scope of this Study.
6.7 Residential Organics Recycling
SSO collection is beginning in the City and does not yet contribute significantly to waste diversion. In fact, food waste and compostable papers were found to be the first and third most prevalent material categories in disposed residential wastes. The 40 percent target capture rate,
Foth Infrastructure & Environment, LLC • 30
however, is very aggressive. Other organics programs in the Metropolitan Area that have been in place for several years have significantly lower capture rates than 40 percent. The Minneapolis program charges each resident for the organics program whether they use it or not so the sign-up rate is growing (currently at 38 percent18). The actual curbside organics recycling setout rate of households that have signed up is uncertain. The City-reported collected weight of organics per participating dwelling unit per week is 4 pounds. This compares to the nine (9) pounds per dwelling unit per week of organics found in the trash in the waste sort results in this Study. As the City’s organics program expands and matures, increased participation may be expected which should move the needle on overall diversion, but the 40 percent target capture rate for organics may require extraordinary efforts to achieve.
6.8 Participation Rates
Approximately 90 percent of the households served by Minneapolis single-stream curbside collection services participate in the curbside recycling program.19 This high participation rate is another indication that the City’s recycling program is very mature. It also indicates the City may have already approached a maximum achievable participation rate. However, this Study indicates that the City’s 2015 recycling capture rate is only 53.7 percent of the total amount of traditional single-stream recyclables and compostables (including both yard waste and organics) in the waste stream. This means that while most City residents separate materials for recycling and composting, their separation of targeted recyclables is not perfect and many recyclables are still being trashed. Previous studies jointly conducted by the City and the County on the effect of enhanced recycling education on recycling behavior showed that even persons that believe they are good or above-average recyclers do not recycle all possible materials.20
6.9 Drop-Off Programs
Minneapolis enjoys a wide variety of recycling drop-off services that complement the City’s municipal curbside recycling collection services. These drop-off recycling and waste reduction opportunities include:
♦ Traditional metal scrap dealers and aluminum redemption centers.
♦ Used clothing and housewares reuse retail stores and drop-off centers.
♦ Retail grocery stores that accept residential plastic film (e.g., plastic grocery bags and other clean, consumer plastic film products).
♦ Organics recycling drop-off centers. Hennepin County and the City of Minneapolis should consider these drop-off opportunities as “partners” to the City’s municipal curbside collection efforts, not competitors. There may be opportunities for collaboration to help increase recycling at these drop-off centers, and these partners could be encouraged or required to report weights of recycled materials to the City.
Foth Infrastructure & Environment, LLC • 31
6.10 Total Recycling vs. Residential Recycling
One of the policy questions that should be further considered is whether or not it is appropriate to apply the 75 percent recycling goals and related objectives equally to residential and commercial generators. The results of this Study that indicate that achieving a residential recycling rate of over 55 percent is not achievable by 2030 with the current waste composition. Hennepin County and MPCA staff should consider different recycling rate objectives and timelines for different generator types. Another consideration is whether recycling rates should be the sole measurement and basis for recycling diversion policies. As noted above, recycling rates that are calculated based on weight are significantly affected by the evolving ton of residential recyclables. This leads to the perception that even cities with high capture rates have low recycling rates. Commodity packaging has been significantly light-weighted over time, glass has significantly decreased in grocery applications and paper is a decreasing percentage of the recycling stream. Liquids and SuperMix materials are not decreasing in weight over time. An alternative and supplemental means of measuring recycling program progress is to determine capture rates by commodity to determine total recycling diversion. This type of measurement protocol will provide policy discussions with measurable and comparable data to advance public purposes.
6.11 Best Opportunities to Recycle More Materials
The best opportunities to recycle more materials are capture of the high-value, high-volume recyclables that currently have strong end use recycling markets. If the current capture rates for these commodities are low to moderate, these commodities should be the priorities for targeted efforts by Hennepin County and the City of Minneapolis for increased recycling rates. The most important high-value, high-volume recyclables include:
♦ Mixed fiber
♦ Corrugated cardboard
♦ Aluminum
♦ Tin
♦ PET
♦ HDPE
♦ Rigid plastics (also referred to as “bulky rigid plastics” in the recycling industry)
♦ Appliances & scrap metal These recyclables are still found in relatively high volumes in the garbage. Other commodities that have much higher capture rates do not have the same opportunity for additional collections as the list of materials above.
Foth Infrastructure & Environment, LLC • 32
6.12 Market Development
Table 6-3 listed the individual capture rates by commodity and the technical constraints which limit the maximum achievable recycling rate to 51.3 percent. In many cases, the key barrier is the lack of adequate end market demand. For example, there are currently no feasible end use recycling markets for:
♦ Mixed processing residuals (aka “SuperMix”);
♦ Gypsum wallboard;
♦ Other residential C&D; and,
♦ Flexible pouches made from multi-layers of multiple materials (aluminum coated plastic, etc.).
Very weak domestic end use recycling markets exist for:
♦ Rigid plastics #3 through #7 when mixed together in the same bale; and,
♦ Contaminated curbside film plastic after processing at a MRF. Most other commodities have a good to strong market demand and the technical barriers to increased diversion are attributable to practical limitations of participation, public education, collection, and MRF processing. There are varied types and forms of plastic containers made from a wide variety of resins. This plethora of plastic types has always been, and will continue to be, an issue for MRFs. For example, plastic resin types #3 (PVC) and #6 (polystyrene) currently have no effective intermediate processing capacity and are sometimes considered as contaminants to the other grades of recyclable plastics. Many of the commodities with no or weak markets listed above could be used as feedstock for some form of waste-to-energy at a mixed waste resource recovery facility. This is not considered recycling by the State of Minnesota and therefore would not help with the challenge to meet State-defined recycling rate goals.
Foth Infrastructure & Environment, LLC • 33
7 Conclusions and Recommendations
7.1 Study Conclusions
The State of Minnesota established a total recycling rate goal of 75 percent by 2030 for the Metropolitan Counties. Recycling programs are implemented and conducted by cities with county assistance. The Sort Report calculates a Minneapolis 2015 residential recycling rate of 36.0 percent of total residential solid waste generated, which is below the 75 percent goal. The maximum theoretical residential recycling rate in Minneapolis is 75.2 percent assuming “perfect” recycling by all residents and collection/processing operators and new markets. Given technical and human behavior constraints associated with the maximum theoretical recycling rate, 75 percent recycling is highly unlikely in the foreseeable future even with the prospect of significant new recovery technologies and development of associated markets. In practice, it is not possible to achieve “perfect” recycling.
As shown in the Final Report and the accompanying Sort Report the “maximum achievable” residential recycling rate for Minneapolis is estimated at 51.3 percent, using aggressive capture rate assumptions. The “maximum achievable” recycling rate includes significant assumptions for development of new programs by 2030 such as collection and recycling of bulky rigid plastics, and new programs and markets for materials such as treated wood and plywood. Current market trends in the consumer products and information/media industries indicate that recyclable materials are declining as a percent by weight in the waste stream. This phenomenon known as the evolving ton of recyclables will continue to put significant downward pressure on maximum theoretical recycling rates. The 2015 capture rate of Minneapolis residential recyclables and compostables was 53.7 percent of the total amount of recyclable materials generated. Capture rates ranged between 91 percent for newspaper to 6 percent for aseptic containers. The organics capture rates for the new collection program was approximately 4 percent, but rollout of the program had not been completed citywide when the sort was conducted. The capture rate reflects the percentage of the recyclable and compostable materials in residential waste that are “captured” for recycling, and measures how well residents divert the compostable and recyclable materials from their waste. This differs from the “recycling rate,” which measures the tons of recyclable materials diverted as a percentage of the total residential solid waste stream. Because recyclables tend to be “light,” (e.g., plastics) and garbage tends to be “heavy” (e.g., diapers, and other non-divertible wastes), the capture rate is a better measure of recycling performance by residents. A unique component of the Study was to determine where in homes recyclables are generated. Plastic containers overwhelmingly had grocery origins. Non-container plastics were broadly scattered in origin throughout the home. Less than 20 percent of the film plastics were recoverable through take back programs. More than 50 percent of the film plastics originated from home uses that led to the material being non-recyclable. More than 50 percent of the paper products sorted were non-recyclable, either because of heavy plastic coatings, contamination or multiple layers of material. Almost 50 percent of the compostable papers were associated with food waste.
Foth Infrastructure & Environment, LLC • 34
7.2 Recommendations for future analysis and programs
This study evaluated only the Minneapolis residential waste stream. The 75 percent recycling rate is generally applied to a whole city or county and not just residential waste. Although it is known that commercial waste has a higher proportion of recyclable or compostable materials (paper, cardboard, restaurants’ compostable wastes, etc.), less is known about commercial recycling compared to residential recycling. Another study could target the commercial waste stream and provide data on how the commercial sector could contribute to the County’s 75 percent recycling rate goal.
Minneapolis has a mature residential recycling program with participation estimated at 90 percent by the City. Many of the barriers to improved residential recycling rates are outside of the City’s control (e.g., packaging design, end use markets, MRF technologies, etc.). Only solid waste from the City’s residential garbage routes were sampled and sorted. Future waste sort protocols should consider the costs and benefits of “side-by-side” sorts of garbage, recyclables and organics. Objectives could include:
(a) Further analysis of composition details;
(b) Standardized sort categories and definitions (so that material by material comparisons between waste streams is more feasible); and
(c) Achieve additional accuracy on capture rates and recycling rates by sector. In order to sustain residential recycling programs in the long term, it is important for recycling professionals to better understand the types and amounts of contaminants collected with the recycling streams, for both traditional recyclables and compostable materials. Hennepin County should continue to provide technical assistance to its cities including measurement of contaminants as collected. Recycling capture rates reflect presence of recyclable materials in use and in the waste stream (not total solid waste) and therefore are a more accurate measure of year-to-year progress in recycling program performance. Recycling capture rates better reflect current consumer buying habits, recycling markets and MRF recovery technologies. Hennepin County could consider separate capture rate goals by sector (i.e., residential vs. commercial).
Recyclables composition studies are already being conducted by some Hennepin County municipalities, including Minneapolis, as a means to help establish annual “splits” of commodities for purposes of calculating revenue share credits from MRFs back to cities. Hennepin County could review the methods and frequency of these recyclables composition studies to determine if additional value can be gained from further refinement and standardization.
Foth Infrastructure & Environment, LLC • 35
1 MPCA Solid Waste Management Policy Plan: 2010 - 2030 (current version as of March 2011): https://www.pca.state.mn.us/sites/default/files/w-sw7-21.pdf.
For more information on the draft MPCA Policy Plan for 2016 – 2036, see also: https://www.pca.state.mn.us/waste/metropolitan-solid-waste-management-policy-plan
2 City of Minneapolis “Solid Waste & Recycling: Historical Highlights” web page: http://www.minneapolismn.gov/solid-waste/about/solid-waste_aboutus-history 3 City of Minneapolis “Solid Waste & Recycling: One-Sort Recycling” web page: http://www.minneapolismn.gov/solid-waste/recycling/solid-waste_recycling 4 Minneapolis web page, “Solid Waste & Recycling: About Us”: http://www.minneapolismn.gov/solid-waste/about/index.htm 5 City of Minneapolis “Solid Waste & Recycling: Residential Organics Recycling” web page: http://www.minneapolismn.gov/solid-waste/organics/index.htm 6 City of Minneapolis “Solid Waste & Recycling: Yard Waste Collection” web page: http://www.minneapolismn.gov/solid-waste/yardwaste/index.htm 7 City of Minneapolis “Solid Waste & Recycling: Large Item Collection” web page: http://www.minneapolismn.gov/solid-waste/garbage/solid-waste_garbage-large-item 8 City of Minneapolis “Solid Waste & Recycling: Voucher Program” web page: http://www.minneapolismn.gov/solid-waste/vouchers/index.htm 9 City of Minneapolis “Solid Waste & Recycling: Event Recycling” web page: http://www.minneapolismn.gov/solid-waste/EventContainers/index.htm 10 Minnesota Statutes (M.S. 115A.551) relating to recycling goals, https://www.revisor.mn.gov/statutes/?id=115A.551, states in part:
“Subd. 2a.County recycling goals.
(a) By December 31, 2030, each county will have as a goal to recycle the following amounts:
…..
(2) for a metropolitan county, 75 percent by weight of total solid waste generation.
(b) Each county will develop and implement or require political subdivisions within the county to develop
and implement programs, practices, or methods designed to meet its recycling goal. Nothing in this
section or in any other law may be construed to prohibit a county from establishing a higher recycling
goal.”
11 Minnesota Pollution Control Agency (MPCA) “(DRAFT) Metropolitan Solid Waste Management Policy Plan 2016 – 2036 (July 2016) https://www.pca.state.mn.us/sites/default/files/w-sw7-21a.pdf 12 MPCA’s (March 2011) current “Metropolitan Solid Waste Management Policy Plan 2010-2030”, https://www.pca.state.mn.us/sites/default/files/w-sw7-21.pdf 13 Hennepin County (April 2016) “Recycling Progress Report: On the path to zero waste landfilled”, http://www.hennepin.us/~/media/hennepinus/your-government/projects-initiatives/documents/recycling-progress-report.pdf?la=en 14 Robinson, Susan (May 18, 2016); “Recycling Challenges and Solutions: A Power Point (PPT) Presentation Prepared for the Foth Solid Waste Workshop”; Waste Management, Inc.
Foth Infrastructure & Environment, LLC • 36
15 Graphic originally produced by Resource Recycling Systems, Inc. “2015 Data Corner Compilation: As seen in Resource Recycling Inc. magazine.” http://recycle.com/app/uploads/2015/12/RRS-RR-Data-Corner-2015-Compilation-122115.pdf 16 Robinson, Susan (May 18, 2016); “Recycling Challenges and Solutions: PPT.” Ibid. 17 City of Minneapolis, “Solid Waste & Recycling Statistics” web page: http://www.minneapolismn.gov/solid-waste/about/stats/index.htm 18 City of Minneapolis “Solid Waste & Recycling: Residential Organics Recycling” web page: http://www.minneapolismn.gov/solid-waste/organics/index.htm 19 Minneapolis web page, “Solid Waste & Recycling: About Us”: http://www.minneapolismn.gov/solid-waste/about/index.htm 20 Minneapolis Recycling Recovery Rate Study (August 14, 2007), Co-sponsored by Hennepin County Department of Environmental Services and the City of Minneapolis Solid Waste & Recycling Services.


![The Minneapolis journal (Minneapolis, Minn.) 1906-04-16 [p 2]](https://img.dokumen.tips/doc/110x75/61ab1ff1053ee543243f419e/the-minneapolis-journal-minneapolis-minn-1906-04-16-p-2.jpg)