Embed Size (px)
Citation preview
1January 2016
2016 Latin American Business Environment Report
Brian C. GendreauTimothy E. McLendon
The contents of this report were developed under a National Resource Center grant from the U.S. Department of Education. Those contents, however, do not necessarily represent the policy of the U.S. Department of Education, and you should not assume endorsement by the Federal Government.

i
*Electronic versions of all 16 previous reports can be accessed at http://www.latam.ufl.edu/research--training/la-business-environment/publications. The report may be cited without permission, but users are asked to acknowledge the source.
The 17th edition of the Latin American Business Environment Report (LABER) represents the first edition in which principal authorship was assumed by Brian Gendreau, the new director of the University of Florida’s Latin American Business Environment Program. Timothy McLendon will continue to author the legal environment section. With a new author come some changes in appearance and focus, as well as the introduction of two Latin American countries in the Caribbean (Cuba and Haiti). The most obvious change involves the title to the document which will henceforth look forward to the year ahead instead of backwards. Thus, this 17th edition will be considered the 2016 LABER. However, this year’s LABER remains true to Dr. Terry McCoy’s original vision of providing a fair and accessible evaluation of the economic, social, political, policy and legal developments in Latin America over the past year that impact the region’s business and investment climate.*
LABER is a publication of the Latin American Business Environment Program (LABEP) in the Center for Latin American Studies in collaboration with the Center for Governmental Responsibility (CGR) in the Levin College of Law at the University of Florida. Through graduate degree concentrations, courses and study abroad opportunities, LABEP (http://www.latam.ufl.edu/research--training/la-business-environment) draws on the diverse expertise and considerable resources of the University to prepare students for careers related to Latin American business. It also organizes conferences, supports the publication of scholarly research and provides professional consulting services.
CGR is a legal and public policy research institute at the Levin College of Law with research programs and grant projects in environmental law, social policy, international trade law, and democracy and governance. CGR provides academic and clinical instruction for law students, and public extension and information services through conferences and publications. CGR has a long history of collaborative work in Haiti, throughout Latin America, Europe and Africa. CGR (http://www.law.ufl.edu/areas-of-study/centers/cgr) hosts an annual “Legal & Policy Issues in the Americas Conference”, now in its 17th year.
Samantha Soffici helped with economic research, while Lauren Samuels assisted with background research for the legal environment section. JoAnn Klein assisted with editing, and Lenny Kennedy assisted with formatting the document and tables. Dayanara Hudson assisted with the final formatting of the document. We thank them for their valuable assistance, but we alone are responsible for the content and analysis.
Brian Gendreau, Director, Latin American Business Environment Program Timothy E. McLendon, Staff Attorneyand Clinical Professor of Finance Center for Governmental ResponsibilityCenter for Latin American Studies Levin College of LawUniversity of Florida University of [email protected] [email protected]
P R E F A C E
ii
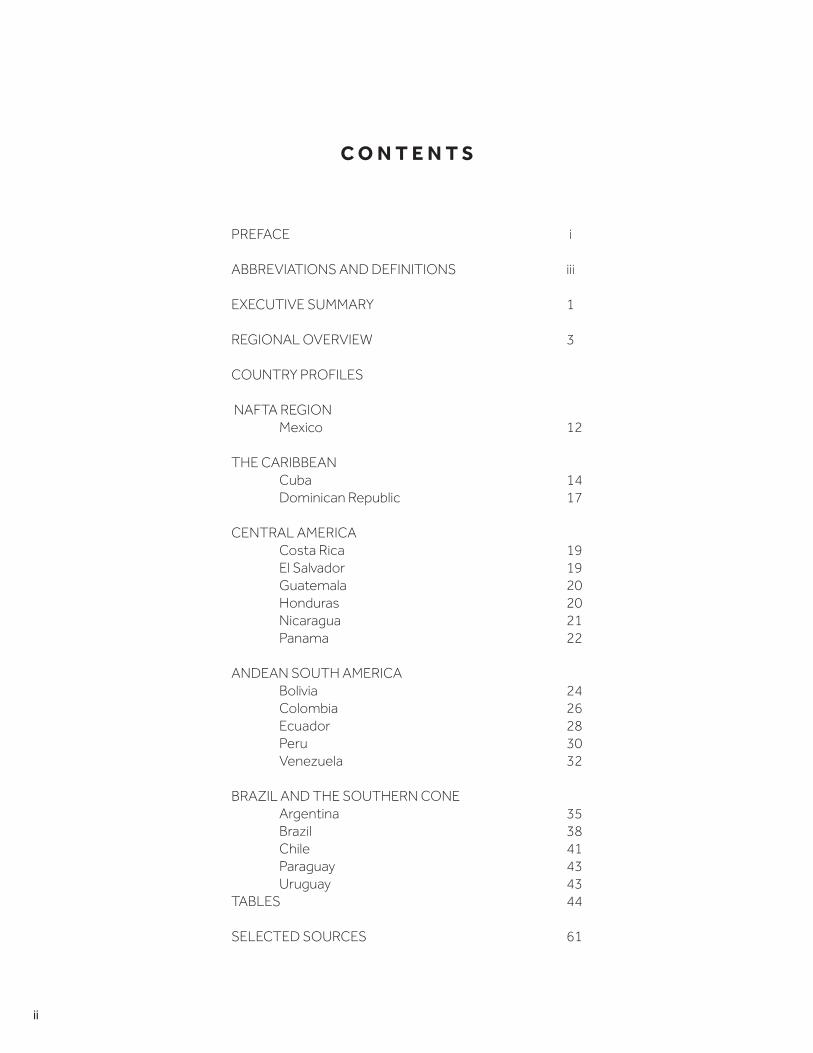
PREFACE i
ABBREVIATIONS AND DEFINITIONS iii
EXECUTIVE SUMMARY 1
REGIONAL OVERVIEW 3
COUNTRY PROFILES
NAFTA REGION Mexico 12
THE CARIBBEAN Cuba 14 Dominican Republic 17
CENTRAL AMERICA Costa Rica 19 El Salvador 19 Guatemala 20 Honduras 20 Nicaragua 21 Panama 22
ANDEAN SOUTH AMERICA Bolivia 24 Colombia 26 Ecuador 28 Peru 30 Venezuela 32
BRAZIL AND THE SOUTHERN CONE Argentina 35 Brazil 38 Chile 41 Paraguay 43 Uruguay 43TABLES 44
SELECTED SOURCES 61
C O N T E N T S
iii
A B B R E V I A T I O N S A N D D E F I N I T I O N S
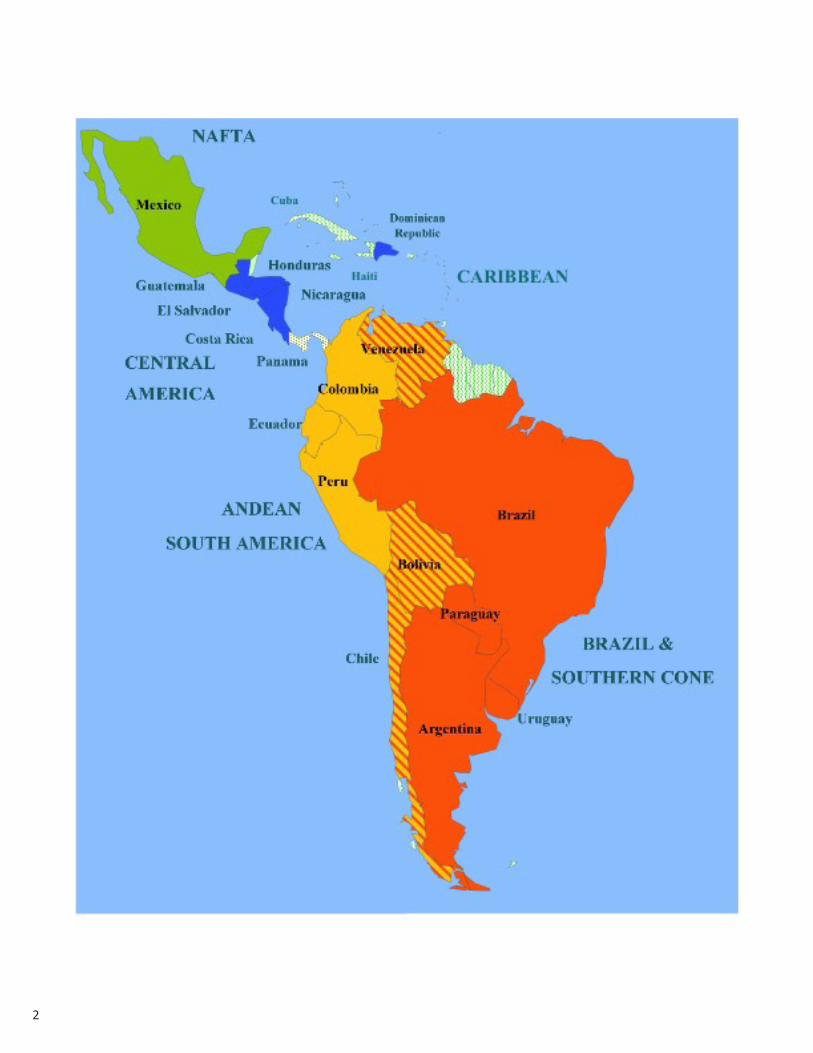
ALBA: Alianza Bolivariana para los Pueblos de Nuestra América (Boliviarian Alliance for the Peoples of our America), an organization founded by Cuba and Venezuela in 2004 to foster regional economic, political, social integration. Its member states, which are socialist or populist in orientation, are Antigua and Barbuda, Bolivia, Cuba, Dominica, Ecuador, Grenada, Nicaragua, Saint Kitts and Nevis, Saint Lucia, Saint Vincent, and Venezuela.
Latin America: The independent states in the Americas in which romance languages are spoken. This definition includes the Caribbean nations of Cuba, the Dominican Republic, and Haiti.
LA10: The 9 largest countries in Latin America by GDP, in PPP prices, plus Panama, included because of its large international banking sector. These are, in order of size, Brazil, Mexico, Argentina, Colombia, Venezuela, Chile, Peru, Ecuador, the Dominican Republic, and Panama.
Mercosur: (Mercosul in Portuguese). A customs union and trading bloc of countries established in 1991 to promote free trade. Its full members are Argentina, Bolivia, Brazil, Paraguay, Uruguay, and Venezuela.
Pacific Alliance: A trade bloc founded in 2011 with the goal of promoting economic integration and free trade with a
“clear orientation toward Asia.” Its members are Chile, Colombia, Mexico, and Peru. Costa Rica was in the process of joining the Alliance in 2014. Its governments tend to be business-friendly.
Dollar: All references to the dollar ($) refer to the United States dollar.
Sources: Sources for the data, forecasts, and rankings used in this publication are listed either below each chart or table or in the footnotes to Tables 1 through 15.

iv
1
2 0 1 6 L A T I N A M E R I C A N B U S I N E S S R E P O R TBrian C. Gendreau and Timothy E. McLendon
E X E C U T I V E S U M M A R Y
A weak world economy and a continued fall in commodity prices made 2015 a difficult year for Latin America, and promise to make the year ahead challenging as well. Economic challenges were accompanied in many countries by political weakness, in large part caused by the emergence of corruption scandals that tarnished governments, undermining their legitimacy and their ability to focus on economic concerns.
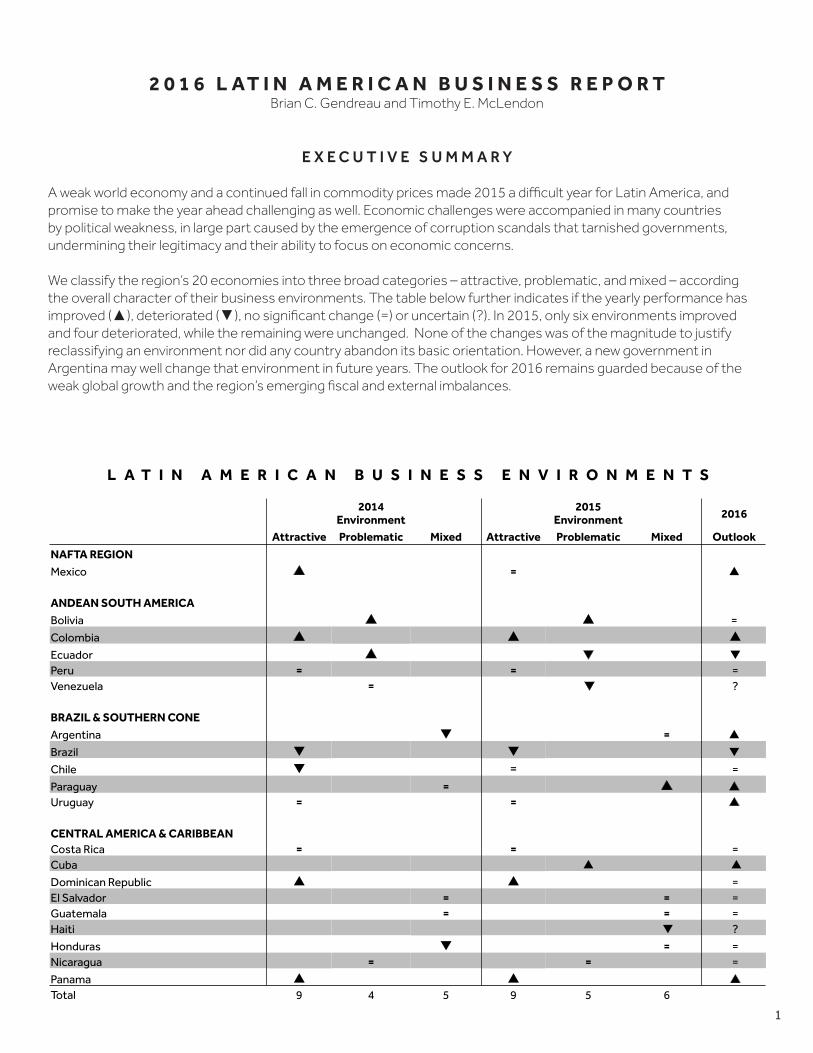
We classify the region’s 20 economies into three broad categories – attractive, problematic, and mixed – according the overall character of their business environments. The table below further indicates if the yearly performance has improved (▲), deteriorated (▼), no significant change (=) or uncertain (?). In 2015, only six environments improved and four deteriorated, while the remaining were unchanged. None of the changes was of the magnitude to justify reclassifying an environment nor did any country abandon its basic orientation. However, a new government in Argentina may well change that environment in future years. The outlook for 2016 remains guarded because of the weak global growth and the region’s emerging fiscal and external imbalances.
L A T I N A M E R I C A N B U S I N E S S E N V I R O N M E N T S
2014 Environment
2015 Environment 2016
Attractive Problematic Mixed Attractive Problematic Mixed Outlook
NAFTA REGION
Mexico ▲ = ▲ ANDEAN SOUTH AMERICA
Bolivia ▲ ▲ =
Colombia ▲ ▲ ▲
Ecuador ▲ ▼ ▼Peru = = =Venezuela = ▼ ? BRAZIL & SOUTHERN CONE
Argentina ▼ = ▲
Brazil ▼ ▼ ▼
Chile ▼ = =
Paraguay = ▲ ▲ Uruguay = = ▲
CENTRAL AMERICA & CARIBBEAN Costa Rica = = =Cuba ▲ ▲
Dominican Republic ▲ ▲ =El Salvador = = =Guatemala = = =Haiti ▼ ?
Honduras ▼ = =Nicaragua = = =
Panama ▲ ▲ ▲ Total 9 4 5 9 5 6
2
3
R E G I O N A L O V E R V I E W
E C O N O M I C O U T L O O K
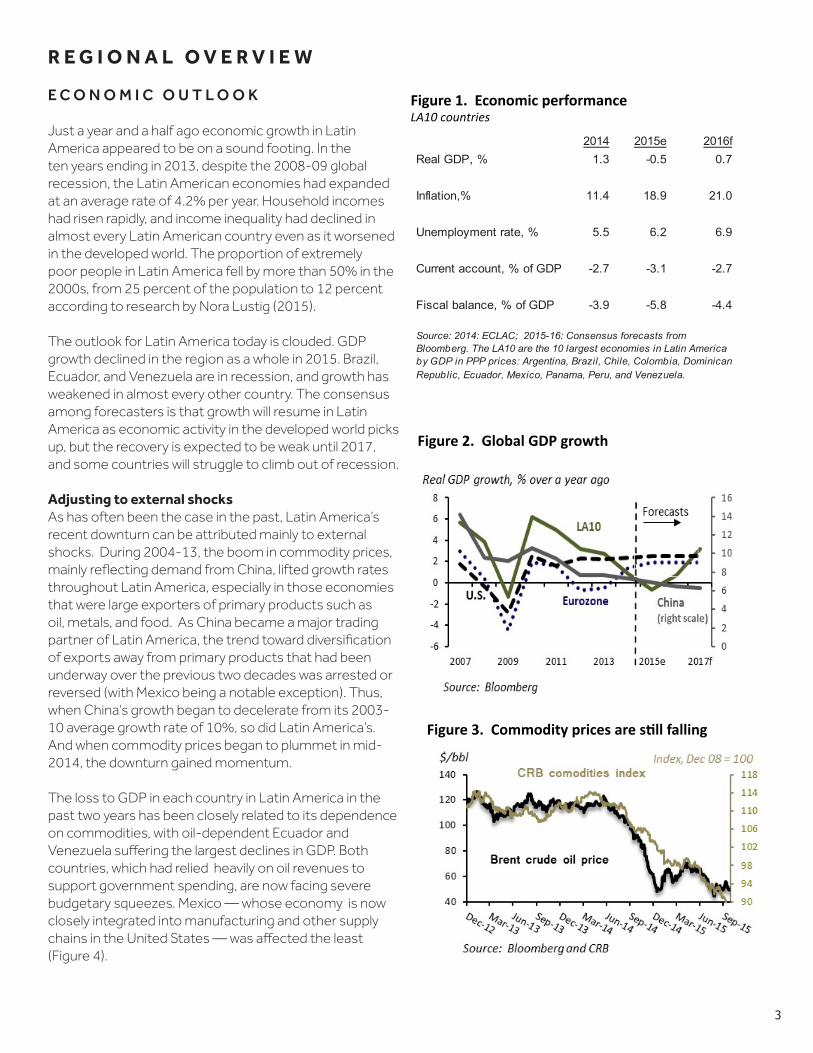
Just a year and a half ago economic growth in Latin America appeared to be on a sound footing. In the ten years ending in 2013, despite the 2008-09 global recession, the Latin American economies had expanded at an average rate of 4.2% per year. Household incomes had risen rapidly, and income inequality had declined in almost every Latin American country even as it worsened in the developed world. The proportion of extremely poor people in Latin America fell by more than 50% in the 2000s, from 25 percent of the population to 12 percent according to research by Nora Lustig (2015).
The outlook for Latin America today is clouded. GDP growth declined in the region as a whole in 2015. Brazil, Ecuador, and Venezuela are in recession, and growth has weakened in almost every other country. The consensus among forecasters is that growth will resume in Latin America as economic activity in the developed world picks up, but the recovery is expected to be weak until 2017, and some countries will struggle to climb out of recession.
Adjusting to external shocksAs has often been the case in the past, Latin America’s recent downturn can be attributed mainly to external shocks. During 2004-13, the boom in commodity prices, mainly reflecting demand from China, lifted growth rates throughout Latin America, especially in those economies that were large exporters of primary products such as oil, metals, and food. As China became a major trading partner of Latin America, the trend toward diversification of exports away from primary products that had been underway over the previous two decades was arrested or reversed (with Mexico being a notable exception). Thus, when China’s growth began to decelerate from its 2003-10 average growth rate of 10%, so did Latin America’s. And when commodity prices began to plummet in mid-2014, the downturn gained momentum.
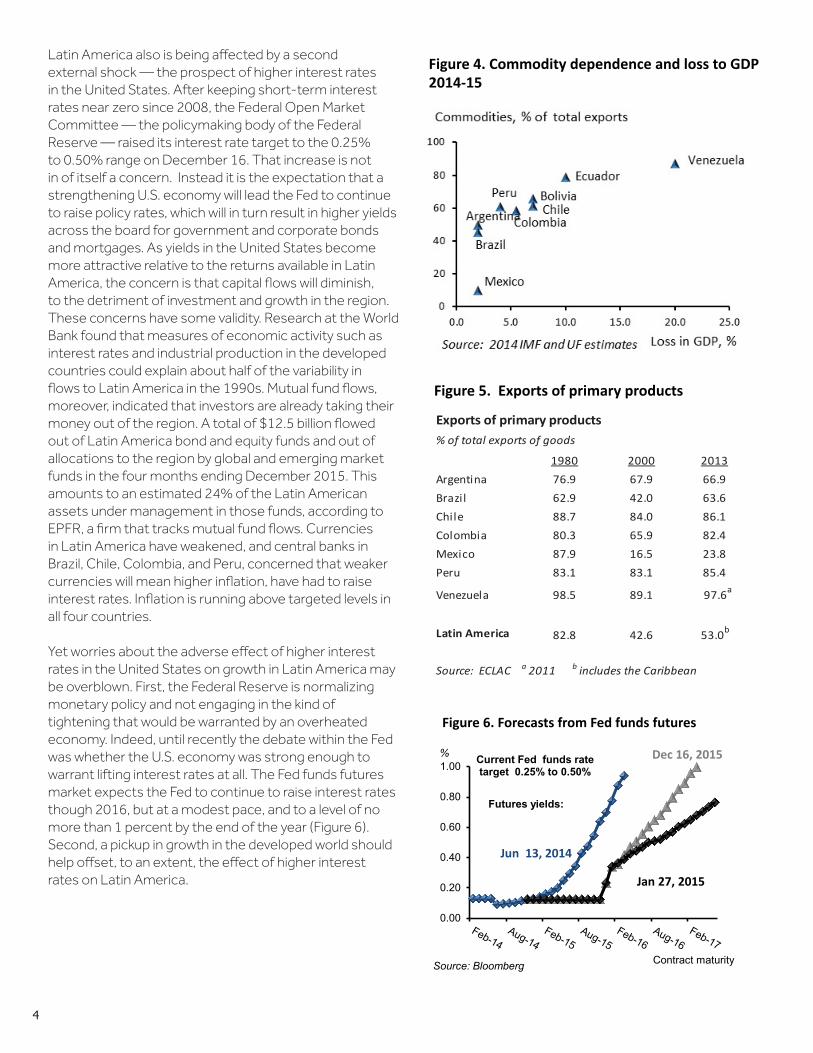
The loss to GDP in each country in Latin America in the past two years has been closely related to its dependence on commodities, with oil-dependent Ecuador and Venezuela suffering the largest declines in GDP. Both countries, which had relied heavily on oil revenues to support government spending, are now facing severe budgetary squeezes. Mexico — whose economy is now closely integrated into manufacturing and other supply chains in the United States — was affected the least (Figure 4).
Figure 2. Global GDP growth
Figure 1. Economic performance LA10 countries
Figure 3. Commodity prices are s@ll falling
2014 2015e 2016fReal GDP, % 1.3 -0.5 0.7
Inflation,% 11.4 18.9 21.0
Unemployment rate, % 5.5 6.2 6.9
Current account, % of GDP -2.7 -3.1 -2.7
Fiscal balance, % of GDP -3.9 -5.8 -4.4
Source: 2014: ECLAC; 2015-16: Consensus forecasts from Bloomberg. The LA10 are the 10 largest economies in Latin America by GDP in PPP prices: Argentina, Brazil, Chile, Colombia, DominicanRepublic, Ecuador, Mexico, Panama, Peru, and Venezuela.
4
Latin America also is being affected by a second external shock — the prospect of higher interest rates in the United States. After keeping short-term interest rates near zero since 2008, the Federal Open Market Committee — the policymaking body of the Federal Reserve — raised its interest rate target to the 0.25% to 0.50% range on December 16. That increase is not in of itself a concern. Instead it is the expectation that a strengthening U.S. economy will lead the Fed to continue to raise policy rates, which will in turn result in higher yields across the board for government and corporate bonds and mortgages. As yields in the United States become more attractive relative to the returns available in Latin America, the concern is that capital flows will diminish, to the detriment of investment and growth in the region. These concerns have some validity. Research at the World Bank found that measures of economic activity such as interest rates and industrial production in the developed countries could explain about half of the variability in flows to Latin America in the 1990s. Mutual fund flows, moreover, indicated that investors are already taking their money out of the region. A total of $12.5 billion flowed out of Latin America bond and equity funds and out of allocations to the region by global and emerging market funds in the four months ending December 2015. This amounts to an estimated 24% of the Latin American assets under management in those funds, according to EPFR, a firm that tracks mutual fund flows. Currencies in Latin America have weakened, and central banks in Brazil, Chile, Colombia, and Peru, concerned that weaker currencies will mean higher inflation, have had to raise interest rates. Inflation is running above targeted levels in all four countries.
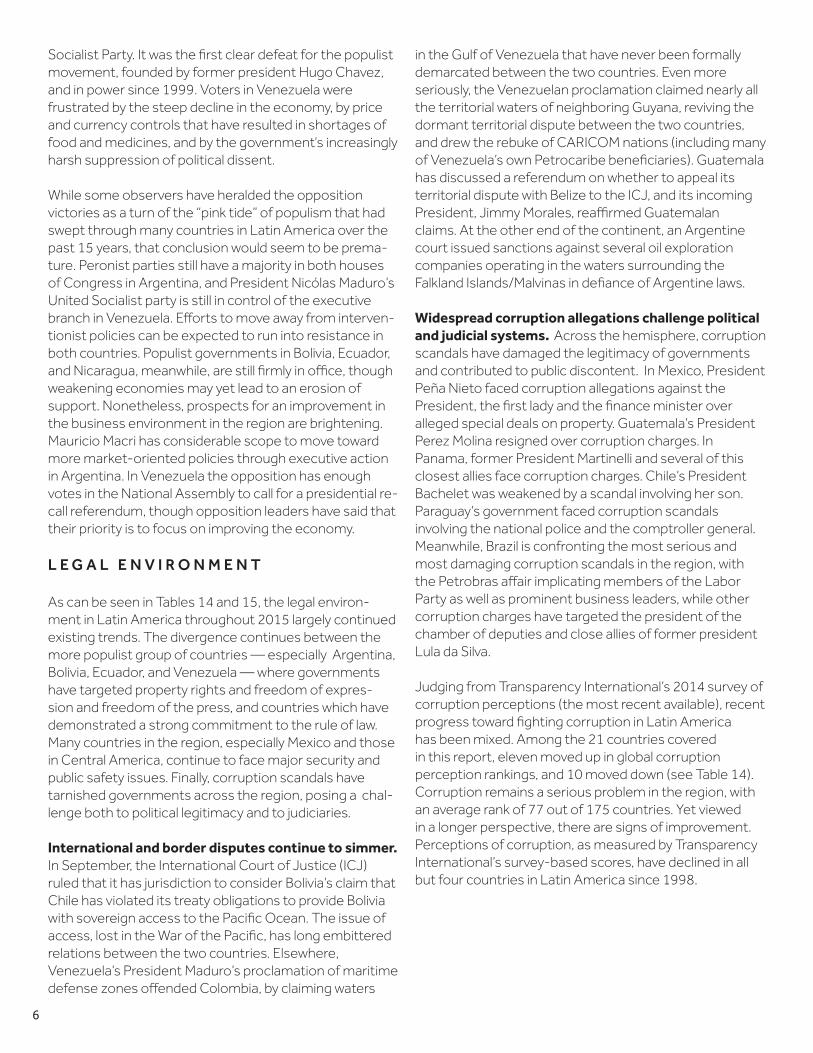
Yet worries about the adverse effect of higher interest rates in the United States on growth in Latin America may be overblown. First, the Federal Reserve is normalizing monetary policy and not engaging in the kind of tightening that would be warranted by an overheated economy. Indeed, until recently the debate within the Fed was whether the U.S. economy was strong enough to warrant lifting interest rates at all. The Fed funds futures market expects the Fed to continue to raise interest rates though 2016, but at a modest pace, and to a level of no more than 1 percent by the end of the year (Figure 6). Second, a pickup in growth in the developed world should help offset, to an extent, the effect of higher interest rates on Latin America.
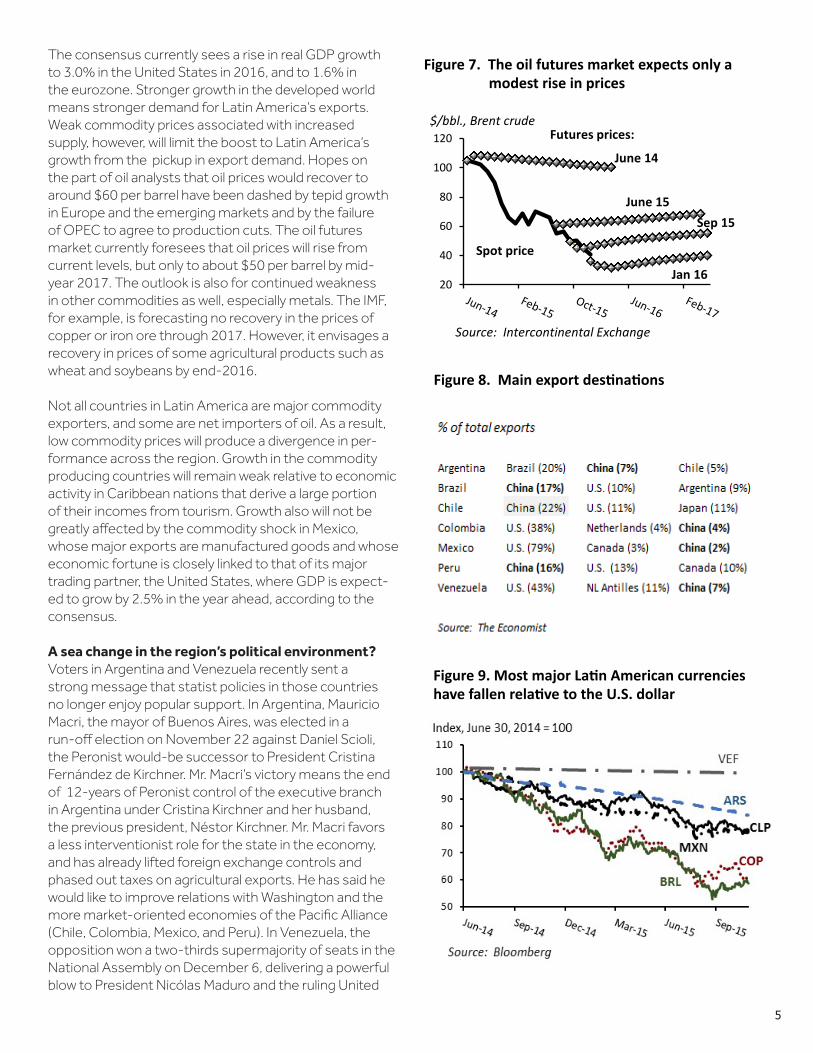
Figure 5. Exports of primary products
Figure 4. Commodity dependence and loss to GDP 2014-‐15
Figure 6. Forecasts from Fed funds futures
Exports of primary products% of total exports of goods
1980 2000 2013Argentina 76.9 67.9 66.9Brazil 62.9 42.0 63.6Chile 88.7 84.0 86.1Colombia 80.3 65.9 82.4Mexico 87.9 16.5 23.8Peru 83.1 83.1 85.4
Venezuela 98.5 89.1 97.6a
Latin America 82.8 42.6 53.0b
Source: ECLAC a 2011 b includes the Caribbean
0.00
0.20
0.40
0.60
0.80
1.00Dec 16, 2015
Jan 27, 2015
Jun 13, 2014
%
Source: Bloomberg
Futures yields:
Current Fed funds ratetarget 0.25% to 0.50%
Contract maturity
5
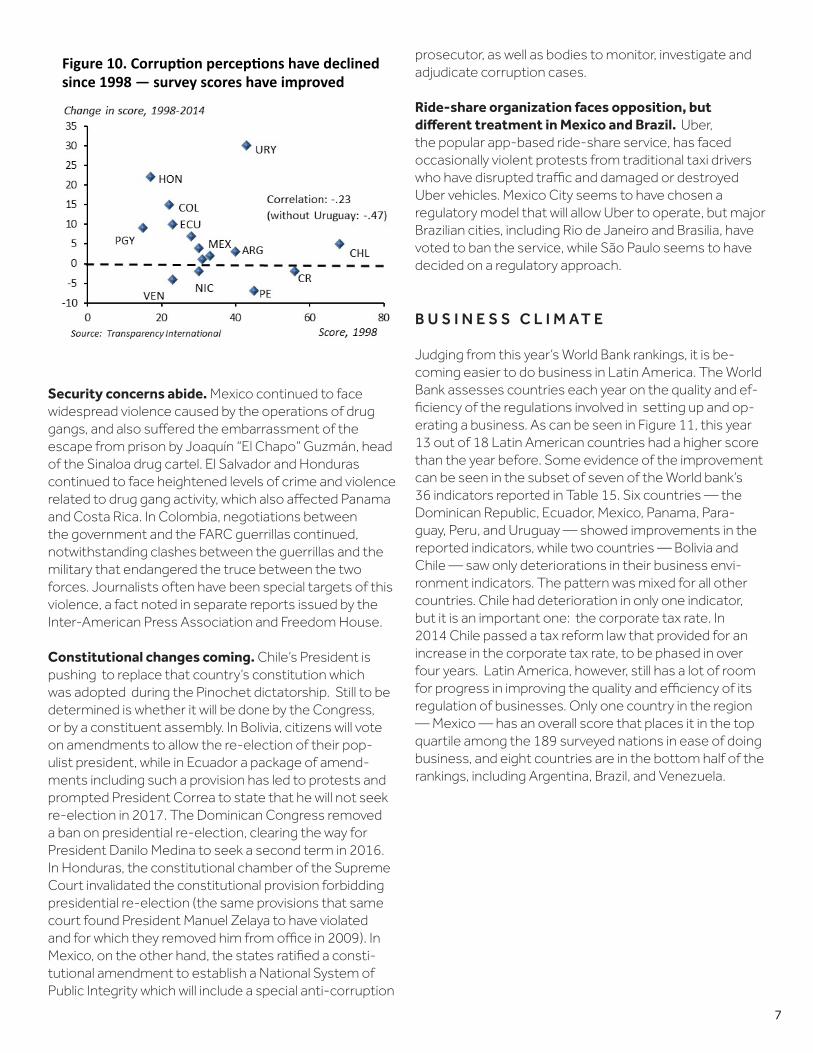
The consensus currently sees a rise in real GDP growth to 3.0% in the United States in 2016, and to 1.6% in the eurozone. Stronger growth in the developed world means stronger demand for Latin America’s exports. Weak commodity prices associated with increased supply, however, will limit the boost to Latin America’s growth from the pickup in export demand. Hopes on the part of oil analysts that oil prices would recover to around $60 per barrel have been dashed by tepid growth in Europe and the emerging markets and by the failure of OPEC to agree to production cuts. The oil futures market currently foresees that oil prices will rise from current levels, but only to about $50 per barrel by mid-year 2017. The outlook is also for continued weakness in other commodities as well, especially metals. The IMF, for example, is forecasting no recovery in the prices of copper or iron ore through 2017. However, it envisages a recovery in prices of some agricultural products such as wheat and soybeans by end-2016.
Not all countries in Latin America are major commodity exporters, and some are net importers of oil. As a result, low commodity prices will produce a divergence in per-formance across the region. Growth in the commodity producing countries will remain weak relative to economic activity in Caribbean nations that derive a large portion of their incomes from tourism. Growth also will not be greatly affected by the commodity shock in Mexico, whose major exports are manufactured goods and whose economic fortune is closely linked to that of its major trading partner, the United States, where GDP is expect-ed to grow by 2.5% in the year ahead, according to the consensus.
A sea change in the region’s political environment? Voters in Argentina and Venezuela recently sent a strong message that statist policies in those countries no longer enjoy popular support. In Argentina, Mauricio Macri, the mayor of Buenos Aires, was elected in a run-off election on November 22 against Daniel Scioli, the Peronist would-be successor to President Cristina Fernández de Kirchner. Mr. Macri’s victory means the end of 12-years of Peronist control of the executive branch in Argentina under Cristina Kirchner and her husband, the previous president, Néstor Kirchner. Mr. Macri favors a less interventionist role for the state in the economy, and has already lifted foreign exchange controls and phased out taxes on agricultural exports. He has said he would like to improve relations with Washington and the more market-oriented economies of the Pacific Alliance (Chile, Colombia, Mexico, and Peru). In Venezuela, the opposition won a two-thirds supermajority of seats in the National Assembly on December 6, delivering a powerful blow to President Nicólas Maduro and the ruling United
Figure 8. Main export des3na3ons
Figure 7. The oil futures market expects only a modest rise in prices
Figure 9. Most major La3n American currencies have fallen rela3ve to the U.S. dollar
20
40
60
80
100
120
June 14
Sep 15June 15
Jan 16
$/bbl., Brent crude
Spot price
Futures prices:
Source: Intercontinental Exchange
6
Socialist Party. It was the first clear defeat for the populist movement, founded by former president Hugo Chavez, and in power since 1999. Voters in Venezuela were frustrated by the steep decline in the economy, by price and currency controls that have resulted in shortages of food and medicines, and by the government’s increasingly harsh suppression of political dissent.
While some observers have heralded the opposition victories as a turn of the “pink tide” of populism that had swept through many countries in Latin America over the past 15 years, that conclusion would seem to be prema-ture. Peronist parties still have a majority in both houses of Congress in Argentina, and President Nicólas Maduro’s United Socialist party is still in control of the executive branch in Venezuela. Efforts to move away from interven-tionist policies can be expected to run into resistance in both countries. Populist governments in Bolivia, Ecuador, and Nicaragua, meanwhile, are still firmly in office, though weakening economies may yet lead to an erosion of support. Nonetheless, prospects for an improvement in the business environment in the region are brightening. Mauricio Macri has considerable scope to move toward more market-oriented policies through executive action in Argentina. In Venezuela the opposition has enough votes in the National Assembly to call for a presidential re-call referendum, though opposition leaders have said that their priority is to focus on improving the economy.
L E G A L E N V I R O N M E N T
As can be seen in Tables 14 and 15, the legal environ-ment in Latin America throughout 2015 largely continued existing trends. The divergence continues between the more populist group of countries — especially Argentina, Bolivia, Ecuador, and Venezuela — where governments have targeted property rights and freedom of expres-sion and freedom of the press, and countries which have demonstrated a strong commitment to the rule of law. Many countries in the region, especially Mexico and those in Central America, continue to face major security and public safety issues. Finally, corruption scandals have tarnished governments across the region, posing a chal-lenge both to political legitimacy and to judiciaries.
International and border disputes continue to simmer. In September, the International Court of Justice (ICJ) ruled that it has jurisdiction to consider Bolivia’s claim that Chile has violated its treaty obligations to provide Bolivia with sovereign access to the Pacific Ocean. The issue of access, lost in the War of the Pacific, has long embittered relations between the two countries. Elsewhere, Venezuela’s President Maduro’s proclamation of maritime defense zones offended Colombia, by claiming waters
in the Gulf of Venezuela that have never been formally demarcated between the two countries. Even more seriously, the Venezuelan proclamation claimed nearly all the territorial waters of neighboring Guyana, reviving the dormant territorial dispute between the two countries, and drew the rebuke of CARICOM nations (including many of Venezuela’s own Petrocaribe beneficiaries). Guatemala has discussed a referendum on whether to appeal its territorial dispute with Belize to the ICJ, and its incoming President, Jimmy Morales, reaffirmed Guatemalan claims. At the other end of the continent, an Argentine court issued sanctions against several oil exploration companies operating in the waters surrounding the Falkland Islands/Malvinas in defiance of Argentine laws.
Widespread corruption allegations challenge political and judicial systems. Across the hemisphere, corruption scandals have damaged the legitimacy of governments and contributed to public discontent. In Mexico, President Peña Nieto faced corruption allegations against the President, the first lady and the finance minister over alleged special deals on property. Guatemala’s President Perez Molina resigned over corruption charges. In Panama, former President Martinelli and several of this closest allies face corruption charges. Chile’s President Bachelet was weakened by a scandal involving her son. Paraguay’s government faced corruption scandals involving the national police and the comptroller general. Meanwhile, Brazil is confronting the most serious and most damaging corruption scandals in the region, with the Petrobras affair implicating members of the Labor Party as well as prominent business leaders, while other corruption charges have targeted the president of the chamber of deputies and close allies of former president Lula da Silva.
Judging from Transparency International’s 2014 survey of corruption perceptions (the most recent available), recent progress toward fighting corruption in Latin America has been mixed. Among the 21 countries covered in this report, eleven moved up in global corruption perception rankings, and 10 moved down (see Table 14). Corruption remains a serious problem in the region, with an average rank of 77 out of 175 countries. Yet viewed in a longer perspective, there are signs of improvement. Perceptions of corruption, as measured by Transparency International’s survey-based scores, have declined in all but four countries in Latin America since 1998.
7
Security concerns abide. Mexico continued to face widespread violence caused by the operations of drug gangs, and also suffered the embarrassment of the escape from prison by Joaquín “El Chapo” Guzmán, head of the Sinaloa drug cartel. El Salvador and Honduras continued to face heightened levels of crime and violence related to drug gang activity, which also affected Panama and Costa Rica. In Colombia, negotiations between the government and the FARC guerrillas continued, notwithstanding clashes between the guerrillas and the military that endangered the truce between the two forces. Journalists often have been special targets of this violence, a fact noted in separate reports issued by the Inter-American Press Association and Freedom House.
Constitutional changes coming. Chile’s President is pushing to replace that country’s constitution which was adopted during the Pinochet dictatorship. Still to be determined is whether it will be done by the Congress, or by a constituent assembly. In Bolivia, citizens will vote on amendments to allow the re-election of their pop-ulist president, while in Ecuador a package of amend-ments including such a provision has led to protests and prompted President Correa to state that he will not seek re-election in 2017. The Dominican Congress removed a ban on presidential re-election, clearing the way for President Danilo Medina to seek a second term in 2016. In Honduras, the constitutional chamber of the Supreme Court invalidated the constitutional provision forbidding presidential re-election (the same provisions that same court found President Manuel Zelaya to have violated and for which they removed him from office in 2009). In Mexico, on the other hand, the states ratified a consti-tutional amendment to establish a National System of Public Integrity which will include a special anti-corruption
Figure 10. Corrup.on percep.ons have declined since 1998 — survey scores have improved
prosecutor, as well as bodies to monitor, investigate and adjudicate corruption cases. Ride-share organization faces opposition, but different treatment in Mexico and Brazil. Uber, the popular app-based ride-share service, has faced occasionally violent protests from traditional taxi drivers who have disrupted traffic and damaged or destroyed Uber vehicles. Mexico City seems to have chosen a regulatory model that will allow Uber to operate, but major Brazilian cities, including Rio de Janeiro and Brasilia, have voted to ban the service, while São Paulo seems to have decided on a regulatory approach.
B U S I N E S S C L I M A T E
Judging from this year’s World Bank rankings, it is be-coming easier to do business in Latin America. The World Bank assesses countries each year on the quality and ef-ficiency of the regulations involved in setting up and op-erating a business. As can be seen in Figure 11, this year 13 out of 18 Latin American countries had a higher score than the year before. Some evidence of the improvement can be seen in the subset of seven of the World bank’s 36 indicators reported in Table 15. Six countries — the Dominican Republic, Ecuador, Mexico, Panama, Para-guay, Peru, and Uruguay — showed improvements in the reported indicators, while two countries — Bolivia and Chile — saw only deteriorations in their business envi-ronment indicators. The pattern was mixed for all other countries. Chile had deterioration in only one indicator, but it is an important one: the corporate tax rate. In 2014 Chile passed a tax reform law that provided for an increase in the corporate tax rate, to be phased in over four years. Latin America, however, still has a lot of room for progress in improving the quality and efficiency of its regulation of businesses. Only one country in the region — Mexico — has an overall score that places it in the top quartile among the 189 surveyed nations in ease of doing business, and eight countries are in the bottom half of the rankings, including Argentina, Brazil, and Venezuela.

8
Source: World Bank, Doing Business 2016: Measuring Regulatory Quality and Efficiency. The rankings are based on each country’s score which seeks to capture the gap between an economy’s performance and a measure of best practice cross 36 indicators, with 100 the highest possible score. The rankings are benchmarked to June 2015. The median score for 189 countries was 61.1, the top quartile had scores above 71.8. An arrow point upward indicates a higher score inthe most recent ranking.
I N V E S T I N G A N D F I N A N C E I N L A T I N A M E R I C A
Capital not only failed to earn a return commensurate with risk in Latin America in 2015, it lost principal. The MSCI Emerging Markets Latin America Index was down 34.3% in dollar terms through December 31, underperforming against markets in emerging Asia, Europe, Japan, and the United States by a wide margin. (The MSCI All-Country World Index — a broad index of stock prices in the devel-oped and emerging markets — was down 1.8% through December 31. ) Latin American equities tend to do poorly in periods of weak growth in the developed world and when commodity prices are weak, and 2015 was hardly an exception. The region’s sovereign and corporate bonds also lost value, with spreads over U.S. Treasuries widening as investors focused on weakening economies and on the prospect of higher interest rates in the U.S. A divergence developed among countries, with investors demanding wider spreads on bonds from countries with lower cred-
it ratings. Brazil’s spreads widened sharply as concerns mounted about its large budget deficit and a deepening recession that will make it difficult to keep the deficit un-der control, and its current political turmoil.
S&P downgraded Brazil’s bonds to junk status on Sep-tember 9, followed by Fitch on December 16. Venezuela’s spreads, which have been pricing in a high probability of default for many months, also widened sharply before backing down somewhat toward the end of the year. Ven-ezuela is currently rated Caa3 or CCC by the three major rating agencies, levels that signal that the country’s bonds are either extremely speculative or at risk of imminent default with little prospect of recovery. Despite suffer-ing a large deterioration in its terms of trade (the price a country gets for its exports relative to what it pays for its imports), Chile’s borrowing costs did not rise substantially in 2015. Spreads on Chile’s 10-year sovereign bond rose only about 80 basis points during the year. Chile enjoys the highest credit ratings in the region.
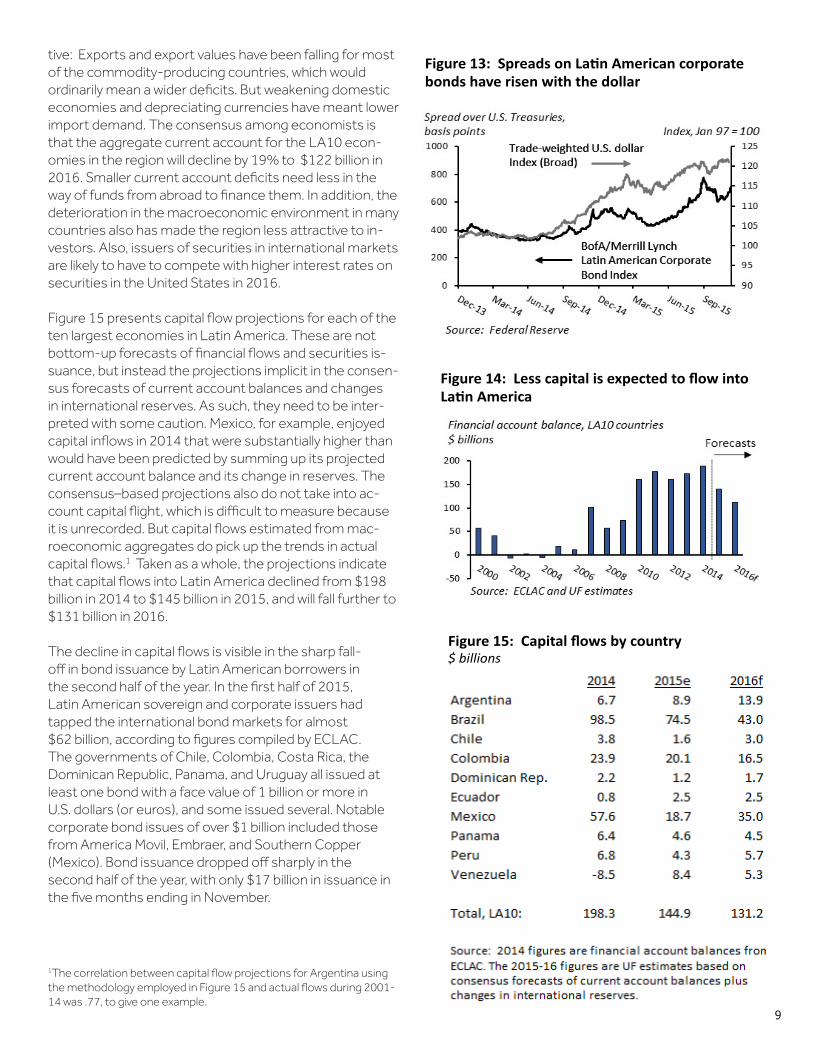
The widening of spreads on Latin American corporate bonds, meanwhile, can be traced to the higher dollar. The depreciation of Latin American currencies against the dollar makes it more expensive for firms to service dollar-denominated debt. Spreads on Latin American corporate bonds have risen by 265 basis points since the dollar started marching upward in late summer of 2014.
Capital flows into Latin America, which had held up well in 2014, declined in 2015 and are on track to decline further in 2016. Mostly the projected decline in capital inflows reflects smaller current account deficits. This is notintui-
Figure 11: World Bank ease of doing business rankings
2015 Rank ScoreMexico 38 73.7 ↑Chile 48 71.5 ↑Peru 50 71.3Colombia 54 70.4 ↑Costa Rica 58 68.6 ↑Panama 69 65.7Guatemala 81 63.5 ↑El Salvador 86 62.8 ↑Uruguay 92 61.2 ↑Dominican Rep.93 61.2 ↑Paraguay 100 60.2Honduras 110 58.1 ↑Brazil 116 57.7 ↑Ecuador 117 57.5 ↑Argentina 121 56.8Nicaragua 125 55.8 ↑Haiti 182 39.6 ↑Venezuela 186 35.5
Figure 12: Widening sovereign spreads Spreads over U.S. Treasury yields on 10-‐year U.S. dollar-‐denominated government bonds
9
Figure 13: Spreads on La3n American corporate bonds have risen with the dollar
Figure 14: Less capital is expected to flow into La3n America
Figure 15: Capital flows by country $ billions
1The correlation between capital flow projections for Argentina using the methodology employed in Figure 15 and actual flows during 2001-14 was .77, to give one example.
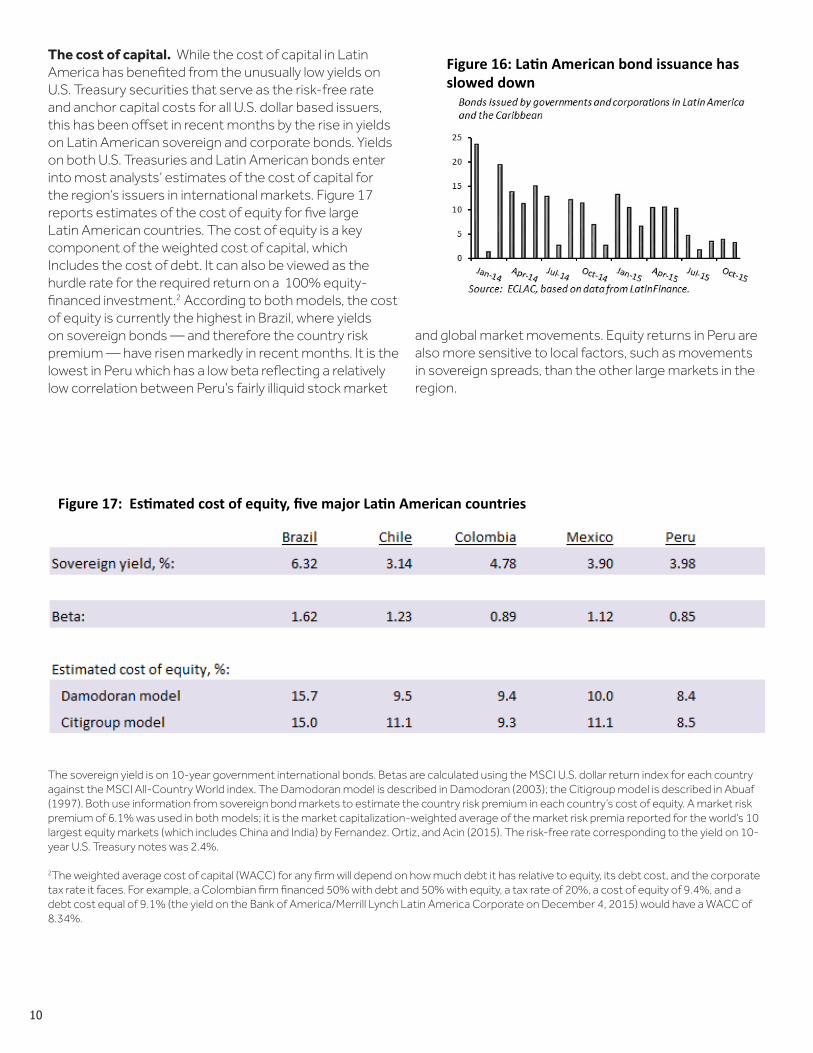
tive: Exports and export values have been falling for most of the commodity-producing countries, which would ordinarily mean a wider deficits. But weakening domestic economies and depreciating currencies have meant lower import demand. The consensus among economists is that the aggregate current account for the LA10 econ-omies in the region will decline by 19% to $122 billion in 2016. Smaller current account deficits need less in the way of funds from abroad to finance them. In addition, the deterioration in the macroeconomic environment in many countries also has made the region less attractive to in-vestors. Also, issuers of securities in international markets are likely to have to compete with higher interest rates on securities in the United States in 2016.
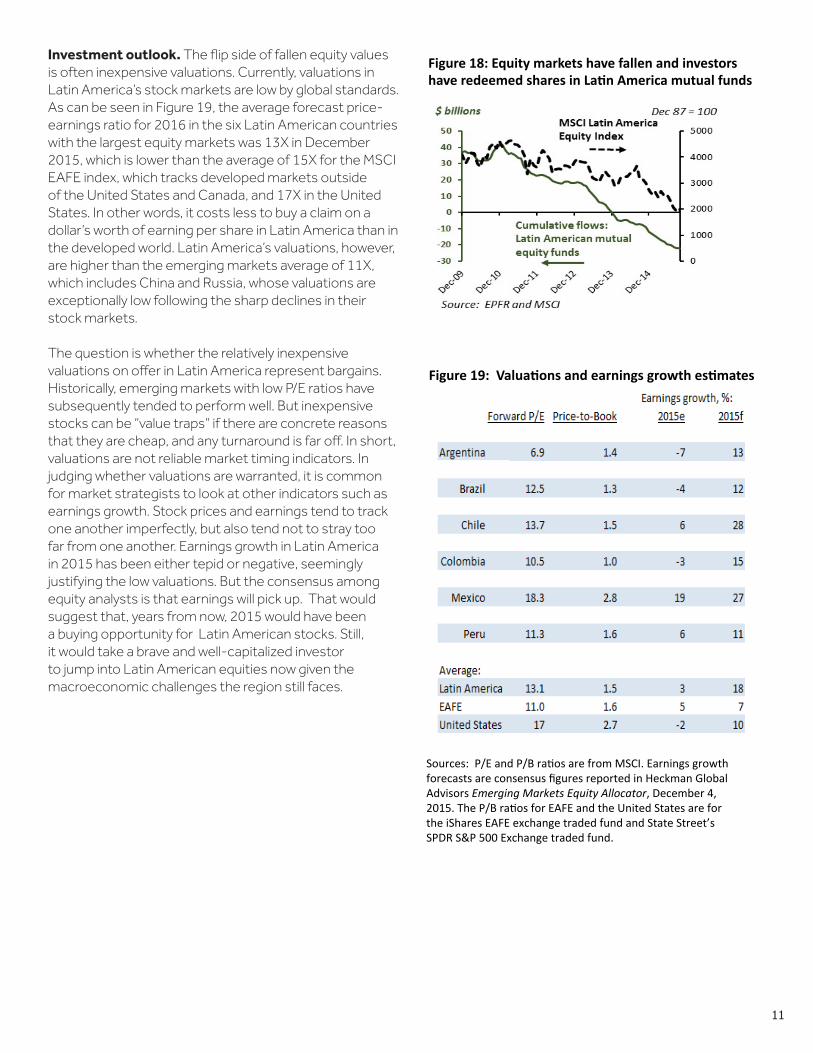
Figure 15 presents capital flow projections for each of the ten largest economies in Latin America. These are not bottom-up forecasts of financial flows and securities is-suance, but instead the projections implicit in the consen-sus forecasts of current account balances and changes in international reserves. As such, they need to be inter-preted with some caution. Mexico, for example, enjoyed capital inflows in 2014 that were substantially higher than would have been predicted by summing up its projected current account balance and its change in reserves. The consensus–based projections also do not take into ac-count capital flight, which is difficult to measure because it is unrecorded. But capital flows estimated from mac-roeconomic aggregates do pick up the trends in actual capital flows.1 Taken as a whole, the projections indicate that capital flows into Latin America declined from $198 billion in 2014 to $145 billion in 2015, and will fall further to $131 billion in 2016.
The decline in capital flows is visible in the sharp fall-off in bond issuance by Latin American borrowers in the second half of the year. In the first half of 2015, Latin American sovereign and corporate issuers had tapped the international bond markets for almost $62 billion, according to figures compiled by ECLAC. The governments of Chile, Colombia, Costa Rica, the Dominican Republic, Panama, and Uruguay all issued at least one bond with a face value of 1 billion or more in U.S. dollars (or euros), and some issued several. Notable corporate bond issues of over $1 billion included those from America Movil, Embraer, and Southern Copper (Mexico). Bond issuance dropped off sharply in the second half of the year, with only $17 billion in issuance in the five months ending in November.
10
The cost of capital. While the cost of capital in Latin America has benefited from the unusually low yields on U.S. Treasury securities that serve as the risk-free rate and anchor capital costs for all U.S. dollar based issuers, this has been offset in recent months by the rise in yields on Latin American sovereign and corporate bonds. Yieldson both U.S. Treasuries and Latin American bonds enter into most analysts’ estimates of the cost of capital for the region’s issuers in international markets. Figure 17 reports estimates of the cost of equity for five large Latin American countries. The cost of equity is a key component of the weighted cost of capital, which Includes the cost of debt. It can also be viewed as the hurdle rate for the required return on a 100% equity-financed investment.2 According to both models, the cost of equity is currently the highest in Brazil, where yields on sovereign bonds — and therefore the country risk premium — have risen markedly in recent months. It is the lowest in Peru which has a low beta reflecting a relatively low correlation between Peru’s fairly illiquid stock market
and global market movements. Equity returns in Peru are also more sensitive to local factors, such as movements in sovereign spreads, than the other large markets in the region.
Figure 16: La-n American bond issuance has slowed down
Figure 17: Es-mated cost of equity, five major La-n American countries
The sovereign yield is on 10-year government international bonds. Betas are calculated using the MSCI U.S. dollar return index for each country against the MSCI All-Country World index. The Damodoran model is described in Damodoran (2003); the Citigroup model is described in Abuaf (1997). Both use information from sovereign bond markets to estimate the country risk premium in each country’s cost of equity. A market risk premium of 6.1% was used in both models; it is the market capitalization-weighted average of the market risk premia reported for the world’s 10 largest equity markets (which includes China and India) by Fernandez. Ortiz, and Acin (2015). The risk-free rate corresponding to the yield on 10-year U.S. Treasury notes was 2.4%.
2The weighted average cost of capital (WACC) for any firm will depend on how much debt it has relative to equity, its debt cost, and the corporate tax rate it faces. For example, a Colombian firm financed 50% with debt and 50% with equity, a tax rate of 20%, a cost of equity of 9.4%, and a debt cost equal of 9.1% (the yield on the Bank of America/Merrill Lynch Latin America Corporate on December 4, 2015) would have a WACC of 8.34%.
11
Investment outlook. The flip side of fallen equity values is often inexpensive valuations. Currently, valuations in Latin America’s stock markets are low by global standards. As can be seen in Figure 19, the average forecast price-earnings ratio for 2016 in the six Latin American countries with the largest equity markets was 13X in December 2015, which is lower than the average of 15X for the MSCI EAFE index, which tracks developed markets outside of the United States and Canada, and 17X in the United States. In other words, it costs less to buy a claim on a dollar’s worth of earning per share in Latin America than in the developed world. Latin America’s valuations, however, are higher than the emerging markets average of 11X, which includes China and Russia, whose valuations are exceptionally low following the sharp declines in their stock markets.
The question is whether the relatively inexpensive valuations on offer in Latin America represent bargains. Historically, emerging markets with low P/E ratios have subsequently tended to perform well. But inexpensive stocks can be “value traps” if there are concrete reasons that they are cheap, and any turnaround is far off. In short, valuations are not reliable market timing indicators. In judging whether valuations are warranted, it is common for market strategists to look at other indicators such as earnings growth. Stock prices and earnings tend to track one another imperfectly, but also tend not to stray too far from one another. Earnings growth in Latin America in 2015 has been either tepid or negative, seemingly justifying the low valuations. But the consensus among equity analysts is that earnings will pick up. That would suggest that, years from now, 2015 would have been a buying opportunity for Latin American stocks. Still, it would take a brave and well-capitalized investor to jump into Latin American equities now given the macroeconomic challenges the region still faces.
Figure 18: Equity markets have fallen and investors have redeemed shares in La;n America mutual funds
Figure 19: Valua.ons and earnings growth es.mates
Sources: P/E and P/B ra1os are from MSCI. Earnings growth forecasts are consensus figures reported in Heckman Global Advisors Emerging Markets Equity Allocator, December 4, 2015. The P/B ra1os for EAFE and the United States are for the iShares EAFE exchange traded fund and State Street’s SPDR S&P 500 Exchange traded fund.
12
N A F T A R E G I O N
M E X I C O▲
• Economic activity is picking up despite lower oil prices.
• Banxico will raise rates along with the Fed — for a while.
• The need to rebuild confidence is distracting from the implementation of President Enrique Peña Nieto’s reform agenda.
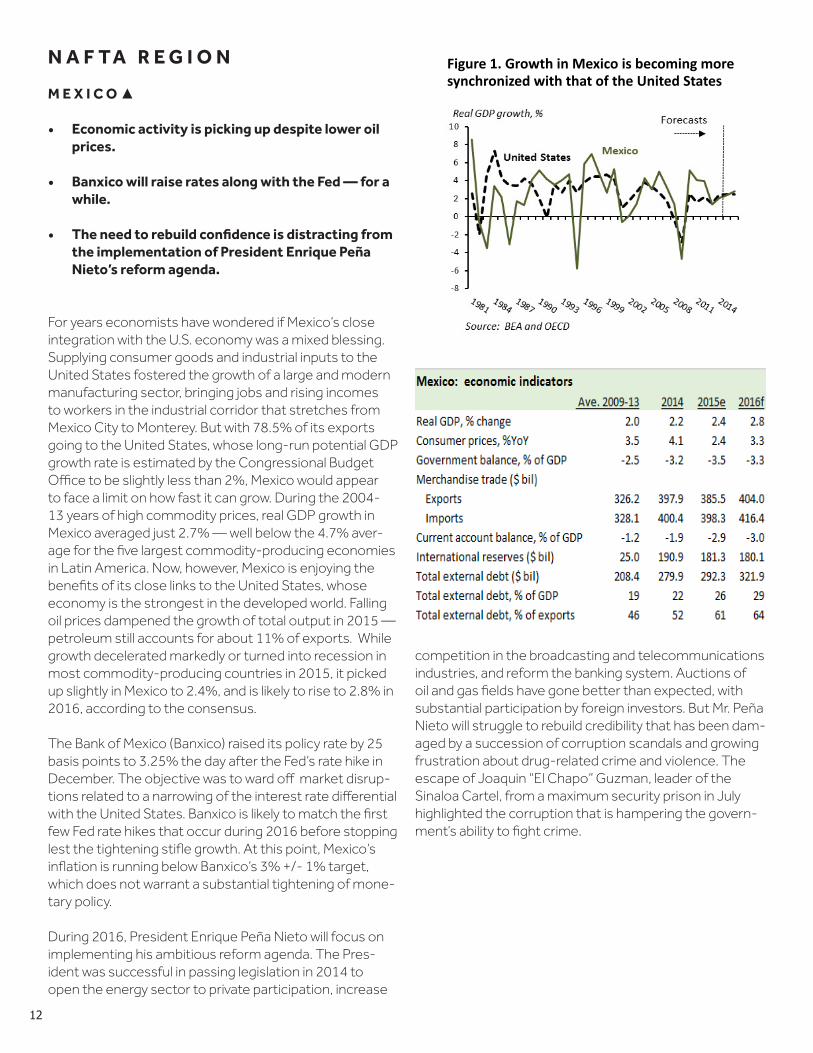
For years economists have wondered if Mexico’s close integration with the U.S. economy was a mixed blessing. Supplying consumer goods and industrial inputs to the United States fostered the growth of a large and modern manufacturing sector, bringing jobs and rising incomes to workers in the industrial corridor that stretches from Mexico City to Monterey. But with 78.5% of its exports going to the United States, whose long-run potential GDP growth rate is estimated by the Congressional Budget Office to be slightly less than 2%, Mexico would appear to face a limit on how fast it can grow. During the 2004-13 years of high commodity prices, real GDP growth in Mexico averaged just 2.7% — well below the 4.7% aver-age for the five largest commodity-producing economies in Latin America. Now, however, Mexico is enjoying the benefits of its close links to the United States, whose economy is the strongest in the developed world. Falling oil prices dampened the growth of total output in 2015 — petroleum still accounts for about 11% of exports. While growth decelerated markedly or turned into recession in most commodity-producing countries in 2015, it picked up slightly in Mexico to 2.4%, and is likely to rise to 2.8% in 2016, according to the consensus.
The Bank of Mexico (Banxico) raised its policy rate by 25 basis points to 3.25% the day after the Fed’s rate hike in December. The objective was to ward off market disrup-tions related to a narrowing of the interest rate differential with the United States. Banxico is likely to match the first few Fed rate hikes that occur during 2016 before stopping lest the tightening stifle growth. At this point, Mexico’s inflation is running below Banxico’s 3% +/- 1% target, which does not warrant a substantial tightening of mone-tary policy.
During 2016, President Enrique Peña Nieto will focus on implementing his ambitious reform agenda. The Pres-ident was successful in passing legislation in 2014 to open the energy sector to private participation, increase
competition in the broadcasting and telecommunications industries, and reform the banking system. Auctions of oil and gas fields have gone better than expected, with substantial participation by foreign investors. But Mr. Peña Nieto will struggle to rebuild credibility that has been dam-aged by a succession of corruption scandals and growing frustration about drug-related crime and violence. The escape of Joaquin “El Chapo” Guzman, leader of the Sinaloa Cartel, from a maximum security prison in July highlighted the corruption that is hampering the govern-ment’s ability to fight crime.
Figure 1. Growth in Mexico is becoming more synchronized with that of the United States
13
L E G A L E N V I R O N M E N T
New anti-corruption system created. In May, constitutional reforms to create a National Anti-Corruption System were adopted. The comprehensive reforms will require additional implementing legislation. The new system will include a committee to help coordinate federal, state and local efforts. The system will give new authority to the federal audit office to supervise the use of federal funds, while a new administrative court will handle major corruption cases. The reforms also include whistleblower provisions to encourage officials or citizens to report corruption. Tax and banking secrecy laws will be relaxed for agencies investigating and punishing corruption. Finally, the reforms also include heightened sanctions for individuals and corporations involved in corruption.
New transparency law adopted. In May, the new Transparency and Access to Public Information Law took effect. The law creates a new National Institute of Transparency, Access to Information, and Personal Data Protection, and provides that all agencies except the Supreme Court are obliged to submit relevant information to the institute upon request.
Minimum wage now standardized across Mexico. On October 1, the wages commission completed its consolidation of wage zones across Mexico from three to one zone. As a result, a minimum wage of 70.10 pesos per day took effect across the country.
Human rights commissions criticize slow pace of murder investigations. In June, the Inter-American Commission on Human Rights condemned the government for the slow pace and lack of cooperation in investigating the murder of 43 teaching college students in Iguala in September 2014. The Mexican human rights commission made similar allegations regarding an alleged murder of civilians by the military in Tlataya in June 2014. Both commissions noted that requests for information and to review case files had not been granted. The Iguala crime was blamed on drug gangs operating with the support of the town’s police and mayor, but relatives of the victims claim that the army also may have been involved.
Criminal procedure reforms expand to Sonora state. National criminal procedure reforms adopted in 2008 and intended to be implemented nationwide by 2016 will shift Mexican courts from the traditional written process to one of oral trials. The reforms also are intended to better protect defendants. Sonora state, which began to implement the reforms in September, is the last state to
adopt the new reform. Sonora will phase in the reforms through May 2016, with lesser crimes subject to the new processes immediately.
Mexican Supreme Court rules in marijuana case. In a November decision, the Mexican Supreme Court found that the laws criminalizing possession and consumption of marijuana violated constitutional guarantees of self-determination and free personal development. The court found that any benefit the law may have was disproportional to the harm produced. The court’s decision only applies to the four people who brought the case, all of whom are members of an organization working for to decriminalize marijuana use. However, the case is a precedent that likely will be used to weaken or remove laws prohibiting personal marijuana use.
Mexican court finds same-sex marriage bans unconstitutional. In June, Mexico’s Supreme Court declared that it was unconstitutional for states to ban same-sex marriages. The court did not invalidate local marriage laws, but provided that persons who are refused marriage rights can appeal to a judge who would have to enforce the right to marry. Currently, only one Mexican state and Mexico City allow same-sex marriage.
United States to expand access for Mexican trucks. After a three-year pilot program, the U.S. Department of Transportation will allow Mexican trucking companies to apply for long-haul operating authority throughout the Unites States. The trucking companies will need to pass safety audits, while drivers will need valid commercial permits and must meet English proficiency requirements. The the access program fulfils a key NAFTA requirement, and marks the final resolution of a long-running dispute between Mexico and the United States on access.
B U S I N E S S E N V I R O N M E N T
At 38th place, Mexico is the highest ranked Latin American country in the World Bank’s ease of doing business rankings, and rose four spots in the rankings in the past year. That places Mexico comfortably in the highest quartile in the rankings worldwide. In two areas, ease of getting credit and resolving insolvencies, Mexico ranks even higher than its overall ranking. Mexico slipped in its Economic Freedom rank, but rose to the 38th percentile in the World Bank’s rule of law ranking. Despite the corruption scandals that made headlines in 2015, survey-based perceptions of corruption actually improved this year.
14
T H E C A R I B B E A N
C U B A ▲
• Cuba is undertaking reforms to make its economy more market-oriented.
• Cuba’s economy is still mostly state-controlled, with little sign that the government intends to ease its tight control of the political system.
• Cuba is dependent on agricultural imports, much of which comes from the United States.
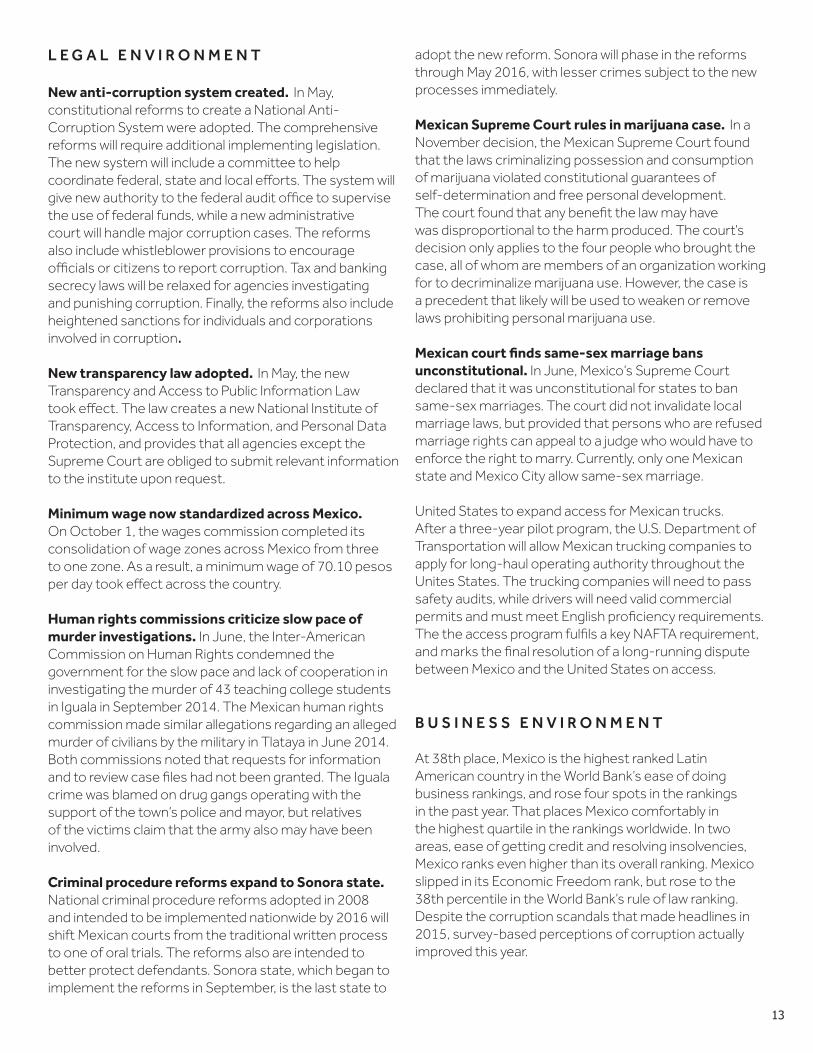
After officially becoming president in February 2008, Raúl Castro launched a series of reforms intended to allow market forces to play a larger role in the Cuban economy. The reforms included:
1. Agricultural reform – individuals and cooperatives and state entities were permitted to cultivate small plots of land (up to 165 acres after 2012) and retain the proceeds of the sale of the crops. The government, however, retained ownership of the land. As of the end of 2012, 3.7 million acres of idle land had been distributed to 174,271 individuals and 2,700 legal entities (Mesa-Lago, 2014).
2. Self-employment – employment in the private sector, which had been permitted on a limited basis, was expanded to include skilled jobs and the operation of small businesses such as restaurants, room rentals, construction, and transportation.
3. More autonomy for state enterprises – instead of allocating resources to under a rigid, central plan, state enterprises have been allowed to retain 50% of their after-tax profits, and managers have been given more authority to make their own decisions.
4. Real estate – the government confiscated most housing in 1960, but allowed monthly rent to be contributed toward homeownership. Although most of the population owns their own homes, private construction was banned and many residences are in disrepair, resulting in a national housing shortage. A 2011 reform allows Cuban citizens and foreigners to purchase and sell homes, own a second home, and include homes in bequests to relatives.
The impetus for these reforms was economic necessity. Cuba’s economy was – and still is – mostly state-controlled, and almost 80% of the population is employed by the government. Wages are often too low to support basic human needs, forcing individuals to attempt to earn
income in the unofficial market. Cuba has long maintained that its population was fully employed, but according to official estimates as of 2011 between 1.3 to 1.8 million workers (between 26% and 36% of the workforce) were underutilized, which reduced productivity, and wages and made them a fiscal burden. The government had dismissed almost 600,000 employees at by the start of 2014 and had targeted 1.8 million layoffs for 2014-15. (Mesa-Logo, 2014). The creation of non-state jobs was necessary to absorb these dismissed employees. So far, however, the growth of jobs in the private sector has not been adequate to provide employment for all of the dismissed employees, and Cuba’s unemployment rate has risen to 3% in 2015 according to the Economist Intelligence Unit, though the unemployment rate does not include those not actively looking for jobs.
Further progress in implementing the market-oriented reforms that began in February 2008 is likely to be uneven, and some backtracking has already occurred.
Figure 1: Employment outside of government Is growing
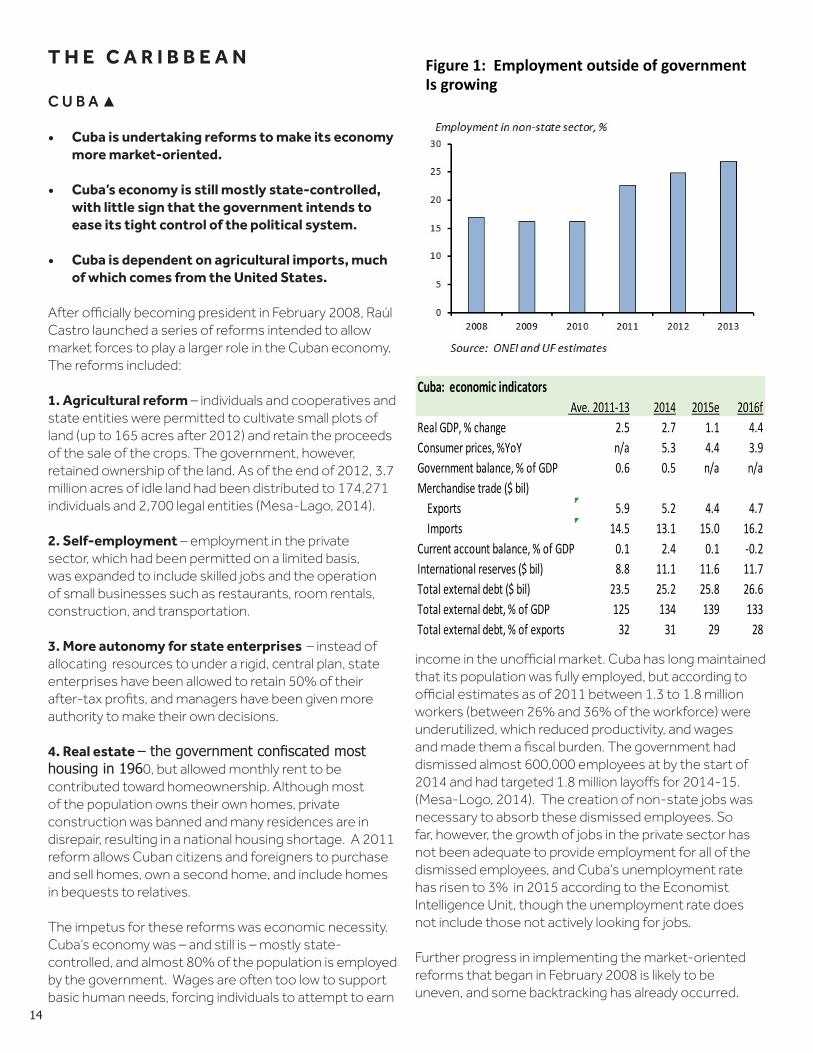
Cuba: economic indicators Ave. 2011-13 2014 2015e 2016f
Real GDP, % change 2.5 2.7 1.1 4.4Consumer prices, %YoY n/a 5.3 4.4 3.9Government balance, % of GDP 0.6 0.5 n/a n/aMerchandise trade ($ bil) Exports 5.9 5.2 4.4 4.7 Imports 14.5 13.1 15.0 16.2Current account balance, % of GDP 0.1 2.4 0.1 -0.2International reserves ($ bil) 8.8 11.1 11.6 11.7Total external debt ($ bil) 23.5 25.2 25.8 26.6Total external debt, % of GDP 125 134 139 133Total external debt, % of exports 32 31 29 28
15
Responding to widespread increases in food prices, the Cuban government in January 2016 moved to reinstate price controls for rice and other food items. The actions reversed an earlier agricultural liberalization that allowed market prices for produce. The new price control measures are combined with efforts by the state to sell basic foodstuffs directly to the public at state-owned stores, and to ban privately owned trucks from delivering to retail vendors.”
The sectors of the Cuba’s economy that generate the bulk of its foreign exchange earnings are tourism (with 3 million tourists visiting Cuba in 2014), nickel mining, and the export of medical services – mostly to Venezuela in exchange for oil. Cubans receive an estimated $4 billion per year in remittances from relatives living abroad, which amounts to about 4.4% of GDP. Cuba is heavily dependent on Venezuela for oil, and in 2000 signed an agreement with Venezuela under which it obtains 100,000 barrels of oil per day (about two thirds of domestic consumption) on preferential terms. Cuba is concerned that Venezuela will cease or cut back on its support.
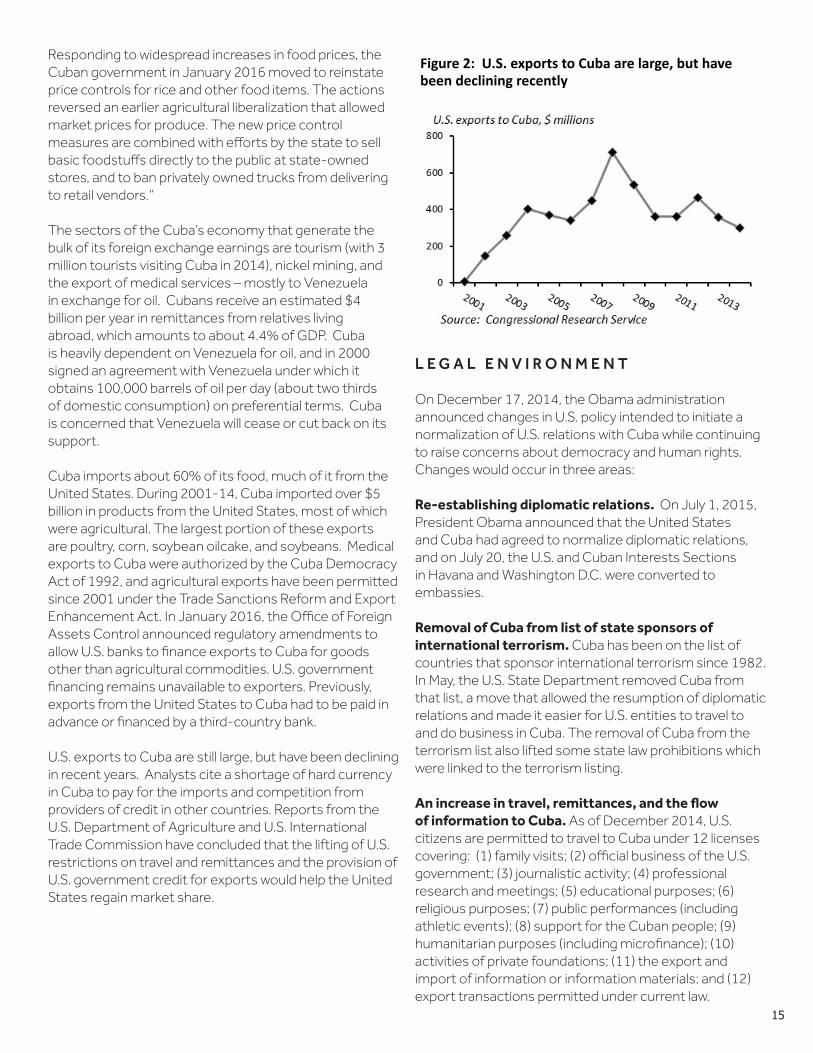
Cuba imports about 60% of its food, much of it from the United States. During 2001-14, Cuba imported over $5 billion in products from the United States, most of which were agricultural. The largest portion of these exports are poultry, corn, soybean oilcake, and soybeans. Medical exports to Cuba were authorized by the Cuba Democracy Act of 1992, and agricultural exports have been permitted since 2001 under the Trade Sanctions Reform and Export Enhancement Act. In January 2016, the Office of Foreign Assets Control announced regulatory amendments to allow U.S. banks to finance exports to Cuba for goods other than agricultural commodities. U.S. government financing remains unavailable to exporters. Previously, exports from the United States to Cuba had to be paid in advance or financed by a third-country bank.
U.S. exports to Cuba are still large, but have been declining in recent years. Analysts cite a shortage of hard currency in Cuba to pay for the imports and competition from providers of credit in other countries. Reports from the U.S. Department of Agriculture and U.S. International Trade Commission have concluded that the lifting of U.S. restrictions on travel and remittances and the provision of U.S. government credit for exports would help the United States regain market share.
L E G A L E N V I R O N M E N T
On December 17, 2014, the Obama administration announced changes in U.S. policy intended to initiate a normalization of U.S. relations with Cuba while continuing to raise concerns about democracy and human rights. Changes would occur in three areas:
Re-establishing diplomatic relations. On July 1, 2015, President Obama announced that the United States and Cuba had agreed to normalize diplomatic relations, and on July 20, the U.S. and Cuban Interests Sections in Havana and Washington D.C. were converted to embassies.
Removal of Cuba from list of state sponsors of international terrorism. Cuba has been on the list of countries that sponsor international terrorism since 1982. In May, the U.S. State Department removed Cuba from that list, a move that allowed the resumption of diplomatic relations and made it easier for U.S. entities to travel to and do business in Cuba. The removal of Cuba from the terrorism list also lifted some state law prohibitions which were linked to the terrorism listing.
An increase in travel, remittances, and the flow of information to Cuba. As of December 2014, U.S. citizens are permitted to travel to Cuba under 12 licenses covering: (1) family visits; (2) official business of the U.S. government; (3) journalistic activity; (4) professional research and meetings; (5) educational purposes; (6) religious purposes; (7) public performances (including athletic events); (8) support for the Cuban people; (9) humanitarian purposes (including microfinance); (10) activities of private foundations; (11) the export and import of information or information materials; and (12) export transactions permitted under current law.
Figure 2: U.S. exports to Cuba are large, but have been declining recently
16
In addition, travelers are no longer subject to a daily limit on expenditures, and may bring back to Cuba up to $400 in goods, with no more than $100 in tobacco or alcohol products combined. U.S. credit and debit cards may now be used in Cuba, but the financial and technological arrangements for their use are not yet in place.
The Obama administration had lifted all restrictions on family visits and remittances to family members in April 2009, and in January 2011 eased restrictions on travel to Cuba for a number of designated purposes, including educational, journalistic, and religious activities, and allowed limited remittances to non-family members. The administration also permitted U.S. international airports to initiate charter flights to Cuba. Negotiations are currently in progress with Cuba to permit regularly scheduled direct flights rather than charter flights. In May 2015, the administration permitted cruise and ferry service to Cuba, though additional permits are still required. In September 2015, all limits on remittances to non-family members were removed.
The trade embargo remains in place. The export of goods and services not specifically authorized in existing legislation and investment in Cuba is prohibited under the Helms-Burton Act of 1996, which extended an embargo originally put into place in 1960. The embargo also denies U.S. exporters access to U.S. government credits. A repeal of the embargo would require Congressional action. Major stumbling blocks to full normalization of economic and civil relations with Cuba include human rights, which remain a key concern of the U.S. government, and the settlement of claims for property expropriated during the Cuban Revolution. The Foreign Claim Settlement Commission of the U.S. Department of Justice has recognized 5,913 in claims for expropriated U.S. property in Cuba worth $1.9 billion, equal to approximately $8 billion at interest. Cuba disputes the valuation of these claims, and maintains that any settlement should recognize the value of losses Cuba has incurred from the embargo.
No changes to U.S. laws regarding Cuban immigrants. Large numbers of Cuban immigrants have been travelling to the United States by way of Central America and Mexico motivated by concerns that U.S. laws that provide favorable treatment to Cuban immigrants may change with the improvement of relations between the two countries. The Cuban Adjustment Act of 1996 allowed Cuban nationals who arrive in the U.S. to remain in the country, though immigrants can still be turned away at sea. The Obama administration announced that it has no plans to change current U.S. migration policies.
Cuban law from 2014 intended to promote and guide foreign investment. Cuba’s Foreign Investment Law, Law 118/2014, will allow increased foreign direct investment. Although the law theoretically allows 100% foreign ownership of joint operations, in practice most projects have been with a Cuban government holding company having majority ownership. Priority sectors for foreign investment include agricultural and food production, health, energy, mining, and tourism. The law provides for certain tax incentives for investors, including no taxes on dividends and an exemption from income tax for eight years (following which the tax rate will be 15%). State control and guidance is maintained, and foreign projects will continue to require government approval. Cuban labor laws have not changed, and most foreign investment projects will continue to involve the use of Cuban nationals who remain employed by a state employment company.
Mariel Special Development Zone begins to attract new investors. The port of Mariel, 30 miles west of Havana, was designated by the Cuban government in 2014 as a special development zone. With a loan from Brazil, the port facilities and infrastructure have been upgraded and should be operational in 2016. Mariel should replace Havana as the country’s main container port. The Cuban government has offered investors additional tax incentives, including a ten-year holiday on taxes on any profits and unlimited ability to repatriate profits. Cleber LLC, a tractor assembly company, is the first U.S. company to request permission from the U.S. Treasury for a license to construct a facility in Mariel.
Cuba’s Exchange Rate RegimeThe Cuban government announced in October 2013 that it would unify its system of dual exchange rates, but official inaction suggests it has been delayed, according to the Economist Intelligence Unit. Currently, most Cuban citizens are paid in CUP, the currency in which most domestically produced goods are priced. The other currency, the CUC, is used for imported goods and tourist transactions. The CUC is pegged at one CUC per dollar, though state enterprises now use a variable exchange rate of about 10 CUP per CUC. The unofficial exchange rate between the two domestic currencies in the non-state sector is currently 24 CUP per CUC. A unification of the exchange rate at a market-determined rate would eventually lead to a better allocation of resources to productive activities in the economy, but the transition period could be disruptive.
17
D O M I N I C A N R E P U B L I C =
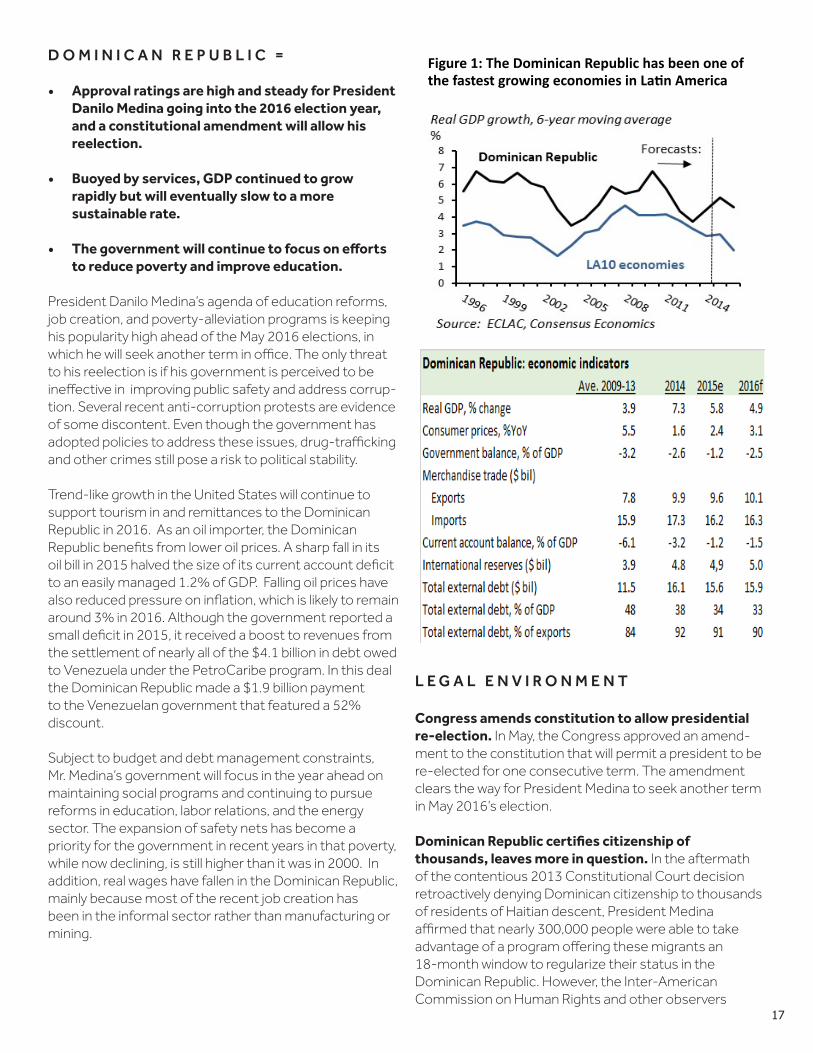
• Approval ratings are high and steady for President Danilo Medina going into the 2016 election year, and a constitutional amendment will allow his reelection.
• Buoyed by services, GDP continued to grow rapidly but will eventually slow to a more sustainable rate.
• The government will continue to focus on efforts to reduce poverty and improve education.
President Danilo Medina’s agenda of education reforms, job creation, and poverty-alleviation programs is keeping his popularity high ahead of the May 2016 elections, in which he will seek another term in office. The only threat to his reelection is if his government is perceived to be ineffective in improving public safety and address corrup-tion. Several recent anti-corruption protests are evidence of some discontent. Even though the government has adopted policies to address these issues, drug-trafficking and other crimes still pose a risk to political stability.
Trend-like growth in the United States will continue to support tourism in and remittances to the Dominican Republic in 2016. As an oil importer, the Dominican Republic benefits from lower oil prices. A sharp fall in its oil bill in 2015 halved the size of its current account deficit to an easily managed 1.2% of GDP. Falling oil prices have also reduced pressure on inflation, which is likely to remain around 3% in 2016. Although the government reported a small deficit in 2015, it received a boost to revenues fromthe settlement of nearly all of the $4.1 billion in debt owed to Venezuela under the PetroCaribe program. In this deal the Dominican Republic made a $1.9 billion payment to the Venezuelan government that featured a 52% discount.
Subject to budget and debt management constraints, Mr. Medina’s government will focus in the year ahead on maintaining social programs and continuing to pursue reforms in education, labor relations, and the energy sector. The expansion of safety nets has become a priority for the government in recent years in that poverty, while now declining, is still higher than it was in 2000. In addition, real wages have fallen in the Dominican Republic, mainly because most of the recent job creation has been in the informal sector rather than manufacturing or mining.
L E G A L E N V I R O N M E N T
Congress amends constitution to allow presidential re-election. In May, the Congress approved an amend-ment to the constitution that will permit a president to be re-elected for one consecutive term. The amendment clears the way for President Medina to seek another term in May 2016’s election.
Dominican Republic certifies citizenship of thousands, leaves more in question. In the aftermath of the contentious 2013 Constitutional Court decision retroactively denying Dominican citizenship to thousands of residents of Haitian descent, President Medina affirmed that nearly 300,000 people were able to take advantage of a program offering these migrants an 18-month window to regularize their status in the Dominican Republic. However, the Inter-American Commission on Human Rights and other observers
Figure 1: The Dominican Republic has been one of the fastest growing economies in La;n America

18
criticized the deportations of and attacks against Haitian descendants. The Dominican Republic denies that there have been arbitrary deportations. An attempt by the OAS to mediate in the dispute was rebuffed as interference with the country’s independence.
Constitutional Court invalidates loosened abortion restrictions. Penal code reforms enacted in 2014 included a provision that allowed the use of abortion in cases of rape or incest, when the fetus was deformed, or when the woman’s life was endangered by the pregnancy. In early December, in a petition brought by conservative and religious groups, the constitutional court found this provision unconstitutional, restoring the previously existing total ban on abortion in the country.
Changes to tax incentives offered for free trade zones. Starting in 2016, companies operating in the Dominican Republic’s 55 free trade zones will be able to offer any amount of products for sale throughout the Dominican market. Until now, only 20% of products manufactured or assembled in a free trade zone could be sold on the local market.
B U S I N E S S E N V I R O N M E N T
Out of 189 economies, the Dominican Republic is ranked 93rd in ease of doing business according to the World Bank. Unfortunately, it fell three places from last year’s report. The Dominican Republic dropped in all categories, except the trading across borders category, where it increased by 6 points. Its highest ratings were in dealing with construction permits and trading across borders in which it is the 3rd best in all of Latin America and the Caribbean. Transparency International ranks the Dominican Republic 100th in its Corruption Perception Index. In Latin America only Nicaragua, Paraguay, Haiti and Venezuela have lower corruption rankings.
19
C E N T R A L A M E R I C A
C O S T A R I C A =
Costa Rica grew modestly in 2015, buoyed by lower fuel prices and a strengthened economy in the United States, its primary export market. The country was formally invited to join the Organization for Economic Cooperation and Development (OECD), a recognition of its economic and fiscal maturity. New president Guillermo Solís, how-ever, faced political turmoil, losing his culture minister to a scandal over a failed international culture festival, and his minister of science, technology and telecommunications over a proposed media law that would have weakened Costa Rica’s traditional freedom of the press. The govern-ment has proposed a tax reform bill which would replace the country’s 13% sales tax with a value added tax, at an initial rate of 14%, rising to 15% in the second year. The tax proposal also includes significant increases to person-al income tax rates.
The business environment continues to be favorable. Costa Rica is ranked 58th in the World Bank’s 2016 ease-of-doing-business report, rising a remarkable 21 places since the 2015 report. It showed large improvements in access to credit and its tax situation. Costa Rica is ranked 47th in the world in Transparency International’s 2014 perceptions of corruption rankings. Only Chile and Uruguay are ranked higher. Costa Rica is in the 71st percentile rank for rule of law in the World Bank’s governance indicators, again following only Chile and Uruguay. Costa Rica is ranked 51st in the latest Economic Freedom Index.
Corporate tax law held unconstitutional. In January, the constitutional chamber of Costa Rica’s Supreme Court found that the corporate tax law, originally adopted in 2011, was unconstitutional due to procedural errors in the original, official publication of the proposal. The court suspended collection of the tax as of 2016.
New banking law may help finance small enterprises. The Law for Development Banking, enacted in November 2014, took effect in May. Intended to encourage Costa Rican banks to promote small and medium enterprises by reserving some 10% to 17% of the amount of a bank’s short-term deposits for financing these entities at more favorable interest rates. The new law also eliminated a policy under which foreign banks registered with the Costa Rican central bank were exempt from withholding taxes on loans which are now subject to a tax rate of between 5.5 to 15%. The action may have the effect of reducing some activities by foreign banks.
International Court of Justice settles boundary dispute with Nicaragua. In December, the International Court of Justice (ICJ) ruled on a dispute between Costa Rica and Nicaragua on the San Juan River, which divides the two countries. The judges found that Nicaraguan drainage and canal projects on the river encroached on Costa Rica’s sovereignty.
E L S A LV A D O R =
El Salvador’s economic performance has lagged behind other countries in Central America in recent years, a pattern which will likely continue in 2016. In November, Moody’s downgraded the country’s outlook to negative, pointing to the need to stabilize debt and government finances. A major piece of the problem is an inadequately funded pensions system, and 2016 should see a pensions reform proposal by the FMLN government of President Salvador Sánchez Cerén, a former guerrilla leader. Homicide and violent crime levels increased from an already high level in 2015, fueled by violence from drug gangs. An attempt to reinstitute a gang truce proved abortive.
Some improvement in El Salvador’s business climate. The World Bank ranked El Salvador 86th in its 2016 ease of doing business report, an improvement from its 97th place showing in the 2015 report. Better access to credit was the main reason for the rise. As for perceptions
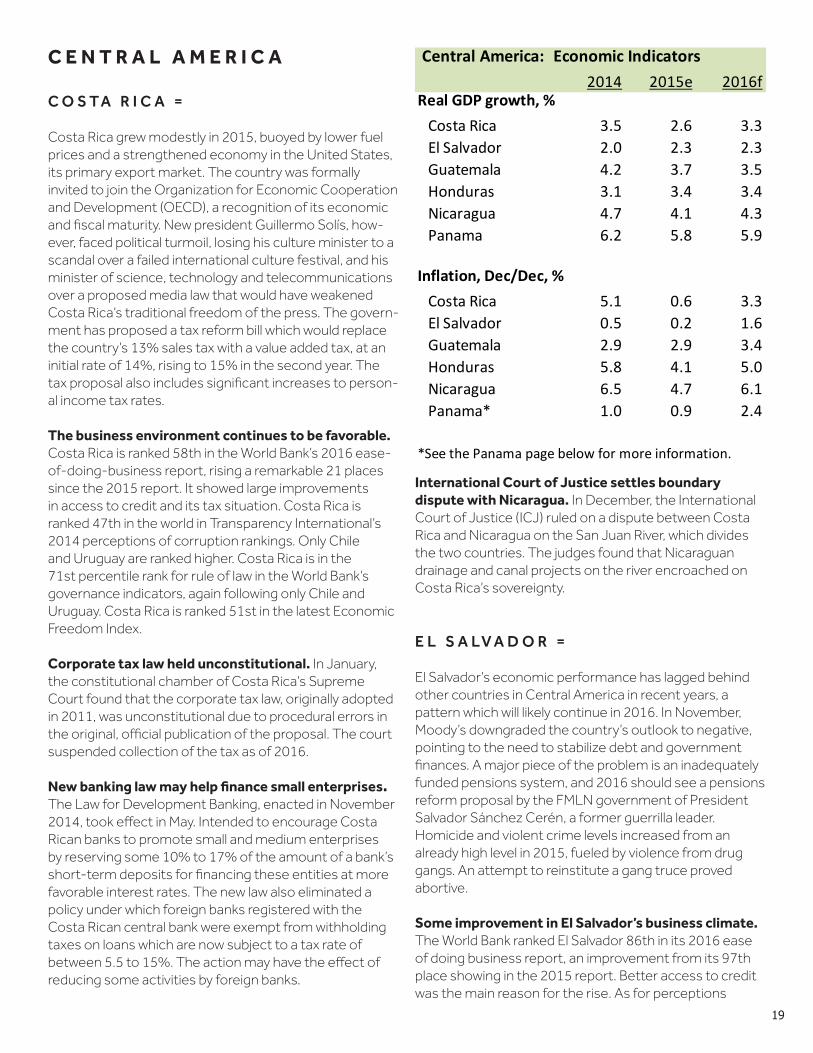
Central America: Economic Indicators2014 2015e 2016f
Real GDP growth, % Costa Rica 3.5 2.6 3.3 El Salvador 2.0 2.3 2.3 Guatemala 4.2 3.7 3.5 Honduras 3.1 3.4 3.4 Nicaragua 4.7 4.1 4.3 Panama 6.2 5.8 5.9
Inflation, Dec/Dec, % Costa Rica 5.1 0.6 3.3 El Salvador 0.5 0.2 1.6 Guatemala 2.9 2.9 3.4 Honduras 5.8 4.1 5.0 Nicaragua 6.5 4.7 6.1 Panama* 1.0 0.9 2.4
*See the Panama page below for more information.
20
Guatemala joins EFTA-Central America Free Trade Agreement. In June, Guatemala signed the Protocol of Accession to the European Free Trade Association (EFTA)-Central America Free Trade Agreement, capping negotiations that began in 2010. The agreement has already been signed by Panama and Costa Rica (where it entered into force in August 2014). Negotiations with Honduras are currently on hold. EFTA member states are Iceland, Liechtenstein, Norway, and Switzerland.
Lower minimum wages for export company workers suspended. In December 2014, the government approved a lower minimum wage for workers in light manufacturing export companies in four municipalities in an attempt to make these areas attractive for foreign investment. However, in January, the Constitutional Court suspended the differential minimum wage and agreed to consider the constitutional validity of the program.
H O N D U R A S =
Honduras remains one of Latin America’s poorest and most dangerous countries, where drug gangs have contributed to a soaring homicide rate. Corruption also remains a problem. In September, the OAS created a Mission to Support the Fight Against Corruption and Impunity in Honduras (MACCIH), an international panel to advise and support Honduran authorities investigating corruption. Critics had pushed for a stronger independent investigating entity akin to Guatemala’s CICIG, which has played a key role in uncovering corruption in that country. In January, Honduras ratified a Foreign Account
of corruption, El Salvador is ranked 80th in the world in Transparency International’s 2014 rankings. El Salvador is ranked 62nd in the latest the world in Transparency International’s 2014 rankings. El Salvador is ranked 62nd in the latest Economic Freedom Index, falling over the last five years due to deteriorations in property rights, business freedom, labor freedom and government finances.
El Salvador Supreme Court rules street gangs are terrorist groups. In August, El Salvador’s Supreme Court upheld the Specialized Law Against Terrorist Acts, allowing drug gangs to be designated as terrorist groups and permitting authorities to freeze the assets of any group categorized as such. The law defines terrorism as “the systematic use of violence” and is intended to help the country combat the wave of violence caused by drug gang activity.
G U A T E M A L A =
Political issues dominated Guatemala in 2015. The first involved the renewal of the U.N.’s International Commission Against Impunity (CICIG), originally established in 2007. Although President Otto Pérez Molina originally opposed renewing the Commission’s mandate, the emergence of political scandals, including a customs fraud scheme that prompted the vice president’s resignation, forced the president’s hand. When CICIG investigations implicated the president himself to a social security fraud scandal which had brought down the central bank president, congress stripped him of his immunity. He resigned and was arrested for corruption. The surprise winner of the September elections is former comedian Jimmy Morales. His party, the National Convergence Front, is seen as conservative and nationalist, and this was evident when comments from the Morales while campaigning seemed to express his intent to renew Guatemalan claims against much of the territory of neighboring Belize. In addition to corruption, security concerns remained constant in 2015.
Little change in the business environment. Guatemala ranked 81st in the World Bank’s most recent ease-of-doing-business ratings, unchanged from its previous ranking. In perceptions of corruption, Guatemala ranks 115th in the world in Transparency International’s 2014 rankings, and the events of 2015 seem to validate that ranking. Guatemala ranked 87th in the 2015 Economic Freedom Index, reflecting concerns about threats to business freedom and property rights.
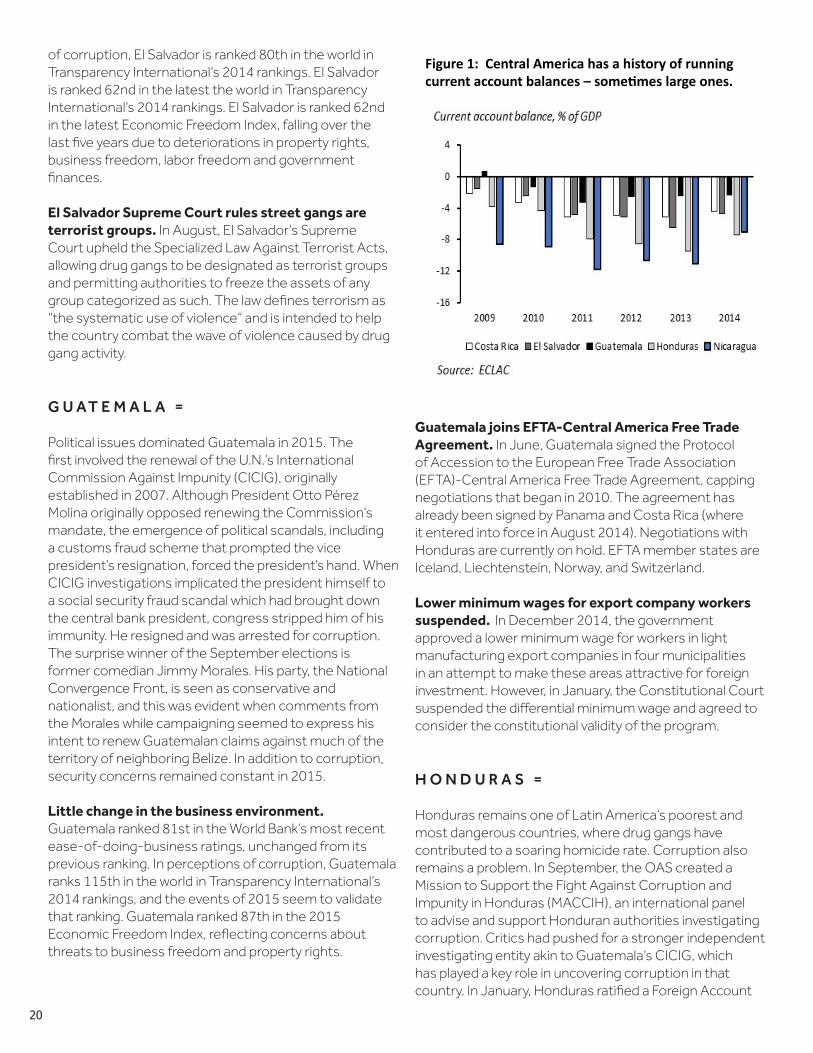
Figure 1: Central America has a history of running current account balances – some9mes large ones.

21
Figure 2: Remi,ances from overseas workers are An important source of income in Central America
Tax Compliance Act (FATCA) agreement with the United States, which should improve tax compliance by U.S. citizens and residents.
Room for improvement in the business environment. Honduras ranked 110th in the World Bank’s ease of doing business ratings for 2016, up from 115th in the 2015 rankings. In perceptions of corruption, Honduras ranks 126th in the world in Transparency International’s 2014 rankings. The country ranked 116th in the 2015 Economic Freedom Index because of persistent problems with rigidity in the labor market, corruption, and government spending.
Court strikes down constitutional provision preventing re-election of president. In April, the constitutional chamber of the Supreme Court invalidated a provision of the constitution that forbade presidential re-election. An attempt by former president Manuel Zelaya to change the same provision had prompted the Supreme Court to remove him from office in 2009. The most recent change was accompanied by confusion that added to the controversy. After an outcry by opponents, one member of the five-judge panel announced that he would withdraw from the decision and change his vote, which would have prompted a review by the full Supreme Court. The government, however, rushed the original unanimous ruling into the official gazette, making it immediately effective.
U.S. investigations target Banco Continental. In October, the U.S. Treasury’s Office of Foreign Assets Control (OFAC) named the Banco Continental, as well as its owners, as drug traffickers under the Foreign Narcotics Kingpin Act. This announcement froze the bank’s U.S. assets, and those of its owners, the Rosenthal family. OFAC claimed the bank was an integral part of the family’s money laundering operations. This was the first time a bank was designated by OFAC under the U.S. law. Shortly afterwards, Honduran authorities seized control of Banco Continental and began its liquidation. The Honduran bank regulator ensured that depositors had access to their funds.
N I C A R A G U A =
Nicaragua has walked a different path than most of its Central American neighbors. With its lower crime rates, security is not a major concern. Under the Sandinista regime of President Daniel Ortega, the government has been careful not to alienate business even as it strengthened government controls. Growth was steady through 2015, and it was one of the few Latin American
countries whose GDP was revised upward during the year. Moody’s upgraded the country’s rating, while Fitch, examining it for the first time, assigned it a B+ rating with a stable outlook. Nicaragua, however, remains one of Latin America’s poorest countries. The grandiose plans of a trans-isthmian canal, announced with great fanfare in 2014 and accompanied by a 50-year concession granted to the Hong Kong-based HKND Group, have not moved forward. The company maintains the delays are due to environmental studies and that work will begin in late 2016, but rumors that Wang Jing, the Chinese billionaire who heads HKND, suffered significant losses in the Chinese stock market, suggest that financing the immense project may still be problematic.
Low rankings for Nicaragua’s business environment. The World Bank ranked Nicaragua 125th in the world ease-of-doing-business ratings for 2016, while Transparency International ranks it 133rd in the 2014 Corruption Perception Index. The country ranked 108th in the 2015 Economic Freedom Index, falling slightly from the previous year due to concerns about property rights, monetary freedom and labor freedom.
U.S. assistance restrictions lifted. In August, the U.S. government lifted restrictions on Nicaragua’s access to international credit and bilateral assistance. The restrictions were imposed in 1990 following the confiscation of property owned by U.S. citizens. Nicaragua had been obliged to seek an annual waiver of the restrictions. The government has been moving to resolve disputes over property seized by the Sandinista government in the 1980’s.
22
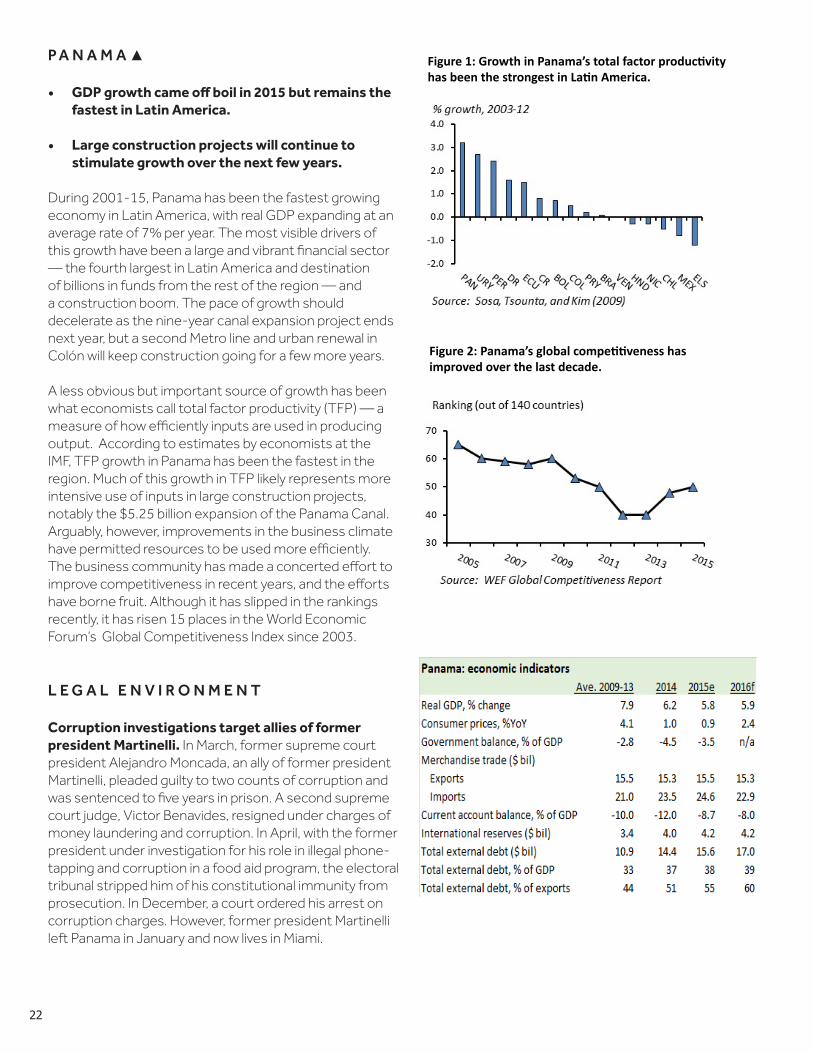
P A N A M A ▲
• GDP growth came off boil in 2015 but remains the fastest in Latin America.
• Large construction projects will continue to stimulate growth over the next few years.
During 2001-15, Panama has been the fastest growing economy in Latin America, with real GDP expanding at an average rate of 7% per year. The most visible drivers of this growth have been a large and vibrant financial sector — the fourth largest in Latin America and destination of billions in funds from the rest of the region — and a construction boom. The pace of growth should decelerate as the nine-year canal expansion project ends next year, but a second Metro line and urban renewal in Colón will keep construction going for a few more years. A less obvious but important source of growth has been what economists call total factor productivity (TFP) — a measure of how efficiently inputs are used in producing output. According to estimates by economists at the IMF, TFP growth in Panama has been the fastest in the region. Much of this growth in TFP likely represents more intensive use of inputs in large construction projects, notably the $5.25 billion expansion of the Panama Canal. Arguably, however, improvements in the business climate have permitted resources to be used more efficiently. The business community has made a concerted effort to improve competitiveness in recent years, and the efforts have borne fruit. Although it has slipped in the rankings recently, it has risen 15 places in the World Economic Forum’s Global Competitiveness Index since 2003.
L E G A L E N V I R O N M E N T
Corruption investigations target allies of former president Martinelli. In March, former supreme court president Alejandro Moncada, an ally of former president Martinelli, pleaded guilty to two counts of corruption and was sentenced to five years in prison. A second supreme court judge, Victor Benavides, resigned under charges of money laundering and corruption. In April, with the former president under investigation for his role in illegal phone-tapping and corruption in a food aid program, the electoral tribunal stripped him of his constitutional immunity from prosecution. In December, a court ordered his arrest on corruption charges. However, former president Martinelli left Panama in January and now lives in Miami.
Figure 1: Growth in Panama’s total factor produc:vity has been the strongest in La:n America.
Figure 2: Panama’s global compe::veness has improved over the last decade.
23
Panama Canal Authority appeals arbitration award to contractors. In December 2014, an arbitration panel awarded contractors in the Panama Canal expansion $233 million over a claim that the Panama Canal Authority failed to provide sufficient basalt, a key ingredient in cement, during the construction process. The Authority had assured contractors the basal would be available during the canal expansion. The panel also found the Authority liable for failing to respond in a timely manner to the contractors’ concerns about the basalt. The Authority has appealed the award to the International Chamber of Commerce arbitration tribunal in Miami.
Free trade agreement with Mexico takes effect. After Mexico’s congress approved the Panama-Mexico Free Trade Agreement in March, the agreement took effect on July 1. The agreement is expected to increase trade between the two countries, and may set the stage for Panama to join the Pacific Alliance trading bloc.
B U S I N E S S E N V I R O N M E N T
Panama is ranked 69th out of 189 countries according to the World Bank in its latest Doing Business survey, though it fell three places from its ranking in the past year. Panama dropped in all categories, including a seven-place fall in the starting a business topic, though it remains the 6th easiest place to start a business in Latin America. Transparency International ranks Panama 94th in its Corruption Perception Index, but reported crime victimization is the second lowest in Latin America, and kidnapping is almost unknown in Panama City.
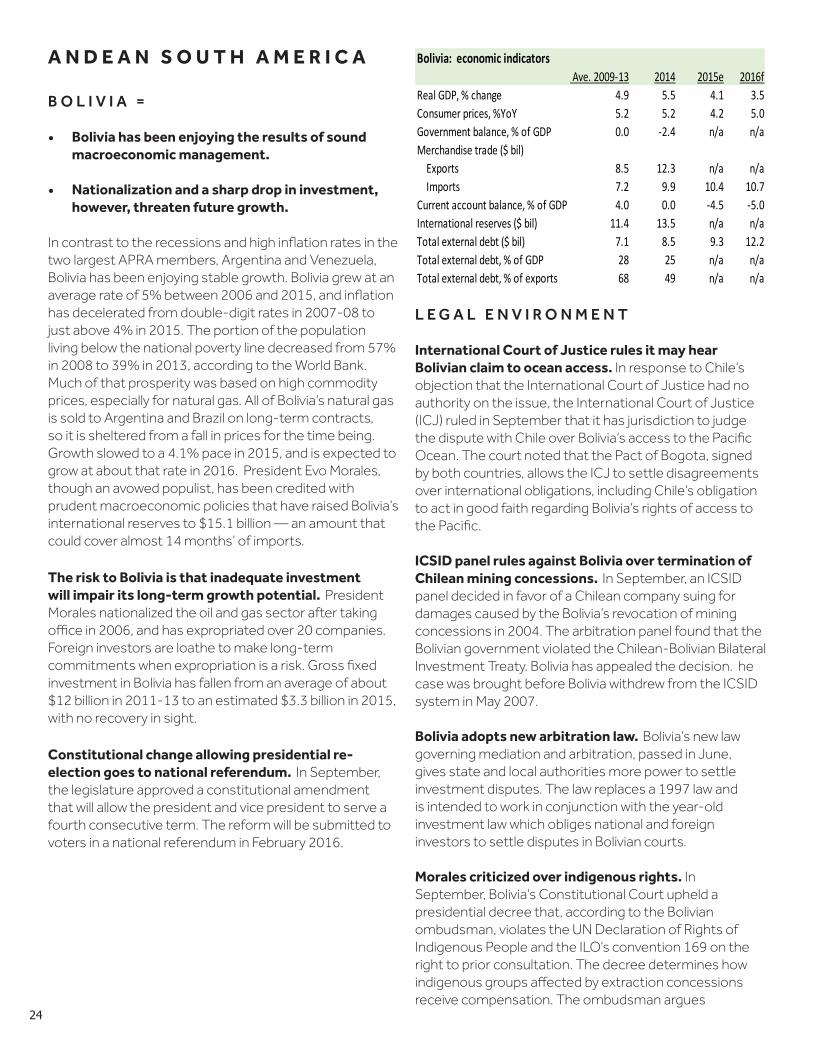
24
A N D E A N S O U T H A M E R I C A
B O L I V I A =
• Bolivia has been enjoying the results of sound macroeconomic management.
• Nationalization and a sharp drop in investment, however, threaten future growth.
In contrast to the recessions and high inflation rates in the two largest APRA members, Argentina and Venezuela, Bolivia has been enjoying stable growth. Bolivia grew at an average rate of 5% between 2006 and 2015, and inflation has decelerated from double-digit rates in 2007-08 to just above 4% in 2015. The portion of the population living below the national poverty line decreased from 57% in 2008 to 39% in 2013, according to the World Bank. Much of that prosperity was based on high commodity prices, especially for natural gas. All of Bolivia’s natural gas is sold to Argentina and Brazil on long-term contracts, so it is sheltered from a fall in prices for the time being. Growth slowed to a 4.1% pace in 2015, and is expected to grow at about that rate in 2016. President Evo Morales, though an avowed populist, has been credited with prudent macroeconomic policies that have raised Bolivia’s international reserves to $15.1 billion — an amount that could cover almost 14 months’ of imports.
The risk to Bolivia is that inadequate investment will impair its long-term growth potential. President Morales nationalized the oil and gas sector after taking office in 2006, and has expropriated over 20 companies. Foreign investors are loathe to make long-term commitments when expropriation is a risk. Gross fixed investment in Bolivia has fallen from an average of about $12 billion in 2011-13 to an estimated $3.3 billion in 2015, with no recovery in sight.
Constitutional change allowing presidential re-election goes to national referendum. In September, the legislature approved a constitutional amendment that will allow the president and vice president to serve a fourth consecutive term. The reform will be submitted to voters in a national referendum in February 2016.
L E G A L E N V I R O N M E N T
International Court of Justice rules it may hear Bolivian claim to ocean access. In response to Chile’s objection that the International Court of Justice had no authority on the issue, the International Court of Justice (ICJ) ruled in September that it has jurisdiction to judge the dispute with Chile over Bolivia’s access to the Pacific Ocean. The court noted that the Pact of Bogota, signed by both countries, allows the ICJ to settle disagreements over international obligations, including Chile’s obligation to act in good faith regarding Bolivia’s rights of access to the Pacific.
ICSID panel rules against Bolivia over termination of Chilean mining concessions. In September, an ICSID panel decided in favor of a Chilean company suing for damages caused by the Bolivia’s revocation of mining concessions in 2004. The arbitration panel found that the Bolivian government violated the Chilean-Bolivian Bilateral Investment Treaty. Bolivia has appealed the decision. he case was brought before Bolivia withdrew from the ICSID system in May 2007.
Bolivia adopts new arbitration law. Bolivia’s new law governing mediation and arbitration, passed in June, gives state and local authorities more power to settle investment disputes. The law replaces a 1997 law and is intended to work in conjunction with the year-old investment law which obliges national and foreign investors to settle disputes in Bolivian courts.
Morales criticized over indigenous rights. In September, Bolivia’s Constitutional Court upheld a presidential decree that, according to the Bolivian ombudsman, violates the UN Declaration of Rights of Indigenous People and the ILO’s convention 169 on the right to prior consultation. The decree determines how indigenous groups affected by extraction concessions receive compensation. The ombudsman argues
Bolivia: economic indicators Ave. 2009-13 2014 2015e 2016f
Real GDP, % change 4.9 5.5 4.1 3.5Consumer prices, %YoY 5.2 5.2 4.2 5.0Government balance, % of GDP 0.0 -2.4 n/a n/aMerchandise trade ($ bil) Exports 8.5 12.3 n/a n/a Imports 7.2 9.9 10.4 10.7Current account balance, % of GDP 4.0 0.0 -4.5 -5.0International reserves ($ bil) 11.4 13.5 n/a n/aTotal external debt ($ bil) 7.1 8.5 9.3 12.2Total external debt, % of GDP 28 25 n/a n/aTotal external debt, % of exports 68 49 n/a n/a
25
that, in accordance with Bolivia’s commitment to the international standards, indigenous communities have the right to determine how the compensation will be dispensed. Further-more, those rights may be moot in light of a second presidential decree allowing extraction of hydro-carbons in protected areas. Hydrocarbons and mining make up more than three-quarters of Bolivia’s exports.
Autonomy amendment rejected. In September, voters in five departments rejected a constitutional reform that would have provided for greater decentralization in separate referenda held in each department. The government pushed the measure and its defeat was seen as a rare defeat for President Morales. The national ombudsman and others criticized the lack of public information available to the public about the autonomy measures.
Electoral court resigns, new court appointed. In May, the electoral court resigned over criticism of is management of state and local elections in March. In July, the legislature selected its six judges, while President Morales appointed the seventh judge. Critics and opposition remain concerned about the court’s ties to the ruling MAS party.
B U S I N E S S E N V I R O N M E N T
Bolivia was ranked 157th in the World Bank’s latest ease of doing business ratings, falling two places since the last report. The country ranks 35th in the world in Transparency International’s 2014 corruption perceptions rankings. In the 2015 Economic Freedom Index, Bolivia was ranked 163rd — the third lowest in Latin America — reflecting poorly protected property rights and a less-than-hospitable labor freedom, investment freedom, and business freedom environment. Bolivia ranks in the 10th percentile for property rights in the Heritage Foundation’s Economic Freedom Index — tied with Cuba, Haiti, and Nicaragua.
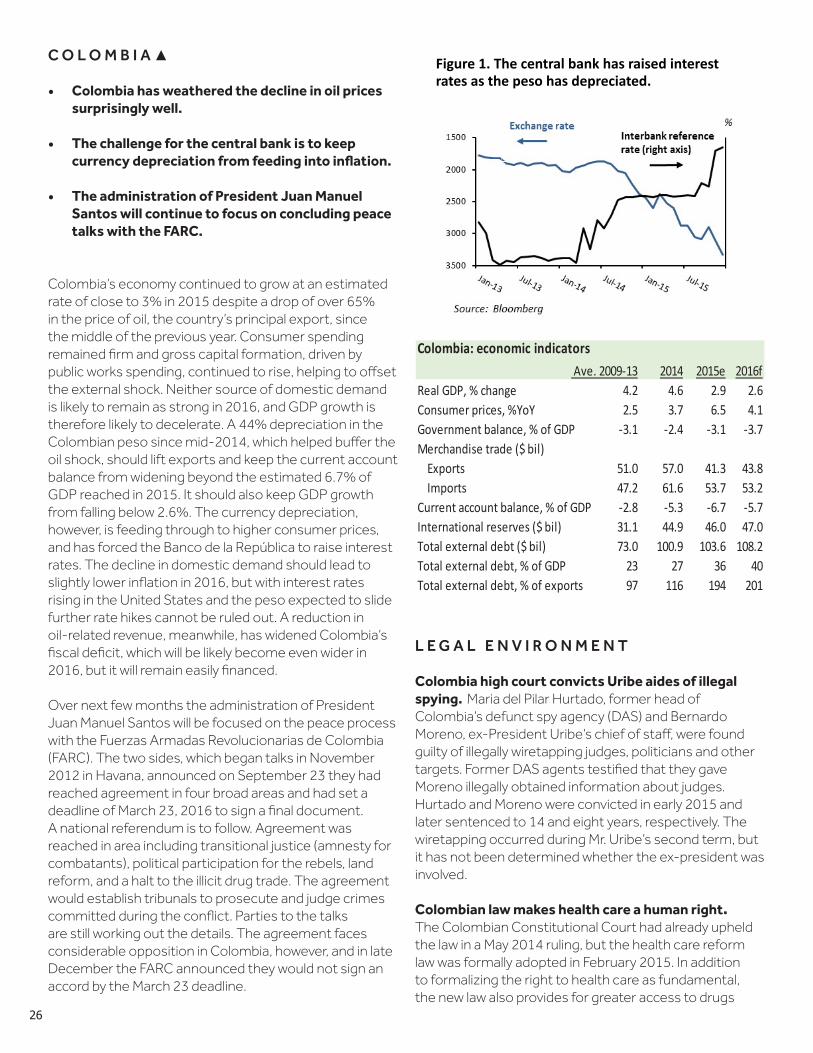
26
C O L O M B I A ▲
• Colombia has weathered the decline in oil prices surprisingly well.
• The challenge for the central bank is to keep currency depreciation from feeding into inflation.
• The administration of President Juan Manuel Santos will continue to focus on concluding peace talks with the FARC.
Colombia’s economy continued to grow at an estimated rate of close to 3% in 2015 despite a drop of over 65% in the price of oil, the country’s principal export, since the middle of the previous year. Consumer spending remained firm and gross capital formation, driven by public works spending, continued to rise, helping to offset the external shock. Neither source of domestic demand is likely to remain as strong in 2016, and GDP growth is therefore likely to decelerate. A 44% depreciation in the Colombian peso since mid-2014, which helped buffer the oil shock, should lift exports and keep the current account balance from widening beyond the estimated 6.7% of GDP reached in 2015. It should also keep GDP growth from falling below 2.6%. The currency depreciation, however, is feeding through to higher consumer prices, and has forced the Banco de la República to raise interest rates. The decline in domestic demand should lead to slightly lower inflation in 2016, but with interest rates rising in the United States and the peso expected to slide further rate hikes cannot be ruled out. A reduction in oil-related revenue, meanwhile, has widened Colombia’s fiscal deficit, which will be likely become even wider in 2016, but it will remain easily financed.
Over next few months the administration of President Juan Manuel Santos will be focused on the peace process with the Fuerzas Armadas Revolucionarias de Colombia (FARC). The two sides, which began talks in November 2012 in Havana, announced on September 23 they had reached agreement in four broad areas and had set a deadline of March 23, 2016 to sign a final document. A national referendum is to follow. Agreement was reached in area including transitional justice (amnesty for combatants), political participation for the rebels, land reform, and a halt to the illicit drug trade. The agreement would establish tribunals to prosecute and judge crimes committed during the conflict. Parties to the talks are still working out the details. The agreement faces considerable opposition in Colombia, however, and in late December the FARC announced they would not sign an accord by the March 23 deadline.
L E G A L E N V I R O N M E N T
Colombia high court convicts Uribe aides of illegal spying. Maria del Pilar Hurtado, former head of Colombia’s defunct spy agency (DAS) and Bernardo Moreno, ex-President Uribe’s chief of staff, were found guilty of illegally wiretapping judges, politicians and other targets. Former DAS agents testified that they gave Moreno illegally obtained information about judges. Hurtado and Moreno were convicted in early 2015 and later sentenced to 14 and eight years, respectively. The wiretapping occurred during Mr. Uribe’s second term, but it has not been determined whether the ex-president was involved.
Colombian law makes health care a human right. The Colombian Constitutional Court had already upheld the law in a May 2014 ruling, but the health care reform law was formally adopted in February 2015. In addition to formalizing the right to health care as fundamental, the new law also provides for greater access to drugs
Figure 1. The central bank has raised interest rates as the peso has depreciated.
Colombia: economic indicators
Ave. 2009-‐13 2014 2015e 2016fReal GDP, % change 4.2 4.6 2.9 2.6Consumer prices, %YoY 2.5 3.7 6.5 4.1Government balance, % of GDP -‐3.1 -‐2.4 -‐3.1 -‐3.7Merchandise trade ($ bil) Exports 51.0 57.0 41.3 43.8 Imports 47.2 61.6 53.7 53.2Current account balance, % of GDP -‐2.8 -‐5.3 -‐6.7 -‐5.7International reserves ($ bil) 31.1 44.9 46.0 47.0Total external debt ($ bil) 73.0 100.9 103.6 108.2Total external debt, % of GDP 23 27 36 40Total external debt, % of exports 97 116 194 201
27
and treatments, and establishes a new pricing system to control drug prices. The law makes mandatory the provision of emergency services, regardless of a patient’s insurance status.
Council of State suspends strategic mining areas designated by Colombian government. In May, the Council of State, the country’s highest administrative court, provisionally suspended a government decision to open up some 20 million hectares of land to mining investment. The council found that the national mining agency failed to undertake prior consultation with indigenous and Afro-Colombian communities in the area before delineating the strategic mining areas.
U.S. Supreme Court upholds dismissal of Alien Torts Statute claims. In April, the U.S. Supreme Court let stand an appeals court decision that held that U.S. courts did not have jurisdiction to hear claims that the U.S. fruit company Chiquita was responsible for murders and atrocities in Colombia committed by paramilitaries who were paid by paid by the company because the acts all occurred outside the United States. Chiquita pled guilty in 2007 to criminal charges involving payments to the paramilitaries and was fined $25 million. The company maintains that it paid the sums under duress to avoid violence against its workers.
B U S I N E S S E N V I R O N M E N T
Colombia is the fourth highest ranked Latin American country in the World Bank’s ease of doing business rankings, and improved in the rankings during 2015. Perceptions of both economic freedom and global competitiveness for Colombia also rose. Progress in some areas, however, was mixed. The World Bank reports it takes less time to start a business, but more time to register property, for example. Colombia fell in the World Bank’s governance indicators, possibly reflecting a lack of confidence among some survey respondents about the terms of the government’s pending peace agreement with the FARC rebels.
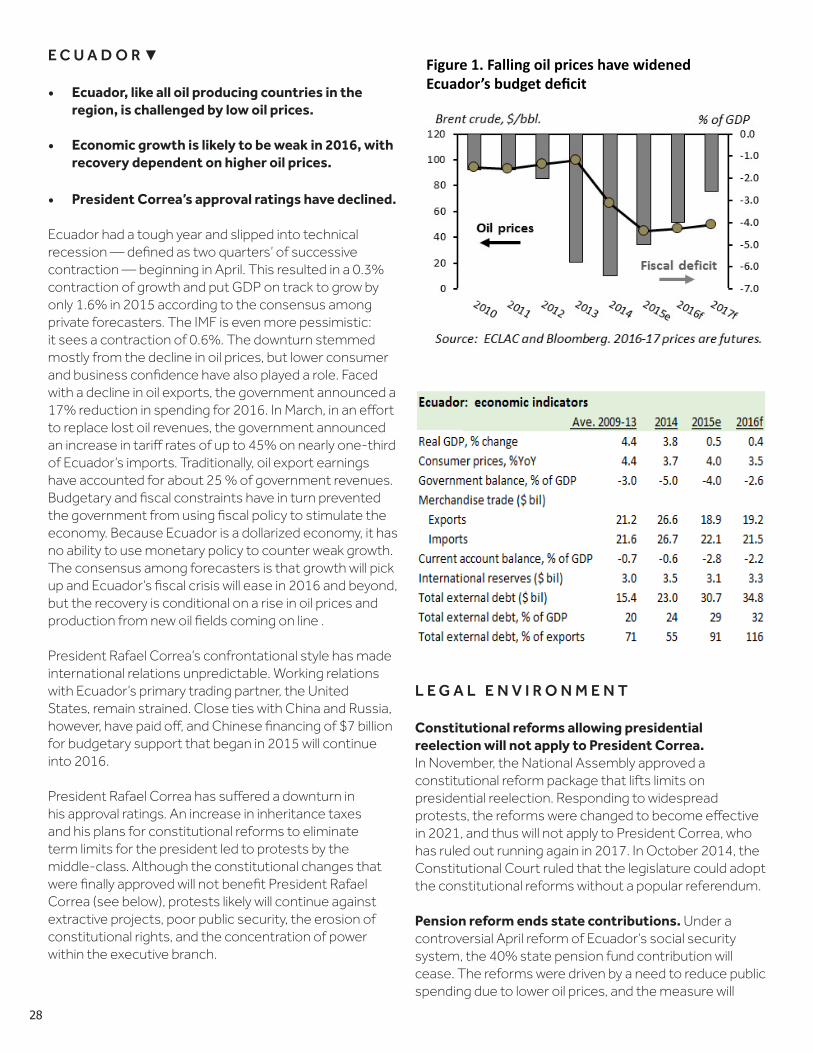
28
E C U A D O R ▼
• Ecuador, like all oil producing countries in the region, is challenged by low oil prices.
• Economic growth is likely to be weak in 2016, with recovery dependent on higher oil prices.
• President Correa’s approval ratings have declined.
Ecuador had a tough year and slipped into technical recession — defined as two quarters’ of successive contraction — beginning in April. This resulted in a 0.3% contraction of growth and put GDP on track to grow by only 1.6% in 2015 according to the consensus among private forecasters. The IMF is even more pessimistic: it sees a contraction of 0.6%. The downturn stemmed mostly from the decline in oil prices, but lower consumer and business confidence have also played a role. Faced with a decline in oil exports, the government announced a 17% reduction in spending for 2016. In March, in an effort to replace lost oil revenues, the government announced an increase in tariff rates of up to 45% on nearly one-third of Ecuador’s imports. Traditionally, oil export earnings have accounted for about 25 % of government revenues. Budgetary and fiscal constraints have in turn prevented the government from using fiscal policy to stimulate the economy. Because Ecuador is a dollarized economy, it has no ability to use monetary policy to counter weak growth. The consensus among forecasters is that growth will pick up and Ecuador’s fiscal crisis will ease in 2016 and beyond, but the recovery is conditional on a rise in oil prices and production from new oil fields coming on line .
President Rafael Correa’s confrontational style has made international relations unpredictable. Working relations with Ecuador’s primary trading partner, the United States, remain strained. Close ties with China and Russia, however, have paid off, and Chinese financing of $7 billion for budgetary support that began in 2015 will continue into 2016.
President Rafael Correa has suffered a downturn in his approval ratings. An increase in inheritance taxes and his plans for constitutional reforms to eliminate term limits for the president led to protests by the middle-class. Although the constitutional changes that were finally approved will not benefit President Rafael Correa (see below), protests likely will continue against extractive projects, poor public security, the erosion of constitutional rights, and the concentration of power within the executive branch.
L E G A L E N V I R O N M E N T
Constitutional reforms allowing presidential reelection will not apply to President Correa. In November, the National Assembly approved a constitutional reform package that lifts limits on presidential reelection. Responding to widespread protests, the reforms were changed to become effective in 2021, and thus will not apply to President Correa, who has ruled out running again in 2017. In October 2014, the Constitutional Court ruled that the legislature could adopt the constitutional reforms without a popular referendum. Pension reform ends state contributions. Under a controversial April reform of Ecuador’s social security system, the 40% state pension fund contribution will cease. The reforms were driven by a need to reduce public spending due to lower oil prices, and the measure will
Figure 1. Falling oil prices have widened Ecuador’s budget deficit
29
save some $1.1 billion annually. The state will continue to guarantee the security of pensions. A law from September 2014 nationalized seven private pension funds, transferring them to the state social security agency. The pension reforms were controversial, and prompted the left-wing Avanza party to leave the government coalition. Inheritance & capital gains tax proposals withdrawn. Tax reform proposals to increase inheritance taxes on a progressive basis and to increase capital gains taxes were withdrawn after widespread protests. The inheritance tax proposal would have raised taxes to 47.5% on estates valued at over $35,400 inherited by immediate family members. It also would have imposed a maximum tax rate of 77.5% on inheritances claimed by anyone other than immediate family members. Critics argued that businesses, mostly family-owned, and real estate would be hurt by this wealth redistribution measure. The government is expected to revisit the inheritance tax proposal in 2016.
Ecuadorean tax amnesty takes effect. The National Assembly passed legislation in April relieving taxpayers of fines, surcharges and interest on taxes owed to national and local tax entities. Under the law, if taxes were paid in full within 60 days of the law’s publication, all fines and interest will be waived; if paid within 90 days, 50% of penalties and interest were forgiven.
Chevron Case repercussions continue. The Chevron case originally involved a multi-billion dollar claim for environmental damages allegedly caused by Chevron’s subsidiary Texaco. Last year, in a civil racketeering suit brought by Chevron, a U.S. federal court in New York found that the plaintiffs and their lawyers secured the Ecuadorean judgment using fraud and corruption, and held that the judgment was unenforceable in the U.S. Steven Donziger, the plaintiffs’ American lawyer, has appealed that ruling. In the meantime, Ecuador has been seeking to enforce the original November 2013 Ecuadorean judgment for $9.5 billion in other jurisdictions. In May, Brazil’s attorney general recommended that Brazil’s courts decline to enforce the judgment, agreeing with the U.S. court’s corruption holding. However, in September, the Canadian Supreme Court found an Ontario court improperly dismissed an effort to enforce the judgment in Canada. The case will return to the trial court to consider whether the judgment should be enforced. The judge at the center of the Ecuadoran judgment may or may not have recanted previous testimony in the U.S. case, but he seems clearly to have accepted payments from both sides in the case. Finally, an American appeals court upheld an international
arbitration award to Chevron of $96 million against Ecuador for other disputes related to Texaco’s work in that country. Chevron began arbitration in The Hague in 2006, and Chevron sued to enforce the arbitral award.
Occidental Petroleum arbitration award reduced to $1 billion. An ICSID appellate panel awarded Occidental Petroleum $1.061 billion in a claim against Ecuador for seizing the company’s assets. The case was brought in 2006 prior to Ecuador’s withdrawal from the ICSID dispute resolution system. The appellate panel reduced the award by 40% because Occidental had transferred the oil fields at issue to a Chinese company. At the time of the seizure, Occidental was the largest oil producer in Ecuador.
B U S I N E S S E N V I R O N M E N T
Among the four populist countries in Latin America, the World Bank ranks Ecuador the highest in ease of doing business, arguably making it the best of the worst. Perceptions of corruption, however, have increased over the past year according to Transparency International, and Ecuador has also slipped in the World Bank’s governance indicators, suggesting a weakening of the rule of law. Questionable legal guarantees and insufficient incentives to conduct business make the business environment problematic.
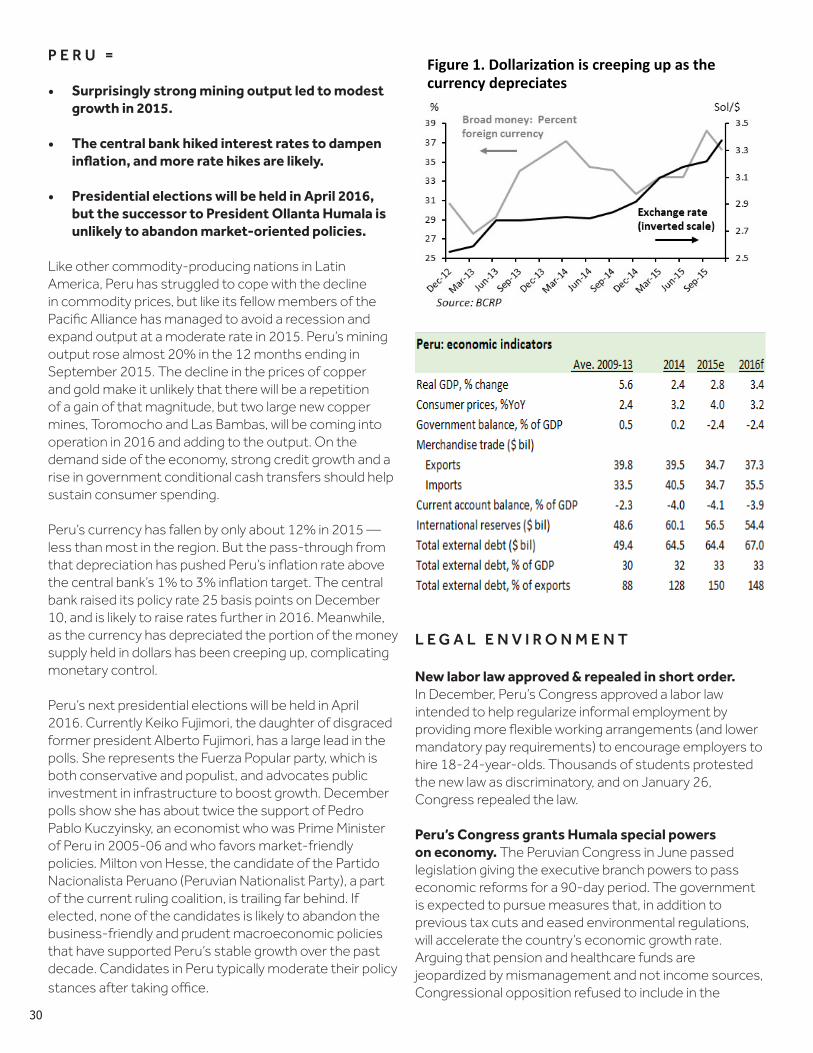
30
P E R U =
• Surprisingly strong mining output led to modest growth in 2015.
• The central bank hiked interest rates to dampen inflation, and more rate hikes are likely.
• Presidential elections will be held in April 2016, but the successor to President Ollanta Humala is unlikely to abandon market-oriented policies.
Like other commodity-producing nations in Latin America, Peru has struggled to cope with the decline in commodity prices, but like its fellow members of the Pacific Alliance has managed to avoid a recession and expand output at a moderate rate in 2015. Peru’s mining output rose almost 20% in the 12 months ending in September 2015. The decline in the prices of copper and gold make it unlikely that there will be a repetition of a gain of that magnitude, but two large new copper mines, Toromocho and Las Bambas, will be coming into operation in 2016 and adding to the output. On the demand side of the economy, strong credit growth and a rise in government conditional cash transfers should help sustain consumer spending.
Peru’s currency has fallen by only about 12% in 2015 — less than most in the region. But the pass-through from that depreciation has pushed Peru’s inflation rate above the central bank’s 1% to 3% inflation target. The central bank raised its policy rate 25 basis points on December 10, and is likely to raise rates further in 2016. Meanwhile, as the currency has depreciated the portion of the money supply held in dollars has been creeping up, complicating monetary control.
Peru’s next presidential elections will be held in April 2016. Currently Keiko Fujimori, the daughter of disgraced former president Alberto Fujimori, has a large lead in the polls. She represents the Fuerza Popular party, which is both conservative and populist, and advocates public investment in infrastructure to boost growth. December polls show she has about twice the support of Pedro Pablo Kuczyinsky, an economist who was Prime Minister of Peru in 2005-06 and who favors market-friendly policies. Milton von Hesse, the candidate of the Partido Nacionalista Peruano (Peruvian Nationalist Party), a part of the current ruling coalition, is trailing far behind. If elected, none of the candidates is likely to abandon the business-friendly and prudent macroeconomic policies that have supported Peru’s stable growth over the past decade. Candidates in Peru typically moderate their policy stances after taking office.
L E G A L E N V I R O N M E N T
New labor law approved & repealed in short order. In December, Peru’s Congress approved a labor law intended to help regularize informal employment by providing more flexible working arrangements (and lower mandatory pay requirements) to encourage employers to hire 18-24-year-olds. Thousands of students protested the new law as discriminatory, and on January 26, Congress repealed the law.
Peru’s Congress grants Humala special powers on economy. The Peruvian Congress in June passed legislation giving the executive branch powers to pass economic reforms for a 90-day period. The government is expected to pursue measures that, in addition to previous tax cuts and eased environmental regulations, will accelerate the country’s economic growth rate. Arguing that pension and healthcare funds are jeopardized by mismanagement and not income sources, Congressional opposition refused to include in the
Figure 1. Dollariza/on is creeping up as the currency depreciates
depreciates.
31
legislation provisions for those programs to be funded by mandatory worker bonus deductions.
New decree forces telecommunications companies to give data to police. Among the most controversial of President Humala’s decrees, adopted under the special grant of authority, was one that allowed police access to metadata on cell phone users without a warrant. The government maintained the decree was necessary to help combat organized crime, while critics deplored the violation of citizen privacy rights. According to the government, a warrant from a judge would be required if the police wish to use any data acquired at trial, though this retroactive judicial involvement failed to assuage critics’ concerns.
Peruvian justice minister resigns after firing anti-corruption prosecutor. In October, the Peruvian prosecutor investigating Peru’s first lady on money-laundering charges was fired and her boss, the justice minister, subsequently resigned. The prosecutor, Julia Principe, had an established career as an investigator in money-laundering cases. While Principe was supposedly fired for insubordination, the justice minister stepped down to avoid impeachment and so as not to be a liability to President Humala’ administration after the firing provoked hefty protests.
Maternity leave extended in Peru. In March, Peru’s Congress ratified ILO Convention 183 which requires paid maternity leave for at least 14 weeks. The convention also defines grounds for firing during maternity leave, and provides for reduced working hours, and paid child care breaks.
B U S I N E S S E N V I R O N M E N T
Peru is ranked number 50 out of 189 countries, in the World Bank’s latest Doing Business report, and moved up in the rankings. It is the third highest ranked country in Latin America — just below Chile but above Colombia. Peru ranked even higher in the getting credit and registering property rankings, though it was ranked substantially lower in some areas, such as starting a business and trading across borders. Peru lost ground in corruption perceptions and in global competitiveness, and more Peruvians report that they or someone in their families have been a victim of a crime than in neighboring countries.
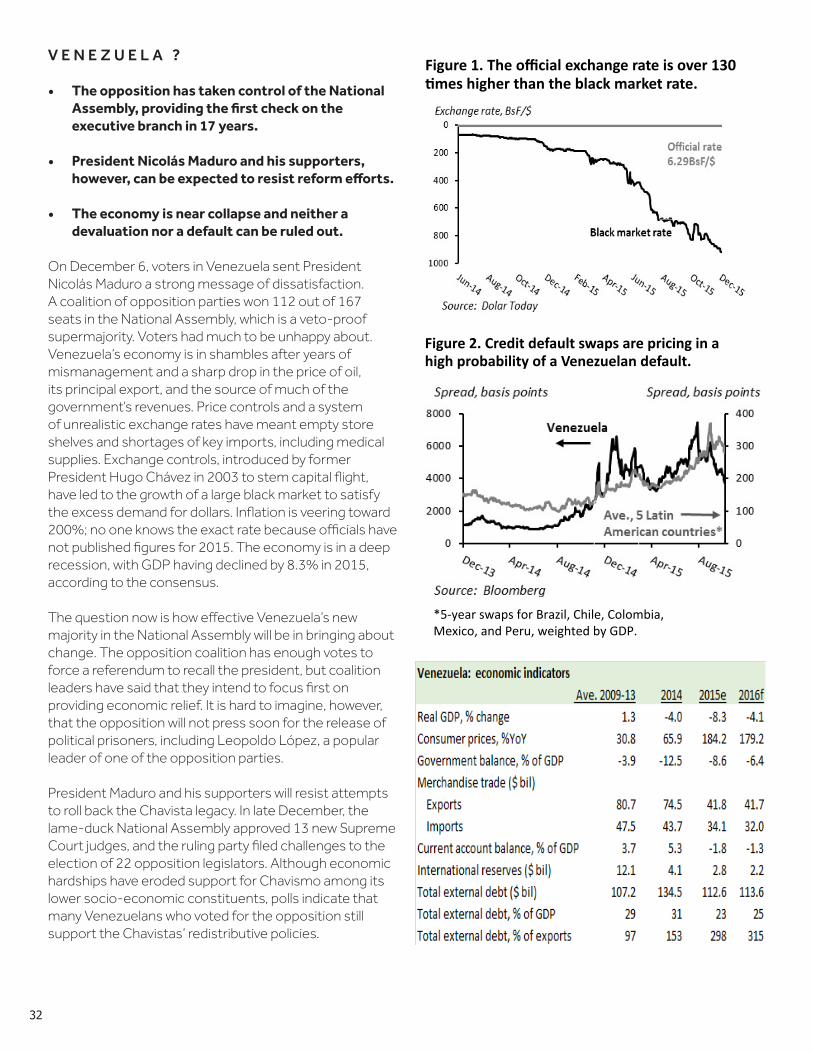
32
V E N E Z U E L A ?
• The opposition has taken control of the National Assembly, providing the first check on the executive branch in 17 years.
• President Nicolás Maduro and his supporters, however, can be expected to resist reform efforts.
• The economy is near collapse and neither a devaluation nor a default can be ruled out.
On December 6, voters in Venezuela sent President Nicolás Maduro a strong message of dissatisfaction. A coalition of opposition parties won 112 out of 167 seats in the National Assembly, which is a veto-proof supermajority. Voters had much to be unhappy about. Venezuela’s economy is in shambles after years of mismanagement and a sharp drop in the price of oil, its principal export, and the source of much of the government’s revenues. Price controls and a system of unrealistic exchange rates have meant empty store shelves and shortages of key imports, including medical supplies. Exchange controls, introduced by former President Hugo Chávez in 2003 to stem capital flight, have led to the growth of a large black market to satisfy the excess demand for dollars. Inflation is veering toward 200%; no one knows the exact rate because officials have not published figures for 2015. The economy is in a deep recession, with GDP having declined by 8.3% in 2015, according to the consensus.
The question now is how effective Venezuela’s new majority in the National Assembly will be in bringing about change. The opposition coalition has enough votes to force a referendum to recall the president, but coalition leaders have said that they intend to focus first on providing economic relief. It is hard to imagine, however, that the opposition will not press soon for the release of political prisoners, including Leopoldo López, a popular leader of one of the opposition parties.
President Maduro and his supporters will resist attempts to roll back the Chavista legacy. In late December, the lame-duck National Assembly approved 13 new Supreme Court judges, and the ruling party filed challenges to the election of 22 opposition legislators. Although economic hardships have eroded support for Chavismo among its lower socio-economic constituents, polls indicate that many Venezuelans who voted for the opposition still support the Chavistas’ redistributive policies.
Figure 1. The official exchange rate is over 130 8mes higher than the black market rate.
Figure 2. Credit default swaps are pricing in a high probability of a Venezuelan default.
*5-‐year swaps for Brazil, Chile, Colombia, Mexico, and Peru, weighted by GDP.
33
Clashes between the ruling party and the oppositionare likely to delay the adjustments needed to stabilize the economy and remove economic distortions. In the meanwhile Venezuela’ international reserves are falling, making a devaluation — the fifth since 2003 — a distinct possibility. Meanwhile, a default on Venezuela’s sovereign bonds cannot be ruled out. With spreads on 5-year credit default swaps (market-traded instruments that provide protection against default risk) at over 6330 basis points in late December, the market is pricing in a 19% probability of default within one year, according to analysts at Deutsche Bank, and a 97% probability of default within five years.
L E G A L E N V I R O N M E N T
Supreme Court rejects suit against central bank over economic statistics. In July, the Venezuelan Supreme Court rejected a suit against the central bank over its failure to publish the country’s economic statistics, including the consumer price index. The Venezuelan affiliate of Transparency International argued that the withholding of macroeconomic indicators thwarts reasonable analysis of and response to economic conditions. Heading into the December elections, the government is alleged to have pressured the head of the central bank not to release bad economic news.
Maritime decree offends both Colombia and Guyana. In May, President Maduro issued a decree setting maritime defense zones. Under the decree, one zone essentially extended across all of Guyana’s territorial waters, reviving the long-running dispute over Venezuela’s claims to the 2/3 of Guyana’s territory lying west of the Essequibo River. The maritime jurisdiction extension coincided with oil exploration efforts licensed by the Guyana’s government. President Maduro repeated Venezuela’s position that the 1899 arbitration agreement that determined the boundaries between Venezuela and Guyana was “null and void” and recalled his ambassador to Guyana. The westernmost Venezuelan defense zone also included all of the Gulf of Venezuela, including waters that are disputed with Colombia. Both of Venezuela’s neighbors protested the actions, which were also criticized by Caricom at its July summit. A re-drafted decree attempted to mollify the Colombian concerns. Maduro extends border closures with Colombia. In September, President Maduro decreed a state of “exception” in the state of Zulia, in effect closing the border with Colombia, increasing deportations of illegal Colombian immigrants, forcing voluntary repatriations, and further disrupting trade between the two countries. The state of emergency in Tachira state was extended
through the end of December, and it is expected that the same will happen for the other states on the country’s border with Colombia. The government cited threats posed by paramilitaries and contraband flowing across the western border.
Opposition leader López convicted and sentenced. In September, opposition leader Leopoldo López was found guilty of arson, criminal association and conspiracy, damage to public property and inciting violence and given a sentence of nearly 14 years imprisonment. The case arose from opposition protests in Caracas in February 2014 that tuned violent and resulted in two deaths. The charges drew widespread international criticism.
Maduro given decree powers through end of 2015. A March enabling law granted President Nicolás Maduro power to legislate on security and economic matters by decree through December 2015 as part of the fight against “imperialism”. The first measures taken under the law involved the nationalization of food distribution and measures to ration medicine. Mr. Maduro previously had been granted decree powers from November 2013 through November 2014. As that earlier grant expired, the president issued decrees increasing value added taxes, as well as taxes on cigarettes and alcohol, and increased fines for tax violations. The Organic Fair Prices Act, adopted by decree in November 2014, provided for confiscation of contraband goods and required that government-mandated prices would be placed on products.
OAS criticizes Venezuela’s electoral system. In November, the Organization of American States addressed a letter to the Venezuelan national electoral council expressing deep concern over the legitimacy of the country’s election process. The extensive list of shortcomings included: changing game rules, arbitrary imprisonment of opposition leaders, and judicial intervention in the affairs of opposition parties. The president of Venezuela’s national assembly dismissed the OAS charges, and the organization was not invited to observe the December elections. Instead, Venezuela invited the more accommodating Union of South American Nations (UNASUR) to fill that role.
B U S I N E S S E N V I R O N M E N T
Venezuela is one of the least hospitable countries in the world for business. According to the World Bank’s 2015 Doing Business report, it ranked 186th out of 189 countries, sandwiched between the Central African Republic and South Sudan. It is in the lowest quartile of
34
the rankings in seven out of the 11 areas in which the World Bank ranks countries, including starting a business, getting electricity, paying taxes, and trading across borders. It is at the bottom of the World Bank’s rule of law ranking, and ranks 176 out of 177 countries in corruption perceptions. Reported crime victimization is the highest in Latin America.
Venezuela’s Exchange RatesVenezuela has three official exchange rates. The official currency peg, which is reserved for public-sector imports, is 6.29 Bolívars per dollar. A second rate, for so-called priority imports, was trading at 13.50 Bolívars per dollar in late December. The third rate, introduced in February 2014, can be used by anyone not authorized to buy dollars at the preferred rates. It has been trading at around 200 Bolívars per dollar. A vibrant black market has arisen for dollars. The black market rate, sometimes called the Cúcuta rate after the Colombian border town in which many such transactions reportedly occur, was around 840 Bolívars per dollar in late December. The official exchange rates are overvalued, making conversion of official statistics to dollar values at those rates unrealistic.
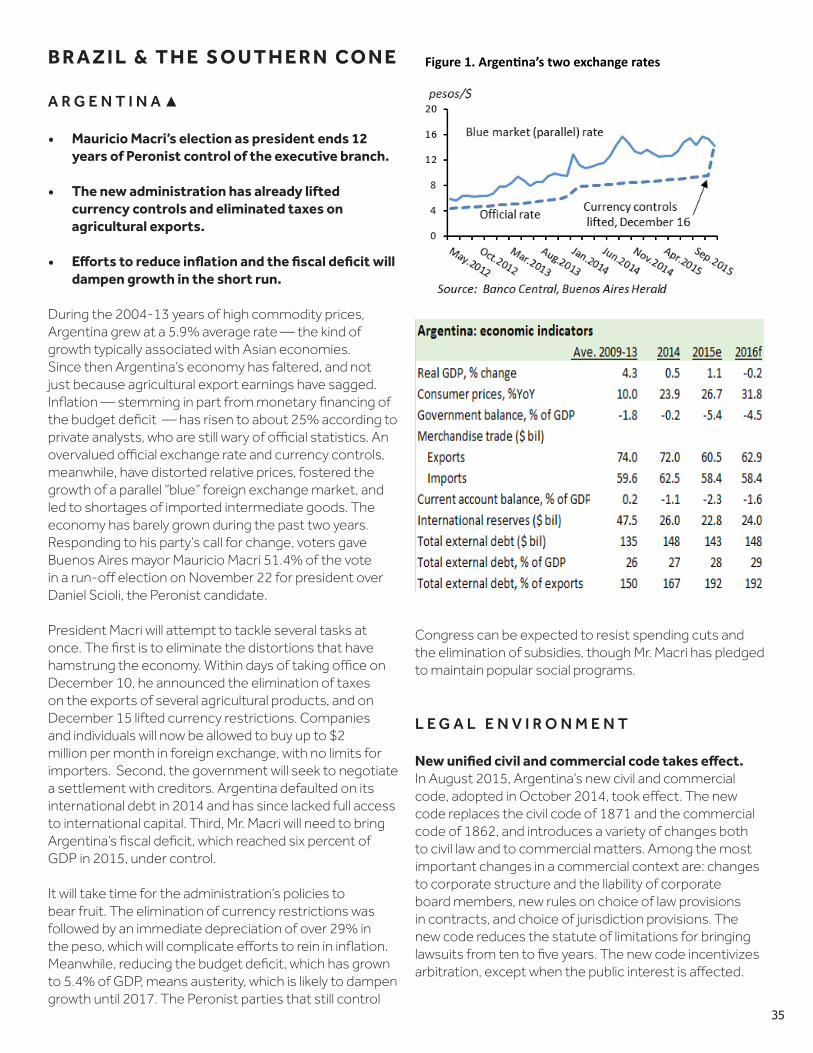
35
B R A Z I L & T H E S O U T H E R N C O N E
A R G E N T I N A ▲
• Mauricio Macri’s election as president ends 12 years of Peronist control of the executive branch.
• The new administration has already lifted currency controls and eliminated taxes on agricultural exports.
• Efforts to reduce inflation and the fiscal deficit will
dampen growth in the short run.
During the 2004-13 years of high commodity prices, Argentina grew at a 5.9% average rate — the kind of growth typically associated with Asian economies. Since then Argentina’s economy has faltered, and not just because agricultural export earnings have sagged. Inflation — stemming in part from monetary financing of the budget deficit — has risen to about 25% according to private analysts, who are still wary of official statistics. An overvalued official exchange rate and currency controls, meanwhile, have distorted relative prices, fostered the growth of a parallel “blue” foreign exchange market, and led to shortages of imported intermediate goods. The economy has barely grown during the past two years. Responding to his party’s call for change, voters gave Buenos Aires mayor Mauricio Macri 51.4% of the vote in a run-off election on November 22 for president over Daniel Scioli, the Peronist candidate.
President Macri will attempt to tackle several tasks at once. The first is to eliminate the distortions that have hamstrung the economy. Within days of taking office on December 10, he announced the elimination of taxes on the exports of several agricultural products, and on December 15 lifted currency restrictions. Companies and individuals will now be allowed to buy up to $2 million per month in foreign exchange, with no limits for importers. Second, the government will seek to negotiate a settlement with creditors. Argentina defaulted on its international debt in 2014 and has since lacked full access to international capital. Third, Mr. Macri will need to bring Argentina’s fiscal deficit, which reached six percent of GDP in 2015, under control.
It will take time for the administration’s policies to bear fruit. The elimination of currency restrictions was followed by an immediate depreciation of over 29% in the peso, which will complicate efforts to rein in inflation. Meanwhile, reducing the budget deficit, which has grown to 5.4% of GDP, means austerity, which is likely to dampen growth until 2017. The Peronist parties that still control
Congress can be expected to resist spending cuts and the elimination of subsidies, though Mr. Macri has pledged to maintain popular social programs.
L E G A L E N V I R O N M E N T
New unified civil and commercial code takes effect. In August 2015, Argentina’s new civil and commercial code, adopted in October 2014, took effect. The new code replaces the civil code of 1871 and the commercial code of 1862, and introduces a variety of changes both to civil law and to commercial matters. Among the most important changes in a commercial context are: changes to corporate structure and the liability of corporate board members, new rules on choice of law provisions in contracts, and choice of jurisdiction provisions. The new code reduces the statute of limitations for bringing lawsuits from ten to five years. The new code incentivizes arbitration, except when the public interest is affected.
Figure 1. Argen,na’s two exchange rates
36
Supreme Court invalidates law allowing political appointment of replacement judges. A law adopted in June gave the council of magistrates, which appoints and removes judges, additional powers to replace judges on courts, and provided that the replacements did not need to be judges. The council, with a strong government majority, removed a sitting judge from the federal court of cassation just as the court was about to rule on the constitutionality of a controversial 2013 treaty with Iran. The judge was replaced with a pro-government lawyer. In November, the Supreme Court ruled that the new appointments law was unconstitutional. The ruling will help the Argentine judiciary maintain its independence.
Case of prosecutor’s death remains unclear, but court rejects allegations of government involvement. In January, special prosecutor Alberto Nisman, who was investigating allegations that the government covered up Iranian involvement in the 1994 bombing of a Jewish community center, filed a 300-page complaint accusing the president and foreign minister of complicity in the affair. A few days later, just before he was supposed to present his evidence to the court, Nisman was found dead in his apartment under mysterious circumstances that have never been completely addressed. In March, a judge dismissed Nisman’s complaints against the president and foreign minister and an appeals court upheld the dismissal.
U.S. court rules Argentine creditors cannot seize assets of central bank. In August, the U.S. Second Circuit Court of Appeals ruled that the Argentine central bank’s assets cannot be seized by creditors holding Argentine debt. Reversing a trial court decision, the appeals court determined that, though the government of Argentina waived its sovereign immunity when it issued debt in 1994, the operations of the central bank—and other state entities like the oil exploration company—are sufficiently autonomous as not to be covered by that waiver. As a result of the decision, the bank and its U.S. partner banks can make interest payments on current debt—ending a state of technical default caused by the lower court decision. The appeals court decision represents the latest move in a long-running battle between Argentina and bondholders. A group of bondholder funds including several U.S. hedge funds have refused exchange offers and continue to pursue damages from Argentina’s 2001 default.
Argentine court orders YPF to disclose details of shale exploration contract with Chevron. In November, the Supreme Court ordered the state energy company, YPF, to make public the terms of its 2013 contract with Chevron to develop the Vaca Muerta shale formation.
The contract was the largest energy investment deal in Argentina with joint investments likely to total some US$15 billion. Foreign investment is needed to exploit Argentina’s shale resources. Opposition lawmakers had claimed that secret clauses in the contract would harm the Argentine national interest. The Supreme Court said that the state company cannot deny public access to this information.
Law renationalizes Argentina’s Rail System. In May, a law re-nationalized Argentina’s railway system. The rail network was privatized in the early 1990s under President Menem. Split into concessions and sold to private companies, the system saw a drop in passengers, revenues and lines. In 2013 the Attorney General revoked the concession held by ALL, a Brazilian company, for noncompliance. During recent years various parts of the rail system have been nationalized and privatized in waves as the government tried to reconcile the political and financial challenges of providing national service.
ICSID appeals committee rejects request to annul pro-Argentina ruling. In January, an International Centre for Settlement of Investment Disputes committee dismissed Daimler Financial Services’ request to annul a 2012 ICSID ruling. Daimler had argued that economic measures adopted by Argentina to address the 2001-2002 financial crisis harmed its business and violated a bilateral investment treaty with Germany. The ICSID panel concurred with Argentina that it had no jurisdiction to arbitrate and that Daimler would have to go through the Argentine court system as provided in the Argentina-Germany bilateral treaty.
Argentina raises minimum wage. In July, the minimum monthly wage in Argentina was increased to US$ 610 from US$ 515. Betting that the increase will stimulate consumer purchasing and not raise product prices, the Minimum Wage Council approved a two-step increase—the first beginning in September and the second to follow in January.
New data protection regulations for Do Not Call registry and CCTV adopted. In February, Argentina’s Data Protection Authority issued regulations to boost private data protection and prevent abusive marketing to consumers. The new measures include fines for failure to observe current personal data processing and Do Not Call regulations, as well as required notice and consent provisions for the use of closed circuit TV data.
Argentina targets companies operating in the Falkland Islands/Malvinas. In June, a court in Argentina’s Tierra del Fuego province ordered the seizure of US$156 million
37
and confiscation of ships and other assets belonging to the Noble Falkland Islands Ltd. and oil companies conducting activities on the continental shelf surrounding the Falkland Islands/Malvinas which are claimed by Argentina. The company had not responded to the court’s request for information about its oil exploration activities in the area which the Argentine government has denounced as illegal. The Argentine government has targeted a consortium of foreign firms, including three British companies (Rockhopper Exploration, Premier Oil and Falkland Oil & Gas); one U.S. firm (Noble Energy); and one Italian firm (Edison International) for their oil exploration work undertaken under permits granted by the Falkland Islands government. Of the companies, only Noble Energy had a presence within Argentina.
B U S I N E S S E N V I R O N M E N T
The new administration of President Macri promises to be substantially more business-friendly than the outgoing Peronist government. There is considerable room for improvement. Argentina ranks 121st out of 189 countries in ease of doing business by the World Bank. In surveys of corruption perceptions it ranks in the third quartile, and dropped in the most recent rankings. Agents report fairly little confidence in the rule of law, and a surprisingly high number of survey respondents report having been victims of crime. Argentina rose in a recent ranking of economic freedom, but from an exceptionally low level.
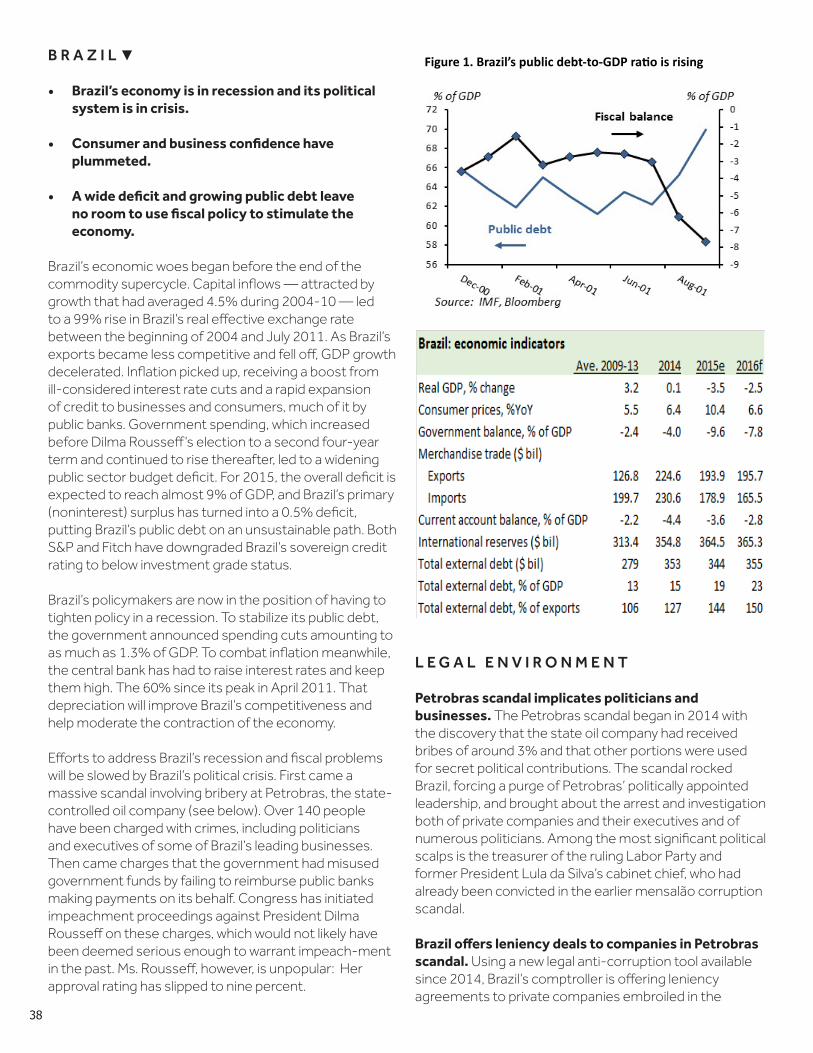
38
B R A Z I L ▼
• Brazil’s economy is in recession and its political system is in crisis.
• Consumer and business confidence have plummeted.
• A wide deficit and growing public debt leave no room to use fiscal policy to stimulate the economy.
Brazil’s economic woes began before the end of the commodity supercycle. Capital inflows — attracted by growth that had averaged 4.5% during 2004-10 — led to a 99% rise in Brazil’s real effective exchange rate between the beginning of 2004 and July 2011. As Brazil’s exports became less competitive and fell off, GDP growth decelerated. Inflation picked up, receiving a boost from ill-considered interest rate cuts and a rapid expansion of credit to businesses and consumers, much of it by public banks. Government spending, which increased before Dilma Rousseff’s election to a second four-year term and continued to rise thereafter, led to a widening public sector budget deficit. For 2015, the overall deficit is expected to reach almost 9% of GDP, and Brazil’s primary (noninterest) surplus has turned into a 0.5% deficit, putting Brazil’s public debt on an unsustainable path. Both S&P and Fitch have downgraded Brazil’s sovereign credit rating to below investment grade status.
Brazil’s policymakers are now in the position of having to tighten policy in a recession. To stabilize its public debt, the government announced spending cuts amounting to as much as 1.3% of GDP. To combat inflation meanwhile, the central bank has had to raise interest rates and keep them high. The 60% since its peak in April 2011. That depreciation will improve Brazil’s competitiveness and help moderate the contraction of the economy.
Efforts to address Brazil’s recession and fiscal problems will be slowed by Brazil’s political crisis. First came a massive scandal involving bribery at Petrobras, the state-controlled oil company (see below). Over 140 people have been charged with crimes, including politicians and executives of some of Brazil’s leading businesses. Then came charges that the government had misused government funds by failing to reimburse public banks making payments on its behalf. Congress has initiated impeachment proceedings against President Dilma Rousseff on these charges, which would not likely have been deemed serious enough to warrant impeach-ment in the past. Ms. Rousseff, however, is unpopular: Her approval rating has slipped to nine percent.
L E G A L E N V I R O N M E N T
Petrobras scandal implicates politicians and businesses. The Petrobras scandal began in 2014 with the discovery that the state oil company had received bribes of around 3% and that other portions were used for secret political contributions. The scandal rocked Brazil, forcing a purge of Petrobras’ politically appointed leadership, and brought about the arrest and investigation both of private companies and their executives and of numerous politicians. Among the most significant political scalps is the treasurer of the ruling Labor Party and former President Lula da Silva’s cabinet chief, who had already been convicted in the earlier mensalão corruption scandal.
Brazil offers leniency deals to companies in Petrobras scandal. Using a new legal anti-corruption tool available since 2014, Brazil’s comptroller is offering leniency agreements to private companies embroiled in the
Figure 1. Brazil’s public debt-‐to-‐GDP ra:o is rising
39
Petrobras corruption scandal. Companies who admit wrongdoing, pay fines, and set up corruption prevention practices will remain eligible for public contracts. Petrobras suspended business with many suppliers who are under investigation for bribery and collusive pricing. The government hopes that Petrobras will resume business with cleared entities, unblocking resources that could affect as many as 51,000 companies. There are concerns that the wealthy and well-connected will not be held accountable for their misdeeds. Critics also wonder whether companies who benefit from the leniency will cooperate with the investigations. The ultimate impact of the new plea bargaining policy is uncertain because these legal options are new to Brazil.
Petrobras draws attention of the Securities and Exchange Commission and U.S. lawyers. Petrobras is being sued by the state of Ohio which argues that the company has defrauded investors. The state pension fund claims it suffered losses as a result of Petrobras’ declining share value, which was in turn precipitated by Brazil’s corruption scandal. The U.S. Securities and Exchange Commission opened investigations of Petrobras activities and subpoenaed the company in November 2014 for information about its activities in relation to corruption investigations. Petrobras is subject to U.S. jurisdiction because its shares are traded on U.S. exchanges.
Brazil adopts new code of civil procedure. When Law No. 13.105/2015 takes effect in March 2016, the new Code of Civil Procedure will replace the current code that dates from 1973. A new code is intended to simplify and streamline court proceedings, and to encourage alternate dispute resolution methods. The code will reduce the number of interlocutory appeals that could be filed during a proceeding, with most issues saved for final appeal. Judges will need to address the arguments of both sides in their rulings. Judges also will encourage mediation efforts by parties, with courts obliged to establish consensual mediation centers.
Brazil adopts new mediation law. A new mediation act, adopted in June, takes effect on December 25, 2015, and is intended provide a comprehensive framework for alternate dispute resolution. The act sets out the requirements and standards for mediators and conciliators operating in Brazil, and outlines the process for mediation. Importantly, the new act allows parties to suspend litigation during the course of mediation, and provides that procedural deadlines also will be suspended while mediation continues. The act provides
for mediation panels to handle disputes with federal, state and municipal governments, but also allows for private mediators. Finally, the new act also provides for the mediation of disputes inside and among government agencies.
Amendments to arbitration law approved. In May, important changes to Brazil’s arbitration law entered into force. The law reinforces and encourages the use of arbitration, allows arbitrators to issue partial awards, upholds corporate arbitration and allows a court to set aside arbitral awards on appeal. Provisions involving arbitration in consumer and labor relations were vetoed by the president.
Brazilian Supreme Court bans corporate donations to political parties. Corporate donations to political parties, hitherto allowed to be 2% of a company’s annual gross revenue, were declared unconstitutional by the Brazilian Supreme Court on September 17. The national bar association challenged the electoral laws claiming they allowed for corporate manipulation of the electoral process. A dissenting justice, however, argued that restricting legitimate funding would silence parties that played by the rules. Others argue that it would leave parties to turn to bribery. In 2014, corporations provided nearly $800 million for the elections while contributions by individual donors totaled less than $130 million.
New corruption charges target presidential allies. In addition to the problems caused by the Petrobras scandal, the electoral court voted in October to reopen a criminal investigation about the use of illegal funds by the ruling coalition in the 2014 presidential election. The allegation is that the Labor Party received large contributions from companies being investigated under the Petrobras corruption scandal. In July, federal prosecutors launched new investigations about corruption in the former administration of President Lula da Silva, involving promotion of Brazil’s Odebrecht construction company in African and Caribbean projects. Finally, the attorney general also brought corruption charges against Eduardo Cunha, president of the lower house of Congress who is not considered an ally of the president.
Brazil proposes new privacy law. The first draft of a privacy law released in July raised concerns that the law could jeopardize commercial activities in the tech sector and data processing businesses, thus harming consumer privacy. Analysts point out that definitions for key terms such as “personal data”, “prior consent”, and “jurisdiction” may be too broad. Critics argue that the law could cause excessive restrictions on data transfers; that its joint
40
liability clause may be better suited to private agreements; and that the need for a new regulatory agency is questionable. The draft law will be subject to rewriting and it is expected to take two years before becoming law.
Brazil raises taxes on financial firms. In September, Brazil’s senate approved legislation to raise the tax on financial firms’ profits to 20% for the next three years, after which the rate will return to the current 15%. The revenue raised from institutions, including banks and brokerages, is projected to be R$4 billion by 2017. Experts predict that the tax increase will lead to a reduction of loans issued and repayments made.
Rio de Janeiro becomes first city in Brazil to ban Uber. In September Rio de Janeiro’s city council passed legislation banning smartphone-based ride-hailing applications, and Mayor Eduardo Paes signed the bill on September 29. São Paolo rejected a similar approach, choosing to regulate Uber as a kind of taxi service. Brasilia also rejected a call to ban the service outright. Uber presents itself as a solution to job creation and to transportation shortages. However, the ridesharing service is controversial in Brazil, provoking large protests from traditional taxi drivers. In addition to Rio and São Paolo, 13 other Brazilian municipalities have considered legislation to ban the service.
Companies focus on compliance policies in the face of Brazil’s anti-corruption crackdown. Brazil’s new anti-corruption statute, the Brazilian Clean Companies Act, adopted in 2014, credits corporate entities for compliance policies and practices. New regulations issued in March address how authorities will evaluate corporate compliance programs, their policies covering interaction with government officials, and the transparency of corporate actions in the political arena. Brazil’s Foreign Corrupt Practices Act, signed into law in 2013, also is being vigorously applied by prosecutors investigating corruption. Companies would be well-advised to monitor their “anti-corruption risk profiles” and audit implementation of their compliance programs.
B U S I N E S S E N V I R O N M E N T
Despite the bribery scandal at Petrobras, survey respondents report that perceptions of corruption and the rule of law are improving in Brazil. Overall, the ease of doing business in Brazil also has improved, according to the World Bank, though Brazil is still in the bottom half of the rankings. That improvement comes despite a deterioration in some subcategories of the rankings, such as the number of tax payments required per year and the corporate tax rate, and in the country’s ranking on economic freedom. Reported crime victimization in Brazil, meanwhile, is one of the highest in Latin America.
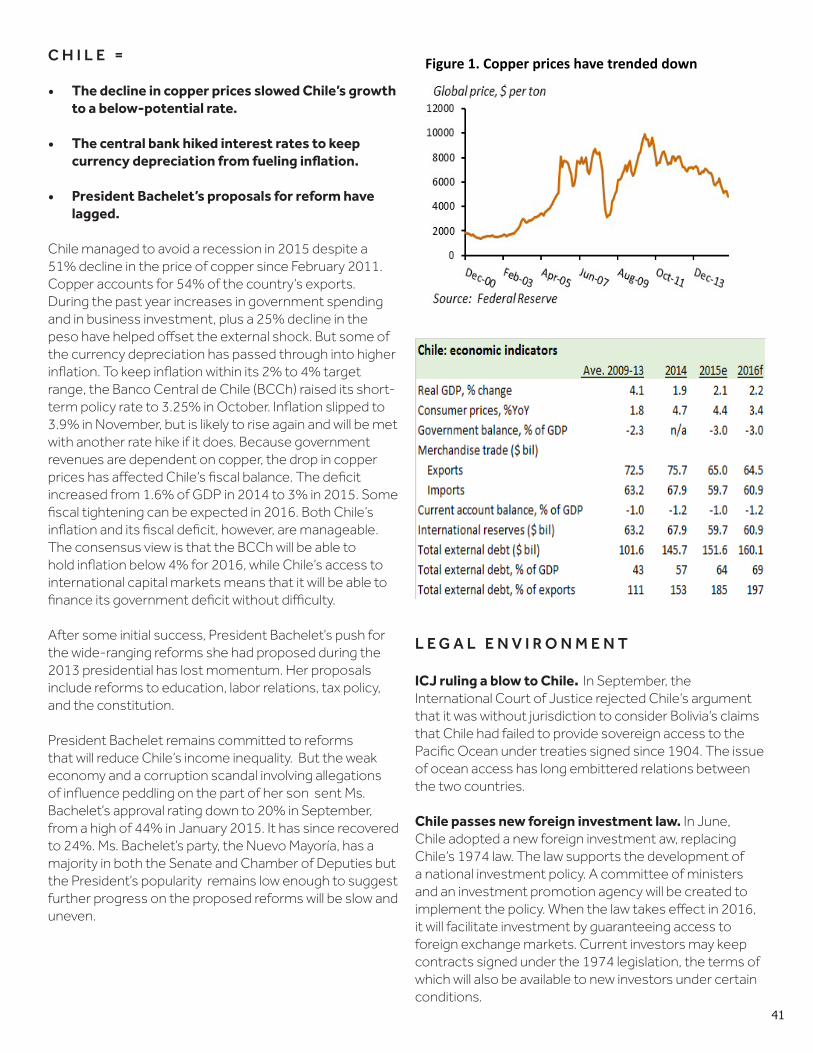
41
C H I L E =
• The decline in copper prices slowed Chile’s growth to a below-potential rate.
• The central bank hiked interest rates to keep currency depreciation from fueling inflation.
• President Bachelet’s proposals for reform have lagged.
Chile managed to avoid a recession in 2015 despite a 51% decline in the price of copper since February 2011. Copper accounts for 54% of the country’s exports. During the past year increases in government spending and in business investment, plus a 25% decline in the peso have helped offset the external shock. But some of the currency depreciation has passed through into higher inflation. To keep inflation within its 2% to 4% target range, the Banco Central de Chile (BCCh) raised its short-term policy rate to 3.25% in October. Inflation slipped to 3.9% in November, but is likely to rise again and will be met with another rate hike if it does. Because government revenues are dependent on copper, the drop in copper prices has affected Chile’s fiscal balance. The deficit increased from 1.6% of GDP in 2014 to 3% in 2015. Some fiscal tightening can be expected in 2016. Both Chile’s inflation and its fiscal deficit, however, are manageable. The consensus view is that the BCCh will be able to hold inflation below 4% for 2016, while Chile’s access to international capital markets means that it will be able to finance its government deficit without difficulty.
After some initial success, President Bachelet’s push for the wide-ranging reforms she had proposed during the 2013 presidential has lost momentum. Her proposals include reforms to education, labor relations, tax policy, and the constitution.
President Bachelet remains committed to reforms that will reduce Chile’s income inequality. But the weak economy and a corruption scandal involving allegations of influence peddling on the part of her son sent Ms. Bachelet’s approval rating down to 20% in September, from a high of 44% in January 2015. It has since recovered to 24%. Ms. Bachelet’s party, the Nuevo Mayoría, has a majority in both the Senate and Chamber of Deputies but the President’s popularity remains low enough to suggest further progress on the proposed reforms will be slow and uneven.
L E G A L E N V I R O N M E N T
ICJ ruling a blow to Chile. In September, the International Court of Justice rejected Chile’s argument that it was without jurisdiction to consider Bolivia’s claims that Chile had failed to provide sovereign access to the Pacific Ocean under treaties signed since 1904. The issue of ocean access has long embittered relations between the two countries.
Chile passes new foreign investment law. In June, Chile adopted a new foreign investment aw, replacing Chile’s 1974 law. The law supports the development of a national investment policy. A committee of ministers and an investment promotion agency will be created to implement the policy. When the law takes effect in 2016, it will facilitate investment by guaranteeing access to foreign exchange markets. Current investors may keep contracts signed under the 1974 legislation, the terms of which will also be available to new investors under certain conditions.
Figure 1. Copper prices have trended down
42
President Bachelet pushes new constitution project. In October, President Bachelet began pushing for a new constitution to replace the current document drawn up in 1980 during the Pinochet dictatorship. Constitutional reform was one of President Bachelet’s main electoral pledges prior to her election in 2013. The reform project will begin with a civic education phase running through March 2016, and ultimately be submitted to Congress in 2017. Any reformed constitution would be considered by the next Congress in 2018, which would also need to decide a mechanism for its approval. Options for the approval could include: 1) a bicameral commission of senators and deputies; 2) a mixed commission made up of citizens and legislators; 3) an elected constituent assembly; or 4) a plebiscite in which the electorate would be asked to decide which of the first three options it prefers.
Education law passes. In January, Congress approved a major part of President Bachelet’s education reform initiative. The new law will end for-profit education in any school which receives public funding and eliminate stu-dent selection by schools. The new law also abolishes the traditional system of education financing which had been divided between the government and payers of school fees. The costs of the education reform will be borne by the government and funded by increases in corporate taxes.
Water conflicts emerge. In March, a Chilean court ruled that Antofagasta, a mining company, must remove part of a waste dam wall which restricted water flow from the Los Pelambres mine site to the nearby town of Caimanes. This decision came after an October 2014 Supreme Court ruling that the company needed to allow some water flow or remove the dam. The ruling had little impact on the company’s production and share prices but the protests and resulting court decisions may reflect increasing the importance and risks of water rights conflicts.
Chile approves civil unions for unmarried and same-sex couples. In January, Congress approved a law providing for civil unions that will provide many of the attributes of marriage both to same-sex and unmarried heterosexual couples.
B U S I N E S S E N V I R O N M E N T
Other than the increase in the corporate tax rate, which is being phased in over four years, the past year saw little change in Chile’s business climate. It remains one of the most business-friendly countries in Latin America, ranked second only to Mexico in the World Bank’s latest ease of doing business ratings. In perceptions of corruption, Chile is ranked 21st in the world, just below Hong Kong, Ireland, and the United States in Transparency International’s most recent rankings.
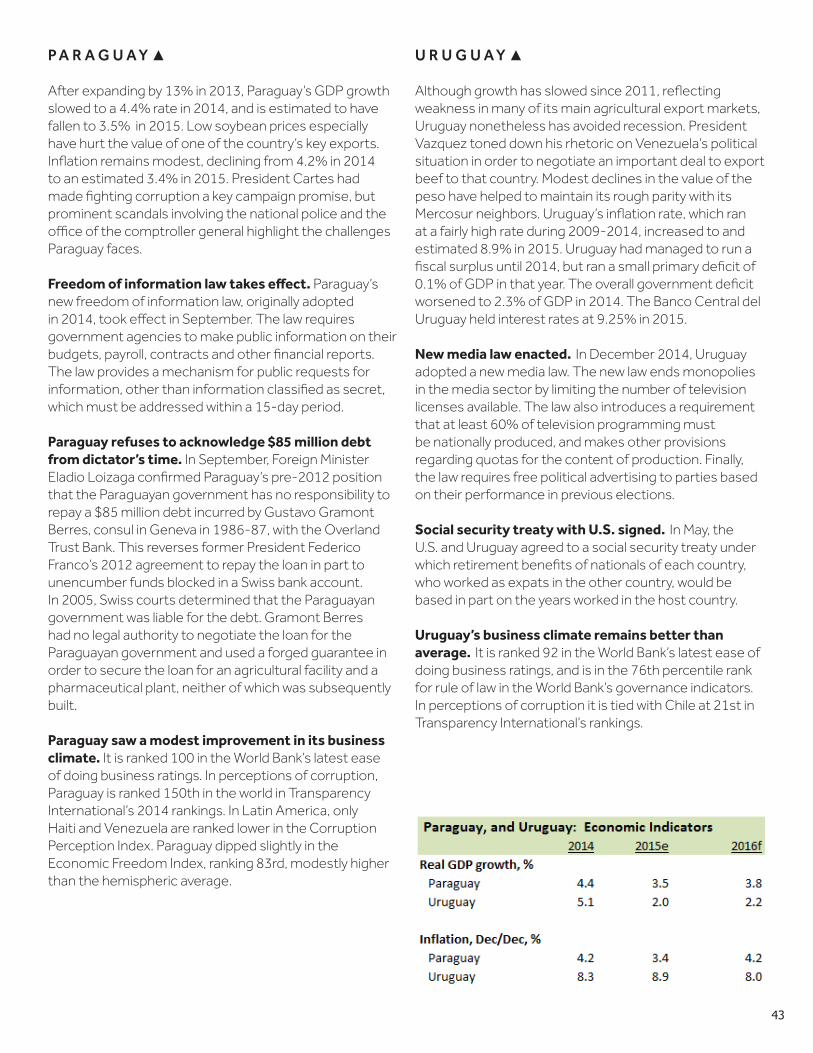
43
P A R A G U A Y ▲
After expanding by 13% in 2013, Paraguay’s GDP growth slowed to a 4.4% rate in 2014, and is estimated to have fallen to 3.5% in 2015. Low soybean prices especially have hurt the value of one of the country’s key exports. Inflation remains modest, declining from 4.2% in 2014 to an estimated 3.4% in 2015. President Cartes had made fighting corruption a key campaign promise, but prominent scandals involving the national police and the office of the comptroller general highlight the challenges Paraguay faces.
Freedom of information law takes effect. Paraguay’s new freedom of information law, originally adopted in 2014, took effect in September. The law requires government agencies to make public information on their budgets, payroll, contracts and other financial reports. The law provides a mechanism for public requests for information, other than information classified as secret, which must be addressed within a 15-day period.
Paraguay refuses to acknowledge $85 million debt from dictator’s time. In September, Foreign Minister Eladio Loizaga confirmed Paraguay’s pre-2012 position that the Paraguayan government has no responsibility to repay a $85 million debt incurred by Gustavo Gramont Berres, consul in Geneva in 1986-87, with the Overland Trust Bank. This reverses former President Federico Franco’s 2012 agreement to repay the loan in part to unencumber funds blocked in a Swiss bank account. In 2005, Swiss courts determined that the Paraguayan government was liable for the debt. Gramont Berres had no legal authority to negotiate the loan for the Paraguayan government and used a forged guarantee in order to secure the loan for an agricultural facility and a pharmaceutical plant, neither of which was subsequently built.
Paraguay saw a modest improvement in its business climate. It is ranked 100 in the World Bank’s latest ease of doing business ratings. In perceptions of corruption, Paraguay is ranked 150th in the world in Transparency International’s 2014 rankings. In Latin America, only Haiti and Venezuela are ranked lower in the Corruption Perception Index. Paraguay dipped slightly in the Economic Freedom Index, ranking 83rd, modestly higher than the hemispheric average.
U R U G U A Y ▲
Although growth has slowed since 2011, reflecting weakness in many of its main agricultural export markets, Uruguay nonetheless has avoided recession. President Vazquez toned down his rhetoric on Venezuela’s political situation in order to negotiate an important deal to export beef to that country. Modest declines in the value of the peso have helped to maintain its rough parity with its Mercosur neighbors. Uruguay’s inflation rate, which ran at a fairly high rate during 2009-2014, increased to and estimated 8.9% in 2015. Uruguay had managed to run a fiscal surplus until 2014, but ran a small primary deficit of 0.1% of GDP in that year. The overall government deficit worsened to 2.3% of GDP in 2014. The Banco Central del Uruguay held interest rates at 9.25% in 2015.
New media law enacted. In December 2014, Uruguay adopted a new media law. The new law ends monopolies in the media sector by limiting the number of television licenses available. The law also introduces a requirement that at least 60% of television programming must be nationally produced, and makes other provisions regarding quotas for the content of production. Finally, the law requires free political advertising to parties based on their performance in previous elections.
Social security treaty with U.S. signed. In May, the U.S. and Uruguay agreed to a social security treaty under which retirement benefits of nationals of each country, who worked as expats in the other country, would be based in part on the years worked in the host country.
Uruguay’s business climate remains better than average. It is ranked 92 in the World Bank’s latest ease of doing business ratings, and is in the 76th percentile rank for rule of law in the World Bank’s governance indicators. In perceptions of corruption it is tied with Chile at 21st in Transparency International’s rankings.

44
45
Table 1 GDP GROWTH, 2006-2016
Table 2 ANNUAL INFLATION, 2006-2016
Table 3 EXPORTS, IMPORTS & CURRENT ACCOUNT BALANCE, 2011-2016
Table 4 TERMS OF TRADE, 2006-2014
Table 5 NET FOREIGN DIRECT INVESTMENT, 2006-2014
Table 6 TOTAL GROSS EXTERNAL DEBT, 2007-2016
Table 7 TOTAL GROSS EXTERNAL DEBT AS PERCENTAGE OF IMPORTS, 2009-2016
Table 8 TOTAL EXTERNAL DEBT AS PERCENTAGE OF GDP, 2006-2016
Table 9 FISCAL BALANCE, 2009-2014
Table 10 CURRENCY REGIMES & EXCHANGE RATES
Table 11 COUNTRY RISK & IMF RELATIONS
Table 12 SOCIAL ENVIRONMENT
Table 13 POLITICAL ENVIRONMENT
Table 14 LEGAL ENVIRONMENT
Table 15 BUSINESS ENVIRONMENT
T A B L E S
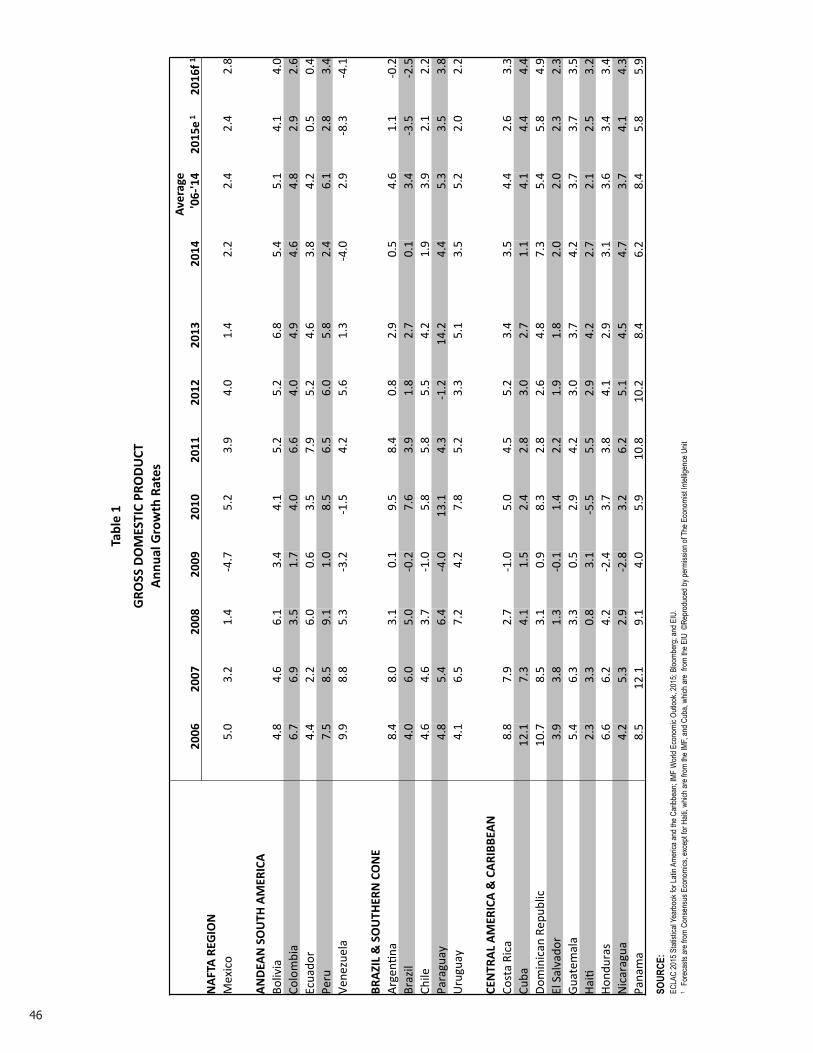
46
Table 1
GRO
SS DOMESTIC PRODUCT
Annual G
rowth Rates
2006
2007
2008
2009
2010
2011
2012
2013
2014
Average
'06-‐'14
2015e 1
2016f 1
NAFTA REG
ION
Mex
ico
5.0
3.2
1.4
-‐4.7
5.
2 3.
9 4.
0 1.
4 2.
2 2.
4 2.
4 2.
8
ANDEAN SOUTH
AMERICA
Bo
livia
4.
8 4.
6 6.
1 3.
4 4.
1 5.
2 5.
2 6.
8 5.
4 5.
1 4.
1 4.
0 Co
lom
bia
6.7
6.9
3.5
1.7
4.0
6.6
4.0
4.9
4.6
4.8
2.9
2.6
Ecua
dor
4.4
2.2
6.0
0.6
3.5
7.9
5.2
4.6
3.8
4.2
0.5
0.4
Peru
7.
5 8.
5 9.
1 1.
0 8.
5 6.
5 6.
0 5.
8 2.
4 6.
1 2.
8 3.
4 Ve
nezu
ela
9.9
8.8
5.3
-‐3.2
-‐1
.5
4.2
5.6
1.3
-‐4.0
2.
9 -‐8
.3
-‐4.1
BR
AZIL & SOUTH
ERN CONE
Ar
genE
na
8.4
8.0
3.1
0.1
9.5
8.4
0.8
2.9
0.5
4.6
1.1
-‐0.2
Br
azil
4.0
6.0
5.0
-‐0.2
7.
6 3.
9 1.
8 2.
7 0.
1 3.
4 -‐3
.5
-‐2.5
Ch
ile
4.6
4.6
3.7
-‐1.0
5.
8 5.
8 5.
5 4.
2 1.
9 3.
9 2.
1 2.
2 Pa
ragu
ay
4.8
5.4
6.4
-‐4.0
13
.1
4.3
-‐1.2
14
.2
4.4
5.3
3.5
3.8
Uru
guay
4.
1 6.
5 7.
2 4.
2 7.
8 5.
2 3.
3 5.
1 3.
5 5.
2 2.
0 2.
2
CENTRAL AMERICA & CARIBB
EAN
Co
sta
Rica
8.
8 7.
9 2.
7 -‐1
.0
5.0
4.5
5.2
3.4
3.5
4.4
2.6
3.3
Cuba
12
.1
7.3
4.1
1.5
2.4
2.8
3.0
2.7
1.1
4.1
4.4
4.4
Dom
inic
an R
epub
lic
10.7
8.
5 3.
1 0.
9 8.
3 2.
8 2.
6 4.
8 7.
3 5.
4 5.
8 4.
9 El
Sal
vado
r 3.
9 3.
8 1.
3 -‐0
.1
1.4
2.2
1.9
1.8
2.0
2.0
2.3
2.3
Guat
emal
a 5.
4 6.
3 3.
3 0.
5 2.
9 4.
2 3.
0 3.
7 4.
2 3.
7 3.
7 3.
5 Ha
iE
2.3
3.3
0.8
3.1
-‐5.5
5.
5 2.
9 4.
2 2.
7 2.
1 2.
5 3.
2 Ho
ndur
as
6.6
6.2
4.2
-‐2.4
3.
7 3.
8 4.
1 2.
9 3.
1 3.
6 3.
4 3.
4 N
icar
agua
4.
2 5.
3 2.
9 -‐2
.8
3.2
6.2
5.1
4.5
4.7
3.7
4.1
4.3
Pana
ma
8.5
12.1
9.
1 4.
0 5.
9 10
.8
10.2
8.
4 6.
2 8.
4 5.
8 5.
9
SOUR
CE:
ECLA
C 20
15 S
tatist
ical Y
earb
ook f
or La
tin A
meric
a and
the C
aribb
ean;
IMF
Wor
ld Ec
onom
ic Ou
tlook
, 201
5; Bl
oomb
erg;
and E
IU.
1 F
orec
asts
are f
rom
Cons
ensu
s Eco
nomi
cs, e
xcep
t for H
aiti, w
hich a
re fr
om th
e IMF
, and
Cub
a, wh
ich ar
e fro
m the
EIU
©Re
prod
uced
by pe
rmiss
ion of
The
Eco
nomi
st Int
ellige
nce U
nit
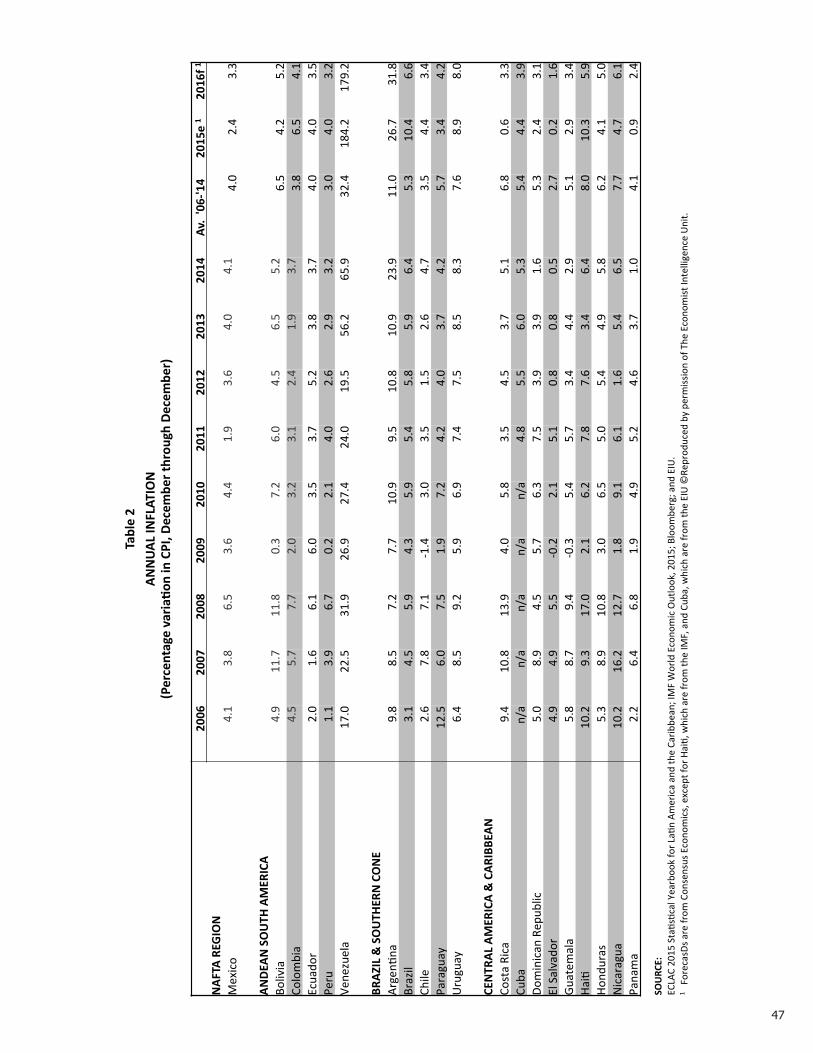
47
Table 2
ANNUAL INFLATION
(Percentage variaTon in CPI, D
ecem
ber through Decem
ber)
2006
2007
2008
2009
2010
2011
2012
2013
2014
Av. '06-‐'14
2015e 1
2016f 1
NAFTA REG
ION
Mex
ico
4.1
3.8
6.5
3.6
4.4
1.9
3.6
4.0
4.1
4.0
2.4
3.3
ANDEAN SOUTH
AMERICA
Bo
livia
4.
9 11
.7
11.8
0.
3 7.
2 6.
0 4.
5 6.
5 5.
2 6.
5 4.
2 5.
2 Co
lom
bia
4.5
5.7
7.7
2.0
3.2
3.1
2.4
1.9
3.7
3.8
6.5
4.1
Ecua
dor
2.0
1.6
6.1
6.0
3.5
3.7
5.2
3.8
3.7
4.0
4.0
3.5
Peru
1.
1 3.
9 6.
7 0.
2 2.
1 4.
0 2.
6 2.
9 3.
2 3.
0 4.
0 3.
2 Ve
nezu
ela
17.0
22
.5
31.9
26
.9
27.4
24
.0
19.5
56
.2
65.9
32
.4
184.
2 17
9.2
BRAZIL & SOUTH
ERN CONE
Ar
genE
na
9.8
8.5
7.2
7.7
10.9
9.
5 10
.8
10.9
23
.9
11.0
26
.7
31.8
Br
azil
3.1
4.5
5.9
4.3
5.9
5.4
5.8
5.9
6.4
5.3
10.4
6.
6 Ch
ile
2.6
7.8
7.1
-‐1.4
3.
0 3.
5 1.
5 2.
6 4.
7 3.
5 4.
4 3.
4 Pa
ragu
ay
12.5
6.
0 7.
5 1.
9 7.
2 4.
2 4.
0 3.
7 4.
2 5.
7 3.
4 4.
2 U
rugu
ay
6.4
8.5
9.2
5.9
6.9
7.4
7.5
8.5
8.3
7.6
8.9
8.0
CENTRAL AMERICA & CARIBB
EAN
Co
sta
Rica
9.
4 10
.8
13.9
4.
0 5.
8 3.
5 4.
5 3.
7 5.
1 6.
8 0.
6 3.
3 Cu
ba
n/a
n/a
n/a
n/a
n/a
4.8
5.5
6.0
5.3
5.4
4.4
3.9
Dom
inic
an R
epub
lic
5.0
8.9
4.5
5.7
6.3
7.5
3.9
3.9
1.6
5.3
2.4
3.1
El S
alva
dor
4.9
4.9
5.5
-‐0.2
2.
1 5.
1 0.
8 0.
8 0.
5 2.
7 0.
2 1.
6 Gu
atem
ala
5.8
8.7
9.4
-‐0.3
5.
4 5.
7 3.
4 4.
4 2.
9 5.
1 2.
9 3.
4 Ha
iE
10.2
9.
3 17
.0
2.1
6.2
7.8
7.6
3.4
6.4
8.0
10.3
5.
9 Ho
ndur
as
5.3
8.9
10.8
3.
0 6.
5 5.
0 5.
4 4.
9 5.
8 6.
2 4.
1 5.
0 N
icar
agua
10
.2
16.2
12
.7
1.8
9.1
6.1
1.6
5.4
6.5
7.7
4.7
6.1
Pana
ma
2.2
6.4
6.8
1.9
4.9
5.2
4.6
3.7
1.0
4.1
0.9
2.4
SOURCE:
ECLA
C 20
15 S
taEs
Ecal
Yea
rboo
k fo
r LaE
n Am
eric
a an
d th
e Ca
ribbe
an; I
MF
Wor
ld E
cono
mic
Out
look
, 201
5; B
loom
berg
; and
EIU
. 1
For
ecas
ts a
re fr
om C
onse
nsus
Eco
nom
ics,
exc
ept f
or H
aiE,
whi
ch a
re fr
om th
e IM
F, a
nd C
uba,
whi
ch a
re fr
om th
e EI
U ©
Repr
oduc
ed b
y pe
rmiss
ion
of T
he E
cono
mist
Inte
llige
nce
Uni
t.
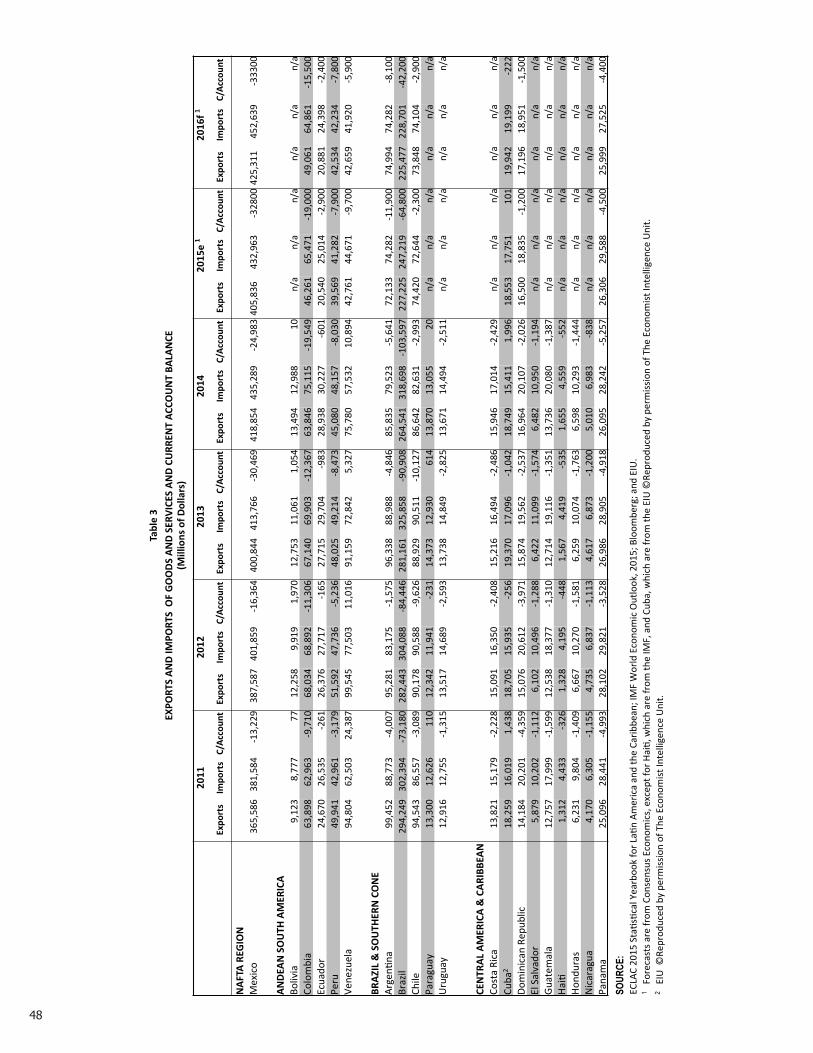
48
Table 3
EXPO
RTS AND IM
PORTS OF GOODS AND SERVICES AND CURR
ENT ACCOUNT BA
LANCE
(M
illions of D
ollars)
2011
2012
2013
2014
2015e 1
2016f 1
Exports
Imports
C/Account Exports
Imports
C/Account Exports
Imports
C/Account Exports
Imports
C/Account Exports
Imports
C/Account Exports
Imports
C/Account
NAFTA REG
ION
Mex
ico
365,
586
381,
584
-‐13,
229
387,
587
401,
859
-‐16,
364
400,
844
413,
766
-‐30,
469
418,
854
435,
289
-‐24,
983
405,
836
43
2,96
3 -‐3
2800
425
,311
45
2,63
9 -‐3
3300
ANDEAN SOUTH
AMERICA
Boliv
ia
9,12
3 8,
777
77
12,2
58
9,91
9 1,
970
12,7
53
11,0
61
1,05
4 13
,494
12
,988
10
n/
a n/
a n/
a n/
a n/
a n/
a Co
lom
bia
63,8
98
62,9
63
-‐9,7
10
68,0
34
68,8
92
-‐11,
306
67,1
40
69,9
03
-‐12,
367
63,8
46
75,1
15
-‐19,
549
46,2
61
65,4
71
-‐19,
000
49,0
61
64,8
61
-‐15,
500
Ecua
dor
24,6
70
26,5
35
-‐261
26
,376
27
,717
-‐1
65
27,7
15
29,7
04
-‐983
28
,938
30
,227
-‐6
01
20,5
40
25,0
14
-‐2,9
00
20,8
81
24,3
98
-‐2,4
00
Peru
49
,941
42
,961
-‐3
,179
51
,592
47
,736
-‐5
,236
48
,025
49
,214
-‐8
,473
45
,080
48
,157
-‐8
,030
39
,569
41
,282
-‐7
,900
42
,534
42
,234
-‐7
,800
Ve
nezu
ela
94,8
04
62,5
03
24,3
87
99,5
45
77,5
03
11,0
16
91,1
59
72,8
42
5,32
7 75
,780
57
,532
10
,894
42
,761
44
,671
-‐9
,700
42
,659
41
,920
-‐5
,900
BRAZIL & SOUTH
ERN CONE
Arge
nEna
99
,452
88
,773
-‐4
,007
95
,281
83
,175
-‐1
,575
96
,338
88
,988
-‐4
,846
85
,835
79
,523
-‐5
,641
72
,133
74
,282
-‐1
1,90
0 74
,994
74
,282
-‐8
,100
Br
azil
294,
249
302,
394
-‐73,
180
282,
443
304,
088
-‐84,
446
281,
161
325,
858
-‐90,
908
264,
541
318,
698
-‐103
,597
22
7,22
5 24
7,21
9 -‐6
4,80
0 22
5,47
7 22
8,70
1 -‐4
2,20
0 Ch
ile
94,5
43
86,5
57
-‐3,0
89
90,1
78
90,5
88
-‐9,6
26
88,9
29
90,5
11
-‐10,
127
86,6
42
82,6
31
-‐2,9
93
74,4
20
72,6
44
-‐2,3
00
73,8
48
74,1
04
-‐2,9
00
Para
guay
13
,300
12
,626
11
0 12
,342
11
,941
-‐2
31
14,3
73
12,9
30
614
13,8
70
13,0
55
20
n/a
n/a
n/a
n/a
n/a
n/a
Uru
guay
12
,916
12
,755
-‐1
,315
13
,517
14
,689
-‐2
,593
13
,738
14
,849
-‐2
,825
13
,671
14
,494
-‐2
,511
n/
a n/
a n/
a n/
a n/
a n/
a
CENTRAL AMERICA & CARIBB
EAN
Co
sta
Rica
13
,821
15
,179
-‐2
,228
15
,091
16
,350
-‐2
,408
15
,216
16
,494
-‐2
,486
15
,946
17
,014
-‐2
,429
n/
a n/
a n/
a n/
a n/
a n/
a Cu
ba2
18,2
59
16,0
19
1,43
8 18
,705
15
,935
-‐2
56
19,3
70
17,0
96
-‐1,0
42
18,7
49
15,4
11
1,99
6 18
,553
17
,751
10
1 19
,942
19
,199
-‐2
22
Dom
inic
an R
epub
lic
14,1
84
20,2
01
-‐4,3
59
15,0
76
20,6
12
-‐3,9
71
15,8
74
19,5
62
-‐2,5
37
16,9
64
20,1
07
-‐2,0
26
16,5
00
18,8
35
-‐1,2
00
17,1
96
18,9
51
-‐1,5
00
El S
alva
dor
5,87
9 10
,202
-‐1
,112
6,
102
10,4
96
-‐1,2
88
6,42
2 11
,099
-‐1
,574
6,
482
10,9
50
-‐1,1
94
n/a
n/a
n/a
n/a
n/a
n/a
Guat
emal
a 12
,757
17
,999
-‐1
,599
12
,538
18
,377
-‐1
,310
12
,714
19
,116
-‐1
,351
13
,736
20
,080
-‐1
,387
n/
a n/
a n/
a n/
a n/
a n/
a Ha
iE
1,31
2 4,
433
-‐326
1,
328
4,19
5 -‐4
48
1,56
7 4,
419
-‐535
1,
655
4,55
9 -‐5
52
n/a
n/a
n/a
n/a
n/a
n/a
Hond
uras
6,
231
9,80
4 -‐1
,409
6,
667
10,2
70
-‐1,5
81
6,25
9 10
,074
-‐1
,763
6,
598
10,2
93
-‐1,4
44
n/a
n/a
n/a
n/a
n/a
n/a
Nic
arag
ua
4,17
0 6,
305
-‐1,1
55
4,73
5 6,
837
-‐1,1
13
4,61
7 6,
873
-‐1,2
00
5,01
0 6,
983
-‐838
n/
a n/
a n/
a n/
a n/
a n/
a Pa
nam
a 25
,096
28
,441
-‐4
,993
28
,102
29
,821
-‐3
,528
26
,986
28
,905
-‐4
,918
26
,095
28
,242
-‐5
,257
26
,306
29
,588
-‐4
,500
25
,999
27
,525
-‐4
,400
SOUR
CE:
ECLA
C 20
15 S
taEs
Ecal
Yea
rboo
k fo
r LaE
n Am
eric
a an
d th
e Ca
ribbe
an; I
MF
Wor
ld E
cono
mic
Out
look
, 201
5; B
loom
berg
; and
EIU
. 1
Fore
cast
s are
from
Con
sens
us E
cono
mic
s, e
xcep
t for
Hai
E, w
hich
are
from
the
IMF,
and
Cub
a, w
hich
are
from
the
EIU
©Re
prod
uced
by
perm
issio
n of
The
Eco
nom
ist In
telli
genc
e U
nit.
2 E
IU ©
Repr
oduc
ed b
y pe
rmiss
ion
of T
he E
cono
mist
Inte
llige
nce
Uni
t.
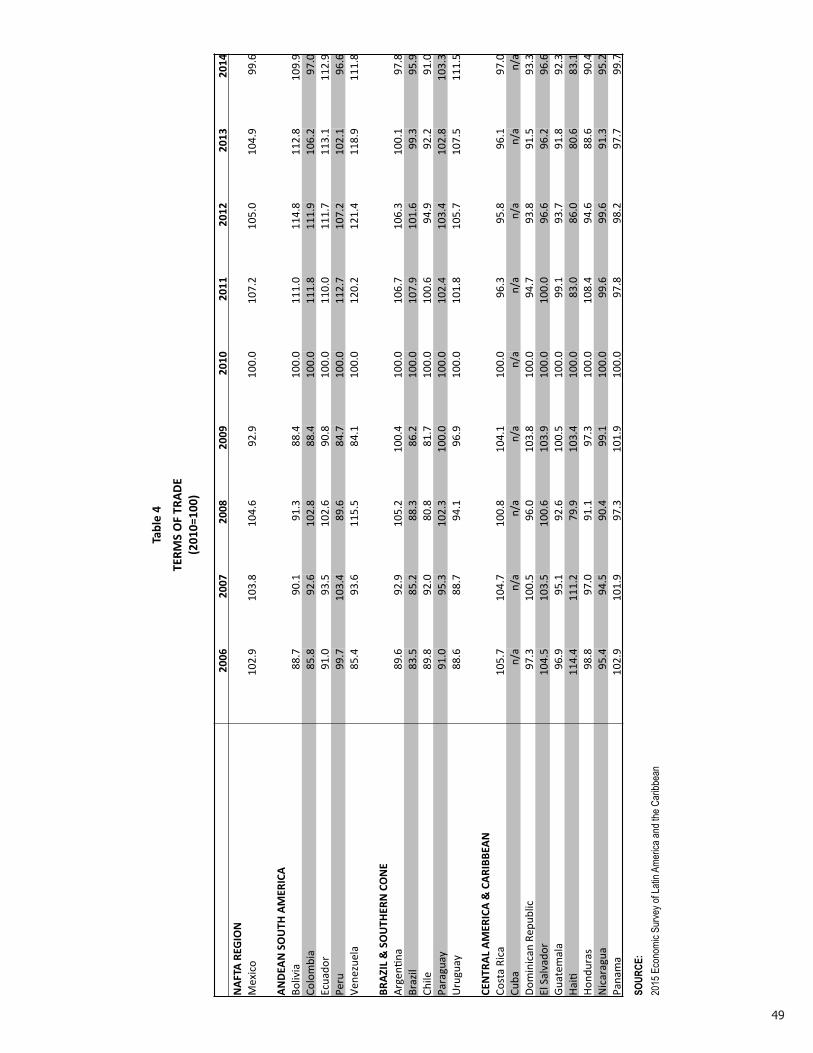
49
Table 4
TERM
S OF TRADE
(2010=100)
2006
2007
2008
2009
2010
2011
2012
2013
2014
NAFTA REG
ION
M
exic
o 10
2.9
103.
8 10
4.6
92.9
10
0.0
107.
2 10
5.0
104.
9 99
.6
ANDEAN SOUTH
AMERICA
Bo
livia
88
.7
90.1
91
.3
88.4
10
0.0
111.
0 11
4.8
112.
8 10
9.9
Colo
mbi
a 85
.8
92.6
10
2.8
88.4
10
0.0
111.
8 11
1.9
106.
2 97
.0
Ecua
dor
91.0
93
.5
102.
6 90
.8
100.
0 11
0.0
111.
7 11
3.1
112.
9 Pe
ru
99.7
10
3.4
89.6
84
.7
100.
0 11
2.7
107.
2 10
2.1
96.6
Ve
nezu
ela
85.4
93
.6
115.
5 84
.1
100.
0 12
0.2
121.
4 11
8.9
111.
8
BR
AZIL & SOUTH
ERN CONE
Ar
genE
na
89.6
92
.9
105.
2 10
0.4
100.
0 10
6.7
106.
3 10
0.1
97.8
Br
azil
83.5
85
.2
88.3
86
.2
100.
0 10
7.9
101.
6 99
.3
95.9
Ch
ile
89.8
92
.0
80.8
81
.7
100.
0 10
0.6
94.9
92
.2
91.0
Pa
ragu
ay
91.0
95
.3
102.
3 10
0.0
100.
0 10
2.4
103.
4 10
2.8
103.
3 U
rugu
ay
88.6
88
.7
94.1
96
.9
100.
0 10
1.8
105.
7 10
7.5
111.
5
CENTRAL AMERICA & CARIBB
EAN
Co
sta
Rica
10
5.7
104.
7 10
0.8
104.
1 10
0.0
96.3
95
.8
96.1
97
.0
Cuba
n/
a n/
a n/
a n/
a n/
a n/
a n/
a n/
a n/
a Do
min
ican
Rep
ublic
97
.3
100.
5 96
.0
103.
8 10
0.0
94.7
93
.8
91.5
93
.3
El S
alva
dor
104.
5 10
3.5
100.
6 10
3.9
100.
0 10
0.0
96.6
96
.2
96.6
Gu
atem
ala
96.9
95
.1
92.6
10
0.5
100.
0 99
.1
93.7
91
.8
92.3
Ha
iE
114.
4 11
1.2
79.9
10
3.4
100.
0 83
.0
86.0
80
.6
83.1
Ho
ndur
as
98.8
97
.0
91.1
97
.3
100.
0 10
8.4
94.6
88
.6
90.4
N
icar
agua
95
.4
94.5
90
.4
99.1
10
0.0
99.6
99
.6
91.3
95
.2
Pana
ma
102.
9 10
1.9
97.3
10
1.9
100.
0 97
.8
98.2
97
.7
99.7
SOUR
CE:
2015
Eco
nomi
c Sur
vey o
f Lati
n Ame
rica a
nd th
e Car
ibbea
n
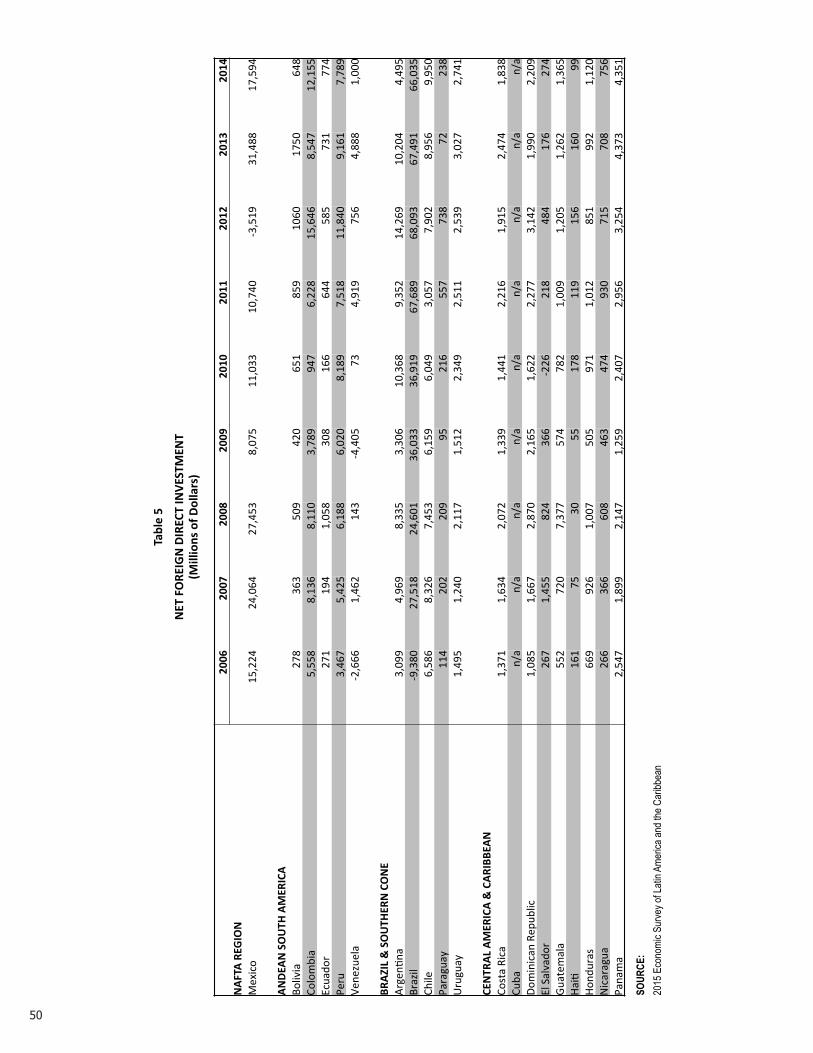
50
Table 5
NET FOREIGN DIRECT INVESTM
ENT
(Millions of D
ollars)
2006
2007
2008
2009
2010
2011
2012
2013
2014
NAFTA REG
ION
M
exic
o 15
,224
24
,064
27
,453
8,
075
11,0
33
10,7
40
-‐3,5
19
31,4
88
17,5
94
ANDEAN SOUTH
AMERICA
Bo
livia
27
8 36
3 50
9 42
0 65
1 85
9 10
60
1750
64
8 Co
lom
bia
5,55
8 8,
136
8,11
0 3,
789
947
6,22
8 15
,646
8,
547
12,1
55
Ecua
dor
271
194
1,05
8 30
8 16
6 64
4 58
5 73
1 77
4 Pe
ru
3,46
7 5,
425
6,18
8 6,
020
8,18
9 7,
518
11,8
40
9,16
1 7,
789
Vene
zuel
a -‐2
,666
1,
462
143
-‐4,4
05
73
4,91
9 75
6 4,
888
1,00
0
BR
AZIL & SOUTH
ERN CONE
Ar
genE
na
3,09
9 4,
969
8,33
5 3,
306
10,3
68
9,35
2 14
,269
10
,204
4,
495
Braz
il -‐9
,380
27
,518
24
,601
36
,033
36
,919
67
,689
68
,093
67
,491
66
,035
Ch
ile
6,58
6 8,
326
7,45
3 6,
159
6,04
9 3,
057
7,90
2 8,
956
9,95
0 Pa
ragu
ay
114
202
209
95
216
557
738
72
238
Uru
guay
1,
495
1,24
0 2,
117
1,51
2 2,
349
2,51
1 2,
539
3,02
7 2,
741
CENTRAL AMERICA & CARIBB
EAN
Co
sta
Rica
1,
371
1,63
4 2,
072
1,33
9 1,
441
2,21
6 1,
915
2,47
4 1,
838
Cuba
n/
a n/
a n/
a n/
a n/
a n/
a n/
a n/
a n/
a Do
min
ican
Rep
ublic
1,
085
1,66
7 2,
870
2,16
5 1,
622
2,27
7 3,
142
1,99
0 2,
209
El S
alva
dor
267
1,45
5 82
4 36
6 -‐2
26
218
484
176
274
Guat
emal
a 55
2 72
0 7,
377
574
782
1,00
9 1,
205
1,26
2 1,
365
HaiE
16
1 75
30
55
17
8 11
9 15
6 16
0 99
Ho
ndur
as
669
926
1,00
7 50
5 97
1 1,
012
851
992
1,12
0 N
icar
agua
26
6 36
6 60
8 46
3 47
4 93
0 71
5 70
8 75
6 Pa
nam
a 2,
547
1,89
9 2,
147
1,25
9 2,
407
2,95
6 3,
254
4,37
3 4,
351
SOUR
CE:
2015
Eco
nomi
c Sur
vey o
f Lati
n Ame
rica a
nd th
e Car
ibbea
n
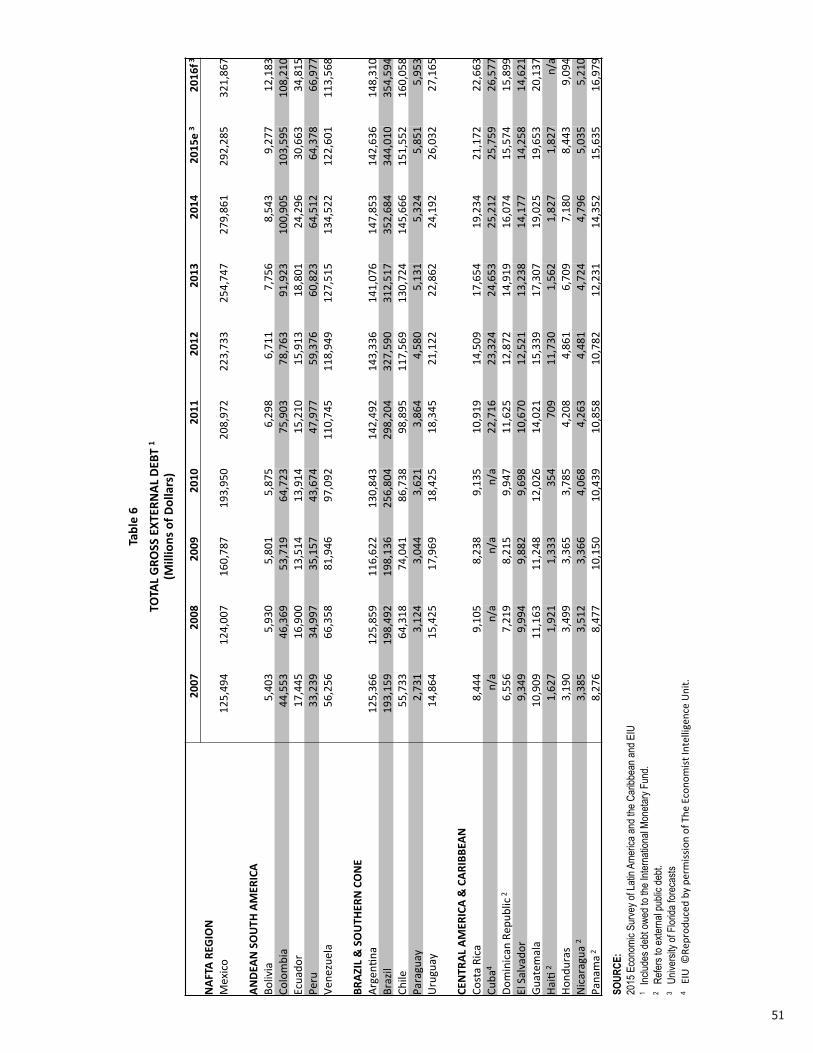
51
Table 6
TOTAL GRO
SS EXTERNAL DEBT 1
(Millions of D
ollars)
2007
2008
2009
2010
2011
2012
2013
2014
2015e 3
2016f 3
NAFTA REG
ION
Mex
ico
125,
494
124,
007
160,
787
193,
950
208,
972
223,
733
254,
747
279,
861
29
2,28
5
32
1,86
7
ANDEAN SOUTH
AMERICA
Boliv
ia
5,40
3 5,
930
5,80
1 5,
875
6,29
8 6,
711
7,75
6 8,
543
9,2
77
1
2,18
3
Colo
mbi
a 44
,553
46
,369
53
,719
64
,723
75
,903
78
,763
91
,923
10
0,90
5
103,
595
108,
210
Ec
uado
r 17
,445
16
,900
13
,514
13
,914
15
,210
15
,913
18
,801
24
,296
30,
663
34,
815
Pe
ru
33,2
39
34,9
97
35,1
57
43,6
74
47,9
77
59,3
76
60,8
23
64,5
12
6
4,37
8
6
6,97
7
Vene
zuel
a 56
,256
66
,358
81
,946
97
,092
11
0,74
5 11
8,94
9 12
7,51
5 13
4,52
2
122,
601
113,
568
BRAZIL & SOUTH
ERN CONE
Arge
nEna
12
5,36
6 12
5,85
9 11
6,62
2 13
0,84
3 14
2,49
2 14
3,33
6 14
1,07
6 14
7,85
3
142,
636
148,
310
Br
azil
193,
159
198,
492
198,
136
256,
804
298,
204
327,
590
312,
517
352,
684
34
4,01
0
35
4,59
4
Chile
55
,733
64
,318
74
,041
86
,738
98
,895
11
7,56
9 13
0,72
4 14
5,66
6
151,
552
160,
058
Pa
ragu
ay
2,73
1 3,
124
3,04
4 3,
621
3,86
4 4,
580
5,13
1 5,
324
5,8
51
5,9
53
Uru
guay
14
,864
15
,425
17
,969
18
,425
18
,345
21
,122
22
,862
24
,192
26,
032
27,
165
CENTRAL AMERICA & CARIBB
EAN
Cost
a Ri
ca
8,44
4 9,
105
8,23
8 9,
135
10,9
19
14,5
09
17,6
54
19,2
34
2
1,17
2
2
2,66
3
Cuba
4 n/
a n/
a n/
a n/
a 22
,716
23
,324
24
,653
25
,212
25
,759
26
,577
Do
min
ican
Rep
ublic
2
6,55
6 7,
219
8,21
5 9,
947
11,6
25
12,8
72
14,9
19
16,0
74
1
5,57
4
1
5,89
9
El S
alva
dor
9,34
9 9,
994
9,88
2 9,
698
10,6
70
12,5
21
13,2
38
14,1
77
1
4,25
8
1
4,62
1
Guat
emal
a 10
,909
11
,163
11
,248
12
,026
14
,021
15
,339
17
,307
19
,025
19,
653
20,
137
Ha
iE 2
1,62
7 1,
921
1,33
3 35
4 70
9 11
,730
1,
562
1,82
7
1
,827
n
/a
Hond
uras
3,
190
3,49
9 3,
365
3,78
5 4,
208
4,86
1 6,
709
7,18
0
8
,443
9
,094
N
icar
agua
2 3,
385
3,51
2 3,
366
4,06
8 4,
263
4,48
1 4,
724
4,79
6
5
,035
5
,210
Pa
nam
a 2
8,27
6 8,
477
10,1
50
10,4
39
10,8
58
10,7
82
12,2
31
14,3
52
1
5,63
5
1
6,97
9
SOUR
CE:
2015
Eco
nomi
c Sur
vey o
f Lati
n Ame
rica a
nd th
e Car
ibbea
n and
EIU
1
Includ
es de
bt ow
ed to
the I
ntern
ation
al Mo
netar
y Fun
d. 2
Refe
rs to
exter
nal p
ublic
debt.
3
Univ
ersit
y of F
lorida
fore
casts
4
EIU
©Re
prod
uced
by
perm
issio
n of
The
Eco
nom
ist In
telli
genc
e U
nit.
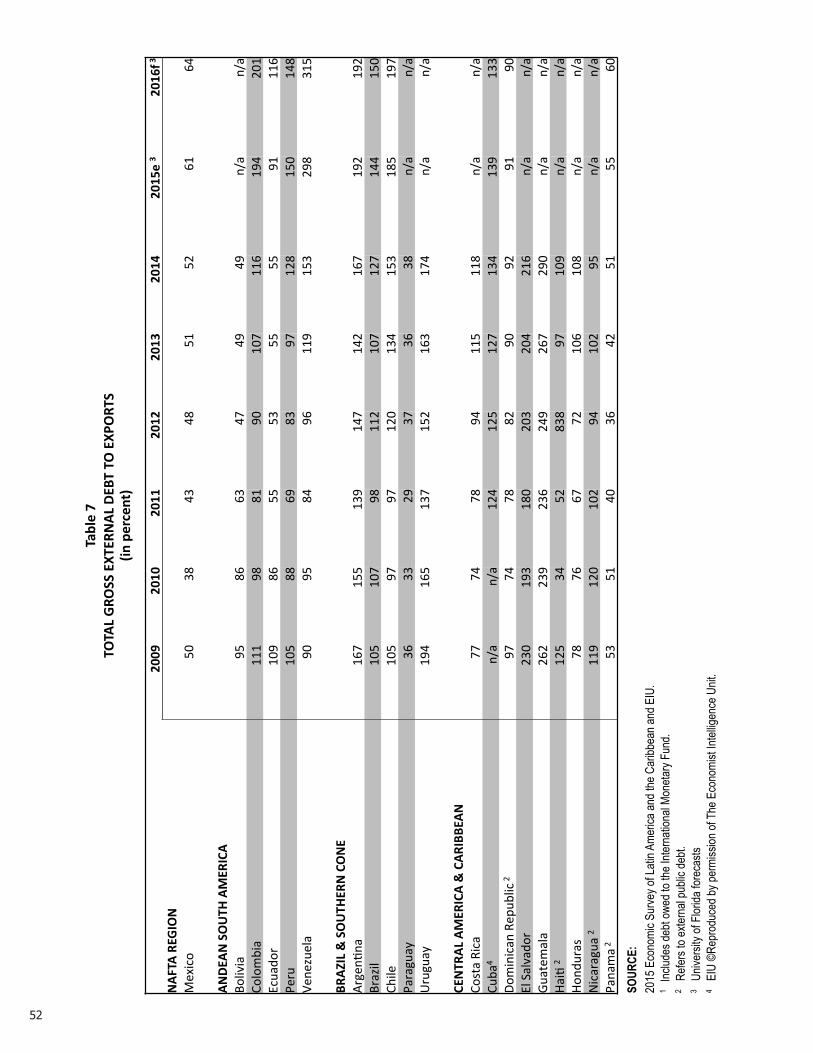
52
Table 7
TOTAL GRO
SS EXTERNAL DEBT TO
EXPORTS
(in percent)
2009
2010
2011
2012
2013
2014
2015e 3
2016f 3
NAFTA REG
ION
Mex
ico
50
38
43
48
51
52
61
64
ANDEAN SOUTH
AMERICA
Boliv
ia
95
86
63
47
49
49
n/a
n/a
Colo
mbi
a 11
1 98
81
90
10
7 11
6 19
4 20
1 Ec
uado
r 10
9 86
55
53
55
55
91
11
6 Pe
ru
105
88
69
83
97
128
150
148
Vene
zuel
a 90
95
84
96
11
9 15
3 29
8 31
5
BRAZIL & SOUTH
ERN CONE
Arge
nEna
16
7 15
5 13
9 14
7 14
2 16
7 19
2 19
2 Br
azil
105
107
98
112
107
127
144
150
Chile
10
5 97
97
12
0 13
4 15
3 18
5 19
7 Pa
ragu
ay
36
33
29
37
36
38
n/a
n/a
Uru
guay
19
4 16
5 13
7 15
2 16
3 17
4 n/
a n/
a
CENTRAL AMERICA & CARIBB
EAN
Cost
a Ri
ca
77
74
78
94
115
118
n/a
n/a
Cuba
4 n/
a n/
a 12
4 12
5 12
7 13
4 13
9 13
3 Do
min
ican
Rep
ublic
2
97
74
78
82
90
92
91
90
El S
alva
dor
230
193
180
203
204
216
n/a
n/a
Guat
emal
a 26
2 23
9 23
6 24
9 26
7 29
0 n/
a n/
a Ha
iE 2
125
34
52
838
97
109
n/a
n/a
Hond
uras
78
76
67
72
10
6 10
8 n/
a n/
a N
icar
agua
2 11
9 12
0 10
2 94
10
2 95
n/
a n/
a Pa
nam
a 2
53
51
40
36
42
51
55
60
SOUR
CE:
2015
Eco
nomi
c Sur
vey o
f Lati
n Ame
rica a
nd th
e Car
ibbea
n and
EIU
.
1 Inc
ludes
debt
owed
to th
e Inte
rnati
onal
Mone
tary F
und.
2
Refe
rs to
exter
nal p
ublic
debt.
3
Univ
ersit
y of F
lorida
fore
casts
4
EIU
©Re
prod
uced
by pe
rmiss
ion of
The
Eco
nomi
st Int
ellige
nce U
nit.
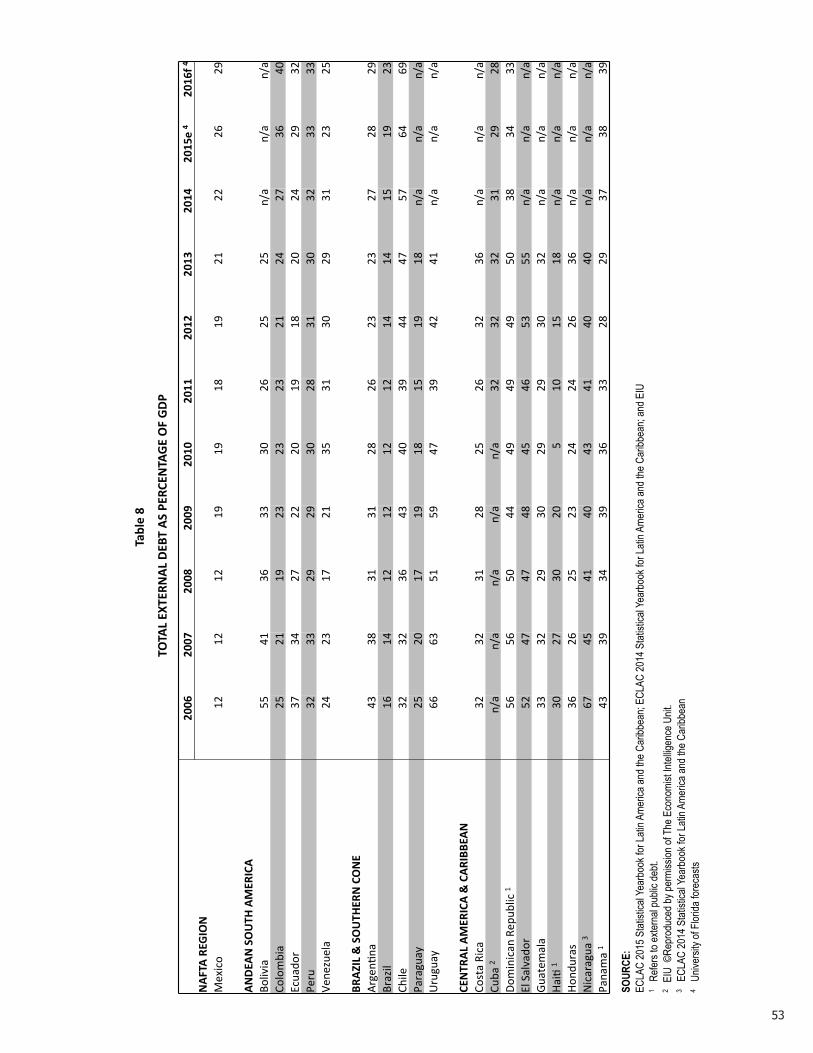
53
Table 8
TOTAL EXTERN
AL DEBT AS PERCEN
TAGE OF GDP
2006
2007
2008
2009
2010
2011
2012
2013
2014
2015e 4
2016f 4
NAFTA REG
ION
M
exic
o 12
12
12
19
19
18
19
21
22
26
29
ANDEAN SOUTH
AMERICA
Bo
livia
55
41
36
33
30
26
25
25
n/
a n/
a n/
a Co
lom
bia
25
21
19
23
23
23
21
24
27
36
40
Ecua
dor
37
34
27
22
20
19
18
20
24
29
32
Peru
32
33
29
29
30
28
31
30
32
33
33
Ve
nezu
ela
24
23
17
21
35
31
30
29
31
23
25
BR
AZIL & SOUTH
ERN CONE
Ar
genE
na
43
38
31
31
28
26
23
23
27
28
29
Braz
il 16
14
12
12
12
12
14
14
15
19
23
Ch
ile
32
32
36
43
40
39
44
47
57
64
69
Para
guay
25
20
17
19
18
15
19
18
n/
a n/
a n/
a U
rugu
ay
66
63
51
59
47
39
42
41
n/a
n/a
n/a
CENTRAL AMERICA & CARIBB
EAN
Co
sta
Rica
32
32
31
28
25
26
32
36
n/
a n/
a n/
a Cu
ba 2
n/a
n/a
n/a
n/a
n/a
32
32
32
31
29
28
Dom
inic
an R
epub
lic 1
56
56
50
44
49
49
49
50
38
34
33
El S
alva
dor
52
47
47
48
45
46
53
55
n/a
n/a
n/a
Guat
emal
a 33
32
29
30
29
29
30
32
n/
a n/
a n/
a Ha
iE 1
30
27
30
20
5 10
15
18
n/
a n/
a n/
a Ho
ndur
as
36
26
25
23
24
24
26
36
n/a
n/a
n/a
Nic
arag
ua 3
67
45
41
40
43
41
40
40
n/a
n/a
n/a
Pana
ma
1 43
39
34
39
36
33
28
29
37
38
39
SOUR
CE:
ECLA
C 20
15 S
tatist
ical Y
earb
ook f
or La
tin A
meric
a and
the C
aribb
ean;
ECLA
C 20
14 S
tatist
ical Y
earb
ook f
or La
tin A
meric
a and
the C
aribb
ean;
and E
IU
1 R
efers
to ex
terna
l pub
lic de
bt.
2 EI
U ©
Repr
oduc
ed by
perm
ission
of T
he E
cono
mist
Intell
igenc
e Unit
. 3
ECL
AC 20
14 S
tatist
ical Y
earb
ook f
or La
tin A
meric
a and
the C
aribb
ean
4 U
niver
sity o
f Flor
ida fo
reca
sts
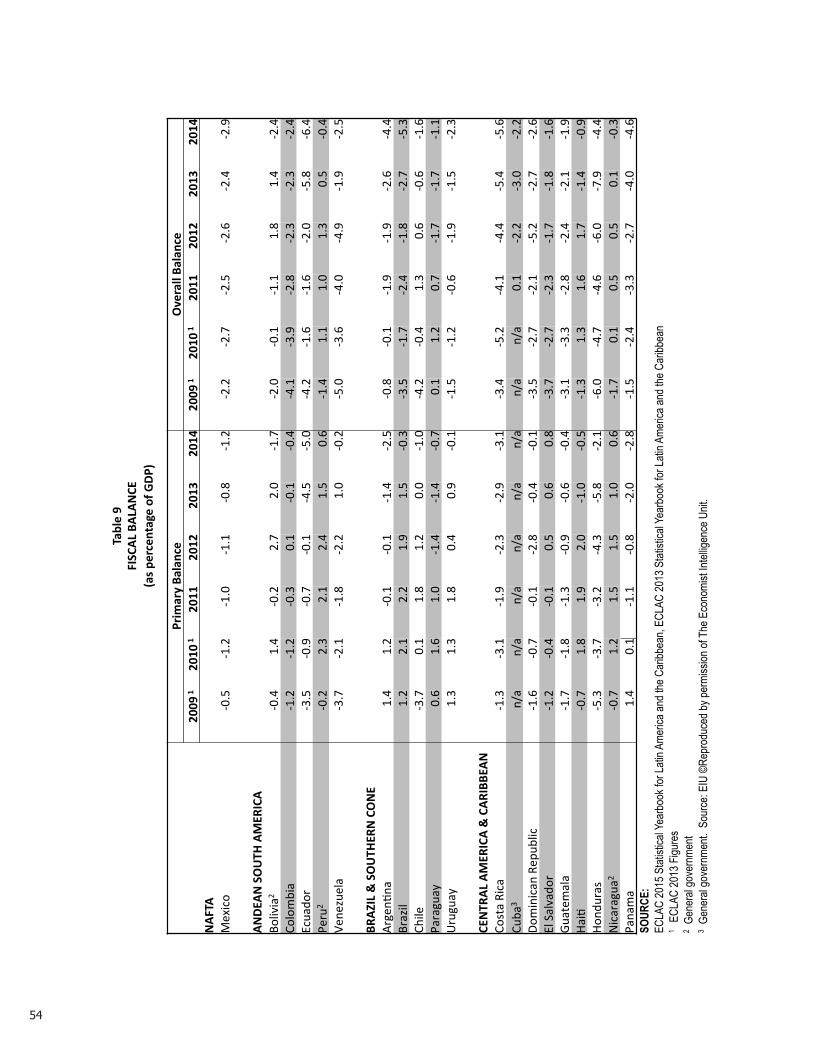
54
Table 9
FISCAL BA
LANCE
(as percentage of G
DP)
Primary Balance
Overall Balance
2009
1
2010
1
2011
2012
2013
2014
2009
1
2010
1
2011
2012
2013
2014
NAFTA
Mex
ico
-‐0.5
-‐1
.2
-‐1.0
-‐1
.1
-‐0.8
-‐1
.2
-‐2.2
-‐2
.7
-‐2.5
-‐2
.6
-‐2.4
-‐2
.9
ANDEAN SOUTH
AMERICA
Boliv
ia2
-‐0.4
1.
4 -‐0
.2
2.7
2.0
-‐1.7
-‐2
.0
-‐0.1
-‐1
.1
1.8
1.4
-‐2.4
Co
lom
bia
-‐1.2
-‐1
.2
-‐0.3
0.
1 -‐0
.1
-‐0.4
-‐4
.1
-‐3.9
-‐2
.8
-‐2.3
-‐2
.3
-‐2.4
Ec
uado
r -‐3
.5
-‐0.9
-‐0
.7
-‐0.1
-‐4
.5
-‐5.0
-‐4
.2
-‐1.6
-‐1
.6
-‐2.0
-‐5
.8
-‐6.4
Pe
ru2
-‐0.2
2.
3 2.
1 2.
4 1.
5 0.
6 -‐1
.4
1.1
1.0
1.3
0.5
-‐0.4
Ve
nezu
ela
-‐3.7
-‐2
.1
-‐1.8
-‐2
.2
1.0
-‐0.2
-‐5
.0
-‐3.6
-‐4
.0
-‐4.9
-‐1
.9
-‐2.5
BRAZIL & SOUTH
ERN CONE
Arge
nEna
1.
4 1.
2 -‐0
.1
-‐0.1
-‐1
.4
-‐2.5
-‐0
.8
-‐0.1
-‐1
.9
-‐1.9
-‐2
.6
-‐4.4
Br
azil
1.2
2.1
2.2
1.9
1.5
-‐0.3
-‐3
.5
-‐1.7
-‐2
.4
-‐1.8
-‐2
.7
-‐5.3
Ch
ile
-‐3.7
0.
1 1.
8 1.
2 0.
0 -‐1
.0
-‐4.2
-‐0
.4
1.3
0.6
-‐0.6
-‐1
.6
Para
guay
0.
6 1.
6 1.
0 -‐1
.4
-‐1.4
-‐0
.7
0.1
1.2
0.7
-‐1.7
-‐1
.7
-‐1.1
U
rugu
ay
1.3
1.3
1.8
0.4
0.9
-‐0.1
-‐1
.5
-‐1.2
-‐0
.6
-‐1.9
-‐1
.5
-‐2.3
CENTRAL AMERICA & CARIBB
EAN
Co
sta
Rica
-‐1
.3
-‐3.1
-‐1
.9
-‐2.3
-‐2
.9
-‐3.1
-‐3
.4
-‐5.2
-‐4
.1
-‐4.4
-‐5
.4
-‐5.6
Cu
ba3
n/a
n/a
n/a
n/a
n/a
n/a
n/a
n/a
0.1
-‐2.2
-‐3
.0
-‐2.2
Do
min
ican
Rep
ublic
-‐1
.6
-‐0.7
-‐0
.1
-‐2.8
-‐0
.4
-‐0.1
-‐3
.5
-‐2.7
-‐2
.1
-‐5.2
-‐2
.7
-‐2.6
El
Sal
vado
r -‐1
.2
-‐0.4
-‐0
.1
0.5
0.6
0.8
-‐3.7
-‐2
.7
-‐2.3
-‐1
.7
-‐1.8
-‐1
.6
Guat
emal
a -‐1
.7
-‐1.8
-‐1
.3
-‐0.9
-‐0
.6
-‐0.4
-‐3
.1
-‐3.3
-‐2
.8
-‐2.4
-‐2
.1
-‐1.9
Ha
iE
-‐0.7
1.
8 1.
9 2.
0 -‐1
.0
-‐0.5
-‐1
.3
1.3
1.6
1.7
-‐1.4
-‐0
.9
Hond
uras
-‐5
.3
-‐3.7
-‐3
.2
-‐4.3
-‐5
.8
-‐2.1
-‐6
.0
-‐4.7
-‐4
.6
-‐6.0
-‐7
.9
-‐4.4
N
icar
agua
2 -‐0
.7
1.2
1.5
1.5
1.0
0.6
-‐1.7
0.
1 0.
5 0.
5 0.
1 -‐0
.3
Pana
ma
1.4
0.1
-‐1.1
-‐0
.8
-‐2.0
-‐2
.8
-‐1.5
-‐2
.4
-‐3.3
-‐2
.7
-‐4.0
-‐4
.6
SOUR
CE:
ECLA
C 20
15 S
tatist
ical Y
earb
ook f
or La
tin A
meric
a and
the C
aribb
ean,
ECLA
C 20
13 S
tatist
ical Y
earb
ook f
or La
tin A
meric
a and
the C
aribb
ean
1 EC
LAC
2013
Figu
res
2 Ge
nera
l gov
ernm
ent
3 Ge
nera
l gov
ernm
ent.
Sour
ce: E
IU ©
Repr
oduc
ed by
perm
ission
of T
he E
cono
mist
Intell
igenc
e Unit
.
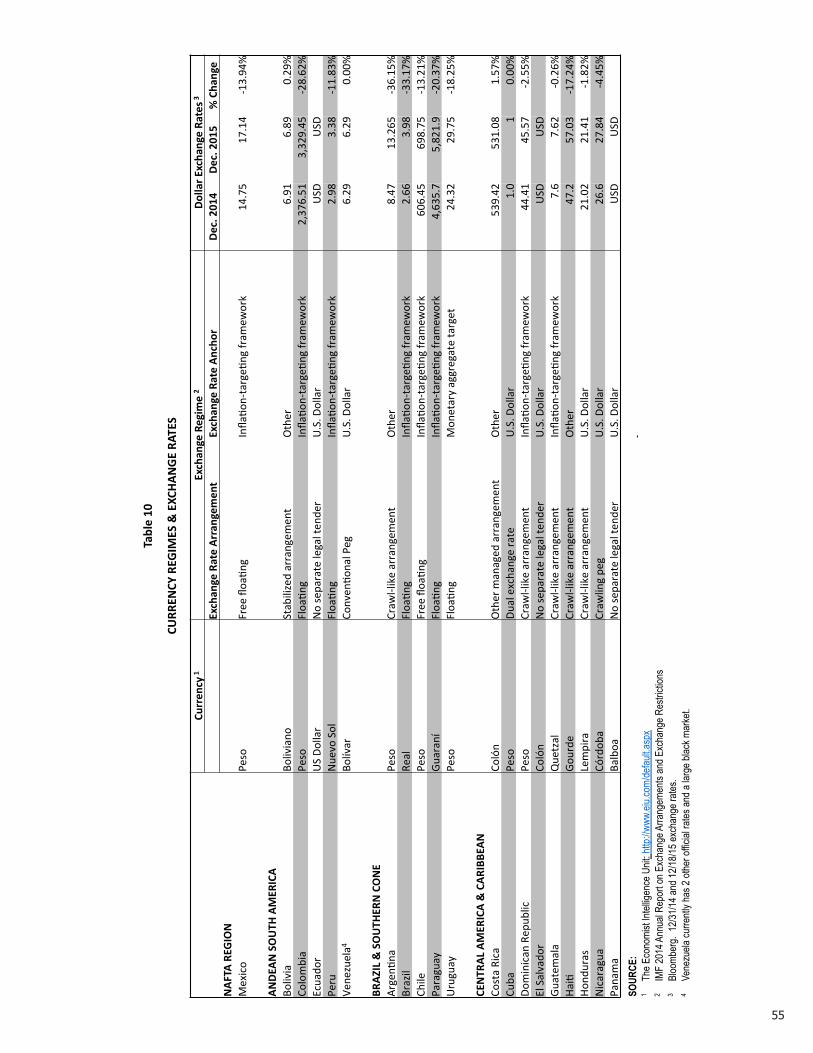
55
Table 10
CURR
ENCY REG
IMES & EXCHANGE RATES
Currency
1
Exchange Regime 2
Dollar Exchange Rates
3
Exchange Rate Arrangement
Exchange Rate Anchor
Dec. 2014
Dec. 2015
% Change
NAFTA REG
ION
Mex
ico
Peso
Fr
ee fl
oaEn
g In
flaEo
n-‐ta
rgeE
ng fr
amew
ork
14.7
5 17
.14
-‐13.
94%
ANDEAN SOUTH
AMERICA
Boliv
ia
Boliv
iano
St
abili
zed
arra
ngem
ent
Oth
er
6.91
6.
89
0.29
%
Colo
mbi
a Pe
so
Floa
Eng
Infla
Eon-‐
targ
eEng
fram
ewor
k 2,
376.
51
3,32
9.45
-‐2
8.62
%
Ecua
dor
US
Dolla
r N
o se
para
te le
gal t
ende
r U
.S. D
olla
r U
SD
USD
Pe
ru
Nue
vo S
ol
Floa
Eng
Infla
Eon-‐
targ
eEng
fram
ewor
k 2.
98
3.38
-‐1
1.83
%
Vene
zuel
a4
Bolív
ar
Conv
enEo
nal P
eg
U.S
. Dol
lar
6.29
6.
29
0.00
%
BR
AZIL & SOUTH
ERN CONE
Arge
nEna
Pe
so
Craw
l-‐lik
e ar
rang
emen
t O
ther
8.
47
13.2
65
-‐36.
15%
Br
azil
Real
Fl
oaEn
g In
flaEo
n-‐ta
rgeE
ng fr
amew
ork
2.66
3.
98
-‐33.
17%
Ch
ile
Peso
Fr
ee fl
oaEn
g In
flaEo
n-‐ta
rgeE
ng fr
amew
ork
606.
45
698.
75
-‐13.
21%
Pa
ragu
ay
Guar
aní
Floa
Eng
Infla
Eon-‐
targ
eEng
fram
ewor
k 4,
635.
7 5,
821.
9 -‐2
0.37
%
Uru
guay
Pe
so
Floa
Eng
Mon
etar
y ag
greg
ate
targ
et
24.3
2 29
.75
-‐18.
25%
CENTRAL AMERICA & CARIBB
EAN
Cost
a Ri
ca
Coló
n O
ther
man
aged
arr
ange
men
t O
ther
53
9.42
53
1.08
1.
57%
Cu
ba
Peso
Du
al e
xcha
nge
rate
U
.S. D
olla
r 1.
0 1
0.00
%
Dom
inic
an R
epub
lic
Peso
Cr
awl-‐l
ike
arra
ngem
ent
Infla
Eon-‐
targ
eEng
fram
ewor
k 44
.41
45.5
7 -‐2
.55%
El
Sal
vado
r Co
lón
No
sepa
rate
lega
l ten
der
U.S
. Dol
lar
USD
U
SD
Guat
emal
a Q
uetz
al
Craw
l-‐lik
e ar
rang
emen
t In
flaEo
n-‐ta
rgeE
ng fr
amew
ork
7.6
7.62
-‐0
.26%
Ha
iE
Gour
de
Craw
l-‐lik
e ar
rang
emen
t O
ther
47
.2
57.0
3 -‐1
7.24
%
Hond
uras
Le
mpi
ra
Craw
l-‐lik
e ar
rang
emen
t U
.S. D
olla
r 21
.02
21.4
1 -‐1
.82%
N
icar
agua
Có
rdob
a Cr
awlin
g pe
g U
.S. D
olla
r 26
.6
27.8
4 -‐4
.45%
Pa
nam
a Ba
lboa
N
o se
para
te le
gal t
ende
r U
.S. D
olla
r U
SD
USD
SO
URCE
:
1
The
Eco
nomi
st Int
ellige
nce U
nit: h
ttp://w
ww.ei
u.com
/defau
lt.asp
x
2
IMF
2014
Ann
ual R
epor
t on E
xcha
nge A
rrang
emen
ts an
d Exc
hang
e Res
trictio
ns
3
Bloo
mber
g. 12
/31/14
and 1
2/18/1
5 exc
hang
e rate
s.
4
Ven
ezue
la cu
rrentl
y has
2 oth
er of
ficial
rates
and a
larg
e blac
k mar
ket.

56
Table 11
COUNTRY RISK AND IM
F RELATIONS
Country Risk
1
Sovereign Spread 1
IMF RelaTons 2
Moody's
S&P
Fitch
Decem
ber '14
Decem
ber '15
NAFTA REG
ION
Mex
ico
A3
BBB+
BB
B+
121
163
Requ
este
d ne
w F
lexi
ble
Cred
it Li
ne
ANDEAN SOUTH
AMERICA
Boliv
ia
Ba3
BB
BB
279
249
Nee
d to
stre
ngth
en p
rivat
e se
ctor
Co
lom
bia
Baa2
BB
B BB
B 15
4 25
1 N
ew F
lexi
ble
Cred
it Li
ne o
f $5.
4 Bi
llion
Ec
uado
r B3
B
B 79
2 98
4 Ex
tern
al sh
ocks
led
to sl
owdo
wn
Peru
A3
BB
B+
BBB+
11
8 17
1 St
rong
eco
nom
y, b
ut c
halle
ngin
g ex
tern
al e
nviro
nmen
t Ve
nezu
ela
Caa3
CC
C CC
C 22
45
2270
N
o co
nsul
taEo
n sin
ce 2
004
BR
AZIL & SOUTH
ERN CONE
Arge
nEna
Ca
Sd
u RD
n/
a n/
a Aw
aiEn
g ne
w C
PI a
nd G
DP d
ata
Braz
il Ba
a3
BB+
BB+
185
405
Mus
t str
engt
hen
mac
roec
onom
ic p
olic
ies
Chile
Aa
3 AA
-‐ A+
79
87
Gr
owth
rem
ains
lack
lust
er
Para
guay
Ba
1 BB
BB
25
1 25
3 Co
nsul
taEo
n: S
tron
g fu
ndam
enta
ls U
rugu
ay
Baa2
BB
B BB
B-‐
361
216
Mod
eraE
ng, b
ut sE
ll so
lid g
row
th
CENTRAL AMERICA & CARIBB
EAN
Cost
a Ri
ca
BA1
BB
BB+
337
438
Cons
ulta
Eon:
Gro
wth
is to
stay
unc
hang
ed
Cuba
Ca
a2
NR
NR
n/a
n/a
n/a
Dom
inic
an R
epub
lic
B1
BB-‐
B+
296
356
Obj
ecEv
e to
incr
ease
inte
rnaE
onal
rese
rves
El
Sal
vado
r Ba
3 B+
B+
36
9 55
9 Ke
y Is
sue:
Mac
roec
onom
ic v
ulne
rabi
liEes
Gu
atem
ala
Ba1
BB
BB
247
293
Cons
ulta
Eon:
Mac
roec
onm
ic o
utlo
ok re
mai
ns b
enig
n Ha
iE
NR
NR
n/a
n/a
n/a
Chal
leng
ing
circ
umst
ance
s Ho
ndur
as
B3
B+
NR
440
404
Firs
t yea
r of F
und-‐
supp
ort p
rogr
am w
as a
succ
ess
Nic
arag
ua
B2
NR
B+
n/a
n/a
The
econ
omic
out
look
rem
ains
favo
rabl
e Pa
nam
a Ba
a2
BBB
BBB
157
184
Cons
ulta
Eon:
Eco
nom
ic p
erfo
rman
ce to
rem
ain
stro
ng
SOUR
CE:
1 B
loomb
erg
2 IM
F Co
untry
Pag
es: U
nder
Artic
le IV
of th
e IMF
's Ar
ticles
of A
gree
ment,
the I
MF ho
lds bi
later
al dis
cuss
ions w
ith m
embe
rs, us
ually
ever
y yea
r. A st
aff te
am vi
sits t
he co
untry
, coll
ects
econ
omic
and f
inanc
ial
infor
matio
n, an
d disc
usse
s with
offic
ials t
he co
untry
's ec
onom
ic de
velop
ments
and p
olicie
s.
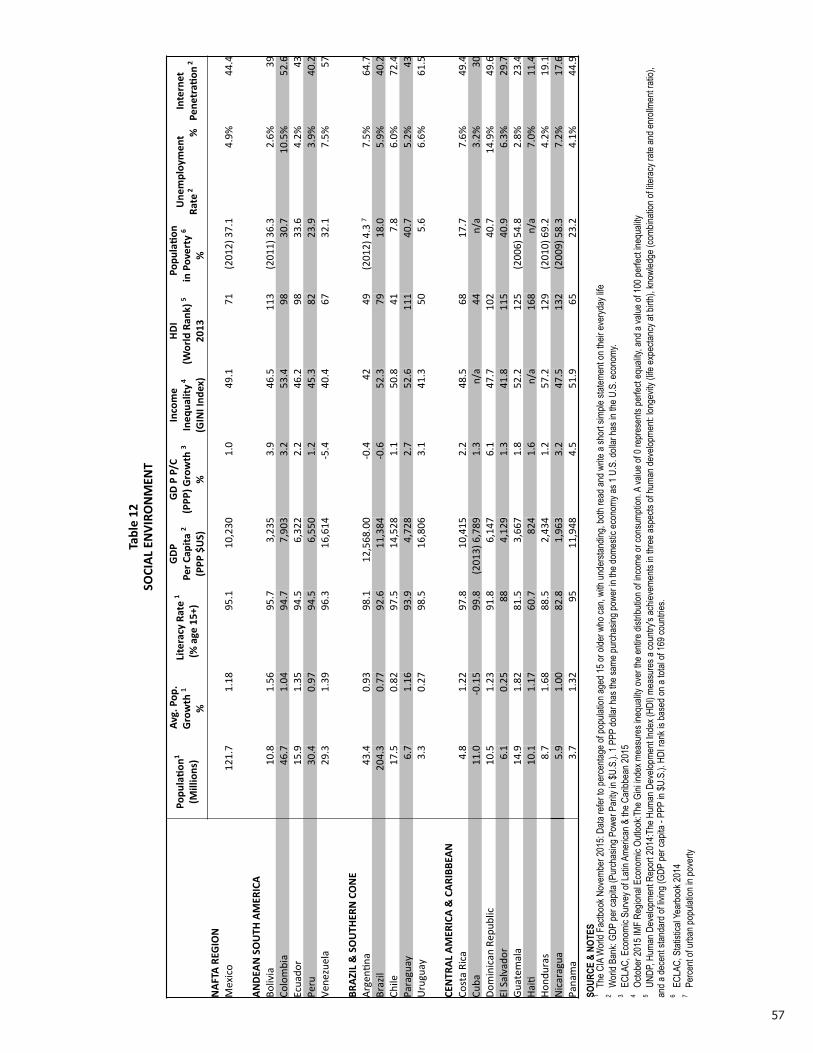
57
Table 12
SOCIAL EN
VIRONMEN
T
PopulaTon
1
(Millions)
Avg. Pop.
Growth 1
%
Literacy Rate 1
(% age 15+)
GDP
Per Capita 2
(PPP $US)
GD P P/C
(PPP) G
rowth 3
%
Income
Inequality 4
(GINI Index)
HDI
(World Rank) 5
2013
PopulaTon
in Poverty 6
%
Unemployment
Rate
2 % Internet
PenetraTon
2
NAFTA REG
ION
Mex
ico
121.
7 1.
18
95.1
10
,230
1.
0 49
.1
71
(201
2) 3
7.1
4.9%
44
.4
ANDEAN SOUTH
AMERICA
Bo
livia
10
.8
1.56
95
.7
3,23
5 3.
9 46
.5
113
(201
1) 3
6.3
2.6%
39
Co
lom
bia
46.7
1.
04
94.7
7,
903
3.2
53.4
98
30
.7
10.5
%
52.6
Ec
uado
r 15
.9
1.35
94
.5
6,32
2 2.
2 46
.2
98
33.6
4.
2%
43
Peru
30
.4
0.97
94
.5
6,55
0 1.
2 45
.3
82
23.9
3.
9%
40.2
Ve
nezu
ela
29.3
1.
39
96.3
16
,614
-‐5
.4
40.4
67
32
.1
7.5%
57
BR
AZIL & SOUTH
ERN CONE
Ar
genE
na
43.4
0.
93
98.1
12
,568
.00
-‐0.4
42
49
(2
012)
4.3
7 7.
5%
64.7
Br
azil
204.
3 0.
77
92.6
11
,384
-‐0
.6
52.3
79
18
.0
5.9%
40
.2
Chile
17
.5
0.82
97
.5
14,5
28
1.1
50.8
41
7.
8 6.
0%
72.4
Pa
ragu
ay
6.7
1.16
93
.9
4,72
8 2.
7 52
.6
111
40.7
5.
2%
43
Uru
guay
3.
3 0.
27
98.5
16
,806
3.
1 41
.3
50
5.6
6.6%
61
.5
CENTRAL AMERICA & CARIBB
EAN
Co
sta
Rica
4.
8 1.
22
97.8
10
,415
2.
2 48
.5
68
17.7
7.
6%
49.4
Cu
ba
11.0
-‐0
.15
99.8
(2
013)
6,7
89
1.3
n/a
44
n/a
3.2%
30
Do
min
ican
Rep
ublic
10
.5
1.23
91
.8
6,14
7 6.
1 47
.7
102
40.7
14
.9%
49
.6
El S
alva
dor
6.1
0.25
88
4,
129
1.3
41.8
11
5 40
.9
6.3%
29
.7
Guat
emal
a 14
.9
1.82
81
.5
3,66
7 1.
8 52
.2
125
(200
6) 5
4.8
2.8%
23
.4
HaiE
10
.1
1.17
60
.7
824
1.6
n/a
168
n/a
7.0%
11
.4
Hond
uras
8.
7 1.
68
88.5
2,
434
1.2
57.2
12
9 (2
010)
69.
2 4.
2%
19.1
N
icar
agua
5.
9 1.
00
82.8
1,
963
3.2
47.5
13
2 (2
009)
58.
3 7.
2%
17.6
Pa
nam
a 3.
7 1.
32
95
11,9
48
4.5
51.9
65
23
.2
4.1%
44
.9
SOUR
CE &
NOT
ES
1 The
CIA
Wor
ld Fa
ctboo
k Nov
embe
r 201
5: Da
ta re
fer to
perce
ntage
of po
pulat
ion ag
ed 15
or ol
der w
ho ca
n, wi
th un
derst
andin
g, bo
th re
ad an
d write
a sh
ort s
imple
state
ment
on th
eir ev
eryd
ay lif
e 2 W
orld
Bank
: GDP
per c
apita
(Pur
chas
ing P
ower
Par
ity in
$U.S
.). 1
PPP
dolla
r has
the s
ame p
urch
asing
powe
r in th
e dom
estic
econ
omy a
s 1 U
.S. d
ollar
has i
n the
U.S
. eco
nomy
. 3 E
CLAC
, Eco
nomi
c Sur
vey o
f Lati
n Ame
rican
& th
e Car
ibbea
n 201
5 4 O
ctobe
r 201
5 IMF
Reg
ional
Econ
omic
Outlo
ok:T
he G
ini in
dex m
easu
res i
nequ
ality
over
the e
ntire
distr
ibutio
n of in
come
or co
nsum
ption
. A va
lue of
0 re
pres
ents
perfe
ct eq
uality
, and
a va
lue of
100 p
erfec
t ineq
uality
5 U
NDP,
Huma
n Dev
elopm
ent R
epor
t 201
4:The
Hum
an D
evelo
pmen
t Inde
x (HD
I) me
asur
es a
coun
try's
achie
veme
nts in
thre
e asp
ects
of hu
man d
evelo
pmen
t: lon
gevit
y (life
expe
ctanc
y at b
irth),
know
ledge
(com
binati
on of
liter
acy r
ate an
d enr
ollme
nt ra
tio),
and a
dece
nt sta
ndar
d of li
ving (
GDP
per c
apita
- PP
P in
$U.S
.). H
DI ra
nk is
base
d on a
total
of 16
9 cou
ntries
. 6 E
CLAC
, Stat
istica
l Yea
rboo
k 201
4 7 P
erce
nt of
urba
n pop
ulatio
n in p
over
ty
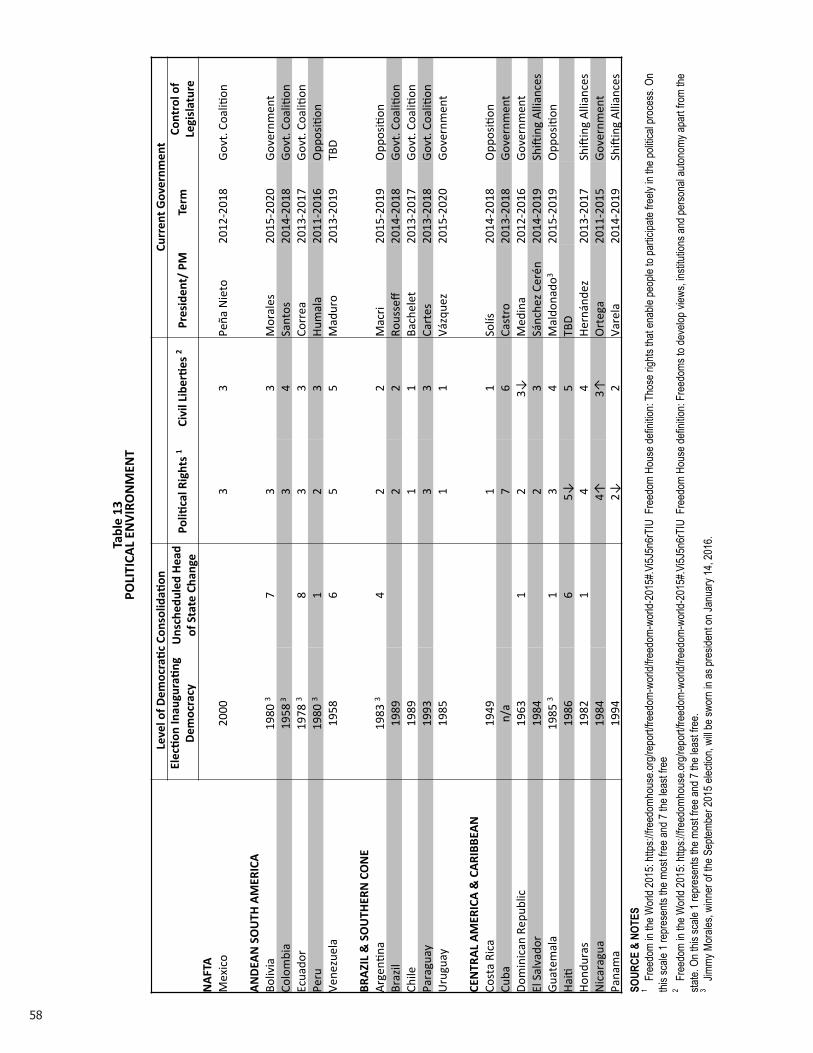
58
Table 13
POLITICA
L EN
VIRONMEN
T
Level of D
emocraTc ConsolidaTon
Current G
overnm
ent
ElecTon InauguraTng
Dem
ocracy
Unscheduled Head
of State Change
PoliTcal Rights 1
Civil LiberTes 2
President/ PM
Term
Control of
Legislature
NAFTA
M
exic
o 20
00
3
3 Pe
ña N
ieto
20
12-‐2
018
Govt
. Coa
liEon
ANDEAN SOUTH
AMERICA
Bo
livia
19
80 3
7 3
3 M
oral
es
2015
-‐202
0 Go
vern
men
t Co
lom
bia
1958
3
3
4 Sa
ntos
20
14-‐2
018
Govt
. Coa
liEon
Ec
uado
r 19
78 3
8 3
3 Co
rrea
20
13-‐2
017
Govt
. Coa
liEon
Pe
ru
1980
3 1
2 3
Hum
ala
2011
-‐201
6 O
ppos
iEon
Ve
nezu
ela
1958
6
5 5
Mad
uro
2013
-‐201
9 TB
D
BR
AZIL & SOUTH
ERN CONE
Ar
genE
na
1983
3 4
2 2
Mac
ri 20
15-‐2
019
Opp
osiE
on
Braz
il 19
89
2
2 Ro
usse
ff 20
14-‐2
018
Govt
. Coa
liEon
Ch
ile
1989
1 1
Bach
elet
20
13-‐2
017
Govt
. Coa
liEon
Pa
ragu
ay
1993
3 3
Cart
es
2013
-‐201
8 Go
vt. C
oaliE
on
Uru
guay
19
85
1
1 Vá
zque
z 20
15-‐2
020
Gove
rnm
ent
CENTRAL AMERICA & CARIBB
EAN
Co
sta
Rica
19
49
1
1 So
lís
2014
-‐201
8 O
ppos
iEon
Cu
ba
n/a
7
6 Ca
stro
20
13-‐2
018
Gove
rnm
ent
Dom
inic
an R
epub
lic
1963
1
2 3↓
M
edin
a 20
12-‐2
016
Gove
rnm
ent
El S
alva
dor
1984
2 3
Sánc
hez C
erén
20
14-‐2
019
Shir
ing
Allia
nces
Gu
atem
ala
1985
3 1
3 4
Mal
dona
do3
2015
-‐201
9 O
ppos
iEon
Ha
iE
1986
6
5↓
5 TB
D
Ho
ndur
as
1982
1
4 4
Hern
ánde
z 20
13-‐2
017
Shir
ing
Allia
nces
N
icar
agua
19
84
4↑
3↑
O
rteg
a 20
11-‐2
015
Gove
rnm
ent
Pana
ma
1994
2↓
2 Va
rela
20
14-‐2
019
Shir
ing
Allia
nces
SO
URCE
& N
OTES
1 Fre
edom
in th
e Wor
ld 20
15: h
ttps:/
/free
domh
ouse
.org/r
epor
t/free
dom-
world
/free
dom-
world
-201
5#.V
i5J5n
6rTI
U F
reed
om H
ouse
defin
ition:
Thos
e righ
ts tha
t ena
ble pe
ople
to pa
rticipa
te fre
ely in
the p
olitic
al pr
oces
s. On
thi
s sca
le 1 r
epre
sents
the m
ost fr
ee an
d 7 th
e lea
st fre
e 2 F
reed
om in
the W
orld
2015
: http
s://fr
eedo
mhou
se.or
g/rep
ort/fr
eedo
m-wo
rld/fr
eedo
m-wo
rld-2
015#
.Vi5J
5n6r
TIU
Fre
edom
Hou
se de
finitio
n: Fr
eedo
ms to
deve
lop vi
ews,
institu
tions
and p
erso
nal a
utono
my ap
art fr
om th
e sta
te. O
n this
scale
1 re
pres
ents
the m
ost fr
ee an
d 7 th
e lea
st fre
e.
3 Jim
my M
orale
s, wi
nner
of th
e Sep
tembe
r 201
5 elec
tion,
will b
e swo
rn in
as pr
eside
nt on
Janu
ary 1
4, 20
16.
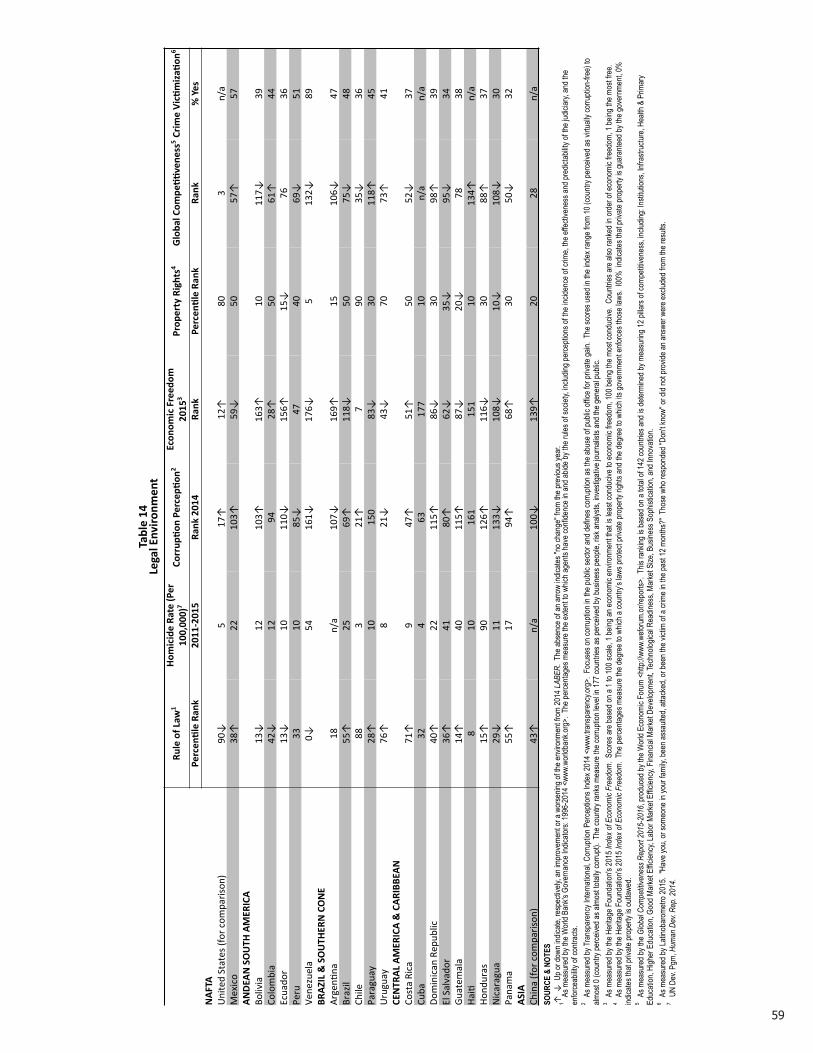
59
Table 14
Legal E
nviron
men
t
Ru
le of L
aw1
Hom
icide Ra
te (P
er
100,00
0)7
Corrup
Bon
PercepB
on2
Econ
omic Freed
om
2015
3 Prop
erty Rights4
Globa
l Com
peBBve
ness
5 Crim
e VicBmizaB
on6
Pe
rcen
Ble Ran
k
2011
-‐201
5 Ra
nk 201
4 Ra
nk
Percen
Ble Ran
k Ra
nk
% Yes
NAFTA
Uni
ted
Stat
es (f
or com
paris
on)
90↓
5
17↑
12
↑
80
3 n/
a M
exico
38↑
22
10
3↑
59↓
50
57
↑
57
ANDEA
N SOUTH
AMER
ICA
Bo
livia
13
↓
12
103↑
16
3↑
10
117↓
39
Co
lom
bia
42↓
12
94
28
↑
50
61↑
44
Ec
uado
r 13
↓
10
110↓
15
6↑
15↓
76
36
Pe
ru
33
10
85↓
47
40
69
↓
51
Vene
zuel
a 0↓
54
16
1↓
176↓
5
132↓
89
BR
AZIL & SOUTH
ERN CONE
Ar
genN
na
18
n/a
107↓
16
9↑
15
106↓
47
Br
azil
55↑
25
69
↑
118↓
50
75
↓
48
Chile
88
3
21↑
7
90
35↓
36
Pa
ragu
ay
28↑
10
15
0 83
↓
30
118↑
45
Uru
guay
76
↑
8 21
↓
43↓
70
73
↑
41
CENTR
AL AMER
ICA & CARIBB
EAN
Co
sta
Rica
71
↑
9 47
↑
51↑
50
52
↓
37
Cuba
32
4
63
177
10
n/a
n/a
Dom
inican
Rep
ublic
40
↑
22
115↑
86
↓
30
98↑
39
El
Sal
vado
r 36
↑
41
80↑
62
↓
35↓
95
↓
34
Guat
emal
a 14
↑
40
115↑
87
↓
20↓
78
38
Ha
iN
8 10
16
1 15
1 10
13
4↑
n/a
Hond
uras
15
↑
90
126↑
11
6↓
30
88↑
37
Nicar
agua
29
↓
11
133↓
10
8↓
10↓
10
8↓
30
Pana
ma
55↑
17
94
↑
68↑
30
50
↓
32
ASIA
Ch
ina
(for c
ompa
rison
) 43
↑
n/a
100↓
13
9↑
20
28
n/a
SOUR
CE &
NOT
ES
↑ ↓
Up o
r dow
n ind
icate,
resp
ectiv
ely, a
n imp
rove
ment
or a
worse
ning o
f the e
nviro
nmen
t from
2014
LABE
R. T
he ab
senc
e of a
n arro
w ind
icates
"no c
hang
e" fr
om th
e pre
vious
year.
1 A
s mea
sure
d by t
he W
orld
Bank
's Go
vern
ance
Indic
ators:
1996
-201
4 <ww
w.wo
rldba
nk.or
g>. T
he pe
rcenta
ges m
easu
re th
e exte
nt to
which
agen
ts ha
ve co
nfide
nce i
n and
abide
by th
e rule
s of s
ociet
y, inc
luding
perce
ption
s of th
e inc
idenc
e of c
rime,
the ef
fectiv
enes
s and
pred
ictab
ility o
f the j
udici
ary,
and t
he
enfor
ceab
ility o
f con
tracts
. 2 A
s mea
sure
d by T
rans
pare
ncy I
ntern
ation
al, C
orru
ption
Per
cepti
ons I
ndex
2014
<ww
w.tra
nspa
renc
y.org
>. F
ocus
es on
corru
ption
in th
e pub
lic se
ctor a
nd de
fines
corru
ption
as th
e abu
se of
publi
c offic
e for
priva
te ga
in. T
he sc
ores
used
in th
e ind
ex ra
nge f
rom
10 (c
ountr
y per
ceive
d as v
irtuall
y cor
rupti
on-fr
ee) t
o alm
ost 0
(cou
ntry p
erce
ived a
s alm
ost to
tally
corru
pt). T
he co
untry
rank
s mea
sure
the c
orru
ption
leve
l in 17
7 cou
ntries
as pe
rceive
d by b
usine
ss pe
ople,
risk a
nalys
ts, in
vesti
gativ
e jou
rnali
sts an
d the
gene
ral p
ublic
. 3 A
s mea
sure
d by t
he H
erita
ge F
ound
ation
's 20
15 In
dex o
f Eco
nom
ic Fr
eedo
m. S
core
s are
base
d on a
1 to
100 s
cale,
1 be
ing an
econ
omic
envir
onme
nt tha
t is le
ast c
ondu
cive t
o eco
nomi
c fre
edom
, 100
being
the m
ost c
ondu
cive.
Cou
ntries
are a
lso ra
nked
in or
der o
f eco
nomi
c fre
edom
, 1 be
ing th
e mos
t free
.
4 As m
easu
red b
y the
Her
itage
Fou
ndati
on's
2015
Inde
x of E
cono
mic
Free
dom
. The
perce
ntage
s mea
sure
the d
egre
e to w
hich a
coun
try’s
laws p
rotec
t priv
ate pr
oper
ty rig
hts an
d the
degr
ee to
whic
h its
gove
rnme
nt en
force
s tho
se la
ws. I
00%
indic
ates t
hat p
rivate
prop
erty
is gu
aran
teed b
y the
gove
rnme
nt, 0%
ind
icates
that
priva
te pr
oper
ty is
outla
wed.
5 As m
easu
red b
y the
Glob
al Co
mpe
titive
ness
Rep
ort 2
015-
2016
, pro
duce
d by t
he W
orld
Econ
omic
Foru
m <h
ttp://w
ww.w
eforu
m.or
/repo
rts>.
This
rank
ing is
base
d on a
total
of 14
2 cou
ntries
and i
s dete
rmine
d by m
easu
ring 1
2 pilla
rs of
comp
etitiv
enes
s, inc
luding
: Insti
tution
s, Inf
rastr
uctur
e, He
alth &
Prim
ary
Educ
ation
, High
er E
duca
tion,
Good
Mar
ket E
fficien
cy, L
abor
Mar
ket E
fficien
cy, F
inanc
ial M
arke
t Dev
elopm
ent, T
echn
ologic
al Re
adine
ss, M
arke
t Size
, Bus
iness
Sop
histic
ation
, and
Inno
vatio
n. 6 A
s mea
sure
d by L
atino
baro
metro
2015
. "Ha
ve yo
u, or
some
one i
n you
r fam
ily, b
een a
ssau
lted,
attac
ked,
or be
en th
e vict
im of
a cri
me in
the p
ast 1
2 mon
ths?"
Tho
se w
ho re
spon
ded "
Don't
know
" or d
id no
t pro
vide a
n ans
wer w
ere e
xclud
ed fr
om th
e res
ults.
7 U
N De
v. Pg
m, H
uman
Dev
. Rep
. 201
4.
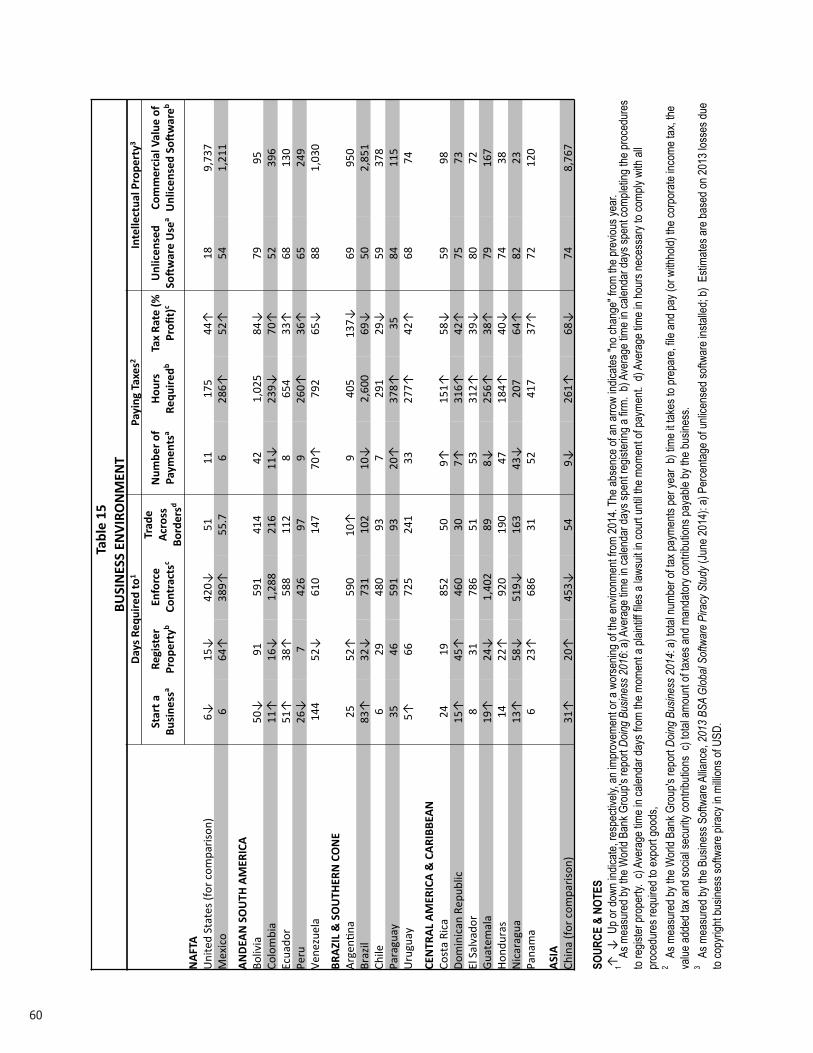
60
Table 15
BUSINESS EN
VIRONMEN
T
Days Required to
1 Paying Taxes
2 Intellectual Property3
Start a
Business
a Register
Property
b Enforce
Contractsc
Trade
Across
Bordersd
Num
ber of
Paym
ents
a Hours
Required
b Tax Rate (%
Profit)c
Unlicensed
Solware Use
a Commercial Value of
Unlicensed Solwareb
NAFTA
U
nite
d St
ates
(for
com
paris
on)
6↓
15↓
42
0↓
51
11
175
44↑
18
9,
737
Mex
ico
6 64
↑
389↑
55
.7
6 28
6↑
52↑
54
1,
211
ANDEAN SOUTH
AMERICA
Bo
livia
50
↓
91
591
414
42
1,02
5 84
↓
79
95
Colo
mbi
a 11
↑
16↓
1,
288
216
11↓
23
9↓
70↑
52
39
6 Ec
uado
r 51
↑
38↑
58
8 11
2 8
654
33↑
68
13
0 Pe
ru
26↓
7
426
97
9 26
0↑
36↑
65
24
9 Ve
nezu
ela
144
52↓
61
0 14
7 70
↑
792
65↓
88
1,
030
BRAZIL & SOUTH
ERN CONE
Ar
genE
na
25
52↑
59
0 10
↑
9 40
5 13
7↓
69
950
Braz
il 83
↑
32↓
73
1 10
2 10
↓
2,60
0 69
↓
50
2,85
1 Ch
ile
6 29
48
0 93
7
291
29↓
59
37
8 Pa
ragu
ay
35
46
591
93
20↑
37
8↑
35
84
115
Uru
guay
5↑
66
72
5 24
1 33
27
7↑
42↑
68
74
CENTRAL AMERICA & CARIBB
EAN
Co
sta
Rica
24
19
85
2 50
9↑
15
1↑
58↓
59
98
Do
min
ican
Rep
ublic
15
↑
45↑
46
0 30
7↑
31
6↑
42↑
75
73
El
Sal
vado
r 8
31
786
51
53
312↑
39
↓
80
72
Guat
emal
a 19
↑
24↓
1,
402
89
8↓
256↑
38
↑
79
167
Hond
uras
14
22
↑
920
190
47
184↑
40
↓
74
38
Nic
arag
ua
13↑
58
↓
519↓
16
3 43
↓
207
64↑
82
23
Pa
nam
a 6
23↑
68
6 31
52
41
7 37
↑
72
120
ASIA
Ch
ina
(for c
ompa
rison
) 31
↑
20↑
45
3↓
54
9↓
261↑
68
↓
74
8,76
7
SOUR
CE &
NOT
ES
↑ ↓
Up o
r dow
n ind
icate,
resp
ectiv
ely, a
n imp
rove
ment
or a
worse
ning o
f the e
nviro
nmen
t from
2014
. The
abse
nce o
f an a
rrow
indica
tes "n
o cha
nge"
from
the p
revio
us ye
ar.
1 As m
easu
red b
y the
Wor
ld Ba
nk G
roup
's re
port
Doing
Bus
iness
201
6: a)
Ave
rage
time i
n cale
ndar
days
spen
t reg
ister
ing a
firm. b
) Ave
rage
time i
n cale
ndar
days
spen
t com
pletin
g the
proc
edur
es
to re
gister
prop
erty.
c) A
vera
ge tim
e in c
alend
ar da
ys fr
om th
e mom
ent a
plain
tiff fil
es a
lawsu
it in c
ourt
until
the m
omen
t of p
ayme
nt. d
) Ave
rage
time i
n hou
rs ne
cess
ary t
o com
ply w
ith al
l pr
oced
ures
requ
ired t
o exp
ort g
oods
, 2 A
s mea
sure
d by t
he W
orld
Bank
Gro
up's
repo
rt Do
ing B
usine
ss 2
014:
a) to
tal nu
mber
of ta
x pay
ments
per y
ear
b) tim
e it ta
kes t
o pre
pare
, file
and p
ay (o
r with
hold)
the c
orpo
rate
incom
e tax
, the
value
adde
d tax
and s
ocial
secu
rity co
ntribu
tions
c) t
otal a
moun
t of ta
xes a
nd m
anda
tory c
ontrib
ution
s pay
able
by th
e bus
iness
. 3 A
s mea
sure
d by t
he B
usine
ss S
oftwa
re A
llianc
e, 20
13 B
SA G
lobal
Softw
are
Pira
cy S
tudy
(Jun
e 201
4): a
) Per
centa
ge of
unlic
ense
d soft
ware
insta
lled;
b) E
stima
tes ar
e bas
ed on
2013
loss
es du
e to
copy
right
busin
ess s
oftwa
re pi
racy
in m
illion
s of U
SD.
61
S E L E C T E D S O U R C E S M O N I T O R E D F O R 2 0 1 5 L A B E R
P R I N TThe Wall Street Journal
O N L I N EAgencia EFE (www.efe.com)América Economía (http://www.americaeconomia.com/)BBC Mundo.com (http://news.bbc.co.uk/hi/spanish/news/)Bloomberg.com: Latin America (http://www.bloomberg.com/news/regions/latinamerica.html) Business News Americas (http://www.bnamericas.com/)Brazil Focus: Weekly Report (Subscriptions available at [email protected])Buenos Aires Herald (www.buenosairesherald.com/)Business Law Magazine (www.businesslaw-magazine.com/)Christian Science Monitor (http://www.csmonistor.com)Consensus Economics (http://www.consensuseconomics.com)Council on Hemispheric Affairs Report (http://www.coha.org/)Economist Intelligence Unit (http://www.eiu.com/)The Economist (http://www.economist.com)Finance & Development (http://www.imf.org/external/pubs/ft/fandd/2015/12/index.htm)Financial Times (http://www.ft.com)Global Arbitration News (http://globalarbitrationnews.com/)Global Tax News (http://www.tax-news.com)The Guardian (www.theguardian.com)Infolatam (http://www.infolatam.com) Insurance Journal (http://www.insurancejournal.com)International Business Times (http://www.ibtimes.com)Investment Arbitration Reporter (http://www.iareporter.com)Journal of Commerce (http://www.joc.com)Jurist (http://jurist.org)Latin American Newspapers accessible through Latin American Network Information Center at: http://www1.lanic.utexas.edu/la/region/news/ Latin America Advisor (Subscriptions available at [email protected]) Latin American Caribbean & Central America Report (http://www.latinnews.com)Latin American Andean Group Report (http://www.latinnews.com)Latin American Brazil & Southern Cone Report (http://www.latinnews.com )Latin American Herald-Tribune (http://laht.com/)Latin American Mexican & NAFTA Report (http://www.latinnews.com)Latin American Monitor (http://www.latinamericamonitor.com/)Latin Correspondent (http://latincorrespondent.com)Latinobarometro (http://www.latinobarometro.org)Los Angeles Times (http://www.latimes.com)Mercopress (http://en.mercopress.com)Miami Herald (http://www.herald.com)Mondaq Regional Business Briefing (http://www.mondaq.com)Mining.com National Law Review (http://www.natlawreview.com)The New York Times (http://www.nytimes.com/)PanAm Post (http://panampost.com)ReutersSUR1810 (www.sur1810.com) Tico Times (http://www.ticotimes.net)World IP Review (www.worldipreview.com/)
62
P R I M A R Y D A T A S O U R C E SInternational Monetary Fund (http://www.imf.org/)UN Economic Commission for Latin America and the Caribbean (ECLAC) (http://www.cepal.org/default.asp?idioma=IN) World Bank (www.worldbank.org)
A R T I C L E S C I T E DNiso Abuaf, “The International Cost of Capital: The Empirical Evidence,” Salomon Brothers (June 1997).
Aswath Damodaran, “Country Risk and Company Exposure: Theory and Practice, Journal of Applied Finance (Fall/Winter 2003).
Pablo Fernandez, Alberto Ortiz, and Isabel Acin, “Discount Rate (Risk-free Rate and market Risk Premium) used for 41 Countries in 2015: A Survey,” IESE Business School, 2015
Nora Lustig, “Most Unequal on Earth,” Finance and Development (September 2015).
Carmel Mesa-Logo, “Institutional Changes of Cuba’s Economic-Social Reforms,” Brookings Institution (August 2015).
Sebastian Sosa, Evridiki Tsounta, and Hye Sun Kim, “Is the Growth Momentum in Latin America Sustainable?”IMF Working Paper (May 2013).
Mark P. Sullivan, Cuba: Issues for the 114th Congress. Congressional Research Service (November 15, 2015).

63
64 65
LatinAmericanBusinessEnvironmentProgramCenter for Latin American StudiesUniversity of FloridaPO Box 115530Gainesville,FL32611-5530USATel:(352)273-4723Fax:(352)392-7682http://www.latam.ufl.edu/research-training/la-business-environment
Center for Governmental ResponsibilityUniversityofFloridaFredricG.LevinCollegeofLawPOBox117629Gainesville,FL32611-7629USATel:(352)273-0835Fax:(352)392-1457http://www.law.ufl.edu/academics/centers/cgr
Latin American Business Environment ProgramCenter for Latin American StudiesUniversity of FloridaPO Box 115530Gainesville, FL 32611-5330 USATel: (352) 273-4723Fax: (352) 392-7682www.latam.ufl.edu/research--training/la-business-environment
Center for Governmental ResponsibilityUniversity of Florida Fredric G. Levin College of LawPO Box 117629Gainesville, FL 32611-7629Tel: (352) 273-0836Fax: (352) 392-1457