Embed Size (px)
Citation preview
PLEASE CHECK THE WEBSITE FOR POSSIBLE UPDATES
Last update - 13/09/2016
EUROCETEuropean network of Competent Authorities for Tissues and
Cells
European data on reproductive cells (ART) - Year 2014
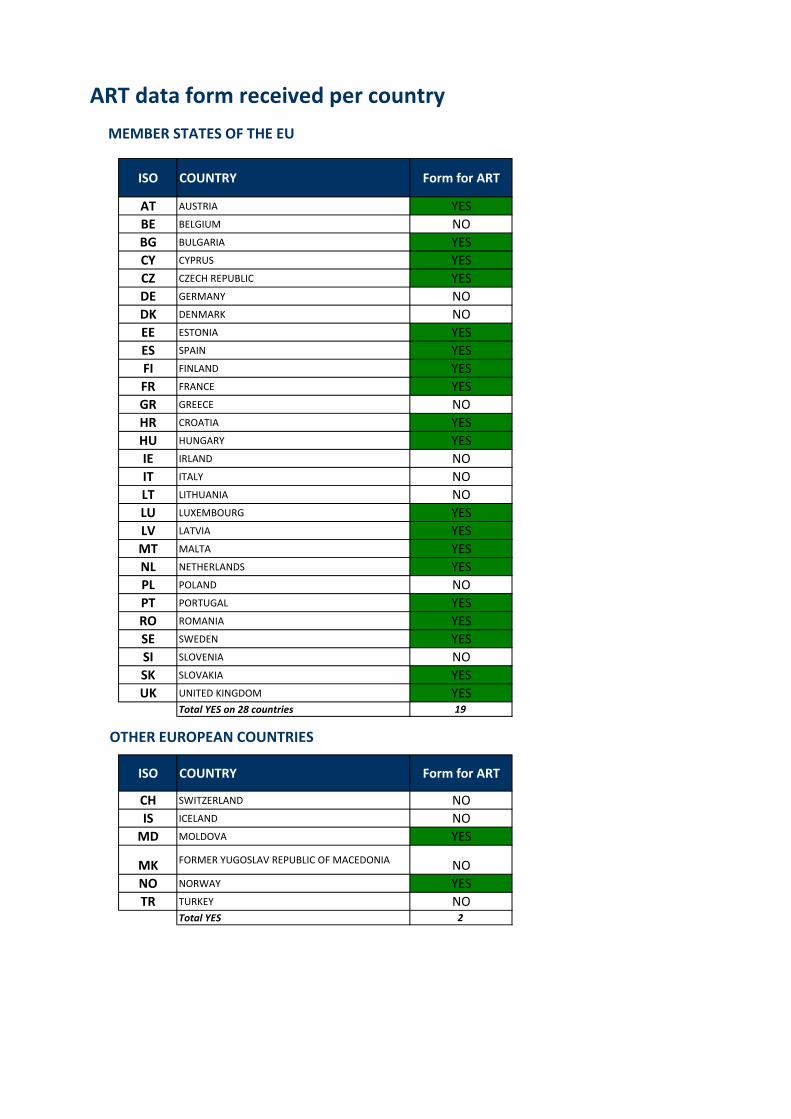
ISO COUNTRY Form for ART
AT AUSTRIA YES
BE BELGIUM NO
BG BULGARIA YES
CY CYPRUS YES
CZ CZECH REPUBLIC YES
DE GERMANY NO
DK DENMARK NO
EE ESTONIA YES
ES SPAIN YES
FI FINLAND YES
FR FRANCE YES
GR GREECE NO
HR CROATIA YES
HU HUNGARY YES
IE IRLAND NO
IT ITALY NO
LT LITHUANIA NO
LU LUXEMBOURG YES
LV LATVIA YES
MT MALTA YES
NL NETHERLANDS YES
PL POLAND NO
PT PORTUGAL YES
RO ROMANIA YES
SE SWEDEN YES
SI SLOVENIA NO
SK SLOVAKIA YES
UK UNITED KINGDOM YESTotal YES on 28 countries 19
ISO COUNTRY Form for ART
CH SWITZERLAND NO
IS ICELAND NO
MD MOLDOVA YES
MK FORMER YUGOSLAV REPUBLIC OF MACEDONIA NO
NO NORWAY YES
TR TURKEY NOTotal YES 2
MEMBER STATES OF THE EU
OTHER EUROPEAN COUNTRIES
ART data form received per country
Preliminary European Figures on Assisted Reproduction Technologies (ART) Donation and
Transplantation Activities, documents produced by the “EUROCET - European Network of Competent
Authorities for Tissues and Cells” (2014)
Data provided by National Competent Authorities: EUROPE Austria Waltraud Trabe Belgium Bulgaria Yordan Peev Cyprus Carolina Stylianou Czech Republic Eva Křemenová Germany Denmark Estonia Siim Suutre Spain Maravilla Izquierdo Martínez Finland Anne Tammiruusu France Candide Font-Sala Greece Croatia Milena Ivanković Hungary Lilla Tokár Ireland Italy
Lithuania Luxembourg Martine Debacker Latvia Ieva Bekere The Republic of Moldova Igor Codreanu Tatiana Timbalari Macedonia Malta Patricia Galea Netherlands Frank Van Linden Norway Zaheer Rana Poland Portugal Ana Rita Laranjera Romania Andrei Nica Sweden Mona Hansson Slovenia Slovakia Magdaléna Krátka Daniel Kuba
Turkey United Kingdom Richard Baranowski
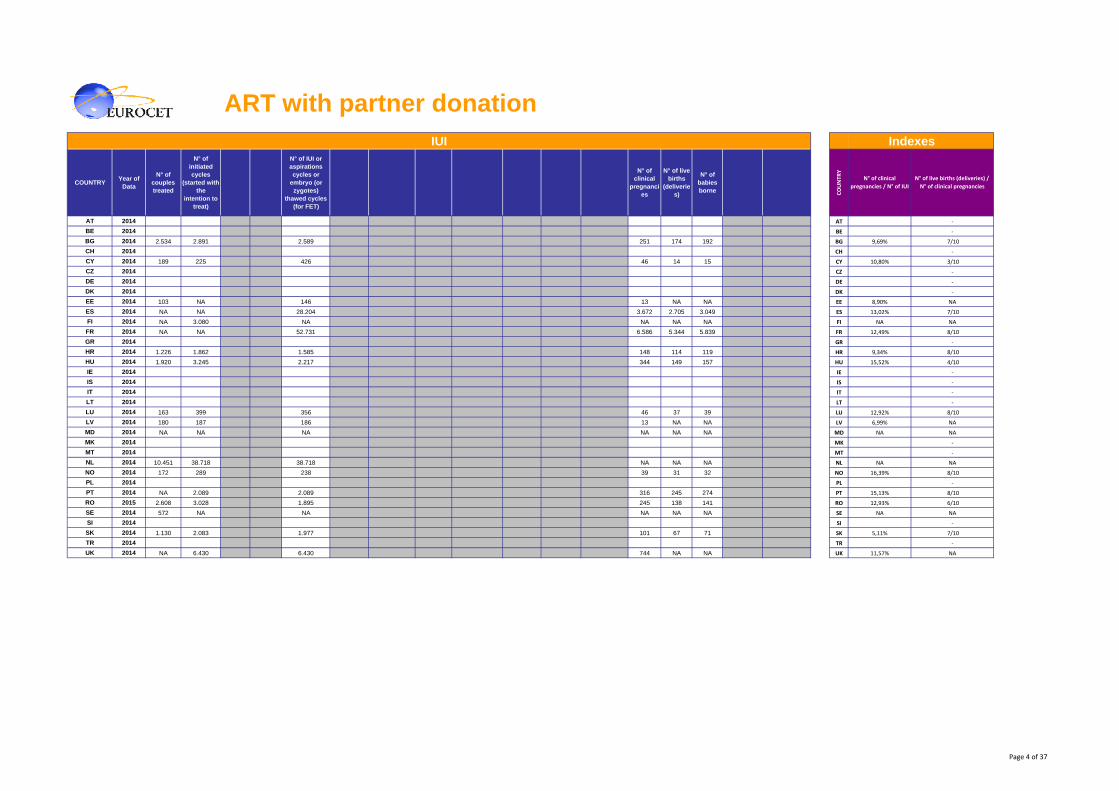
ART with partner donationIUI Indexes
COUNTRY Year of Data
N° of couples treated
N° of initiated cycles
(started with the
intention to treat)
N° of IUI or aspirations cycles or
embryo (or zygotes)
thawed cycles (for FET)
N° of clinical
pregnancies
N° of live births
(deliveries)
N° of babies borne C
OUNTR
Y
AT 2014 AT
BE 2014 BE
BG 2014 2.534 2.891 2.589 251 174 192 BG
CH 2014 CH
CY 2014 189 225 426 46 14 15 CY
CZ 2014 CZ
DE 2014 DE
DK 2014 DK
EE 2014 103 NA 146 13 NA NA EE
ES 2014 NA NA 28.204 3.672 2.705 3.049 ES
FI 2014 NA 3.080 NA NA NA NA FI
FR 2014 NA NA 52.731 6.586 5.344 5.839 FR
GR 2014 GR
HR 2014 1.226 1.862 1.585 148 114 119 HR
HU 2014 1.920 3.245 2.217 344 149 157 HU
IE 2014 IE
IS 2014 IS
IT 2014 IT
LT 2014 LT
LU 2014 163 399 356 46 37 39 LU
LV 2014 180 187 186 13 NA NA LV
MD 2014 NA NA NA NA NA NA MD
MK 2014 MK
MT 2014 MT
NL 2014 10.451 38.718 38.718 NA NA NA NL
NO 2014 172 289 238 39 31 32 NO
PL 2014 PL
PT 2014 NA 2.089 2.089 316 245 274 PT
RO 2015 2.608 3.028 1.895 245 138 141 RO
SE 2014 572 NA NA NA NA NA SE
SI 2014 SI
SK 2014 1.130 2.083 1.977 101 67 71 SK
TR 2014 TR
UK 2014 NA 6.430 6.430 744 NA NA UK
8/10
NA
‐
‐
NA
NA
‐
NA
‐
‐
NA
7/10
NA
12,49%
8,90%
4/10
13,02%
NA
15,13%
NA
‐
‐
8/10
‐
‐
8/10
6,99%
NA
‐
3/10
‐
10,80%
15,52%
9,34%
7/10
8/10
‐
8/10
‐
16,39%
12,93%
12,92%
11,57%
‐
NA
6/10
NA
5,11%
N° of clinical
pregnancies / N° of IUI
N° of live births (deliveries) /
N° of clinical pregnancies
9,69%
‐
‐
7/10
Page 4 of 37

ART with partner donationIVF Indexes
COUNTRY Year of Data
N° of couples treated
N° of initiated cycles
(started with the
intention to treat)
Fresh cycles
Frozen cycles
N° of aspirations
cycles
N° of oocytes
collected
N°of oocytes inseminated/in
jected
N° of oocytes frozen
during IVF or ICSI
N° of embryos (or zygotes)
created
N° of embryos (or
zygotes) frozen
N° of embryos (or
zygotes) transfers
(ET)
N° of embryos or zygotes transferred
N° of clinical
pregnancies
N° of live births
(deliveries)
N° of babies borne
Total N° of frozen
oocytes stored at
31.12 24:00
Total N°of frozen
embryos/zygotes stored at 31.12 24:00
COUNTR
Y
N° of clinical pregn
ancies
/ N° of aspirations cycles
N° of clinical pregn
ancies
/ N° of embryos (or
zygo
tes) transfers (ET)
N° of embryos
tran
sferred / N° of
embryos tran
sfers (ET)
N° of live births
(deliveries) / N° of
clinical pregn
ancies
AT 2014 AT ‐ ‐ ‐ ‐
BE 2014 BE ‐ ‐ ‐ ‐
BG 2014 942 963 979 20 843 4.939 3.794 2 3.113 558 672 1.333 264 182 222 5 849 BG 31,32% 39,29% 2,0 7/10
CH 2014 CH ‐ ‐ ‐ ‐
CY 2014 146 141 116 10 137 1.521 1.086 366 588 251 264 358 65 25 9 24 127 CY 47,45% 24,62% 1,4 4/10
CZ 2014 807 898 NA NA NA 7.925 7.807 NA 4.967 940 728 923 243 NA NA NA NA CZ NA 33,38% 1,3 NA
DE 2014 DE ‐ ‐ ‐ ‐
DK 2014 DK ‐ ‐ ‐ ‐
EE 2014 450 NA NA NA 535 NA 4.829 NA 3.459 1.474 459 764 145 NA NA NA NA EE 27,10% 31,59% 1,7 NA
ES 2014 4.663 NA 5.491 NA 4.935 36.994 35.178 60 23.770 6.594 3.923 6.616 1.421 970 1.141 NA NA ES 28,79% 36,22% 1,7 7/10
FI 2014 NA 2.441 NA NA NA NA NA NA NA NA 2.006 NA NA NA NA NA NA FI NA NA NA NA
FR 2014 NA NA NA NA 20.425 179.739 172.676 NA 106.813 24.611 15.655 25.863 4.856 3.869 4.404 NA NA FR 23,77% 31,02% 1,7 8/10
GR 2014 GR ‐ ‐ ‐ ‐
HR 2014 1.523 2.166 2.137 28 1.909 8.650 7.927 120 5.311 947 1.588 2.604 431 354 388 1.040 4.663 HR 22,58% 27,14% 1,6 8/10
HU 2014 826 740 531 18 661 7.973 5.007 0 3.366 1.303 876 1.860 308 181 246 53 1.569 HU 46,60% 2,1 6/10
IE 2014 IE ‐ ‐ ‐ ‐
IS 2014 IS ‐ ‐ ‐ ‐
IT 2014 IT ‐ ‐ ‐ ‐
LT 2014 LT ‐ ‐ ‐ ‐
LU 2014 218 582* NA NA 265 2.017 1.893 0* 1.265 351 217 383 63 49 61 0* 1600* LU 23,77% 29,03% 1,8 8/10
LV 2014 435 471 NA NA 470 5.059 5.013 0 3.039 828 389 619 99 NA NA NA NA LV 21,06% 25,45% 1,6 NA
MD 2014 MD ‐ ‐ ‐ ‐
MK 2014 NA NA NA NA NA NA NA NA NA NA NA NA NA NA NA NA NA MK NA NA NA NA
MT 2014 NA NA 0 0 0 0 0 0 NE NE 0 0 0 0 0 0 NE MT ‐ ‐ ‐ ‐
NL 2014 NA 6.537 NA NA 5.851 NA NA NA NA NA 5.247 NA 1.757 1.260 1.313 NA NA NL 30,03% 33,49% NA 7/10
NO 2014 2.212 2.929 2.929 0 2.796 23.268 23.307 1.344 14.353 3.995 2.441 3.279 850 702 754 NA NA NO 30,40% 34,82% 1,3 8/10
PL 2014 PL ‐ ‐ ‐ ‐
PT 2014 NA 2.144 2.144 0 2.063 16.638 15.698 23 9.416 197 1.626 2.922 646 478 576 NA 6.844 PT 31,31% 39,73% 1,8 7/10
RO 2015 1.332 1.401 1.367 39 1.137 1.229 10.258 26 5.984 2.205 1.597 2.593 401 289 349 856 4.055 RO 35,27% 25,11% 1,6 7/10
SE 2014 9.210 NA NA NA NA 115.645 NA 1.929 34.743 14.331 14.265 17.281 NA NA NA NA NA SE NA NA 1,2 NA
SI 2014 SI ‐ ‐ ‐ ‐
SK 2014 436 444 270 150 393 4.438 2.997 94 1.018 1.297 454 833 215 123 139 20 1.728 SK 54,71% 47,36% 1,8 6/10
TR 2014 TR ‐ ‐ ‐ ‐
UK 2014 17.399 19.777 19.777 10.788 17.346 167.106 163.503 846 101.736 21.631 15.338 23.455 5.513 4.746 5.340 NA NA UK 31,78% 35,94% 1,5 9/10
Page 5 of 37
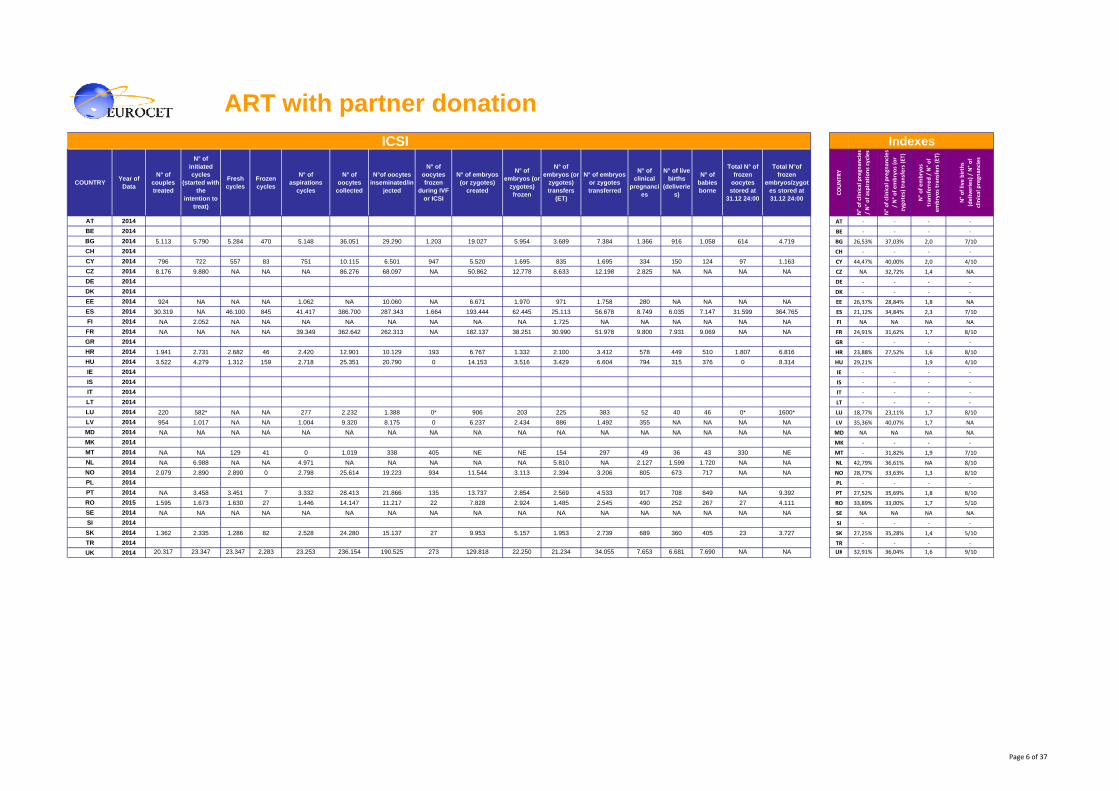
ART with partner donationICSI Indexes
COUNTRY Year of Data
N° of couples treated
N° of initiated cycles
(started with the
intention to treat)
Fresh cycles
Frozen cycles
N° of aspirations
cycles
N° of oocytes
collected
N°of oocytes inseminated/in
jected
N° of oocytes frozen
during IVF or ICSI
N° of embryos (or zygotes)
created
N° of embryos (or
zygotes) frozen
N° of embryos (or
zygotes) transfers
(ET)
N° of embryos or zygotes transferred
N° of clinical
pregnancies
N° of live births
(deliveries)
N° of babies borne
Total N° of frozen
oocytes stored at
31.12 24:00
Total N°of frozen
embryos/zygotes stored at 31.12 24:00
COUNTR
Y
N° of clinical pregn
ancies
/ N° of aspirations cycles
N° of clinical pregn
ancies
/ N° of embryos (or
zygo
tes) transfers (ET)
N° of embryos
tran
sferred / N° of
embryos tran
sfers (ET)
N° of live births
(deliveries) / N° of
clinical pregn
ancies
AT 2014 AT ‐ ‐ ‐ ‐
BE 2014 BE ‐ ‐ ‐ ‐
BG 2014 5.113 5.790 5.284 470 5.148 36.051 29.290 1.203 19.027 5.954 3.689 7.384 1.366 916 1.058 614 4.719 BG 26,53% 37,03% 2,0 7/10
CH 2014 CH ‐ ‐ ‐ ‐
CY 2014 796 722 557 83 751 10.115 6.501 947 5.520 1.695 835 1.695 334 150 124 97 1.163 CY 44,47% 40,00% 2,0 4/10
CZ 2014 8.176 9.880 NA NA NA 86.276 68.097 NA 50.862 12.778 8.633 12.198 2.825 NA NA NA NA CZ NA 32,72% 1,4 NA
DE 2014 DE ‐ ‐ ‐ ‐
DK 2014 DK ‐ ‐ ‐ ‐
EE 2014 924 NA NA NA 1.062 NA 10.060 NA 6.671 1.970 971 1.758 280 NA NA NA NA EE 26,37% 28,84% 1,8 NA
ES 2014 30.319 NA 46.100 845 41.417 386.700 287.343 1.664 193.444 62.445 25.113 56.678 8.749 6.035 7.147 31.599 364.765 ES 21,12% 34,84% 2,3 7/10
FI 2014 NA 2.052 NA NA NA NA NA NA NA NA 1.725 NA NA NA NA NA NA FI NA NA NA NA
FR 2014 NA NA NA NA 39.349 362.642 262.313 NA 182.137 38.251 30.990 51.978 9.800 7.931 9.069 NA NA FR 24,91% 31,62% 1,7 8/10
GR 2014 GR ‐ ‐ ‐ ‐
HR 2014 1.941 2.731 2.682 46 2.420 12.901 10.129 193 6.767 1.332 2.100 3.412 578 449 510 1.807 6.816 HR 23,88% 27,52% 1,6 8/10
HU 2014 3.522 4.279 1.312 159 2.718 25.351 20.790 0 14.153 3.516 3.429 6.604 794 315 376 0 8.314 HU 29,21% 1,9 4/10
IE 2014 IE ‐ ‐ ‐ ‐
IS 2014 IS ‐ ‐ ‐ ‐
IT 2014 IT ‐ ‐ ‐ ‐
LT 2014 LT ‐ ‐ ‐ ‐
LU 2014 220 582* NA NA 277 2.232 1.388 0* 906 203 225 383 52 40 46 0* 1600* LU 18,77% 23,11% 1,7 8/10
LV 2014 954 1.017 NA NA 1.004 9.320 8.175 0 6.237 2.434 886 1.492 355 NA NA NA NA LV 35,36% 40,07% 1,7 NA
MD 2014 NA NA NA NA NA NA NA NA NA NA NA NA NA NA NA NA NA MD NA NA NA NA
MK 2014 MK ‐ ‐ ‐ ‐
MT 2014 NA NA 129 41 0 1.019 338 405 NE NE 154 297 49 36 43 330 NE MT ‐ 31,82% 1,9 7/10
NL 2014 NA 6.988 NA NA 4.971 NA NA NA NA NA 5.810 NA 2.127 1.599 1.720 NA NA NL 42,79% 36,61% NA 8/10
NO 2014 2.079 2.890 2.890 0 2.798 25.614 19.223 934 11.544 3.113 2.394 3.206 805 673 717 NA NA NO 28,77% 33,63% 1,3 8/10
PL 2014 PL ‐ ‐ ‐ ‐
PT 2014 NA 3.458 3.451 7 3.332 28.413 21.866 135 13.737 2.854 2.569 4.533 917 708 849 NA 9.392 PT 27,52% 35,69% 1,8 8/10
RO 2015 1.595 1.673 1.630 27 1.446 14.147 11.217 22 7.828 2.924 1.485 2.545 490 252 267 27 4.111 RO 33,89% 33,00% 1,7 5/10
SE 2014 NA NA NA NA NA NA NA NA NA NA NA NA NA NA NA NA NA SE NA NA NA NA
SI 2014 SI ‐ ‐ ‐ ‐
SK 2014 1.362 2.335 1.286 82 2.528 24.280 15.137 27 9.953 5.157 1.953 2.739 689 360 405 23 3.727 SK 27,25% 35,28% 1,4 5/10
TR 2014 TR ‐ ‐ ‐ ‐
UK 2014 20.317 23.347 23.347 2.283 23.253 236.154 190.525 273 129.818 22.250 21.234 34.055 7.653 6.681 7.690 NA NA UK 32,91% 36,04% 1,6 9/10
Page 6 of 37
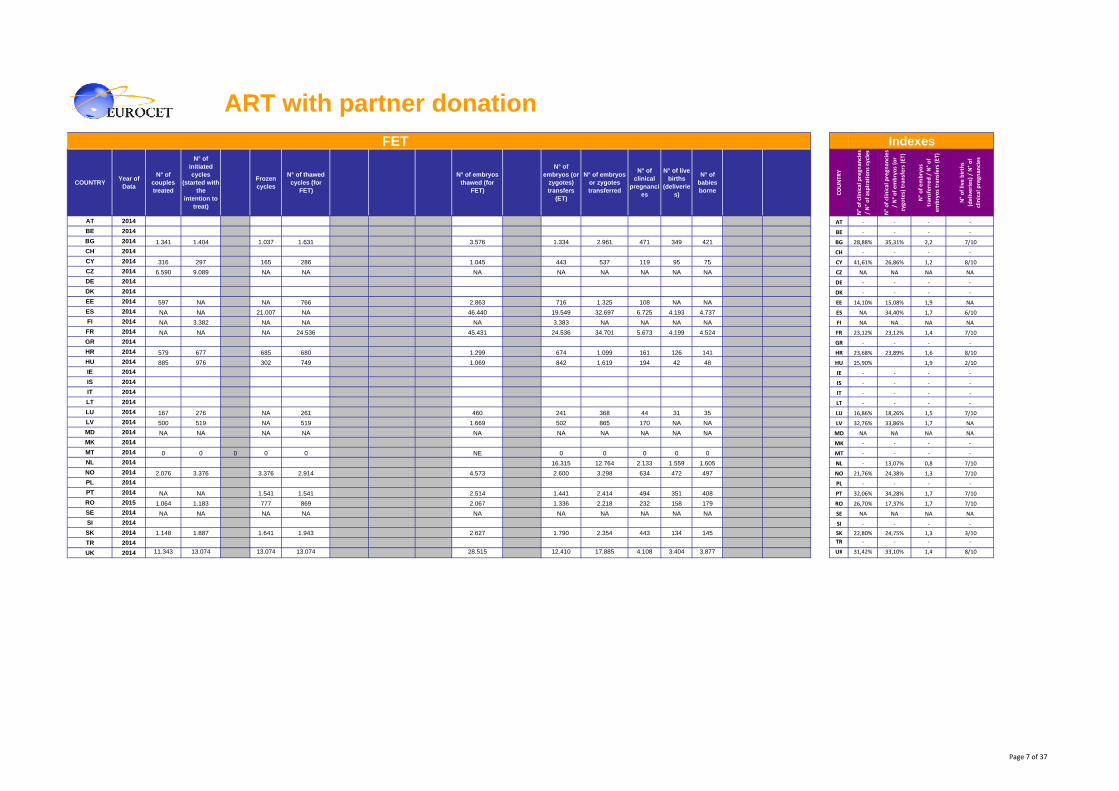
ART with partner donationFET Indexes
COUNTRY Year of Data
N° of couples treated
N° of initiated cycles
(started with the
intention to treat)
Frozen cycles
N° of thawed cycles (for
FET)
N° of embryos thawed (for
FET)
N° of embryos (or
zygotes) transfers
(ET)
N° of embryos or zygotes transferred
N° of clinical
pregnancies
N° of live births
(deliveries)
N° of babies borne C
OUNTR
Y
N° of clinical pregn
ancies
/ N° of aspirations cycles
N° of clinical pregn
ancies
/ N° of embryos (or
zygo
tes) transfers (ET)
N° of embryos
tran
sferred / N° of
embryos tran
sfers (ET)
N° of live births
(deliveries) / N° of
clinical pregn
ancies
AT 2014 AT ‐ ‐ ‐ ‐
BE 2014 BE ‐ ‐ ‐ ‐
BG 2014 1.341 1.404 1.037 1.631 3.576 1.334 2.961 471 349 421 BG 28,88% 35,31% 2,2 7/10
CH 2014 CH ‐ ‐ ‐ ‐
CY 2014 316 297 165 286 1.045 443 537 119 95 75 CY 41,61% 26,86% 1,2 8/10
CZ 2014 6.590 9.089 NA NA NA NA NA NA NA NA CZ NA NA NA NA
DE 2014 DE ‐ ‐ ‐ ‐
DK 2014 DK ‐ ‐ ‐ ‐
EE 2014 597 NA NA 766 2.863 716 1.325 108 NA NA EE 14,10% 15,08% 1,9 NA
ES 2014 NA NA 21.007 NA 46.440 19.549 32.697 6.725 4.193 4.737 ES NA 34,40% 1,7 6/10
FI 2014 NA 3.382 NA NA NA 3.383 NA NA NA NA FI NA NA NA NA
FR 2014 NA NA NA 24.536 45.431 24.536 34.701 5.673 4.199 4.524 FR 23,12% 23,12% 1,4 7/10
GR 2014 GR ‐ ‐ ‐ ‐
HR 2014 579 677 685 680 1.299 674 1.099 161 126 141 HR 23,68% 23,89% 1,6 8/10
HU 2014 885 976 302 749 1.069 842 1.619 194 42 48 HU 25,90% 1,9 2/10
IE 2014 IE ‐ ‐ ‐ ‐
IS 2014 IS ‐ ‐ ‐ ‐
IT 2014 IT ‐ ‐ ‐ ‐
LT 2014 LT ‐ ‐ ‐ ‐
LU 2014 167 276 NA 261 460 241 368 44 31 35 LU 16,86% 18,26% 1,5 7/10
LV 2014 500 519 NA 519 1.669 502 865 170 NA NA LV 32,76% 33,86% 1,7 NA
MD 2014 NA NA NA NA NA NA NA NA NA NA MD NA NA NA NA
MK 2014 MK ‐ ‐ ‐ ‐
MT 2014 0 0 0 0 0 NE 0 0 0 0 0 MT ‐ ‐ ‐ ‐
NL 2014 16.315 12.764 2.133 1.559 1.605 NL ‐ 13,07% 0,8 7/10
NO 2014 2.076 3.376 3.376 2.914 4.573 2.600 3.298 634 472 497 NO 21,76% 24,38% 1,3 7/10
PL 2014 PL ‐ ‐ ‐ ‐
PT 2014 NA NA 1.541 1.541 2.514 1.441 2.414 494 351 408 PT 32,06% 34,28% 1,7 7/10
RO 2015 1.064 1.183 777 869 2.067 1.336 2.218 232 158 179 RO 26,70% 17,37% 1,7 7/10
SE 2014 NA NA NA NA NA NA NA NA NA NA SE NA NA NA NA
SI 2014 SI ‐ ‐ ‐ ‐
SK 2014 1.148 1.887 1.641 1.943 2.627 1.790 2.354 443 134 145 SK 22,80% 24,75% 1,3 3/10
TR 2014 TR ‐ ‐ ‐ ‐
UK 2014 11.343 13.074 13.074 13.074 28.515 12.410 17.885 4.108 3.404 3.877 UK 31,42% 33,10% 1,4 8/10
Page 7 of 37
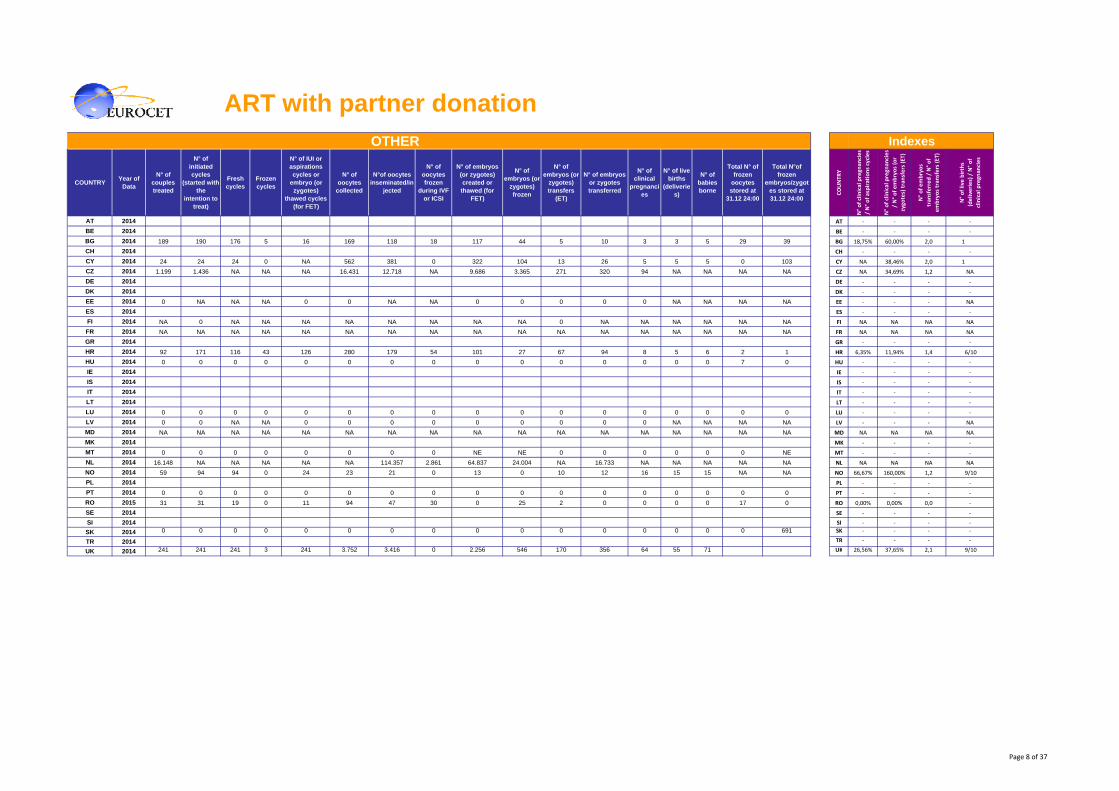
ART with partner donationOTHER Indexes
COUNTRY Year of Data
N° of couples treated
N° of initiated cycles
(started with the
intention to treat)
Fresh cycles
Frozen cycles
N° of IUI or aspirations cycles or
embryo (or zygotes)
thawed cycles (for FET)
N° of oocytes
collected
N°of oocytes inseminated/in
jected
N° of oocytes frozen
during IVF or ICSI
N° of embryos (or zygotes) created or
thawed (for FET)
N° of embryos (or
zygotes) frozen
N° of embryos (or
zygotes) transfers
(ET)
N° of embryos or zygotes transferred
N° of clinical
pregnancies
N° of live births
(deliveries)
N° of babies borne
Total N° of frozen
oocytes stored at
31.12 24:00
Total N°of frozen
embryos/zygotes stored at 31.12 24:00
COUNTR
Y
N° of clinical pregn
ancies
/ N° of aspirations cycles
N° of clinical pregn
ancies
/ N° of embryos (or
zygo
tes) transfers (ET)
N° of embryos
tran
sferred / N° of
embryos tran
sfers (ET)
N° of live births
(deliveries) / N° of
clinical pregn
ancies
AT 2014 AT ‐ ‐ ‐ ‐
BE 2014 BE ‐ ‐ ‐ ‐
BG 2014 189 190 176 5 16 169 118 18 117 44 5 10 3 3 5 29 39 BG 18,75% 60,00% 2,0 1
CH 2014 CH ‐ ‐ ‐ ‐
CY 2014 24 24 24 0 NA 562 381 0 322 104 13 26 5 5 5 0 103 CY NA 38,46% 2,0 1
CZ 2014 1.199 1.436 NA NA NA 16.431 12.718 NA 9.686 3.365 271 320 94 NA NA NA NA CZ NA 34,69% 1,2 NA
DE 2014 DE ‐ ‐ ‐ ‐
DK 2014 DK ‐ ‐ ‐ ‐
EE 2014 0 NA NA NA 0 0 NA NA 0 0 0 0 0 NA NA NA NA EE ‐ ‐ ‐ NA
ES 2014 ES ‐ ‐ ‐ ‐
FI 2014 NA 0 NA NA NA NA NA NA NA NA 0 NA NA NA NA NA NA FI NA NA NA NA
FR 2014 NA NA NA NA NA NA NA NA NA NA NA NA NA NA NA NA NA FR NA NA NA NA
GR 2014 GR ‐ ‐ ‐ ‐
HR 2014 92 171 116 43 126 280 179 54 101 27 67 94 8 5 6 2 1 HR 6,35% 11,94% 1,4 6/10
HU 2014 0 0 0 0 0 0 0 0 0 0 0 0 0 0 0 7 0 HU ‐ ‐ ‐ ‐
IE 2014 IE ‐ ‐ ‐ ‐
IS 2014 IS ‐ ‐ ‐ ‐
IT 2014 IT ‐ ‐ ‐ ‐
LT 2014 LT ‐ ‐ ‐ ‐
LU 2014 0 0 0 0 0 0 0 0 0 0 0 0 0 0 0 0 0 LU ‐ ‐ ‐ ‐
LV 2014 0 0 NA NA 0 0 0 0 0 0 0 0 0 NA NA NA NA LV ‐ ‐ ‐ NA
MD 2014 NA NA NA NA NA NA NA NA NA NA NA NA NA NA NA NA NA MD NA NA NA NA
MK 2014 MK ‐ ‐ ‐ ‐
MT 2014 0 0 0 0 0 0 0 0 NE NE 0 0 0 0 0 0 NE MT ‐ ‐ ‐ ‐
NL 2014 16.148 NA NA NA NA NA 114.357 2.861 64.837 24.004 NA 16.733 NA NA NA NA NA NL NA NA NA NA
NO 2014 59 94 94 0 24 23 21 0 13 0 10 12 16 15 15 NA NA NO 66,67% 160,00% 1,2 9/10
PL 2014 PL ‐ ‐ ‐ ‐
PT 2014 0 0 0 0 0 0 0 0 0 0 0 0 0 0 0 0 0 PT ‐ ‐ ‐ ‐
RO 2015 31 31 19 0 11 94 47 30 0 25 2 0 0 0 0 17 0 RO 0,00% 0,00% 0,0 ‐
SE 2014 SE ‐ ‐ ‐ ‐
SI 2014 SI ‐ ‐ ‐ ‐
SK 2014 0 0 0 0 0 0 0 0 0 0 0 0 0 0 0 0 691 SK ‐ ‐ ‐ ‐
TR 2014 TR ‐ ‐ ‐ ‐
UK 2014 241 241 241 3 241 3.752 3.416 0 2.256 546 170 356 64 55 71 UK 26,56% 37,65% 2,1 9/10
Page 8 of 37
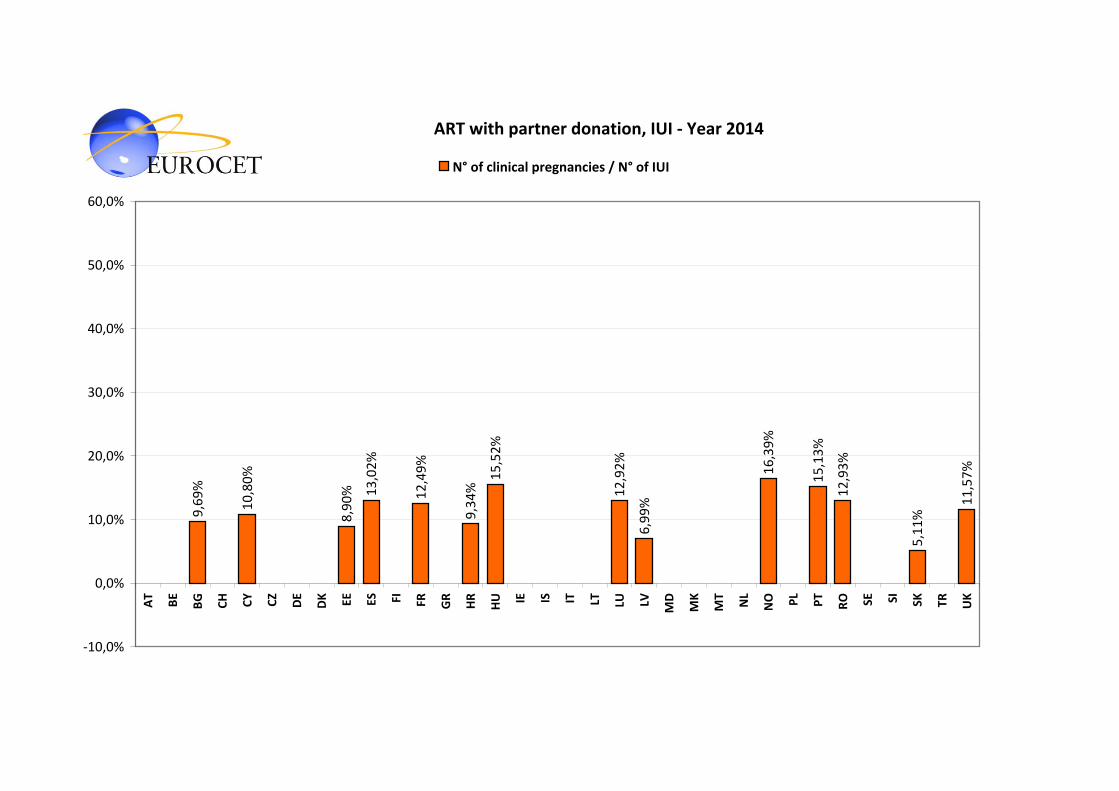
ART with partner donation, IUI ‐ Year 2014
9,69%
10,80%
8,90% 13,02%
12,49%
9,34%
15,52%
12,92%
6,99%
16,39%
15,13%
12,93%
5,11%
11,57%
‐10,0%
0,0%
10,0%
20,0%
30,0%
40,0%
50,0%
60,0%
AT
BE
BG
CH CY CZ
DE
DK EE ES FI FR GR
HR
HU IE IS IT LT LU LV MD
MK
MT
NL
NO PL
PT
RO SE SI SK TR UK
N° of clinical pregnancies / N° of IUI

ART with partner donation, IVF ‐ Year 2014
39,29%
24,62%
33,38%
31,59% 36,22%
31,02%
27,14%
29,03%
25,45%
33,49%
34,82% 39,73%
25,11%
47,36%
35,94%
‐10,0%
0,0%
10,0%
20,0%
30,0%
40,0%
50,0%
60,0%
AT BE BG CH CY CZ DE DK EE ES FI FR GR HR HU IE IS IT LT LU LV MD MK MT NL NO PL PT RO SE SI SK TR UK
N° of clinical pregnancies / N° of embryos (or zygotes) transfers (ET)
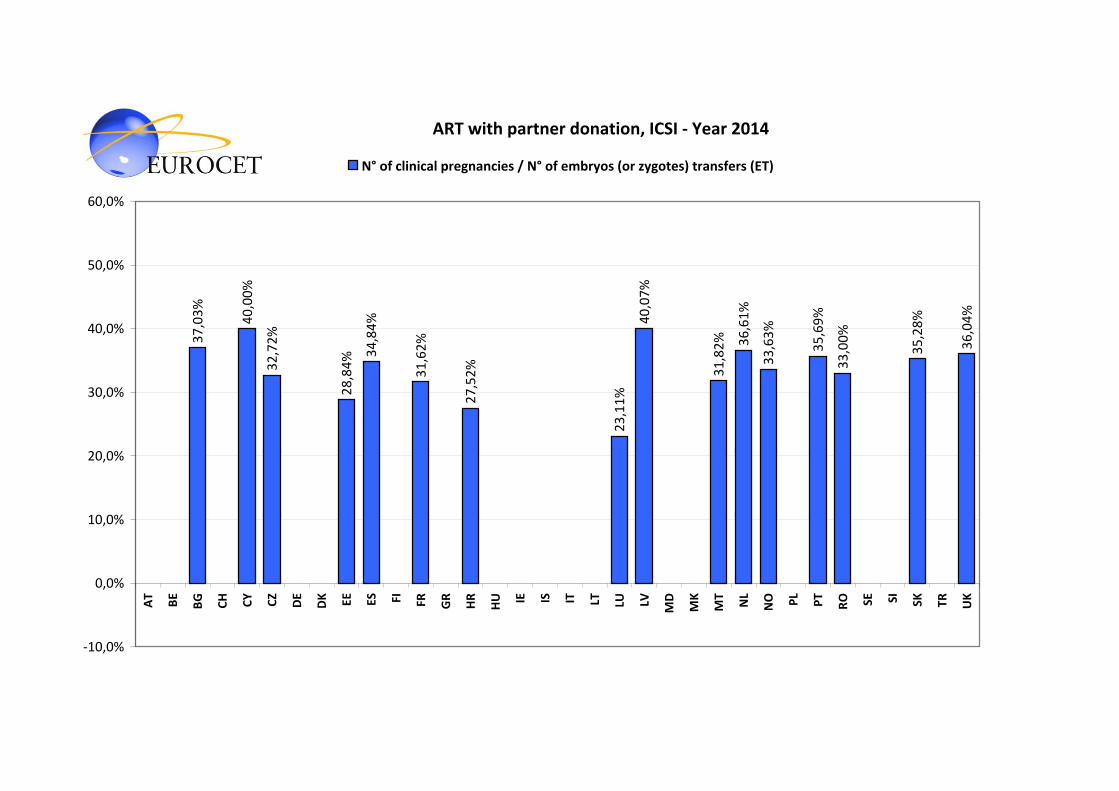
ART with partner donation, ICSI ‐ Year 2014
37,03%
40,00%
32,72%
28,84% 34,84%
31,62%
27,52%
23,11%
40,07%
31,82% 36,61%
33,63%
35,69%
33,00%
35,28%
36,04%
‐10,0%
0,0%
10,0%
20,0%
30,0%
40,0%
50,0%
60,0%
AT
BE
BG
CH CY CZ
DE
DK EE ES FI FR GR
HR
HU IE IS IT LT LU LV MD
MK
MT
NL
NO PL
PT
RO SE SI SK TR UK
N° of clinical pregnancies / N° of embryos (or zygotes) transfers (ET)
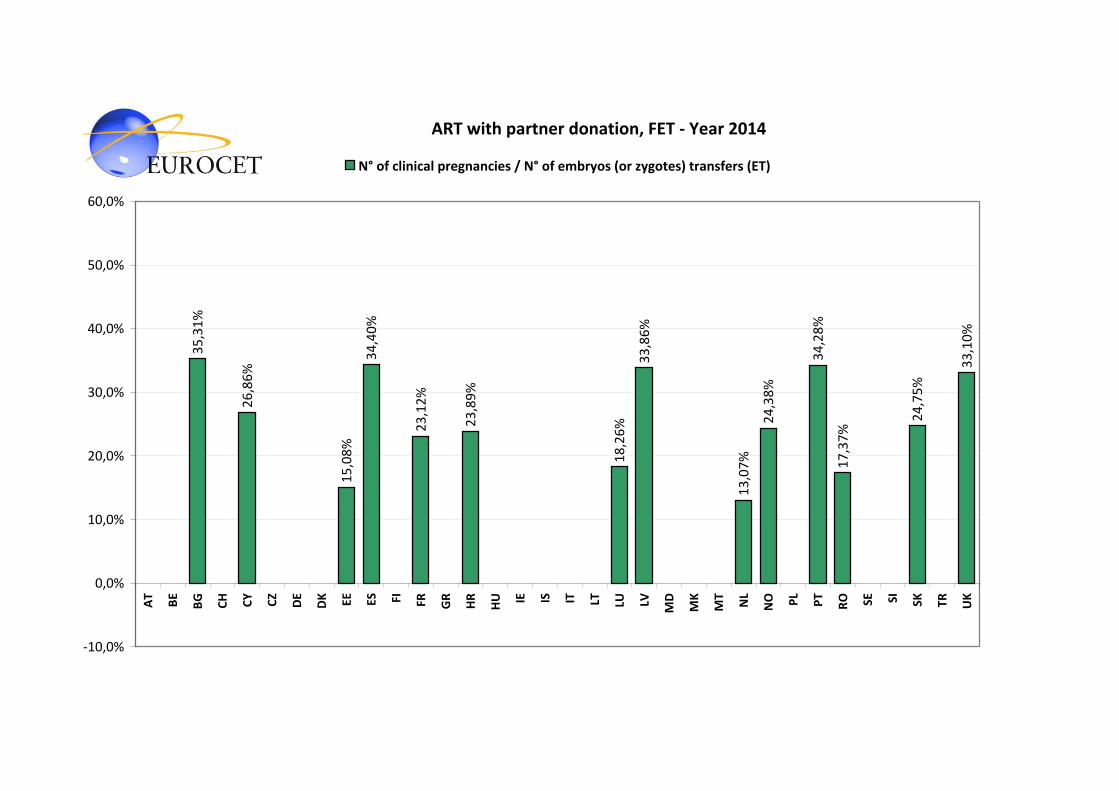
ART with partner donation, FET ‐ Year 2014
35,31%
26,86%
15,08%
34,40%
23,12%
23,89%
18,26%
13,07%
34,28%
17,37%
24,75%
33,10%
33,86%
24,38%
‐10,0%
0,0%
10,0%
20,0%
30,0%
40,0%
50,0%
60,0%
AT
BE
BG
CH CY CZ
DE
DK EE ES FI FR GR
HR
HU IE IS IT LT LU LV MD
MK
MT
NL
NO PL
PT
RO SE SI SK TR UK
N° of clinical pregnancies / N° of embryos (or zygotes) transfers (ET)
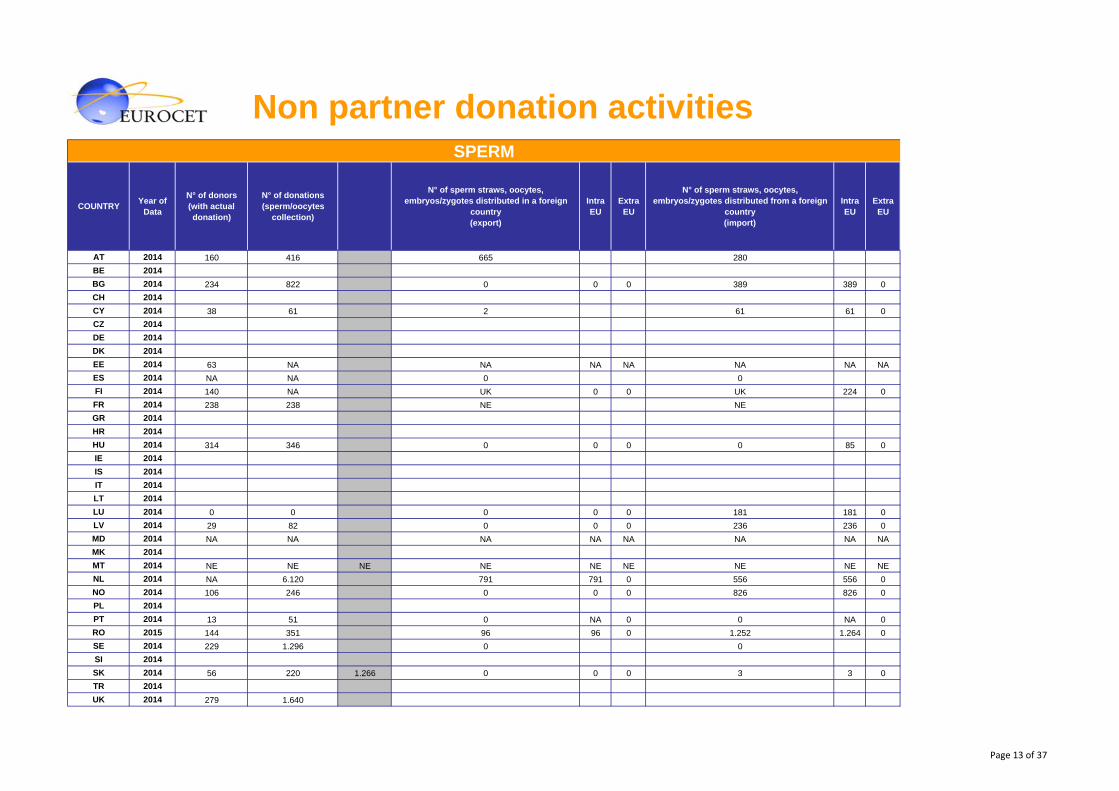
Non partner donation activitiesSPERM
COUNTRY Year of Data
N° of donors (with actual donation)
N° of donations (sperm/oocytes
collection)
N° of sperm straws, oocytes, embryos/zygotes distributed in a foreign
country (export)
IntraEU
ExtraEU
N° of sperm straws, oocytes, embryos/zygotes distributed from a foreign
country (import)
IntraEU
ExtraEU
AT 2014 160 416 665 280BE 2014BG 2014 234 822 0 0 0 389 389 0CH 2014CY 2014 38 61 2 61 61 0CZ 2014DE 2014DK 2014EE 2014 63 NA NA NA NA NA NA NAES 2014 NA NA 0 0FI 2014 140 NA UK 0 0 UK 224 0FR 2014 238 238 NE NEGR 2014HR 2014HU 2014 314 346 0 0 0 0 85 0IE 2014IS 2014IT 2014LT 2014LU 2014 0 0 0 0 0 181 181 0LV 2014 29 82 0 0 0 236 236 0MD 2014 NA NA NA NA NA NA NA NAMK 2014MT 2014 NE NE NE NE NE NE NE NE NENL 2014 NA 6.120 791 791 0 556 556 0NO 2014 106 246 0 0 0 826 826 0PL 2014PT 2014 13 51 0 NA 0 0 NA 0RO 2015 144 351 96 96 0 1.252 1.264 0SE 2014 229 1.296 0 0SI 2014SK 2014 56 220 1.266 0 0 0 3 3 0TR 2014UK 2014 279 1.640
Page 13 of 37
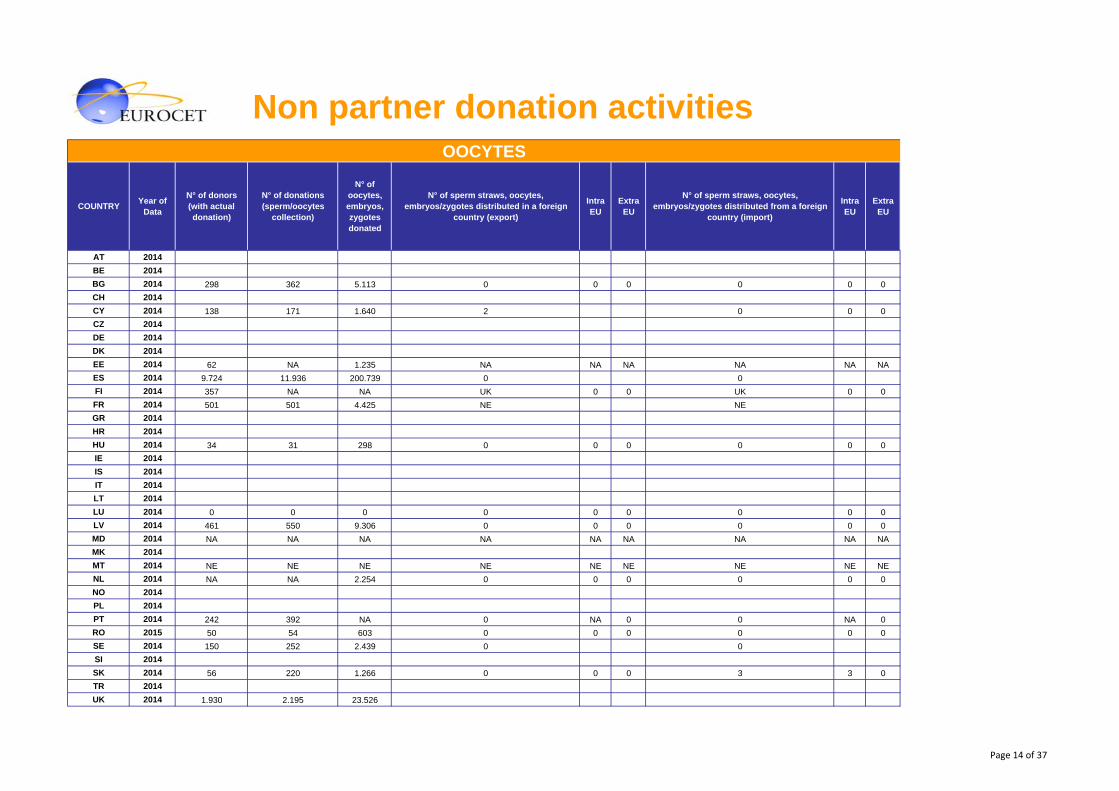
Non partner donation activitiesOOCYTES
COUNTRY Year of Data
N° of donors (with actual donation)
N° of donations (sperm/oocytes
collection)
N° of oocytes, embryos, zygotes donated
N° of sperm straws, oocytes, embryos/zygotes distributed in a foreign
country (export)
Intra EU
Extra EU
N° of sperm straws, oocytes, embryos/zygotes distributed from a foreign
country (import)
Intra EU
Extra EU
AT 2014BE 2014BG 2014 298 362 5.113 0 0 0 0 0 0CH 2014CY 2014 138 171 1.640 2 0 0 0CZ 2014DE 2014DK 2014EE 2014 62 NA 1.235 NA NA NA NA NA NAES 2014 9.724 11.936 200.739 0 0FI 2014 357 NA NA UK 0 0 UK 0 0FR 2014 501 501 4.425 NE NEGR 2014HR 2014HU 2014 34 31 298 0 0 0 0 0 0IE 2014IS 2014IT 2014LT 2014LU 2014 0 0 0 0 0 0 0 0 0LV 2014 461 550 9.306 0 0 0 0 0 0MD 2014 NA NA NA NA NA NA NA NA NAMK 2014MT 2014 NE NE NE NE NE NE NE NE NENL 2014 NA NA 2.254 0 0 0 0 0 0NO 2014PL 2014PT 2014 242 392 NA 0 NA 0 0 NA 0RO 2015 50 54 603 0 0 0 0 0 0SE 2014 150 252 2.439 0 0SI 2014SK 2014 56 220 1.266 0 0 0 3 3 0TR 2014UK 2014 1.930 2.195 23.526
Page 14 of 37
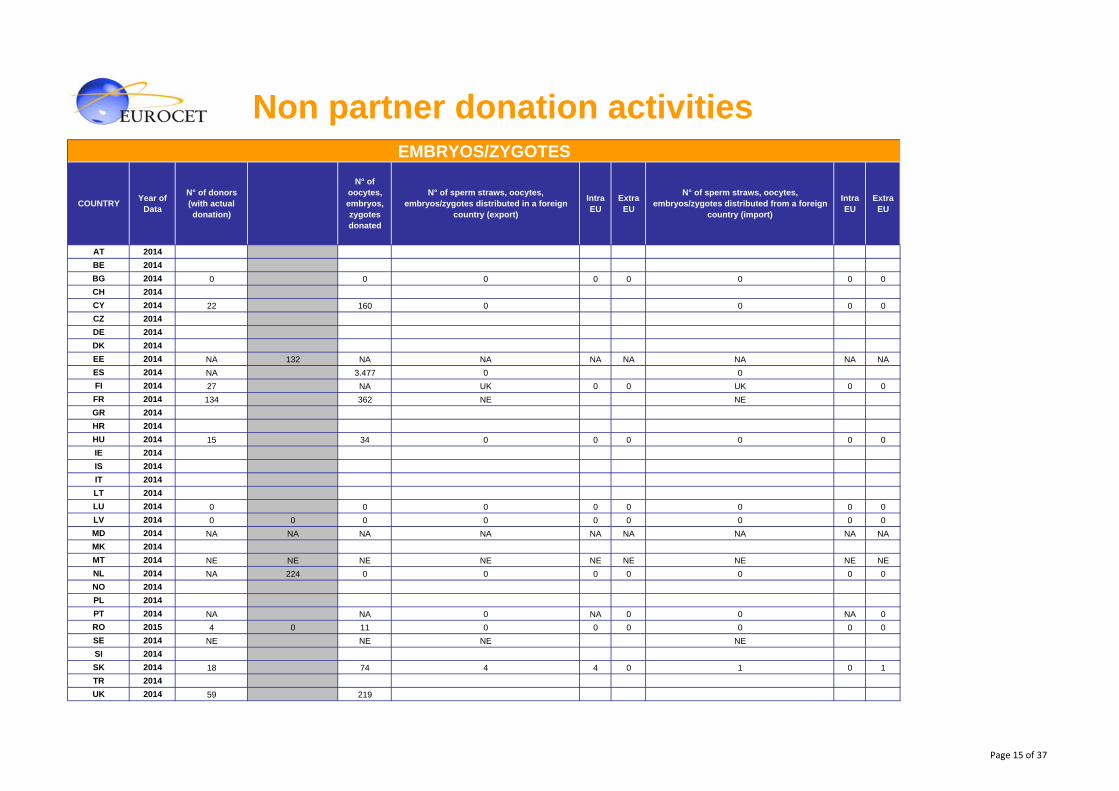
Non partner donation activitiesEMBRYOS/ZYGOTES
COUNTRY Year of Data
N° of donors (with actual donation)
N° of oocytes, embryos, zygotes donated
N° of sperm straws, oocytes, embryos/zygotes distributed in a foreign
country (export)
Intra EU
Extra EU
N° of sperm straws, oocytes, embryos/zygotes distributed from a foreign
country (import)
Intra EU
Extra EU
AT 2014BE 2014BG 2014 0 0 0 0 0 0 0 0CH 2014CY 2014 22 160 0 0 0 0CZ 2014DE 2014DK 2014EE 2014 NA 132 NA NA NA NA NA NA NAES 2014 NA 3.477 0 0FI 2014 27 NA UK 0 0 UK 0 0FR 2014 134 362 NE NEGR 2014HR 2014HU 2014 15 34 0 0 0 0 0 0IE 2014IS 2014IT 2014LT 2014LU 2014 0 0 0 0 0 0 0 0LV 2014 0 0 0 0 0 0 0 0 0MD 2014 NA NA NA NA NA NA NA NA NAMK 2014MT 2014 NE NE NE NE NE NE NE NE NENL 2014 NA 224 0 0 0 0 0 0 0NO 2014PL 2014PT 2014 NA NA 0 NA 0 0 NA 0RO 2015 4 0 11 0 0 0 0 0 0SE 2014 NE NE NE NESI 2014SK 2014 18 74 4 4 0 1 0 1TR 2014UK 2014 59 219
Page 15 of 37
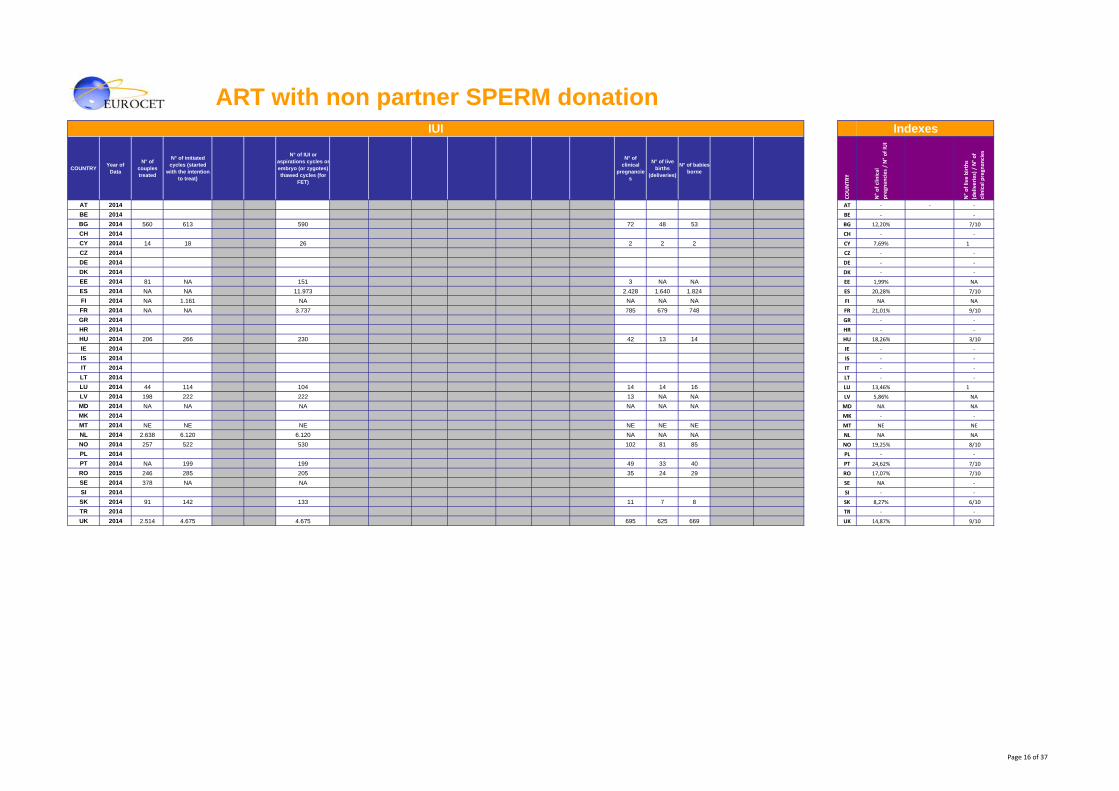
ART with non partner SPERM donationIUI Indexes
COUNTRY Year of Data
N° of couples treated
N° of initiated cycles (started
with the intention to treat)
N° of IUI or aspirations cycles orembryo (or zygotes) thawed cycles (for
FET)
N° of clinical
pregnancies
N° of live births
(deliveries)
N° of babiesborne
COUNTR
Y
N° of clinical
pregnancies / N° of IUI
N° of live births
(deliveries) / N° of
clinical pregnancies
AT 2014 AT ‐ ‐ ‐
BE 2014 BE ‐ ‐
BG 2014 560 613 590 72 48 53 BG 12,20% 7/10
CH 2014 CH ‐ ‐
CY 2014 14 18 26 2 2 2 CY 7,69% 1
CZ 2014 CZ ‐ ‐
DE 2014 DE ‐ ‐
DK 2014 DK ‐ ‐
EE 2014 81 NA 151 3 NA NA EE 1,99% NA
ES 2014 NA NA 11.973 2.428 1.640 1.824 ES 20,28% 7/10
FI 2014 NA 1.161 NA NA NA NA FI NA NA
FR 2014 NA NA 3.737 785 679 748 FR 21,01% 9/10
GR 2014 GR ‐ ‐
HR 2014 HR ‐ ‐
HU 2014 206 266 230 42 13 14 HU 18,26% 3/10
IE 2014 IE ‐ ‐
IS 2014 IS ‐ ‐
IT 2014 IT ‐ ‐
LT 2014 LT ‐ ‐
LU 2014 44 114 104 14 14 16 LU 13,46% 1
LV 2014 198 222 222 13 NA NA LV 5,86% NA
MD 2014 NA NA NA NA NA NA MD NA NA
MK 2014 MK ‐ ‐
MT 2014 NE NE NE NE NE NE MT NE NE
NL 2014 2.638 6.120 6.120 NA NA NA NL NA NA
NO 2014 257 522 530 102 81 85 NO 19,25% 8/10
PL 2014 PL ‐ ‐
PT 2014 NA 199 199 49 33 40 PT 24,62% 7/10
RO 2015 246 285 205 35 24 29 RO 17,07% 7/10
SE 2014 378 NA NA SE NA ‐
SI 2014 SI ‐ ‐
SK 2014 91 142 133 11 7 8 SK 8,27% 6/10
TR 2014 TR ‐ ‐
UK 2014 2.514 4.675 4.675 695 625 669 UK 14,87% 9/10
Page 16 of 37
Total
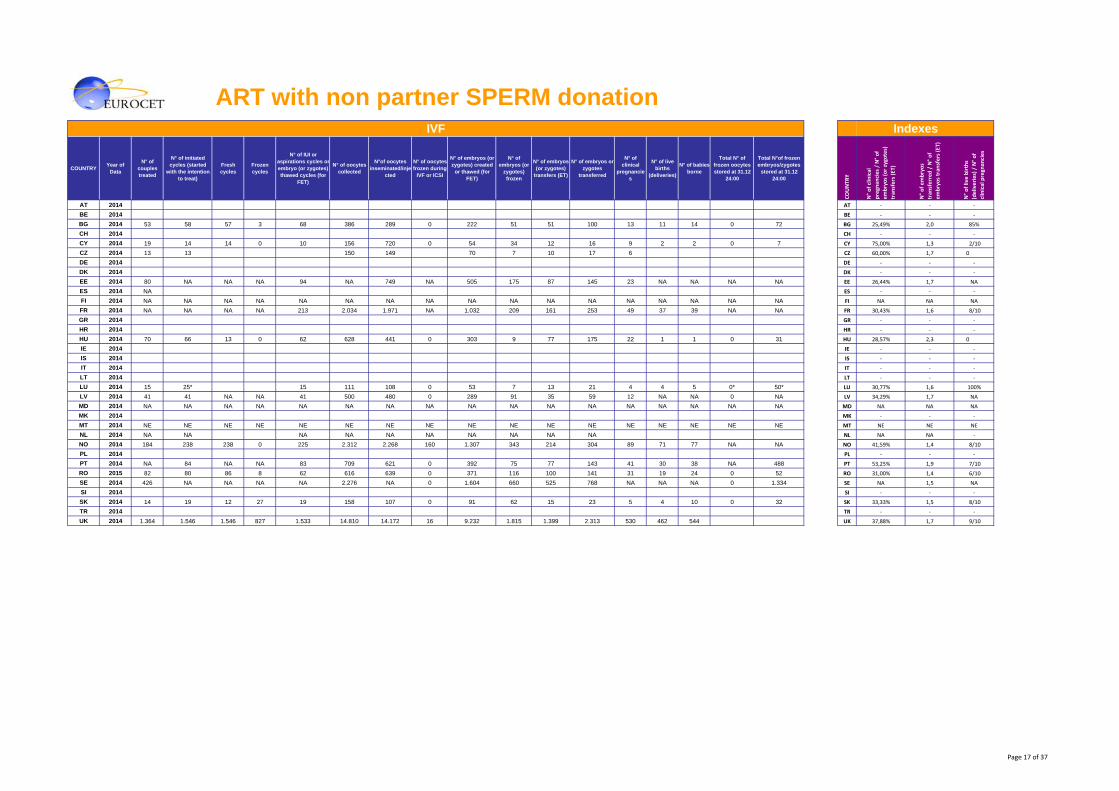
ART with non partner SPERM donationIVF Indexes
COUNTRY Year of Data
N° of couples treated
N° of initiated cycles (started
with the intention to treat)
Fresh cycles
Frozen cycles
N° of IUI or aspirations cycles orembryo (or zygotes) thawed cycles (for
FET)
N° of oocytes collected
N°of oocytes inseminated/inje
cted
N° of oocytes frozen during
IVF or ICSI
N° of embryos (or zygotes) created
or thawed (for FET)
N° of embryos (or
zygotes) frozen
N° of embryos (or zygotes)
transfers (ET)
N° of embryos or zygotes
transferred
N° of clinical
pregnancies
N° of live births
(deliveries)
N° of babiesborne
Total N° of frozen oocytes stored at 31.12
24:00
Total N°of frozen embryos/zygotes
stored at 31.12 24:00
COUNTR
Y
N° of clinical
pregnancies / N° of
embryos (or zygotes)
transfers (ET)
N° of embryos
transferred / N° of
embryos transfers (ET)
N° of live births
(deliveries) / N° of
clinical pregnancies
AT 2014 AT ‐ ‐ ‐
BE 2014 BE ‐ ‐ ‐
BG 2014 53 58 57 3 68 386 289 0 222 51 51 100 13 11 14 0 72 BG 25,49% 2,0 85%
CH 2014 CH ‐ ‐ ‐
CY 2014 19 14 14 0 10 156 720 0 54 34 12 16 9 2 2 0 7 CY 75,00% 1,3 2/10
CZ 2014 13 13 150 149 70 7 10 17 6 CZ 60,00% 1,7 0
DE 2014 DE ‐ ‐ ‐
DK 2014 DK ‐ ‐ ‐
EE 2014 80 NA NA NA 94 NA 749 NA 505 175 87 145 23 NA NA NA NA EE 26,44% 1,7 NA
ES 2014 NA ES ‐ ‐ ‐
FI 2014 NA NA NA NA NA NA NA NA NA NA NA NA NA NA NA NA NA FI NA NA NA
FR 2014 NA NA NA NA 213 2.034 1.971 NA 1.032 209 161 253 49 37 39 NA NA FR 30,43% 1,6 8/10
GR 2014 GR ‐ ‐ ‐
HR 2014 HR ‐ ‐ ‐
HU 2014 70 66 13 0 62 628 441 0 303 9 77 175 22 1 1 0 31 HU 28,57% 2,3 0
IE 2014 IE ‐ ‐ ‐
IS 2014 IS ‐ ‐ ‐
IT 2014 IT ‐ ‐ ‐
LT 2014 LT ‐ ‐ ‐
LU 2014 15 25* 15 111 108 0 53 7 13 21 4 4 5 0* 50* LU 30,77% 1,6 100%
LV 2014 41 41 NA NA 41 500 480 0 289 91 35 59 12 NA NA 0 NA LV 34,29% 1,7 NA
MD 2014 NA NA NA NA NA NA NA NA NA NA NA NA NA NA NA NA NA MD NA NA NA
MK 2014 MK ‐ ‐ ‐
MT 2014 NE NE NE NE NE NE NE NE NE NE NE NE NE NE NE NE NE MT NE NE NE
NL 2014 NA NA NA NA NA NA NA NA NA NA NL NA NA ‐
NO 2014 184 238 238 0 225 2.312 2.268 160 1.307 343 214 304 89 71 77 NA NA NO 41,59% 1,4 8/10
PL 2014 PL ‐ ‐ ‐
PT 2014 NA 84 NA NA 83 709 621 0 392 75 77 143 41 30 38 NA 488 PT 53,25% 1,9 7/10
RO 2015 82 80 86 8 62 616 639 0 371 116 100 141 31 19 24 0 52 RO 31,00% 1,4 6/10
SE 2014 426 NA NA NA NA 2.276 NA 0 1.604 660 525 768 NA NA NA 0 1.334 SE NA 1,5 NA
SI 2014 SI ‐ ‐ ‐
SK 2014 14 19 12 27 19 158 107 0 91 62 15 23 5 4 10 0 32 SK 33,33% 1,5 8/10
TR 2014 TR ‐ ‐ ‐
UK 2014 1.364 1.546 1.546 827 1.533 14.810 14.172 16 9.232 1.815 1.399 2.313 530 462 544 UK 37,88% 1,7 9/10
Page 17 of 37

ART with non partner SPERM donationICSI Indexes Non P
COUNTRY Year of Data
N° of couples treated
N° of initiated cycles (started
with the intention to
treat)
Fresh cycles
Frozen cycles
N° of IUI or aspirations
cycles or embryo (or zygotes)
thawed cycles (for FET)
N° of oocytes
collected
N°of oocytes inseminated/i
njected
N° of oocytes frozen
during IVF or ICSI
N° of embryos (or zygotes) created or thawed (for
FET)
N° of embryos
(or zygotes) frozen
N° of embryos (or
zygotes) transfers
(ET)
N° of embryos or zygotes transferred
N° of clinical
pregnancies
N° of live births
(deliveries)
N° of babies borne
Total N° of frozen
oocytes stored at
31.12 24:00
Total N°of frozen
embryos/zygotes stored at 31.12
24:00
COUNTR
Y
N° of clinical
pregnancies / N° of
embryos (or zygotes)
transfers (ET)
N° of embryos
transferred / N° of
embryos transfers (ET)
N° of live births
(deliveries) / N° of
clinical pregnancies
AT 2014 AT ‐ ‐ ‐
BE 2014 BE ‐ ‐ ‐
BG 2014 317 330 289 39 256 2.005 1.614 68 928 312 223 462 92 73 87 54 263 BG 41,26% 2,1 8/10
CH 2014 CH ‐ ‐ ‐
CY 2014 61 44 34 0 39 395 355 0 103 76 58 85 12 5 2 0 5 CY 20,69% 1,5 4/10
CZ 2014 524 574 5.511 4.347 3.396 1.030 507 817 202 CZ 39,84% 1,6 0
DE 2014 DE ‐ ‐ ‐
DK 2014 DK ‐ ‐ ‐
EE 2014 73 NA NA NA 81 NA 915 NA 506 142 91 168 18 NA NA NA NA EE 19,78% 1,8 NA
ES 2014 8.057 5.947 2.694 1.878 2.268 ES 45,30% 0,0 7/10
FI 2014 NA NA NA NA NA NA NA NA NA NA NA NA NA NA NA NA NA FI NA NA NA
FR 2014 NA NA NA NA 946 8.454 6.297 NA 4.562 994 781 1.345 250 193 225 NA NA FR 32,01% 1,7 8/10
GR 2014 GR ‐ ‐ ‐
HR 2014 HR ‐ ‐ ‐
HU 2014 167 172 79 2 151 1.205 1.021 18 569 114 154 314 49 25 31 0 91 HU 31,82% 2,0 5/10
IE 2014 IE ‐ ‐ ‐
IS 2014 IS ‐ ‐ ‐
IT 2014 IT ‐ ‐ ‐
LT 2014 LT ‐ ‐ ‐
LU 2014 5 25* 6 45 29 0 16 3 4 6 2 2 2 0* 50* LU 50,00% 1,5 100%
LV 2014 72 77 NA NA 76 615 560 0 455 179 70 117 22 NA NA 0 NA LV 31,43% 1,7 NA
MD 2014 NA NA NA NA NA NA NA NA NA NA NA NA NA NA NA NA NA MD NA NA NA
MK 2014 MK ‐ ‐ ‐
MT 2014 NE NE NE NE NE NE NE NE NE NE NE NE NE NE NE NE NE MT NE NE NE
NL 2014 NA NA NA NA NA NA NA NA NA NA NL NA NA ‐
NO 2014 53 69 69 0 67 548 444 22 325 103 56 76 18 18 21 NA NA NO 32,14% 1,4 1
PL 2014 PL ‐ ‐ ‐
PT 2014 NA 63 NA NA 59 663 520 0 371 90 48 86 20 15 19 NA 216 PT 41,67% 1,8 8/10
RO 2015 68 72 77 1 50 671 567 0 351 133 82 143 31 13 17 0 158 RO 37,80% 1,7 4/10
SE 2014 NA SE ‐ ‐ ‐
SI 2014 SI ‐ ‐ ‐
SK 2014 87 132 82 49 128 1.341 919 2 701 345 115 170 37 22 31 2 136 SK 32,17% 1,5 6/10
TR 2014 TR ‐ ‐ ‐
UK 2014 1.021 1.134 1.134 69 1.108 11.637 9.212 7 6.644 1.213 1.015 1.659 351 295 351 UK 34,58% 1,6 8/10
Page 18 of 37
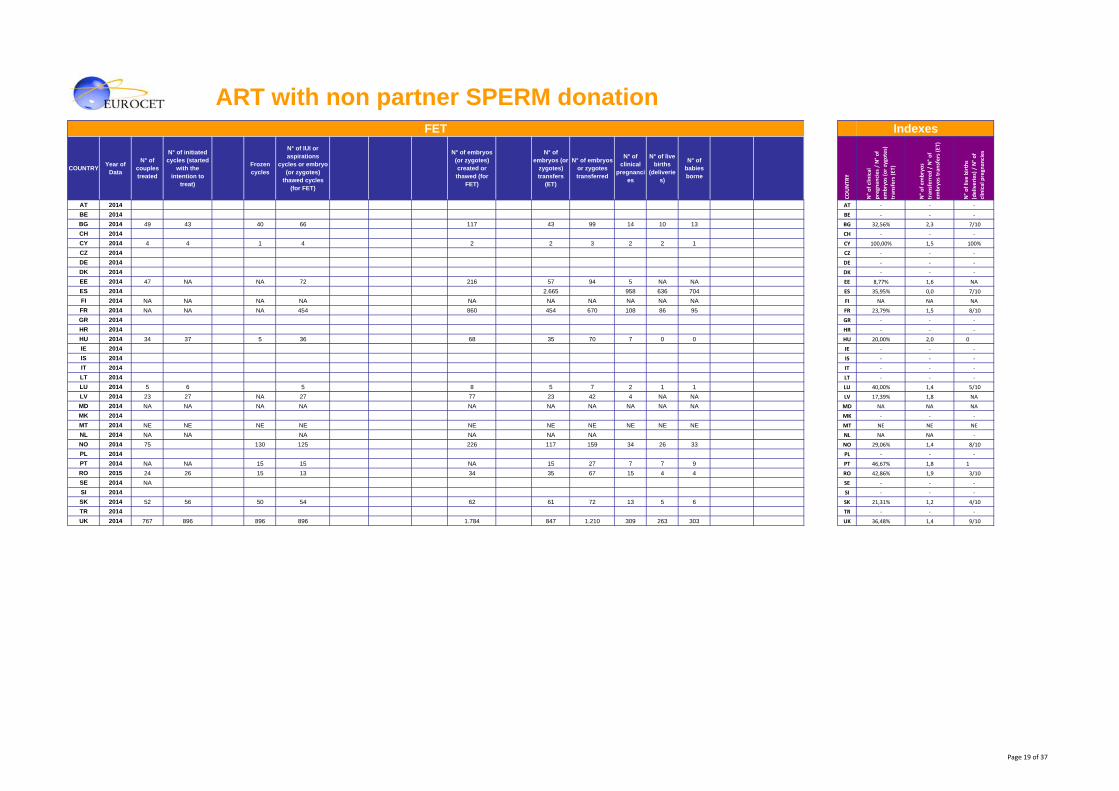
ART with non partner SPERM donationFET Indexes
COUNTRY Year of Data
N° of couples treated
N° of initiated cycles (started
with the intention to
treat)
Frozen cycles
N° of IUI or aspirations
cycles or embryo (or zygotes)
thawed cycles (for FET)
N° of embryos (or zygotes) created or thawed (for
FET)
N° of embryos (or
zygotes) transfers
(ET)
N° of embryos or zygotes transferred
N° of clinical
pregnancies
N° of live births
(deliveries)
N° of babies borne
COUNTR
Y
N° of clinical
pregnancies / N° of
embryos (or zygotes)
transfers (ET)
N° of embryos
transferred / N° of
embryos transfers (ET)
N° of live births
(deliveries) / N° of
clinical pregnancies
AT 2014 AT ‐ ‐ ‐
BE 2014 BE ‐ ‐ ‐
BG 2014 49 43 40 66 117 43 99 14 10 13 BG 32,56% 2,3 7/10
CH 2014 CH ‐ ‐ ‐
CY 2014 4 4 1 4 2 2 3 2 2 1 CY 100,00% 1,5 100%
CZ 2014 CZ ‐ ‐ ‐
DE 2014 DE ‐ ‐ ‐
DK 2014 DK ‐ ‐ ‐
EE 2014 47 NA NA 72 216 57 94 5 NA NA EE 8,77% 1,6 NA
ES 2014 2.665 958 636 704 ES 35,95% 0,0 7/10
FI 2014 NA NA NA NA NA NA NA NA NA NA FI NA NA NA
FR 2014 NA NA NA 454 860 454 670 108 86 95 FR 23,79% 1,5 8/10
GR 2014 GR ‐ ‐ ‐
HR 2014 HR ‐ ‐ ‐
HU 2014 34 37 5 36 68 35 70 7 0 0 HU 20,00% 2,0 0
IE 2014 IE ‐ ‐ ‐
IS 2014 IS ‐ ‐ ‐
IT 2014 IT ‐ ‐ ‐
LT 2014 LT ‐ ‐ ‐
LU 2014 5 6 5 8 5 7 2 1 1 LU 40,00% 1,4 5/10
LV 2014 23 27 NA 27 77 23 42 4 NA NA LV 17,39% 1,8 NA
MD 2014 NA NA NA NA NA NA NA NA NA NA MD NA NA NA
MK 2014 MK ‐ ‐ ‐
MT 2014 NE NE NE NE NE NE NE NE NE NE MT NE NE NE
NL 2014 NA NA NA NA NA NA NL NA NA ‐
NO 2014 75 130 125 226 117 159 34 26 33 NO 29,06% 1,4 8/10
PL 2014 PL ‐ ‐ ‐
PT 2014 NA NA 15 15 NA 15 27 7 7 9 PT 46,67% 1,8 1
RO 2015 24 26 15 13 34 35 67 15 4 4 RO 42,86% 1,9 3/10
SE 2014 NA SE ‐ ‐ ‐
SI 2014 SI ‐ ‐ ‐
SK 2014 52 56 50 54 62 61 72 13 5 6 SK 21,31% 1,2 4/10
TR 2014 TR ‐ ‐ ‐
UK 2014 767 896 896 896 1.784 847 1.210 309 263 303 UK 36,48% 1,4 9/10
Page 19 of 37
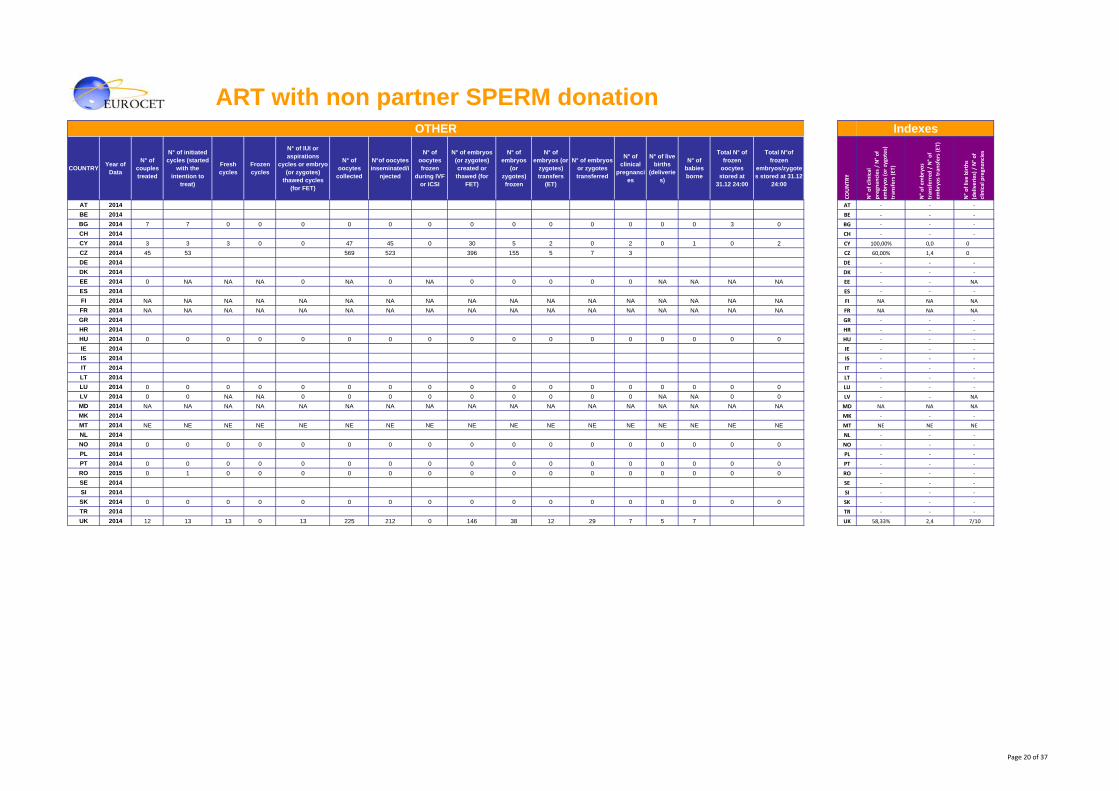
ART with non partner SPERM donationOTHER Indexes
COUNTRY Year of Data
N° of couples treated
N° of initiated cycles (started
with the intention to
treat)
Fresh cycles
Frozen cycles
N° of IUI or aspirations
cycles or embryo (or zygotes)
thawed cycles (for FET)
N° of oocytes
collected
N°of oocytes inseminated/i
njected
N° of oocytes frozen
during IVF or ICSI
N° of embryos (or zygotes) created or thawed (for
FET)
N° of embryos
(or zygotes) frozen
N° of embryos (or
zygotes) transfers
(ET)
N° of embryos or zygotes transferred
N° of clinical
pregnancies
N° of live births
(deliveries)
N° of babies borne
Total N° of frozen
oocytes stored at
31.12 24:00
Total N°of frozen
embryos/zygotes stored at 31.12
24:00
COUNTR
Y
N° of clinical
pregnancies / N° of
embryos (or zygotes)
transfers (ET)
N° of embryos
transferred / N° of
embryos transfers (ET)
N° of live births
(deliveries) / N° of
clinical pregnancies
AT 2014 AT ‐ ‐ ‐
BE 2014 BE ‐ ‐ ‐
BG 2014 7 7 0 0 0 0 0 0 0 0 0 0 0 0 0 3 0 BG ‐ ‐ ‐
CH 2014 CH ‐ ‐ ‐
CY 2014 3 3 3 0 0 47 45 0 30 5 2 0 2 0 1 0 2 CY 100,00% 0,0 0
CZ 2014 45 53 569 523 396 155 5 7 3 CZ 60,00% 1,4 0
DE 2014 DE ‐ ‐ ‐
DK 2014 DK ‐ ‐ ‐
EE 2014 0 NA NA NA 0 NA 0 NA 0 0 0 0 0 NA NA NA NA EE ‐ ‐ NA
ES 2014 ES ‐ ‐ ‐
FI 2014 NA NA NA NA NA NA NA NA NA NA NA NA NA NA NA NA NA FI NA NA NA
FR 2014 NA NA NA NA NA NA NA NA NA NA NA NA NA NA NA NA NA FR NA NA NA
GR 2014 GR ‐ ‐ ‐
HR 2014 HR ‐ ‐ ‐
HU 2014 0 0 0 0 0 0 0 0 0 0 0 0 0 0 0 0 0 HU ‐ ‐ ‐
IE 2014 IE ‐ ‐ ‐
IS 2014 IS ‐ ‐ ‐
IT 2014 IT ‐ ‐ ‐
LT 2014 LT ‐ ‐ ‐
LU 2014 0 0 0 0 0 0 0 0 0 0 0 0 0 0 0 0 0 LU ‐ ‐ ‐
LV 2014 0 0 NA NA 0 0 0 0 0 0 0 0 0 NA NA 0 0 LV ‐ ‐ NA
MD 2014 NA NA NA NA NA NA NA NA NA NA NA NA NA NA NA NA NA MD NA NA NA
MK 2014 MK ‐ ‐ ‐
MT 2014 NE NE NE NE NE NE NE NE NE NE NE NE NE NE NE NE NE MT NE NE NE
NL 2014 NL ‐ ‐ ‐
NO 2014 0 0 0 0 0 0 0 0 0 0 0 0 0 0 0 0 0 NO ‐ ‐ ‐
PL 2014 PL ‐ ‐ ‐
PT 2014 0 0 0 0 0 0 0 0 0 0 0 0 0 0 0 0 0 PT ‐ ‐ ‐
RO 2015 0 1 0 0 0 0 0 0 0 0 0 0 0 0 0 0 0 RO ‐ ‐ ‐
SE 2014 SE ‐ ‐ ‐
SI 2014 SI ‐ ‐ ‐
SK 2014 0 0 0 0 0 0 0 0 0 0 0 0 0 0 0 0 0 SK ‐ ‐ ‐
TR 2014 TR ‐ ‐ ‐
UK 2014 12 13 13 0 13 225 212 0 146 38 12 29 7 5 7 UK 58,33% 2,4 7/10
Page 20 of 37

ART with non partner SPERM donation, IUI ‐ Year 2014
12,20%
1,99%
21,01%
13,46%
17,07%
14,87%
7,69%
20,28%
18,26%
5,86%
19,25%
24,62%
8,27%
0,0%
10,0%
20,0%
30,0%
40,0%
50,0%
60,0%
70,0%
80,0%
90,0%
100,0%
AT
BE
BG
CH CY CZ
DE
DK EE ES FI FR GR
HR
HU IE IS IT LT LU LV MD
MK
MT
NL
NO PL
PT
RO SE SI SK TR UK
N° of clinical pregnancies / N° of IUI
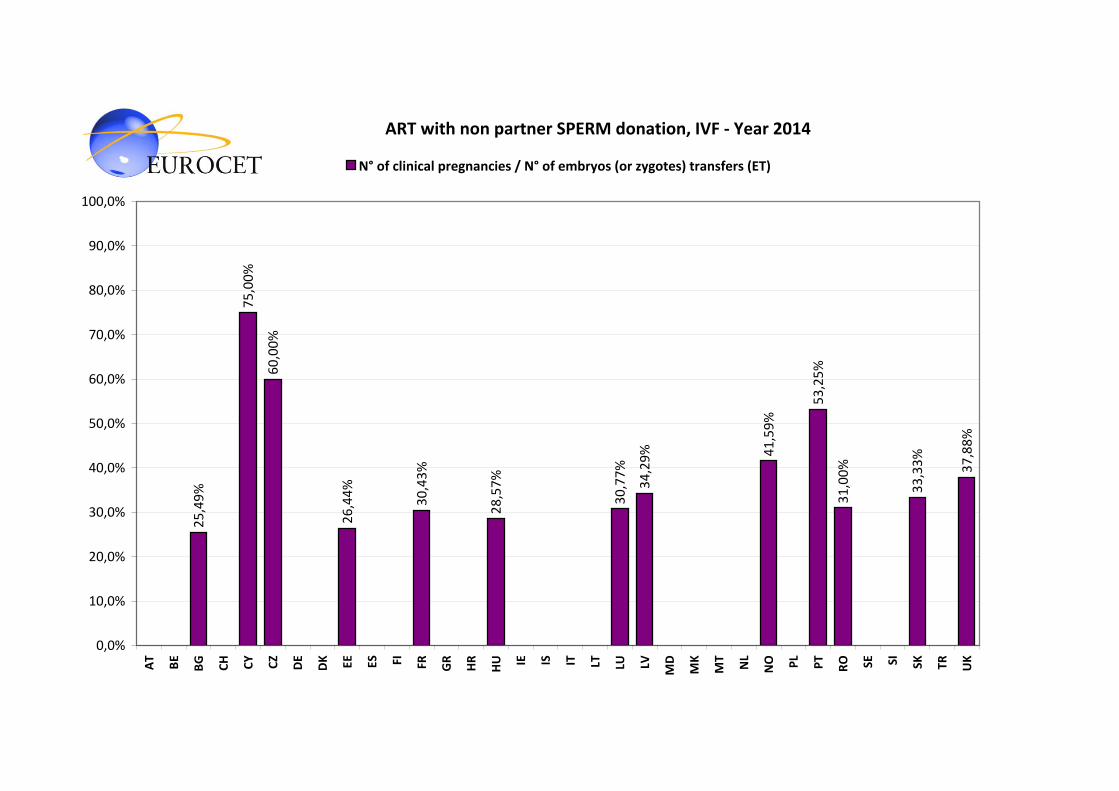
ART with non partner SPERM donation, IVF ‐ Year 2014
25,49%
75,00%
60,00%
26,44%
30,43%
28,57%
30,77%
31,00% 37,88%
34,29% 41,59%
53,25%
33,33%
0,0%
10,0%
20,0%
30,0%
40,0%
50,0%
60,0%
70,0%
80,0%
90,0%
100,0%
AT
BE
BG
CH CY CZ
DE
DK EE ES FI FR GR
HR
HU IE IS IT LT LU LV MD
MK
MT
NL
NO PL
PT
RO SE SI SK TR UK
N° of clinical pregnancies / N° of embryos (or zygotes) transfers (ET)
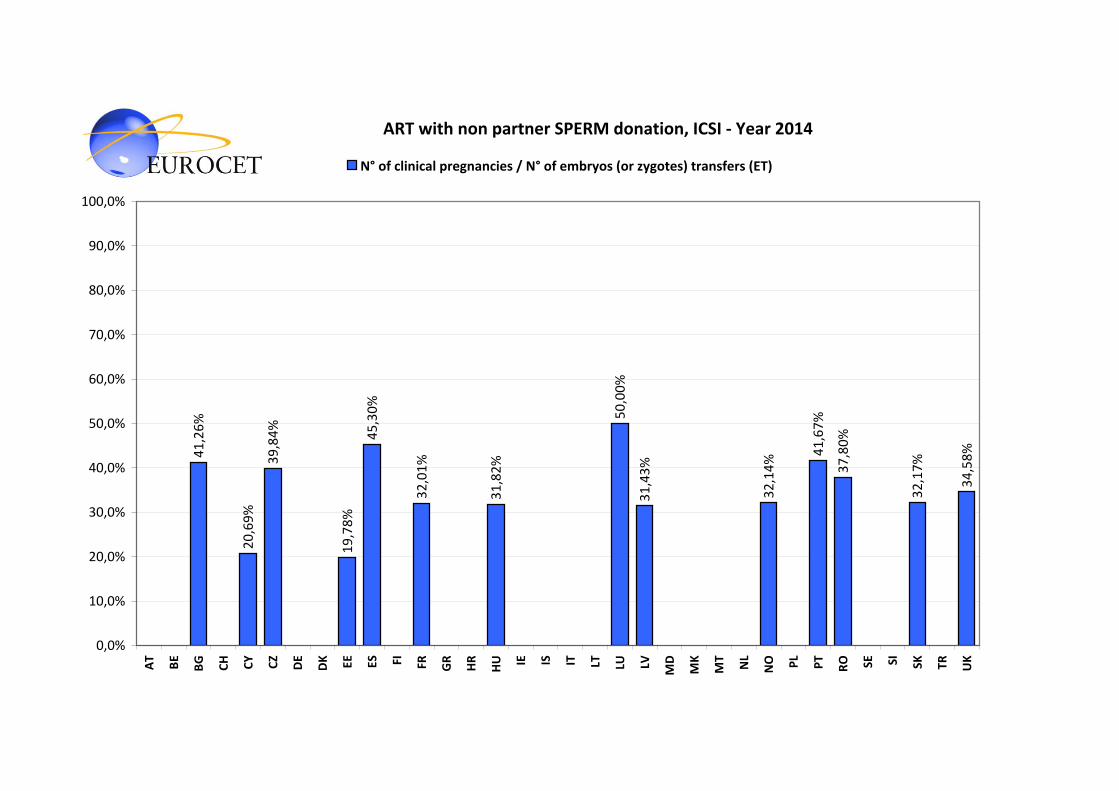
ART with non partner SPERM donation, ICSI ‐ Year 2014
41,26%
20,69%
39,84%
19,78%
32,01%
31,82%
50,00%
37,80%
34,58%
45,30%
31,43%
32,14%
41,67%
32,17%
0,0%
10,0%
20,0%
30,0%
40,0%
50,0%
60,0%
70,0%
80,0%
90,0%
100,0%
AT
BE
BG
CH CY CZ
DE
DK EE ES FI FR GR
HR
HU IE IS IT LT LU LV MD
MK
MT
NL
NO PL
PT
RO SE SI SK TR UK
N° of clinical pregnancies / N° of embryos (or zygotes) transfers (ET)
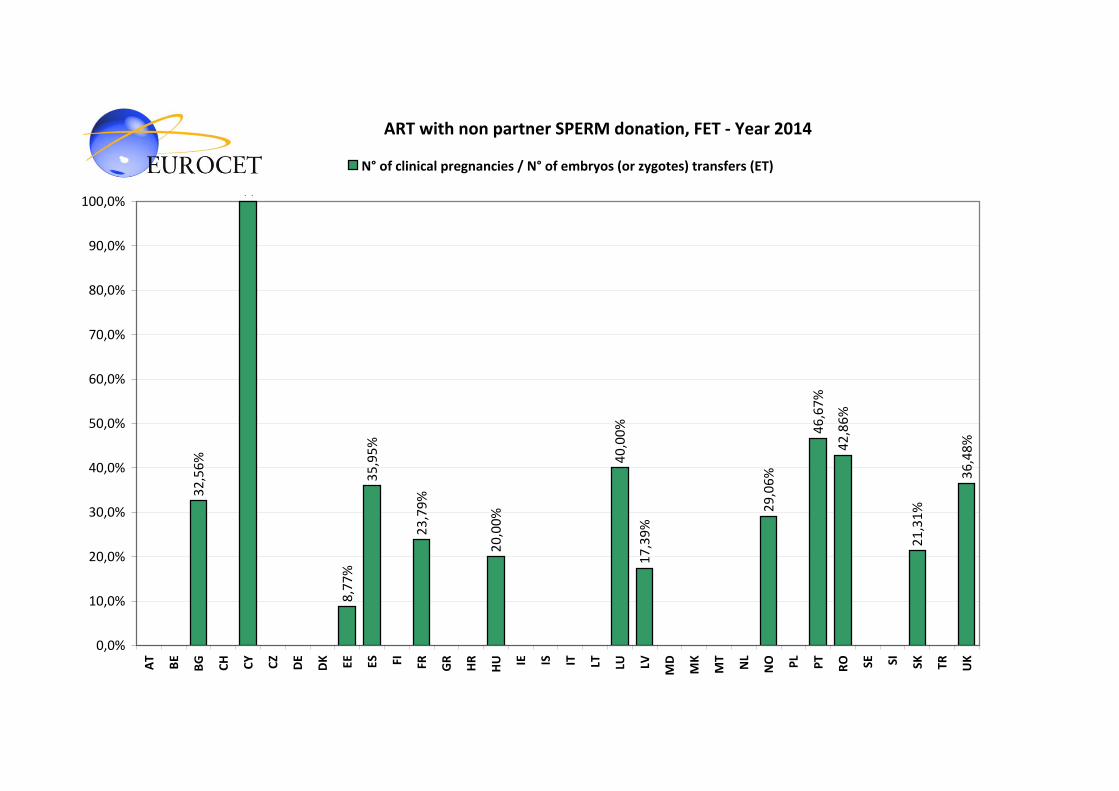
ART with non partner SPERM donation, FET ‐ Year 2014
32,56%
100,00%
8,77%
23,79%
40,00%
42,86%
36,48%
35,95%
20,00%
17,39%
29,06%
46,67%
21,31%
0,0%
10,0%
20,0%
30,0%
40,0%
50,0%
60,0%
70,0%
80,0%
90,0%
100,0%
AT
BE
BG
CH CY CZ
DE
DK EE ES FI FR GR
HR
HU IE IS IT LT LU LV MD
MK
MT
NL
NO PL
PT
RO SE SI SK TR UK
N° of clinical pregnancies / N° of embryos (or zygotes) transfers (ET)

ART with non partner OOCYTE donationIVF Indexes
COUNTRY Year of Data
N° of Cycles IVF or ICSI or FET for
recipients
N° total of oocytes
allocated
N° of oocytes mixed/injected
N° of embryos or zygotes created o
thawed (FET)
N° of embryos/zygotes
frozen
N° of embryos or zygotes transfers
(ET)
N°of embryos or zygotes
transferred
N° of clinical pregnancies
N° of live births
(deliveries)
N° of babies borne
Total N°of frozen embryos/zygotes
stored at 31.12 24:00
COUNTR
Y
N° of clinical
pregnan
cies / N° of
embryos (or zygotes)
tran
sfers (ET)
N° of embryos
tran
sferred / N° of
embryos tran
sfers (ET)
N° of live births
(deliveries) / N° of
clinical pregnan
cies
AT 2014 AT ‐ ‐ ‐
BE 2014 BE ‐ ‐ ‐
BG 2014 54 392 304 197 69 39 96 12 9 10 46 BG 30,77% 2,5 8/10
CH 2014 CH ‐ ‐ ‐
CY 2014 79 304 294 220 94 31 61 16 2 4 12 CY 51,61% 2,0 1/10
CZ 2014 16 192 188 135 45 13 19 7 CZ 53,85% 1,5 0
DE 2014 DE ‐ ‐ ‐
DK 2014 DK ‐ ‐ ‐
EE 2014 44 NA 541 371 127 41 71 21 NA NA NA EE 51,22% 1,7 NA
ES 2014 ES ‐ ‐ ‐
FI 2014 NA NA NA NA NA NA NA NA NA NA NA FI NA NA NA
FR 2014 79 435 430 287 64 67 117 19 15 19 NA FR 28,36% 1,7 8/10
GR 2014 GR ‐ ‐ ‐
HR 2014 HR ‐ ‐ ‐
HU 2014 9 112 75 49 9 10 25 7 6 6 9 HU 70,00% 2,5 9/10
IE 2014 IE ‐ ‐ ‐
IS 2014 IS ‐ ‐ ‐
IT 2014 IT ‐ ‐ ‐
LT 2014 LT ‐ ‐ ‐
LU 2014 0 0 0 0 0 0 0 0 0 0 0 LU ‐ ‐ ‐
LV 2014 23 443 443 237 80 21 39 7 NA NA NA LV 33,33% 1,9 NA
MD 2014 NA NA NA NA NA NA NA NA NA NA NA MD NA NA NA
MK 2014 MK ‐ ‐ ‐
MT 2014 NE NE NE NE NE NE NE NE NE NE NE MT NE NE NE
NL 2014 NL ‐ ‐ ‐
NO 2014 NO ‐ ‐ ‐
PL 2014 PL ‐ ‐ ‐
PT 2014 122 NA 1.318 930 291 103 190 100 41 60 980 PT 97,09% 1,8 4/10
RO 2015 31 416 355 264 114 26 59 17 9 14 101 RO 65,38% 2,3 5/10
SE 2014 495 185 203 251 561 SE 0,00% 1,2 ‐
SI 2014 SI ‐ ‐ ‐
SK 2014 12 98 68 0 42 12 12 4 0 0 18 SK 33,33% 1,0 0
TR 2014 TR ‐ ‐ ‐
UK 2014 791 7.992 5.267 1.526 725 1.045 339 304 346 UK 46,76% 1,4 9/10
Page 25 of 37

ART with non partner OOCYTE donationICSI Indexes
COUNTRY Year of Data
N° of Cycles IVF or ICSI or FET for
recipients
N° total of oocytes
allocated
N° of oocytes mixed/injected
N° of embryos or zygotes created o
thawed (FET)
N° of embryos/zygotes
frozen
N° of embryos or zygotes transfers
(ET)
N°of embryos or zygotes
transferred
N° of clinical pregnancies
N° of live births
(deliveries)
N° of babies borne
Total N°of frozen embryos/zygotes
stored at 31.12 24:00
COUNTR
Y
N° of clinical
pregnan
cies / N° of
embryos (or zygotes)
tran
sfers (ET)
N° of embryos
tran
sferred / N° of
embryos tran
sfers (ET)
N° of live births
(deliveries) / N° of
clinical pregnan
cies
AT 2014 AT ‐ ‐ ‐
BE 2014 BE ‐ ‐ ‐
BG 2014 417 4.495 3.514 2.411 1.114 289 646 159 126 160 882 BG 55,02% 2,2 8/10
CH 2014 CH ‐ ‐ ‐
CY 2014 176 1.557 1.239 621 336 127 151 43 29 32 323 CY 33,86% 1,2 7/10
CZ 2014 5.409 54.836 49.264 41.462 12.956 4.782 8.715 2.230 CZ 46,63% 1,8 0
DE 2014 DE ‐ ‐ ‐
DK 2014 DK ‐ ‐ ‐
EE 2014 47 NA 667 349 121 42 73 17 NA NA NA EE 40,48% 1,7 NA
ES 2014 22.477 259.721 197.301 144.525 50.891 18.455 33.156 10.020 6.863 8.624 ES 54,29% 1,8 7/10
FI 2014 NA NA NA NA NA NA NA NA NA NA NA FI NA NA NA
FR 2014 882 3.990 3.482 2.507 617 700 1.156 188 153 185 NA FR 26,86% 1,7 8/10
GR 2014 GR ‐ ‐ ‐
HR 2014 HR ‐ ‐ ‐
HU 2014 36 268 208 148 64 35 59 12 1 1 123 HU 34,29% 1,7 1/10
IE 2014 IE ‐ ‐ ‐
IS 2014 IS ‐ ‐ ‐
IT 2014 IT ‐ ‐ ‐
LT 2014 LT ‐ ‐ ‐
LU 2014 0 0 0 0 0 0 0 0 0 0 0 LU ‐ ‐ ‐
LV 2014 418 5.898 5.372 4.391 2.390 411 689 185 NA NA NA LV 45,01% 1,7 NA
MD 2014 NA NA NA NA NA NA NA NA NA NA NA MD NA NA NA
MK 2014 MK ‐ ‐ ‐
MT 2014 NE NE NE NE NE NE NE NE NE NE NE MT NE NE NE
NL 2014 NL ‐ ‐ ‐
NO 2014 NO ‐ ‐ ‐
PL 2014 PL ‐ ‐ ‐
PT 2014 364 NA 3.613 2.428 746 292 530 144 107 141 2.955 PT 49,32% 1,8 7/10
RO 2015 22 252 179 146 70 15 39 5 3 3 134 RO 33,33% 2,6 6/10
SE 2014 SE ‐ ‐ ‐
SI 2014 SI ‐ ‐ ‐
SK 2014 116 1.161 440 671 294 115 188 42 10 13 98 SK 36,52% 1,6 2/10
TR 2014 TR ‐ ‐ ‐
UK 2014 1.076 8.573 6.341 1.349 996 1.534 435 374 463 UK 43,67% 1,5 9/10
Page 26 of 37
ART with non partner OOCYTE donationFET Indexes
COUNTRY Year of Data
N° of Cycles IVF or ICSI or FET for
recipients
N° of embryos or zygotes created o
thawed (FET)
N° of embryos or zygotes transfers
(ET)
N°of embryos or zygotes
transferred
N° of clinical pregnancies
N° of live births
(deliveries)
N° of babies borne
COUNTR
Y
N° of clinical
pregnan
cies / N° of
embryos (or zygotes)
tran
sfers (ET)
N° of embryos
tran
sferred / N° of
embryos tran
sfers (ET)
N° of live births
(deliveries) / N° of
clinical pregnan
cies
AT 2014 AT ‐ ‐ ‐
BE 2014 BE ‐ ‐ ‐
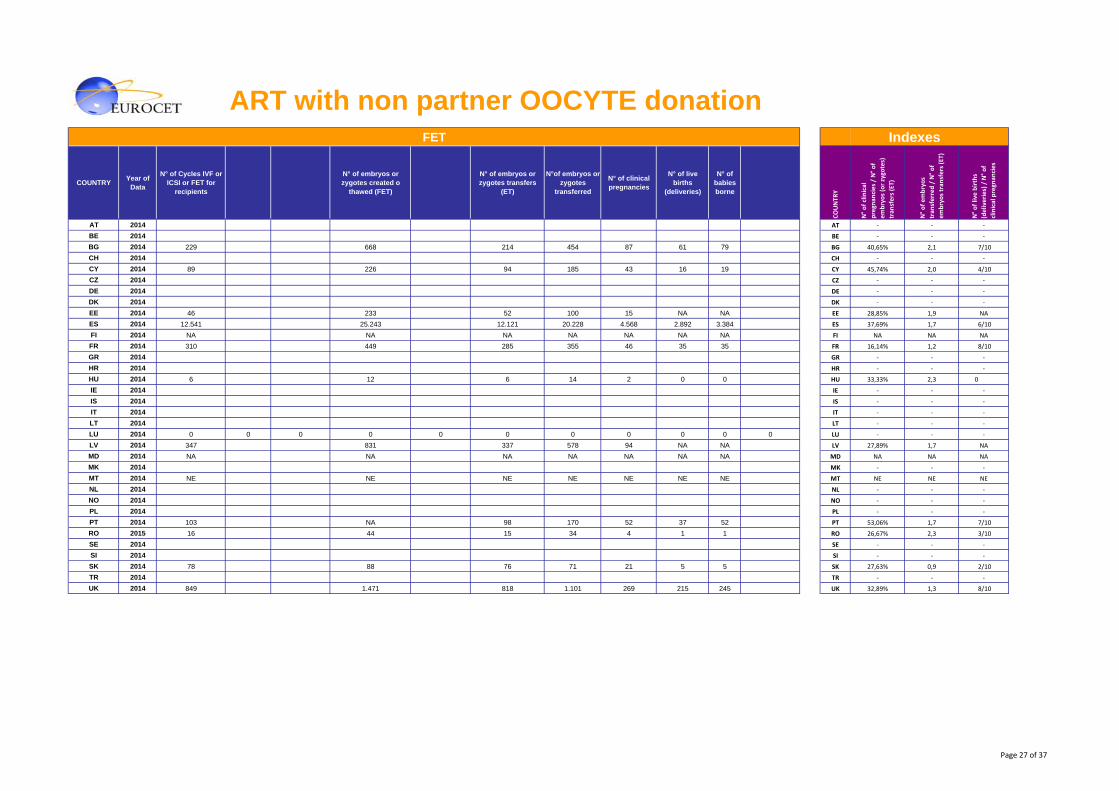
BG 2014 229 668 214 454 87 61 79 BG 40,65% 2,1 7/10
CH 2014 CH ‐ ‐ ‐
CY 2014 89 226 94 185 43 16 19 CY 45,74% 2,0 4/10
CZ 2014 CZ ‐ ‐ ‐
DE 2014 DE ‐ ‐ ‐
DK 2014 DK ‐ ‐ ‐
EE 2014 46 233 52 100 15 NA NA EE 28,85% 1,9 NA
ES 2014 12.541 25.243 12.121 20.228 4.568 2.892 3.384 ES 37,69% 1,7 6/10
FI 2014 NA NA NA NA NA NA NA FI NA NA NA
FR 2014 310 449 285 355 46 35 35 FR 16,14% 1,2 8/10
GR 2014 GR ‐ ‐ ‐
HR 2014 HR ‐ ‐ ‐
HU 2014 6 12 6 14 2 0 0 HU 33,33% 2,3 0
IE 2014 IE ‐ ‐ ‐
IS 2014 IS ‐ ‐ ‐
IT 2014 IT ‐ ‐ ‐
LT 2014 LT ‐ ‐ ‐
LU 2014 0 0 0 0 0 0 0 0 0 0 0 LU ‐ ‐ ‐
LV 2014 347 831 337 578 94 NA NA LV 27,89% 1,7 NA
MD 2014 NA NA NA NA NA NA NA MD NA NA NA
MK 2014 MK ‐ ‐ ‐
MT 2014 NE NE NE NE NE NE NE MT NE NE NE
NL 2014 NL ‐ ‐ ‐
NO 2014 NO ‐ ‐ ‐
PL 2014 PL ‐ ‐ ‐
PT 2014 103 NA 98 170 52 37 52 PT 53,06% 1,7 7/10
RO 2015 16 44 15 34 4 1 1 RO 26,67% 2,3 3/10
SE 2014 SE ‐ ‐ ‐
SI 2014 SI ‐ ‐ ‐
SK 2014 78 88 76 71 21 5 5 SK 27,63% 0,9 2/10
TR 2014 TR ‐ ‐ ‐
UK 2014 849 1.471 818 1.101 269 215 245 UK 32,89% 1,3 8/10
Page 27 of 37
ART with non partner OOCYTE donationOTHER Indexes
COUNTRY Year of Data
N° of Cycles IVF or ICSI or FET for
recipients
N° total of oocytes
allocated
N° of oocytes mixed/injected
N° of embryos or zygotes created o
thawed (FET)
N° of embryos/zygotes
frozen
N° of embryos or zygotes transfers
(ET)
N°of embryos or zygotes
transferred
N° of clinical pregnancies
N° of live births
(deliveries)
N° of babies borne
Total N°of frozen embryos/zygotes
stored at 31.12 24:00
COUNTR
Y
N° of clinical
pregnan
cies / N° of
embryos (or zygotes)
tran
sfers (ET)
N° of embryos
tran
sferred / N° of
embryos tran
sfers (ET)
N° of live births
(deliveries) / N° of
clinical pregnan
cies
AT 2014 AT ‐ ‐ ‐
BE 2014 BE ‐ ‐ ‐
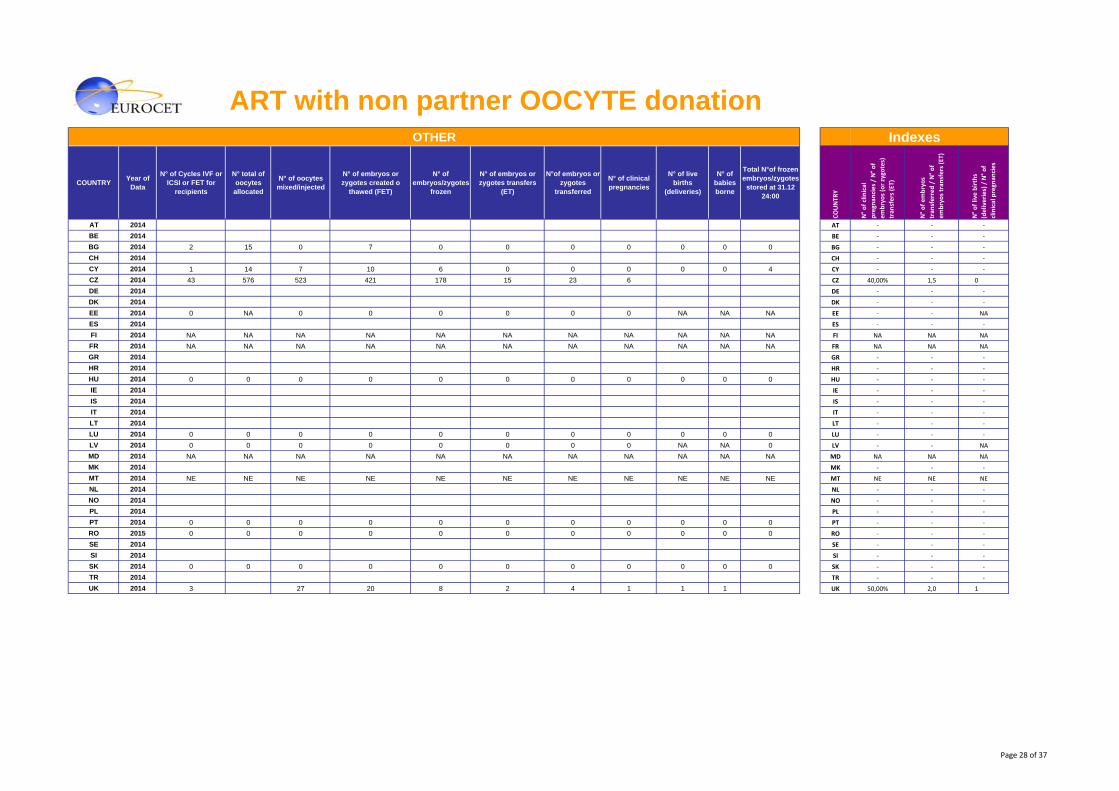
BG 2014 2 15 0 7 0 0 0 0 0 0 0 BG ‐ ‐ ‐
CH 2014 CH ‐ ‐ ‐
CY 2014 1 14 7 10 6 0 0 0 0 0 4 CY ‐ ‐ ‐
CZ 2014 43 576 523 421 178 15 23 6 CZ 40,00% 1,5 0
DE 2014 DE ‐ ‐ ‐
DK 2014 DK ‐ ‐ ‐
EE 2014 0 NA 0 0 0 0 0 0 NA NA NA EE ‐ ‐ NA
ES 2014 ES ‐ ‐ ‐
FI 2014 NA NA NA NA NA NA NA NA NA NA NA FI NA NA NA
FR 2014 NA NA NA NA NA NA NA NA NA NA NA FR NA NA NA
GR 2014 GR ‐ ‐ ‐
HR 2014 HR ‐ ‐ ‐
HU 2014 0 0 0 0 0 0 0 0 0 0 0 HU ‐ ‐ ‐
IE 2014 IE ‐ ‐ ‐
IS 2014 IS ‐ ‐ ‐
IT 2014 IT ‐ ‐ ‐
LT 2014 LT ‐ ‐ ‐
LU 2014 0 0 0 0 0 0 0 0 0 0 0 LU ‐ ‐ ‐
LV 2014 0 0 0 0 0 0 0 0 NA NA 0 LV ‐ ‐ NA
MD 2014 NA NA NA NA NA NA NA NA NA NA NA MD NA NA NA
MK 2014 MK ‐ ‐ ‐
MT 2014 NE NE NE NE NE NE NE NE NE NE NE MT NE NE NE
NL 2014 NL ‐ ‐ ‐
NO 2014 NO ‐ ‐ ‐
PL 2014 PL ‐ ‐ ‐
PT 2014 0 0 0 0 0 0 0 0 0 0 0 PT ‐ ‐ ‐
RO 2015 0 0 0 0 0 0 0 0 0 0 0 RO ‐ ‐ ‐
SE 2014 SE ‐ ‐ ‐
SI 2014 SI ‐ ‐ ‐
SK 2014 0 0 0 0 0 0 0 0 0 0 0 SK ‐ ‐ ‐
TR 2014 TR ‐ ‐ ‐
UK 2014 3 27 20 8 2 4 1 1 1 UK 50,00% 2,0 1
Page 28 of 37
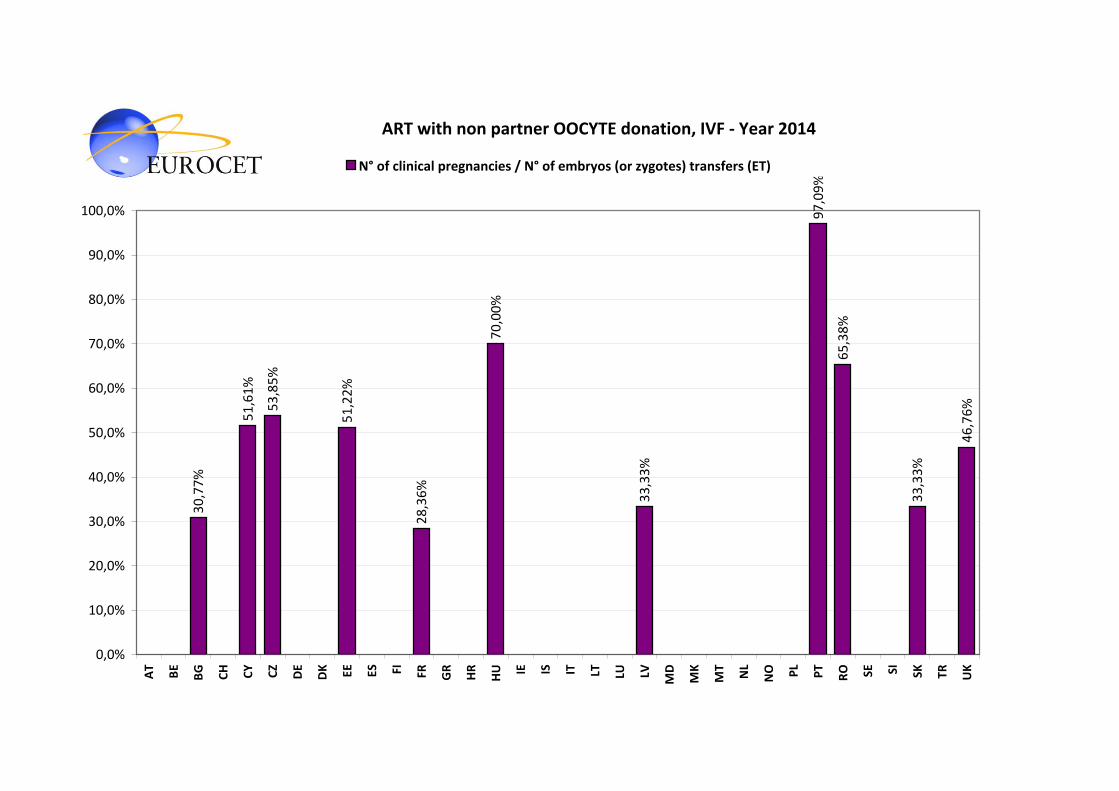
ART with non partner OOCYTE donation, IVF ‐ Year 2014
30,77%
51,61%
53,85%
51,22%
28,36%
97,09%
65,38%
46,76%
70,00%
33,33%
33,33%
0,0%
10,0%
20,0%
30,0%
40,0%
50,0%
60,0%
70,0%
80,0%
90,0%
100,0%
AT
BE
BG
CH CY CZ
DE
DK EE ES FI FR GR
HR
HU IE IS IT LT LU LV MD
MK
MT
NL
NO PL
PT
RO SE SI SK TR UK
N° of clinical pregnancies / N° of embryos (or zygotes) transfers (ET)
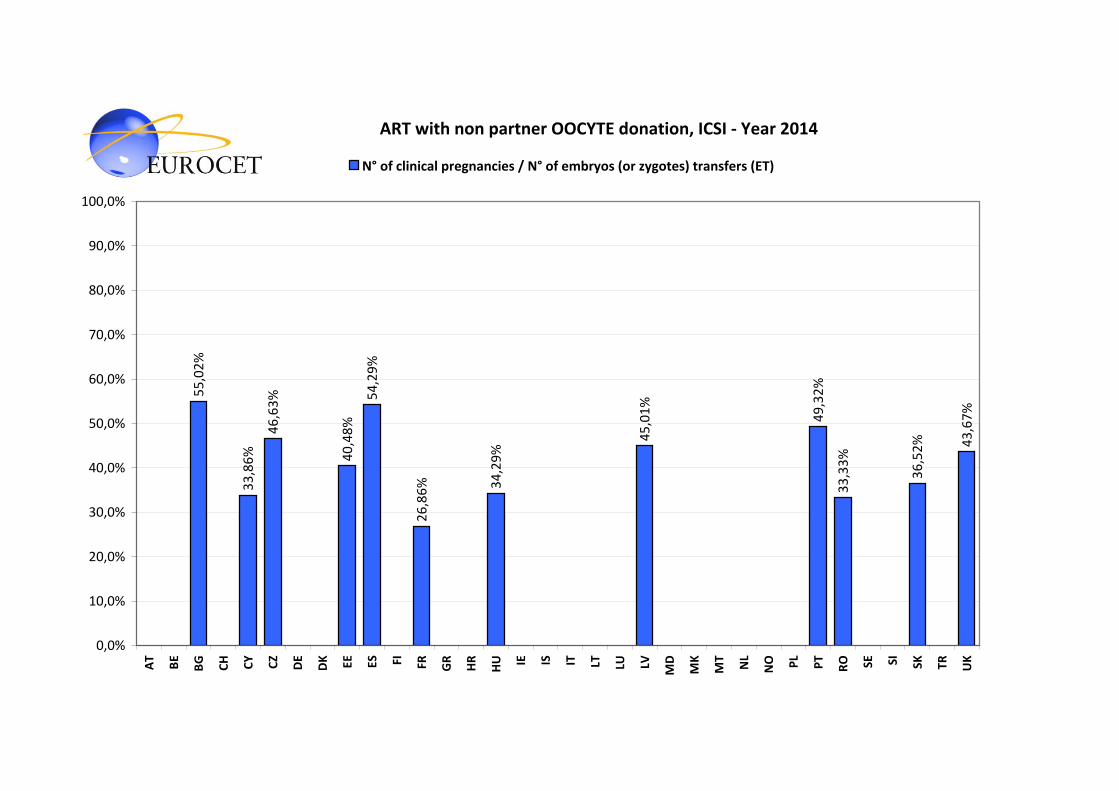
ART with non partner OOCYTE donation, ICSI ‐ Year 2014
55,02%
33,86%
46,63%
40,48%
54,29%
26,86% 34,29%
45,01%
49,32%
33,33%
36,52% 43,67%
0,0%
10,0%
20,0%
30,0%
40,0%
50,0%
60,0%
70,0%
80,0%
90,0%
100,0%
AT
BE
BG
CH CY CZ
DE
DK EE ES FI FR GR
HR
HU IE IS IT LT LU LV MD
MK
MT
NL
NO PL
PT
RO SE SI SK TR UK
N° of clinical pregnancies / N° of embryos (or zygotes) transfers (ET)
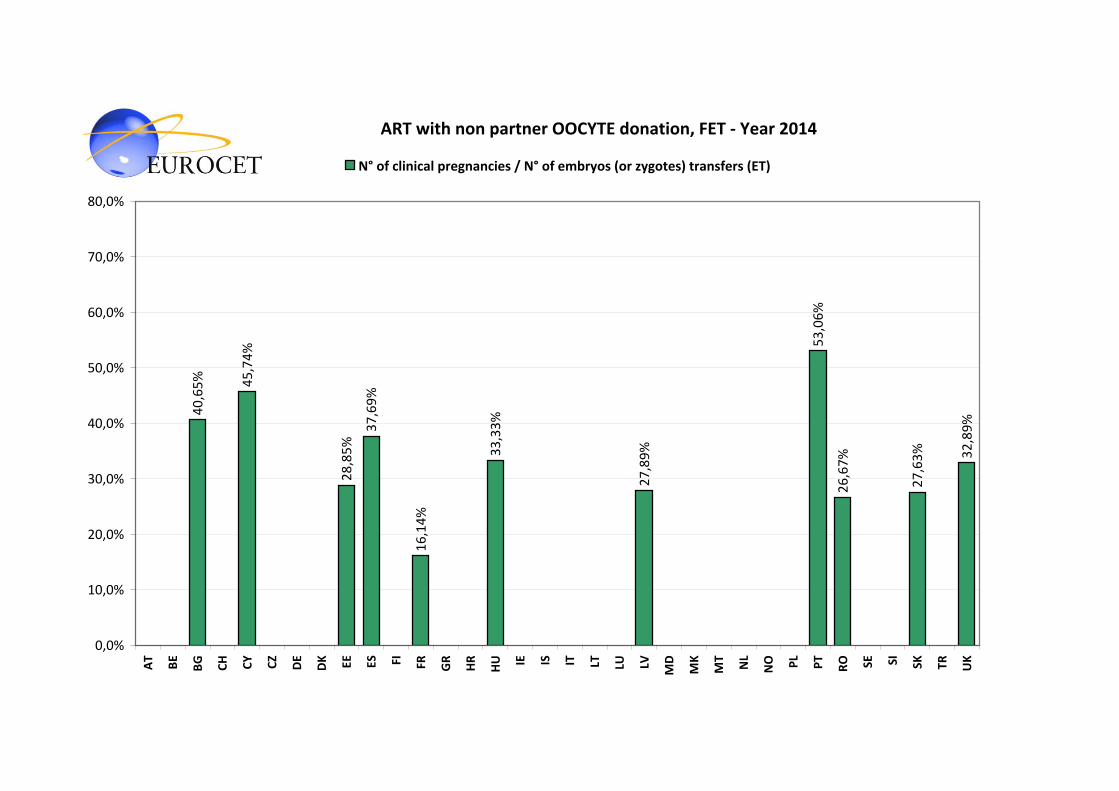
ART with non partner OOCYTE donation, FET ‐ Year 2014
40,65% 45,74%
28,85%
16,14%
26,67% 32,89%37,69%
33,33%
27,89%
53,06%
27,63%
0,0%
10,0%
20,0%
30,0%
40,0%
50,0%
60,0%
70,0%
80,0%
AT
BE
BG
CH CY CZ
DE
DK EE ES FI FR GR
HR
HU IE IS IT LT LU LV MD
MK
MT
NL
NO PL
PT
RO SE SI SK TR UK
N° of clinical pregnancies / N° of embryos (or zygotes) transfers (ET)
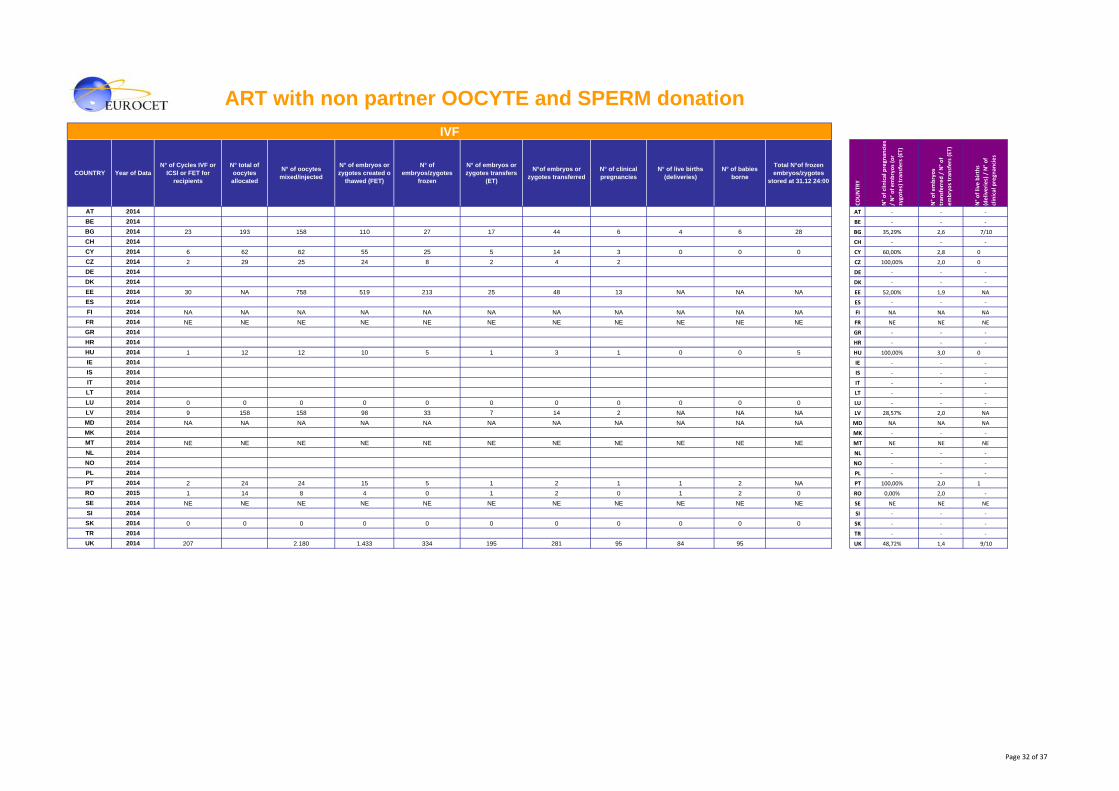
ART with non partner OOCYTE and SPERM donationIVF
COUNTRY Year of DataN° of Cycles IVF or
ICSI or FET for recipients
N° total of oocytes
allocated
N° of oocytes mixed/injected
N° of embryos or zygotes created o
thawed (FET)
N° of embryos/zygotes
frozen
N° of embryos or zygotes transfers
(ET)
N°of embryos or zygotes transferred
N° of clinical pregnancies
N° of live births (deliveries)
N° of babiesborne
Total N°of frozen embryos/zygotes
stored at 31.12 24:00
COUNTR
Y
N° of clinical pregn
ancies
/ N° of embryos (or
zygo
tes) transfers (ET)
N° of embryos
tran
sferred / N° of
embryos tran
sfers (ET)
N° of live births
(deliveries) / N° of
clinical pregn
ancies
AT 2014 AT ‐ ‐ ‐
BE 2014 BE ‐ ‐ ‐
BG 2014 23 193 158 110 27 17 44 6 4 6 28 BG 35,29% 2,6 7/10
CH 2014 CH ‐ ‐ ‐
CY 2014 6 62 62 55 25 5 14 3 0 0 0 CY 60,00% 2,8 0
CZ 2014 2 29 25 24 8 2 4 2 CZ 100,00% 2,0 0
DE 2014 DE ‐ ‐ ‐
DK 2014 DK ‐ ‐ ‐
EE 2014 30 NA 758 519 213 25 48 13 NA NA NA EE 52,00% 1,9 NA
ES 2014 ES ‐ ‐ ‐
FI 2014 NA NA NA NA NA NA NA NA NA NA NA FI NA NA NA
FR 2014 NE NE NE NE NE NE NE NE NE NE NE FR NE NE NE
GR 2014 GR ‐ ‐ ‐
HR 2014 HR ‐ ‐ ‐
HU 2014 1 12 12 10 5 1 3 1 0 0 5 HU 100,00% 3,0 0
IE 2014 IE ‐ ‐ ‐
IS 2014 IS ‐ ‐ ‐
IT 2014 IT ‐ ‐ ‐
LT 2014 LT ‐ ‐ ‐
LU 2014 0 0 0 0 0 0 0 0 0 0 0 LU ‐ ‐ ‐
LV 2014 9 158 158 98 33 7 14 2 NA NA NA LV 28,57% 2,0 NA
MD 2014 NA NA NA NA NA NA NA NA NA NA NA MD NA NA NA
MK 2014 MK ‐ ‐ ‐
MT 2014 NE NE NE NE NE NE NE NE NE NE NE MT NE NE NE
NL 2014 NL ‐ ‐ ‐
NO 2014 NO ‐ ‐ ‐
PL 2014 PL ‐ ‐ ‐
PT 2014 2 24 24 15 5 1 2 1 1 2 NA PT 100,00% 2,0 1
RO 2015 1 14 8 4 0 1 2 0 1 2 0 RO 0,00% 2,0 ‐
SE 2014 NE NE NE NE NE NE NE NE NE NE NE SE NE NE NE
SI 2014 SI ‐ ‐ ‐
SK 2014 0 0 0 0 0 0 0 0 0 0 0 SK ‐ ‐ ‐
TR 2014 TR ‐ ‐ ‐
UK 2014 207 2.180 1.433 334 195 281 95 84 95 UK 48,72% 1,4 9/10
Page 32 of 37
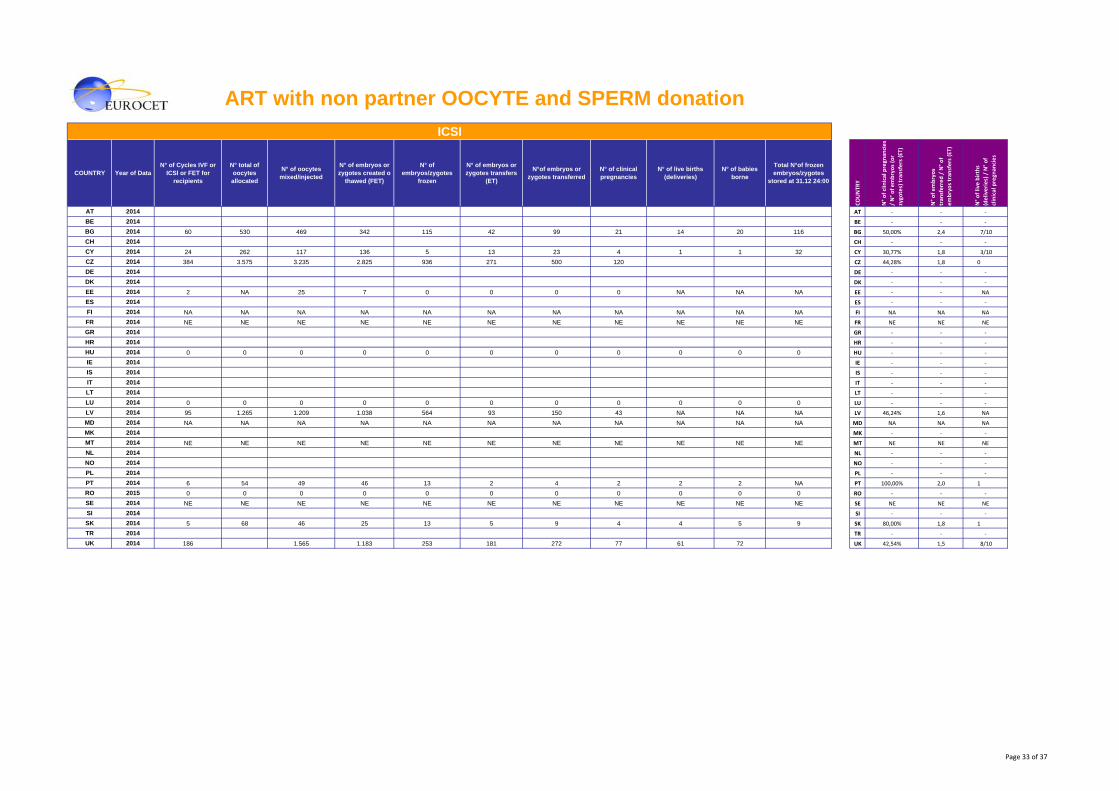
ART with non partner OOCYTE and SPERM donationICSI
COUNTRY Year of DataN° of Cycles IVF or
ICSI or FET for recipients
N° total of oocytes
allocated
N° of oocytes mixed/injected
N° of embryos or zygotes created o
thawed (FET)
N° of embryos/zygotes
frozen
N° of embryos or zygotes transfers
(ET)
N°of embryos or zygotes transferred
N° of clinical pregnancies
N° of live births (deliveries)
N° of babies borne
Total N°of frozen embryos/zygotes
stored at 31.12 24:00
COUNTR
Y
N° of clinical pregn
ancies
/ N° of embryos (or
zygo
tes) transfers (ET)
N° of embryos
tran
sferred / N° of
embryos tran
sfers (ET)
N° of live births
(deliveries) / N° of
clinical pregn
ancies
AT 2014 AT ‐ ‐ ‐
BE 2014 BE ‐ ‐ ‐
BG 2014 60 530 469 342 115 42 99 21 14 20 116 BG 50,00% 2,4 7/10
CH 2014 CH ‐ ‐ ‐
CY 2014 24 262 117 136 5 13 23 4 1 1 32 CY 30,77% 1,8 3/10
CZ 2014 384 3.575 3.235 2.825 936 271 500 120 CZ 44,28% 1,8 0
DE 2014 DE ‐ ‐ ‐
DK 2014 DK ‐ ‐ ‐
EE 2014 2 NA 25 7 0 0 0 0 NA NA NA EE ‐ ‐ NA
ES 2014 ES ‐ ‐ ‐
FI 2014 NA NA NA NA NA NA NA NA NA NA NA FI NA NA NA
FR 2014 NE NE NE NE NE NE NE NE NE NE NE FR NE NE NE
GR 2014 GR ‐ ‐ ‐
HR 2014 HR ‐ ‐ ‐
HU 2014 0 0 0 0 0 0 0 0 0 0 0 HU ‐ ‐ ‐
IE 2014 IE ‐ ‐ ‐
IS 2014 IS ‐ ‐ ‐
IT 2014 IT ‐ ‐ ‐
LT 2014 LT ‐ ‐ ‐
LU 2014 0 0 0 0 0 0 0 0 0 0 0 LU ‐ ‐ ‐
LV 2014 95 1.265 1.209 1.038 564 93 150 43 NA NA NA LV 46,24% 1,6 NA
MD 2014 NA NA NA NA NA NA NA NA NA NA NA MD NA NA NA
MK 2014 MK ‐ ‐ ‐
MT 2014 NE NE NE NE NE NE NE NE NE NE NE MT NE NE NE
NL 2014 NL ‐ ‐ ‐
NO 2014 NO ‐ ‐ ‐
PL 2014 PL ‐ ‐ ‐
PT 2014 6 54 49 46 13 2 4 2 2 2 NA PT 100,00% 2,0 1
RO 2015 0 0 0 0 0 0 0 0 0 0 0 RO ‐ ‐ ‐
SE 2014 NE NE NE NE NE NE NE NE NE NE NE SE NE NE NE
SI 2014 SI ‐ ‐ ‐
SK 2014 5 68 46 25 13 5 9 4 4 5 9 SK 80,00% 1,8 1
TR 2014 TR ‐ ‐ ‐
UK 2014 186 1.565 1.183 253 181 272 77 61 72 UK 42,54% 1,5 8/10
Page 33 of 37

ART with non partner OOCYTE and SPERM donationFET
COUNTRY Year of DataN° of Cycles IVF or
ICSI or FET for recipients
N° of embryos or zygotes created o
thawed (FET)
N° of embryos or zygotes transfers
(ET)
N°of embryos or zygotes transferred
N° of clinical pregnancies
N° of live births (deliveries)
N° of babies borne
COUNTR
Y
N° of clinical pregn
ancies
/ N° of embryos (or
zygo
tes) transfers (ET)
N° of embryos
tran
sferred / N° of
embryos tran
sfers (ET)
N° of live births
(deliveries) / N° of
clinical pregn
ancies
AT 2014 AT ‐ ‐ ‐
BE 2014 BE ‐ ‐ ‐
BG 2014 31 74 28 56 10 9 13 BG 35,71% 2,0 90%
CH 2014 CH ‐ ‐ ‐
CY 2014 13 35 9 18 6 3 4 CY 66,67% 2,0 5/10
CZ 2014 CZ ‐ ‐ ‐
DE 2014 DE ‐ ‐ ‐
DK 2014 DK ‐ ‐ ‐
EE 2014 13 84 14 24 3 NA NA EE 21,43% 1,7 NA
ES 2014 ES ‐ ‐ ‐
FI 2014 NA NA NA NA NA NA NA FI NA NA NA
FR 2014 NE NE NE NE NE NE NE FR NE NE NE
GR 2014 GR ‐ ‐ ‐
HR 2014 HR ‐ ‐ ‐
HU 2014 0 0 0 0 0 0 0 HU ‐ ‐ ‐
IE 2014 IE ‐ ‐ ‐
IS 2014 IS ‐ ‐ ‐
IT 2014 IT ‐ ‐ ‐
LT 2014 LT ‐ ‐ ‐
LU 2014 0 0 0 0 0 0 0 LU ‐ ‐ ‐
LV 2014 68 153 68 104 20 NA NA LV 29,41% 1,5 NA
MD 2014 NA NA NA NA NA NA NA MD NA NA NA
MK 2014 MK ‐ ‐ ‐
MT 2014 NE NE NE NE NE NE NE MT NE NE NE
NL 2014 NL ‐ ‐ ‐
NO 2014 NO ‐ ‐ ‐
PL 2014 PL ‐ ‐ ‐
PT 2014 NA NA NA NA NA NA NA PT NA NA NA
RO 2015 2 6 2 4 0 0 0 RO 0,00% 2,0 ‐
SE 2014 NE NE NE NE NE NE NE NE NE NE NE SE NE NE NE
SI 2014 SI ‐ ‐ ‐
SK 2014 12 7 12 15 8 4 4 SK 66,67% 1,3 5/10
TR 2014 TR ‐ ‐ ‐
UK 2014 346 726 336 466 107 88 97 UK 31,85% 1,4 8/10
Page 34 of 37
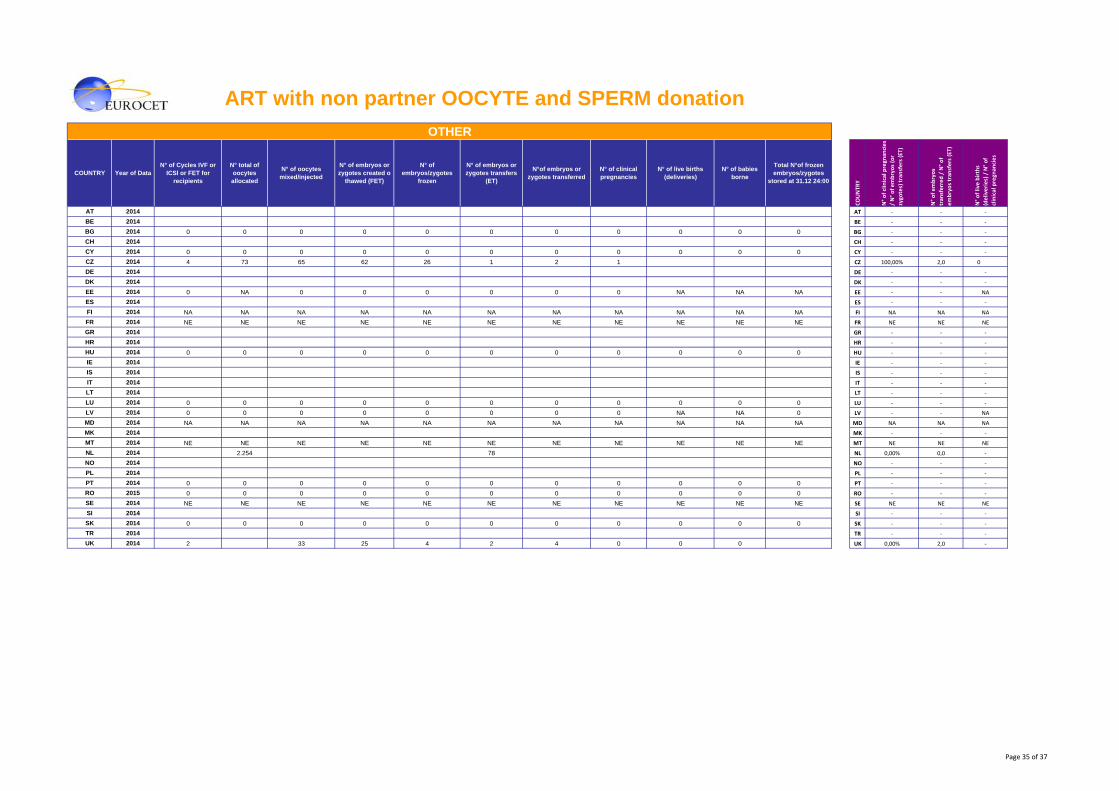
ART with non partner OOCYTE and SPERM donationOTHER
COUNTRY Year of DataN° of Cycles IVF or
ICSI or FET for recipients
N° total of oocytes
allocated
N° of oocytes mixed/injected
N° of embryos or zygotes created o
thawed (FET)
N° of embryos/zygotes
frozen
N° of embryos or zygotes transfers
(ET)
N°of embryos or zygotes transferred
N° of clinical pregnancies
N° of live births (deliveries)
N° of babies borne
Total N°of frozen embryos/zygotes
stored at 31.12 24:00
COUNTR
Y
N° of clinical pregn
ancies
/ N° of embryos (or
zygo
tes) transfers (ET)
N° of embryos
tran
sferred / N° of
embryos tran
sfers (ET)
N° of live births
(deliveries) / N° of
clinical pregn
ancies
AT 2014 AT ‐ ‐ ‐
BE 2014 BE ‐ ‐ ‐
BG 2014 0 0 0 0 0 0 0 0 0 0 0 BG ‐ ‐ ‐
CH 2014 CH ‐ ‐ ‐
CY 2014 0 0 0 0 0 0 0 0 0 0 0 CY ‐ ‐ ‐
CZ 2014 4 73 65 62 26 1 2 1 CZ 100,00% 2,0 0
DE 2014 DE ‐ ‐ ‐
DK 2014 DK ‐ ‐ ‐
EE 2014 0 NA 0 0 0 0 0 0 NA NA NA EE ‐ ‐ NA
ES 2014 ES ‐ ‐ ‐
FI 2014 NA NA NA NA NA NA NA NA NA NA NA FI NA NA NA
FR 2014 NE NE NE NE NE NE NE NE NE NE NE FR NE NE NE
GR 2014 GR ‐ ‐ ‐
HR 2014 HR ‐ ‐ ‐
HU 2014 0 0 0 0 0 0 0 0 0 0 0 HU ‐ ‐ ‐
IE 2014 IE ‐ ‐ ‐
IS 2014 IS ‐ ‐ ‐
IT 2014 IT ‐ ‐ ‐
LT 2014 LT ‐ ‐ ‐
LU 2014 0 0 0 0 0 0 0 0 0 0 0 LU ‐ ‐ ‐
LV 2014 0 0 0 0 0 0 0 0 NA NA 0 LV ‐ ‐ NA
MD 2014 NA NA NA NA NA NA NA NA NA NA NA MD NA NA NA
MK 2014 MK ‐ ‐ ‐
MT 2014 NE NE NE NE NE NE NE NE NE NE NE MT NE NE NE
NL 2014 2.254 78 NL 0,00% 0,0 ‐
NO 2014 NO ‐ ‐ ‐
PL 2014 PL ‐ ‐ ‐
PT 2014 0 0 0 0 0 0 0 0 0 0 0 PT ‐ ‐ ‐
RO 2015 0 0 0 0 0 0 0 0 0 0 0 RO ‐ ‐ ‐
SE 2014 NE NE NE NE NE NE NE NE NE NE NE SE NE NE NE
SI 2014 SI ‐ ‐ ‐
SK 2014 0 0 0 0 0 0 0 0 0 0 0 SK ‐ ‐ ‐
TR 2014 TR ‐ ‐ ‐
UK 2014 2 33 25 4 2 4 0 0 0 UK 0,00% 2,0 ‐
Page 35 of 37
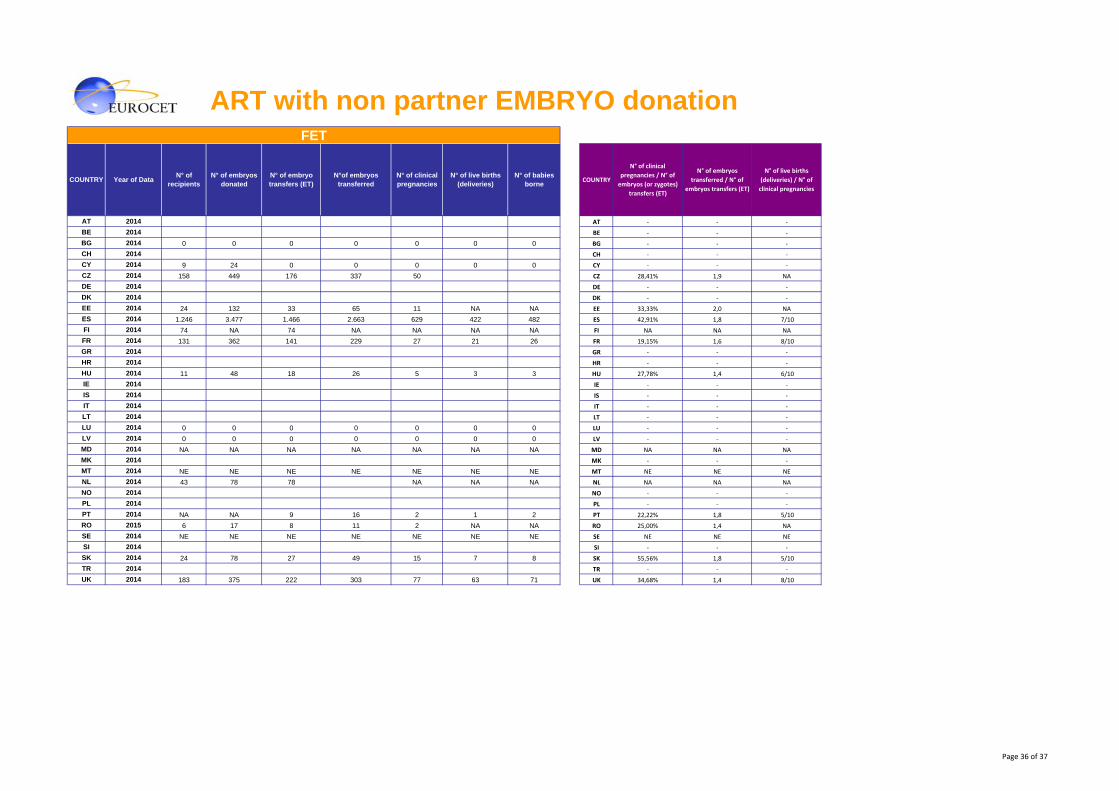
ART with non partner EMBRYO donationFET E
COUNTRY Year of Data N° of recipients
N° of embryos donated
N° of embryo transfers (ET)
N°of embryos transferred
N° of clinical pregnancies
N° of live births (deliveries)
N° of babies borne COUNTRY
N° of clinical
pregnancies / N° of
embryos (or zygotes)
transfers (ET)
N° of embryos
transferred / N° of
embryos transfers (ET)
N° of live births
(deliveries) / N° of
clinical pregnancies
AT 2014 AT ‐ ‐ ‐
BE 2014 BE ‐ ‐ ‐
BG 2014 0 0 0 0 0 0 0 BG ‐ ‐ ‐
CH 2014 CH ‐ ‐ ‐
CY 2014 9 24 0 0 0 0 0 CY ‐ ‐ ‐
CZ 2014 158 449 176 337 50 CZ 28,41% 1,9 NA
DE 2014 DE ‐ ‐ ‐
DK 2014 DK ‐ ‐ ‐
EE 2014 24 132 33 65 11 NA NA EE 33,33% 2,0 NA
ES 2014 1.246 3.477 1.466 2.663 629 422 482 ES 42,91% 1,8 7/10
FI 2014 74 NA 74 NA NA NA NA FI NA NA NA
FR 2014 131 362 141 229 27 21 26 FR 19,15% 1,6 8/10
GR 2014 GR ‐ ‐ ‐
HR 2014 HR ‐ ‐ ‐
HU 2014 11 48 18 26 5 3 3 HU 27,78% 1,4 6/10
IE 2014 IE ‐ ‐ ‐
IS 2014 IS ‐ ‐ ‐
IT 2014 IT ‐ ‐ ‐
LT 2014 LT ‐ ‐ ‐
LU 2014 0 0 0 0 0 0 0 LU ‐ ‐ ‐
LV 2014 0 0 0 0 0 0 0 LV ‐ ‐ ‐
MD 2014 NA NA NA NA NA NA NA MD NA NA NA
MK 2014 MK ‐ ‐ ‐
MT 2014 NE NE NE NE NE NE NE MT NE NE NE
NL 2014 43 78 78 NA NA NA NL NA NA NA
NO 2014 NO ‐ ‐ ‐
PL 2014 PL ‐ ‐ ‐
PT 2014 NA NA 9 16 2 1 2 PT 22,22% 1,8 5/10
RO 2015 6 17 8 11 2 NA NA RO 25,00% 1,4 NA
SE 2014 NE NE NE NE NE NE NE SE NE NE NE
SI 2014 SI ‐ ‐ ‐
SK 2014 24 78 27 49 15 7 8 SK 55,56% 1,8 5/10
TR 2014 TR ‐ ‐ ‐
UK 2014 183 375 222 303 77 63 71 UK 34,68% 1,4 8/10
Page 36 of 37
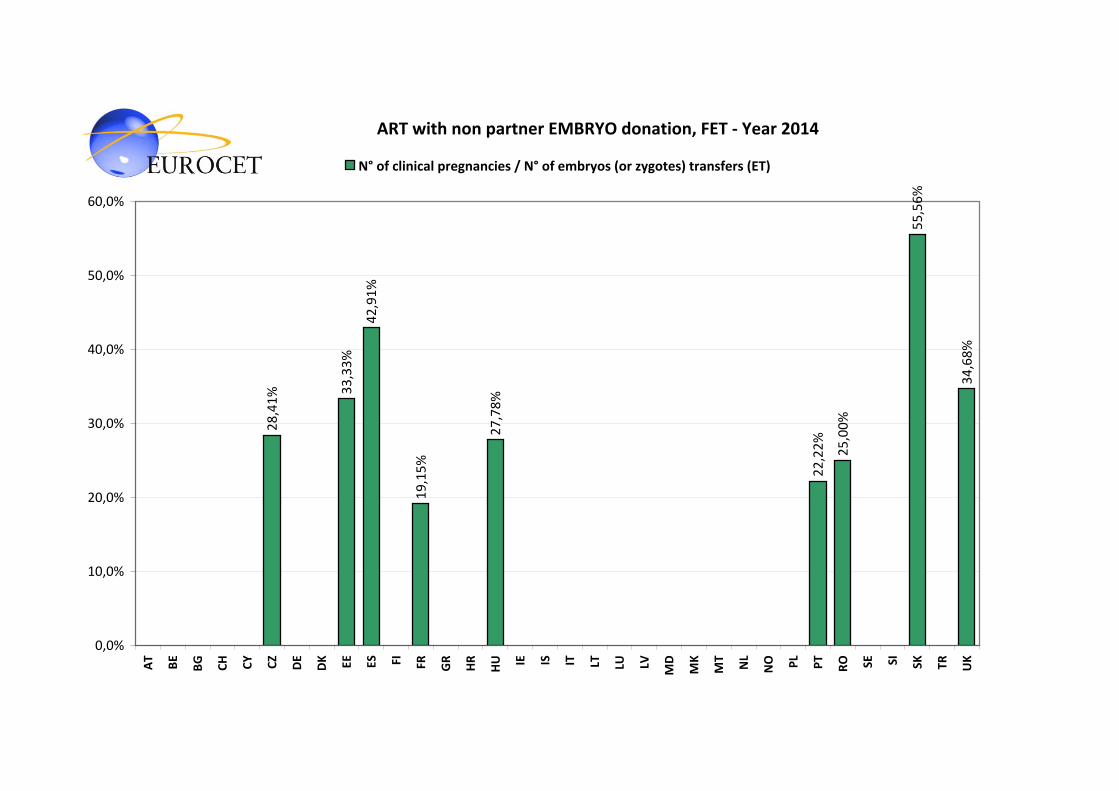
ART with non partner EMBRYO donation, FET ‐ Year 2014
28,41% 33,33%
42,91%
19,15%
27,78%
22,22%
25,00%
55,56%
34,68%
0,0%
10,0%
20,0%
30,0%
40,0%
50,0%
60,0%
AT
BE
BG
CH CY CZ
DE
DK EE ES FI FR GR
HR
HU IE IS IT LT LU LV MD
MK
MT
NL
NO PL
PT
RO SE SI SK TR UK
N° of clinical pregnancies / N° of embryos (or zygotes) transfers (ET)


