Embed Size (px)
Citation preview
ApicultureMINISTRY FOR PRIMARY INDUSTRIES
2016 APICULTURE MONITORING PROGRAMME
2 2016 APICULTURE
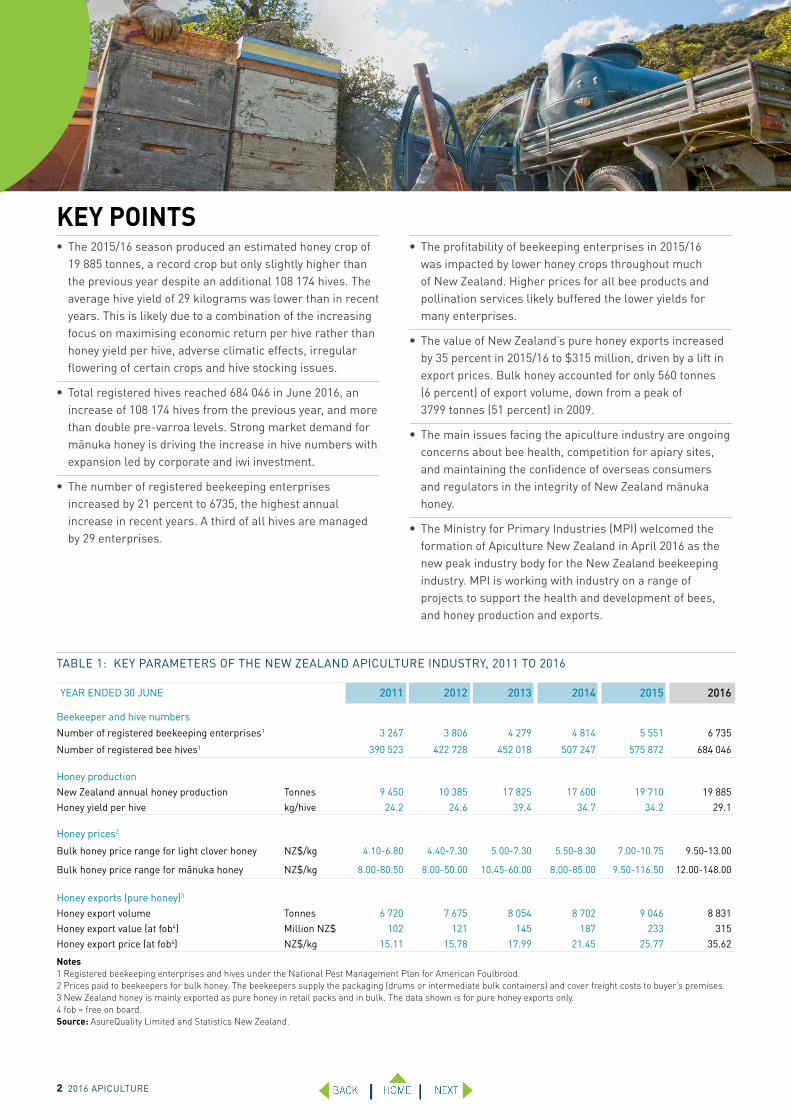
KEY POINTS• The 2015/16 season produced an estimated honey crop of
19 885 tonnes, a record crop but only slightly higher than the previous year despite an additional 108 174 hives. The average hive yield of 29 kilograms was lower than in recent years. This is likely due to a combination of the increasing focus on maximising economic return per hive rather than honey yield per hive, adverse climatic effects, irregular flowering of certain crops and hive stocking issues.
• Total registered hives reached 684 046 in June 2016, an increase of 108 174 hives from the previous year, and more than double pre-varroa levels. Strong market demand for mānuka honey is driving the increase in hive numbers with expansion led by corporate and iwi investment.
• The number of registered beekeeping enterprises increased by 21 percent to 6735, the highest annual increase in recent years. A third of all hives are managed by 29 enterprises.
• The profitability of beekeeping enterprises in 2015/16 was impacted by lower honey crops throughout much of New Zealand. Higher prices for all bee products and pollination services likely buffered the lower yields for many enterprises.
• The value of New Zealand’s pure honey exports increased by 35 percent in 2015/16 to $315 million, driven by a lift in export prices. Bulk honey accounted for only 560 tonnes (6 percent) of export volume, down from a peak of 3799 tonnes (51 percent) in 2009.
• The main issues facing the apiculture industry are ongoing concerns about bee health, competition for apiary sites, and maintaining the confidence of overseas consumers and regulators in the integrity of New Zealand mānuka honey.
• The Ministry for Primary Industries (MPI) welcomed the formation of Apiculture New Zealand in April 2016 as the new peak industry body for the New Zealand beekeeping industry. MPI is working with industry on a range of projects to support the health and development of bees, and honey production and exports.
TABLE 1: KEY PARAMETERS OF THE NEW ZEALAND APICULTURE INDUSTRY, 2011 TO 2016
YEAR ENDED 30 JUNE 2011 2012 2013 2014 2015 2016
Beekeeper and hive numbersNumber of registered beekeeping enterprises1 3 267 3 806 4 279 4 814 5 551 6 735
Number of registered bee hives1 390 523 422 728 452 018 507 247 575 872 684 046
Honey production New Zealand annual honey production Tonnes 9 450 10 385 17 825 17 600 19 710 19 885Honey yield per hive kg/hive 24.2 24.6 39.4 34.7 34.2 29.1
Honey prices2
Bulk honey price range for light clover honey NZ$/kg 4.10-6.80 4.40-7.30 5.00-7.30 5.50-8.30 7.00-10.75 9.50-13.00
Bulk honey price range for mānuka honey NZ$/kg 8.00-80.50 8.00-50.00 10.45-60.00 8.00-85.00 9.50-116.50 12.00-148.00
Honey exports (pure honey)3
Honey export volume Tonnes 6 720 7 675 8 054 8 702 9 046 8 831Honey export value (at fob4) Million NZ$ 102 121 145 187 233 315Honey export price (at fob4) NZ$/kg 15.11 15.78 17.99 21.45 25.77 35.62
Notes1 Registered beekeeping enterprises and hives under the National Pest Management Plan for American Foulbrood.2 Prices paid to beekeepers for bulk honey. The beekeepers supply the packaging (drums or intermediate bulk containers) and cover freight costs to buyer’s premises.3 New Zealand honey is mainly exported as pure honey in retail packs and in bulk. The data shown is for pure honey exports only.4 fob = free on board. Source: AsureQuality Limited and Statistics New Zealand.
2016 APICULTURE 3
YEAR ENDED 30 JUNE 2011 (tonnes)
2012 (tonnes)
2013 (tonnes)
2014 (tonnes)
2015 (tonnes)
2016 (tonnes)
6-year average (tonnes)
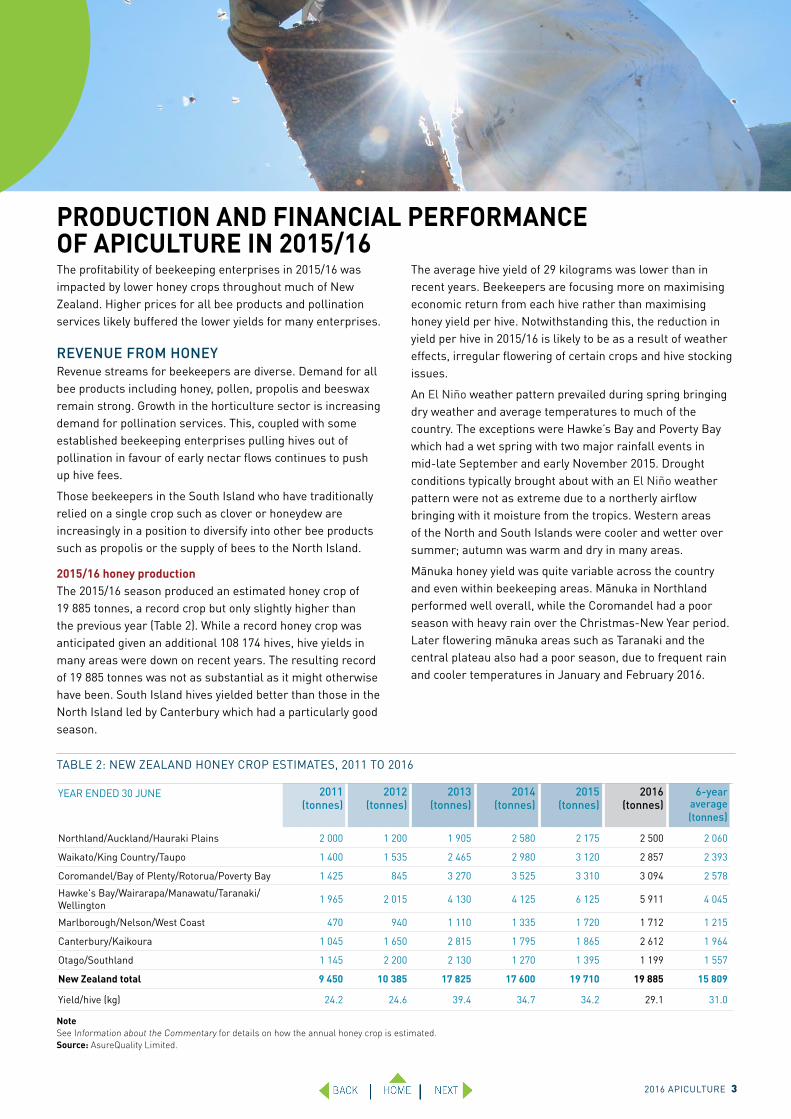
Northland/Auckland/Hauraki Plains 2 000 1 200 1 905 2 580 2 175 2 500 2 060
Waikato/King Country/Taupo 1 400 1 535 2 465 2 980 3 120 2 857 2 393
Coromandel/Bay of Plenty/Rotorua/Poverty Bay 1 425 845 3 270 3 525 3 310 3 094 2 578
Hawke's Bay/Wairarapa/Manawatu/Taranaki/ Wellington 1 965 2 015 4 130 4 125 6 125 5 911 4 045
Marlborough/Nelson/West Coast 470 940 1 110 1 335 1 720 1 712 1 215
Canterbury/Kaikoura 1 045 1 650 2 815 1 795 1 865 2 612 1 964
Otago/Southland 1 145 2 200 2 130 1 270 1 395 1 199 1 557
New Zealand total 9 450 10 385 17 825 17 600 19 710 19 885 15 809
Yield/hive (kg) 24.2 24.6 39.4 34.7 34.2 29.1 31.0
NoteSee Information about the Commentary for details on how the annual honey crop is estimated.Source: AsureQuality Limited.
TABLE 2: NEW ZEALAND HONEY CROP ESTIMATES, 2011 TO 2016
PRODUCTION AND FINANCIAL PERFORMANCE OF APICULTURE IN 2015/16 The profitability of beekeeping enterprises in 2015/16 was impacted by lower honey crops throughout much of New Zealand. Higher prices for all bee products and pollination services likely buffered the lower yields for many enterprises.
REVENUE FROM HONEYRevenue streams for beekeepers are diverse. Demand for all bee products including honey, pollen, propolis and beeswax remain strong. Growth in the horticulture sector is increasing demand for pollination services. This, coupled with some established beekeeping enterprises pulling hives out of pollination in favour of early nectar flows continues to push up hive fees.
Those beekeepers in the South Island who have traditionally relied on a single crop such as clover or honeydew are increasingly in a position to diversify into other bee products such as propolis or the supply of bees to the North Island.
2015/16 honey productionThe 2015/16 season produced an estimated honey crop of 19 885 tonnes, a record crop but only slightly higher than the previous year (Table 2). While a record honey crop was anticipated given an additional 108 174 hives, hive yields in many areas were down on recent years. The resulting record of 19 885 tonnes was not as substantial as it might otherwise have been. South Island hives yielded better than those in the North Island led by Canterbury which had a particularly good season.
The average hive yield of 29 kilograms was lower than in recent years. Beekeepers are focusing more on maximising economic return from each hive rather than maximising honey yield per hive. Notwithstanding this, the reduction in yield per hive in 2015/16 is likely to be as a result of weather effects, irregular flowering of certain crops and hive stocking issues.
An El Niño weather pattern prevailed during spring bringing dry weather and average temperatures to much of the country. The exceptions were Hawke’s Bay and Poverty Bay which had a wet spring with two major rainfall events in mid-late September and early November 2015. Drought conditions typically brought about with an El Niño weather pattern were not as extreme due to a northerly airflow bringing with it moisture from the tropics. Western areas of the North and South Islands were cooler and wetter over summer; autumn was warm and dry in many areas.
Mānuka honey yield was quite variable across the country and even within beekeeping areas. Mānuka in Northland performed well overall, while the Coromandel had a poor season with heavy rain over the Christmas-New Year period. Later flowering mānuka areas such as Taranaki and the central plateau also had a poor season, due to frequent rain and cooler temperatures in January and February 2016.
4 2016 APICULTURE
FIGURE 1: REGISTERED BEEKEEPING ENTERPRISES AND HIVE NUMBERS IN NEW ZEALAND1, 2000 TO 2016
Notes1 Registered beekeeping enterprises and hives under the National Pest Management Plan for American Foulbrood. Varroa was discovered in hives in New Zealand in 2000.Source: AsureQuality Limited.
00
Num
ber
of r
egis
tere
d hi
ves
Registered Hives1 000
2 000
3 000
4 000
5 000
6 000
100 000
200 000
300 000
400 000
500 000
600 000
Num
ber o
f reg
iste
red
beek
eepi
ng e
nter
pris
es
Registered beekeeping enterprises
2000 2001 2002 2003 2004 2005 2006 2007 2008 2009 2010 2011 2012 2013 2014 2015
Year ended 30 June
7 000700 000
2016
Beekeepers reported that methylglyoxal levels in mānuka honey from several areas were lower in 2015/16 compared with the previous season. The main reason appears to be nectar dilution with bees harvesting from several nectar sources due to poor flowering of mānuka.
In contrast to last season, 2015/16 was a good rewarewa year with good yields reported out of the wider Auckland area, Waikato and Bay of Plenty. The El Niño weather pattern brought dry weather to these areas prior to Christmas resulting in a high number of foraging days.
The West Coast came off two good years and performed reasonably well in 2015/16 with a good kamahi flow. However, beekeepers noted that the season was particularly difficult due to poor weather (El Niño effect), a lot of swarming and queen failure.
Canterbury beekeepers had a good season in 2015/16. Those in North Canterbury experienced a reasonably short season due to very dry conditions which extended into autumn. Good yields were achieved for hives on beech honeydew, mānuka and kānuka nectar sources. Clover performed poorly but like a number of other areas, bees also collected a reasonable amount of willow honeydew later in the season. The giant willow aphid does not seem to be as widespread in Canterbury as it is in some North Island regions so willow
honeydew is mostly mixed with other honey types such as clover. This dilution avoids difficulties with extraction.
Otago/Southland beekeepers reported a poor season overall due to climatic factors, with very little clover and below average thyme yield in central Otago.
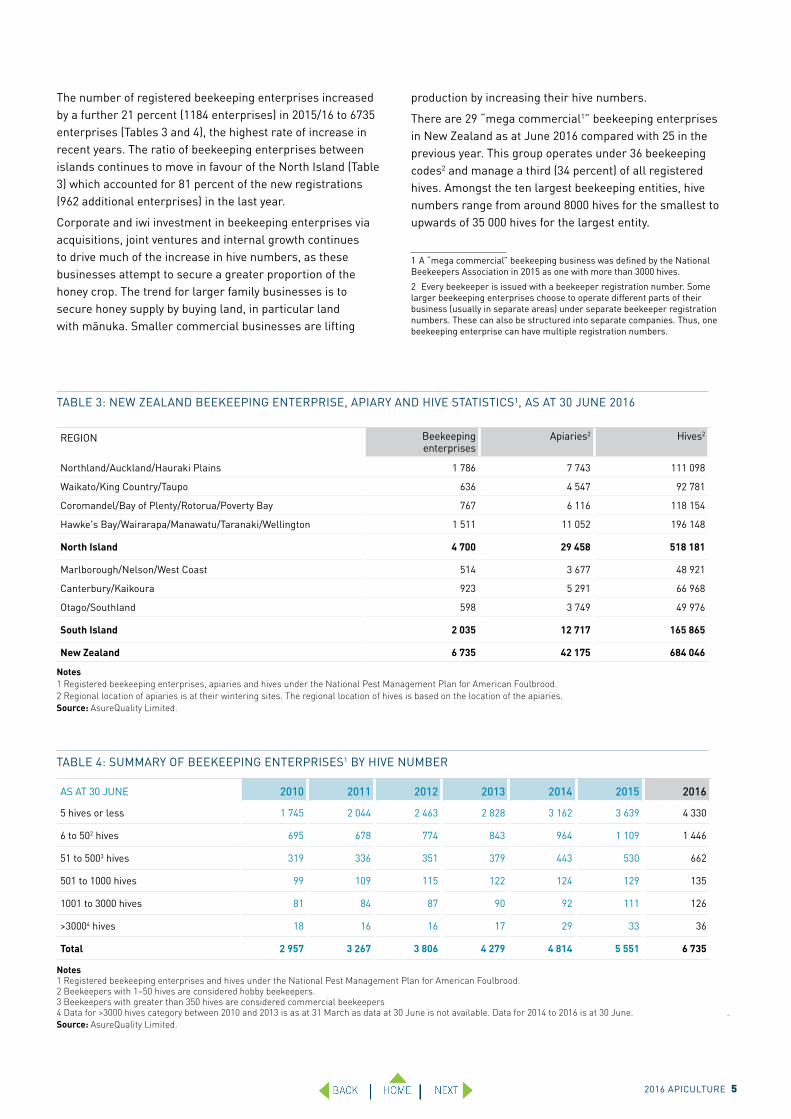
Significant increase in hive numbersHive numbers increased by 108 174 hives from last year to 684 046 hives as at 30 June 2016 (Figure 1). This increase was driven by the strong market demand for mānuka honey. The demand for hives is expected to continue into the coming season, in both the North and South Islands.
Hive numbers increased by 23 percent (97 387 hives) in the North Island compared with a seven percent (10 787 hives) increase in the South Island. Increased hive numbers in the North Island were due to a natural increase and hive purchases from the South Island. These purchases provide an important income stream for South Island beekeepers. The increase in hive numbers in the South Island was similar to last year signalling a growing level of confidence. As areas of the North Island reach a point where additional hives increasingly impact on the yield of other hives in the area, larger enterprises may start looking at opportunities in the South Island.
2016 APICULTURE 5
The number of registered beekeeping enterprises increased by a further 21 percent (1184 enterprises) in 2015/16 to 6735 enterprises (Tables 3 and 4), the highest rate of increase in recent years. The ratio of beekeeping enterprises between islands continues to move in favour of the North Island (Table 3) which accounted for 81 percent of the new registrations (962 additional enterprises) in the last year.
Corporate and iwi investment in beekeeping enterprises via acquisitions, joint ventures and internal growth continues to drive much of the increase in hive numbers, as these businesses attempt to secure a greater proportion of the honey crop. The trend for larger family businesses is to secure honey supply by buying land, in particular land with mānuka. Smaller commercial businesses are lifting
production by increasing their hive numbers.
There are 29 “mega commercial1” beekeeping enterprises in New Zealand as at June 2016 compared with 25 in the previous year. This group operates under 36 beekeeping codes2 and manage a third (34 percent) of all registered hives. Amongst the ten largest beekeeping entities, hive numbers range from around 8000 hives for the smallest to upwards of 35 000 hives for the largest entity.
1 A “mega commercial” beekeeping business was defined by the National Beekeepers Association in 2015 as one with more than 3000 hives.
2 Every beekeeper is issued with a beekeeper registration number. Some larger beekeeping enterprises choose to operate different parts of their business (usually in separate areas) under separate beekeeper registration numbers. These can also be structured into separate companies. Thus, one beekeeping enterprise can have multiple registration numbers.
TABLE 3: NEW ZEALAND BEEKEEPING ENTERPRISE, APIARY AND HIVE STATISTICS¹, AS AT 30 JUNE 2016
REGION Beekeeping enterprises
Apiaries2 Hives2
Northland/Auckland/Hauraki Plains 1 786 7 743 111 098
Waikato/King Country/Taupo 636 4 547 92 781
Coromandel/Bay of Plenty/Rotorua/Poverty Bay 767 6 116 118 154
Hawke's Bay/Wairarapa/Manawatu/Taranaki/Wellington 1 511 11 052 196 148
North Island 4 700 29 458 518 181
Marlborough/Nelson/West Coast 514 3 677 48 921
Canterbury/Kaikoura 923 5 291 66 968
Otago/Southland 598 3 749 49 976
South Island 2 035 12 717 165 865
New Zealand 6 735 42 175 684 046
Notes1 Registered beekeeping enterprises, apiaries and hives under the National Pest Management Plan for American Foulbrood.2 Regional location of apiaries is at their wintering sites. The regional location of hives is based on the location of the apiaries.Source: AsureQuality Limited.
TABLE 4: SUMMARY OF BEEKEEPING ENTERPRISES1 BY HIVE NUMBER
AS AT 30 JUNE 2010 2011 2012 2013 2014 2015 2016
5 hives or less 1 745 2 044 2 463 2 828 3 162 3 639 4 330
6 to 502 hives 695 678 774 843 964 1 109 1 446
51 to 5003 hives 319 336 351 379 443 530 662
501 to 1000 hives 99 109 115 122 124 129 135
1001 to 3000 hives 81 84 87 90 92 111 126
>30004 hives 18 16 16 17 29 33 36
Total 2 957 3 267 3 806 4 279 4 814 5 551 6 735
Notes1 Registered beekeeping enterprises and hives under the National Pest Management Plan for American Foulbrood.2 Beekeepers with 1–50 hives are considered hobby beekeepers.3 Beekeepers with greater than 350 hives are considered commercial beekeepers4 Data for >3000 hives category between 2010 and 2013 is as at 31 March as data at 30 June is not available. Data for 2014 to 2016 is at 30 June. .Source: AsureQuality Limited.
6 2016 APICULTURE
TABLE 5: RETURNS FOR APICULTURE PRODUCTS, 2011 TO 2016
YEAR ENDED 30 JUNE 2010/11 2011/12 2012/13 2013/14 2014/15 2015/16
Bulk honey1 ($ per kg)
Light (clover type) 4.10-6.80 4.40-7.30 5.00-7.30 5.50-8.30 7.00-10.75 9.50-13.00
Light amber 4.00-5.80 4.30-6.00 5.50-8.50 4.50-8.00 7.00-9.00 9.00-11.50
Dark, including honeydew 4.50-5.00 5.00-6.00 4.50-8.50 5.50-10.00 7.00-12.50 8.00-14.50
Mānuka 8.00-80.50 8.00-50.00 10.45-60.00 8.00-85.00 9.50-116.50 12.00-148.00
Beeswax2 ($ per kg)
Light 7.00-7.80 7.00-7.50 7.50-8.50 8.00-10.50 9.00-12.50 11.00-15.00
Dark 6.00-6.80 5.00-7.50 6.50-7.80 6.50-7.80 8.00-10.00 9.00-10.00
Pollen2 ($ per kg)
Not dried or cleaned 16.00-20.00 25.00-28.00 25.50-30.50 25.50-30.50 25.00-27.00 25.00
Cleaned and dried 32.00-38.00 35.00-40.00 40-00-45.00 40.00-45.00 40.00-46.00 …
Pollination3 ($ per hive)
Pipfruit, stonefruit and berryfruit 60-120 60-120 60-120 60-120 60-140 60-150
Kiwifruit
– Hawke’s Bay 104-160 104-160 120-180 120-185 120-180 165-300
– Auckland 120-150 120-150 120-150 120-150 120-150 150-400
– Bay of Plenty 110-178 115-200 120-195 140-210 142-195 145-400
– Nelson 120-150 120-150 120-150 120-150 115-195 178-190
Canola and small seeds (carrots) 120-150 100-180 150-195 150-195 150-195 130-200
Live Bees2
Bulk bees for export ($ per 1kg package) 26-27 27-28 27-29 27-32 28-32 31-35
Queen bees (per queen) local sales ($) 25 28 33-37 33-37 30-37 35-60
Notes… Data not available. All prices are exclusive of GST. 1 Prices paid to beekeepers for bulk honey. The beekeepers supply the packaging (drums or intermediate bulk containers) and cover freight costs to the buyer’s premise.2 Prices paid to beekeepers. The beekeepers cover the freight costs to the buyer’s premise.3 Prices paid to beekeepers. Prices at the lower end of the range are for hives delivered to depot sites. Upper end prices include delivery into the orchard and sugar for 3 to 4 one-two litre feeds to stimulate the bees to collect pollen. Source: AsureQuality Limited.
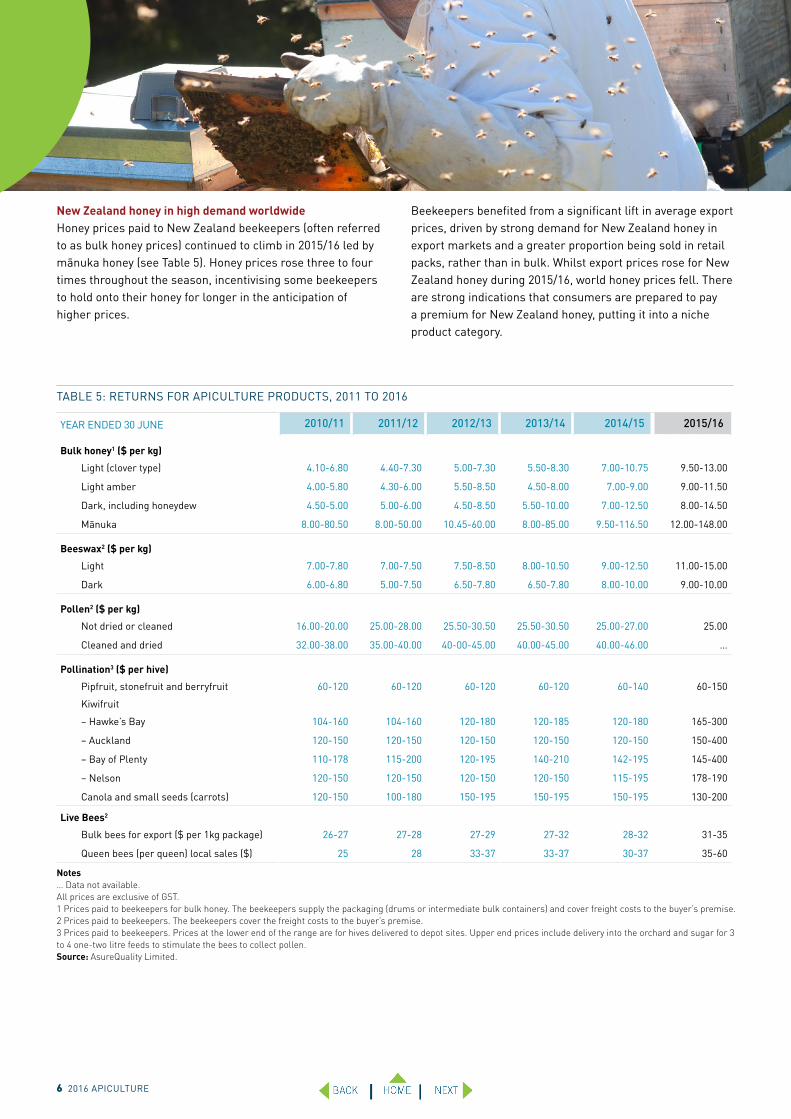
New Zealand honey in high demand worldwide Honey prices paid to New Zealand beekeepers (often referred to as bulk honey prices) continued to climb in 2015/16 led by mānuka honey (see Table 5). Honey prices rose three to four times throughout the season, incentivising some beekeepers to hold onto their honey for longer in the anticipation of higher prices.
Beekeepers benefited from a significant lift in average export prices, driven by strong demand for New Zealand honey in export markets and a greater proportion being sold in retail packs, rather than in bulk. Whilst export prices rose for New Zealand honey during 2015/16, world honey prices fell. There are strong indications that consumers are prepared to pay a premium for New Zealand honey, putting it into a niche product category.
2016 APICULTURE 7
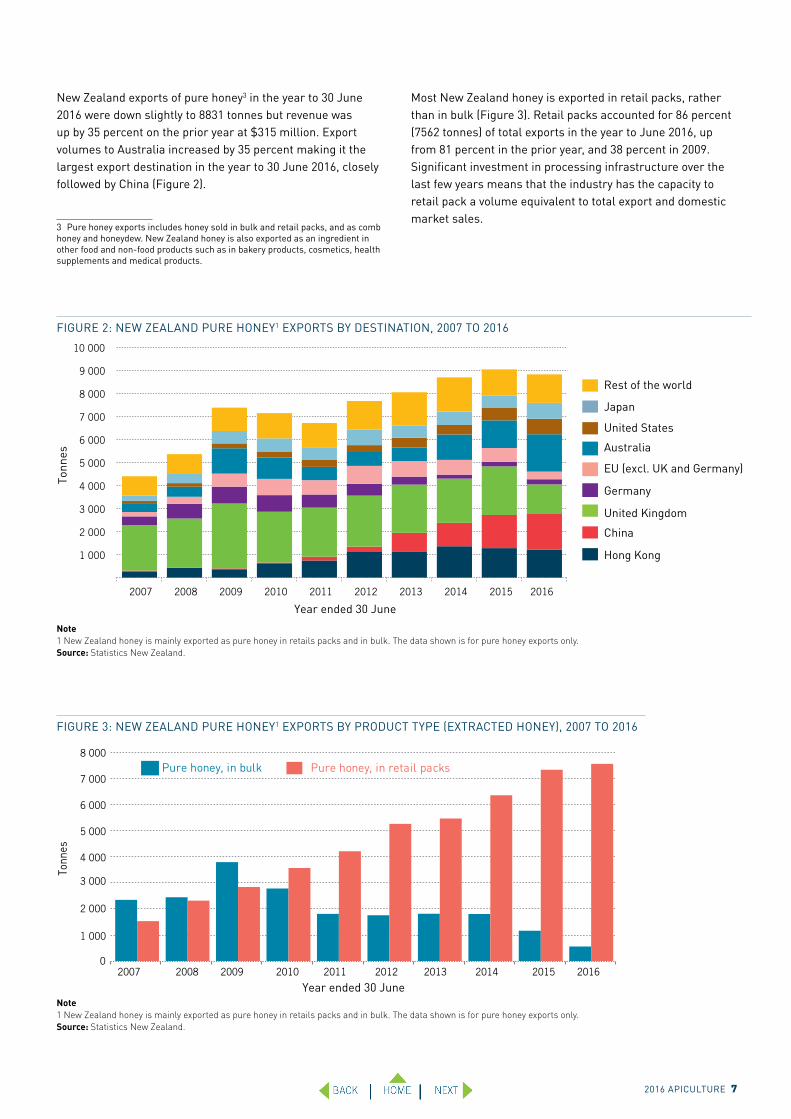
New Zealand exports of pure honey3 in the year to 30 June 2016 were down slightly to 8831 tonnes but revenue was up by 35 percent on the prior year at $315 million. Export volumes to Australia increased by 35 percent making it the largest export destination in the year to 30 June 2016, closely followed by China (Figure 2).
3 Pure honey exports includes honey sold in bulk and retail packs, and as comb honey and honeydew. New Zealand honey is also exported as an ingredient in other food and non-food products such as in bakery products, cosmetics, health supplements and medical products.
Most New Zealand honey is exported in retail packs, rather than in bulk (Figure 3). Retail packs accounted for 86 percent (7562 tonnes) of total exports in the year to June 2016, up from 81 percent in the prior year, and 38 percent in 2009. Significant investment in processing infrastructure over the last few years means that the industry has the capacity to retail pack a volume equivalent to total export and domestic market sales.
FIGURE 3: NEW ZEALAND PURE HONEY1 EXPORTS BY PRODUCT TYPE (EXTRACTED HONEY), 2007 TO 2016
Note1 New Zealand honey is mainly exported as pure honey in retails packs and in bulk. The data shown is for pure honey exports only. Source: Statistics New Zealand.
0
1 000
2 000
3 000
4 000
5 000
6 000
7 000
8 000
2007 2008 2009 2010 2011 2012 2013 2014 2015
Tonn
es
2016
Year ended 30 June
Pure honey, in bulk Pure honey, in retail packs
FIGURE 2: NEW ZEALAND PURE HONEY1 EXPORTS BY DESTINATION, 2007 TO 2016
1 000
2 000
3 000
4 000
5 000
6 000
7 000
8 000
9 000
10 000
2007 2008 2009 2010 2011 2012 2013 2014 2015
Tonn
es
Year ended 30 June
Rest of the world
Japan
United States
Australia
EU (excl. UK and Germany)
Germany
United Kingdom
China
Hong Kong
2016
Note1 New Zealand honey is mainly exported as pure honey in retails packs and in bulk. The data shown is for pure honey exports only.Source: Statistics New Zealand.
8 2016 APICULTURE
OTHER REVENUE SOURCESPollinationDemand for pollination services is increasing with on-going expansion in several horticulture sectors including kiwifruit, pipfruit, avocados, stonefruit and blueberries. There is also an increasing trend of growing some of these fruit crops under covers, such as blueberries, cherries and G3 Gold kiwifruit.
There is reluctance by several beekeepers to supply hives for pollination, particularly amongst the corporate beekeepers who do not see pollination services as part of their core business. Beekeepers that do provide hives are tending to supply the weaker ones, preferring to send the stronger hives onto early nectar flows. There seems to be increased resistance amongst beekeepers to auditing of pollination hives4 which is an additional cost. Some beekeepers are of the view that they are ‘doing growers a favour’ in providing hives for pollination, when they could be collecting honey.
Pollination prices increased for all crop types in 2015/16 due to several factors including (i) increasing demand, (ii) some existing beekeepers no longer offering pollination services,
4 Best practice guidelines for pollination have been developed for several fruit crops. These include guidelines for hive strength such as amount and age of brood, bee numbers, honey reserves, pest and disease status, etc. Hive audits provide assurances to growers on the strength and overall health of hives used for pollination.
(iii) the opportunity cost of a lost honey crop of increasingly higher value, and (iv) adverse effects of crop covers on bees. Some beekeepers are charging a price premium of 30 to 100 percent above the price for an open orchard to provide hives in covered orchards. With blueberries under covers, beekeepers are cycling hives in and out at regular intervals (7 to 10 days) throughout flowering, lifting pollination costs. Beekeepers seem more concerned about the impact of crop canopies on bees than they are of pesticide risks.
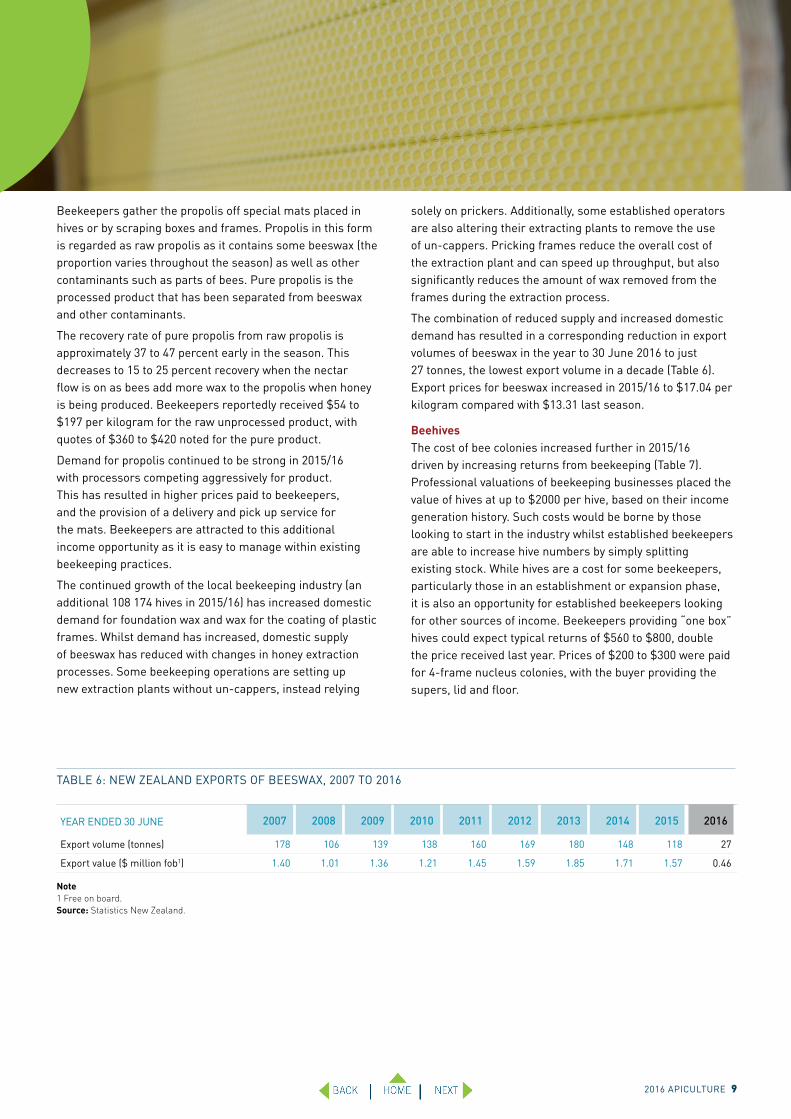
Live bee exportsThe mild winter in Canada in 2015/165 (attributed to the El Niño weather pattern) and lower global honey prices resulted in a significant drop in demand for live bee exports from New Zealand to 25 407 one-kilogram packages, down from 35 431 one-kilogram packages last year (Figure 4).
Bumble bee shipments to the Maldives are increasing with 4800 individual bees sent in the year to 30 June 2016, more than double that of last season. These bees are mainly used to pollinate crops grown in greenhouses.
Propolis and beeswaxPropolis is a resin collected by bees from some tree species and marketed as a dietary supplement. Demand from markets in Asia is increasing.
5 http://www.ontariobee.com/sites/ontariobee.com/files/2016-CAPA-Statement-on-Colony-Losses-July-19_0.pdf
FIGURE 4: NEW ZEALAND EXPORT OF LIVE BEES1, 2007 TO 2016
Notes1 Honey bees only. A small number of bumble bees are also exported.2 A package of bees generally consists of 1 kilogram of bees housed within a ventilated cardboard tube or a cardboard and wire screen box about the size of a shoe box. The package may hold a supply of sugar syrup and a queen bee in a cage. All packages and the majority of the queen bees go to Canada.The exporting season is late January to May.Source: AsureQuality Limited.
Year ended 30 June
Queen beesOne kilogram packages2
0
Num
ber
of q
ueen
bee
s or
pac
kage
s
5 000
10 000
15 000
20 000
25 000
30 000
35 000
40 000
2007 2008 2009 2010 2011 2012 2013 2014 2015 2016
2016 APICULTURE 9
Beekeepers gather the propolis off special mats placed in hives or by scraping boxes and frames. Propolis in this form is regarded as raw propolis as it contains some beeswax (the proportion varies throughout the season) as well as other contaminants such as parts of bees. Pure propolis is the processed product that has been separated from beeswax and other contaminants.
The recovery rate of pure propolis from raw propolis is approximately 37 to 47 percent early in the season. This decreases to 15 to 25 percent recovery when the nectar flow is on as bees add more wax to the propolis when honey is being produced. Beekeepers reportedly received $54 to $197 per kilogram for the raw unprocessed product, with quotes of $360 to $420 noted for the pure product.
Demand for propolis continued to be strong in 2015/16 with processors competing aggressively for product. This has resulted in higher prices paid to beekeepers, and the provision of a delivery and pick up service for the mats. Beekeepers are attracted to this additional income opportunity as it is easy to manage within existing beekeeping practices.
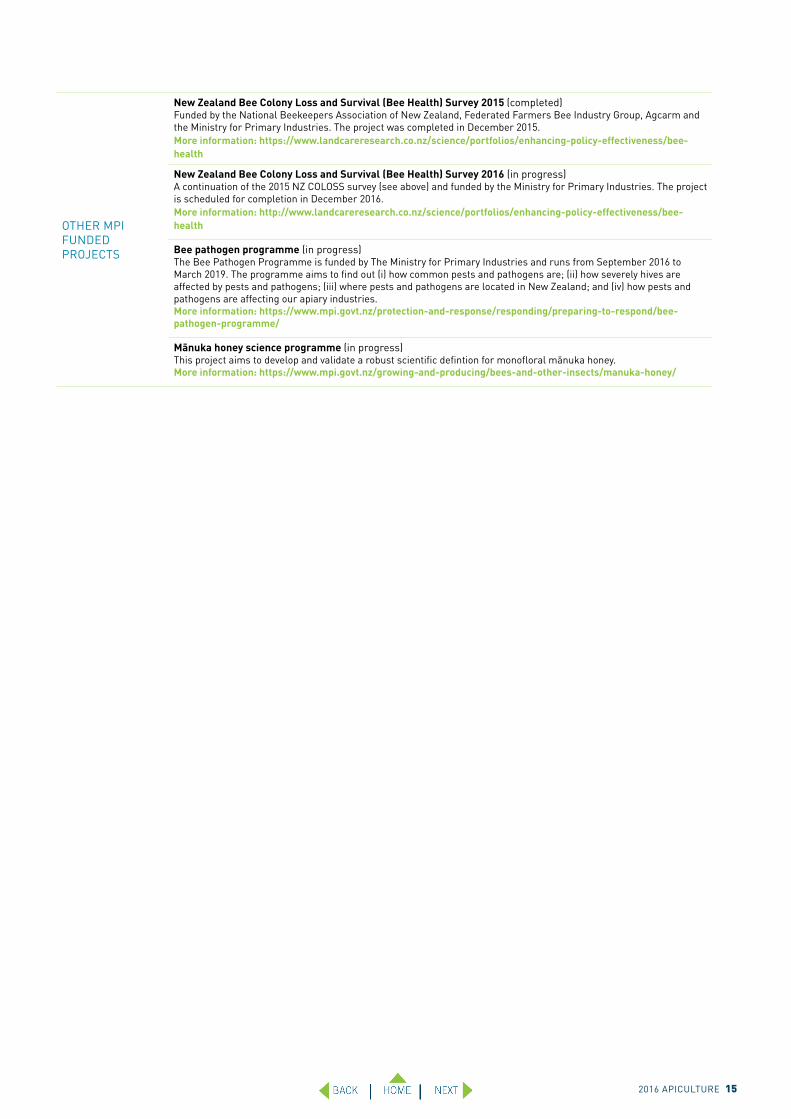
The continued growth of the local beekeeping industry (an additional 108 174 hives in 2015/16) has increased domestic demand for foundation wax and wax for the coating of plastic frames. Whilst demand has increased, domestic supply of beeswax has reduced with changes in honey extraction processes. Some beekeeping operations are setting up new extraction plants without un-cappers, instead relying
solely on prickers. Additionally, some established operators are also altering their extracting plants to remove the use of un-cappers. Pricking frames reduce the overall cost of the extraction plant and can speed up throughput, but also significantly reduces the amount of wax removed from the frames during the extraction process.
The combination of reduced supply and increased domestic demand has resulted in a corresponding reduction in export volumes of beeswax in the year to 30 June 2016 to just 27 tonnes, the lowest export volume in a decade (Table 6). Export prices for beeswax increased in 2015/16 to $17.04 per kilogram compared with $13.31 last season.
BeehivesThe cost of bee colonies increased further in 2015/16 driven by increasing returns from beekeeping (Table 7). Professional valuations of beekeeping businesses placed the value of hives at up to $2000 per hive, based on their income generation history. Such costs would be borne by those looking to start in the industry whilst established beekeepers are able to increase hive numbers by simply splitting existing stock. While hives are a cost for some beekeepers, particularly those in an establishment or expansion phase, it is also an opportunity for established beekeepers looking for other sources of income. Beekeepers providing “one box” hives could expect typical returns of $560 to $800, double the price received last year. Prices of $200 to $300 were paid for 4-frame nucleus colonies, with the buyer providing the supers, lid and floor.
YEAR ENDED 30 JUNE 2007 2008 2009 2010 2011 2012 2013 2014 2015 2016
Export volume (tonnes) 178 106 139 138 160 169 180 148 118 27
Export value ($ million fob1) 1.40 1.01 1.36 1.21 1.45 1.59 1.85 1.71 1.57 0.46
Note1 Free on board. Source: Statistics New Zealand.
TABLE 6: NEW ZEALAND EXPORTS OF BEESWAX, 2007 TO 2016
10 2016 APICULTURE
OPERATING COSTS (TABLE 7)SugarBeekeepers paid between $789 and $1009 per tonne dry weight for sugar in 2015/16, similar to last year. World demand for sugar exceeded supply in 2015/16, reducing surplus stocks from 2014/15. This resulted in an increase in sugar price towards the end of the 2015/16 season.
The USDA Foreign Agricultural Service6 indicates that global sugar consumption will likely exceed production in 2016/17, further reducing inventories. Hence higher sugar prices are anticipated in 2016/17.
Most beekeepers prefer to pay a little extra to have ready mixed liquid syrup delivered. Beekeepers are acutely aware of the issues of accidental or deliberate sugar adulteration. Rapidly expanding export markets such as China are routinely checking honey for evidence of adulteration. There are increasing reports of mānuka honey producers retaining bush honey or clover honey to feed their bees rather than using sugar for feeding bees over winter.
FuelBeekeepers enjoyed lower fuel prices in 2015/16 compared with recent years. With improved profitability, beekeepers are investing in new(er) vehicles and consequently the industry is operating a much younger fleet of vehicles with modern, fuel efficient diesel engines. For some businesses at least, the lower fuel prices and more fuel efficient vehicles should buffer the longer distances travelled for high value nectar flows and servicing pollination contracts.
LabourThe range of wage rates paid to beekeeping staff in 2015/16 remained largely unchanged from last season. Many business owners commented that they intend to move good
6 http://apps.fas.usda.gov/psdonline/circulars/Sugar.pdf
staff up through the pay scale more quickly than in the past, as staff recruitment and retention is becoming more difficult in an increasingly competitive labour market. Remuneration packages, particularly for managerial staff are variable and can include mobile phones, production bonuses, discounted housing, meals, vehicles, extra holidays, and the use of extracting plant and machinery if employees own their own hives.
Apiarists are on Immigration New Zealand’s immediate skill shortage list, allowing businesses to recruit skilled beekeepers from overseas. In addition, businesses are increasingly employing and training unskilled staff.
Site rentalsThe average price paid for apiary site rentals rose again in 2015/16 as competition for sites increases in intensity, especially in the North Island with 97 387 additional hives in the past season. Some beekeepers have reportedly been asked to leave sites that they had occupied for many years on account of the landowner being offered a better deal by another beekeeping operation.
In addition to the traditional per hive, per apiary, and crop percentage rental calculations, beekeepers are also offering large farming operations a ‘per farm’ rental alternative. In 2015/16, this ranged in value depending on the size and yield type associated with the land, with $5000 to $10 000 quoted.
Beekeepers are also paying for good spring build-up apiary sites. Characteristics of preferred spring build-up sites are good access, shelter and pollen sources such as gorse or willow. These are often pastoral farm sites with fees paid of up to $1000 per apiary. Pastoral farmers are being alerted to the downsides of hosting apiaries for spring build-up only, where the hives are then typically moved on to mānuka, as they will likely lose out on the pollination of clover which flowers from October/November onwards.
2016 APICULTURE 11
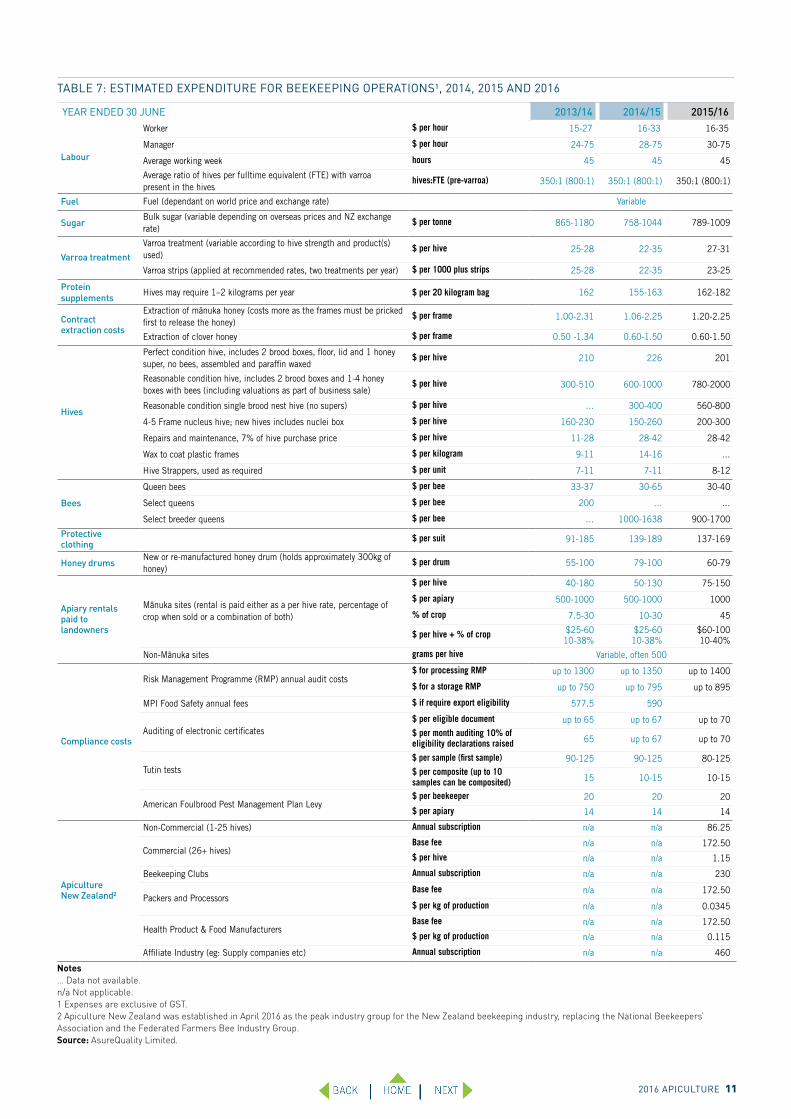
TABLE 7: ESTIMATED EXPENDITURE FOR BEEKEEPING OPERATIONS¹, 2014, 2015 AND 2016
YEAR ENDED 30 JUNE 2013/14 2014/15 2015/16
Labour
Worker $ per hour 15-27 16-33 16-35
Manager $ per hour 24-75 28-75 30-75
Average working week hours 45 45 45
Average ratio of hives per fulltime equivalent (FTE) with varroa present in the hives
hives:FTE (pre-varroa) 350:1 (800:1) 350:1 (800:1) 350:1 (800:1)
Fuel Fuel (dependant on world price and exchange rate) Variable
SugarBulk sugar (variable depending on overseas prices and NZ exchange rate)
$ per tonne 865-1180 758-1044 789-1009
Varroa treatmentVarroa treatment (variable according to hive strength and product(s) used)
$ per hive 25-28 22-35 27-31
Varroa strips (applied at recommended rates, two treatments per year) $ per 1000 plus strips 25-28 22-35 23-25
Protein supplements
Hives may require 1–2 kilograms per year $ per 20 kilogram bag 162 155-163 162-182
Contract extraction costs
Extraction of mānuka honey (costs more as the frames must be pricked first to release the honey)
$ per frame 1.00-2.31 1.06-2.25 1.20-2.25
Extraction of clover honey $ per frame 0.50 -1.34 0.60-1.50 0.60-1.50
Hives
Perfect condition hive, includes 2 brood boxes, floor, lid and 1 honey super, no bees, assembled and paraffin waxed
$ per hive 210 226 201
Reasonable condition hive, includes 2 brood boxes and 1-4 honey boxes with bees (including valuations as part of business sale)
$ per hive 300-510 600-1000 780-2000
Reasonable condition single brood nest hive (no supers) $ per hive … 300-400 560-800
4-5 Frame nucleus hive; new hives includes nuclei box $ per hive 160-230 150-260 200-300
Repairs and maintenance, 7% of hive purchase price $ per hive 11-28 28-42 28-42
Wax to coat plastic frames $ per kilogram 9-11 14-16 …
Hive Strappers, used as required $ per unit 7-11 7-11 8-12
Bees
Queen bees $ per bee 33-37 30-65 30-40
Select queens $ per bee 200 … …
Select breeder queens $ per bee … 1000-1638 900-1700
Protective clothing
$ per suit 91-185 139-189 137-169
Honey drumsNew or re-manufactured honey drum (holds approximately 300kg of honey)
$ per drum 55-100 79-100 60-79
Apiary rentals paid to landowners
Mānuka sites (rental is paid either as a per hive rate, percentage of crop when sold or a combination of both)
$ per hive 40-180 50-130 75-150
$ per apiary 500-1000 500-1000 1000
% of crop 7.5-30 10-30 45
$ per hive + % of crop $25-60 10-38%
$25-60 10-38%
$60-100 10-40%
Non-Mānuka sites grams per hive Variable, often 500
Compliance costs
Risk Management Programme (RMP) annual audit costs$ for processing RMP up to 1300 up to 1350 up to 1400
$ for a storage RMP up to 750 up to 795 up to 895
MPI Food Safety annual fees $ if require export eligibility 577.5 590
Auditing of electronic certificates$ per eligible document up to 65 up to 67 up to 70$ per month auditing 10% of eligibility declarations raised 65 up to 67 up to 70
Tutin tests$ per sample (first sample) 90-125 90-125 80-125$ per composite (up to 10 samples can be composited) 15 10-15 10-15
American Foulbrood Pest Management Plan Levy $ per beekeeper 20 20 20
$ per apiary 14 14 14
Apiculture New Zealand2
Non-Commercial (1-25 hives) Annual subscription n/a n/a 86.25
Commercial (26+ hives)Base fee n/a n/a 172.50
$ per hive n/a n/a 1.15
Beekeeping Clubs Annual subscription n/a n/a 230
Packers and ProcessorsBase fee n/a n/a 172.50
$ per kg of production n/a n/a 0.0345
Health Product & Food ManufacturersBase fee n/a n/a 172.50
$ per kg of production n/a n/a 0.115
Affiliate Industry (eg: Supply companies etc) Annual subscription n/a n/a 460
Notes… Data not available. n/a Not applicable. 1 Expenses are exclusive of GST. 2 Apiculture New Zealand was established in April 2016 as the peak industry group for the New Zealand beekeeping industry, replacing the National Beekeepers’ Association and the Federated Farmers Bee Industry Group. Source: AsureQuality Limited.
12 2016 APICULTURE
INDUSTRY ISSUES AND DEVELOPMENTSTUTIN LEVELS IN HONEYThe 2015/16 season has seen some areas produce a significant volume of honey that has tested above the new tutin limit of 0.7 milligrams per kilogram of honey. The limit prior to the 2015/16 season was 2.0 milligrams per kilogram so this was less of an issue in previous seasons. Beekeepers will need to give greater consideration to the location and timing of honey collection in order to avoid unacceptable levels of tutin in honey.
MONOFLORAL STANDARDS AND LABEL CLAIMS FOR MĀNUKA HONEY As the price of mānuka honey continues to rise, domestic and overseas consumers are increasingly concerned that honey labelled as ‘mānuka’ is authentic. The Ministry for Primary Industries (MPI) issued an “Interim Labelling Guide for Mānuka Honey” in July 2014 as a first step in formally addressing this issue. MPI is leading and managing a three-year science programme with the aim of establishing a regulatory, science-based definition for mono-floral and multi-floral mānuka honey in early 2017. Exported honey is expected to be required to comply with this definition by mid-2017, following a period of consultation.
HIVE THEFT/HIVE VANDALISMHive theft and hive vandalism is a growing issue in the industry. The high value of hives, coupled with the income generation potential, has resulted in them becoming a target for theft.
Beekeepers are extending into established nectar collection areas that they perceive to be under-utilised. Tension between neighbouring beekeepers and/or landowners has in some cases led to hive theft and vandalism.
In order to protect hives, beekeepers are increasingly experimenting with the use of cameras and tracking technology. The police are also aware of the escalating issue and are seeking to work collaboratively with the beekeeping industry to manage the problem at a national level.
Regulatory controls are being promoted by some, but industry, local and central government recognise the legal and practical challenges of implementing and policing regulatory controls over apiary site placement.
BEE HEALTHNew Zealand Colony Loss and Survival surveyThe first New Zealand Colony Loss and Survival (COLOSS) survey was carried out in 2015. This survey involved close to 40 percent of total hives and captured overwintering bee losses reported in the spring of 2015. The national average rate of hive losses in winter 2015 was estimated at 10.7 percent, although there were reports of significant losses in some individual cases. This compares to a hive loss rate of 17 percent in the northern hemisphere. Losses were most frequently attributed to queen problems, colony death (especially starvation), and wasps. Information from the 2015 survey has already proved valuable for the beekeeping industry, MPI, and for many beekeepers. Results from the 2015 survey are available on: https://www.mpi.govt.nz/growing-and-producing/bees-and-other-insects/bee-colony-loss-survey/
The New Zealand COLOSS survey was repeated in 2016 with results available in early 2017. The survey is anonymous, and enables beekeepers to benchmark their experience against national averages. The ability to evaluate bee health on a year by year basis will provide valuable indications of beekeeping practices and emerging issues, and guide further investigation or action.
Bee pathogen programmeMPI launched the Bee Pathogen Programme in September 2016, a three-year research programme to identify honey bee diseases and parasites in New Zealand. Hives from sixty apiaries throughout the country are being inspected for endemic and exotic pests and diseases by authorized experts who then take bee samples to send to MPI laboratories for testing. MPI is developing molecular tests for viruses, bacteria, trypanosomes and microsporidia to compare these New Zealand apiaries with overseas research. Measurements are also being taken of the number of varroa mites and nosema spores per bee using international protocols.
The programme aims to find out (i) how common bee pests and pathogens are; (ii) how severely are hives affected; (iii) where the pests and pathogens are located in New Zealand; and (iv) how they impact our apiary industries. Summary data will be made publicly available following consultation with the research participants.
2016 APICULTURE 13
GIANT WILLOW APHID AND WASPS The giant willow aphid (Tuberolachnus salignus) has spread to most parts of New Zealand.
Beekeepers are reporting difficulties in extracting honey made by bees harvesting honeydew secreted by giant willow aphids. This honey crystallises quickly in the frames. Beekeepers are also concerned about the adverse effect of the aphids on the willow trees, as willows are an important source of spring pollen.
The honeydew is also available to wasps. Supported by a significant food resource late in the autumn, larger wasp nests are able to overwinter making it difficult to keep bees in some heavily wasp-infested areas. Beekeepers are hopeful that a new wasp bait introduced on to the market in 2015/16 will assist in reducing wasp populations.
A new industry-led project “Combating the Giant Willow Aphid” got underway in 2016 with funding from the Sustainable Farming Fund. This project will run for three years and aims to (i) assess the economic impact of Giant Willow Aphid; (ii) identify willow cultivars that are resistant to the aphid; and (iii) investigate options for biological control of the aphid.
The potential for biological control of Vespula wasps via a new mite recently discovered in wasp nests, is being investigated in another Sustainable Farming Fund project.
HEALTH AND SAFETYBeekeepers are reporting increased expenditure and time commitments associated with implementing the Health and Safety at Work Act 2015. Some have opted to use health and safety consultants to assist in assessing risks and putting health and safety management plans and protocols in place. There is increasing investment in machinery and other tools to reduce heavy lifting, such as changing honey boxes to smaller sizes and reduced weights, and buying cranes and lifters.
INDUSTRY UNITYIn April 2016, a new industry peak body called Apiculture New Zealand was established. Apiculture New Zealand replaced the National Beekeepers’ Association and the Federated Farmers Bee Industry Group as the key advocacy group for the New Zealand beekeeping industry. In June 2016, Apiculture New Zealand hosted its first apiculture industry conference attracting some 1400 delegates and 150 trade displays.
Apiculture New Zealand aims to focus on issues across the wider industry, including beekeepers, processors and exporters. It is still building its mandate and membership base. Some beekeepers are concerned that issues of most interest to them might not be well represented in the wider industry body.
14 2016 APICULTURE
PRIMARY GROWTH PARTNERSHIP
High-performance Mānuka Plantations (in progress)The PGP Programme led by Mānuka Research Partnership (NZ) Limited and Comvita Limited aims to move the industry from wild harvest to science-based farming of mānuka plantations.More information: http://www.mpi.govt.nz/funding-and-programmes/primary-growth-partnership/primary-growth-partnership-programmes/high-performance-manuka-plantations/
SUSTAINABLE FARMING FUND
TREES FOR BEES: Strategic bee plantations for pollination and honey (in progress)The aim of this project is to support the development of the wider agricultural sector to achieve sustainability and growth targets, through increased honey and related medical product exports, and by improved pasture, horticulture and arable crop pollination helping drive growth. This will be achieved by having healthy and thriving bee populations through focused research on floral pollen and nectar sources that meet bee nutrition requirements at the right time and in sufficient quantity, and strategic bee plantations that enable apiarists, farmers and landowners to ensure year-round bee feed supplies. These outcomes will be delivered through demonstration farms, workshops and field days and employ a suite of extension tools developed during the project. More information: http://www.mpi.govt.nz/document-vault/11941
TREES FOR BEES: Producing abundant bee pollinators for sustainable farming (in progress)This project aims to increase the number of strong, healthy honey bees to ensure pollination services for agricultural crops. In many areas, pollen and nectar sources are being removed leading to poor nutrition for bees. They become weakened, malnourished and sometimes starving. To restore flowers for bees we are installing demonstration plantations of trees and shrubs to show how to supply a steady source of high-protein pollen to support bee colonies. The result will be more bees for pollination services leading to increased crop and pasture yields.More information: http://www.treesforbeesnz.org/research/project-4-producing-abundant-bee-pollinators-for-sustainable-farming
TREES FOR BEES: Flowers for healthy bees in times of pollen dearth (recently completed)The project aims to improve honey bee health by increasing the availability of nutritious pollen sources by: identifying good bee plants that have protein-rich pollen and flower at the right times especially when there is a pollen shortage; trialling the use of good bee plants that are the most practical plants for farms; and encouraging farmers to plant good bee plants to protect and support bees.More information: http://www.treesforbeesnz.org/research/healthy-bees
Combating the Giant Willow Aphid (in progress)Willows are highly valued in New Zealand as early season nectar and pollen sources critical to the spring growth of honeybee colonies, and for soil erosion control and riverbank stabilisation. The giant willow aphid (GWA), an invasive exotic species first reported in New Zealand in December 2013, is now found throughout New Zealand and is causing a cascading series of impacts. Infestation causes tree stress that reduces willow health and productivity. Aphids secrete large quantities of honeydew, rich in melezitose sugar that is readily collected by bees and introduced vespulid wasps. Melizitose-enriched honey crystallises within the hive, resulting in a significant volume of honey being either rendered non-extractable or tainted by the melezitose. This programme responds to an urgent widespread need from various industry groups by tackling three areas: 1) the economic impact of GWA, 2) identifying GWA-resistant willow cultivars, and 3) determining options for biological control of GWA.
New mite for biological control of Vespula wasps (in progress)European wasps of the genus Vespula are now a serious invasive pest throughout New Zealand, causing direct economic losses and putting labourers at risk in various primary sectors. A recent review concluded that available control options offer limited relief, and are restricted in range. Biocontrol, on the other hand, can offer a sustainable long-term solution that will complement current control methods. In addition to providing large-scale long-term control, biocontrol is environmentally-safe and highly cost-effective in the long run. This project will explore the potential of a new mite recently discovered in wasp nests as a biocontrol solution for Vespula wasps. Using lab studies we will develop the mite as a safe and effective biocontrol tool. Field surveys will be conducted to determine the spread and impact of the mite on wasp populations.More information: http://www.landcareresearch.co.nz/science/plants-animals-fungi/animals/invertebrates/invasive-invertebrates/wasps/wasp-biocontrol-updates
A collaborative industry approach to reduce the threat of pyrrolizidine alkaloids in honey (recently completed)The Bee Products Standards Council (BPSC) is undertaking a significant research project to ensure that New Zealand honey remains a safe food.More information: http://maxa.maf.govt.nz/sff/about-projects/search/12-018/index.htm
Sustainable beekeeping by and for Māori landowners (in progress)The project aims to assess and develop year round nutritional resources for honey bees to promote sustainable residential beekeeping on Māori land.
Developing a Bee Industry in Te Riu O Waiapu: A Project Management Role (recently completed)The project aims to address a core and critical phase of a long-term project and vision for a substantial beekeeping and whanau-based bee product industry for the Waiapu, a whanau-based community in the East Cape area.
Honeybee genetics for sustainability and pollination security (recently completed)The project aims to deliver practical solutions that will increase the sustainability of beekeeping, and its effectiveness in servicing NZ’s primary industries. We will apply new genetic assays to identify at-risk bee populations and provide breeding strategies to improve their genetic resilience. We will also trial a novel technique to identify bees with improved pollination performance and determine whether this trait can be selected for within breeding programmes.More information: http://maxa.maf.govt.nz/sff/about-projects/search/12-017/index.htm
TABLE 8: MPI-FUNDED APICULTURE AND HONEY PROJECTS
2016 APICULTURE 15
OTHER MPI FUNDED PROJECTS
New Zealand Bee Colony Loss and Survival (Bee Health) Survey 2015 (completed)Funded by the National Beekeepers Association of New Zealand, Federated Farmers Bee Industry Group, Agcarm and the Ministry for Primary Industries. The project was completed in December 2015.More information: https://www.landcareresearch.co.nz/science/portfolios/enhancing-policy-effectiveness/bee-health
New Zealand Bee Colony Loss and Survival (Bee Health) Survey 2016 (in progress)A continuation of the 2015 NZ COLOSS survey (see above) and funded by the Ministry for Primary Industries. The project is scheduled for completion in December 2016.More information: http://www.landcareresearch.co.nz/science/portfolios/enhancing-policy-effectiveness/bee-health
Bee pathogen programme (in progress)The Bee Pathogen Programme is funded by The Ministry for Primary Industries and runs from September 2016 to March 2019. The programme aims to find out (i) how common pests and pathogens are; (ii) how severely hives are affected by pests and pathogens; (iii) where pests and pathogens are located in New Zealand; and (iv) how pests and pathogens are affecting our apiary industries.More information: https://www.mpi.govt.nz/protection-and-response/responding/preparing-to-respond/bee-pathogen-programme/
Mānuka honey science programme (in progress)This project aims to develop and validate a robust scientific defintion for monofloral mānuka honey.More information: https://www.mpi.govt.nz/growing-and-producing/bees-and-other-insects/manuka-honey/
16 2016 APICULTURE
Ministry for Primary Industries PO Box 2526, Wellington 6140, New Zealand Freephone 0800 00 83 33 Email: [email protected] Web: www.mpi.govt.nz
ISBN No. 978-1-77665-488-8 (Print) ISBN No. 978-1-77665-487-1 (Online) © Crown copyright February 2017 – Ministry for Primary Industries
DisclaimerThe information in this report by the Ministry for Primary Industries is based on the best information available to the the Ministry at the time it was drawn up and all due care was exercised in its preparation. As it is not possible to foresee all uses of this information or to predict all future developments and trends, any subsequent action that relies on the accuracy of the information in this report is the sole commercial decision of the user and is taken at his/her own risk. Accordingly, the Ministry for Primary Industries disclaims any liability whatsoever for any losses or damages arising out of the use of this information, or in respect of any actions taken.
INFORMATION ABOUT THE COMMENTARYThis commentary was developed from information gathered through surveys completed by beekeepers, honey packers and exporters and augmented with a review of export documents, the apiary database and published reports.
Honey production, price and expenses figures are based on a survey of a range of beekeeping enterprises that account for 40 to 50 percent of registered hives in New Zealand. The survey is administered by AsureQuality Limited during their annual Risk Management Programme audits and/or hive audits, and via targeted interviews.
Surveys record honey crop information based on the beekeeper enterprise location, not apiary (or hive) locations. This means that honey production information is recorded against where the honey is extracted, not harvested.
Therefore, with an increasing trend of migrating hives long distances to harvest mānuka, in particular in the North Island, caution needs to be exercised in interpreting the regional breakdown of honey production and yield per hive.
The data recorded in the surveys are extrapolated to provide an estimate of national honey production, price ranges for honey and honey products, and expenses for beekeeping operations.
For more information please contact: [email protected]