Embed Size (px)
Citation preview
2016–17 Australian Plastics Recycling Survey – National report
Envisage Works – Positive Impact Consulting
Page ii
This report has been commissioned and funded by the following organisations:
• Australian Government Department of the Environment and Energy
• Queensland Department of Environment and Heritage Protection
• Western Australia Department of Environment Regulation
• Sustainability Victoria
• New South Wales Environment Protection Authority.
We acknowledge the time and effort that companies around Australia put into completing this survey year-on-year. This support allows the survey to be completed each year, with the outcome being one of the most long-running and comprehensive studies of its type in Australia. We would like to acknowledge and sincerely thank the following organisations for their input and support of the 2016–17 Australian Plastics Recycling Survey:
• Plastics reprocessors — for the provision of extensive data on plastics reprocessing activity in Australia.
• Waste plastics exporters — for the provision of information on the scrap plastics export market activity.
• Australian polymer producers and major importers — for the provision of resin production and consumption data.
• Supermarket industry and plastic bag manufacturers – for the provision of detailed information and advice on plastic bag consumption nationally.
• Green Industries SA for the provision of South Australian plastics recycling data.
Project name: 2016–17 Australian Plastics Recycling Survey
Report title: National report
Author: Kyle O’Farrell
Reviewers: Peter Allan and Dan A’Vard
Project reference: A21502 Envisage Works (ABN 12 584 231 841)
PO Box 7050, Reservoir East VIC 3073
Document reference: R01-04-A21502
Date: 1 May 2018
Disclaimer
This report has been prepared on behalf of and for the exclusive use of the Department of the Environment and Energy, and is subject to and issued in accordance with the agreement between the Department of the Environment and Energy and Envisage Works. Envisage Works accepts no liability or responsibility whatsoever for any use of or reliance upon this report by any third party.
2016–17 Australian Plastics Recycling Survey – National report
Envisage Works – Positive Impact Consulting
Page iii
2016–17 Australian Plastics Recycling Survey – National report
Envisage Works – Positive Impact Consulting
Page iv
ABS/SAN Acrylonitrile butadiene styrene and styrene acrylonitrile (PIC 7).
Commercial and Industrial (C&I) Material from all commercial and industry sources other than building and demolition.
Construction and Demolition (C&D)
Material from the construction, refurbishment and building demolition industries.
Consumption Total use of product by Australian industry and consumers. Includes locally made and used product, imported product and locally utilised recyclate. Does not include locally made product that is exported for sale.
Converter Company which converts polymer resin, either virgin resin or recycled content resin, into plastic products.
Diversion rate Recycling as a proportion of end-of-life disposal.
Domestic Material from domestic (household) sources.
Export for reprocessing Material sent for reprocessing overseas.
Feedstock (chemical) recycling The use of chemical processes such as pyrolysis to convert scrap plastics into a hydrocarbon gas or liquid (often a polymer to monomer conversion) that is usable as a fuel or as an input for manufacturing plastics resins.
Flexible plastics Plastic material that does not hold a three-dimensional shape during sorting and transport.
Household Material from domestic (household) sources.
In the gate Material entering a facility for reprocessing. This may include material that is unusable due to contamination.
Internal use Recyclate processed and used within the one company.
Local use Recyclate used within Australia by an Australian company in the manufacture of a new product.
Local/Locally In Australia.
Mechanical recycling The use of physical processes such as sorting, chipping, grinding, washing and extruding to convert scrap plastics to a usable input for the manufacture of new products.
MRF Material Recovery Facility – a facility for the sorting of recyclables (typically packaging) into various product streams.
Municipal Household material plus material from public place recycling.
Non-packaging / durable Long-term use item; not designed to be single use or disposable within a 12-month period.
Other Polymers other than those individually analysed; includes nylon, polyurethane, polycarbonate and polyesters.
Out the gate Material leaving a facility following reprocessing, and excludes most contamination.
Packaging Plastic material used for the containment, protection, marketing or handling of product. Includes primary, secondary and tertiary/freight packaging in both consumer and industrial packaging applications.
PE-HD or HDPE High density polyethylene (PIC 2). Typically referred to as HDPE.
PE-LD/LLD or LDPE/LLDPE Both low density polyethylene and linear low density polyethylene (PIC 4). Typically referred to as LDPE/LLDPE.
PE-LD or LDPE Low density polyethylene (PIC 4). Typically referred to as LDPE.
PE-LLD or LLDPE Linear low density polyethylene (PIC 4). Typically referred to as LLDPE.
PET Polyethylene terephthalate (PIC 1).
PIC Plastic identification code.
PU or PUR Polyurethane (PIC 7).
Post-consumer domestic Used material from household sources. Mostly packaging material from kerbside recycling collections.
Post-consumer industrial Used material from non-household sources.
PP Polypropylene (PIC 5).
Pre-consumer industrial
Scrap off-cuts and off-specification items in the manufacturing industry which are not used by the consumer which are collected for reprocessing at a different site. Does not include material that is recycled directly back into manufacturing processes at the same site. Does not include material that has reached the end consumer, whether domestic or industrial.
PS Polystyrene (PIC 6).
2016–17 Australian Plastics Recycling Survey – National report
Envisage Works – Positive Impact Consulting
Page v
PS-E or EPS Expanded polystyrene (PIC 6). Typically referred to as EPS.
PVC Polyvinyl chloride (PIC 3).
Recovery The amount of material collected for recycling.
Recyclate Scrap material either before or after reprocessing.
Recycling A general term covering the process chain of collection, sorting, reprocessing and the manufacture of new products.
Reprocess Process(es) by which aggregated end-of-life materials are converted into a raw material that can be used as an input into new product manufacturing.
Resin Raw polymer material.
Sorting A process typically between collection (recovery) and reprocessing in which collected end-of-life materials are sorted (or disassembled) into more usable and economically valuable material fractions.
Virgin All-new polymer material containing no recycled material.
Waste plastics export Export of (typically baled) scrap plastics material sent off-shore for reprocessing.
XPS Extruded polystyrene (PIC 6).
2016–17 Australian Plastics Recycling Survey – National report
Envisage Works – Positive Impact Consulting
Page 1
In 2017, the Department of the Environment and Energy, and Queensland, Western Australian, Victorian and NSW state agencies commissioned the annual Australian Plastics Recycling Survey (APRS) to capture the consumption and recycling of plastics in Australia during the 2016–17 financial year.
This information is collected through a detailed survey of Australian reprocessors, Australian resin manufacturers and importers, and extensive interrogation of Australian Customs data, sourced from the Department of Foreign Affairs and Trade (DFAT).
Green Industries SA performs its own survey of South Australian plastics reprocessors and material recovery facility operators, and the data from that survey is incorporated into this report.
The 2017 survey has been conducted by the partnership of Envisage Works and Sustainable Resource Use (SRU), and the survey results are aggregated and analysed within this report. This research started in 1997 and has been undertaken annually since 2000.
For the first time this year’s survey includes consumption and recycling of tyres nationally.
As an add-on task to the main time-series APRS study this year, an assessment of national consumption of plastic retail carry bags in 2016–17 has been undertaken, with a focus on single-use bags.
The survey provides a comprehensive picture of the consumption, flow, recovery and recycling of plastics in Australia, the state of reprocessing markets and assists in informing the status of product stewardship commitments in relation to plastic products. The survey is a valuable tool for promotion, knowledge of the industry and forward planning, including informing and tracking policies and programs to further improve plastics resource efficiency over whole of life.
The key findings of the Australian Plastics Recycling Survey assessing the 2016–17 financial year are:
• A total of 3 513 100 tonnes of plastics were consumed in Australia in 2016–17.
• A total of 293 900 tonnes of plastics were recycled in 2016–17 (excluding tyres recovery), which is a fall of 10% from 2015–16 recovery. Including tyres total plastics recovery was 415 200 tonnes.
• In 2016–17 the national plastics recycling rate was 11.8%.
• Of the 415 200 tonnes of plastics collected for recycling, 180 100 tonnes (43.4%) was reprocessed in Australia and 235 100 tonnes (56.6%) was exported for reprocessing. Local reprocessing was flat from 2015–16, with export for reprocessing falling by 20%.
2016–17 Australian Plastics Recycling Survey – National report
Envisage Works – Positive Impact Consulting
Page 2
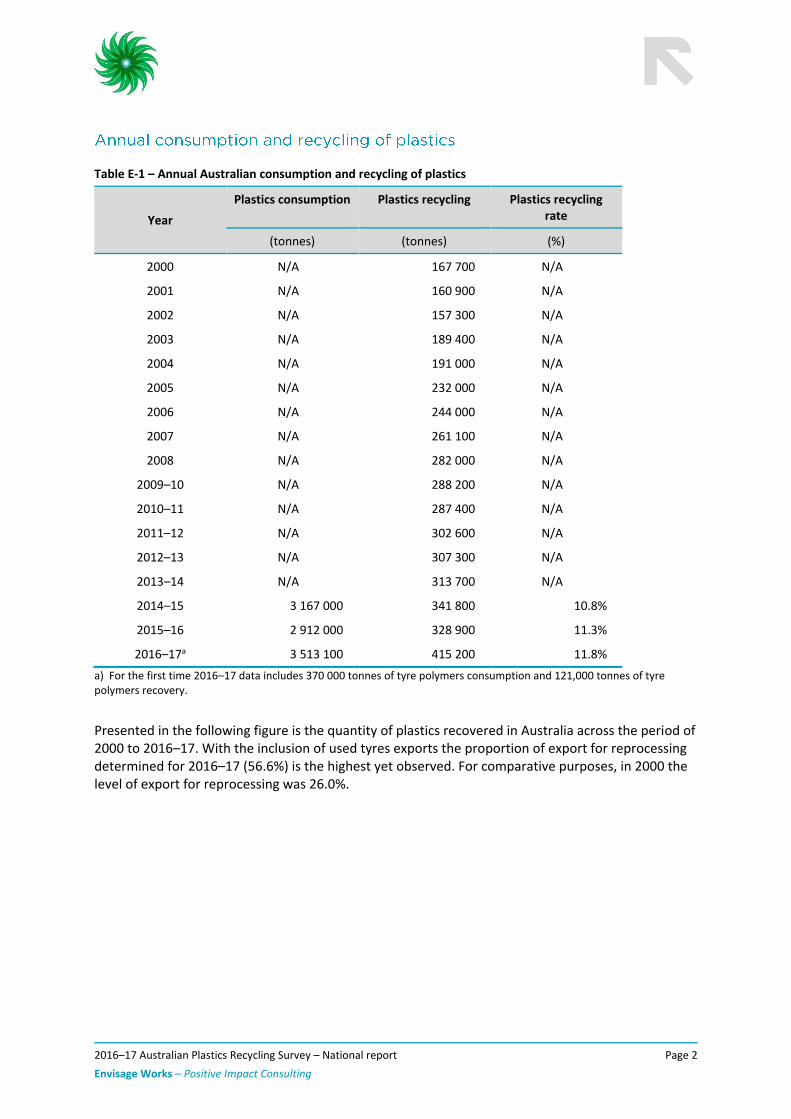
Table E-1 – Annual Australian consumption and recycling of plastics
Year
Plastics consumption Plastics recycling Plastics recycling rate
(tonnes) (tonnes) (%)
2000 N/A 167 700 N/A
2001 N/A 160 900 N/A
2002 N/A 157 300 N/A
2003 N/A 189 400 N/A
2004 N/A 191 000 N/A
2005 N/A 232 000 N/A
2006 N/A 244 000 N/A
2007 N/A 261 100 N/A
2008 N/A 282 000 N/A
2009–10 N/A 288 200 N/A
2010–11 N/A 287 400 N/A
2011–12 N/A 302 600 N/A
2012–13 N/A 307 300 N/A
2013–14 N/A 313 700 N/A
2014–15 3 167 000 341 800 10.8%
2015–16 2 912 000 328 900 11.3%
2016–17a 3 513 100 415 200 11.8%
a) For the first time 2016–17 data includes 370 000 tonnes of tyre polymers consumption and 121,000 tonnes of tyre polymers recovery.
Presented in the following figure is the quantity of plastics recovered in Australia across the period of 2000 to 2016–17. With the inclusion of used tyres exports the proportion of export for reprocessing determined for 2016–17 (56.6%) is the highest yet observed. For comparative purposes, in 2000 the level of export for reprocessing was 26.0%.
2016–17 Australian Plastics Recycling Survey – National report
Envisage Works – Positive Impact Consulting
Page 3
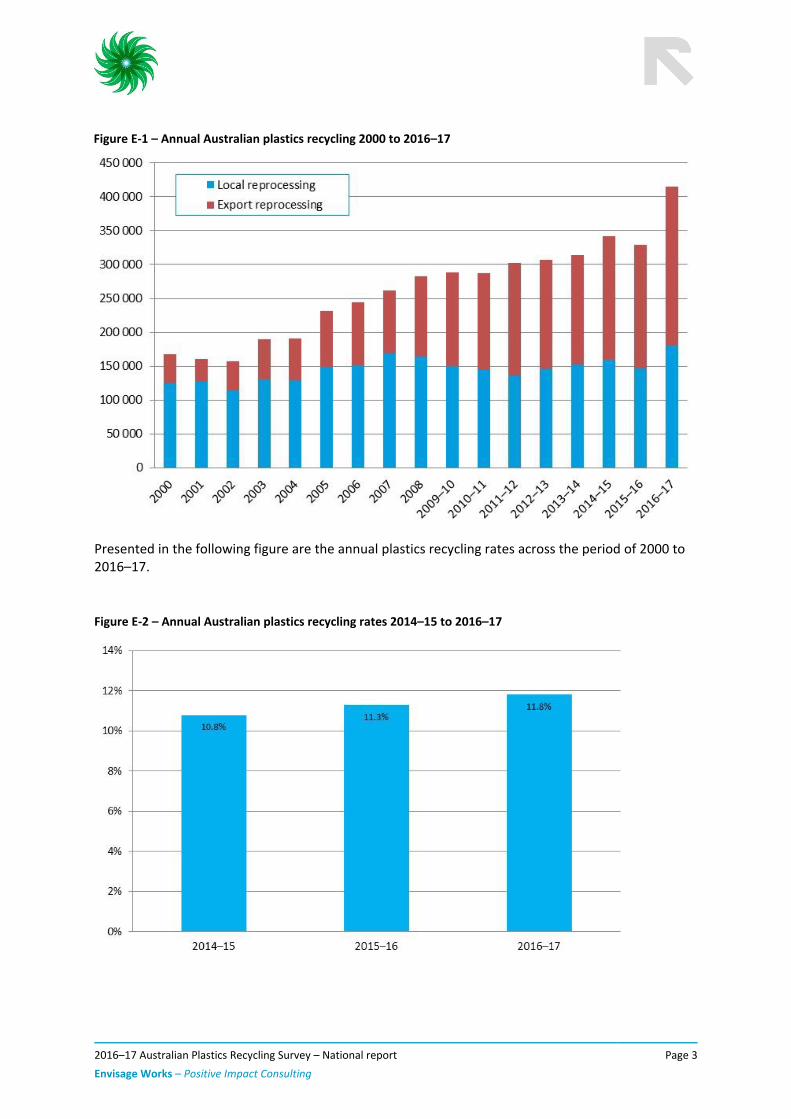
Figure E-1 – Annual Australian plastics recycling 2000 to 2016–17
Presented in the following figure are the annual plastics recycling rates across the period of 2000 to 2016–17.
Figure E-2 – Annual Australian plastics recycling rates 2014–15 to 2016–17

2016–17 Australian Plastics Recycling Survey – National report
Envisage Works – Positive Impact Consulting
Page 4
Around 66% of plastics consumption is now through imported finished and semi-finished goods, with only 34% of consumption through local manufacturing using either virgin resins (locally manufactured or imported) or locally processed recyclate based resins.
Figure E-3 – Australian plastics consumption by polymer type and source in 2016–17 (tonnes)
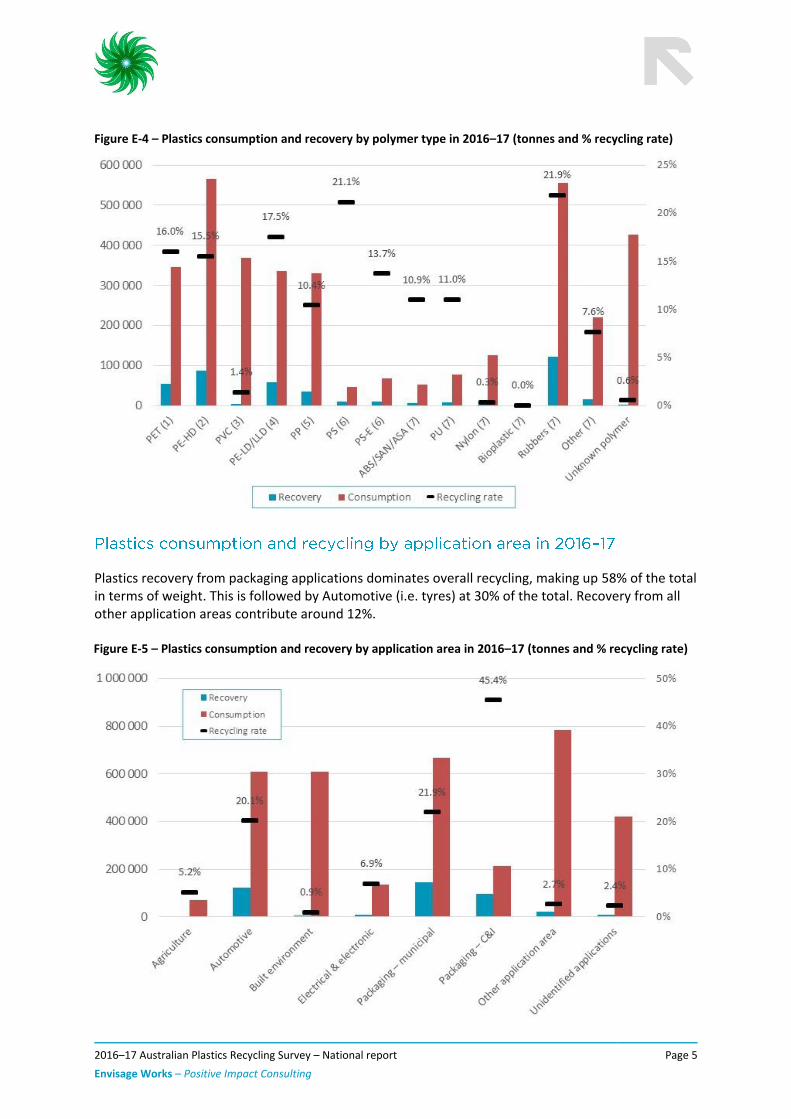
The highest recycling rate observed in 2016–17 was for rubber at 21.9% (sourced from tyres), followed by polystyrene (sourced from packaging, and electrical and electronic waste) at 21.1%. The recycling of these polymer is underpinned by product stewardship schemes, the National Tyre Product Stewardship Scheme in the case of tyres, and both the Australian Packaging Covenant and National Television and Computer Recycling Scheme in the case of polystyrene.
Following rubber and polystyrene the next highest recycling rates were for LDPE/LLDPE (17.5%), PET (16.0%) and HDPE (15.5%). This reflects the relatively high proportion of the consumption of these polymer types going into packaging applications (both flexible and rigid), with the generally higher recycling rates of plastics going into packaging applications relative to other application areas.
2016–17 Australian Plastics Recycling Survey – National report
Envisage Works – Positive Impact Consulting
Page 5
Figure E-4 – Plastics consumption and recovery by polymer type in 2016–17 (tonnes and % recycling rate)
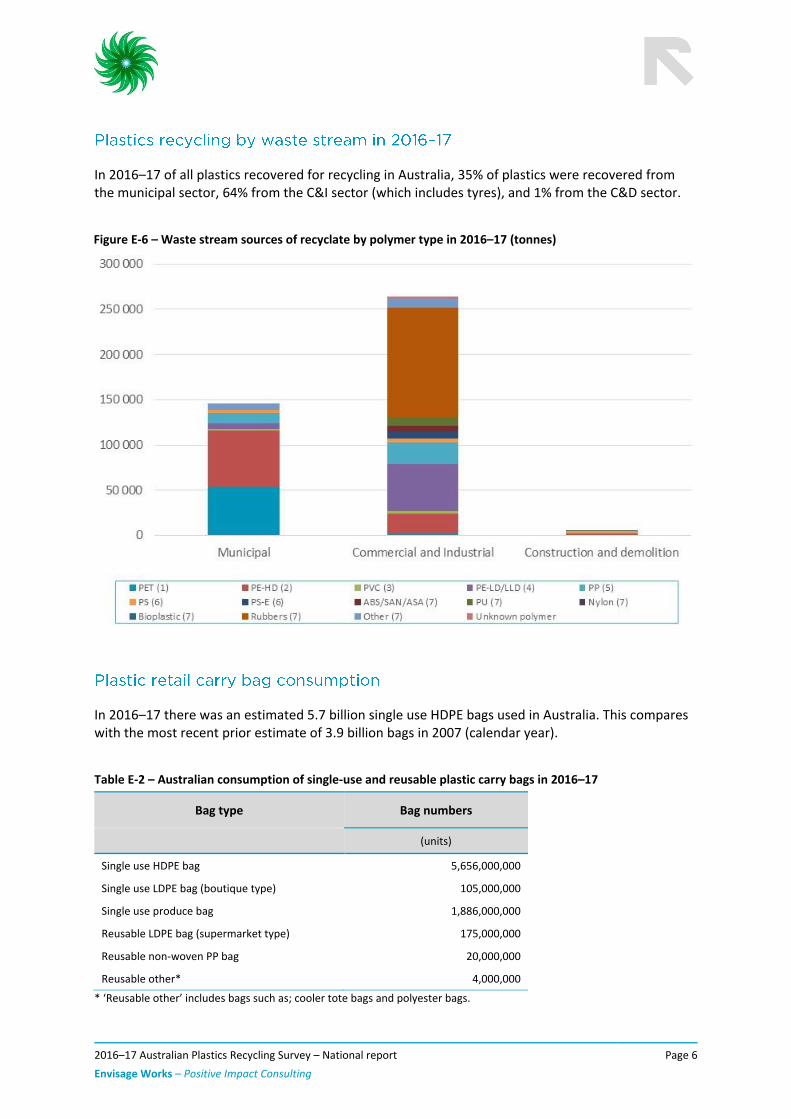
Plastics recovery from packaging applications dominates overall recycling, making up 58% of the total in terms of weight. This is followed by Automotive (i.e. tyres) at 30% of the total. Recovery from all other application areas contribute around 12%. Figure E-5 – Plastics consumption and recovery by application area in 2016–17 (tonnes and % recycling rate)
2016–17 Australian Plastics Recycling Survey – National report
Envisage Works – Positive Impact Consulting
Page 6
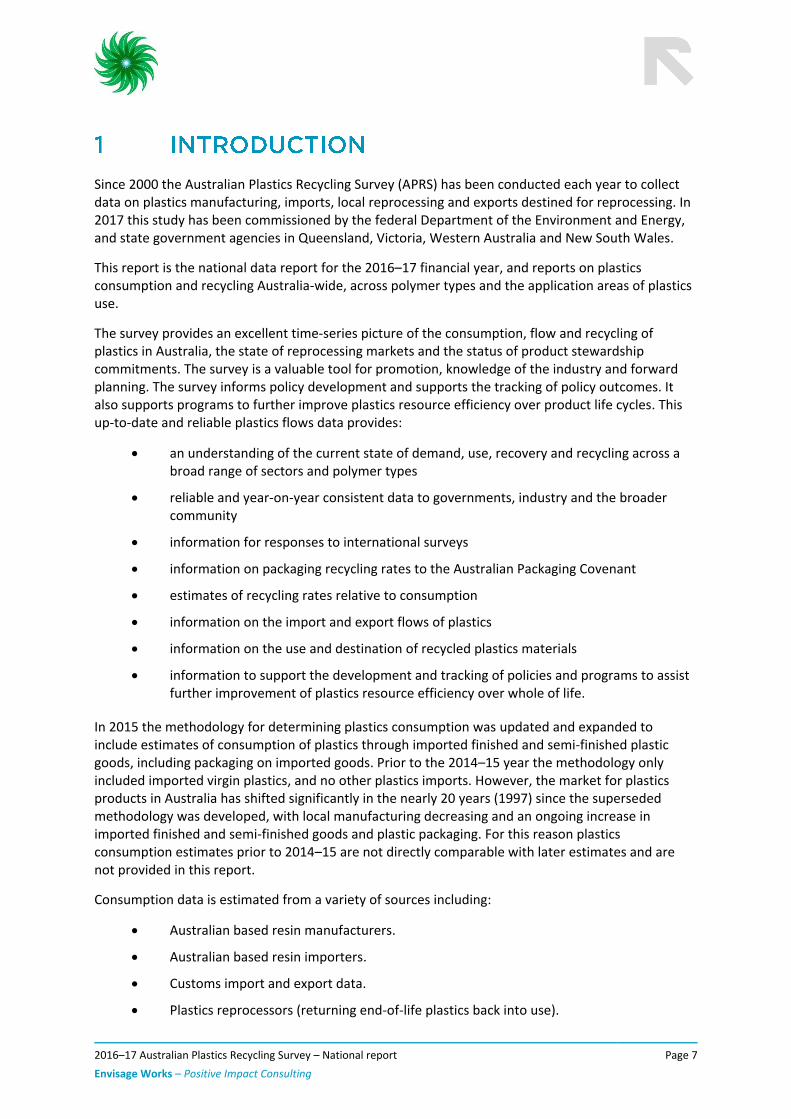
In 2016–17 of all plastics recovered for recycling in Australia, 35% of plastics were recovered from the municipal sector, 64% from the C&I sector (which includes tyres), and 1% from the C&D sector.
Figure E-6 – Waste stream sources of recyclate by polymer type in 2016–17 (tonnes)
In 2016–17 there was an estimated 5.7 billion single use HDPE bags used in Australia. This compares with the most recent prior estimate of 3.9 billion bags in 2007 (calendar year).
Table E-2 – Australian consumption of single-use and reusable plastic carry bags in 2016–17
Bag type Bag numbers
(units)
Single use HDPE bag 5,656,000,000
Single use LDPE bag (boutique type) 105,000,000
Single use produce bag 1,886,000,000
Reusable LDPE bag (supermarket type) 175,000,000
Reusable non-woven PP bag 20,000,000
Reusable other* 4,000,000
* ‘Reusable other’ includes bags such as; cooler tote bags and polyester bags.
2016–17 Australian Plastics Recycling Survey – National report
Envisage Works – Positive Impact Consulting
Page 7
Since 2000 the Australian Plastics Recycling Survey (APRS) has been conducted each year to collect data on plastics manufacturing, imports, local reprocessing and exports destined for reprocessing. In 2017 this study has been commissioned by the federal Department of the Environment and Energy, and state government agencies in Queensland, Victoria, Western Australia and New South Wales.
This report is the national data report for the 2016–17 financial year, and reports on plastics consumption and recycling Australia-wide, across polymer types and the application areas of plastics use.
The survey provides an excellent time-series picture of the consumption, flow and recycling of plastics in Australia, the state of reprocessing markets and the status of product stewardship commitments. The survey is a valuable tool for promotion, knowledge of the industry and forward planning. The survey informs policy development and supports the tracking of policy outcomes. It also supports programs to further improve plastics resource efficiency over product life cycles. This up-to-date and reliable plastics flows data provides:
• an understanding of the current state of demand, use, recovery and recycling across a broad range of sectors and polymer types
• reliable and year-on-year consistent data to governments, industry and the broader community
• information for responses to international surveys
• information on packaging recycling rates to the Australian Packaging Covenant
• estimates of recycling rates relative to consumption
• information on the import and export flows of plastics
• information on the use and destination of recycled plastics materials
• information to support the development and tracking of policies and programs to assist further improvement of plastics resource efficiency over whole of life.
In 2015 the methodology for determining plastics consumption was updated and expanded to include estimates of consumption of plastics through imported finished and semi-finished plastic goods, including packaging on imported goods. Prior to the 2014–15 year the methodology only included imported virgin plastics, and no other plastics imports. However, the market for plastics products in Australia has shifted significantly in the nearly 20 years (1997) since the superseded methodology was developed, with local manufacturing decreasing and an ongoing increase in imported finished and semi-finished goods and plastic packaging. For this reason plastics consumption estimates prior to 2014–15 are not directly comparable with later estimates and are not provided in this report.
Consumption data is estimated from a variety of sources including:
• Australian based resin manufacturers.
• Australian based resin importers.
• Customs import and export data.
• Plastics reprocessors (returning end-of-life plastics back into use).
2016–17 Australian Plastics Recycling Survey – National report
Envisage Works – Positive Impact Consulting
Page 8
As this project was undertaken as a national study and there is currently insufficient data available to break down consumption by jurisdiction, consumption has been split by jurisdiction based on per capita allocations. As such, estimates for jurisdiction based consumption do not include the varying intensity of industry across different jurisdictions nor allow for any variable patterns of domestic consumption.
For all plastic products, recovery is often an important stage of the product life cycle. While there are a range of current technologies available for recovery, in Australia mechanical recycling is the primary process used to recover plastic materials, with energy recovery accounting for minimal recovery during 2016–17 (around 1–2%). The export market is different, most notably with most used tyres exported from Australia going into the international tyre derived fuel (TDF) market.
The life-span of plastic products varies from short-term single-use items, to long-term durable products which may remain in use for many years before reaching end-of-life. This creates a challenge for estimating the recycling rates of plastic products with a lifespan of more than 1–2 years as consumption is not equivalent to the quantity of plastics reaching end-of-life (waste arisings) and are thus available for recovery. This issue and how it is handled is discussed in more detail in Section 3.4 of this report.
The demand for recycled plastics, used in the production of new products, has continued to grow in strength both domestically and internationally, albeit sometimes slowly. Well-developed plastics recycling through the kerbside recycling system enables the collection of many post-consumer household recyclables. There are also established systems for the collection and reprocessing of pre-consumer industrial scrap and many types of post-consumer industrial plastics.
However away-from-home plastic packaging recycling systems, and systems for the recovery of many types of durable plastic items, both residential and non-residential, are not nearly so well developed, and most of these products continue to be disposed to landfill at end of life.
For clarity, the definition of a ‘plastic’ that has been applied in the survey scope coverage and this report is:
A plastic material is any of a wide range of synthetic or semi-synthetic organic solids that are mouldable. Plastics are typically organic polymers of high molecular mass, but they often contain other substances. They are usually synthetic, most commonly derived from petrochemicals, but many are either partially natural or fully natural (i.e. biobased).
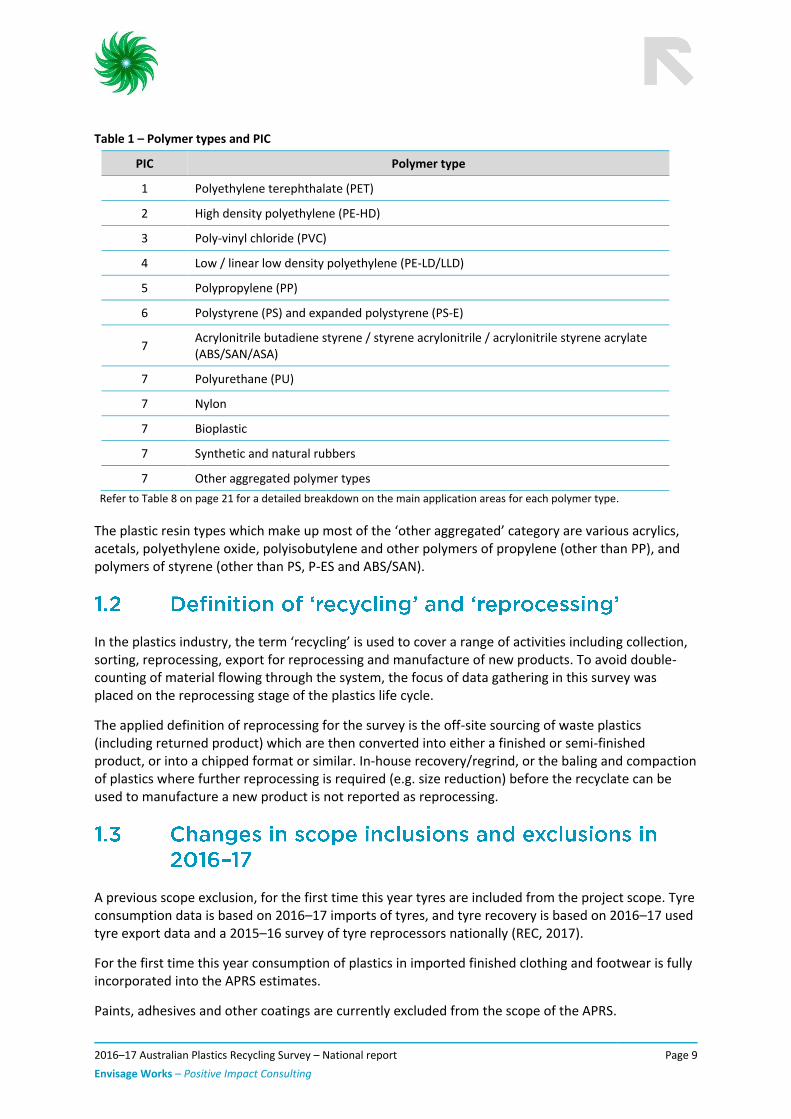
The polymer types covered in the study are summarised in the following table.
2016–17 Australian Plastics Recycling Survey – National report
Envisage Works – Positive Impact Consulting
Page 9
Table 1 – Polymer types and PIC
PIC Polymer type
1 Polyethylene terephthalate (PET)
2 High density polyethylene (PE-HD)
3 Poly-vinyl chloride (PVC)
4 Low / linear low density polyethylene (PE-LD/LLD)
5 Polypropylene (PP)
6 Polystyrene (PS) and expanded polystyrene (PS-E)
7 Acrylonitrile butadiene styrene / styrene acrylonitrile / acrylonitrile styrene acrylate (ABS/SAN/ASA)
7 Polyurethane (PU)
7 Nylon
7 Bioplastic
7 Synthetic and natural rubbers
7 Other aggregated polymer types
Refer to Table 8 on page 21 for a detailed breakdown on the main application areas for each polymer type.
The plastic resin types which make up most of the ‘other aggregated’ category are various acrylics, acetals, polyethylene oxide, polyisobutylene and other polymers of propylene (other than PP), and polymers of styrene (other than PS, P-ES and ABS/SAN).
In the plastics industry, the term ‘recycling’ is used to cover a range of activities including collection, sorting, reprocessing, export for reprocessing and manufacture of new products. To avoid double-counting of material flowing through the system, the focus of data gathering in this survey was placed on the reprocessing stage of the plastics life cycle.
The applied definition of reprocessing for the survey is the off-site sourcing of waste plastics (including returned product) which are then converted into either a finished or semi-finished product, or into a chipped format or similar. In-house recovery/regrind, or the baling and compaction of plastics where further reprocessing is required (e.g. size reduction) before the recyclate can be used to manufacture a new product is not reported as reprocessing.
A previous scope exclusion, for the first time this year tyres are included from the project scope. Tyre consumption data is based on 2016–17 imports of tyres, and tyre recovery is based on 2016–17 used tyre export data and a 2015–16 survey of tyre reprocessors nationally (REC, 2017).
For the first time this year consumption of plastics in imported finished clothing and footwear is fully incorporated into the APRS estimates.
Paints, adhesives and other coatings are currently excluded from the scope of the APRS.
2016–17 Australian Plastics Recycling Survey – National report
Envisage Works – Positive Impact Consulting
Page 10
Latex into plastics applications is included in the project scope, as it is often blended with synthetic rubbers for many applications.
This report provides data on plastics reprocessing from Australian sources for the 2016–17 financial year. Data for 58 reprocessing facilities nationally, out of 64 reprocessors known to be operating during 2016–17, has been obtained either through surveys or estimated (six facilities) and incorporated into the survey dataset. This is a coverage rate of 90% by number, and is estimated to account for >95% of local reprocessing by weight. Considering individual reprocessor stated response accuracies, nationwide it is estimated that local reprocessing quantities provided in this report are within ±9% of actual reprocessing.
As this project was undertaken as a national study and there is insufficient data available to break down consumption by jurisdiction, consumption has been split by jurisdiction on a per capita basis. As such, estimates for jurisdiction based consumption do not include the varying intensity of industry across different jurisdictions nor allow for any variable patterns of domestic consumption. For comparison purposes the use of gross state expenditure (GSE) based jurisdictional consumption splits were also reviewed, however this data appeared to overstate consumption in the smaller jurisdictions and so has not been applied or further reported.
National Television and Computer Recycling Scheme (NTCRS) data incorporated into the study is for the 2015–16 financial year, as 2016–17 data was not available at the time of reporting.
Local tyre industry data on the processing of tyres into tyre crumb and similar products for the local market, is for the 2015–16 financial year, as 2016–17 data was not available at the time of reporting. This represents around 27% of tyres recovered for reprocessing. The other 73% of recovery was sent to export, which is based on 2016–17 data.
To avoid overstating the accuracy of the data and the subsequent calculations, data in this report has generally been rounded to the nearest 100 tonnes.
Summary tables and figures presented in this report, minor discrepancies may occur between stated totals and the sums of the component items. Totals are calculated using component item values prior to rounding, and therefore a minor discrepancy may occur from the total that can be calculated from the rounded values.
2016–17 Australian Plastics Recycling Survey – National report
Envisage Works – Positive Impact Consulting
Page 11
Extensive efforts have been made to progressively improve the survey over time to ensure that the year-on-year rigour and detail of the study is of a high level. In line with these ongoing efforts, in 2015 the project methodology was updated to include a much broader range of imported finished and semi-finished plastic goods, including estimates of plastic packaging on imported goods.
Plastics consumption and recycling data was obtained through from a combination of sources, primarily:
• Australian resin producers (survey).
• Resin importers (survey).
• Australian import and export data (Australian Customs import/export Harmonized Tariff Item Statistical Code (HTISC) data extract).
• Australian plastics reprocessors (survey).
• Australian plastics export brokers (survey).
Resin producers and importers, reprocessors, MRF operators and exporters of used plastics were identified through: previous survey contacts, the project team’s industry knowledge, state agency consultation and industry sources.
Import and export flows of plastics were primarily determined through the review and analysis of 2,340 Customs import codes and 1,320 export codes.
Domestic reprocessing figures are obtained from surveying individual Australian plastics reprocessing businesses, and export of recyclate is estimated from data provided by reprocessors and exporters, and review and analysis of the relevant Customs export codes.
The recycled plastics data published throughout this report does include a relatively small amount of material being burnt in cement kilns for energy recovery. This type of recovery was restricted to South Australia in 2016–17.
Population data was sourced from the Australian Bureau of Statistics for all states and territories, and was used to estimate plastics consumption for each jurisdiction on a per capita basis.
2016–17 Australian Plastics Recycling Survey – National report
Envisage Works – Positive Impact Consulting
Page 12
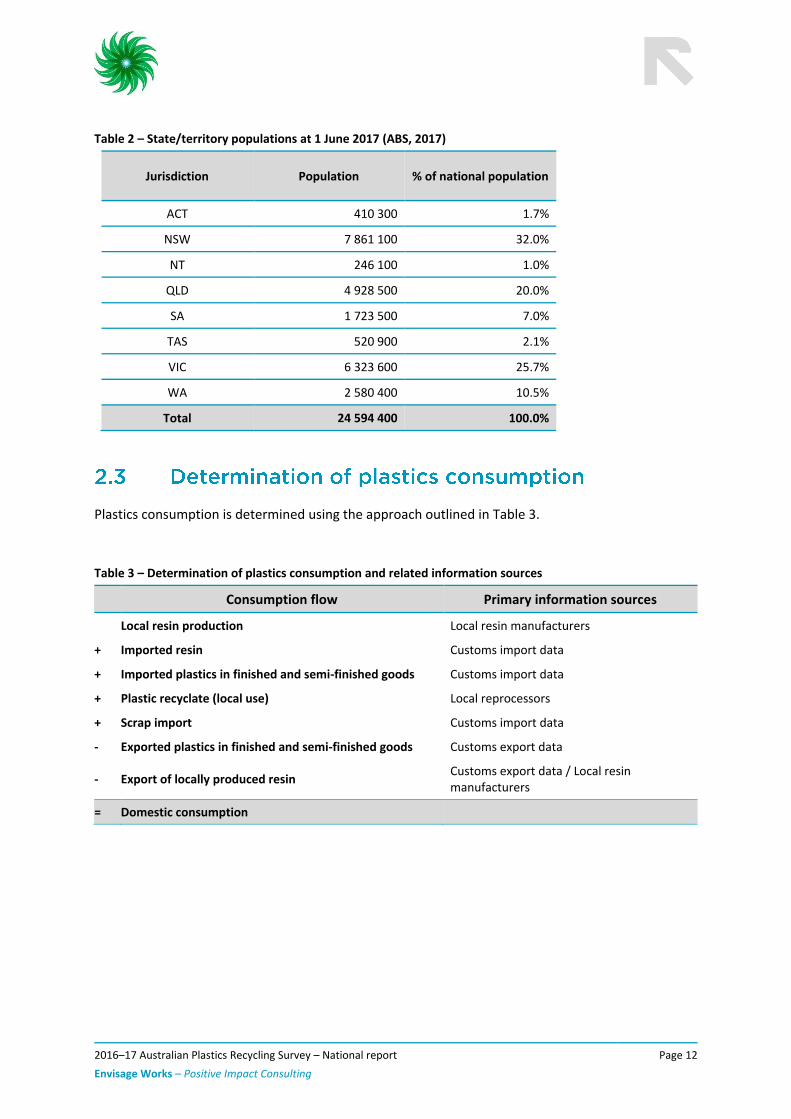
Table 2 – State/territory populations at 1 June 2017 (ABS, 2017)
Jurisdiction Population % of national population
ACT 410 300 1.7%
NSW 7 861 100 32.0%
NT 246 100 1.0%
QLD 4 928 500 20.0%
SA 1 723 500 7.0%
TAS 520 900 2.1%
VIC 6 323 600 25.7%
WA 2 580 400 10.5%
Total 24 594 400 100.0%
Plastics consumption is determined using the approach outlined in Table 3.
Table 3 – Determination of plastics consumption and related information sources
Consumption flow Primary information sources
Local resin production Local resin manufacturers
+ Imported resin Customs import data
+ Imported plastics in finished and semi-finished goods Customs import data
+ Plastic recyclate (local use) Local reprocessors
+ Scrap import Customs import data
- Exported plastics in finished and semi-finished goods Customs export data
- Export of locally produced resin Customs export data / Local resin manufacturers
= Domestic consumption
2016–17 Australian Plastics Recycling Survey – National report
Envisage Works – Positive Impact Consulting
Page 13
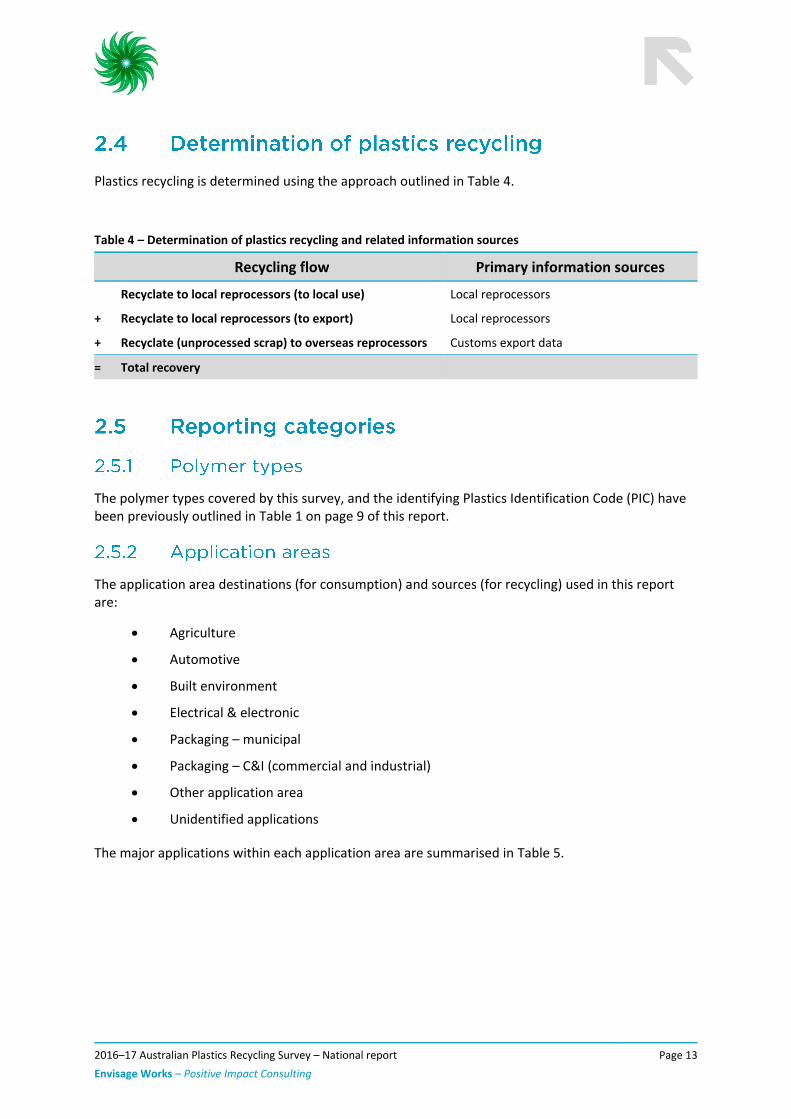
Plastics recycling is determined using the approach outlined in Table 4.
Table 4 – Determination of plastics recycling and related information sources
Recycling flow Primary information sources
Recyclate to local reprocessors (to local use) Local reprocessors
+ Recyclate to local reprocessors (to export) Local reprocessors
+ Recyclate (unprocessed scrap) to overseas reprocessors Customs export data
= Total recovery
The polymer types covered by this survey, and the identifying Plastics Identification Code (PIC) have been previously outlined in Table 1 on page 9 of this report.
The application area destinations (for consumption) and sources (for recycling) used in this report are:
• Agriculture
• Automotive
• Built environment
• Electrical & electronic
• Packaging – municipal
• Packaging – C&I (commercial and industrial)
• Other application area
• Unidentified applications
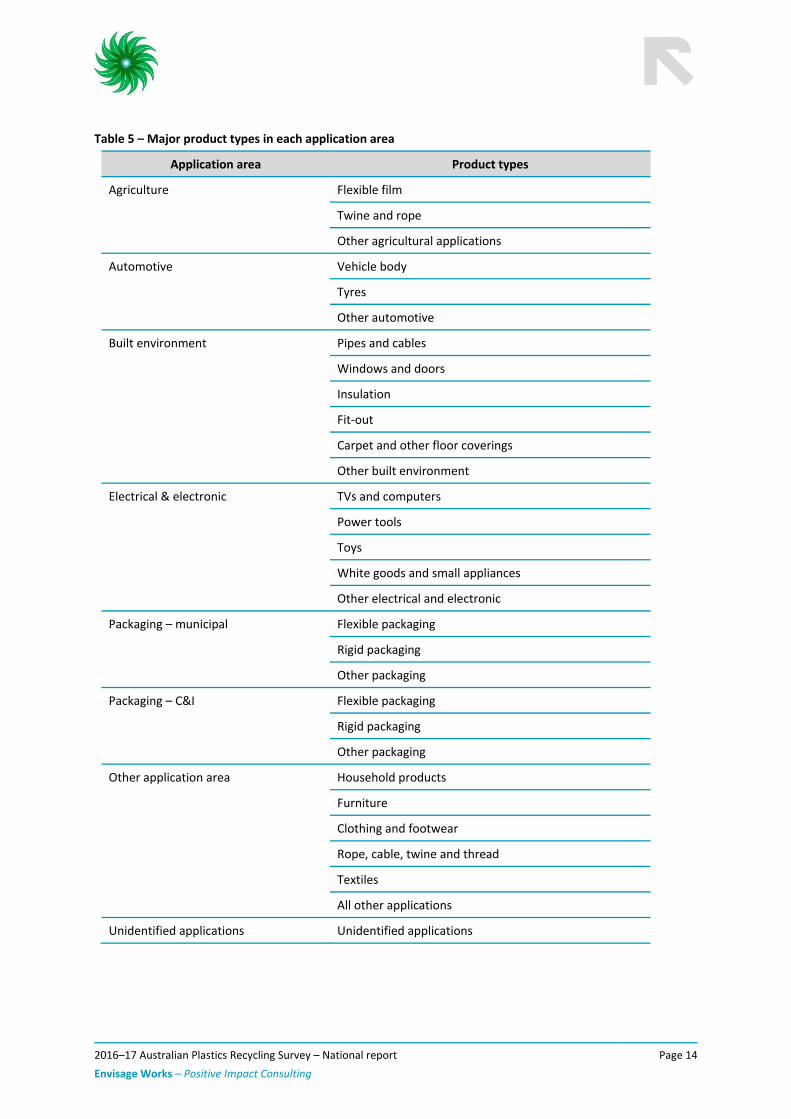
The major applications within each application area are summarised in Table 5.
2016–17 Australian Plastics Recycling Survey – National report
Envisage Works – Positive Impact Consulting
Page 14
Table 5 – Major product types in each application area
Application area Product types
Agriculture Flexible film
Twine and rope
Other agricultural applications
Automotive Vehicle body
Tyres
Other automotive
Built environment Pipes and cables
Windows and doors
Insulation
Fit-out
Carpet and other floor coverings
Other built environment
Electrical & electronic TVs and computers
Power tools
Toys
White goods and small appliances
Other electrical and electronic
Packaging – municipal Flexible packaging
Rigid packaging
Other packaging
Packaging – C&I Flexible packaging
Rigid packaging
Other packaging
Other application area Household products
Furniture
Clothing and footwear
Rope, cable, twine and thread
Textiles
All other applications
Unidentified applications Unidentified applications
2016–17 Australian Plastics Recycling Survey – National report
Envisage Works – Positive Impact Consulting
Page 15
In this report waste stream sources of recyclate are reported, in terms of the municipal, commercial & industrial (C&I), and construction & demolition (C&D) sectoral waste streams.
Refer to Section 3.5 of this report for the scope and method used to determine plastic retail carry bag consumption estimates.
2016–17 Australian Plastics Recycling Survey – National report
Envisage Works – Positive Impact Consulting
Page 16
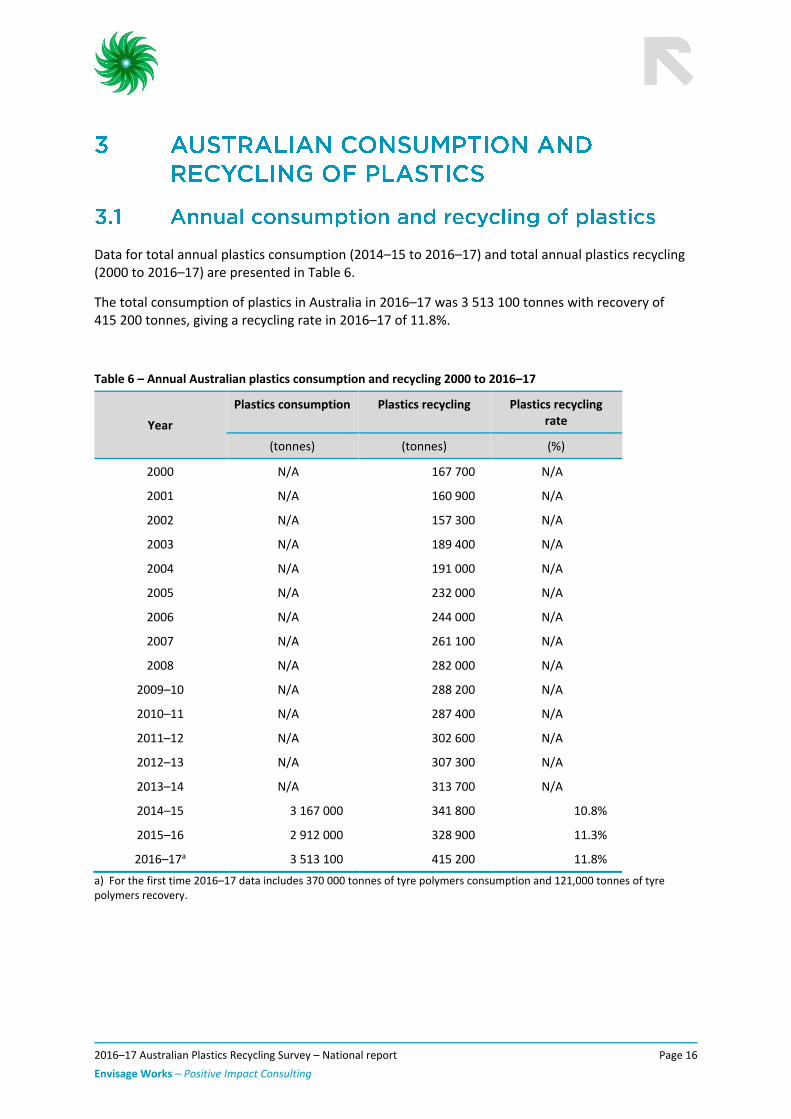
Data for total annual plastics consumption (2014–15 to 2016–17) and total annual plastics recycling (2000 to 2016–17) are presented in Table 6.
The total consumption of plastics in Australia in 2016–17 was 3 513 100 tonnes with recovery of 415 200 tonnes, giving a recycling rate in 2016–17 of 11.8%.
Table 6 – Annual Australian plastics consumption and recycling 2000 to 2016–17
Year
Plastics consumption Plastics recycling Plastics recycling rate
(tonnes) (tonnes) (%)
2000 N/A 167 700 N/A
2001 N/A 160 900 N/A
2002 N/A 157 300 N/A
2003 N/A 189 400 N/A
2004 N/A 191 000 N/A
2005 N/A 232 000 N/A
2006 N/A 244 000 N/A
2007 N/A 261 100 N/A
2008 N/A 282 000 N/A
2009–10 N/A 288 200 N/A
2010–11 N/A 287 400 N/A
2011–12 N/A 302 600 N/A
2012–13 N/A 307 300 N/A
2013–14 N/A 313 700 N/A
2014–15 3 167 000 341 800 10.8%
2015–16 2 912 000 328 900 11.3%
2016–17a 3 513 100 415 200 11.8%
a) For the first time 2016–17 data includes 370 000 tonnes of tyre polymers consumption and 121,000 tonnes of tyre polymers recovery.
2016–17 Australian Plastics Recycling Survey – National report
Envisage Works – Positive Impact Consulting
Page 17
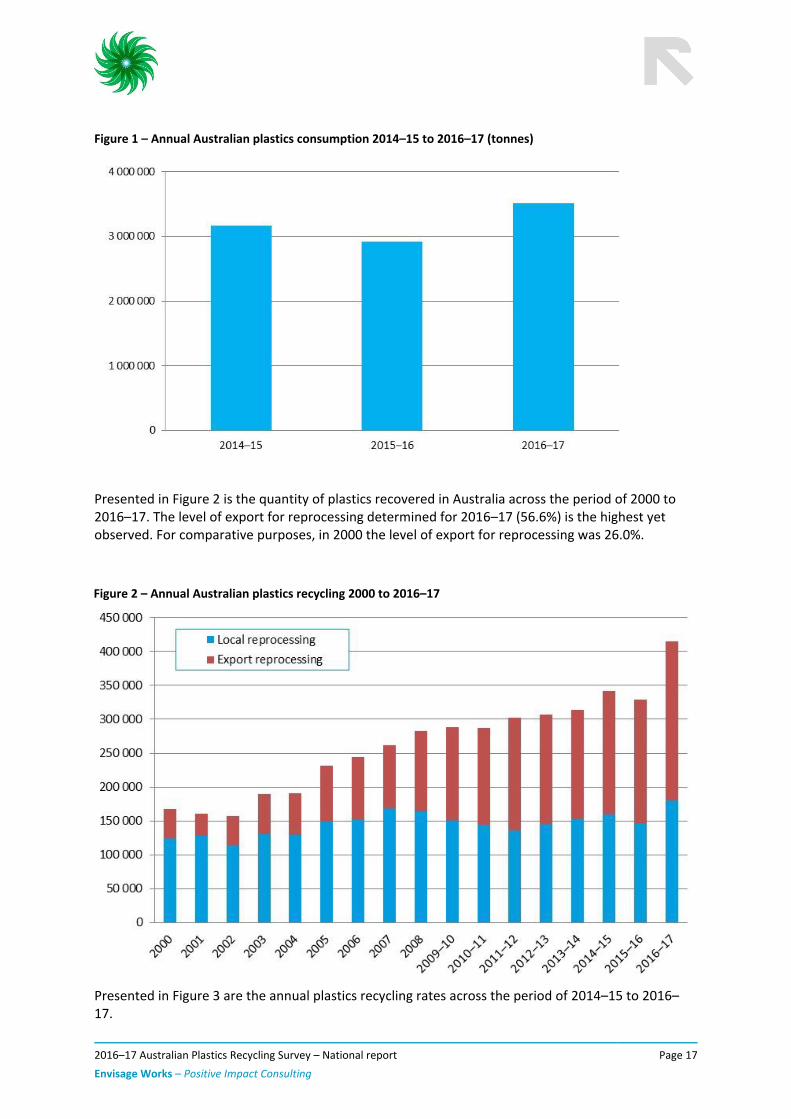
Figure 1 – Annual Australian plastics consumption 2014–15 to 2016–17 (tonnes)
Presented in Figure 2 is the quantity of plastics recovered in Australia across the period of 2000 to 2016–17. The level of export for reprocessing determined for 2016–17 (56.6%) is the highest yet observed. For comparative purposes, in 2000 the level of export for reprocessing was 26.0%.
Figure 2 – Annual Australian plastics recycling 2000 to 2016–17
Presented in Figure 3 are the annual plastics recycling rates across the period of 2014–15 to 2016–17.
2016–17 Australian Plastics Recycling Survey – National report
Envisage Works – Positive Impact Consulting
Page 18
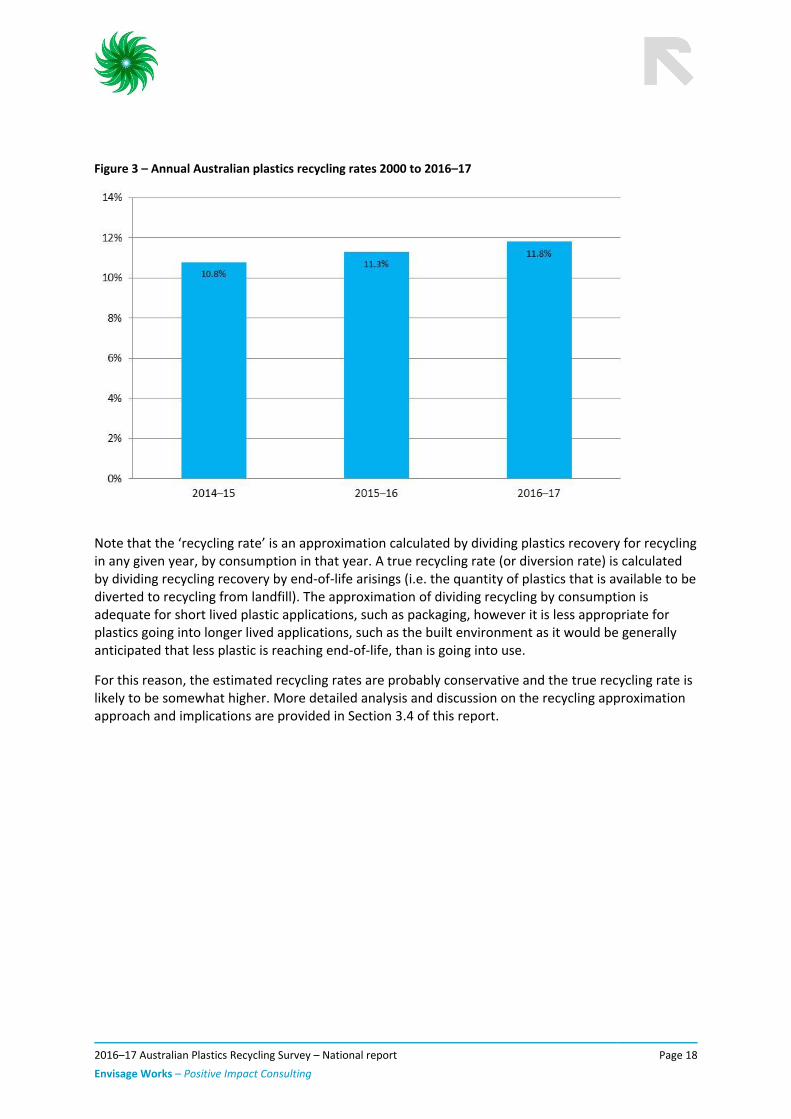
Figure 3 – Annual Australian plastics recycling rates 2000 to 2016–17
Note that the ‘recycling rate’ is an approximation calculated by dividing plastics recovery for recycling in any given year, by consumption in that year. A true recycling rate (or diversion rate) is calculated by dividing recycling recovery by end-of-life arisings (i.e. the quantity of plastics that is available to be diverted to recycling from landfill). The approximation of dividing recycling by consumption is adequate for short lived plastic applications, such as packaging, however it is less appropriate for plastics going into longer lived applications, such as the built environment as it would be generally anticipated that less plastic is reaching end-of-life, than is going into use.
For this reason, the estimated recycling rates are probably conservative and the true recycling rate is likely to be somewhat higher. More detailed analysis and discussion on the recycling approximation approach and implications are provided in Section 3.4 of this report.
2016–17 Australian Plastics Recycling Survey – National report
Envisage Works – Positive Impact Consulting
Page 19
Australian plastics consumption data for 2016–17 is summarised in Table 7 and Figure 4.
Table 7 – Australian plastics consumption by polymer type and source in 2016–17 (tonnes)
Polymer type
Local use of locally
manufactured + imported resins
Imports of plastics in
finished and semi-finished
goods
Locally processed recyclate into
local use
Australian consumption
PET (1) 118 200 214 100 13 300 345 600
PE-HD (2) 293 600 238 600 32 800 565 000
PVC (3) 211 100 153 700 3 400 368 200
PE-LD/LLD (4) 150 700 156 000 28 300 335 000
PP (5) 72 100 242 300 14 800 329 200
PS (6) 13 000 32 400 1 600 47 000
PS-E (6) 45 800 20 300 1 100 67 200
ABS/SAN/ASA (7) 8 500 43 300 700 52 500
PU (7) 29 400 39 600 8 500 77 500
Nylon (7) 12 300 113 200 100 125 600
Bioplastic (7) 0 0 0 0
Rubbers (7) 0 522 100 32 700 554 800
Other (7) 69 100 137 000 13 200 219 300
Unknown polymer 3 400 423 000 0 426 400
Total 1 027 200 2 335 600 150 500 3 513 100
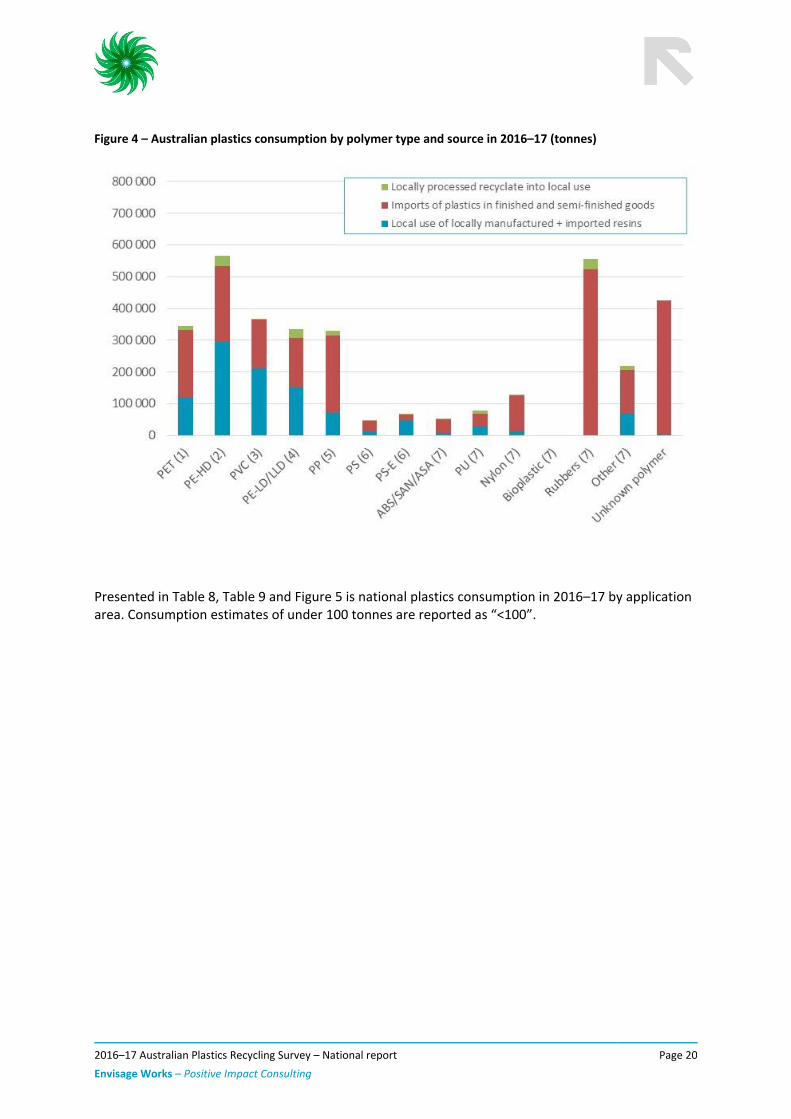
Around 66% of plastics consumption is now through imported finished and semi-finished goods, with only 34% of consumption through local manufacturing using either virgin resins or recyclate based resins. The last decade has seen the local manufacturers of PET, PVC, PP, PS and EPS resins cease production, and at the current time the only major resin types still produced in Australia are HDPE and LDPE.
2016–17 Australian Plastics Recycling Survey – National report
Envisage Works – Positive Impact Consulting
Page 20
Figure 4 – Australian plastics consumption by polymer type and source in 2016–17 (tonnes)
Presented in Table 8, Table 9 and Figure 5 is national plastics consumption in 2016–17 by application area. Consumption estimates of under 100 tonnes are reported as “<100”.

2016–17 Australian Plastics Recycling Survey – National report
Envisage Works – Positive Impact Consulting
Page 21
Table 8 – Application area destinations of all plastics by polymer type in 2016–17 (tonnes)
Polymer type Agriculture Automotive Built
environment Electrical & electronic
Packaging – municipal
Packaging – C&I
Other applic. area
Unidentified applications
Total
PET (1) 1 800 4 900 26 500 <100 122 600 11 800 139 900 38 000 345 600
PE-HD (2) 23 200 6 600 77 800 7 200 220 800 98 000 99 600 31 900 565 000
PVC (3) <100 18 100 253 000 32 400 16 500 <100 38 100 10 200 368 200
PE-LD/LLD (4) 41 100 <100 38 300 4 600 123 600 89 900 18 800 18 600 335 000
PP (5) 3 600 66 000 29 800 10 800 98 400 <100 75 700 45 000 329 200
PS (6) <100 2 600 5 200 26 100 5 400 2 600 5 700 <100 46 900
PS-E (6) <100 <100 32 600 13 300 6 700 11 400 2 600 400 67 200
ABS/SAN/ASA (7) <100 39 600 800 9 600 1 500 <100 200 700 52 400
PU (7) <100 22 800 24 200 900 <100 <100 25 600 4 000 77 500
Nylon (7) 2 200 14 700 17 500 <100 100 <100 76 600 14 500 125 600
Bioplastic (7) <100 <100 <100 <100 <100 <100 <100 <100 <100
Rubbers (7) <100 377 600 41 300 800 <100 <100 43 400 91 800 554 800
Other (7) <100 20 900 43 800 <100 7 700 <100 42 900 104 800 219 300
Unknown polymer 500 36 100 19 900 30 900 63 000 <100 215 400 60 500 426 300
Total 72 400 609 900 610 700 136 600 666 300 213 700 784 500 420 400 3 513 100
2016–17 Australian Plastics Recycling Survey – National report
Envisage Works – Positive Impact Consulting
Page 22
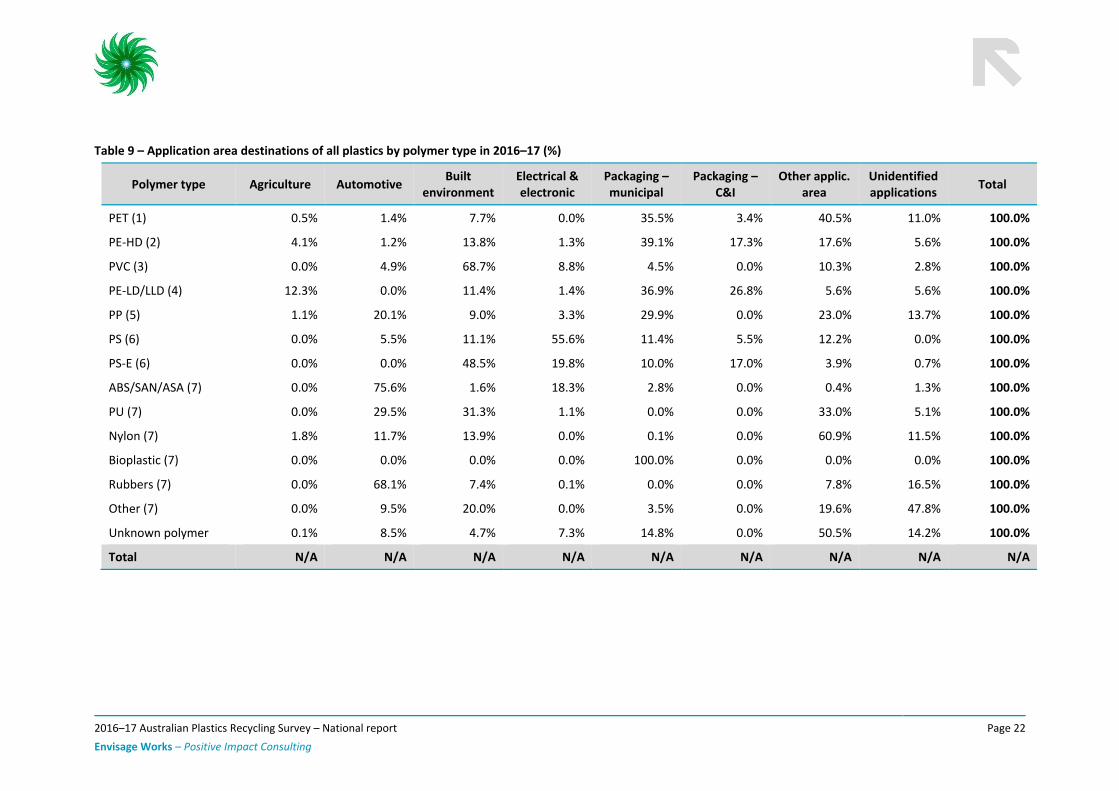
Table 9 – Application area destinations of all plastics by polymer type in 2016–17 (%)
Polymer type Agriculture Automotive Built
environment Electrical & electronic
Packaging – municipal
Packaging – C&I
Other applic. area
Unidentified applications
Total
PET (1) 0.5% 1.4% 7.7% 0.0% 35.5% 3.4% 40.5% 11.0% 100.0%
PE-HD (2) 4.1% 1.2% 13.8% 1.3% 39.1% 17.3% 17.6% 5.6% 100.0%
PVC (3) 0.0% 4.9% 68.7% 8.8% 4.5% 0.0% 10.3% 2.8% 100.0%
PE-LD/LLD (4) 12.3% 0.0% 11.4% 1.4% 36.9% 26.8% 5.6% 5.6% 100.0%
PP (5) 1.1% 20.1% 9.0% 3.3% 29.9% 0.0% 23.0% 13.7% 100.0%
PS (6) 0.0% 5.5% 11.1% 55.6% 11.4% 5.5% 12.2% 0.0% 100.0%
PS-E (6) 0.0% 0.0% 48.5% 19.8% 10.0% 17.0% 3.9% 0.7% 100.0%
ABS/SAN/ASA (7) 0.0% 75.6% 1.6% 18.3% 2.8% 0.0% 0.4% 1.3% 100.0%
PU (7) 0.0% 29.5% 31.3% 1.1% 0.0% 0.0% 33.0% 5.1% 100.0%
Nylon (7) 1.8% 11.7% 13.9% 0.0% 0.1% 0.0% 60.9% 11.5% 100.0%
Bioplastic (7) 0.0% 0.0% 0.0% 0.0% 100.0% 0.0% 0.0% 0.0% 100.0%
Rubbers (7) 0.0% 68.1% 7.4% 0.1% 0.0% 0.0% 7.8% 16.5% 100.0%
Other (7) 0.0% 9.5% 20.0% 0.0% 3.5% 0.0% 19.6% 47.8% 100.0%
Unknown polymer 0.1% 8.5% 4.7% 7.3% 14.8% 0.0% 50.5% 14.2% 100.0%
Total N/A N/A N/A N/A N/A N/A N/A N/A N/A
2016–17 Australian Plastics Recycling Survey – National report
Envisage Works – Positive Impact Consulting
Page 23
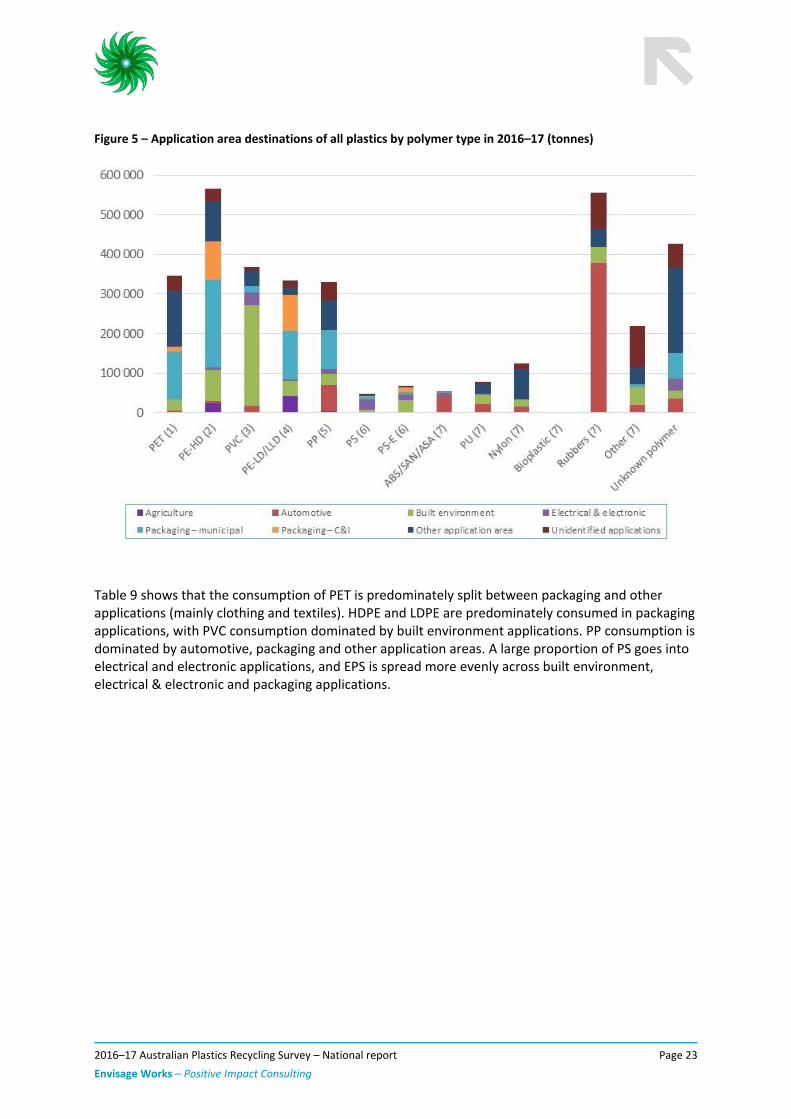
Figure 5 – Application area destinations of all plastics by polymer type in 2016–17 (tonnes)
Table 9 shows that the consumption of PET is predominately split between packaging and other applications (mainly clothing and textiles). HDPE and LDPE are predominately consumed in packaging applications, with PVC consumption dominated by built environment applications. PP consumption is dominated by automotive, packaging and other application areas. A large proportion of PS goes into electrical and electronic applications, and EPS is spread more evenly across built environment, electrical & electronic and packaging applications.
2016–17 Australian Plastics Recycling Survey – National report
Envisage Works – Positive Impact Consulting
Page 24
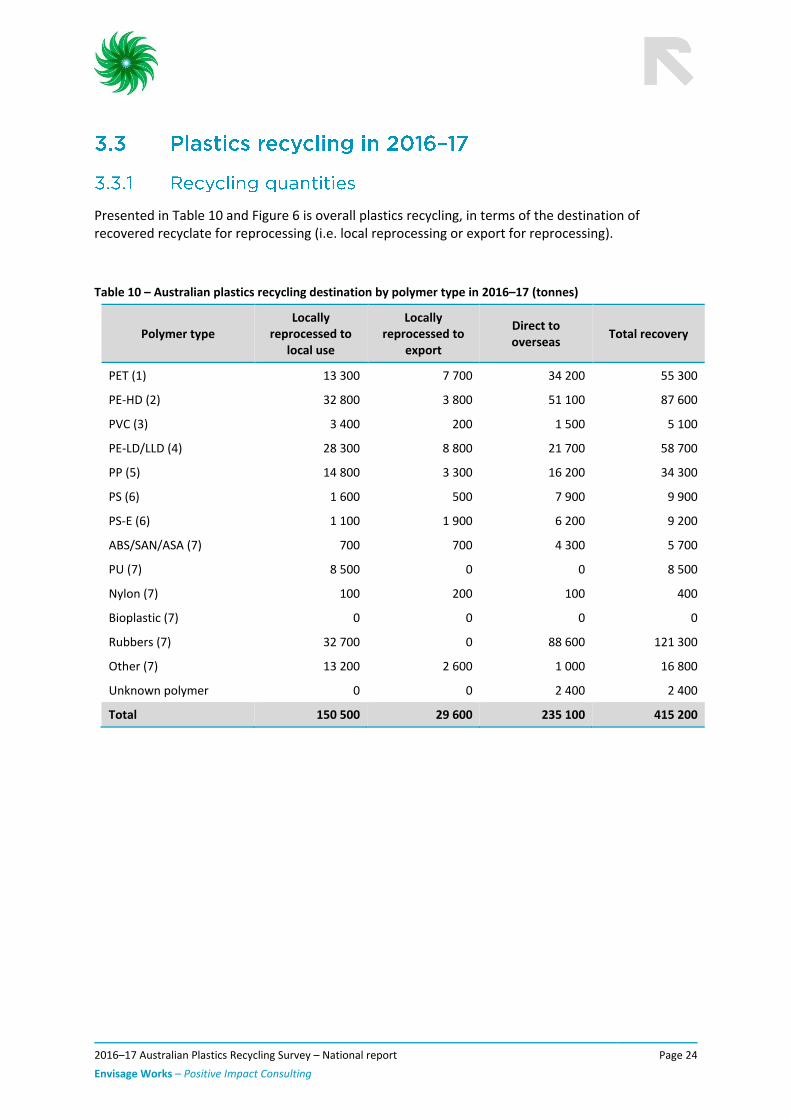
Presented in Table 10 and Figure 6 is overall plastics recycling, in terms of the destination of recovered recyclate for reprocessing (i.e. local reprocessing or export for reprocessing).
Table 10 – Australian plastics recycling destination by polymer type in 2016–17 (tonnes)
Polymer type Locally
reprocessed to local use
Locally reprocessed to
export
Direct to overseas
Total recovery
PET (1) 13 300 7 700 34 200 55 300
PE-HD (2) 32 800 3 800 51 100 87 600
PVC (3) 3 400 200 1 500 5 100
PE-LD/LLD (4) 28 300 8 800 21 700 58 700
PP (5) 14 800 3 300 16 200 34 300
PS (6) 1 600 500 7 900 9 900
PS-E (6) 1 100 1 900 6 200 9 200
ABS/SAN/ASA (7) 700 700 4 300 5 700
PU (7) 8 500 0 0 8 500
Nylon (7) 100 200 100 400
Bioplastic (7) 0 0 0 0
Rubbers (7) 32 700 0 88 600 121 300
Other (7) 13 200 2 600 1 000 16 800
Unknown polymer 0 0 2 400 2 400
Total 150 500 29 600 235 100 415 200
2016–17 Australian Plastics Recycling Survey – National report
Envisage Works – Positive Impact Consulting
Page 25
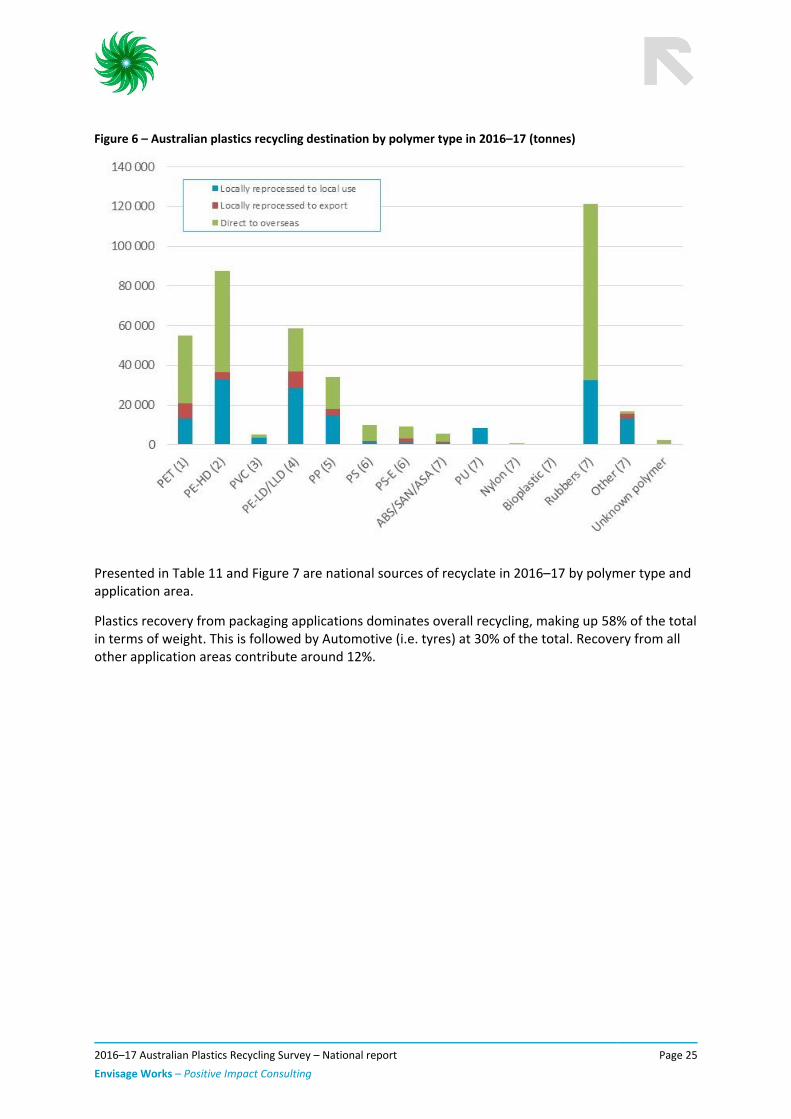
Figure 6 – Australian plastics recycling destination by polymer type in 2016–17 (tonnes)
Presented in Table 11 and Figure 7 are national sources of recyclate in 2016–17 by polymer type and application area.
Plastics recovery from packaging applications dominates overall recycling, making up 58% of the total in terms of weight. This is followed by Automotive (i.e. tyres) at 30% of the total. Recovery from all other application areas contribute around 12%.

2016–17 Australian Plastics Recycling Survey – National report
Envisage Works – Positive Impact Consulting
Page 26
Table 11 – Application area sources of recyclate by polymer type in 2016–17 (tonnes)
Polymer type Agriculture Automotive Built
environment Electrical & electronic
Packaging – municipal
Packaging – C&I
Other applic. area
Unidentified applications
Total
PET (1) 0 200 0 0 53 400 1 400 200 0 55 300
PE-HD (2) 1 500 800 2 600 0 62 800 14 800 3 500 1 700 87 600
PVC (3) 0 0 900 0 1 500 0 2 600 0 5 100
PE-LD/LLD (4) 1 800 0 0 0 6 500 46 400 800 3 300 58 700
PP (5) 200 200 0 0 10 800 18 700 4 400 0 34 300
PS (6) 100 0 1 000 2 200 4 000 700 100 1 800 9 900
PS-E (6) 0 0 1 100 0 200 5 900 0 1 900 9 200
ABS/SAN/ASA (7) 0 400 0 4 800 0 300 300 0 5 700
PU (7) 0 0 0 0 0 0 8 500 0 8 500
Nylon (7) 0 0 0 0 0 200 200 0 400
Bioplastic (7) 0 0 0 0 0 0 0 0 0
Rubbers (7) 0 121 300 0 0 0 0 0 0 121 300
Other (7) 200 0 0 0 6 500 8 600 400 1 200 16 800
Unknown polymer 0 0 0 2 400 0 0 0 0 2 400
Total 3 700 122 800 5 600 9 400 145 800 97 100 21 000 9 900 415 200
2016–17 Australian Plastics Recycling Survey – National report
Envisage Works – Positive Impact Consulting
Page 27
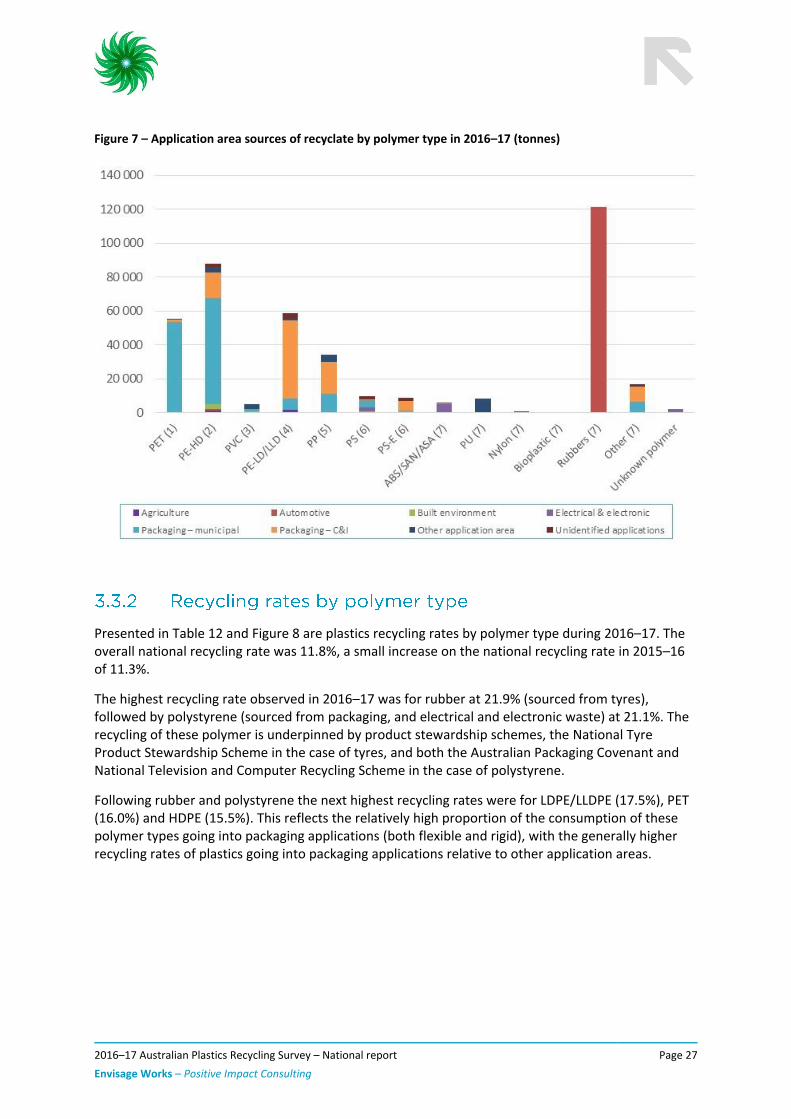
Figure 7 – Application area sources of recyclate by polymer type in 2016–17 (tonnes)
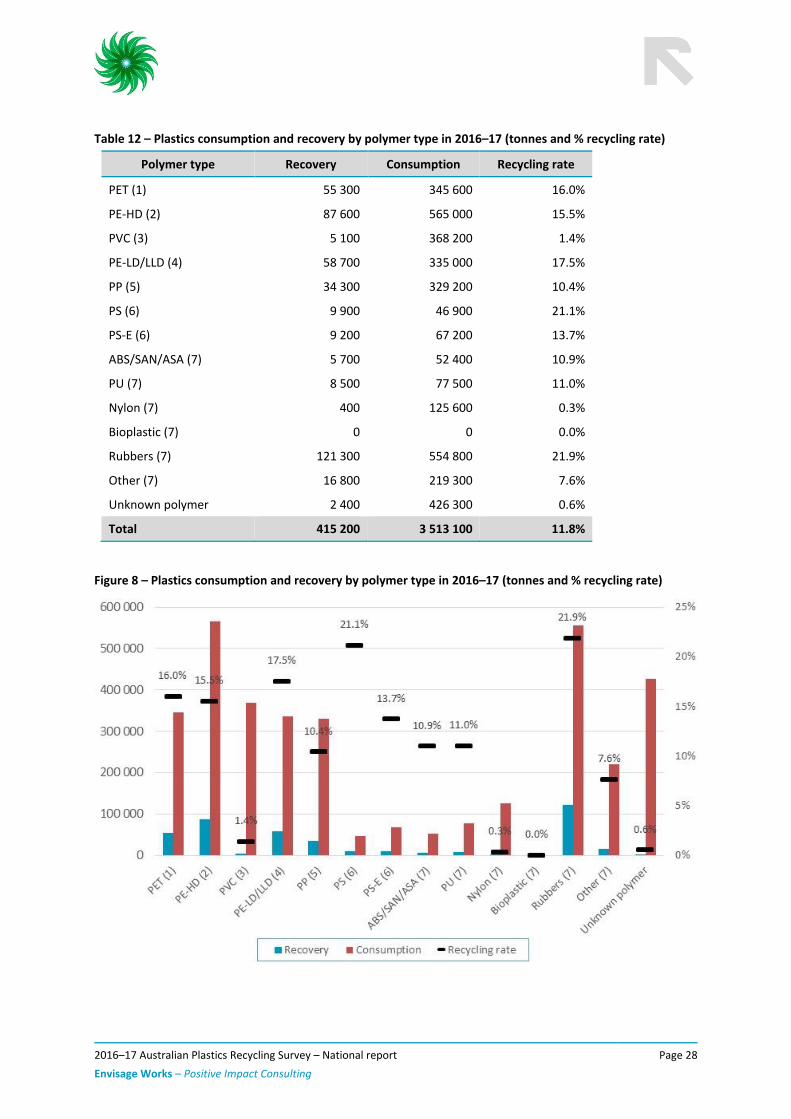
Presented in Table 12 and Figure 8 are plastics recycling rates by polymer type during 2016–17. The overall national recycling rate was 11.8%, a small increase on the national recycling rate in 2015–16 of 11.3%.
The highest recycling rate observed in 2016–17 was for rubber at 21.9% (sourced from tyres), followed by polystyrene (sourced from packaging, and electrical and electronic waste) at 21.1%. The recycling of these polymer is underpinned by product stewardship schemes, the National Tyre Product Stewardship Scheme in the case of tyres, and both the Australian Packaging Covenant and National Television and Computer Recycling Scheme in the case of polystyrene.
Following rubber and polystyrene the next highest recycling rates were for LDPE/LLDPE (17.5%), PET (16.0%) and HDPE (15.5%). This reflects the relatively high proportion of the consumption of these polymer types going into packaging applications (both flexible and rigid), with the generally higher recycling rates of plastics going into packaging applications relative to other application areas.
2016–17 Australian Plastics Recycling Survey – National report
Envisage Works – Positive Impact Consulting
Page 28
Table 12 – Plastics consumption and recovery by polymer type in 2016–17 (tonnes and % recycling rate)
Polymer type Recovery Consumption Recycling rate
PET (1) 55 300 345 600 16.0%
PE-HD (2) 87 600 565 000 15.5%
PVC (3) 5 100 368 200 1.4%
PE-LD/LLD (4) 58 700 335 000 17.5%
PP (5) 34 300 329 200 10.4%
PS (6) 9 900 46 900 21.1%
PS-E (6) 9 200 67 200 13.7%
ABS/SAN/ASA (7) 5 700 52 400 10.9%
PU (7) 8 500 77 500 11.0%
Nylon (7) 400 125 600 0.3%
Bioplastic (7) 0 0 0.0%
Rubbers (7) 121 300 554 800 21.9%
Other (7) 16 800 219 300 7.6%
Unknown polymer 2 400 426 300 0.6%
Total 415 200 3 513 100 11.8%
Figure 8 – Plastics consumption and recovery by polymer type in 2016–17 (tonnes and % recycling rate)
2016–17 Australian Plastics Recycling Survey – National report
Envisage Works – Positive Impact Consulting
Page 29
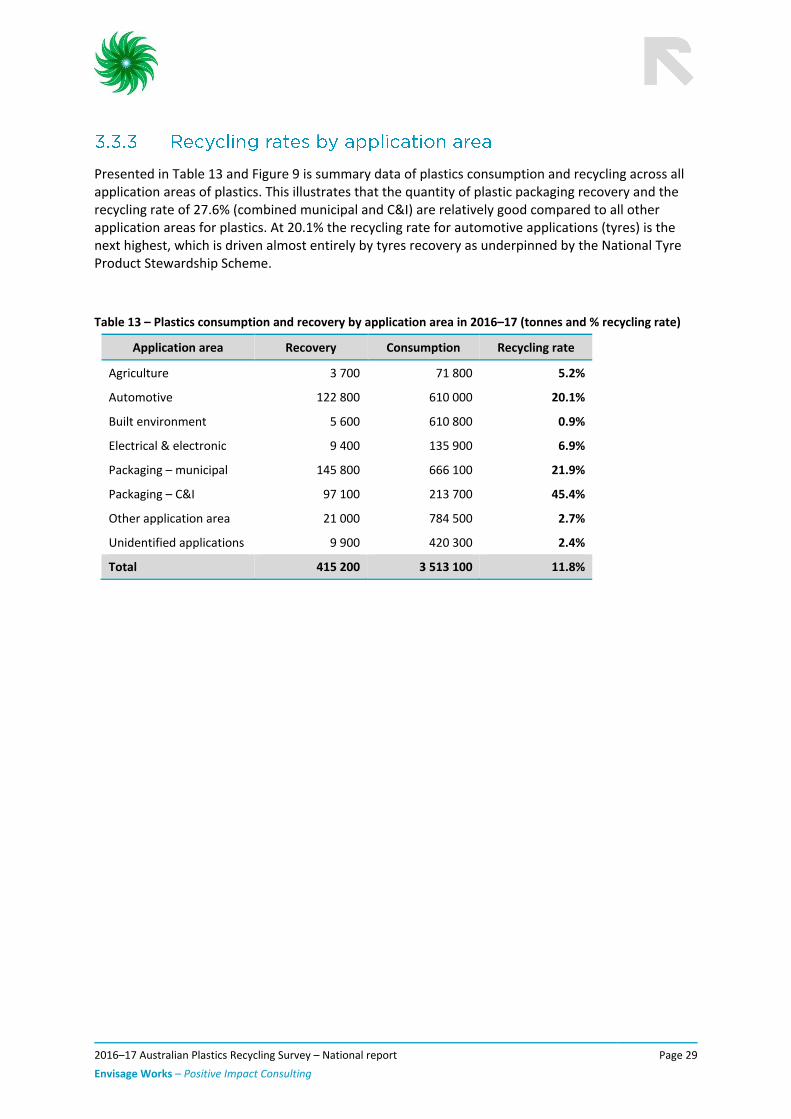
Presented in Table 13 and Figure 9 is summary data of plastics consumption and recycling across all application areas of plastics. This illustrates that the quantity of plastic packaging recovery and the recycling rate of 27.6% (combined municipal and C&I) are relatively good compared to all other application areas for plastics. At 20.1% the recycling rate for automotive applications (tyres) is the next highest, which is driven almost entirely by tyres recovery as underpinned by the National Tyre Product Stewardship Scheme.
Table 13 – Plastics consumption and recovery by application area in 2016–17 (tonnes and % recycling rate)
Application area Recovery Consumption Recycling rate
Agriculture 3 700 71 800 5.2%
Automotive 122 800 610 000 20.1%
Built environment 5 600 610 800 0.9%
Electrical & electronic 9 400 135 900 6.9%
Packaging – municipal 145 800 666 100 21.9%
Packaging – C&I 97 100 213 700 45.4%
Other application area 21 000 784 500 2.7%
Unidentified applications 9 900 420 300 2.4%
Total 415 200 3 513 100 11.8%
2016–17 Australian Plastics Recycling Survey – National report
Envisage Works – Positive Impact Consulting
Page 30
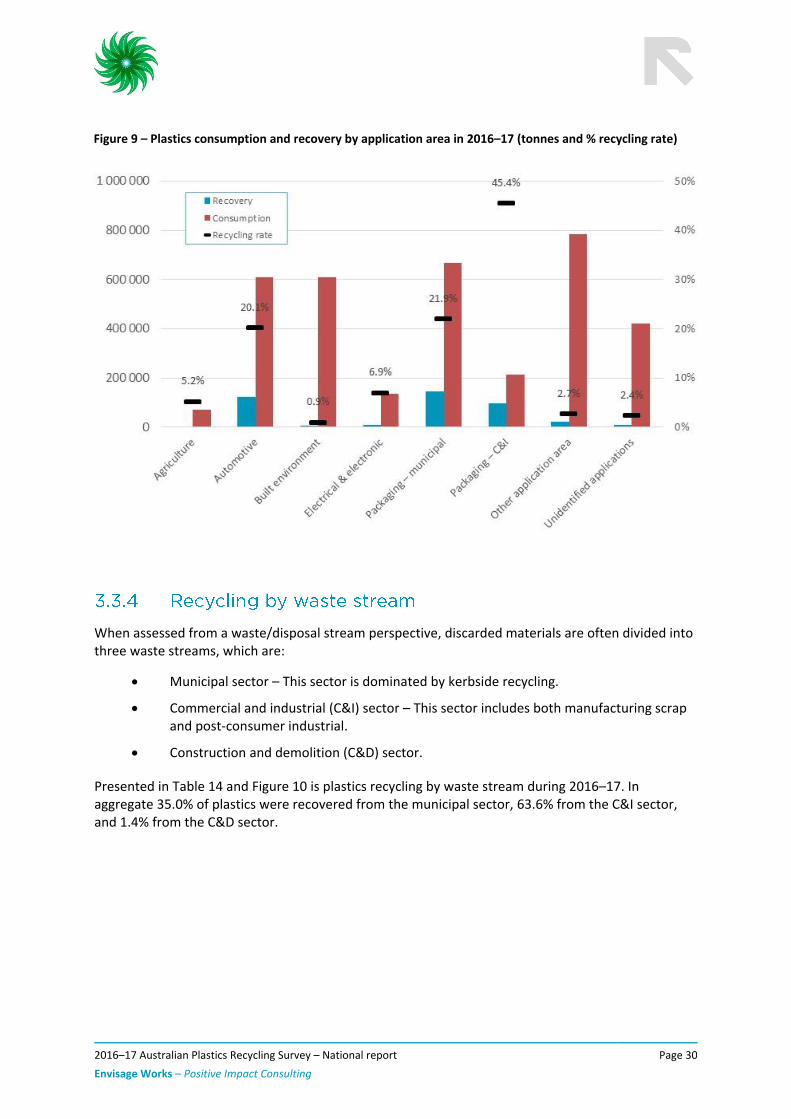
Figure 9 – Plastics consumption and recovery by application area in 2016–17 (tonnes and % recycling rate)
When assessed from a waste/disposal stream perspective, discarded materials are often divided into three waste streams, which are:
• Municipal sector – This sector is dominated by kerbside recycling.
• Commercial and industrial (C&I) sector – This sector includes both manufacturing scrap and post-consumer industrial.
• Construction and demolition (C&D) sector.
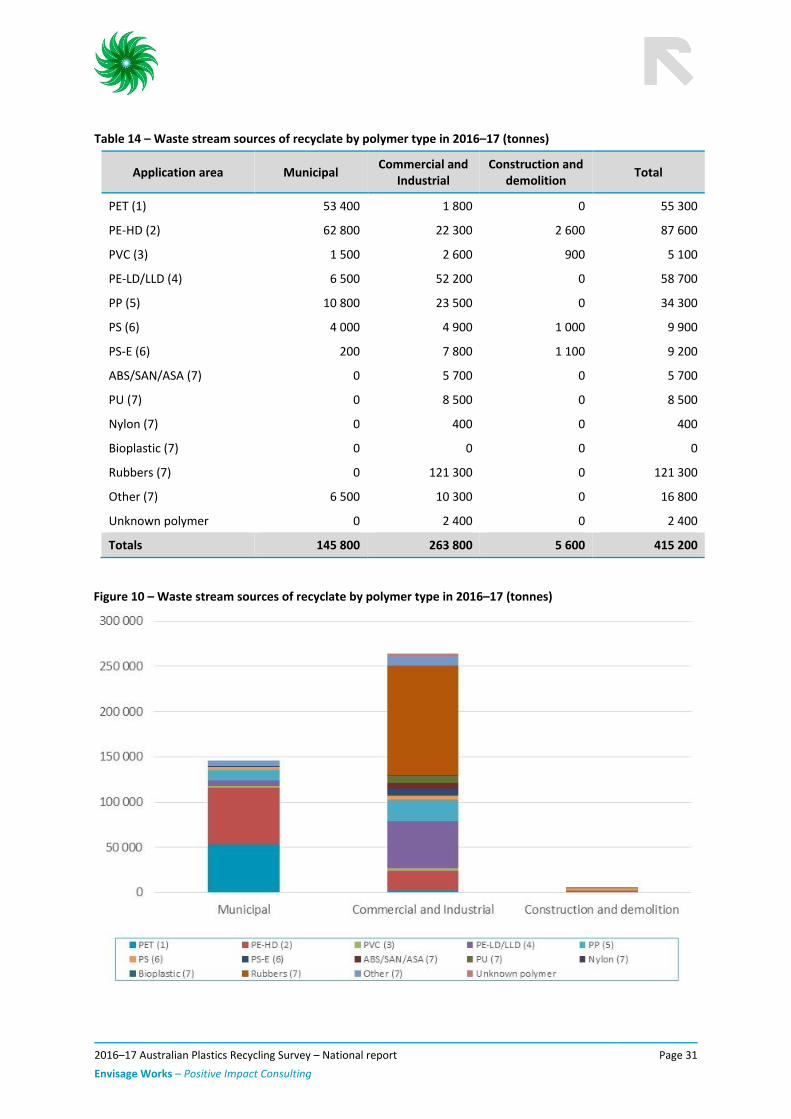
Presented in Table 14 and Figure 10 is plastics recycling by waste stream during 2016–17. In aggregate 35.0% of plastics were recovered from the municipal sector, 63.6% from the C&I sector, and 1.4% from the C&D sector.
2016–17 Australian Plastics Recycling Survey – National report
Envisage Works – Positive Impact Consulting
Page 31
Table 14 – Waste stream sources of recyclate by polymer type in 2016–17 (tonnes)
Application area Municipal Commercial and
Industrial Construction and
demolition Total
PET (1) 53 400 1 800 0 55 300
PE-HD (2) 62 800 22 300 2 600 87 600
PVC (3) 1 500 2 600 900 5 100
PE-LD/LLD (4) 6 500 52 200 0 58 700
PP (5) 10 800 23 500 0 34 300
PS (6) 4 000 4 900 1 000 9 900
PS-E (6) 200 7 800 1 100 9 200
ABS/SAN/ASA (7) 0 5 700 0 5 700
PU (7) 0 8 500 0 8 500
Nylon (7) 0 400 0 400
Bioplastic (7) 0 0 0 0
Rubbers (7) 0 121 300 0 121 300
Other (7) 6 500 10 300 0 16 800
Unknown polymer 0 2 400 0 2 400
Totals 145 800 263 800 5 600 415 200
Figure 10 – Waste stream sources of recyclate by polymer type in 2016–17 (tonnes)
2016–17 Australian Plastics Recycling Survey – National report
Envisage Works – Positive Impact Consulting
Page 32
In the calculations undertaken for this report the ‘recycling rate’ is an approximation calculated by dividing plastics recovery for recycling in any given year, by consumption in that year. A true recycling rate (or diversion rate) is calculated by dividing recycling recovery by end-of-life arisings (i.e. the quantity of plastics that is available to be diverted to recycling from landfill). The approximation of dividing recycling by consumption is adequate for short-lived plastic applications, such as packaging. However, it is less appropriate for plastics going into longer lived applications, such as the built environment, as it would be generally anticipated that in any given year less plastic is reaching end-of-life, than is going into use. For this reason, the estimated recycling rates are probably conservative and the true recycling rate is likely to be somewhat higher.
This is supported by the plastics recycling rate for 2014–15 reported in the Australian National Waste Report 2016 (Blue Environment, 2017, p. viii) of 12.8%, in which end-of-life plastics arising are estimated based on audits of plastics to landfill, plus plastics recovered for recycling. This compares with the recycling rate of 10.8% for 2014–15 presented in Section 3.1 of this report.
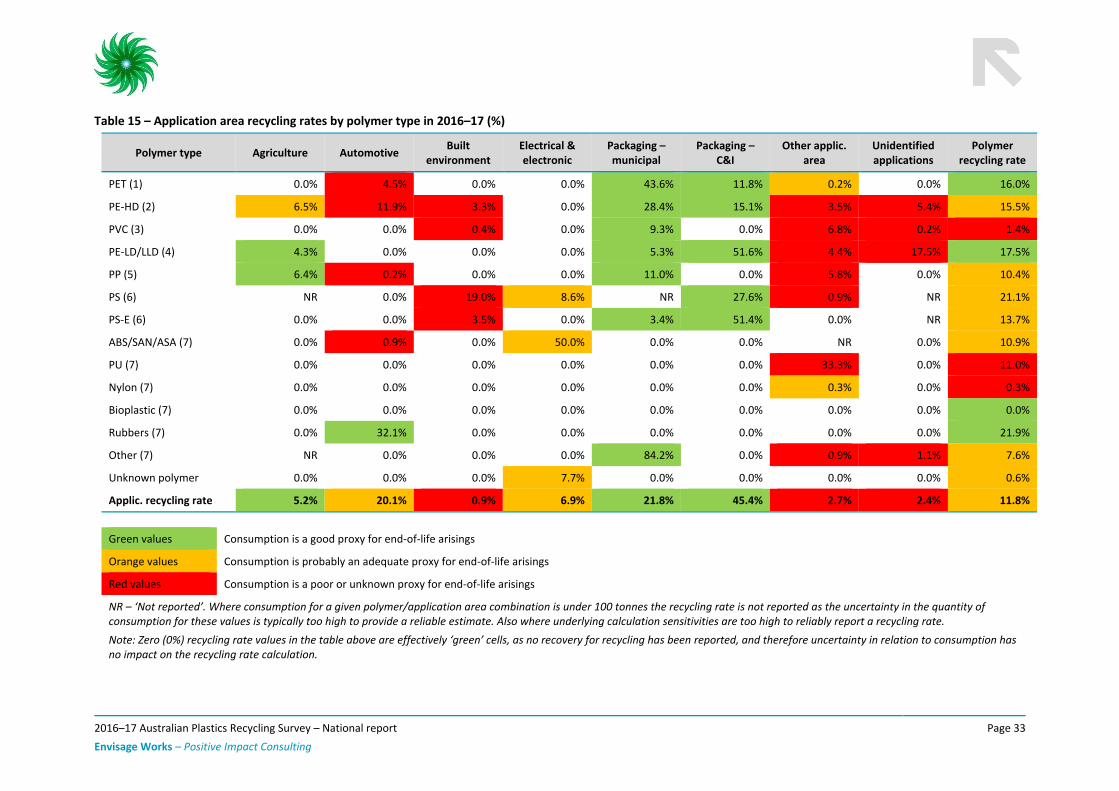
Presented in Table 15 and Figure 9 are the application area recycling rates by polymer type in 2016–17 with the impact of using consumption as a proxy for end-of-life arisings highlighted.
The recycling rates for plastics coming out of agricultural and packaging applications are likely to be accurate, and the recycling rate for plastics coming out of automotive and electrical & electronic applications reasonably good. The recycling rates for plastics coming out of built environment applications may not be accurate and in particular may be understating the true recycling rates. This is due to both the increase in use of these products, the generally increasing proportion of plastics in these products over time, and the potentially long lag time before they enter the waste stream.
2016–17 Australian Plastics Recycling Survey – National report
Envisage Works – Positive Impact Consulting
Page 33
Table 15 – Application area recycling rates by polymer type in 2016–17 (%)
Polymer type Agriculture Automotive Built
environment Electrical & electronic
Packaging – municipal
Packaging – C&I
Other applic. area
Unidentified applications
Polymer recycling rate
PET (1) 0.0% 4.5% 0.0% 0.0% 43.6% 11.8% 0.2% 0.0% 16.0%
PE-HD (2) 6.5% 11.9% 3.3% 0.0% 28.4% 15.1% 3.5% 5.4% 15.5%
PVC (3) 0.0% 0.0% 0.4% 0.0% 9.3% 0.0% 6.8% 0.2% 1.4%
PE-LD/LLD (4) 4.3% 0.0% 0.0% 0.0% 5.3% 51.6% 4.4% 17.5% 17.5%
PP (5) 6.4% 0.2% 0.0% 0.0% 11.0% 0.0% 5.8% 0.0% 10.4%
PS (6) NR 0.0% 19.0% 8.6% NR 27.6% 0.9% NR 21.1%
PS-E (6) 0.0% 0.0% 3.5% 0.0% 3.4% 51.4% 0.0% NR 13.7%
ABS/SAN/ASA (7) 0.0% 0.9% 0.0% 50.0% 0.0% 0.0% NR 0.0% 10.9%
PU (7) 0.0% 0.0% 0.0% 0.0% 0.0% 0.0% 33.3% 0.0% 11.0%
Nylon (7) 0.0% 0.0% 0.0% 0.0% 0.0% 0.0% 0.3% 0.0% 0.3%
Bioplastic (7) 0.0% 0.0% 0.0% 0.0% 0.0% 0.0% 0.0% 0.0% 0.0%
Rubbers (7) 0.0% 32.1% 0.0% 0.0% 0.0% 0.0% 0.0% 0.0% 21.9%
Other (7) NR 0.0% 0.0% 0.0% 84.2% 0.0% 0.9% 1.1% 7.6%
Unknown polymer 0.0% 0.0% 0.0% 7.7% 0.0% 0.0% 0.0% 0.0% 0.6%
Applic. recycling rate 5.2% 20.1% 0.9% 6.9% 21.8% 45.4% 2.7% 2.4% 11.8%
Green values Consumption is a good proxy for end-of-life arisings
Orange values Consumption is probably an adequate proxy for end-of-life arisings
Red values Consumption is a poor or unknown proxy for end-of-life arisings
NR – ‘Not reported’. Where consumption for a given polymer/application area combination is under 100 tonnes the recycling rate is not reported as the uncertainty in the quantity of consumption for these values is typically too high to provide a reliable estimate. Also where underlying calculation sensitivities are too high to reliably report a recycling rate.
Note: Zero (0%) recycling rate values in the table above are effectively ‘green’ cells, as no recovery for recycling has been reported, and therefore uncertainty in relation to consumption has no impact on the recycling rate calculation.
2016–17 Australian Plastics Recycling Survey – National report
Envisage Works – Positive Impact Consulting
Page 34
As an add-on task to the main time-series APRS study this year, an assessment of national consumption of plastic retail carry bags in 2016–17 has been undertaken, with a focus on single-use bags.
The plastic retail carry bag is used across many retail sectors, including; supermarket and grocery stores, other food retailing, clothing retailing, department stores, consumer goods retailing, fast food, convenience stores, and numerous other sectors.
The most commonly used single-use plastic bags are made of high density polyethylene (HDPE) plastic (e.g. the standard grey supermarket single-use bag). Other commonly used plastic bags include low density polyethylene (LDPE) plastic (e.g. the reusable heavier-duty supermarket bags and the ‘boutique’ type plastic bags, and non-woven polypropylene (PP) bags intended for multiple uses (e.g. the typical ‘green’ bag and insulated cooler tote bags).
With the exception of a small proportion of reusable LDPE bags, virtually all retail shopping bags are now imported into Australia and have been since 2012.
Over the last decade the following single-use plastic carry bag bans have been implemented or are planned nationally:
• SA 2009
• ACT 2011
• NT 2011
• TAS 2013
• WA 1 July 2018
• QLD 1 July 2018
• VIC Consultation on ban in progress (ends March 2018).
The bans that are currently in place cover 11.8% of the Australian population, and primarily impact the consumption of single-use HDPE and LDPE carry bags in the jurisdictions where the bans apply.
The scope of the assessment undertaken in this section of the report is the determination of:
• 2016–17 national estimated plastic bag consumption by bag type and sector.
• Comparisons with available historical consumption and recycling estimates.
2016–17 Australian Plastics Recycling Survey – National report
Envisage Works – Positive Impact Consulting
Page 35
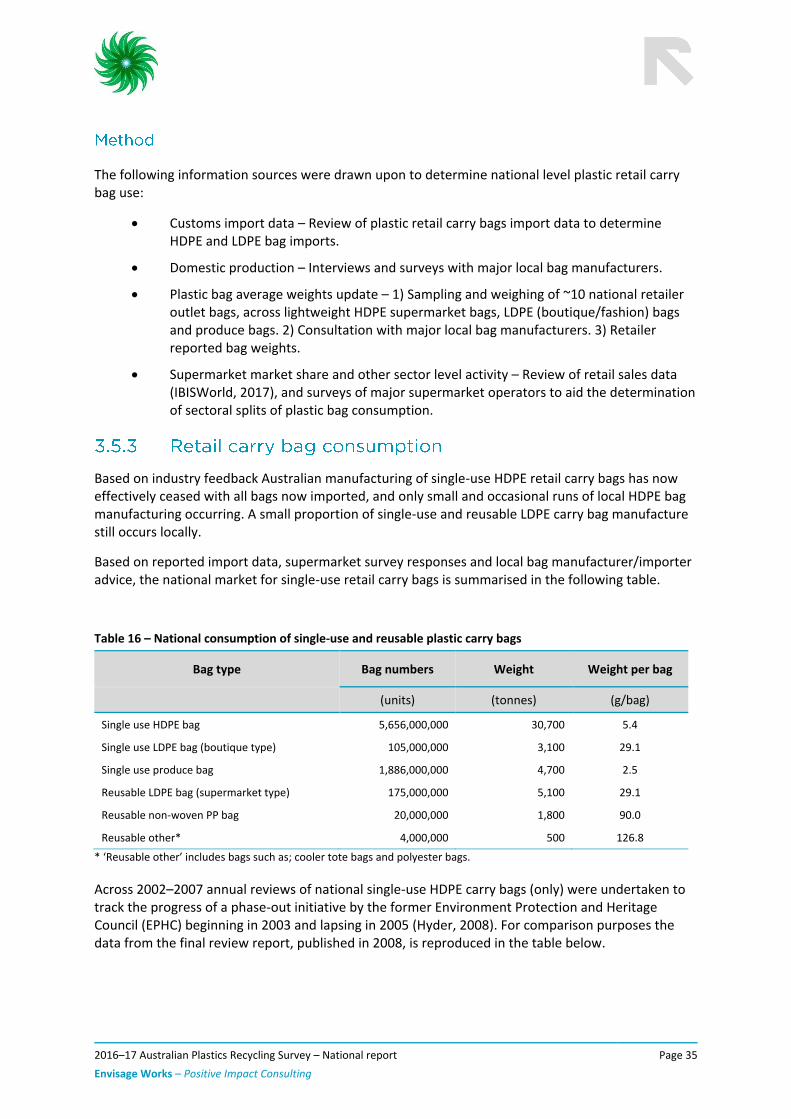
The following information sources were drawn upon to determine national level plastic retail carry bag use:
• Customs import data – Review of plastic retail carry bags import data to determine HDPE and LDPE bag imports.
• Domestic production – Interviews and surveys with major local bag manufacturers.
• Plastic bag average weights update – 1) Sampling and weighing of ~10 national retailer outlet bags, across lightweight HDPE supermarket bags, LDPE (boutique/fashion) bags and produce bags. 2) Consultation with major local bag manufacturers. 3) Retailer reported bag weights.
• Supermarket market share and other sector level activity – Review of retail sales data (IBISWorld, 2017), and surveys of major supermarket operators to aid the determination of sectoral splits of plastic bag consumption.
Based on industry feedback Australian manufacturing of single-use HDPE retail carry bags has now effectively ceased with all bags now imported, and only small and occasional runs of local HDPE bag manufacturing occurring. A small proportion of single-use and reusable LDPE carry bag manufacture still occurs locally.
Based on reported import data, supermarket survey responses and local bag manufacturer/importer advice, the national market for single-use retail carry bags is summarised in the following table.
Table 16 – National consumption of single-use and reusable plastic carry bags
Bag type Bag numbers Weight Weight per bag
(units) (tonnes) (g/bag)
Single use HDPE bag 5,656,000,000 30,700 5.4
Single use LDPE bag (boutique type) 105,000,000 3,100 29.1
Single use produce bag 1,886,000,000 4,700 2.5
Reusable LDPE bag (supermarket type) 175,000,000 5,100 29.1
Reusable non-woven PP bag 20,000,000 1,800 90.0
Reusable other* 4,000,000 500 126.8
* ‘Reusable other’ includes bags such as; cooler tote bags and polyester bags.
Across 2002–2007 annual reviews of national single-use HDPE carry bags (only) were undertaken to track the progress of a phase-out initiative by the former Environment Protection and Heritage Council (EPHC) beginning in 2003 and lapsing in 2005 (Hyder, 2008). For comparison purposes the data from the final review report, published in 2008, is reproduced in the table below.

2016–17 Australian Plastics Recycling Survey – National report
Envisage Works – Positive Impact Consulting
Page 36
Table 17 – National consumption of single-use HDPE carry bags only
Year Number of bags Weight of bags
(billions) (tonnes)
2002 5.95 32 700
2003 5.24 28 800
2004 4.73 26 000
2005 3.92 21 500
2006 3.36 18 100
2007 3.93 21 200
2016–17 5.66 30 700
It can be seen from the available time-series data that single-use HDPE plastic bag consumption has rebounded significantly over the last decade against the low in 2006, and is now almost back up at the 2002 levels on a number basis, even with the bans in four jurisdictions.
Estimates of total consumption and supermarket sector level plastic bag consumption splits are available, allowing the reporting of supermarket sector consumption of plastic bags versus all other sectors. National consumption data for these two categories are provided in the following two tables.
Table 18 – National supermarket consumption of single-use and reusable plastic carry bags
Bag type Bag numbers Weight Weight per bag
(units) (tonnes) (g/bag)
Single use HDPE bag 5,090,000,000 27,600 5.4
Single use LDPE bag (boutique type) 0 0 0.0
Single use produce bag 1,745,000,000 4,400 2.5
Reusable LDPE bag (supermarket type) 175,000,000 5,100 29.1
Reusable non-woven PP bag 19,000,000 1,700 90.0
Reusable other 3,000,000 400 126.8

2016–17 Australian Plastics Recycling Survey – National report
Envisage Works – Positive Impact Consulting
Page 37
Table 19 – National non-supermarket consumption of single-use and reusable plastic carry bags
Bag type Bag numbers Weight Weight per bag
(units) (tonnes) (g/bag)
Single use HDPE bag 566,000,000 3,100 5.4
Single use LDPE bag (boutique type) 105,000,000 3,100 29.1
Single use produce bag 141,000,000 400 2.5
Reusable LDPE bag (supermarket type) 0 0 29.1
Reusable non-woven PP bag 2,000,000 100 90.0
Reusable other 0 0 126.8
It is expected that the single-use bag bans in Queensland and Western Australia from mid-2018, and the national phase-outs planned by Woolworths and Coles, also by mid-2018, will have a very significant effect on single use HDPE bag consumption from July 2018 onwards. However, this will come with a corresponding (albeit smaller) increase in the consumption of reusable LDPE and non-woven PP bags.
2016–17 Australian Plastics Recycling Survey – National report
Envisage Works – Positive Impact Consulting
Page 38
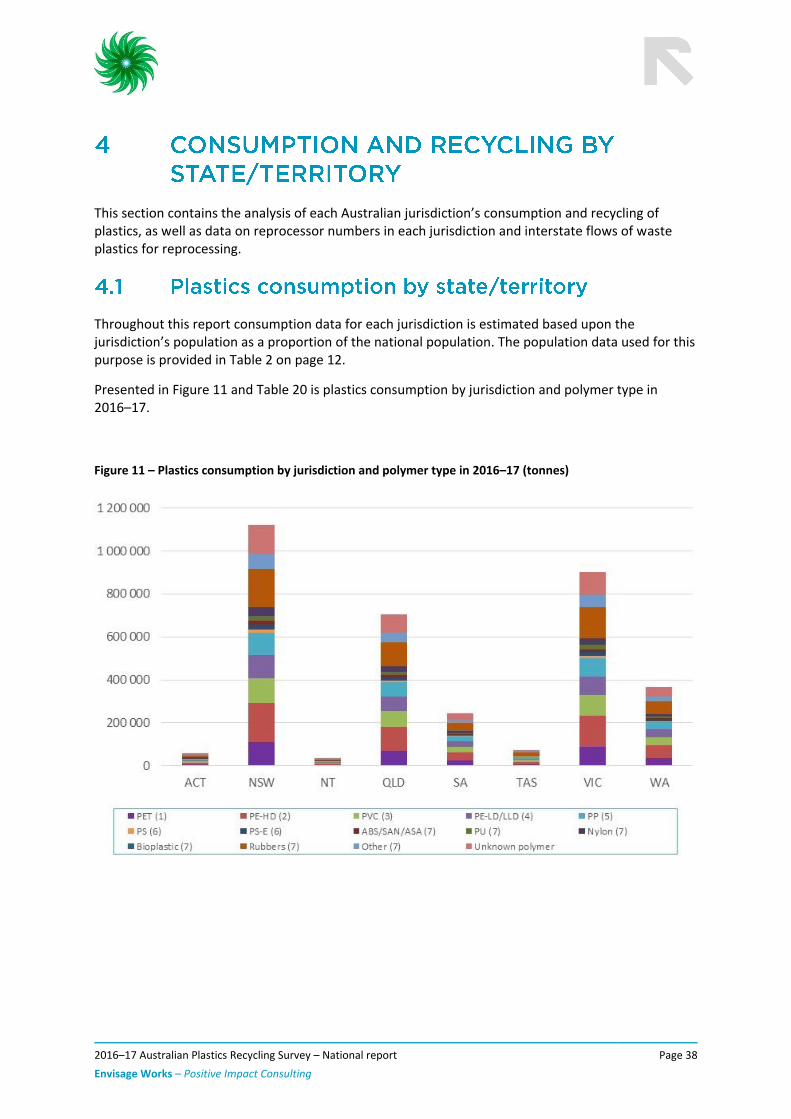
This section contains the analysis of each Australian jurisdiction’s consumption and recycling of plastics, as well as data on reprocessor numbers in each jurisdiction and interstate flows of waste plastics for reprocessing.
Throughout this report consumption data for each jurisdiction is estimated based upon the jurisdiction’s population as a proportion of the national population. The population data used for this purpose is provided in Table 2 on page 12.
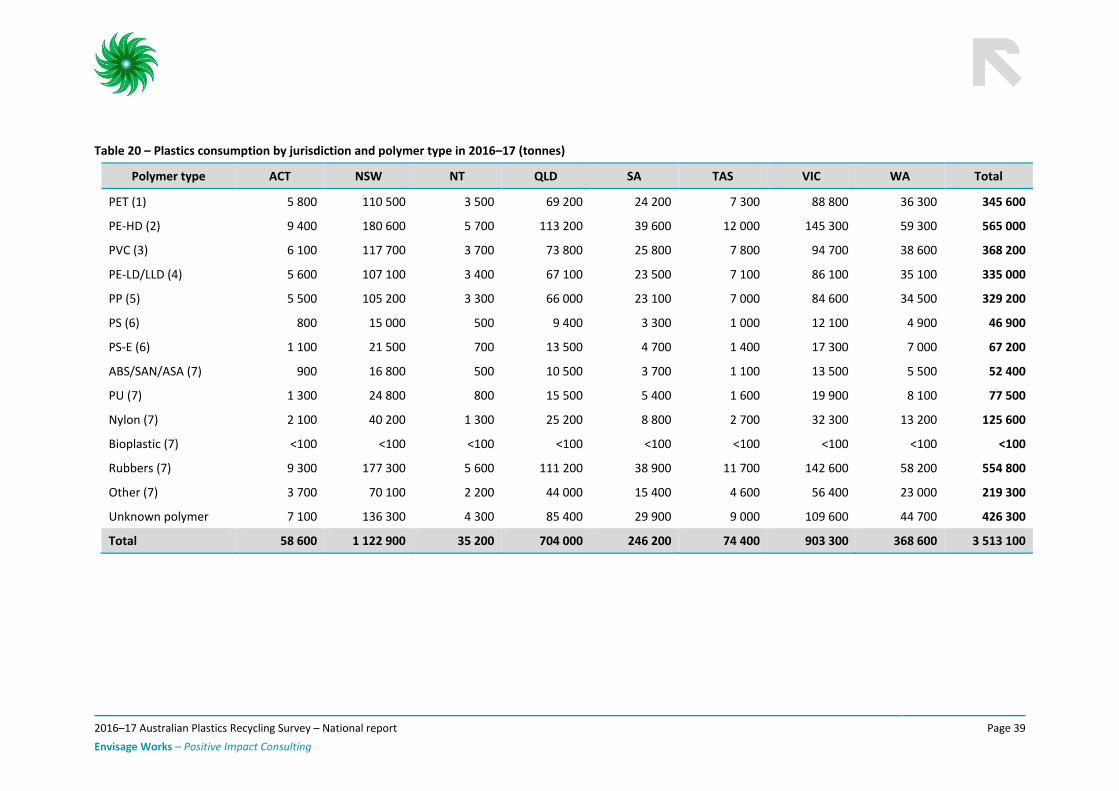
Presented in Figure 11 and Table 20 is plastics consumption by jurisdiction and polymer type in 2016–17.
Figure 11 – Plastics consumption by jurisdiction and polymer type in 2016–17 (tonnes)
2016–17 Australian Plastics Recycling Survey – National report
Envisage Works – Positive Impact Consulting
Page 39
Table 20 – Plastics consumption by jurisdiction and polymer type in 2016–17 (tonnes)
Polymer type ACT NSW NT QLD SA TAS VIC WA Total
PET (1) 5 800 110 500 3 500 69 200 24 200 7 300 88 800 36 300 345 600
PE-HD (2) 9 400 180 600 5 700 113 200 39 600 12 000 145 300 59 300 565 000
PVC (3) 6 100 117 700 3 700 73 800 25 800 7 800 94 700 38 600 368 200
PE-LD/LLD (4) 5 600 107 100 3 400 67 100 23 500 7 100 86 100 35 100 335 000
PP (5) 5 500 105 200 3 300 66 000 23 100 7 000 84 600 34 500 329 200
PS (6) 800 15 000 500 9 400 3 300 1 000 12 100 4 900 46 900
PS-E (6) 1 100 21 500 700 13 500 4 700 1 400 17 300 7 000 67 200
ABS/SAN/ASA (7) 900 16 800 500 10 500 3 700 1 100 13 500 5 500 52 400
PU (7) 1 300 24 800 800 15 500 5 400 1 600 19 900 8 100 77 500
Nylon (7) 2 100 40 200 1 300 25 200 8 800 2 700 32 300 13 200 125 600
Bioplastic (7) <100 <100 <100 <100 <100 <100 <100 <100 <100
Rubbers (7) 9 300 177 300 5 600 111 200 38 900 11 700 142 600 58 200 554 800
Other (7) 3 700 70 100 2 200 44 000 15 400 4 600 56 400 23 000 219 300
Unknown polymer 7 100 136 300 4 300 85 400 29 900 9 000 109 600 44 700 426 300
Total 58 600 1 122 900 35 200 704 000 246 200 74 400 903 300 368 600 3 513 100
2016–17 Australian Plastics Recycling Survey – National report
Envisage Works – Positive Impact Consulting
Page 40
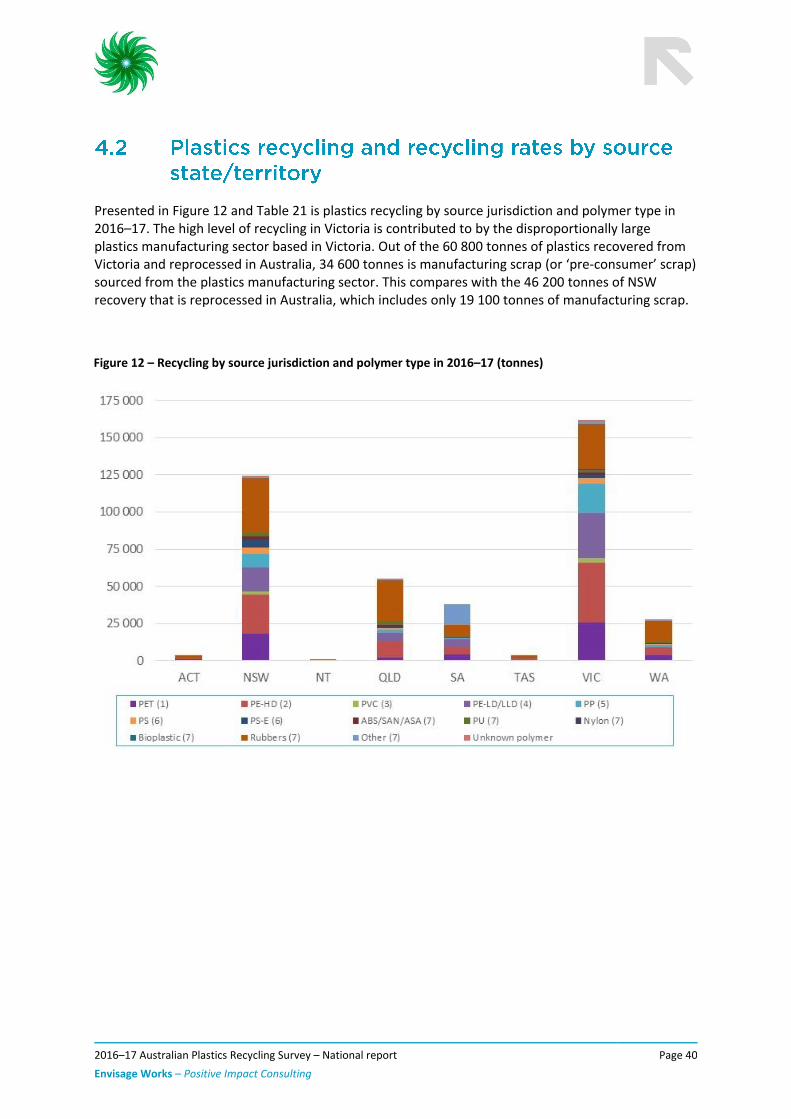
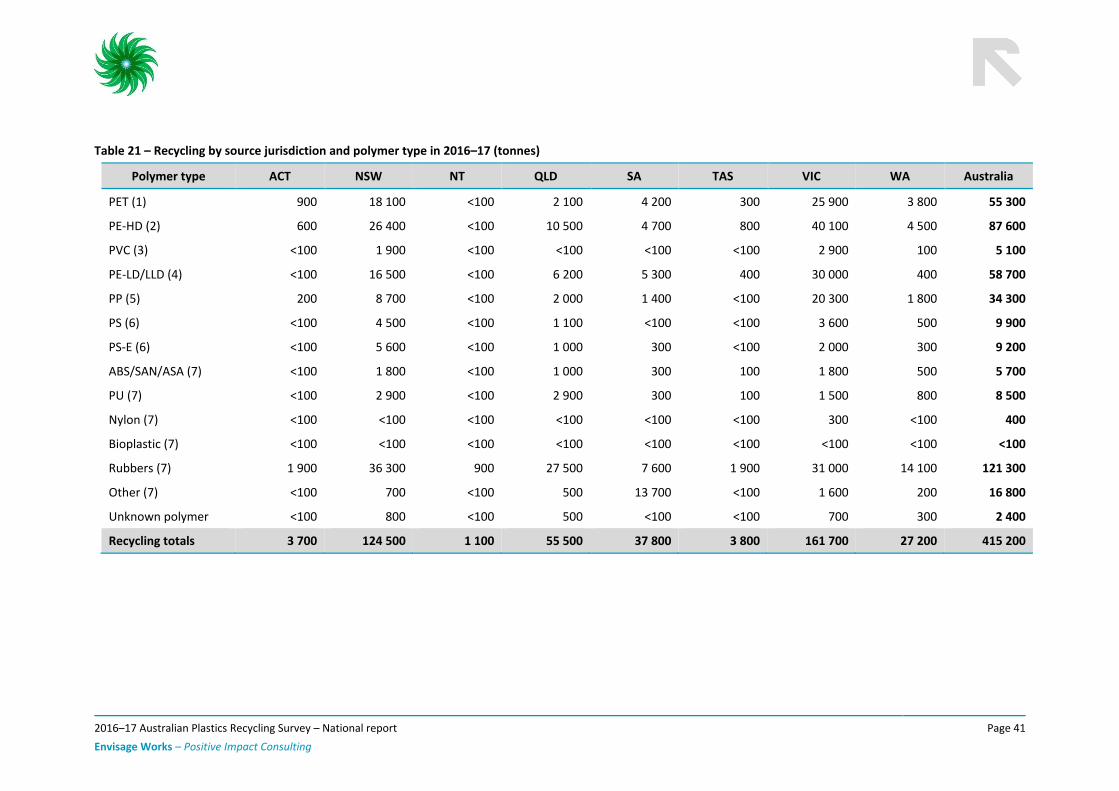
Presented in Figure 12 and Table 21 is plastics recycling by source jurisdiction and polymer type in 2016–17. The high level of recycling in Victoria is contributed to by the disproportionally large plastics manufacturing sector based in Victoria. Out of the 60 800 tonnes of plastics recovered from Victoria and reprocessed in Australia, 34 600 tonnes is manufacturing scrap (or ‘pre-consumer’ scrap) sourced from the plastics manufacturing sector. This compares with the 46 200 tonnes of NSW recovery that is reprocessed in Australia, which includes only 19 100 tonnes of manufacturing scrap.
Figure 12 – Recycling by source jurisdiction and polymer type in 2016–17 (tonnes)
2016–17 Australian Plastics Recycling Survey – National report
Envisage Works – Positive Impact Consulting
Page 41
Table 21 – Recycling by source jurisdiction and polymer type in 2016–17 (tonnes)
Polymer type ACT NSW NT QLD SA TAS VIC WA Australia
PET (1) 900 18 100 <100 2 100 4 200 300 25 900 3 800 55 300
PE-HD (2) 600 26 400 <100 10 500 4 700 800 40 100 4 500 87 600
PVC (3) <100 1 900 <100 <100 <100 <100 2 900 100 5 100
PE-LD/LLD (4) <100 16 500 <100 6 200 5 300 400 30 000 400 58 700
PP (5) 200 8 700 <100 2 000 1 400 <100 20 300 1 800 34 300
PS (6) <100 4 500 <100 1 100 <100 <100 3 600 500 9 900
PS-E (6) <100 5 600 <100 1 000 300 <100 2 000 300 9 200
ABS/SAN/ASA (7) <100 1 800 <100 1 000 300 100 1 800 500 5 700
PU (7) <100 2 900 <100 2 900 300 100 1 500 800 8 500
Nylon (7) <100 <100 <100 <100 <100 <100 300 <100 400
Bioplastic (7) <100 <100 <100 <100 <100 <100 <100 <100 <100
Rubbers (7) 1 900 36 300 900 27 500 7 600 1 900 31 000 14 100 121 300
Other (7) <100 700 <100 500 13 700 <100 1 600 200 16 800
Unknown polymer <100 800 <100 500 <100 <100 700 300 2 400
Recycling totals 3 700 124 500 1 100 55 500 37 800 3 800 161 700 27 200 415 200
2016–17 Australian Plastics Recycling Survey – National report
Envisage Works – Positive Impact Consulting
Page 42
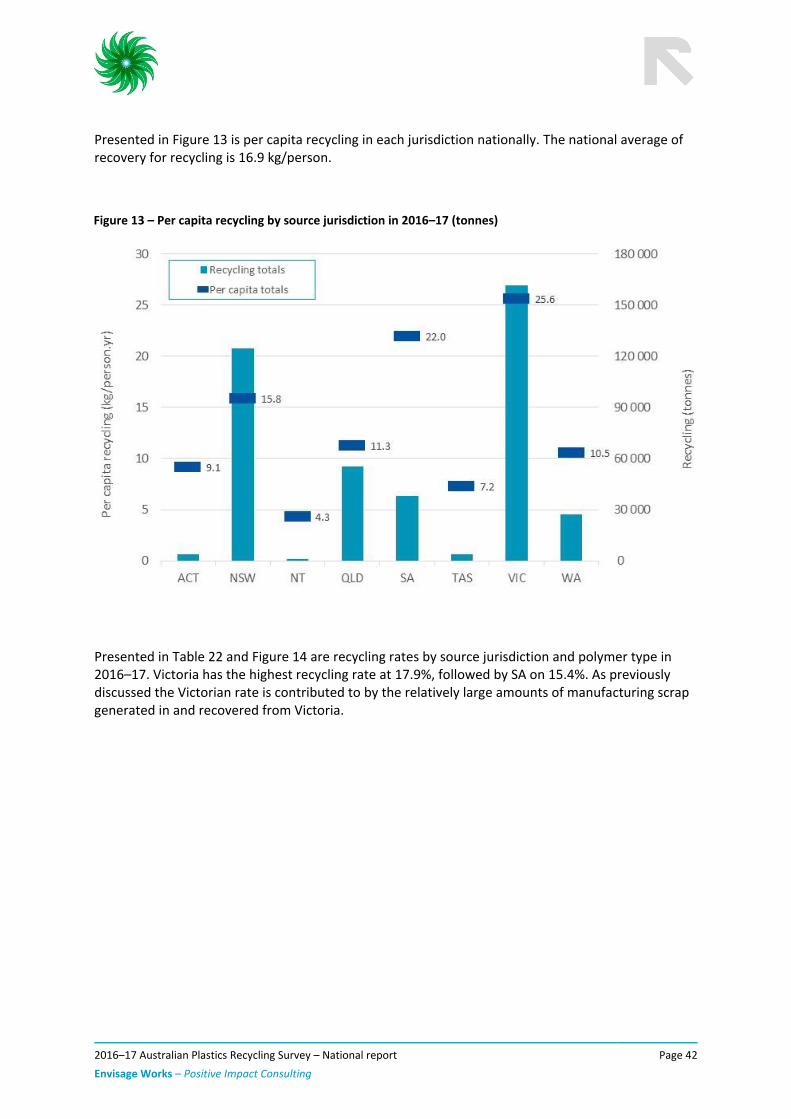
Presented in Figure 13 is per capita recycling in each jurisdiction nationally. The national average of recovery for recycling is 16.9 kg/person.
Figure 13 – Per capita recycling by source jurisdiction in 2016–17 (tonnes)
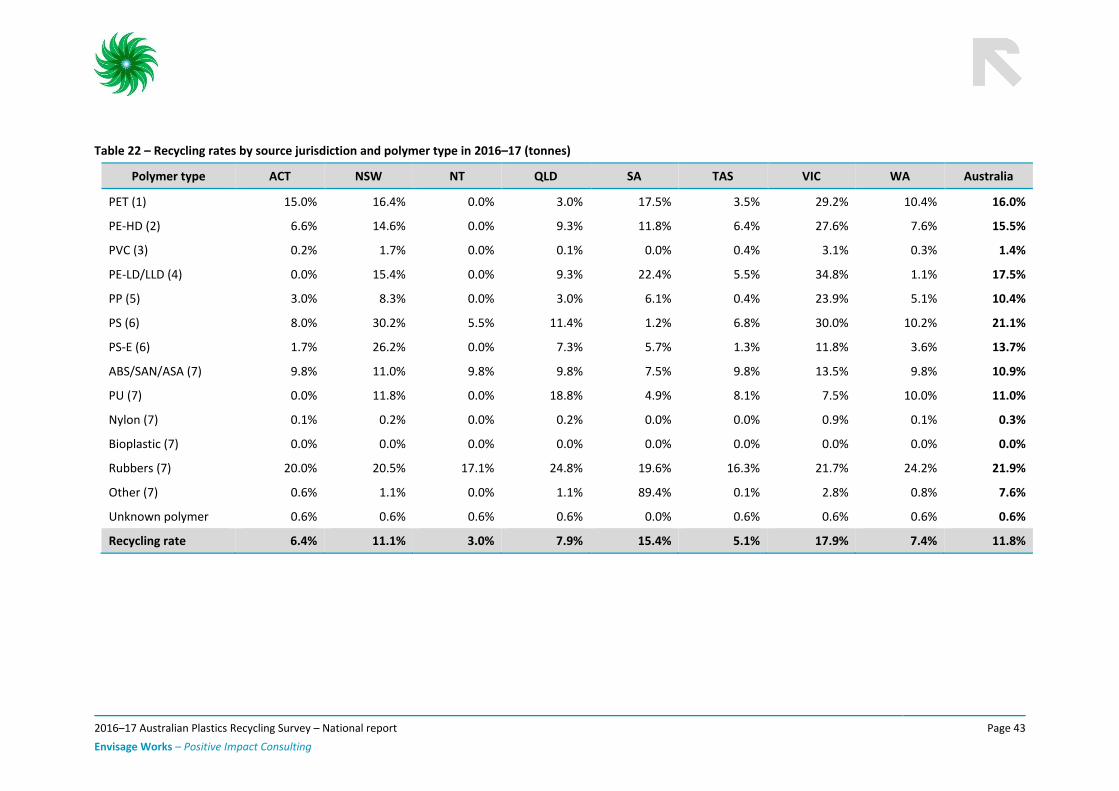
Presented in Table 22 and Figure 14 are recycling rates by source jurisdiction and polymer type in 2016–17. Victoria has the highest recycling rate at 17.9%, followed by SA on 15.4%. As previously discussed the Victorian rate is contributed to by the relatively large amounts of manufacturing scrap generated in and recovered from Victoria.
2016–17 Australian Plastics Recycling Survey – National report
Envisage Works – Positive Impact Consulting
Page 43
Table 22 – Recycling rates by source jurisdiction and polymer type in 2016–17 (tonnes)
Polymer type ACT NSW NT QLD SA TAS VIC WA Australia
PET (1) 15.0% 16.4% 0.0% 3.0% 17.5% 3.5% 29.2% 10.4% 16.0%
PE-HD (2) 6.6% 14.6% 0.0% 9.3% 11.8% 6.4% 27.6% 7.6% 15.5%
PVC (3) 0.2% 1.7% 0.0% 0.1% 0.0% 0.4% 3.1% 0.3% 1.4%
PE-LD/LLD (4) 0.0% 15.4% 0.0% 9.3% 22.4% 5.5% 34.8% 1.1% 17.5%
PP (5) 3.0% 8.3% 0.0% 3.0% 6.1% 0.4% 23.9% 5.1% 10.4%
PS (6) 8.0% 30.2% 5.5% 11.4% 1.2% 6.8% 30.0% 10.2% 21.1%
PS-E (6) 1.7% 26.2% 0.0% 7.3% 5.7% 1.3% 11.8% 3.6% 13.7%
ABS/SAN/ASA (7) 9.8% 11.0% 9.8% 9.8% 7.5% 9.8% 13.5% 9.8% 10.9%
PU (7) 0.0% 11.8% 0.0% 18.8% 4.9% 8.1% 7.5% 10.0% 11.0%
Nylon (7) 0.1% 0.2% 0.0% 0.2% 0.0% 0.0% 0.9% 0.1% 0.3%
Bioplastic (7) 0.0% 0.0% 0.0% 0.0% 0.0% 0.0% 0.0% 0.0% 0.0%
Rubbers (7) 20.0% 20.5% 17.1% 24.8% 19.6% 16.3% 21.7% 24.2% 21.9%
Other (7) 0.6% 1.1% 0.0% 1.1% 89.4% 0.1% 2.8% 0.8% 7.6%
Unknown polymer 0.6% 0.6% 0.6% 0.6% 0.0% 0.6% 0.6% 0.6% 0.6%
Recycling rate 6.4% 11.1% 3.0% 7.9% 15.4% 5.1% 17.9% 7.4% 11.8%
2016–17 Australian Plastics Recycling Survey – National report
Envisage Works – Positive Impact Consulting
Page 44
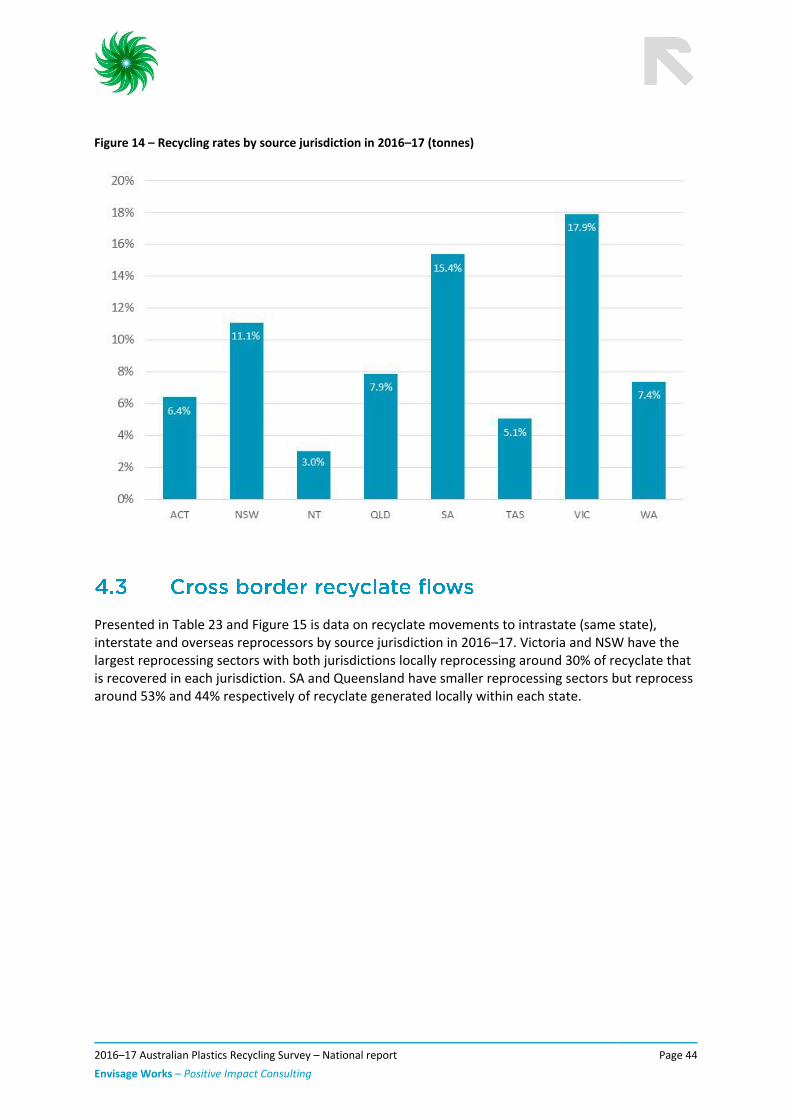
Figure 14 – Recycling rates by source jurisdiction in 2016–17 (tonnes)
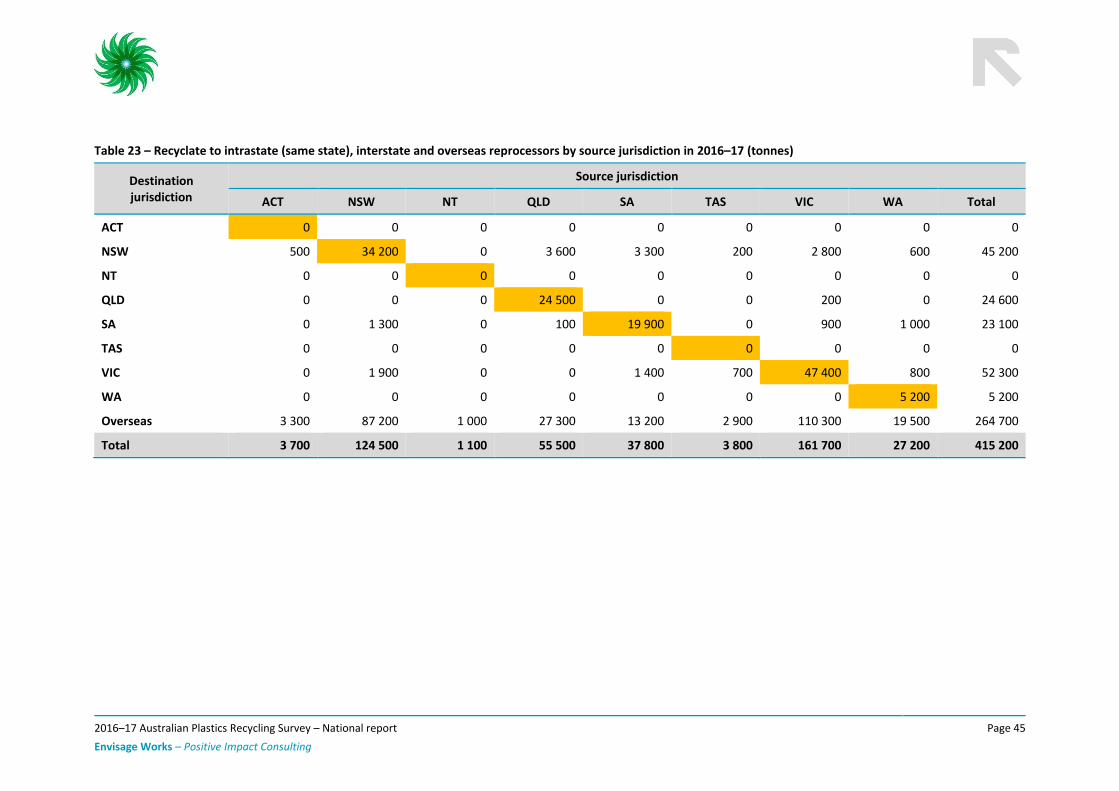
Presented in Table 23 and Figure 15 is data on recyclate movements to intrastate (same state), interstate and overseas reprocessors by source jurisdiction in 2016–17. Victoria and NSW have the largest reprocessing sectors with both jurisdictions locally reprocessing around 30% of recyclate that is recovered in each jurisdiction. SA and Queensland have smaller reprocessing sectors but reprocess around 53% and 44% respectively of recyclate generated locally within each state.
2016–17 Australian Plastics Recycling Survey – National report
Envisage Works – Positive Impact Consulting
Page 45
Table 23 – Recyclate to intrastate (same state), interstate and overseas reprocessors by source jurisdiction in 2016–17 (tonnes)
Destination jurisdiction
Source jurisdiction
ACT NSW NT QLD SA TAS VIC WA Total
ACT 0 0 0 0 0 0 0 0 0
NSW 500 34 200 0 3 600 3 300 200 2 800 600 45 200
NT 0 0 0 0 0 0 0 0 0
QLD 0 0 0 24 500 0 0 200 0 24 600
SA 0 1 300 0 100 19 900 0 900 1 000 23 100
TAS 0 0 0 0 0 0 0 0 0
VIC 0 1 900 0 0 1 400 700 47 400 800 52 300
WA 0 0 0 0 0 0 0 5 200 5 200
Overseas 3 300 87 200 1 000 27 300 13 200 2 900 110 300 19 500 264 700
Total 3 700 124 500 1 100 55 500 37 800 3 800 161 700 27 200 415 200
2016–17 Australian Plastics Recycling Survey – National report
Envisage Works – Positive Impact Consulting
Page 46
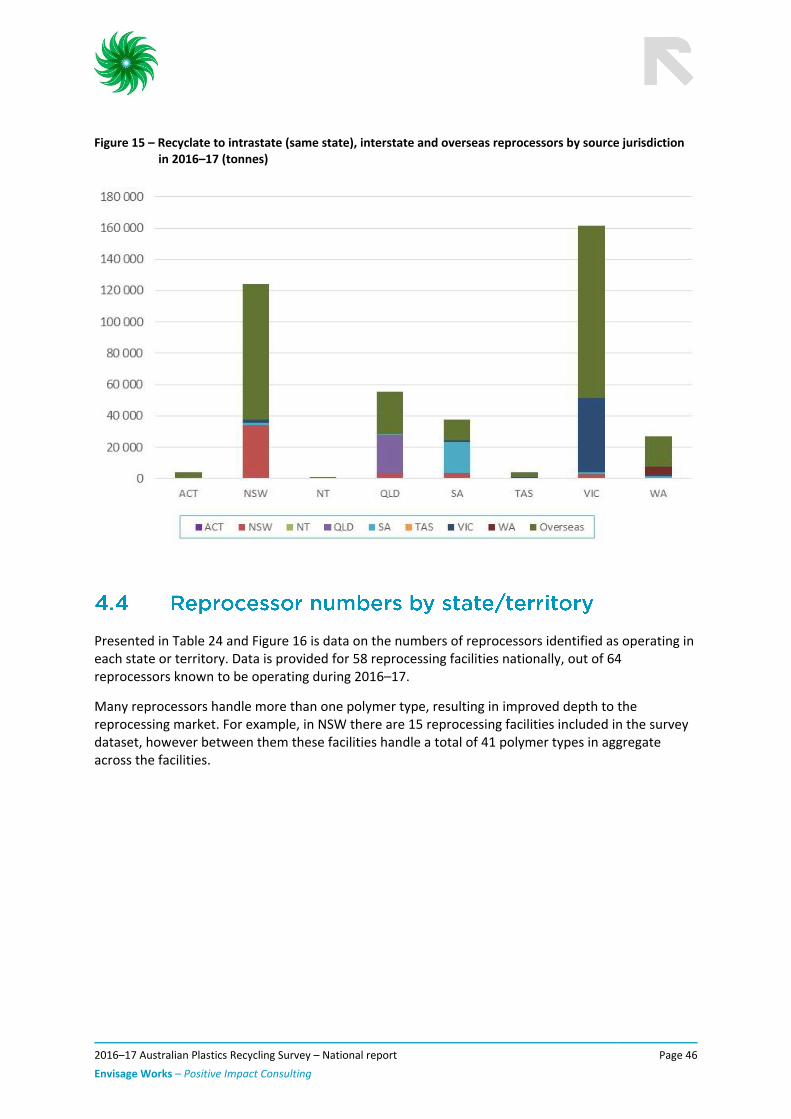
Figure 15 – Recyclate to intrastate (same state), interstate and overseas reprocessors by source jurisdiction in 2016–17 (tonnes)
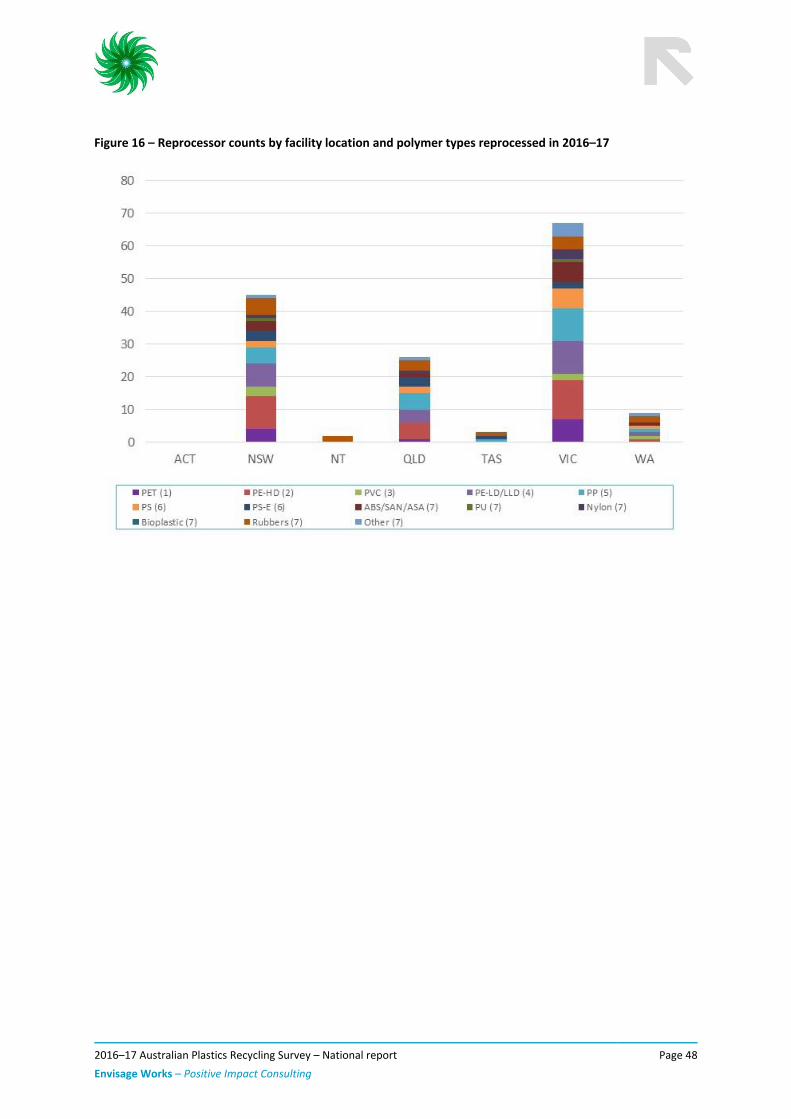
Presented in Table 24 and Figure 16 is data on the numbers of reprocessors identified as operating in each state or territory. Data is provided for 58 reprocessing facilities nationally, out of 64 reprocessors known to be operating during 2016–17.
Many reprocessors handle more than one polymer type, resulting in improved depth to the reprocessing market. For example, in NSW there are 15 reprocessing facilities included in the survey dataset, however between them these facilities handle a total of 41 polymer types in aggregate across the facilities.

2016–17 Australian Plastics Recycling Survey – National report
Envisage Works – Positive Impact Consulting
Page 47
Table 24 – Reprocessor counts by facility location and polymer types reprocessed in 2016–17
ACT NSW NT QLD SA1 TAS VIC WA Total
Number of reprocessors
0 20 2 12 12 2 24 4 76
Polymer reprocessed Number of reprocessors in the jurisdiction reprocessing the polymer type
PET (1) 0 4 0 1 N/A 0 7 0 12
PE-HD (2) 0 10 0 5 N/A 0 12 1 28
PVC (3) 0 3 0 0 N/A 0 2 1 6
PE-LD/LLD (4) 0 7 0 4 N/A 0 10 1 22
PP (5) 0 5 0 5 N/A 1 10 1 22
PS (6) 0 2 0 2 N/A 0 6 1 11
PS-E (6) 0 3 0 3 N/A 1 2 0 9
ABS/SAN/ASA (7) 0 3 0 1 N/A 0 6 1 11
PU (7) 0 1 0 0 N/A 0 1 0 2
Nylon (7) 0 1 0 1 N/A 0 3 0 5
Bioplastic (7) 0 0 0 0 N/A 0 0 0 0
Rubbers (7) 0 5 2 3 N/A 1 4 2 17
Other (7) 0 1 0 1 N/A 0 4 1 7
Unknown polymer 0 0 0 0 N/A 0 0 0 0
Total count 0 45 2 26 N/A 3 67 9 152
1. SA data on the number of reprocessors handling each polymer type not available to be reported.
2016–17 Australian Plastics Recycling Survey – National report
Envisage Works – Positive Impact Consulting
Page 48
Figure 16 – Reprocessor counts by facility location and polymer types reprocessed in 2016–17
2016–17 Australian Plastics Recycling Survey – National report
Envisage Works – Positive Impact Consulting
Page 49
The resource efficiency hierarchy (or waste hierarchy) provides a guide to the selection of waste minimisation and recovery strategies which maximise the conservation of resources. Avoidance is always preferable to recovery, however there are a number of beneficial options available for the recovery of plastic products. It is also important that recoverability should be considered at the design stage to minimise the product’s environmental impacts at end of life. This is now often considered during packaging design in Australia, but is rarely considered for plastics used in other applications.
The following sections provide a summary of the current status of each recovery option for plastics products in Australia.
The feasibility and environmental benefit of each recovery option will depend on the design of the product, its durability and the availability of a suitable recovery system. For this reason, an important distinction needs to be made between short-life products such as packaging, and more durable products such as appliances, furniture and building products.
The environmental impacts and benefits of durable products such as electrical and electronic appliances, furniture, cars and building products over their life cycle are more likely to be associated with the use stage.
Reuse is usually a preferable end of life option, however its feasibility will depend on the economic viability and environmental impacts of reuse, for example from cleaning or transport. Reuse is increasingly being used as a design for sustainability strategy for distribution packaging, for example reusable produce (RPCs) crates are now commonly used for transporting fruit and vegetables from growers all the way to the supermarket shelf and have avoided the consumption of huge quantities of single-use cardboard boxes. There is some reuse of automotive parts. Remanufacturing is undertaken on a smaller scale, usually for electrical or electronic products such as toner cartridges and photocopiers.
Mechanical recycling is the focus of this report. The infrastructure for collection and reprocessing is relatively well established in Australia for some products such as packaging. It is also generally preferable to feedstock recycling because it maintains the economic value of the polymer at a relatively high level and reduces the amount of energy required to manufacture new plastic products.
This recovery option is most economically viable for plastics that are available in large quantities, in a clean and homogenous (or sortable) form, and in locations with reasonable access to recycling facilities. Mixed plastics can also be recycled, however they are more challenging as they either need to be separated, or recycled into a reduced range of mixed polymer product types. These mixed polymer products often have long lifespans, and may be recycled back into similar products at end of life.
2016–17 Australian Plastics Recycling Survey – National report
Envisage Works – Positive Impact Consulting
Page 50
Feedstock recycling is the conversion of polymers back into a monomer or new raw materials by changing their chemical structure. Feedstock recycling back into monomers is undertaken on a small scale overseas but not currently in Australia.
Biological recycling (i.e. through composting or anaerobic digestion) is undertaken on a very small scale for packaging made from biodegradable plastics, but facilities are limited, and contamination of compost products is a significant issue. The quantities of biodegradable plastics recovered into compost in Australia are unknown, but would be very low nationally (i.e. >100 tonnes).
Energy can be recovered from plastics through controlled combustion or conversion to a liquid fuel (which is subsequently burnt). Energy recovery may be a good option for plastics that are not suitable for mechanical recycling, such as contaminated products. There is now some controlled combustion occurring in Australia, however there is no known conversion to liquid fuels.
There is some energy recovery from plastics by a waste derived process fuel at one cement kiln in South Australia. There is also the thermal treatment of medical waste, which contains a reasonably high proportion of plastics, however this is typically undertaken without energy recovery.
2016–17 Australian Plastics Recycling Survey – National report
Envisage Works – Positive Impact Consulting
Page 51
By the end of 2017 new Chinese scrap import restrictions will significantly reduce or completely ban imports of mixed plastic wastes, and higher quality sorted scrap plastics such as baled PET bottles, HPDE bottles, C&I LDPE film, and C&I EPS extruded/compacted packaging. The exception to the bans may be plastic scrap that has been converted back to a single thermoplastic material and transformed into primary forms (i.e. equivalent to virgin resin).
China is currently the largest destination market of mixed kerbside recyclables from Australia and therefore the ban will likely place significant downwards pressure on the price of recovered plastics internationally, as the rest of the global market for plastics scrap will be unlikely to be able to absorb the available supply in the short to medium term.
E-waste plastics have already been affected by the ban, as China has been a significant market for TV, computer and other forms of scrap e-waste related plastics generated through local e-waste recovery and recycling activities. This is creating significant challenges for the local industry.
Used tyre exports will probably be unaffected by the ban as only around 2% of used tyres exported from Australia are sent to China, with the major destinations being India (20%), Taiwan (19%), USA (13%), Republic of Korea (13%) and Thailand (7%). Note that a proportion of used tyre exports may be to intermediary countries and are then re-exported to China (e.g. Taiwan to China). However, as a potential outcome of the ban will be to drive more and higher quality plastics into energy recovery fates, this may create competition for used tyres into energy recovery, driving down the price of used tyres and creating challenges for the local used tyre recovery export market. Used tyres are not mentioned in the Chinese ban filing with the World Trade Organisation (WTO).
Waste textiles and used clothing are also captured in the ban, so any reuse or recycling of unprocessed synthetic fibres by Chinese manufacturers are likely to also be significantly reduced, however exports of these materials from Australia to China is low.
The detail of how the Chinese Government will apply the bans is still a developing space although it has already had an impact on the local reprocessor market in the second half of 2017. It is anticipated that the actual impact will become clearer during 2018.
The original filing of the ban by Chinese trade officials with the WTO in July 2017 can be viewed at:
https://docs.wto.org/dol2fe/Pages/FE_Search/FE_S_S009-DP.aspx?language=E&CatalogueIdList=237688
• Continuing on from 2015–06, 2016–17 was also characterised by very slim margins available on recycled plastics due to low oil and gas prices making virgin resins cheaper, along with a general oversupply of virgin polymer manufacturing capacity internationally. Virgin resins contain new polymer material with no recycled material content. In the manufacturing of new products virgin resin are often the major competitor to recycled plastics. In many cases manufacturers of new products expect recyclate based resins to be equivalent in performance and less costly than virgin resin,
2016–17 Australian Plastics Recycling Survey – National report
Envisage Works – Positive Impact Consulting
Page 52
so in the current virgin resin low-cost environment, recyclate based resins are not purchased.
• Export quality continues to be identified as a key challenge in 2016–17 for recovered packaging plastics, particularly for mixed plastics. This issue is highly likely to be greatly exacerbated in 2018 due to the Chinese scrap plastic import bans coming into force.
• Local reprocessors have seen the impact of the Chinese bans starting as early as the September 2017, and some are responding by investing in infrastructure to manufacture recycled content products for local markets.
• Changes in processing –International innovations in processing equipment (e.g. polymer sorters) mean there is greater capacity to sort and separate different plastic packaging types by polymer type and colour. This type of equipment is now well-established at significant scale of use in Australia.
The following is a synthesis of comments received (not direct quotes) from plastics reprocessors, with respect to the market conditions for used plastics during the 2016–17 financial year:
• The shift in the export of scrap plastics (both pre-consumer and post-consumer) from China to Vietnam and Malaysia is already being reported by local reprocessors, and is anticipated to reduce the price/cost of recyclate, including higher value pre-consumer sourced scrap plastics, such as PET from beverage bottle manufacture.
• A notable oversupply of recyclate is starting to be observed by some local reprocessors, that coming into the end of 2017 have started to receive more enquiries to take waste plastics. In many cases reprocessors are not interested as their facilities are already operating at full capacity for the markets that they serve. There are exceptions to this where strong local markets for recycled plastics exist, such as EPS into the building industry.
The following is a summary of the feedback received from a number of plastics reprocessors with respect to the market conditions for the sale of plastic recyclate:
• Slim margins available on recycled plastics due to low oil and gas prices making virgin plastics cheaper, along with a general oversupply of virgin polymer manufacturing capacity internationally.
• The Chinese export ban is already placing downwards pressure on the local and export market prices for processed recyclate.

2016–17 Australian Plastics Recycling Survey – National report
Envisage Works – Positive Impact Consulting
Page 53
After reprocessing, recycled plastics are used to manufacture new products, with new applications often quite different from those of the original use. The applications for recycled plastics are growing in Australia. Outlined in Table 25 are many of the typical uses of recycled plastics in Australia.
Table 25 – Typical uses of recycled plastics in Australia
Polymer Major uses of recycled polymer Minor uses of recycled polymer
PET Beverage bottles Timber substitutes, geo-textiles, pallets and fence posts.
PE-HD Films, pallets, wheelie bins, irrigation hose and pipes
Cable covers, extruded sheet, moulded products, shopping and garbage bags, slip sheets, drip sheets for water, wood substitutes and mixed plastics products (e.g. fence posts, bollards, kerbing, marine structures and outdoor furniture), materials handling and roto-moulded water tanks.
PVC Pipe, floor coverings
Hose applications and fittings, pipes including foam core pipes, profiles and electrical conduit, general extrusion and injection moulding, clothing, fashion bags and shoes.
PE-LD/LLD Film (incl. builders’ and agricultural film, concrete lining, freight packaging, garbage bags, shopping bags), agricultural piping
Trickle products, vineyard cover, pallets, shrink wrap, roto-moulding, slip sheets, irrigation tube, timber substitutes, cable covers, builders’ film, garbage bags, carry bags, and other building industry applications.
PP Crates boxes and plant pots
Electrical cable covers, building panels and concrete reinforcement stools (bar chairs and shims), furniture, irrigation fittings, agricultural and garden pipe, drainage products (such as drain gates) and tanks, builders film, kerbing, bollards, concrete reinforcing and a wide variety of injection moulded products.
PS Bar chairs and industrial spools Office accessories, coat hangers, glasses, building components, industrial packing trays, wire spools and a range of extrusion products.
PS-E Waffle pods for under slab construction of buildings
Synthetic timber applications (including photo frames, decorative architraves, fence posts), XPS (extruded polystyrene) insulation sheeting, and lightweight concrete.
ABS/SAN Injection moulded products Automotive components, laminate edging, sheet extrusion, coffin handles, drainage covers, auto parts and a range of injection moulded products.
Polyurethane Carpet underlay Mattresses
Nylon Injection moulded products Furniture fittings, wheels and castors and a range of injection moulded products.
Other and mixed
Timber substitute products in general and piping
Fence posts, bollards, garden stakes, kerbing, marine structures, post and rail systems, scaffold pads, piggery boards, shipping dunnage, rail bridge transoms.
2016–17 Australian Plastics Recycling Survey – National report
Envisage Works – Positive Impact Consulting
Page 54
ABS, 2017. 3101.0 Australian Demographic Statistics. Table 4. Estimated Resident Population, States and Territories (Number). [Online] Available at: http://www.abs.gov.au/AUSSTATS/[email protected]/DetailsPage/3101.0Jun%202017?OpenDocument [Accessed 4 January 2018].
ACT NOWaste, 2017. ACT NOWaste Recycling Industry Survey (unpublished), Canberra: ACT NOWaste.
ANZRP, 2017. ANZRP Annual Report 2015/2016 Regulator Version, Melbourne: Australia and New Zealand Recycling Platform.
Blue Environment, 2017. Australian National Waste Report 2016, Melbourne: Report prepared by Blue Environment and Randell Environmental Consulting on behalf of the Department of the Environment and Energy.
DEE, 2016. National Television and Computer Recycling Scheme – Outcomes 2014–15, Canberra: Department of the Environment and Energy.
DFAT, 2017. Australian Customs Service – Plastics import and export data – 2016–17, Canberra: Department of Foreign Affairs and Trade.
Ecycle, 2017. Ecycle Solutions Annual Report 2016 - Co-regulatory Arrangement - National Television and Computer Recycling Scheme, Dandenong: Ecycle Solutions.
Envisage, 2017. Used tyres material flow analysis (MFA) and market opportunities assessment model (unpublished), Melbourne: Model developed by Envisage Works, Randell Environmental Consulting and Reincarnate on behalf of Sustainability Victoria and partners.
EPSA, 2017. Product Stewardship Televisions and Computers - Annual Report 2015/16, Villawood: Electronic Product Stewardship Australasia.
Green Industries SA, 2017. Survey of South Australian plastics reprocessors – 2016–17 data, Adelaide: Green Industries SA.
Hyder, 2008. Plastic Retail Carry Bag Use – 2006 and 2007 consumption, Melbourne: Report prepared by Hyder Consulting on behalf of the Environment Protection and Heritage Council.
IBISWorld, 2017. IBISWorld Industry Report G4111 - Supermarkets and Grocery Stores in Australia, Melbourne: IBISWorld.
MRI PSO, 2017. MRI PSO Product Stewardship Arrangement 2015-16 Annual Report, Campbellfield: MRI PSO.
REC, 2017. National survey of tyre reprocessors for 2015–16 (unpublished), Melbourne: Survey undertaken by Randell Environmental Consulting, Reincarnate and Envisage Works on behalf of Sustainability Victoria and partners.