Embed Size (px)
Citation preview
MICHIGAN DEPARTMENT OF NATURAL RESOURCES Wildlife Report No. 3621
July 2016
A contribution of Federal Aid in Wildlife Restoration, Michigan Project W-147-R
Equal Rights for Natural Resource Users The Michigan Department of Natural Resources provides equal opportunities for employment and access to Michigan's natural resources. Both State and Federal laws prohibit discrimination on the basis of race, color, national origin, religion, disability, age, sex, height, weight or marital status under the U.S. Civil Rights Acts of 1964 as amended, 1976 MI PA 453, 1976 MI PA 220, Title V of the Rehabilitation Act of 1973 as amended, and the 1990 Americans with Disabilities Act, as amended. If you believe that you have been discriminated against in any program, activity, or facility, or if you desire additional information, please write: Human Resources, Michigan Department of Natural Resources, PO Box 30473, Lansing MI 48909-7973, or Michigan Department of Civil Rights, Cadillac Place, 3054 West Grand Blvd, Suite 3-600, Detroit, MI 48202, or Division of Federal Assistance, U.S. Fish & Wildlife Service, 4401 North Fairfax Drive, Mail Stop MBSP-4020, Arlington, VA 22203.
For information or assistance on this publication, contact Michigan Department of Natural Resources, Wildlife Division, P.O. Box 30444, MI 48909. This publication is available in alternative formats upon request.
IC2390-11 (07/19/2016)
MICHIGAN DEER HARVEST SURVEY REPORT 2015 SEASONS
Brian J. Frawley and Caitlin E. Boon
ABSTRACT A survey of deer hunters was conducted following the 2015 hunting seasons to estimate hunter participation, harvest, and hunting effort. In 2015, an estimated 607,113 hunters spent 8.7 million days afield. Statewide, the number of people hunting decreased significantly by 1% between 2014 and 2015. Hunters harvested about 335,000 deer. Harvest was not significantly different from 2014. Statewide, 42% of hunters harvested a deer in 2015. About 19% of the hunters took an antlerless deer and 29% took an antlered buck in 2015. Approximately 12% of deer hunters harvested two or more deer of any type. Less than 4% of hunters statewide harvested two antlered bucks. Levels of satisfaction with numbers of deer seen, bucks seen, and number of deer taken statewide increased significantly in 2015 from 2014, while satisfaction with overall deer hunting experience was not significantly changed. Statewide, 45% of hunters were satisfied with their overall hunting experience in 2014, and satisfaction was highest in the Lower Peninsula. About 185,632 hunters used a crossbow during the 2015 archery season, and they harvested approximately 65,988 deer with the crossbow. About 8% fewer individuals purchased a deer hunting license in 2015 than ten years ago in 2005. Although the overall number of license buyers declined from 2005, an increased number of people younger than 14 years of age and people older than 50 purchased a license in 2015. Over 11% of the license buyers in 2015 were younger than 17 years old.
2
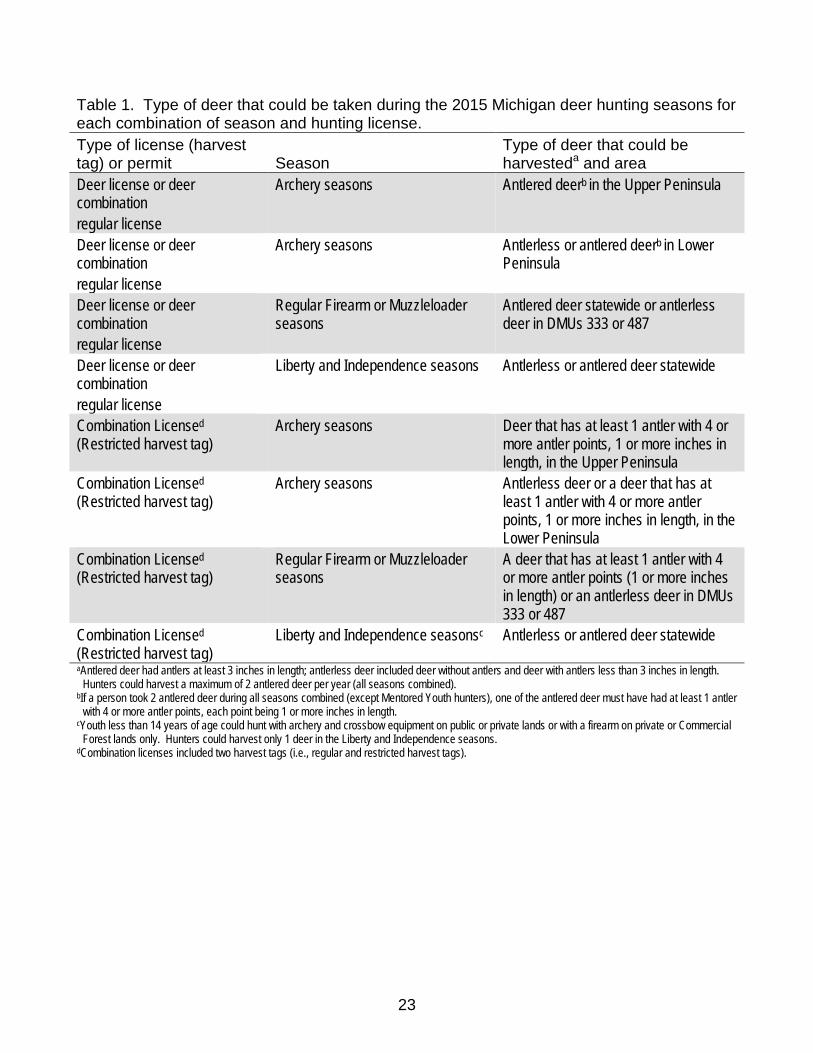
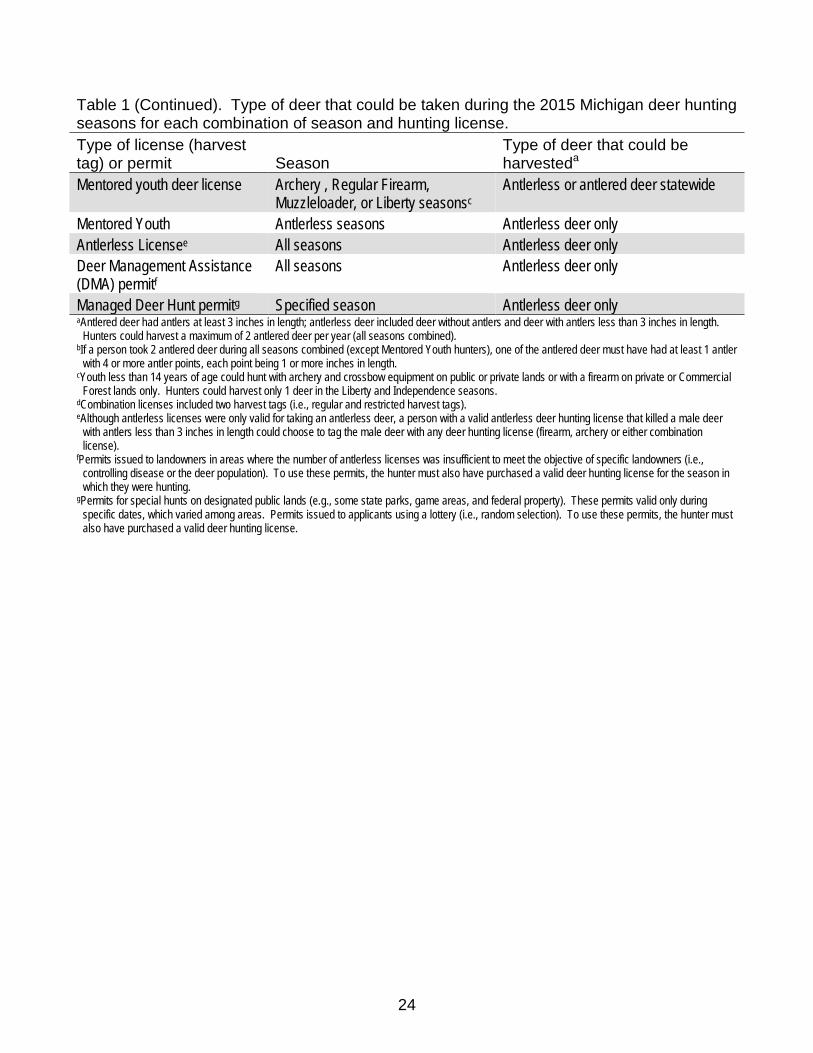
INTRODUCTION The Natural Resources Commission (NRC) and Michigan Department of Natural Resources (DNR) have the authority and responsibility to protect and manage the wildlife resources of the state of Michigan. Harvest surveys are one of the management tools used to accomplish this statutory responsibility. Estimating hunter participation, harvest, and hunting effort (hereafter referred to as estimates) are the primary objectives of these surveys. Estimates derived from harvest surveys as well as information from deer (Odocoileus virginianus) harvest check stations, deer pellet group surveys, trends in deer-vehicle collisions, population modeling, and input received from the public are used to monitor deer populations and establish harvest regulations. Estimating harvest, hunter numbers, and hunting effort were the primary objectives of the deer harvest survey. This survey also provided an opportunity to collect information about management issues. Questions were added to the questionnaire to investigate hunter satisfaction with the 2014 hunting season and deer numbers. Deer hunters were also asked whether they supported the antler point restrictions that were enacted in the Upper Peninsula (UP) and Deer Management Unit (DMU) 487 (northeast Lower Peninsula). Deer were grouped into either antlered or antlerless deer when developing hunting regulations. Antlered deer included deer with at least one antler three inches or longer, and antlerless deer included deer without antlers and deer with antlers less than 3 inches in length. The type of deer that could be harvested by hunters depended upon the area hunted, hunting season, and license purchased (Table 1). During 2015, deer could be harvested primarily during the following hunting seasons: Liberty, archery, regular firearm, muzzleloader, early antlerless, late antlerless, and Independence. In order to harvest a deer, hunters had to possess a hunting license (deer, combination, antlerless, mentored youth license, or antlerless) (Table 1). A harvest tag was issued as part of the hunting license. Deer, mentored youth, and antlerless licenses included one harvest tag, while combination licenses had two harvest tags. Hunters could purchase a maximum of two licenses for taking antlered deer. Hunters wanting to harvest only one antlered deer could purchase a single deer license (one kill tag), while hunters wanting to take two antlered deer could purchase a combination license (two kill tags). Hunters who purchased a single deer license could not purchase a second deer license or a combination license. If a hunter took two antlered deer, one needed to have at least one antler with four or more points (qualifying points must be at least one inch), except for deer taken by mentored youth hunters. A person with a mentored youth license could use their one harvest tag to take a deer of either sex during the archery, regular firearm, muzzleloader, or Liberty seasons. Antler point restrictions were adopted in 2008 for the taking of antlered deer (bucks) in the UP. Under this regulation, the regular buck tag of a combination deer license could only be used to tag a buck with at least three antler points on one side. The restricted tag could only be
3
placed on a buck with a minimum of four points on one side. Hunters who chose to purchase only a deer license were restricted to one buck only (without any antler point restrictions) in the UP, all seasons combined. The same antler point restrictions that were adopted in the UP in 2008 were implemented in DMU 487 in the northeast Lower Peninsula (LP) in 2010. In addition, hunters in DMU 487 could use any deer hunting license (including the combination license) to take an antlerless deer during the firearm or muzzleloader seasons. Deer Management Unit 487 included Alcona, Alpena, Iosco, Montmorency, Oscoda, and Presque Isle counties. Antler point restrictions were implemented in the 12-county area in the northwest Lower Peninsula. This area included Antrim, Benzie, Charlevoix, Emmet, Grand Traverse, Kalkaska, Lake, Manistee, Mason, Missaukee, Osceola, or Wexford counties. All antlered deer taken in these counties had to have at least three points on one antler. Antlerless licenses could be purchased in addition to deer, mentored youth, or combination licenses. Antlerless deer licenses allowed hunters to take antlerless deer during any season with equipment appropriate for the season. Use of each antlerless license was restricted to a single DMU designated at the time of purchase. Antlerless licenses were available for most of the state, except in nineteen DMUs (007, 017, 021, 022, 027, 031, 036, 042, 048, 066, 117, 121, 127, 131, 149, 152, 249, 252, and 349) in the UP. A limited number of antlerless licenses were issued specifically for either public or private lands. Public land antlerless licenses were not available in all DMUs that had private land licenses. A public-land antlerless deer license was required to hunt antlerless deer on Commercial Forest land. The number of licenses available in DMUs open to antlerless deer hunting was established by the NRC (Appendix A). Hunters could apply for an antlerless license through the drawing, purchase a private land license for selected areas without application, or wait to purchase a leftover license after the drawing, if available. A private land antlerless deer hunting license was valid for taking antlerless deer only from privately-owned lands within the DMU specified on the license with landowner permission. A private land license was not valid on land enrolled in the Commercial Forest Act program (Commercial Forest Lands). A public land antlerless deer hunting license allowed an individual to hunt for antlerless deer upon publicly-owned lands (including state, federal, and county lands) open to hunting and Commercial Forest Lands within the DMU for which it was issued. A public land license was invalid on any privately-owned lands except Commercial Forest Lands. Hunters could purchase two antlerless deer licenses each day, except for licenses valid in DMUs 333, 452, and 487. Hunters could purchase five antlerless licenses each day for private land in DMU 487 and could purchase five public land antlerless licenses each day in DMU 452. An unlimited number of antlerless licenses could be purchased per day for DMU 333. Furthermore, hunters were limited to a maximum of five private land antlerless deer licenses for the entire year, except for DMUs 019, 033, 078, 333, and 487. Hunters were limited to ten private land licenses in DMU 487. There was no seasonal limit for the
4
number of private lands licenses that could be purchased in DMU 019, 033, 078, and 333. In addition, there was no seasonal limit for public land antlerless licenses in any DMU where licenses were available. Deer Management Unit 487 included private land in DMUs 001, 004, 035, 060, 068, 071, 135 and 452. A private land antlerless deer license for DMU 487 was valid on private land within any of the eight subunits. The Pure Michigan Hunt (PMH) was a unique multi-species hunting opportunity offered for the first time in 2010. Individuals could purchase an unlimited number of applications for the PMH. Three individuals were randomly chosen from all applications, and winners received elk, bear, spring turkey, fall turkey, and antlerless deer hunting licenses and could participate in a reserved waterfowl hunt on a managed waterfowl area. The antlerless deer hunting license was valid for all areas open for hunting antlerless deer and during all deer hunting seasons in which they were eligible to participate. Deer Management Assistance (DMA) permits were special antlerless permits issued to landowners where the number of antlerless licenses was insufficient to meet the objective of specific landowners (e.g., controlling disease, crop damage, or deer abundance). These permits allowed hunters to take one antlerless deer per permit during any deer season on the land where issued or adjacent private lands with the landowner’s permission. To use these permits, the hunter also must have purchased a valid deer hunting license for the season in which they were hunting and abide by all other hunting regulations. Managed Deer Hunt permits were antlerless permits that could be used during special seasons on some public lands (e.g., state parks, state wildlife areas, and some federal land). These permits were issued by special random drawings. To use these permits, the hunter also must have purchased a valid deer hunting license and abide by all other hunting regulations. The Liberty Season was held during September 19-20 on public and private lands statewide. Youth (less than 17 years old) and disabled hunters could take no more than one deer during the season. Eligible disabled hunters included hunters issued a permit to use a laser-sighting device or to hunt from a standing vehicle, veterans with 100% disability as defined by the United States Department of Veterans Affairs, or legally blind people could participate in this season. Hunters could take one deer of either sex using a deer or combination license, and antler point restrictions did not apply to taking antlered deer. Only an antlerless deer could be taken with an antlerless license or DMA permit. Youth less than 14 years of age could hunt with archery and crossbow equipment on public or private lands or with a firearm on private or Commercial Forest lands only. All hunters under age 17 hunting with a firearm had to be accompanied by a parent, guardian or someone designated by their parent or guardian. In addition, hunters under 10 years of age had to be licensed through the Mentored Youth Hunting Program and accompanied by a qualified mentor. The archery season occurred statewide on public and private lands. This season was divided into early and late segments (October 1 through November 14 and December 1,
5
2015, through January 1, 2016). Deer licenses, antlerless deer licenses, combination licenses, mentored youth licenses, and DMA permits could be used to take deer during the archery seasons using archery equipment. Deer could also be taken during the Independence Hunt October 15-18, 2015. Hunters could take one deer of either sex on private lands or public lands requiring an access permit. Hunters could use a deer or combination license, and antler point restrictions did not apply to taking antlered deer. Only an antlerless deer could be taken with an antlerless license or DMA permit. Only hunters that were issued a permit to use a laser-sighting device or to hunt from a standing vehicle; veterans with 100% disability as defined by the United States Department of Veterans Affairs; or legally blind people could participate in this season. The statewide regular firearm season occurred November 15-30. The muzzleloader season was held December 4-13 in the UP and Northern LP, and December 4-20 in the Southern LP. Hunters were allowed to take deer on both public and private lands with mentored youth, deer and deer combo hunting licenses during the regular firearm and muzzleloader seasons. Antlerless licenses (including DMA permits) also could be used during the firearm seasons. The early antlerless firearm season occurred from September 19-20. Hunters pursuing deer during this season had to purchase an antlerless or mentored youth license, possess an unused antlerless harvest tag (including DMA permits), and were limited to hunting on private land. The area open to hunting during the early antlerless season was limited to all or portions of 35 counties in the LP (Alcona, Alpena, Antrim, Arenac, Bay, Benzie, Charlevoix, Clinton, Genesee, Grand Traverse, Hillsdale, Huron, Iosco, Ingham, Isabella, Jackson, Lapeer, Leelanau, Lenawee, Livingston, Macomb, Manistee, Midland, Monroe, Montmorency, Oakland, Oscoda, Presque Isle, St. Clair, Saginaw, Sanilac, Shiawassee, Tuscola, Washtenaw, and Wayne). Three more counties were open in 2015 than 2014. The late antlerless firearm season occurred from December 21, 2015, through January 1, 2016. Hunters pursuing deer during this season had to have purchased an antlerless or mentored youth license, possess an unused antlerless harvest tag (including DMA permits), and were limited to hunting on private land. All counties open during the early antlerless firearm season were also open for the late antlerless firearm season, as well as 19 additional counties: Allegan, Barry, Berrien, Branch, Calhoun, Cass, Eaton, Gratiot, Ionia, Kalamazoo, Kent, Mecosta, Montcalm, Muskegon, Newaygo, Oceana, Ottawa, St. Joseph, and Van Buren. Crossbows were legal to use during all archery and firearm seasons statewide, except in the UP, where crossbow use was prohibited during the late archery and muzzleloader seasons, unless the hunter was disabled.
6
METHODS The Wildlife Division provided all hunters the option to report information about their deer hunting activity voluntarily via the internet. This option was advertised through the hunting regulation booklet (digest) and on the DNR website, and an email message was sent to all license buyers that had provided an email address to the DNR (132,905). Hunters reported whether they hunted, the days spent afield, and whether they harvested a deer. Deer hunters were also asked whether they supported the antler point restrictions in the UP and DMU 487. Following the 2015 deer hunting seasons, a questionnaire was sent to 59,966 randomly selected individuals who had purchased a hunting license (deer, antlerless, mentored youth, or combination deer hunting licenses) and had not already voluntarily reported harvest information via the internet. Hunters receiving the questionnaire were asked the same questions as asked via the internet. Hunters were instructed not to report hunting effort and harvest associated with DMA permits because landowners obtaining these permits already were required to report the number of deer harvested to the DNR. Estimates were based primarily on information collected from random samples of hunting license buyers. Thus, these estimates were subject to sampling errors (Cochran 1977). Estimates were calculated using a stratified random sampling design (Cochran 1977) and were presented along with their 95% confidence limit (CL). In theory, this CL can be added and subtracted from the estimate to calculate the 95% confidence interval. The confidence interval is a measure of the precision associated with the estimate and implies the true value would be within this interval 95 times out of 100. Unfortunately, there are several other possible sources of error in surveys that are probably more serious than theoretical calculations of sampling error. They include failure of participants to provide answers (nonresponse bias), question wording, and question order. It is very difficult to measure these biases. License buyers were assigned to one of five groups (strata) based on the type of license purchased and season that it was valid. The first stratum consisted of people eligible only for the archery, regular firearm, and muzzleloader hunting seasons (N = 408,700). The second stratum consisted of people eligible to hunt during archery, regular firearm, muzzleloader, early antlerless, and late antlerless seasons (N = 185,414). The third stratum consisted of people eligible to hunt during archery, regular firearm, muzzleloader, late antlerless, and Liberty seasons (N = 48,915). The fourth stratum consisted of 6,920 people that were eligible to participate in the special disabled hunts. Beginning in 2013, disabled veterans could obtain a free deer hunting license (i.e., Disabled Veteran license type). A unique type of hunting license was not available for non-veteran hunters with disabilities; however, disabled hunters younger than 65 years were sold a discounted hunting license (i.e., sold a senior hunting license). The fifth stratum consisted of 4,630 people that had voluntarily reported information about their hunting activity via the Internet before the random sample was selected. The random sample consisted of 29,239 people from the first stratum; 12,727 from the second stratum; 11,399 from the third stratum; and 6,601 from the fourth stratum. The stratified sampling design accounted for the varying probabilities of being selected from the strata so estimates could be reliably extrapolated from the sample to all license buyers.
7
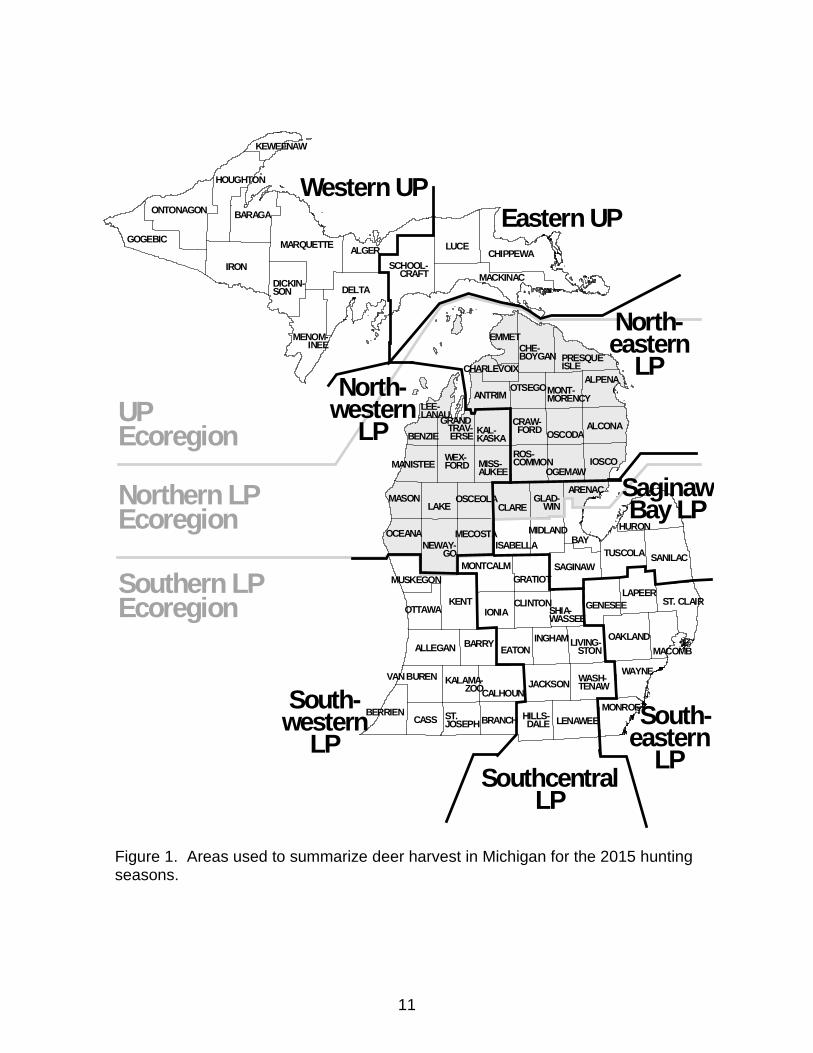
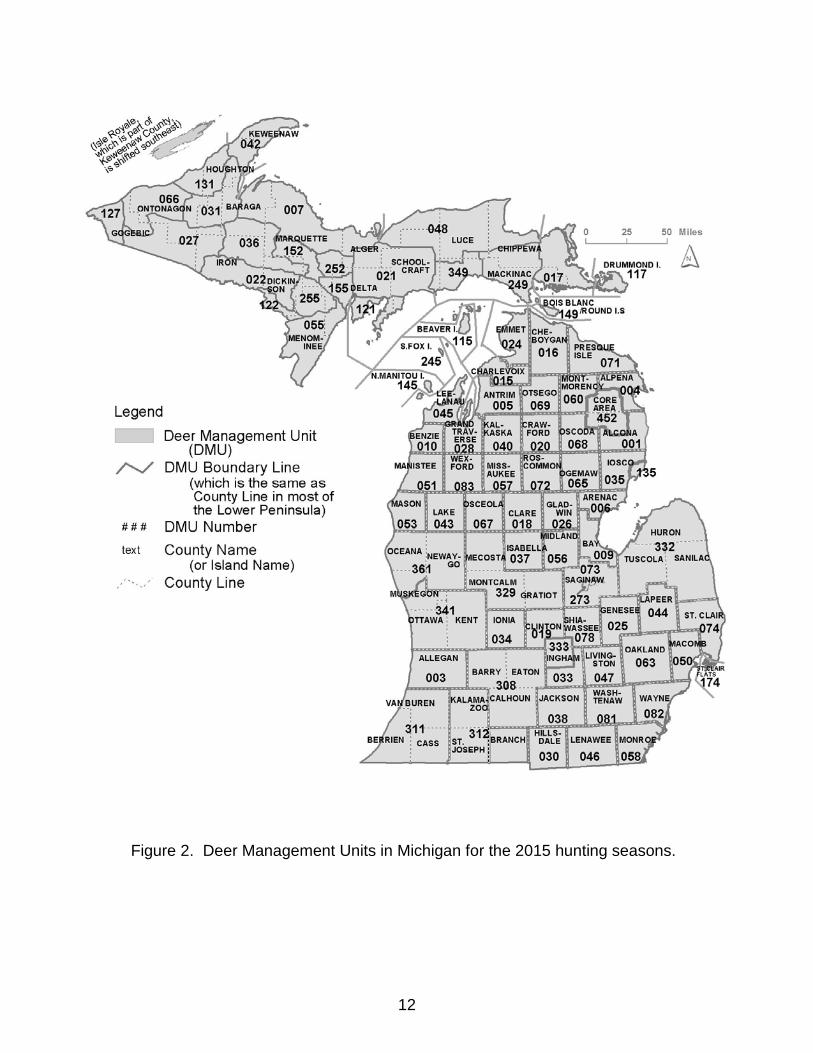
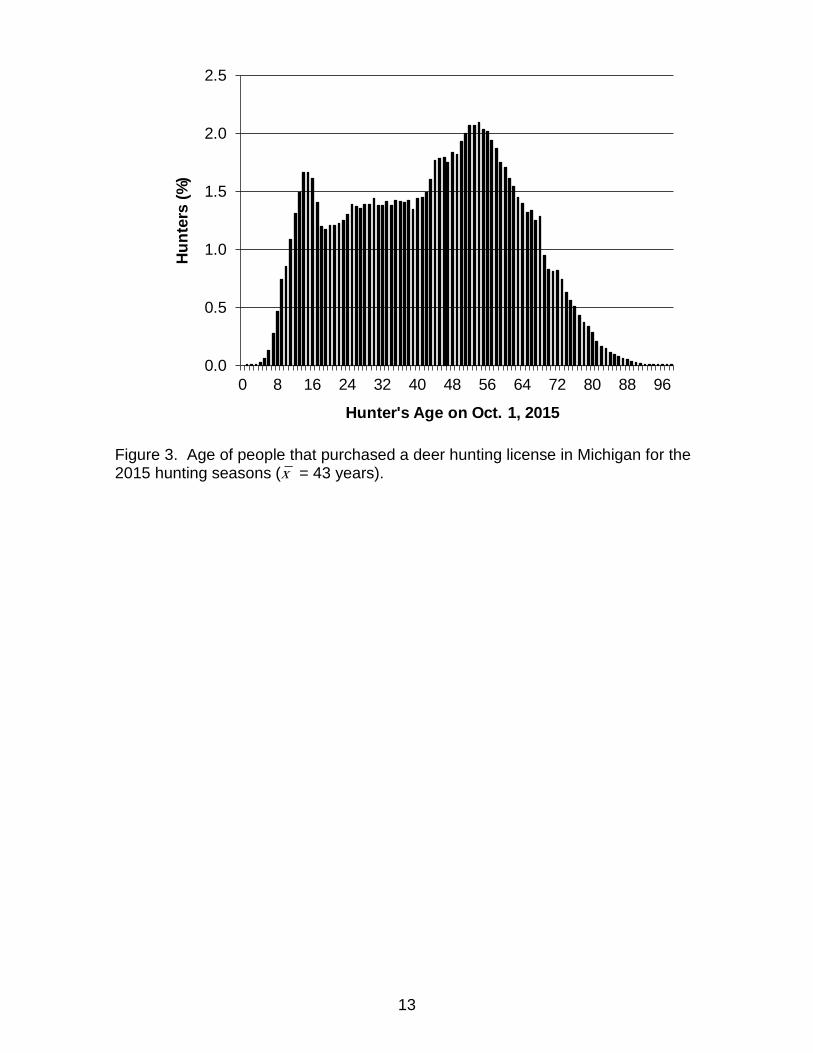
Estimates were calculated separately by the area where the hunt occurred. For consistency with previous surveys, the state was divided into eight areas that closely matched the DNR’s previous wildlife management administrative units (Figure 1). The state was also divided into three ecological regions (UP, Northern LP, and Southern LP). These regions generally matched major ecoregions (Albert 1995), except in the UP where two ecoregions were combined. Ecoregions are regions having similar soils, vegetation, climate, geology, and physiography. Estimates were also calculated for each DMU (Figure 2, Appendix B). Deer harvested from unknown locations were allocated among areas in proportion to the known harvest. Statistical tests are used routinely to determine the likelihood that the differences among estimates are larger than expected by chance alone. The overlap of 95% confidence intervals was used to determine whether estimates differed. Non-overlapping 95% confidence intervals were equivalent to stating that the difference between the means was larger than would be expected 995 out of 1,000 times, if the study had been repeated (Payton et al. 2003). Questionnaires were initially mailed during mid-January 2016, and two follow-up questionnaires were mailed to nonrespondents. To increase the number of questionnaires returned, respondents that returned their questionnaire promptly became eligible to win a firearm or bow. Although 59,966 people were sent the questionnaire, 1,458 surveys were undeliverable resulting in an adjusted sample size of 58,508. Questionnaires were returned by 28,826 people (49% response rate). Estimates of harvest, hunting effort, and hunter participation are affected by the willingness of people to complete and return their questionnaires. This problem can confound comparisons of estimates made between years if response rates vary greatly. The percentage of people returning their questionnaire this year was lower than previous years. To reduce bias caused by this lower response rate, an adjustment was made on the 2015 estimates to make them comparable to the adjusted 2014 estimates (adjusted to a 74% response rate). Estimates of harvest, hunting effort, and hunter numbers were reduced by 6.7%, 5.0%, and 2.0%, respectively, to make estimates comparable to 2014. These reductions reflected the average decline noted between estimates calculated when 51% and 74% of the responses were used in 2000 and 2001 surveys. RESULTS In 2015, 654,579 people purchased a license to hunt deer in Michigan. The number of people buying a license in 2015 decreased by 1.5% from 2014 (664,762 people purchased a license in 2014). Most of the people buying a license were male (89%), and the average age of license buyers was 43 years (Figure 3). Over 11% (74,600) of the license buyers were younger than 17 years old. About 4% (23,942) of the license buyers were younger than 12 years old. The number of people buying a license in 2015 was about 8% less than the number of people who purchased a license ten years ago in 2004 (712,466 people purchased a license in
8
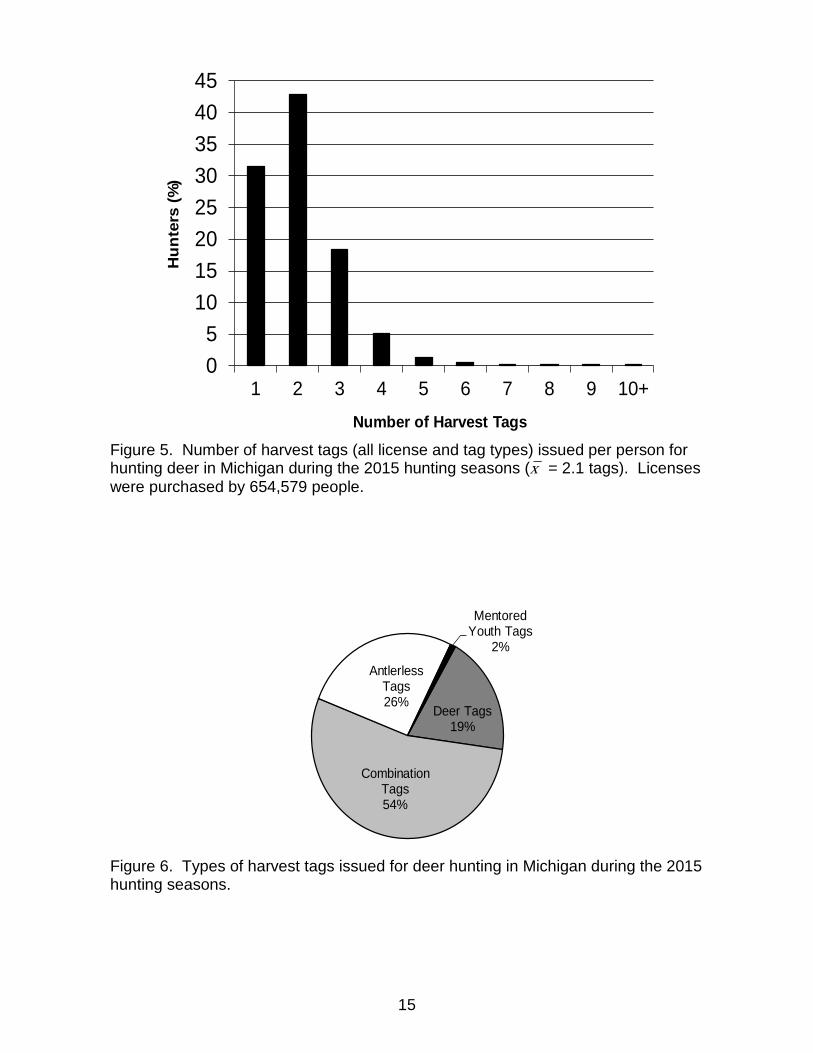
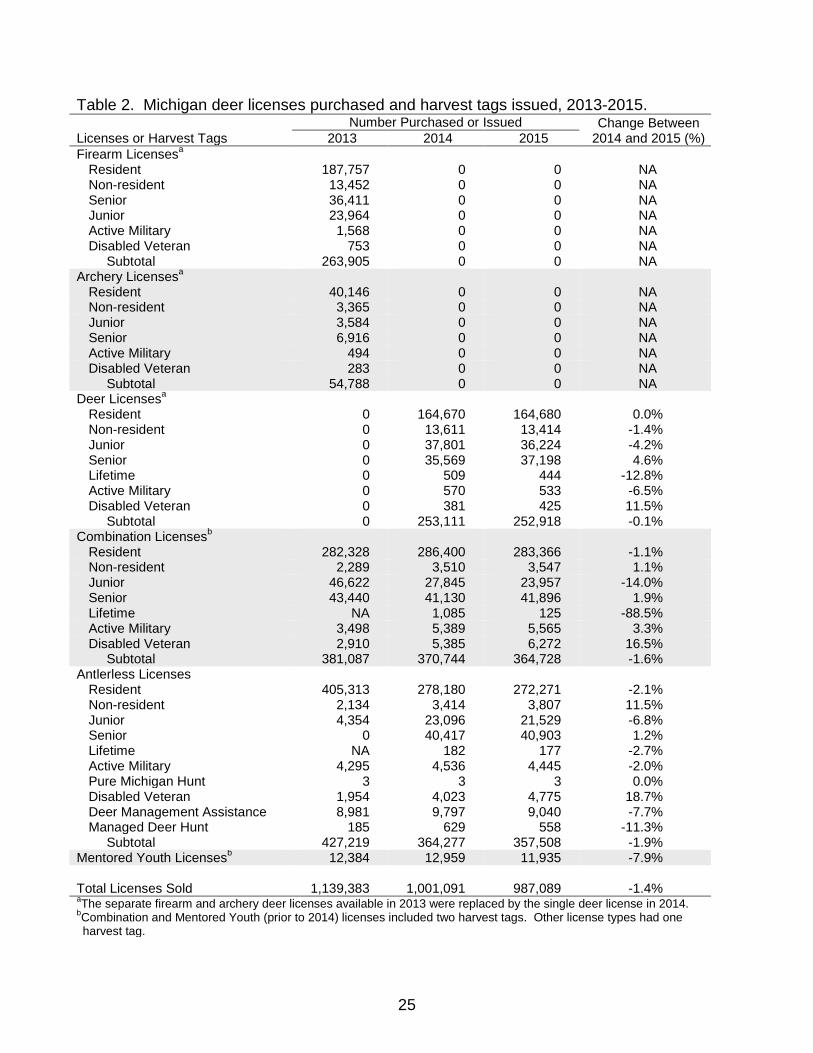
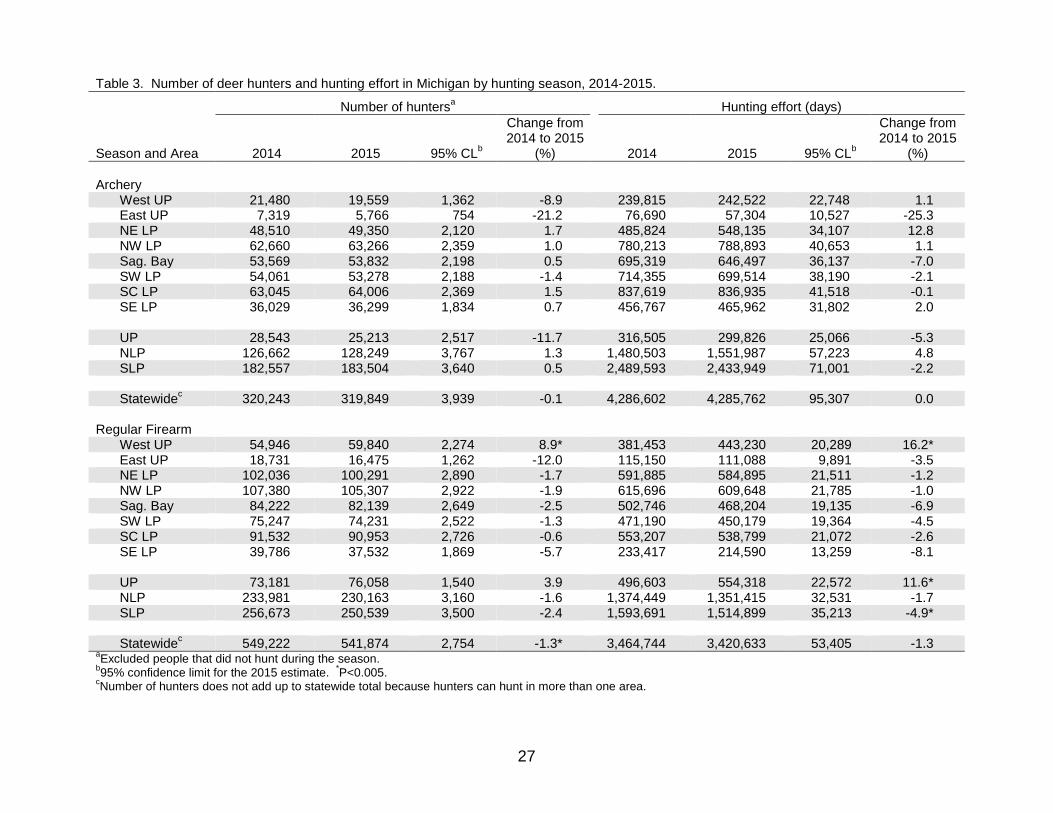
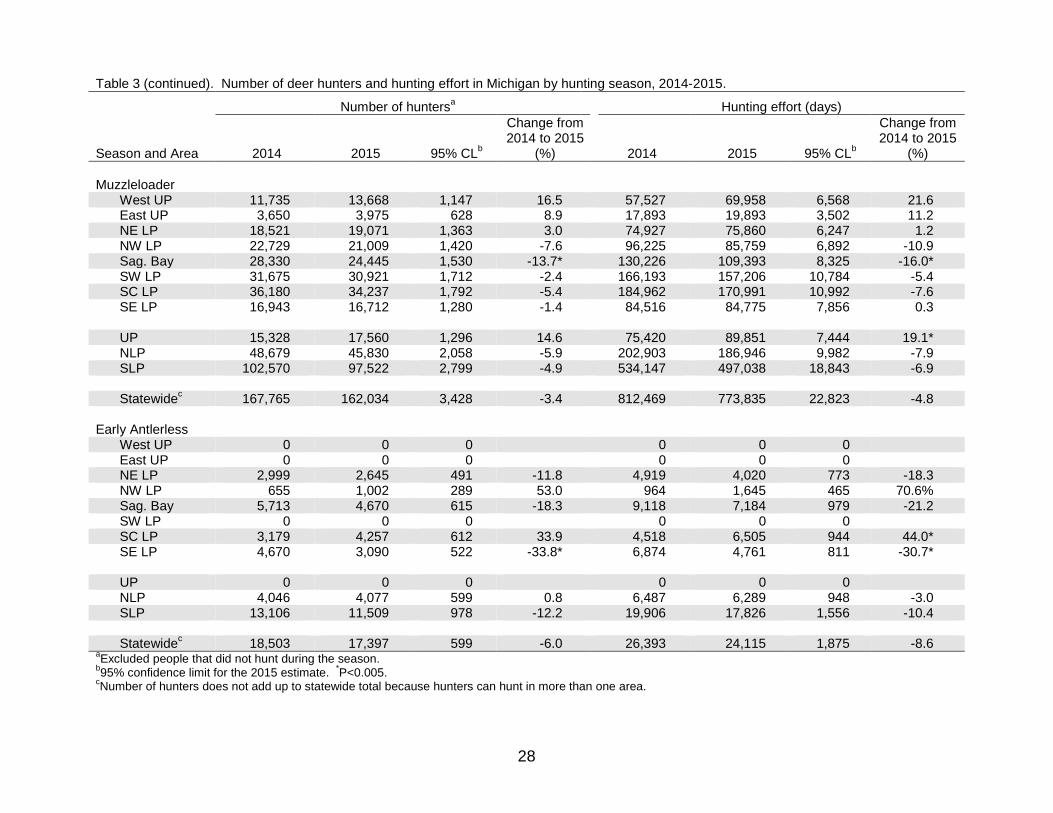
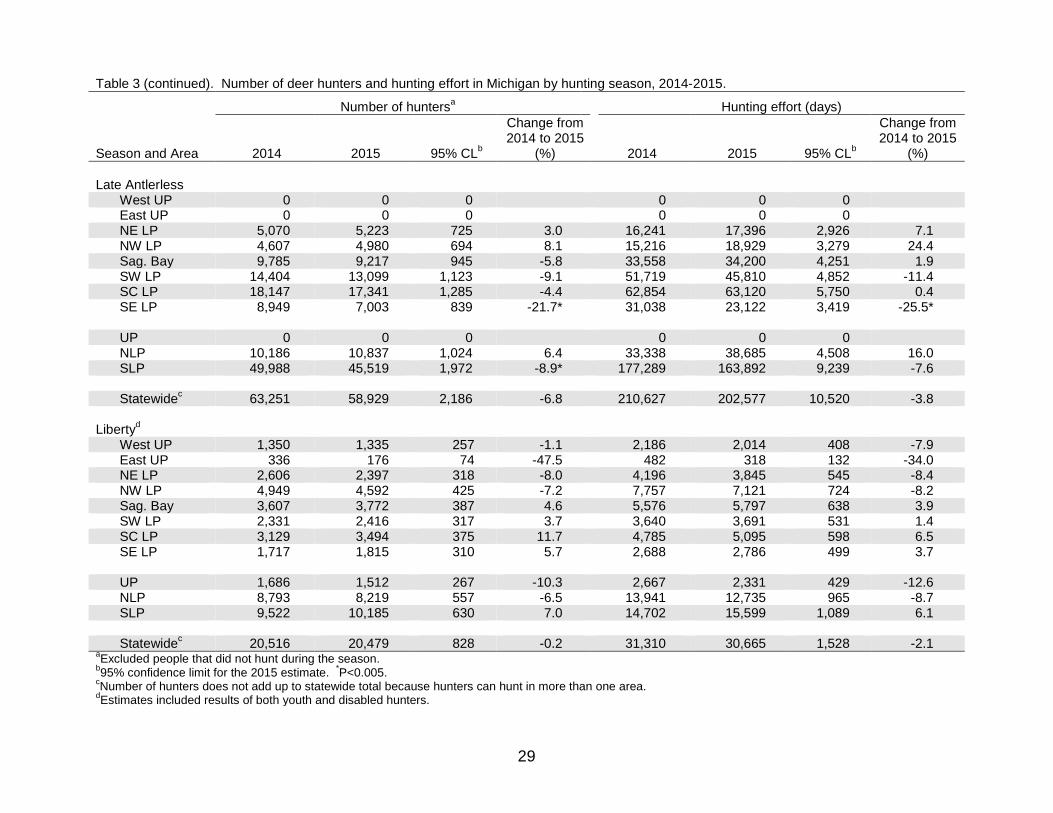
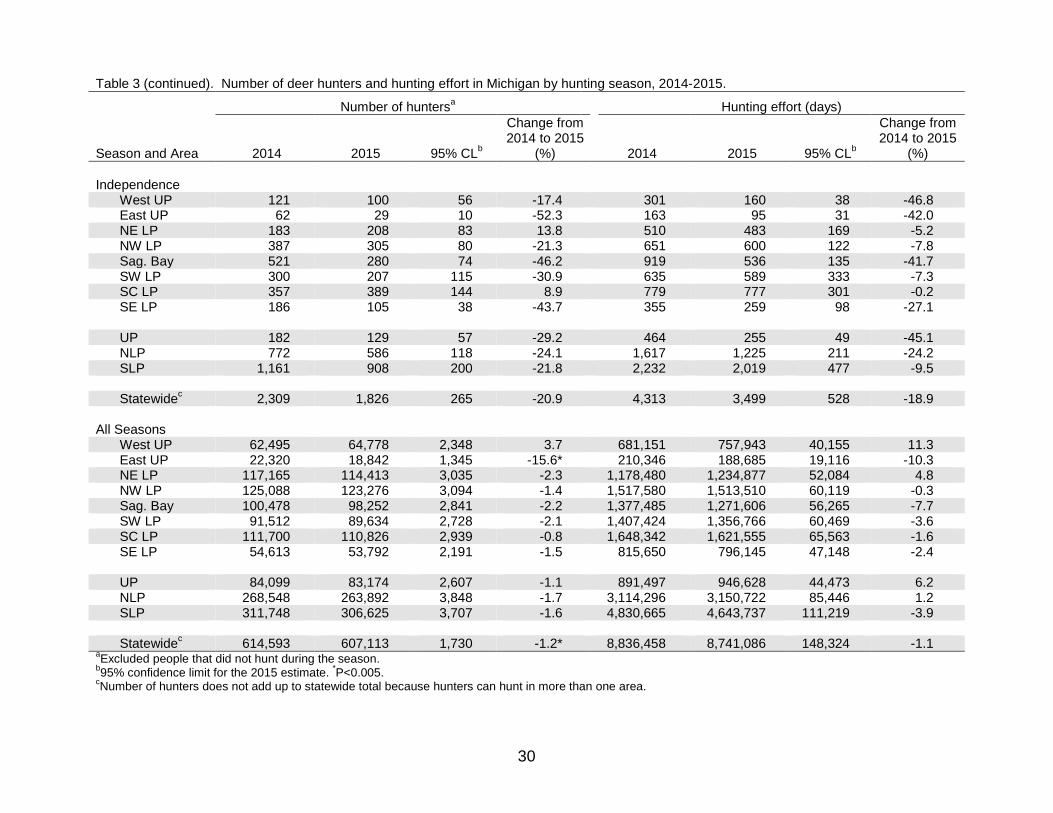
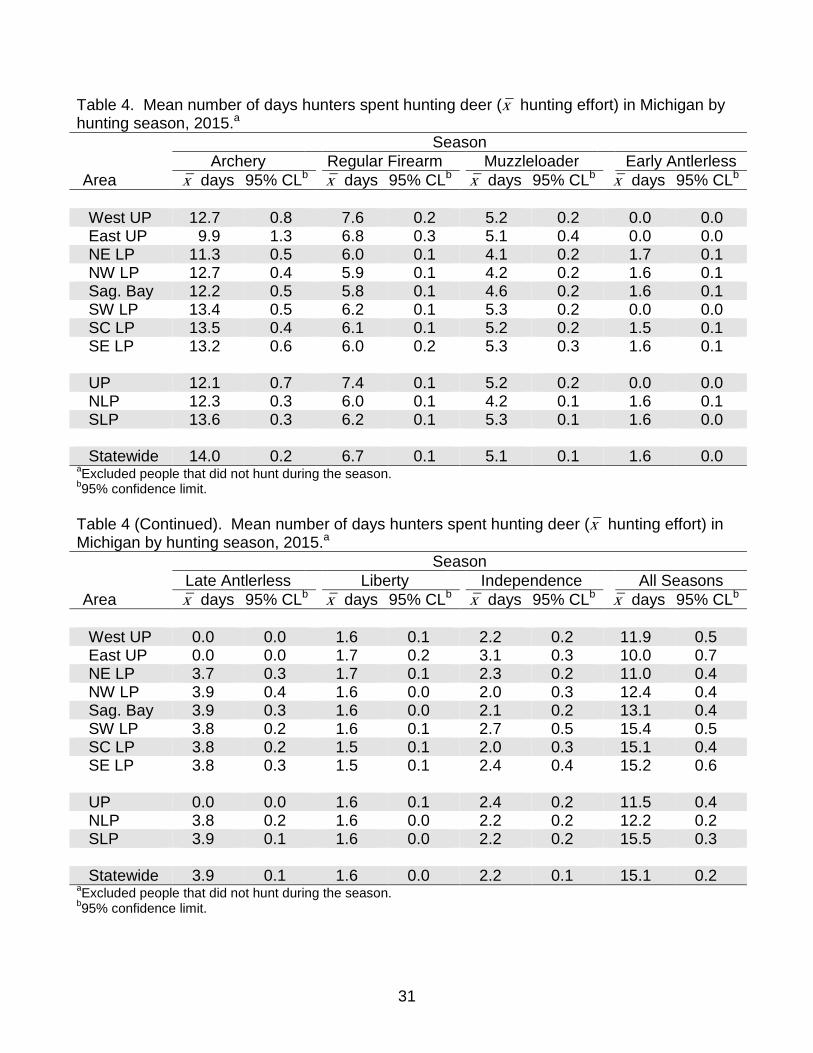
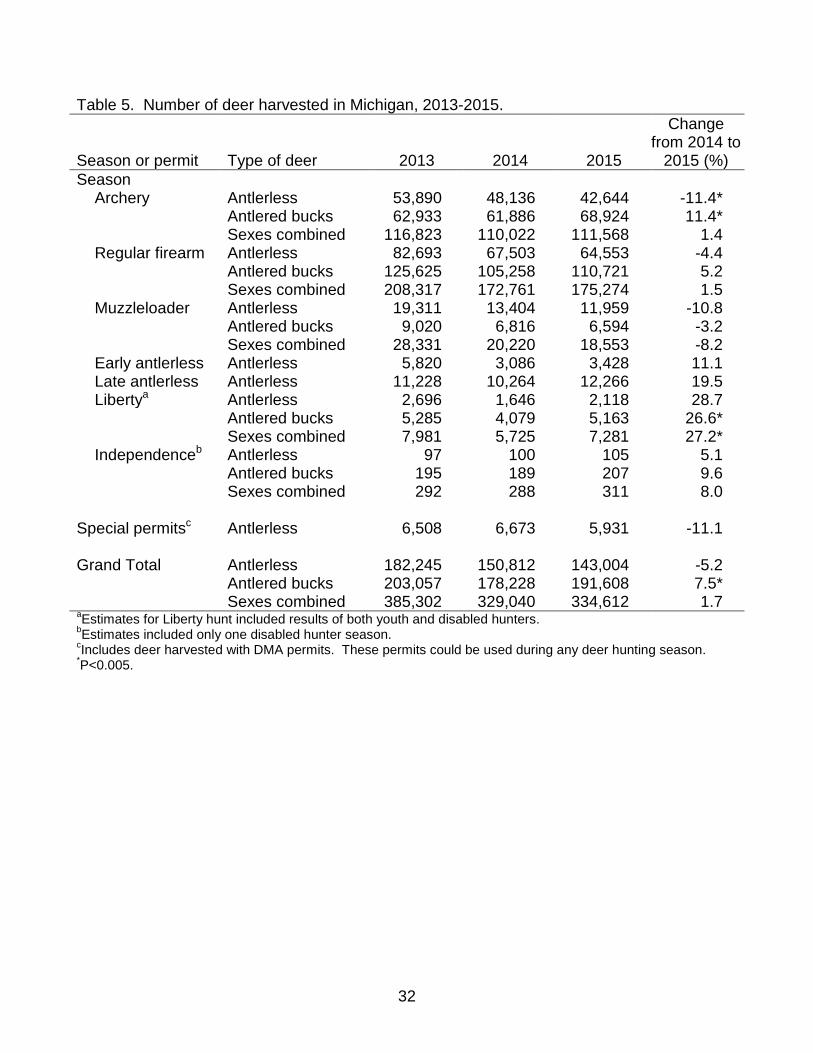
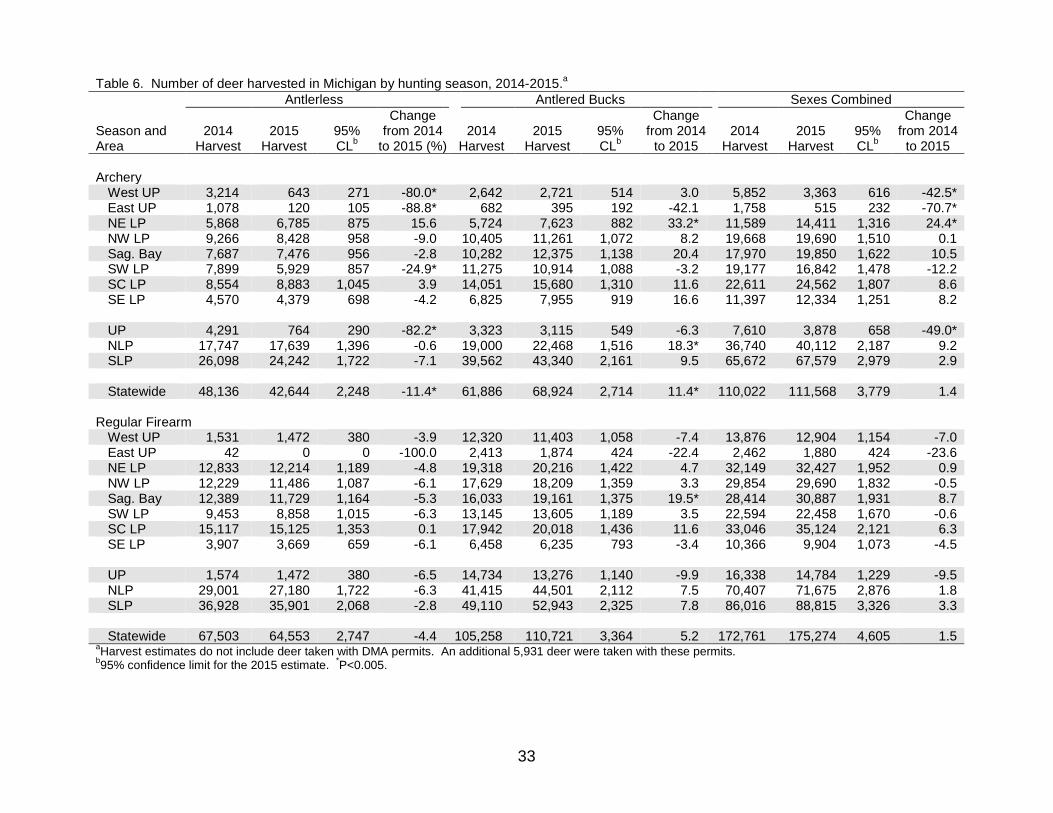
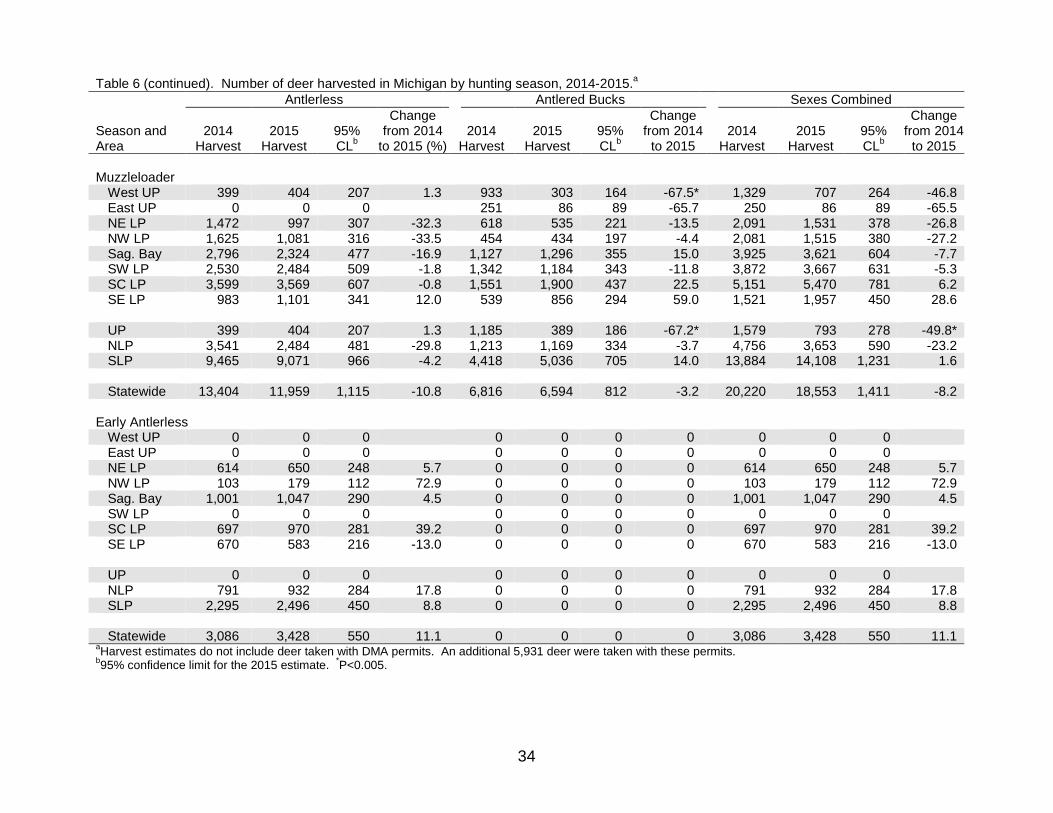
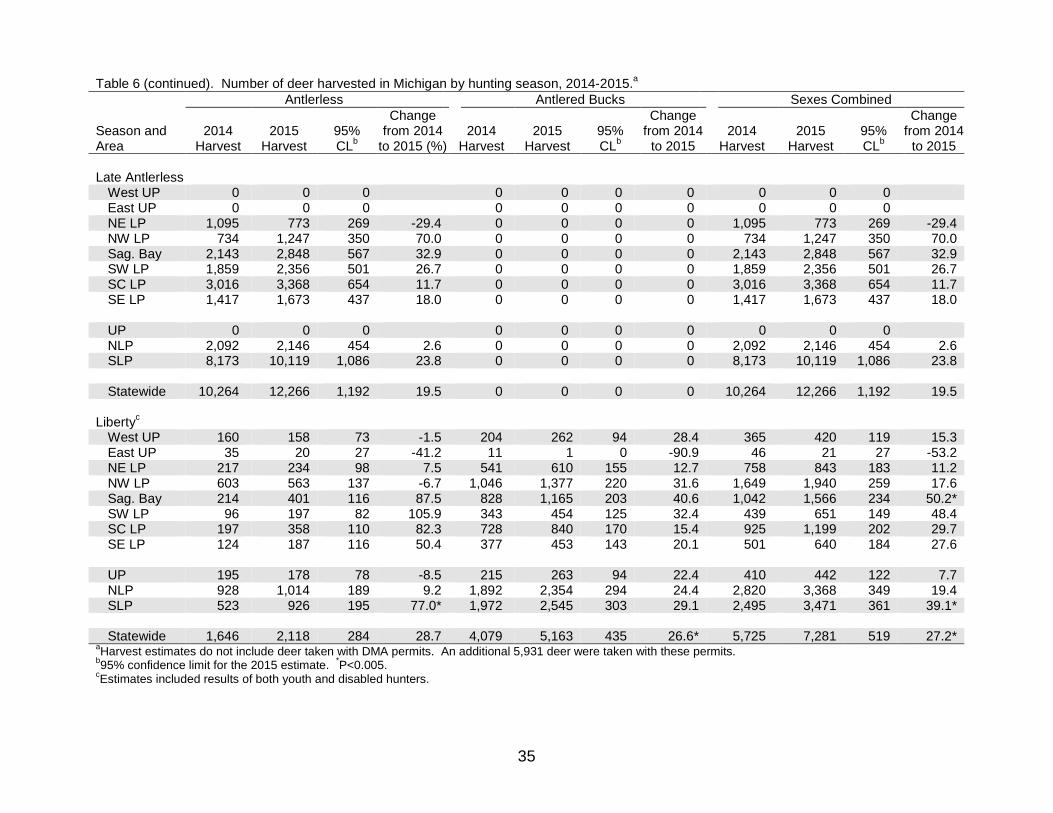
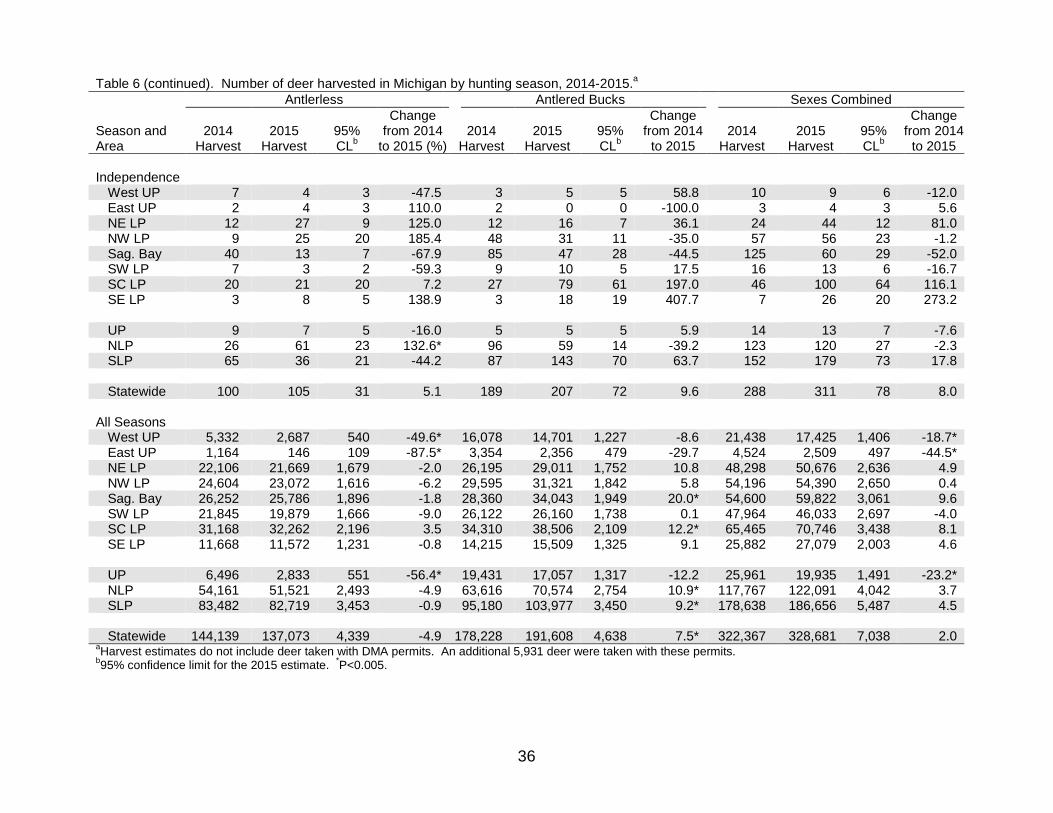
2005). There were fewer license buyers for all age classes between 14 and 52 years of age in 2015, compared to 2005 (Figure 4). However, there were increased hunter numbers among the youngest and oldest age classes in 2015. The increased hunter numbers in the oldest age classes likely represented the rising share of older people in the population as the baby-boom generation aged and life expectancies have increased. In addition, legalization of crossbow use during the archery season probably increased participation among hunters in the oldest age classes. The increased participation among the youngest hunters likely reflected the lowering of the minimum age requirements. In 2012, the minimum age requirement was eliminated to hunt deer with a firearm, while hunters had to be at least 12 years old to participate in 2005. The number of 2015 deer harvest tags sold for all license types combined decreased by 1.5% from 2014 (Table 2). License buyers were issued an average of 2.1 harvest tags. About 93% of the license buyers obtained three or fewer harvest tags, and about 99% had five or fewer harvest tags (Figure 5). Hunters most frequently obtained antlerless and combination harvest tags (Figure 6). About 40% of the license buyers purchased at least one antlerless license (263,419 people), and greater than 98% of antlerless license buyers purchased three or fewer antlerless licenses, public and private licenses combined (Figure 7). The antlerless license quota on private lands increased slightly from 434,000 in 2014 to 435,400 licenses in 2015 (Appendix A). The quota for public land antlerless licenses also increased slightly from 58,500 to 58,700 between 2014 and 2015. Although the antlerless license quota was nearly the same in both 2014 and 2015, the number of antlerless licenses sold declined by nearly 2% in 2015 (Table 2). About 92.7 ± 0.3% (607,113 hunters) of the people buying a license in 2015 actually spent time hunting deer (Table 3). Statewide, the number of people hunting deer during all seasons combined was about 1% lower than hunter numbers in 2014. Most hunters (541,874) pursued deer during the regular firearm season (Figure 8). Significantly fewer people hunted during the regular firearm season (-1%) during 2015 (Table 3). The numbers of people hunting in the archery, muzzleloader, early antlerless, late antlerless, Liberty and Independence seasons were not significantly different between 2014 and 2015 (Figure 9). About 49% of the days hunters spent pursuing deer throughout the state occurred in the archery season (Figure 10). About 40% of the hunting effort occurred during the regular firearm season. Nearly 11% of the hunting effort occurred in the muzzleloader and late antlerless seasons combined. Statewide, hunters devoted an average of 15.1 days afield hunting deer during all seasons combined (Table 4). Archers had the greatest number of days available to hunt deer (77 days) and devoted the greatest number of days afield (x̄ = 14.0 days/hunter) (Figure 11, Table 4). For every season, and for all seasons combined, there was no significant difference between hunting effort in 2014 and 2015. About 334,612 deer were harvested statewide in 2015, which was not significantly different than in 2014 (Figures 12-13, Tables 5-6). Although statewide harvest was similar between
9
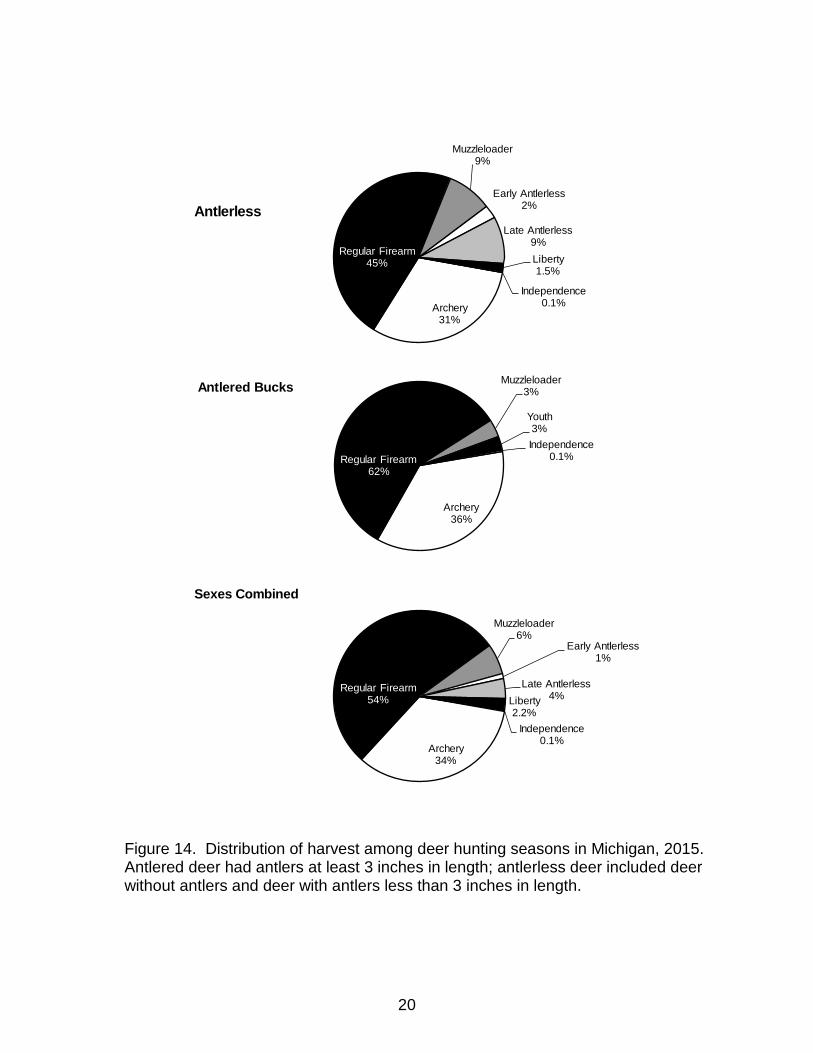
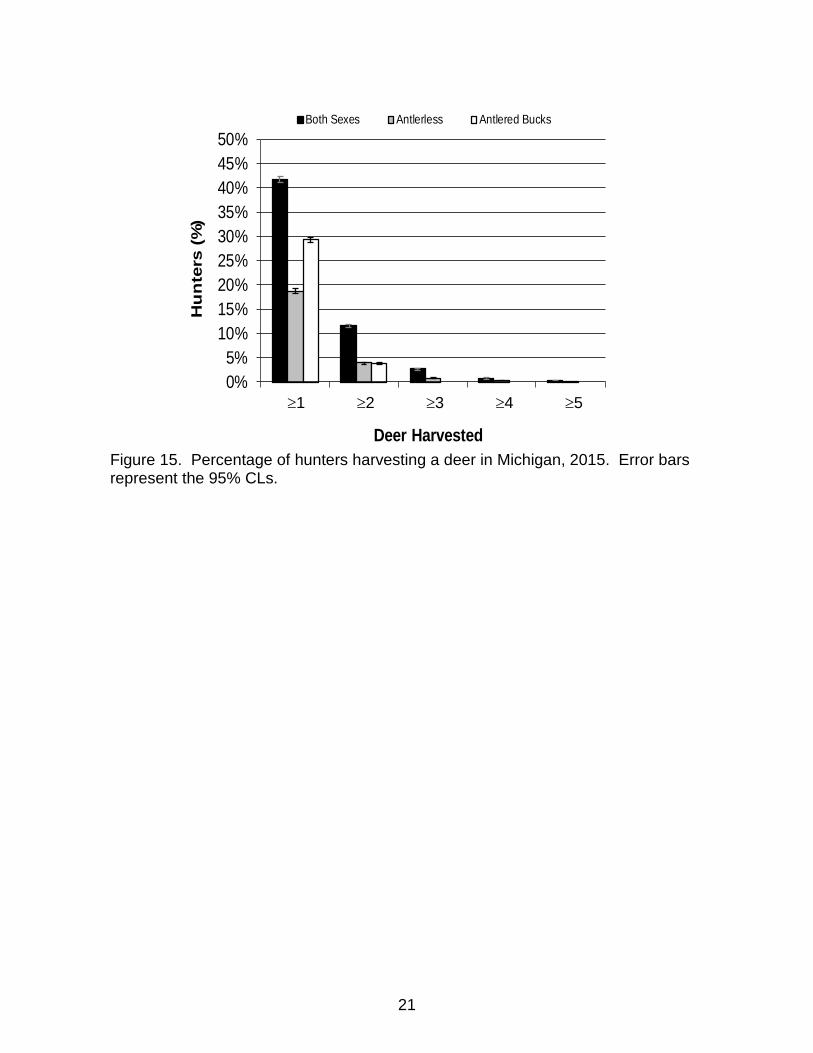
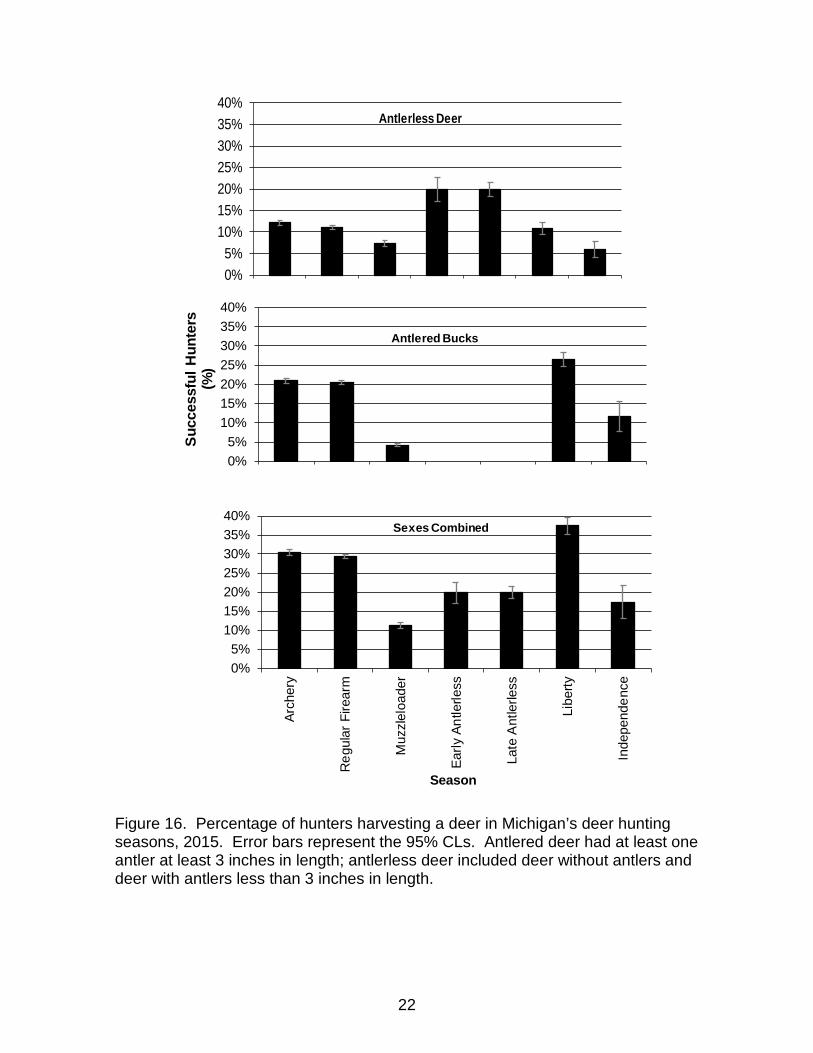
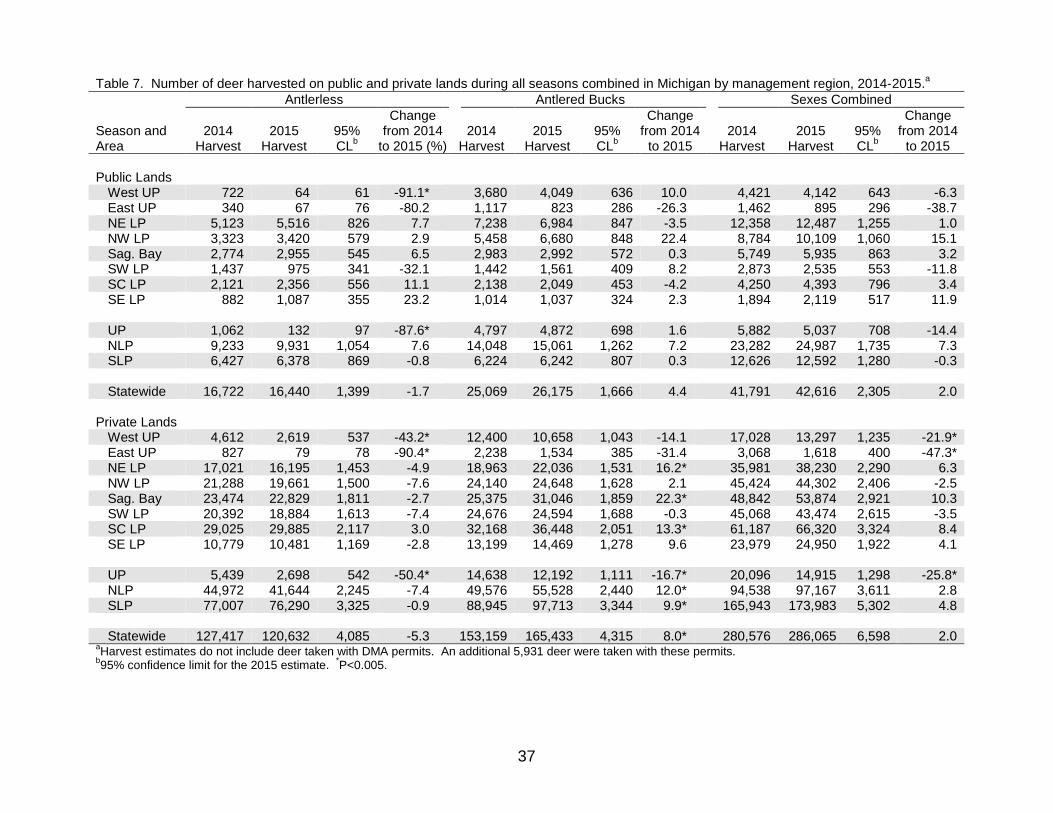
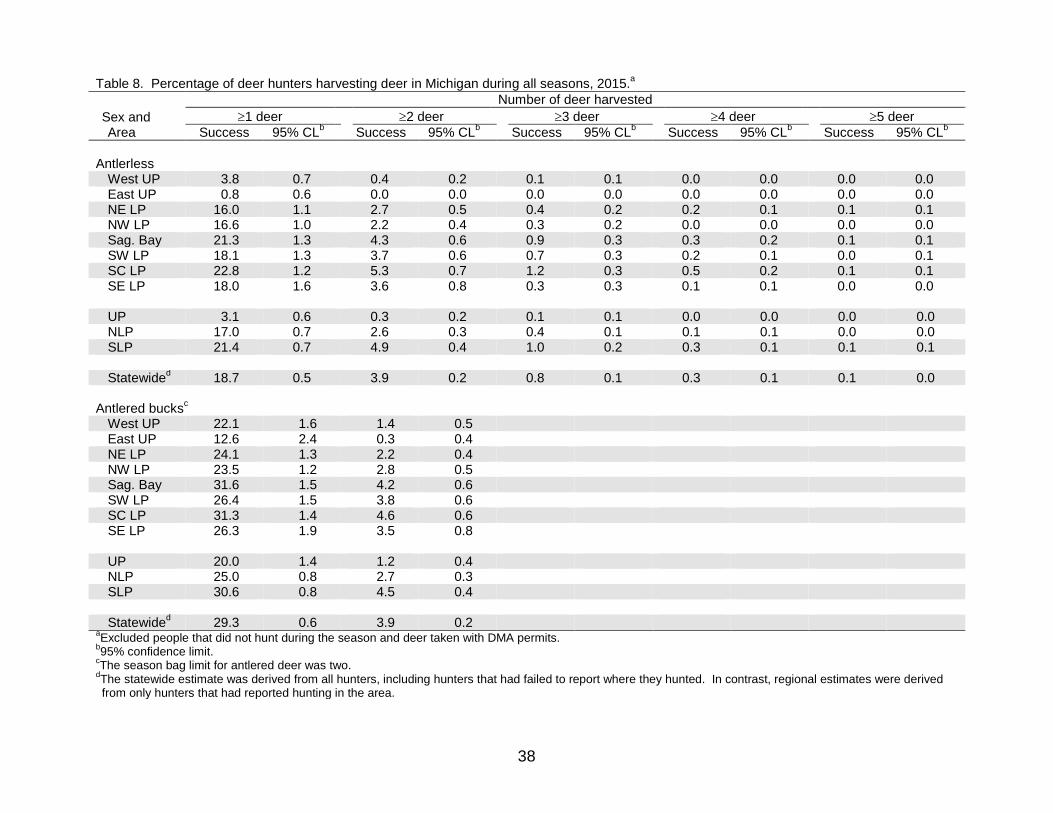
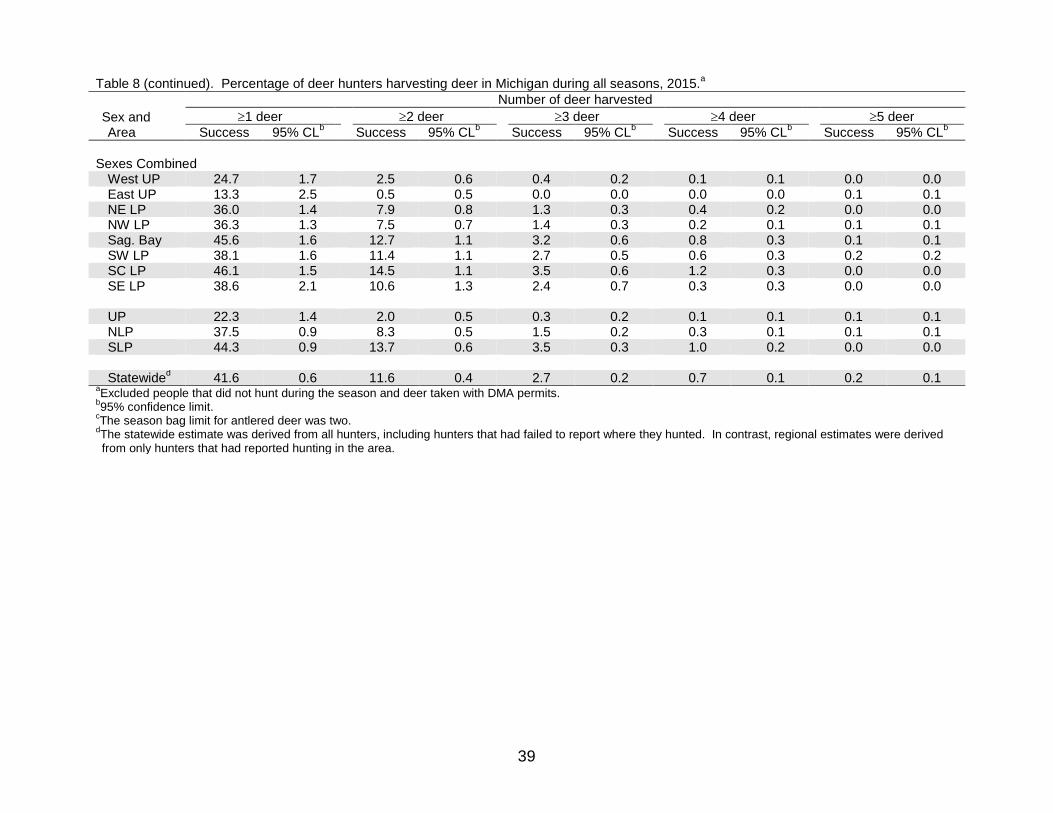
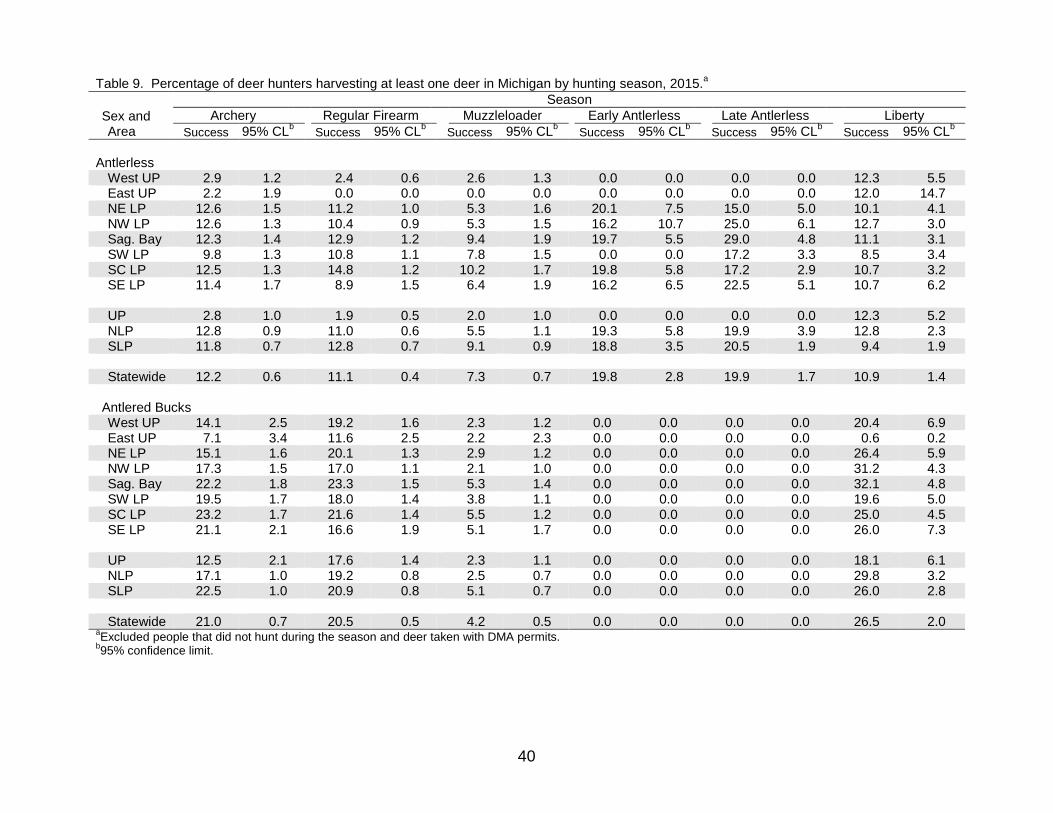
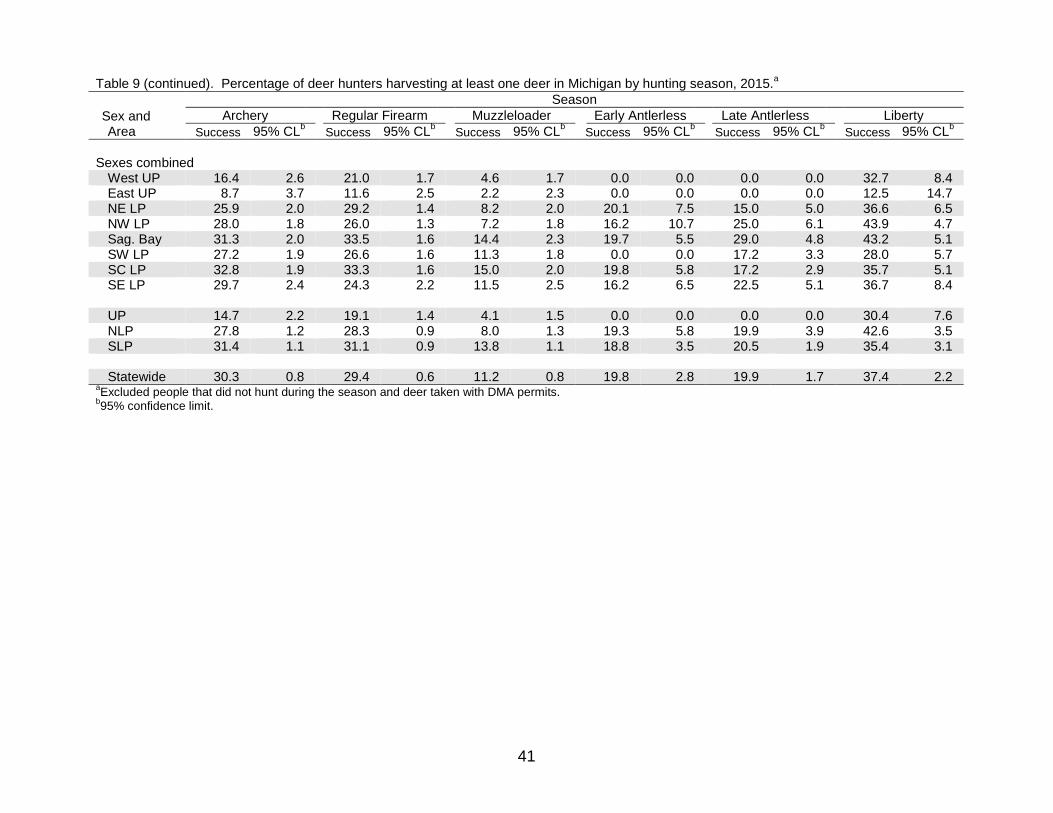
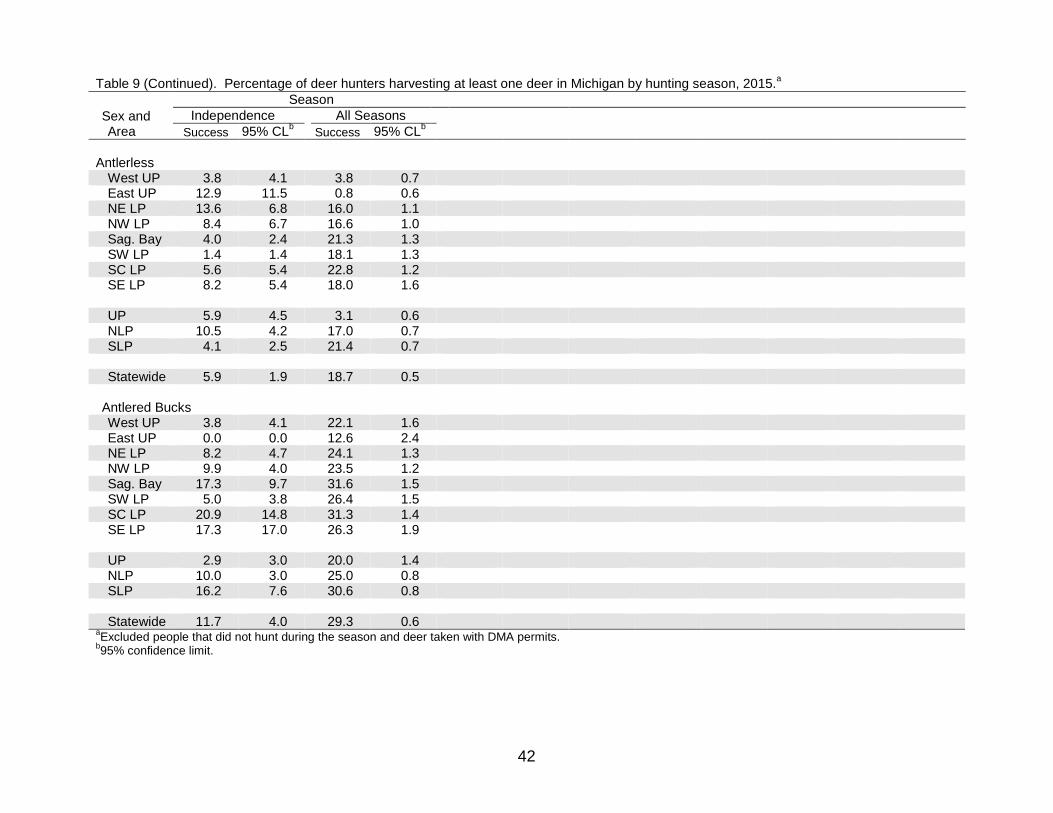
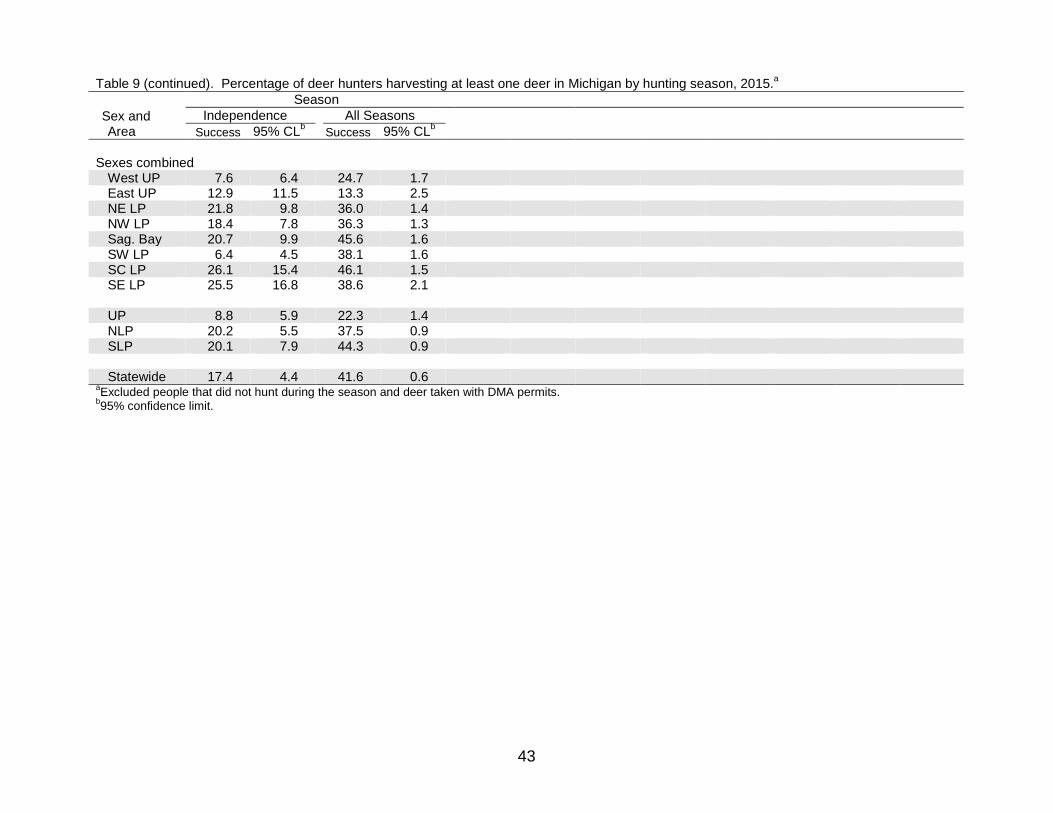
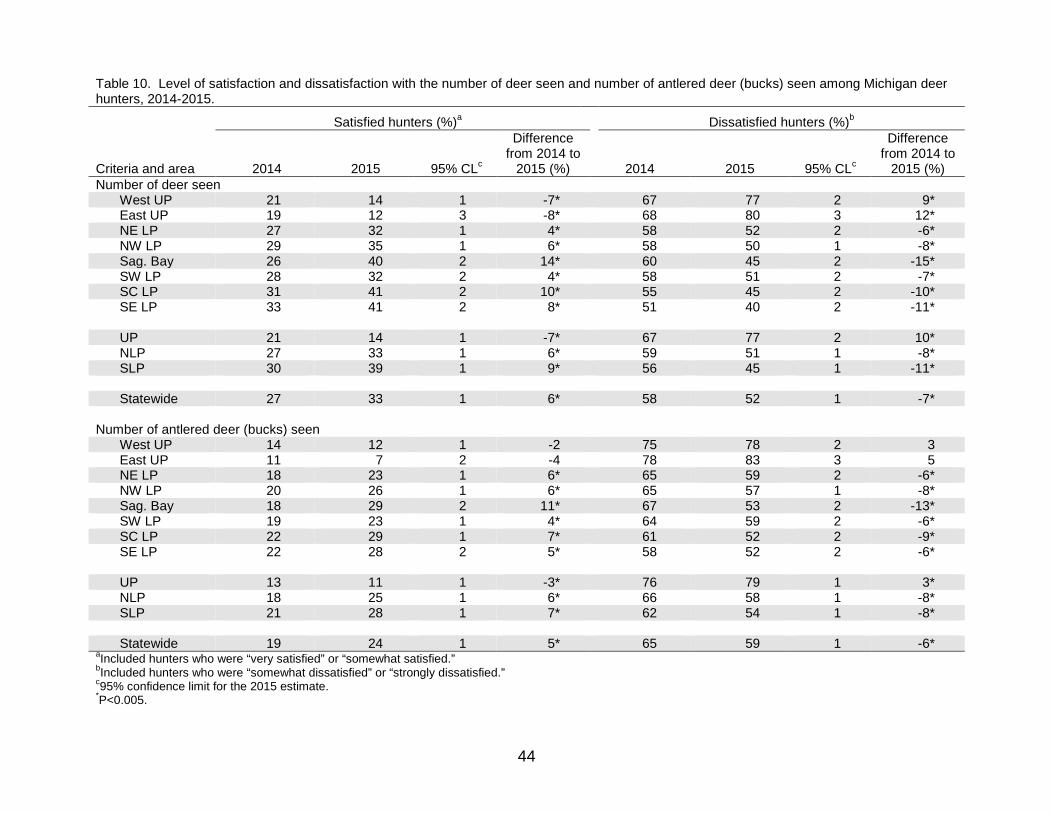
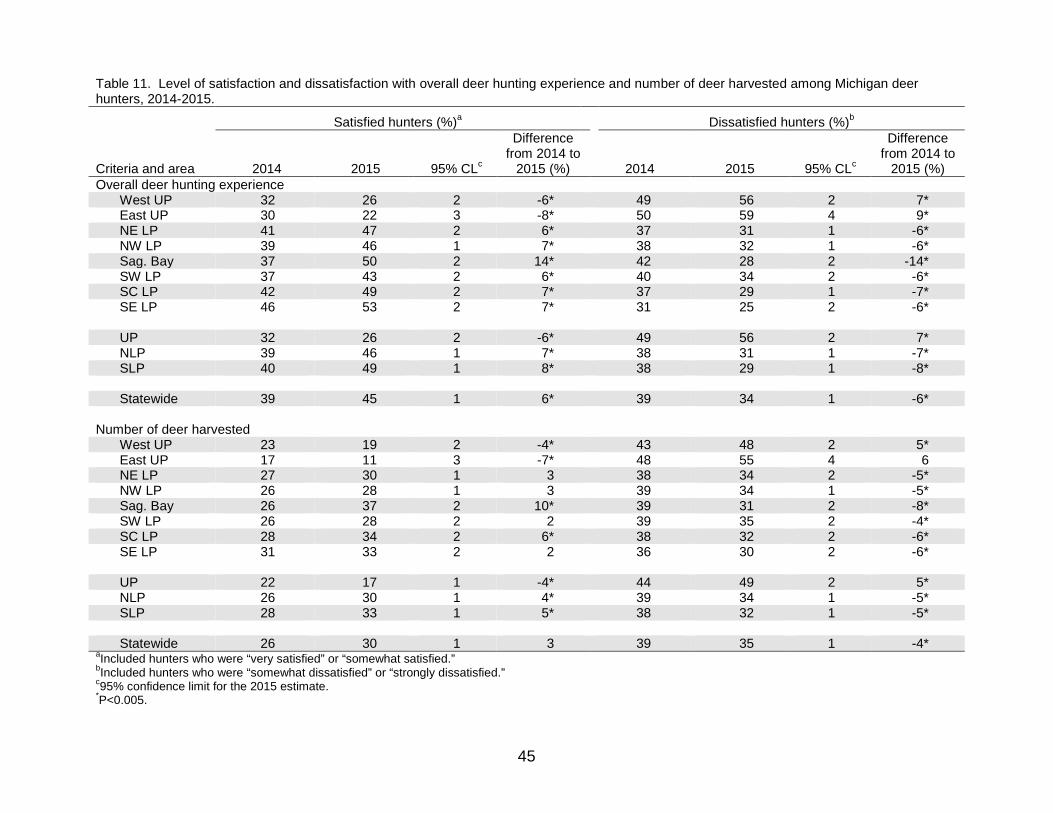
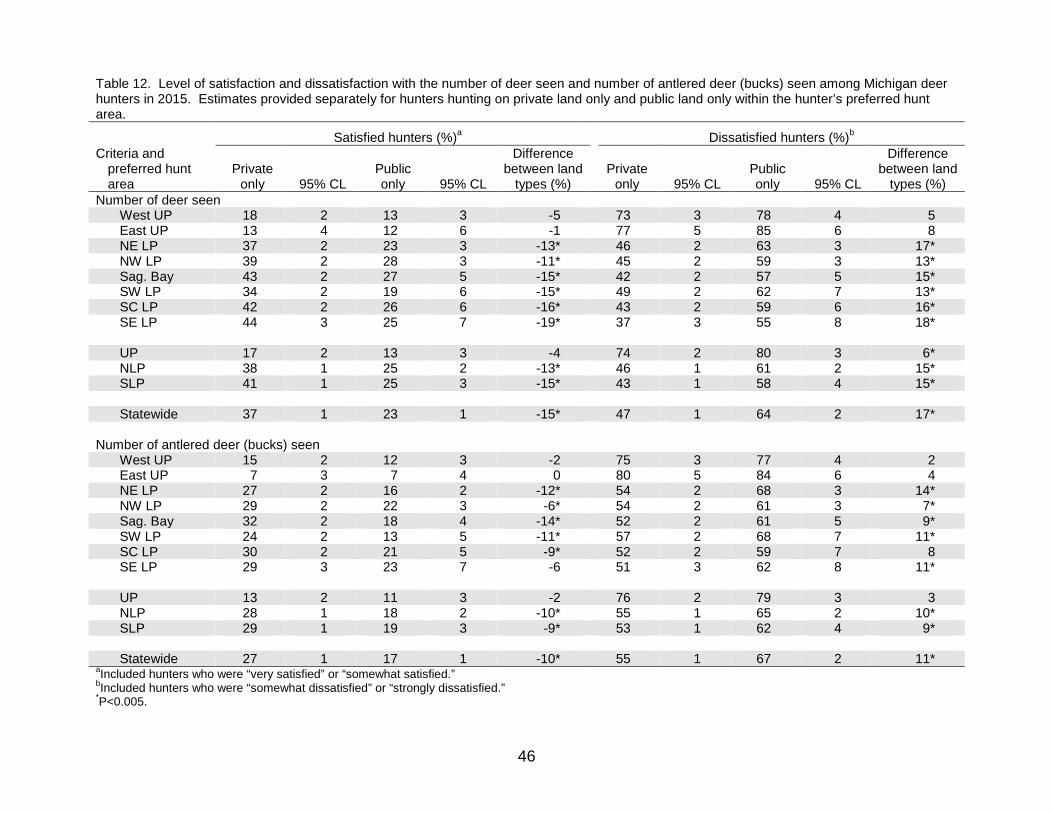
years, harvest in the UP declined by 23% in 2015. Statewide harvest of antlerless deer in 2015 was not significantly different from 2014, while harvest of antlered deer increased by nearly 8% from 2014 (Table 5). Between 2014 and 2015, harvest of antlered deer increased significantly during the archery (11%) and Liberty (27%) seasons, but was unchanged in other seasons. Statewide harvest of antlerless deer decreased significantly in the archery (11%) season but was unchanged in other seasons. About 54% of the deer harvested (sexes combined) in 2015 were taken during the regular firearm season (Figure 14). Nearly 45% of the antlerless deer and 62% of the antlered bucks were harvested in the regular firearm season. Hunters took 34% of the harvested deer (sexes combined) during archery season. These archers took 31% of the antlerless deer and 36% of the antlered bucks harvested. Few antlered bucks (3%) were taken in the muzzleloader season. The early and late antlerless and muzzleloader seasons combined accounted for about 11% of the antlerless deer harvested. About 87% of the animals harvested (sexes combined) in 2015 were taken on private lands (Table 7). Statewide, most of the antlerless deer (88%) and antlered bucks (86%) were harvested on private lands. Statewide, 42% of deer hunters harvested at least one deer (all deer seasons and sexes combined) in 2015 (Figure 15, Table 8), compared to the 41% successful in 2014. About 19% of hunters took an antlerless deer, and 29% took an antlered buck in 2014. About 12% of deer hunters harvested two or more deer. Hunters were most successful in taking a deer during the Liberty (37%), archery (30%), and regular firearm (29%) seasons (Figure 16, Table 9). Hunter success was lowest in the muzzleloader (11%) season. Nearly 21% of hunters took an antlered buck and 11% harvested an antlerless deer during the regular firearm season. Deer hunters were asked to report how satisfied they were with (1) number of deer seen, (2) number of antlered deer [bucks] seen, (3) number of deer taken, and (4) their overall hunting experience. Statewide, <45% of hunters were satisfied with numbers of deer seen, bucks seen, deer taken, and their overall hunting experience in 2015 (Tables 10-11). Statewide levels of satisfaction increased significantly for all measures except number of deer harvested between 2014 and 2015. People hunting deer only on private lands were generally less satisfied than people hunting only on public lands (Tables 12-13). Statewide, about 62% of hunters supported the antler point restrictions on buck harvest implemented for the UP (Table 14), and about 64% of the hunters that preferred to hunt in the UP supported the antler point restrictions. Statewide support for the restrictions significantly increased between 2014 and 2015. Statewide, about 50% of hunters supported the antler point restrictions on buck harvest implemented for the DMU 487 (Table 15), and about 58% of the hunters that preferred to hunt in the northeast LP supported the restrictions. Statewide support for the restrictions in
10
DMU 487 was significantly increased, and opposition decreased significantly between 2014 and 2015 (decreased from 19% to 15%). Satisfaction levels among people hunting deer in the 12-county area in the northwest Lower Peninsula where antler point restrictions were implemented in 2013 were similar to hunters throughout the NLP (Tables 16). About 185,632 hunters used a crossbow during the archery season, and they harvested about 65,988 deer with the crossbow (Tables 17-19). The number of archers using a crossbow increased significantly by 6% from 2014 (174,558 archers in 2014). Harvest of deer by archers using a crossbow increased significantly by 11% from last year (59,266 deer taken in 2014). About 32% of these archers using a crossbow in 2015 harvested a deer with a crossbow in the archery season. ACKNOWLEDGEMENTS I thank all the deer hunters that provided information. Heidi Densteadt, Ariel-Bridget Foy, Dennis Jablonski, and Theresa Riebow completed data entry. The figure of DMUs was prepared by Marshall Strong. Ashley Autenrieth, Steve Chadwick, Russ Mason, and Chad Stewart reviewed a previous version of this report. LITERATURE CITED Albert, D. A. 1995. Regional landscape ecosystems of Michigan, Minnesota, and Wisconsin:
a working map and classification. General Technical Report NC-178. U.S. Department of Agriculture, Forest Service, North Central Forest Experimental Station, St. Paul, Minnesota, USA.
Cochran, W. G. 1977. Sampling techniques. John Wiley & Sons, New York, USA. Payton, M. E., M. H. Greenstone, and N. Schenker. 2003. Overlapping confidence intervals
or standard error intervals: what do they mean in terms of statistical significance? Journal of Insect Science 3:34.
11
IRON
DELTA
LUCE
KENT
MARQUETTE ALGER CHIPPEWAGOGEBIC
HURONBAY
SANILAC
LAKE
BARAGA
IONIA
ONTONAGON
MACKINAC
OAKLAND
CASS
ALLEGAN
HOUGHTON
IOSCO
CLARE
TUSCOLA
MENOM-INEE
SAGINAW
ALCONA
LAPEER
EATONBARRY
NEWAY-GO
WAYNE
SCHOOL-CRAFT
LENAWEE
JACKSON
ALPENA
CALHOUN
INGHAM
DICKIN-SON
MASON
ANTRIM
GENESEE
EMMET
OTTAWA
OSCODA
CLINTON
BERRIEN
OCEANA
GRATIOTMONTCALM
CHE-BOYGAN
BRANCH
OTSEGO
ISABELLA
OGEMAW
MONROE
OSCEOLA
MIDLANDMECOSTA
HILLS-DALE
WEX-FORD
KAL-KASKA
MANISTEE
GLAD-WIN
MACOMB
WASH-TENAW
VAN BUREN
MISS-AUKEE
LIVING-STON
BENZIECRAW-FORD
ST.JOSEPH
PRESQUE ISLE
MUSKEGON
ARENAC
SHIA-WASSEE
LEE-LANAU
CHARLEVOIX
KEWEENAW
ST. CLAIR
KALAMA-ZOO
ROS-COMMON
MONT-MORENCY
GRAND TRAV-ERSE
Southern LPEcoregion
Western UP
Northern LPEcoregion
UPEcoregion
Eastern UP
North-eastern
LPNorth-
westernLP
South-eastern
LP
South-western
LPSouthcentral
LP
SaginawBay LP
Figure 1. Areas used to summarize deer harvest in Michigan for the 2015 hunting seasons.
12
Figure 2. Deer Management Units in Michigan for the 2015 hunting seasons.
13
0.0
0.5
1.0
1.5
2.0
2.5
0 8 16 24 32 40 48 56 64 72 80 88 96
Hun
ters
(%)
Hunter's Age on Oct. 1, 2015
Figure 3. Age of people that purchased a deer hunting license in Michigan for the 2015 hunting seasons (x̄ = 43 years).

14
Figure 4. Number of deer hunting license buyers in Michigan by age and sex during 2005 and 2015 hunting seasons. Deer hunting licenses were purchased by 712,466 people in 2005 and 654,579 people in 2015.
20,000 15,000 10,000 5,000 0 5,00005
101520253035404550556065707580859095
100
License buyers (No.)
Hun
ter's
age
on
Oct
ober
12015 2005
Male Female
15
Figure 5. Number of harvest tags (all license and tag types) issued per person for hunting deer in Michigan during the 2015 hunting seasons (x̄ = 2.1 tags). Licenses were purchased by 654,579 people.
05
1015202530354045
1 2 3 4 5 6 7 8 9 10+
Hun
ters
(%)
Number of Harvest Tags
Figure 6. Types of harvest tags issued for deer hunting in Michigan during the 2015 hunting seasons.
Deer Tags19%
Combination Tags54%
Antlerless Tags26%
Mentored Youth Tags
2%
16
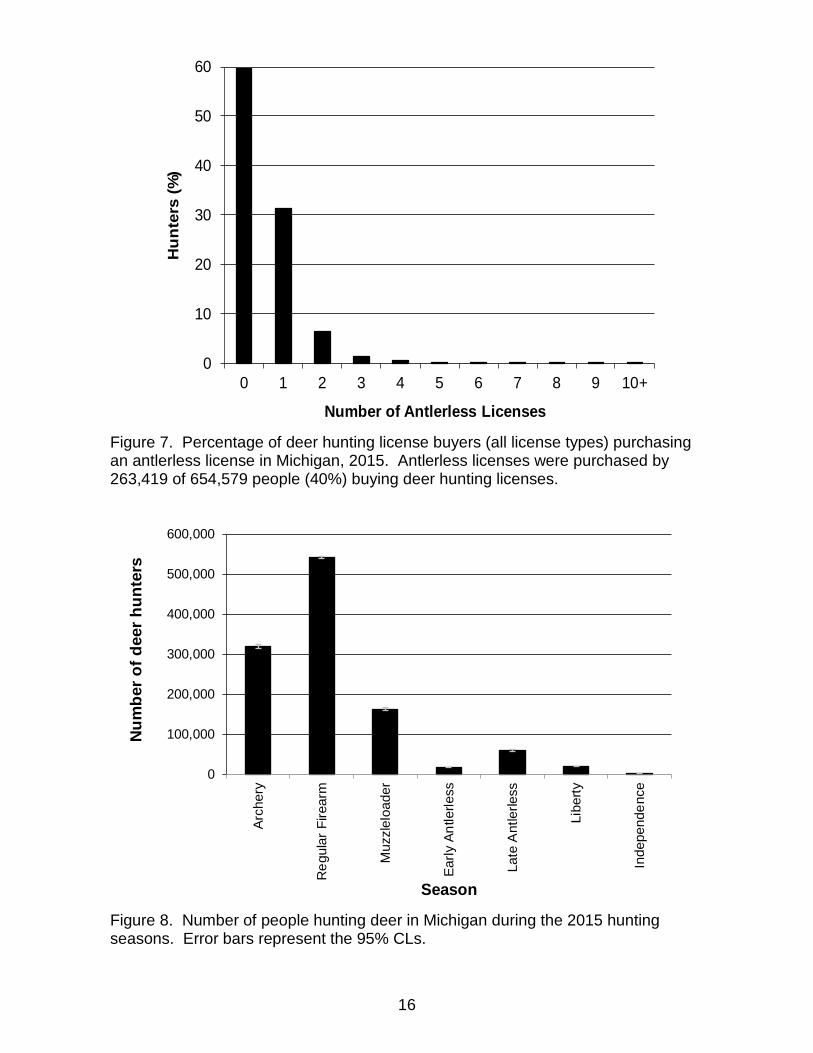
Figure 7. Percentage of deer hunting license buyers (all license types) purchasing an antlerless license in Michigan, 2015. Antlerless licenses were purchased by 263,419 of 654,579 people (40%) buying deer hunting licenses.
0
10
20
30
40
50
60
0 1 2 3 4 5 6 7 8 9 10+
Hun
ters
(%)
Number of Antlerless Licenses
Figure 8. Number of people hunting deer in Michigan during the 2015 hunting seasons. Error bars represent the 95% CLs.
0
100,000
200,000
300,000
400,000
500,000
600,000
Arch
ery
Reg
ular
Fire
arm
Muz
zlel
oade
r
Early
Ant
lerle
ss
Late
Ant
lerle
ss
Libe
rty
Inde
pend
ence
Num
ber o
f dee
r hun
ters
Season
17
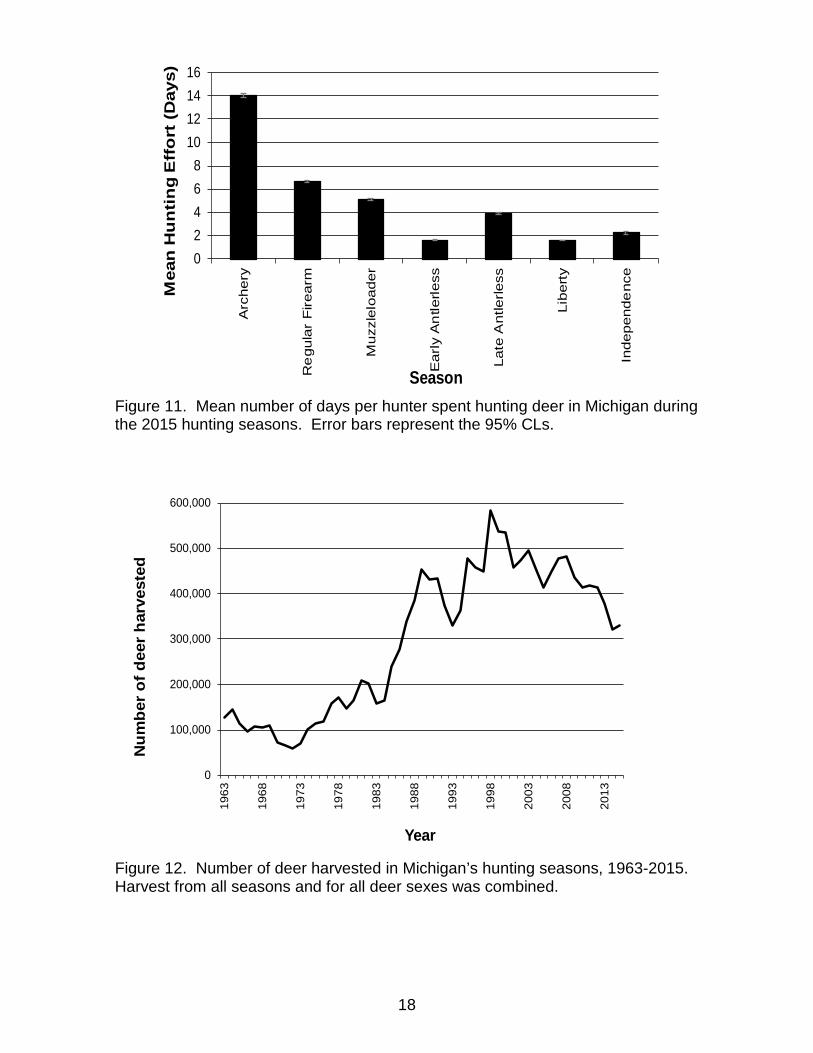
Figure 9. Number of people hunting deer in Michigan during the regular firearm, archery, and muzzleloader seasons, 1953-2015.
0
100,000
200,000
300,000
400,000
500,000
600,000
700,000
800,000
900,000
1953
1957
1961
1965
1969
1973
1977
1981
1985
1989
1993
1997
2001
2005
2009
2013
Num
ber
of d
eer
hunt
ers
Year
Regular firearm Archery Muzzleloader
Figure 10. Distribution of hunting effort among deer hunting seasons in Michigan, 2015.
Archery49%
Regular Firearm
40%
Muzzleloader9%
Early Antlerless
0.28%
Late Antlerless2%
Liberty0.35%
Independence0.04%
18
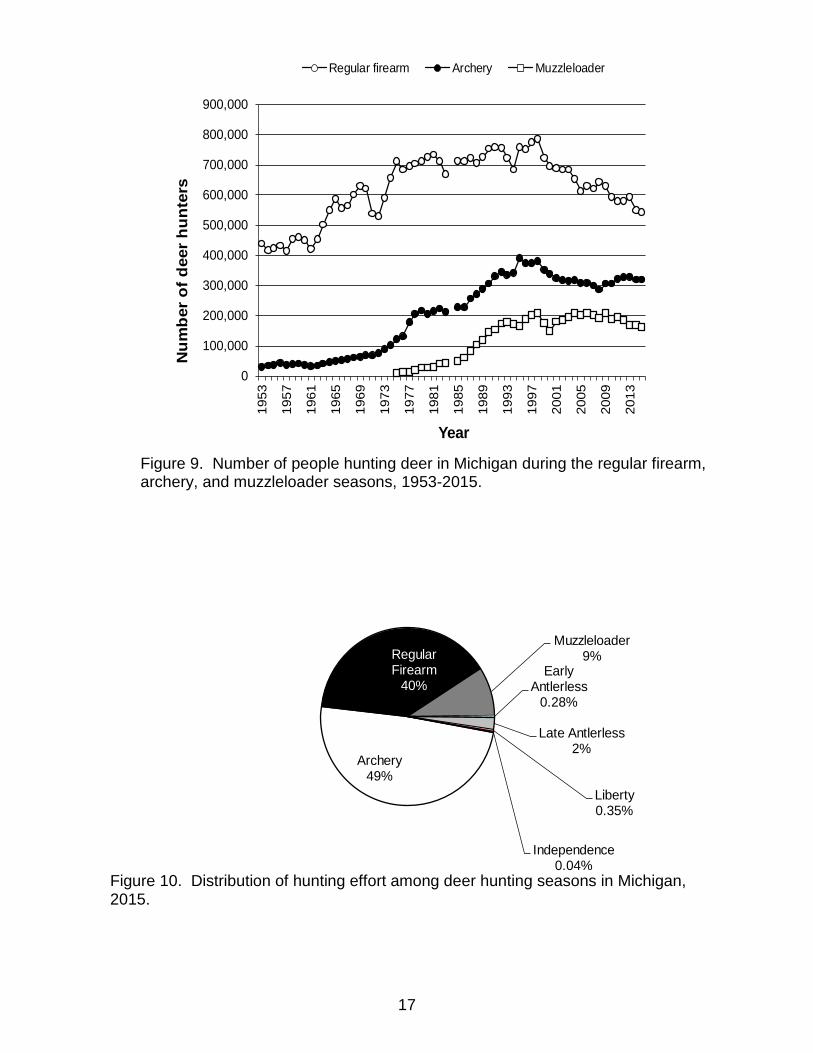
Figure 11. Mean number of days per hunter spent hunting deer in Michigan during the 2015 hunting seasons. Error bars represent the 95% CLs.
02468
10121416
Arc
hery
Re
gula
r F
irear
m
Muz
zlel
oade
r
Ear
ly A
ntle
rless
Late
Ant
lerle
ss
Libe
rty
Inde
pend
enc
e
Mea
n H
un
tin
g E
ffo
rt (
Day
s)
Season
Figure 12. Number of deer harvested in Michigan’s hunting seasons, 1963-2015. Harvest from all seasons and for all deer sexes was combined.
0
100,000
200,000
300,000
400,000
500,000
600,000
1963
1968
1973
1978
1983
1988
1993
1998
2003
2008
2013
Num
ber
of d
eer
harv
este
d
Year
19
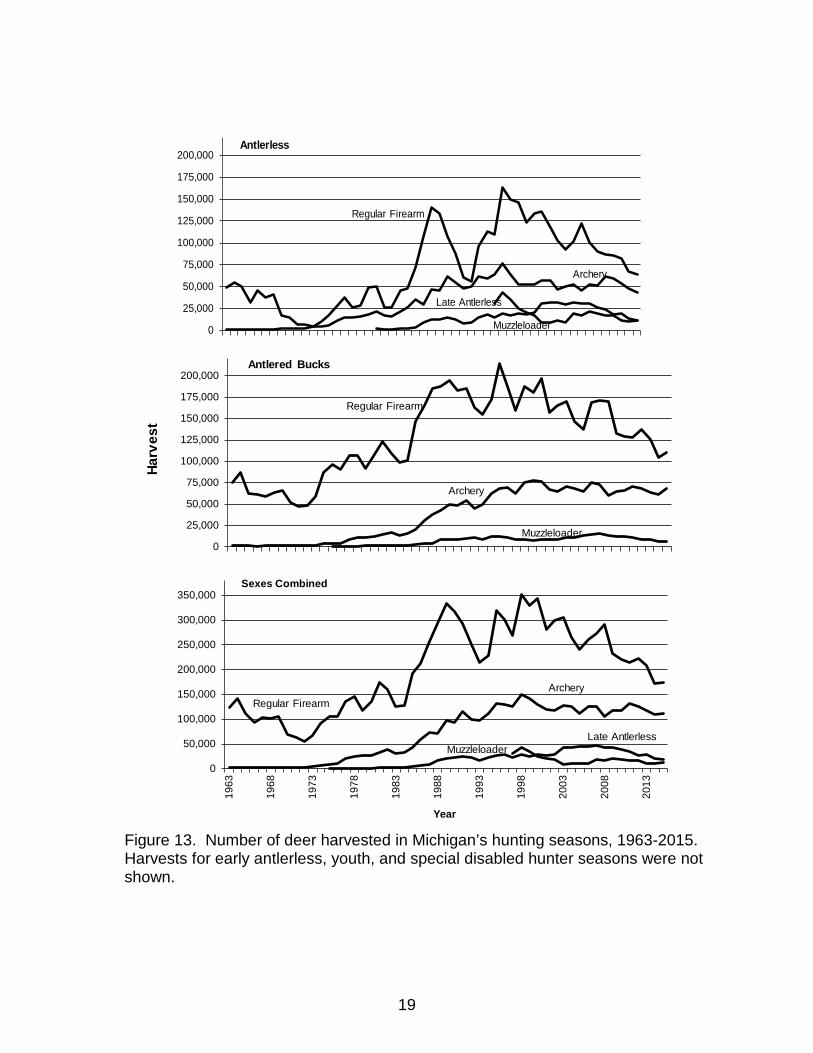
Figure 13. Number of deer harvested in Michigan’s hunting seasons, 1963-2015. Harvests for early antlerless, youth, and special disabled hunter seasons were not shown.
0
25,000
50,000
75,000
100,000
125,000
150,000
175,000
200,000
Regular Firearm
Muzzleloader
Late Antlerless
Archery
Antlerless
0
25,000
50,000
75,000
100,000
125,000
150,000
175,000
200,000
Harv
est
Regular Firearm
Muzzleloader
Archery
Antlered Bucks
0
50,000
100,000
150,000
200,000
250,000
300,000
350,000
1963
1968
1973
1978
1983
1988
1993
1998
2003
2008
2013
Year
Regular Firearm
Muzzleloader
Sexes Combined
Archery
Late Antlerless
20
Figure 14. Distribution of harvest among deer hunting seasons in Michigan, 2015. Antlered deer had antlers at least 3 inches in length; antlerless deer included deer without antlers and deer with antlers less than 3 inches in length.
Archery36%
Regular Firearm62%
Muzzleloader3%
Youth3%Independence
0.1%
Antlered Bucks
Archery34%
Regular Firearm54%
Muzzleloader6%
Early Antlerless1%
Late Antlerless4%Liberty
2.2%Independence
0.1%
Sexes Combined
Archery31%
Regular Firearm45%
Muzzleloader9%
Early Antlerless2%
Late Antlerless9%Liberty1.5%
Independence0.1%
Antlerless
21
Figure 15. Percentage of hunters harvesting a deer in Michigan, 2015. Error bars represent the 95% CLs.
≥1 ≥2 ≥3 ≥4 ≥5
0%5%
10%15%20%25%30%35%40%45%50%
Hu
nte
rs (
%)
Deer Harvested
Both Sexes Antlerless Antlered Bucks
22
Figure 16. Percentage of hunters harvesting a deer in Michigan’s deer hunting seasons, 2015. Error bars represent the 95% CLs. Antlered deer had at least one antler at least 3 inches in length; antlerless deer included deer without antlers and deer with antlers less than 3 inches in length.
0%5%
10%15%20%25%30%35%40%
Antlerless Deer
0%5%
10%15%20%25%30%35%40%
Succ
essf
ul H
unte
rs
(%)
Antlered Bucks
0%5%
10%15%20%25%30%35%40%
Arch
ery
Reg
ular
Fire
arm
Muz
zlel
oade
r
Early
Ant
lerle
ss
Late
Ant
lerle
ss
Libe
rty
Inde
pend
ence
Season
Sexes Combined
23
Table 1. Type of deer that could be taken during the 2015 Michigan deer hunting seasons for each combination of season and hunting license. Type of license (harvest tag) or permit Season
Type of deer that could be harvesteda and area
Deer license or deer combination regular license
Archery seasons Antlered deerb in the Upper Peninsula
Deer license or deer combination regular license
Archery seasons Antlerless or antlered deerb in Lower Peninsula
Deer license or deer combination regular license
Regular Firearm or Muzzleloader seasons
Antlered deer statewide or antlerless deer in DMUs 333 or 487
Deer license or deer combination regular license
Liberty and Independence seasons Antlerless or antlered deer statewide
Combination Licensed (Restricted harvest tag)
Archery seasons Deer that has at least 1 antler with 4 or more antler points, 1 or more inches in length, in the Upper Peninsula
Combination Licensed (Restricted harvest tag)
Archery seasons Antlerless deer or a deer that has at least 1 antler with 4 or more antler points, 1 or more inches in length, in the Lower Peninsula
Combination Licensed (Restricted harvest tag)
Regular Firearm or Muzzleloader seasons
A deer that has at least 1 antler with 4 or more antler points (1 or more inches in length) or an antlerless deer in DMUs 333 or 487
Combination Licensed (Restricted harvest tag)
Liberty and Independence seasonsc Antlerless or antlered deer statewide
aAntlered deer had antlers at least 3 inches in length; antlerless deer included deer without antlers and deer with antlers less than 3 inches in length. Hunters could harvest a maximum of 2 antlered deer per year (all seasons combined).
bIf a person took 2 antlered deer during all seasons combined (except Mentored Youth hunters), one of the antlered deer must have had at least 1 antler with 4 or more antler points, each point being 1 or more inches in length.
cYouth less than 14 years of age could hunt with archery and crossbow equipment on public or private lands or with a firearm on private or Commercial Forest lands only. Hunters could harvest only 1 deer in the Liberty and Independence seasons.
dCombination licenses included two harvest tags (i.e., regular and restricted harvest tags).
24
Table 1 (Continued). Type of deer that could be taken during the 2015 Michigan deer hunting seasons for each combination of season and hunting license. Type of license (harvest tag) or permit Season
Type of deer that could be harvesteda
Mentored youth deer license Archery , Regular Firearm, Muzzleloader, or Liberty seasonsc
Antlerless or antlered deer statewide
Mentored Youth Antlerless seasons Antlerless deer only Antlerless Licensee All seasons Antlerless deer only Deer Management Assistance (DMA) permitf
All seasons Antlerless deer only
Managed Deer Hunt permitg Specified season Antlerless deer only aAntlered deer had antlers at least 3 inches in length; antlerless deer included deer without antlers and deer with antlers less than 3 inches in length.
Hunters could harvest a maximum of 2 antlered deer per year (all seasons combined). bIf a person took 2 antlered deer during all seasons combined (except Mentored Youth hunters), one of the antlered deer must have had at least 1 antler
with 4 or more antler points, each point being 1 or more inches in length. cYouth less than 14 years of age could hunt with archery and crossbow equipment on public or private lands or with a firearm on private or Commercial
Forest lands only. Hunters could harvest only 1 deer in the Liberty and Independence seasons. dCombination licenses included two harvest tags (i.e., regular and restricted harvest tags). eAlthough antlerless licenses were only valid for taking an antlerless deer, a person with a valid antlerless deer hunting license that killed a male deer
with antlers less than 3 inches in length could choose to tag the male deer with any deer hunting license (firearm, archery or either combination license).
fPermits issued to landowners in areas where the number of antlerless licenses was insufficient to meet the objective of specific landowners (i.e., controlling disease or the deer population). To use these permits, the hunter must also have purchased a valid deer hunting license for the season in which they were hunting.
gPermits for special hunts on designated public lands (e.g., some state parks, game areas, and federal property). These permits valid only during specific dates, which varied among areas. Permits issued to applicants using a lottery (i.e., random selection). To use these permits, the hunter must also have purchased a valid deer hunting license.
25
Table 2. Michigan deer licenses purchased and harvest tags issued, 2013-2015.
Licenses or Harvest Tags Number Purchased or Issued Change Between
2014 and 2015 (%) 2013 2014 2015 Firearm Licensesa
Resident 187,757 0 0 NA Non-resident 13,452 0 0 NA Senior 36,411 0 0 NA Junior 23,964 0 0 NA Active Military 1,568 0 0 NA Disabled Veteran 753 0 0 NA
Subtotal 263,905 0 0 NA Archery Licensesa
Resident 40,146 0 0 NA Non-resident 3,365 0 0 NA Junior 3,584 0 0 NA Senior 6,916 0 0 NA Active Military 494 0 0 NA Disabled Veteran 283 0 0 NA
Subtotal 54,788 0 0 NA Deer Licensesa
Resident 0 164,670 164,680 0.0% Non-resident 0 13,611 13,414 -1.4% Junior 0 37,801 36,224 -4.2% Senior 0 35,569 37,198 4.6% Lifetime 0 509 444 -12.8% Active Military 0 570 533 -6.5% Disabled Veteran 0 381 425 11.5%
Subtotal 0 253,111 252,918 -0.1% Combination Licensesb
Resident 282,328 286,400 283,366 -1.1% Non-resident 2,289 3,510 3,547 1.1% Junior 46,622 27,845 23,957 -14.0% Senior 43,440 41,130 41,896 1.9% Lifetime NA 1,085 125 -88.5% Active Military 3,498 5,389 5,565 3.3% Disabled Veteran 2,910 5,385 6,272 16.5%
Subtotal 381,087 370,744 364,728 -1.6% Antlerless Licenses
Resident 405,313 278,180 272,271 -2.1% Non-resident 2,134 3,414 3,807 11.5% Junior 4,354 23,096 21,529 -6.8% Senior 0 40,417 40,903 1.2% Lifetime NA 182 177 -2.7% Active Military 4,295 4,536 4,445 -2.0% Pure Michigan Hunt 3 3 3 0.0% Disabled Veteran 1,954 4,023 4,775 18.7% Deer Management Assistance 8,981 9,797 9,040 -7.7% Managed Deer Hunt 185 629 558 -11.3%
Subtotal 427,219 364,277 357,508 -1.9% Mentored Youth Licensesb 12,384 12,959 11,935 -7.9% Total Licenses Sold 1,139,383 1,001,091 987,089 -1.4% aThe separate firearm and archery deer licenses available in 2013 were replaced by the single deer license in 2014. bCombination and Mentored Youth (prior to 2014) licenses included two harvest tags. Other license types had one harvest tag.

26
Table 2 (Continued). Michigan deer licenses purchased and harvest tags issued, 2013-2015.
Licenses or Harvest Tags
Number Purchased or Issued Change Between 2014 and 2015 (%) 2013 2014 2015
Harvest Tags Issued Firearma 263,905 0 0 NA Archerya 54,788 0 0 NA Deera 0 253,111 252,918 -0.1% Combinationb 762,174 741,488 729,456 -1.6% Antlerless 427,219 364,277 357,508 -1.9% Mentored Youthb 24,768 12,959 11,935 -7.9%
Total Harvest Tags 1,532,854 1,371,835 1,351,817 -1.5% aFirearm and Archery license types were replaced in 2014 with a Deer license. bCombination and Mentored Youth (prior to 2014) licenses included two harvest tags. Other license types had one harvest tag.
27
Table 3. Number of deer hunters and hunting effort in Michigan by hunting season, 2014-2015.
Season and Area
Number of huntersa Hunting effort (days)
2014 2015 95% CLb
Change from 2014 to 2015
(%) 2014 2015 95% CLb
Change from 2014 to 2015
(%) Archery
West UP 21,480 19,559 1,362 -8.9 239,815 242,522 22,748 1.1 East UP 7,319 5,766 754 -21.2 76,690 57,304 10,527 -25.3 NE LP 48,510 49,350 2,120 1.7 485,824 548,135 34,107 12.8 NW LP 62,660 63,266 2,359 1.0 780,213 788,893 40,653 1.1 Sag. Bay 53,569 53,832 2,198 0.5 695,319 646,497 36,137 -7.0 SW LP 54,061 53,278 2,188 -1.4 714,355 699,514 38,190 -2.1 SC LP 63,045 64,006 2,369 1.5 837,619 836,935 41,518 -0.1 SE LP 36,029 36,299 1,834 0.7 456,767 465,962 31,802 2.0 UP 28,543 25,213 2,517 -11.7 316,505 299,826 25,066 -5.3 NLP 126,662 128,249 3,767 1.3 1,480,503 1,551,987 57,223 4.8 SLP 182,557 183,504 3,640 0.5 2,489,593 2,433,949 71,001 -2.2 Statewidec 320,243 319,849 3,939 -0.1 4,286,602 4,285,762 95,307 0.0
Regular Firearm
West UP 54,946 59,840 2,274 8.9* 381,453 443,230 20,289 16.2* East UP 18,731 16,475 1,262 -12.0 115,150 111,088 9,891 -3.5 NE LP 102,036 100,291 2,890 -1.7 591,885 584,895 21,511 -1.2 NW LP 107,380 105,307 2,922 -1.9 615,696 609,648 21,785 -1.0 Sag. Bay 84,222 82,139 2,649 -2.5 502,746 468,204 19,135 -6.9 SW LP 75,247 74,231 2,522 -1.3 471,190 450,179 19,364 -4.5 SC LP 91,532 90,953 2,726 -0.6 553,207 538,799 21,072 -2.6 SE LP 39,786 37,532 1,869 -5.7 233,417 214,590 13,259 -8.1 UP 73,181 76,058 1,540 3.9 496,603 554,318 22,572 11.6* NLP 233,981 230,163 3,160 -1.6 1,374,449 1,351,415 32,531 -1.7 SLP 256,673 250,539 3,500 -2.4 1,593,691 1,514,899 35,213 -4.9* Statewidec 549,222 541,874 2,754 -1.3* 3,464,744 3,420,633 53,405 -1.3
aExcluded people that did not hunt during the season. b95% confidence limit for the 2015 estimate. *P<0.005. cNumber of hunters does not add up to statewide total because hunters can hunt in more than one area.
28
Table 3 (continued). Number of deer hunters and hunting effort in Michigan by hunting season, 2014-2015.
Season and Area
Number of huntersa Hunting effort (days)
2014 2015 95% CLb
Change from 2014 to 2015
(%) 2014 2015 95% CLb
Change from 2014 to 2015
(%) Muzzleloader
West UP 11,735 13,668 1,147 16.5 57,527 69,958 6,568 21.6 East UP 3,650 3,975 628 8.9 17,893 19,893 3,502 11.2 NE LP 18,521 19,071 1,363 3.0 74,927 75,860 6,247 1.2 NW LP 22,729 21,009 1,420 -7.6 96,225 85,759 6,892 -10.9 Sag. Bay 28,330 24,445 1,530 -13.7* 130,226 109,393 8,325 -16.0* SW LP 31,675 30,921 1,712 -2.4 166,193 157,206 10,784 -5.4 SC LP 36,180 34,237 1,792 -5.4 184,962 170,991 10,992 -7.6 SE LP 16,943 16,712 1,280 -1.4 84,516 84,775 7,856 0.3 UP 15,328 17,560 1,296 14.6 75,420 89,851 7,444 19.1* NLP 48,679 45,830 2,058 -5.9 202,903 186,946 9,982 -7.9 SLP 102,570 97,522 2,799 -4.9 534,147 497,038 18,843 -6.9 Statewidec 167,765 162,034 3,428 -3.4 812,469 773,835 22,823 -4.8
Early Antlerless
West UP 0 0 0 0 0 0 East UP 0 0 0 0 0 0 NE LP 2,999 2,645 491 -11.8 4,919 4,020 773 -18.3 NW LP 655 1,002 289 53.0 964 1,645 465 70.6% Sag. Bay 5,713 4,670 615 -18.3 9,118 7,184 979 -21.2 SW LP 0 0 0 0 0 0 SC LP 3,179 4,257 612 33.9 4,518 6,505 944 44.0* SE LP 4,670 3,090 522 -33.8* 6,874 4,761 811 -30.7* UP 0 0 0 0 0 0 NLP 4,046 4,077 599 0.8 6,487 6,289 948 -3.0 SLP 13,106 11,509 978 -12.2 19,906 17,826 1,556 -10.4 Statewidec 18,503 17,397 599 -6.0 26,393 24,115 1,875 -8.6
aExcluded people that did not hunt during the season. b95% confidence limit for the 2015 estimate. *P<0.005. cNumber of hunters does not add up to statewide total because hunters can hunt in more than one area.
29
Table 3 (continued). Number of deer hunters and hunting effort in Michigan by hunting season, 2014-2015.
Season and Area
Number of huntersa Hunting effort (days)
2014 2015 95% CLb
Change from 2014 to 2015
(%) 2014 2015 95% CLb
Change from 2014 to 2015
(%) Late Antlerless
West UP 0 0 0 0 0 0 East UP 0 0 0 0 0 0 NE LP 5,070 5,223 725 3.0 16,241 17,396 2,926 7.1 NW LP 4,607 4,980 694 8.1 15,216 18,929 3,279 24.4 Sag. Bay 9,785 9,217 945 -5.8 33,558 34,200 4,251 1.9 SW LP 14,404 13,099 1,123 -9.1 51,719 45,810 4,852 -11.4 SC LP 18,147 17,341 1,285 -4.4 62,854 63,120 5,750 0.4 SE LP 8,949 7,003 839 -21.7* 31,038 23,122 3,419 -25.5* UP 0 0 0 0 0 0 NLP 10,186 10,837 1,024 6.4 33,338 38,685 4,508 16.0 SLP 49,988 45,519 1,972 -8.9* 177,289 163,892 9,239 -7.6 Statewidec 63,251 58,929 2,186 -6.8 210,627 202,577 10,520 -3.8
Libertyd
West UP 1,350 1,335 257 -1.1 2,186 2,014 408 -7.9 East UP 336 176 74 -47.5 482 318 132 -34.0 NE LP 2,606 2,397 318 -8.0 4,196 3,845 545 -8.4 NW LP 4,949 4,592 425 -7.2 7,757 7,121 724 -8.2 Sag. Bay 3,607 3,772 387 4.6 5,576 5,797 638 3.9 SW LP 2,331 2,416 317 3.7 3,640 3,691 531 1.4 SC LP 3,129 3,494 375 11.7 4,785 5,095 598 6.5 SE LP 1,717 1,815 310 5.7 2,688 2,786 499 3.7 UP 1,686 1,512 267 -10.3 2,667 2,331 429 -12.6 NLP 8,793 8,219 557 -6.5 13,941 12,735 965 -8.7 SLP 9,522 10,185 630 7.0 14,702 15,599 1,089 6.1 Statewidec 20,516 20,479 828 -0.2 31,310 30,665 1,528 -2.1
aExcluded people that did not hunt during the season. b95% confidence limit for the 2015 estimate. *P<0.005. cNumber of hunters does not add up to statewide total because hunters can hunt in more than one area. dEstimates included results of both youth and disabled hunters.
30
Table 3 (continued). Number of deer hunters and hunting effort in Michigan by hunting season, 2014-2015.
Season and Area
Number of huntersa Hunting effort (days)
2014 2015 95% CLb
Change from 2014 to 2015
(%) 2014 2015 95% CLb
Change from 2014 to 2015
(%) Independence
West UP 121 100 56 -17.4 301 160 38 -46.8 East UP 62 29 10 -52.3 163 95 31 -42.0 NE LP 183 208 83 13.8 510 483 169 -5.2 NW LP 387 305 80 -21.3 651 600 122 -7.8 Sag. Bay 521 280 74 -46.2 919 536 135 -41.7 SW LP 300 207 115 -30.9 635 589 333 -7.3 SC LP 357 389 144 8.9 779 777 301 -0.2 SE LP 186 105 38 -43.7 355 259 98 -27.1 UP 182 129 57 -29.2 464 255 49 -45.1 NLP 772 586 118 -24.1 1,617 1,225 211 -24.2 SLP 1,161 908 200 -21.8 2,232 2,019 477 -9.5 Statewidec 2,309 1,826 265 -20.9 4,313 3,499 528 -18.9
All Seasons
West UP 62,495 64,778 2,348 3.7 681,151 757,943 40,155 11.3 East UP 22,320 18,842 1,345 -15.6* 210,346 188,685 19,116 -10.3 NE LP 117,165 114,413 3,035 -2.3 1,178,480 1,234,877 52,084 4.8 NW LP 125,088 123,276 3,094 -1.4 1,517,580 1,513,510 60,119 -0.3 Sag. Bay 100,478 98,252 2,841 -2.2 1,377,485 1,271,606 56,265 -7.7 SW LP 91,512 89,634 2,728 -2.1 1,407,424 1,356,766 60,469 -3.6 SC LP 111,700 110,826 2,939 -0.8 1,648,342 1,621,555 65,563 -1.6 SE LP 54,613 53,792 2,191 -1.5 815,650 796,145 47,148 -2.4 UP 84,099 83,174 2,607 -1.1 891,497 946,628 44,473 6.2 NLP 268,548 263,892 3,848 -1.7 3,114,296 3,150,722 85,446 1.2 SLP 311,748 306,625 3,707 -1.6 4,830,665 4,643,737 111,219 -3.9 Statewidec 614,593 607,113 1,730 -1.2* 8,836,458 8,741,086 148,324 -1.1
aExcluded people that did not hunt during the season. b95% confidence limit for the 2015 estimate. *P<0.005. cNumber of hunters does not add up to statewide total because hunters can hunt in more than one area.
31
Table 4. Mean number of days hunters spent hunting deer (x̄ hunting effort) in Michigan by hunting season, 2015.a
Area
Season Archery Regular Firearm Muzzleloader Early Antlerless
x̄ days 95% CLb x̄ days 95% CLb x̄ days 95% CLb x̄ days 95% CLb
West UP 12.7 0.8 7.6 0.2 5.2 0.2 0.0 0.0 East UP 9.9 1.3 6.8 0.3 5.1 0.4 0.0 0.0 NE LP 11.3 0.5 6.0 0.1 4.1 0.2 1.7 0.1 NW LP 12.7 0.4 5.9 0.1 4.2 0.2 1.6 0.1 Sag. Bay 12.2 0.5 5.8 0.1 4.6 0.2 1.6 0.1 SW LP 13.4 0.5 6.2 0.1 5.3 0.2 0.0 0.0 SC LP 13.5 0.4 6.1 0.1 5.2 0.2 1.5 0.1 SE LP 13.2 0.6 6.0 0.2 5.3 0.3 1.6 0.1 UP 12.1 0.7 7.4 0.1 5.2 0.2 0.0 0.0 NLP 12.3 0.3 6.0 0.1 4.2 0.1 1.6 0.1 SLP 13.6 0.3 6.2 0.1 5.3 0.1 1.6 0.0 Statewide 14.0 0.2 6.7 0.1 5.1 0.1 1.6 0.0
aExcluded people that did not hunt during the season. b95% confidence limit. Table 4 (Continued). Mean number of days hunters spent hunting deer (x̄ hunting effort) in Michigan by hunting season, 2015.a
Area
Season Late Antlerless Liberty Independence All Seasons x̄ days 95% CLb x̄ days 95% CLb x̄ days 95% CLb x̄ days 95% CLb
West UP 0.0 0.0 1.6 0.1 2.2 0.2 11.9 0.5 East UP 0.0 0.0 1.7 0.2 3.1 0.3 10.0 0.7 NE LP 3.7 0.3 1.7 0.1 2.3 0.2 11.0 0.4 NW LP 3.9 0.4 1.6 0.0 2.0 0.3 12.4 0.4 Sag. Bay 3.9 0.3 1.6 0.0 2.1 0.2 13.1 0.4 SW LP 3.8 0.2 1.6 0.1 2.7 0.5 15.4 0.5 SC LP 3.8 0.2 1.5 0.1 2.0 0.3 15.1 0.4 SE LP 3.8 0.3 1.5 0.1 2.4 0.4 15.2 0.6 UP 0.0 0.0 1.6 0.1 2.4 0.2 11.5 0.4 NLP 3.8 0.2 1.6 0.0 2.2 0.2 12.2 0.2 SLP 3.9 0.1 1.6 0.0 2.2 0.2 15.5 0.3 Statewide 3.9 0.1 1.6 0.0 2.2 0.1 15.1 0.2
aExcluded people that did not hunt during the season. b95% confidence limit.
32
Table 5. Number of deer harvested in Michigan, 2013-2015.
Season or permit Type of deer 2013 2014 2015
Change from 2014 to
2015 (%) Season
Archery Antlerless 53,890 48,136 42,644 -11.4* Antlered bucks 62,933 61,886 68,924 11.4* Sexes combined 116,823 110,022 111,568 1.4 Regular firearm Antlerless 82,693 67,503 64,553 -4.4 Antlered bucks 125,625 105,258 110,721 5.2 Sexes combined 208,317 172,761 175,274 1.5 Muzzleloader Antlerless 19,311 13,404 11,959 -10.8 Antlered bucks 9,020 6,816 6,594 -3.2 Sexes combined 28,331 20,220 18,553 -8.2 Early antlerless Antlerless 5,820 3,086 3,428 11.1 Late antlerless Antlerless 11,228 10,264 12,266 19.5 Libertya Antlerless 2,696 1,646 2,118 28.7 Antlered bucks 5,285 4,079 5,163 26.6* Sexes combined 7,981 5,725 7,281 27.2* Independenceb Antlerless 97 100 105 5.1 Antlered bucks 195 189 207 9.6 Sexes combined 292 288 311 8.0
Special permitsc Antlerless 6,508 6,673 5,931 -11.1 Grand Total Antlerless 182,245 150,812 143,004 -5.2 Antlered bucks 203,057 178,228 191,608 7.5* Sexes combined 385,302 329,040 334,612 1.7 aEstimates for Liberty hunt included results of both youth and disabled hunters. bEstimates included only one disabled hunter season. cIncludes deer harvested with DMA permits. These permits could be used during any deer hunting season. *P<0.005.
33
Table 6. Number of deer harvested in Michigan by hunting season, 2014-2015.a
Season and Area
Antlerless Antlered Bucks Sexes Combined
2014 Harvest
2015 Harvest
95% CLb
Change from 2014
to 2015 (%) 2014
Harvest 2015
Harvest 95% CLb
Change from 2014
to 2015 2014
Harvest 2015
Harvest 95% CLb
Change from 2014
to 2015 Archery
West UP 3,214 643 271 -80.0* 2,642 2,721 514 3.0 5,852 3,363 616 -42.5* East UP 1,078 120 105 -88.8* 682 395 192 -42.1 1,758 515 232 -70.7* NE LP 5,868 6,785 875 15.6 5,724 7,623 882 33.2* 11,589 14,411 1,316 24.4* NW LP 9,266 8,428 958 -9.0 10,405 11,261 1,072 8.2 19,668 19,690 1,510 0.1 Sag. Bay 7,687 7,476 956 -2.8 10,282 12,375 1,138 20.4 17,970 19,850 1,622 10.5 SW LP 7,899 5,929 857 -24.9* 11,275 10,914 1,088 -3.2 19,177 16,842 1,478 -12.2 SC LP 8,554 8,883 1,045 3.9 14,051 15,680 1,310 11.6 22,611 24,562 1,807 8.6 SE LP 4,570 4,379 698 -4.2 6,825 7,955 919 16.6 11,397 12,334 1,251 8.2 UP 4,291 764 290 -82.2* 3,323 3,115 549 -6.3 7,610 3,878 658 -49.0* NLP 17,747 17,639 1,396 -0.6 19,000 22,468 1,516 18.3* 36,740 40,112 2,187 9.2 SLP 26,098 24,242 1,722 -7.1 39,562 43,340 2,161 9.5 65,672 67,579 2,979 2.9 Statewide 48,136 42,644 2,248 -11.4* 61,886 68,924 2,714 11.4* 110,022 111,568 3,779 1.4
Regular Firearm
West UP 1,531 1,472 380 -3.9 12,320 11,403 1,058 -7.4 13,876 12,904 1,154 -7.0 East UP 42 0 0 -100.0 2,413 1,874 424 -22.4 2,462 1,880 424 -23.6 NE LP 12,833 12,214 1,189 -4.8 19,318 20,216 1,422 4.7 32,149 32,427 1,952 0.9 NW LP 12,229 11,486 1,087 -6.1 17,629 18,209 1,359 3.3 29,854 29,690 1,832 -0.5 Sag. Bay 12,389 11,729 1,164 -5.3 16,033 19,161 1,375 19.5* 28,414 30,887 1,931 8.7 SW LP 9,453 8,858 1,015 -6.3 13,145 13,605 1,189 3.5 22,594 22,458 1,670 -0.6 SC LP 15,117 15,125 1,353 0.1 17,942 20,018 1,436 11.6 33,046 35,124 2,121 6.3 SE LP 3,907 3,669 659 -6.1 6,458 6,235 793 -3.4 10,366 9,904 1,073 -4.5 UP 1,574 1,472 380 -6.5 14,734 13,276 1,140 -9.9 16,338 14,784 1,229 -9.5 NLP 29,001 27,180 1,722 -6.3 41,415 44,501 2,112 7.5 70,407 71,675 2,876 1.8 SLP 36,928 35,901 2,068 -2.8 49,110 52,943 2,325 7.8 86,016 88,815 3,326 3.3
Statewide 67,503 64,553 2,747 -4.4 105,258 110,721 3,364 5.2 172,761 175,274 4,605 1.5
aHarvest estimates do not include deer taken with DMA permits. An additional 5,931 deer were taken with these permits. b95% confidence limit for the 2015 estimate. *P<0.005.
34
Table 6 (continued). Number of deer harvested in Michigan by hunting season, 2014-2015.a
Season and Area
Antlerless Antlered Bucks Sexes Combined
2014 Harvest
2015 Harvest
95% CLb
Change from 2014
to 2015 (%) 2014
Harvest 2015
Harvest 95% CLb
Change from 2014
to 2015 2014
Harvest 2015
Harvest 95% CLb
Change from 2014
to 2015 Muzzleloader
West UP 399 404 207 1.3 933 303 164 -67.5* 1,329 707 264 -46.8 East UP 0 0 0 251 86 89 -65.7 250 86 89 -65.5 NE LP 1,472 997 307 -32.3 618 535 221 -13.5 2,091 1,531 378 -26.8 NW LP 1,625 1,081 316 -33.5 454 434 197 -4.4 2,081 1,515 380 -27.2 Sag. Bay 2,796 2,324 477 -16.9 1,127 1,296 355 15.0 3,925 3,621 604 -7.7 SW LP 2,530 2,484 509 -1.8 1,342 1,184 343 -11.8 3,872 3,667 631 -5.3 SC LP 3,599 3,569 607 -0.8 1,551 1,900 437 22.5 5,151 5,470 781 6.2 SE LP 983 1,101 341 12.0 539 856 294 59.0 1,521 1,957 450 28.6 UP 399 404 207 1.3 1,185 389 186 -67.2* 1,579 793 278 -49.8* NLP 3,541 2,484 481 -29.8 1,213 1,169 334 -3.7 4,756 3,653 590 -23.2 SLP 9,465 9,071 966 -4.2 4,418 5,036 705 14.0 13,884 14,108 1,231 1.6 Statewide 13,404 11,959 1,115 -10.8 6,816 6,594 812 -3.2 20,220 18,553 1,411 -8.2
Early Antlerless
West UP 0 0 0 0 0 0 0 0 0 0 East UP 0 0 0 0 0 0 0 0 0 0 NE LP 614 650 248 5.7 0 0 0 0 614 650 248 5.7 NW LP 103 179 112 72.9 0 0 0 0 103 179 112 72.9 Sag. Bay 1,001 1,047 290 4.5 0 0 0 0 1,001 1,047 290 4.5 SW LP 0 0 0 0 0 0 0 0 0 0 SC LP 697 970 281 39.2 0 0 0 0 697 970 281 39.2 SE LP 670 583 216 -13.0 0 0 0 0 670 583 216 -13.0 UP 0 0 0 0 0 0 0 0 0 0 NLP 791 932 284 17.8 0 0 0 0 791 932 284 17.8 SLP 2,295 2,496 450 8.8 0 0 0 0 2,295 2,496 450 8.8 Statewide 3,086 3,428 550 11.1 0 0 0 0 3,086 3,428 550 11.1
aHarvest estimates do not include deer taken with DMA permits. An additional 5,931 deer were taken with these permits. b95% confidence limit for the 2015 estimate. *P<0.005.
35
Table 6 (continued). Number of deer harvested in Michigan by hunting season, 2014-2015.a
Season and Area
Antlerless Antlered Bucks Sexes Combined
2014 Harvest
2015 Harvest
95% CLb
Change from 2014
to 2015 (%) 2014
Harvest 2015
Harvest 95% CLb
Change from 2014
to 2015 2014
Harvest 2015
Harvest 95% CLb
Change from 2014
to 2015 Late Antlerless
West UP 0 0 0 0 0 0 0 0 0 0 East UP 0 0 0 0 0 0 0 0 0 0 NE LP 1,095 773 269 -29.4 0 0 0 0 1,095 773 269 -29.4 NW LP 734 1,247 350 70.0 0 0 0 0 734 1,247 350 70.0 Sag. Bay 2,143 2,848 567 32.9 0 0 0 0 2,143 2,848 567 32.9 SW LP 1,859 2,356 501 26.7 0 0 0 0 1,859 2,356 501 26.7 SC LP 3,016 3,368 654 11.7 0 0 0 0 3,016 3,368 654 11.7 SE LP 1,417 1,673 437 18.0 0 0 0 0 1,417 1,673 437 18.0 UP 0 0 0 0 0 0 0 0 0 0 NLP 2,092 2,146 454 2.6 0 0 0 0 2,092 2,146 454 2.6 SLP 8,173 10,119 1,086 23.8 0 0 0 0 8,173 10,119 1,086 23.8 Statewide 10,264 12,266 1,192 19.5 0 0 0 0 10,264 12,266 1,192 19.5
Libertyc
West UP 160 158 73 -1.5 204 262 94 28.4 365 420 119 15.3 East UP 35 20 27 -41.2 11 1 0 -90.9 46 21 27 -53.2 NE LP 217 234 98 7.5 541 610 155 12.7 758 843 183 11.2 NW LP 603 563 137 -6.7 1,046 1,377 220 31.6 1,649 1,940 259 17.6 Sag. Bay 214 401 116 87.5 828 1,165 203 40.6 1,042 1,566 234 50.2* SW LP 96 197 82 105.9 343 454 125 32.4 439 651 149 48.4 SC LP 197 358 110 82.3 728 840 170 15.4 925 1,199 202 29.7 SE LP 124 187 116 50.4 377 453 143 20.1 501 640 184 27.6 UP 195 178 78 -8.5 215 263 94 22.4 410 442 122 7.7 NLP 928 1,014 189 9.2 1,892 2,354 294 24.4 2,820 3,368 349 19.4 SLP 523 926 195 77.0* 1,972 2,545 303 29.1 2,495 3,471 361 39.1* Statewide 1,646 2,118 284 28.7 4,079 5,163 435 26.6* 5,725 7,281 519 27.2*
aHarvest estimates do not include deer taken with DMA permits. An additional 5,931 deer were taken with these permits. b95% confidence limit for the 2015 estimate. *P<0.005. cEstimates included results of both youth and disabled hunters.
36
Table 6 (continued). Number of deer harvested in Michigan by hunting season, 2014-2015.a
Season and Area
Antlerless Antlered Bucks Sexes Combined
2014 Harvest
2015 Harvest
95% CLb
Change from 2014
to 2015 (%) 2014
Harvest 2015
Harvest 95% CLb
Change from 2014
to 2015 2014
Harvest 2015
Harvest 95% CLb
Change from 2014
to 2015 Independence
West UP 7 4 3 -47.5 3 5 5 58.8 10 9 6 -12.0 East UP 2 4 3 110.0 2 0 0 -100.0 3 4 3 5.6 NE LP 12 27 9 125.0 12 16 7 36.1 24 44 12 81.0 NW LP 9 25 20 185.4 48 31 11 -35.0 57 56 23 -1.2 Sag. Bay 40 13 7 -67.9 85 47 28 -44.5 125 60 29 -52.0 SW LP 7 3 2 -59.3 9 10 5 17.5 16 13 6 -16.7 SC LP 20 21 20 7.2 27 79 61 197.0 46 100 64 116.1 SE LP 3 8 5 138.9 3 18 19 407.7 7 26 20 273.2 UP 9 7 5 -16.0 5 5 5 5.9 14 13 7 -7.6 NLP 26 61 23 132.6* 96 59 14 -39.2 123 120 27 -2.3 SLP 65 36 21 -44.2 87 143 70 63.7 152 179 73 17.8
Statewide 100 105 31 5.1 189 207 72 9.6 288 311 78 8.0
All Seasons
West UP 5,332 2,687 540 -49.6* 16,078 14,701 1,227 -8.6 21,438 17,425 1,406 -18.7* East UP 1,164 146 109 -87.5* 3,354 2,356 479 -29.7 4,524 2,509 497 -44.5* NE LP 22,106 21,669 1,679 -2.0 26,195 29,011 1,752 10.8 48,298 50,676 2,636 4.9 NW LP 24,604 23,072 1,616 -6.2 29,595 31,321 1,842 5.8 54,196 54,390 2,650 0.4 Sag. Bay 26,252 25,786 1,896 -1.8 28,360 34,043 1,949 20.0* 54,600 59,822 3,061 9.6 SW LP 21,845 19,879 1,666 -9.0 26,122 26,160 1,738 0.1 47,964 46,033 2,697 -4.0 SC LP 31,168 32,262 2,196 3.5 34,310 38,506 2,109 12.2* 65,465 70,746 3,438 8.1 SE LP 11,668 11,572 1,231 -0.8 14,215 15,509 1,325 9.1 25,882 27,079 2,003 4.6 UP 6,496 2,833 551 -56.4* 19,431 17,057 1,317 -12.2 25,961 19,935 1,491 -23.2* NLP 54,161 51,521 2,493 -4.9 63,616 70,574 2,754 10.9* 117,767 122,091 4,042 3.7 SLP 83,482 82,719 3,453 -0.9 95,180 103,977 3,450 9.2* 178,638 186,656 5,487 4.5
Statewide 144,139 137,073 4,339 -4.9 178,228 191,608 4,638 7.5* 322,367 328,681 7,038 2.0
aHarvest estimates do not include deer taken with DMA permits. An additional 5,931 deer were taken with these permits. b95% confidence limit for the 2015 estimate. *P<0.005.
37
Table 7. Number of deer harvested on public and private lands during all seasons combined in Michigan by management region, 2014-2015.a
Season and Area
Antlerless Antlered Bucks Sexes Combined
2014 Harvest
2015 Harvest
95% CLb
Change from 2014
to 2015 (%) 2014
Harvest 2015
Harvest 95% CLb
Change from 2014
to 2015 2014
Harvest 2015
Harvest 95% CLb
Change from 2014
to 2015 Public Lands
West UP 722 64 61 -91.1* 3,680 4,049 636 10.0 4,421 4,142 643 -6.3 East UP 340 67 76 -80.2 1,117 823 286 -26.3 1,462 895 296 -38.7 NE LP 5,123 5,516 826 7.7 7,238 6,984 847 -3.5 12,358 12,487 1,255 1.0 NW LP 3,323 3,420 579 2.9 5,458 6,680 848 22.4 8,784 10,109 1,060 15.1 Sag. Bay 2,774 2,955 545 6.5 2,983 2,992 572 0.3 5,749 5,935 863 3.2 SW LP 1,437 975 341 -32.1 1,442 1,561 409 8.2 2,873 2,535 553 -11.8 SC LP 2,121 2,356 556 11.1 2,138 2,049 453 -4.2 4,250 4,393 796 3.4 SE LP 882 1,087 355 23.2 1,014 1,037 324 2.3 1,894 2,119 517 11.9 UP 1,062 132 97 -87.6* 4,797 4,872 698 1.6 5,882 5,037 708 -14.4 NLP 9,233 9,931 1,054 7.6 14,048 15,061 1,262 7.2 23,282 24,987 1,735 7.3 SLP 6,427 6,378 869 -0.8 6,224 6,242 807 0.3 12,626 12,592 1,280 -0.3 Statewide 16,722 16,440 1,399 -1.7 25,069 26,175 1,666 4.4 41,791 42,616 2,305 2.0
Private Lands
West UP 4,612 2,619 537 -43.2* 12,400 10,658 1,043 -14.1 17,028 13,297 1,235 -21.9* East UP 827 79 78 -90.4* 2,238 1,534 385 -31.4 3,068 1,618 400 -47.3* NE LP 17,021 16,195 1,453 -4.9 18,963 22,036 1,531 16.2* 35,981 38,230 2,290 6.3 NW LP 21,288 19,661 1,500 -7.6 24,140 24,648 1,628 2.1 45,424 44,302 2,406 -2.5 Sag. Bay 23,474 22,829 1,811 -2.7 25,375 31,046 1,859 22.3* 48,842 53,874 2,921 10.3 SW LP 20,392 18,884 1,613 -7.4 24,676 24,594 1,688 -0.3 45,068 43,474 2,615 -3.5 SC LP 29,025 29,885 2,117 3.0 32,168 36,448 2,051 13.3* 61,187 66,320 3,324 8.4 SE LP 10,779 10,481 1,169 -2.8 13,199 14,469 1,278 9.6 23,979 24,950 1,922 4.1 UP 5,439 2,698 542 -50.4* 14,638 12,192 1,111 -16.7* 20,096 14,915 1,298 -25.8* NLP 44,972 41,644 2,245 -7.4 49,576 55,528 2,440 12.0* 94,538 97,167 3,611 2.8 SLP 77,007 76,290 3,325 -0.9 88,945 97,713 3,344 9.9* 165,943 173,983 5,302 4.8
Statewide 127,417 120,632 4,085 -5.3 153,159 165,433 4,315 8.0* 280,576 286,065 6,598 2.0
aHarvest estimates do not include deer taken with DMA permits. An additional 5,931 deer were taken with these permits. b95% confidence limit for the 2015 estimate. *P<0.005.
38
Table 8. Percentage of deer hunters harvesting deer in Michigan during all seasons, 2015.a
Sex and Area
Number of deer harvested ≥1 deer ≥2 deer ≥3 deer ≥4 deer ≥5 deer
Success 95% CLb Success 95% CLb Success 95% CLb Success 95% CLb Success 95% CLb Antlerless
West UP 3.8 0.7 0.4 0.2 0.1 0.1 0.0 0.0 0.0 0.0 East UP 0.8 0.6 0.0 0.0 0.0 0.0 0.0 0.0 0.0 0.0 NE LP 16.0 1.1 2.7 0.5 0.4 0.2 0.2 0.1 0.1 0.1 NW LP 16.6 1.0 2.2 0.4 0.3 0.2 0.0 0.0 0.0 0.0 Sag. Bay 21.3 1.3 4.3 0.6 0.9 0.3 0.3 0.2 0.1 0.1 SW LP 18.1 1.3 3.7 0.6 0.7 0.3 0.2 0.1 0.0 0.1 SC LP 22.8 1.2 5.3 0.7 1.2 0.3 0.5 0.2 0.1 0.1 SE LP 18.0 1.6 3.6 0.8 0.3 0.3 0.1 0.1 0.0 0.0 UP 3.1 0.6 0.3 0.2 0.1 0.1 0.0 0.0 0.0 0.0 NLP 17.0 0.7 2.6 0.3 0.4 0.1 0.1 0.1 0.0 0.0 SLP 21.4 0.7 4.9 0.4 1.0 0.2 0.3 0.1 0.1 0.1 Statewided 18.7 0.5 3.9 0.2 0.8 0.1 0.3 0.1 0.1 0.0
Antlered bucksc West UP 22.1 1.6 1.4 0.5 East UP 12.6 2.4 0.3 0.4 NE LP 24.1 1.3 2.2 0.4 NW LP 23.5 1.2 2.8 0.5 Sag. Bay 31.6 1.5 4.2 0.6 SW LP 26.4 1.5 3.8 0.6 SC LP 31.3 1.4 4.6 0.6 SE LP 26.3 1.9 3.5 0.8 UP 20.0 1.4 1.2 0.4 NLP 25.0 0.8 2.7 0.3 SLP 30.6 0.8 4.5 0.4 Statewided 29.3 0.6 3.9 0.2
aExcluded people that did not hunt during the season and deer taken with DMA permits. b95% confidence limit. cThe season bag limit for antlered deer was two. dThe statewide estimate was derived from all hunters, including hunters that had failed to report where they hunted. In contrast, regional estimates were derived from only hunters that had reported hunting in the area.
39
Table 8 (continued). Percentage of deer hunters harvesting deer in Michigan during all seasons, 2015.a
Sex and Area
Number of deer harvested ≥1 deer ≥2 deer ≥3 deer ≥4 deer ≥5 deer
Success 95% CLb Success 95% CLb Success 95% CLb Success 95% CLb Success 95% CLb Sexes Combined
West UP 24.7 1.7 2.5 0.6 0.4 0.2 0.1 0.1 0.0 0.0 East UP 13.3 2.5 0.5 0.5 0.0 0.0 0.0 0.0 0.1 0.1 NE LP 36.0 1.4 7.9 0.8 1.3 0.3 0.4 0.2 0.0 0.0 NW LP 36.3 1.3 7.5 0.7 1.4 0.3 0.2 0.1 0.1 0.1 Sag. Bay 45.6 1.6 12.7 1.1 3.2 0.6 0.8 0.3 0.1 0.1 SW LP 38.1 1.6 11.4 1.1 2.7 0.5 0.6 0.3 0.2 0.2 SC LP 46.1 1.5 14.5 1.1 3.5 0.6 1.2 0.3 0.0 0.0 SE LP 38.6 2.1 10.6 1.3 2.4 0.7 0.3 0.3 0.0 0.0 UP 22.3 1.4 2.0 0.5 0.3 0.2 0.1 0.1 0.1 0.1 NLP 37.5 0.9 8.3 0.5 1.5 0.2 0.3 0.1 0.1 0.1 SLP 44.3 0.9 13.7 0.6 3.5 0.3 1.0 0.2 0.0 0.0 Statewided 41.6 0.6 11.6 0.4 2.7 0.2 0.7 0.1 0.2 0.1
aExcluded people that did not hunt during the season and deer taken with DMA permits. b95% confidence limit. cThe season bag limit for antlered deer was two. dThe statewide estimate was derived from all hunters, including hunters that had failed to report where they hunted. In contrast, regional estimates were derived from only hunters that had reported hunting in the area.
40
Table 9. Percentage of deer hunters harvesting at least one deer in Michigan by hunting season, 2015.a
Sex and Area
Season Archery Regular Firearm Muzzleloader Early Antlerless Late Antlerless Liberty
Success 95% CLb Success 95% CLb Success 95% CLb Success 95% CLb Success 95% CLb Success 95% CLb Antlerless
West UP 2.9 1.2 2.4 0.6 2.6 1.3 0.0 0.0 0.0 0.0 12.3 5.5 East UP 2.2 1.9 0.0 0.0 0.0 0.0 0.0 0.0 0.0 0.0 12.0 14.7 NE LP 12.6 1.5 11.2 1.0 5.3 1.6 20.1 7.5 15.0 5.0 10.1 4.1 NW LP 12.6 1.3 10.4 0.9 5.3 1.5 16.2 10.7 25.0 6.1 12.7 3.0 Sag. Bay 12.3 1.4 12.9 1.2 9.4 1.9 19.7 5.5 29.0 4.8 11.1 3.1 SW LP 9.8 1.3 10.8 1.1 7.8 1.5 0.0 0.0 17.2 3.3 8.5 3.4 SC LP 12.5 1.3 14.8 1.2 10.2 1.7 19.8 5.8 17.2 2.9 10.7 3.2 SE LP 11.4 1.7 8.9 1.5 6.4 1.9 16.2 6.5 22.5 5.1 10.7 6.2 UP 2.8 1.0 1.9 0.5 2.0 1.0 0.0 0.0 0.0 0.0 12.3 5.2 NLP 12.8 0.9 11.0 0.6 5.5 1.1 19.3 5.8 19.9 3.9 12.8 2.3 SLP 11.8 0.7 12.8 0.7 9.1 0.9 18.8 3.5 20.5 1.9 9.4 1.9 Statewide 12.2 0.6 11.1 0.4 7.3 0.7 19.8 2.8 19.9 1.7 10.9 1.4
Antlered Bucks West UP 14.1 2.5 19.2 1.6 2.3 1.2 0.0 0.0 0.0 0.0 20.4 6.9 East UP 7.1 3.4 11.6 2.5 2.2 2.3 0.0 0.0 0.0 0.0 0.6 0.2 NE LP 15.1 1.6 20.1 1.3 2.9 1.2 0.0 0.0 0.0 0.0 26.4 5.9 NW LP 17.3 1.5 17.0 1.1 2.1 1.0 0.0 0.0 0.0 0.0 31.2 4.3 Sag. Bay 22.2 1.8 23.3 1.5 5.3 1.4 0.0 0.0 0.0 0.0 32.1 4.8 SW LP 19.5 1.7 18.0 1.4 3.8 1.1 0.0 0.0 0.0 0.0 19.6 5.0 SC LP 23.2 1.7 21.6 1.4 5.5 1.2 0.0 0.0 0.0 0.0 25.0 4.5 SE LP 21.1 2.1 16.6 1.9 5.1 1.7 0.0 0.0 0.0 0.0 26.0 7.3 UP 12.5 2.1 17.6 1.4 2.3 1.1 0.0 0.0 0.0 0.0 18.1 6.1 NLP 17.1 1.0 19.2 0.8 2.5 0.7 0.0 0.0 0.0 0.0 29.8 3.2 SLP 22.5 1.0 20.9 0.8 5.1 0.7 0.0 0.0 0.0 0.0 26.0 2.8 Statewide 21.0 0.7 20.5 0.5 4.2 0.5 0.0 0.0 0.0 0.0 26.5 2.0
aExcluded people that did not hunt during the season and deer taken with DMA permits. b95% confidence limit.
41
Table 9 (continued). Percentage of deer hunters harvesting at least one deer in Michigan by hunting season, 2015.a
Sex and Area
Season Archery Regular Firearm Muzzleloader Early Antlerless Late Antlerless Liberty
Success 95% CLb Success 95% CLb Success 95% CLb Success 95% CLb Success 95% CLb Success 95% CLb Sexes combined
West UP 16.4 2.6 21.0 1.7 4.6 1.7 0.0 0.0 0.0 0.0 32.7 8.4 East UP 8.7 3.7 11.6 2.5 2.2 2.3 0.0 0.0 0.0 0.0 12.5 14.7 NE LP 25.9 2.0 29.2 1.4 8.2 2.0 20.1 7.5 15.0 5.0 36.6 6.5 NW LP 28.0 1.8 26.0 1.3 7.2 1.8 16.2 10.7 25.0 6.1 43.9 4.7 Sag. Bay 31.3 2.0 33.5 1.6 14.4 2.3 19.7 5.5 29.0 4.8 43.2 5.1 SW LP 27.2 1.9 26.6 1.6 11.3 1.8 0.0 0.0 17.2 3.3 28.0 5.7 SC LP 32.8 1.9 33.3 1.6 15.0 2.0 19.8 5.8 17.2 2.9 35.7 5.1 SE LP 29.7 2.4 24.3 2.2 11.5 2.5 16.2 6.5 22.5 5.1 36.7 8.4 UP 14.7 2.2 19.1 1.4 4.1 1.5 0.0 0.0 0.0 0.0 30.4 7.6 NLP 27.8 1.2 28.3 0.9 8.0 1.3 19.3 5.8 19.9 3.9 42.6 3.5 SLP 31.4 1.1 31.1 0.9 13.8 1.1 18.8 3.5 20.5 1.9 35.4 3.1 Statewide 30.3 0.8 29.4 0.6 11.2 0.8 19.8 2.8 19.9 1.7 37.4 2.2
aExcluded people that did not hunt during the season and deer taken with DMA permits. b95% confidence limit.
42
Table 9 (Continued). Percentage of deer hunters harvesting at least one deer in Michigan by hunting season, 2015.a
Sex and Area
Season Independence All Seasons
Success 95% CLb Success 95% CLb Antlerless
West UP 3.8 4.1 3.8 0.7 East UP 12.9 11.5 0.8 0.6 NE LP 13.6 6.8 16.0 1.1 NW LP 8.4 6.7 16.6 1.0 Sag. Bay 4.0 2.4 21.3 1.3 SW LP 1.4 1.4 18.1 1.3 SC LP 5.6 5.4 22.8 1.2 SE LP 8.2 5.4 18.0 1.6 UP 5.9 4.5 3.1 0.6 NLP 10.5 4.2 17.0 0.7 SLP 4.1 2.5 21.4 0.7 Statewide 5.9 1.9 18.7 0.5
Antlered Bucks West UP 3.8 4.1 22.1 1.6 East UP 0.0 0.0 12.6 2.4 NE LP 8.2 4.7 24.1 1.3 NW LP 9.9 4.0 23.5 1.2 Sag. Bay 17.3 9.7 31.6 1.5 SW LP 5.0 3.8 26.4 1.5 SC LP 20.9 14.8 31.3 1.4 SE LP 17.3 17.0 26.3 1.9 UP 2.9 3.0 20.0 1.4 NLP 10.0 3.0 25.0 0.8 SLP 16.2 7.6 30.6 0.8 Statewide 11.7 4.0 29.3 0.6
aExcluded people that did not hunt during the season and deer taken with DMA permits. b95% confidence limit.
43
Table 9 (continued). Percentage of deer hunters harvesting at least one deer in Michigan by hunting season, 2015.a
Sex and Area
Season Independence All Seasons
Success 95% CLb Success 95% CLb Sexes combined
West UP 7.6 6.4 24.7 1.7 East UP 12.9 11.5 13.3 2.5 NE LP 21.8 9.8 36.0 1.4 NW LP 18.4 7.8 36.3 1.3 Sag. Bay 20.7 9.9 45.6 1.6 SW LP 6.4 4.5 38.1 1.6 SC LP 26.1 15.4 46.1 1.5 SE LP 25.5 16.8 38.6 2.1 UP 8.8 5.9 22.3 1.4 NLP 20.2 5.5 37.5 0.9 SLP 20.1 7.9 44.3 0.9 Statewide 17.4 4.4 41.6 0.6
aExcluded people that did not hunt during the season and deer taken with DMA permits. b95% confidence limit.
44
Table 10. Level of satisfaction and dissatisfaction with the number of deer seen and number of antlered deer (bucks) seen among Michigan deer hunters, 2014-2015.
Criteria and area
Satisfied hunters (%)a Dissatisfied hunters (%)b
2014 2015 95% CLc
Difference from 2014 to
2015 (%) 2014 2015 95% CLc
Difference from 2014 to
2015 (%) Number of deer seen
West UP 21 14 1 -7* 67 77 2 9* East UP 19 12 3 -8* 68 80 3 12* NE LP 27 32 1 4* 58 52 2 -6* NW LP 29 35 1 6* 58 50 1 -8* Sag. Bay 26 40 2 14* 60 45 2 -15* SW LP 28 32 2 4* 58 51 2 -7* SC LP 31 41 2 10* 55 45 2 -10* SE LP 33 41 2 8* 51 40 2 -11* UP 21 14 1 -7* 67 77 2 10* NLP 27 33 1 6* 59 51 1 -8* SLP 30 39 1 9* 56 45 1 -11* Statewide 27 33 1 6* 58 52 1 -7*
Number of antlered deer (bucks) seen
West UP 14 12 1 -2 75 78 2 3 East UP 11 7 2 -4 78 83 3 5 NE LP 18 23 1 6* 65 59 2 -6* NW LP 20 26 1 6* 65 57 1 -8* Sag. Bay 18 29 2 11* 67 53 2 -13* SW LP 19 23 1 4* 64 59 2 -6* SC LP 22 29 1 7* 61 52 2 -9* SE LP 22 28 2 5* 58 52 2 -6* UP 13 11 1 -3* 76 79 1 3* NLP 18 25 1 6* 66 58 1 -8* SLP 21 28 1 7* 62 54 1 -8* Statewide 19 24 1 5* 65 59 1 -6*
aIncluded hunters who were “very satisfied” or “somewhat satisfied.” bIncluded hunters who were “somewhat dissatisfied” or “strongly dissatisfied.” c95% confidence limit for the 2015 estimate. *P<0.005.
45
Table 11. Level of satisfaction and dissatisfaction with overall deer hunting experience and number of deer harvested among Michigan deer hunters, 2014-2015.
Criteria and area
Satisfied hunters (%)a Dissatisfied hunters (%)b
2014 2015 95% CLc
Difference from 2014 to
2015 (%) 2014 2015 95% CLc
Difference from 2014 to
2015 (%) Overall deer hunting experience
West UP 32 26 2 -6* 49 56 2 7* East UP 30 22 3 -8* 50 59 4 9* NE LP 41 47 2 6* 37 31 1 -6* NW LP 39 46 1 7* 38 32 1 -6* Sag. Bay 37 50 2 14* 42 28 2 -14* SW LP 37 43 2 6* 40 34 2 -6* SC LP 42 49 2 7* 37 29 1 -7* SE LP 46 53 2 7* 31 25 2 -6* UP 32 26 2 -6* 49 56 2 7* NLP 39 46 1 7* 38 31 1 -7* SLP 40 49 1 8* 38 29 1 -8* Statewide 39 45 1 6* 39 34 1 -6*
Number of deer harvested
West UP 23 19 2 -4* 43 48 2 5* East UP 17 11 3 -7* 48 55 4 6 NE LP 27 30 1 3 38 34 2 -5* NW LP 26 28 1 3 39 34 1 -5* Sag. Bay 26 37 2 10* 39 31 2 -8* SW LP 26 28 2 2 39 35 2 -4* SC LP 28 34 2 6* 38 32 2 -6* SE LP 31 33 2 2 36 30 2 -6* UP 22 17 1 -4* 44 49 2 5* NLP 26 30 1 4* 39 34 1 -5* SLP 28 33 1 5* 38 32 1 -5* Statewide 26 30 1 3 39 35 1 -4*
aIncluded hunters who were “very satisfied” or “somewhat satisfied.” bIncluded hunters who were “somewhat dissatisfied” or “strongly dissatisfied.” c95% confidence limit for the 2015 estimate. *P<0.005.
46
Table 12. Level of satisfaction and dissatisfaction with the number of deer seen and number of antlered deer (bucks) seen among Michigan deer hunters in 2015. Estimates provided separately for hunters hunting on private land only and public land only within the hunter’s preferred hunt area.
Criteria and preferred hunt area
Satisfied hunters (%)a Dissatisfied hunters (%)b
Private only 95% CL
Public only 95% CL
Difference between land
types (%) Private
only 95% CL Public only 95% CL
Difference between land
types (%) Number of deer seen
West UP 18 2 13 3 -5 73 3 78 4 5 East UP 13 4 12 6 -1 77 5 85 6 8 NE LP 37 2 23 3 -13* 46 2 63 3 17* NW LP 39 2 28 3 -11* 45 2 59 3 13* Sag. Bay 43 2 27 5 -15* 42 2 57 5 15* SW LP 34 2 19 6 -15* 49 2 62 7 13* SC LP 42 2 26 6 -16* 43 2 59 6 16* SE LP 44 3 25 7 -19* 37 3 55 8 18* UP 17 2 13 3 -4 74 2 80 3 6* NLP 38 1 25 2 -13* 46 1 61 2 15* SLP 41 1 25 3 -15* 43 1 58 4 15* Statewide 37 1 23 1 -15* 47 1 64 2 17*
Number of antlered deer (bucks) seen
West UP 15 2 12 3 -2 75 3 77 4 2 East UP 7 3 7 4 0 80 5 84 6 4 NE LP 27 2 16 2 -12* 54 2 68 3 14* NW LP 29 2 22 3 -6* 54 2 61 3 7* Sag. Bay 32 2 18 4 -14* 52 2 61 5 9* SW LP 24 2 13 5 -11* 57 2 68 7 11* SC LP 30 2 21 5 -9* 52 2 59 7 8 SE LP 29 3 23 7 -6 51 3 62 8 11* UP 13 2 11 3 -2 76 2 79 3 3 NLP 28 1 18 2 -10* 55 1 65 2 10* SLP 29 1 19 3 -9* 53 1 62 4 9* Statewide 27 1 17 1 -10* 55 1 67 2 11*
aIncluded hunters who were “very satisfied” or “somewhat satisfied.” bIncluded hunters who were “somewhat dissatisfied” or “strongly dissatisfied.” *P<0.005.
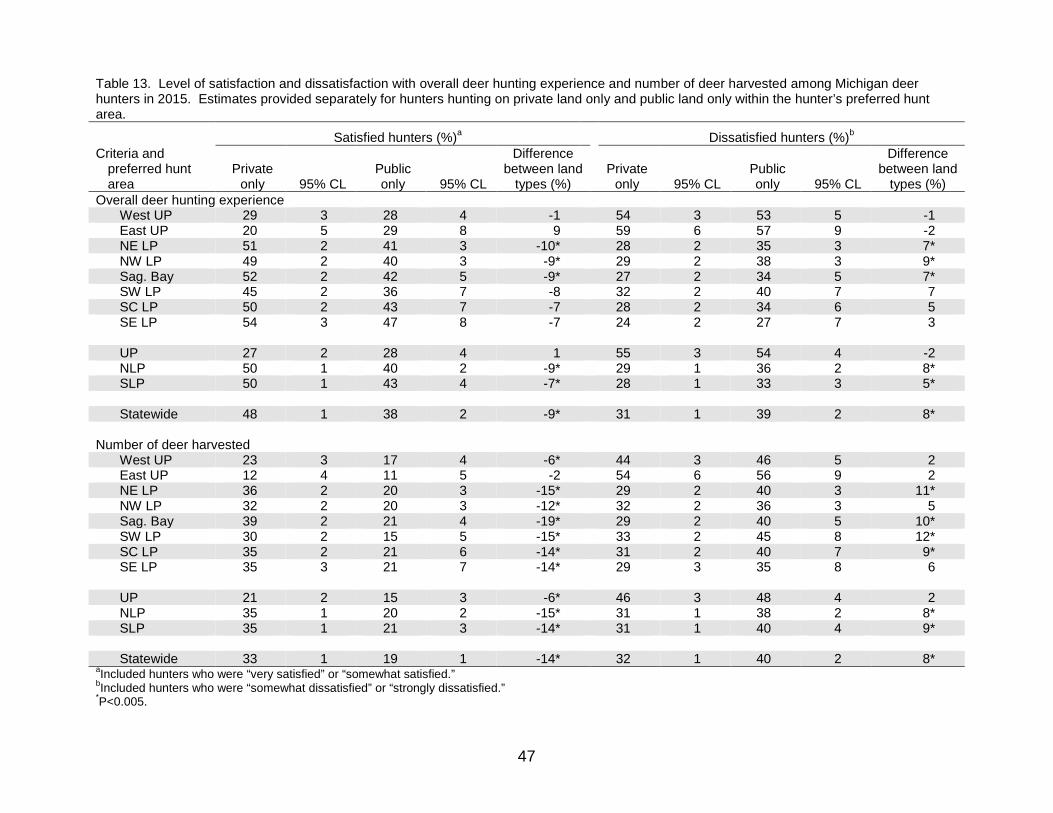
47
Table 13. Level of satisfaction and dissatisfaction with overall deer hunting experience and number of deer harvested among Michigan deer hunters in 2015. Estimates provided separately for hunters hunting on private land only and public land only within the hunter’s preferred hunt area.
Criteria and preferred hunt area
Satisfied hunters (%)a Dissatisfied hunters (%)b
Private only 95% CL
Public only 95% CL
Difference between land
types (%) Private
only 95% CL Public only 95% CL
Difference between land
types (%) Overall deer hunting experience
West UP 29 3 28 4 -1 54 3 53 5 -1 East UP 20 5 29 8 9 59 6 57 9 -2 NE LP 51 2 41 3 -10* 28 2 35 3 7* NW LP 49 2 40 3 -9* 29 2 38 3 9* Sag. Bay 52 2 42 5 -9* 27 2 34 5 7* SW LP 45 2 36 7 -8 32 2 40 7 7 SC LP 50 2 43 7 -7 28 2 34 6 5 SE LP 54 3 47 8 -7 24 2 27 7 3 UP 27 2 28 4 1 55 3 54 4 -2 NLP 50 1 40 2 -9* 29 1 36 2 8* SLP 50 1 43 4 -7* 28 1 33 3 5* Statewide 48 1 38 2 -9* 31 1 39 2 8*
Number of deer harvested
West UP 23 3 17 4 -6* 44 3 46 5 2 East UP 12 4 11 5 -2 54 6 56 9 2 NE LP 36 2 20 3 -15* 29 2 40 3 11* NW LP 32 2 20 3 -12* 32 2 36 3 5 Sag. Bay 39 2 21 4 -19* 29 2 40 5 10* SW LP 30 2 15 5 -15* 33 2 45 8 12* SC LP 35 2 21 6 -14* 31 2 40 7 9* SE LP 35 3 21 7 -14* 29 3 35 8 6 UP 21 2 15 3 -6* 46 3 48 4 2 NLP 35 1 20 2 -15* 31 1 38 2 8* SLP 35 1 21 3 -14* 31 1 40 4 9* Statewide 33 1 19 1 -14* 32 1 40 2 8*
aIncluded hunters who were “very satisfied” or “somewhat satisfied.” bIncluded hunters who were “somewhat dissatisfied” or “strongly dissatisfied.” *P<0.005.
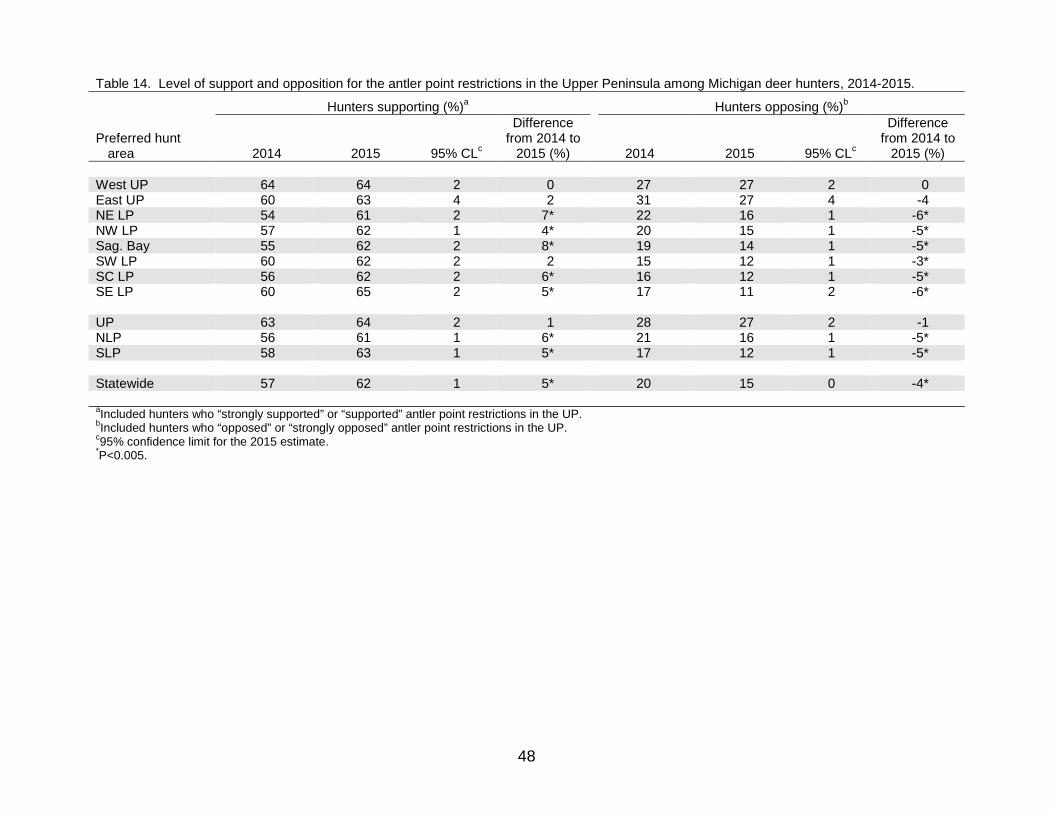
48
Table 14. Level of support and opposition for the antler point restrictions in the Upper Peninsula among Michigan deer hunters, 2014-2015.
Preferred hunt area
Hunters supporting (%)a Hunters opposing (%)b
2014 2015 95% CLc
Difference from 2014 to
2015 (%) 2014 2015 95% CLc
Difference from 2014 to
2015 (%) West UP 64 64 2 0 27 27 2 0 East UP 60 63 4 2 31 27 4 -4 NE LP 54 61 2 7* 22 16 1 -6* NW LP 57 62 1 4* 20 15 1 -5* Sag. Bay 55 62 2 8* 19 14 1 -5* SW LP 60 62 2 2 15 12 1 -3* SC LP 56 62 2 6* 16 12 1 -5* SE LP 60 65 2 5* 17 11 2 -6* UP 63 64 2 1 28 27 2 -1 NLP 56 61 1 6* 21 16 1 -5* SLP 58 63 1 5* 17 12 1 -5* Statewide 57 62 1 5* 20 15 0 -4* aIncluded hunters who “strongly supported” or “supported” antler point restrictions in the UP. bIncluded hunters who “opposed” or “strongly opposed” antler point restrictions in the UP. c95% confidence limit for the 2015 estimate. *P<0.005.
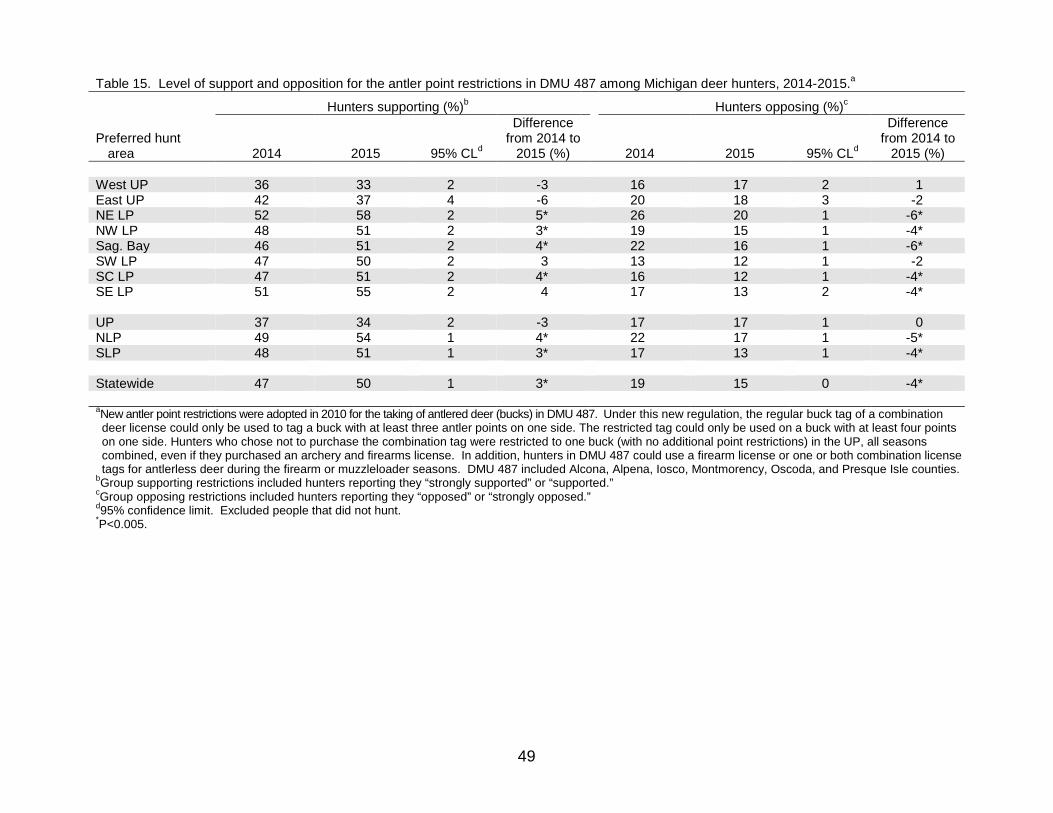
49
Table 15. Level of support and opposition for the antler point restrictions in DMU 487 among Michigan deer hunters, 2014-2015.a
Preferred hunt area
Hunters supporting (%)b Hunters opposing (%)c
2014 2015 95% CLd
Difference from 2014 to
2015 (%) 2014 2015 95% CLd
Difference from 2014 to
2015 (%) West UP 36 33 2 -3 16 17 2 1 East UP 42 37 4 -6 20 18 3 -2 NE LP 52 58 2 5* 26 20 1 -6* NW LP 48 51 2 3* 19 15 1 -4* Sag. Bay 46 51 2 4* 22 16 1 -6* SW LP 47 50 2 3 13 12 1 -2 SC LP 47 51 2 4* 16 12 1 -4* SE LP 51 55 2 4 17 13 2 -4* UP 37 34 2 -3 17 17 1 0 NLP 49 54 1 4* 22 17 1 -5* SLP 48 51 1 3* 17 13 1 -4* Statewide 47 50 1 3* 19 15 0 -4* aNew antler point restrictions were adopted in 2010 for the taking of antlered deer (bucks) in DMU 487. Under this new regulation, the regular buck tag of a combination deer license could only be used to tag a buck with at least three antler points on one side. The restricted tag could only be used on a buck with at least four points on one side. Hunters who chose not to purchase the combination tag were restricted to one buck (with no additional point restrictions) in the UP, all seasons combined, even if they purchased an archery and firearms license. In addition, hunters in DMU 487 could use a firearm license or one or both combination license tags for antlerless deer during the firearm or muzzleloader seasons. DMU 487 included Alcona, Alpena, Iosco, Montmorency, Oscoda, and Presque Isle counties.
bGroup supporting restrictions included hunters reporting they “strongly supported” or “supported.” cGroup opposing restrictions included hunters reporting they “opposed” or “strongly opposed.” d95% confidence limit. Excluded people that did not hunt. *P<0.005.
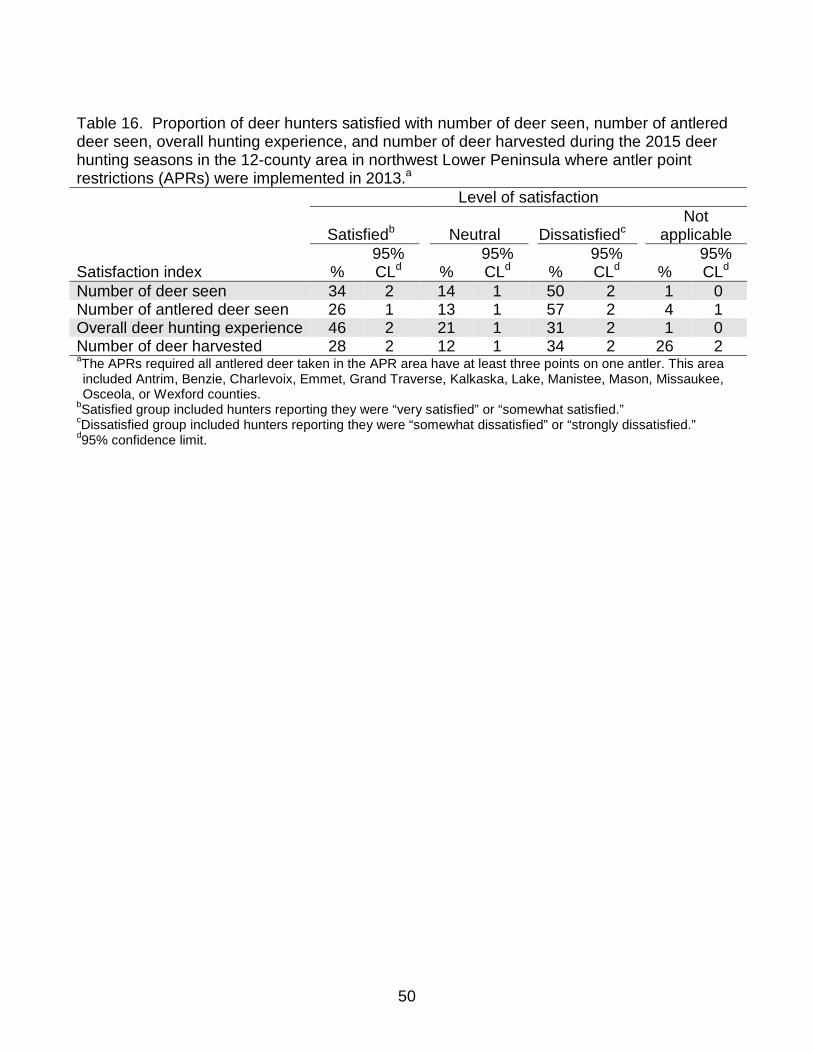
50
Table 16. Proportion of deer hunters satisfied with number of deer seen, number of antlered deer seen, overall hunting experience, and number of deer harvested during the 2015 deer hunting seasons in the 12-county area in northwest Lower Peninsula where antler point restrictions (APRs) were implemented in 2013.a
Satisfaction index
Level of satisfaction
Satisfiedb Neutral Dissatisfiedc Not
applicable
% 95% CLd %
95% CLd %
95% CLd %
95% CLd
Number of deer seen 34 2 14 1 50 2 1 0 Number of antlered deer seen 26 1 13 1 57 2 4 1 Overall deer hunting experience 46 2 21 1 31 2 1 0 Number of deer harvested 28 2 12 1 34 2 26 2 aThe APRs required all antlered deer taken in the APR area have at least three points on one antler. This area included Antrim, Benzie, Charlevoix, Emmet, Grand Traverse, Kalkaska, Lake, Manistee, Mason, Missaukee, Osceola, or Wexford counties.
bSatisfied group included hunters reporting they were “very satisfied” or “somewhat satisfied.” cDissatisfied group included hunters reporting they were “somewhat dissatisfied” or “strongly dissatisfied.” d95% confidence limit.
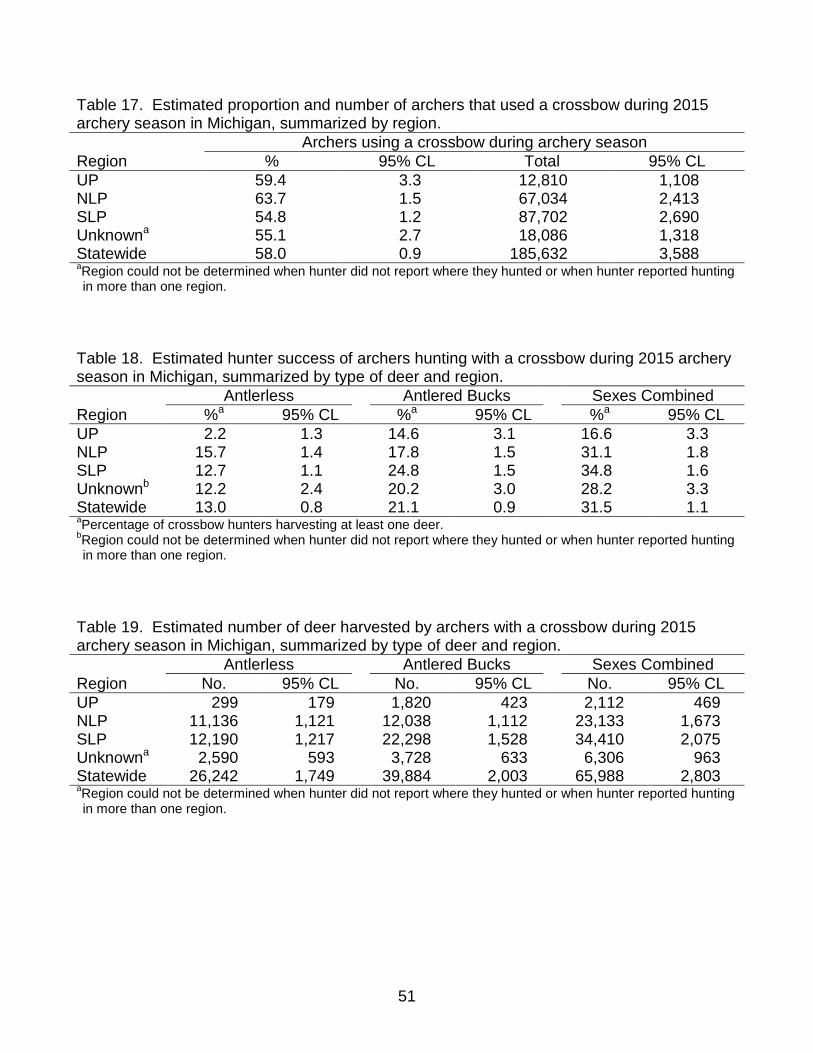
51
Table 17. Estimated proportion and number of archers that used a crossbow during 2015 archery season in Michigan, summarized by region.
Region Archers using a crossbow during archery season
% 95% CL Total 95% CL UP 59.4 3.3 12,810 1,108 NLP 63.7 1.5 67,034 2,413 SLP 54.8 1.2 87,702 2,690 Unknowna 55.1 2.7 18,086 1,318 Statewide 58.0 0.9 185,632 3,588 aRegion could not be determined when hunter did not report where they hunted or when hunter reported hunting in more than one region.
Table 18. Estimated hunter success of archers hunting with a crossbow during 2015 archery season in Michigan, summarized by type of deer and region.
Region Antlerless Antlered Bucks Sexes Combined
%a 95% CL %a 95% CL %a 95% CL UP 2.2 1.3 14.6 3.1 16.6 3.3 NLP 15.7 1.4 17.8 1.5 31.1 1.8 SLP 12.7 1.1 24.8 1.5 34.8 1.6 Unknownb 12.2 2.4 20.2 3.0 28.2 3.3 Statewide 13.0 0.8 21.1 0.9 31.5 1.1 aPercentage of crossbow hunters harvesting at least one deer. bRegion could not be determined when hunter did not report where they hunted or when hunter reported hunting in more than one region.
Table 19. Estimated number of deer harvested by archers with a crossbow during 2015 archery season in Michigan, summarized by type of deer and region.
Region Antlerless Antlered Bucks Sexes Combined
No. 95% CL No. 95% CL No. 95% CL UP 299 179 1,820 423 2,112 469 NLP 11,136 1,121 12,038 1,112 23,133 1,673 SLP 12,190 1,217 22,298 1,528 34,410 2,075 Unknowna 2,590 593 3,728 633 6,306 963 Statewide 26,242 1,749 39,884 2,003 65,988 2,803 aRegion could not be determined when hunter did not report where they hunted or when hunter reported hunting in more than one region.
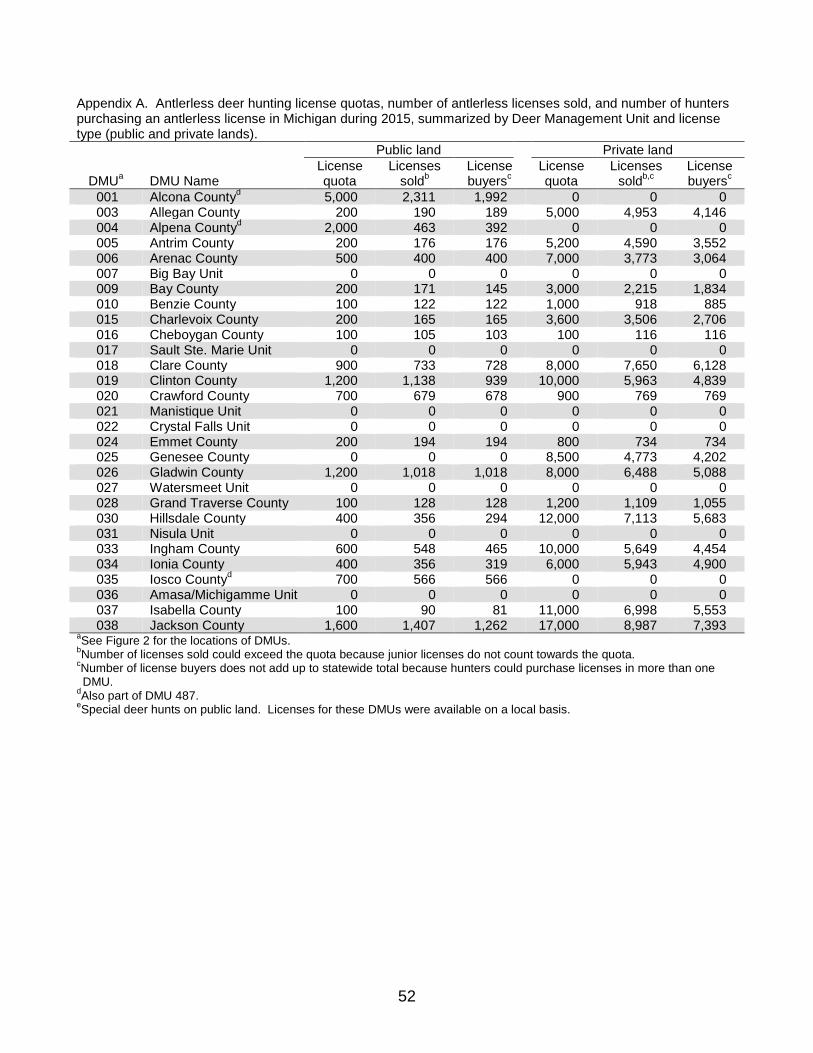
52
Appendix A. Antlerless deer hunting license quotas, number of antlerless licenses sold, and number of hunters purchasing an antlerless license in Michigan during 2015, summarized by Deer Management Unit and license type (public and private lands).
DMUa DMU Name
Public land Private land License quota
Licenses soldb
License buyersc
License quota
Licenses soldb,c
License buyersc
001 Alcona Countyd 5,000 2,311 1,992 0 0 0 003 Allegan County 200 190 189 5,000 4,953 4,146 004 Alpena Countyd 2,000 463 392 0 0 0 005 Antrim County 200 176 176 5,200 4,590 3,552 006 Arenac County 500 400 400 7,000 3,773 3,064 007 Big Bay Unit 0 0 0 0 0 0 009 Bay County 200 171 145 3,000 2,215 1,834 010 Benzie County 100 122 122 1,000 918 885 015 Charlevoix County 200 165 165 3,600 3,506 2,706 016 Cheboygan County 100 105 103 100 116 116 017 Sault Ste. Marie Unit 0 0 0 0 0 0 018 Clare County 900 733 728 8,000 7,650 6,128 019 Clinton County 1,200 1,138 939 10,000 5,963 4,839 020 Crawford County 700 679 678 900 769 769 021 Manistique Unit 0 0 0 0 0 0 022 Crystal Falls Unit 0 0 0 0 0 0 024 Emmet County 200 194 194 800 734 734 025 Genesee County 0 0 0 8,500 4,773 4,202 026 Gladwin County 1,200 1,018 1,018 8,000 6,488 5,088 027 Watersmeet Unit 0 0 0 0 0 0 028 Grand Traverse County 100 128 128 1,200 1,109 1,055 030 Hillsdale County 400 356 294 12,000 7,113 5,683 031 Nisula Unit 0 0 0 0 0 0 033 Ingham County 600 548 465 10,000 5,649 4,454 034 Ionia County 400 356 319 6,000 5,943 4,900 035 Iosco Countyd 700 566 566 0 0 0 036 Amasa/Michigamme Unit 0 0 0 0 0 0 037 Isabella County 100 90 81 11,000 6,998 5,553 038 Jackson County 1,600 1,407 1,262 17,000 8,987 7,393
aSee Figure 2 for the locations of DMUs. bNumber of licenses sold could exceed the quota because junior licenses do not count towards the quota. cNumber of license buyers does not add up to statewide total because hunters could purchase licenses in more than one DMU.
dAlso part of DMU 487. eSpecial deer hunts on public land. Licenses for these DMUs were available on a local basis.
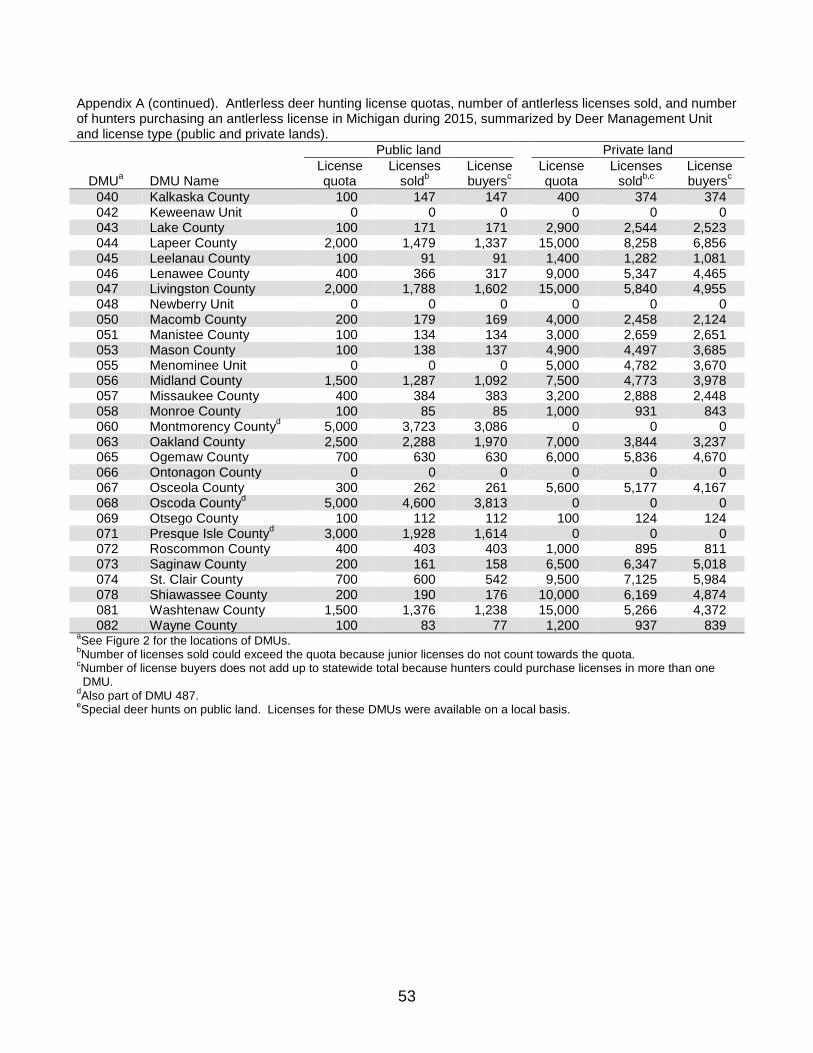
53
Appendix A (continued). Antlerless deer hunting license quotas, number of antlerless licenses sold, and number of hunters purchasing an antlerless license in Michigan during 2015, summarized by Deer Management Unit and license type (public and private lands).
DMUa DMU Name
Public land Private land License quota
Licenses soldb
License buyersc
License quota
Licenses soldb,c
License buyersc
040 Kalkaska County 100 147 147 400 374 374 042 Keweenaw Unit 0 0 0 0 0 0 043 Lake County 100 171 171 2,900 2,544 2,523 044 Lapeer County 2,000 1,479 1,337 15,000 8,258 6,856 045 Leelanau County 100 91 91 1,400 1,282 1,081 046 Lenawee County 400 366 317 9,000 5,347 4,465 047 Livingston County 2,000 1,788 1,602 15,000 5,840 4,955 048 Newberry Unit 0 0 0 0 0 0 050 Macomb County 200 179 169 4,000 2,458 2,124 051 Manistee County 100 134 134 3,000 2,659 2,651 053 Mason County 100 138 137 4,900 4,497 3,685 055 Menominee Unit 0 0 0 5,000 4,782 3,670 056 Midland County 1,500 1,287 1,092 7,500 4,773 3,978 057 Missaukee County 400 384 383 3,200 2,888 2,448 058 Monroe County 100 85 85 1,000 931 843 060 Montmorency Countyd 5,000 3,723 3,086 0 0 0 063 Oakland County 2,500 2,288 1,970 7,000 3,844 3,237 065 Ogemaw County 700 630 630 6,000 5,836 4,670 066 Ontonagon County 0 0 0 0 0 0 067 Osceola County 300 262 261 5,600 5,177 4,167 068 Oscoda Countyd 5,000 4,600 3,813 0 0 0 069 Otsego County 100 112 112 100 124 124 071 Presque Isle Countyd 3,000 1,928 1,614 0 0 0 072 Roscommon County 400 403 403 1,000 895 811 073 Saginaw County 200 161 158 6,500 6,347 5,018 074 St. Clair County 700 600 542 9,500 7,125 5,984 078 Shiawassee County 200 190 176 10,000 6,169 4,874 081 Washtenaw County 1,500 1,376 1,238 15,000 5,266 4,372 082 Wayne County 100 83 77 1,200 937 839
aSee Figure 2 for the locations of DMUs. bNumber of licenses sold could exceed the quota because junior licenses do not count towards the quota. cNumber of license buyers does not add up to statewide total because hunters could purchase licenses in more than one DMU.
dAlso part of DMU 487. eSpecial deer hunts on public land. Licenses for these DMUs were available on a local basis.
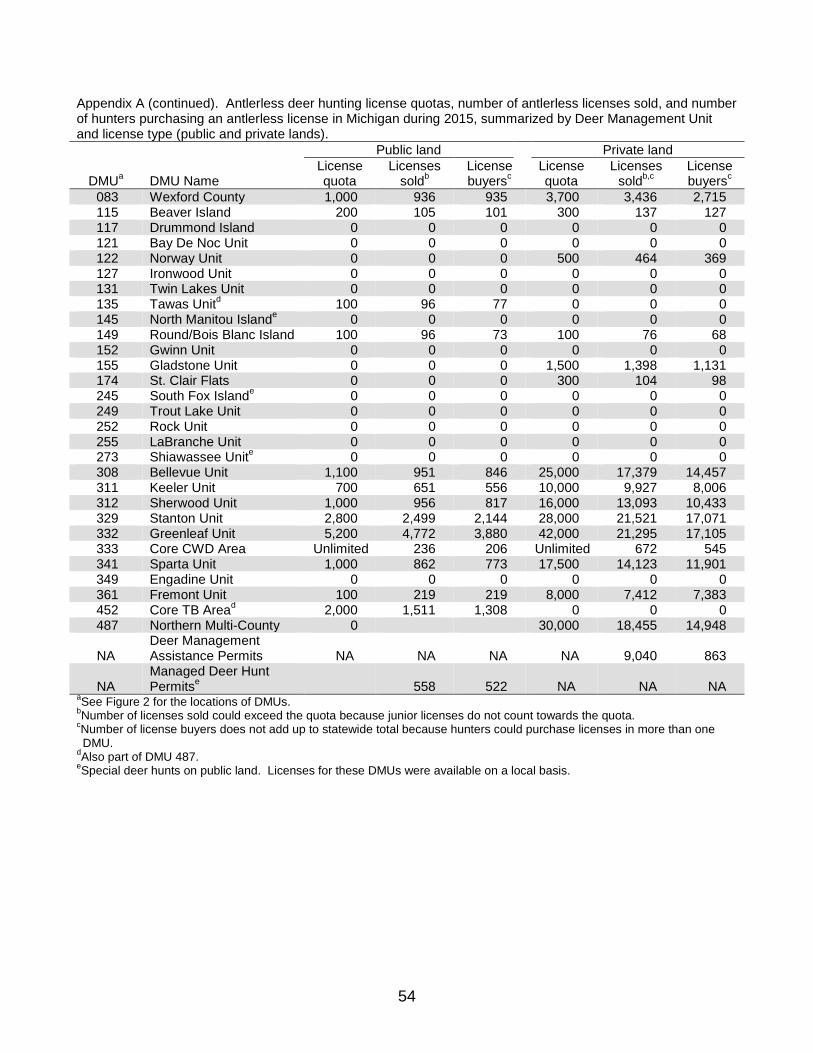
54
Appendix A (continued). Antlerless deer hunting license quotas, number of antlerless licenses sold, and number of hunters purchasing an antlerless license in Michigan during 2015, summarized by Deer Management Unit and license type (public and private lands).
DMUa DMU Name
Public land Private land License quota
Licenses soldb
License buyersc
License quota
Licenses soldb,c
License buyersc
083 Wexford County 1,000 936 935 3,700 3,436 2,715 115 Beaver Island 200 105 101 300 137 127 117 Drummond Island 0 0 0 0 0 0 121 Bay De Noc Unit 0 0 0 0 0 0 122 Norway Unit 0 0 0 500 464 369 127 Ironwood Unit 0 0 0 0 0 0 131 Twin Lakes Unit 0 0 0 0 0 0 135 Tawas Unitd 100 96 77 0 0 0 145 North Manitou Islande 0 0 0 0 0 0 149 Round/Bois Blanc Island 100 96 73 100 76 68 152 Gwinn Unit 0 0 0 0 0 0 155 Gladstone Unit 0 0 0 1,500 1,398 1,131 174 St. Clair Flats 0 0 0 300 104 98 245 South Fox Islande 0 0 0 0 0 0 249 Trout Lake Unit 0 0 0 0 0 0 252 Rock Unit 0 0 0 0 0 0 255 LaBranche Unit 0 0 0 0 0 0 273 Shiawassee Unite 0 0 0 0 0 0 308 Bellevue Unit 1,100 951 846 25,000 17,379 14,457 311 Keeler Unit 700 651 556 10,000 9,927 8,006 312 Sherwood Unit 1,000 956 817 16,000 13,093 10,433 329 Stanton Unit 2,800 2,499 2,144 28,000 21,521 17,071 332 Greenleaf Unit 5,200 4,772 3,880 42,000 21,295 17,105 333 Core CWD Area Unlimited 236 206 Unlimited 672 545 341 Sparta Unit 1,000 862 773 17,500 14,123 11,901 349 Engadine Unit 0 0 0 0 0 0 361 Fremont Unit 100 219 219 8,000 7,412 7,383 452 Core TB Aread 2,000 1,511 1,308 0 0 0 487 Northern Multi-County 0 30,000 18,455 14,948
NA Deer Management Assistance Permits NA NA NA NA 9,040 863
NA Managed Deer Hunt Permitse 558 522 NA NA NA
aSee Figure 2 for the locations of DMUs. bNumber of licenses sold could exceed the quota because junior licenses do not count towards the quota. cNumber of license buyers does not add up to statewide total because hunters could purchase licenses in more than one DMU.
dAlso part of DMU 487. eSpecial deer hunts on public land. Licenses for these DMUs were available on a local basis.
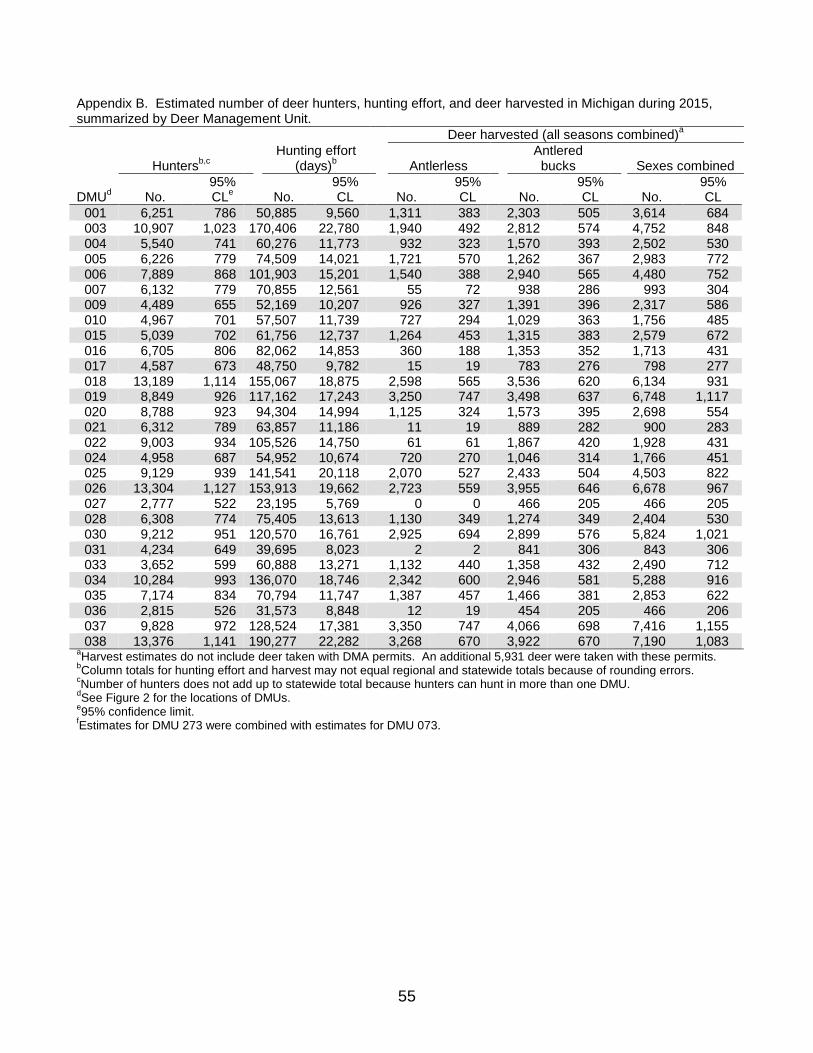
55
Appendix B. Estimated number of deer hunters, hunting effort, and deer harvested in Michigan during 2015, summarized by Deer Management Unit.
DMUd
Huntersb,c Hunting effort
(days)b
Deer harvested (all seasons combined)a
Antlerless Antlered bucks Sexes combined
No. 95% CLe No.
95% CL No.
95% CL No.
95% CL No.
95% CL
001 6,251 786 50,885 9,560 1,311 383 2,303 505 3,614 684 003 10,907 1,023 170,406 22,780 1,940 492 2,812 574 4,752 848 004 5,540 741 60,276 11,773 932 323 1,570 393 2,502 530 005 6,226 779 74,509 14,021 1,721 570 1,262 367 2,983 772 006 7,889 868 101,903 15,201 1,540 388 2,940 565 4,480 752 007 6,132 779 70,855 12,561 55 72 938 286 993 304 009 4,489 655 52,169 10,207 926 327 1,391 396 2,317 586 010 4,967 701 57,507 11,739 727 294 1,029 363 1,756 485 015 5,039 702 61,756 12,737 1,264 453 1,315 383 2,579 672 016 6,705 806 82,062 14,853 360 188 1,353 352 1,713 431 017 4,587 673 48,750 9,782 15 19 783 276 798 277 018 13,189 1,114 155,067 18,875 2,598 565 3,536 620 6,134 931 019 8,849 926 117,162 17,243 3,250 747 3,498 637 6,748 1,117 020 8,788 923 94,304 14,994 1,125 324 1,573 395 2,698 554 021 6,312 789 63,857 11,186 11 19 889 282 900 283 022 9,003 934 105,526 14,750 61 61 1,867 420 1,928 431 024 4,958 687 54,952 10,674 720 270 1,046 314 1,766 451 025 9,129 939 141,541 20,118 2,070 527 2,433 504 4,503 822 026 13,304 1,127 153,913 19,662 2,723 559 3,955 646 6,678 967 027 2,777 522 23,195 5,769 0 0 466 205 466 205 028 6,308 774 75,405 13,613 1,130 349 1,274 349 2,404 530 030 9,212 951 120,570 16,761 2,925 694 2,899 576 5,824 1,021 031 4,234 649 39,695 8,023 2 2 841 306 843 306 033 3,652 599 60,888 13,271 1,132 440 1,358 432 2,490 712 034 10,284 993 136,070 18,746 2,342 600 2,946 581 5,288 916 035 7,174 834 70,794 11,747 1,387 457 1,466 381 2,853 622 036 2,815 526 31,573 8,848 12 19 454 205 466 206 037 9,828 972 128,524 17,381 3,350 747 4,066 698 7,416 1,155 038 13,376 1,141 190,277 22,282 3,268 670 3,922 670 7,190 1,083
aHarvest estimates do not include deer taken with DMA permits. An additional 5,931 deer were taken with these permits. bColumn totals for hunting effort and harvest may not equal regional and statewide totals because of rounding errors. cNumber of hunters does not add up to statewide total because hunters can hunt in more than one DMU. dSee Figure 2 for the locations of DMUs. e95% confidence limit. fEstimates for DMU 273 were combined with estimates for DMU 073.
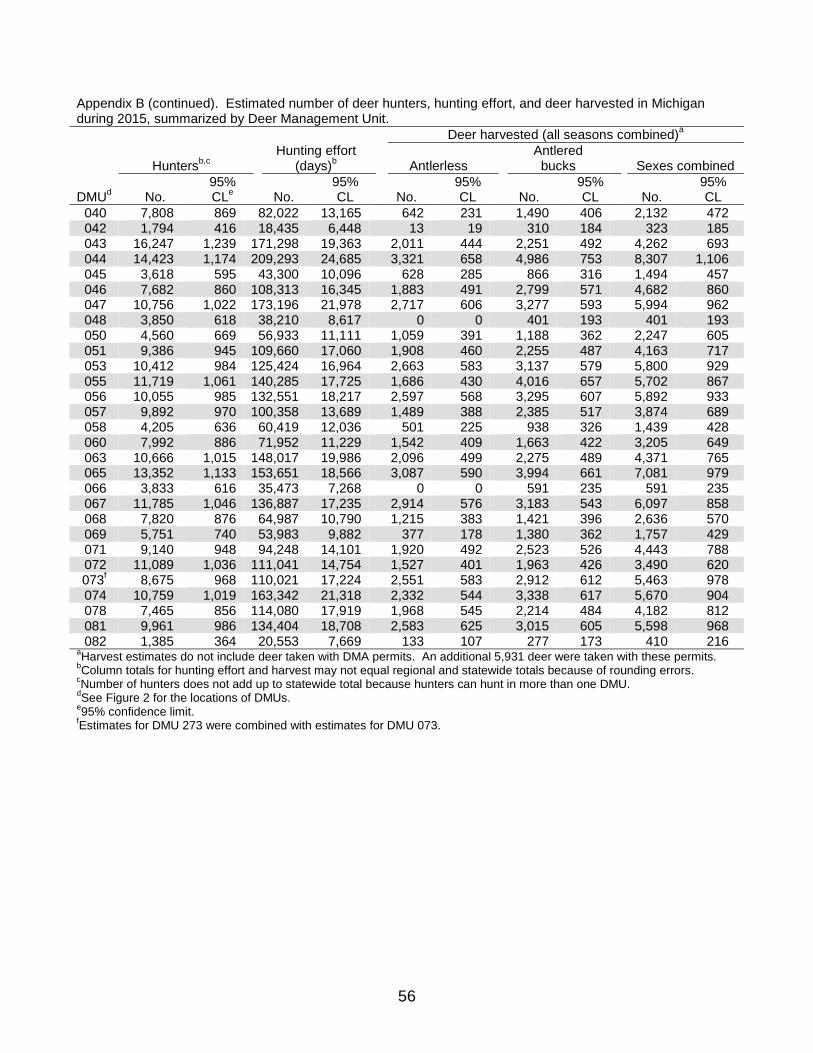
56
Appendix B (continued). Estimated number of deer hunters, hunting effort, and deer harvested in Michigan during 2015, summarized by Deer Management Unit.
DMUd
Huntersb,c Hunting effort
(days)b
Deer harvested (all seasons combined)a
Antlerless Antlered bucks Sexes combined
No. 95% CLe No.
95% CL No.
95% CL No.
95% CL No.
95% CL
040 7,808 869 82,022 13,165 642 231 1,490 406 2,132 472 042 1,794 416 18,435 6,448 13 19 310 184 323 185 043 16,247 1,239 171,298 19,363 2,011 444 2,251 492 4,262 693 044 14,423 1,174 209,293 24,685 3,321 658 4,986 753 8,307 1,106 045 3,618 595 43,300 10,096 628 285 866 316 1,494 457 046 7,682 860 108,313 16,345 1,883 491 2,799 571 4,682 860 047 10,756 1,022 173,196 21,978 2,717 606 3,277 593 5,994 962 048 3,850 618 38,210 8,617 0 0 401 193 401 193 050 4,560 669 56,933 11,111 1,059 391 1,188 362 2,247 605 051 9,386 945 109,660 17,060 1,908 460 2,255 487 4,163 717 053 10,412 984 125,424 16,964 2,663 583 3,137 579 5,800 929 055 11,719 1,061 140,285 17,725 1,686 430 4,016 657 5,702 867 056 10,055 985 132,551 18,217 2,597 568 3,295 607 5,892 933 057 9,892 970 100,358 13,689 1,489 388 2,385 517 3,874 689 058 4,205 636 60,419 12,036 501 225 938 326 1,439 428 060 7,992 886 71,952 11,229 1,542 409 1,663 422 3,205 649 063 10,666 1,015 148,017 19,986 2,096 499 2,275 489 4,371 765 065 13,352 1,133 153,651 18,566 3,087 590 3,994 661 7,081 979 066 3,833 616 35,473 7,268 0 0 591 235 591 235 067 11,785 1,046 136,887 17,235 2,914 576 3,183 543 6,097 858 068 7,820 876 64,987 10,790 1,215 383 1,421 396 2,636 570 069 5,751 740 53,983 9,882 377 178 1,380 362 1,757 429 071 9,140 948 94,248 14,101 1,920 492 2,523 526 4,443 788 072 11,089 1,036 111,041 14,754 1,527 401 1,963 426 3,490 620 073f 8,675 968 110,021 17,224 2,551 583 2,912 612 5,463 978 074 10,759 1,019 163,342 21,318 2,332 544 3,338 617 5,670 904 078 7,465 856 114,080 17,919 1,968 545 2,214 484 4,182 812 081 9,961 986 134,404 18,708 2,583 625 3,015 605 5,598 968 082 1,385 364 20,553 7,669 133 107 277 173 410 216
aHarvest estimates do not include deer taken with DMA permits. An additional 5,931 deer were taken with these permits. bColumn totals for hunting effort and harvest may not equal regional and statewide totals because of rounding errors. cNumber of hunters does not add up to statewide total because hunters can hunt in more than one DMU. dSee Figure 2 for the locations of DMUs. e95% confidence limit. fEstimates for DMU 273 were combined with estimates for DMU 073.
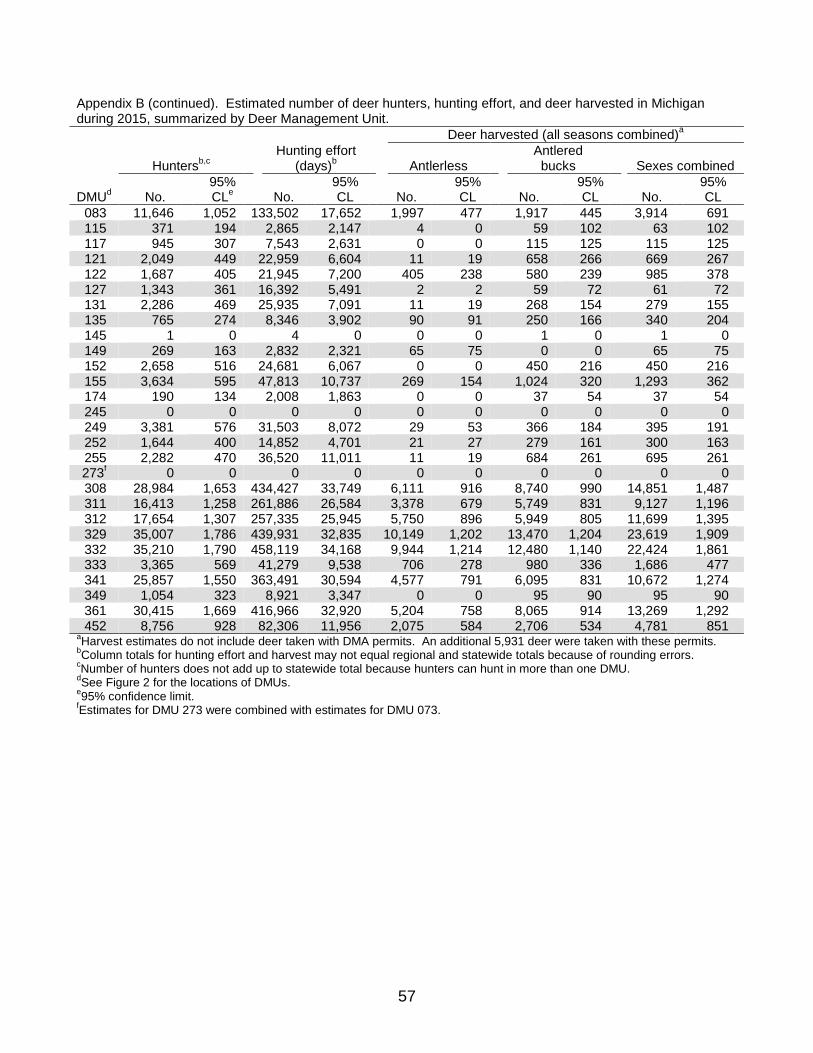
57
Appendix B (continued). Estimated number of deer hunters, hunting effort, and deer harvested in Michigan during 2015, summarized by Deer Management Unit.
DMUd
Huntersb,c Hunting effort
(days)b
Deer harvested (all seasons combined)a
Antlerless Antlered bucks Sexes combined
No. 95% CLe No.
95% CL No.
95% CL No.
95% CL No.
95% CL
083 11,646 1,052 133,502 17,652 1,997 477 1,917 445 3,914 691 115 371 194 2,865 2,147 4 0 59 102 63 102 117 945 307 7,543 2,631 0 0 115 125 115 125 121 2,049 449 22,959 6,604 11 19 658 266 669 267 122 1,687 405 21,945 7,200 405 238 580 239 985 378 127 1,343 361 16,392 5,491 2 2 59 72 61 72 131 2,286 469 25,935 7,091 11 19 268 154 279 155 135 765 274 8,346 3,902 90 91 250 166 340 204 145 1 0 4 0 0 0 1 0 1 0 149 269 163 2,832 2,321 65 75 0 0 65 75 152 2,658 516 24,681 6,067 0 0 450 216 450 216 155 3,634 595 47,813 10,737 269 154 1,024 320 1,293 362 174 190 134 2,008 1,863 0 0 37 54 37 54 245 0 0 0 0 0 0 0 0 0 0 249 3,381 576 31,503 8,072 29 53 366 184 395 191 252 1,644 400 14,852 4,701 21 27 279 161 300 163 255 2,282 470 36,520 11,011 11 19 684 261 695 261 273f 0 0 0 0 0 0 0 0 0 0 308 28,984 1,653 434,427 33,749 6,111 916 8,740 990 14,851 1,487 311 16,413 1,258 261,886 26,584 3,378 679 5,749 831 9,127 1,196 312 17,654 1,307 257,335 25,945 5,750 896 5,949 805 11,699 1,395 329 35,007 1,786 439,931 32,835 10,149 1,202 13,470 1,204 23,619 1,909 332 35,210 1,790 458,119 34,168 9,944 1,214 12,480 1,140 22,424 1,861 333 3,365 569 41,279 9,538 706 278 980 336 1,686 477 341 25,857 1,550 363,491 30,594 4,577 791 6,095 831 10,672 1,274 349 1,054 323 8,921 3,347 0 0 95 90 95 90 361 30,415 1,669 416,966 32,920 5,204 758 8,065 914 13,269 1,292 452 8,756 928 82,306 11,956 2,075 584 2,706 534 4,781 851
aHarvest estimates do not include deer taken with DMA permits. An additional 5,931 deer were taken with these permits. bColumn totals for hunting effort and harvest may not equal regional and statewide totals because of rounding errors. cNumber of hunters does not add up to statewide total because hunters can hunt in more than one DMU. dSee Figure 2 for the locations of DMUs. e95% confidence limit. fEstimates for DMU 273 were combined with estimates for DMU 073.

522 Questions continued on next page. PR2057-18 (Rev. 09/22/2015)
Michigan Department of Natural Resources – Wildlife Division PO Box 30030 Lansing MI 48909-7530
2015 MICHIGAN DEER HARVEST STUDY This information is requested under authority of Part 435, 1994 PA 451, M.C.L. 324.43539.
It is important that you return this questionnaire even if you did not hunt or harvest a deer. Please report only your hunting activities, and only report taking a deer if your kill
tag was attached to it. If you want to provide your answers via the internet, visit our website at https://secure1.state.mi.us/deersurvey.
1. Did you hunt deer in Michigan during the 2015 seasons? 1 Yes. 2 No. If you did not hunt deer, skip to Question #10.
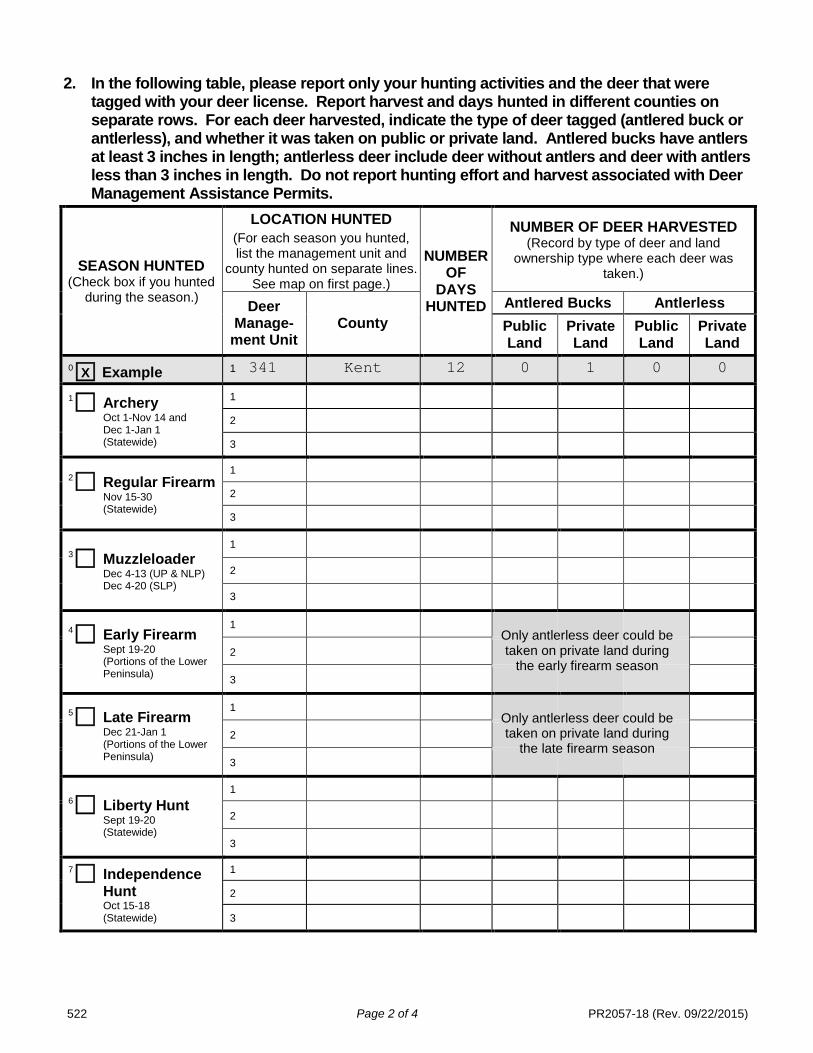
522 Page 2 of 4 PR2057-18 (Rev. 09/22/2015)
2. In the following table, please report only your hunting activities and the deer that were
tagged with your deer license. Report harvest and days hunted in different counties on separate rows. For each deer harvested, indicate the type of deer tagged (antlered buck or antlerless), and whether it was taken on public or private land. Antlered bucks have antlers at least 3 inches in length; antlerless deer include deer without antlers and deer with antlers less than 3 inches in length. Do not report hunting effort and harvest associated with Deer Management Assistance Permits.
SEASON HUNTED (Check box if you hunted
during the season.)
LOCATION HUNTED (For each season you hunted, list the management unit and
county hunted on separate lines. See map on first page.)
NUMBER OF
DAYS HUNTED
NUMBER OF DEER HARVESTED (Record by type of deer and land
ownership type where each deer was taken.)
Deer Manage-
ment Unit County
Antlered Bucks Antlerless Public Land
Private Land
Public Land
Private Land
0 X Example 1 341 Kent 12 0 1 0 0
1 Archery Oct 1-Nov 14 and Dec 1-Jan 1 (Statewide)
1 2 3
2 Regular Firearm Nov 15-30 (Statewide)
1 2 3
3 Muzzleloader Dec 4-13 (UP & NLP) Dec 4-20 (SLP)
1
2
3
4 Early Firearm Sept 19-20 (Portions of the Lower Peninsula)
1
2
3
5 Late Firearm Dec 21-Jan 1 (Portions of the Lower Peninsula)
1
2
3
6 Liberty Hunt Sept 19-20 (Statewide)
1
2
3 7 Independence
Hunt Oct 15-18 (Statewide)
1 2 3
Only antlerless deer could be taken on private land during
the early firearm season
Only antlerless deer could be taken on private land during
the late firearm season
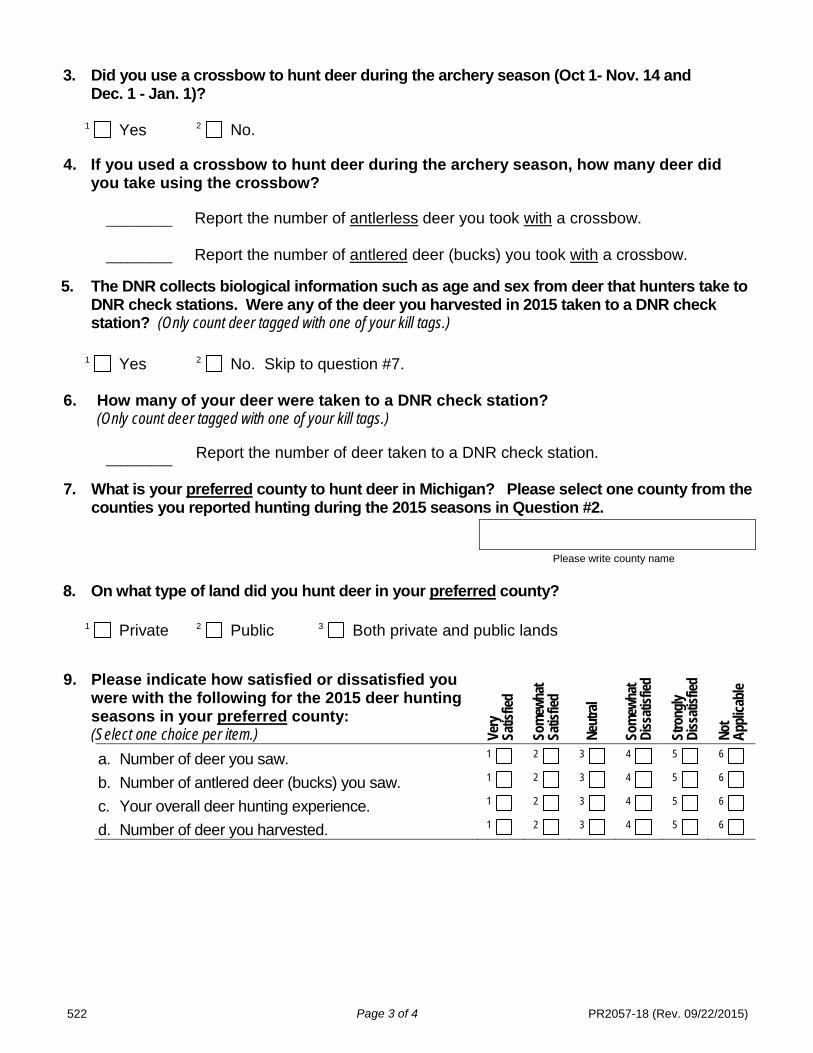
522 Page 3 of 4 PR2057-18 (Rev. 09/22/2015)
3. Did you use a crossbow to hunt deer during the archery season (Oct 1- Nov. 14 and
Dec. 1 - Jan. 1)?
1 Yes 2 No.
4. If you used a crossbow to hunt deer during the archery season, how many deer did you take using the crossbow?
_________ Report the number of antlerless deer you took with a crossbow.
_________ Report the number of antlered deer (bucks) you took with a crossbow.
5. The DNR collects biological information such as age and sex from deer that hunters take to DNR check stations. Were any of the deer you harvested in 2015 taken to a DNR check station? (Only count deer tagged with one of your kill tags.)
1 Yes 2 No. Skip to question #7.
6. How many of your deer were taken to a DNR check station? (Only count deer tagged with one of your kill tags.)
_________ Report the number of deer taken to a DNR check station.
7. What is your preferred county to hunt deer in Michigan? Please select one county from the counties you reported hunting during the 2015 seasons in Question #2.
Please write county name
8. On what type of land did you hunt deer in your preferred county?
1 Private 2 Public 3 Both private and public lands
9. Please indicate how satisfied or dissatisfied you were with the following for the 2015 deer hunting seasons in your preferred county: (Select one choice per item.) Ve
ry
Satis
fied
Some
what
Sa
tisfie
d
Neu
tral
Some
what
D
issati
sfied
Stro
ngly
Diss
atisfi
ed
Not
A
pplic
able
a. Number of deer you saw. 1 2 3 4 5 6 b. Number of antlered deer (bucks) you saw. 1 2 3 4 5 6 c. Your overall deer hunting experience. 1 2 3 4 5 6 d. Number of deer you harvested. 1 2 3 4 5 6
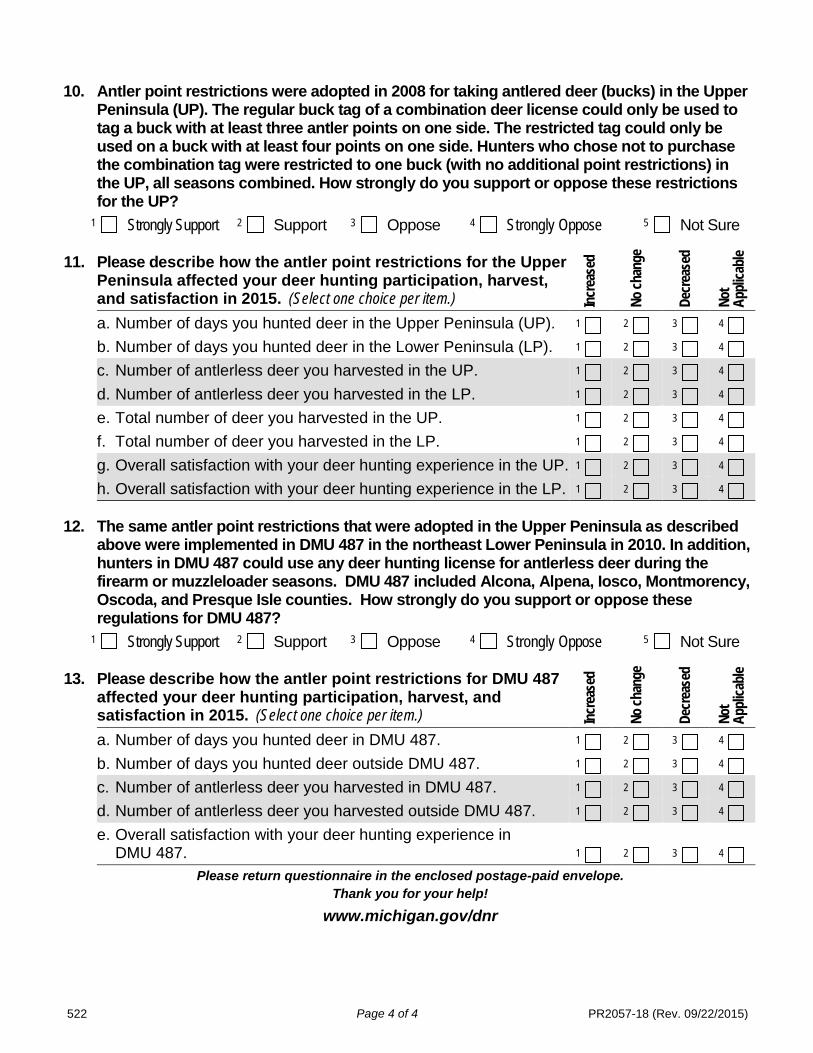
522 Page 4 of 4 PR2057-18 (Rev. 09/22/2015)
10. Antler point restrictions were adopted in 2008 for taking antlered deer (bucks) in the Upper Peninsula (UP). The regular buck tag of a combination deer license could only be used to tag a buck with at least three antler points on one side. The restricted tag could only be used on a buck with at least four points on one side. Hunters who chose not to purchase the combination tag were restricted to one buck (with no additional point restrictions) in the UP, all seasons combined. How strongly do you support or oppose these restrictions for the UP?
1 Strongly Support 2 Support 3 Oppose 4 Strongly Oppose 5 Not Sure
11. Please describe how the antler point restrictions for the Upper Peninsula affected your deer hunting participation, harvest, and satisfaction in 2015. (Select one choice per item.) In
crea
sed
No c
hang
e
Dec
reas
ed
Not
A
pplic
able
a. Number of days you hunted deer in the Upper Peninsula (UP). 1 2 3 4 b. Number of days you hunted deer in the Lower Peninsula (LP). 1 2 3 4 c. Number of antlerless deer you harvested in the UP. 1 2 3 4 d. Number of antlerless deer you harvested in the LP. 1 2 3 4 e. Total number of deer you harvested in the UP. 1 2 3 4 f. Total number of deer you harvested in the LP. 1 2 3 4 g. Overall satisfaction with your deer hunting experience in the UP. 1 2 3 4 h. Overall satisfaction with your deer hunting experience in the LP. 1 2 3 4
12. The same antler point restrictions that were adopted in the Upper Peninsula as described above were implemented in DMU 487 in the northeast Lower Peninsula in 2010. In addition, hunters in DMU 487 could use any deer hunting license for antlerless deer during the firearm or muzzleloader seasons. DMU 487 included Alcona, Alpena, Iosco, Montmorency, Oscoda, and Presque Isle counties. How strongly do you support or oppose these regulations for DMU 487?
1 Strongly Support 2 Support 3 Oppose 4 Strongly Oppose 5 Not Sure
13. Please describe how the antler point restrictions for DMU 487 affected your deer hunting participation, harvest, and satisfaction in 2015. (Select one choice per item.) In
crea
sed
No c
hang
e
Dec
reas
ed
Not
A
pplic
able
a. Number of days you hunted deer in DMU 487. 1 2 3 4 b. Number of days you hunted deer outside DMU 487. 1 2 3 4 c. Number of antlerless deer you harvested in DMU 487. 1 2 3 4 d. Number of antlerless deer you harvested outside DMU 487. 1 2 3 4 e. Overall satisfaction with your deer hunting experience in
DMU 487. 1 2 3 4 Please return questionnaire in the enclosed postage-paid envelope.
Thank you for your help!
www.michigan.gov/dnr