Embed Size (px)
Citation preview
2014 N.C. Water Resources Congress
October 30 • http://ncwrcongress.org/NC State University McKimmon Center

Jonathan Williams, PE (NC, SC, TX)
HDR Assistant Project Manager
9 years at HDR Structural engineering background
o Water/wastewater facilitieso Municipal infrastructure
Water supply planningo Regional & municipal water planningo Water supply permitting and licensingo Water quantity modelingo Contingency/emergency planningo Feasibility studieso Preliminary infrastructure engineering
Contact: [email protected]
© 2014 HDR, Inc., all rights reserved.
Picture or Color BlockPicture or Color Block
Catawba-Wateree Water Supply Master Plan

2006 Water Supply Study found maximum capacity of Catawba River Basin for water supply could be reached mid-century
Catawba-Wateree Water Management Group incorporated - December 2007
Water Supply Master Plan commissioned in 2010
Purpose of Master Plan is to find ways to extend the time before the capacity of the Basin is reached
Background
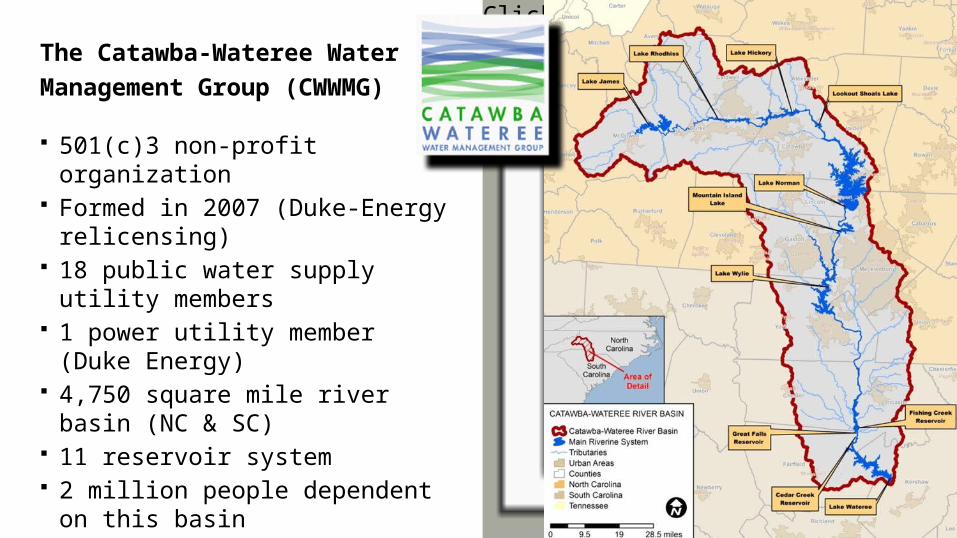
The Catawba-Wateree Water
Management Group (CWWMG)
501(c)3 non-profit organization Formed in 2007 (Duke-Energy relicensing) 18 public water supply utility members 1 power utility member (Duke Energy) 4,750 square mile river basin (NC & SC) 11 reservoir system 2 million people dependent on this basin Foothills of NC to Sandhills of SCMission:“to identify, fund, and manage projects that will help preserve, extend, and enhance the capabilities of the Catawba-Wateree River Basin to provide water resources for human needs while maintaining the ecological integrity of the waterway.”
Click icon to add picture

CWWMG Members City of Belmont, NC City of Camden, SC Catawba River Water Treatment Plant (Union County, NC &
Lancaster County Water and Sewer District, SC) Charlotte-Mecklenburg Utility Department, NC Chester Metropolitan District, SC Duke Energy Carolinas, NC & SC Two Rivers Utilities (Gastonia), NC Town of Granite Falls, NC City of Hickory, NC City of Lenoir, NC Lincoln County, NC Town of Long View, NC Lugoff-Elgin Water Authority, SC Town of Mooresville, NC City of Morganton, NC City of Mount Holly, NC City of Rock Hill, SC City of Statesville, NC Town of Valdese, NC http://www.catawbawatereewmg.org
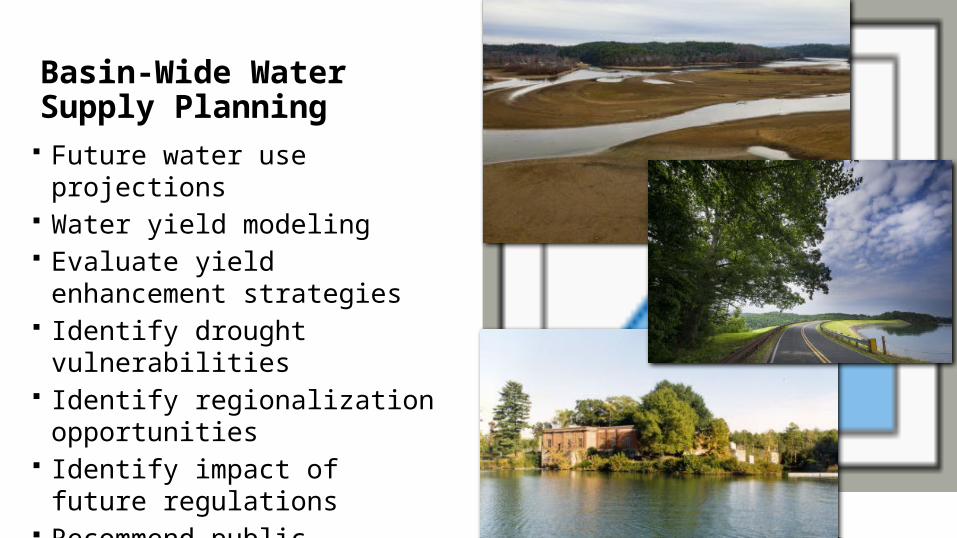
Basin-Wide Water Supply Planning
Future water use projections Water yield modeling Evaluate yield enhancement strategies Identify drought vulnerabilities Identify regionalization opportunities Identify impact of future regulations Recommend public outreach initiatives Recommend water quality modeling
initiatives
Click icon to add picture

Project was funded by: Duke Energy Foundation North Carolina Department of Environment and
Natural Resources
South Carolina Department of Natural Resources Catawba-Wateree Water Management Group
Acknowledgements/Thanks

Supplemental funding Stakeholder input Water use projections Refinement of hydrologic model Climate change impacts Develop & evaluate options Action plan and schedule Publish report Implementation, on-going public input Periodic future updates
Elements of the Master Plan
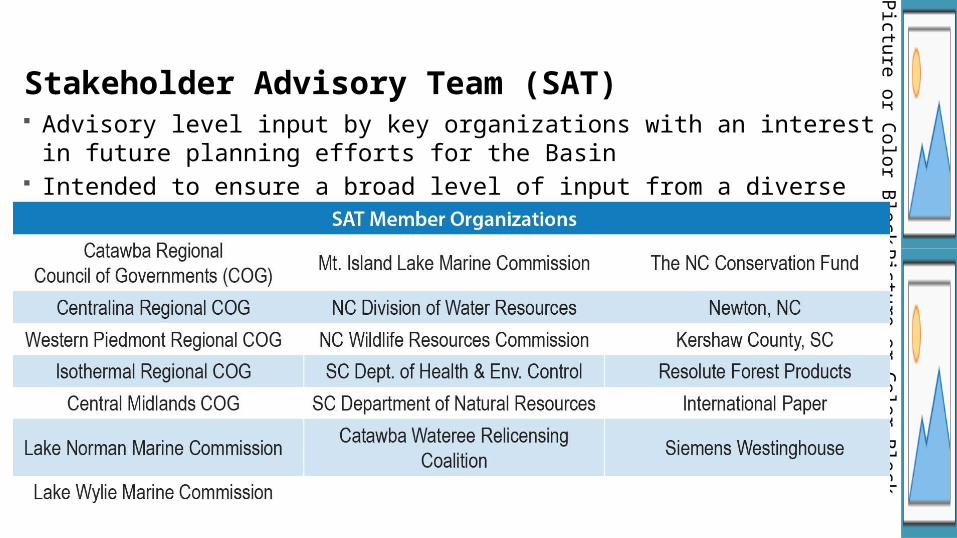
Advisory level input by key organizations with an interest in future planning efforts for the Basin Intended to ensure a broad level of input from a diverse group of interested stakeholders
Stakeholder Advisory Team (SAT)
Picture or Color BlockPicture or Color Block
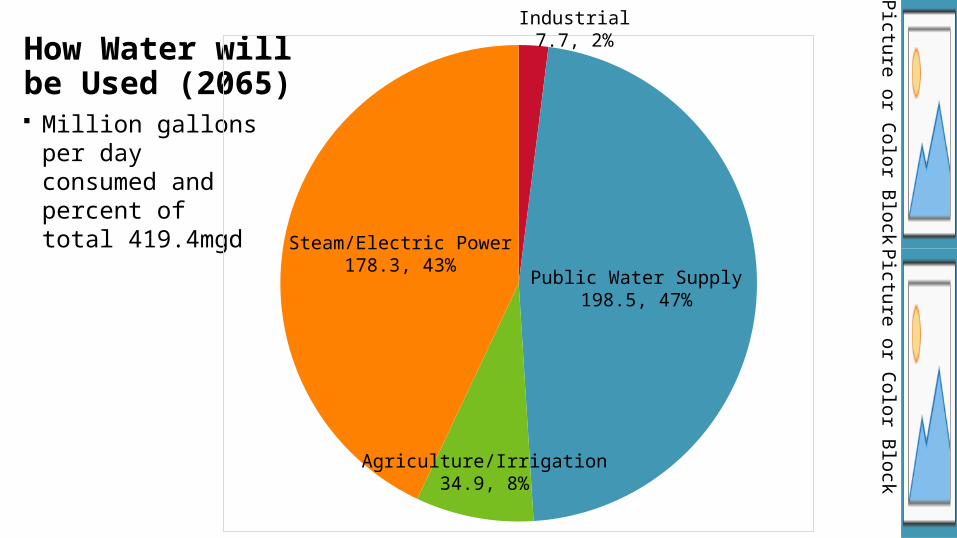
Million gallons per day consumed and percent of total 419.4mgd
How Water will be Used (2065)
Picture or Color BlockPicture or Color Block
Steam/Electric Power178.3, 43%
Industrial7.7, 2%
Public Water Supply198.5, 47%
Agriculture/Irrigation34.9, 8%

Water Use ProjectionsPicture or Color Block
Picture or Color Block
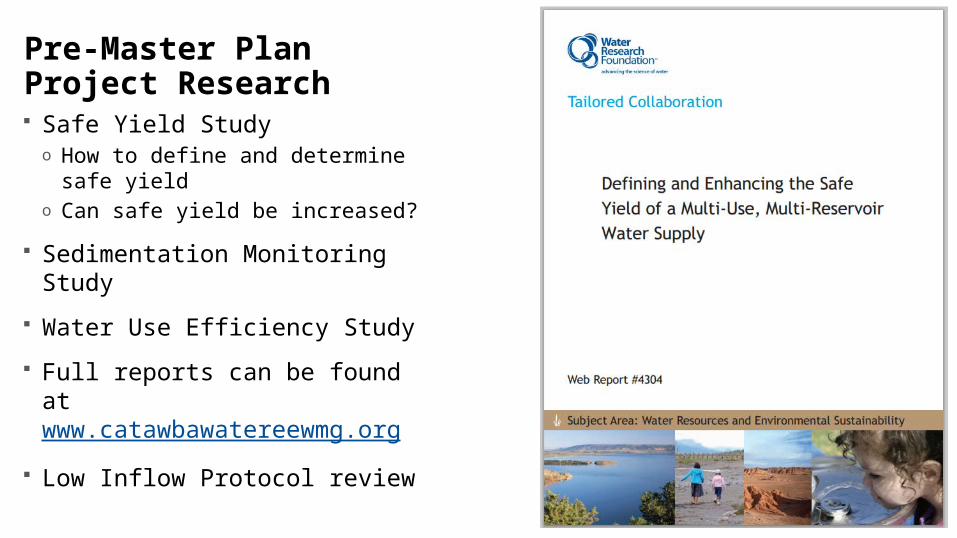
Safe Yield Studyo How to define and determine safe yieldo Can safe yield be increased?
Sedimentation Monitoring Study
Water Use Efficiency Study
Full reports can be found at www.catawbawatereewmg.org
Low Inflow Protocol review
Pre-Master Plan Project Research
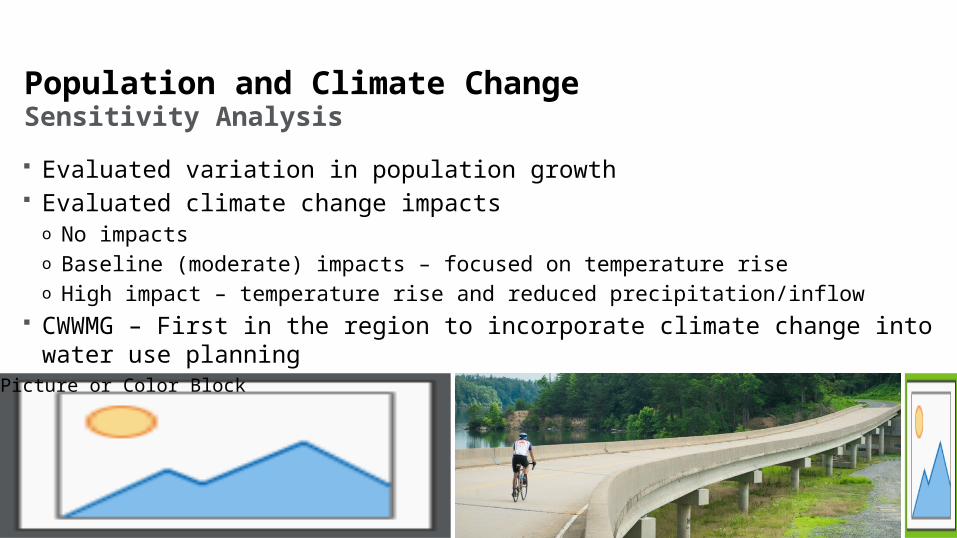
Sensitivity Analysis
Evaluated variation in population growth Evaluated climate change impacts
o No impactso Baseline (moderate) impacts – focused on temperature riseo High impact – temperature rise and reduced precipitation/inflow
CWWMG – First in the region to incorporate climate change into water use planning
Population and Climate Change
Picture or Color Block
Picture or Color Block

Playing the “What If?” Game with a Robust Water Model
Baseline Population growth Climate change Public water supplier water use changes (water use efficiency, reroute wastewater) Power consumptive water use changes (e.g. relocation of demand) New off-stream storage reservoirs Critical intake modifications Effluent flow recycling Modified reservoir operations Low Inflow Protocol (drought management plan) modifications
Individual and Integrated Future Planning Scenarios
Picture or Color BlockPicture or Color Block

Improve safe yield of the Basin by over 200 mgd
Extend water yield by 40 years
Results and Recommendations
Picture or Color BlockPicture or Color Block
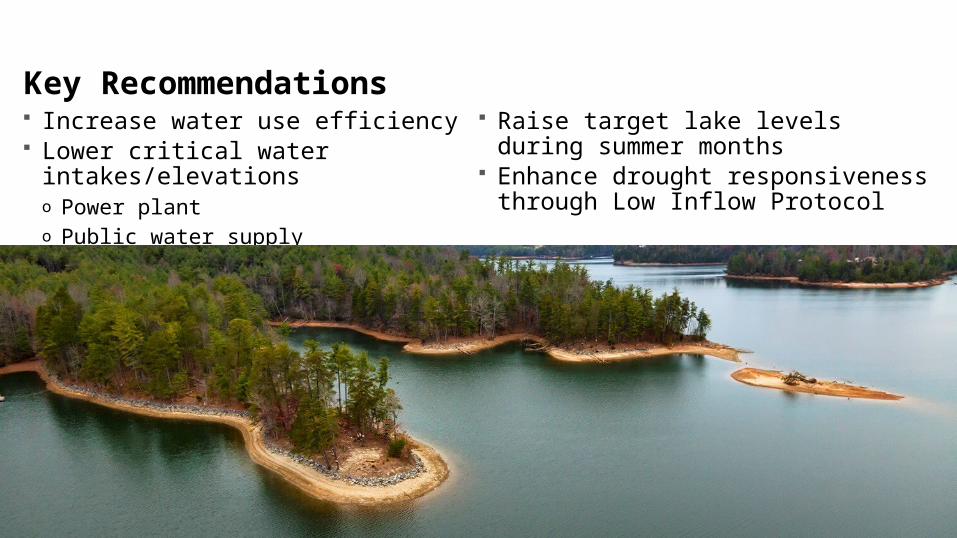
Increase water use efficiency Lower critical water intakes/elevations
o Power planto Public water supply
Raise target lake levels during summer months Enhance drought responsiveness through Low
Inflow Protocol
Key Recommendations

Example: average per capita use in the Charlotte-Mecklenburg systemo Current ~100 gallons/day/person (residential)o Recommended 2065 ~80 gallons/day/person (residential)
Water Use Efficiency RecommendationsPicture or Color Block
Picture or Color Block
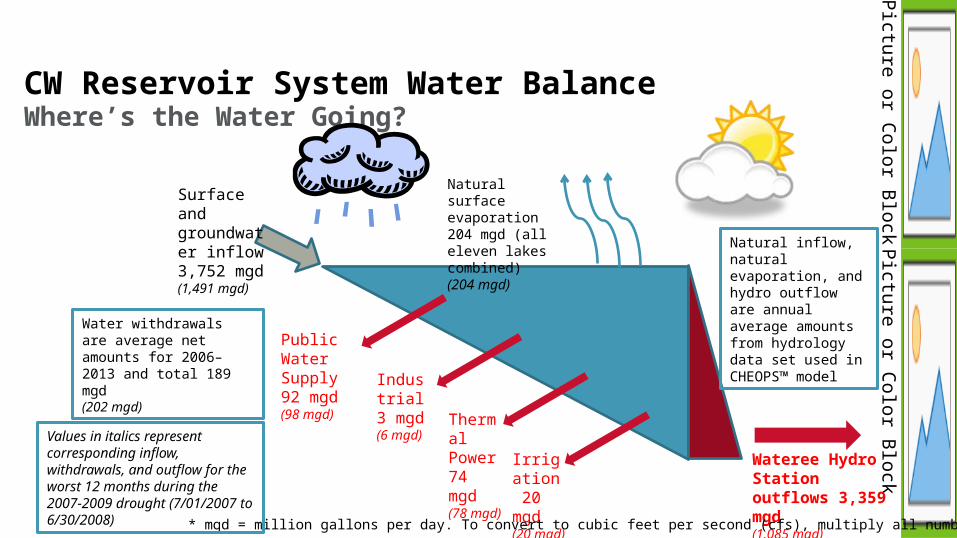
Where’s the Water Going?CW Reservoir System Water Balance
Picture or Color BlockPicture or Color Block
Wateree Hydro Station outflows 3,359 mgd(1,085 mgd)
Natural surface evaporation 204 mgd (all eleven lakes combined)(204 mgd)
Surface and groundwater inflow3,752 mgd(1,491 mgd)
Public Water Supply92 mgd(98 mgd)
Industrial3 mgd(6 mgd) Thermal
Power74 mgd(78 mgd)
Irrigation 20 mgd(20 mgd)
Water withdrawals are average net amounts for 2006–2013 and total 189 mgd (202 mgd)
Natural inflow, natural evaporation, and hydro outflow are annual average amounts from hydrology data set used in CHEOPS™ model
* mgd = million gallons per day. To convert to cubic feet per second (cfs), multiply all numbers by 1.5475
Values in italics represent corresponding inflow, withdrawals, and outflow for the worst 12 months during the 2007-2009 drought (7/01/2007 to 6/30/2008)
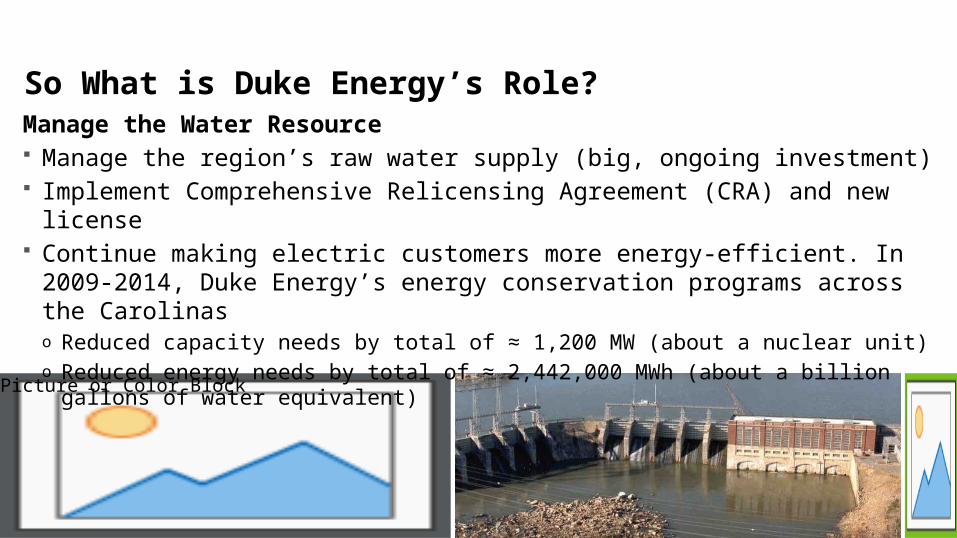
So What is Duke Energy’s Role?
Picture or Color Block
Picture or Color Block
Manage the Water Resource Manage the region’s raw water supply (big, ongoing investment) Implement Comprehensive Relicensing Agreement (CRA) and new license Continue making electric customers more energy-efficient. In 2009-2014, Duke Energy’s energy
conservation programs across the Carolinaso Reduced capacity needs by total of ≈ 1,200 MW (about a nuclear unit)o Reduced energy needs by total of ≈ 2,442,000 MWh (about a billion gallons of water equivalent)
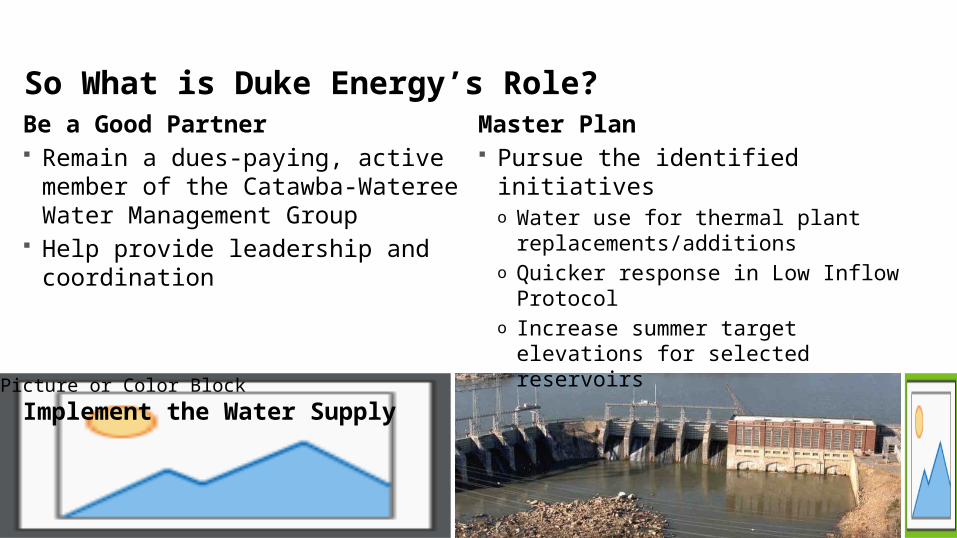
So What is Duke Energy’s Role?
Picture or Color Block
Picture or Color Block
Be a Good Partner Remain a dues-paying, active member of the
Catawba-Wateree Water Management Group Help provide leadership and coordination
Implement the Water Supply Master Plan Pursue the identified initiatives
o Water use for thermal plant replacements/additionso Quicker response in Low Inflow Protocolo Increase summer target elevations for selected
reservoirs
Picture or Color Block
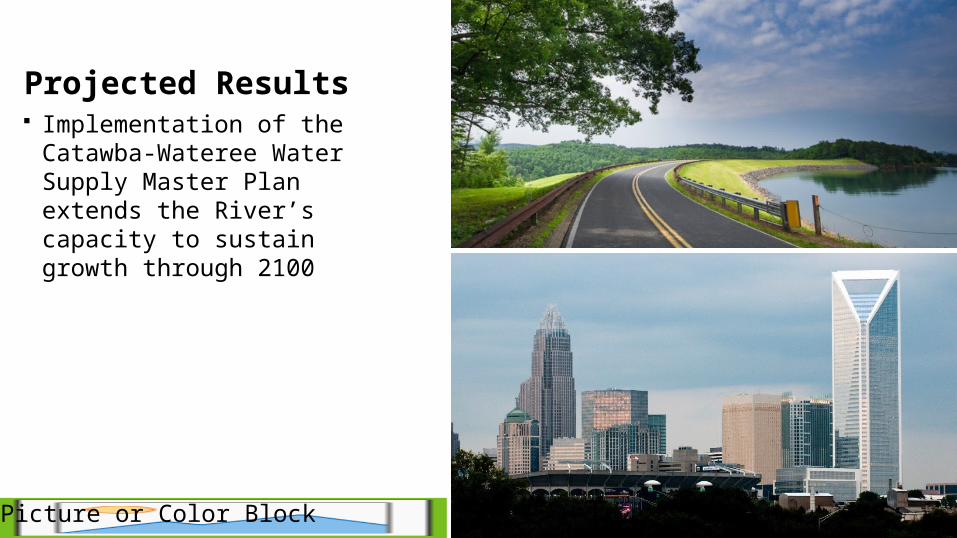
Implementation of the Catawba-Wateree Water Supply Master Plan extends the River’s capacity to sustain growth through 2100
Projected Results
Complete Water Supply Master Plan Report is available at www.catawbawatereewmg.org
Questions?