Embed Size (px)
Citation preview

2014 2013.4.1 2014.3.31
Issued in July 2014Printed in Japan
GranTokyo South Tower, 9-2, Marunouchi 1-chome,Chiyoda-ku, Tokyo, 100-6606, JapanPhone: 81-3-5533-7000 Fax: 81-3-5533-7077http://www.hitachi-chem.co.jp/english/index.html
2014
Annual Report 2014
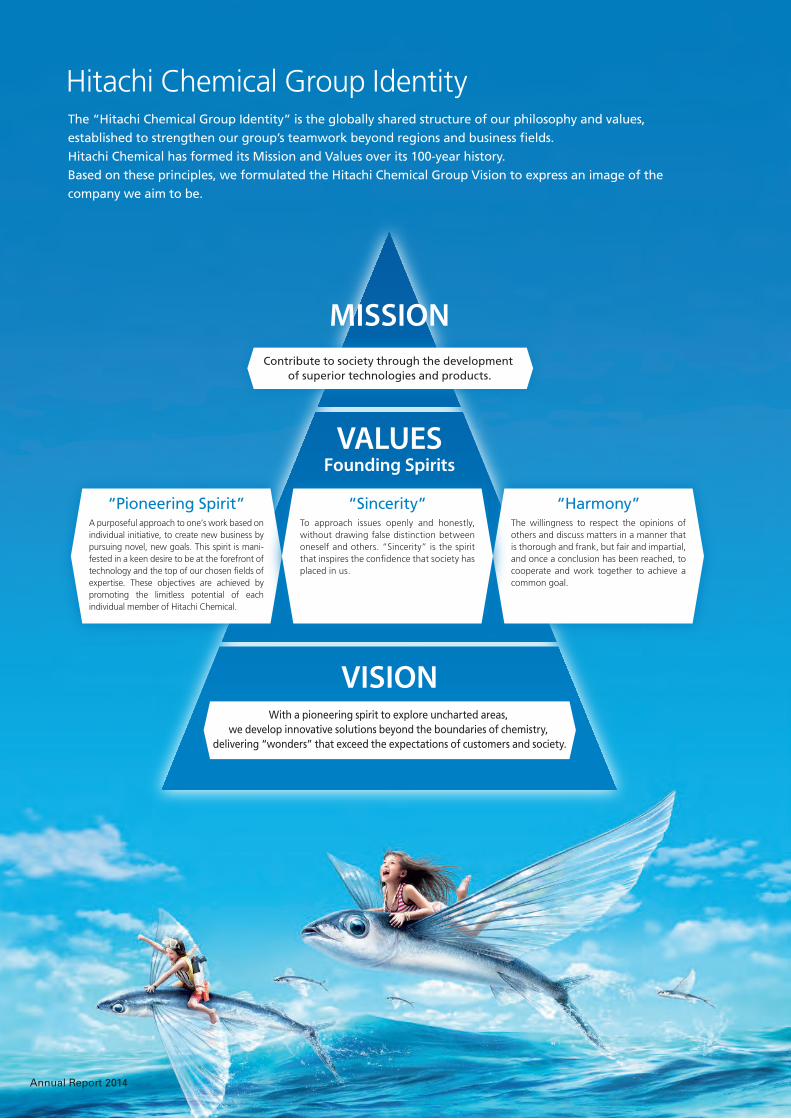
Hitachi Chemical Group IdentityThe “Hitachi Chemical Group Identity” is the globally shared structure of our philosophy and values, established to strengthen our group’s teamwork beyond regions and business fields.Hitachi Chemical has formed its Mission and Values over its 100-year history.Based on these principles, we formulated the Hitachi Chemical Group Vision to express an image of the company we aim to be.
VALUESFounding Spirits
VISION
Contribute to society through the development of superior technologies and products.
“Pioneering Spirit”A purposeful approach to one’s work based on individual initiative, to create new business by pursuing novel, new goals. This spirit is mani-fested in a keen desire to be at the forefront of technology and the top of our chosen �elds of expertise. These objectives are achieved by promoting the limitless potential of each individual member of Hitachi Chemical.
“Harmony”The willingness to respect the opinions of others and discuss matters in a manner that is thorough and frank, but fair and impartial, and once a conclusion has been reached, to cooperate and work together to achieve a common goal.
With a pioneering spirit to explore uncharted areas, we develop innovative solutions beyond the boundaries of chemistry,
delivering “wonders” that exceed the expectations of customers and society.
MISSION
“Sincerity”To approach issues openly and honestly, without drawing false distinction between oneself and others. “Sincerity” is the spirit that inspires the con�dence that society has placed in us.

02
Annual Report 2014
Organizations CoveredHitachi Chemical Co., Ltd. and its 58 consolidated subsidiaries
Subject notificationWhen the Hitachi Chemical Group as a whole is indicated, the terms “Hitachi Chemical,” “the Hitachi Chemical Group,” “the Group” and “consolidated” are used. In contrast, the terms “the Company” and “non-consolidated” refer to Hitachi Chemical Co., Ltd.
Period Covered by ReportFiscal year 2013 (April 1, 2013 to March 31, 2014)This report also contains information on activities of particular impor-tance prior to and after fiscal year 2013.
Please note that “fiscal year” or “FY” refers to the accounting year ending on March 31.
Guidelines Adopted with Respect to Non-financial InformationGlobal Reporting Initiative (GRI) Sustainability Reporting Guidelines Version 4.0 (G4)Environmental Reporting Guidelines 2012 version and Environmental Accounting Guidelines 2005 version issued by the Ministry of the En-vironment of Japan
Forward-looking StatementsIn addition to information of material fact regarding the past and pres-ent activities of Hitachi Chemical, this report contains forward-looking statements concerning future plans and forecasts. Forward-looking statements are based on currently available information as well as the Group’s assumptions and beliefs as of the date this report was issued. Accordingly, actual results and events may differ materially from for-ward-looking statements due to a variety of factors, including chang-es in operating conditions.
Status of Inclusion in IndicesHitachi Chemical is included in a number of domestic and international socially responsible investment (SRI) indices in recognition of the Com-pany’s established sustainability activity track record and constructive stance toward information disclosure. Please refer to page 34.
Editorial PolicyRecognizing that non-financial information integrated with financial data has played an increasingly important role in evaluating a compa-ny’s activities, Hitachi Chemical Co., Ltd. began issuing its Annual Re-port in a revised format that integrates both Annual and Sustainability Report components from Annual Report 2012. Our hope is that this Report will provide stakeholders with a deeper understanding of the Company’s economic, environmental and social activities that reflect the Hitachi Chemical Group Identity. With respect to content contained in this report, we have adopted a selective approach based on a materiality analysis. Please refer to pages 15 and 16. Detailed information is also posted on our website. Issued in both Japanese and English, we have supplemented the hard copy version with a PDF format posted on our homepage. The English report contains the Financial Section. For financial data in Japa-nese, readers are directed to the Company’s Securities Report.
Top Message 3
Special Feature 1
Hitachi Chemical’s Solutions for Resolution of Social Issues
9
Special Feature 2
Stakeholders’ Dialogue:Contributing to Society by Resolving Social Issues with Integrating Business Strategies and CSR
11
Hitachi Chemical’s Value Creation Process 15
Inputs 17
Hitachi Chemical Business Activities 19
Strengthening Material Technology Capabilities 21
Global Business Expansion 23
Creating New Businesses and Products 25
Promotion of Sustainable Engineering 26
Delivering Safe and Easy-to-use Products 27
Supply-chain Management 28
Engaging in Environmental Management 29
Intellectual Property Strategy 30
Development and Evaluation of Globally-competitive Human Resources
31
Diversity Management 32
Working On Wonders Beyond Boundaries (WOW-BB) Activities
33
Interactive Communication with Stakeholders 34
Hitachi Chemical Products and Services (Outputs)
35
Providing Value to Stakeholders 39
Corporate Governance 41
Financial Section 45
CONTENTS
Various Communication Tools
Corporate Website
http://www.hitachi-chem.co.jp/
english/index.html
Company Brochure
http://www.hitachi-chem.co.jp/english/
company/company_b.html
Company’s Securities Report
http://www.hitachi-chem.co.jp/
japanese/ir/jar1.html
(Japanese)
(Japanese)Business Report for Domestic
Shareholders
http://www.hitachi-chem.co.jp/
japanese/ir/jar2.html

03
Annual Report 2014
President and Chief Executive OfficerKazuyuki Tanaka
We create new value by developing
products and technologies
that contribute to the resolution of
social issues.
Top Message

04
Annual Report 2014
Hitachi Chemical marked the anniversary of its 50th year in business in 2012. We took the opportunity to hold communica-tion workshops with all of our approximately 17,000 employees (at the time), in order to give every member of the corporate group around the world a better understanding of the Hitachi Chemical Group, and to reaffirm our commitment as a group to realizing our Mission. The Executive Officers leading this effort discussed at length the goals for Hitachi Chemical for the next 50 years, and how to achieve them. Their thoughts were compiled as a management message. During the communica-tion workshops we held discussions based on this message, and received a wide range of opinions from employees regarding the next half century. Through this process we created the Hitachi Chemical Group Identity, based on our Mission to “contribute to society through the development of superior technologies and products.” Our first objective is to expand our business scope beyond solely focusing on chemistry. Drawing on our core competence
in materials technology, we will actively expand into beyond-chemical fields, such as control systems for energy storage devices systems, and create new value for the future. The next objective is to exceed expectations by offering unique and original value to our customers and society. Instead of just meeting customer needs, we will deeply cultivate materials technologies to more proactively offer “wonders.” Finally, through constant self-reformation, we will contin-ually reinvent ourselves in order to stay at the forefront of the ever-changing market. These efforts constitute the Hitachi Chemical Group Vision stipulating our aspirations for the future. Combining this with our Mission and the “Founding Spirits (Values)” inherited from Hitachi, Ltd. we established the Hitachi Chemical Group Identity. This Identity is the systematization of the philosophy and values that we should share as a global corporation.
The “Hitachi Chemical Group Identity” was created in March 2014. What was the process and thinking behind this philosophy?Q1
Related information: P.1
The two priority measures in the Medium-term Management Plan are to strengthen material technologies in high-end fields in order to generate differentiated products and expand business globally, and to strengthen our foundation through structural reform. Through these complementary measures, we aim to increase revenue and earnings. Our target for fiscal year 2015 is net sales of ¥600 billion, with an operating income margin over 10%. The targets for this first year of the plan (fiscal year 2013), were net sales of ¥500 billion, with an
operating income margin of 6.2% Our performance for fiscal year 2013 was supported by favorable business conditions, including firm consumer spending on the back of economic measures, taken by the Japanese Government and the weaker yen which boosted exports. We achieved increases in both revenue and earnings, but fell short of our targets, posting net sales of ¥493,766 million (+6.3% compared with the previous FY), with oper-ating income of ¥27,775 million (+17.9%), for an operating
Fiscal year 2013 was the first year of the Medium-term Management Plan (fiscal years 2013–2015). What is your assessment of the business results?
Q2
Hitachi Chemical Group Identity
MissionContribute to society through the development of superior technologies and products.
Hitachi Chemical Group VisionWith a pioneering spirit to explore uncharted areas, we develop innovative solutions beyond the boundaries of chemistry, delivering “wonders” that exceed the expectations of customers and society.
Founding Spirits “Pioneering Spirit” “Sincerity” “Harmony”
The Mission that the Hitachi Chemical Group aspires to ful�ll in society.
The values that the Hitachi Chemical Group requires in order to accomplish its Mission.
What the Hitachi Chemical Group aims to become in the near future.
MISSION
VALUES
VISION
Top Message

Basic Policies and Strategies of the Medium-term Management Plan
Reflections on Fiscal Year 2013
05
Annual Report 2014
margin of 5.6%. In the Functional Materials segment, core demand in the electronics materials field is shifting from computers and LCD televisions to smartphones and tablets. Since the products are smaller, less material is used, and the demand for materials does not keep pace with growth in unit sales. Also, the sales have been slow for touch panel peripheral materials, an area we have focused on in recent years, because of a drop in demand from certain customers, and delays in bringing out new products. In the Advanced Components and Systems segment, since fiscal year 2011 we have been increasing our production
capacity with new overseas production sites, mainly for the automobile products field. We had expected to begin reaping the benefits from these investments in fiscal year 2013, but so far the gains have been less than we would like, and we need to further expand sales. The energy storage devices field is an area that is expected to grow in the future, and we have expanded our production capacity for large-scale lithium-ion batteries to more than four times the previous level, putting in place a production structure that will allow us to immediately handle large projects. At this point, however, these are still up-front investments, and depreciation has been a considerable burden.
Achieve revenue and income growth by differentiating high-end products with material technologies
and expanding on the global stage
Strengthen organizational structure through structural reforms
Business Strategies:
Growth Strategies
Cost Structure Reforms
High functional materials
Implement reforms from the perspectives of both business structures and work�ow processes
Improve pro�tability by differentiating high-end products with material technologies as a revenue growth driver and expand product sales overseas
Target position as a global supplier, improve pro�tability by increasing overseas production, expand overseas sales channels, and accelerate development of next-generation products
Automotive products
Accelerate growth in the global market and establish operating foundations for full-�edged growth starting in the �scal year ending March 31, 2017, as a future mainstay business
Develop track record in diagnostics �eld as a future base business and explore potential of new business areas
Revise research portfolio to contribute to the development of new businesses
Stringently select investment themes that will directly generate earnings (Introduce ROIC as an investment management index)
Energy storage devices
Life sciences
R&D Strategies:
Investment Strategies:
Failure to Meet Sales and Income Targets in the Plan’s First Year
Net Sales
1
Delayed Response to Overseas Investment2
Reorganization of Group Companies (Hitachi Powdered Metals, Hitachi Kasei Shoji), Business Structure Improvement (Domestic Electronic Components and Overseas Printed Wiring Board Operations)
3
Touch panel peripheral materials: Sluggish sales of a part of products as well as delayed contributions of othersAutomotive products: Unsatisfactory performance by Thai base (declining automotive sales and low export demand in Thailand)
2012Actual
464.7493.8500.0
23.6 27.827.831.031.0
2013Actual
2013Targets announced
in April 2013
(FY)
(Billions of yen)
Net sales
Operating income
Operating IncomeFunctional Materials segment: Low sales volume growthAdvanced Components and Systems segment: Luck of success in meeting the operating income target and delayed cost reduction resulted from lower productivity of certain products
Hitachi Chemical’s mission is to provide products and services that help resolve the issues facing society. We are a corporate group that works behind the scenes. Fields related to Hitachi Chemical’s business that have attracted considerable interest in recent years include envi-ronment and energy, and life sciences. For environment and energy, we are focusing on the energy storage devices busi-ness. Renewable energy has received much attention since the Fukushima nuclear plant accident, but supply stability and other advancements are necessary for widespread adoption.
Solar and wind power stations are subject to the weather and the amount of energy they produce varies considerably depending on weather conditions. If these fluctuations are directly sent to the network, low energy volume increases the risk of blackout, and when supply exceeds demand there is potential for damage to the distribution network. These prob-lems can be resolved by combining renewable power facilities with storage devices to collect excess energy when supply is high, and provide it when supply is low. Power generated from renewable energy is still a small portion of the total. The
Q3
Related information: P.10
Can you elaborate on the objective of offering unique and original value to customers and society?
Top Message

The Growth Strategies of Energy Storage Devices
06
Annual Report 2014
American, European and Japanese markets are expected to be particularly large. We expect the energy storage devices business to be-come our third core business pillar alongside high functional materials and automotive products. Along with automobile lead-acid storage batteries, we plan to develop the industrial lead-acid and lithium-ion batteries essential for the effective utilization of renewable and other types of energy, and fur-
ther expand our business with system development. Industrial lithium-ion batteries are being tested for various applications in Japan and around world, and in some cases are already in practical use. These include mitigating fluctu-ations in output from solar and wind power stations, as well as in factories and buildings to lessen peak power use periods and provide emergency backup power.
Hitachi Chemical’s life sciences business has up to this point focused primarily on diagnostic agents and related systems. The new allergy diagnostic agent we launched this year, MAST III, is capable of measuring many types of allergens simultaneously with just a small amount of blood at one time. In Japan, because the number of children with food allergies is increasing, this is an effective product to help doctors diag-nose such food allergies. Japan is also facing the situation of a low birthrate and aging population, thus rising medical costs are a major problem. Preventing illness and early diagnosis are important ways to address these concerns. The Point-of-Care Testing (POCT) system offered by Hitachi Chemical allows
biochemical and immunological tests, which previously could only be conducted at hospitals and facilities with the proper equipment, to be done at the point of care. Doctors can immediately review the results, promptly provide treat-ment, and monitor the process and results. Going forward, to enhance patients’ quality of life we are also working on realizing “tailor-made” medicine utilizing genetic testing, and developing products for early detection of cancer metastasis.
Our R&D strategy is to concentrate resources in new fields such as environment and energy, and life sciences. We are also taking steps to strengthen fundamental technologies such as development of new resins and analytical techniques, with the aim of establishing new businesses. We invested 5.3% of sales as R&D expenditures during fiscal year 2013. One example of R&D that led to product
commercialization is how we leveraged our expertise in or-ganic chemistry to develop high-performance energy storage devices. During fiscal year 2014, we will accelerate the pro-cess of business commercialization by shifting more corporate research personnel to the environment and energy sector. For R&D of core technologies, we will continue to train and develop researchers internally. However, because of
What is Hitachi Chemical pursuing in life sciences?
What are your strategies and advancements in R&D?
Q4
Q5
Accelerate overseas sales of batteries for new cars and replacement batteries, further global expansion, and strengthen marketing as base businessAccumulate local production knowledge
Leverage industrial lead-acid battery sales channels in marketing effortsParticipate in veri�cation testing for renewable energy sourcesDrastically reduce costs and develop cost reduction measures by utilizing material technologies
Reduce costs by leveraging automotive-use lead-acid battery manufacturing expertise and shorten development times for production processes
Develop third core businessGrow energy storage devices business into a 3rd core business for the Group by 2020
Automotive-uselead-acid batteries
Industrial lead-acid batteries
Industrial lithium-ionbatteries
Clinical Analyzer
Related information: P.9–10
Related information: P.25
Top Message

Corporate R&D Staff Allocation
Cost Structure Reforms
07
Annual Report 2014
Expanding the global business will require not only success with technical capabilities but also enhancing the efficiency of our business investments. As part of this effort, we have introduced ROIC and begun managing the investment efficiency of our main businesses. The product lifecycle and other factors vary by business, prohibiting a uniform standard for assessing investment efficiency. In electronics,
for example, the lifecycle change is fast, so if we do not set a high hurdle and raise the return we cannot continue to invest. For automobiles, however, the same materials and components are used for a set period until the next full model change. Incorporating such factors, we aim to maintain an ROIC hurdle rate higher than the industry average.
Along with growing our businesses, we are reforming the cost structure to ensure robust management. Our cost of sales is currently 75.8%, and we aim to improve that to 74% by fiscal year 2015. Similarly, we plan to lower our SG&A ratio from the current 18.6% to 16% within the same timeframe,
and achieve an operating income margin of at least 10%. To achieve this we will reform all operational processes, not only business divisions but also R&D and administrative divisions such as human resources and finance.
Why did you decide to include return on invested capital (ROIC) as an indicator from the Medium-term Management Plan?Q6
Q7
the need to diversify research themes and the faster pace of development, it is ineffective for us to handle everything ourselves. Accordingly, we will further accelerate our efforts through our use of open innovation. Opportunities to search
for the technologies necessary to develop new products are in demand around the world, and incorporating Hitachi Chemical’s technologies can help producers to get ahead of the competition to bring new products to market.
¥600.0 billion¥525.0 billion¥493.8 billionNet sales
Operating income
Cost of sales
SG&A expenses
2013 Actual 2014 Planned 2015 Planned(FY)
Business Structure Reforms
Work�ow Process Reforms
Targets
Strengthen new businesses and new products
Shift operations abroad
Address products lacking pro�tability
Reduce operators by utilizing robots
Promote Group purchasing and procurement engineering
Expand logistics outsourcing
Standardize and rationalize sales and order receipt processes
Create global standards for administrative functions, outsourcing a portion of these functions
18.6%
75.8%
5.6%
18%
75%
7%
16%
74%
Over10%
61%
34%
3%
2009 Actual
Telecommunication & Displays
2%
47%
26%
24%
2013 Actual
3%30%
50%
10%
2015 Planned (FY)
10%
Environment & Energy
Life Sciences
Core Technologies, etc
Related information: P.21–22
What progress have you made in the cost structure reforms?
Top Message
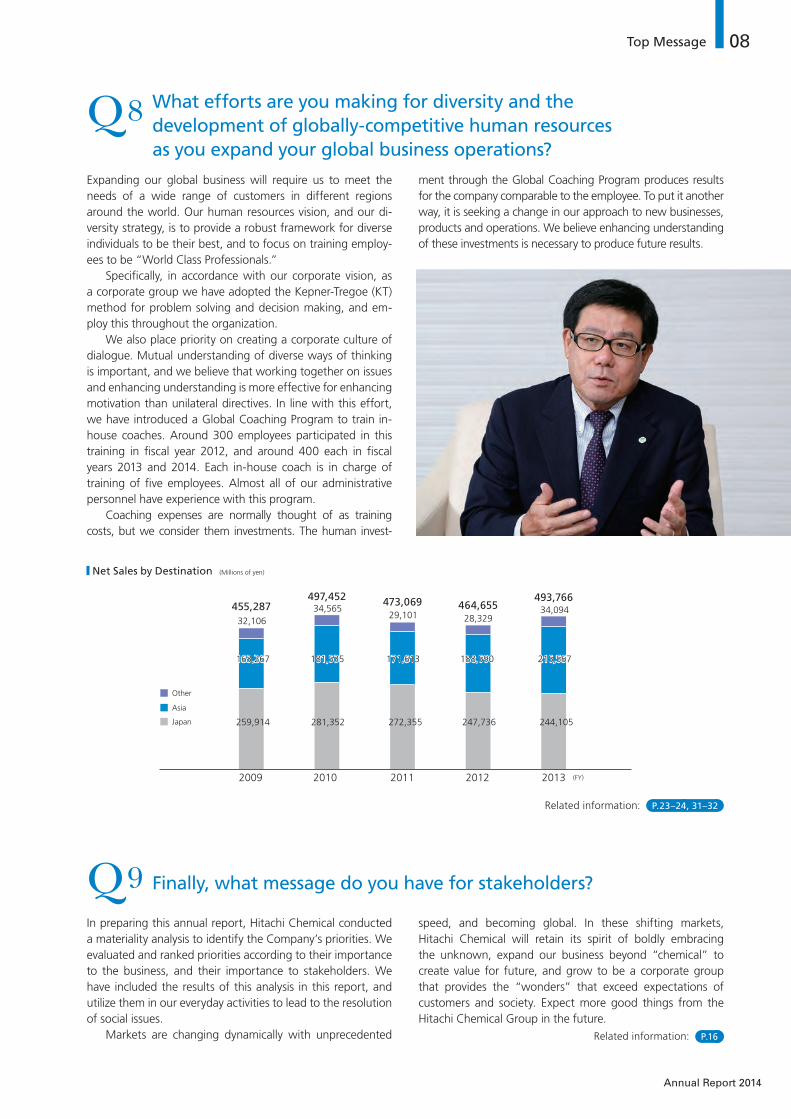
2009 2010 2011 20132012 (FY)
Other
Asia
Japan 259,914 281,352 272,355 247,736 244,105
163,267 163,267 181,535 181,535 171,613 171,613 188,590 188,590 215,567215,567
32,106 32,106 34,565 34,565
29,101 29,101 28,329 28,329 34,09434,094455,287
497,452 473,069 464,655493,766
Net Sales by Destination
08
Annual Report 2014
Expanding our global business will require us to meet the needs of a wide range of customers in different regions around the world. Our human resources vision, and our di-versity strategy, is to provide a robust framework for diverse individuals to be their best, and to focus on training employ-ees to be “World Class Professionals.” Specifically, in accordance with our corporate vision, as a corporate group we have adopted the Kepner-Tregoe (KT) method for problem solving and decision making, and em-ploy this throughout the organization. We also place priority on creating a corporate culture of dialogue. Mutual understanding of diverse ways of thinking is important, and we believe that working together on issues and enhancing understanding is more effective for enhancing motivation than unilateral directives. In line with this effort, we have introduced a Global Coaching Program to train in-house coaches. Around 300 employees participated in this training in fiscal year 2012, and around 400 each in fiscal years 2013 and 2014. Each in-house coach is in charge of training of five employees. Almost all of our administrative personnel have experience with this program. Coaching expenses are normally thought of as training costs, but we consider them investments. The human invest-
ment through the Global Coaching Program produces results for the company comparable to the employee. To put it another way, it is seeking a change in our approach to new businesses, products and operations. We believe enhancing understanding of these investments is necessary to produce future results.
In preparing this annual report, Hitachi Chemical conducted a materiality analysis to identify the Company’s priorities. We evaluated and ranked priorities according to their importance to the business, and their importance to stakeholders. We have included the results of this analysis in this report, and utilize them in our everyday activities to lead to the resolution of social issues. Markets are changing dynamically with unprecedented
speed, and becoming global. In these shifting markets, Hitachi Chemical will retain its spirit of boldly embracing the unknown, expand our business beyond “chemical” to create value for future, and grow to be a corporate group that provides the “wonders” that exceed expectations of customers and society. Expect more good things from the Hitachi Chemical Group in the future.
What efforts are you making for diversity and the development of globally-competitive human resources as you expand your global business operations?
Finally, what message do you have for stakeholders?
Q8
Q9
(Millions of yen)
Related information: P.16
Related information: P.23–24, 31–32
Top Message
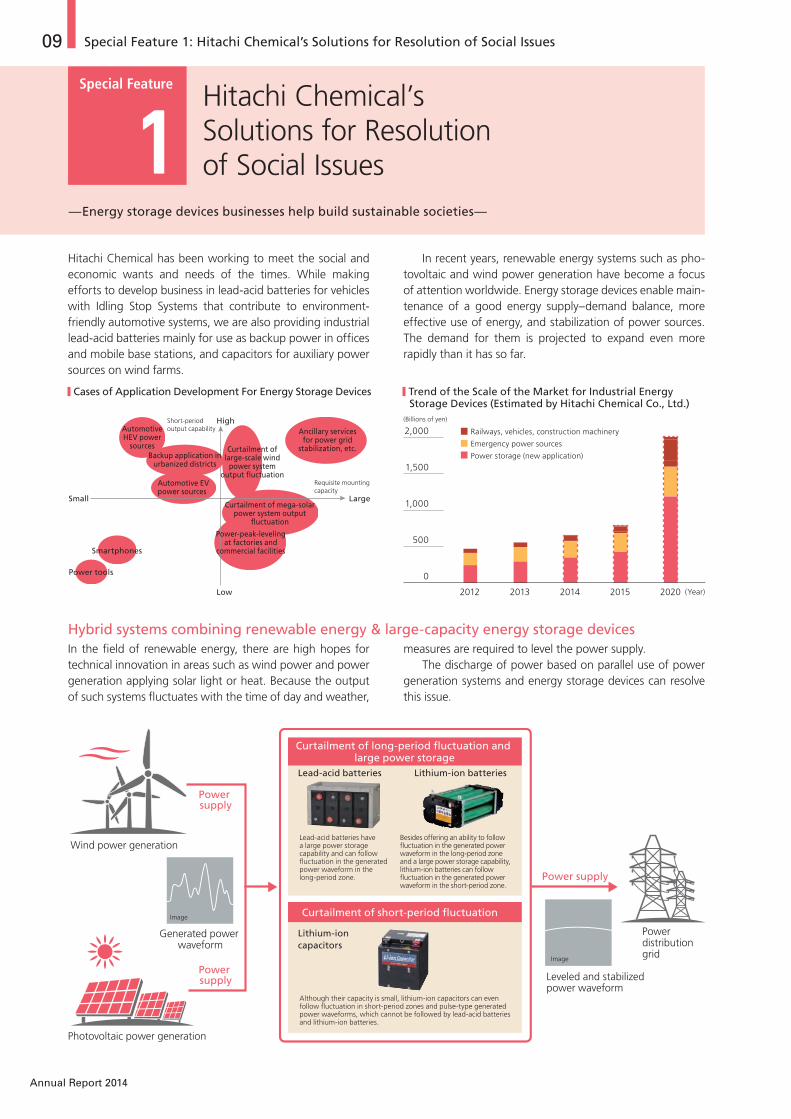
Cases of Application Development For Energy Storage Devices Trend of the Scale of the Market for Industrial Energy Storage Devices (Estimated by Hitachi Chemical Co., Ltd.)
Wind power generation
Generated power waveform
Power supply
Power supply
Power supply
Photovoltaic power generation
Leveled and stabilized power waveform
Power distributiongridImage
Image
Lead-acid batteries Lithium-ion batteries
Lithium-ion capacitors
Curtailment of short-period �uctuation
Curtailment of long-period �uctuation and large power storage
Lead-acid batteries have a large power storage capability and can follow �uctuation in the generated power waveform in the long-period zone.
Besides offering an ability to follow �uctuation in the generated power waveform in the long-period zone and a large power storage capability, lithium-ion batteries can follow �uctuation in the generated power waveform in the short-period zone.
Although their capacity is small, lithium-ion capacitors can even follow �uctuation in short-period zones and pulse-type generated power waveforms, which cannot be followed by lead-acid batteries and lithium-ion batteries.
High
Low
Small Large
Requisite mounting capacity
Automotive EV power sources
Power tools
Smartphones
Automotive HEV power
sources
Short-period output capability
Power-peak-leveling at factories and
commercial facilities
Backup application in urbanized districts
Curtailment of mega-solar power system output
�uctuation
Ancillary services for power grid
stabilization, etc.Curtailment of large-scale wind
power system output �uctuation
0
500
1,000
1,500
2,000
2012 2013 2014 2015 2020
Railways, vehicles, construction machinery
Emergency power sources
Power storage (new application)
(Billions of yen)
(Year)
09
Annual Report 2014
—Energy storage devices businesses help build sustainable societies—
Hybrid systems combining renewable energy & large-capacity energy storage devicesIn the field of renewable energy, there are high hopes for technical innovation in areas such as wind power and power generation applying solar light or heat. Because the output of such systems fluctuates with the time of day and weather,
measures are required to level the power supply.The discharge of power based on parallel use of power
generation systems and energy storage devices can resolve this issue.
Hitachi Chemical has been working to meet the social and economic wants and needs of the times. While making efforts to develop business in lead-acid batteries for vehicles with Idling Stop Systems that contribute to environment-friendly automotive systems, we are also providing industrial lead-acid batteries mainly for use as backup power in offices and mobile base stations, and capacitors for auxiliary power sources on wind farms.
In recent years, renewable energy systems such as pho-tovoltaic and wind power generation have become a focus of attention worldwide. Energy storage devices enable main-tenance of a good energy supply–demand balance, more effective use of energy, and stabilization of power sources. The demand for them is projected to expand even more rapidly than it has so far.
Special Feature
1Special Feature 1: Hitachi Chemical’s Solutions for Resolution of Social Issues
Hitachi Chemical’s Solutions for Resolution of Social Issues

Sales Plan for Hitachi Chemical’s Energy Storage Devices Business
Lead-acid batteries
Lithium-ion capacitors
Industrial lithium-ion batteries
Condensers (capacitors)
Automotive
16 serial module 32 serial module Aluminum electrolytic capacitor Plastic film capacitor
Industrial Standby use Cycle use
10
Annual Report 2014
Participation in a demonstration test in the United States of a container-type energy stor-age system to assist extensive input of photovoltaic and wind power generation systems
The lithium-ion batteries developed by Hitachi Chemical are used in a container-type energy storage system devel-oped by Hitachi, Ltd.
Named “CrystEna,” this system package entered a demonstration test in the United States in June 2014. This test anticipates the market associated with frequency adjustment (ancillary service) and capacity there.
In the United States, photovoltaic systems, wind turbines and other types of power generation utilizing renewable energy are in extensive diffusion. However, the output of such systems is marked by a certain instability, and there are apprehensions about the adverse influence of output fluctuation on maintenance of frequency.
For this reason, studies are being made of systems to adjust frequency and capacity through the use of grid energy storage systems installed to keep the power gen-eration grid stable.
Hitachi’s CrystEna is a grid energy storage system de-signed to serve as the core of the overall system for stor-age of energy. It consists of lithium-ion batteries brought to the level of practical utilization by Hitachi Chemical, and control systems, power conditioning systems (PCS)and other components developed by Hitachi, Ltd.
The data from the demonstration test in the United
States will provide the basis for efforts to further heighten the economic merit of lithium-ion batteries by lengthen-ing service life, improving performance and making the design more compact.
40.7
72.7
110.0
75.0
32.0 35.0
2013 Actual 2015 Planned 2020 Targeted (FY)
(Billions of yen)
Aiming for a 10% share of the
global market
Industrial use
Automotive
Four types of energy storage devices in the hands of Hitachi ChemicalThrough its many years of activity in the field, Hitachi Chem-ical has accumulated an immense repository of materials and design technology and know-how related to energy storage devices. We are drawing on this repository in efforts to make such devices a third pillar of our business alongside electron-ics materials and automotive products.
Our business is set apart from that of other firms by our possession of four types of energy storage devices: lead-acid batteries, lithium-ion batteries, lithium-ion capacitors and condensers (capacitors).
We have the ability to offer hybrid systems applying two or more of these devices, with optimal designs for the needs of each customer.
Lithium-ion batteries have better features than lead-acid batteries in respects including a high short-period output, long service life, large capacity and low total cost. We are striving toward their commercialization as core products of next-generation industrial energy storage systems.
Fiscal year 2013 saw the adoption of our lithium-ion bat-teries for container-type energy storage systems developed by Hitachi, Ltd., and the start of demonstration tests of these systems in the United States. (For more details, see Case )
Business plans for energy storage devicesHitachi Chemical has targeted a 10% share of the global market for energy storage devices in fiscal year 2020. To this end, we are expanding our production capacity and constructing sales routes.
Photovoltaic power generation Wind power generation
CrystEna, a container-type energy storage system
Lithium-ion batteries
Power electronicsControl technology
Information & communications
Business establishments Substations Power grid
Grid stabilization
Case
Special Feature 1: Hitachi Chemical’s Solutions for Resolution of Social Issues

11
Annual Report 2014
Special Feature
2Contributing to Society by Resolving Social Issues with Integrating Business Strategies and CSR
Hitachi Chemical is taking a new approach to communicating with capital markets, from issuing its Annual Report in a format that integrates both annual and sustainability report components from Annual Report 2012, to announcing its Medium-term Management Plan from fiscal year 2013. Enterprise evaluation spe-cialists and Hitachi Chemical Executive Officers participated in an exchange of opinions on how this new approach is being perceived.
Growth Strategy for Automotive Products Built on Key Principles of Environment, Safety and Comfort
Aiming to create synergies through Group restructuring while reaping the benefits of globalized upfront investments in distinctive products and materials
Nomura: Several years ago, we actively set about restruc-turing the Group’s businesses and investing overseas. As
a result, I believe we were able to establish an integrated management system and a base for growing sales in the au-tomotive products business. Going forward, we will further accelerate business expansion and will reap the benefits of upfront investments as we work toward achieving the tar-gets of our Medium-term Management Plan. With product development based on the key principles of “environment, safety and comfort,” we will also work toward developing the materials and components that will contribute to
Special Feature 2: Stakeholders’ Dialogue
“The world is full of issues that need resolving. I want Hitachi Chemical to be the one to take them on.”
Yoshihiro Nomura Senior Vice President and Executive OfficerOversight of Automotive Products Business and Risk Management Hitachi Chemical Co., Ltd.
“The energy storage devices business has a very import-ant mission in society. We hope to utilize our superiori-ty here to help resolve social issues.”
Shigeru ItoVice President and Executive OfficerOversight of Energy Devices & System BusinessHitachi Chemical Co., Ltd.
“Only a few companies are innovative enough to intro-duce ROIC as an investment management index for each business division.”
Takao KanaiManaging Director, Fundamental Analysis Citi ResearchCitigroup Global Markets Japan Inc.
“Hitachi Chemical is taking the right approach by disclosing its KPIs to help explain medium to long-term corporate value.”
Keisuke TakegaharaGeneral Manager, Environmental Initiative & Corporate Social Responsibility – Support DepartmentDevelopment Bank of Japan Inc.

12
Annual Report 2014
resolving social issues within the automotive industry. We have already contributed to the lightweighting of automobiles by using plastic for the back door module and other automobile body components, in addi-tion to which we are developing disc brake pads with less copper content ahead of the introduction of copper restrictions in the Unit-ed States from 2021.
Kanai: I believe the Medium-term Management Plan clearly details a growth strategy that improves profitabil-ity in a more targeted way. We are seeing results from past investment in the automotive products business, so market expectation is also increasing.Takegahara: Despite parts manufacturers and other B-to-B companies playing an enormous role in the outcomes of automobile manufacturers, it is diffi-cult to visualize the value they contribute. As a result, these companies are not being properly evaluated in line with their true efforts. If the businesses with a significant impact on the industry are revealed, such as Hitachi Chemical’s efforts to convert materials to plastic and to support regulations ahead of implemen-tation, then we will be able to see new value in these B-to-B companies.Nomura: As you say, that will be the result if we can respond to automotive industry issues as a parts man-ufacturer. That is why we have to provide distinctive products and materials, and value has to be recog-nized by our customers. For example, we are confident that our plastic molded products are second to none in performance but rather than leaving it at that, we recognize the necessity of asking ourselves the hard questions of whether we can produce value that other manufacturers cannot produce in order to further in-crease the value that Hitachi Chemical provides.
Further Enhancing Energy Storage Devices Business to Contribute to a Low-CO2 Society
Hitachi Chemical utilizes its strengths in industrial markets that expect considerable future growth
Ito: Our energy storage devices business is divided into two areas: automotive and industrial. The direction for the energy storage devices business as indicated in the Medium-term Management Plan is to grow it into a core
business for the Group. With our industrial business in particular, the market is expected to greatly expand from 2017, so our work takes a long-term approach.
Important issues for our existing automotive busi-ness are accelerated overseas expansion and support for batteries for the Idling Stop Systems (ISS*) that are forecast to be installed in 60% of automobiles by 2016. Our industrial business is achieving its mission in society, which is to provide a stable supply of energy to ensure backup power sources for power stations, hospitals and other places. Supporting renewable energy in particular is an important issue.
What differentiates Hitachi Chemical from others is that we have accumulated the highly confidential know-how for manufacturing batteries with organic materials, we are able to develop social infrastructure businesses in cooperation with the Hitachi Group, and we are able to offer hybrid energy storage systems combining Hitachi Chemical’s four types of energy storage devices. We want to continue communicating these advantages, expand our business and contribute to society.
Refer to pages 9–10 for details.* Idling stop systems prevent unnecessary idling by automatically stopping the engine
when waiting at traffic signals and other places. This contributes to improved fuel efficiency and reduced CO2 emissions.
Takegahara: So your business strengths lead to value creation for society. I think this is the story of how Hitachi Chemical is able to integrate its business strategies and CSR.
Fostering Life Sciences Business to Meet the Health Checkup Needs of an Aging Society
Increased growth of existing businesses toward future base businesses, and opening up new business fields
Nomura: Life sciences businesses revolve around sys-tems to quickly diagnose allergies and lifestyle-related diseases. We will expand these businesses with Hi-tachi Chemical’s unique strengths—diagnostics and medical instruments—and focus on the exploration of new business fields that can become future base businesses for us. As well as expanding the scope of diagnosis and investigating global business growth, I believe it is necessary for us to take diagnostics to the next level through M&As and other external tie-ups.Takegahara: The diagno-
Special Feature 2: Stakeholders’ Dialogue
13
Annual Report 2014
sis-related business has clear Environmental, Social and Governance (ESG) outcomes, including meeting the early detection and early treatment requirements of the medical field and contributing to reductions in national medical expenses. We expect considerable expansion of the scope of this business in the future as well.
Improvement of Material Technology Capabilities Through the Promotion of Open Innovation
Toward improved R&D efficiencies and enhanced R&D in collaboration with a range of stakeholders
Nomura: We have to increase the pace of technology and product development. Hitachi Chemical aims to accelerate the creation and commercial-ization of new technologies by promoting open innovation and conducting exchanges with customers, universities, research institutes and consor-tiums.
We are also taking a new open laboratory approach to in-troducing state-of-the-art semi-conductor package evaluation equipment into our lab. Rather than just having our customers
use this equipment, our engineers are conducting evalua-tion and analysis of packaging materials together with the customers, which I believe has benefits for customers, such as being able to reduce evaluation times, and for us, such as being able to more quickly develop next-generation pack-aging materials.Takegahara: The open laboratory approach is very inter-esting because it can offer customers suggestions for im-proving the efficiency of their own R&D activities. It should be effective in improving medium- to long-term enterprise evaluation.Nomura: We are also committed to reforming our cost structures and channeling part of those cost reductions into R&D. We already have businesses achieving success from such things as introducing robots, so going forward we will expand these initiatives across the entire Group to enhance our R&D capabilities.
Investment Strategy
Aiming to carefully select investments and improve profitability through introduction of ROIC
Nomura: Hitachi Chemical introduced the use of return on capital invested (ROIC) from fiscal year 2013 as an index for managing investment efficiency for each
business division. ROIC enables easy comparison with past investment effects, so I think it carries enormous benefits for deciding investments.
On the other hand, upfront investment is quite high in the automotive products business, so those benefits will be reaped in the future. Recent ROIC does not look good but a company needs a certain level of upfront investment in this industry to survive, so not all businesses are evaluated equally using ROIC.Ito: ROIC is a useful index for determining the validity of an investment. However, businesses that require upfront investments, such as the lithium-ion battery business, sometimes require investment targeted five years into the future, so they can be a concern.Kanai: The introduction of ROIC is excellent from the perspective of the discipline of investment working well. But do you divide single business segments into those businesses looking for short-term benefits and those businesses where recovery of the investment is further down the track?Ito: We do not make any particular differentiation. Our approach in the energy business is for our existing busi-nesses to absorb any upfront investment. If we were to divide them as you say, then it would be difficult to accept the low profitability of businesses that require upfront investment.Kanai: The idea of using ROIC to establish targets for each business division is quite innovative, so I am very interested to hear how that is being managed. Do you take a flexible approach to your management policy in re-gards to how to determine ROIC for businesses requiring upfront investment?Takegahara: Hitachi Chemical’s approach to utilize ROIC in each business segment as a metric for managing performance should evolve into one of its strengths. In an intensely competitive market, an ROIC indicator that outperforms the industry average implies the existence of a competitive advantage, including a non-financial edge. Conversely, in the event of a lower-than-average indicator, if the investment will largely contribute to solving a social issue, you can make an argument for its future potential by adopting a long-term outlook. This is an excellent approach as it provided a comprehensive evaluation of corporate performance while also serving as a purely financial indicator.
Information Disclosure
Aiming to consider trends in non-financial information and provide disclosure that meets the needs of investors
Nomura: I frankly believe the current stock price reflects the recent performance of our company. What we have to do is to achieve our Medium-term Management Plan and put numbers to those outcomes. We also have to
Special Feature 2: Stakeholders’ Dialogue

14
Annual Report 2014
make efforts to clearly communicate direc-tions and measures for management and business.Kanai: The Japanese stock market has been stagnant for a long time, so the climate is not suited to inves-tor risk. Consequently, even with an attractive growth story, investors do not buy stocks with-out a strong recent per-formance, so we really
do have to boost performance.On the other hand, the stock price also factors in future
growth so the growth story is important. Communicating to the market your strategies for achieving targets will ensure a fair stock price, and it may also have the effect of improving that stock price in anticipation of growth if the market moves upward. How you address issues such as safety and compliance is also important.Takegahara: There is definitely an increasing trend in enterprise evaluation to focus on the value of non-financial information. In addition to business delivering strong messages directly linked to resolving social issues, it should also enhance information delivery for improving productivity as it looks for the Hitachi Chemical Monozukuri Way. Investors focused on ESG and analysts busy analyzing supporting non-financial information will both welcome these responses.Ito: Our company also needs to take every opportunity
to enhance communication in response to capital market needs, and make efforts to disclose information in the Hitachi Chemical way.
Hitachi Chemical DNA
Aiming to become an unparalleled value creator in 10 years’ time, and to then take the challenge further
Nomura: Hitachi Chemical’s vision of what it should be in 2023 is “a value creator that is ahead of the times in re-sponding to consumer changes, improving the value of end products for the customer by delivering unparalleled materi-als and products.” We have already begun activities toward this vision of our company in 10 years’ time.
What we need to become a true value creator is the flex-ibility to be able to respond to any and all changes. That is part of the DNA of Hitachi Chemical, the Pioneering Spirit of the Hitachi Group, which is one of the Company’s Founding Spirits. I would like to build on this going forward.Kanai: Hitachi Chemical has a very broad base of technolo-gies. You have avoided relying too much on any specific field or technology in the past, and are able to respond to chang-es in the business environment. I also believe you receive high market rates in respect to your ongoing sustainability.Takegahara: With the strength of flexibility, you are able to continue the cycle from quickly responding to signs of change, to developing new businesses, and helping resolve social issues while building your own business. Your current course of integrating CSR with business activities, typified by sustainable engineering, is a good model for sustainable management, so I look forward to Hitachi Chemical’s future activities.
Special Feature 2: Stakeholders’ Dialogue

15
Annual Report 2014
ShareholdersInvestors
Through prompt and fair disclosure of information and high-quality communi-cation, we strive to heighten our pres-ence in the capital market and increase our corporate value.
CustomersSuppliers
We aim for the development of next-gen-eration technologies and the steady supply of reliable products through the mainte-nance of good partnerships. We identify and deal with risks from a perspective encompassing the entire value chain.
EmployeesWe provide a pleasant and safe working environment while respecting human rights and promoting individual growth through education.
Governance
Business model
Risks and opportunities
Strategy and resource allocation
Performance Outlook
Mission
Society
GovernmentPublic administration
Employees
ShareholdersInvestors
Global environment
CustomersSuppliers
Results produced by business activities
Capital invested business activities
Providing value to stakeholders
(P.39–40)
Inputs(P.17–18)
Hitachi Chemicalbusiness activities
(P.19–34)
Hitachi Chemical products & services
(Outputs)(P.35–38)
Manufactured capital
Financial capital
Intellectual capital
Human capital
Natural capital
Social and relationship capital
Creating value for stakeholders
Society
We make ongoing contributions to local communities, residents and the interna-tional community through understand-ing the conditions and circumstances of the regions in which we do business.
GovernmentPublic
administration
We constantly update our knowledge of, and strictly adhere to, the statuto-ry and regulatory requirements of the countries and regions in which we do business and fulfill obligations as a good corporate citizen.
Global environment
With conservation of the global envi-ronment being an issue of propriety for management, we are pursuing techno-logical development and production activities through implementation of sustainable engineering.
It is the Mission of Hitachi Chemical to contribute to society through the development of superior technologies and products (see page 1). Based on the Mission, we take in various capital in promoting business activities that fuse financial and non-financial aspects. In these activities, we are constantly aware of the external environment, risks and opportunities, and take proper steps in deployment of strategy and resource allocation, with full consideration of materiality. Through this process, we generate technologies and products that support modern living, and strive for continuous growth while creating value for all our stakeholders on a long-term basis.
Hitachi Chemical’s Value Creation Process
Hitachi Chemical’s Value Creation Process

16
Annual Report 2014
Outline of materiality analysisHitachi Chemical has posted reform in the three areas of busi-ness, organization and human resources in its management policy, and is promoting such reform as a priority project.
Sure and efficient pursuit of reform demands a firm grasp of issues to be addressed on a priority basis and proper ordering of priorities.
Previously, we deduced issues to be tackled on a priority basis by analyzing both internal and external factors. In fiscal year 2013, however, we prepared a materiality matrix for
analysis of materiality based on the process outlined below.We analyze the materiality of the issues deduced from
the environmental analysis in the two aspects of business and stakeholders, and order the priority of the major issues to be addressed by Hitachi Chemical. The matrix presents the results in a chart.
We intend to make continued studies with members of the management team for periodic revision, to assist the development of our business.
Step 1 Identification of issues
Awareness of external factors, risks and opportunities is of vital importance. For this reason, we identified issues for Hitachi Chemical based on an environmental analysis. The environmental analysis was a compre-hensive one examining factors in both the internal environment (e.g., the Hitachi Chemical Group Identity, Codes of Conduct, Medium-term Management Plan, CSR policy and Human Resources Vision) and the external environment (e.g., ISO 26000, DJSI, GRI Sustainability Reporting Guidelines Version 4 and the management environment). We grouped the issues identified into various categories and performed a repeated process of fusion as a task, eventually identifying 22 material issues including reinforcement of capabilities in the area of materials technology.
Step 2 Analysis of materiality
To assess the order of priority of the material issues identified in Step 1, we applied two axes: importance to business and stakeholders.
The importance to business consists of several aspects identified with reference to our basic man-agement policy. Executive Officers and the in-house materiality studies team jointly made assessments to determine the relative importance of each aspect. For assessment of importance to stakeholders, we specified all parties with a stake in Hitachi Chemical and made a numerical evaluation of their relative importance.
The materiality analysis was conducted by using these importance evaluations as weighting in a reas-sessment of the 22 material issues in respect of the importance of each.
Step 3 Preparation of the materiality matrix
The materiality matrix was prepared from the results of the materiality analysis in Step 2. The chart below shows the Hitachi Chemical materiality matrix completed upon confirmation by Executive Officers. Of the 22 material issues, this Annual Report presents information on the 12 thought to be particularly important (to the right of the white line in the chart).
Importance to businessHigh
Very high
Imp
ort
ance
to
sta
keh
old
ers
Business
Increase in productivity
Strengthening marketing
Interactive communication with stakeholders
Creating new businesses and products
Diversity management
Promotion of sustainable engineeringIntellectual property strategy
WOW-BB activities*
Occupational safety and health managementPromotion of open innovation
Enhancement of localization
Stable supply of products
Promotion of strategic alliances Improvement of synergy management
Supply-chain management
Organization
Human resources
Strengthening quality management
Offering material system solutions
Global business expansion
Very high
Engaging in environmental management
Safe and easy-to-use products
*Refer to P.33
Development and evaluation of globally-competitive human resources
Strengthening material engineering
•Environmental analysis
•Identi�cation of issues
Step 1Identi�cation
of issues
Step 2Analysis of materiality
• Analysis of importance to business and stakeholders
• Speci�cation of material issues
Step 3Preparation of the materiality matrix• Examination and
determination at the Executive Of�cers’ Meeting
Hitachi Chemical’s Value Creation Process

Financial Capital
R&D Expenses / Percentage of Net Sales(Millions of yen)
0
5,000
10,000
15,000
20,000
25,000
30,000
(%)
0
1.0
2.0
3.0
4.0
5.0
6.0
Cost of Sales
Intangible Assets
Number of Employees
Natural Capital
Input of Energy*3
(1,000 GJ)
Input of Raw Materials*3
(1,000 tons)
Input of Water Resources*3
(1,000 m3)
Manufactured Capital
Capital Expenditures
Human Capital
Total Transport Energy Used*4
(1,000 GJ)
(Millions of yen)
0
20,000
40,000
60,000
80,000
100,000
0
4,000
2,000
6,000
8,000
10,000
12,000
0
100
200
300
400
500
0
3,000
6,000
9,000
12,000
15,000
0
100
200
300
400
500
Selling, General and Administrative Expenses
(%)
(Millions of yen)
0
100,000
200,000
300,000
400,000
2009 2010 2011 20132012
Environmental Protection Costs (Expenses)*3
(Millions of yen)
0
4,000
8,000
12,000
2009 2010 2011 20132012
Environmental Protection Costs (Investment)*3
(Millions of yen)
0
1,000
1,500
2,000
500
2009 2010 2011 20132012
2009 2010 2011 20132012
2009 2010 2011 20132012
2009 2010 2011 20132012
2009 2010 2011 20132012 (FY) (FY) (FY) (FY)(FY) (FY)
(FY) (FY) (FY)
(FY)(FY)
(FY)
(FY)
(FY) (FY) (FY)
(FY) (FY) (FY)
(FY) (FY) (FY)
2009 2010 2011 20132012
2009 2010 2011 20132012
2009 2010 2011 20132012
2009 2010 2011 20132012
2009 2010 2011 20132012
0
5,000
10,000
15,000
20,000
0
40
20
60
80
100
(Millions of yen)
0
10,000
20,000
30,000
40,000
50,000
New Graduate Recruitment by Gender*2
2009 2010 2011 201320120
20
40
60
80
Changes in Average Training Expenses Per Employee*2
Japan
Corporate R&D Staff Allocation*1
Telecommunication & Displays
Life Sciences Core Technologies, etc.
Environment & Energy
Abroad
Social and Relationship Capital
Social Contribution Expenditure*5
(Millions of yen)
0
60
80
100
120
40
20
2009 2010 2011 20132012
Number of Patent Applications
Intellectual Capital
2009 2010 2011 20132012
Number of Patent Applications in Japan
0
1,000
800
600
400
200
Number of Patent Applications Overseas
Number of Patents Held
2009 2010 2011 20132012
Number of Patents Held in Japan
0
500
1,500
2,000
2,500
3,000
1,000
Number of Patents Held Overseas
Female Male
Net Property, Plant and Equipment(Millions of yen)
0
50,000
100,000
150,000
200,000
2009 2010 2011 20132012
(Millions of yen)
0
10,000
20,000
30,000
40,000
2009 2010 2011 20132012
Number of Employees by Segment
2009 2010 2011 201320120
5,000
10,000
15,000
20,000
Functional Materials Advanced Components and Systems
Number of Employee Volunteers to Social Contribution Activities
0
500
1,000
1,500
2,000
2009 2010 2011 20132012
Refer to for details. Top Message
Refer to for details. Top Message
Refer to for details. P.30
Refer to for details. P.29
Refer to for details. P.34Refer to for details. P.30
(Yen)
0
10,000
20,000
30,000
40,000
50,000
2009 2010 2011 20132012
R&D ExpensesPercentage of Net Sales
Volume of PRTR Substances Handled*4
(1,000 tons)
0
30
60
90
120
150
2009 2010 2011 20132012
17
Annual Report 2014
Inputs (Main Capital Invested in Business Activities)
Hitachi Chemical’s Value Creation Process

Financial Capital
R&D Expenses / Percentage of Net Sales(Millions of yen)
0
5,000
10,000
15,000
20,000
25,000
30,000
(%)
0
1.0
2.0
3.0
4.0
5.0
6.0
Cost of Sales
Intangible Assets
Number of Employees
Natural Capital
Input of Energy*3
(1,000 GJ)
Input of Raw Materials*3
(1,000 tons)
Input of Water Resources*3
(1,000 m3)
Manufactured Capital
Capital Expenditures
Human Capital
Total Transport Energy Used*4
(1,000 GJ)
(Millions of yen)
0
20,000
40,000
60,000
80,000
100,000
0
4,000
2,000
6,000
8,000
10,000
12,000
0
100
200
300
400
500
0
3,000
6,000
9,000
12,000
15,000
0
100
200
300
400
500
Selling, General and Administrative Expenses
(%)
(Millions of yen)
0
100,000
200,000
300,000
400,000
2009 2010 2011 20132012
Environmental Protection Costs (Expenses)*3
(Millions of yen)
0
4,000
8,000
12,000
2009 2010 2011 20132012
Environmental Protection Costs (Investment)*3
(Millions of yen)
0
1,000
1,500
2,000
500
2009 2010 2011 20132012
2009 2010 2011 20132012
2009 2010 2011 20132012
2009 2010 2011 20132012
2009 2010 2011 20132012 (FY) (FY) (FY) (FY)(FY) (FY)
(FY) (FY) (FY)
(FY)(FY)
(FY)
(FY)
(FY) (FY) (FY)
(FY) (FY) (FY)
(FY) (FY) (FY)
2009 2010 2011 20132012
2009 2010 2011 20132012
2009 2010 2011 20132012
2009 2010 2011 20132012
2009 2010 2011 20132012
0
5,000
10,000
15,000
20,000
0
40
20
60
80
100
(Millions of yen)
0
10,000
20,000
30,000
40,000
50,000
New Graduate Recruitment by Gender*2
2009 2010 2011 201320120
20
40
60
80
Changes in Average Training Expenses Per Employee*2
Japan
Corporate R&D Staff Allocation*1
Telecommunication & Displays
Life Sciences Core Technologies, etc.
Environment & Energy
Abroad
Social and Relationship Capital
Social Contribution Expenditure*5
(Millions of yen)
0
60
80
100
120
40
20
2009 2010 2011 20132012
Number of Patent Applications
Intellectual Capital
2009 2010 2011 20132012
Number of Patent Applications in Japan
0
1,000
800
600
400
200
Number of Patent Applications Overseas
Number of Patents Held
2009 2010 2011 20132012
Number of Patents Held in Japan
0
500
1,500
2,000
2,500
3,000
1,000
Number of Patents Held Overseas
Female Male
Net Property, Plant and Equipment(Millions of yen)
0
50,000
100,000
150,000
200,000
2009 2010 2011 20132012
(Millions of yen)
0
10,000
20,000
30,000
40,000
2009 2010 2011 20132012
Number of Employees by Segment
2009 2010 2011 201320120
5,000
10,000
15,000
20,000
Functional Materials Advanced Components and Systems
Number of Employee Volunteers to Social Contribution Activities
0
500
1,000
1,500
2,000
2009 2010 2011 20132012
Refer to for details. Top Message
Refer to for details. Top Message
Refer to for details. P.30
Refer to for details. P.29
Refer to for details. P.34Refer to for details. P.30
(Yen)
0
10,000
20,000
30,000
40,000
50,000
2009 2010 2011 20132012
R&D ExpensesPercentage of Net Sales
Volume of PRTR Substances Handled*4
(1,000 tons)
0
30
60
90
120
150
2009 2010 2011 20132012
18
Annual Report 2014
*1. Only total figures are presented for fiscal year 2010 and 2011 because the breakdowns of these fiscal years were different from those of other fiscal years.
*2. Totals include Hitachi Chemical Co., Ltd. only.
*3. Data aggregated from 15 companies and 30 sites: Hitachi Chemical Co., Ltd. (including former Hitachi Powdered Metals Co., Ltd.), Shin-Kobe Electric Machinery Co., Ltd., Hitachi AIC Inc., Hitachi Chemical Electronics Co., Ltd., Hitachi Kasei Polymer Co., Ltd., Hitachi Chemical Automotive Products Co., Ltd., Japan Brake Industrial Co., Ltd., Hitachi Chemical Filtec Co., Ltd., Hitachi Chemical Techno Service Co., Ltd., Hitachi Chemical (Singapore) Pte. Ltd., Hitachi Chemical Co., (Taiwan) Ltd., Hitachi Chemical (Dongguan) Co., Ltd., Hitachi Chemical (Johor) Sdn. Bhd., Hitachi Chemical (Suzhou) Co., Ltd. and Hitachi Storage Battery (Dongguan) Co., Ltd.
*4. Data aggregated from 24 sites in Japan within sites listed in *3.
*5. Data aggregated from fiscal year 2011.
Inputs Hitachi Chemical business activities
Hitachi Chemical products and services (Outputs)
Providing value to stakeholders
Hitachi Chemical’s Value Creation Process

Fiscal Year 2013 Business Activities
Business
Organization
People
Hitachi Chemical strives for sustainable growth by devel-oping sustainable business around the world, prioritizing the reduction of global environmental impact through the combination and integration of wide-ranging technologies.
Through aggressive measures including M&A, Hitachi Chemical has undertaken considerable organizational reforms to match changes in markets. It has also fostered a more communicative culture between management and employees, and continues sound corporate management with high transparency.
Hitachi Chemical fosters World Class Professionals (WCPs) able to compete on the world stage, and focuses on im-proving the business mindset of each employee to move one step closer to sustainable growth.
Integrating Business Strategies with CSRThe mission of Hitachi Chemical is to continue providing
new value to customers and the community. To this end,
continual reform is necessary. Hence, we defined Business
Reform, Organizational Reform and Human Resource Reform
as our management policies in 2009. Additionally, in 2011
the Group started its CSR Medium-term Roadmap: Stage
2, and re-envisioned these three business reforms from a
sustainability perspective, defining them as Business Stance,
Corporate Stance and Individual Stance. Going forward,
the Group seeks to earn sufficient understanding inside
and outside its companies for this new direction so that its
business activities can continue to progress.
Sustainable Development of Business by 3 St
ance
s
Prom
otion of Im
portant Business by 3 Reforms
Hitachi Chemical Business Activities
Management Policies
CSR Medium-term Roadmap: Stage 2
Business Reform
Organizational Reform
Human Resources Reform
Business Stance
Corporate Stance
Individual Stance
Promoting the energy storage devices business to contribute to a sustainable society
P.9–10
Strengthening the materials technologies by promoting open innovation and realignment of our R&D structure
P.21–22
Strengthening energy storage device materials and technology development utilizing organic chemistry technologies
P.22
Interactive communications with stakeholders P.11–14P.34
Implementing the Global Coaching Program aiming to foster an open, communicative culture
P.31
Expanding training in critical thinking KT method related to problem solving and decision making
P.31
Building fair and impartial global human resources evaluation systems
P.31
Business Reform +
Business Stance
Organizational Reform +
Corporate Stance
Human Resources Reform +
Individual Stance
Reducing CO2 emissions from products and manufacturing processes
P.29
Effectively utilizing water resources by promoting recycling and reusing water, including sites abroad
P.29
Continually boosting the environmental activities by using the GREEN21-2015 Evaluation System for environmental activities
P.29
19
Annual Report 2014
Hitachi Chemical Business Activities
Hitachi Chemical’s Value Creation Process
Hitachi Chemical works to create and provide value while integrating its business with CSR endeavors, maintaining positive relationships with its various stakeholders, and pursuing apt strategies and wise allocation of resources for its business.

Fiscal Year 2013 Business Activities
Developing next-generation automotive products that aim to be energy saving, environmental regulation compli-ant, lightweight and comfortable
P.22
Strengthening regional integration functions as well as R&D and operations frameworks that allow our global business activities to accelerate
P.23–24
Creating new businesses and new products by setting up open laboratories, etc.
P.25
Launching Mastimmunosystems III for enhanced diagnosis of food allergens
P.25
Contributing to regions and societies by expanding sustainable engineering
P.26
Preventing the recurrence of product accident P.27
Enhancing our chemical substance information database P.27
Improving supply chain management through CSR procurement and auditing
P.28
Reducing costs and improving quality by strengthening ties with business partners
P.28
Avoiding human rights risks through initiatives to address Conflict Minerals
P.28
Providing optimum solutions for customers by expanding Material System Solutions (MSS)
WEB
Ensuring quality in our products through quality control meth-ods addressing particular product characteristics
WEB
Strengthening our BCM to ensure stable product supply WEB
Strengthening chemical substance management by revising our Green Procurement Guidelines
WEB
Implementing the Global Leadership Forum for bringing together the top management from each country of our overseas sites
P.32
Increasing opportunities for an active, diverse workforce by promoting diversity
P.32
Launching WOW-BB activities with sights set on achievements in the next 10 years
P.33
Conducting surveys for all employees P.34
Maintaining a positive relationship with society through communication about our IR activities and social contribution programs
P.34
Reflecting employee feedback in our management by holding Town Meetings
P.34
Strengthening labor–management communication through the labor union WEB
Implementing work-life management by formulating our Next-generation Care & Support Action Plan
WEB
Strengthening occupational health and safety management WEB
Coexisting with local communities through social contribution activities
WEB
Enriching local communities through the Sakura Café WEB
Preserving the global environment by promoting green curtain projects
WEB
Preserving the global environment and revitalizing regions through the natural environment restoration in the Kasumigaura area
WEB
Boosting children's interest in science in order to help foster the human resources who will lead the next generation
WEB
Respecting human rights by emphasizing international rights initiatives
WEB
Providing training and support for career development for employees WEB
Establishing a system to support contributions to society by employees
WEB
Working to decrease air pollution and burdens on our daily-living environment
P.29
Ensuring technological and product superiority by promoting intellectual property strategies
P.30
Promoting early and efficient acquisition of intellectual property rights in each country and region
P.30
Strengthening CSR management by holding Group Environment & CSR Meetings
WEB
Improving the level of environmental safety activities Group-wide through environmental safety audits inside and outside Japan
WEB
Spreading environmental awareness through environmental education inside and outside Japan
WEB
Addressing environment-related laws and regulations through the Hitachi Group's global environmental network
WEB
Managing the amounts of Scope 3 CO2 emissions along our entire value chain
WEB
Reducing environmental impacts by promoting carbon management strategies
WEB
Limiting the generation of waste by promoting recycling-oriented manufacturing
WEB
Promoting more efficient environmental preservation activities through the greater use of environmental accounting
WEB
Understanding our material balance in order to lessen our envi-ronmental impacts
WEB
Strengthening management by better understanding chemical substance risks
WEB
Efficiently using resources by promoting product recycling WEB
Reducing transportation burdens by promoting transportation efficiency improvements and modal shifts reduc-ing transportation burdens
WEB
Strengthening measures for preventing soil contamination WEB
Reducing the environmental impacts of business sites WEB
20
Annual Report 2014
Hitachi Chemical’s Value Creation Process
Inputs Hitachi Chemical business activities
Hitachi Chemical products and services (Outputs)
Providing value to stakeholders

21
Annual Report 2014
Strengthening Material Technology Capabilities
Hitachi Chemical has provided value to customers by freely combining its extensive expertise in materials, fostered during the development of its four original products and encom-passing both organic and inorganic chemicals, with diverse technologies, derived during the evolution of our products. Our four types of technology are: “material technologies,” which consist of the basics of material development—
synthesis, purification and mixing; “process technologies,” for the economical and efficient manufacturing of products; “evaluation technologies,” for assessing our next steps through accurate data analysis; and “design technologies,” to achieve the desired functions. These technologies lead to the creation of products that will contribute to the realization of a better society.
Strengthening our R&D structureR&D at Hitachi Chemical plays an important part in promoting the development of new business platforms. In light of this, the Company embarked on the reorganization of its R&D structure for key fields of research. By developing shared technology platforms and introducing functions to analyze materials handled throughout the Hitachi Chemical Group at the Fundamental Technology Development Center, a part of the Tsukuba Research Laboratory, the Company was able to strengthen cross-organizational functions. We also
established the Frontier Technology Development Center to boost research in the field of emerging technologies which will play an important role in the future. Moreover, by giving this center control over the U.S. Hitachi Chemical Research Center, alliances with partners abroad were strengthened. In fiscal year 2014, the Company will enhance the organizational structure of the Fundamental Technology Development Center and expand the sharing of various technologies and information to increase applications to new businesses and products.
Developments in Fiscal Year 2013
Technology Platforms and Business Fields
Basic Approach
New Business Development Headquarters
Tsukuba Research Laboratory
Telecommunication Materials Development Center
Energy Devices and Materials Development Center
Advanced Fundamental Technology Development Center
Fundamental Technology Development Center
Hitachi Chemical Research Center, Inc. Hitachi Chemical Research Center, Inc.
Fiscal Year 2012
Tsukuba Research Laboratory
Fundamental Technology Development Center
Cross-organizational functions
New Business Development Headquarters
Telecommunication Materials Development Center
Energy Devices and Materials Development Center
Social Infrastructure-related Materials Development Center
Frontier Technology Development Center
Reorganization
Fiscal Year 2013
Business
Original Products
Insulating varnishes
Industrial laminates
Carbon brushes
Porcelain insulators
Technology Platforms Key Business Fields
Telecommunications & Displays
Environment & Energy
Life Sciences
Automobiles & Transportation Infrastructure
Material Technologies
Puri�cation, Extraction, Compounding, Organic and inorganic synthesis, Precision polymerization, Organic–inorganic hybrid
Process Technologies
Surface control, Interface control, Dispersion, Impregnation, Coating, Composite formation, Lamination, Sintering, Molding,Biotechnology
Material property evaluation, Packaging process evaluation,Package reliability evaluation, Analysis
Evaluation Technologies
Design Technologies
Molecular and particle design, Functional resin design,Device design, High-frequency circuit design, Thermal management, CAE
R&D Structure
Hitachi Chemical’s Value Creation Process

22
Annual Report 2014
Open innovation initiativesWith ongoing changes in the market environment and the continuing diversification of customer needs, Hitachi Chem-ical believes it is important to embark on open innovation, in other words, collaborating with organizations outside the Group that are in line with social trends, rather than relying solely on internal innovations. This will facilitate the creation of new businesses and products, in addition to the develop-ment of products and technologies that contribute to the resolving of social issues through the application of existing technologies.
Enhancing the development of energy stor-age device materials and technologiesFrom October 2012, the R&D department of Shin-Kobe Electric Machinery, a Group company, was integrated with the R&D department of Hitachi Chemical Co., Ltd. to establish the Energy Devices and Materials Development Center, which specializes in handling energy storage device technologies. As it possesses a wide range of material tech-nologies, Hitachi Chemical is able to analyze and design optimal structures for materials to improve the safety and durability of energy storage devices. Using this advantage,
in fiscal year 2013 Hitachi Chemical developed a novel additive technology. This technology became the basis for the development of lead battery technology with enhanced load capacity and durability for use in next-generation au-tomobile ISS*. In the second half of fiscal year 2014, we plan to begin successive commercialization of products.
* Idling stop systems
Development of next-generation automotive products based on our material technologiesIn accordance with the Medium-term Management Plan, Hitachi Chemical is developing parts for new automotive products planned to be released by automobile manufactur-ers from fiscal year 2016 by fully utilizing proprietary technol-ogies, such as those for materials, molding and processing, evaluation and analysis, and design. The keywords are energy saving, compliance with environmental regulations, lightweight and comfort. Hitachi Chemical is undertaking development in a number of areas, including creating plastic gears that are lightweight and have enhanced strength, disc brake pads with reduced copper content and IPM housing and battery module cases for eco-friendly, next-generation automobiles.
Hitachi Chemical Group
Hitachi Group• Hitachi Central Research Laboratory, Hitachi, Ltd.• Hitachi Research Laboratory, Hitachi, Ltd. and more
New Business Development Headquarters•Tsukuba Research Laboratory•Hitachi Chemical Research Center, Inc.•Hitachi Chemical–Shanghai Jiao Tong University R&D Center
• Yamagata University• Tokyo Institute of Technology• Kyoto University• Tsinghua University (China) and more
• CEREBA: Chemical Materials Evaluation and Research Base• LIBTEC: Lithium Ion Battery Technology and Evaluation Center• JAPERA: Japan Advanced Printed Electronics Technology Research Association• TPEC: Tsukuba Power-Electronics Constellations and more
• AIST: National Institute of Advanced Industrial Science and Technology• IMEC: Interuniversity Microelectronics Center• A*STAR: Agency for Science–Technology and Research (Singapore) and more
Universities
ResearchInstitutes
Technology Research Associations, Consortiums
Hitachi ChemicalShin-Kobe Electric Machinery
Energy storage devices technologies and expertise
Material & analysis technologies
Analyze and design optimal structures using analytical and computational chemistry, and develop materials in a short period of time
Knowledge regarding attributes necessary for energy storage devices
Reinforced-plastic gears IPM housing
Inputs Hitachi Chemical business activities
Hitachi Chemical products and services (Outputs)
Providing value to stakeholders
Overview of Hitachi Chemical’s Open Innovation
Development of Energy Storage Devices Using Organic Chemical Technologies
Hitachi Chemical’s Value Creation Process

23
Annual Report 2014
ASEAN, India
Management integration of local sites across regions, improvements in governance
Establishment of region-speci�c marketing functions
Establishment of marketing, development and production functions
Region FY2013 FY2014 FY2015
Europe
China
The Americas
Photosensitive dry films for printed wiring boards Development center in Suzhou, China Hitachi Chemical Research Center, Inc. in the United States
Global Business ExpansionBusiness
To secure demand in overseas markets, particularly in emerging markets, Hitachi Chemical is actively carrying out capital investments in various regions, as well as imple-menting marketing strategies aligned with demand trends in each region, and conducting R&D, manufacturing and sales activities suited to local demand. As one step in this direction, the Group is establishing local subsidiaries with regional headquarters function in key regions to develop efficient management and business operational struc-tures. In our Medium-term Management Plan (fiscal years
2013–2015), our overseas expansion policy calls for the en-hancement of product development in the high functional materials business, in the mid-range area, to compete successfully in the global market; strengthening of the overseas production and sales structure in the automotive products business to become a global supplier; and the extensive development of overseas markets, particularly for automotive lead-acid batteries, in the energy storage devices business.
Basic Approach
Promotion Planning for Regional Headquarters
Strengthening the functions of regional headquartersIn fiscal year 2011, in order to respond appropriately to de-mand trends in the Chinese market, Hitachi Chemical central-ized management and strengthened governance of Hitachi Chemical Group companies in China by establishing Hitachi Chemical (China) Co., Ltd. as the regional headquarters for China. In fiscal year 2013, planning services for marketing strategies, including priority assignment of sales staff, in the business of photosensitive dry films for printed wiring boards, for which overseas demand is expanding, were transferred to the regional headquarters in China. In this way, we built a business structure with bases located in close proximity to our customers, where they could quickly take advantage of business opportunities. Going forward, we plan to systematically establish and develop regional headquarters functions in areas outside of China.
Promoting global R&DIn the development of new products and technologies that are suitable for overseas markets, it is necessary to actively pursue technical alliances on a global scale to further en-hance our materials technologies, which are the foundation of Hitachi Chemical’s R&D capabilities, and to implement R&D methods suited to local needs, including demand trends. Hitachi Chemical recognizes the importance of this and is embarking on enhancing its R&D network with Hitachi Chemical Group companies, the Hitachi Group and external organizations. Currently, we have dispatched researchers to the United States, Europe and China to seek out novel research subjects.
Developments in Fiscal Year 2013
Hitachi Chemical’s Value Creation Process

24
Annual Report 2014
Strengthening the global business structureIn its global development of new markets and customers, Hitachi Chemical, including its overseas Group companies, is embarking on measures to establish a sales and marketing structure that is compatible with customers’ supply chains. In addition, in the promotion of global sales activities, we have implemented standardization of sales processes to boost efficiency and prioritize our sales resources. Included in these initiatives is the enhancing of the sales structure, particularly for accounts overseas, through the reallocation of sales resources in Japan and overseas by absorbing sales rights for Hitachi Chemical Group products held by sales subsidiary Hitachi Kasei Shoji to the Company from fiscal year 2014.
JapanHitachi Chemical Co., Ltd.
Consolidated subsidiaries: 19 companies
The AmericasConsolidated subsidiaries: 5 companies
ASEAN, IndiaConsolidated subsidiaries: 14 companies
Europe, AfricaConsolidated subsidiaries: 1 company
ChinaConsolidated subsidiaries: 19 companies
Chinab Carbon anode materials: New facility (from ’12/4)
b Automotive friction materials: Capacity expansion (from ’12/7)
b Photosensitive dry �lm slit processing for printed wiring boards: New facility (from ’13/1)
b Functional resins and chemical materials: New facility (from ’13/3)
b Photosensitive dry �lm for printed wiring boards: Capacity expansion (from ’13/3)
b CMP slurry for semiconductor production: New facility (from ’13/4)
b Plastic molded products for automobiles: New facility (from ’14/1)
Indonesiab Powder metal products: New facility (from ’12/2)
Thailandb Automotive lead-acid batteries: New facility (from ’12/4)
b Automotive carbon brushes: New facility (from ’12/4)
b Automotive friction materials: Capacity expansion (from ’13/2)
b Powder metal products: New facility (from ’13/7)
Mexicob Automotive friction materials: Capacity expansion (from ’12/8)b Powder metal products: New facility (FY2014, planned)India
b Automotive friction materials: Joint venture established (from ’12/12)
b Powder metal product: New facility (from ’13/4)
Europe, AfricaExploring business in the African market[Dispatching of personnel to South Africa](from ’14/4)
Initiatives for Strengthening Global Business
Production sites commenced operation after FY2012 bHigh Functional Materials bAutomotive Products bEnergy Storage Devices
The United Statesb Powder metal products: Capacity expansion (FY2014, planned)
Business reforms Business strategies
Enhance organizational sales capabilities
Deploy sales support tools throughout the Company
Standardize sales processesShared use of databases
Cultivate new markets and customers
Identify new subjects and implement early commercializationAccount strategies Regional strategies
Strengthening Business Structure
Hitachi Chemical’s Value Creation Process
Inputs Hitachi Chemical business activities
Hitachi Chemical products and services (Outputs)
Providing value to stakeholders

25
Annual Report 2014
Promotion of Super-X and Next-X Projects
Strengthening Partnerships with Customers through Open Laboratory
Super-X project(New businesses)
Next-X project(Existing businesses or extension of those businesses)
Marketing Group
Society and technology
trend analysis
Advanced technologies
exploring
Conventional approach New approach (Open laboratory)
Customer acceptance
Submit sample
Repeat until OK is given
Open laboratory
Customer acceptance
Hitachi Chemical sample
Materials brought in by customers
High-precision packaging and analysis equivalent to that of customers
Customer evaluation (material/process)
Packaging evaluation (propose solutions)
Recommend materials to customers
Recommend materials to customers
Open laboratory
Creating New Businesses and ProductsBusiness
Hitachi Chemical aims to create new businesses and products based on a broad understanding of social and market trends and, to that end, we have strengthened the organizational structure of our New Business Development Headquarters (see page 21 for details). Under that orga-nization, the Group aims to create new businesses and are implementing six R&D projects under the collective name, Super-X, which mainly deals with the fields of the environment and energy, and life sciences. Also, we are promoting 12 projects, collectively named Next-X, which aim to strengthen existing businesses and focus on the electronics-related and energy storage devices businesses. The research centers and development departments of our business divisions are being integrated, and we actively
promote businesses that contribute to the creation of value for stakeholders, such as those aimed at resolving social issues (support for launching and independence of commu-nity businesses), and the recycling business.
Basic Approach
Establishing an open laboratoryIn the high functional materials business, the Hitachi Chemi-cal Group aims to develop high-end, high-margin products. Hitachi Chemical has established a new research facility called the open laboratory and are working to strengthen development partnerships with our customers. The goal of the open laboratory is to improve the efficiency of R&D for semiconductor packaging materials and increase the speed of evaluations by customers. The laboratory was established within the Tsukuba Research Laboratory (Tsukuba City, Ibara-ki Prefecture).
The creation and eval-uation of prototypes for various types of advanced packaging using novel packaging technologies is carried out in the lab-oratory. Customers work alongside Hitachi Chemi-
cal engineers at the laboratory to create packaging prototypes using state-of-the-art facilities. We expect the benefits for cus-tomers to be shorter evaluation times and, for us, the faster acceptance of multiple types of packaging materials.
Reagent for diagnosing allergensIn Japan, the increase in allergy patients in recent years due to changes in living environments and lifestyles has become a social issue. According to a survey conducted by the Ministry of Education, Culture, Sports, Science and Technology in 2013, 4.5% of children (around 450,000) have some type of food allergy, which is an increase of more than 120,000 children from the 2004 survey. In response to this, utilizing core technologies for diagnostic reagents, Hitachi Chemical developed and began marketing the Mastimmunosystems III (MAST III)*, a new in vitro diagnostic product to test for allergies with five additional food categories, for which there was high demand in medical practice.
* This product enables screening for 33 major allergens from a single blood sample. In particular, it can be used to diagnose the existence of 18 different types of food allergies, including allergies to foods that are frequently consumed by children, such as bananas and pork.
Developments in Fiscal Year 2013
Mastimmunosystems III
Hitachi Chemical’s Value Creation Process

Starting in fiscal year 2012, the sustainable engineering products ratio was expanded to reflect global operations, and now includes all consolidated sales.
Sustainable Engineering Products Examples
26
Annual Report 2014
*Results are presented with fiscal year 2011 objective data as a base of 100.
Promotion of Sustainable EngineeringBusiness
Sustainable engineering is at the core of sustainable business, and represents the culmination of all the tech-nologies of Hitachi Chemical, whereas business innovation is the key to sustainable engineering. The Group aims to increase corporate value and contribute to society and the environment through prioritizing the minimization of our impact on the global environment at the R&D and product planning and design stages. We monitor our progress with sustainable engineering using a KPI based on the sales ratio
of Eco-products to total sales.There is a common definition of Eco-products for all
Hitachi Group companies. Eco-products are those that are assessed as meeting a certain standard, based on the follow-ing eight categories: product functionality, resource saving, recyclability, safety of chemical substances, green energy chemistry, environmental protection, energy efficiency and availability of information.
Basic Approach
Promoting sustainable engineeringIn fiscal year 2013, the ratio of sustainable engineering products (Eco-products) to total sales was 83.9%, down 1.5 percentage points compared with fiscal year 2012, due to slower growth in sales of electronics-related products, which have a high ratio of Eco-products. Hitachi Chemical is aiming to boost the sales ratio to 88% or higher in fiscal year 2014, and 89% or higher in fiscal year 2015.
CEL-W series of white epoxy molding compounds for LED packagesThe CEL-W series of white epoxy mold-ing compounds for LED packages is used as an anti-reflective material in LEDs. The use of LEDs is increasing at a rapid pace because they have a service life tens of times longer than incandescent lamps,
and energy consumption is a fraction that of incan-descent lamps. Increasing luminance even further remains an outstanding technology issue, but the CEL-W series has been praised for its outstanding reflective characteristics as well as its high heat and light resistance (character-istics that deteriorate little even under bright light).
Powder metal products for environmentally friendly mobility and equipment that improves fuel efficiencyAutomakers have concentrated on the improvement of internal combustion engines and the development of electric vehicles in order to meet environmental regulations that tighten every year. Hita-chi Chemical has responded to these cus-tomer needs by providing powder metal products that offer a high degree of shape and mate-rial freedom in the powder metal production method. Our variable valve timing components (picture in the image above the right) have been well received by customers for their contri-bution to reducing exhaust gas and improving fuel economy and horsepower by varying the timing of engine exhaust valves.
Developments in Fiscal Year 2013
Hitachi Chemical’s Value Creation Process
FY2014 target
FY2014 target
88 or higher
89 or higher
FY2011 FY2012 FY2013
85.1 85.4 83.9
Ratio of Sustainable Engineering Products to Total Sales (ratio of Eco-products)
(%)
Insulating varnishes for hybrid vehicle motors
Dehalogenated encapsulants
White epoxy molding compounds for LED packages
Equipment that provides mobility with highly efficient energy conversion
Far UV-curable resins
Photosensitive dry films for direct imaging
Reduced-copper friction materials
2011 2012 2013 2014Target
2015Target
(FY)
100 500
2,200
2,500
4,4757,500
12,500
335
Results
Targets
2011 2012 2013 2014Target
2015Target
(FY)
100278
444575
6251,169
2,200
172
Results
Targets
Sale Targets and Results (on the index)
Sale Targets and Results (on the index)
Inputs Hitachi Chemical business activities
Hitachi Chemical products and services (Outputs)
Providing value to stakeholders

27
Annual Report 2014
Quality Management System
Flow for Quality Assurance Improvements
v Needsv Technical requirements
v Product speci�cationsv A variety of documentation for the exporting of products (Safety data sheet (SDS), product speci�cation manual and other materials)
Information �ow with customers and suppliers Product �ow Sharing information in-house and collaboration among different processes
Customers Sales division
Purchasing division SuppliersQuality assurance division
b Internal audits b Correction/prevention b Customer satisfaction evaluation
Development and design division
b Development/improvement b Quality assessment
Manufacturing divisionb Manufacturing
b Shipment inspections b Delivery
Production sites
CustomersProduct QC
accidentDemand for improvement
Production SitesProduct QC accident
Remedial measures (prevent reoccurrence)
Revises related rulebooks
Applies these steps to similar products
Other Production SitesApplies to similar products
ManagementShares accident data
Instructs relevant business sections
Headquarters Quality Assurance Division
Review accident data
Reaf�rm corrective action taken
Trend analysis and companywide purview
Delivering Safe and Easy-to-use ProductsBusiness
Hitachi Chemical is continuing to monitor various processes and carry out improvements through its Quality Manage-ment System (QMS), while working to maintain and improve services that support the globalization of its customers’ business operations and needs.
Hitachi Chemical expects to acquire ISO 9001 certification in fiscal year 2015 for all its new overseas production sites
added to its network in recent years as a part of its business expansion. Also, the material procurement division promptly supplies the development and design division and the quality assurance division with information on the quality of material procured globally and on chemical substances. Each division works together in close cooperation to supply superior quality products with a high level of safety.
Basic Approach
Thorough prevention of product-related accidentsIn fiscal year 2013, Hitachi Chemical implemented e-learning for all employees in the manufacturing process, including workers at overseas sites, regarding the shift in the quality improvement focus to upstream processes in the manu-facturing process (design, development, manufacturing and quality assurance). Hitachi Chemical also established a network through which all production sites, including those overseas, can transmit information on quality issues.
From fiscal year 2014, Hitachi Chemical will have put in place a system that will enable management and all the production sites to share information on product defects and requests for improvements, and details relating to corrections of these issues will be made available throughout the Group.
Managing chemical substances in productsHitachi Chemical has established a system to centrally man-age safety information on chemical substances and product information to customers expanding on a global scale and provides the same accurate information on chemical sub-stances from all the production sites.
In fiscal year 2013, Hitachi Chemical completed a data-base containing information on chemical substances includ-ed in chemical products and procured materials.
Disclosing product environmental informationHitachi Chemical strives to carry out appropriate informa-tion management and disclosure with respect to chemical substances in its products. In accordance with relevant laws and regulations, we have established standards for chemical substance management and are applying those standards throughout the Group. Through these efforts, the Group was also in proper compliance with the various laws and regulations in fiscal year 2013, and consequently there were no penalties imposed on the Group overall in relation to breaches of chemical substance management.
In fiscal year 2014, Hitachi Chemical will proceed to develop a system for providing appropriate information to the many stakeholders expanding globally, including com-pliance with the South Korean Act on the Registration and Evaluation of Chemical Substances.
Developments in Fiscal Year 2013
Hitachi Chemical’s Value Creation Process

28
Annual Report 2014
Supply-chain ManagementBusiness
The procurement of materials that satisfy the requirements of quality, delivery time, price and advanced technology is essen-tial for supplying customers with superior products. To that end, Hitachi Chemical strives to build a strong supply chain by searching on a global basis for suppliers that have strong operational and management capabilities and can provide sta-ble supplies. In particular, in recent years the Group has been focusing on preventing the risk of exclusive manufacturers of products and acquiring new suppliers in Leading Competitive Countries (LCC), primarily emerging countries.
Hitachi Chemical also believes that it is important to fulfil social responsibilities, such as respecting human rights, ensur-ing occupational health and safety, complying with laws and social norms, and carrying out environmental conservation activities, throughout the entire supply chain. To that end, we have built close and fair cooperative relationships with
our suppliers by sharing essential information with suppliers while carefully guarding business secrets, and deepening communication to build trust. We also ask our suppliers to understand and follow the Hitachi Chemical Group Supply-Chain CSR Deployment Guide-book and, in some cases, transactions are not undertaken with suppliers that do not agree to do so.
Basic Approach
CSR procurement and auditsBased on the results of surveys Hitachi Chemical conducted on the state of CSR activities at its major suppliers, we have been directly visiting suppliers and gaining their understand-ing of the Hitachi Chemical Group’s stance on CSR issues, including human rights and working environments. The Group plans to continue this course of action from fiscal year 2014. Hitachi Chemical also participated in CSR audit activi-ties carried out by Hitachi, Ltd. targeted at overseas suppliers.
Selecting new suppliersWhen selecting a new supplier Hitachi Chemical undertakes an investigation that includes evaluating the price and quality of the product to be procured and checking the creditwor-thiness of the supplier, as well as examining the supplier from a CSR perspective. In all cases, the general manager of the procurement department checks the results, and the supplier may not be accepted if there are problems.
Dealing with Conflict MineralsIn accordance with Hitachi Group policies and the Hitachi Chemical procurement policies, the Group tracks the supply chain back to determine the country of origin of the minerals being used at the customer’s request. In fiscal year 2013, we responded to 118 requests for investigations. Section 1502 of the U.S. Dodd-Frank Wall Street Re-form and Consumer Protection Act was enacted with the goal of cutting off sources of funding for armed insurgent groups that inflict serious human rights abuses in the Dem-ocratic Republic of the Congo and neighboring regions. Hitachi Chemical believes that the intent of this law should
be observed and will respond sincerely to the request for investigations.
Strengthening cooperation with suppliersTo ensure stable supply and improve the quality of the products we deliver to our customers, Hitachi Chemical is strengthening its cooperation with suppliers by confirming conditions and risks to suppliers of raw materials through regular ISO audits and technical liaison meetings and other means, and exchanging opinions on improvements. In some cases, we also receive cost reduction proposals.
Environmental initiatives within the supply-chainHitachi Chemical’s high functional materials, energy storage devices, automotive products and other products play a ma-jor role in the miniaturization of final products, enhancement of capacity and performance improvement. As a result, the Group is also contributing to the reduction of environmental impacts through the supply chain. Moreover, as the ratio of overseas sales increases, we are proceeding with localization of production, which will lead to major achievements in reducing transportation loads.
Developments in Fiscal Year 2013
Hitachi Chemical’s Value Creation Process
Inputs Hitachi Chemical business activities
Hitachi Chemical products and services (Outputs)
Providing value to stakeholders

29
Annual Report 2014
Environmental Management
Product BusinessStrategies
Supply ChainResource Recycling
Eco Mind
Eco Products
Global Warming
Environmental Cooperation with Stakeholders
Actual result of FY2012 (451 GP)Target of FY2013 (512 GP)Actual result of FY2013 (533 GP)
80
20
40
60
100
0
54
79
56
54
7566
65
84
Engaging in Environmental ManagementOrganization
In its environmental management, Hitachi Chemical is focusing on the three pillars of “Prevention of Global Warm-ing,” “Conservation of Resources” and “Preservation of Ecosystems,” in line with the Hitachi Group Environmental Vision. Under the vision Hitachi Chemical has formulated the CSR Policy of the Hitachi Chemical Group and the Hitachi Chemical Action Guidelines for Environmental Conservation.
The Group engages in business activities that are in full compliance with these policies. At the same time, the Group is taking into account the impact that product life-cycle has on the environment and is implementing various measures to reduce this impact. It is through these efforts that Hitachi Chemical aims to realize a sustainable society that is in har-mony with the global environment.
Basic Approach
Reducing CO2 emissions reflecting products and business activitiesThe Hitachi Chemical Group is participating in the Hitachi Group’s plan to reduce CO2 emissions by 100 million tons an-nually by fiscal year 2025 through its products and services. In fiscal year 2013, Hitachi Chemical reduced its CO2 emissions by roughly 3,900 tons in the production of backdoor modules for automobiles.
The Group is also continuing to embark on the reduction of total energy input during production activities.
Reduction of water resourcesThe Hitachi Chemical Group is undertaking measures to re-duce the amount of water being used, particularly at its over-seas production sites. In fiscal year 2013, Hitachi Chemical used 2,380,000m3 of water at overseas production sites, and recycled and reused 1,780,000m3 of that amount. Moreover, the Group has improved water con-sumption per unit of sales at its main over-seas production sites by 62%, compared with the base year of fiscal year 2005.
Using the GREEN21-2015 Evaluation System for environmental activitiesHitachi Chemical uses a Green Points (GP) system to objec-tively analyze the progress of each business location and the Group as a whole in achieving activity objectives for each fiscal
year. This system helps continually improve environmental activities. In fiscal year 2013, the Group achieved a GP rating of 533, outperforming the set GP target of 512, and achieving improvements in all categories over fiscal year 2012. This in-cluded major improvements in the “Eco Mind” and “Environ-mental Cooperation with Stakeholders” categories. In fiscal year 2014, we are continuing to improve our activity levels even more, focusing on the supply chain and Eco-products.
Air pollution and reducing its impact on living environmentsHitachi Chemical is tackling the reduction of volatile organic compound (VOC) emissions (41 substances designated by the Hitachi Group based on standards set by the Ministry of the Environment of Japan). The Group is also appropriately managing other burdens on living environments, such as noise, vibration and odors, by regular measurements at each of its production sites.and other measures.
Developments in Fiscal Year 2013
GREEN21-2015 Assessment Radar Chart*
Hitachi Chemical’s Value Creation Process
(1,000 tons)
0
100
200
300
400
500
2009
445
2010 2011 20132012 (FY)
474 495490 491
(1,000 tons)
0
3,000
6,000
9,000
12,000
15,000
2009
13,000 12,400 12,500
2010 2011 20132012 (FY)
11,400 10,970
(Tons)
0
200
400
600
2009
531
2010 2011 20132012 (FY)
518 506500 514
Greenhouse Effect Gas Emissions*
Input of Water Resources*
VOC Emissions*
* Refer to P.18 *3 for the scope of the data aggregation.

30
Annual Report 2014
Intellectual Property Education Activities
Number of Patent Applications and Patents Held
TargetEducation for researchers and engineers
Legal knowledge concerning patent applications and patent rightsPreparation of patent speci�cations (exercise) and dealing with reasons for patent rejectionSearch for patent information
Main content of education activities
Education for the sales personnel
Measures to prevent leaking of technical informationMethods of utilizing patents in business activities
Education for all employees
Basic knowledge related to intellectual property (new employee training)Measures to prevent leaking of technical informationPatent clearance (compliance)
Regional strategiesUtilizing the Patent Prosecution Highway (PPH) and active-ly meeting with local examiners, Hitachi Chemical works to acquire patent rights quickly in countries and regions where the Company, its competitors or both the Company and its competitors manufactures and sells products, with a view to improving the support it can provide when start-ing up a business. In addition, in Taiwan and China Hitachi Chemical is focusing on applications for utility model reg-istration, as well as patents, as Hitachi Chemical expects this will enable the Group to quickly acquire rights. In this way, the Group is working to acquire effective rights in accordance with the systems of each country.
* Figures for 2013 include estimated values
Patent registrations
(FY)2009 2010 2011 2012 20130
50
100
150
200
Utility model registrationsPatent applications Utility model applications
106
5262
104 105
132
85
9 19 15 1616
148
177 178
0
500
1,000
1,500
2,000
2,500
(FY)
Number of patents held in Japan Number of patents held overseasNumber of patent applications overseasNumber of patent applications in Japan
1,696
1,957
2,205
1,537
1,734
2,040
708
556698
788 841
816
2,371
2,582
2,174
2,406
727 727
724 665
2009 2010 2011 2012 2013
Intellectual Property StrategyOrganization
Regarding intellectual property as an important and indis-pensable asset in the promotion of its business strategy, Hitachi Chemical has established three patent policies based on the principle of “obtaining effective patents and actively utilizing such patents both in Japan and overseas in line with its business strategy.” These policies are: “to maintain superiority in products and technologies,” “to respect the patent rights of other companies” and “to deal resolutely with infringements of its patent rights.”
In addition, Hitachi Chemical has set up a full-time office (Intellectual Property Office) that conducts a variety of activi-ties related to intellectual property and continuously mounts
educational activities for its employees, including those at subsidiaries, with a view to increasing their awareness of intellectual property matters.
Basic Approach
Maintaining superiority in products and technologiesHitachi Chemical has implemented patent portfolio manage-ment (PPM) in each of its technological and product fields. Depending on the business stage—early, development or maturation stage—and competitiveness, Hitachi Chemical is building a global patent network that is highly effective in supporting its businesses and maintaining the superiority of its products and technologies.
The royalty income received from outside the Company from intellectual property owned by the Company totaled ¥1.5 billion in fiscal year 2013.
Respecting the patent rights of other com-paniesConsolidating a patent search system and nurturing patent search experts, Hitachi Chemical rigorously implements searches and analyses of other companies’ technologies and patents from the R&D phase. While respecting the intellectu-al property of other companies, the Company supports the differentiation of its own technologies.
Dealing resolutely with patent rights infringementsWith regard to corporations that infringe on its patent rights, the Company actively takes global countermeasures and works to maximize business support through intellectual property.
Developments in Fiscal Year 2013
Hitachi Chemical’s Value Creation Process
Inputs Hitachi Chemical business activities
Hitachi Chemical products and services (Outputs)
Providing value to stakeholders
Number of Patent and Utility Model Applications and Registrations in China

31
Annual Report 2014
Human Resources Reform Scenario
Employees participating in the Global Coaching Program
Activating Communication Skills
Improvement in Creativity and Productivity through Development of World Class Professionals
Human Resources Vision of “World Class Professionals”Person who develops himself/herself (self-sustaining) through practice and
review based on Hitachi Chemical's unique corporate philosophy and culture while continuously improving his/her strengths (knowledge and skills)
Standardizing Human Resources Management Foundation
Global Coaching ProgramKT (Kepner-Tregoe) methodCommunication in English
Global Talent StandardHitachi Chemical Group vision-based “human resources evaluation”
Hitachi Global GradingMarket principle-based “position evaluation”
Development and Evaluation of Globally-competitive Human ResourcesPeople
Hitachi Chemical holds Human Resources Reform as one of its three management reform policies, and tackles it with the development of “World Class Professionals (WCPs).”
The Group also has been standardizing its human re-sources management foundation through introduction of new performance evaluation systems—Global Talent Stan-dard and Hitachi Global Grading—which have already been put in place at Hitachi Chemical and some Group companies. In fiscal year 2014, the new performance evaluation systems will also be applied to the remaining Group companies in Ja-pan, followed by introduction at overseas Group companies by fiscal year 2015.
Basic Approach
Global Coaching ProgramIn order to keep delivering new values, Hitachi Chemi-cal needs human resources with diverse skills to get to-gether and takes challenges through dialogue and coop-eration. One effort in this re-gard is the Global Coaching Program.
In the program, an in-house coach has dialogues with five stakeholders on several occasions, encouraging them to take self-motivated actions and make progresses. In fiscal year 2013, the Group trained 397 in-house coaches, totaling 1,985, consisting of stakeholders from 12 countries and regions.
Introduction of KT (Kepner-Tregoe) methodThe KT method is a communication method that has been put in place throughout the entire Hitachi Chemical Group and is a thought process on decision making and problem solution methods. It’s a tool to understand situations and make selections and decisions. In fiscal year 2013, Hitachi Chemical started holding a KT training program at overseas sites to train instructors abroad and approximately 100 overseas employees completed the program in addition to around 400 who completed it in Japan.
Promotion of English as the Group’s official languageThe Hitachi Chemical Group has been promoting English to become the official language of the Group. In Decem-ber 2013, we launched a new English learning program in addition to the existing correspondence learning program. Hitachi Chemical also has a program in place where senior staff members with substantial overseas experiences offer one-on-one training. Additionally, materials for the Executive Officers’ Meeting are produced in English.
Fair human resources evaluationThe Hitachi Chemical Group sees fair human resources evalu-ation as a foundation for sustaining its growth as a company. As part of the Group’s efforts, Hitachi Chemical is working on the establishment of a global human resources evaluation system by driving the introduction of Global Talent Standard and Hitachi Global Grading. In fiscal year 2013, the Group put a new goal management system, together with these two performance evaluation systems, in place for management positions of the Company and Shin-Kobe Electric Machinery. The new systems are scheduled to be introduced at Hitachi Chemical’s 14 domestic Group companies in fiscal year 2014.
Developments in Fiscal Year 2013
Global Coaching Program Participants’ Awareness (who rated over 4 point out of 5)
0
20
40
60
80
100(%)
A B C D E F
A Dialogue Dialogue with people outside my department is necessary
General employees (5,129 people)
B Dialogue I am actively participating in dialogue outsidemy department
C Ingenuity I am incorporating my ingenuity in my work
D Self-sustaining I actively set goals for my actions
E Self-sustaining I am always positive about my work
F Self-sustaining I am proactive in everything I do
Global Coaching Program participants (614 people)
Hitachi Chemical’s Value Creation Process
32
Annual Report 2014
Diversity ManagementPeople
In order to deal with the increasing globalization and more diverse customer needs, Hitachi Chemical promotes diversity, positioning “innovations and solutions created by human resources with diverse skills, ideas and values as management strategy for expanding the Group’s overall potential.” Hitachi
Chemical is making company-wide efforts by encouraging this approach through updates in its systems and structure environments while the president addresses employees in his/her message on the “acceleration of diversity.”
Basic Approach
Global Leadership ForumThe Hitachi Chemical Group has been conducting the Glob-al Leadership Forum for the national management staff of its foreign sites every year. In fiscal year 2013, Hitachi Chemical newly incorporated a program to help the par-ticipants review their leadership and a discussion program inviting next-generation managers in the forum. The Group is also expanding its foreign language learning programs to help its employees improve their English skills and develop “World Class Professionals” who can compete globally.
More opportunities for womenThe Hitachi Chemical Group continuously supports more career opportunities for female employees. In fiscal year 2013, women accounted for over 30% of the Company’s new recruits. The Company appointed its first female outside director in the same year. However, the ratio of women in management positions was only 2% in fiscal year 2013. The Group is working on promoting the company-wide employ-ment of female employees by setting and managing new targets designed to achieve an equal ratio between men and women in management.
In fiscal year 2013, the Company increased the number of female employees dispatched to J-Win, an NPO pro-moting diversity, from two to seven. The existing and new members conducted a hearing for female employees on how the system and environment could be improved to help them become part of the long-term labor force and presented their proposals to the man-agement. As a result, a designated section for diversity promotion was launched in fiscal year 2014.
Hiring of foreign nationalsHitachi Chemical employs human resources regardless of their nationalities.
Out of new recruits in fiscal year 2013, foreign nationals accounted for 14%. Hitachi Chemical will continue actively hiring foreign nationals to help it become better-positioned to deal with rapidly globalized business environments. The Group is developing an employee training system that includes global-standardized performance evaluation and training opportunities to train individuals to exhibit skills regardless of their nationalities.
Promoting employment of disabled peopleHitachi Chemical has been assigning disabled employees to wider areas of work while improving its facilities to make them more accessible to disabled workers.
In fiscal year 2013, disabled employees accounted for 2.06% of the Company’s workforce, and 2.27% on a Japanese Group basis (over 200 employed, 12 companies combined), both of which exceed the ratio required by the law. Hitachi Chemical will continue its efforts to provide more employment opportunities to disabled people while sharing information within the Group.
Promoting wider opportunities for re-employed workersThe Company has established a re-employment system for retirees aged 60 or older. As of April 2014, 136 people are employed under this system. It has been developed to help employees to continue working based on their substantial experience and skills beyond retirement age, until they reach 65.
Developments in Fiscal Year 2013
Yukako Uchinaga, J-Win Director (second right, font row), with President and employees of the Company(Photo from the 24th issue of J-Win report)
Employment Ratio of Disabled People(%)
FY 2009 2010 2011 2012 2013
JapaneseGroup 2.01 2.13 1.97 2.18 2.27
The Company alone 2.10 2.19 1.93 2.02 2.06
Hitachi Chemical’s Value Creation Process
Inputs Hitachi Chemical business activities
Hitachi Chemical products and services (Outputs)
Providing value to stakeholders

33
Annual Report 2014
WOW-BB book published and distributed to all employeesBased on the “Management Message” for the next 50 years and beyond and the Single Word Workshop initiative that had been provided to the entire workforce of the Group, Hitachi Chemical conduct-ed further discussions and incorporated the results in the new Hitachi Chemical Group Vision.
WOW-BB book –2023 Corporate Bro-chure is a manifestation of this vision and em-bodies management’s commitment to WOW Marketing and lays out five challenges that Hitachi Chemi-cal takes on– 1 Have the ability to identify needs; 2 Envision
future scenarios; 3 Create the next core technologies; 4
Become a globally-preferred company; and 5 Develop work styles that allow for co-creation.
Starting April 2014, WOW-BB book has been distribut-ed to employees of all the Group’s global sites and will be the basis for conducting “WOW Global Award” and “Sce-nario Planning.”
Developments in Fiscal Year 2013
Working On Wonders Beyond Boundaries (WOW-BB) ActivitiesPeople
Hitachi Chemical discussed “Hitachi Chemical 50 years and beyond” as it celebrated its 50th anniversary, and launched Working On Wonders Beyond Boundaries (WOW-BB) activ-ities focused on the next 10 years as the first step toward “Hitachi Chemical 50 years and beyond.”
In fiscal year 2014, Hitachi Chemical launched two ac-tivities: WOW Global Award and Scenario Planning. WOW Global Award is an award program for global employees of the Hitachi Chemical Group that encourages them to make efforts and take actions around specific themes. Supporting employees in their active endeavors is part of our challenge to “create a corporate culture” to help us continue growing for the next 50 years and beyond. Scenario Planning is a new method that is incorporated into strategy development based on our business and functional axes. This is designed to help the Group achieve “business creation” with the prospect for future social environments and customer needs by ensuring that the Group has several “strategic options” to prepare for future uncertainties.
Basic Approach
Purpose of WOW-BB
Aggressive corporate culture
Development of original technologies
Forward-looking business approach
Scenario developed with long-term perspectives
Proactively creating and delivering what society is looking for
Marketing based on self-discovery
Hitachi Chemical becomes a powerful group with a challenging spirit that continuously innovates,
building on individual initiatives
Hitachi Chemical’s Value Creation Process

FY 2009 2010 2011 2012 2013
Total 237 192 228 223 220
Social Contribution Expenditure
(Fiscal Year 2013)
102.61million yen
Cash donations33%
In-kind donations1%
Offering use of facilities22%
Costs for self-organized programs36%
Participation / dispatch of employees5%
Support for disaster-affected areas3%
34
Annual Report 2014
Updating IR activitiesThe Hitachi Chemical Group discloses information about its business strategies, financial standings and CSR as needed and appropriate to gain the understanding of its sharehold-ers and investors including overseas institutional investors and their fair evaluations. Hitachi Chemical is taking various measures for improvement while identifying issues through dialogues with analysts, shareholders and investors. The Group’s CSR-related efforts and information have been acclaimed and selected for the following SRI indices.
Social contribution activitiesBased on the philosophy that “a company is a member of society,” Hitachi Chemical has been actively engaged in social contribution activities including preservation of the global environment and development of human resources that will
lead the next generation, with a focus on areas closely related to the Group. Hitachi Chemical also follows up on the costs associated with such activities to improve its initiatives further.
Survey for all employeesIn September 2013, Hitachi Chemical conducted a survey for its entire workforce and around 5,129 responded. Asked about the satisfaction with their work, 54% responded they were satisfied. 14% were unsatisfied and 32% were neither satisfied nor dissatisfied with the current work. An-other survey, conducted in January 2014, sought to collect employees’ feedback on the organizational culture and management system. These results are incorporated into the Executive Officers’ Meeting, then shared with each company and division in order to further develop working environments that are satisfying and rewarding.
The Town Meeting–opportunity for dialogue between Executive Officers and employeesTown Meeting is an opportunity where Hitachi Chemical’s Executive Officers visit Hitachi Chemical sites in Japan and abroad and explain relevant matters directly to the employ-ees and takes questions and provide answers in a dialogue setting. This has been designed to ensure the employees of all Group companies understand Hitachi Chemical’s corpo-rate vision, budgets and Mid-term Plans and also develop a “culture of dialogue” within the Group that allows for free and candid exchange of opinions.
Town Meetings held in fiscal year 2013 received 416 opinions and questions. Feedback from employees is shared among all Executive Officers and reflected in the management of Hitachi Chemical.
With the goal of achieving a sustainable society, the Hitachi Chemical Group has been working to integrate CSR into its business activities and ensure business management that is fair to all stakeholders. As part of these efforts, Hitachi Chemical has active dialogues and communication with various stakeholders and conducts fair business activities to gain further trust as a corporate group.
Number of Interviews with Investors
Social Contribution Expenditure
Global Environment
Society
Hitachi Chemical
Employees
CustomersSuppliers
ShareholdersInvestors
GovernmentPublic Administration
Town Meeting
Interactive Communication with StakeholdersPeople
Basic Approach
Relations with Stakeholders
Developments in Fiscal Year 2013
Hitachi Chemical’s Value Creation Process
Inputs Hitachi Chemical business activities
Hitachi Chemical products and services (Outputs)
Providing value to stakeholders

Optically clear �lm that �lls interlayer spacesClear adhesive �lm, in liquid form, that makes screens more viewable
Lithium-ion battery anode materialsCarbon anode materials that contribute to larger battery capacity
Coating resins used for paintsResins which serve as base polymers for many types of highly functional paints, such as high-gloss and scratch-resistant paints
Energy storage devices
Power storage systemA system that stores power in the evening for use during the day
Original electrical storage systems that support the steady supply of electrical power
Contributing to the use of natural energy
Wind power generation
Carbon brushesComponents that draw electricity from power generator
Electrical insulating varnishesIts is an insulating material indispensable in power generator coils. Automobiles
Lithium-ion battery carbon anode materials for electric vehiclesMaterials making possible specialized lithium-ion batteries with high capacity and high discharge load
Automotive-use lead-acid batteriesHigh-endurance batteries for many types of vehicles, including those with Idling Stop Systems (ISS)
Plastic back door modulesStylishly designed and lightweight, for added fuel ef�ciency, plastic modules for the back doors of vehicles
Electrical insulating varnishesVarnishes used in the motors of hybrid vehicle drive systems, as well as in motors in other vehicle components
Semiconductors for PCs, etc.
Die bonding �lmsUltra-thin adhesive �lms used in securing semiconductor chips
Copper-clad laminates for printed wiring boardsBase materials for printed wiring boards
Photosensitive dry �lms for printed wiring boardsFilms for making printed wiring board circuits
CMP slurryMaterials used for polishing �ne irregularities in semiconductor circuits
Epoxy molding compoundsResin for protecting semiconductor chips from heat, dust, etc.
Systems used to manage sushi-go-round plates and ensure great tasting food
Restaurants and Sushi-go-round restaurants
RFID tagsTags instrumental in identifying and managing items
Food wrapping �lmWrap that resists rupture and shrinkage in microwave ovens
Components instrumental in vehicle safety
Vehicle-to-vehicle
Disc brake padsHigh performance brake pads that stop vehicles in rain, snow and other adverse conditions
Surface antennasSurface antennas for vehicle radars to maintain safe distances between vehicles
Provides energy-saving, long-life lighting
LED lighting
White epoxy molding compoundsMaterial that boosts brightness and is used in the re�ector for LED light
High thermal conductivity adhesive sheetsMaterial that readily dissipates heat produced by LEDs and extends their life
Quietly supporting the on-time arrival of trains
Trains
Carbon brushesComponents that send electricity to motor rotors
Electrical insulating varnishesIt is an insulating material indispensable in motor coils.
Arti�cial satellites
Multi Wiring boardsWiring boards with excellent reliability even under extreme conditions
Hitachi Chemical's wiring boards are also utilized in space
Materials taking a role in improving fuel ef�ciency and making environmentally friendly vehicles a reality
Essential materials for semiconductors that are the brains of electric and electronic devices
PET scanners
GSO single crystalsA scintillator used with a PET scanner to pinpoint the location of cancer cells
Instrumental in the early detection of cancer
Power shovels
Axle bearings (powder metal products)Robust, abrasion-resistant components that are sintered and compact-molded from metal powders
Products that help lubri-cate the joints of con-struction equipment
Roofs of houses
Conductive �lmsFilm for interconnecting micro electrodes on photovoltaic cells
Instrumental in helping solar panels generate electricity more ef�ciently
Walls of buildings
Acrylic resins for paintsResins that form the base for various paints used on building exteriors
Resins that form the base for the paint on building exteriors help keep them attractive over long periods
Golf courses
Battery passenger cart systemGolf carts that automatically drive themselves
Golf carts make transportation easy on sprawling golf courses
SmartphonesEssential smartphone components that ensure optimal display quality and extended use
Moisture proof insulating varnishesVarnishes for coating the electrodes of liquid crystals to protect them from moisture and short-circuiting
Adhesive �lmProtective �lm to prevent scratches to components during the manufacturing process
Anisotropic conductive �lmFilm that can interconnect several �ne, micron-sized circuits at once
LCD TVsMaterials that support the new generation of thin-screen high-precision LCD TVs
Allergy tests
MAST III measuring reagent A reagent that is used to test patients up to 33 major allergens with a single serum sample
Diagnostic kits used for pollen and food allergy tests
35
Annual Report 2014
Hitachi Chemical Products and Services (Outputs)
Functional Materials Segment Advanced Components and Systems Segment
New products continue to enter the market at a constant pace. Innovations in materials underpin this uninterrupted stream of evolution. Hitachi Chemical employs its wide-ranging technological fields that harness both organic and inorganic chemicals cultivated over many years to deliver leading-edge functional materials that assist customers in resolving problems.
Social and environment needs are becoming increasingly in-tricate and diverse. By combining and adapting its cumulative portfolio of advanced material and processing technologies, Hitachi Chemical is developing highly reliable advanced com-ponents and systems that address customer needs in a diverse spectrum of fields including automobiles, industrial energy, electronic devices and life sciences.
Net Sales / Operating Income
(FY) (FY)
(Billions of yen) (Billions of yen)Net Sales Operating Income (right)
2009 2010 2011 2012 2013
493.8 billion yen
FY2013Net Sales
6.3% increase year over year
0
100
200
300
400
0
10
20
30
40
(Billions of yen)
0
10
20
30
40
32.1
240.7 252.0 244.9 245.2 260.8
31.1
20.1 21.424.4
2009 2010 2011 2012 20130
100
200
300
400
6.2
214.6245.5
228.2 219.5 233.0
12.4
4.42.2 3.4
(Billions of yen) Net Sales Operating Income (right)
Net Sales / Operating Income
The products of the Hitachi Chemical Group are used as materials and in the components employed in a variety of familiar items, including digital household appliances and automobiles, and act as the unseen contributors to enhancing the functions and performance of those items.
Hitachi Chemical’s Value Creation Process

Optically clear �lm that �lls interlayer spacesClear adhesive �lm, in liquid form, that makes screens more viewable
Lithium-ion battery anode materialsCarbon anode materials that contribute to larger battery capacity
Coating resins used for paintsResins which serve as base polymers for many types of highly functional paints, such as high-gloss and scratch-resistant paints
Energy storage devices
Power storage systemA system that stores power in the evening for use during the day
Original electrical storage systems that support the steady supply of electrical power
Contributing to the use of natural energy
Wind power generation
Carbon brushesComponents that draw electricity from power generator
Electrical insulating varnishesIts is an insulating material indispensable in power generator coils. Automobiles
Lithium-ion battery carbon anode materials for electric vehiclesMaterials making possible specialized lithium-ion batteries with high capacity and high discharge load
Automotive-use lead-acid batteriesHigh-endurance batteries for many types of vehicles, including those with Idling Stop Systems (ISS)
Plastic back door modulesStylishly designed and lightweight, for added fuel ef�ciency, plastic modules for the back doors of vehicles
Electrical insulating varnishesVarnishes used in the motors of hybrid vehicle drive systems, as well as in motors in other vehicle components
Semiconductors for PCs, etc.
Die bonding �lmsUltra-thin adhesive �lms used in securing semiconductor chips
Copper-clad laminates for printed wiring boardsBase materials for printed wiring boards
Photosensitive dry �lms for printed wiring boardsFilms for making printed wiring board circuits
CMP slurryMaterials used for polishing �ne irregularities in semiconductor circuits
Epoxy molding compoundsResin for protecting semiconductor chips from heat, dust, etc.
Systems used to manage sushi-go-round plates and ensure great tasting food
Restaurants and Sushi-go-round restaurants
RFID tagsTags instrumental in identifying and managing items
Food wrapping �lmWrap that resists rupture and shrinkage in microwave ovens
Components instrumental in vehicle safety
Vehicle-to-vehicle
Disc brake padsHigh performance brake pads that stop vehicles in rain, snow and other adverse conditions
Surface antennasSurface antennas for vehicle radars to maintain safe distances between vehicles
Provides energy-saving, long-life lighting
LED lighting
White epoxy molding compoundsMaterial that boosts brightness and is used in the re�ector for LED light
High thermal conductivity adhesive sheetsMaterial that readily dissipates heat produced by LEDs and extends their life
Quietly supporting the on-time arrival of trains
Trains
Carbon brushesComponents that send electricity to motor rotors
Electrical insulating varnishesIt is an insulating material indispensable in motor coils.
Arti�cial satellites
Multi Wiring boardsWiring boards with excellent reliability even under extreme conditions
Hitachi Chemical's wiring boards are also utilized in space
Materials taking a role in improving fuel ef�ciency and making environmentally friendly vehicles a reality
Essential materials for semiconductors that are the brains of electric and electronic devices
PET scanners
GSO single crystalsA scintillator used with a PET scanner to pinpoint the location of cancer cells
Instrumental in the early detection of cancer
Power shovels
Axle bearings (powder metal products)Robust, abrasion-resistant components that are sintered and compact-molded from metal powders
Products that help lubri-cate the joints of con-struction equipment
Roofs of houses
Conductive �lmsFilm for interconnecting micro electrodes on photovoltaic cells
Instrumental in helping solar panels generate electricity more ef�ciently
Walls of buildings
Acrylic resins for paintsResins that form the base for various paints used on building exteriors
Resins that form the base for the paint on building exteriors help keep them attractive over long periods
Golf courses
Battery passenger cart systemGolf carts that automatically drive themselves
Golf carts make transportation easy on sprawling golf courses
SmartphonesEssential smartphone components that ensure optimal display quality and extended use
Moisture proof insulating varnishesVarnishes for coating the electrodes of liquid crystals to protect them from moisture and short-circuiting
Adhesive �lmProtective �lm to prevent scratches to components during the manufacturing process
Anisotropic conductive �lmFilm that can interconnect several �ne, micron-sized circuits at once
LCD TVsMaterials that support the new generation of thin-screen high-precision LCD TVs
Allergy tests
MAST III measuring reagent A reagent that is used to test patients up to 33 major allergens with a single serum sample
Diagnostic kits used for pollen and food allergy tests
36
Annual Report 2014
Inputs Hitachi Chemical business activities
Hitachi Chemical products and services (Outputs)
Providing value to stakeholders
Hitachi Chemical’s Value Creation Process
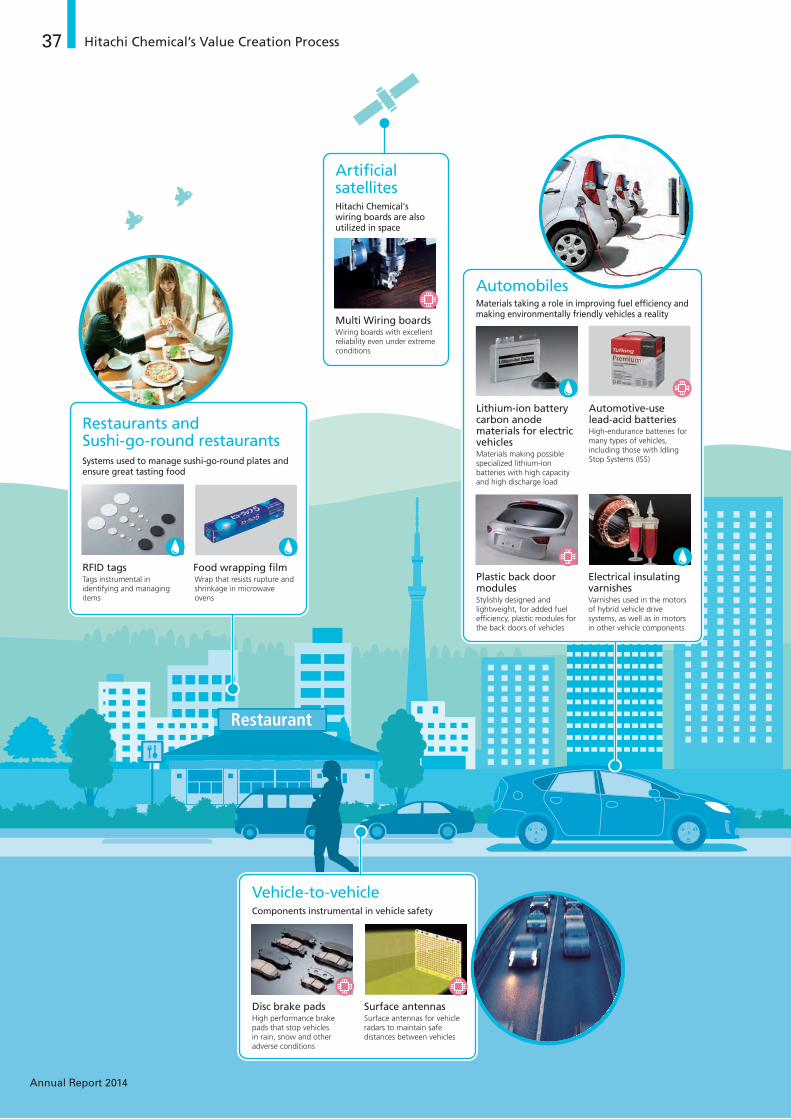
Optically clear �lm that �lls interlayer spacesClear adhesive �lm, in liquid form, that makes screens more viewable
Lithium-ion battery anode materialsCarbon anode materials that contribute to larger battery capacity
Coating resins used for paintsResins which serve as base polymers for many types of highly functional paints, such as high-gloss and scratch-resistant paints
Energy storage devices
Power storage systemA system that stores power in the evening for use during the day
Original electrical storage systems that support the steady supply of electrical power
Contributing to the use of natural energy
Wind power generation
Carbon brushesComponents that draw electricity from power generator
Electrical insulating varnishesIts is an insulating material indispensable in power generator coils. Automobiles
Lithium-ion battery carbon anode materials for electric vehiclesMaterials making possible specialized lithium-ion batteries with high capacity and high discharge load
Automotive-use lead-acid batteriesHigh-endurance batteries for many types of vehicles, including those with Idling Stop Systems (ISS)
Plastic back door modulesStylishly designed and lightweight, for added fuel ef�ciency, plastic modules for the back doors of vehicles
Electrical insulating varnishesVarnishes used in the motors of hybrid vehicle drive systems, as well as in motors in other vehicle components
Semiconductors for PCs, etc.
Die bonding �lmsUltra-thin adhesive �lms used in securing semiconductor chips
Copper-clad laminates for printed wiring boardsBase materials for printed wiring boards
Photosensitive dry �lms for printed wiring boardsFilms for making printed wiring board circuits
CMP slurryMaterials used for polishing �ne irregularities in semiconductor circuits
Epoxy molding compoundsResin for protecting semiconductor chips from heat, dust, etc.
Systems used to manage sushi-go-round plates and ensure great tasting food
Restaurants and Sushi-go-round restaurants
RFID tagsTags instrumental in identifying and managing items
Food wrapping �lmWrap that resists rupture and shrinkage in microwave ovens
Components instrumental in vehicle safety
Vehicle-to-vehicle
Disc brake padsHigh performance brake pads that stop vehicles in rain, snow and other adverse conditions
Surface antennasSurface antennas for vehicle radars to maintain safe distances between vehicles
Provides energy-saving, long-life lighting
LED lighting
White epoxy molding compoundsMaterial that boosts brightness and is used in the re�ector for LED light
High thermal conductivity adhesive sheetsMaterial that readily dissipates heat produced by LEDs and extends their life
Quietly supporting the on-time arrival of trains
Trains
Carbon brushesComponents that send electricity to motor rotors
Electrical insulating varnishesIt is an insulating material indispensable in motor coils.
Arti�cial satellites
Multi Wiring boardsWiring boards with excellent reliability even under extreme conditions
Hitachi Chemical's wiring boards are also utilized in space
Materials taking a role in improving fuel ef�ciency and making environmentally friendly vehicles a reality
Essential materials for semiconductors that are the brains of electric and electronic devices
PET scanners
GSO single crystalsA scintillator used with a PET scanner to pinpoint the location of cancer cells
Instrumental in the early detection of cancer
Power shovels
Axle bearings (powder metal products)Robust, abrasion-resistant components that are sintered and compact-molded from metal powders
Products that help lubri-cate the joints of con-struction equipment
Roofs of houses
Conductive �lmsFilm for interconnecting micro electrodes on photovoltaic cells
Instrumental in helping solar panels generate electricity more ef�ciently
Walls of buildings
Acrylic resins for paintsResins that form the base for various paints used on building exteriors
Resins that form the base for the paint on building exteriors help keep them attractive over long periods
Golf courses
Battery passenger cart systemGolf carts that automatically drive themselves
Golf carts make transportation easy on sprawling golf courses
SmartphonesEssential smartphone components that ensure optimal display quality and extended use
Moisture proof insulating varnishesVarnishes for coating the electrodes of liquid crystals to protect them from moisture and short-circuiting
Adhesive �lmProtective �lm to prevent scratches to components during the manufacturing process
Anisotropic conductive �lmFilm that can interconnect several �ne, micron-sized circuits at once
LCD TVsMaterials that support the new generation of thin-screen high-precision LCD TVs
Allergy tests
MAST III measuring reagent A reagent that is used to test patients up to 33 major allergens with a single serum sample
Diagnostic kits used for pollen and food allergy tests
37
Annual Report 2014
Hitachi Chemical’s Value Creation Process
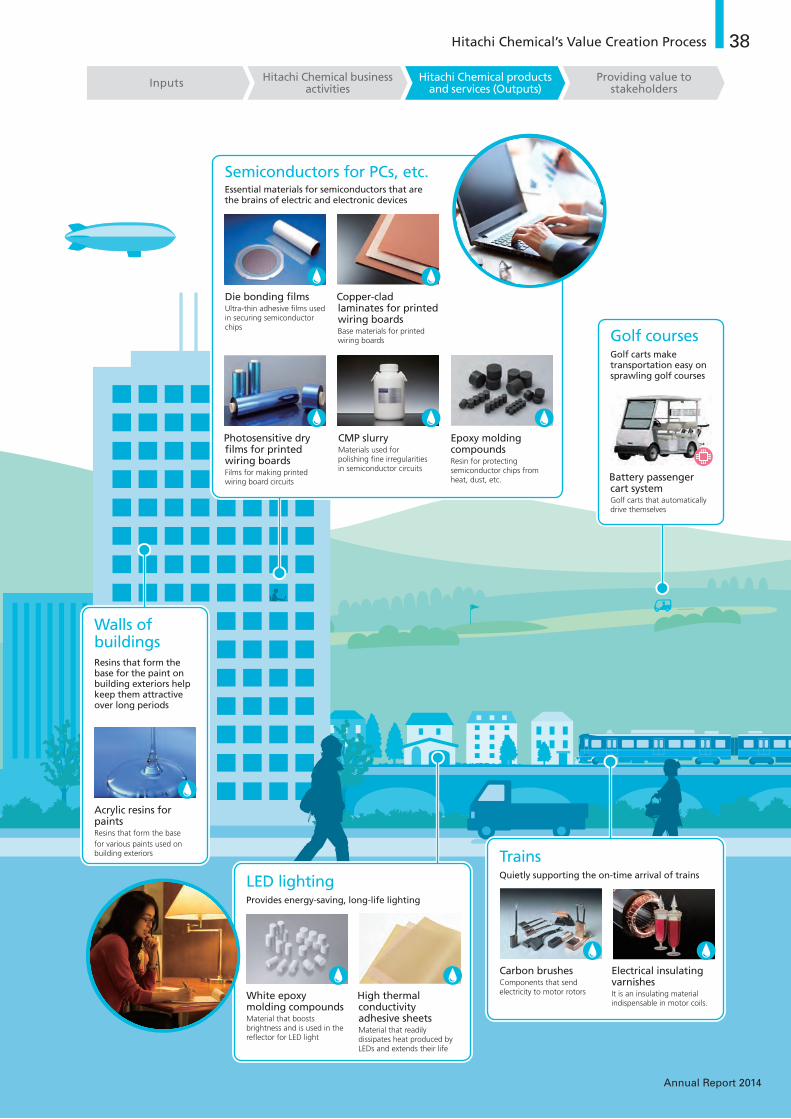
Optically clear �lm that �lls interlayer spacesClear adhesive �lm, in liquid form, that makes screens more viewable
Lithium-ion battery anode materialsCarbon anode materials that contribute to larger battery capacity
Coating resins used for paintsResins which serve as base polymers for many types of highly functional paints, such as high-gloss and scratch-resistant paints
Energy storage devices
Power storage systemA system that stores power in the evening for use during the day
Original electrical storage systems that support the steady supply of electrical power
Contributing to the use of natural energy
Wind power generation
Carbon brushesComponents that draw electricity from power generator
Electrical insulating varnishesIts is an insulating material indispensable in power generator coils. Automobiles
Lithium-ion battery carbon anode materials for electric vehiclesMaterials making possible specialized lithium-ion batteries with high capacity and high discharge load
Automotive-use lead-acid batteriesHigh-endurance batteries for many types of vehicles, including those with Idling Stop Systems (ISS)
Plastic back door modulesStylishly designed and lightweight, for added fuel ef�ciency, plastic modules for the back doors of vehicles
Electrical insulating varnishesVarnishes used in the motors of hybrid vehicle drive systems, as well as in motors in other vehicle components
Semiconductors for PCs, etc.
Die bonding �lmsUltra-thin adhesive �lms used in securing semiconductor chips
Copper-clad laminates for printed wiring boardsBase materials for printed wiring boards
Photosensitive dry �lms for printed wiring boardsFilms for making printed wiring board circuits
CMP slurryMaterials used for polishing �ne irregularities in semiconductor circuits
Epoxy molding compoundsResin for protecting semiconductor chips from heat, dust, etc.
Systems used to manage sushi-go-round plates and ensure great tasting food
Restaurants and Sushi-go-round restaurants
RFID tagsTags instrumental in identifying and managing items
Food wrapping �lmWrap that resists rupture and shrinkage in microwave ovens
Components instrumental in vehicle safety
Vehicle-to-vehicle
Disc brake padsHigh performance brake pads that stop vehicles in rain, snow and other adverse conditions
Surface antennasSurface antennas for vehicle radars to maintain safe distances between vehicles
Provides energy-saving, long-life lighting
LED lighting
White epoxy molding compoundsMaterial that boosts brightness and is used in the re�ector for LED light
High thermal conductivity adhesive sheetsMaterial that readily dissipates heat produced by LEDs and extends their life
Quietly supporting the on-time arrival of trains
Trains
Carbon brushesComponents that send electricity to motor rotors
Electrical insulating varnishesIt is an insulating material indispensable in motor coils.
Arti�cial satellites
Multi Wiring boardsWiring boards with excellent reliability even under extreme conditions
Hitachi Chemical's wiring boards are also utilized in space
Materials taking a role in improving fuel ef�ciency and making environmentally friendly vehicles a reality
Essential materials for semiconductors that are the brains of electric and electronic devices
PET scanners
GSO single crystalsA scintillator used with a PET scanner to pinpoint the location of cancer cells
Instrumental in the early detection of cancer
Power shovels
Axle bearings (powder metal products)Robust, abrasion-resistant components that are sintered and compact-molded from metal powders
Products that help lubri-cate the joints of con-struction equipment
Roofs of houses
Conductive �lmsFilm for interconnecting micro electrodes on photovoltaic cells
Instrumental in helping solar panels generate electricity more ef�ciently
Walls of buildings
Acrylic resins for paintsResins that form the base for various paints used on building exteriors
Resins that form the base for the paint on building exteriors help keep them attractive over long periods
Golf courses
Battery passenger cart systemGolf carts that automatically drive themselves
Golf carts make transportation easy on sprawling golf courses
SmartphonesEssential smartphone components that ensure optimal display quality and extended use
Moisture proof insulating varnishesVarnishes for coating the electrodes of liquid crystals to protect them from moisture and short-circuiting
Adhesive �lmProtective �lm to prevent scratches to components during the manufacturing process
Anisotropic conductive �lmFilm that can interconnect several �ne, micron-sized circuits at once
LCD TVsMaterials that support the new generation of thin-screen high-precision LCD TVs
Allergy tests
MAST III measuring reagent A reagent that is used to test patients up to 33 major allergens with a single serum sample
Diagnostic kits used for pollen and food allergy tests
38
Annual Report 2014
Hitachi Chemical’s Value Creation Process
Inputs Hitachi Chemical business activities
Hitachi Chemical products and services (Outputs)
Providing value to stakeholders

0
-15,000
-10,000
-5,000
5,000
Operating IncomeOperating Margin
ShareholdersInvestors
Operating Income / Operating Margin(Millions of yen)
Net Sales by Destination and Ratio to Net Sales(Millions of yen) (%)
Cash Dividends per Share / Payout Ratio(Yen) (%)
Average Number of Years of Continuous Service*1
(%)
Employees
Number of Participants in Social Contribution Activities
Corporate and Other Taxes Paid
0
10,000
20,000
30,000
40,000
50,000
0
2.0
4.0
6.0
8.0
10.0
0
100,000
200,000
300,000
400,000
500,000
(Millions of yen)
Through prompt and fair disclosure of information and high-quality communication, we strive to heighten our presence in the capital market and increase our corporate value.
We provide a pleasant and safe working environment while respecting human rights and promoting individual growth through education.
We aim for the development of next-generation technologies and the steady supply of reliable products through the maintenance of good partnerships. We identify and deal with risks from a perspective encompassing the entire value chain.
We make ongoing contributions to local communities, residents and the international community through understanding the conditions and circumstances of the regions in which we do business.
0
1,000
2,000
3,000
4,000
0
10
20
30
40
0
10
20
30
40
50
2009 2010 2011 201320120
5,000
10,000
15,000
20,000
2009 2010 2011 20132012
0
5
10
15
20
2009 2010 2011 20132012
2009 2010 2011 20132012
(Yen)
Net Income per Share
0
20
40
60
80
100
120
2009 2010 2011 20132012
Economic Effects of Environmental Accounting*6
(Millions of yen)
0
1,000
2,000
3,000
4,000
2009 2010 2011 20132012
Emission of Wastes*6
(1,000 tons)
0
20
40
60
80
2009 2010 2011 20132012
2009 2010 2011 20132012
ROE / ROA(%)
0
2.0
4.0
6.0
8.0
10.0
ROE ROA
2009 2010 2011 20132012 2009 2010 2011 20132012
Inclusion in Socially Responsible Investment (SRI) Indices
Female Male
Percentage of Sustainable Engineering Product Sales(%)
2009 2010 2011 20132012
Customers Suppliers
Society
Emissions of VOC*6
(Tons)
0
200
400
600
2009 2010 2011 20132012
Number of Participants in Compliance Training
0
1,000
500
1,500
2,000
2009 2010 2011 20132012
Global Environment With conservation of the global environment being an issue of propriety for management, we are pursuing technological development and production activities through implementation of sustainable engineering.
Greenhouse Effect Gas Emissions*6 (1,000 tons)
0
200
300
400
500
100
2009 2010 2011 20132012
We constantly update our knowledge of, and strictly adhere to, the statutory and regulatory requirements of the countries and regions in which we do business and ful�ll obligations as a good corporate citizen.
Participation Rate in Town Meetings*3
(%)
Number of Participants in Global Coaching Program*5
0
1,000
1,500
2,000
2,500
500
Number of Participants in Global Leadership Forum*4
2009 2010 2011 20132012 2009 2010 2011 20132012 2009 2010 2011 201320120
40
20
60
80
100
0
20
30
40
50
10
Japan
Overseas
Changes in Accident Frequency Rate and Severity Rate*2
2009 2010 2011 201320120
0.2
0.1
0.3
0.4
0.5 Frequency Rate Severity Rate
Government / Public Administration
In recognition of Hitachi Chemical Group’s CSR initiatives, in �scal year 2013 the Group has again been included in such global socially responsible investment (SRI) indices as the Dow Jones Sustainability Asia Paci�c Index, the FTSE4Good Index Series and Morningstar (MS-SRI) for �ve, eleven and eight consecutive years, respectively.
Cash Flows from Operating Activities(Millions of yen)
Cash Flows from Financing Activities(Millions of yen)
0
10,000
20,000
30,000
40,000
50,000
60,000
2009 2010 2011 20132012
2009 2010 2011 20132012
Cash Flows from Investing Activities(Millions of yen)
2009 2010 2011 20132012
Refer to for details. Top Message
(FY) (FY) (FY)
Refer to for details. P.23
Refer to for details. P.29
Refer to for details. P.26
Refer to for details. P.34
Refer to for details. P.31
Refer to for details. P.34
(FY) (FY) (FY)
(FY) (FY)
(FY) (FY) (FY)
(FY)(FY) (FY)
(FY)(FY) (FY)
(FY)(FY)
(FY) (FY)
Customer Satisfaction Percentage*7
Customers with satisfaction
Investigation coverage(%)
2009 2010 2011 20132012 (FY)
0
20
30
40
50
60
10
Cash Dividends per SharePayout Ratio
0
40
20
60
80
100
0
40
60
80
20-80,000
-60,000
-40,000
-20,000
0
Japan Asia
Other
39
Annual Report 2014
Providing Value to Stakeholders
Hitachi Chemical’s Value Creation Process

0
-15,000
-10,000
-5,000
5,000
Operating IncomeOperating Margin
ShareholdersInvestors
Operating Income / Operating Margin(Millions of yen)
Net Sales by Destination and Ratio to Net Sales(Millions of yen) (%)
Cash Dividends per Share / Payout Ratio(Yen) (%)
Average Number of Years of Continuous Service*1
(%)
Employees
Number of Participants in Social Contribution Activities
Corporate and Other Taxes Paid
0
10,000
20,000
30,000
40,000
50,000
0
2.0
4.0
6.0
8.0
10.0
0
100,000
200,000
300,000
400,000
500,000
(Millions of yen)
Through prompt and fair disclosure of information and high-quality communication, we strive to heighten our presence in the capital market and increase our corporate value.
We provide a pleasant and safe working environment while respecting human rights and promoting individual growth through education.
We aim for the development of next-generation technologies and the steady supply of reliable products through the maintenance of good partnerships. We identify and deal with risks from a perspective encompassing the entire value chain.
We make ongoing contributions to local communities, residents and the international community through understanding the conditions and circumstances of the regions in which we do business.
0
1,000
2,000
3,000
4,000
0
10
20
30
40
0
10
20
30
40
50
2009 2010 2011 201320120
5,000
10,000
15,000
20,000
2009 2010 2011 20132012
0
5
10
15
20
2009 2010 2011 20132012
2009 2010 2011 20132012
(Yen)
Net Income per Share
0
20
40
60
80
100
120
2009 2010 2011 20132012
Economic Effects of Environmental Accounting*6
(Millions of yen)
0
1,000
2,000
3,000
4,000
2009 2010 2011 20132012
Emission of Wastes*6
(1,000 tons)
0
20
40
60
80
2009 2010 2011 20132012
2009 2010 2011 20132012
ROE / ROA(%)
0
2.0
4.0
6.0
8.0
10.0
ROE ROA
2009 2010 2011 20132012 2009 2010 2011 20132012
Inclusion in Socially Responsible Investment (SRI) Indices
Female Male
Percentage of Sustainable Engineering Product Sales(%)
2009 2010 2011 20132012
Customers Suppliers
Society
Emissions of VOC*6
(Tons)
0
200
400
600
2009 2010 2011 20132012
Number of Participants in Compliance Training
0
1,000
500
1,500
2,000
2009 2010 2011 20132012
Global Environment With conservation of the global environment being an issue of propriety for management, we are pursuing technological development and production activities through implementation of sustainable engineering.
Greenhouse Effect Gas Emissions*6 (1,000 tons)
0
200
300
400
500
100
2009 2010 2011 20132012
We constantly update our knowledge of, and strictly adhere to, the statutory and regulatory requirements of the countries and regions in which we do business and ful�ll obligations as a good corporate citizen.
Participation Rate in Town Meetings*3
(%)
Number of Participants in Global Coaching Program*5
0
1,000
1,500
2,000
2,500
500
Number of Participants in Global Leadership Forum*4
2009 2010 2011 20132012 2009 2010 2011 20132012 2009 2010 2011 201320120
40
20
60
80
100
0
20
30
40
50
10
Japan
Overseas
Changes in Accident Frequency Rate and Severity Rate*2
2009 2010 2011 201320120
0.2
0.1
0.3
0.4
0.5 Frequency Rate Severity Rate
Government / Public Administration
In recognition of Hitachi Chemical Group’s CSR initiatives, in �scal year 2013 the Group has again been included in such global socially responsible investment (SRI) indices as the Dow Jones Sustainability Asia Paci�c Index, the FTSE4Good Index Series and Morningstar (MS-SRI) for �ve, eleven and eight consecutive years, respectively.
Cash Flows from Operating Activities(Millions of yen)
Cash Flows from Financing Activities(Millions of yen)
0
10,000
20,000
30,000
40,000
50,000
60,000
2009 2010 2011 20132012
2009 2010 2011 20132012
Cash Flows from Investing Activities(Millions of yen)
2009 2010 2011 20132012
Refer to for details. Top Message
(FY) (FY) (FY)
Refer to for details. P.23
Refer to for details. P.29
Refer to for details. P.26
Refer to for details. P.34
Refer to for details. P.31
Refer to for details. P.34
(FY) (FY) (FY)
(FY) (FY)
(FY) (FY) (FY)
(FY)(FY) (FY)
(FY)(FY) (FY)
(FY)(FY)
(FY) (FY)
Customer Satisfaction Percentage*7
Customers with satisfaction
Investigation coverage(%)
2009 2010 2011 20132012 (FY)
0
20
30
40
50
60
10
Cash Dividends per SharePayout Ratio
0
40
20
60
80
100
0
40
60
80
20-80,000
-60,000
-40,000
-20,000
0
Japan Asia
Other
*1. Totals include Hitachi Chemical Co., Ltd. only.
*2. Totals include consolidated companies in Japan. Frequency rate: The frequency of accidents and num-
ber of casualties due to occupational accidents per one million hours of work (cumulative).
Severity rate: The degree of accident severity and number of work days lost due to work-loss injuries per 1,000 working hours (cumulative).
*3. Implemented from fiscal year 2010.
*4. Not implemented in fiscal year 2009 and 2011.
*5. Implemented from fiscal year 2012.
*6. Refer to data aggregation for *3 on p.18.
*7. Implemented from fiscal year 2010.
40
Annual Report 2014
Inputs Hitachi Chemical business activities
Hitachi Chemical products and services (Outputs)
Providing value to stakeholders
Hitachi Chemical’s Value Creation Process

41
Annual Report 2014
Hitachi Chemical maintains the highest standards of ethics and business integrity, fulfills its responsibilities of communicating effectively with stakeholders and engages in transparent and sound corporate management.
Hitachi Chemical employs a "Company with Committee System" structure that separates executive and supervisory functions to realize a management structure that is highly objective and transparent. In addition, directors and auditors from Hitachi Chemical are assigned as necessary to Group companies to enhance oversight.
Hitachi Chemical is also striving to augment its structure of corporate governance to ensure its operations conform to the law and its Articles of Incorporation. Hitachi Chemical periodically conducts internal audits of business sites and Group companies. In fiscal year 2013, audits were carried out at 46 locations.
Furthermore, to secure the credibility of our financial reporting, the Group documents its performance and objec-tively evaluates the effectiveness of governance in financial reporting in accordance with the Standards for Management Assessment and Audit concerning Internal Control over Financial Reporting in Japan. The Company discloses results within the framework of the Financial Instruments and Exchange Law. With respect to Group companies, Hitachi Chemical periodically performs operation audits while mon-itoring internal controls and supporting improvements in control environments.
Director compensationAt Hitachi Chemical, in order to increase the appropriateness of compensations for its Directors and enhance their moti-vations, the Compensation Committee discusses policies and standards of compensations for Directors and Executive Officers and determines the compensations for them based on the results of discussion, considering the following two principle policies: 1) with focus on balance with business results, compensations should be a motivation for man-agement that drives not only short-term but medium- and long-term improvement in corporate value; and 2) by making compensations more competitive, it should be possible to attract diverse and excellent human resources. Directors’ compensations consist of monthly base salary and term-end bonuses while Executive Officers’ compensations consist of monthly base salary and performance-based reward.
Compensations for Hitachi Chemical Directors (Fiscal Year 2013)
Corporate Governance Structure (As of the end of June 2014)
Corporate Governance
Type of Management Position
Type of Compensation
Director (excl. Outside Director)
Executive Officer
Outside Director
Total Compensation (in million yen) 50 555 71
Compensation by Category
(in million yen)
Monthly Base Salary 44 460 62
Performance-based Reward / Term-end Bonus 6 95 9
Retirement Bonus – – –
Number of Eligible Directors 4 14 5
* The amounts are rounded off for digits lower than the million.
* The amounts of compensations for Directors who also serve as Executive Officers consist of those for Directors and those for Executive Officers and are included in the chart accordingly.
* 2 of 4 Directors (excluding Outside Directors) serve also as Executive Officers.
Executive Of�cers’ Meeting (An Advisory Body to the Chief Executive Of�cer)
Considers issues of importance which may affect Hitachi Chemical Co., Ltd. or the Hitachi Chemical Group
Shareholders’ Meeting
* 2 of the 9 directors also serve as Executive Of�cers
Board of Directors (9 Directors* including 6 Outside Directors)
President and Chief Executive Of�cerSenior Vice President and Executive Of�cer
Vice President and Executive Of�cerExecutive Of�cer
Nominating Committee (5 Directors, of which 4 are Outside Directors)
Compensation Committee (3 Directors, of which 2 are Outside Directors)
Audit Committee (5 Directors, of which 4 are Outside Directors)
Decisions on proposals for election and dismissal of Directors
Decisions on compensation of Directors and Executive Of�cers
•Audit of Directors’ and Executive Officers’ business operations and preparation of audit report
•Decisions on candidates for Independent Auditors
CSR Management Sector
Risk Management Center
Auditing Of�ce
Supervision
Execution
Independent Auditor (Ernst & Young ShinNihon LLC)
Strengthening Corporate Governance
Corporate Governance

42
Annual Report 2014
CSR promoting structureHitachi Chemical promotes CSR management and all divisions are working together to implement CSR activities horizontally in line with the CSR Medium-term Roadmap: Stage 2. The CSR Management Sector oversees conven-tional CSR-related areas such as Environment & Safety Management, CSR Quality Assurance and Social Contri-bution as well as Public and Investor Relations, Brand PR, Export Management, and Finance & Human Resources. In April 2014, Risk Management Center was launched to
comprehensively deal with the enhancement of gover-nance and the surrounding risks enterprises. The Company also holds the Group Environment and CSR Committee meeting every quarterly settlement
seasons to discuss and determine the Group’s common basic policies and important matters relevant to CSR management.
Risk managementIn preparation for a risk event, the Company has created the Hitachi Chemical Risk Management Implementation Guide-lines, which provides a list of applicable risks and requires all managers and employees to prevent risks from occurring. It also outlines the members and priorities of Emergency Response Headquarters set up when needed, and commu-nications standards during risk events. Especially, risks that can significantly affect the management are reported at the Executive Officers’ Meeting and the Board of Directors’ Meeting as well as disclosed in the Company’s Securities Re-port. The Risk Management Center also includes an internal audit section and is working closely with the Board of Audi-tors as an organization directly reporting to the president, independent of other divisions.
Concept of complianceHitachi Chemical defines that compliance includes not only complying with statutory requirements, the industry’s voluntary standards and corporate and social ethics but also ensuring and improving employee behaviors and common sense according to the corporate ethics, and position it as a core factor of CSR.
To ensure employees fully understand the Hitachi Chem-ical Group Codes of Conduct, Hitachi Chemical has been conducting e-learning programs and case study sessions at all Group companies in and outside Japan so that all understand the Codes of Conduct including the possibility of reprimand in cases of violation. The Hitachi Chemical Group Codes of Conduct Handbook has also been produced, and gives easy-to-understand explanations of the Codes of Conduct in Japanese, English and simplified/traditional Chinese and are distributed to the employees of all Group companies in Japan and overseas. They are requested to meet regularly to
read the handbook to confirm they understand the contents.If, however, a breach of statutory requirements should
nevertheless arise, employees are required to promptly re-port all details to the pre-determined departments involved and to consult with legal advisors toward an early resolution.
The Hitachi Chemical Hotline was established for em-ployees as a consultation and whistle-blowing system for compliance. In fiscal year 2013, there were 15 cases of con-sultation and whistle-blowing from in and outside Japan. However, none of them turned out to be a serious breach of statutory requirements. Personal information is handled appropriately while protecting the secrecy of the person reporting.
CSR Promoting Structure
Risk Management System
President and CEO
Business departments, Sites, Group companies
CSR Management Sector
Group Environment and CSR Committee
CSR Quality Assurance Division
Environmental Safety Promotion Division
Corporate Communication Center
Finance Center
Global Human Resources and Administration Center
Risk Management Center
Board of Directors Meeting
President and CEO
Hitachi Chemical Business
Departments
Group Companies
CSR Management Sector
Risk Management Center
Board of Auditors
CSR Quality Assurance Division
Export Registration & Control Group
Sustainability Group
Global Operations Group
Auditing Of�ce
Environmental Safety Promotion Division
Corporate Communication Center
Number of Consultation and Whistle-blowing Calls
FY 2009 2010 2011 2012 2013
Total 16 24 24 16 15
Corporate Governance
Group Environment and CSR Committee

43
Annual Report 2014
Corporate Governance
Antimonopoly Act workshops
Training on and audit for complianceWithout exception, new and mid-career recruits undergo training on CSR, compliance and human rights.
In fiscal year 2013, the CSR Management Sector conduct-ed education and training programs 38 times (34 times in Japan and four times overseas). The number of participants amounted to 2,072, surpassing the target of 1,000.
Moreover, compliance audits were conducted at one business site of the Company and four Group companies in Japan as well as at four overseas companies to confirm the implementation status of management systems and educa-tion and uncover areas for improvement. The results of each audit are reported to management through the Auditing
Office. In fiscal year 2014, plans are in place to systematically conduct audits at one business site of the Company and four Group companies in Japan and eight overseas companies.
Strict adherence to the Antimonopoly ActHitachi Chemical puts the highest priority on compliance with the Antimonopoly Act in compliance management. Our efforts range from publication and distribution of the Antimonopoly Act Handbook and a message by the presi-dent issued during Hitachi Chemical Group Corporate Ethics Month, calling on employees to strictly adhere to the Anti-monopoly Act. If there is even a hint of any potential breach of the Antimonopoly Act, employees are obliged to record the details in the Compliance Information Record Notebook
and all records are subject to biannual audits conducted by the division in charge of compliance. Furthermore, in July 2013 a lawyer was invited to conduct an Antimo-nopoly Act workshop for employees involved in sales, marketing and busi-ness planning, in which a total of 317 employees participated.
Ensuring strict adherence to information security policiesHitachi Chemical has established the Information Security Policy that manages protection of personal information and information security in an integrated manner. The Company also maintains the same level of security as Hitachi, Ltd., as it is using a shared network environment. To prevent infor-mation leakage from PCs and other information devices and external memory media, we have installed antivirus software, encryption software and email and web filtering systems. Hitachi Chemical also conducts education and
training as well as audits every year to ensure information security is maintained and improved.
In fiscal year 2013, the Company has added and imple-mented education related to the appropriate use of social media. Also, internal audit was carried out at 21 of our do-mestic companies as well as 38 overseas companies while staff were dispatched from Japan to the Group companies in China and Malaysia to inspect the information security situations there.
Record of CSR / Compliance Training (unit: persons)
Objective person
ContentsNew recruits General
employees
Section managers and
higherTotal
Overall compliance 188 521 1,019 1,728
Harassment – 26 1 27
Antimonopoly Act – – 317 317
Total 188 547 1,337 2,072
President and CEO
Person in Charge of Information Security
Information Security Committee
Secretariat (Risk Management Center)
Information Security Organization at Sites
Group Companies
* CISO: Chief Information Security Officer
Information Asset Managers
Managerial Agency
Persons responsible for information security
Information Security Auditors
Information System Owners
Physical Security Manager
Contact for External Affairs
Information Security Promoting Division
The Committee performs the �ve following activities about personal information protection and information security:- Risk management- Deployment of policy- Implementation of measures- Planning and promotion of
education- Conduct audits of the Group
b Chairperson: CISO*b Commissioners Information Security
Educational Chief Information Security Chief
Auditor Information Security
Directive Auditor Commissioners nominated
by CISO
Information Security Management System
In June 2014, Hitachi Chemical was inspected on-site by the Japanese Fair Trade Commission on alleged conspiracy with other manufacturers/sellers in forming a price cartel for aluminum electrolytic capacitor and other products. Also, the Group is currently investigated by overseas competition authorities in Europe, US, and other countries on trading of aluminum electrolytic capacitors, etc. As the Group, we are and will be, from now on as well, cooperating with investigations by the Fair Trade Commission and the competition authorities of these countries.

Directors and Executive Officers (as of the end of June 2014)
Takashi Kawamura
Chieko Matsuda
Shigeru Azuhata
Kazuyuki Tanaka
Yoshio Osawa
Kazuyoshi Tsunoda
Takemoto Oto
Yoshihiro Nomura
George Olcott
44
Annual Report 2014
Committee Members
b NOMINATING COMMITTEE
Takashi KawamuraCommittee Chairman
Shigeru AzuhataCommittee Member
Yoshio OsawaCommittee Member
Takemoto OtoCommittee Member
Kazuyuki TanakaCommittee Member
b AUDIT COMMITTEE
Kazuyoshi TsunodaCommittee Chairman
Yoshio OsawaCommittee Member
Takemoto OtoCommittee Member
George OlcottCommittee Member
Chieko MatsudaCommittee Member
b COMPENSATION COMMITTEE
Kazuyuki TanakaCommittee Chairman
Takashi KawamuraCommittee Member
Shigeru AzuhataCommittee Member
Executive Officers
Kazuyuki TanakaRepresentative Executive OfficerPresident and Chief Executive Officer
Yoshihiro NomuraRepresentative Executive OfficerSenior Vice President and Executive Officer(Oversight of automotive products business and risk management (including corporate export regulation & control and internal control))
Shigeru ItoVice President and Executive Officer(Oversight of energy devices & system business)
Shun-ichiro UchimuraVice President and Executive Officer(Oversight of R&D strategy, new business development, intellectual property and medical business)
Masayuki KanVice President and Executive Officer(Oversight of technology innovation management and operational transformation)
(Production, purchasing and production control)
Akira KanekoExecutive Officer(Production process innovation)
Satoshi TakahashiExecutive Officer(Automotive products business)
Misao NakagawaExecutive Officer(Oversight of advanced performance materials business)
Hajime NakayamaExecutive Officer(Oversight of electronic components business)
Hisashi MaruyamaExecutive Officer(Oversight of CSR)(Risk management (including corporate export regulation & control and internal control))
Toshihiko Miyauchi Executive Officer(Oversight of business strategies)
Masami YamamoriExecutive Officer(Oversight of China business)
Itsuo Watanabe Executive Officer(Oversight of marketing & sales)
Directors
Takashi KawamuraChairman of the BoardOutside Director(Chairman Emeritus, Hitachi, Ltd.)
Shigeru AzuhataOutside Director(Fellow, Hitachi, Ltd.)
Yoshio OsawaOutside Director(Chairman, Konomi, Inc.)
Takemoto OtoOutside Director(Counselor, Nichirei Corp.)
George OlcottOutside Director(Guest Professor, Faculty of Business and Commerce, Keio University)
Chieko MatsudaOutside Director(Professor of Management, Graduate School of Social Science, Tokyo Metropolitan University)
(Professor, Faculty of Urban Liberal Arts, School of Business Administration, Tokyo Metropolitan University)
Kazuyuki TanakaDirector(President and Chief Executive Officer)
Kazuyoshi TsunodaDirector
Yoshihiro NomuraDirector(Senior Vice President and Executive Officer)
Corporate Governance

Annual Report 2014
Financial Section46 Six-Year Summary
47 Management’s Discussion and Analysis of Operations and Finances
52 Consolidated Balance Sheets
54 Consolidated Statements of Income and Consolidated Statements of Comprehensive Income
55 Consolidated Statements of Changes in Net Assets
56 Consolidated Statements of Cash Flows
57 Notes to Consolidated Financial Statements
77 Report of Independent Auditors

46
Annual Report 2014
Financial Section
Hitachi Chemical Co., Ltd. and Consolidated SubsidiariesFor the Years Ended March 31, 2014, 2013, 2012, 2011, 2010 and 2009
SIX-YEAR SUMMARY
Millions of yen (except per share data)
Thousands of U.S. dollars
(except per share data)(Note 1)
2014 2013 2012 2011 2010 2009 2014
For the year:
Net sales ¥ 493,766 ¥ 464,655 ¥ 473,069 ¥ 497,452 ¥ 455,287 ¥ 488,638 $4,793,845
Operating income 27,775 23,559 24,495 43,471 38,341 19,938 269,660
Net income 24,103 18,818 16,427 18,943 23,509 2,740 234,010
Cash dividends 7,497 7,913 7,497 7,497 6,664 6,665 72,786
Capital expenditures 33,492 46,698 37,347 30,432 20,984 35,972 325,165
Depreciation and amortization 24,453 25,255 28,240 28,985 31,666 34,560 237,408
Research and development expenses 26,234 25,534 25,680 26,382 25,402 27,617 254,699
At year-end:
Total assets ¥ 508,080 ¥ 477,880 ¥ 440,981 ¥ 432,184 ¥ 426,586 ¥ 391,350 $4,932,816
Total liabilities 171,694 164,476 153,742 141,873 143,984 127,762 1,666,932
Interest-bearing liabilities (Note 2) 57,590 51,077 40,856 27,151 24,557 30,806 559,126
Total net assets
(Stockholders’ equity) 336,386 313,404 287,239 290,311 282,602 263,588 3,265,884
Per share data:
Net income (basic) ¥ 115.74 ¥ 90.36 ¥ 78.88 ¥ 90.96 ¥ 112.88 ¥ 13.15 $ 1.12
Net income (diluted) — — — — — 13.15 —
Cash dividends 36.00 38.00 36.00 36.00 32.00 32.00 0.35
Net assets 1,588.09 1,474.11 1,359.33 1,320.30 1,289.11 1,203.92 15.42
Value indicators:
Operating margin (%) 5.6 5.1 5.2 8.7 8.4 4.1
Return on sales (%) 4.9 4.0 3.5 3.8 5.2 0.6
Return on equity (ROE) (%) 7.6 6.4 5.9 7.0 9.1 1.1
Return on assets (ROA) (%) 4.9 4.1 3.8 4.4 5.7 0.6
Net worth ratio
(Stockholders’ equity ratio) (%)65.1 64.2 64.2 63.6 62.9 64.1
Debt/Equity ratio (DER) (times) 0.2 0.2 0.1 0.1 0.1 0.1
Inventory turnover (times) 10.1 10.4 11.7 13.2 12.7 12.4
Number of employees 18,149 17,732 16,713 15,930 15,267 15,289
Notes: 1. U.S. dollar amounts in this annual report are translated from yen, solely for the convenience of the reader, at the rate of ¥103=US$1, the approximate exchange rate prevailing on the Tokyo Foreign Exchange Market as of March 31, 2014.
2. Interest-bearing liabilities include trade notes discounted.
47
Annual Report 2014
Financial Section
MANAGEMENT’S DISCUSSION AND ANALYSIS OF OPERATIONS AND FINANCESFor the Year Ended March 31, 2014
RESULTS OF OPERATIONS
Overview of Economic Trends and Business Results
Looking at the world economy during fiscal year 2013, the fiscal year ended March 2014, the U.S. economy continued its grad-ual recovery on the back of strong consumer spending due to the improved employment environment. In Europe as well, the economy is on the road to recovery from the recession stem-ming from the sovereign debt crisis. Developing nations, as is evident in China’s slowing economic growth, have been under-going economic expansion at a gentler pace.
In Japan, corrections to the sudden rise in the yen seen at the beginning of 2013, and an upturn in stock prices, have resulted in increased corporate earnings, and a corresponding rise in capital investment. The latter half of the quarter saw in-creased consumer spending due to last-minute purchases be-fore consumption tax rose, prompting a continuation of the country’s economic recovery.
In such an economic climate, the Hitachi Chemical Group steadily increased its earning power and, in order to further strengthen management infrastructure, implemented the me-dium-term management plan from the beginning of this fiscal year. This strategy comprises 1) the creation of new products and businesses; 2) investment of management resources at key points in the expected future growth fields of environment and energy; and 3) an acceleration in global expansion. In addition, the Group has proactively implemented both a reorganization of business operations in pursuit of more efficient management resources, as well as measures to further reduce costs. One ex-ample of this, in the fields of environment and energy, is that production capability for high-capacity lithium-ion batteries for large-scale power storage systems has increased more than four times, and a production system has been established that can respond rapidly to increased customer demand, particularly in the field of renewable energy. In order to thoroughly cater to in-creasing global demand, we strengthened overseas production systems in a number of areas, including plastic molded prod-ucts, friction materials, and powder metal products for automo-biles, as well as slurry for chemical mechanical planarization for use in semiconductors. In addition, Hitachi Chemical focused on the reorganization of the Group businesses operations. The transfer of the sales, business planning, and research and devel-opment departments of Shin-Kobe Electric Machinery Co., Ltd. to Hitachi Chemical was completed on April 1, 2013, in a bid to enhance synergetic effects through business integration, and on April 1, 2014, Hitachi Powdered Metals Co., Ltd. merged by absorption into Hitachi Chemical with the primary aim of improving management resource efficiency in the automotive products business.
As a result, sales and operating income rose steadily on higher demand, and the positive benefits of business integra-tion. Net income, despite increases in impairment losses and amortization of goodwill, was further boosted by compensation from Tokyo Electric Power Company for suspended operations at the Fukushima Dai-ichi Nuclear Power Station.
Net Sales
As a result of the above measures and the effect of foreign ex-change rates, consolidated net sales for this fiscal year amount-
ed to ¥493,766 million, an increase of 6.3% from the previous fiscal year. This mainly reflected higher demand in the auto-motive and semiconductor markets, along with the effects of depreciation of the yen.
By business segment, in the Functional Materials segment, sales amounted to ¥260,800 million yen, an increase of 6.4% from the previous fiscal year.
In the electronics materials field, sales of epoxy molding compounds for semiconductors rose as a result of widespread adoption, as well as the transfer of the molding compounds business from Nitto Denko Corporation on October 1, 2012. Sales of die bonding materials for semiconductors increased on greater adoption for smartphones and tablet PCs. Sales of slur-ry for chemical mechanical planarization decreased as a result of the impact of slower demand from certain customers. Sales of varnishes increased on high demand for home appliances, stemming from growth in housing starts in Japan.
In the inorganic materials field, sales of carbon anode mate-rials for lithium-ion batteries rose due to an increase in sales for eco-friendly automobiles. Sales of carbon products increased on growth in sales of automobiles in emerging countries.
In the polymer science materials field, sales of functional resins increased due to the positive impact of foreign exchange, despite lower demand for synthetic resins for paints from cer-tain customers. Sales of adhesive films decreased, reflecting lower demand for use in surface protection of the optical sheets used in LCDs. Sales of anisotropic conductive films for displays increased on an upturn in sales for smartphones. Sales of touch panel supporting materials decreased on sluggish demand from certain customers.
In the printed wiring board materials field, sales of cop-per-clad laminates for printed wiring boards decreased, reflect-ing a drop in demand for use in personal computers. Sales of photosensitive dry films for printed wiring boards increased on higher sales for use in smartphones and tablet PCs.
In the Advanced Components and Systems segment, sales amounted to ¥232,966 million, an increase of 6.1% from the previous fiscal year.
In the automotive products field, sales of plastic molded products were on a par with the previous fiscal year, due mainly
Net Sales
488.6 497.5455.3
0
800
600
400
200
473.1 493.8464.7
10 1109 12 13 14
Billions of yen
Years ended March 31

48
Annual Report 2014
Financial Section
to the positive effect of foreign exchange rates, which offset a decrease in demand from certain customers. Sales of friction materials increased on higher sales at overseas subsidiaries. Sales of powder metal products increased on rising demand in Japan and North America.
In the energy storage devices and systems field, sales of vehicle batteries increased as overseas production sites began full-scale operations, along with growth in sales of products used in eco-friendly automobiles equipped with Idling Stop Systems. Sales of industrial batteries and systems decreased due to a fall in sales of power supply devices for telecommunications providers. Sales of capacitors were higher on increased sales for use in wind power and photovoltaic power generation systems.
In the electronics components field, sales of printed wiring boards increased on recovery in demand for use in semiconduc-tor testers.
In the “others” field, revenue from diagnostics and instru-ments remained on a par with the previous fiscal year, as sales of allergy diagnostic kits were stagnant from the beginning of the fiscal year.
Overseas sales amounted to ¥249,661 million, an increase of ¥32,742 million, or 15.1% from the previous fiscal year, with a particularly large gain in Asia. The proportion of overseas sales continued to increase, reaching 50.6% of total net sales, an increase of 3.9 percentage points from a year earlier.
Cost of Sales and Selling, General and Administrative Expenses
Cost of sales amounted to ¥373,940 million, an increase of ¥17,728 million, or 5.0%, compared with the previous fiscal year. This mainly reflected the increase in sales, and higher raw material expenses. The cost of sales ratio to total net sales de-creased 1.0 percentage points to 75.7%, from 76.7% in the previous fiscal year.
Selling, general and administrative (SG&A) expenses amounted to ¥92,051 million, an increase of ¥7,167 million, or 8.4%, from the previous fiscal year. SG&A expenses as a ratio to total net sales edged up 0.3 percentage points to 18.6%, from 18.3% in the previous fiscal year.
Operating Income
Operating income amounted to ¥27,775 million, an increase of ¥4,216 million, or 17.9% from the previous fiscal year. This mainly reflected higher demand in the semiconductor and au-tomotive markets, along with the effects of depreciation of the yen. The operating income margin rose 0.5 percentage points to 5.6%, from 5.1% in the previous fiscal year.
In the Functional Materials segment, operating income to-taled ¥24,400 million, an increase of ¥3,042 million, or 14.2% from the previous fiscal year. The operating income margin for this segment rose 0.7 percentage points to 9.4%
In the Advanced Components and Systems segment, op-erating income totaled ¥3,379 million, an increase of ¥1,161 million, or 52.3% from the previous fiscal year. The operating income margin for this segment rose 0.5 percentage points to 1.5%.
Other Income (Expenses)
Net other income amounted to ¥6,064 million, a decrease of ¥1,403 million from the previous fiscal year. This mainly re-flected a ¥1,664 million increase in impairment losses on fixed assets, and the recording in the subject fiscal year of ¥1,146 million for amortization of goodwill and ¥1,484 million for business structure improvement expenses, offsetting a ¥2,370 million increase in compensation income received from Tokyo Electric Power Company, for loss of income during suspended operations due to the Fukushima Dai-ichi Nuclear Power Station accident.
Net Income
As a result, net income amounted to ¥24,103 million, an in-crease of ¥5,285 million, or 28.1% from the previous fiscal year. As a ratio of net sales, this represented an increase of 0.9 of a percentage point to 4.9%. Return on equity (ROE) increased 1.2 percentage points to 7.6%, and return on assets (ROA) im-proved 0.8 percentage points to 4.9%. Net income per share (basic) increased to ¥115.74 per share, from ¥90.36 in the pre-vious fiscal year.
Operating Income / Operating MarginBillions of yen %
Years ended March 31
Net Income /Net Income per Share (Basic)Billions of yen Yen
Years ended March 31
Return on Equity (ROE) /Return on Assets (ROA)%
Years ended March 31
Net incomeNet income per share (basic)(right scale)
Operating incomeOperating margin(right scale)
ROEROA
19.9
43.5
0
80
60
40
20
24.5
1009 11 12 13
4.1
8.78.4
5.2
0
20
15
10
5
38.3
14
23.627.8
5.1 5.6
2.7
23.5
0
80
60
40
20
10 11 12 13 14
13.15
90.96
112.88
78.88
0
200
150
100
5018.9 18.8
24.190.36
115.74
09 10 11 12 13 1409
1.1
7.0
0
20
15
10
5
5.9
0.6
5.74.4
9.1
6.47.6
4.916.4 4.13.8

49
Annual Report 2014
Financial Section
FINANCIAL CONDITION
Cash Flows
Cash and cash equivalents at March 31, 2014, stood at ¥87,652 million, an increase of ¥13,674 million from the end of the previous fiscal year.
Net cash provided by operating activities amounted to ¥51,000 million, an increase of ¥3,069 million from the pre-vious fiscal year. This was due mainly to increases from net income; impairment losses on fixed assets; accounts receiv-able-other; decrease in trade payables; and the “other” cat-egory; offsetting decreases from notes and accounts receiv-able-trade; and net defined benefit liability.
Net cash used in investing activities amounted to ¥37,088 million, a decrease of ¥16,094 million from the previous fiscal year. This was due mainly to decreases from expenses for prop-erty, plant and equipment acquired; purchase of investments
in subsidiaries; and the “other” category; offsetting increases from payments into deposit paid in subsidiaries and affiliates.
Net cash used in financing activities amounted to ¥3,028 million, an increase of ¥161 million from the previous fiscal year. This was due mainly to increases from payments on long-term debt; and the “other” category; offsetting decreases from net increase in short-term debt.
Assets, Liabilities, and Net AssetsAssets
Total assets at March 31, 2014, stood at ¥508,080 million, an increase of ¥30,200 million compared with the previous fis-cal year-end. Current assets rose ¥26,734 million on gains in deposit paid in subsidiaries and affiliates, while fixed assets climbed ¥3,466 million, mainly reflecting an increase in total net property, plant and equipment that offset a decrease in goodwill.
Liabilities
Total liabilities amounted to ¥171,694 million, an increase of ¥7,218 million compared with the end of the previous fiscal year. This was due mainly to increases in short-term and long-term debt.
Net Assets
Total net assets amounted to ¥336,386 million, an increase of ¥22,982 million year on year. This mainly reflected increases
MANAGEMENT’S DISCUSSION AND ANALYSIS OF OPERATIONS AND FINANCES
Cash FlowsYears ended March 31, Billions of yen
2014 2013 2012
Cash flows from operating activities ¥ 51.0 ¥ 47.9 ¥ 42.1
Cash flows from investing activities (37.1) (53.2) (67.2)
Cash flows from financing activities (3.0) (2.9) 4.6
Cash and cash equivalents at end of year 87.7 74.0 76.3
Total Assets
Billions of yen
Years ended March 31
Capital Expenditures / Depreciation and AmortizationBillions of yen
Years ended March 31
Research and Development (R&D) Expenses / Ratio of R&D Expenditures to Net SalesBillions of yen %
Years ended March 31
1009 11 12 13 14 10 11 12 13 1409 10 11 12 13 1409
Capital expendituresDepreciation and amortization
27.6 26.425.4
0
40
30
20
10
25.7
5.7 5.6
0
12
9
6
3
Research and development (R&D) expensesRatio of R&D expenditures to net sales (right scale)
25.5 26.2
5.3
0
60
45
30
15
37.336.0
21.0
34.631.7 30.4
46.7
33.5
25.3 24.528.229.0391.4
432.2426.6
0
800
600
400
200
441.0478.0
508.1
5.4 5.55.3

50
Annual Report 2014
Financial Section
in retained earnings, and foreign currency translation adjust-ments.
Capital Expenditure, R&D Expenses
Total capital expenditure amounted to ¥33,492 million, a de-crease of ¥13,206 million from the previous fiscal year. This mainly reflected the completion of the current round of over-seas investment activity. Overseas capital expenditures com-prised 46.3% of the total, down from 50.8% a year earlier.
R&D expenses totaled ¥26,234 million, a slight increase from ¥25,534 million in the previous fiscal year. This represent-ed 5.3% of total net sales, down 0.2 percentage points year on year.
BASIC POLICY ON APPROPRIATION OF EARNINGSDIVIDEND FORECAST FOR THE FISCAL YEAR ENDING MARCH 31, 2015Hitachi Chemical considers its operating environment, per-formance, future business prospects, and the payout ratio in allocating earnings to dividends and internal capital reserves. The Company uses internal capital reserves to effectively build on its strong financial structures while investing in the R&D of promising new high-value-added products and adding vitality to existing businesses.
For the fiscal year ended March 31, 2014, the Company paid a year-end cash dividend of ¥18 per share. Combined with the payment of the second quarter dividend of ¥18 per share,
the annual dividend was ¥36 per share. For the fiscal year end-ing March, 2015, the Company is forecasting an annual divi-dend of ¥36 per share, comprising a second quarter dividend of ¥18 yen per share, and year-end dividend of ¥18 yen per share.
OUTLOOK AND FORECASTS FOR THE FISCAL YEAR END-ING MARCH 31, 2015The US economy is forecast to continue its growth on the back of a bullish housing market and increasing consumer spending. In Europe, gradual recovery is expected to continue. However, there are concerns of an economic slowdown in developing countries, most particularly China, making the outlook for the world economy unpredictable. In Japan, although economic recovery is expected to continue, the rise in the consumption tax may yet lead to economic decline, and the situation is far from reassuring.
The Hitachi Chemical Group is assessing the trends of the current economic climate. In order to respond flexibly to severe changes, the Group is both pursuing the achievement of the medium-term management plan started in fiscal year 2013, and rapidly implementing measures to build a stable manage-ment infrastructure.
For the consolidated fiscal year ending March 31, 2015, the Hitachi Chemical Group is forecasting net sales of ¥525.0 billion (+6.3% year on year), with operating income of ¥36.0 billion (+29.6%), and net income of ¥24.0 billion (-0.4%) (as of April 24, 2014).
24.6
0
60
45
30
15
40.9
0.1
0.1
0.10.1
0.2 0.2
0
0.4
0.3
0.2
0.1
30.8
51.1
Cash Dividends per Share
Yen
Years ended March 31
1009 11 12 13 14
32
36
32
0
40
30
20
10
36
Interest-bearing Liabilities / Debt / Equity Ratio (DER)Billions of yen %
Years ended March 31
10 11 12 13 1409
Total Net Assets / Net Worth Ratio(Stockholders’ Equity Ratio)Billions of yen %
Years ended March 31
10 11 12 13 14090 0
Interest-bearing liabilitiesDept / Equity ratio (DER) (right scale)
263.6
400
300
200
100
80
60
40
20
64.1 64.262.9 63.6 65.1336.4313.4
290.3282.6 287.2 64.2
Net worth ratio (Stockholders’ equity ratio)(right scale)
Total net assets 57.6
27.2
3638
51
Annual Report 2014
Financial Section
MANAGEMENT’S DISCUSSION AND ANALYSIS OF OPERATIONS AND FINANCES
BUSINESS AND OTHER RISKS
Hitachi Chemical operates globally in a diverse range of fields, using sophisticated, specialized technologies. For this reason, a variety of factors may materially impact Group operations. These major business and other risks are described below. Statements concerning the future represent the judgment of Hitachi Chemical as of March 31, 2014.
(1) Exchange Rate FluctuationsHitachi Chemical holds assets and liabilities from overseas op-erations that are affected by fluctuations in foreign exchange rates. Due to product exports and raw material imports usually denominated in U.S. dollars, and at times in other local cur-rencies, exchange rate fluctuations may exert a material impact on the performance of the Group. The appreciation of the yen against the U.S. dollar and other currencies may exert a ma-terial impact on earnings by weakening the competitiveness of products exported to overseas markets. The Group pursues measures to attenuate the risk from exchange rate fluctuations, but cannot guarantee that exchange rate fluctuations will not affect performance.
(2) Major Raw Material Price FluctuationsMany of Hitachi Chemical’s products use petrochemical prod-ucts as raw materials. The purchase prices of petrochemical products are susceptible to fluctuations in crude oil prices. In addition, fluctuations in the markets for other raw materials and export regulations in producing countries may increase procurement costs or make it difficult to procure the necessary quantities. These factors may exert a material impact on Group performance.
(3) Acquisitions, Joint Ventures, and Strategic AlliancesHitachi Chemical may acquire outside companies, establish joint ventures, and implement strategic alliances in order to devel-op new technologies and products, and raise competitiveness. These complex initiatives involve integration of businesses, technologies, products, and personnel that requires time and expense. Failure to implement these initiatives as planned may exert a material impact on Group operations. The success of these business alliances is determined in part by factors beyond the Group’s control including alliance partner decisions and ca-pabilities, and market trends. Implementation of these initia-tives may cause the Group to incur acquisition-related expenses including expenses for integration and restructuring of acquired businesses. In addition, the Group cannot guarantee that it will succeed in integrating acquired businesses or that its initiatives will achieve all or part of initial objectives.
(4) Potential Risks in Overseas ActivitiesHitachi Chemical produces and sells products in Japan, coun-tries in Asia, the United States, and in other regions. Exposure to political and social risks in these overseas markets may exert a material impact on the financial position and performance of the Group.
(5) Public RegulationsHitachi Chemical’s business activities are subject to various reg-ulations in the countries in which it operates. The regulations include legal obligations related to foreign investment, trade, competition, intellectual properties, taxes, exchange rates, the environment, and recycling. Significant changes to these reg-ulations could restrict operations, increase costs, and exert a material impact on Group performance.
(6) Financial RiskHitachi Chemical holds equities and other marketable securities. A decrease in the value of these marketable securities may exert a material impact on the financial position and performance of the Group. In addition, long-term procurement of funds from capital markets exposes the Group to risk associated with inter-est rate fluctuations and credit.
(7) Retirement Benefit ObligationsHitachi Chemical bears considerable retirement benefit expense obligations that are computed using actuarial calculations. These appraisals involve important assumptions about condi-tions for estimating the fair value of pension assets including mortality rates, decrement rates, retirement rates, salary chang-es, discount rates, and expected rates of return on pension as-sets. In making these assumptions, the Group must take into account numerous factors including personnel conditions, cur-rent market conditions, and future interest rate trends.
Although the Group makes reasonable assumptions about conditions based on key factors, it cannot guarantee that pro-jections will agree with actual results. Lower discount rates lead to an increase in actuarial retirement benefit obligations. An increase or decrease in retirement benefit obligations may in-fluence the actuarial difference amortized over the period of employment. Accordingly, changes in conditions may exert a material impact on the financial position and performance of the Group.
(8) Relationship with the Parent CompanyAs of March 31, 2014, Hitachi, Ltd., the parent company of Hitachi Chemical Co., Ltd., holds 51.2 percent of the Compa-ny’s total number of shares issued and 51.4 percent of the total number of shares with voting rights (exclusive of indirect share-holdings). Hitachi, Ltd. oversees numerous associated compa-nies, and engages in a wide variety of operations covering the manufacture, sale, and service of products in five groups: Infor-mation & Telecommunication Systems, Infrastructure Systems, Power Systems, Construction Machinery and High Functional Materials & Components. Hitachi Chemical Co., Ltd. is part of the Hitachi Group’s High Functional Materials & Components, and two of its nine Directors serve concurrently as Director or Executive Officer of Hitachi, Ltd. (as of June 18, 2014). The close relations between Hitachi Chemical Co., Ltd. and its parent company in areas including technical and personnel coopera-tion and product supply may lead to situations in which Hitachi Group developments exert a material impact on the manage-ment strategy and other policies of Hitachi Chemical.

Consolidated BalanCe sheetHitachi Chemical Co., Ltd. and Consolidated Subsidiaries As of March 31, 2014 and 2013
Millions of yenThousands of
U.S. dollars (Note 2)
assets 2014 2013 2014
Current assets:
Cash and deposits (Notes 3 and 21) ¥ 37,419 ¥ 36,955 $ 363,291
Deposits paid in subsidiaries and affiliates (Notes 3, 21 and 24) 57,238 37,317 555,709
Trade receivables (Note 3):
Notes 8,790 8,778 85,339
Accounts 99,503 96,356 966,049
108,293 105,134 1,051,388
Short-term investments in securities (Notes 3 and 4) — 499 —
Inventories (Note 5) 50,335 47,259 488,690
Other current assets (Note 6) 25,916 25,368 251,612
Less allowance for doubtful receivables (726) (791) (7,049)
Total current assets 278,475 251,741 2,703,641
Property, plant and equipment, at cost (Note 7): 622,712 598,507 6,045,747
Less accumulated depreciation (451,008) (436,487) (4,378,718)
Net property, plant and equipment 171,704 162,020 1,667,029
intangible assets:
Goodwill 19,079 24,398 185,233
Other intangible assets 5,878 6,080 57,068
Total intangible assets 24,957 30,478 242,301
investments and other assets:
Investments in affiliated companies under the equity method 6,980 7,786 67,767
Net defined benefit assets (Note 9) 5,115 — 49,660
Investments in securities (Notes 3 and 4) 6,701 7,473 65,058
Other assets (Notes 6 and 9) 14,962 19,208 145,263
Less allowance for doubtful accounts (814) (826) (7,903)
Total investments and other assets 32,944 33,641 319,845
¥508,080 ¥477,880 $4,932,816
See accompanying notes to consolidated financial statements.
52
Annual Report 2014
Financial Section

Millions of yenThousands of
U.S. dollars (Note 2)
liabilities and net assets 2014 2013 2014
Current liabilities:
Short-term debt (Notes 3 and 8) ¥ 24,615 ¥ 20,387 $ 238,981
Trade payables (Note 3):
Notes 89 103 864
Accounts 49,530 48,509 480,874
49,619 48,612 481,738
Accrued expenses 20,546 19,521 199,475
Accrued income taxes 5,238 7,778 50,854
Other current liabilities (Note 6) 19,588 17,292 190,175
Total current liabilities 119,606 113,590 1,161,223
long-term debt (Notes 3 and 8) 30,616 28,053 297,243
Retirement and severance benefits (Note 9) — 17,111 —
net defined benefit liability (Note 9) 16,259 — 157,854
other liabilities (Notes 6 and 10) 5,213 5,722 50,612
Total liabilities 171,694 164,476 1,666,932
Commitments and contingencies (Note 14)
net assets:
stockholders’ equity:
Common stock (Note 12)
Authorized—800,000,000 shares;
Issued—208,364,913 shares in 2014 and 2013 (Note 11) 15,454 15,454 150,039
Capital surplus (Note 12) 36,113 36,113 350,612
Retained earnings (Note 12) 274,895 259,230 2,668,883
Treasury stock, at cost,
122,189 shares in 2014 and 117,316 shares in 2013 (Note 13) (200) (193) (1,942)
Total stockholders’ equity 326,262 310,604 3,167,592
accumulated other comprehensive income:
Valuation difference on available-for-sale securities 1,475 1,077 14,320
Deferred gains or losses on hedges 14 68 136
Foreign currency translation adjustments 2,146 (4,770) 20,835
Remeasurements of defined benefit plans 811 — 7,874
Total accumulated other comprehensive income 4,446 (3,625) 43,165
Minority interests 5,678 6,425 55,127
Total net assets 336,386 313,404 3,265,884
¥508,080 ¥477,880 $4,932,816
53
Annual Report 2014
Financial Section

(Consolidated statement of income)
Millions of yenThousands of
U.S. dollars (Note 2)
2014 2013 2014
net sales ¥493,766 ¥464,655 $4,793,845
Cost of sales (Note 15) (373,940) (356,212) (3,630,486)
Gross profit 119,826 108,443 1,163,359
selling, general and administrative expenses (Note 15) (92,051) (84,884) (893,699)
Operating income 27,775 23,559 269,660
other income (expenses):
Interest income 368 433 3,573
Dividends income 211 178 2,049
Equity in earnings (losses) of affiliated companies 2,486 2,078 24,136
Foreign exchange gains (losses) 1,303 1,949 12,650
Interest expenses (1,507) (1,085) (14,631)
Loss on disposal of property, plant and equipment (1,014) (1,193) (9,845)
Royalty income 1,532 1,389 14,874
Business structure improvement expenses (1,484) — (14,408)
Impairment losses on fixed assets (Note 16) (2,872) (1,208) (27,883)
Amortization of goodwill (Note 17) (1,146) — (11,126)
Compensation income (Note 18) 7,260 4,890 70,485
Other 927 36 9,000
6,064 7,467 58,874
Income before income taxes and minority interests 33,839 31,026 328,534
income taxes (Note 6) (10,334) (11,579) (100,330)
Income before minority interests 23,505 19,447 228,204
Minority interests 598 (629) 5,806
Net income ¥ 24,103 ¥ 18,818 $ 234,010
Yen U.S. dollars (Note 2)
2014 2013 2014
Basic net income per share (Note 20) ¥ 115.74 ¥ 90.36 $ 1.12
diluted net income per share (Note 20) ¥ — ¥ — $ —
See accompanying notes to consolidated financial statements.
(Consolidated statement of Comprehensive income)
Millions of yenThousands of
U.S. dollars (Note 2)
2014 2013 2014
income before minority interests ¥ 23,505 ¥ 19,447 $ 228,204
other comprehensive income (Note 19):
Valuation difference on available-for-sale securities 398 344 3,864
Deferred gains or losses on hedges (54) 234 (524)
Foreign currency translation adjustments 6,225 12,877 60,437
Remeasurements of defined benefit plans 5,221 — 50,689
Share of other comprehensive income of affiliates accounted for using equity method 720 578 6,990
12,510 14,033 121,456
Comprehensive income 36,015 33,480 349,660
Comprehensive income attributable to shareholders of the parent 36,584 31,815 355,184
Comprehensive income (loss) attributable to minority interests ¥ (569) ¥ 1,665 $ (5,524)
Consolidated stateMent of inCoMe and Consolidated stateMent of CoMPRehensive inCoMeHitachi Chemical Co., Ltd. and Consolidated SubsidiariesFor the Years Ended March 31, 2014 and 2013
54
Annual Report 2014
Financial Section

Millions of yenThousands of
U.S. dollars (Note 2)
2014 2013 2014
Common stock (Note 11):
Balance at beginning of year ¥ 15,454 ¥ 15,454 $ 150,039
Balance at end of year 15,454 15,454 150,039
Capital surplus:
Balance at beginning of year 36,113 36,113 350,612
Balance at end of year 36,113 36,113 350,612
Retained earnings:
Balance at beginning of year 259,230 248,325 2,516,796
Cumulative effect of changes in accounting policies (941) — (9,136)
Restated balance 258,289 248,325 2,507,660
Net income 24,103 18,818 234,010
Cash dividends (Note 12) (7,497) (7,913) (72,787)
Gain (loss) on sale of treasury stock — 0 —
Balance at end of year 274,895 259,230 2,668,883
treasury stock (Note 13):
Balance at beginning of year (193) (191) (1,874)
Purchase of treasury stock (7) (2) (68)
Sale of treasury stock 0 0 0
Balance at end of year (200) (193) (1,942)
valuation difference on available-for-sale securities:
Balance at beginning of year 1,077 732 10,456
Net change during the year 398 345 3,864
Balance at end of year 1,475 1,077 14,320
deferred gains or losses on hedges:
Balance at beginning of year 68 (166) 660
Net change during the year (54) 234 (524)
Balance at end of year 14 68 136
foreign currency translation adjustments:
Balance at beginning of year (4,770) (17,188) (46,311)
Net change during the year 6,916 12,418 67,146
Balance at end of year 2,146 (4,770) 20,835
Remeasurements of defined benefit plans:
Balance at beginning of year — — —
Cumulative effect of changes in accounting policies (4,410) — (42,815)
Restated balance (4,410) — (42,815)
Net change during the year 5,221 — 50,689
Balance at end of year 811 — 7,874
Minority interests:
Balance at beginning of year 6,425 4,160 62,379
Net change during the year (747) 2,265 (7,252)
Balance at end of year 5,678 6,425 55,127
Total net assets ¥336,386 ¥313,404 $3,265,884
See accompanying notes to consolidated financial statements.
Consolidated stateMent of Changes in net assetsHitachi Chemical Co., Ltd. and Consolidated SubsidiariesFor the Years Ended March 31, 2014 and 2013
55
Annual Report 2014
Financial Section

Millions of yenThousands of
U.S. dollars (Note 2)
2014 2013 2014
Cash flows from operating activities (Note 21):
Net income ¥ 24,103 ¥ 18,818 $ 234,010
Adjustments to reconcile net income to net cash provided by operating activities:
Depreciation 24,453 25,255 237,408
Amortization of goodwill 4,416 3,725 42,874
Increase (decrease) in allowance for doubtful receivables (114) (793) (1,107)
Equity in (earnings) losses of affiliated companies (2,486) (2,078) (24,136)
Net loss on retirement and sale of property, plant and equipment 911 900 8,845
Impairment losses on fixed assets (Note 16) 2,872 1,208 27,883
Deferred income taxes (591) 404 (5,738)
Minority interests in income (598) 629 (5,806)
Decrease (increase) in trade receivables 498 9,800 4,835
Decrease (increase) in inventories (1,791) (1,375) (17,388)
Decrease (increase) in accounts receivable—other 1,629 (1,745) 15,816
Increase (decrease) in trade payables (1,432) (8,129) (13,903)
Increase (decrease) in provision for loss on disaster — (12) —
Increase (decrease) in net defined benefit liability (1,704) — (16,544)
Increase (decrease) in provision for retirement benefits — 302 —
Other 834 1,022 8,097
Net cash provided by operating activities 51,000 47,931 495,146
Cash flows from investing activities:
Proceeds from redemption of short-term investments in securities 500 2,110 4,854
Purchases of property, plant and equipment (33,286) (48,040) (323,165)
Proceeds from sale of property, plant and equipment 539 1,149 5,233
Purchases of subsidiaries’ and affiliated companies’ stock and investments in securities — (2,597) —
Proceeds from sale of subsidiaries’ and affiliated companies’ stock and investments in securities 2,523 492 24,495
Purchases of investments in subsidiaries resulting in change in scope of consolidation — (2,898) —
Payments into deposits paid in subsidiaries and affiliates (7,000) — (67,961)
Other (364) (3,398) (3,534)
Net cash used in investing activities (37,088) (53,182) (360,078)
Cash flows from financing activities:
Net increase (decrease) in short-term debt 5,164 (523) 50,136
Proceeds from long-term debt 4,551 5,217 44,184
Payments of long-term debt (4,617) (1,621) (44,825)
Dividends paid to stockholders (7,497) (7,913) (72,787)
Dividends paid to minority stockholders of consolidated subsidiaries (277) (98) (2,689)
Other (352) 2,071 (3,417)
Net cash used in financing activities (3,028) (2,867) (29,398)
effect of exchange rate changes on cash and cash equivalents 2,790 5,761 27,087
Net increase (decrease) in cash and cash equivalents 13,674 (2,357) 132,757
Cash and cash equivalents at beginning of year 73,978 76,318 718,233
Increase in cash and cash equivalents from newly consolidated subsidiaries — 17 —
Cash and cash equivalents at end of year (Note 21) ¥ 87,652 ¥ 73,978 $ 850,990
See accompanying notes to consolidated financial statements.
Consolidated stateMent of Cash flowsHitachi Chemical Co., Ltd. and Consolidated SubsidiariesFor the Years Ended March 31, 2014 and 2013
56
Annual Report 2014
Financial Section

1. Basis of Presentation and Summary of Significant Accounting Policies(a) Basis of Presentation
The accompanying consolidated financial statements of Hitachi
Chemical Co., Ltd. (the “Company”) and consolidated subsidiaries
are prepared on the basis of accounting principles generally
accepted in Japan, which are different in certain respects as to the
application and disclosure requirements of International Financial
Reporting Standards, and are compiled from the consolidated
financial statements prepared by the Company as required by the
Financial Instruments and Exchange Law of Japan.
In addition, for the convenience of readers outside Japan, the
consolidated financial statements, including the notes to the
consolidated financial statements, include certain reclassifications
and additional information which is not required under accounting
principles generally accepted in Japan.
(b) Principles of Consolidation
The consolidated financial statements include the accounts of the
Company and those of its effectively controlled subsidiaries, wheth-
er directly or indirectly controlled. All significant intercompany
accounts and transactions have been eliminated in consolidation.
Most of the investments in affiliated companies are stated at
their underlying equity value, and the appropriate portion of the
earnings of such companies is included in consolidated net
income. The investments in affiliated companies which do not
materially affect earnings and equity are stated at cost.
Goodwill, based on the fair value, acquired by the Company is
being amortized on a straight-line basis over their estimated useful
period by each individual investment in subsidiaries, not exceeding
20 years or, if the amount is not material, charged immediately to
earnings.
(c) Cash and Cash equivalents
For the purpose of the consolidated statement of cash flows, the
Company and its consolidated companies consider all highly liquid
investments with insignificant risk of change in value, which have
maturities of generally three months or less when purchased, to be
cash equivalents.
(d) allowance for doubtful Receivables
General provision for doubtful receivables is provided by applying
a certain reserve percentage of the receivables based on
experience from past transactions. When considered necessary,
specific reserves are provided based on the assessment of individu-
al receivables.
(e) investments in securities
Securities are to be classified into one of the following two cate-
gories and accounted for as follows:
• Securities that the Company has the positive intent and ability
to hold to maturity are classified as held-to-maturity securities and
measured at amortized cost.
• Securities other than held-to-maturity securities are classified
as available-for-sale securities. Unrealized holding gains and losses
of available-for-sale securities with fair values are reported as a net
amount in a separate component of net assets until realized.
Available-for-sale securities without fair values are carried at cost.
In computing realized gain or loss, cost of available-for-sale
securities is principally determined by the moving-average method.
(f) inventories
Inventories are principally stated at cost determined by the
moving-average method. When their costs exceed the net realized
value, inventories are written down to the net realized value.
(g) Property, Plant and equipment
Property, plant and equipment is depreciated principally on a
straight-line basis over its estimated useful life.
(h) intangible assets
Intangible assets are amortized principally on a straight-line basis.
Cost incurred for computer software for internal use is capitalized
and amortized on a straight-line basis over its estimated useful life.
(i) impairment of fixed assets
Fixed assets are reviewed for impairment whenever events or
changes in circumstances indicate that the carrying amount may
not be recoverable. When amounts of undiscounted future cash
flows of fixed assets are less than the carrying amounts, the fixed
assets are determined to be impaired. Then, an amount by which
the carrying amount exceeds the recoverable amount is recognized
as an impairment loss in earnings.
The recoverable amount of fixed assets is the greater of the net
selling price or the present value of the future cash flows expected
to be derived from the fixed assets. The Company and consolidat-
ed subsidiaries identify groups of assets by their business location
and business division as the smallest identifiable group of assets
that generates cash inflows that are largely independent of the
cash inflows from other assets or groups of assets.
(j) Retirement and severance Benefits
Allowance for retirement and severance benefits for employees is
provided based on the estimated retirement benefit obligation and
fair value of the pension assets. In determining the present value
of its defined benefit obligations and the related current service
cost, the Company and its consolidated companies attribute bene-
fit to periods of service under the plan’s benefit formula.
Prior service benefits and costs are recognized as income or
expense on a straight-line basis over certain years, principally 10
years, not exceeding the expected average remaining service
periods of the employees active at the date of the amendment.
Actuarial gains and losses are recognized as income or expense on
a straight-line basis from the next year of incurrence over certain
years, principally 10 years, not exceeding the expected average
remaining service periods of the employees participating in the
plans.
The Company and consolidated subsidiaries have adopted
“Accounting Standard for Retirement Benefits” (Accounting
Standards Board of Japan (ASBJ) Guidance No. 25, issued on May
notes to Consolidated finanCial stateMentsHitachi Chemical Co., Ltd. and Consolidated SubsidiariesFor the Years Ended March 31, 2014 and 2013
57
Annual Report 2014
Financial Section

17, 2012) and “Guidance on Accounting Standard for Retirement
Benefits” (ASBJ Guidance No. 25, issued on May 17, 2012) as of
the beginning of the fiscal year ended March 31, 2014. This
accounting standard requires entities to apply a revised method for
recording the retirement benefit obligation, after deducting
pension plan assets, as net defined benefit liability. Accordingly,
unrecognized actuarial differences and unrecognized prior service
costs are recorded as net defined benefit liability. In addition, the
Company and consolidated subsidiaries changed the method of
attributing expected benefit to periods from the straight-line basis
to the benefit formula basis using weighted average discount rate
based on the expected timing of the benefit payments.
Concerning the application of the standard, based on the provi-
sional treatment set out in Clause 37 of the standard, the effects
of such changes in the current fiscal year were adjusted through
accumulated other comprehensive income and retained earnings.
As a result, the Company and consolidated subsidiaries recog-
nized net defined benefit liability in the amount of ¥22,405 million
($217,524 thousand), defined benefit assets in the amount of ¥699
million ($6,786 thousand) at April 1, 2013. In addition, accumulat-
ed other comprehensive income was decreased by ¥4,410 million
($42,816 thousand), and retained earnings was decreased by ¥941
million ($9,136 thousand) at April 1, 2013. The application of the
new accounting standard did not have a material effect on operat-
ing income, income before income taxes and minority interests.
(k) derivative financial instruments
In principle, net assets or liabilities arising from derivative financial
instruments are measured at fair value, with unrealized gain or loss
included in earnings. Hedging transactions, that meet the criteria
of hedge accounting as regulated in “Accounting Standard for
Financial Instruments,” are accounted for using deferral hedge
accounting, which requires the unrealized gain or loss to be
deferred as net unrealized gains or losses on hedge transactions,
component of net assets, until gain or loss relating to the hedge
object is recognized.
(l) foreign Currency translations
Foreign currency transactions are translated into yen on the basis
of the exchange rates in effect at the transaction date. At year-
end, monetary assets and liabilities denominated in foreign curren-
cies are translated into yen at the exchange rates in effect at the
balance sheet date. Gains or losses resulting from the translation
of foreign currencies, including gains and losses on settlement, are
credited or charged to earnings as incurred.
The financial statements of the consolidated foreign subsidiaries
are translated into the reporting currency of yen as follows: all
assets and liabilities are translated at the exchange rates in effect
at the balance sheet date; stockholders’ equity accounts are trans-
lated at historical rates; income and expenses are translated at an
average of the exchange rates in effect during the year; and a
comprehensive adjustment resulting from the translation of assets,
liabilities and stockholders’ equity is included in minority interests
and foreign currency translation adjustments as a separate compo-
nent of net assets.
(m) income taxes
Deferred income taxes are accounted for under the asset and lia-
bility method, and deferred tax assets and liabilities are recognized
for the expected future tax consequences attributable to differenc-
es between the financial statement carrying amount of existing
assets and liabilities and their respective tax bases. Deferred tax
assets and liabilities are measured using enacted tax rates expect-
ed to be applied to taxable income in the years in which those
temporary differences are expected to be reversed.
(n) Consumption taxes
Transactions subject to consumption taxes are recorded at
amounts exclusive of consumption taxes.
(o) net income per share
Basic net income per share is computed by dividing income avail-
able to common stockholders by the weighted average number of
common shares outstanding during each year. Diluted net income
per share reflects the potential dilution that could occur if securi-
ties or other contracts to issue common stock were exercised
or converted into common stock or resulted in the issuance of
common stock that then shared in the earnings of the entity.
(p) Reclassifications
Certain reclassifications have been made to the prior year’s consol-
idated financial statements in order to conform to the current year
presentations.
(q) standards issued but not yet effective
On September 13, 2013, the ASBJ issued “Revised Accounting
Standard for Business Combinations” (ASBJ Statement No. 21),
“Revised Accounting Standard for Consolidated Financial
Statement” (ASBJ Statement No. 22), “Revised Accounting
Standard for Business Divestitures” (ASBJ Statement No. 7),
“Revised Accounting Standard for Earnings Per Share” (ASBJ
Statement No. 2), “Revised Guidance on Accounting Standard for
Business Combinations and Accounting Standard for Business
Divestitures” (ASBJ Guidance No. 10), and “Revised Guidance on
Accounting Standard for Earnings Per Share” (ASBJ Guidance
No. 4).
Under these revised accounting standards, the accounting treat-
ment for changes in a parent’s ownership interest in a subsidiary
when the parent retains control over the subsidiary and the
accounting for acquisition-related costs were revised. These stan-
dards also revised the presentation of net income and the refer-
ence to “minority interests” was changed to “non-controlling
interests.” The accounting for adjustments to provisional amounts
recognized as of the acquisition date was also revised.
The Company expects to adopt these revised accounting stan-
dards and guidance from the beginning of the fiscal year ending
March 31, 2016.
The Company is currently evaluating the effect of adopting
these revised standards on its consolidated financial statements.
58
Annual Report 2014
Financial Section

2. Basis of Financial Statement TranslationThe accompanying consolidated financial statements are expressed
in yen and, solely for the convenience of the reader, have been
translated into U.S. dollars at the rate of ¥103=US$1, the approxi-
mate exchange rate prevailing at the Tokyo Foreign Exchange
Market as of March 31, 2014. This translation should not be
construed as a representation that all amounts shown could be
converted into U.S. dollars.
3. Financial InstrumentsIn principle, funds are managed through short-term deposits and
are procured through debentures and bank loans. Additionally,
derivative financial instruments are used in order to manage the
Company’s exposure to fluctuation in foreign currency exchange
rates, interest rates, and commodity prices.
Trade notes and accounts receivables is subject to the credit risk
of customers. In order to minimize this risk, the Company and its
subsidiaries periodically monitor the financial condition of custom-
ers in accordance with the credit management standards and
claims management standards. The Company and its subsidiaries
also work to fully grasp the financial condition of customers and
manage the settlement terms and balances of each customer.
Short-term investments and investments in securities primarily
consist of bonds and equity securities of the trading partners. In
principle, only bonds that are highly safe are held, therefore, credit
risk is minimal. Equity securities, on the other hand, is subject to
risks related to the fluctuation of market value. In order to manage
these risks, the Company and its subsidiaries periodically reconfirm
the market value of the equity securities held and the financial
condition of trading partners, and revaluate the holding of such
equity securities while also taking into consideration the relation-
ships with these trading partners.
The following tables represent the carrying amount, the fair value, and the difference between these two items of major financial instru-
ments as of March 31, 2014 and 2013: Millions of yen
Carrying amount Fair value Difference Carrying amount Fair value Difference
2014 2013
Assets:
Cash and deposits ¥ 37,419 ¥ 37,419 ¥ — ¥ 36,955 ¥ 36,955 ¥ —
Deposits paid in subsidiaries and affiliates 57,238 57,238 — 37,317 37,317 —
Trade notes and accounts receivables (Note a) 108,293 105,134
Less allowance for doubtful receivables (Note b) (723) (770)
107,570 107,565 (5) 104,364 104,353 (11)
Short-term investments and investments in securities
Held-to-maturity securities 101 100 (1) 101 98 (3)
Available-for-sale securities 5,628 5,628 — 6,164 6,164 —
Total assets ¥207,956 ¥207,950 ¥ (6) ¥184,901 ¥184,887 ¥ (14)
Liabilities:
Trade notes and accounts payables (Note c) ¥ 49,619 ¥ 49,619 ¥ — ¥ 48,612 ¥ 48,612 ¥ —
Short-term debt 24,615 24,615 — 20,387 20,387 —
Long-term debt
Debentures 20,000 20,805 805 20,000 20,945 945
Long-term loans payable 10,616 10,678 62 8,053 8,117 64
Total liabilities ¥104,850 ¥105,717 ¥867 ¥ 97,052 ¥ 98,061 ¥1,009
Derivative financial instrument transactions (Note d):
For which hedge accounting is not applied ¥ (1,157) ¥ (1,157) ¥ — ¥ (1,882) ¥ (1,882) ¥ —
For which hedge accounting is applied 22 22 — 109 109 —
Total derivatives ¥ (1,135) ¥ (1,135) ¥ — ¥ (1,773) ¥ (1,773) ¥ —
59
Annual Report 2014
Financial Section

Thousands of U.S. dollars
Carrying amount Fair value Difference
2014
Assets:
Cash and deposits $ 363,291 $ 363,291 $ —
Deposits paid in subsidiaries and affiliates 555,709 555,709 —
Trade notes and accounts receivables (Note a) 1,051,388
Less allowance for doubtful receivables (Note b) (7,019)
1,044,369 1,044,321 (48)
Short-term investments and investments in securities
Held-to-maturity securities 981 971 (10)
Available-for-sale securities 54,640 54,640 —
Total assets $2,018,990 $2,018,932 $ (58)
Liabilities:
Trade notes and accounts payables (Note c) $ 481,738 $ 481,738 $ —
Short-term debt 238,981 238,981 —
Long-term debt
Debentures 194,174 201,990 7,816
Long-term loans payable 103,068 103,670 602
Total liabilities $1,017,961 $1,026,379 $8,418
Derivative financial instrument transactions (Note d):
For which hedge accounting is not applied $ (11,233) $ (11,233) $ —
For which hedge accounting is applied 214 214 —
Total derivatives $ (11,019) $ (11,019) $ —
Notes: a. The hedged foreign currency receivables recorded using forward foreign exchange contract rate is included. The amounts as of March 31, 2014 and 2013 included are
¥1,030 million ($10,000 thousand) and ¥1,146 million, respectively.
b. These amounts are general provision for doubtful receivables and specific reserves for individual receivables associated with trade notes and accounts receivables.
c. The hedged foreign currency payables recorded using forward foreign exchange contract rate is included. The amount as of March 31, 2014 is included ¥47 million
($456 thousand).
d. These represent net assets or liabilities arising from derivative transactions. The figures in parentheses indicate net liabilities.
The method of calculating the fair value of financial instruments is
as follows:
Cash and deposits, deposits paid in subsidiaries and affiliates
As these items are settled in the short term, the fair value of these
items approximates the book value.
trade notes and accounts receivables
The fair value of items settled in the short term approximates the
book value. The fair value of installment receivables is determined
by discounting the amount of receivables by a rate that reflects the
credit risk.
short-term investments and investments in securities
The fair value of equity securities is the quoted market prices on
the stock exchange. The fair value of bond is the value provided by
the counterparty financial institution.
trade notes and accounts payables, short-term debt
As these items are settled in the short term, the fair value of these
items approximates the book value.
debentures
The fair value of debentures issued by the Company is the value
provided by the counterparty financial institutions.
long-term loans payable
Loans with floating interest rates reflect market interest rates over
the short term, and the Company’s credit standing has not
changed significantly after the loan was made. The fair value
approximates the book value, therefore, the book value is used.
The fair value of fixed-rate loans is determined by discounting the
total amount of principal and interest by the assumed rate on new
borrowings of the same type.
derivative financial instrument transactions
The fair value of derivative financial instrument transactions is the
value provided by the counterparty financial institutions.
60
Annual Report 2014
Financial Section

The tables above do not include non-marketable securities for which it is extremely difficult in estimating fair value. The carrying amount
of non-marketable securities amounted to ¥7,952 million ($77,204 thousand) and ¥9,493 million at March 31, 2014 and 2013, respectively.
Redemption schedules of receivables and securities with a maturity date are as follows:Millions of yen
Withinone year
After oneyear through
five years
After fiveyears through
ten yearsAfter
ten yearsWithin
one year
After oneyear through
five years
After fiveyears through
ten yearsAfter
ten years
2014 2013
Deposits ¥ 37,391 ¥ — ¥— ¥— ¥ 36,608 ¥ — ¥— ¥ —
Deposits paid in subsidiaries and affiliates 57,238 — — — 37,317 — — —
Trade notes and accounts receivables 107,539 31 — — 104,293 71 — —
Short-term investments and investments in securities
Held-to-maturity securities
Debentures — 100 — — — 100 — —
Available-for-sale securities
Debt securities — — — — 500 — — 1,000
¥202,168 ¥131 ¥— ¥— ¥178,718 ¥171 ¥— ¥1,000
Thousands of U.S. dollars
Withinone year
After oneyear through
five years
After fiveyears through
ten yearsAfter
ten years
2014
Deposits $ 363,019 $ — $— $—
Deposits paid in subsidiaries and affiliates 555,709 — — —
Trade notes and accounts receivables 1,044,068 301 — —
Short-term investments and investments in securities
Held-to-maturity securities
Debentures — 971 — —
Available-for-sale securities
Debt securities — — — —
$1,962,796 $1,272 $ — $ —
4. Short-term Investments and Investments in SecuritiesHeld-to-maturity securities
Millions of yen
Carrying amount
Estimated fair value
Unrealized gains (losses)
Carrying amount
Estimated fair value
Unrealized gains (losses)
2014 2013
Held-to-maturity securities with gross unrealized
holding losses:
Government bonds, municipal bonds, and other ¥ — ¥ — ¥— ¥ — ¥ — ¥—
Debentures 101 100 (1) 101 98 (3)
Other bonds — — — — — —
101 100 (1) 101 98 (3)
¥101 ¥100 ¥ (1) ¥101 ¥98 ¥ (3)
61
Annual Report 2014
Financial Section

Thousands of U.S. dollars
Carrying amount
Estimated fair value
Unrealized gains (losses)
2014
Held-to-maturity securities with gross unrealized
holding losses:
Government bonds, municipal bonds, and other $ — $ — $ —
Debentures 981 971 (10)
Other bonds — — —
981 971 (10)
$981 $971 $(10)
Available-for-sale securitiesMillions of yen
Carrying amount
Acquisition cost
Unrealized gains (losses)
Carrying amount
Acquisition cost
Unrealized gains (losses)
2014 2013
Available-for-sale securities with gross unrealized holding gains:
Equity securities ¥5,392 ¥2,839 ¥2,553 ¥4,381 ¥2,366 ¥2,015
Debt securities — — — 1,003 1,000 3
Other securities — — — — — —
5,392 2,839 2,553 5,384 3,366 2,018
Available-for-sale securities with gross unrealized holding losses:
Equity securities 106 119 (13) 142 160 (18)
Debt securities — — — 499 500 (1)
Other securities 130 130 — 139 139 —
236 249 (13) 780 799 (19)
¥5,628 ¥3,088 ¥2,540 ¥6,164 ¥4,165 ¥1,999
Thousands of U.S. dollars
Carrying amount
Acquisition cost
Unrealized gains (losses)
2014
Available-for-sale securities with gross unrealized holding gains:
Equity securities $52,350 $27,563 $24,787
Debt securities — — —
Other securities — — —
52,350 27,563 24,787
Available-for-sale securities with gross unrealized holding losses:
Equity securities 1,029 1,156 (127)
Debt securities 0 0 0
Other securities 1,262 1,262 —
2,291 2,418 (127)
$54,641 $29,981 $24,660
62
Annual Report 2014
Financial Section
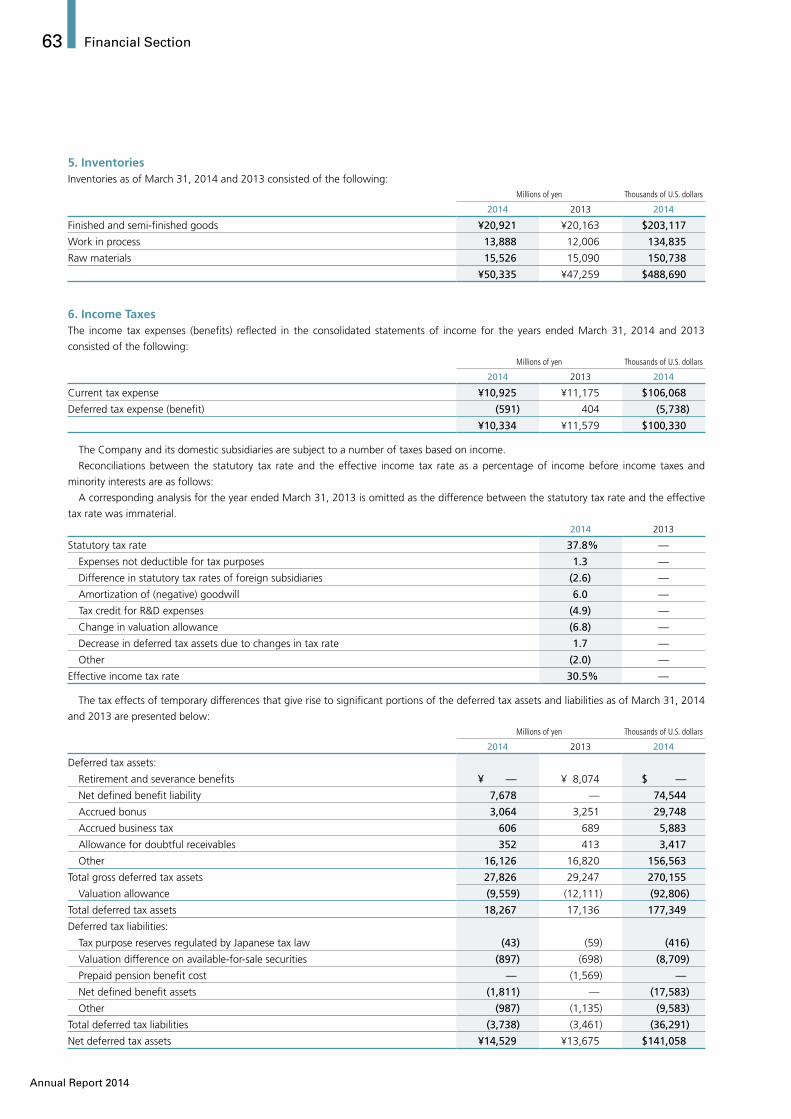
5. InventoriesInventories as of March 31, 2014 and 2013 consisted of the following:
Millions of yen Thousands of U.S. dollars
2014 2013 2014
Finished and semi-finished goods ¥20,921 ¥20,163 $203,117
Work in process 13,888 12,006 134,835
Raw materials 15,526 15,090 150,738
¥50,335 ¥47,259 $488,690
6. Income TaxesThe income tax expenses (benefits) reflected in the consolidated statements of income for the years ended March 31, 2014 and 2013
consisted of the following:Millions of yen Thousands of U.S. dollars
2014 2013 2014
Current tax expense ¥10,925 ¥11,175 $106,068
Deferred tax expense (benefit) (591) 404 (5,738)
¥10,334 ¥11,579 $100,330
The Company and its domestic subsidiaries are subject to a number of taxes based on income.
Reconciliations between the statutory tax rate and the effective income tax rate as a percentage of income before income taxes and
minority interests are as follows:
A corresponding analysis for the year ended March 31, 2013 is omitted as the difference between the statutory tax rate and the effective
tax rate was immaterial.2014 2013
Statutory tax rate 37.8% —
Expenses not deductible for tax purposes 1.3 —
Difference in statutory tax rates of foreign subsidiaries (2.6) —
Amortization of (negative) goodwill 6.0 —
Tax credit for R&D expenses (4.9) —
Change in valuation allowance (6.8) —
Decrease in deferred tax assets due to changes in tax rate 1.7 —
Other (2.0) —
Effective income tax rate 30.5% —
The tax effects of temporary differences that give rise to significant portions of the deferred tax assets and liabilities as of March 31, 2014
and 2013 are presented below: Millions of yen Thousands of U.S. dollars
2014 2013 2014
Deferred tax assets:
Retirement and severance benefits ¥ — ¥ 8,074 $ —
Net defined benefit liability 7,678 — 74,544
Accrued bonus 3,064 3,251 29,748
Accrued business tax 606 689 5,883
Allowance for doubtful receivables 352 413 3,417
Other 16,126 16,820 156,563
Total gross deferred tax assets 27,826 29,247 270,155
Valuation allowance (9,559) (12,111) (92,806)
Total deferred tax assets 18,267 17,136 177,349
Deferred tax liabilities:
Tax purpose reserves regulated by Japanese tax law (43) (59) (416)
Valuation difference on available-for-sale securities (897) (698) (8,709)
Prepaid pension benefit cost — (1,569) —
Net defined benefit assets (1,811) — (17,583)
Other (987) (1,135) (9,583)
Total deferred tax liabilities (3,738) (3,461) (36,291)
Net deferred tax assets ¥14,529 ¥13,675 $141,058
63
Annual Report 2014
Financial Section

Net deferred tax assets as of March 31, 2014 and 2013 are reflected in the consolidated balance sheets under the following captions:Millions of yen Thousands of U.S. dollars
2014 2013 2014
Other current assets ¥ 7,243 ¥ 6,259 $ 70,320
Other assets 7,858 8,006 76,291
Other current liabilities — (2) —
Other liabilities (572) (588) (5,553)
Net deferred tax assets ¥14,529 ¥13,675 $141,058
Revisions to the amounts of deferred tax assets and liabilities attributable to changes in corporate and other tax rates
The “Act for Partial Amendment of the Income Tax Act, etc.” (Act No. 10 of 2014) was promulgated on March 31, 2014 and, as a result,
the Company is no longer subject to the Special Reconstruction Corporation Tax effective for fiscal years beginning on or after April 1, 2014.
The effective statutory tax rate used to measure the Company’s deferred tax assets and liabilities was changed from 37.8% to 35.4% for
the temporary differences expected to be realized or settled from fiscal years beginning April 1, 2014.
The effect of the announced reduction of the effective statutory tax rate was to decrease deferred tax assets after offsetting deferred tax
liabilities by ¥582 million ($5,650 thousand) and increase deferred income taxes by ¥582 million ($5,650 thousand) as of and for the year
ended March 31, 2014.
7. Property, Plant and EquipmentProperty, plant and equipment, at cost as of March 31, 2014 and 2013 consisted of the following:
Millions of yen Thousands of U.S. dollars
2014 2013 2014
Buildings and structures ¥161,495 ¥146,985 $1,567,913
Machinery and transportation equipment 361,051 339,725 3,505,349
Land 21,577 20,165 209,485
Construction in progress 9,102 23,508 88,369
Other 69,487 68,124 674,631
¥622,712 ¥598,507 $6,045,747
8. Short-term and Long-term DebtLong-term debt as of March 31, 2014 and 2013 is as follows:
Millions of yen Thousands of U.S. dollars
2014 2013 2014
Debentures:
8th series, due 2016, interest 2.17% ¥10,000 ¥10,000 $ 97,087
9th series, due 2022, interest 1.19% 10,000 10,000 97,087
Loans, principally from banks:
Maturing 2015–2018, interest 4.0% (average) 10,616 8,053 103,069
¥30,616 ¥28,053 $297,243
The aggregate annual maturities of long-term debt after March 31, 2014 are as follows:Millions of yen Thousands of U.S. dollars
2015 ¥ — $ —
2016 5,694 55,282
2017 1,200 11,651
2018 3,593 34,883
2019 129 1,252
2020 and thereafter — —
¥10,616 $103,068
64
Annual Report 2014
Financial Section

9. Retirement Benefit Plansfor the year ended March 31, 2013
defined benefit plans
The Company and certain subsidiaries have defined-benefit corpo-
rate pension plans and lump-sum retirement plans to provide
retirement and severance benefits to substantially all of their
employees.
Funded status of the Company’s and subsidiaries’ plans as of
March 31, 2013 is as follows:Millions of yen
2013
Projected benefit obligations ¥(96,277)
Plan assets at fair value 75,946
Funded status (20,331)
Unrecognized actuarial loss 7,648
Unrecognized prior service benefit (230)
Net amount recognized in the consolidated balance sheet ¥(12,913)
Amounts recognized in the consolidated balance sheet consist of:
Prepaid retirement benefit cost (other assets) ¥ 4,198
Retirement and severance benefits (17,111)
¥(12,913)
Net periodic benefit costs for the funded benefit pension plans
and the unfunded lump-sum payment plans for the year ended
March 31, 2013 consisted of the following components:Millions of yen
2013
Service cost ¥3,039
Interest cost 1,977
Expected return on plan assets (1,259)
Amortization of unrecognized actuarial loss 1,815
Amortization of unrecognized prior service benefit (223)
Net periodic benefit cost ¥5,349
Note: In addition to the retirement and severance benefits under the defined benefit
pension plans above, special retirement benefits of ¥214 million is charged to
earnings during the year ended March 31, 2013.
Actuarial assumptions used in the accounting for the Company’s
and subsidiaries’ plans are principally as follows:2013
Discount rate 1.0–2.5%
Expected return rate on plan assets 2.0%
defined contribution plans
The amount of cost recognized for the Company’s and certain
subsidiaries’ contribution to the plans for the year ended March
31, 2013 is ¥944 million.
for the year ended March 31, 2014
outline of the adopted retirement benefit plans
The Company and its consolidated subsidiaries have adopted
funded and unfunded defined benefit plans and defined contribu-
tion plans in order to provide for employees’ retirement benefits.
The funded defined benefit plans include a defined benefit corpo-
rate pension plan and a lump-sum severance indemnity plan for
which a retirement benefit trust is established.
The unfunded defined benefit plan is a lump-sum severance
indemnity plan for which a retirement benefit trust is not
established.
Certain consolidated subsidiaries have adopted the simplified val-
uation method for the calculation of projected benefit obligations.
On some occasions of an employee’s retirement or other termi-
nation, special retirement benefits may be provided, which is not
included in the retirement benefit obligations based on the actuar-
ial calculation under retirement benefit accounting.
defined benefits plans
Reconciliation schedule for opening and closing balances of pro-
jected benefit obligations
Millions of yenThousands of U.S. dollars
2014 2014
Projected benefit obligations at April 1, 2013 ¥97,699 $948,534
Service cost 3,882 37,689
Interest cost 1,082 10,505
Actuarial gain (4,549) (44,165)
Retirement benefits paid (5,485) (53,252)
Prior service cost (355) (3,447)
Other 1,019 9,893
Projected benefit obligations at March 31, 2014 ¥93,293 $905,757
Reconciliation schedule for opening and closing balances of plan
assets
Millions of yenThousands of U.S. dollars
2014 2014
Plan assets at April 1, 2013 ¥75,946 $737,340
Expected return on plan assets 1,389 13,485
Actuarial gain 3,149 30,573
Contributions by the Company 4,040 39,223
Retirement benefits paid (4,093) (39,738)
Other 1,718 16,680
Plan assets at March 31, 2014 ¥82,149 $797,563
65
Annual Report 2014
Financial Section

Reconciliation of projected benefit obligations and plan assets at
March 31, 2014, and the net defined benefit assets and liabilities
recorded in the consolidated balance sheet
Millions of yenThousands of U.S. dollars
2014 2014
Funded retirement benefit obligations ¥82,702 $802,932
Plan assets at fair value (82,149) (797,563)
553 5,369
Unfunded retirement benefit obligations 10,591 102,825
Net amount of liabilities and assets recognized in the consolidated balance sheet ¥11,144 $108,194
Millions of yenThousands of U.S. dollars
2014 2014
Net defined benefit liabilities ¥16,259 $157,854
Net defined benefit assets (5,115) (49,660)
Net amount of liabilities and assets recognized in the consolidated balance sheet ¥11,144 $108,194
The components of retirement benefit expenses are as follows:
Millions of yenThousands of U.S. dollars
2014 2014
Service cost ¥3,882 $37,689
Interest cost 1,082 10,505
Expected return on plan assets (1,389) (13,485)
Amortization of actuarial loss 476 4,621
Amortization of prior service cost (193) (1,874)
Provisional additional severance benefits paid 289 2,806
Subtotal 4,147 40,262
Loss accompanying business structure improvement (Note) 1,413 13,719
Retirement benefits expenses related to defined benefit plans ¥5,560 $53,981
Note: Posted in other income (expenses) “Business structure improvement expenses”
Adjustments related to retirement benefits
The components of the adjustments related to retirement benefits
(before tax effect) are as follows:
Millions of yenThousands of U.S. dollars
2014 2014
Prior service cost ¥ 159 $ 1,544
Actuarial gain 8,084 78,485
¥8,243 $80,029
Cumulative adjustments related to retirement benefits
The breakdown of items recorded in cumulative adjustments r elated
to retirement benefits (before tax effect deductions) is as follows:
Millions of yenThousands of U.S. dollars
2014 2014
Unrecognized prior service cost ¥(389) $(3,777)
Unrecognized actuarial loss (516) (5,009)
¥(905) $(8,786)
Items concerning plan assets
(a) Primary breakdown of plan assets
The ratio for each main category with respect to total plan assets
is as follows:2014
Bonds 61%
Equity securities 22%
Cash and deposits 2%
Other 15%
100%
Note: Total plan assets include 8% of the retirement benefits trust established with
respect to the defined benefit-type retirement benefit plan.
(b) Method for establishing the expected return rate on plan assets
The expected return rate on plan assets is determined considering
the current and future allocation of plan assets, and the current
and expected return rate from the diverse assets composing the
plan assets.
Actuarial assumptions used in the accounting for the Company’s
and subsidiaries’ plans are principally as follows:2014
Discount rate 0.8–1.5%
Expected return rate on plan assets 2.0%
defined contribution plans
The amount of cost recognized for the Company’s and certain
subsidiaries’ contribution to the plans for the year ended March
31, 2014 is ¥1,077 million ($10,456 thousand).
66
Annual Report 2014
Financial Section

10. Asset Retirement ObligationsThe Company has recorded asset retirement obligations pertaining to the legal obligation to eliminate asbestos and other harmful substanc-
es present in property, plant and equipment upon their retirement and to the obligation to return offices and other leased facilities to their
original condition (restitution obligations) as stated in the lease contracts.
Methods of calculating the amounts for asset retirement obligations in the years ended March 31, 2014 and 2013 are as follows:Estimated period
of use Discount rateEstimated period
of use Discount rate
2014 2013
Obligations to eliminate asbestos, etc. 5–35 years 0.5–2.3% 5–35 years 0.5–2.3%
Restitution obligations 8–60 years 1.0–2.4% 8–60 years 1.0–2.4%
Changes in applicable asset retirement obligations in the years ended March 31, 2014 and 2013 are as follows:Millions of yen Thousands of U.S. dollars
2014 2013 2014
Balance at beginning of year ¥1,054 ¥ 943 $10,233
Increase due to acquisition of property, plant and equipment 108 231 1,049
Adjustment due to passage of time 13 14 126
Decrease due to fulfillment of obligations (58) (134) (563)
Balance at end of year ¥1,117 ¥1,054 $10,845
11. Common StockIssued shares, changes in shares, and the amount of common stock for the years ended March 31, 2014 and 2013 are as follows:
Millions of yen Thousands of U.S. dollars
Issued shares Amount Amount
Balances as of April 1, 2012 208,364,913 ¥15,454
Balances as of March 31, 2013 208,364,913 15,454 $150,039
Balances as of March 31, 2014 208,364,913 ¥15,454 $150,039
12. Net Assets and Cash DividendsThe Company’s common stock has no par value in accordance
with the Japanese Corporate Law (JCL). Under JCL, at least 50%
of the amount actually paid in or provided in consideration for
newly issued stocks is designated as stated common stock and
proceeds in excess of the amount designated as stated common
stock are recorded as capital surplus.
The JCL requires an amount equal to at least 10% of distribu-
tions of retained earnings to be appropriated as legal reserve,
which are included in capital surplus and retained earnings, until
legal reserve equals 25% of stated common stock. In addition,
common stock, capital surplus, and retained earnings, including
legal reserves, can generally be transferred to each other upon res-
olution of the shareholders’ meeting.
Cash dividends during the years ended March 31, 2014 and
2013 in the consolidated statements of changes in net assets
represent dividends resolved during those years.
For the year ended March 31, 2014
Dividends paid
Resolution Type of sharesTotal dividends (Millions of yen)
Total dividends(Thousands of U.S. dollars)
Dividends per share
(Yen)
Dividends per share
(U.S. dollars) Cut-off date Effective date
Meeting of the Board of Directors on May 29, 2013
Common stock
¥3,748 $36,388 ¥18 $0.17March 31,
2013May 30,
2013
Meeting of the Board of Directors on October 25, 2013
Common stock
¥3,748 $36,388 ¥18 $0.17September 30,
2013November 28,
2013
67
Annual Report 2014
Financial Section

Dividends with the cut-off date in the year ended March 31, 2014 and the effective date in the year ending March 31, 2015
Resolution Type of sharesTotal dividends (Millions of yen)
Total dividends(Thousands of U.S. dollars)
Source of dividends
Dividends per share
(Yen)
Dividends per share
(U.S. dollars) Cut-off date Effective date
Meeting of the Board of Directors on May 29, 2014
Common stock
¥3,748 $36,388Retained earnings
¥18 $0.17March 31,
2014May 30,
2014
For the year ended March 31, 2013
Dividends paid
Resolution Type of sharesTotal dividends (Millions of yen)
Dividends per share
(Yen) Cut-off date Effective date
Meeting of the Board of Directors on May 28, 2012
Common stock
¥3,748 ¥18March 31,
2012May 29,
2012
Meeting of the Board of Directors on October 29, 2012
Common stock
¥4,165 ¥20September 30,
2012November 28,
2012
Dividends with the cut-off date in the year ended March 31, 2013 and the effective date in the year ended March 31, 2014
Resolution Type of sharesTotal dividends (Millions of yen)
Source of dividends
Dividends per share
(Yen) Cut-off date Effective date
Meeting of the Board of Directors on May 29, 2013
Common stock
¥3,748Retained earnings
¥18March 31,
2013May 30,
2013
13. Treasury StockThe Japanese Corporate Law (JCL) allows a company to acquire
treasury stocks upon shareholders’ approval to the extent that suf-
ficient distributable funds are available. If the Board of Directors’
authority is stated in the Articles of Incorporation, a company is
allowed to purchase treasury stock only with the Board of
Directors’ approval. Purchase of treasury stock is authorized with
the approval by the Board of Directors under the Company’s
Articles of Incorporation.
Pursuant to the provisions of the JCL, shareholders may request
the Company to acquire their shares below a minimum trading lot
(100 shares) as shares below a minimum trading lot cannot be
publicly traded and do not carry a voting right. The JCL also states
that a shareholder holding shares less than a minimum trading lot
is entitled to request the company to sell its treasury stock, if any,
to the shareholder up to a minimum trading lot, provided that sale
of treasury stock is allowed under the Articles of Incorporation.
Sale of treasury stock is allowed under the Company’s Articles of
Incorporation.
The changes in treasury stock for the years ended March 31, 2014 and 2013 are as follows:Shares
Balances as of April 1, 2012 115,612
Purchase of treasury stock 1,818
Sale of treasury stock (114)
Balances as of March 31, 2013 117,316
Purchase of treasury stock 5,039
Sale of treasury stock (166)
Balances as of March 31, 2014 122,189
68
Annual Report 2014
Financial Section

14. Commitments and ContingenciesContingent liabilities related to guarantees for bank loans of
employees amounted to ¥105 million ($1,019 thousand) and ¥117
million at March 31, 2014 and 2013, respectively.
It is a common practice in Japan for companies, in the ordinary
course of business, to receive promissory notes in the settlement
of trade accounts receivable and to transfer them by endorsement
to suppliers in the settlement of accounts payable. The Company
and its subsidiaries are contingently liable for trade notes
endorsed, which amounted to ¥688 million ($6,680 thousand)
and ¥679 million at March 31, 2014 and 2013, respectively.
15. Research and Development ExpensesResearch and development expenses included in general and administrative expenses and gross production cost for the years ended March
31, 2014 and 2013 amounted to ¥26,234 million ($254,699 thousand) and ¥25,534 million, respectively.
16. Impairment Losses on Fixed AssetsFor the year ended March 31, 2014, certain consolidated subsidiaries recognized impairment losses on fixed assets as follows:Location Use Type
China, other Production facilities and other Machinery and equipment, and other
India Other Goodwill
Production facilities and other assets for which value declined
due to decreased profitability were devalued from the carrying
amount to the recoverable amount, and resulted in an impairment
loss of ¥2,872 million ($27,883 thousand), which was reported in
impairment losses on fixed assets in the consolidated statements
of income.
The Company and its subsidiaries determine recoverable
amount using value in use. Value in use is based on the present
value of future cash flows calculated using a discount rate of 6.0–
17.0%.
For the year ended March 31, 2013, certain consolidated subsidiaries recognized impairment losses on fixed assets as follows:Location Use Type
Mexico, other Production facilities and other Machinery and equipment, and other
Production facilities and other assets for which value declined
due to decreased profitability were devalued from the carrying
amount to the recoverable amount, and resulted in an impairment
loss of ¥1,208 million, which was reported in impairment losses on
fixed assets in the consolidated statements of income.
The Company and its subsidiaries determine recoverable
amount using either net selling price or value in use. Net selling
price is based on the assessed value for property tax purpose,
which is adjusted as appropriate. Value in use is based on the pres-
ent value of future cash flows calculated using a discount rate of
5.0%.
17. Amortization of GoodwillDuring the year ended March 31, 2014, the Company accelerated amortization of its goodwill related to subsidiaries and amortized the
entire amount because it was deemed impaired, in accordance with Paragraph 32 (1) of JICPA Accounting Committee Report No. 7
“Practical Guidance for Consolidated Procedures Related to Equity Account in Consolidated Financial Statements.”
18. Compensation IncomeThe compensation income for the years ended March 31, 2014 and 2013 represents the amount the Company and its consolidated subsid-
iaries received from Tokyo Electric Power Company, Incorporated as a compensation for the lost income and certain other additional costs.
69
Annual Report 2014
Financial Section

19. Reclassification Adjustment and Tax Effect Amounts Relating to Other Comprehensive IncomeReclassification adjustment and tax effect amounts relating to other comprehensive income for the years ended March 31, 2014 and 2013
are as follows:Millions of yen Thousands of U.S. dollars
2014 2013 2014
Valuation difference on available-for-sale securities:
Amount arising during the year ¥ 940 ¥ 553 $ 9,126
Reclassification adjustment (325) (17) (3,155)
Amount before tax effect 615 536 5,971
Tax effect (217) (192) (2,107)
Valuation difference on available-for-sale securities 398 344 3,864
Deferred gains or losses on hedges:
Amount arising during the year 158 185 1,534
Reclassification adjustment 212 295 2,058
Asset acquisition cost adjustment (457) (101) (4,437)
Amount before tax effect (87) 379 (845)
Tax effect 33 (145) 321
Deferred gains or losses on hedges (54) 234 (524)
Foreign currency translation adjustments:
Amount arising during the year 6,263 12,883 60,806
Reclassification adjustment (38) (6) (369)
Foreign currency translation adjustments 6,225 12,877 60,437
Remeasurements of defined benefit plans:
Amount arising during the year 8,136 — 78,990
Reclassification adjustment 107 — 1,039
Amount before tax effect 8,243 — 80,029
Tax effect (3,022) — (29,340)
Remeasurements of defined benefit plans 5,221 — 50,689
Share of other comprehensive income of associates accounted for using equity method:
Amount arising during the year 720 578 6,990
Total other comprehensive income ¥12,510 ¥14,033 $121,456
20. Amount per ShareThe reconciliation of the number of shares and the amounts used in the basic and diluted net income per share computations for the years
ended March 31, 2014 and 2013 are as follows:Thousands of shares
2014 2013
Weighted average number of shares on which basic net income per share is calculated 208,245 208,248
Effect of dilutive securities — —
Number of shares on which diluted net income per share is calculated 208,245 208,248
Millions of yen Thousands of U.S. dollars
2014 2013 2014
Net income ¥24,103 ¥18,818 $234,010
Net income not applicable to common stockholders — — —
Net income on which basic net income per share is calculated 24,103 18,818 234,010
Effect of dilutive securities — — —
Net income on which diluted net income per share is calculated ¥24,103 ¥18,818 $234,010
70
Annual Report 2014
Financial Section

Yen U.S. dollars
2014 2013 2014
Net income per share:
Basic ¥115.74 ¥90.36 $ 1.12
Diluted ¥ — ¥ — $ —
Net assets per share as of March 31, 2014 and 2013 are as follows:Yen U.S. dollars
2014 2013 2014
Basic ¥1,588.09 ¥1,474.11 $ 15.42
The Company and consolidated subsidiaries have adopted the Accounting Standard for Retirement Benefits (ASBJ Statement No. 26,
issued on May 17, 2012, the “Accounting Standard”) and the Guidance on Accounting Standard for Retirement Benefits (ASBJ Guidance
No. 25, the “Guidance”) applicable from the fiscal year ended March 31, 2014 using the transitional treatment stipulated in Paragraph 37
of the Accounting Standard.
As a result, net assets per share as of March 31, 2014 decreased by ¥0.12.
21. Supplementary Cash Flow InformationCash paid for interest and income taxes for the years ended March 31, 2014 and 2013 are as follows:
Millions of yen Thousands of U.S. dollars
2014 2013 2014
Cash paid during the year for:
Interest ¥ 1,460 ¥1,105 $ 14,175
Income taxes ¥14,450 ¥8,735 $140,291
The components of cash and cash equivalents as of March 31, 2014 and 2013 are as follows:Millions of yen Thousands of U.S. dollars
2014 2013 2014
Cash and deposits ¥37,419 ¥36,955 $363,291
Time deposits with over three months maturity (5) (294) (49)
Deposits paid in subsidiaries and affiliates 57,238 37,317 555,709
Deposits paid in subsidiaries and affiliates with over three months maturity (7,000) — (67,961)
Cash and cash equivalents ¥87,652 ¥73,978 $850,990
22. Financial Instruments and Derivative Financial InstrumentsThe Company and certain subsidiaries operate globally and are
exposed to market risks arising from fluctuations in foreign curren-
cy exchange rates, interest rates, and commodity prices. In order to
manage such risks, the Company and certain subsidiaries enter into
various contracts on derivative financial instruments, including for-
ward exchange contracts, currency option contracts, currency swap
contracts, interest rate option contracts, and commodity swap con-
tracts. Forward exchange contracts are utilized to manage risks aris-
ing from foreign currency receivables from export of finished
goods; foreign currency payables from the import of raw materials;
and forecasted foreign currency sales and purchase transactions.
Currency option contracts, interest rate option contracts, and inter-
est rate swap contracts are utilized to manage foreign currency risk
and interest rate risk for debts. Commodity swap contracts are
utilized to manage the commodity price fluctuation risk on
purchased raw material (lead and copper). The Company and its
subsidiaries have no derivative financial instruments for trading pur-
poses. In addition, the Company and its subsidiaries are exposed to
potential credit-related losses in the event of non-performance by
counterparties to financial instruments and derivative financial
instruments, but it is not expected that any counterparties will fail
to meet their obligations, because most of the counterparties are
financial institutions with a sound credit profile.
The Company and its subsidiaries have also developed hedging
policies to control various aspects of derivative financial transac-
tions including authorization levels and transaction volumes. Based
on these policies, the Company and its subsidiaries hedge, within
certain scopes, risks arising from changes in foreign currency
exchange rates, interest rates, and commodity prices. The
Company and its subsidiaries review periodically the effectiveness
of all the hedge policies to take account of the cumulative cash
flows and any changes in the market.
71
Annual Report 2014
Financial Section

The fair values of the derivative financial instruments for which hedge accounting is not applied as of March 31, 2014 and 2013 are as
follows:Millions of yen
Notionalamount
Estimatedfair value
Unrealizedgains (losses)
Notionalamount
Estimatedfair value
Unrealizedgains (losses)
2014 2013
Forward exchange contracts:
To sell foreign currencies ¥ 6,880 ¥ 27 ¥ 27 ¥16,870 ¥ (925) ¥ (925)
To buy foreign currencies 846 (2) (2) 3,714 64 64
Currency swap contracts:
To sell foreign currencies 3,527 (1,053) (1,053) 1,557 (338) (338)
To buy foreign currencies 600 (150) (150) 3,267 (678) (678)
¥11,853 ¥(1,178) ¥(1,178) ¥25,408 ¥(1,877) ¥(1,877)
Thousands of U.S. dollars
Notionalamount
Estimatedfair value
Unrealizedgains (losses)
2014
Forward exchange contracts:
To sell foreign currencies $ 66,796 $ 262 $ 262
To buy foreign currencies 8,214 (19) (19)
Currency swap contracts:
To sell foreign currencies 34,243 (10,224) (10,224)
To buy foreign currencies 5,825 (1,456) (1,456)
$115,078 $(11,437) $(11,437)
The fair values of derivative financial instruments are estimated on the basis of information obtained from counterparty financial
institutions.
Millions of yen
Notionalamount
Estimatedfair value
Notionalamount
Estimatedfair value
2014 2013
Commodity swap contracts:
Variable receipt and fixed payment ¥— ¥ — ¥79 ¥ (5)
¥— ¥— ¥ — ¥—
Thousands of U.S. dollars
Notionalamount
Estimatedfair value
2014
Commodity swap contracts:
Variable receipt and fixed payment $— $—
$— $—
72
Annual Report 2014
Financial Section

The fair values of derivative financial instruments are estimated on the basis of information obtained from counterparty financial
institutions.
The fair values of the derivative financial instruments for which hedge accounting is applied as of March 31, 2014 and 2013 are as follows:
Processing method in principleMillions of yen
Notionalamount
Estimatedfair value
Notionalamount
Estimatedfair value
2014 2013
Currency option contracts:
To sell foreign currencies ¥— ¥— ¥ — ¥ —
To buy foreign currencies — — — —
Forward exchange contracts:
To sell foreign currencies — — 2,755 (102)
To buy foreign currencies — — — —
¥— ¥— ¥2,755 ¥(102)
Thousands of U.S. dollars
Notionalamount
Estimatedfair value
2014
Currency option contracts:
To sell foreign currencies $— $—
To buy foreign currencies — —
Forward exchange contracts:
To sell foreign currencies — —
To buy foreign currencies — —
$— $—
Assigning method of foreign forward exchange contractsMillions of yen
Notionalamount
Estimatedfair value
Notionalamount
Estimatedfair value
2014 2013
Forward exchange contracts:
To sell foreign currencies ¥1,030 ¥— ¥1,146 ¥—
To buy foreign currencies 47 — — —
¥1,077 ¥— ¥1,146 ¥—
Thousands of U.S. dollars
Notionalamount
Estimatedfair value
2014
Forward exchange contracts:
To sell foreign currencies $10,000 $—
To buy foreign currencies 456 —
$10,456 $ —
The fair values of derivative financial instruments are estimated on the basis of information obtained from counterparty financial
institutions.
73
Annual Report 2014
Financial Section

Forward exchange contracts accounted for under the assigning method are handled together with accounts receivable and accounts
payable. Therefore, their fair value is included within the fair value of accounts receivable and accounts payable.Millions of yen
Notionalamount
Estimatedfair value
Notionalamount
Estimatedfair value
2014 2013
Commodity swap contracts:
Variable receipt and fixed payment ¥1,571 ¥22 ¥2,251 ¥211
¥1,571 ¥22 ¥2,251 ¥211
Thousands of U.S. dollars
Notionalamount
Estimatedfair value
2014
Commodity swap contracts:
Variable receipt and fixed payment $15,252 $214
$15,252 $214
The fair values of derivative financial instruments are estimated on the basis of information obtained from counterparty financial
institutions.
23. Leaseslessee
Future minimum lease payments under non-cancelable operating lease arrangements as of March 31, 2014 are ¥557 million ($5,408 thou-
sand) due within one year and ¥756 million ($7,340 thousand) due after one year.
24. Related Party TransactionsThe Company and its consolidated subsidiaries have related party transactions with Hitachi, Ltd., the parent company. The major transac-
tions with Hitachi, Ltd., are as follows;
Transactions between certain subsidiary and related party:Millions of yen Thousands of U.S. dollars
2014 2013 2014
Balances with Hitachi, Ltd.
Deposits to Hitachi group cash management fund ¥49,358 ¥30,314 $479,204
Transactions with Hitachi, Ltd.
Net increase (decrease) in deposits to Hitachi group cash management fund ¥19,044 ¥ (4,854) $184,893
25. Segment InformationThe Company’s reportable segments are the constituent units of
our business, for which separate financial information is available,
and whose operating results are reviewed periodically by the Board
of Directors of the Company to determine the allocation of man-
agement resources and assess their performance.
The Company is developing business activities based on the
organizational structure that is categorized depending on the
degree of product processing, from materials through components
to parts.
Based on the above, according to the degree of product pro-
cessing, the Company determines two reportable segments,
namely categorizing materials as “Functional Materials Segment”
and the components and parts as “Advanced Components and
Systems Segment” and the main products of each reportable
segment are provided on pages 35–38 of this annual report.
74
Annual Report 2014
Financial Section

Reportable segment information:Millions of yen
Functional Materials
Advanced Components and Systems Total Eliminations Consolidated
2014
Sales to external customers ¥260,800 ¥232,966 ¥493,766 ¥ — ¥493,766
Intersegment sales 10,452 1,745 12,197 (12,197) —
271,252 234,711 505,963 (12,197) 493,766
Operating income ¥ 24,400 ¥ 3,379 ¥ 27,779 ¥ (4) ¥ 27,775
Assets ¥292,946 ¥218,073 ¥511,019 ¥ (2,939) ¥508,080
Other
Depreciation and amortization ¥ 12,540 ¥ 11,913 ¥ 24,453 ¥ — ¥ 24,453
Investments in equity method affiliates 4,265 2,715 6,980 — 6,980
Increase in property, plant and equipment and intangible assets 13,607 19,885 33,492 — 33,492
Impairment losses on fixed assets 1,602 1,270 2,872 — 2,872
Amortization of goodwill 1,466 2,950 4,416 — 4,416
Goodwill — 19,079 19,079 — 19,079
Millions of yen
Functional Materials
Advanced Components and Systems Total Eliminations Consolidated
2013
Sales to external customers ¥245,157 ¥219,498 ¥464,655 ¥ — ¥464,655
Intersegment sales 8,101 1,304 9,405 (9,405) —
253,258 220,802 474,060 (9,405) 464,655
Operating income ¥ 21,358 ¥ 2,218 ¥ 23,576 ¥ (17) ¥ 23,559
Assets ¥270,357 ¥209,587 ¥479,944 ¥(2,064) ¥477,880
Other
Depreciation and amortization ¥ 12,804 ¥ 12,451 ¥ 25,255 ¥ — ¥ 25,255
Investments in equity method affiliates 5,666 2,120 7,786 — 7,786
Increase in property, plant and equipment and intangible assets 22,619 27,263 49,882 — 49,882
Impairment losses on fixed assets — 1,208 1,208 — 1,208
Amortization of goodwill 453 3,272 3,725 — 3,725
Goodwill 1,347 23,051 24,398 — 24,398
75
Annual Report 2014
Financial Section
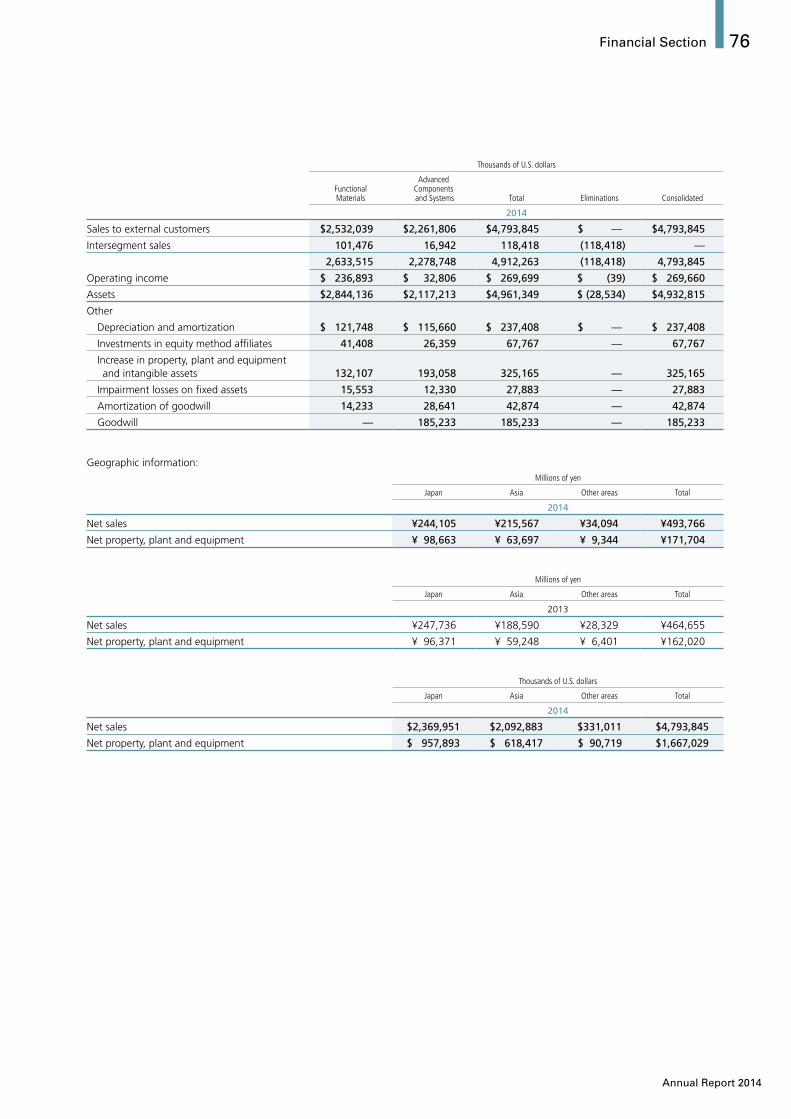
Thousands of U.S. dollars
Functional Materials
Advanced Components and Systems Total Eliminations Consolidated
2014
Sales to external customers $2,532,039 $2,261,806 $4,793,845 $ — $4,793,845
Intersegment sales 101,476 16,942 118,418 (118,418) —
2,633,515 2,278,748 4,912,263 (118,418) 4,793,845
Operating income $ 236,893 $ 32,806 $ 269,699 $ (39) $ 269,660
Assets $2,844,136 $2,117,213 $4,961,349 $ (28,534) $4,932,815
Other
Depreciation and amortization $ 121,748 $ 115,660 $ 237,408 $ — $ 237,408
Investments in equity method affiliates 41,408 26,359 67,767 — 67,767
Increase in property, plant and equipment and intangible assets 132,107 193,058 325,165 — 325,165
Impairment losses on fixed assets 15,553 12,330 27,883 — 27,883
Amortization of goodwill 14,233 28,641 42,874 — 42,874
Goodwill — 185,233 185,233 — 185,233
Geographic information:Millions of yen
Japan Asia Other areas Total
2014
Net sales ¥244,105 ¥215,567 ¥34,094 ¥493,766
Net property, plant and equipment ¥ 98,663 ¥ 63,697 ¥ 9,344 ¥171,704
Millions of yen
Japan Asia Other areas Total
2013
Net sales ¥247,736 ¥188,590 ¥28,329 ¥464,655
Net property, plant and equipment ¥ 96,371 ¥ 59,248 ¥ 6,401 ¥162,020
Thousands of U.S. dollars
Japan Asia Other areas Total
2014
Net sales $2,369,951 $2,092,883 $331,011 $4,793,845
Net property, plant and equipment $ 957,893 $ 618,417 $ 90,719 $1,667,029
76
Annual Report 2014
Financial Section

77
Annual Report 2014
Financial Section
REPORT OF INDEPENDENT AUDITORS


![G-FAIR 브로셔-영문(전) [변환됨] - KOTRAkotra.or.jp/wp-content/uploads/2014/08/G-FAIRKOREA2014... · 2014. 8. 4. · 2014 2014 2014 2014 2014 1st-4th, 2014 2014. 10. 1(Wed)~4(Sat)](https://img.dokumen.tips/doc/110x75/60b1934121e8123f905422c2/g-fair-eoeeoe-e-ee-2014-8-4-2014-2014-2014-2014-2014.jpg)


![[XLS] · Web view2014 2010 2014 2012 2014 2012 2014 2013 2014 2013 2014 2014 2014 2007 2014 2009 2014 2010 2014 2010 2014 2010 2014 2010 2014 2011 2014 2011 2014 2011 2014 2011 2014](https://img.dokumen.tips/doc/110x75/5c633c9b09d3f29e2d8b4f9d/xls-web-view2014-2010-2014-2012-2014-2012-2014-2013-2014-2013-2014-2014-2014.jpg)