Embed Size (px)
Citation preview

2013
Pharma 50
www.PharmExec.com
Patent expiries dampen revenues for some of the biggest Big Pharma, but deep pipelines and the geographic play on emerging country markets soften the blow—while growth continues unabated for a few nimble “stealth” players moving steadily up the list.
Disruptive market change in the biopharmaceuti-cal industry is a given—but individual company
performance is rising to the occasion through ef-ficient deployment of a still considerable inventory of product, process, and knowledge assets. If anything, uncertainty has helped push the Big Pharma players to put their own houses in order, chiefly by slowing the hemorrhage in R&D costs, which has deflected the negatives from the transformation of healthcare as a budget buster—for both households and gov-ernments. True to form, Pharm Exec’s 2013 ranking of the top 50 pharma companies worldwide finds few variations from last year, with the notable excep-tion being the Rx success of global generic firms as they benefit from innovative portfolio diversification: Teva is nipping at the heels of Eli Lilly, at just one slot short of the top 10, while Ranbaxy joins the Pharma 50 list for the first time. Overall, however, only a relatively small set of companies—BMS, in particular, which drops to 17th in global Rx sales,
from 11th last year—have been affected by the rush of patent expiries, contributing disproportionately to the weaker industry sales performance over the past several years.
Another enduring truth is the startling lack of concentrated market power in pharmaceuticals. What has not changed since we began compiling the Pharma 50 in 2000 is the top 10 still comprise less than 50 percent of the global market (their 2012 global share is 42 percent, compared to 43 percent in 2007). Other industries less reputationally vulnerable than pharma see much more concentration at the top; certainly this is true in the payer community, where governments increasingly hold sway. Even in the patent protected market, the core competency of Big Pharma, the top 10 players’ share remained at 52 percent in 2012, the same level it was in 2007. The bottom line? For pharma, business is still an intensely competitive game of chance. —William Looney, Editor-in-Chief
By Waseem Noor and Michael Kleinrock, IMS
ELECTRONICALLY REPRINTED FROM MAY 2013

PHARMACEUTICAL EXECUTIVEPHARMACEUTICAL EXECUTIVE MAY 2013 www.PharmExec.com
Pharma 50
2013 Rank Company HQ [website] 2012 Rx Sales (USD billions) 2012 R&D spend (USD millions)
1 Pfizer New York [pfizer.com]
$47.404 $7,046
2 Novartis Basel, Switzerland [novartis.com]
$45.418 $8,831
3 Merck Whitehouse Station, NJ [merck.com]
$41.143 $7,911
4 Sanofi Paris, France [sanofi.com]
$38.370 $6,117.8
5 Roche Basel, Switzerland [roche.com]
$37.542 $8,032.2
6 GlaxoSmithKline Brentford, England [gsk.com]
$33.107 $5,255.7
7 AstraZeneca London, England [astrazeneca.com]
$27.064 $4,452
8 Johnson & Johnson New Brunswick, New Jersey [jnj.com]
$23.491 $5,362
9 Abbott Abbott Park, Illinois [abbott.com]
$23.119 $2,900
10 Eli Lilly Indianapolis, Indiana [lilly.com]
$18.509 $5,074.5
Sources: Company financial statements, SEC 10k reports, other Pharm Exec estimates, and contributions from the EvaluatePharma industry sales surveys.
To identify what’s driving the num-bers, we examined the top 50 as a group and in comparison to companies outside the top 50. We see five trends shaping current sales performance across the geographies where the phar-ma group competes:
Perhaps most notable is the contrac-tion in the US market—the first in more than 50 years. This contraction comes not only from several patent expiries of billion dollar blockbusters—including Plavix, Seroquel, Lipitor, and Zyprexa—but also from increased scrutiny by pay-ers for reimbursement and regulators for approval. The negative growth is driven by a few companies, each of whom had exposure to over $5 billion in revenue loss due to patent expiration of their major products. In the United States, there were 13 such companies in the five year period
of 2008 to 2012: Pfizer, GSK, Takeda, Merck, J&J, BMS, AZ, Novartis, Sanofi, Lilly, Forest, Boehringer-Ingelheim, Ei-sai, and Roche. Thus, in Figure 1, we see that year-on-year growth for the entire market was negative for the first time.
For the 13 companies, year-on-year performance for 2012 amounted to a close to 10 percent contraction in rev-enues against 2011. Excluding these companies, we see that US growth per-formance for the remainder of the top 50 was actually slightly higher com-pared to last year. The 13 companies thus represent the brunt of the loss to the industry, with the remaining com-panies in the top 50 performing fairly well. The top line in Figure 1 represents the growth of all other companies with revenue in the United States, comprised of over 600 companies outside of the
top 50. The growth in these companies is significantly more than the top 50, and includes companies with extremely varied portfolios, including branded products and generics. In many ways it is not surprising to see such growth, given that they are starting from a smaller base of revenues than the top 50 and that some are posting new revenues from newly launched generics, at the expense of those facing patent expiries.
The second trend is the impact of the recession in Europe, where we see a zero growth situation rather than an outright contraction. The lagging performance of the pharmaceutical industry in the five major EU countries is due more to austerity and government fiscal issues rather than inherent company dynam-ics. In these countries, patent expiration does not have as striking an effect on

PHARMACEUTICAL EXECUTIVEPHARMACEUTICAL EXECUTIVE MAY 2013 www.PharmExec.com
Pharma 50
company sales after loss of exclusivity (LOE) because the branded product’s re-tention of sales is much higher compared to the United States. Many companies retain significant sales from off-patent products in the EU five as government reimbursement treats off-patent brands and generics similarly. Nonetheless, policy changes in the last five years have changed this pattern substantially and there is significant reduction in sales for off-patent brands as well as steeper ero-sion of new patent expiries.
In the European countries, industry performance is thus a bit better than in the United States, with sales relatively flat and zero growth. Once again, a handful of countries are driving stagnant growth of the industry overall. In this case, by splitting the performance of the compa-nies that had over $5 billion in patent exposure in the European Union alone—Novartis, Pfizer, Sanofi, Merck, GSK, AZ, and Takeda—we see that as a group these seven contracted by about almost 6 percent in 2012 (Figure 2). The remain-ing companies in the top 50 actually had an uptick in growth compared to 2011 with almost 3.5 percent growth in 2012, which is also stronger than the growth experienced by all the other companies with sales in Europe outside of the top 50. These remaining companies consti-tute about 1,600 small companies spread through all of the EU five markets.
Third, in the other lead mature mar-ket, Japan, we see more positive growth for the industry, albeit at low single digits. The every-other-year mandatory price cuts on pharmaceutical products imposed by the government, defines the zig-zag nature of Figure 3. We can see, though, that by separating the perfor-mance of those five companies that had patent expiry revenue exposure close to $5 billion—Pfizer, Merck, Sanofi, Dai-nippon Sumitomo, and Eisai—perfor-mance of the other members of the top 50 was slightly higher than the group as a whole. Once again, performance of companies outside of the top 50 was even higher given the small base for growth.
–15.0%
–10.0%
–5.0%
0.0%
5.0%
10.0%
15.0%
20.0%
25.0%
2008 2009 2010 2011 2012
Total US
LOE >$5BN Companies
Other Top 50 Companies
Remaining Companies
YoY
Gro
wth
Figure 1: Performance of US pharma market by company type.
–4.0%
–2.0%
0.0%
2.0%
4.0%
6.0%
8.0%
10.0%
12.0%
2008 2009 2010 2011 2012
YoY
Gro
wth
Total Japan
LOE >$5BN Companies
Other Top 50 Companies
Remaining Companies
Figure 3: Performance of Japan’s pharma market by company type.
Figure 2: Performance of EU pharma market by company type.
–8.0%
–6.0%
–4.0%
–2.0%
0.0%
2.0%
4.0%
6.0%
8.0%
10.0%
2008 2009 2010 2011 2012
Total EU5
LOE >$5BN Companies
Other top 50 Companies
Remaining Companies
YoY
Gro
wth
PHARMACEUTICAL EXECUTIVEPHARMACEUTICAL EXECUTIVE MAY 2013 www.PharmExec.com
Pharma 50
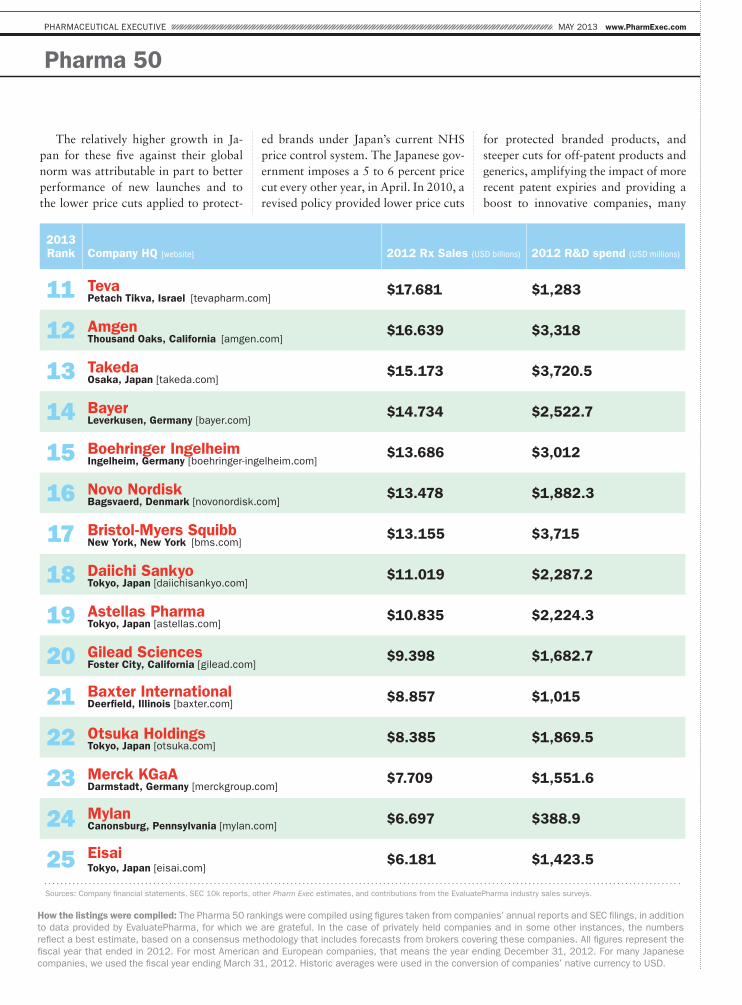
The relatively higher growth in Ja-pan for these five against their global norm was attributable in part to better performance of new launches and to the lower price cuts applied to protect-
ed brands under Japan’s current NHS price control system. The Japanese gov-ernment imposes a 5 to 6 percent price cut every other year, in April. In 2010, a revised policy provided lower price cuts
for protected branded products, and steeper cuts for off-patent products and generics, amplifying the impact of more recent patent expiries and providing a boost to innovative companies, many
2013 Rank Company HQ [website] 2012 Rx Sales (USD billions) 2012 R&D spend (USD millions)
11 Teva Petach Tikva, Israel [tevapharm.com]
$17.681 $1,283
12 Amgen Thousand Oaks, California [amgen.com]
$16.639 $3,318
13 Takeda Osaka, Japan [takeda.com]
$15.173 $3,720.5
14 Bayer Leverkusen, Germany [bayer.com]
$14.734 $2,522.7
15 Boehringer Ingelheim Ingelheim, Germany [boehringer-ingelheim.com]
$13.686 $3,012
16 Novo Nordisk Bagsvaerd, Denmark [novonordisk.com]
$13.478 $1,882.3
17 Bristol-Myers Squibb New York, New York [bms.com]
$13.155 $3,715
18 Daiichi Sankyo Tokyo, Japan [daiichisankyo.com]
$11.019 $2,287.2
19 Astellas Pharma Tokyo, Japan [astellas.com]
$10.835 $2,224.3
20 Gilead Sciences Foster City, California [gilead.com]
$9.398 $1,682.7
21 Baxter International Deerfield, Illinois [baxter.com] $8.857 $1,015
22 Otsuka Holdings Tokyo, Japan [otsuka.com]
$8.385 $1,869.5
23 Merck KGaA Darmstadt, Germany [merckgroup.com]
$7.709 $1,551.6
24 Mylan Canonsburg, Pennsylvania [mylan.com] $6.697 $388.9
25 Eisai Tokyo, Japan [eisai.com]
$6.181 $1,423.5
Sources: Company financial statements, SEC 10k reports, other Pharm Exec estimates, and contributions from the EvaluatePharma industry sales surveys.
How the listings were compiled: The Pharma 50 rankings were compiled using figures taken from companies’ annual reports and SEC filings, in addition to data provided by EvaluatePharma, for which we are grateful. In the case of privately held companies and in some other instances, the numbers reflect a best estimate, based on a consensus methodology that includes forecasts from brokers covering these companies. All figures represent the fiscal year that ended in 2012. For most American and European companies, that means the year ending December 31, 2012. For many Japanese companies, we used the fiscal year ending March 31, 2012. Historic averages were used in the conversion of companies’ native currency to USD.

PHARMACEUTICAL EXECUTIVEPHARMACEUTICAL EXECUTIVE MAY 2013 www.PharmExec.com
Pharma 50
of whom are responding by launching products in Japan earlier in their global launch sequence than they had in the past. Vaccines are another bright spot, aided by more government support for immunization and access.
Fourth, the strong economic growth platform provided by the emerging country markets are helping to differ-entiate revenues for those companies with a solid commitment to establish-ing a local presence (Figure 4). Not all the top 50 are playing in the emerg-ing markets; the sales performance of those who are competing in these markets has been in the double-digits. Many of the top 50 are selling both original and branded generic products since growth in both of these sectors has been exceptionally strong in the past five years. However, despite the promise of continued double digit sales growth in many emerging markets, the gains have not been able to off-set weaker performance in the United States and Europe.
In Figure 4, we see the performance of the companies within the top 50 com-pared with performance of all the other companies selling in emerging markets. The top 50 companies primarily are selling innovative brands along with branded generics and annual growth in these two segments has been close to 10 percent over the past five years. Compa-nies outside of the top 50 are primarily selling branded generics (non-original brands that have some unique branding and where the company marketing the products is not the originator) and regu-lar generics. The “other products” cat-egory includes OTC medicines as well as products like homeopathic or traditional Chinese medicines as well as vaccines. For companies outside of the top 50, the growth in all these segments has been in-credibly strong, although the innovative brand growth is off a smaller base.
The fifth and final trend on perfor-mance of the Pharma 50 is the broad move away from relying on mergers, acquisitions, and divestitures to replace
or supplement organic growth (Figure 5). The pace of mega-mergers since the start of the century has begun to slow—Pfizer/Pharmacia (2003), Sanofi/Aventis (2004), Roche/ Genentech (2009), Mer-ck/Schering-Plough (2009), and Pfizer/Wyeth (2009). One might argue that Sanofi-Genzyme (in 2011) could be the last of the mega-mergers.
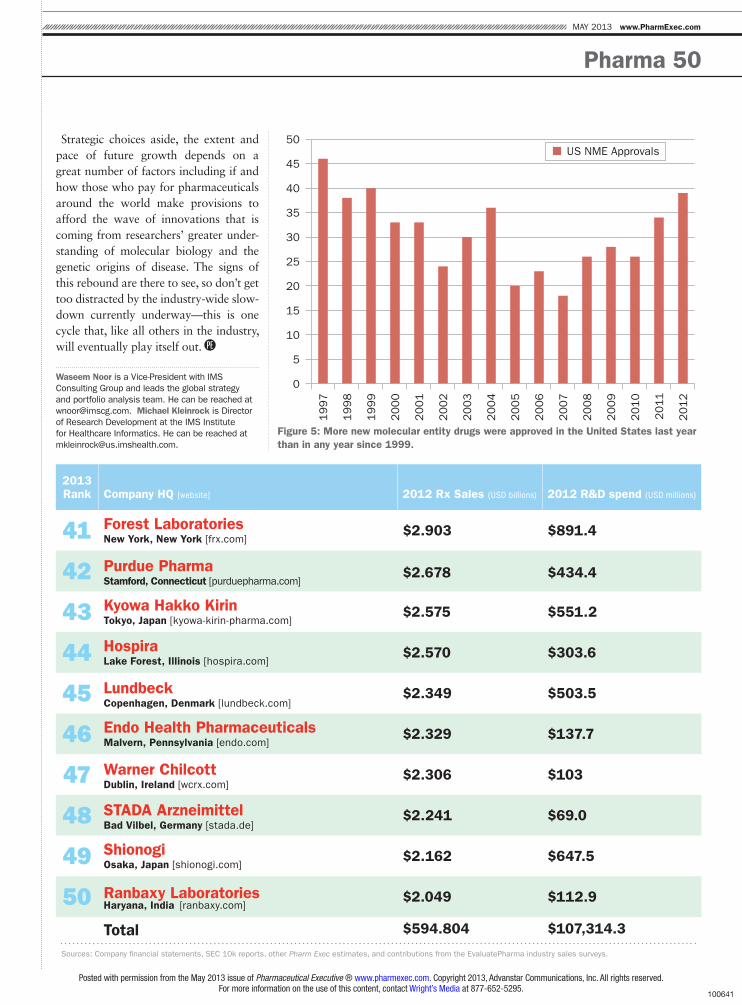
Science dividend Looking ahead, although industry per-formance in the mature market countries is slowing compared to historical rates, a trend moderated by the growing sup-port from emerging markets, there is still a silver lining. More New Molecular En-tity (NME) drugs were approved in the United States last year than in any year since 1999, continuing a rebound in ap-provals that started in 2011 and appears set to continue.
The right model? The relative stability of the top 10 com-panies and the fact that many in this set
2012 Sales in Pharmerging Markets
Top Company Five Year Compound Annual Growth Rate Non-Top Company Five Year Compound Annual Growth Rate
Top company group
Non-top company group
– 50 100Sales $BN
Innovative Branded Non-Original Branded Unbranded Products Other Products
Innovative branded
Non-original branded
Unbranded products
Other products
10.2%
9.6%
20.6%
12.7%
Innovative branded
Non-original branded
Unbranded products
Other products
11.5%
17.5%
26.7%
23.3%
Figure 4: The performance of the companies within the top 50 compared with performance of all the other companies selling in emerging markets.

PHARMACEUTICAL EXECUTIVE
Pharma 50
have a predominant impact on the slow industry performance overall provides insight into the current discussion over alternative business models to drive fu-ture success. As companies look to fill the gaps in their portfolios by patent-expired blockbusters, most are finding that it takes several mid-sized products
with appeal to a well-defined disease segment in the specialty class. This is be-cause it is becoming increasingly difficult for drug makers in the small molecule, primary care markets to demonstrate the benefit of new drugs against the existing standard of care. A strength in specialist-driven markets provides better prospects
up front, especially for those therapies that initiate use in the in-hospital setting. Regardless of whether it is a recent stra-tegic choice, or if the company was one of the early few who began with a ratio-nale to serve this segment, a visible pres-ence in specialty seems to be working in the current environment.
2013 Rank Company HQ [website] 2012 Rx Sales (USD billions) 2012 R&D spend (USD millions)
26 Celgene Summit, New Jersey [celgene.com]
$5.369 $1,412.1
27 CSLMelbourne, Australia [csl.com.au]
$5.345 $423.5
28 Les Laboratoires ServierNeuilly-sur-Seine, France [servier.com]
$4.931 $1,232.7
29 Allergan Irvine, California [allergan.com]
$4.756 $926.8
30 Actavis Zug, Switzerland [actavis.com]
$4.716 $401.8
31 Mitsubishi Tanabe Pharma Osaka, Japan [mt-pharma.co.jp]
$4.547 $853.2
32 Shire Dublin, Ireland [shire.com]
$4.407 $848.8
33 Chugai Pharmaceutical Tokyo, Japan [chugai-pharm.co.jp]
$4.359 $761.1
34 Biogen Idec Weston, Massachusetts [biogenidec.com]
$3.783 $1,326.3
35 Dainippon Sumitomo Pharma Osaka, Japan [ds-pharma.com]
$3.625 $723.2
36 UCB Brussels, Belgium [ucb.com]
$3.566 $1,064.6
37 Fresenius Bad Homburg, Germany [fresenius-kabi.com]
$3.445 $270
38 Menarini Florence, Italy [menarini.com]
$3.045 $220.7
39 Grifols Barcelona, Spain [grifols.com]
$3.000 $137.7
40 Valeant Pharmaceuticals International Mississauga, Ontario [valeant.com]
$2.957 $79.1
Sources: Company financial statements, SEC 10k reports, other Pharm Exec estimates, and contributions from the EvaluatePharma industry sales surveys.
Pharma 50
MAY 2013 www.PharmExec.com
Strategic choices aside, the extent and pace of future growth depends on a great number of factors including if and how those who pay for pharmaceuticals around the world make provisions to afford the wave of innovations that is coming from researchers’ greater under-standing of molecular biology and the genetic origins of disease. The signs of this rebound are there to see, so don’t get too distracted by the industry-wide slow-down currently underway—this is one cycle that, like all others in the industry, will eventually play itself out.
Waseem Noor is a Vice-President with IMS Consulting Group and leads the global strategy and portfolio analysis team. He can be reached at [email protected]. Michael Kleinrock is Director of Research Development at the IMS Institute for Healthcare Informatics. He can be reached at [email protected].
0
5
10
15
20
25
30
35
40
45
50
1997
1998
1999
2000
2001
2002
2003
2004
2005
2006
2007
2008
2009
2010
2011
2012
US NME Approvals
Figure 5: More new molecular entity drugs were approved in the United States last year than in any year since 1999.
2013 Rank Company HQ [website] 2012 Rx Sales (USD billions) 2012 R&D spend (USD millions)
41 Forest Laboratories New York, New York [frx.com]
$2.903 $891.4
42 Purdue Pharma Stamford, Connecticut [purduepharma.com]
$2.678 $434.4
43 Kyowa Hakko Kirin Tokyo, Japan [kyowa-kirin-pharma.com]
$2.575 $551.2
44 Hospira Lake Forest, Illinois [hospira.com]
$2.570 $303.6
45 Lundbeck Copenhagen, Denmark [lundbeck.com]
$2.349 $503.5
46 Endo Health Pharmaceuticals Malvern, Pennsylvania [endo.com]
$2.329 $137.7
47 Warner Chilcott Dublin, Ireland [wcrx.com]
$2.306 $103
48 STADA Arzneimittel Bad Vilbel, Germany [stada.de]
$2.241 $69.0
49 Shionogi Osaka, Japan [shionogi.com]
$2.162 $647.5
50 Ranbaxy Laboratories Haryana, India [ranbaxy.com]
$2.049 $112.9
Total $594.804 $107,314.3
Sources: Company financial statements, SEC 10k reports, other Pharm Exec estimates, and contributions from the EvaluatePharma industry sales surveys.
Posted with permission from the May 2013 issue of Pharmaceutical Executive ® www.pharmexec.com. Copyright 2013, Advanstar Communications, Inc. All rights reserved.For more information on the use of this content, contact Wright’s Media at 877-652-5295.
100641