Embed Size (px)
Citation preview

2013 Learning Assessment of SEQAEP
Institutions Public Report
Australian Council for Educational Research
10/15/2014

ii
This Page has been left blank intentionally
iii
Table of Contents Executive Summary ................................................................................................................................. 1
Key Highlights .......................................................................................................................................... 2
Performance by Subjects ........................................................................................................................ 2
Bangla .............................................................................................................................................. 3
English ............................................................................................................................................. 3
Mathematics ................................................................................................................................... 4
Performance between years ................................................................................................................... 4
Results for Socio-economic background ................................................................................................. 4
Student factors impacting learning outcomes ................................................................................ 4
Teacher factors impacting learning outcomes ............................................................................... 5
Chapter I Introduction ............................................................................................................................ 6
1.1 Learning Assessment of SEQAEP Institutions ............................................................................. 6
1.2 LASI Assessment Instruments ..................................................................................................... 7
1.2.1 Bangla ..................................................................................................................................... 8
1.2.2 English .................................................................................................................................... 9
1.2.3 Mathematics .......................................................................................................................... 9
1.3 LASI Questionnaires .................................................................................................................. 11
1.4 LASI population and sample coverage ...................................................................................... 11
1.5 Administration of Tools and Monitoring .................................................................................. 12
1.6 Data Management and Analysis of Data................................................................................... 12
1.7 Understanding of Results .......................................................................................................... 13
1.7.1 .............................................................................................................................................. 13
1.7.1 Competency (skill) bands: ............................................................................................. 13
1.7.2 Statistical Significance ................................................................................................... 14
1.7.3 Effect Size ...................................................................................................................... 14
1.7.4 Percentiles ..................................................................................................................... 14
Chapter II Bangla Achievement ............................................................................................................. 16
2.1 Bangla Scale Score Map .................................................................................................................. 16
2.2 Analysis of questions by Content and Cognitive skills .................................................................... 17
2.3 Benchmarking of Bangla Language ................................................................................................. 18
2.4 Bangla Language achievement by Grade ........................................................................................ 21
2.4.1Trends in Grade 8 Bangla achievement between 2012 (Grade 9) and 2013 (Grade 8) ........ 22
2.4.2 Trends in Bangla band distribution ...................................................................................... 22
iv
2.5 Bangla Language achievement by Gender ...................................................................................... 23
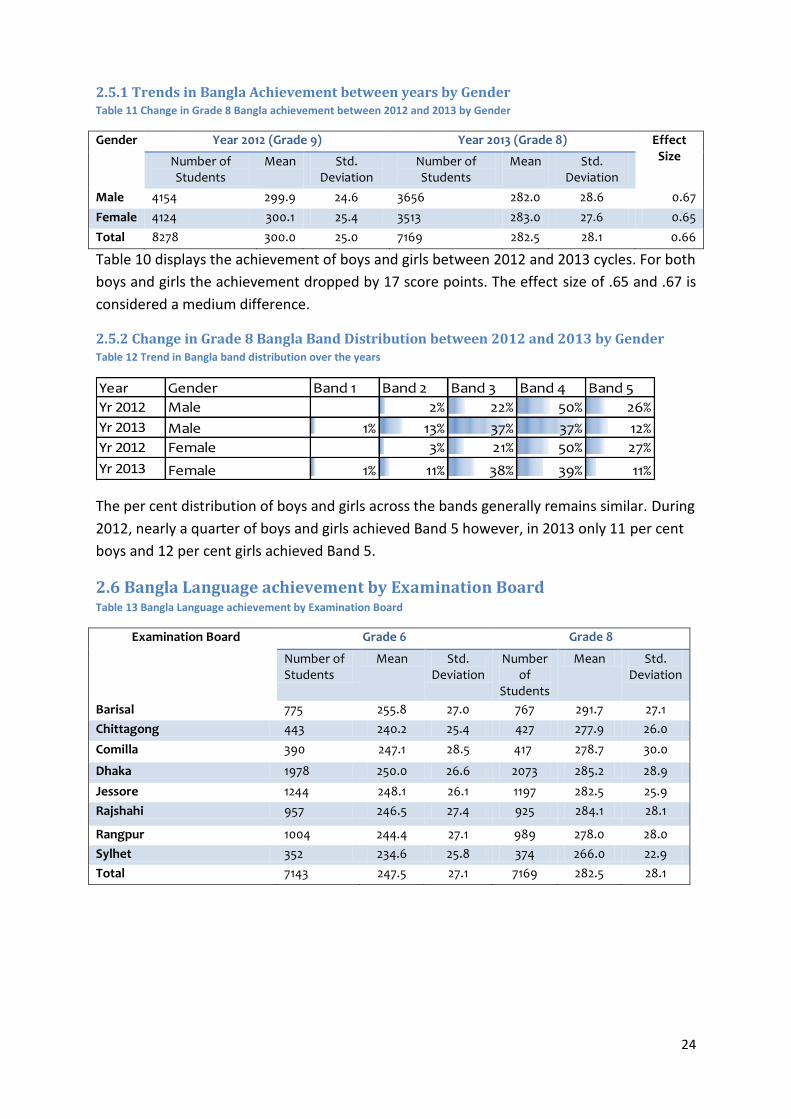
2.5.1 Trends in Bangla Achievement between years by Gender .................................................. 24
2.5.2 Change in Grade 8 Bangla Band Distribution between 2012 and 2013 by Gender ............. 24
2.6 Bangla Language achievement by Examination Board ................................................................... 24
2.6.1 Band distribution of Bangla Language achievement by Examination Board ....................... 26
2.6.2 Trends in Grade 8 Bangla achievement between years by Examination Board .................. 26
2.7 Bangla language achievement by School type ................................................................................ 27
2.7.1Band distribution of Bangla Language achievement by School type .................................... 28
2.7.2 Trends in Grade 8 Bangla achievement between years by School type .............................. 28
2.7.3 Trends in Grade 8 Bangla Band distribution between years by School type ....................... 28
Chapter III: English Achievement .......................................................................................................... 29
3.1 English Scale Score Map .................................................................................................................. 29
3.2 Analysis of questions by content and cognitive skills ..................................................................... 30
3.3 Benchmarking of English Language ................................................................................................ 31
3.4 English language performance by Grade ........................................................................................ 34
3.3.1 Trends in Grade 8 English achievement between years ...................................................... 34
3.3.2 Trend in Grade 8 English Band distribution between 2012(Grade 9) and 2013 (Grade 8) .. 35
3.4 English language performance by Gender ...................................................................................... 35
3.4.1 Band distribution of English achievement by Gender ......................................................... 36
3.5 English language performance by Examination Board ................................................................... 37
3.5.1 Trend in Grade 8 English achievement between years by Examination Board ................... 39
3.6 English language performance by School Type .............................................................................. 40
3.6.1 Band distribution of English achievement by School type ................................................... 41
3.6.2 Trend in Grade 8 English achievement between years by School type ............................... 41
Chapter IV: Mathematics Achievement ............................................................................................... 43
4.1 Mathematics Scale Score Map ........................................................................................................ 43
4.2 Analysis of questions by content and cognitive skills ..................................................................... 44
4.3 Benchmarking of Mathematics ....................................................................................................... 45
4.4 Mathematics achievement by Grade .............................................................................................. 48
4.4.1 Trends in Grade 8 Mathematics achievement between years ............................................ 48
4.5 Mathematics achievement by Gender............................................................................................ 49
4.5.1 Band distribution of Mathematics achievement by Gender ............................................... 50
4.5.2 Trend in Grade 8 Mathematics achievement between years by Gender ............................ 50
4.6 Mathematics performance by Examination Board ......................................................................... 51
v
4.6.1 Band distribution of Mathematics achievement by Examination Board ............................. 52
4.6.2 Trend in Grade 8 Mathematics achievement between years by Examination Board ......... 53
4.7 Mathematics performance by School type ..................................................................................... 53
4.7.1 Band distribution of Mathematics achievement by School type ......................................... 54
4.7.2 Trend in Grade 8 Mathematics achievement between years by School type ..................... 55
Chapter V Other Findings and Factors Impacting Learning Outcomes ................................................. 56
5.1 Student Performance in Bangla, English and Mathematics between Schools ............................... 56
5.2 Bangla between School variation ................................................................................................... 56
5.3 English between School variation ................................................................................................... 57
5.4 Mathematics between School variation ......................................................................................... 58
5.4 Result of background variables ....................................................................................................... 59
5.4.1 Teacher Variance Analysis ........................................................................................................... 60
5.4.2 Teacher and Student Factors link with Learning outcome ......................................................... 61
5.4.3 Factors associated with Bangla Learning outcomes ............................................................. 63
5.4.4 Factors associated with English Learning outcomes ............................................................. 64
5.4.5 Factors associated with Mathematics Learning outcomes ......................................................... 65
5.4.6 Detention in previous grade and Learning Outcomes ................................................................. 66
5.4.7 PMT stipend and Learning outcomes .......................................................................................... 66
5.4.8 Head Teachers’ perception on Teacher Efficiency and Student learning outcomes in
Mathematics ......................................................................................................................................... 66
5.4.9 Head Teachers’ perception on lack of school resources and Student learning outcomes in
Mathematics ......................................................................................................................................... 68
5.4.10 SEQAEP Intervention and Student Achievement ....................................................................... 69
5.4.11 School Having Additional Classes and school mean achievement of students in English and
Mathematics ......................................................................................................................................... 69
5.5 Feedback: What Students Know and Can Do.................................................................................. 70
5.6 Concluding Comments and way forward ........................................................................................ 82
Appendix I. ............................................................................................................................................ 85
vi
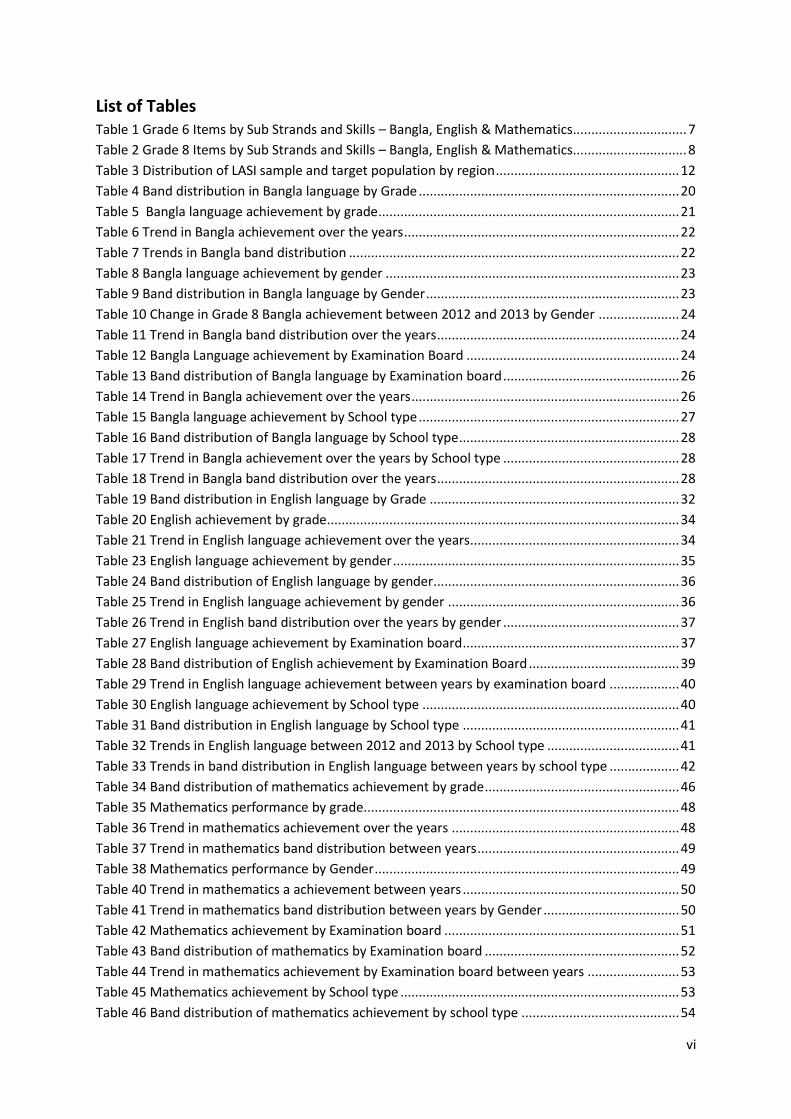
List of Tables Table 1 Grade 6 Items by Sub Strands and Skills – Bangla, English & Mathematics ............................... 7
Table 2 Grade 8 Items by Sub Strands and Skills – Bangla, English & Mathematics ............................... 8
Table 3 Distribution of LASI sample and target population by region .................................................. 12
Table 4 Band distribution in Bangla language by Grade ....................................................................... 20
Table 5 Bangla language achievement by grade .................................................................................. 21
Table 6 Trend in Bangla achievement over the years ........................................................................... 22
Table 7 Trends in Bangla band distribution .......................................................................................... 22
Table 8 Bangla language achievement by gender ................................................................................ 23
Table 9 Band distribution in Bangla language by Gender ..................................................................... 23
Table 10 Change in Grade 8 Bangla achievement between 2012 and 2013 by Gender ...................... 24
Table 11 Trend in Bangla band distribution over the years .................................................................. 24
Table 12 Bangla Language achievement by Examination Board .......................................................... 24
Table 13 Band distribution of Bangla language by Examination board ................................................ 26
Table 14 Trend in Bangla achievement over the years ......................................................................... 26
Table 15 Bangla language achievement by School type ....................................................................... 27
Table 16 Band distribution of Bangla language by School type ............................................................ 28
Table 17 Trend in Bangla achievement over the years by School type ................................................ 28
Table 18 Trend in Bangla band distribution over the years .................................................................. 28
Table 19 Band distribution in English language by Grade .................................................................... 32
Table 20 English achievement by grade ................................................................................................ 34
Table 21 Trend in English language achievement over the years ......................................................... 34
Table 23 English language achievement by gender .............................................................................. 35
Table 24 Band distribution of English language by gender................................................................... 36
Table 25 Trend in English language achievement by gender ............................................................... 36
Table 26 Trend in English band distribution over the years by gender ................................................ 37
Table 27 English language achievement by Examination board ........................................................... 37
Table 28 Band distribution of English achievement by Examination Board ......................................... 39
Table 29 Trend in English language achievement between years by examination board ................... 40
Table 30 English language achievement by School type ...................................................................... 40
Table 31 Band distribution in English language by School type ........................................................... 41
Table 32 Trends in English language between 2012 and 2013 by School type .................................... 41
Table 33 Trends in band distribution in English language between years by school type ................... 42
Table 34 Band distribution of mathematics achievement by grade ..................................................... 46
Table 35 Mathematics performance by grade...................................................................................... 48
Table 36 Trend in mathematics achievement over the years .............................................................. 48
Table 37 Trend in mathematics band distribution between years ....................................................... 49
Table 38 Mathematics performance by Gender ................................................................................... 49
Table 40 Trend in mathematics a achievement between years ........................................................... 50
Table 41 Trend in mathematics band distribution between years by Gender ..................................... 50
Table 42 Mathematics achievement by Examination board ................................................................ 51
Table 43 Band distribution of mathematics by Examination board ..................................................... 52
Table 44 Trend in mathematics achievement by Examination board between years ......................... 53
Table 45 Mathematics achievement by School type ............................................................................ 53
Table 46 Band distribution of mathematics achievement by school type ........................................... 54
vii
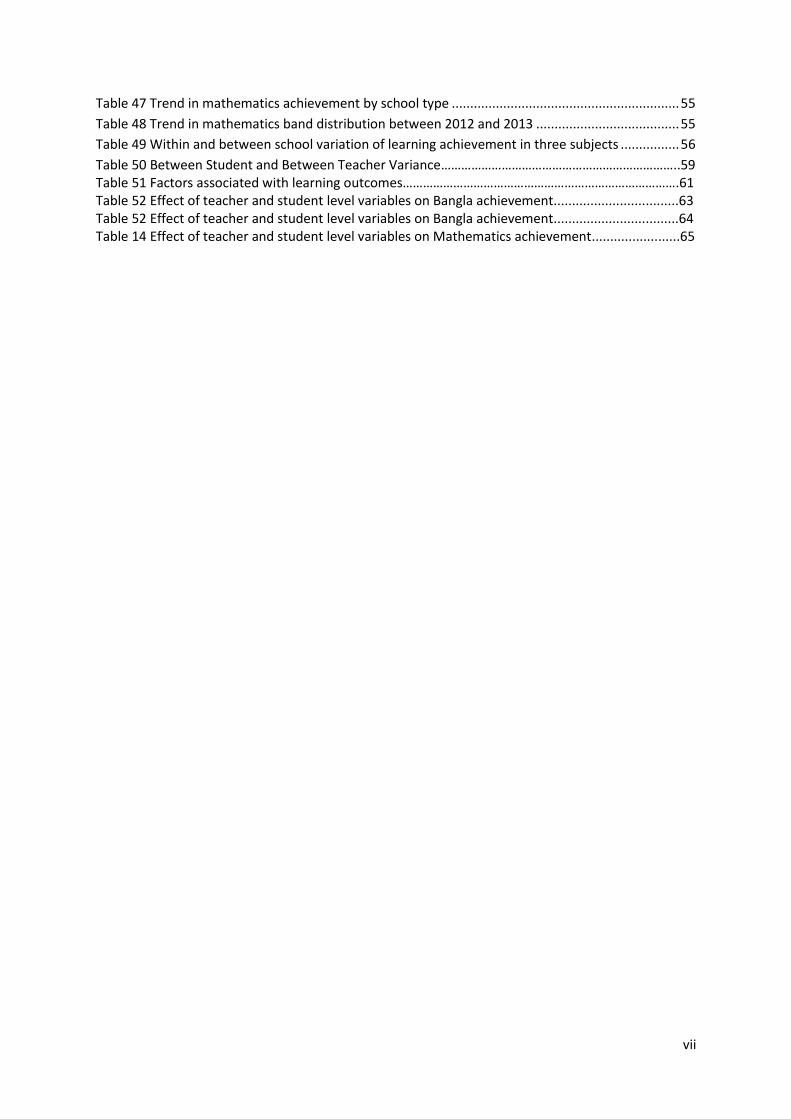
Table 47 Trend in mathematics achievement by school type .............................................................. 55
Table 48 Trend in mathematics band distribution between 2012 and 2013 ....................................... 55
Table 49 Within and between school variation of learning achievement in three subjects ................ 56
Table 50 Between Student and Between Teacher Variance……………………………………………………………..59 Table 51 Factors associated with learning outcomes……………………………………………………………………….61 Table 52 Effect of teacher and student level variables on Bangla achievement..................................63 Table 52 Effect of teacher and student level variables on Bangla achievement..................................64 Table 14 Effect of teacher and student level variables on Mathematics achievement........................65
viii
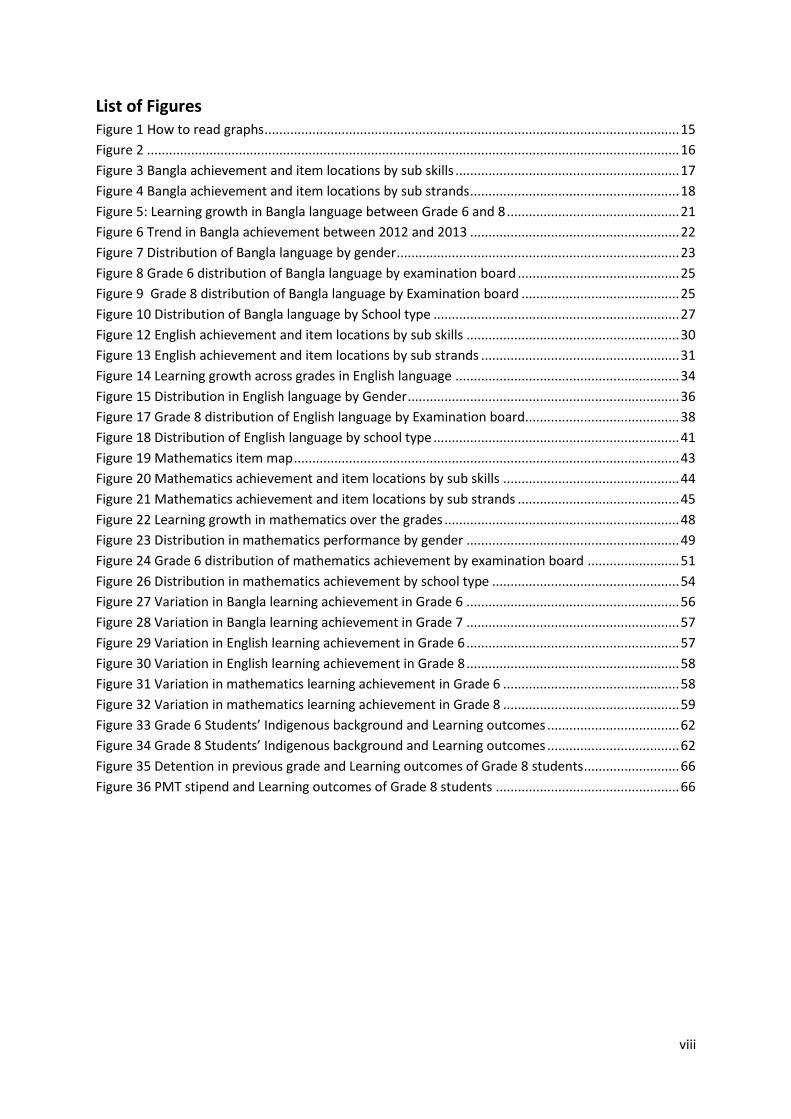
List of Figures Figure 1 How to read graphs ................................................................................................................. 15
Figure 2 ................................................................................................................................................. 16
Figure 3 Bangla achievement and item locations by sub skills ............................................................. 17
Figure 4 Bangla achievement and item locations by sub strands ......................................................... 18
Figure 5: Learning growth in Bangla language between Grade 6 and 8 ............................................... 21
Figure 6 Trend in Bangla achievement between 2012 and 2013 ......................................................... 22
Figure 7 Distribution of Bangla language by gender ............................................................................. 23
Figure 8 Grade 6 distribution of Bangla language by examination board ............................................ 25
Figure 9 Grade 8 distribution of Bangla language by Examination board ........................................... 25
Figure 10 Distribution of Bangla language by School type ................................................................... 27
Figure 12 English achievement and item locations by sub skills .......................................................... 30
Figure 13 English achievement and item locations by sub strands ...................................................... 31
Figure 14 Learning growth across grades in English language ............................................................. 34
Figure 15 Distribution in English language by Gender .......................................................................... 36
Figure 17 Grade 8 distribution of English language by Examination board .......................................... 38
Figure 18 Distribution of English language by school type ................................................................... 41
Figure 19 Mathematics item map ......................................................................................................... 43
Figure 20 Mathematics achievement and item locations by sub skills ................................................ 44
Figure 21 Mathematics achievement and item locations by sub strands ............................................ 45
Figure 22 Learning growth in mathematics over the grades ................................................................ 48
Figure 23 Distribution in mathematics performance by gender .......................................................... 49
Figure 24 Grade 6 distribution of mathematics achievement by examination board ......................... 51
Figure 26 Distribution in mathematics achievement by school type ................................................... 54
Figure 27 Variation in Bangla learning achievement in Grade 6 .......................................................... 56
Figure 28 Variation in Bangla learning achievement in Grade 7 .......................................................... 57
Figure 29 Variation in English learning achievement in Grade 6 .......................................................... 57
Figure 30 Variation in English learning achievement in Grade 8 .......................................................... 58
Figure 31 Variation in mathematics learning achievement in Grade 6 ................................................ 58
Figure 32 Variation in mathematics learning achievement in Grade 8 ................................................ 59
Figure 33 Grade 6 Students’ Indigenous background and Learning outcomes .................................... 62
Figure 34 Grade 8 Students’ Indigenous background and Learning outcomes .................................... 62
Figure 35 Detention in previous grade and Learning outcomes of Grade 8 students .......................... 66
Figure 36 PMT stipend and Learning outcomes of Grade 8 students .................................................. 66

ix
This page has been left blank intentionally
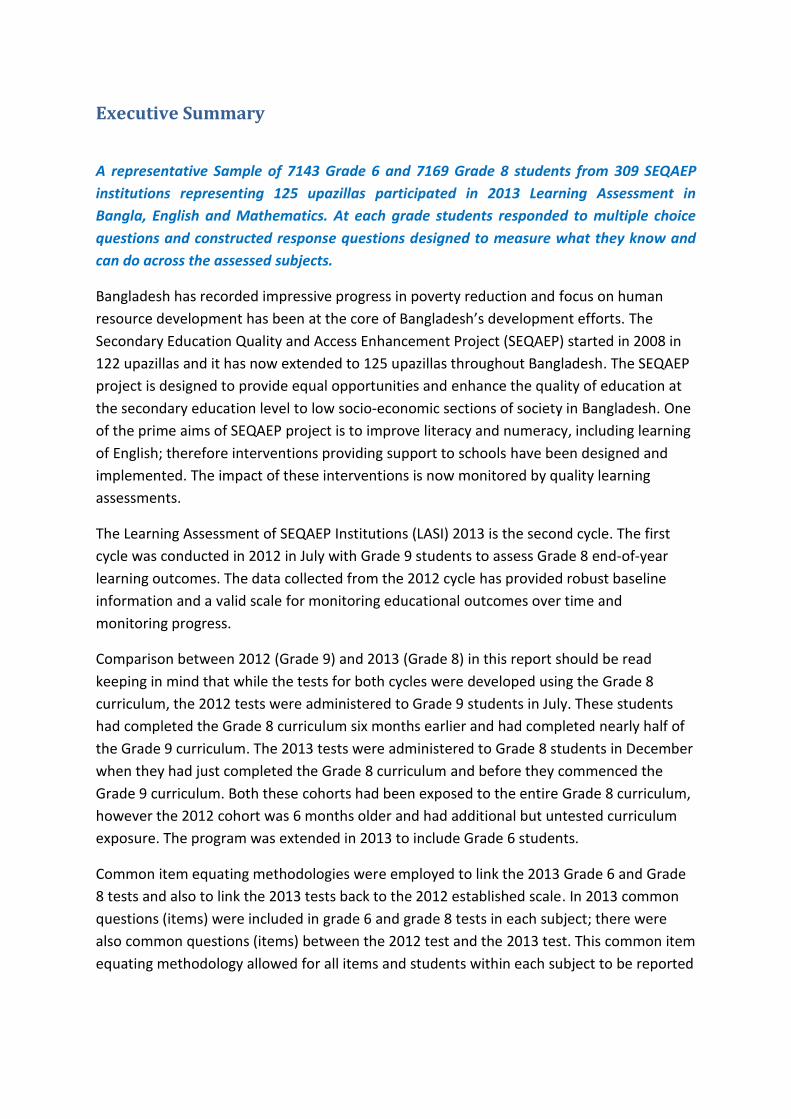
Executive Summary
A representative Sample of 7143 Grade 6 and 7169 Grade 8 students from 309 SEQAEP
institutions representing 125 upazillas participated in 2013 Learning Assessment in
Bangla, English and Mathematics. At each grade students responded to multiple choice
questions and constructed response questions designed to measure what they know and
can do across the assessed subjects.
Bangladesh has recorded impressive progress in poverty reduction and focus on human
resource development has been at the core of Bangladesh’s development efforts. The
Secondary Education Quality and Access Enhancement Project (SEQAEP) started in 2008 in
122 upazillas and it has now extended to 125 upazillas throughout Bangladesh. The SEQAEP
project is designed to provide equal opportunities and enhance the quality of education at
the secondary education level to low socio-economic sections of society in Bangladesh. One
of the prime aims of SEQAEP project is to improve literacy and numeracy, including learning
of English; therefore interventions providing support to schools have been designed and
implemented. The impact of these interventions is now monitored by quality learning
assessments.
The Learning Assessment of SEQAEP Institutions (LASI) 2013 is the second cycle. The first
cycle was conducted in 2012 in July with Grade 9 students to assess Grade 8 end-of-year
learning outcomes. The data collected from the 2012 cycle has provided robust baseline
information and a valid scale for monitoring educational outcomes over time and
monitoring progress.
Comparison between 2012 (Grade 9) and 2013 (Grade 8) in this report should be read
keeping in mind that while the tests for both cycles were developed using the Grade 8
curriculum, the 2012 tests were administered to Grade 9 students in July. These students
had completed the Grade 8 curriculum six months earlier and had completed nearly half of
the Grade 9 curriculum. The 2013 tests were administered to Grade 8 students in December
when they had just completed the Grade 8 curriculum and before they commenced the
Grade 9 curriculum. Both these cohorts had been exposed to the entire Grade 8 curriculum,
however the 2012 cohort was 6 months older and had additional but untested curriculum
exposure. The program was extended in 2013 to include Grade 6 students.
Common item equating methodologies were employed to link the 2013 Grade 6 and Grade
8 tests and also to link the 2013 tests back to the 2012 established scale. In 2013 common
questions (items) were included in grade 6 and grade 8 tests in each subject; there were
also common questions (items) between the 2012 test and the 2013 test. This common item
equating methodology allowed for all items and students within each subject to be reported
2
on the established 2012 subject scale. Further technical information on this methodology is
provided in the equating section of the Technical Report.
In addition to students responding to achievement tests in Bangla, English and
Mathematics, background questionnaires were administered to students, teachers and head
teachers to collect demographic and attitudinal data.
Key Highlights
Students achieved significantly higher in Bangla in 2012 (Grade 9) than in 2013
(Grade 8). The Bangla mean scale score (BSS) in 2012 was 300 compared to 283 in
2013. There was minimal change in student achievement in English and
mathematics. The English mean scale score (ESS) in 2012 (Grade 9) was 300
compared with 294 in 2013 (Grade 8). The mathematics mean scale score (MSS) was
300 in 2012 and was 299 in 2013.
Relative achievement in Examination Boards changed from 2012 (Grade 9) to 2013
(Grade 8). In 2012 Barisal had the highest means scores in English and mathematics
and Khulna had the highest mean in Bangla. In 2013 Barisal had the highest mean
score for both grades in all three subjects.
Sylhet had the lowest mean performance in all subjects in 2012 (Grade 9) and 2013
(Grade 8).
The General Education and Madrasah schools are disaggregated to other types-
Junior Secondary Schools, Secondary Schools, Higher Secondary and Dhakil
Madrasah, Alim Madrasah and Fazil Madrasah respectively but because the numbers
were small for the purpose of reporting the schools have been clubbed together. In
both 2012 (Grade 9) and 2013 (Grade 8) General Education schools achieved higher
mean scores than Madrasah Education Schools in both grades and in all subjects.
There was no significant difference in performance between boys and girls in 2012
or 2013, suggesting higher levels of gender equity in the Bangladesh education
system than in other Asian and European countries.
Grade 8 student achievement was significantly higher than Grade 6 and indicates a
strong learning growth in all subjects.
LASI 2013 between-school variations in learning achievement in both grades and in
all three subjects was very high, suggesting large differences in instruction quality in
SEQAEP schools.
Performance by Subjects
Performance of students has been reported in Bands (achievement levels). The Bands provide a more generalised picture of development in a subject, by reporting percentages of students in particular score ranges and are useful as a frame of reference for monitoring growth between grades and over the years of the intervention. Band 1 is the basic level of proficiency while Band 5 is the highest skill level.
3
Bangla
Mean performance of students at Grade 6 was 248 and 283 at Grade 8. It indicates a strong
learning growth between the two grade levels.
11 per cent of Grade 6 students and 49 per cent of Grade 8 students demonstrated
reading skills of band 4 and 5 levels. Students at this level are able to draw
inferences in complex texts, interpret, infer and synthesise information to arrive at a
conclusion. Students performing at bands 4 and 5 are also likely to have acquired the
skills of all lower bands.
32 per cent Grade 6 and 38 per cent Grade 8 students demonstrated band 3 reading
skills. Students at this level demonstrate an ability to connect related information
and interpret actions, behaviour and emotions of a character in simple narrative
texts. They understand the meaning of moderately difficult words in context.
Students performing at band 3 are also likely to have acquired the skills of all lower
bands.
41 per cent Grade 6 and 12 per cent Grade 8 students demonstrated band 2 skills.
Students at this level are able to draw very simple inferences by connecting
information across sentences and interpret explicitly stated information from more
complex texts. They know the meaning of simple but less common words.
Only 1 per cent of Grade 8 students and 16 per cent of Grade 6 students
demonstrated band 1 skills. Students at this level have acquired only basic reading
skills. They are able to retrieve information from short simple texts.
There was no significant difference in gender performance.
General Education schools performed slightly higher than the Madrasah Education
schools in Grade 6 and considerably high at Grade 8.
English
Mean performance of students at Grade 6 was 273 and 294 at Grade 8. It indicates a
strong learning growth between grades.
8 per cent students of Grade 6 and 34 per cent students of Grade 8 achieved in
bands 4 and 5. They demonstrate well developed understanding of interpreting
complex texts, and identify implicit attitude of the writer in a persuasive text.
32 per cent of Grade 6 students and 42 per cent of Grade 8 students achieved in
band 3. These students demonstrate an ability to make simple inferences by
connecting information, understand sequence of events in texts, and show
knowledge of simple grammatical concepts.
18 per cent of Grade 6 students and 3 per cent of Grade 8 students achieved in band
1. These students acquired some basic English language skills. They locate explicit
stated information from short and simple texts.
The gender differences are small, favouring boys, in both grades. This is counter to
the pattern of gender differences seen in many other countries.
4
General Education schools performed moderately higher than Madrasah Education
schools at Grade 6 and considerably higher at Grade 8.
Mathematics
Mean performance of students at Grade 6 was 284 and at Grade 8 was 299. It
indicates a strong learning growth between grades.
18 per cent of Grade 6 students and 35 per cent of Grade 8 students achieved in
bands 4 and 5. These students demonstrate a well developed understanding of
mathematical concepts. They have developed reasoning and problem solving skills.
18 per cent of Grade 6 students and 26 per cent of Grade 8 students achieved at
band 3 level. Students at this level solve problems involving different mathematical
operations, simplify algebraic expressions.
26 per cent of students at Grade 6 and 9 per cent of students at Grade 8 achieved at
band 1 level. Students at this level have acquired skills to use routine processes,
demonstrate an understanding of whole numbers, and recognise properties.
General Education schools performed slightly higher than Madrasah Education
schools at Grade 6 and moderately higher at Grade 8.
Performance between years
In 2012 (Grade 9) students performed better in Bangla than in 2013 (Grade 8). The
mean performance of students in 2012 was 300 while in 2013 it was 283.
In 2012 (Grade 9) students performed slightly better in English than in 2013 (Grade
8). The mean of students in 2012 was 300 while in 2013 it was 294.
In 2012 (Grade 9) students performed about the same in mathematics as in 2013
(Grade 8). The means were 300 and 299 respectively.
Barisal Examination Board mean performance improved for all subjects in 2013.
Results for Socio-economic background
International research studies indicate that a supportive home and school environment has
a high impact on student performance. The approach of analysis for this report takes into
account selected variables at the same time. It means that it represents the effects between
teacher and student level variables and achievement while all other significant effects are
already taken into account. For example, father's education has a positive effect on
achievement even after the positive effect on achievement of instructional strategies as
reported by students has been taken into account. The LASI background questionnaire
analysis findings are:
Student factors impacting learning outcomes
Students who indicate that they belong to a tribe perform at a significantly lower
level than their peers in Bangla, English and Mathematics. This trend is observed
both in Grade 6 and 8.
5
Students whose fathers have experienced more than primary school education
perform at a higher level than students whose fathers are illiterate or have
completed only primary school.
Students who report that their teachers make the classes and learning interesting,
explain things clearly and want to help students to learn perform at a higher level
than their peers in Bangla, English and Mathematics.
No differences in student performance emerge depending on different perceptions
regarding the academic self-assessment students have. In other words, students
who report being keen, successful and good students do not perform at a higher
level than their peers with a lower general academic self-assessment.
Students who report greater levels of being hit or threatened by other students,
disruptive behaviour of other students in class and other students spreading
rumours about them perform at a lower level in Bangla, English and Mathematics.
Students who do not repeat a class perform better than students who are repeating
a class.
Receiving PMT stipend is not conclusively indicating having any effect on student
achievement.
Teacher factors impacting learning outcomes
Students in schools where more teachers report having a Masters level qualification
performed at a higher level in English but not in Bangla or Mathematics.
Students in schools where more teachers report having a Bachelor of Education
degree perform at a higher level in Bangla and English but not in Mathematics.
There was insufficient variance to conclusive inform the link between teacher
qualification and student achievement as 94 per cent of teachers answered "yes" to
the question "Have you received SSC Teacher Incentive Award from SEQAEP in
2012?"
Students in schools where teachers report having more years of teaching experience
perform at the same level as students in schools where teachers reported having
less teaching experience in Bangla, English and Mathematics.
Students taught in schools where teachers have been teaching for longer perform at
a higher level than students in schools where teachers have shorter teaching
experience.
Schools where Head Teacher reports high teacher efficiency has higher student
achievement.
Student achievement is low in schools / divisions where Head Teachers perceives
that the school recourses are inadequate.
6
Chapter I Introduction
The Secondary Education Quality and Access Enhancement Project (SEQAEP) is one of the
biggest projects under taken by the Directorate of Secondary and Higher Education (DESHE),
in Bangladesh. The main objective of the SEQAEP is ensuring quality education and
equitable access for poor students at secondary level. The program is being implemented in
125 selected Upazillas. The Monitoring and Evaluation Wing (MEW) is responsible for
monitoring and reporting on the implementation of SEQUAEP. Assessment of teaching-
learning outcomes is one of the identified key indicators and is managed under the aegis of
MEW.
1.1 Learning Assessment of SEQAEP Institutions
The Learning Assessment of SEQAEP Institutions (LASI) was established in 2012 as one of the
key performance indicator for the SEQAEP institutions. Modern test theory, specifically Item
Response Theory (IRT) methodology was adopted to develop subject educational
measurement scales that allow valid and reliable monitoring of progress in learning over
time. The first cycle conducted in 2012 was in July with Grade 9 students assessed on the
Grade 8 competencies. In 2013 the testing program was extended to include Grade 6. From
the 2013 LASI results it is possible to describe the trajectory of learning between Grades 6
and 8 and to describe the variation in achievement between the 2012 and 2013 SEQEAP
cohorts.
The LASI is a useful program to provide a feedback to the teachers, policymakers and
stakeholders alike – to establish what students are achieving in Bangla, English and
mathematics and to identify areas of concern. By repeating LASI at regular intervals the data
can be used to measure trends in achievement and progress and the quality of education to
inform quality-related policies and the effectiveness of interventions in SEQAEP institutions.
LASI has been established to answer the following questions:
How well are the students learning in the SEQAEP institutions?
Is there evidence of strengths and weaknesses in areas of students’ knowledge and
skills?
How are sub-groups performing in the SEQAEP institutions?
What factors are associated with student achievement?
Does the achievement of students change over time?
LASI is an annual sample-based assessment program conducted in Grades 6 and 8 of
SEQAEP institutions in Bangla, English and Mathematics. A representative, random sample
of students is drawn from the SEQAEP institutions to take part in the testing program.
Students studying in SEQAEP institutions from 125 Upazillas representing all divisions were
chosen to participate in the assessment. LASI tests are equated so that 2013 results can be
validly compared with those of 2012.
7
The 2012 LASI results were reported using three achievement scales – Bangla reading,
English reading and Mathematics – and these scales make it possible to report students
from 2013 cycle and all future cycles on the same scales, providing valid comparisons
between grades and between years.
1.2 LASI Assessment Instruments
Since one main focus of the SEQAEP project is to improve literacy and numeracy skills, the
LASI assesses these skills and collects survey data on other factors known to impact on the
quality of literacy and numeracy learning.
A rigorous process for test development was adopted. The content of the Bangla, English
and mathematics tests was determined by the specifications provided in the assessment
framework for each subject. These frameworks, which describe the specific knowledge and
skills to be assessed in each subject, were developed in consultation with the National
Curriculum and Textbook Board (NCTB), who provided academic and curriculum expertise.
The Australian Council for Educational Research (ACER) provided MEW with technical
assistance in developing the tests. MEW and NCTB subject experts reviewed the tests prior
to piloting to ensure that the tests reflected the intent of the national curriculum – both the
acquisition and application of basic skills in each subject. All tests were piloted with
approximately 450 students from 30 schools to ensure the measurement properties of each
question and final tests were selected by MEW and NCTB in consultation with ACER.
In all three subject tests multiple choice questions and constructed response questions were
included and each question was classified according to the cognitive domain it addressed:
knowledge, understanding, and application.
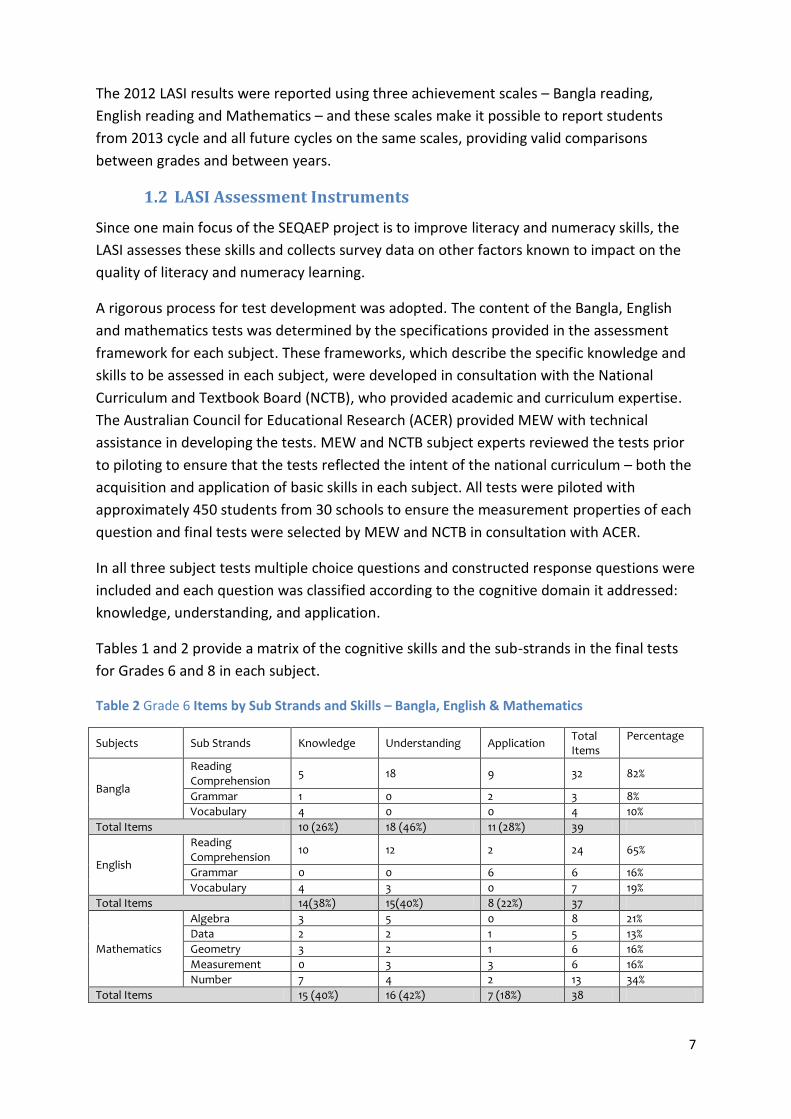
Tables 1 and 2 provide a matrix of the cognitive skills and the sub-strands in the final tests
for Grades 6 and 8 in each subject.
Table 2 Grade 6 Items by Sub Strands and Skills – Bangla, English & Mathematics
Subjects Sub Strands Knowledge Understanding Application Total Items
Percentage
Bangla
Reading Comprehension
5 18 9 32 82%
Grammar 1 0 2 3 8%
Vocabulary 4 0 0 4 10%
Total Items 10 (26%) 18 (46%) 11 (28%) 39
English
Reading Comprehension
10 12 2 24 65%
Grammar 0 0 6 6 16%
Vocabulary 4 3 0 7 19%
Total Items 14(38%) 15(40%) 8 (22%) 37
Mathematics
Algebra 3 5 0 8 21%
Data 2 2 1 5 13%
Geometry 3 2 1 6 16%
Measurement 0 3 3 6 16%
Number 7 4 2 13 34%
Total Items 15 (40%) 16 (42%) 7 (18%) 38
8
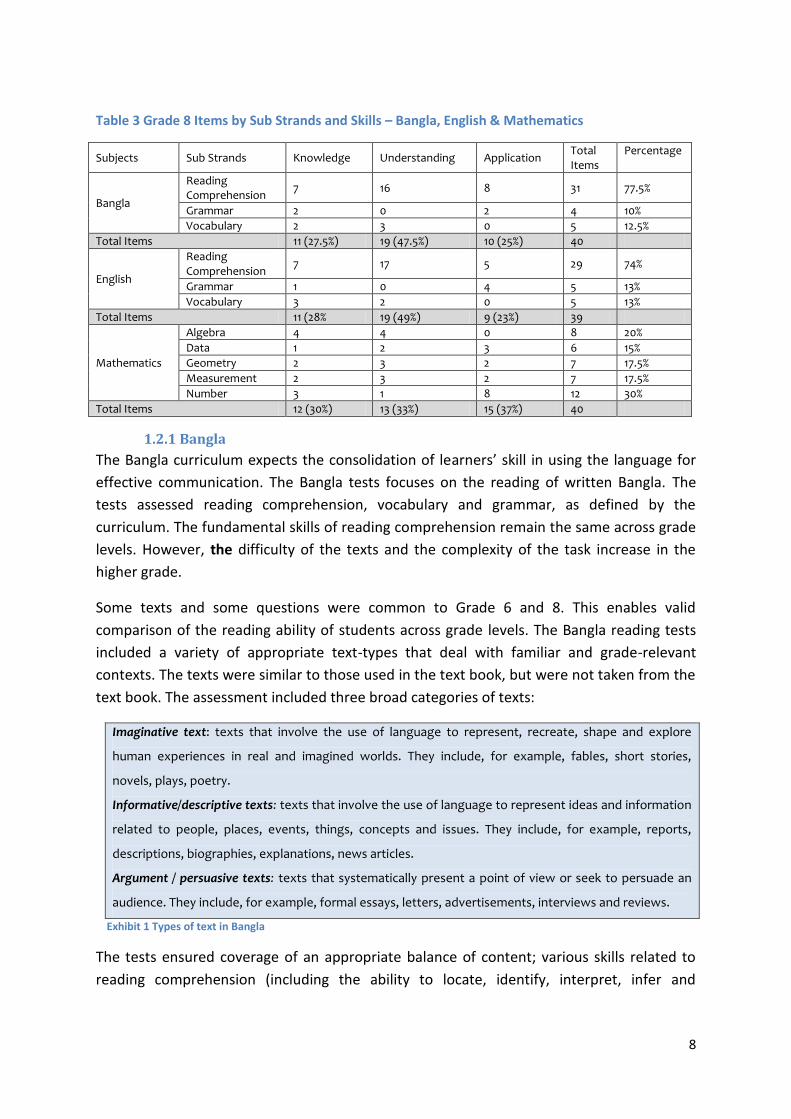
Table 3 Grade 8 Items by Sub Strands and Skills – Bangla, English & Mathematics
Subjects Sub Strands Knowledge Understanding Application Total Items
Percentage
Bangla
Reading Comprehension
7 16 8 31 77.5%
Grammar 2 0 2 4 10%
Vocabulary 2 3 0 5 12.5%
Total Items 11 (27.5%) 19 (47.5%) 10 (25%) 40
English
Reading Comprehension
7 17 5 29 74%
Grammar 1 0 4 5 13%
Vocabulary 3 2 0 5 13%
Total Items 11 (28% 19 (49%) 9 (23%) 39
Mathematics
Algebra 4 4 0 8 20%
Data 1 2 3 6 15%
Geometry 2 3 2 7 17.5%
Measurement 2 3 2 7 17.5%
Number 3 1 8 12 30%
Total Items 12 (30%) 13 (33%) 15 (37%) 40
1.2.1 Bangla
The Bangla curriculum expects the consolidation of learners’ skill in using the language for
effective communication. The Bangla tests focuses on the reading of written Bangla. The
tests assessed reading comprehension, vocabulary and grammar, as defined by the
curriculum. The fundamental skills of reading comprehension remain the same across grade
levels. However, the difficulty of the texts and the complexity of the task increase in the
higher grade.
Some texts and some questions were common to Grade 6 and 8. This enables valid
comparison of the reading ability of students across grade levels. The Bangla reading tests
included a variety of appropriate text-types that deal with familiar and grade-relevant
contexts. The texts were similar to those used in the text book, but were not taken from the
text book. The assessment included three broad categories of texts:
Imaginative text: texts that involve the use of language to represent, recreate, shape and explore
human experiences in real and imagined worlds. They include, for example, fables, short stories,
novels, plays, poetry.
Informative/descriptive texts: texts that involve the use of language to represent ideas and information
related to people, places, events, things, concepts and issues. They include, for example, reports,
descriptions, biographies, explanations, news articles.
Argument / persuasive texts: texts that systematically present a point of view or seek to persuade an
audience. They include, for example, formal essays, letters, advertisements, interviews and reviews.
Exhibit 1 Types of text in Bangla
The tests ensured coverage of an appropriate balance of content; various skills related to
reading comprehension (including the ability to locate, identify, interpret, infer and
9
synthesise information) as well as aspects of language use such as vocabulary and grammar
were tested. Questions were classified as per the cognitive domains – knowledge,
understanding and application.
1.2.2 English
The curriculum expects the students to acquire the basic skills of the global language, to
prepare them for its use in higher education and in their working life. The English tests
assessed reading comprehension, vocabulary and grammar as defined by the curriculum.
The fundamental skills of reading comprehension remain the same across grade levels.
However, the difficulty of the texts used and the complexity of the task increased in the
higher grade. Some texts and some questions were common to Grade 6 and 8. This enables
valid comparison of the reading ability of students on the same scale across grade levels.
The tests included a variety of appropriate text-types that deal with familiar and grade-
relevant contexts. The texts had contexts similar to those used in the text book, but were
not taken from the text book.
The assessment included three broad categories of texts:
Imaginative text: texts that involve the use of language to represent, recreate, shape and explore human
experiences in real and imagined worlds. They include, for example, fables, short stories, novels, plays,
poetry.
Informative/descriptive texts: texts that involve the use of language to represent ideas and information
related to people, places, events, things, concepts and issues. They include, for example, reports,
descriptions, biographies, explanations, news articles.
Argument / persuasive texts: texts that systematically present a point of view or seek to persuade an
audience. They include, for example, formal essays, letters, advertisements, interviews and reviews.
Exhibit 2 Types of text in English
Both the Grade 6 and Grade 8 tests contained continuous and non-continuous texts. Non-
continuous texts present information in, for example, charts and graphs, forms and
information sheets and much of the English-text reading required of Bangladeshis will be
reading these kinds of texts for work and for further education. The tests assessed various
skills related to reading comprehension (including the ability to locate, identify, interpret
and infer information) as well as aspects of language use such as vocabulary and grammar.
1.2.3 Mathematics
The mathematics curriculum focuses on developing student ability to apply methods and
skills logically and analytically; and to develop problem-solving skills in their day to day life.
At each grade the mathematics framework is organised around two dimensions: content
(number, algebra, geometry and data) and cognitive skills. The table below summarises the
content domains and the cognitive domains.
10
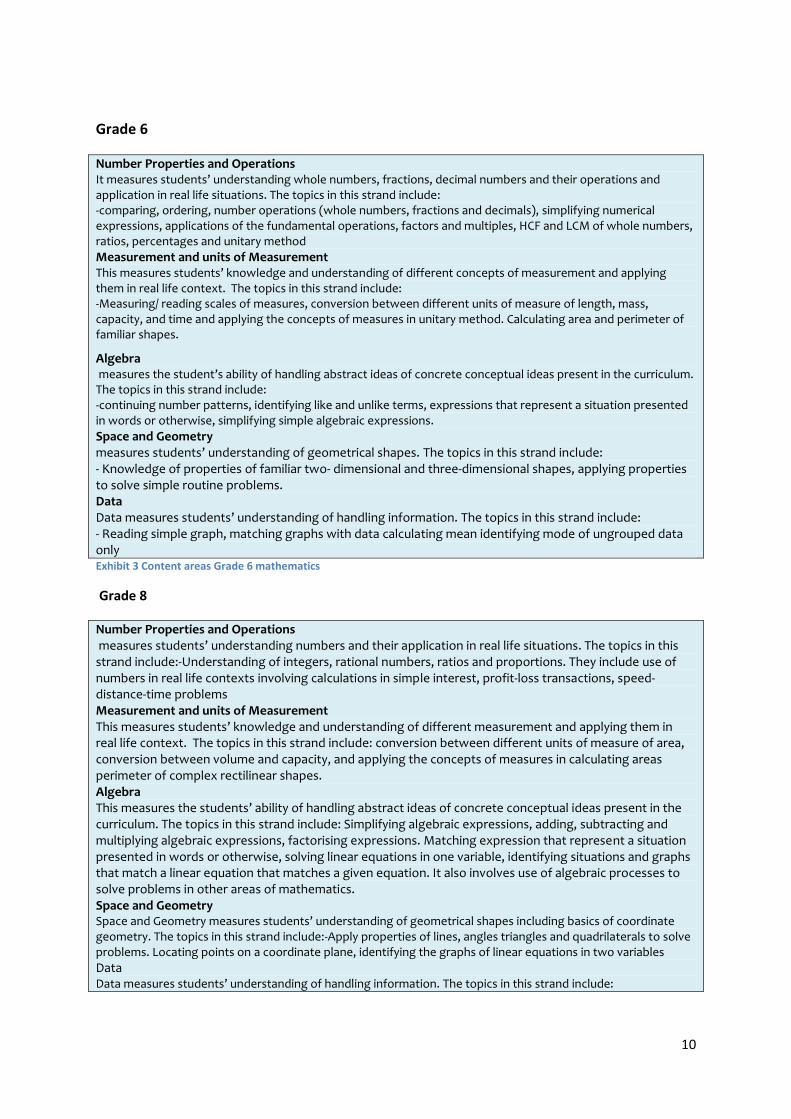
Grade 6
Number Properties and Operations It measures students’ understanding whole numbers, fractions, decimal numbers and their operations and application in real life situations. The topics in this strand include: -comparing, ordering, number operations (whole numbers, fractions and decimals), simplifying numerical expressions, applications of the fundamental operations, factors and multiples, HCF and LCM of whole numbers, ratios, percentages and unitary method
Measurement and units of Measurement This measures students’ knowledge and understanding of different concepts of measurement and applying them in real life context. The topics in this strand include: -Measuring/ reading scales of measures, conversion between different units of measure of length, mass, capacity, and time and applying the concepts of measures in unitary method. Calculating area and perimeter of familiar shapes.
Algebra measures the student’s ability of handling abstract ideas of concrete conceptual ideas present in the curriculum. The topics in this strand include: -continuing number patterns, identifying like and unlike terms, expressions that represent a situation presented in words or otherwise, simplifying simple algebraic expressions.
Space and Geometry measures students’ understanding of geometrical shapes. The topics in this strand include: - Knowledge of properties of familiar two- dimensional and three-dimensional shapes, applying properties to solve simple routine problems. Data Data measures students’ understanding of handling information. The topics in this strand include: - Reading simple graph, matching graphs with data calculating mean identifying mode of ungrouped data only Exhibit 3 Content areas Grade 6 mathematics
Grade 8
Number Properties and Operations measures students’ understanding numbers and their application in real life situations. The topics in this strand include:-Understanding of integers, rational numbers, ratios and proportions. They include use of numbers in real life contexts involving calculations in simple interest, profit-loss transactions, speed-distance-time problems Measurement and units of Measurement This measures students’ knowledge and understanding of different measurement and applying them in real life context. The topics in this strand include: conversion between different units of measure of area, conversion between volume and capacity, and applying the concepts of measures in calculating areas perimeter of complex rectilinear shapes. Algebra This measures the students’ ability of handling abstract ideas of concrete conceptual ideas present in the curriculum. The topics in this strand include: Simplifying algebraic expressions, adding, subtracting and multiplying algebraic expressions, factorising expressions. Matching expression that represent a situation presented in words or otherwise, solving linear equations in one variable, identifying situations and graphs that match a linear equation that matches a given equation. It also involves use of algebraic processes to solve problems in other areas of mathematics. Space and Geometry Space and Geometry measures students’ understanding of geometrical shapes including basics of coordinate geometry. The topics in this strand include:-Apply properties of lines, angles triangles and quadrilaterals to solve problems. Locating points on a coordinate plane, identifying the graphs of linear equations in two variables
Data Data measures students’ understanding of handling information. The topics in this strand include:
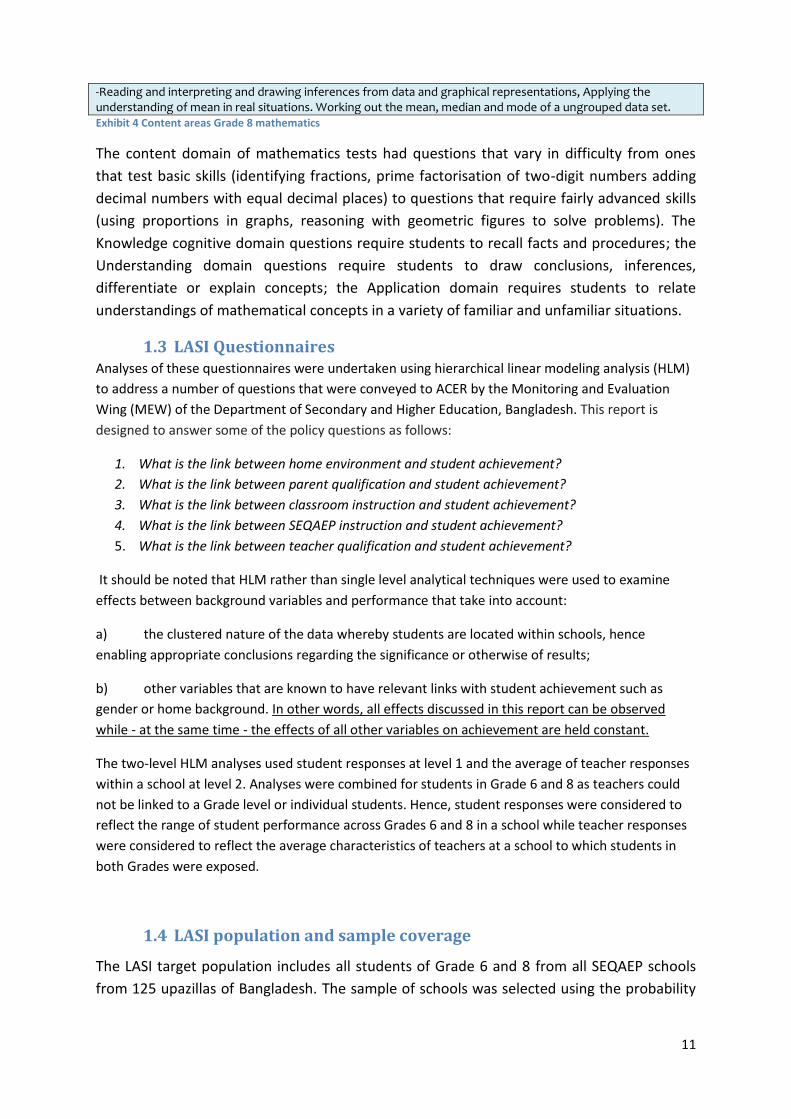
11
-Reading and interpreting and drawing inferences from data and graphical representations, Applying the understanding of mean in real situations. Working out the mean, median and mode of a ungrouped data set. Exhibit 4 Content areas Grade 8 mathematics
The content domain of mathematics tests had questions that vary in difficulty from ones
that test basic skills (identifying fractions, prime factorisation of two-digit numbers adding
decimal numbers with equal decimal places) to questions that require fairly advanced skills
(using proportions in graphs, reasoning with geometric figures to solve problems). The
Knowledge cognitive domain questions require students to recall facts and procedures; the
Understanding domain questions require students to draw conclusions, inferences,
differentiate or explain concepts; the Application domain requires students to relate
understandings of mathematical concepts in a variety of familiar and unfamiliar situations.
1.3 LASI Questionnaires Analyses of these questionnaires were undertaken using hierarchical linear modeling analysis (HLM)
to address a number of questions that were conveyed to ACER by the Monitoring and Evaluation
Wing (MEW) of the Department of Secondary and Higher Education, Bangladesh. This report is
designed to answer some of the policy questions as follows:
1. What is the link between home environment and student achievement?
2. What is the link between parent qualification and student achievement?
3. What is the link between classroom instruction and student achievement?
4. What is the link between SEQAEP instruction and student achievement?
5. What is the link between teacher qualification and student achievement?
It should be noted that HLM rather than single level analytical techniques were used to examine
effects between background variables and performance that take into account:
a) the clustered nature of the data whereby students are located within schools, hence
enabling appropriate conclusions regarding the significance or otherwise of results;
b) other variables that are known to have relevant links with student achievement such as
gender or home background. In other words, all effects discussed in this report can be observed
while - at the same time - the effects of all other variables on achievement are held constant.
The two-level HLM analyses used student responses at level 1 and the average of teacher responses
within a school at level 2. Analyses were combined for students in Grade 6 and 8 as teachers could
not be linked to a Grade level or individual students. Hence, student responses were considered to
reflect the range of student performance across Grades 6 and 8 in a school while teacher responses
were considered to reflect the average characteristics of teachers at a school to which students in
both Grades were exposed.
1.4 LASI population and sample coverage
The LASI target population includes all students of Grade 6 and 8 from all SEQAEP schools
from 125 upazillas of Bangladesh. The sample of schools was selected using the probability
12
proportionate to size (PPS) sampling model, an established and professionally recognised
method of scientific sampling. Out of 6371 educational institutions 239 General Education
schools and 70 Madrasha schools were selected. Over 7000 students were randomly
selected from the selected institutions. The proportion population percentage coverage
from each division is displayed in the table below:
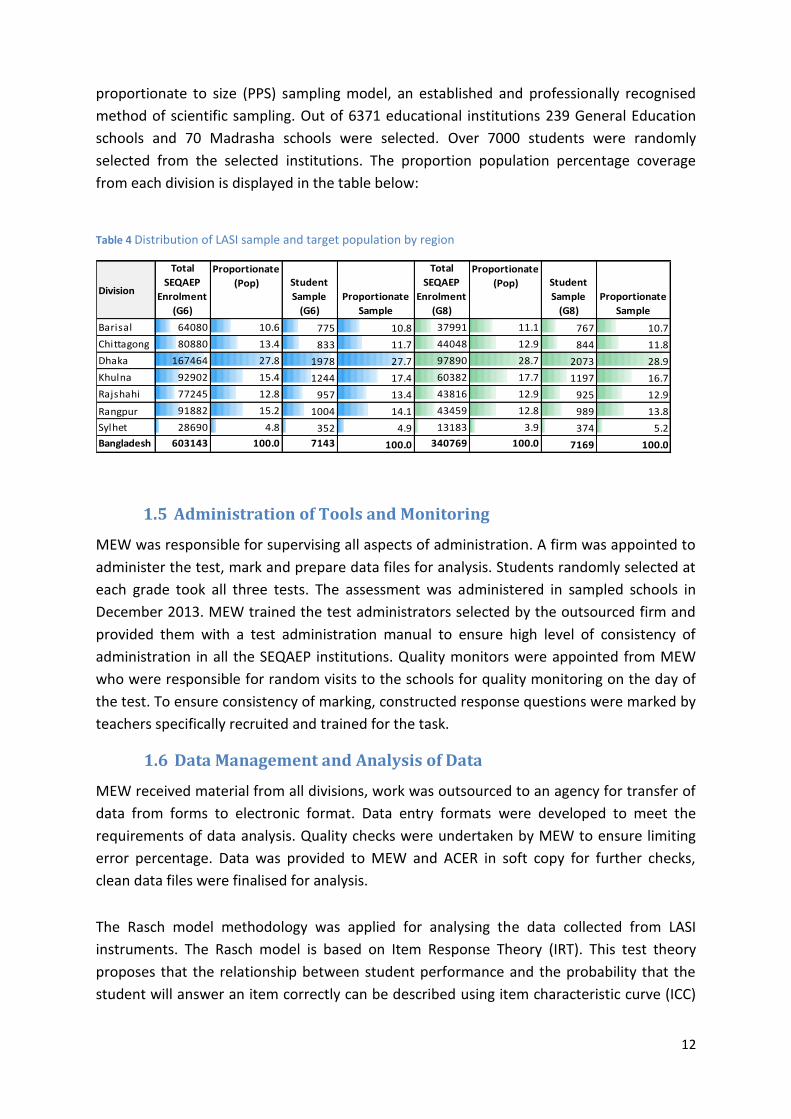
Table 4 Distribution of LASI sample and target population by region
Division
Total
SEQAEP
Enrolment
(G6)
Proportionate
(Pop) Student
Sample
(G6)
Proportionate
Sample
Total
SEQAEP
Enrolment
(G8)
Proportionate
(Pop) Student
Sample
(G8)
Proportionate
Sample
Barisal 64080 10.6 775 10.8 37991 11.1 767 10.7
Chittagong 80880 13.4 833 11.7 44048 12.9 844 11.8
Dhaka 167464 27.8 1978 27.7 97890 28.7 2073 28.9
Khulna 92902 15.4 1244 17.4 60382 17.7 1197 16.7
Rajshahi 77245 12.8 957 13.4 43816 12.9 925 12.9
Rangpur 91882 15.2 1004 14.1 43459 12.8 989 13.8
Sylhet 28690 4.8 352 4.9 13183 3.9 374 5.2
Bangladesh 603143 100.0 7143 100.0 340769 100.0 7169 100.0
1.5 Administration of Tools and Monitoring
MEW was responsible for supervising all aspects of administration. A firm was appointed to
administer the test, mark and prepare data files for analysis. Students randomly selected at
each grade took all three tests. The assessment was administered in sampled schools in
December 2013. MEW trained the test administrators selected by the outsourced firm and
provided them with a test administration manual to ensure high level of consistency of
administration in all the SEQAEP institutions. Quality monitors were appointed from MEW
who were responsible for random visits to the schools for quality monitoring on the day of
the test. To ensure consistency of marking, constructed response questions were marked by
teachers specifically recruited and trained for the task.
1.6 Data Management and Analysis of Data
MEW received material from all divisions, work was outsourced to an agency for transfer of
data from forms to electronic format. Data entry formats were developed to meet the
requirements of data analysis. Quality checks were undertaken by MEW to ensure limiting
error percentage. Data was provided to MEW and ACER in soft copy for further checks,
clean data files were finalised for analysis.
The Rasch model methodology was applied for analysing the data collected from LASI
instruments. The Rasch model is based on Item Response Theory (IRT). This test theory
proposes that the relationship between student performance and the probability that the
student will answer an item correctly can be described using item characteristic curve (ICC)

13
(Lawley 1942; Stocking, 1999). The Rasch analysis provides an item map which places the
item difficulties (also the item location) and student abilities on the same scale. This is in
keeping with the best practice of major international and national surveys such as
Programme for International Student Assessment (PISA). In this survey, a one-parameter
logistic model was used.
Background factors were analysed after conducting some initial exploratory bivariate
correlation analyses in SPSS, hierarchical linear modelling analysis (HLM; Raudenbush &
Bryk, 2002) was employed.
1.7 Understanding of Results
Throughout this report results are reported using ‘scale scores’ calculated using IRT. The
measurement scales are fixed so that results from all future surveys can be reported on the
same scale. The LASI Bangla, English and mathematics test were scored and reported in two
ways:
1.7.1 Scale Scores: Raw score is the number of correct responses that a student
achieved on a test. This score is not comparable and is not reliable for monitoring learning
progress over time or learning growth between grades. To enable comparisons, reliability
and for reporting the average performance of students, the test scores are transformed into
scale score so that students from different grades and all cycles of the learning assessment
can be placed on a single scale.
Scale score is the mathematical transformation of individuals’ raw scores in order to report each test taker’s score on a continuum consistently over the years and across different version of tests. The scale score provides a comparable metric, across all the tests within a subject. The IRT analyses allow for test difficulty and student ability to be reported independently on the same scale. In addition, a scale score of 100 will mean the same in 2013 as it did in 2011.
Exhibit 5 Scale score
The statistically obtained scale scores reported onto a measurement scale accounts for
differences in difficulty between tasks and between forms. The scale scores are anchored to
a mean score and a standard deviation. In LASI the scale score for 2013 have been anchored
to the 2012 mean scale score of 300 with a standard deviation of 25.
1.7.1 Competency (skill) bands: Band is the reference indicator of student’s
level of proficiency in subjects against the competencies assessed in the test. They help to
understand and compare present and future performances of the students. To interpret
achievement the subject expert team examined the content of the items and analysed them
to describe achievement for each subject to a scale according to what students know and
can do at different points on the scale. The descriptive scales were written to define the
skills that students acquired at Grades 6 and 8, measured by scale score. The competency
levels for LASI 2013 are described in Exhibit 5 and figure 1 as bands with cut off points. Band
1 is indicative of the lowest achievement level and band 5 indicates high achievement.

14
Based on the curriculum documents and the complexity of competency levels assessed by
the tests, five bands of achievement have been developed for each subject. Each band
provides a more generalised description of the skills associated with that part of the scale.
1.7.2 Statistical Significance
All measures have a degree of uncertainty associated with them. It is important to know the
degree of uncertainty about the measures when reporting performance of groups so that
only real differences in performance are reported. Difference between the scores of groups
of students can occur because of random fluctuation. A test of statistical significance at the
0.05 level has been applied to the NSA 2011 as well as 2013 data. All reported differences in
the performance of groups have been tested for significance and there is a 95 per cent
likelihood that the difference did not occur by chance.
1.7.3 Effect Size
Effect size or standardised mean difference is calculated to understand whether the
magnitudes of effects are substantively or practically important. This is a matter of
particular interest to policymakers and various other stakeholders. Effect size is the
proportion of the mean difference of the standard deviation. The magnitude of effect size
can be low, moderate or large between two groups under discussion.
An effect size of about 0.20 is considered “small”; about 0.50 is considered “medium”; and about 0.80 is considered “large.”
Exhibit 6 Effect size
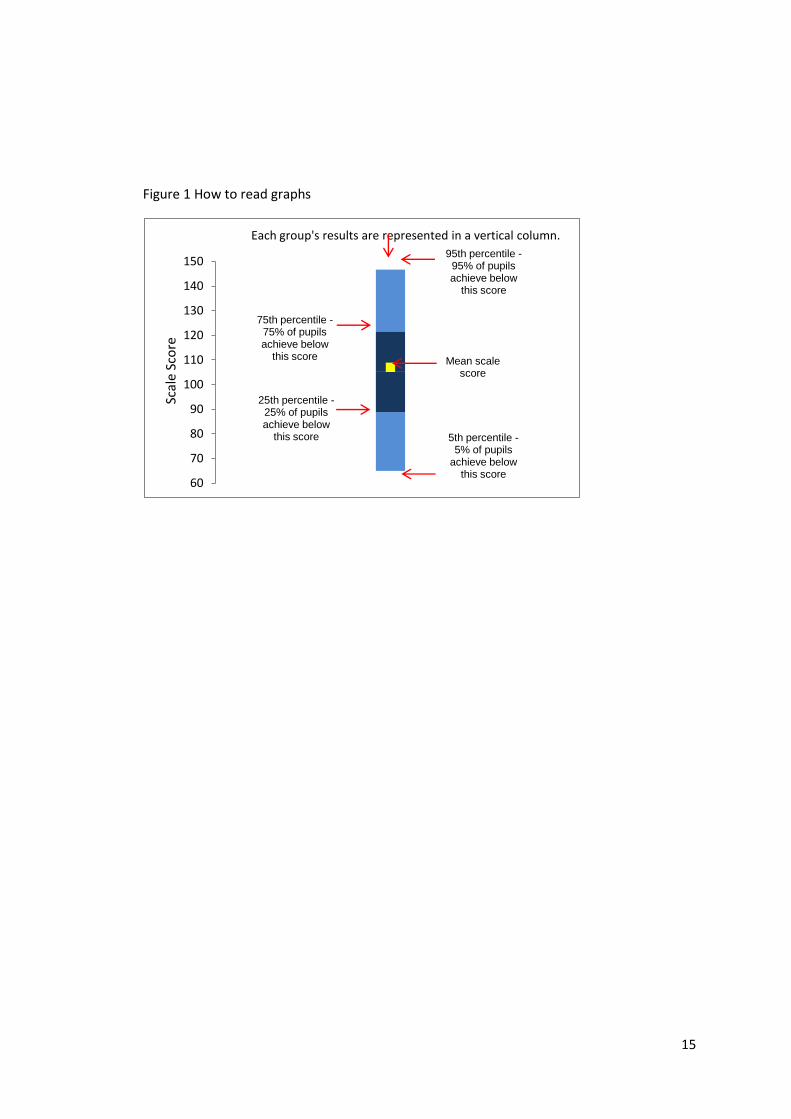
1.7.4 Percentiles
Percentile scores provide information about the relative performance of lower, middle and
higher performing students, results are displayed at five key percentiles (5th, 25th, 50th, 75th
and 95th). For example, the score at the 25th percentile is the score which 75 per cent of
students achieve or surpass, and the score at the 95th percentile is the score that 5 per cent
of students achieve or surpass. The range between the 25th and 75th percentiles (the inter-
quartile range) represents the performance of the middle 50 per cent of students. This,
therefore, is a good indicator of the degree of homogeneity within a student cohort.
A percentile is a measure used in statistics indicating the value below which a given percentage of
observations in a group of observations fall. For example, the 20th percentile is the value (or score)
below which 20 percent and above which 80 per cent of the observations may be found.
Exhibit 7 Percentile
15
Figure 1 How to read graphs
5th percentile - 5% of pupils
achieve below this score
25th percentile - 25% of pupils achieve below
this score
75th percentile - 75% of pupils achieve below
this score
95th percentile - 95% of pupils achieve below
this score
Mean scale score
60
70
80
90
100
110
120
130
140
150
Sca
le S
core
Each group's results are represented in a vertical column.
16
Chapter II Bangla Achievement
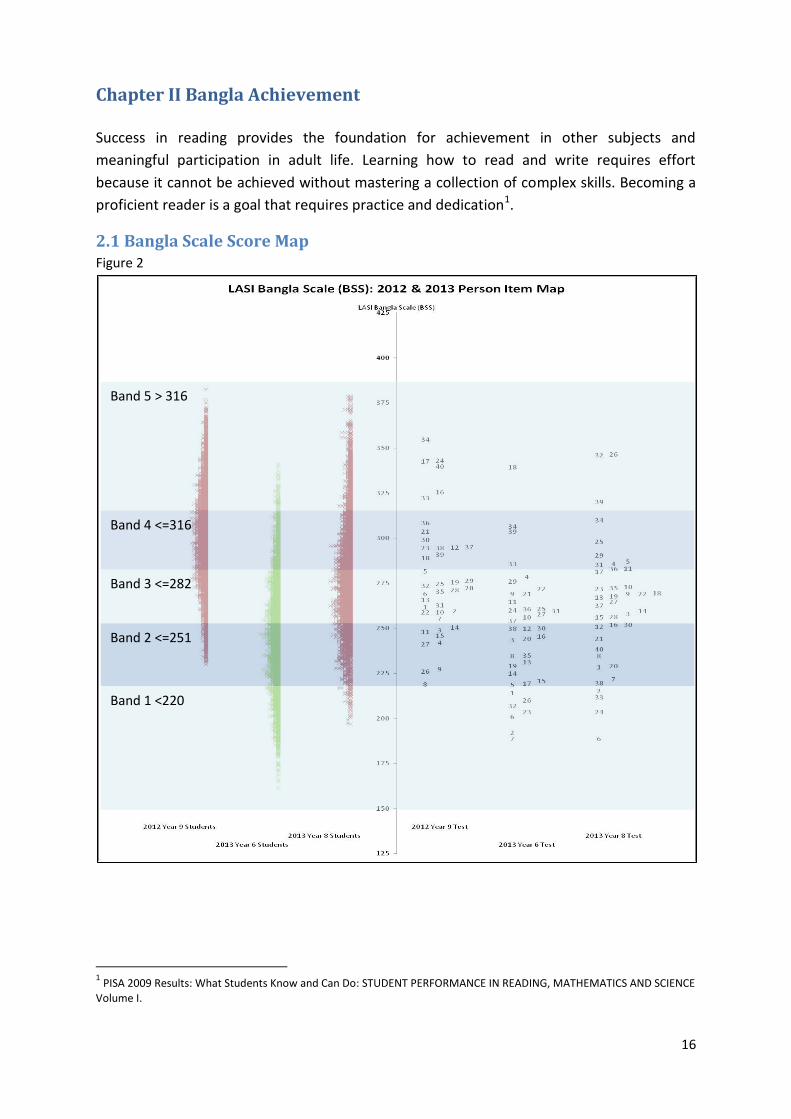
Success in reading provides the foundation for achievement in other subjects and
meaningful participation in adult life. Learning how to read and write requires effort
because it cannot be achieved without mastering a collection of complex skills. Becoming a
proficient reader is a goal that requires practice and dedication1.
2.1 Bangla Scale Score Map Figure 2
1 PISA 2009 Results: What Students Know and Can Do: STUDENT PERFORMANCE IN READING, MATHEMATICS AND SCIENCE
Volume I.
Band 1 <220
Band 2 <=251
Band 3 <=282
Band 4 <=316
Band 5 > 316
17
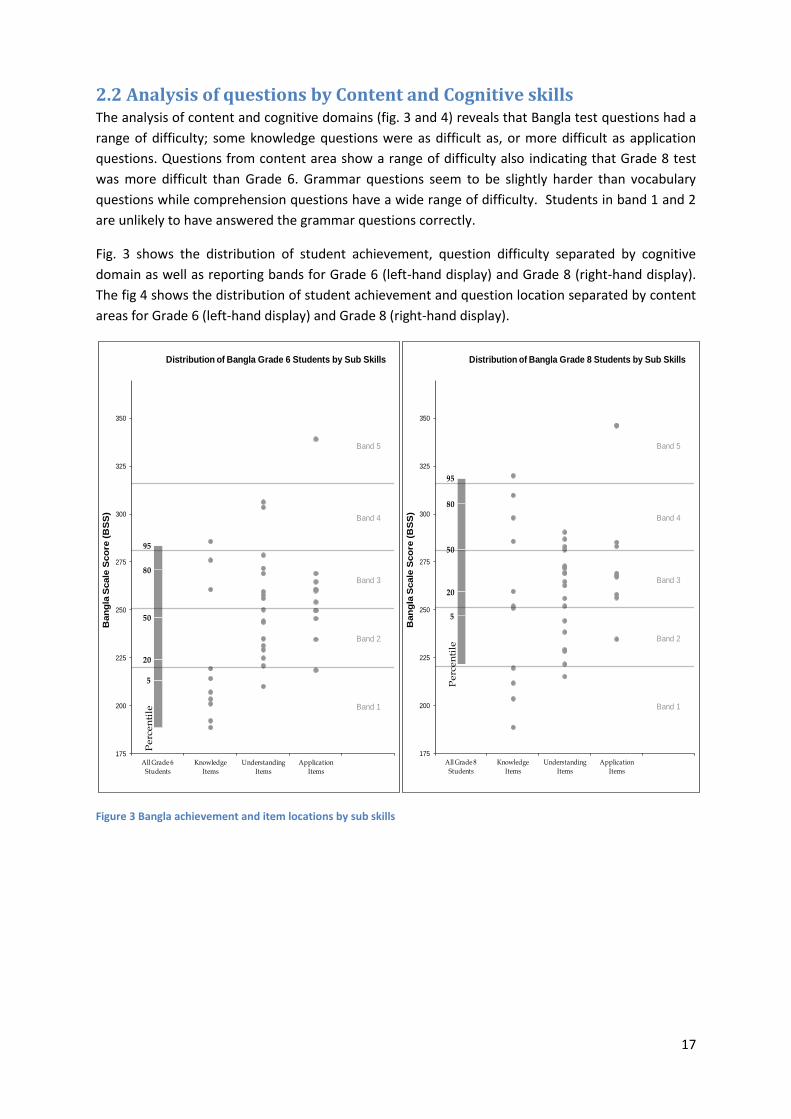
2.2 Analysis of questions by Content and Cognitive skills The analysis of content and cognitive domains (fig. 3 and 4) reveals that Bangla test questions had a
range of difficulty; some knowledge questions were as difficult as, or more difficult as application
questions. Questions from content area show a range of difficulty also indicating that Grade 8 test
was more difficult than Grade 6. Grammar questions seem to be slightly harder than vocabulary
questions while comprehension questions have a wide range of difficulty. Students in band 1 and 2
are unlikely to have answered the grammar questions correctly.
Fig. 3 shows the distribution of student achievement, question difficulty separated by cognitive
domain as well as reporting bands for Grade 6 (left-hand display) and Grade 8 (right-hand display).
The fig 4 shows the distribution of student achievement and question location separated by content
areas for Grade 6 (left-hand display) and Grade 8 (right-hand display).
Figure 3 Bangla achievement and item locations by sub skills
5
20
50
80
95
Pe
rce
nti
le Band 1
Band 2
Band 3
Band 4
Band 5
175
200
225
250
275
300
325
350
All Grade 6
Students
Knowledge
Items
Understanding
Items
Application
Items
Ban
gla
Scale
Sco
re (
BS
S)
Distribution of Bangla Grade 6 Students by Sub Skills
5
20
50
80
95
Perc
en
tile
Band 1
Band 2
Band 3
Band 4
Band 5
175
200
225
250
275
300
325
350
All Grade 8
Students
Knowledge
Items
Understanding
Items
Application
Items
Ban
gla
Scale
Sco
re (
BS
S)
Distribution of Bangla Grade 8 Students by Sub Skills
18
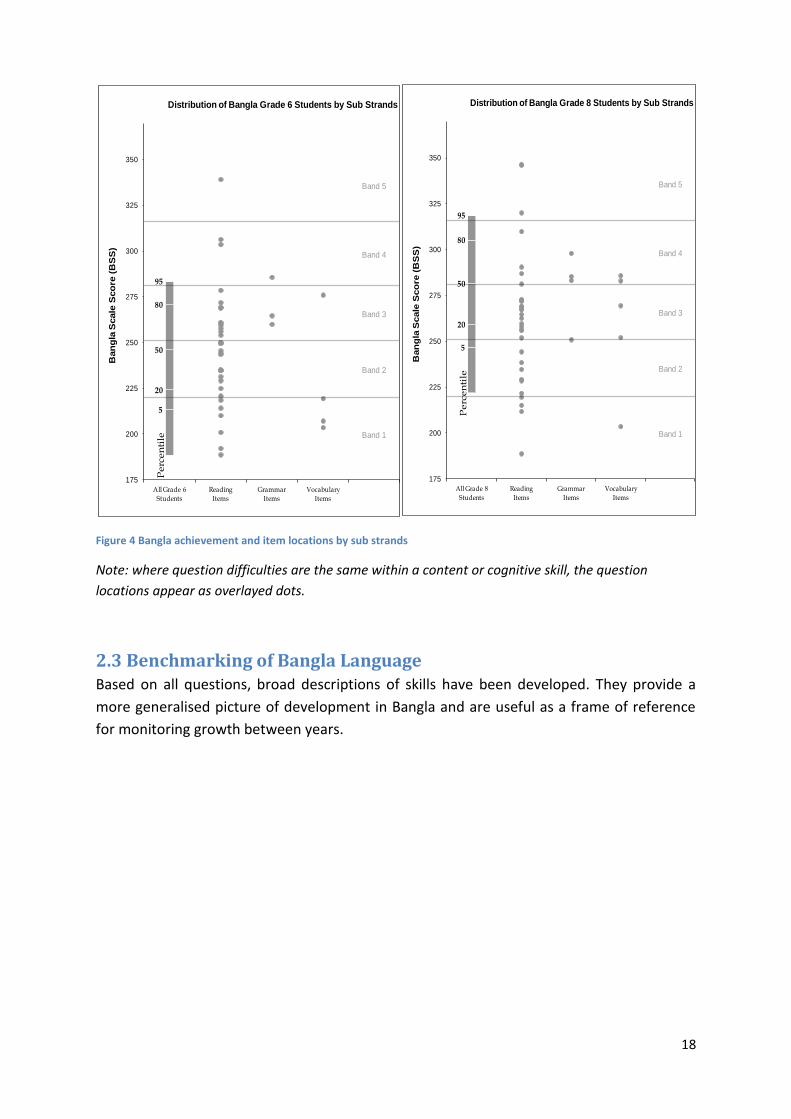
Figure 4 Bangla achievement and item locations by sub strands
Note: where question difficulties are the same within a content or cognitive skill, the question
locations appear as overlayed dots.
2.3 Benchmarking of Bangla Language Based on all questions, broad descriptions of skills have been developed. They provide a
more generalised picture of development in Bangla and are useful as a frame of reference
for monitoring growth between years.
5
20
50
80
95
Perc
en
tile Band 1
Band 2
Band 3
Band 4
Band 5
175
200
225
250
275
300
325
350
All Grade 6
Students
Reading
Items
Grammar
Items
Vocabulary
Items
Ban
gla
Scale
Sco
re (
BS
S)
Distribution of Bangla Grade 6 Students by Sub Strands
5
20
50
80
95
Perc
en
tile
Band 1
Band 2
Band 3
Band 4
Band 5
175
200
225
250
275
300
325
350
All Grade 8
Students
Reading
Items
Grammar
Items
Vocabulary
Items
Ban
gla
Scale
Sco
re (
BS
S)
Distribution of Bangla Grade 8 Students by Sub Strands
19
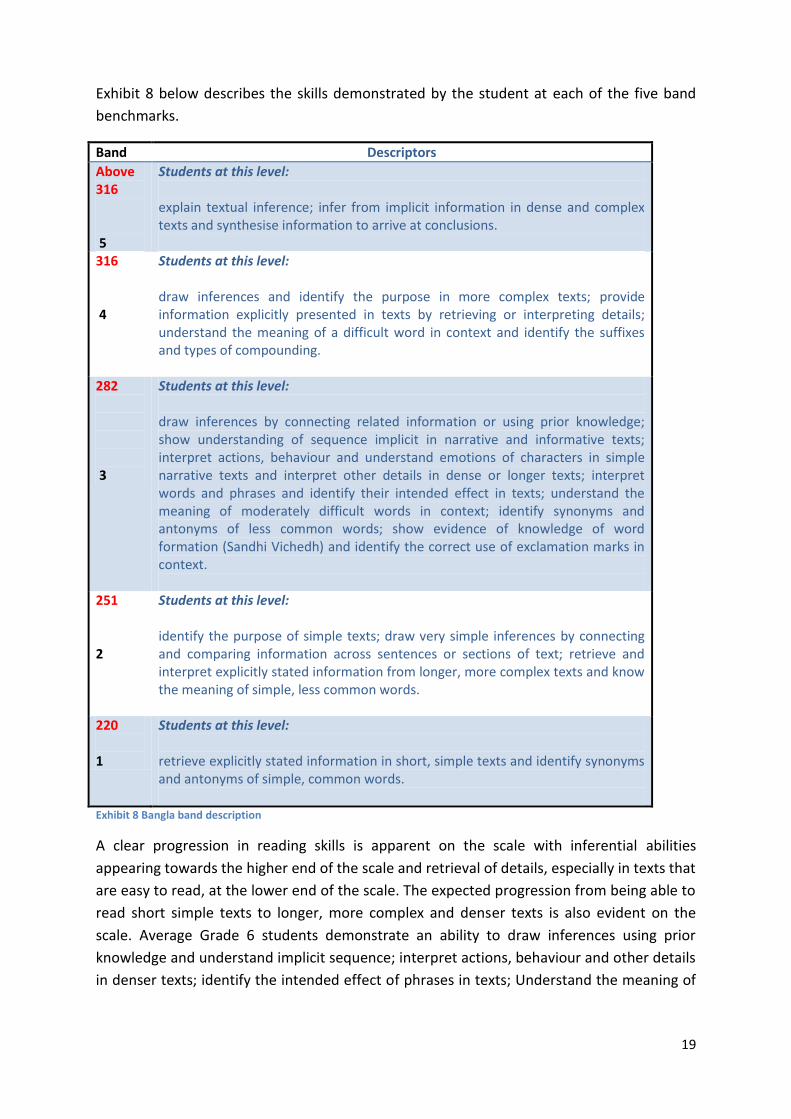
Exhibit 8 below describes the skills demonstrated by the student at each of the five band
benchmarks.
Band Descriptors
Above 316 5
Students at this level: explain textual inference; infer from implicit information in dense and complex texts and synthesise information to arrive at conclusions.
316 4
Students at this level: draw inferences and identify the purpose in more complex texts; provide information explicitly presented in texts by retrieving or interpreting details; understand the meaning of a difficult word in context and identify the suffixes and types of compounding.
282 3
Students at this level: draw inferences by connecting related information or using prior knowledge; show understanding of sequence implicit in narrative and informative texts; interpret actions, behaviour and understand emotions of characters in simple narrative texts and interpret other details in dense or longer texts; interpret words and phrases and identify their intended effect in texts; understand the meaning of moderately difficult words in context; identify synonyms and antonyms of less common words; show evidence of knowledge of word formation (Sandhi Vichedh) and identify the correct use of exclamation marks in context.
251 2
Students at this level: identify the purpose of simple texts; draw very simple inferences by connecting and comparing information across sentences or sections of text; retrieve and interpret explicitly stated information from longer, more complex texts and know the meaning of simple, less common words.
220 1
Students at this level: retrieve explicitly stated information in short, simple texts and identify synonyms and antonyms of simple, common words.
Exhibit 8 Bangla band description
A clear progression in reading skills is apparent on the scale with inferential abilities
appearing towards the higher end of the scale and retrieval of details, especially in texts that
are easy to read, at the lower end of the scale. The expected progression from being able to
read short simple texts to longer, more complex and denser texts is also evident on the
scale. Average Grade 6 students demonstrate an ability to draw inferences using prior
knowledge and understand implicit sequence; interpret actions, behaviour and other details
in denser texts; identify the intended effect of phrases in texts; Understand the meaning of
20
a moderately difficult words; Show evidence of knowledge of word formation (Sandhi
Vichedh); Show some knowledge of punctuation. Average Grade 8 students have skills to
draw inferences and identify the purpose in more complex texts; write out information
explicitly provided in texts by retrieving or interpreting details; interpret information,
character emotions in dense text; understand the meaning of difficult words in context and
show improved knowledge of word formation.
Constructed response items where students need to write a response rather than select the
answer from the options provided tend to be the more difficult items.
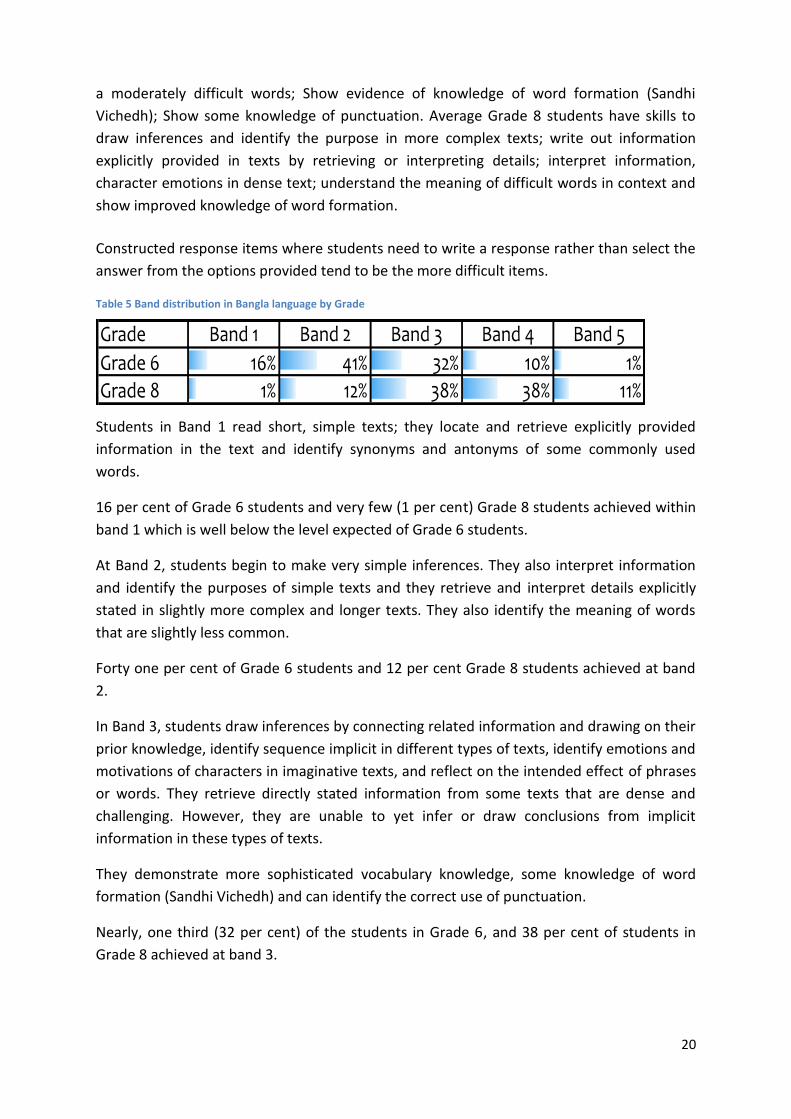
Table 5 Band distribution in Bangla language by Grade
Grade Band 1 Band 2 Band 3 Band 4 Band 5
Grade 6 16% 41% 32% 10% 1%Grade 8 1% 12% 38% 38% 11%
Students in Band 1 read short, simple texts; they locate and retrieve explicitly provided
information in the text and identify synonyms and antonyms of some commonly used
words.
16 per cent of Grade 6 students and very few (1 per cent) Grade 8 students achieved within
band 1 which is well below the level expected of Grade 6 students.
At Band 2, students begin to make very simple inferences. They also interpret information
and identify the purposes of simple texts and they retrieve and interpret details explicitly
stated in slightly more complex and longer texts. They also identify the meaning of words
that are slightly less common.
Forty one per cent of Grade 6 students and 12 per cent Grade 8 students achieved at band
2.
In Band 3, students draw inferences by connecting related information and drawing on their
prior knowledge, identify sequence implicit in different types of texts, identify emotions and
motivations of characters in imaginative texts, and reflect on the intended effect of phrases
or words. They retrieve directly stated information from some texts that are dense and
challenging. However, they are unable to yet infer or draw conclusions from implicit
information in these types of texts.
They demonstrate more sophisticated vocabulary knowledge, some knowledge of word
formation (Sandhi Vichedh) and can identify the correct use of punctuation.
Nearly, one third (32 per cent) of the students in Grade 6, and 38 per cent of students in
Grade 8 achieved at band 3.
21
At band 4, students read more complex texts and draw inferences from them. They identify
the purpose of such texts. It is at this level that students generate independent written
responses to questions that require location of directly stated information. They identify the
meaning of difficult words and identify suffixes and the type of compounding.
Ten per cent of Grade 6 students and over a third (38 per cent) of Grade 8 students
achieved at band 4.
Students in band 5 read challenging and dense texts and infer or synthesise information to
draw conclusions. They can write their conclusions in response to texts without the support
of multiple choice options.
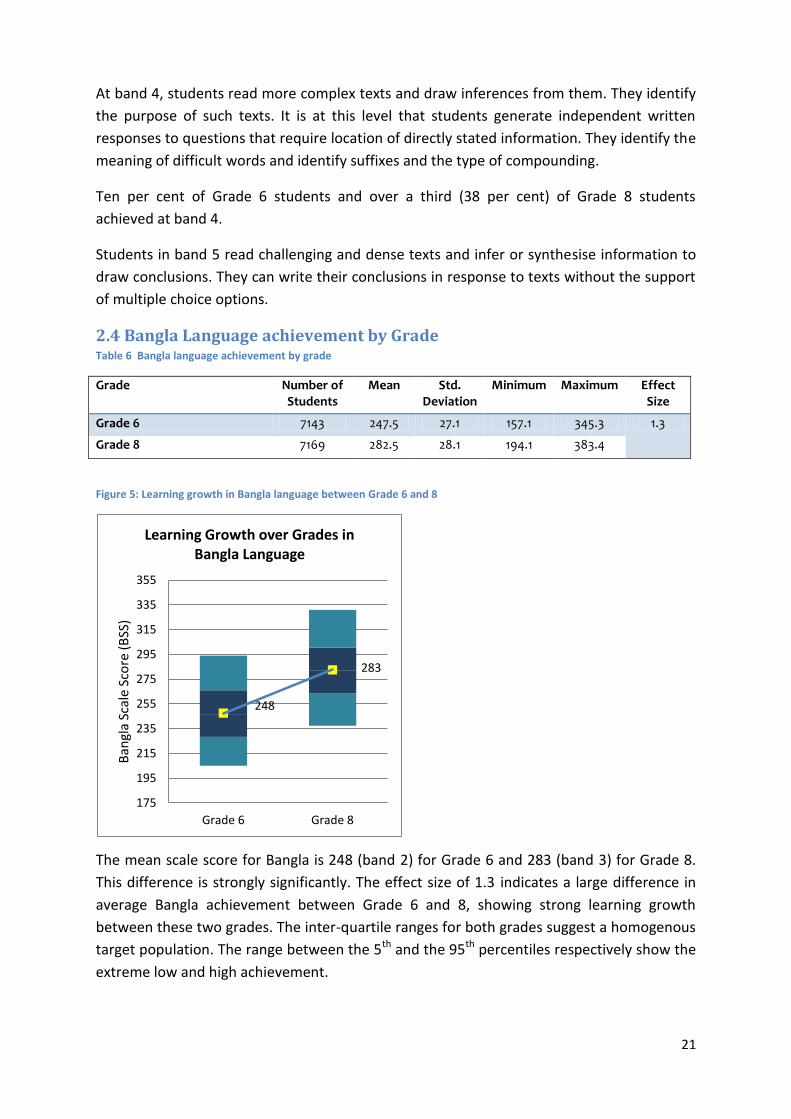
2.4 Bangla Language achievement by Grade Table 6 Bangla language achievement by grade
Grade Number of Students
Mean Std. Deviation
Minimum Maximum Effect Size
Grade 6 7143 247.5 27.1 157.1 345.3 1.3
Grade 8 7169 282.5 28.1 194.1 383.4
Figure 5: Learning growth in Bangla language between Grade 6 and 8
The mean scale score for Bangla is 248 (band 2) for Grade 6 and 283 (band 3) for Grade 8.
This difference is strongly significantly. The effect size of 1.3 indicates a large difference in
average Bangla achievement between Grade 6 and 8, showing strong learning growth
between these two grades. The inter-quartile ranges for both grades suggest a homogenous
target population. The range between the 5th and the 95th percentiles respectively show the
extreme low and high achievement.
248
283
175
195
215
235
255
275
295
315
335
355
Grade 6 Grade 8
Ban
gla
Scal
e Sc
ore
(B
SS)
Learning Growth over Grades in Bangla Language
22
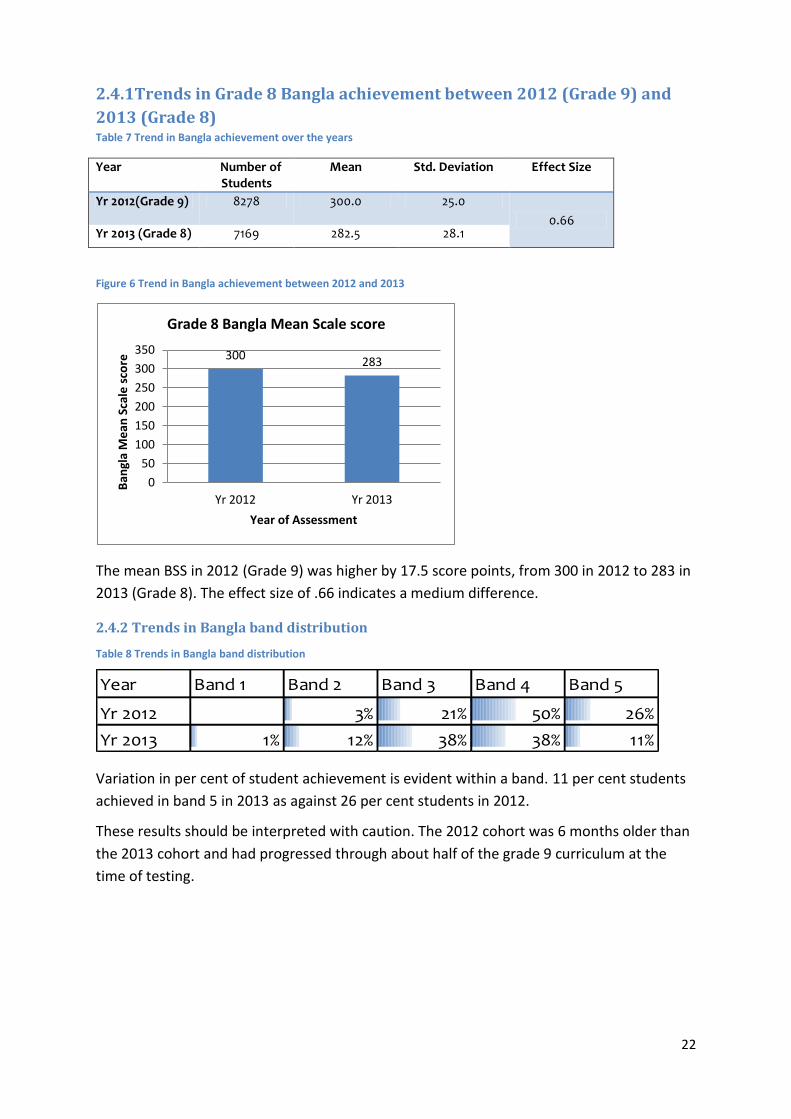
2.4.1Trends in Grade 8 Bangla achievement between 2012 (Grade 9) and
2013 (Grade 8) Table 7 Trend in Bangla achievement over the years
Year Number of Students
Mean Std. Deviation Effect Size
Yr 2012(Grade 9) 8278 300.0 25.0
0.66 Yr 2013 (Grade 8) 7169 282.5 28.1
Figure 6 Trend in Bangla achievement between 2012 and 2013
The mean BSS in 2012 (Grade 9) was higher by 17.5 score points, from 300 in 2012 to 283 in
2013 (Grade 8). The effect size of .66 indicates a medium difference.
2.4.2 Trends in Bangla band distribution
Table 8 Trends in Bangla band distribution
Year Band 1 Band 2 Band 3 Band 4 Band 5
Yr 2012 3% 21% 50% 26%
Yr 2013 1% 12% 38% 38% 11%
Variation in per cent of student achievement is evident within a band. 11 per cent students
achieved in band 5 in 2013 as against 26 per cent students in 2012.
These results should be interpreted with caution. The 2012 cohort was 6 months older than
the 2013 cohort and had progressed through about half of the grade 9 curriculum at the
time of testing.
300 283
0
50
100
150
200
250
300
350
Yr 2012 Yr 2013
Ban
gla
Me
an S
cale
sco
re
Year of Assessment
Grade 8 Bangla Mean Scale score
23
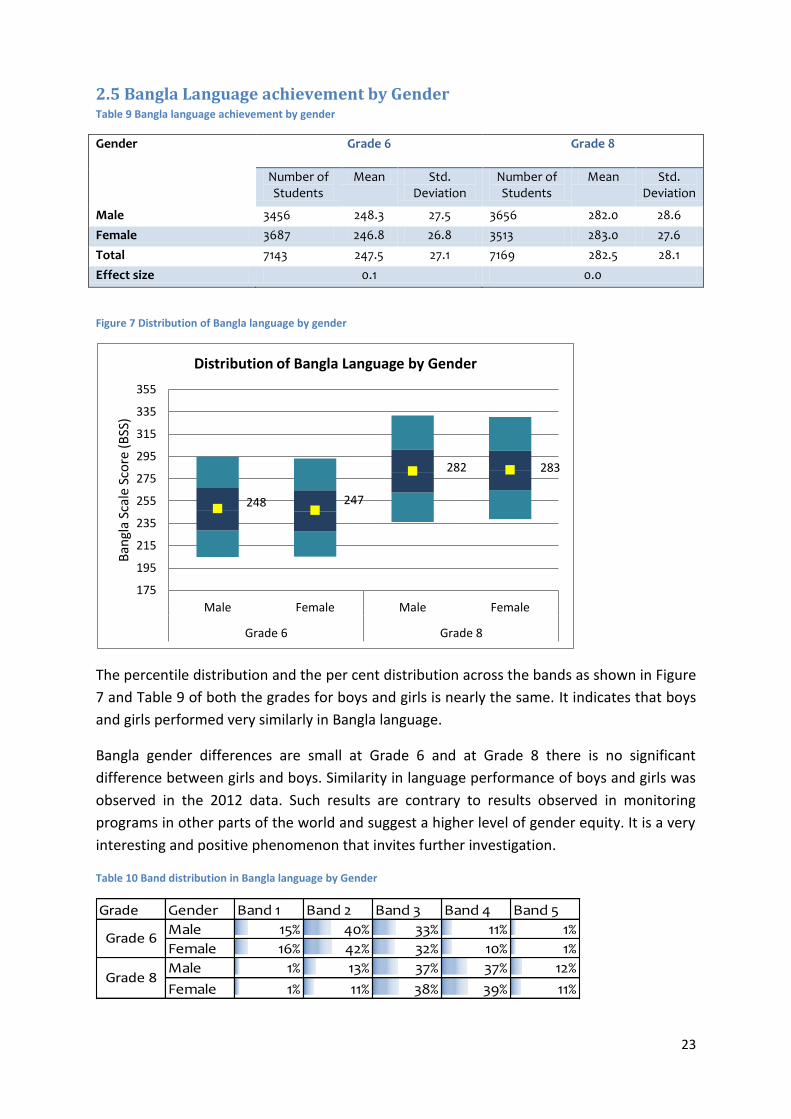
2.5 Bangla Language achievement by Gender Table 9 Bangla language achievement by gender
Gender Grade 6 Grade 8
Number of Students
Mean Std. Deviation
Number of Students
Mean Std. Deviation
Male 3456 248.3 27.5 3656 282.0 28.6
Female 3687 246.8 26.8 3513 283.0 27.6
Total 7143 247.5 27.1 7169 282.5 28.1
Effect size 0.1 0.0
Figure 7 Distribution of Bangla language by gender
The percentile distribution and the per cent distribution across the bands as shown in Figure
7 and Table 9 of both the grades for boys and girls is nearly the same. It indicates that boys
and girls performed very similarly in Bangla language.
Bangla gender differences are small at Grade 6 and at Grade 8 there is no significant
difference between girls and boys. Similarity in language performance of boys and girls was
observed in the 2012 data. Such results are contrary to results observed in monitoring
programs in other parts of the world and suggest a higher level of gender equity. It is a very
interesting and positive phenomenon that invites further investigation.
Table 10 Band distribution in Bangla language by Gender
Grade Gender Band 1 Band 2 Band 3 Band 4 Band 5
Male 15% 40% 33% 11% 1%
Female 16% 42% 32% 10% 1%
Male 1% 13% 37% 37% 12%
Female 1% 11% 38% 39% 11%
Grade 6
Grade 8
248 247
282 283
175
195
215
235
255
275
295
315
335
355
Male Female Male Female
Grade 6 Grade 8
Ban
gla
Scal
e Sc
ore
(B
SS)
Distribution of Bangla Language by Gender
24
2.5.1 Trends in Bangla Achievement between years by Gender Table 11 Change in Grade 8 Bangla achievement between 2012 and 2013 by Gender
Gender Year 2012 (Grade 9) Year 2013 (Grade 8) Effect Size Number of
Students Mean Std.
Deviation Number of Students
Mean Std. Deviation
Male 4154 299.9 24.6 3656 282.0 28.6 0.67
Female 4124 300.1 25.4 3513 283.0 27.6 0.65
Total 8278 300.0 25.0 7169 282.5 28.1 0.66
Table 10 displays the achievement of boys and girls between 2012 and 2013 cycles. For both
boys and girls the achievement dropped by 17 score points. The effect size of .65 and .67 is
considered a medium difference.
2.5.2 Change in Grade 8 Bangla Band Distribution between 2012 and 2013 by Gender Table 12 Trend in Bangla band distribution over the years
Year Gender Band 1 Band 2 Band 3 Band 4 Band 5
Yr 2012 Male 2% 22% 50% 26%
Yr 2013 Male 1% 13% 37% 37% 12%
Yr 2012 Female 3% 21% 50% 27%
Yr 2013 Female 1% 11% 38% 39% 11%
The per cent distribution of boys and girls across the bands generally remains similar. During
2012, nearly a quarter of boys and girls achieved Band 5 however, in 2013 only 11 per cent
boys and 12 per cent girls achieved Band 5.
2.6 Bangla Language achievement by Examination Board Table 13 Bangla Language achievement by Examination Board
Examination Board Grade 6 Grade 8
Number of Students
Mean Std. Deviation
Number of
Students
Mean Std. Deviation
Barisal 775 255.8 27.0 767 291.7 27.1
Chittagong 443 240.2 25.4 427 277.9 26.0
Comilla 390 247.1 28.5 417 278.7 30.0
Dhaka 1978 250.0 26.6 2073 285.2 28.9
Jessore 1244 248.1 26.1 1197 282.5 25.9
Rajshahi 957 246.5 27.4 925 284.1 28.1
Rangpur 1004 244.4 27.1 989 278.0 28.0
Sylhet 352 234.6 25.8 374 266.0 22.9
Total 7143 247.5 27.1 7169 282.5 28.1
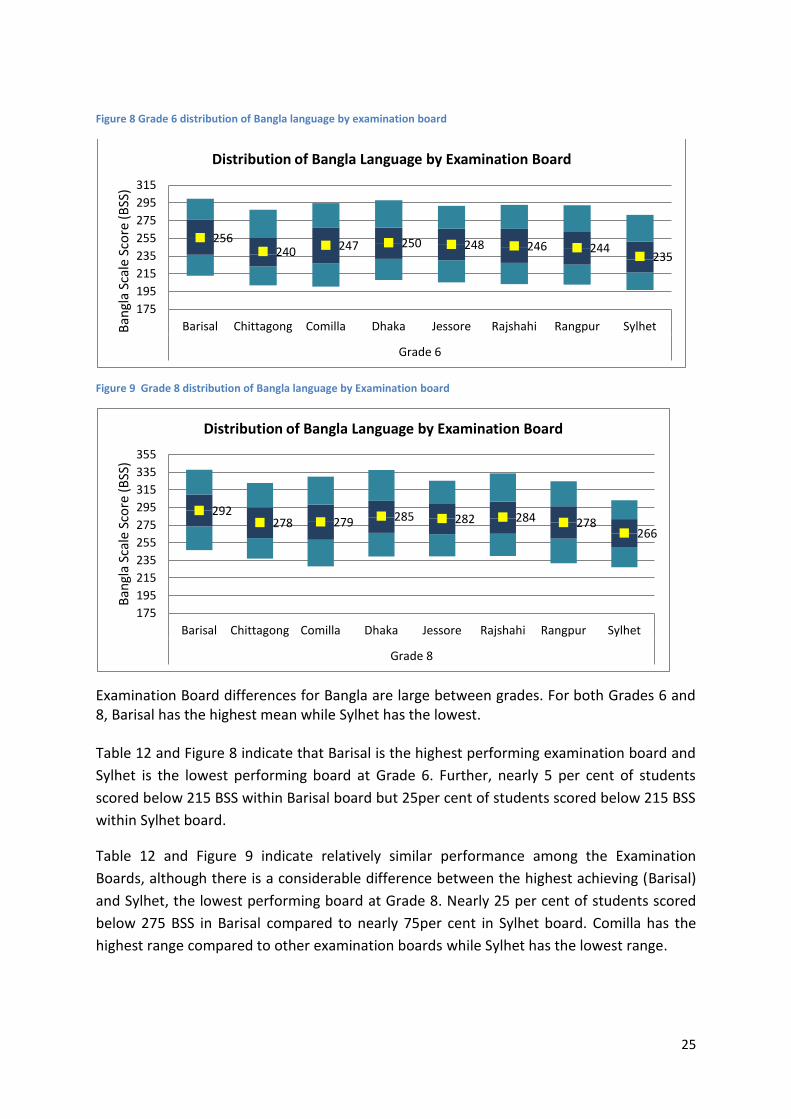
25
Figure 8 Grade 6 distribution of Bangla language by examination board
Figure 9 Grade 8 distribution of Bangla language by Examination board
Examination Board differences for Bangla are large between grades. For both Grades 6 and 8, Barisal has the highest mean while Sylhet has the lowest.
Table 12 and Figure 8 indicate that Barisal is the highest performing examination board and
Sylhet is the lowest performing board at Grade 6. Further, nearly 5 per cent of students
scored below 215 BSS within Barisal board but 25per cent of students scored below 215 BSS
within Sylhet board.
Table 12 and Figure 9 indicate relatively similar performance among the Examination
Boards, although there is a considerable difference between the highest achieving (Barisal)
and Sylhet, the lowest performing board at Grade 8. Nearly 25 per cent of students scored
below 275 BSS in Barisal compared to nearly 75per cent in Sylhet board. Comilla has the
highest range compared to other examination boards while Sylhet has the lowest range.
256 240 247 250 248 246 244
235
175
195
215
235
255
275
295
315
Barisal Chittagong Comilla Dhaka Jessore Rajshahi Rangpur Sylhet
Grade 6
Ban
gla
Scal
e Sc
ore
(B
SS)
Distribution of Bangla Language by Examination Board
292 278 279 285 282 284 278
266
175
195
215
235
255
275
295
315
335
355
Barisal Chittagong Comilla Dhaka Jessore Rajshahi Rangpur Sylhet
Grade 8
Ban
gla
Scal
e Sc
ore
(B
SS)
Distribution of Bangla Language by Examination Board
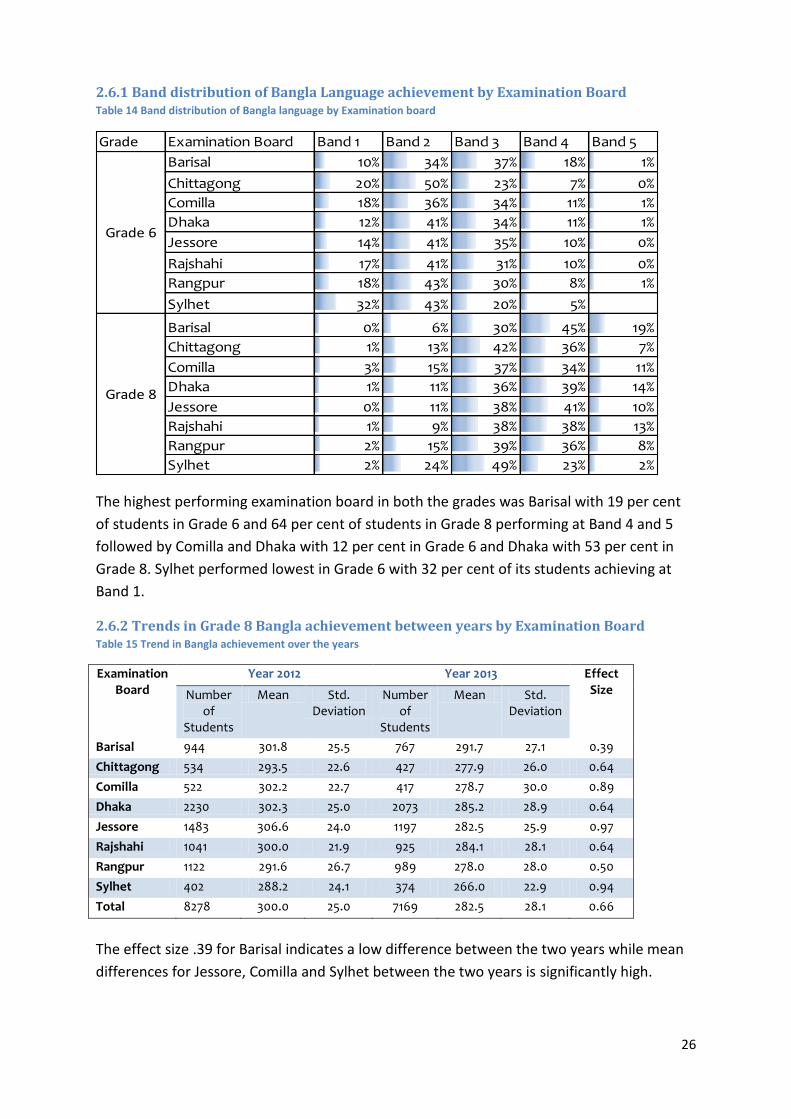
26
2.6.1 Band distribution of Bangla Language achievement by Examination Board Table 14 Band distribution of Bangla language by Examination board
Grade Examination Board Band 1 Band 2 Band 3 Band 4 Band 5
Barisal 10% 34% 37% 18% 1%
Chittagong 20% 50% 23% 7% 0%
Comilla 18% 36% 34% 11% 1%
Dhaka 12% 41% 34% 11% 1%
Jessore 14% 41% 35% 10% 0%
Rajshahi 17% 41% 31% 10% 0%
Rangpur 18% 43% 30% 8% 1%
Sylhet 32% 43% 20% 5%
Barisal 0% 6% 30% 45% 19%
Chittagong 1% 13% 42% 36% 7%
Comilla 3% 15% 37% 34% 11%
Dhaka 1% 11% 36% 39% 14%
Jessore 0% 11% 38% 41% 10%
Rajshahi 1% 9% 38% 38% 13%
Rangpur 2% 15% 39% 36% 8%
Sylhet 2% 24% 49% 23% 2%
Grade 6
Grade 8
The highest performing examination board in both the grades was Barisal with 19 per cent
of students in Grade 6 and 64 per cent of students in Grade 8 performing at Band 4 and 5
followed by Comilla and Dhaka with 12 per cent in Grade 6 and Dhaka with 53 per cent in
Grade 8. Sylhet performed lowest in Grade 6 with 32 per cent of its students achieving at
Band 1.
2.6.2 Trends in Grade 8 Bangla achievement between years by Examination Board Table 15 Trend in Bangla achievement over the years
Examination Board
Year 2012 Year 2013 Effect Size Number
of Students
Mean Std. Deviation
Number of
Students
Mean Std. Deviation
Barisal 944 301.8 25.5 767 291.7 27.1 0.39
Chittagong 534 293.5 22.6 427 277.9 26.0 0.64
Comilla 522 302.2 22.7 417 278.7 30.0 0.89
Dhaka 2230 302.3 25.0 2073 285.2 28.9 0.64
Jessore 1483 306.6 24.0 1197 282.5 25.9 0.97
Rajshahi 1041 300.0 21.9 925 284.1 28.1 0.64
Rangpur 1122 291.6 26.7 989 278.0 28.0 0.50
Sylhet 402 288.2 24.1 374 266.0 22.9 0.94
Total 8278 300.0 25.0 7169 282.5 28.1 0.66
The effect size .39 for Barisal indicates a low difference between the two years while mean
differences for Jessore, Comilla and Sylhet between the two years is significantly high.
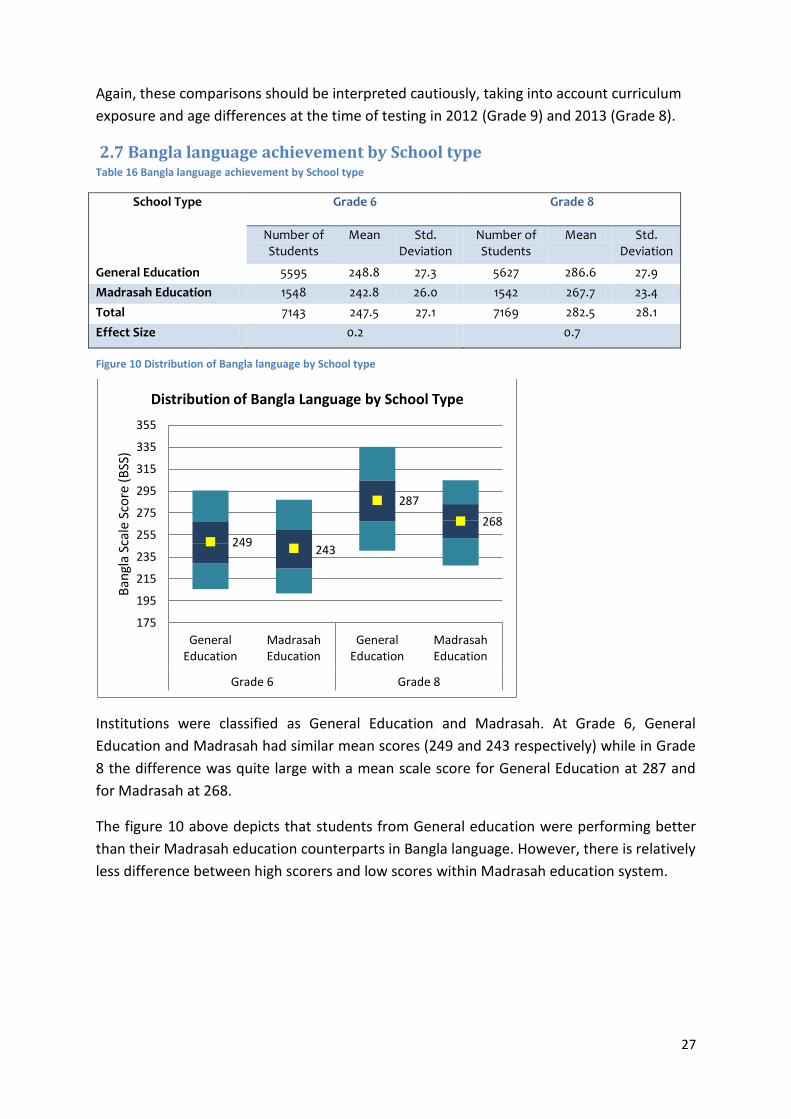
27
Again, these comparisons should be interpreted cautiously, taking into account curriculum
exposure and age differences at the time of testing in 2012 (Grade 9) and 2013 (Grade 8).
2.7 Bangla language achievement by School type Table 16 Bangla language achievement by School type
School Type Grade 6 Grade 8
Number of Students
Mean Std. Deviation
Number of Students
Mean Std. Deviation
General Education 5595 248.8 27.3 5627 286.6 27.9
Madrasah Education 1548 242.8 26.0 1542 267.7 23.4
Total 7143 247.5 27.1 7169 282.5 28.1
Effect Size 0.2 0.7
Figure 10 Distribution of Bangla language by School type
Institutions were classified as General Education and Madrasah. At Grade 6, General
Education and Madrasah had similar mean scores (249 and 243 respectively) while in Grade
8 the difference was quite large with a mean scale score for General Education at 287 and
for Madrasah at 268.
The figure 10 above depicts that students from General education were performing better
than their Madrasah education counterparts in Bangla language. However, there is relatively
less difference between high scorers and low scores within Madrasah education system.
249 243
287
268
175
195
215
235
255
275
295
315
335
355
General Education
Madrasah Education
General Education
Madrasah Education
Grade 6 Grade 8
Ban
gla
Scal
e Sc
ore
(B
SS)
Distribution of Bangla Language by School Type
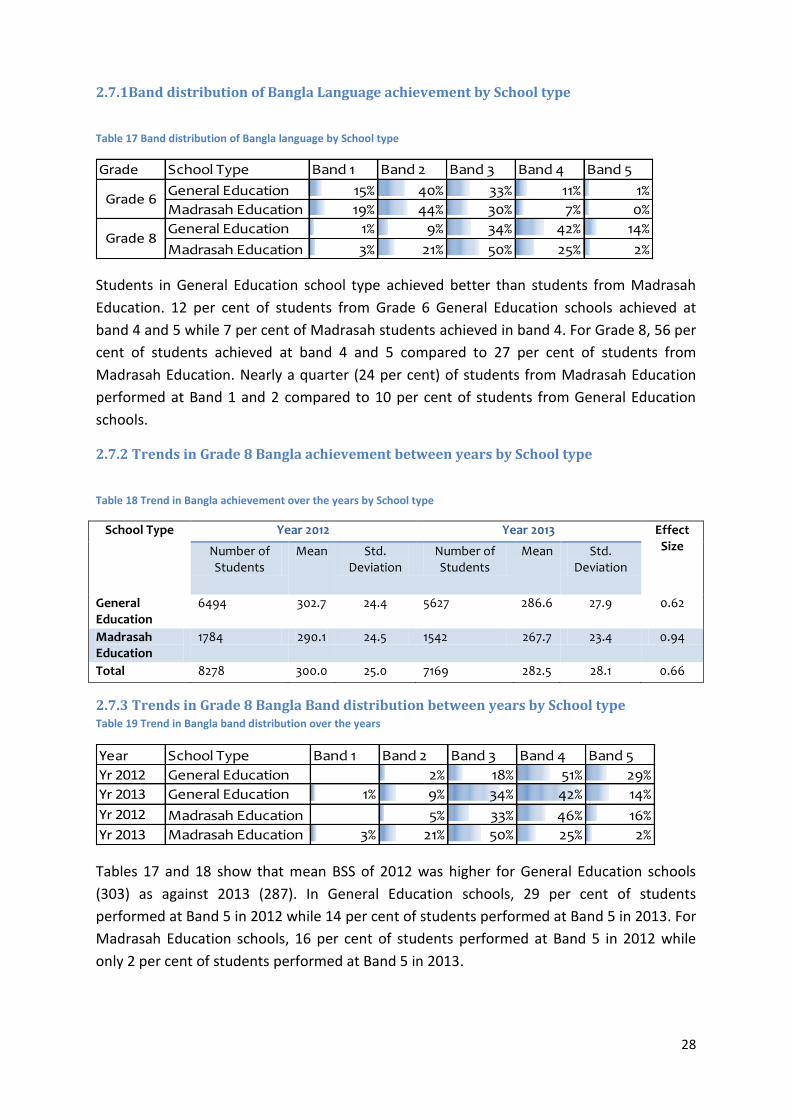
28
2.7.1Band distribution of Bangla Language achievement by School type
Table 17 Band distribution of Bangla language by School type
Grade School Type Band 1 Band 2 Band 3 Band 4 Band 5
General Education 15% 40% 33% 11% 1%
Madrasah Education 19% 44% 30% 7% 0%
General Education 1% 9% 34% 42% 14%
Madrasah Education 3% 21% 50% 25% 2%
Grade 6
Grade 8
Students in General Education school type achieved better than students from Madrasah
Education. 12 per cent of students from Grade 6 General Education schools achieved at
band 4 and 5 while 7 per cent of Madrasah students achieved in band 4. For Grade 8, 56 per
cent of students achieved at band 4 and 5 compared to 27 per cent of students from
Madrasah Education. Nearly a quarter (24 per cent) of students from Madrasah Education
performed at Band 1 and 2 compared to 10 per cent of students from General Education
schools.
2.7.2 Trends in Grade 8 Bangla achievement between years by School type
Table 18 Trend in Bangla achievement over the years by School type
School Type Year 2012 Year 2013 Effect Size Number of
Students Mean Std.
Deviation Number of Students
Mean Std. Deviation
General Education
6494 302.7 24.4 5627 286.6 27.9 0.62
Madrasah Education
1784 290.1 24.5 1542 267.7 23.4 0.94
Total 8278 300.0 25.0 7169 282.5 28.1 0.66
2.7.3 Trends in Grade 8 Bangla Band distribution between years by School type Table 19 Trend in Bangla band distribution over the years
Year School Type Band 1 Band 2 Band 3 Band 4 Band 5
Yr 2012 General Education 2% 18% 51% 29%
Yr 2013 General Education 1% 9% 34% 42% 14%
Yr 2012 Madrasah Education 5% 33% 46% 16%
Yr 2013 Madrasah Education 3% 21% 50% 25% 2%
Tables 17 and 18 show that mean BSS of 2012 was higher for General Education schools
(303) as against 2013 (287). In General Education schools, 29 per cent of students
performed at Band 5 in 2012 while 14 per cent of students performed at Band 5 in 2013. For
Madrasah Education schools, 16 per cent of students performed at Band 5 in 2012 while
only 2 per cent of students performed at Band 5 in 2013.
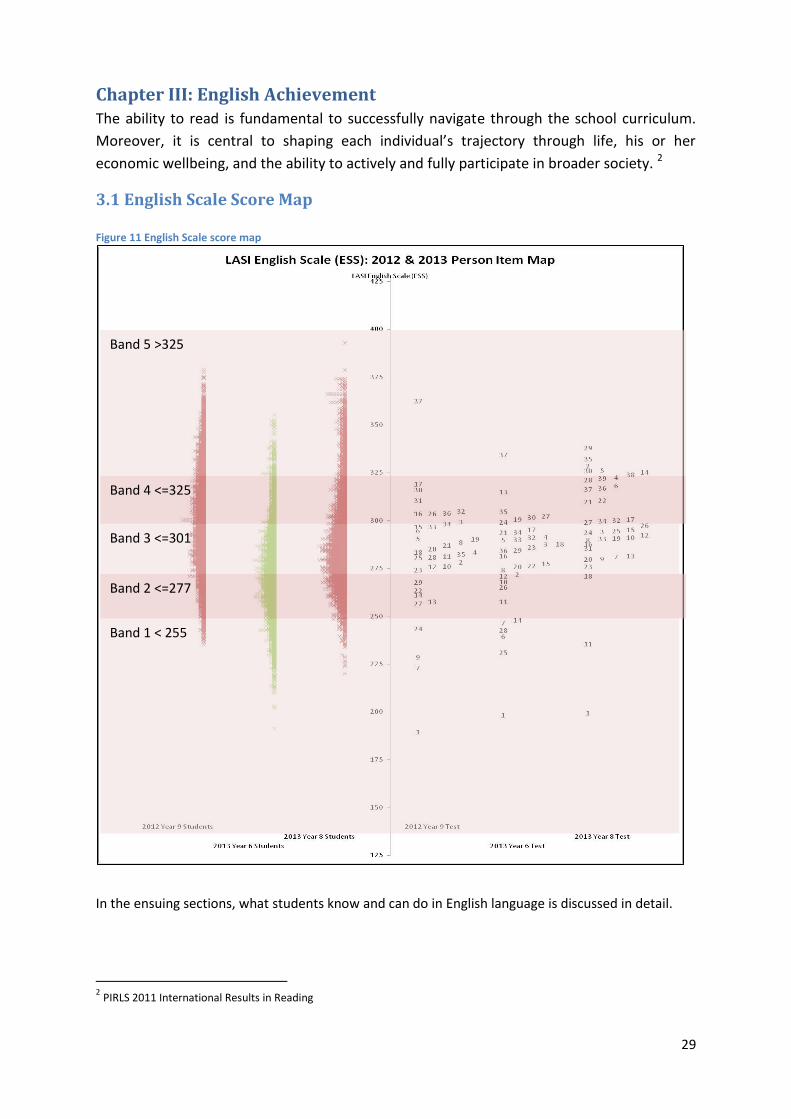
29
Chapter III: English Achievement The ability to read is fundamental to successfully navigate through the school curriculum.
Moreover, it is central to shaping each individual’s trajectory through life, his or her
economic wellbeing, and the ability to actively and fully participate in broader society. 2
3.1 English Scale Score Map Figure 11 English Scale score map
In the ensuing sections, what students know and can do in English language is discussed in detail.
2 PIRLS 2011 International Results in Reading
Band 1 < 255
Band 2 <=277
Band 3 <=301
Band 4 <=325
Band 5 >325
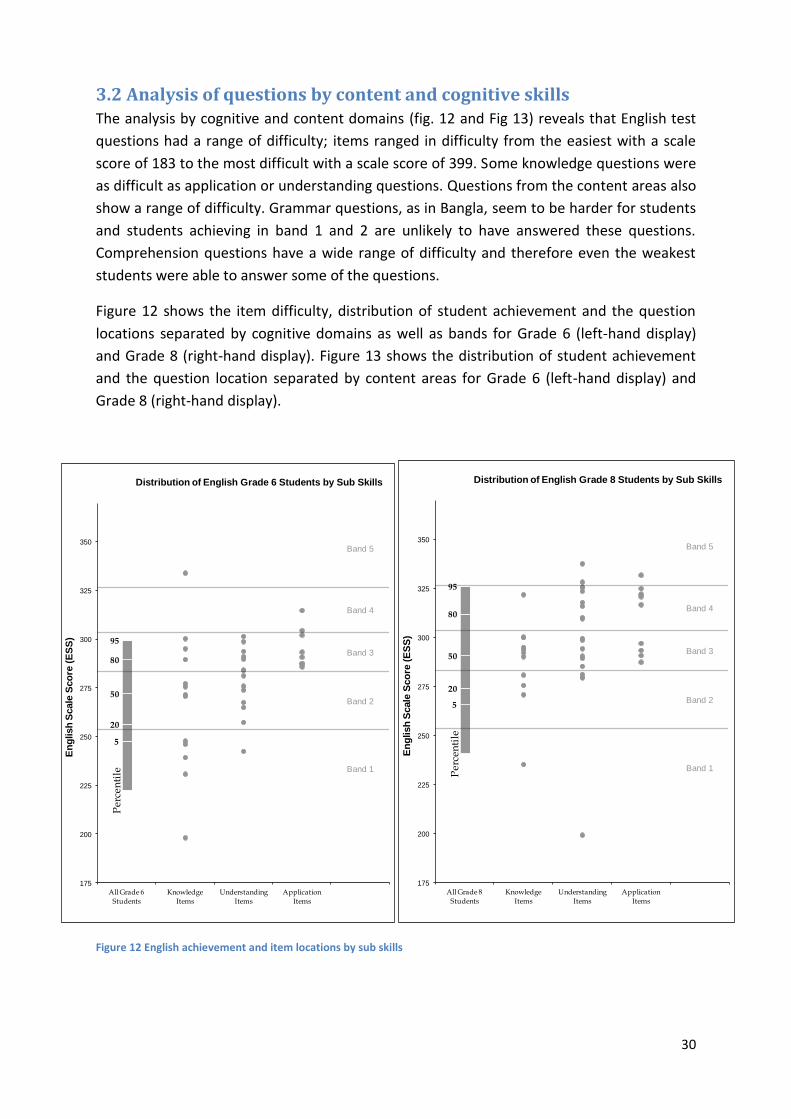
30
3.2 Analysis of questions by content and cognitive skills The analysis by cognitive and content domains (fig. 12 and Fig 13) reveals that English test
questions had a range of difficulty; items ranged in difficulty from the easiest with a scale
score of 183 to the most difficult with a scale score of 399. Some knowledge questions were
as difficult as application or understanding questions. Questions from the content areas also
show a range of difficulty. Grammar questions, as in Bangla, seem to be harder for students
and students achieving in band 1 and 2 are unlikely to have answered these questions.
Comprehension questions have a wide range of difficulty and therefore even the weakest
students were able to answer some of the questions.
Figure 12 shows the item difficulty, distribution of student achievement and the question
locations separated by cognitive domains as well as bands for Grade 6 (left-hand display)
and Grade 8 (right-hand display). Figure 13 shows the distribution of student achievement
and the question location separated by content areas for Grade 6 (left-hand display) and
Grade 8 (right-hand display).
Figure 12 English achievement and item locations by sub skills
5
20
50
80
95
Per
cen
tile Band 1
Band 2
Band 3
Band 4
Band 5
175
200
225
250
275
300
325
350
All Grade 6
Students
Knowledge
Items
Understanding
Items
Application
Items
En
glish
Scale
Sco
re (
ES
S)
Distribution of English Grade 6 Students by Sub Skills
5
20
50
80
95
Per
cen
tile
Band 1
Band 2
Band 3
Band 4
Band 5
175
200
225
250
275
300
325
350
All Grade 8
Students
Knowledge
Items
Understanding
Items
Application
Items
En
glish
Scale
Sco
re (
ES
S)
Distribution of English Grade 8 Students by Sub Skills
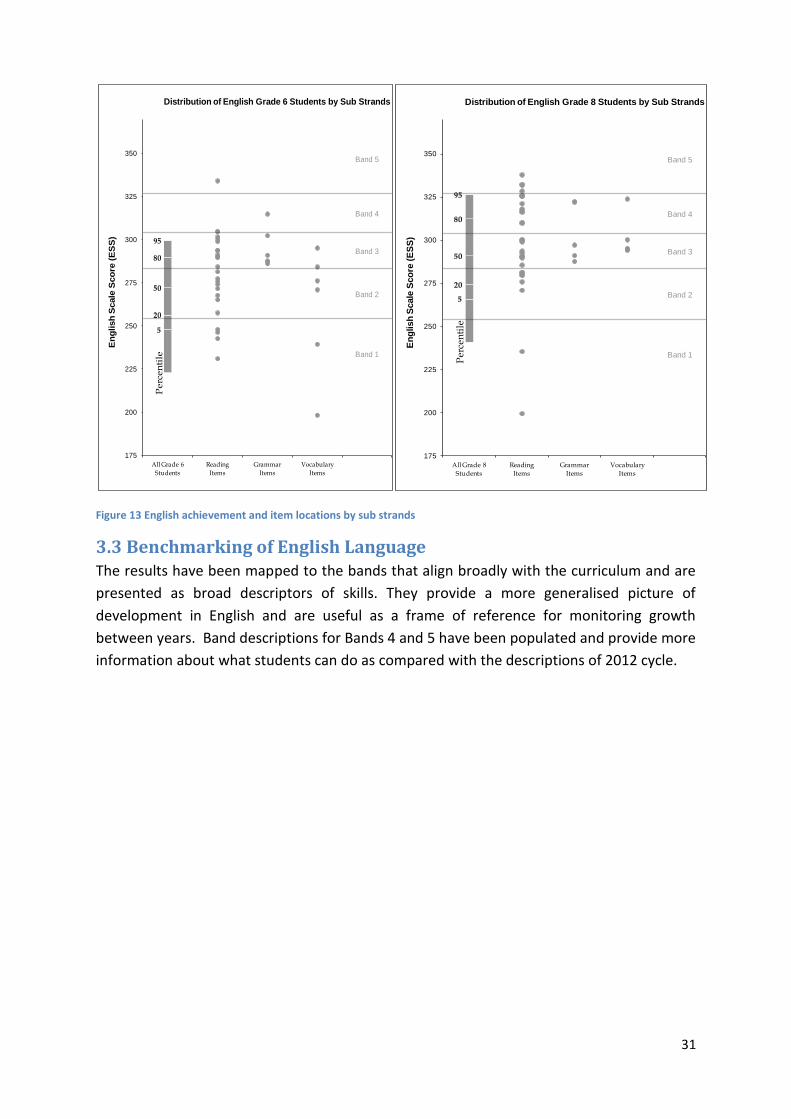
31
Figure 13 English achievement and item locations by sub strands
3.3 Benchmarking of English Language The results have been mapped to the bands that align broadly with the curriculum and are
presented as broad descriptors of skills. They provide a more generalised picture of
development in English and are useful as a frame of reference for monitoring growth
between years. Band descriptions for Bands 4 and 5 have been populated and provide more
information about what students can do as compared with the descriptions of 2012 cycle.
5
20
50
80
95
Perc
en
tile Band 1
Band 2
Band 3
Band 4
Band 5
175
200
225
250
275
300
325
350
All Grade 6
Students
Reading
Items
Grammar
Items
Vocabulary
Items
En
glish
Scale
Sco
re (
ES
S)
Distribution of English Grade 6 Students by Sub Strands
5
20
50
80
95
Per
cen
tile
Band 1
Band 2
Band 3
Band 4
Band 5
175
200
225
250
275
300
325
350
All Grade 8
Students
Reading
Items
Grammar
Items
Vocabulary
Items
En
glish
Scale
Sco
re (
ES
S)
Distribution of English Grade 8 Students by Sub Strands
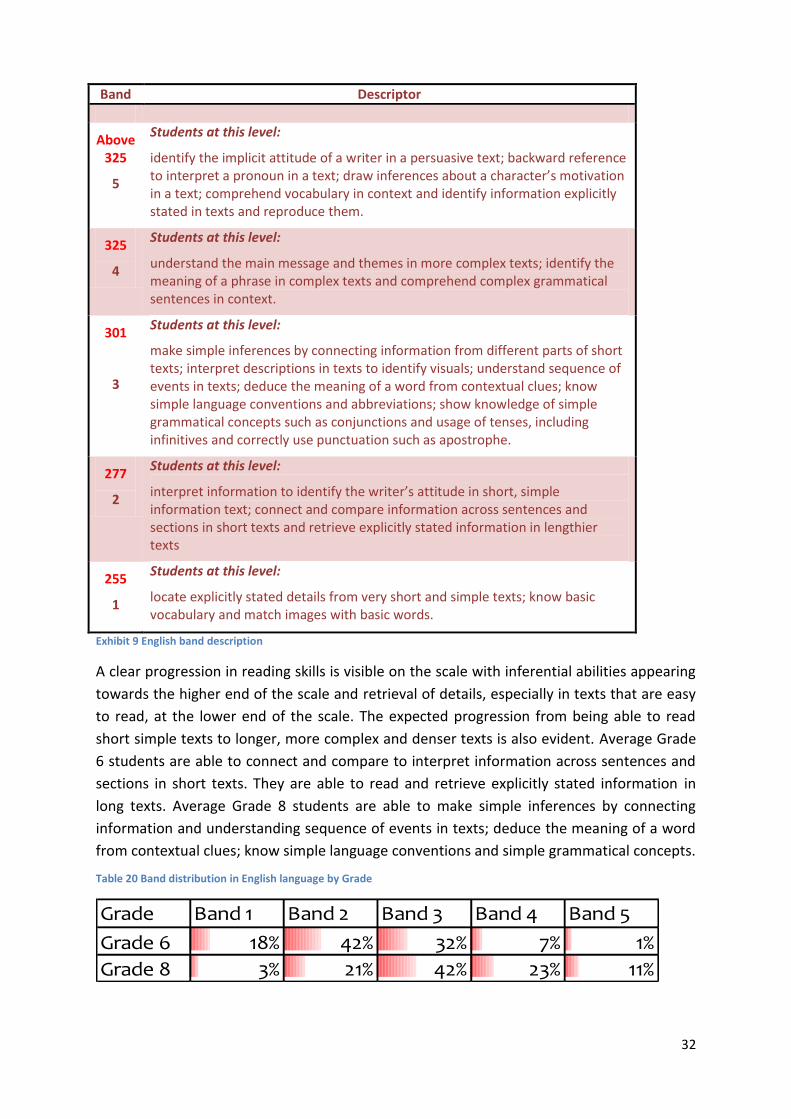
32
Band Descriptor
Above 325
5
Students at this level:
identify the implicit attitude of a writer in a persuasive text; backward reference to interpret a pronoun in a text; draw inferences about a character’s motivation in a text; comprehend vocabulary in context and identify information explicitly stated in texts and reproduce them.
325
4
Students at this level:
understand the main message and themes in more complex texts; identify the meaning of a phrase in complex texts and comprehend complex grammatical sentences in context.
301
3
Students at this level:
make simple inferences by connecting information from different parts of short texts; interpret descriptions in texts to identify visuals; understand sequence of events in texts; deduce the meaning of a word from contextual clues; know simple language conventions and abbreviations; show knowledge of simple grammatical concepts such as conjunctions and usage of tenses, including infinitives and correctly use punctuation such as apostrophe.
277
2
Students at this level:
interpret information to identify the writer’s attitude in short, simple information text; connect and compare information across sentences and sections in short texts and retrieve explicitly stated information in lengthier texts
255
1
Students at this level:
locate explicitly stated details from very short and simple texts; know basic vocabulary and match images with basic words.
Exhibit 9 English band description
A clear progression in reading skills is visible on the scale with inferential abilities appearing
towards the higher end of the scale and retrieval of details, especially in texts that are easy
to read, at the lower end of the scale. The expected progression from being able to read
short simple texts to longer, more complex and denser texts is also evident. Average Grade
6 students are able to connect and compare to interpret information across sentences and
sections in short texts. They are able to read and retrieve explicitly stated information in
long texts. Average Grade 8 students are able to make simple inferences by connecting
information and understanding sequence of events in texts; deduce the meaning of a word
from contextual clues; know simple language conventions and simple grammatical concepts.
Table 20 Band distribution in English language by Grade
Grade Band 1 Band 2 Band 3 Band 4 Band 5
Grade 6 18% 42% 32% 7% 1%
Grade 8 3% 21% 42% 23% 11%
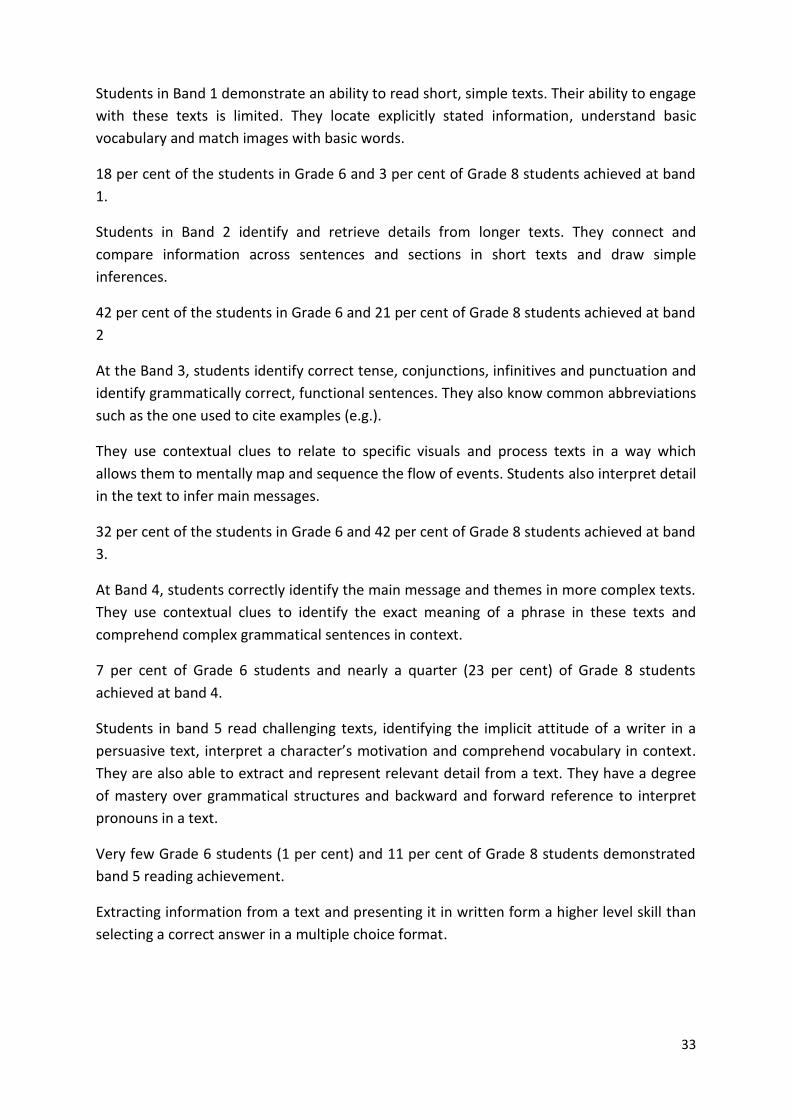
33
Students in Band 1 demonstrate an ability to read short, simple texts. Their ability to engage
with these texts is limited. They locate explicitly stated information, understand basic
vocabulary and match images with basic words.
18 per cent of the students in Grade 6 and 3 per cent of Grade 8 students achieved at band
1.
Students in Band 2 identify and retrieve details from longer texts. They connect and
compare information across sentences and sections in short texts and draw simple
inferences.
42 per cent of the students in Grade 6 and 21 per cent of Grade 8 students achieved at band
2
At the Band 3, students identify correct tense, conjunctions, infinitives and punctuation and
identify grammatically correct, functional sentences. They also know common abbreviations
such as the one used to cite examples (e.g.).
They use contextual clues to relate to specific visuals and process texts in a way which
allows them to mentally map and sequence the flow of events. Students also interpret detail
in the text to infer main messages.
32 per cent of the students in Grade 6 and 42 per cent of Grade 8 students achieved at band
3.
At Band 4, students correctly identify the main message and themes in more complex texts.
They use contextual clues to identify the exact meaning of a phrase in these texts and
comprehend complex grammatical sentences in context.
7 per cent of Grade 6 students and nearly a quarter (23 per cent) of Grade 8 students
achieved at band 4.
Students in band 5 read challenging texts, identifying the implicit attitude of a writer in a
persuasive text, interpret a character’s motivation and comprehend vocabulary in context.
They are also able to extract and represent relevant detail from a text. They have a degree
of mastery over grammatical structures and backward and forward reference to interpret
pronouns in a text.
Very few Grade 6 students (1 per cent) and 11 per cent of Grade 8 students demonstrated
band 5 reading achievement.
Extracting information from a text and presenting it in written form a higher level skill than
selecting a correct answer in a multiple choice format.
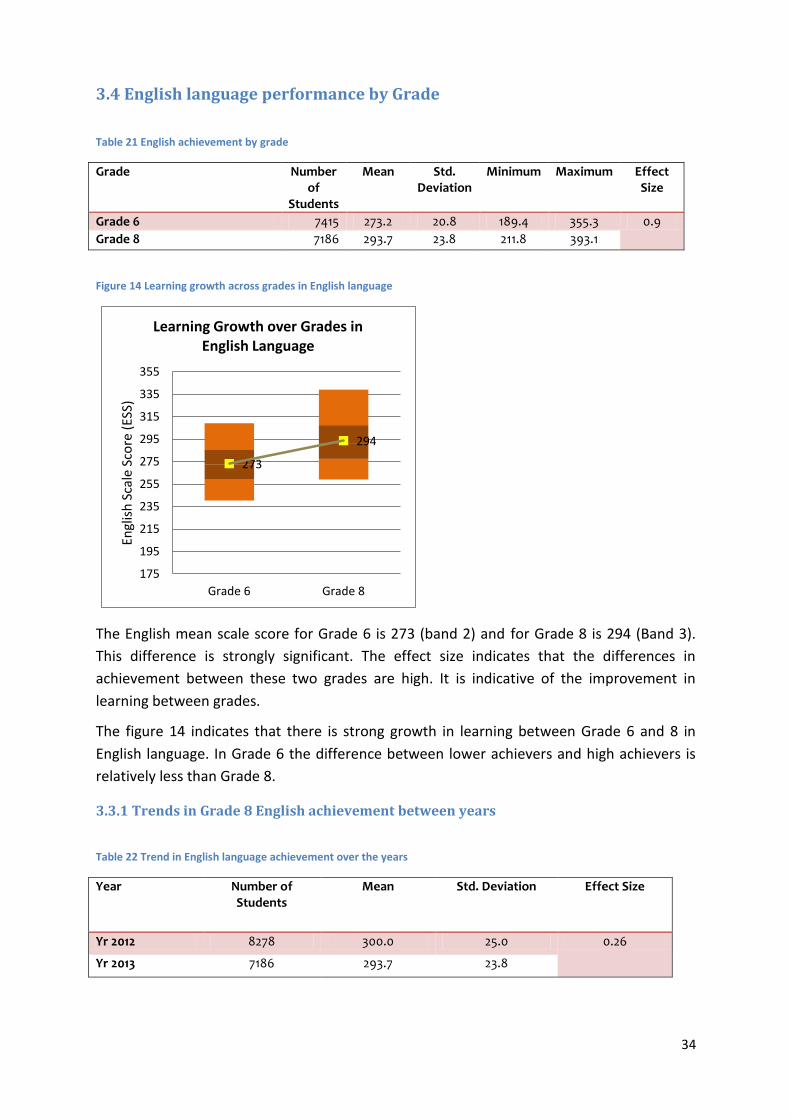
34
3.4 English language performance by Grade
Table 21 English achievement by grade
Grade Number of
Students
Mean Std. Deviation
Minimum Maximum Effect Size
Grade 6 7415 273.2 20.8 189.4 355.3 0.9
Grade 8 7186 293.7 23.8 211.8 393.1
Figure 14 Learning growth across grades in English language
The English mean scale score for Grade 6 is 273 (band 2) and for Grade 8 is 294 (Band 3).
This difference is strongly significant. The effect size indicates that the differences in
achievement between these two grades are high. It is indicative of the improvement in
learning between grades.
The figure 14 indicates that there is strong growth in learning between Grade 6 and 8 in
English language. In Grade 6 the difference between lower achievers and high achievers is
relatively less than Grade 8.
3.3.1 Trends in Grade 8 English achievement between years
Table 22 Trend in English language achievement over the years
Year Number of Students
Mean Std. Deviation Effect Size
Yr 2012 8278 300.0 25.0 0.26
Yr 2013 7186 293.7 23.8
273
294
175
195
215
235
255
275
295
315
335
355
Grade 6 Grade 8
Engl
ish
Sca
le S
core
(ES
S)
Learning Growth over Grades in English Language
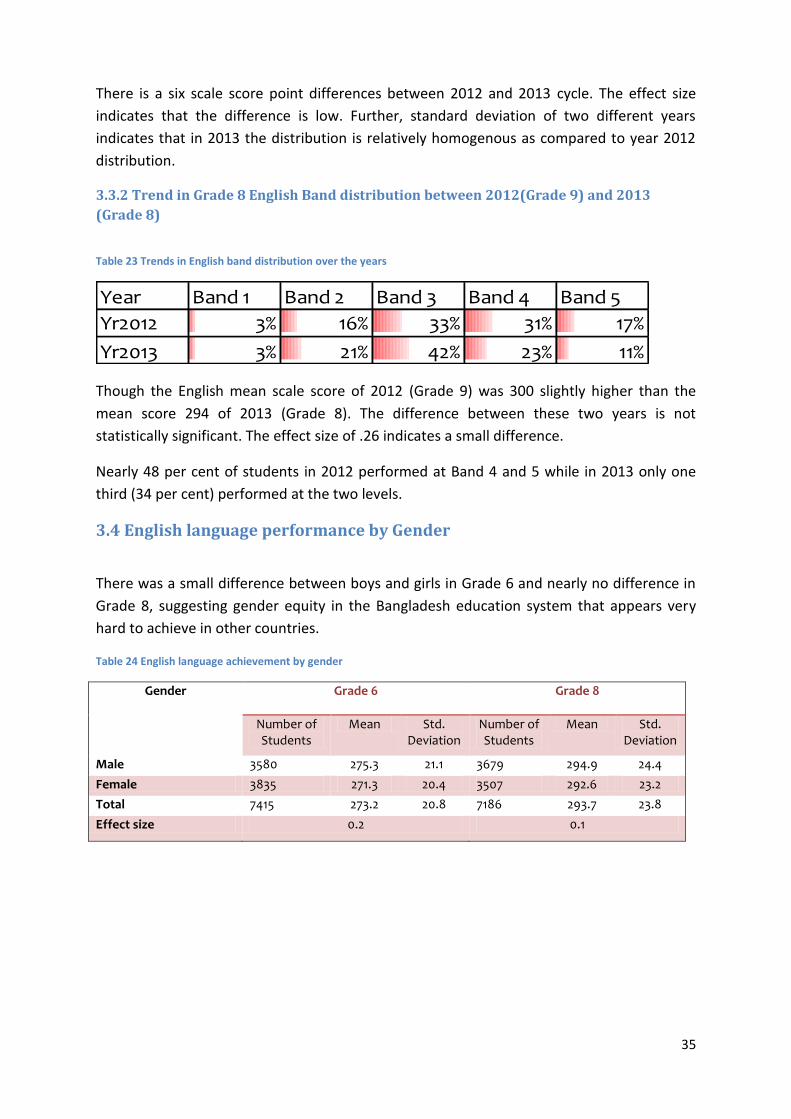
35
There is a six scale score point differences between 2012 and 2013 cycle. The effect size
indicates that the difference is low. Further, standard deviation of two different years
indicates that in 2013 the distribution is relatively homogenous as compared to year 2012
distribution.
3.3.2 Trend in Grade 8 English Band distribution between 2012(Grade 9) and 2013
(Grade 8)
Table 23 Trends in English band distribution over the years
Year Band 1 Band 2 Band 3 Band 4 Band 5
Yr2012 3% 16% 33% 31% 17%
Yr2013 3% 21% 42% 23% 11%
Though the English mean scale score of 2012 (Grade 9) was 300 slightly higher than the
mean score 294 of 2013 (Grade 8). The difference between these two years is not
statistically significant. The effect size of .26 indicates a small difference.
Nearly 48 per cent of students in 2012 performed at Band 4 and 5 while in 2013 only one
third (34 per cent) performed at the two levels.
3.4 English language performance by Gender
There was a small difference between boys and girls in Grade 6 and nearly no difference in
Grade 8, suggesting gender equity in the Bangladesh education system that appears very
hard to achieve in other countries.
Table 24 English language achievement by gender
Gender Grade 6 Grade 8
Number of Students
Mean Std. Deviation
Number of Students
Mean Std. Deviation
Male 3580 275.3 21.1 3679 294.9 24.4
Female 3835 271.3 20.4 3507 292.6 23.2
Total 7415 273.2 20.8 7186 293.7 23.8
Effect size 0.2 0.1

36
Figure 15 Distribution in English language by Gender
The figure above shows that within the grade boys and girls performed similarly in English
language. The low effect size indicates that there is gender equity in English achievement.
3.4.1 Band distribution of English achievement by Gender Table 25 Band distribution of English language by gender
Grade Gender Band 1 Band 2 Band 3 Band 4 Band 5
Male 16% 40% 33% 9% 2%
Female 20% 43% 30% 6% 1%
Male 3% 20% 41% 23% 12%
Female 3% 22% 43% 22% 9%
Grade 6
Grade 8
11 per cent and 35 per cent males performed at band 4 and 5 in Grades 6 and 8
respectively. In comparison 7 per cent and 31 per cent females performed at Band 4 and 5
respectively.
3.4.2 Trends in Grade 8 English achievement between years by Gender
Table 26 Trend in English language achievement by gender
Gender Year 2012 Year 2013 Effect Size Number of
Students Mean Std.
Deviation Number of Students
Mean Std. Deviation
Male 4154 300.5 24.7 3679 294.9 24.4 0.23
Female 4124 299.5 25.3 3507 292.6 23.2 0.29
Total 8278 300.0 25.0 7186 293.7 23.8 0.26
275 271
295 293
175
195
215
235
255
275
295
315
335
355
Male Female Male Female
Grade 6 Grade 8
Engl
ish
Sca
le S
core
(ES
S)
Distribution of English Language by Gender
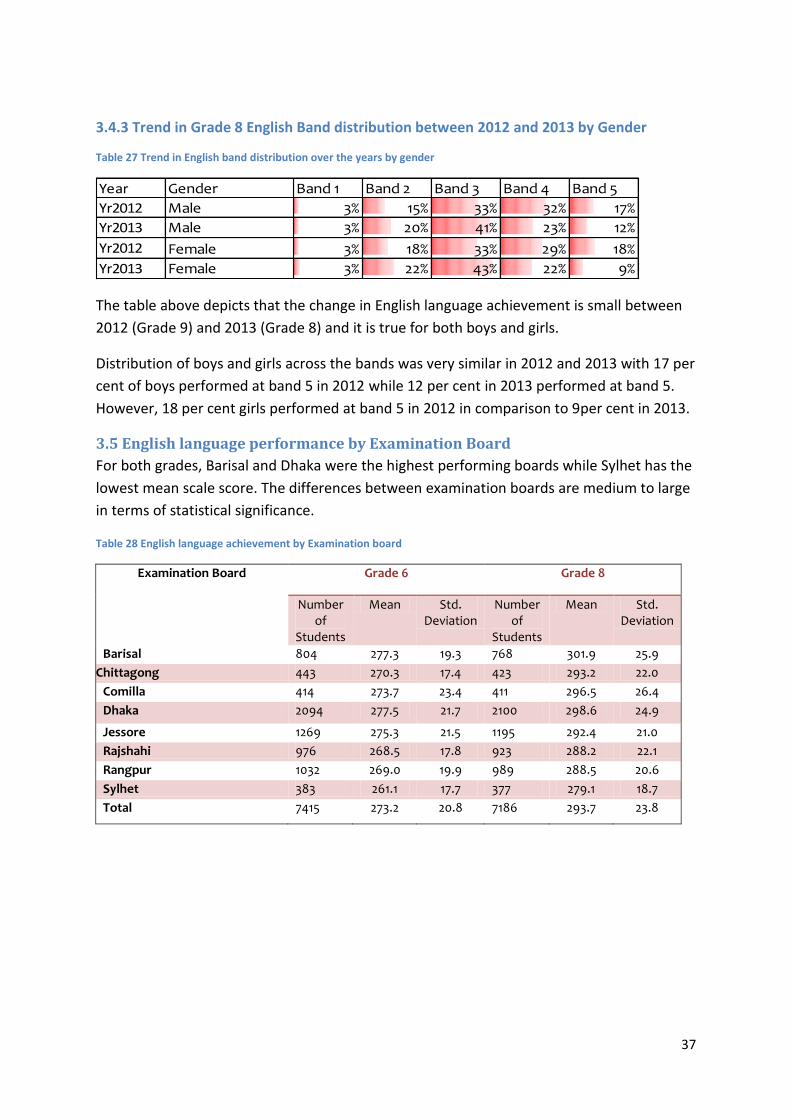
37
3.4.3 Trend in Grade 8 English Band distribution between 2012 and 2013 by Gender
Table 27 Trend in English band distribution over the years by gender
Year Gender Band 1 Band 2 Band 3 Band 4 Band 5
Yr2012 Male 3% 15% 33% 32% 17%
Yr2013 Male 3% 20% 41% 23% 12%
Yr2012 Female 3% 18% 33% 29% 18%
Yr2013 Female 3% 22% 43% 22% 9%
The table above depicts that the change in English language achievement is small between
2012 (Grade 9) and 2013 (Grade 8) and it is true for both boys and girls.
Distribution of boys and girls across the bands was very similar in 2012 and 2013 with 17 per
cent of boys performed at band 5 in 2012 while 12 per cent in 2013 performed at band 5.
However, 18 per cent girls performed at band 5 in 2012 in comparison to 9per cent in 2013.
3.5 English language performance by Examination Board
For both grades, Barisal and Dhaka were the highest performing boards while Sylhet has the
lowest mean scale score. The differences between examination boards are medium to large
in terms of statistical significance.
Table 28 English language achievement by Examination board
Examination Board Grade 6 Grade 8
Number of
Students
Mean Std. Deviation
Number of
Students
Mean Std. Deviation
Barisal 804 277.3 19.3 768 301.9 25.9
Chittagong 443 270.3 17.4 423 293.2 22.0
Comilla 414 273.7 23.4 411 296.5 26.4
Dhaka 2094 277.5 21.7 2100 298.6 24.9
Jessore 1269 275.3 21.5 1195 292.4 21.0
Rajshahi 976 268.5 17.8 923 288.2 22.1
Rangpur 1032 269.0 19.9 989 288.5 20.6
Sylhet 383 261.1 17.7 377 279.1 18.7
Total 7415 273.2 20.8 7186 293.7 23.8
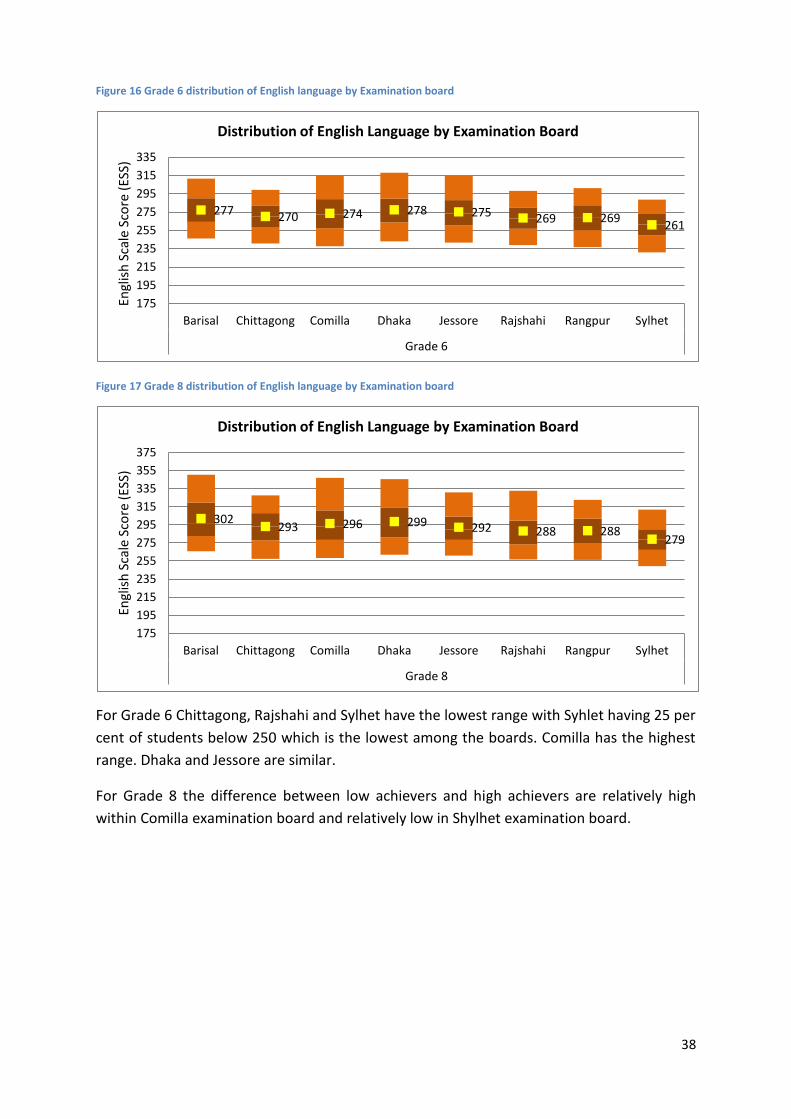
38
Figure 16 Grade 6 distribution of English language by Examination board
Figure 17 Grade 8 distribution of English language by Examination board
For Grade 6 Chittagong, Rajshahi and Sylhet have the lowest range with Syhlet having 25 per
cent of students below 250 which is the lowest among the boards. Comilla has the highest
range. Dhaka and Jessore are similar.
For Grade 8 the difference between low achievers and high achievers are relatively high
within Comilla examination board and relatively low in Shylhet examination board.
277 270 274 278 275 269 269 261
175
195
215
235
255
275
295
315
335
Barisal Chittagong Comilla Dhaka Jessore Rajshahi Rangpur Sylhet
Grade 6
Engl
ish
Sca
le S
core
(ES
S)
Distribution of English Language by Examination Board
302 293 296 299 292 288 288
279
175
195
215
235
255
275
295
315
335
355
375
Barisal Chittagong Comilla Dhaka Jessore Rajshahi Rangpur Sylhet
Grade 8
Engl
ish
Sca
le S
core
(ES
S)
Distribution of English Language by Examination Board

39
Table 29 Band distribution of English achievement by Examination Board
Grade Examination Board Band 1 Band 2 Band 3 Band 4 Band 5
Barisal 12% 40% 36% 12% 1%
Chittagong 18% 47% 31% 4% 0%
Comilla 21% 36% 32% 8% 3%
Dhaka 13% 39% 36% 9% 3%
Jessore 16% 41% 32% 10% 2%
Rajshahi 22% 48% 27% 3% 0%
Rangpur 24% 42% 28% 5% 0%
Sylhet 36% 45% 18% 1%
Barisal 1% 15% 39% 24% 21%
Chittagong 4% 20% 39% 31% 6%
Comilla 4% 19% 40% 22% 15%
Dhaka 2% 16% 40% 26% 15%
Jessore 2% 20% 48% 23% 7%
Rajshahi 4% 29% 44% 16% 8%
Rangpur 4% 26% 44% 22% 4%
Sylhet 8% 38% 43% 10% 1%
Grade 6
Grade 8
At Grade 6, 12 to 13 per cent of students from Barisal and Jessore examination board
achieved Band 4 and 5 whilst only 1 to 3 per cent of students from Sylhet and Rajshahi
achieved band 4 and 5. In Sylhet examination board, 36 per cent of students scored at band
1.
At Grade 8, 21 per cent of students from Barisal examination board achieved Band 5 and 1
per cent of students from Sylhet achieved Band 5.
3.5.1 Trend in Grade 8 English achievement between years by Examination Board
The difference between boards was significant from medium to low. Range of score
differences varied from 3 score points to 12 score points between boards from 2012 to
2013. Minimum difference between 2012 and 2013 in English scale score was observed in
Dhaka and Rangpur examination board and maximum difference was observed in Jessore
examination board.
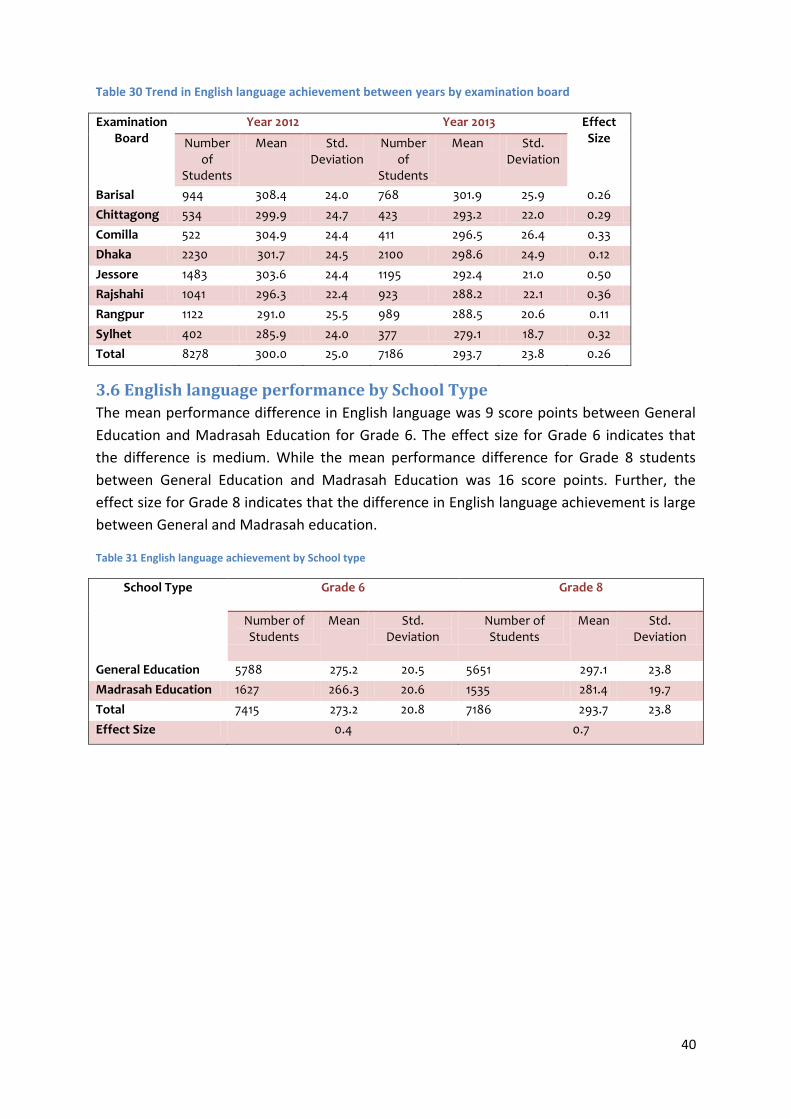
40
Table 30 Trend in English language achievement between years by examination board
Examination Board
Year 2012 Year 2013 Effect Size Number
of Students
Mean Std. Deviation
Number of
Students
Mean Std. Deviation
Barisal 944 308.4 24.0 768 301.9 25.9 0.26
Chittagong 534 299.9 24.7 423 293.2 22.0 0.29
Comilla 522 304.9 24.4 411 296.5 26.4 0.33
Dhaka 2230 301.7 24.5 2100 298.6 24.9 0.12
Jessore 1483 303.6 24.4 1195 292.4 21.0 0.50
Rajshahi 1041 296.3 22.4 923 288.2 22.1 0.36
Rangpur 1122 291.0 25.5 989 288.5 20.6 0.11
Sylhet 402 285.9 24.0 377 279.1 18.7 0.32
Total 8278 300.0 25.0 7186 293.7 23.8 0.26
3.6 English language performance by School Type
The mean performance difference in English language was 9 score points between General
Education and Madrasah Education for Grade 6. The effect size for Grade 6 indicates that
the difference is medium. While the mean performance difference for Grade 8 students
between General Education and Madrasah Education was 16 score points. Further, the
effect size for Grade 8 indicates that the difference in English language achievement is large
between General and Madrasah education.
Table 31 English language achievement by School type
School Type Grade 6 Grade 8
Number of Students
Mean Std. Deviation
Number of Students
Mean Std. Deviation
General Education 5788 275.2 20.5 5651 297.1 23.8
Madrasah Education 1627 266.3 20.6 1535 281.4 19.7
Total 7415 273.2 20.8 7186 293.7 23.8
Effect Size 0.4 0.7
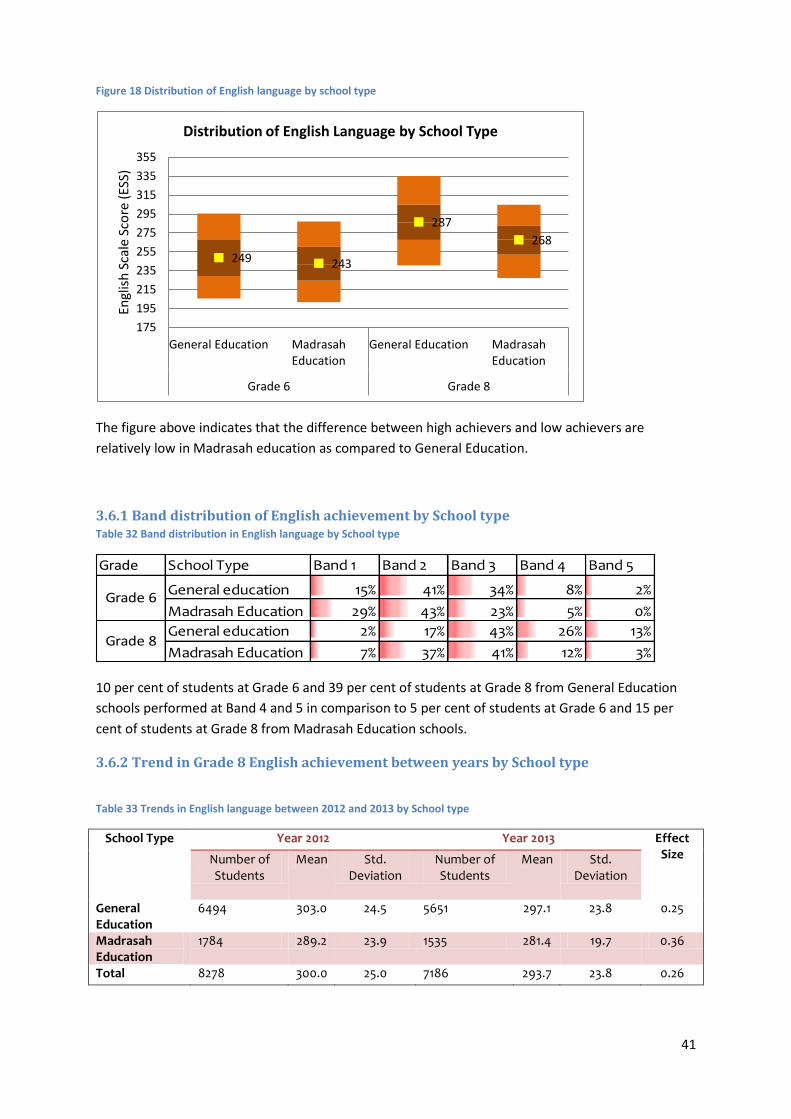
41
Figure 18 Distribution of English language by school type
The figure above indicates that the difference between high achievers and low achievers are
relatively low in Madrasah education as compared to General Education.
3.6.1 Band distribution of English achievement by School type Table 32 Band distribution in English language by School type
Grade School Type Band 1 Band 2 Band 3 Band 4 Band 5
General education 15% 41% 34% 8% 2%
Madrasah Education 29% 43% 23% 5% 0%
General education 2% 17% 43% 26% 13%
Madrasah Education 7% 37% 41% 12% 3%
Grade 6
Grade 8
10 per cent of students at Grade 6 and 39 per cent of students at Grade 8 from General Education
schools performed at Band 4 and 5 in comparison to 5 per cent of students at Grade 6 and 15 per
cent of students at Grade 8 from Madrasah Education schools.
3.6.2 Trend in Grade 8 English achievement between years by School type
Table 33 Trends in English language between 2012 and 2013 by School type
School Type Year 2012 Year 2013 Effect Size Number of
Students Mean Std.
Deviation Number of Students
Mean Std. Deviation
General Education
6494 303.0 24.5 5651 297.1 23.8 0.25
Madrasah Education
1784 289.2 23.9 1535 281.4 19.7 0.36
Total 8278 300.0 25.0 7186 293.7 23.8 0.26
249 243
287
268
175
195
215
235
255
275
295
315
335
355
General Education Madrasah Education
General Education Madrasah Education
Grade 6 Grade 8
Engl
ish
Sca
le S
core
(ES
S)
Distribution of English Language by School Type
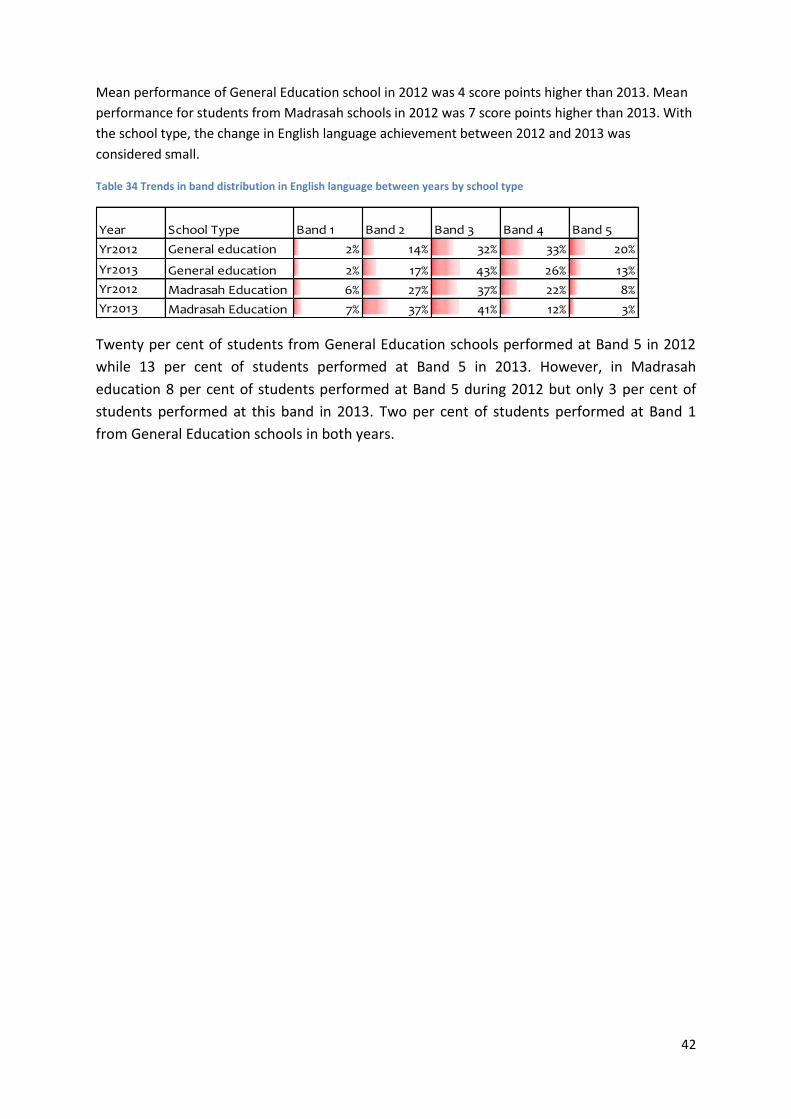
42
Mean performance of General Education school in 2012 was 4 score points higher than 2013. Mean
performance for students from Madrasah schools in 2012 was 7 score points higher than 2013. With
the school type, the change in English language achievement between 2012 and 2013 was
considered small.
Table 34 Trends in band distribution in English language between years by school type
Year School Type Band 1 Band 2 Band 3 Band 4 Band 5
Yr2012 General education 2% 14% 32% 33% 20%
Yr2013 General education 2% 17% 43% 26% 13%
Yr2012 Madrasah Education 6% 27% 37% 22% 8%
Yr2013 Madrasah Education 7% 37% 41% 12% 3%
Twenty per cent of students from General Education schools performed at Band 5 in 2012
while 13 per cent of students performed at Band 5 in 2013. However, in Madrasah
education 8 per cent of students performed at Band 5 during 2012 but only 3 per cent of
students performed at this band in 2013. Two per cent of students performed at Band 1
from General Education schools in both years.
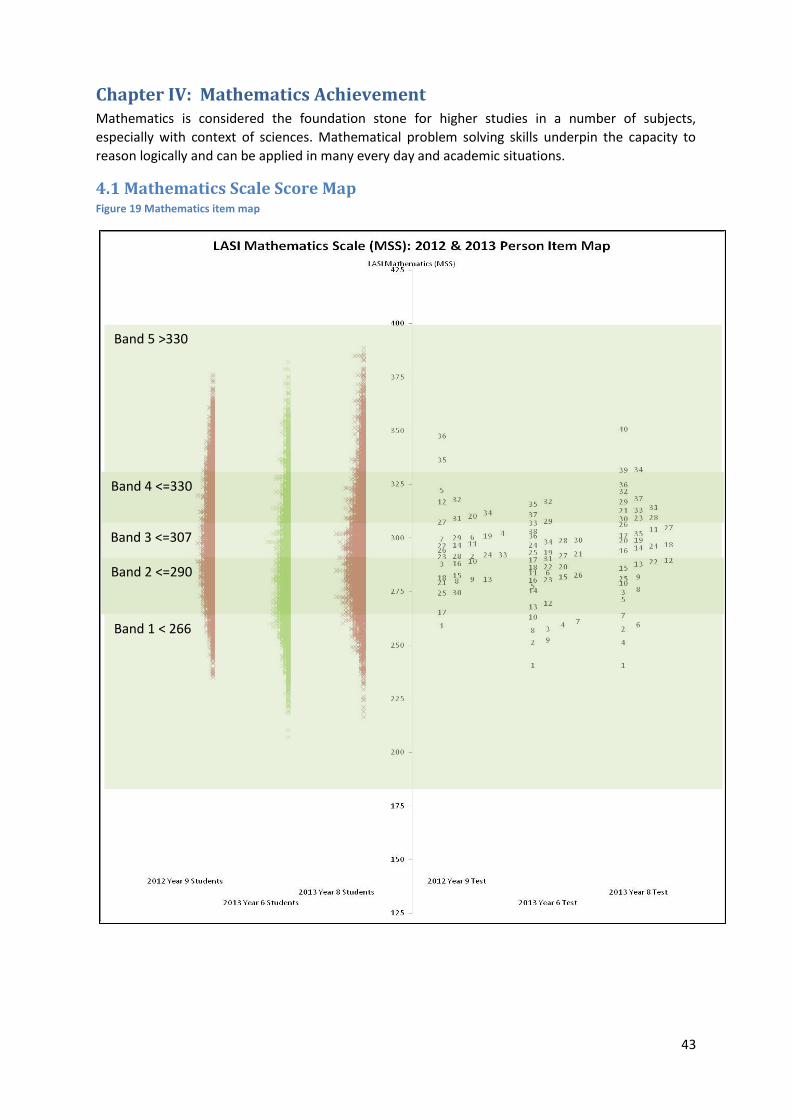
43
Chapter IV: Mathematics Achievement Mathematics is considered the foundation stone for higher studies in a number of subjects,
especially with context of sciences. Mathematical problem solving skills underpin the capacity to
reason logically and can be applied in many every day and academic situations.
4.1 Mathematics Scale Score Map Figure 19 Mathematics item map
Band 1 < 266
Band 2 <=290
Band 3 <=307
Band 4 <=330
Band 5 >330
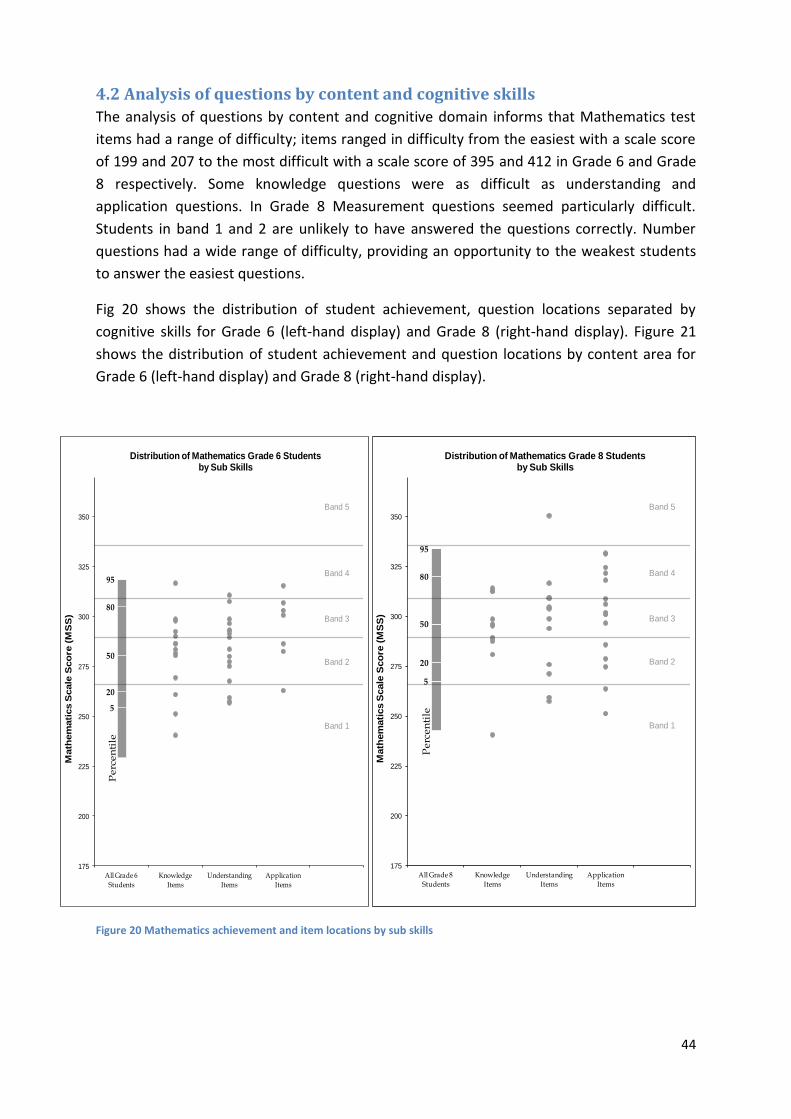
44
4.2 Analysis of questions by content and cognitive skills
The analysis of questions by content and cognitive domain informs that Mathematics test
items had a range of difficulty; items ranged in difficulty from the easiest with a scale score
of 199 and 207 to the most difficult with a scale score of 395 and 412 in Grade 6 and Grade
8 respectively. Some knowledge questions were as difficult as understanding and
application questions. In Grade 8 Measurement questions seemed particularly difficult.
Students in band 1 and 2 are unlikely to have answered the questions correctly. Number
questions had a wide range of difficulty, providing an opportunity to the weakest students
to answer the easiest questions.
Fig 20 shows the distribution of student achievement, question locations separated by
cognitive skills for Grade 6 (left-hand display) and Grade 8 (right-hand display). Figure 21
shows the distribution of student achievement and question locations by content area for
Grade 6 (left-hand display) and Grade 8 (right-hand display).
Figure 20 Mathematics achievement and item locations by sub skills
5
20
50
80
95
Perc
en
tile
Band 1
Band 2
Band 3
Band 4
Band 5
175
200
225
250
275
300
325
350
All Grade 6
Students
Knowledge
Items
Understanding
Items
Application
Items
Math
em
ati
cs S
cale
Sco
re (
MS
S)
Distribution of Mathematics Grade 6 Students by Sub Skills
5
20
50
80
95
Perc
en
tile
Band 1
Band 2
Band 3
Band 4
Band 5
175
200
225
250
275
300
325
350
All Grade 8
Students
Knowledge
Items
Understanding
Items
Application
Items
Math
em
ati
cs S
cale
Sco
re (
MS
S)
Distribution of Mathematics Grade 8 Students by Sub Skills
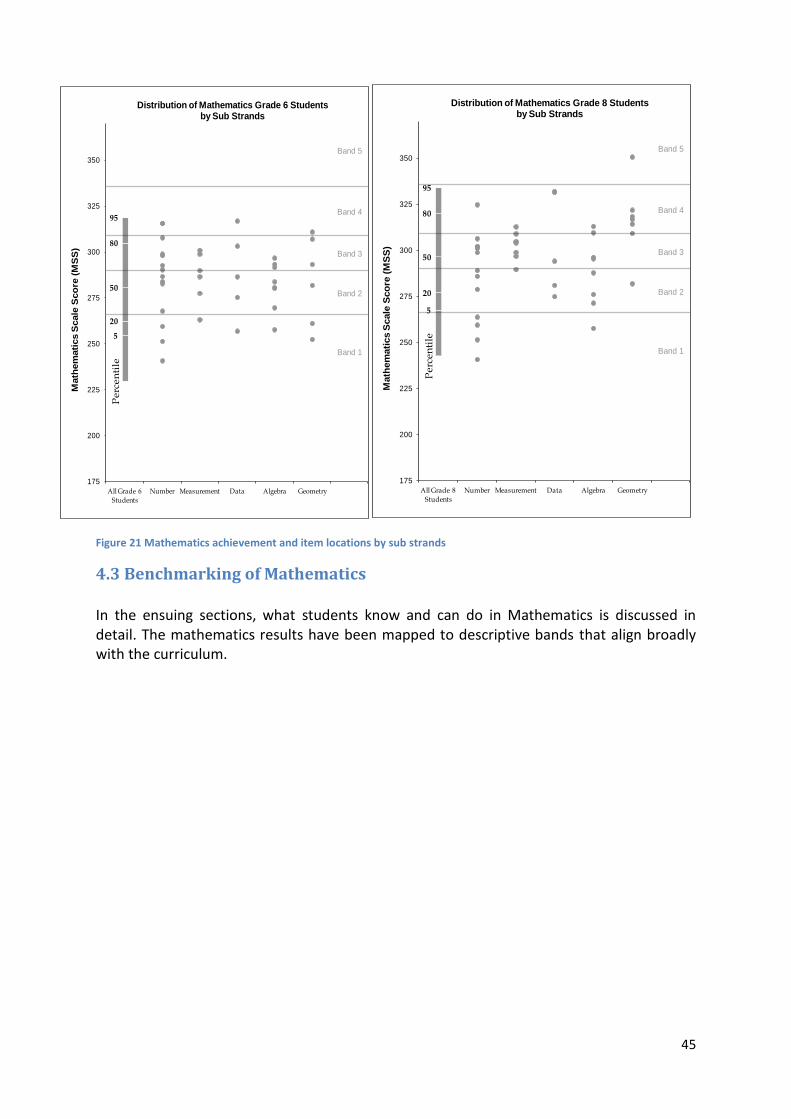
45
Figure 21 Mathematics achievement and item locations by sub strands
4.3 Benchmarking of Mathematics
In the ensuing sections, what students know and can do in Mathematics is discussed in detail. The mathematics results have been mapped to descriptive bands that align broadly with the curriculum.
5
20
50
80
95
Pe
rce
nti
le
Band 1
Band 2
Band 3
Band 4
Band 5
175
200
225
250
275
300
325
350
All Grade 6
Students
Number Measurement Data Algebra Geometry
Math
em
ati
cs S
cale
Sco
re (
MS
S)
Distribution of Mathematics Grade 6 Students by Sub Strands
5
20
50
80
95
Perc
en
tile
Band 1
Band 2
Band 3
Band 4
Band 5
175
200
225
250
275
300
325
350
All Grade 8
Students
Number Measurement Data Algebra Geometry
Math
em
ati
cs S
cale
Sco
re (
MS
S)
Distribution of Mathematics Grade 8 Students by Sub Strands
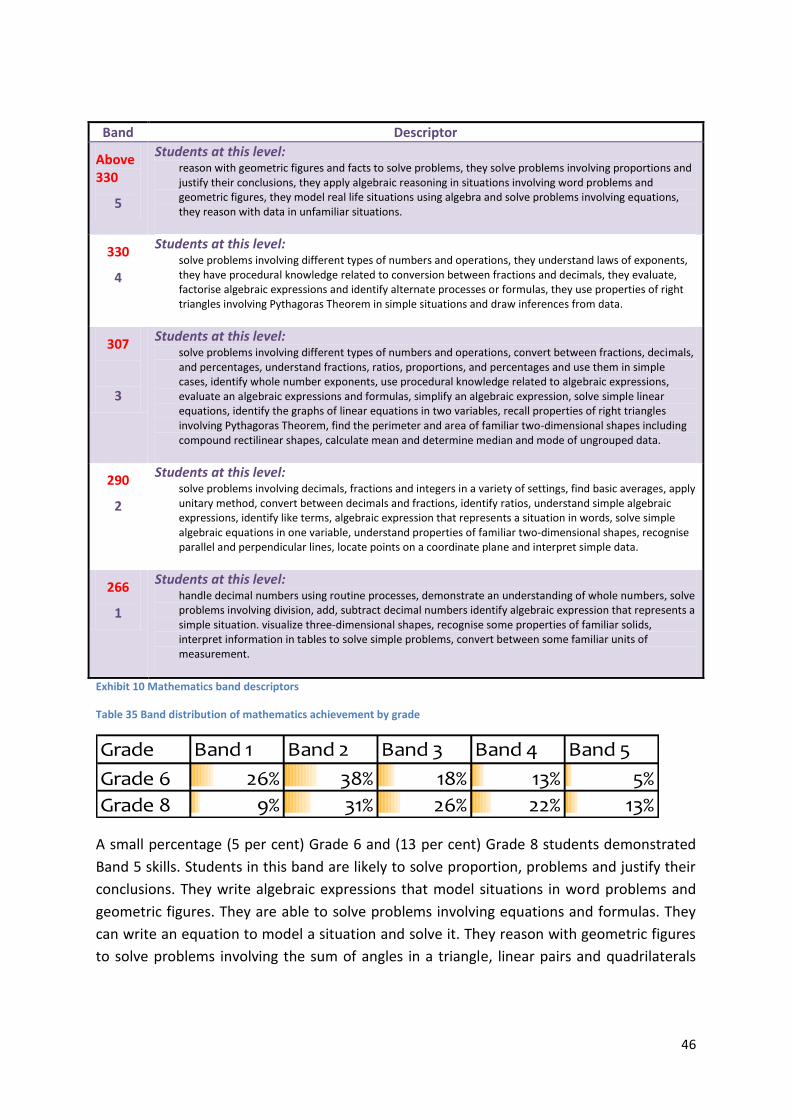
46
Band Descriptor
Above 330
5
Students at this level: reason with geometric figures and facts to solve problems, they solve problems involving proportions and justify their conclusions, they apply algebraic reasoning in situations involving word problems and geometric figures, they model real life situations using algebra and solve problems involving equations, they reason with data in unfamiliar situations.
330
4
Students at this level: solve problems involving different types of numbers and operations, they understand laws of exponents, they have procedural knowledge related to conversion between fractions and decimals, they evaluate, factorise algebraic expressions and identify alternate processes or formulas, they use properties of right triangles involving Pythagoras Theorem in simple situations and draw inferences from data.
307
3
Students at this level: solve problems involving different types of numbers and operations, convert between fractions, decimals, and percentages, understand fractions, ratios, proportions, and percentages and use them in simple cases, identify whole number exponents, use procedural knowledge related to algebraic expressions, evaluate an algebraic expressions and formulas, simplify an algebraic expression, solve simple linear equations, identify the graphs of linear equations in two variables, recall properties of right triangles involving Pythagoras Theorem, find the perimeter and area of familiar two-dimensional shapes including compound rectilinear shapes, calculate mean and determine median and mode of ungrouped data.
290
2
Students at this level: solve problems involving decimals, fractions and integers in a variety of settings, find basic averages, apply unitary method, convert between decimals and fractions, identify ratios, understand simple algebraic expressions, identify like terms, algebraic expression that represents a situation in words, solve simple algebraic equations in one variable, understand properties of familiar two-dimensional shapes, recognise parallel and perpendicular lines, locate points on a coordinate plane and interpret simple data.
266
1
Students at this level: handle decimal numbers using routine processes, demonstrate an understanding of whole numbers, solve problems involving division, add, subtract decimal numbers identify algebraic expression that represents a simple situation. visualize three-dimensional shapes, recognise some properties of familiar solids, interpret information in tables to solve simple problems, convert between some familiar units of measurement.
Exhibit 10 Mathematics band descriptors
Table 35 Band distribution of mathematics achievement by grade
Grade Band 1 Band 2 Band 3 Band 4 Band 5
Grade 6 26% 38% 18% 13% 5%
Grade 8 9% 31% 26% 22% 13%
A small percentage (5 per cent) Grade 6 and (13 per cent) Grade 8 students demonstrated
Band 5 skills. Students in this band are likely to solve proportion, problems and justify their
conclusions. They write algebraic expressions that model situations in word problems and
geometric figures. They are able to solve problems involving equations and formulas. They
can write an equation to model a situation and solve it. They reason with geometric figures
to solve problems involving the sum of angles in a triangle, linear pairs and quadrilaterals
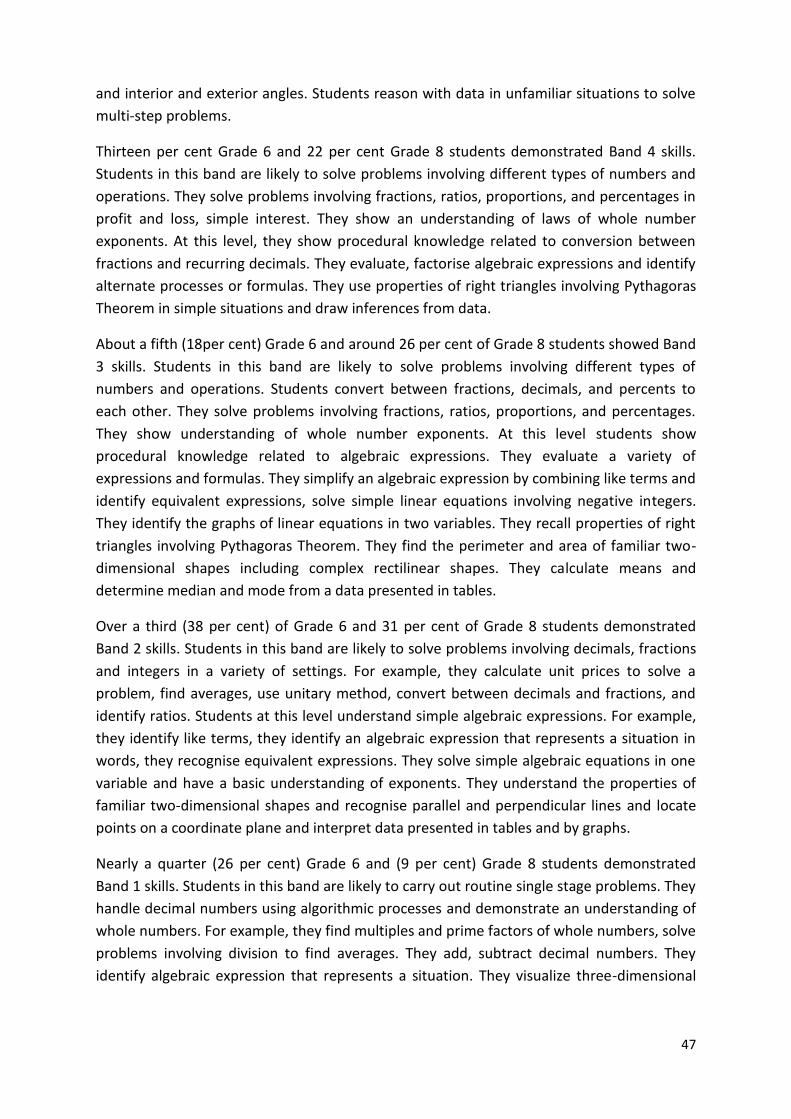
47
and interior and exterior angles. Students reason with data in unfamiliar situations to solve
multi-step problems.
Thirteen per cent Grade 6 and 22 per cent Grade 8 students demonstrated Band 4 skills.
Students in this band are likely to solve problems involving different types of numbers and
operations. They solve problems involving fractions, ratios, proportions, and percentages in
profit and loss, simple interest. They show an understanding of laws of whole number
exponents. At this level, they show procedural knowledge related to conversion between
fractions and recurring decimals. They evaluate, factorise algebraic expressions and identify
alternate processes or formulas. They use properties of right triangles involving Pythagoras
Theorem in simple situations and draw inferences from data.
About a fifth (18per cent) Grade 6 and around 26 per cent of Grade 8 students showed Band
3 skills. Students in this band are likely to solve problems involving different types of
numbers and operations. Students convert between fractions, decimals, and percents to
each other. They solve problems involving fractions, ratios, proportions, and percentages.
They show understanding of whole number exponents. At this level students show
procedural knowledge related to algebraic expressions. They evaluate a variety of
expressions and formulas. They simplify an algebraic expression by combining like terms and
identify equivalent expressions, solve simple linear equations involving negative integers.
They identify the graphs of linear equations in two variables. They recall properties of right
triangles involving Pythagoras Theorem. They find the perimeter and area of familiar two-
dimensional shapes including complex rectilinear shapes. They calculate means and
determine median and mode from a data presented in tables.
Over a third (38 per cent) of Grade 6 and 31 per cent of Grade 8 students demonstrated
Band 2 skills. Students in this band are likely to solve problems involving decimals, fractions
and integers in a variety of settings. For example, they calculate unit prices to solve a
problem, find averages, use unitary method, convert between decimals and fractions, and
identify ratios. Students at this level understand simple algebraic expressions. For example,
they identify like terms, they identify an algebraic expression that represents a situation in
words, they recognise equivalent expressions. They solve simple algebraic equations in one
variable and have a basic understanding of exponents. They understand the properties of
familiar two-dimensional shapes and recognise parallel and perpendicular lines and locate
points on a coordinate plane and interpret data presented in tables and by graphs.
Nearly a quarter (26 per cent) Grade 6 and (9 per cent) Grade 8 students demonstrated
Band 1 skills. Students in this band are likely to carry out routine single stage problems. They
handle decimal numbers using algorithmic processes and demonstrate an understanding of
whole numbers. For example, they find multiples and prime factors of whole numbers, solve
problems involving division to find averages. They add, subtract decimal numbers. They
identify algebraic expression that represents a situation. They visualize three-dimensional
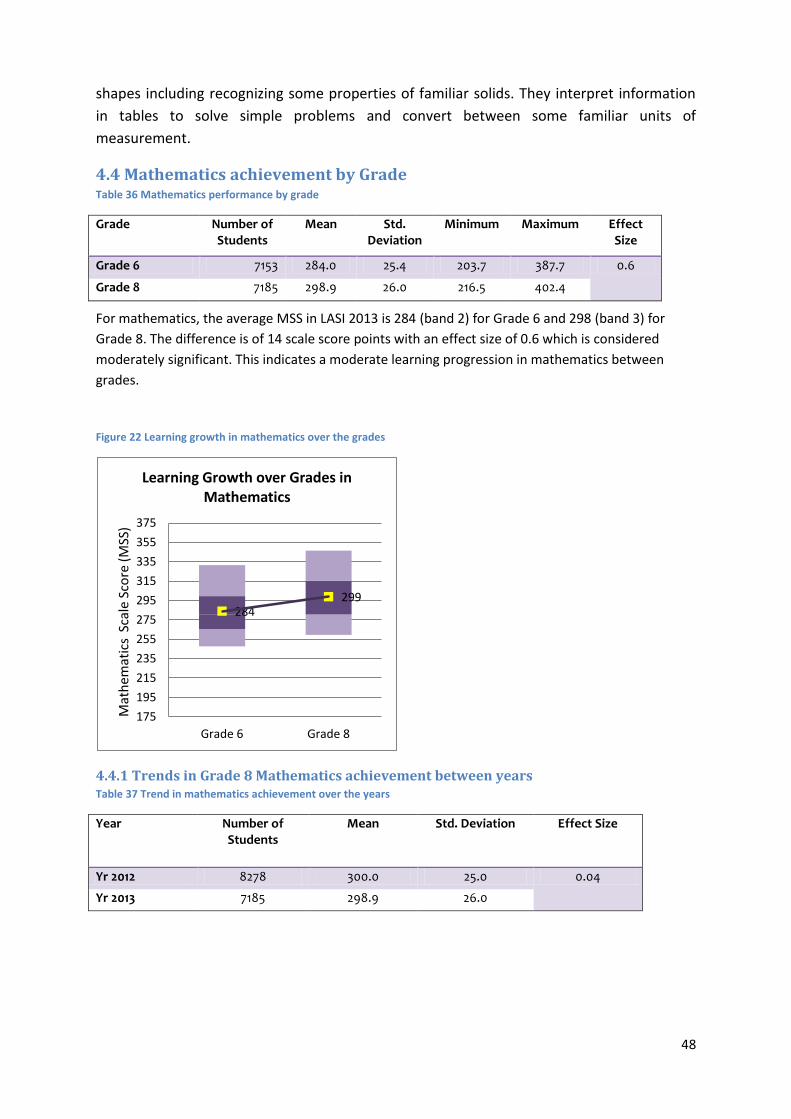
48
shapes including recognizing some properties of familiar solids. They interpret information
in tables to solve simple problems and convert between some familiar units of
measurement.
4.4 Mathematics achievement by Grade Table 36 Mathematics performance by grade
Grade Number of Students
Mean Std. Deviation
Minimum Maximum Effect Size
Grade 6 7153 284.0 25.4 203.7 387.7 0.6
Grade 8 7185 298.9 26.0 216.5 402.4
For mathematics, the average MSS in LASI 2013 is 284 (band 2) for Grade 6 and 298 (band 3) for
Grade 8. The difference is of 14 scale score points with an effect size of 0.6 which is considered
moderately significant. This indicates a moderate learning progression in mathematics between
grades.
Figure 22 Learning growth in mathematics over the grades
4.4.1 Trends in Grade 8 Mathematics achievement between years Table 37 Trend in mathematics achievement over the years
Year Number of Students
Mean Std. Deviation Effect Size
Yr 2012 8278 300.0 25.0 0.04
Yr 2013 7185 298.9 26.0
284 299
175
195
215
235
255
275
295
315
335
355
375
Grade 6 Grade 8
Mat
hem
atic
s S
cale
Sco
re (
MSS
)
Learning Growth over Grades in Mathematics
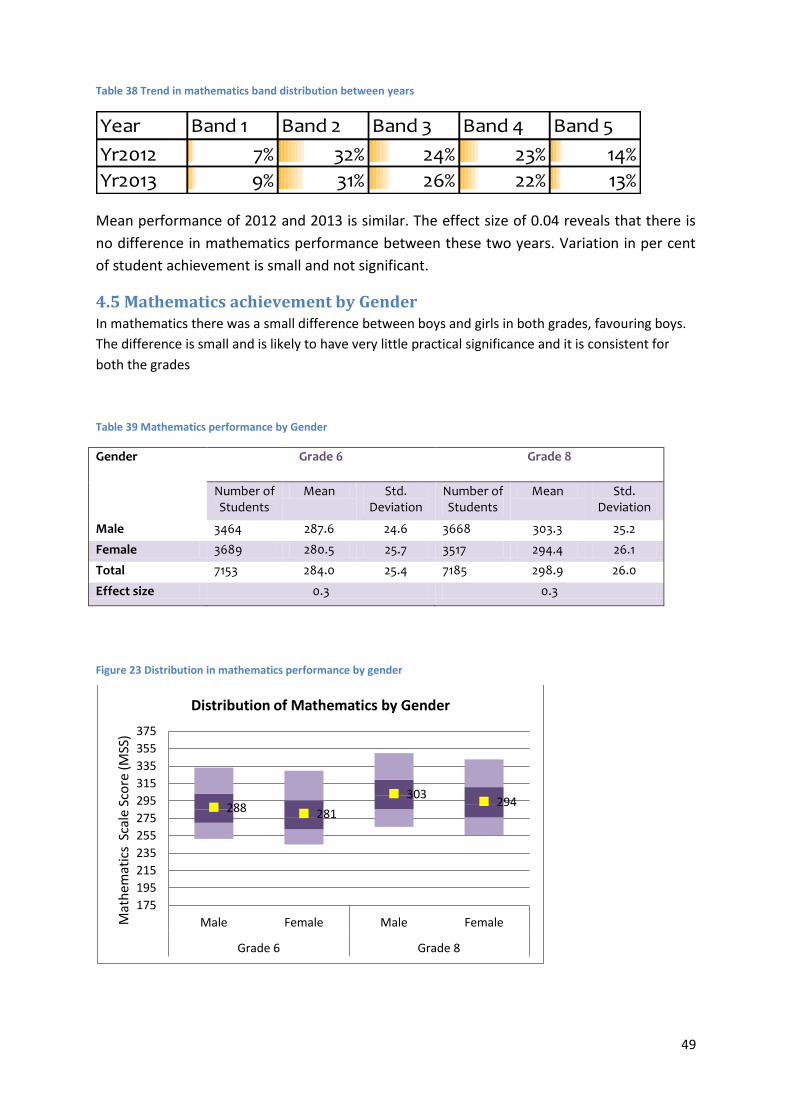
49
Table 38 Trend in mathematics band distribution between years
Year Band 1 Band 2 Band 3 Band 4 Band 5
Yr2012 7% 32% 24% 23% 14%
Yr2013 9% 31% 26% 22% 13%
Mean performance of 2012 and 2013 is similar. The effect size of 0.04 reveals that there is
no difference in mathematics performance between these two years. Variation in per cent
of student achievement is small and not significant.
4.5 Mathematics achievement by Gender In mathematics there was a small difference between boys and girls in both grades, favouring boys.
The difference is small and is likely to have very little practical significance and it is consistent for
both the grades
Table 39 Mathematics performance by Gender
Gender Grade 6 Grade 8
Number of Students
Mean Std. Deviation
Number of Students
Mean Std. Deviation
Male 3464 287.6 24.6 3668 303.3 25.2
Female 3689 280.5 25.7 3517 294.4 26.1
Total 7153 284.0 25.4 7185 298.9 26.0
Effect size 0.3 0.3
Figure 23 Distribution in mathematics performance by gender
288 281
303 294
175
195
215
235
255
275
295
315
335
355
375
Male Female Male Female
Grade 6 Grade 8
Mat
hem
atic
s S
cale
Sco
re (
MSS
)
Distribution of Mathematics by Gender
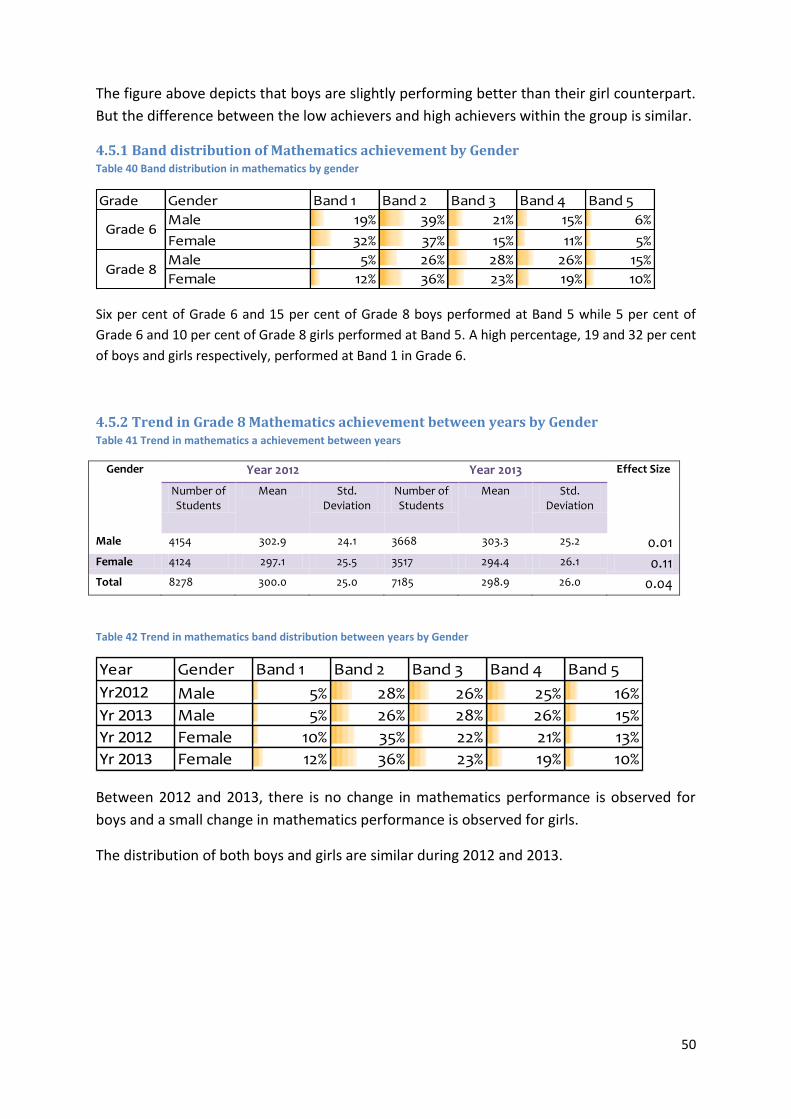
50
The figure above depicts that boys are slightly performing better than their girl counterpart.
But the difference between the low achievers and high achievers within the group is similar.
4.5.1 Band distribution of Mathematics achievement by Gender Table 40 Band distribution in mathematics by gender
Grade Gender Band 1 Band 2 Band 3 Band 4 Band 5
Male 19% 39% 21% 15% 6%
Female 32% 37% 15% 11% 5%
Male 5% 26% 28% 26% 15%
Female 12% 36% 23% 19% 10%
Grade 6
Grade 8
Six per cent of Grade 6 and 15 per cent of Grade 8 boys performed at Band 5 while 5 per cent of
Grade 6 and 10 per cent of Grade 8 girls performed at Band 5. A high percentage, 19 and 32 per cent
of boys and girls respectively, performed at Band 1 in Grade 6.
4.5.2 Trend in Grade 8 Mathematics achievement between years by Gender Table 41 Trend in mathematics a achievement between years
Gender Year 2012 Year 2013 Effect Size
Number of Students
Mean Std. Deviation
Number of Students
Mean Std. Deviation
Male 4154 302.9 24.1 3668 303.3 25.2 0.01 Female 4124 297.1 25.5 3517 294.4 26.1 0.11 Total 8278 300.0 25.0 7185 298.9 26.0 0.04
Table 42 Trend in mathematics band distribution between years by Gender
Year Gender Band 1 Band 2 Band 3 Band 4 Band 5
Yr2012 Male 5% 28% 26% 25% 16%
Yr 2013 Male 5% 26% 28% 26% 15%
Yr 2012 Female 10% 35% 22% 21% 13%
Yr 2013 Female 12% 36% 23% 19% 10%
Between 2012 and 2013, there is no change in mathematics performance is observed for
boys and a small change in mathematics performance is observed for girls.
The distribution of both boys and girls are similar during 2012 and 2013.
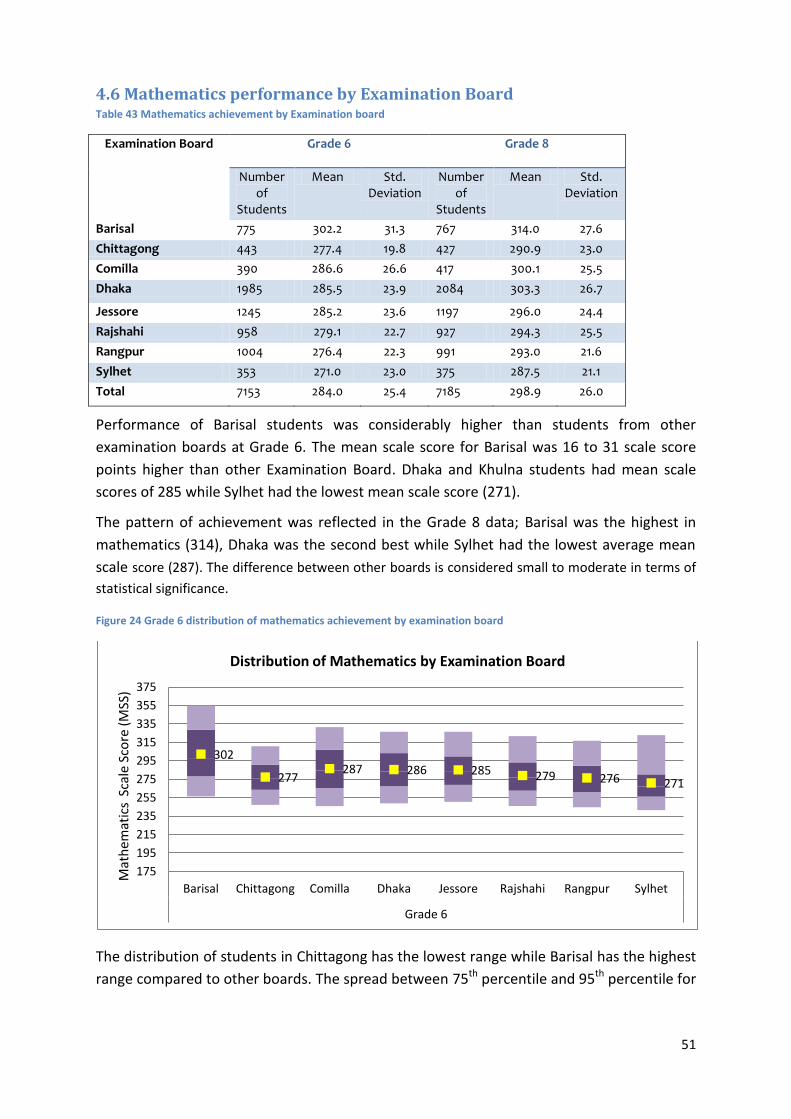
51
4.6 Mathematics performance by Examination Board Table 43 Mathematics achievement by Examination board
Examination Board Grade 6 Grade 8
Number of
Students
Mean Std. Deviation
Number of
Students
Mean Std. Deviation
Barisal 775 302.2 31.3 767 314.0 27.6
Chittagong 443 277.4 19.8 427 290.9 23.0
Comilla 390 286.6 26.6 417 300.1 25.5
Dhaka 1985 285.5 23.9 2084 303.3 26.7
Jessore 1245 285.2 23.6 1197 296.0 24.4
Rajshahi 958 279.1 22.7 927 294.3 25.5
Rangpur 1004 276.4 22.3 991 293.0 21.6
Sylhet 353 271.0 23.0 375 287.5 21.1
Total 7153 284.0 25.4 7185 298.9 26.0
Performance of Barisal students was considerably higher than students from other
examination boards at Grade 6. The mean scale score for Barisal was 16 to 31 scale score
points higher than other Examination Board. Dhaka and Khulna students had mean scale
scores of 285 while Sylhet had the lowest mean scale score (271).
The pattern of achievement was reflected in the Grade 8 data; Barisal was the highest in
mathematics (314), Dhaka was the second best while Sylhet had the lowest average mean
scale score (287). The difference between other boards is considered small to moderate in terms of
statistical significance.
Figure 24 Grade 6 distribution of mathematics achievement by examination board
The distribution of students in Chittagong has the lowest range while Barisal has the highest
range compared to other boards. The spread between 75th percentile and 95th percentile for
302
277 287 286 285 279 276 271
175
195
215
235
255
275
295
315
335
355
375
Barisal Chittagong Comilla Dhaka Jessore Rajshahi Rangpur Sylhet
Grade 6
Mat
hem
atic
s S
cale
Sco
re (
MSS
)
Distribution of Mathematics by Examination Board

52
Syhlet is very high as compared to others. In Shylhet examination board 25 per cent
students scored at or less than 255 score points however in Barisal just 5 per cent students
score at or less than 255 score point.
Figure 25 Grade 8 distribution of mathematics achievement by examination board
Rangpur and Shylet have the lowest range of distribution while Dhaka has the highest range
of distribution in Grade 8. In Chittagong, Rajshahi and Sylhet examination board near 25 per
cent students scored at or less than 275 scale score point however, in Barisal examination
board just little over 5 per cent students score at or less than 275 score point.
4.6.1 Band distribution of Mathematics achievement by Examination Board Table 44 Band distribution of mathematics by Examination board
Grade Examination Board Band 1 Band 2 Band 3 Band 4 Band 5
Barisal 12% 31% 16% 17% 24%
Chittagong 31% 43% 20% 5% 1%
Comilla 26% 30% 19% 20% 5%
Dhaka 22% 36% 21% 17% 3%
Jessore 20% 42% 20% 13% 4%
Rajshahi 31% 40% 17% 10% 2%
Rangpur 35% 41% 16% 6% 3%
Sylhet 47% 38% 7% 5% 3%
Barisal 3% 18% 21% 27% 31%
Chittagong 12% 42% 23% 17% 6%
Comilla 7% 32% 24% 26% 11%
Dhaka 7% 26% 25% 26% 16%
Jessore 9% 33% 28% 21% 8%
Rajshahi 12% 36% 25% 17% 11%
Rangpur 10% 35% 30% 21% 5%
Sylhet 15% 42% 24% 16% 3%
Grade 6
Grade 8
314
291 300 303
296 294 293 288
175
195
215
235
255
275
295
315
335
355
375
Barisal Chittagong Comilla Dhaka Jessore Rajshahi Rangpur Sylhet
Grade 8
Mat
hem
atic
s S
cale
Sco
re (
MSS
)
Distribution of Mathematics by Examination Board
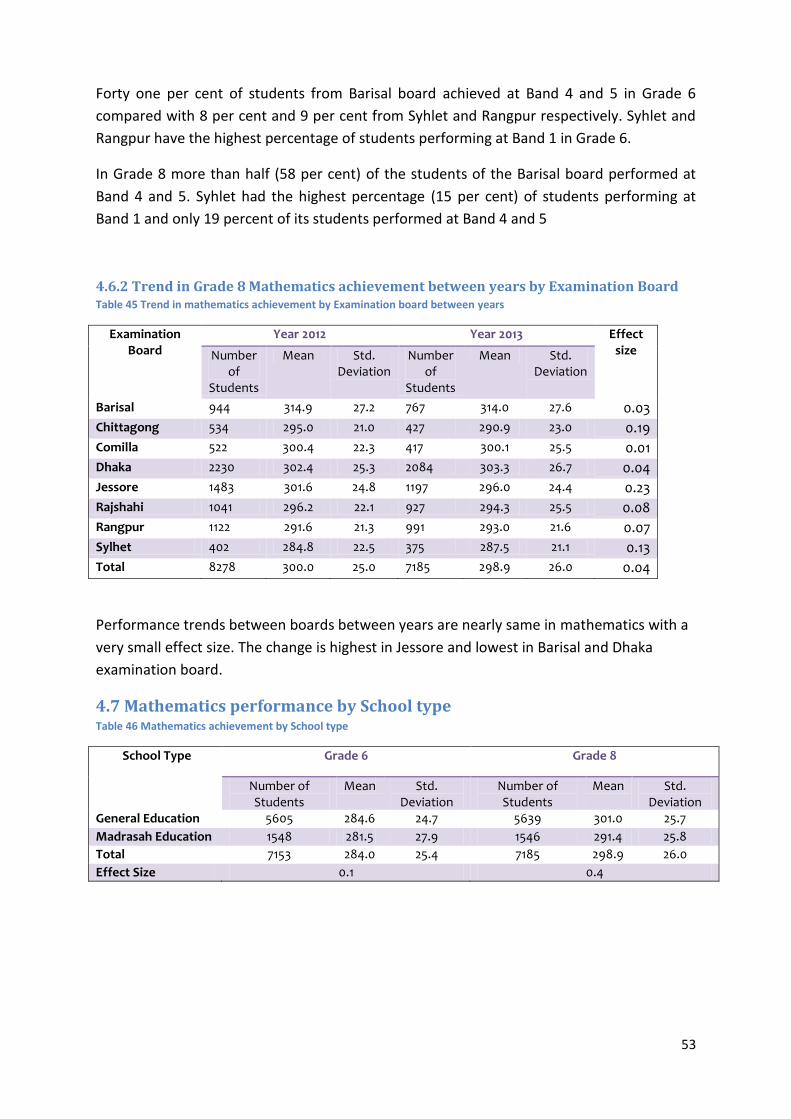
53
Forty one per cent of students from Barisal board achieved at Band 4 and 5 in Grade 6
compared with 8 per cent and 9 per cent from Syhlet and Rangpur respectively. Syhlet and
Rangpur have the highest percentage of students performing at Band 1 in Grade 6.
In Grade 8 more than half (58 per cent) of the students of the Barisal board performed at
Band 4 and 5. Syhlet had the highest percentage (15 per cent) of students performing at
Band 1 and only 19 percent of its students performed at Band 4 and 5
4.6.2 Trend in Grade 8 Mathematics achievement between years by Examination Board Table 45 Trend in mathematics achievement by Examination board between years
Examination Board
Year 2012 Year 2013 Effect size Number
of Students
Mean Std. Deviation
Number of
Students
Mean Std. Deviation
Barisal 944 314.9 27.2 767 314.0 27.6 0.03
Chittagong 534 295.0 21.0 427 290.9 23.0 0.19
Comilla 522 300.4 22.3 417 300.1 25.5 0.01
Dhaka 2230 302.4 25.3 2084 303.3 26.7 0.04
Jessore 1483 301.6 24.8 1197 296.0 24.4 0.23
Rajshahi 1041 296.2 22.1 927 294.3 25.5 0.08
Rangpur 1122 291.6 21.3 991 293.0 21.6 0.07
Sylhet 402 284.8 22.5 375 287.5 21.1 0.13
Total 8278 300.0 25.0 7185 298.9 26.0 0.04
Performance trends between boards between years are nearly same in mathematics with a
very small effect size. The change is highest in Jessore and lowest in Barisal and Dhaka
examination board.
4.7 Mathematics performance by School type Table 46 Mathematics achievement by School type
School Type Grade 6 Grade 8
Number of Students
Mean Std. Deviation
Number of Students
Mean Std. Deviation
General Education 5605 284.6 24.7 5639 301.0 25.7
Madrasah Education 1548 281.5 27.9 1546 291.4 25.8
Total 7153 284.0 25.4 7185 298.9 26.0
Effect Size 0.1 0.4
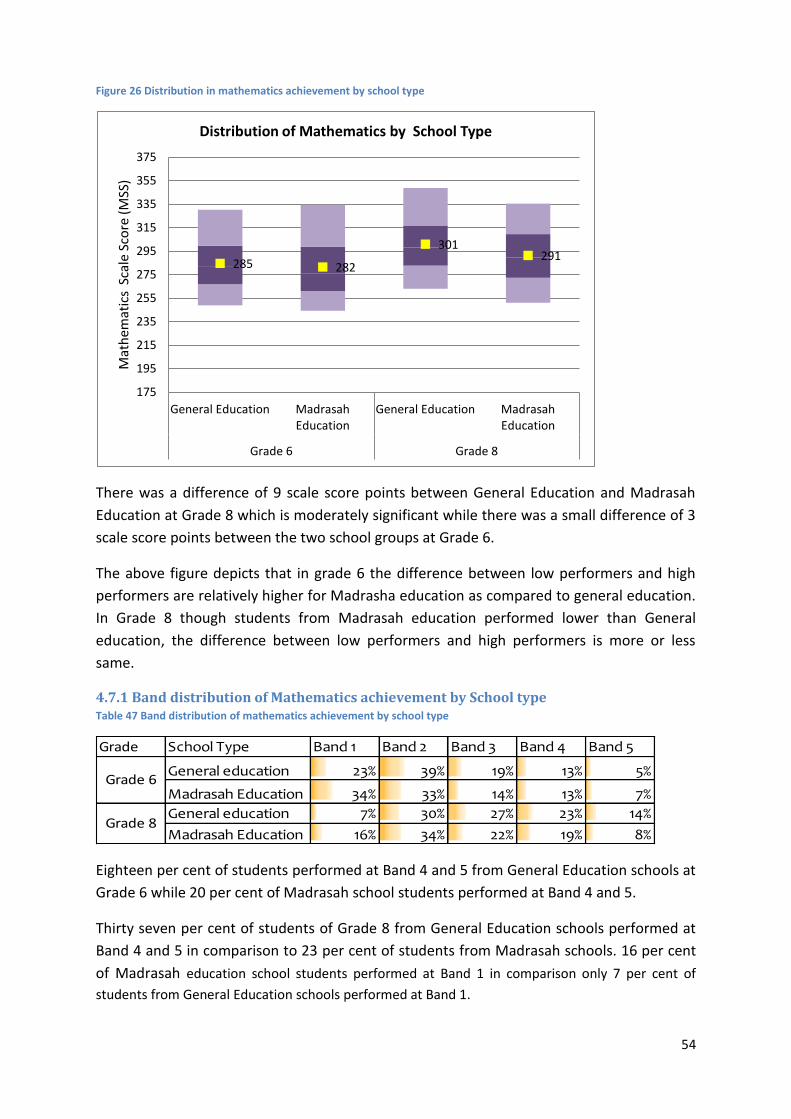
54
Figure 26 Distribution in mathematics achievement by school type
There was a difference of 9 scale score points between General Education and Madrasah
Education at Grade 8 which is moderately significant while there was a small difference of 3
scale score points between the two school groups at Grade 6.
The above figure depicts that in grade 6 the difference between low performers and high
performers are relatively higher for Madrasha education as compared to general education.
In Grade 8 though students from Madrasah education performed lower than General
education, the difference between low performers and high performers is more or less
same.
4.7.1 Band distribution of Mathematics achievement by School type Table 47 Band distribution of mathematics achievement by school type
Grade School Type Band 1 Band 2 Band 3 Band 4 Band 5
General education 23% 39% 19% 13% 5%
Madrasah Education 34% 33% 14% 13% 7%
General education 7% 30% 27% 23% 14%
Madrasah Education 16% 34% 22% 19% 8%
Grade 6
Grade 8
Eighteen per cent of students performed at Band 4 and 5 from General Education schools at
Grade 6 while 20 per cent of Madrasah school students performed at Band 4 and 5.
Thirty seven per cent of students of Grade 8 from General Education schools performed at
Band 4 and 5 in comparison to 23 per cent of students from Madrasah schools. 16 per cent
of Madrasah education school students performed at Band 1 in comparison only 7 per cent of
students from General Education schools performed at Band 1.
285 282
301 291
175
195
215
235
255
275
295
315
335
355
375
General Education Madrasah Education
General Education Madrasah Education
Grade 6 Grade 8
Mat
hem
atic
s S
cale
Sco
re (
MSS
) Distribution of Mathematics by School Type
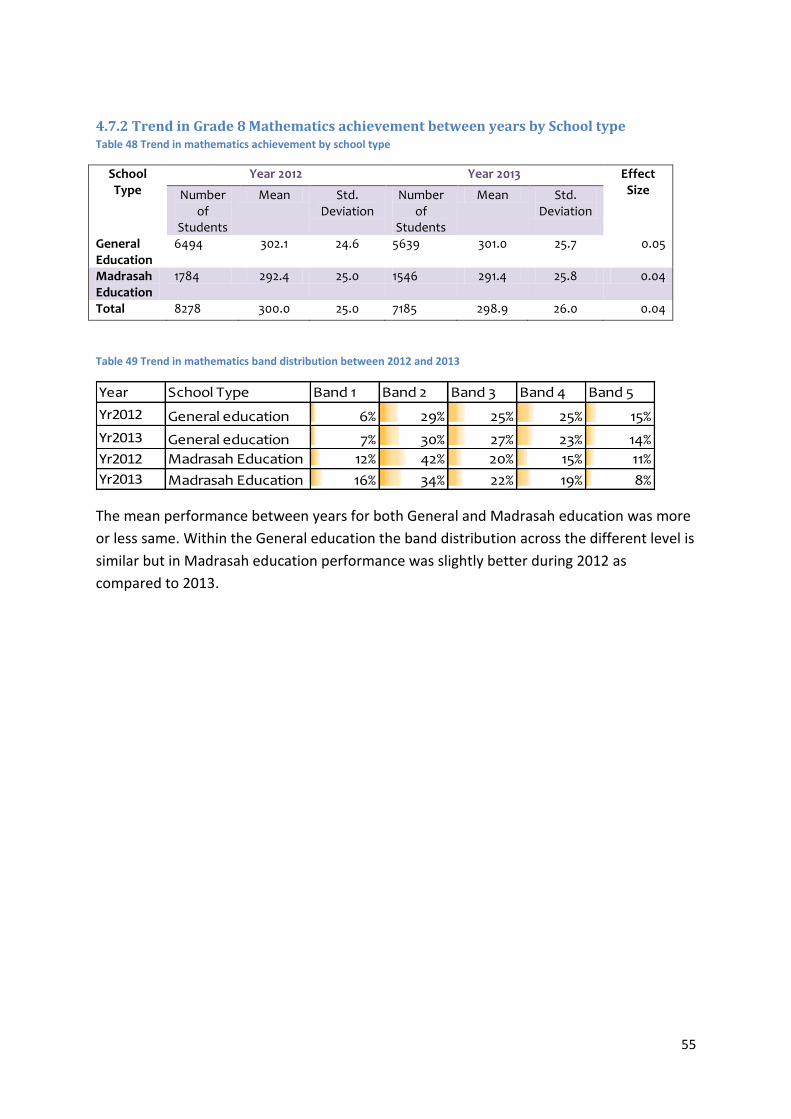
55
4.7.2 Trend in Grade 8 Mathematics achievement between years by School type Table 48 Trend in mathematics achievement by school type
School Type
Year 2012 Year 2013 Effect Size Number
of Students
Mean Std. Deviation
Number of
Students
Mean Std. Deviation
General Education
6494 302.1 24.6 5639 301.0 25.7 0.05
Madrasah Education
1784 292.4 25.0 1546 291.4 25.8 0.04
Total 8278 300.0 25.0 7185 298.9 26.0 0.04
Table 49 Trend in mathematics band distribution between 2012 and 2013
Year School Type Band 1 Band 2 Band 3 Band 4 Band 5
Yr2012 General education 6% 29% 25% 25% 15%
Yr2013 General education 7% 30% 27% 23% 14%
Yr2012 Madrasah Education 12% 42% 20% 15% 11%
Yr2013 Madrasah Education 16% 34% 22% 19% 8%
The mean performance between years for both General and Madrasah education was more
or less same. Within the General education the band distribution across the different level is
similar but in Madrasah education performance was slightly better during 2012 as
compared to 2013.
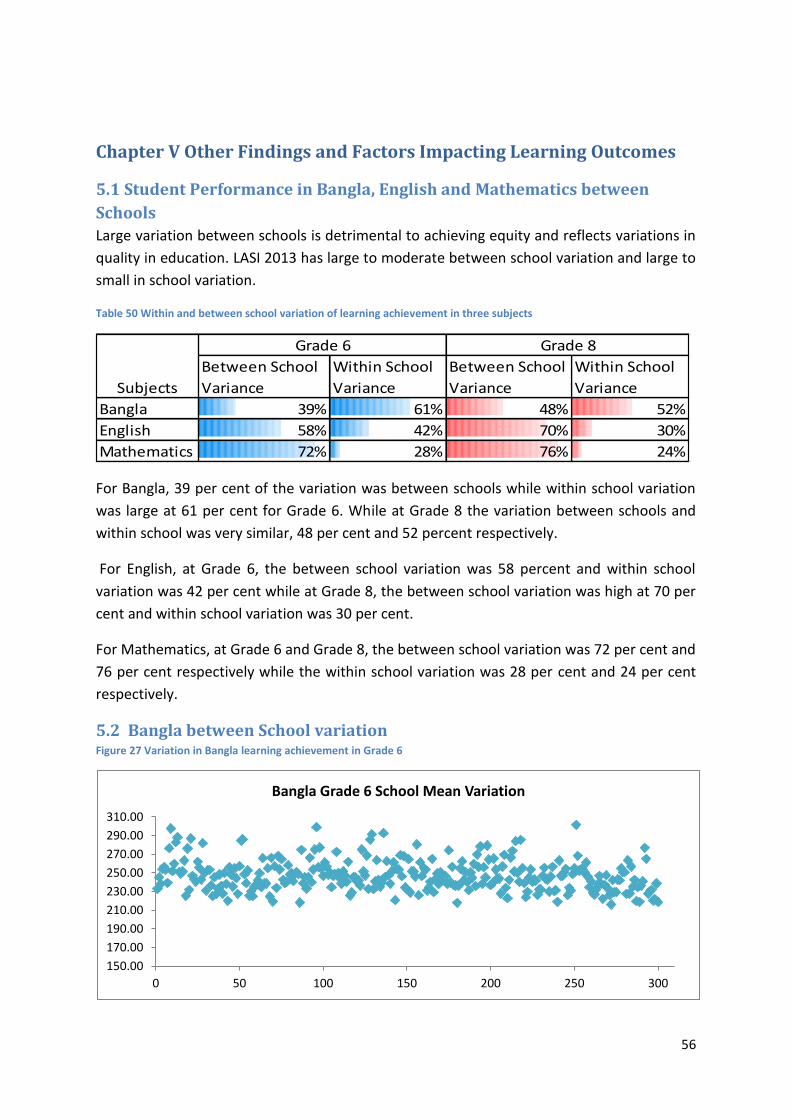
56
Chapter V Other Findings and Factors Impacting Learning Outcomes
5.1 Student Performance in Bangla, English and Mathematics between
Schools
Large variation between schools is detrimental to achieving equity and reflects variations in
quality in education. LASI 2013 has large to moderate between school variation and large to
small in school variation.
Table 50 Within and between school variation of learning achievement in three subjects
Between School
Variance
Within School
Variance
Between School
Variance
Within School
Variance
Bangla 39% 61% 48% 52%
English 58% 42% 70% 30%
Mathematics 72% 28% 76% 24%
Grade 6 Grade 8
Subjects
For Bangla, 39 per cent of the variation was between schools while within school variation
was large at 61 per cent for Grade 6. While at Grade 8 the variation between schools and
within school was very similar, 48 per cent and 52 percent respectively.
For English, at Grade 6, the between school variation was 58 percent and within school
variation was 42 per cent while at Grade 8, the between school variation was high at 70 per
cent and within school variation was 30 per cent.
For Mathematics, at Grade 6 and Grade 8, the between school variation was 72 per cent and
76 per cent respectively while the within school variation was 28 per cent and 24 per cent
respectively.
5.2 Bangla between School variation Figure 27 Variation in Bangla learning achievement in Grade 6
150.00
170.00
190.00
210.00
230.00
250.00
270.00
290.00
310.00
0 50 100 150 200 250 300
Bangla Grade 6 School Mean Variation
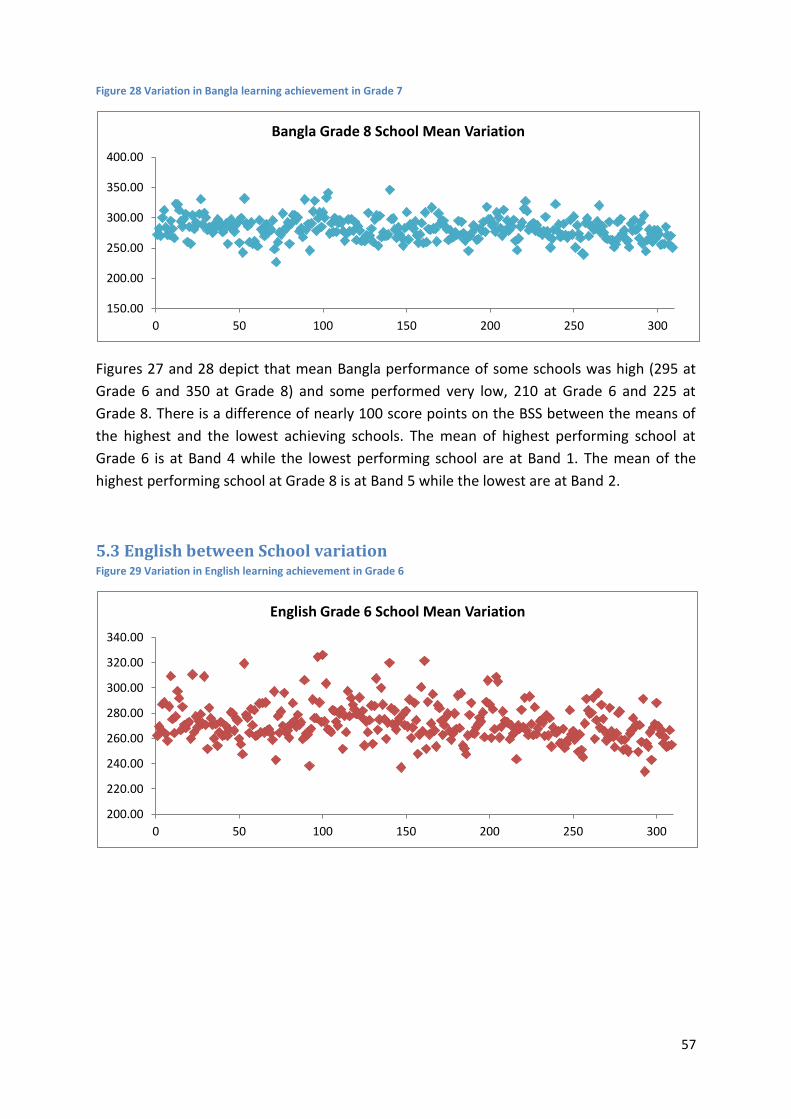
57
Figure 28 Variation in Bangla learning achievement in Grade 7
Figures 27 and 28 depict that mean Bangla performance of some schools was high (295 at
Grade 6 and 350 at Grade 8) and some performed very low, 210 at Grade 6 and 225 at
Grade 8. There is a difference of nearly 100 score points on the BSS between the means of
the highest and the lowest achieving schools. The mean of highest performing school at
Grade 6 is at Band 4 while the lowest performing school are at Band 1. The mean of the
highest performing school at Grade 8 is at Band 5 while the lowest are at Band 2.
5.3 English between School variation Figure 29 Variation in English learning achievement in Grade 6
150.00
200.00
250.00
300.00
350.00
400.00
0 50 100 150 200 250 300
Bangla Grade 8 School Mean Variation
200.00
220.00
240.00
260.00
280.00
300.00
320.00
340.00
0 50 100 150 200 250 300
English Grade 6 School Mean Variation
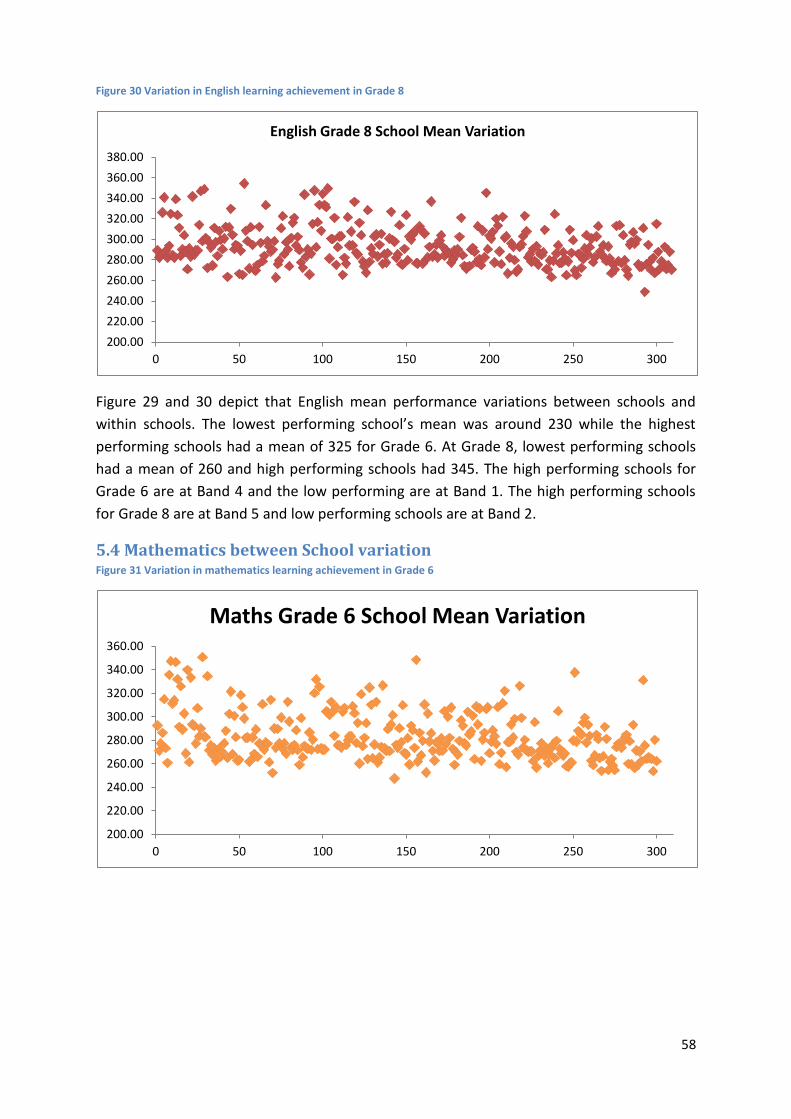
58
Figure 30 Variation in English learning achievement in Grade 8
Figure 29 and 30 depict that English mean performance variations between schools and
within schools. The lowest performing school’s mean was around 230 while the highest
performing schools had a mean of 325 for Grade 6. At Grade 8, lowest performing schools
had a mean of 260 and high performing schools had 345. The high performing schools for
Grade 6 are at Band 4 and the low performing are at Band 1. The high performing schools
for Grade 8 are at Band 5 and low performing schools are at Band 2.
5.4 Mathematics between School variation Figure 31 Variation in mathematics learning achievement in Grade 6
200.00
220.00
240.00
260.00
280.00
300.00
320.00
340.00
360.00
380.00
0 50 100 150 200 250 300
English Grade 8 School Mean Variation
200.00
220.00
240.00
260.00
280.00
300.00
320.00
340.00
360.00
0 50 100 150 200 250 300
Maths Grade 6 School Mean Variation
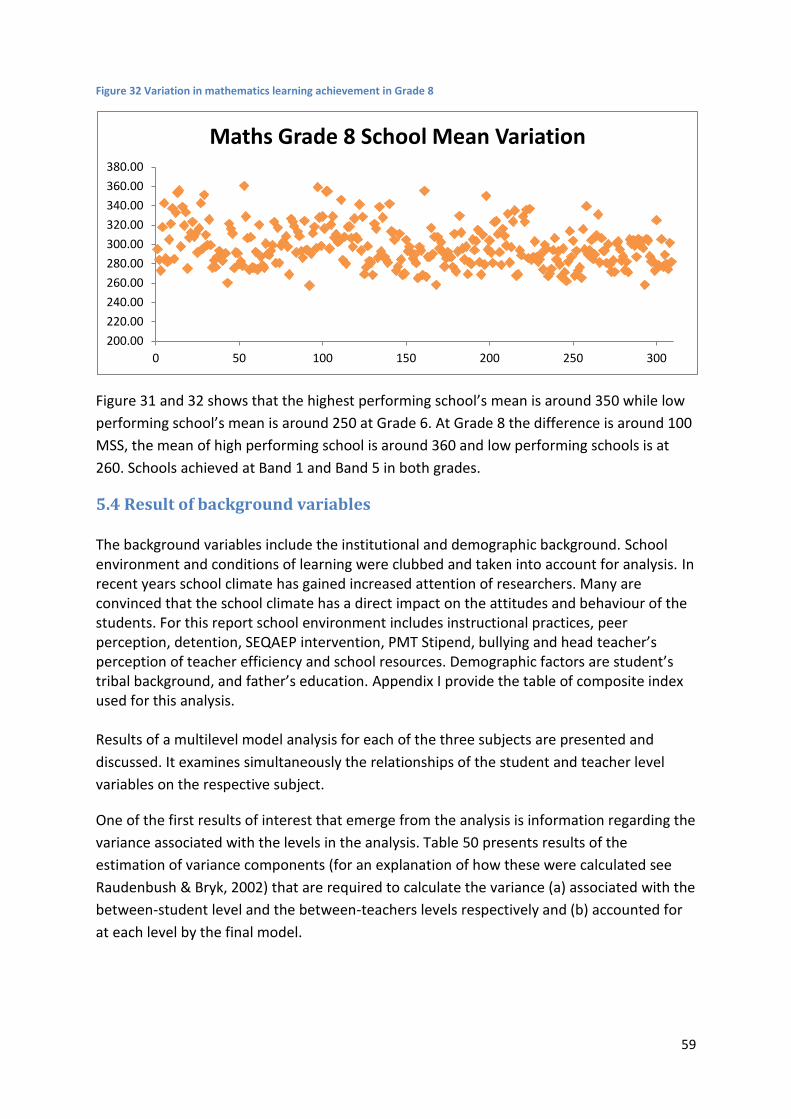
59
Figure 32 Variation in mathematics learning achievement in Grade 8
Figure 31 and 32 shows that the highest performing school’s mean is around 350 while low
performing school’s mean is around 250 at Grade 6. At Grade 8 the difference is around 100
MSS, the mean of high performing school is around 360 and low performing schools is at
260. Schools achieved at Band 1 and Band 5 in both grades.
5.4 Result of background variables
The background variables include the institutional and demographic background. School environment and conditions of learning were clubbed and taken into account for analysis. In recent years school climate has gained increased attention of researchers. Many are convinced that the school climate has a direct impact on the attitudes and behaviour of the students. For this report school environment includes instructional practices, peer perception, detention, SEQAEP intervention, PMT Stipend, bullying and head teacher’s perception of teacher efficiency and school resources. Demographic factors are student’s tribal background, and father’s education. Appendix I provide the table of composite index used for this analysis. Results of a multilevel model analysis for each of the three subjects are presented and
discussed. It examines simultaneously the relationships of the student and teacher level
variables on the respective subject.
One of the first results of interest that emerge from the analysis is information regarding the
variance associated with the levels in the analysis. Table 50 presents results of the
estimation of variance components (for an explanation of how these were calculated see
Raudenbush & Bryk, 2002) that are required to calculate the variance (a) associated with the
between-student level and the between-teachers levels respectively and (b) accounted for
at each level by the final model.
200.00
220.00
240.00
260.00
280.00
300.00
320.00
340.00
360.00
380.00
0 50 100 150 200 250 300
Maths Grade 8 School Mean Variation
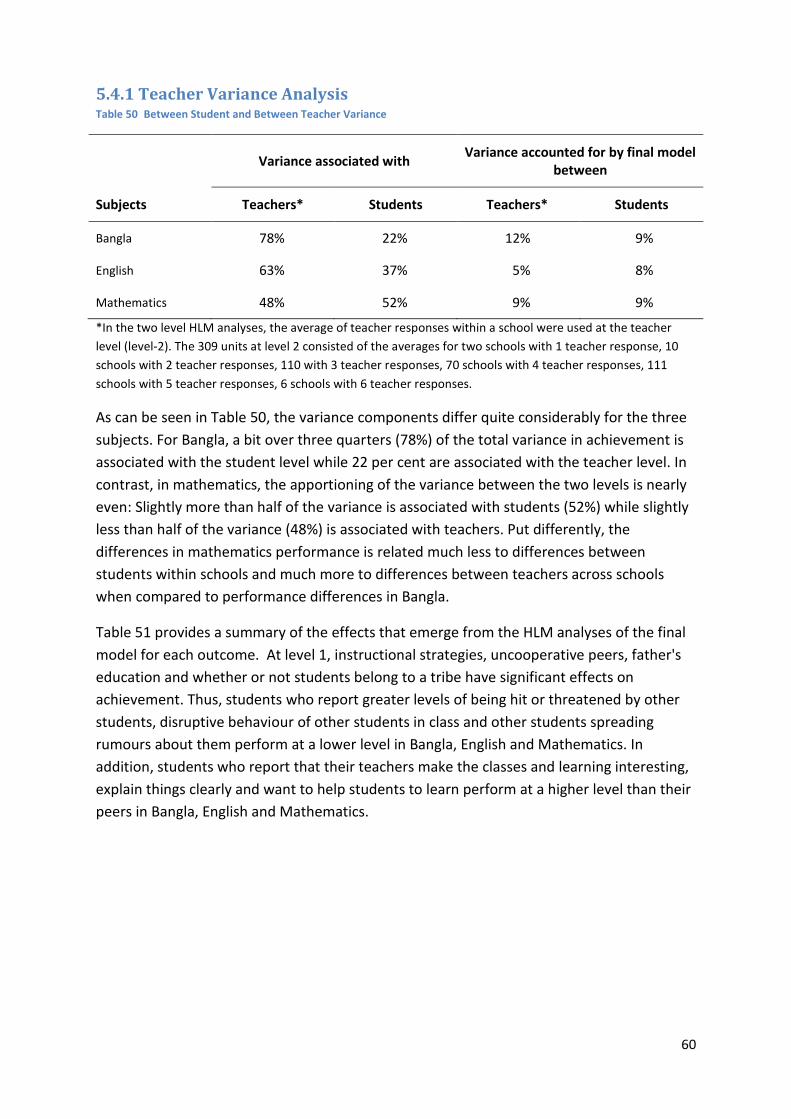
60
5.4.1 Teacher Variance Analysis Table 50 Between Student and Between Teacher Variance
Variance associated with
Variance accounted for by final model between
Subjects Teachers* Students Teachers* Students
Bangla 78% 22% 12% 9%
English 63% 37% 5% 8%
Mathematics 48% 52% 9% 9%
*In the two level HLM analyses, the average of teacher responses within a school were used at the teacher
level (level-2). The 309 units at level 2 consisted of the averages for two schools with 1 teacher response, 10
schools with 2 teacher responses, 110 with 3 teacher responses, 70 schools with 4 teacher responses, 111
schools with 5 teacher responses, 6 schools with 6 teacher responses.
As can be seen in Table 50, the variance components differ quite considerably for the three
subjects. For Bangla, a bit over three quarters (78%) of the total variance in achievement is
associated with the student level while 22 per cent are associated with the teacher level. In
contrast, in mathematics, the apportioning of the variance between the two levels is nearly
even: Slightly more than half of the variance is associated with students (52%) while slightly
less than half of the variance (48%) is associated with teachers. Put differently, the
differences in mathematics performance is related much less to differences between
students within schools and much more to differences between teachers across schools
when compared to performance differences in Bangla.
Table 51 provides a summary of the effects that emerge from the HLM analyses of the final
model for each outcome. At level 1, instructional strategies, uncooperative peers, father's
education and whether or not students belong to a tribe have significant effects on
achievement. Thus, students who report greater levels of being hit or threatened by other
students, disruptive behaviour of other students in class and other students spreading
rumours about them perform at a lower level in Bangla, English and Mathematics. In
addition, students who report that their teachers make the classes and learning interesting,
explain things clearly and want to help students to learn perform at a higher level than their
peers in Bangla, English and Mathematics.
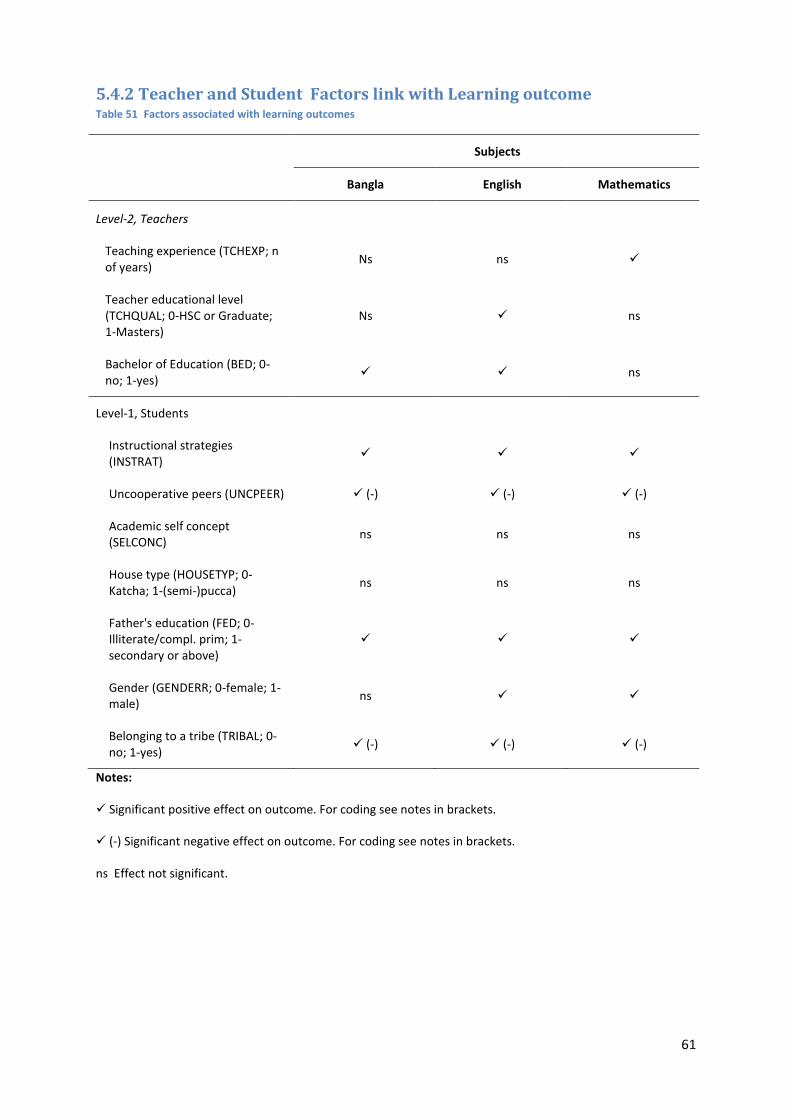
61
5.4.2 Teacher and Student Factors link with Learning outcome Table 51 Factors associated with learning outcomes
Subjects
Bangla English Mathematics
Level-2, Teachers
Teaching experience (TCHEXP; n of years)
Ns ns
Teacher educational level (TCHQUAL; 0-HSC or Graduate; 1-Masters)
Ns ns
Bachelor of Education (BED; 0-no; 1-yes)
ns
Level-1, Students
Instructional strategies (INSTRAT)
Uncooperative peers (UNCPEER) (-) (-) (-)
Academic self concept (SELCONC)
ns ns ns
House type (HOUSETYP; 0-Katcha; 1-(semi-)pucca)
ns ns ns
Father's education (FED; 0-Illiterate/compl. prim; 1-secondary or above)
Gender (GENDERR; 0-female; 1-male)
ns
Belonging to a tribe (TRIBAL; 0-no; 1-yes)
(-) (-) (-)
Notes:
Significant positive effect on outcome. For coding see notes in brackets.
(-) Significant negative effect on outcome. For coding see notes in brackets.
ns Effect not significant.
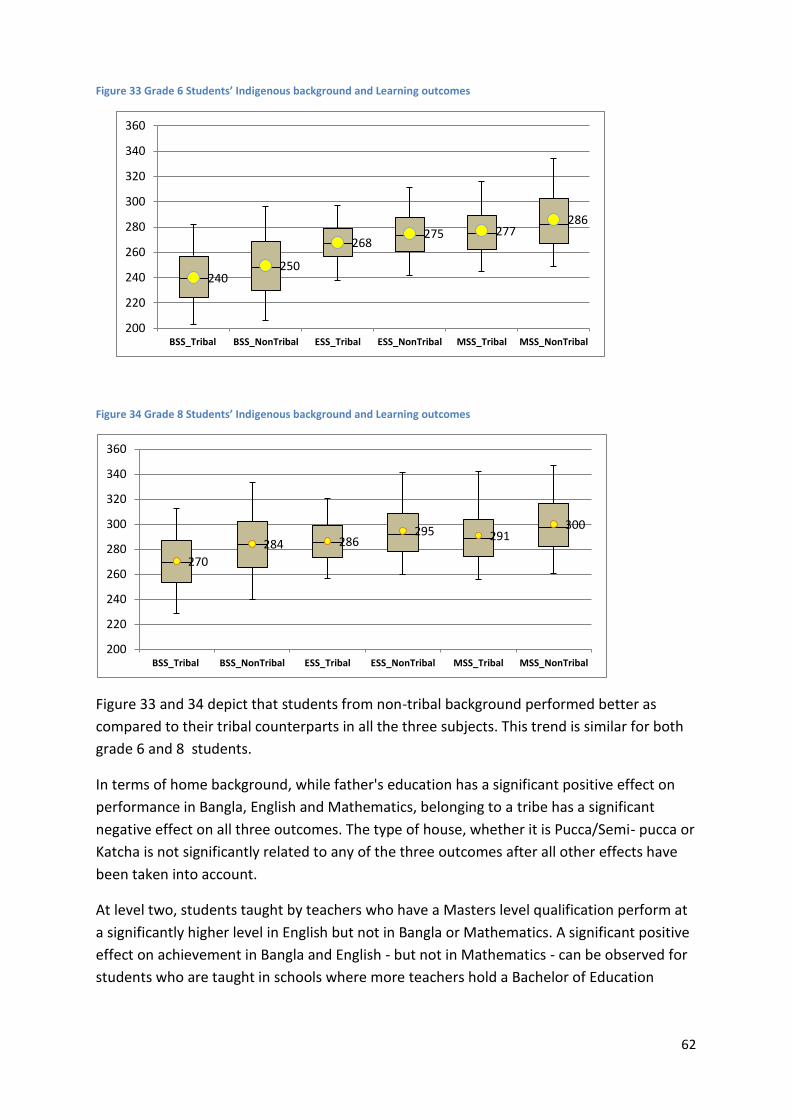
62
Figure 33 Grade 6 Students’ Indigenous background and Learning outcomes
Figure 34 Grade 8 Students’ Indigenous background and Learning outcomes
Figure 33 and 34 depict that students from non-tribal background performed better as
compared to their tribal counterparts in all the three subjects. This trend is similar for both
grade 6 and 8 students.
In terms of home background, while father's education has a significant positive effect on
performance in Bangla, English and Mathematics, belonging to a tribe has a significant
negative effect on all three outcomes. The type of house, whether it is Pucca/Semi- pucca or
Katcha is not significantly related to any of the three outcomes after all other effects have
been taken into account.
At level two, students taught by teachers who have a Masters level qualification perform at
a significantly higher level in English but not in Bangla or Mathematics. A significant positive
effect on achievement in Bangla and English - but not in Mathematics - can be observed for
students who are taught in schools where more teachers hold a Bachelor of Education
240 250
268 275 277
286
200
220
240
260
280
300
320
340
360
BSS_Tribal BSS_NonTribal ESS_Tribal ESS_NonTribal MSS_Tribal MSS_NonTribal
270
284 286 295 291
300
200
220
240
260
280
300
320
340
360
BSS_Tribal BSS_NonTribal ESS_Tribal ESS_NonTribal MSS_Tribal MSS_NonTribal
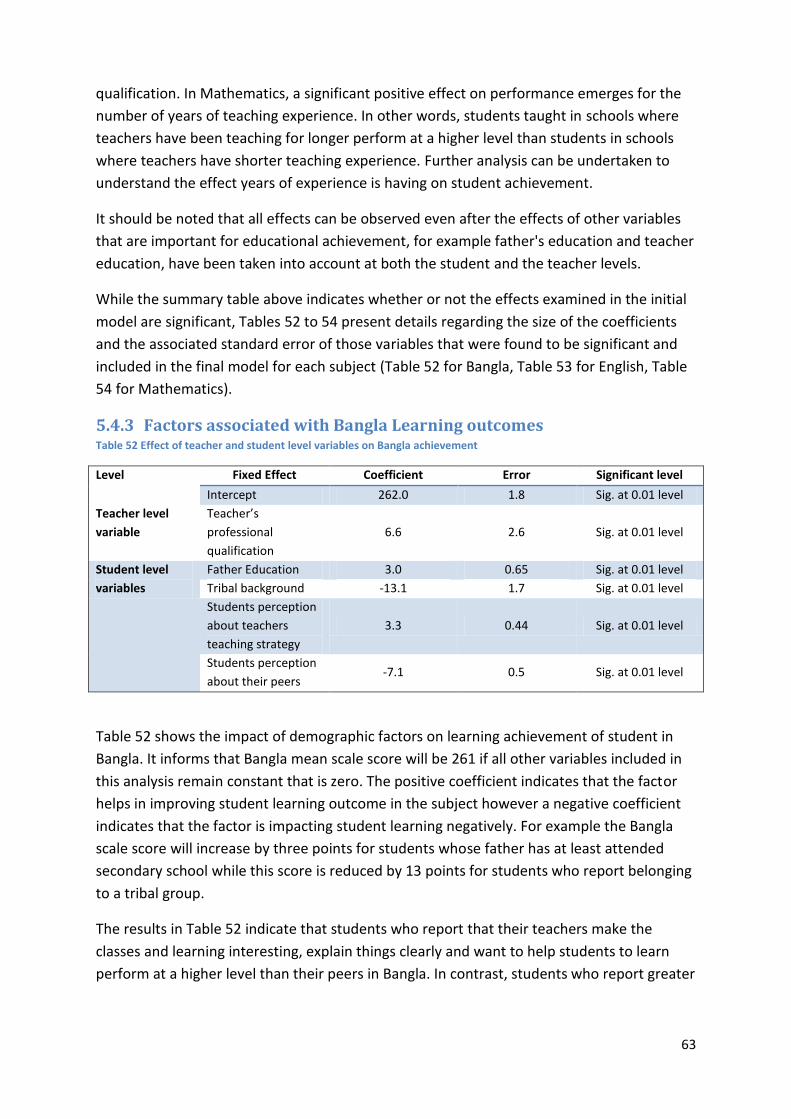
63
qualification. In Mathematics, a significant positive effect on performance emerges for the
number of years of teaching experience. In other words, students taught in schools where
teachers have been teaching for longer perform at a higher level than students in schools
where teachers have shorter teaching experience. Further analysis can be undertaken to
understand the effect years of experience is having on student achievement.
It should be noted that all effects can be observed even after the effects of other variables
that are important for educational achievement, for example father's education and teacher
education, have been taken into account at both the student and the teacher levels.
While the summary table above indicates whether or not the effects examined in the initial
model are significant, Tables 52 to 54 present details regarding the size of the coefficients
and the associated standard error of those variables that were found to be significant and
included in the final model for each subject (Table 52 for Bangla, Table 53 for English, Table
54 for Mathematics).
5.4.3 Factors associated with Bangla Learning outcomes Table 52 Effect of teacher and student level variables on Bangla achievement
Level Fixed Effect Coefficient Error Significant level
Intercept 262.0 1.8 Sig. at 0.01 level
Teacher level
variable
Teacher’s
professional
qualification
6.6 2.6 Sig. at 0.01 level
Student level
variables
Father Education 3.0 0.65 Sig. at 0.01 level
Tribal background -13.1 1.7 Sig. at 0.01 level
Students perception
about teachers
teaching strategy
3.3 0.44 Sig. at 0.01 level
Students perception
about their peers -7.1 0.5 Sig. at 0.01 level
Table 52 shows the impact of demographic factors on learning achievement of student in
Bangla. It informs that Bangla mean scale score will be 261 if all other variables included in
this analysis remain constant that is zero. The positive coefficient indicates that the factor
helps in improving student learning outcome in the subject however a negative coefficient
indicates that the factor is impacting student learning negatively. For example the Bangla
scale score will increase by three points for students whose father has at least attended
secondary school while this score is reduced by 13 points for students who report belonging
to a tribal group.
The results in Table 52 indicate that students who report that their teachers make the
classes and learning interesting, explain things clearly and want to help students to learn
perform at a higher level than their peers in Bangla. In contrast, students who report greater
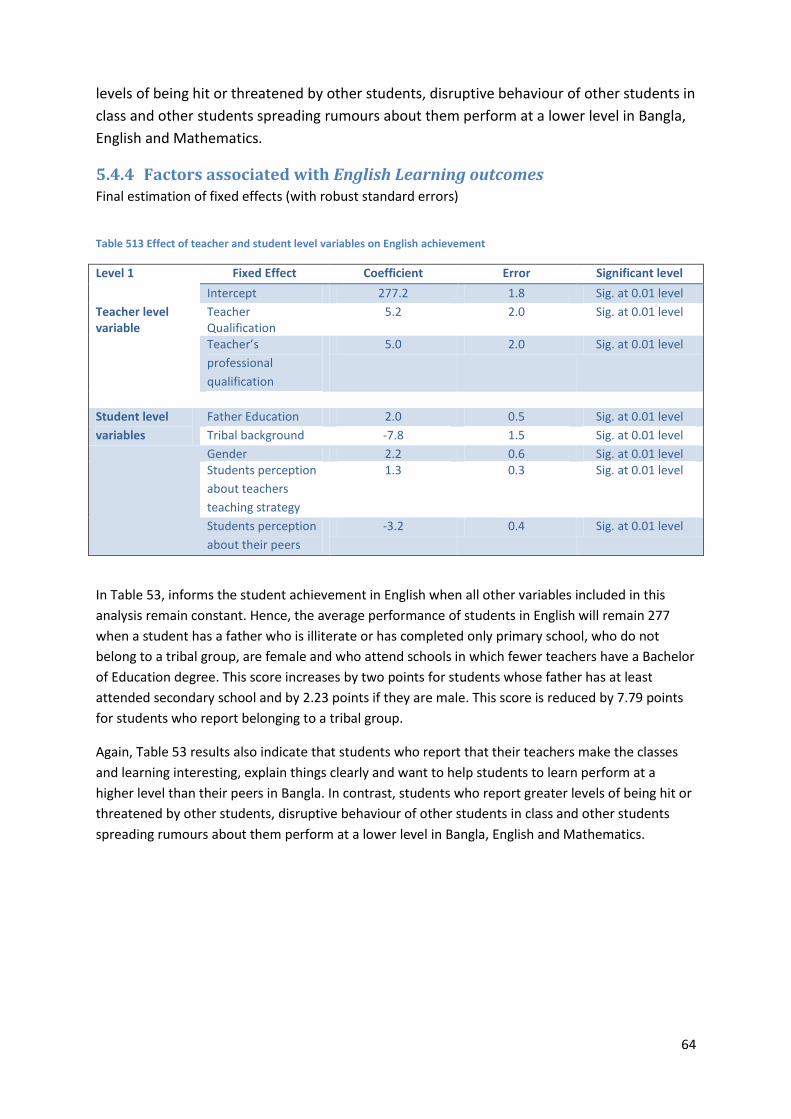
64
levels of being hit or threatened by other students, disruptive behaviour of other students in
class and other students spreading rumours about them perform at a lower level in Bangla,
English and Mathematics.
5.4.4 Factors associated with English Learning outcomes Final estimation of fixed effects (with robust standard errors)
Table 513 Effect of teacher and student level variables on English achievement
Level 1 Fixed Effect Coefficient Error Significant level
Intercept 277.2 1.8 Sig. at 0.01 level
Teacher level variable
Teacher Qualification
5.2 2.0 Sig. at 0.01 level
Teacher’s
professional
qualification
5.0 2.0 Sig. at 0.01 level
Student level
variables
Father Education 2.0 0.5 Sig. at 0.01 level
Tribal background -7.8 1.5 Sig. at 0.01 level
Gender 2.2 0.6 Sig. at 0.01 level Students perception
about teachers
teaching strategy
1.3 0.3 Sig. at 0.01 level
Students perception
about their peers
-3.2 0.4 Sig. at 0.01 level
In Table 53, informs the student achievement in English when all other variables included in this
analysis remain constant. Hence, the average performance of students in English will remain 277
when a student has a father who is illiterate or has completed only primary school, who do not
belong to a tribal group, are female and who attend schools in which fewer teachers have a Bachelor
of Education degree. This score increases by two points for students whose father has at least
attended secondary school and by 2.23 points if they are male. This score is reduced by 7.79 points
for students who report belonging to a tribal group.
Again, Table 53 results also indicate that students who report that their teachers make the classes
and learning interesting, explain things clearly and want to help students to learn perform at a
higher level than their peers in Bangla. In contrast, students who report greater levels of being hit or
threatened by other students, disruptive behaviour of other students in class and other students
spreading rumours about them perform at a lower level in Bangla, English and Mathematics.
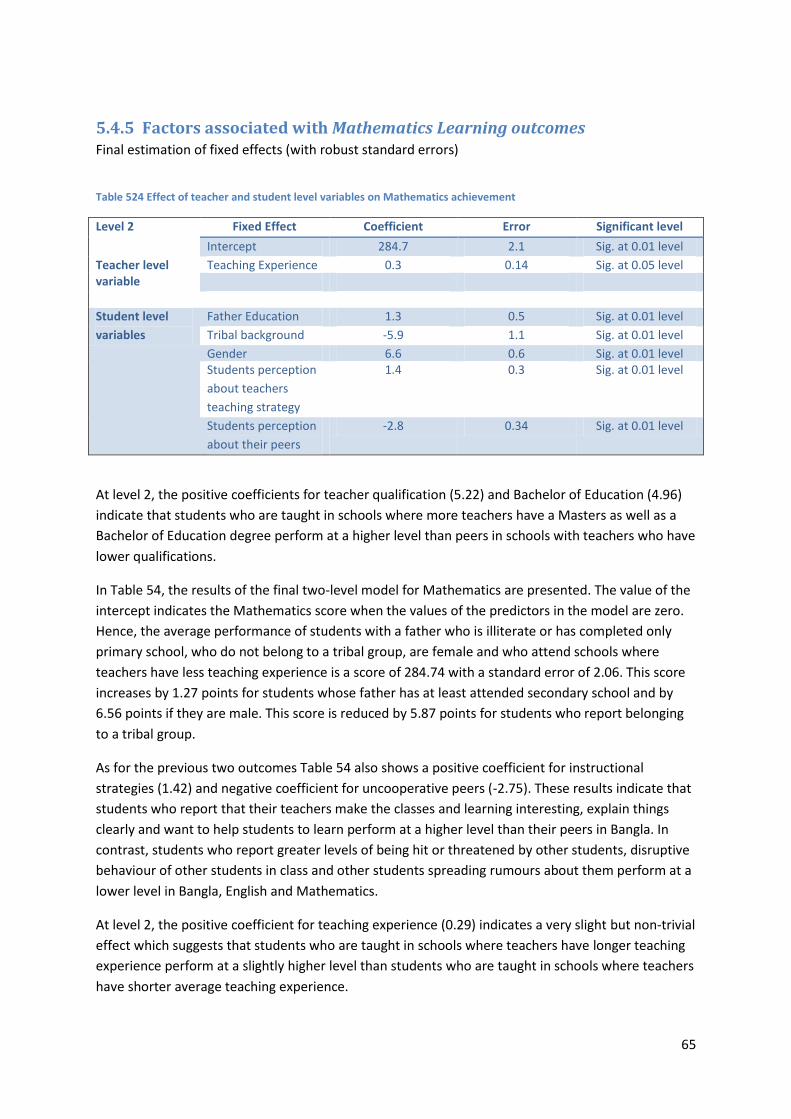
65
5.4.5 Factors associated with Mathematics Learning outcomes Final estimation of fixed effects (with robust standard errors)
Table 524 Effect of teacher and student level variables on Mathematics achievement
Level 2 Fixed Effect Coefficient Error Significant level
Intercept 284.7 2.1 Sig. at 0.01 level
Teacher level variable
Teaching Experience 0.3 0.14 Sig. at 0.05 level
Student level
variables
Father Education 1.3 0.5 Sig. at 0.01 level
Tribal background -5.9 1.1 Sig. at 0.01 level
Gender 6.6 0.6 Sig. at 0.01 level Students perception
about teachers
teaching strategy
1.4 0.3 Sig. at 0.01 level
Students perception
about their peers
-2.8 0.34 Sig. at 0.01 level
At level 2, the positive coefficients for teacher qualification (5.22) and Bachelor of Education (4.96)
indicate that students who are taught in schools where more teachers have a Masters as well as a
Bachelor of Education degree perform at a higher level than peers in schools with teachers who have
lower qualifications.
In Table 54, the results of the final two-level model for Mathematics are presented. The value of the
intercept indicates the Mathematics score when the values of the predictors in the model are zero.
Hence, the average performance of students with a father who is illiterate or has completed only
primary school, who do not belong to a tribal group, are female and who attend schools where
teachers have less teaching experience is a score of 284.74 with a standard error of 2.06. This score
increases by 1.27 points for students whose father has at least attended secondary school and by
6.56 points if they are male. This score is reduced by 5.87 points for students who report belonging
to a tribal group.
As for the previous two outcomes Table 54 also shows a positive coefficient for instructional
strategies (1.42) and negative coefficient for uncooperative peers (-2.75). These results indicate that
students who report that their teachers make the classes and learning interesting, explain things
clearly and want to help students to learn perform at a higher level than their peers in Bangla. In
contrast, students who report greater levels of being hit or threatened by other students, disruptive
behaviour of other students in class and other students spreading rumours about them perform at a
lower level in Bangla, English and Mathematics.
At level 2, the positive coefficient for teaching experience (0.29) indicates a very slight but non-trivial
effect which suggests that students who are taught in schools where teachers have longer teaching
experience perform at a slightly higher level than students who are taught in schools where teachers
have shorter average teaching experience.
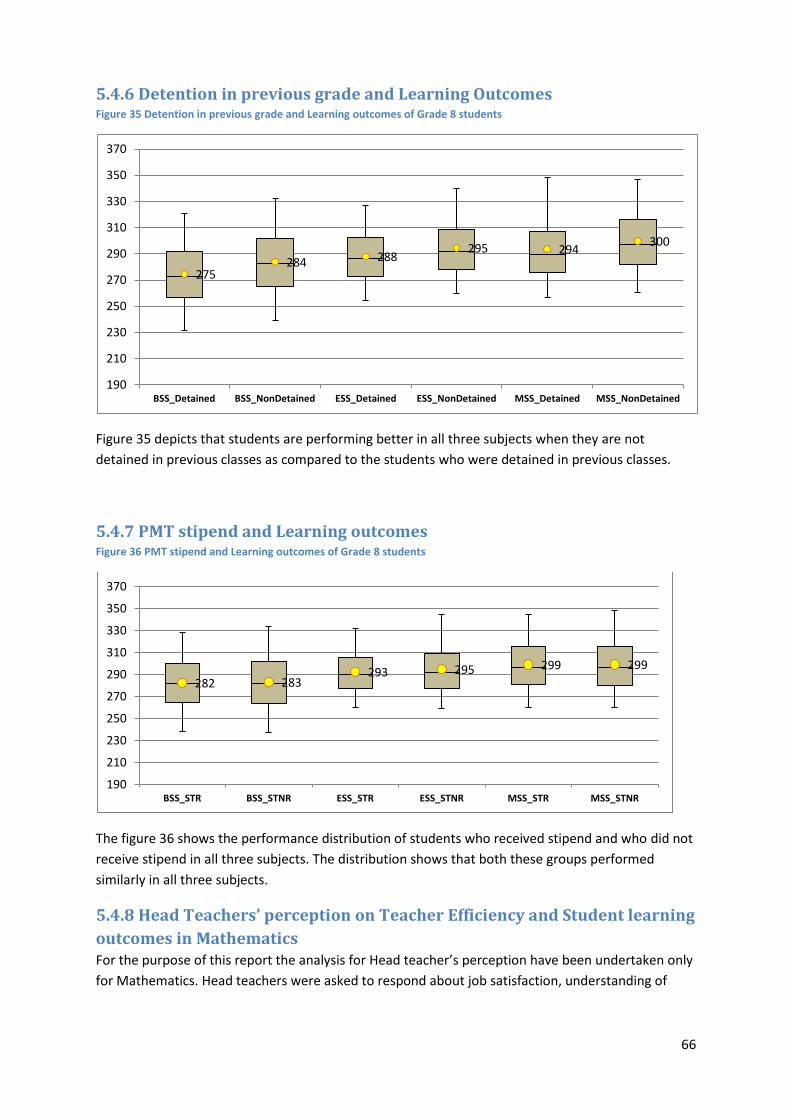
66
5.4.6 Detention in previous grade and Learning Outcomes Figure 35 Detention in previous grade and Learning outcomes of Grade 8 students
Figure 35 depicts that students are performing better in all three subjects when they are not
detained in previous classes as compared to the students who were detained in previous classes.
5.4.7 PMT stipend and Learning outcomes Figure 36 PMT stipend and Learning outcomes of Grade 8 students
The figure 36 shows the performance distribution of students who received stipend and who did not
receive stipend in all three subjects. The distribution shows that both these groups performed
similarly in all three subjects.
5.4.8 Head Teachers’ perception on Teacher Efficiency and Student learning
outcomes in Mathematics For the purpose of this report the analysis for Head teacher’s perception have been undertaken only
for Mathematics. Head teachers were asked to respond about job satisfaction, understanding of
275 284 288
295 294 300
190
210
230
250
270
290
310
330
350
370
BSS_Detained BSS_NonDetained ESS_Detained ESS_NonDetained MSS_Detained MSS_NonDetained
282 283 293 295 299 299
190
210
230
250
270
290
310
330
350
370
BSS_STR BSS_STNR ESS_STR ESS_STNR MSS_STR MSS_STNR
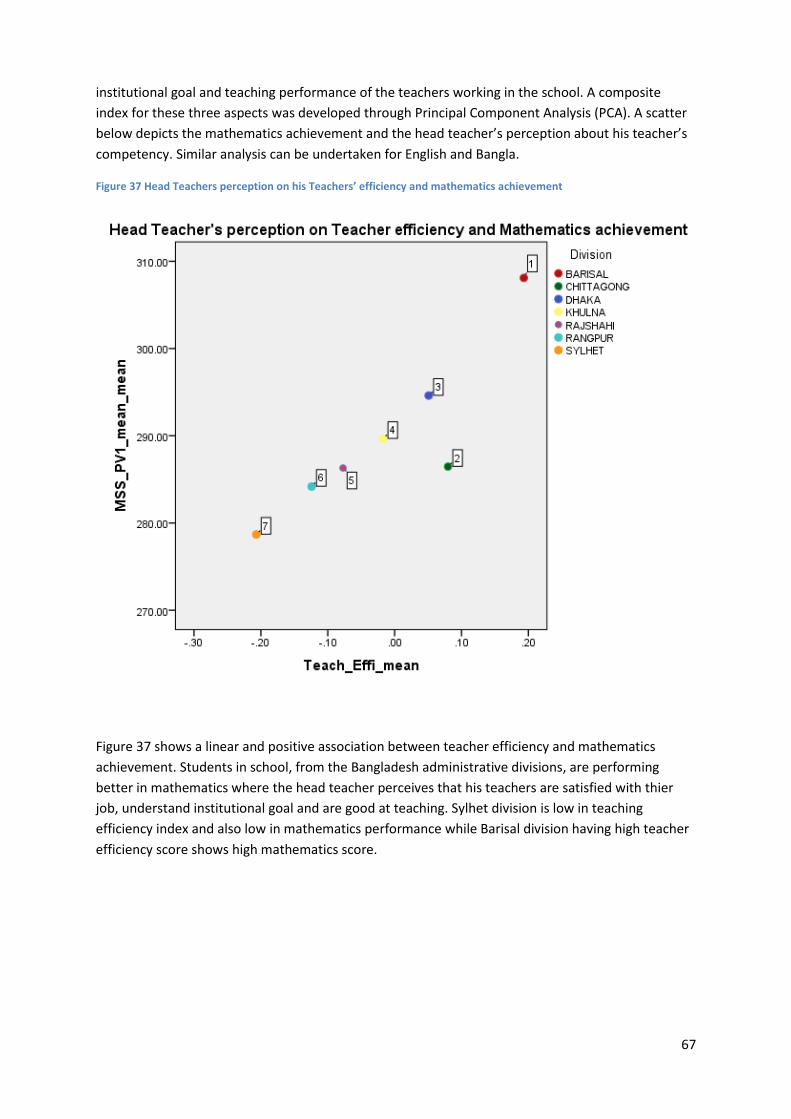
67
institutional goal and teaching performance of the teachers working in the school. A composite
index for these three aspects was developed through Principal Component Analysis (PCA). A scatter
below depicts the mathematics achievement and the head teacher’s perception about his teacher’s
competency. Similar analysis can be undertaken for English and Bangla.
Figure 37 Head Teachers perception on his Teachers’ efficiency and mathematics achievement
Figure 37 shows a linear and positive association between teacher efficiency and mathematics
achievement. Students in school, from the Bangladesh administrative divisions, are performing
better in mathematics where the head teacher perceives that his teachers are satisfied with thier
job, understand institutional goal and are good at teaching. Sylhet division is low in teaching
efficiency index and also low in mathematics performance while Barisal division having high teacher
efficiency score shows high mathematics score.
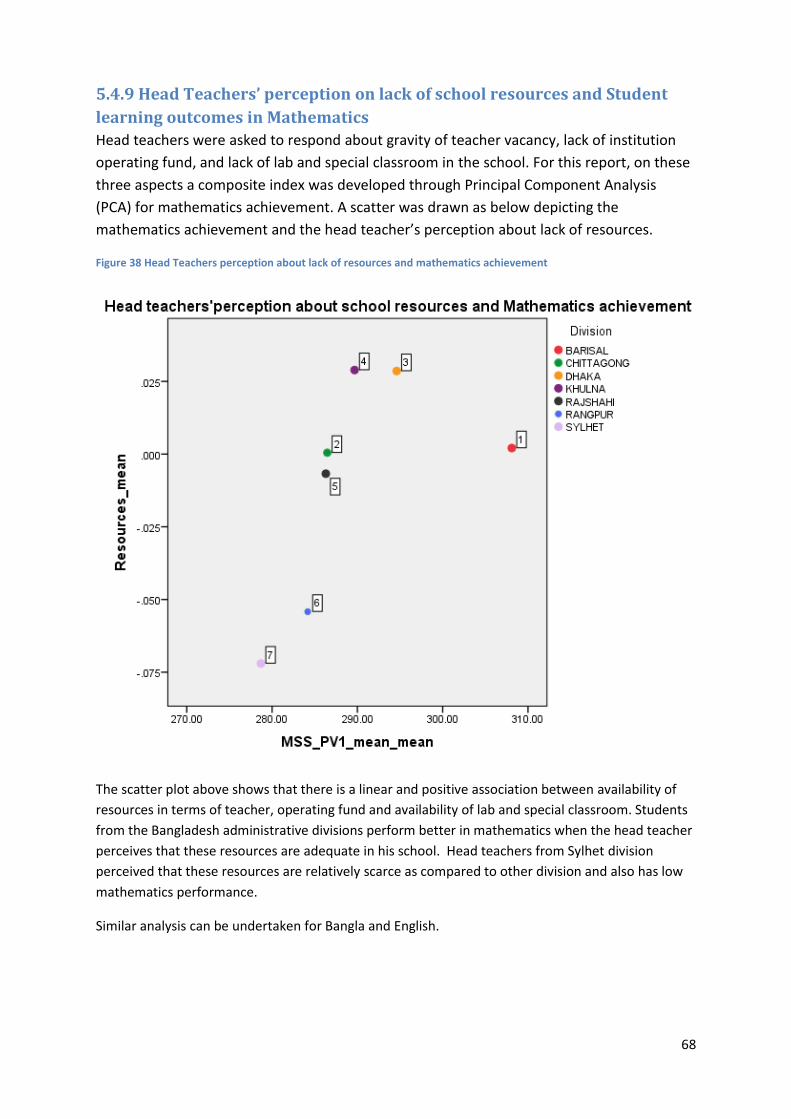
68
5.4.9 Head Teachers’ perception on lack of school resources and Student
learning outcomes in Mathematics
Head teachers were asked to respond about gravity of teacher vacancy, lack of institution
operating fund, and lack of lab and special classroom in the school. For this report, on these
three aspects a composite index was developed through Principal Component Analysis
(PCA) for mathematics achievement. A scatter was drawn as below depicting the
mathematics achievement and the head teacher’s perception about lack of resources.
Figure 38 Head Teachers perception about lack of resources and mathematics achievement
The scatter plot above shows that there is a linear and positive association between availability of
resources in terms of teacher, operating fund and availability of lab and special classroom. Students
from the Bangladesh administrative divisions perform better in mathematics when the head teacher
perceives that these resources are adequate in his school. Head teachers from Sylhet division
perceived that these resources are relatively scarce as compared to other division and also has low
mathematics performance.
Similar analysis can be undertaken for Bangla and English.
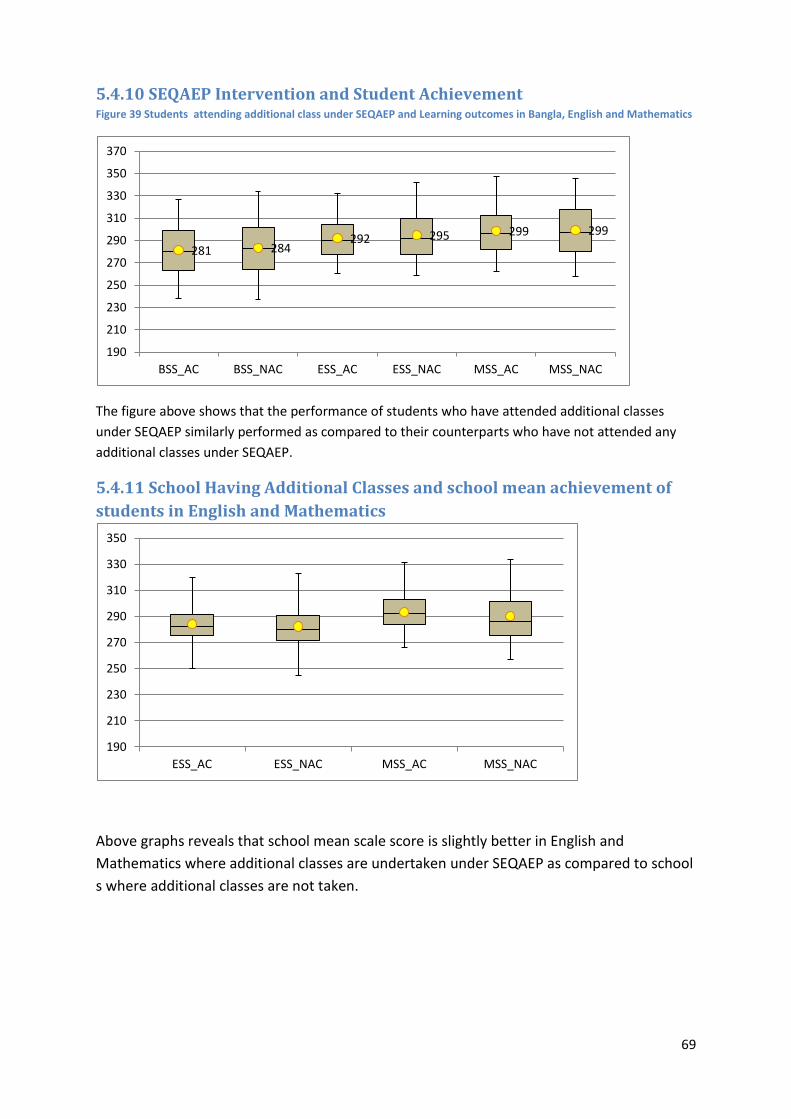
69
5.4.10 SEQAEP Intervention and Student Achievement Figure 39 Students attending additional class under SEQAEP and Learning outcomes in Bangla, English and Mathematics
The figure above shows that the performance of students who have attended additional classes
under SEQAEP similarly performed as compared to their counterparts who have not attended any
additional classes under SEQAEP.
5.4.11 School Having Additional Classes and school mean achievement of
students in English and Mathematics
Above graphs reveals that school mean scale score is slightly better in English and
Mathematics where additional classes are undertaken under SEQAEP as compared to school
s where additional classes are not taken.
281 284 292 295 299 299
190
210
230
250
270
290
310
330
350
370
BSS_AC BSS_NAC ESS_AC ESS_NAC MSS_AC MSS_NAC
190
210
230
250
270
290
310
330
350
ESS_AC ESS_NAC MSS_AC MSS_NAC
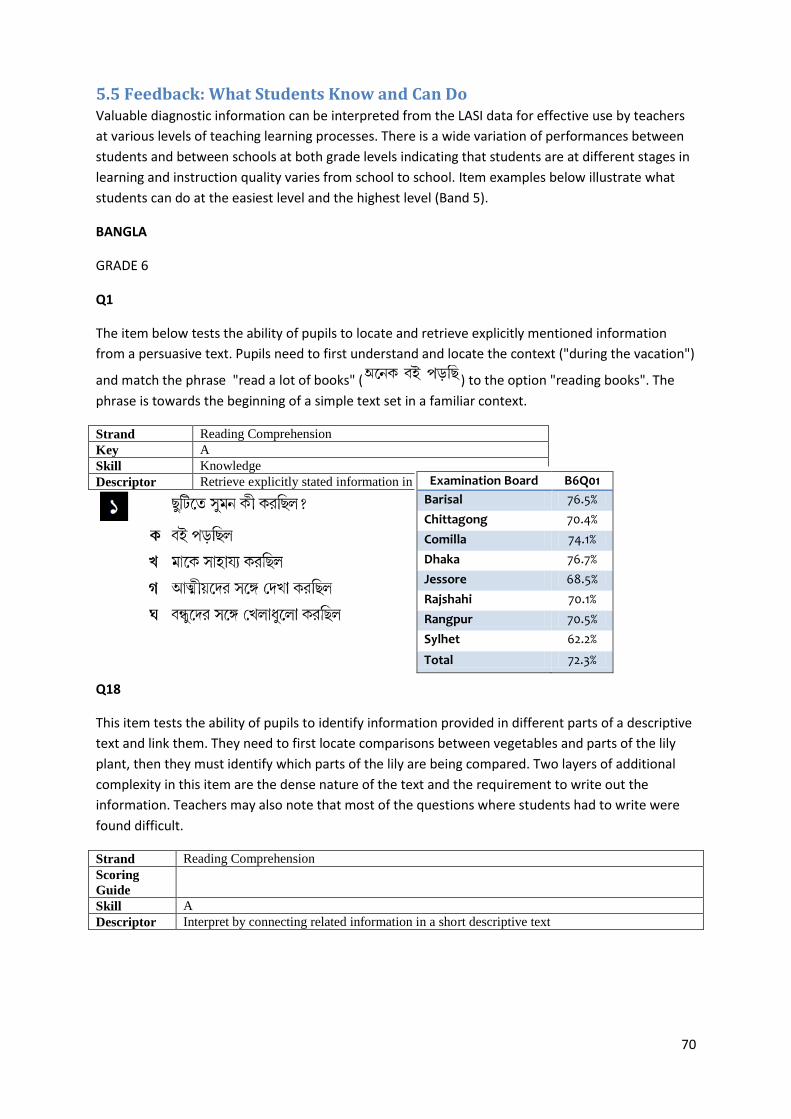
70
5.5 Feedback: What Students Know and Can Do Valuable diagnostic information can be interpreted from the LASI data for effective use by teachers
at various levels of teaching learning processes. There is a wide variation of performances between
students and between schools at both grade levels indicating that students are at different stages in
learning and instruction quality varies from school to school. Item examples below illustrate what
students can do at the easiest level and the highest level (Band 5).
BANGLA
GRADE 6
Q1
The item below tests the ability of pupils to locate and retrieve explicitly mentioned information
from a persuasive text. Pupils need to first understand and locate the context ("during the vacation")
and match the phrase "read a lot of books" ( ) to the option "reading books". The
phrase is towards the beginning of a simple text set in a familiar context.
Strand Reading Comprehension
Key A
Skill Knowledge
Descriptor Retrieve explicitly stated information in a persuasive text
Q18
This item tests the ability of pupils to identify information provided in different parts of a descriptive
text and link them. They need to first locate comparisons between vegetables and parts of the lily
plant, then they must identify which parts of the lily are being compared. Two layers of additional
complexity in this item are the dense nature of the text and the requirement to write out the
information. Teachers may also note that most of the questions where students had to write were
found difficult.
Strand Reading Comprehension
Scoring
Guide
Skill A
Descriptor Interpret by connecting related information in a short descriptive text
Examination Board B6Q01
Barisal 76.5%
Chittagong 70.4%
Comilla 74.1%
Dhaka 76.7%
Jessore 68.5%
Rajshahi 70.1%
Rangpur 70.5%
Sylhet 62.2%
Total 72.3%
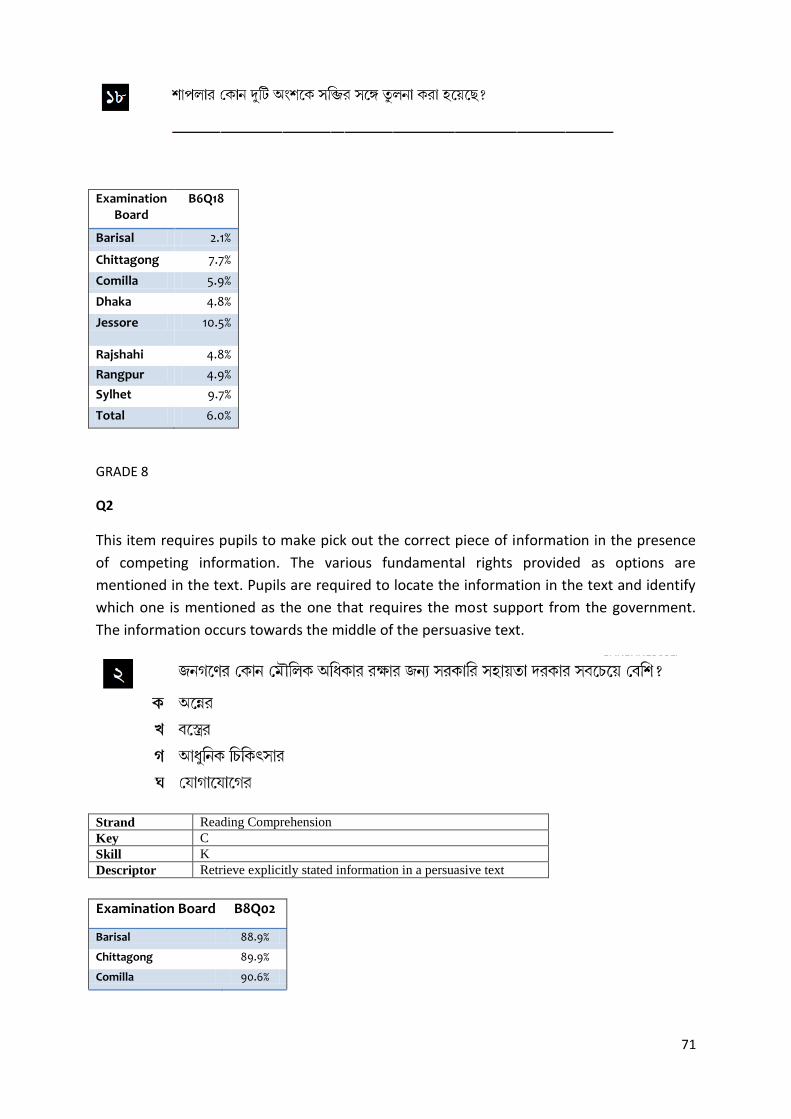
71
Examination Board
B6Q18
Barisal 2.1%
Chittagong 7.7%
Comilla 5.9%
Dhaka 4.8%
Jessore 10.5%
Rajshahi 4.8%
Rangpur 4.9%
Sylhet 9.7%
Total 6.0%
GRADE 8
Q2
This item requires pupils to make pick out the correct piece of information in the presence
of competing information. The various fundamental rights provided as options are
mentioned in the text. Pupils are required to locate the information in the text and identify
which one is mentioned as the one that requires the most support from the government.
The information occurs towards the middle of the persuasive text.
Strand Reading Comprehension
Key C
Skill K
Descriptor Retrieve explicitly stated information in a persuasive text
Examination Board B8Q02
Barisal 88.9%
Chittagong 89.9%
Comilla 90.6%
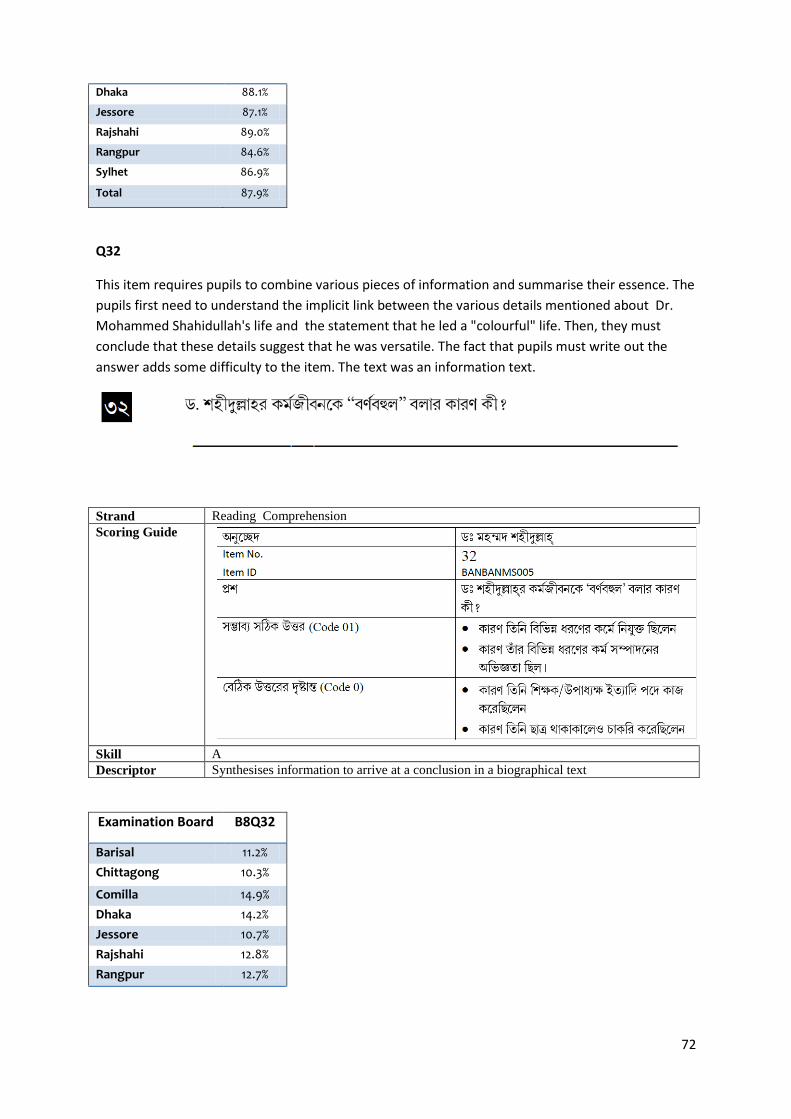
72
Dhaka 88.1%
Jessore 87.1%
Rajshahi 89.0%
Rangpur 84.6%
Sylhet 86.9%
Total 87.9%
Q32
This item requires pupils to combine various pieces of information and summarise their essence. The
pupils first need to understand the implicit link between the various details mentioned about Dr.
Mohammed Shahidullah's life and the statement that he led a "colourful" life. Then, they must
conclude that these details suggest that he was versatile. The fact that pupils must write out the
answer adds some difficulty to the item. The text was an information text.
Strand Reading Comprehension
Scoring Guide
Skill A
Descriptor Synthesises information to arrive at a conclusion in a biographical text
Examination Board B8Q32
Barisal 11.2%
Chittagong 10.3%
Comilla 14.9%
Dhaka 14.2%
Jessore 10.7%
Rajshahi 12.8%
Rangpur 12.7%
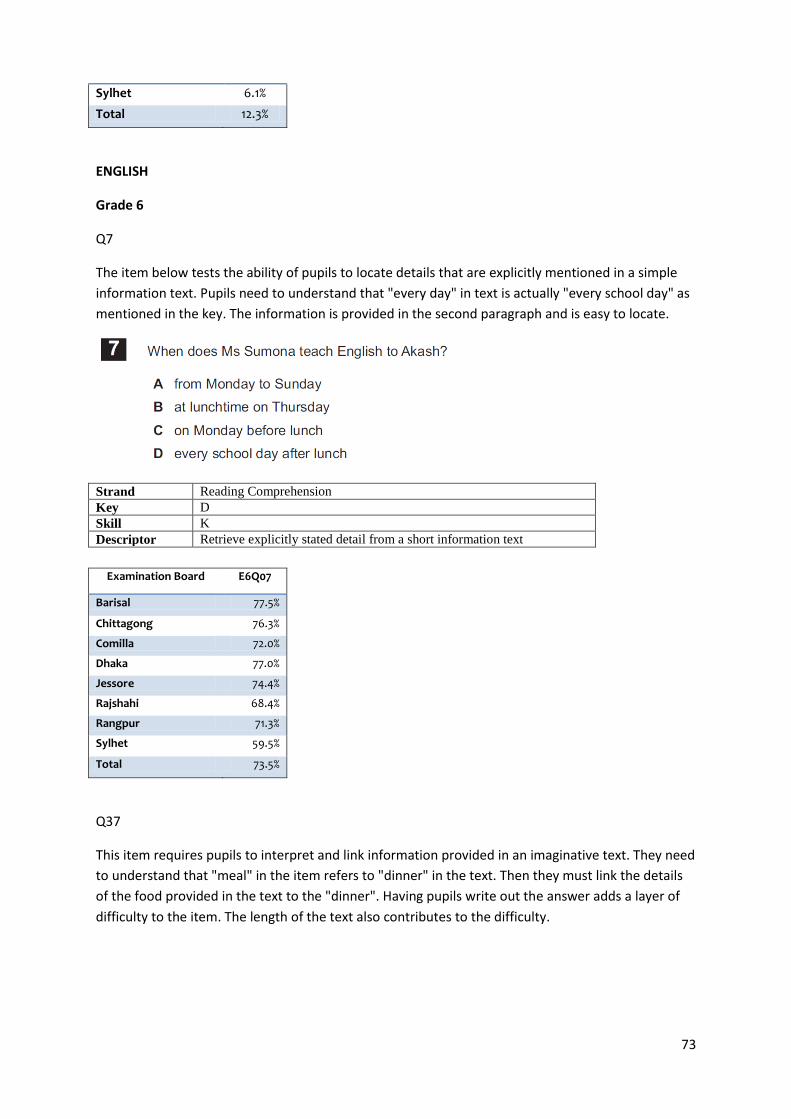
73
Sylhet 6.1%
Total 12.3%
ENGLISH
Grade 6
Q7
The item below tests the ability of pupils to locate details that are explicitly mentioned in a simple
information text. Pupils need to understand that "every day" in text is actually "every school day" as
mentioned in the key. The information is provided in the second paragraph and is easy to locate.
Strand Reading Comprehension
Key D
Skill K
Descriptor Retrieve explicitly stated detail from a short information text
Examination Board E6Q07
Barisal 77.5%
Chittagong 76.3%
Comilla 72.0%
Dhaka 77.0%
Jessore 74.4%
Rajshahi 68.4%
Rangpur 71.3%
Sylhet 59.5%
Total 73.5%
Q37
This item requires pupils to interpret and link information provided in an imaginative text. They need
to understand that "meal" in the item refers to "dinner" in the text. Then they must link the details
of the food provided in the text to the "dinner". Having pupils write out the answer adds a layer of
difficulty to the item. The length of the text also contributes to the difficulty.
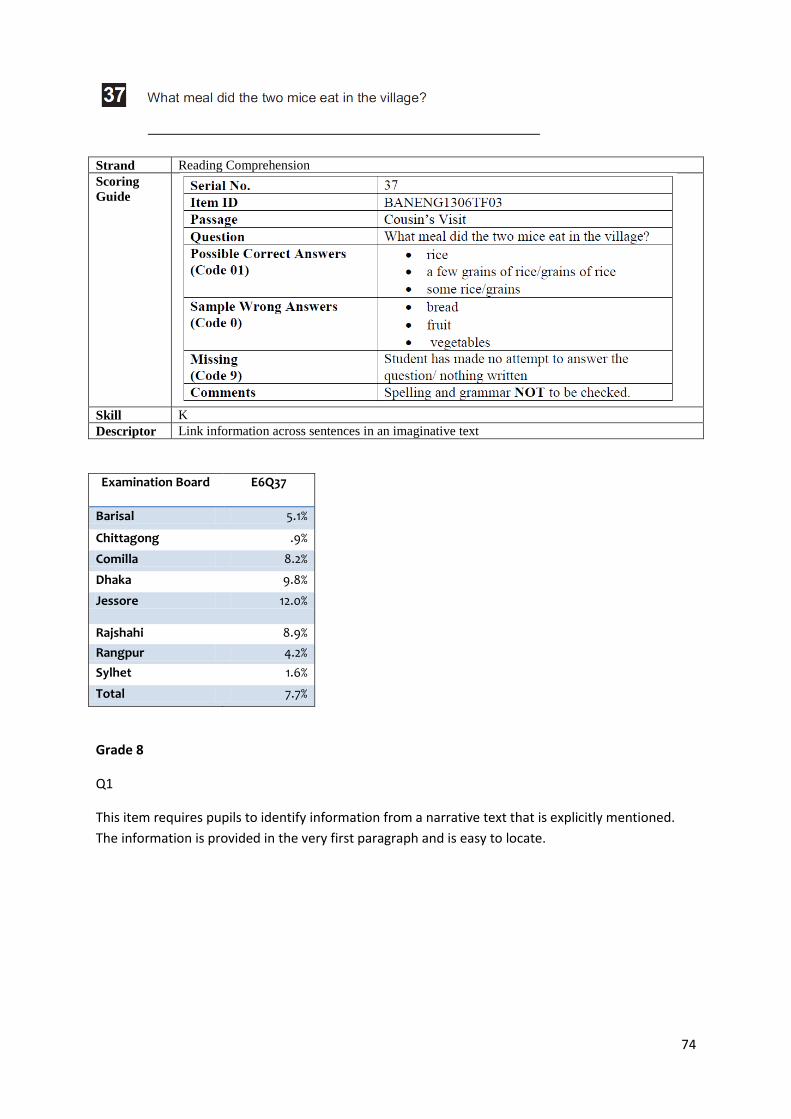
74
Strand Reading Comprehension
Scoring
Guide
Skill K
Descriptor Link information across sentences in an imaginative text
Examination Board E6Q37
Barisal 5.1%
Chittagong .9%
Comilla 8.2%
Dhaka 9.8%
Jessore 12.0%
Rajshahi 8.9%
Rangpur 4.2%
Sylhet 1.6%
Total 7.7%
Grade 8
Q1
This item requires pupils to identify information from a narrative text that is explicitly mentioned.
The information is provided in the very first paragraph and is easy to locate.

75
Strand Reading Comprehension
Key D
Skill K
Descriptor Retrieve explicitly stated details from a short narrative text
Examination Board E8Q01
Barisal 97.8%
Chittagong 98.6%
Comilla 99.0%
Dhaka 96.4%
Jessore 97.2%
Rajshahi 93.6%
Rangpur 96.8%
Sylhet 93.6%
Total 96.5%
Q29
This item tests pupils ability to identify the meaning of a word based on clues provided. The
word "diet" is the title of a column in the table. Pupils need to understand that the heading
often summarises the information in the column. They then need to match the option that
best captures the information provided in the column with the word "diet". The text is a
non-continuous information text.
Strand Vocabulary
Key A
Skill A
Descriptor Deduce the meaning of a word from contextual clues
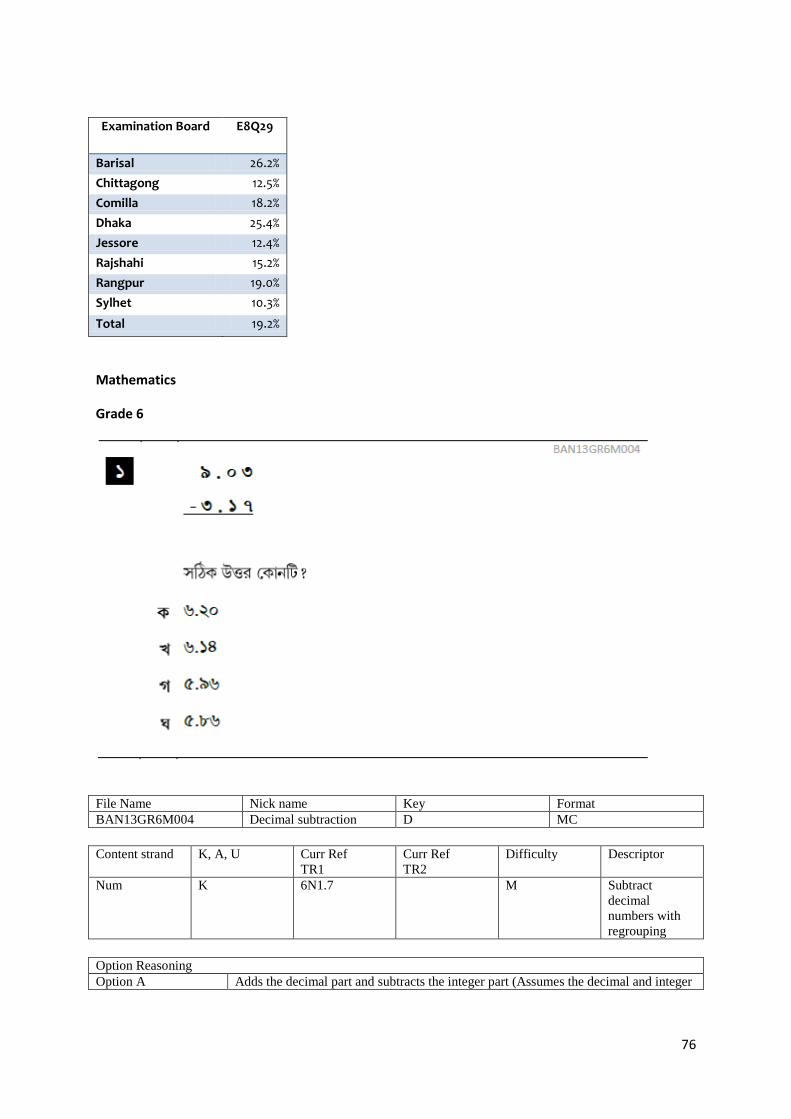
76
Examination Board E8Q29
Barisal 26.2%
Chittagong 12.5%
Comilla 18.2%
Dhaka 25.4%
Jessore 12.4%
Rajshahi 15.2%
Rangpur 19.0%
Sylhet 10.3%
Total 19.2%
Mathematics
Grade 6
File Name Nick name Key Format
BAN13GR6M004 Decimal subtraction D MC
Content strand K, A, U Curr Ref
TR1
Curr Ref
TR2
Difficulty Descriptor
Num K 6N1.7 M Subtract
decimal
numbers with
regrouping
Option Reasoning
Option A Adds the decimal part and subtracts the integer part (Assumes the decimal and integer
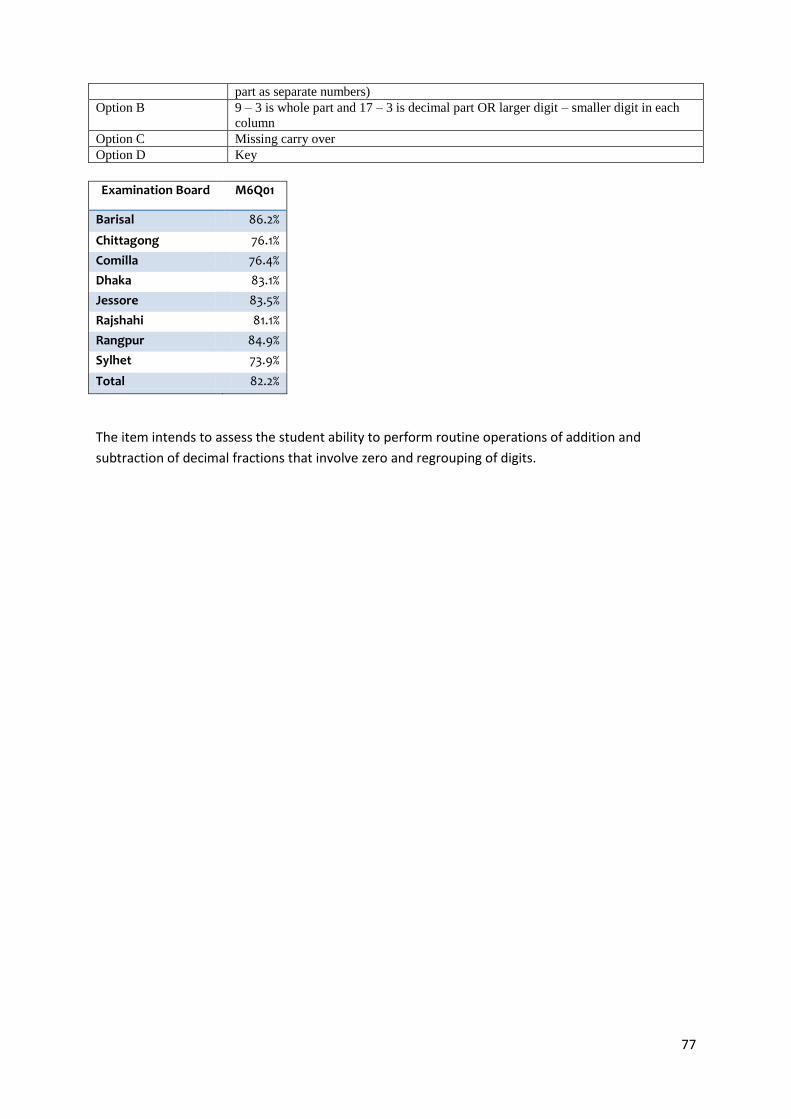
77
part as separate numbers)
Option B 9 – 3 is whole part and 17 – 3 is decimal part OR larger digit – smaller digit in each
column
Option C Missing carry over
Option D Key
Examination Board M6Q01
Barisal 86.2%
Chittagong 76.1%
Comilla 76.4%
Dhaka 83.1%
Jessore 83.5%
Rajshahi 81.1%
Rangpur 84.9%
Sylhet 73.9%
Total 82.2%
The item intends to assess the student ability to perform routine operations of addition and
subtraction of decimal fractions that involve zero and regrouping of digits.
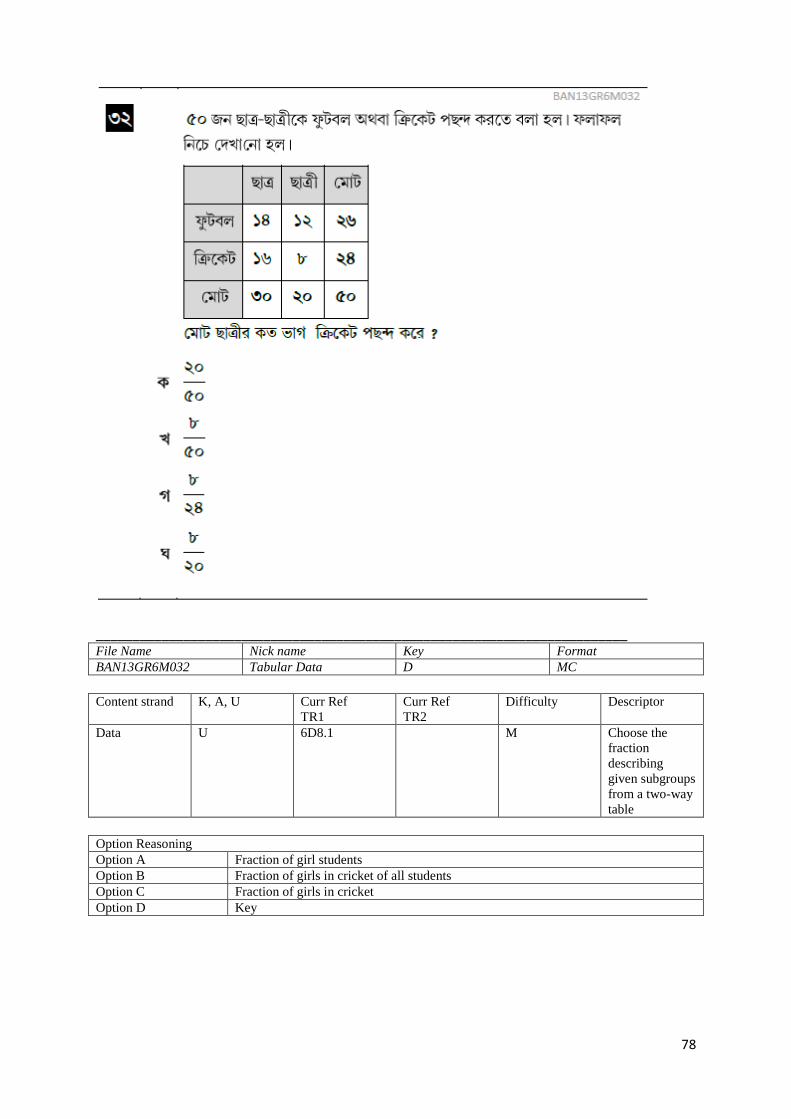
78
_________________________________________________________________________ File Name Nick name Key Format
BAN13GR6M032 Tabular Data D MC
Content strand K, A, U Curr Ref
TR1
Curr Ref
TR2
Difficulty Descriptor
Data U 6D8.1 M Choose the
fraction
describing
given subgroups
from a two-way
table
Option Reasoning
Option A Fraction of girl students
Option B Fraction of girls in cricket of all students
Option C Fraction of girls in cricket
Option D Key
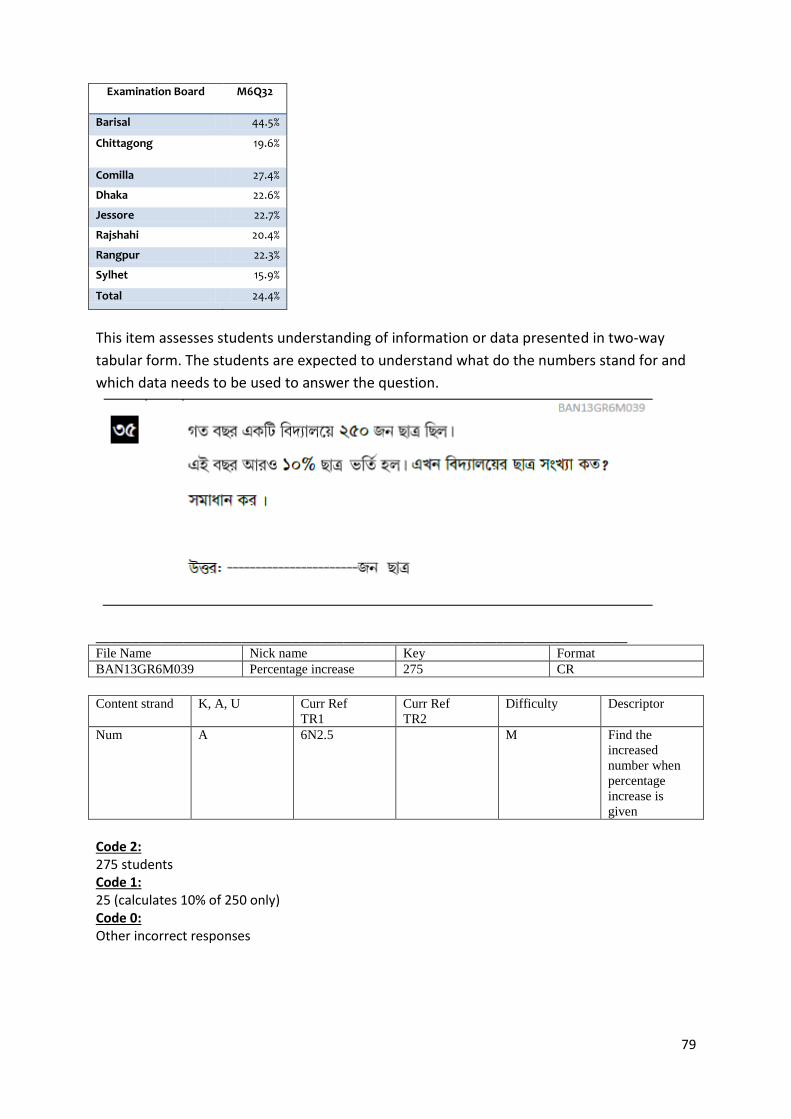
79
Examination Board M6Q32
Barisal 44.5%
Chittagong 19.6%
Comilla 27.4%
Dhaka 22.6%
Jessore 22.7%
Rajshahi 20.4%
Rangpur 22.3%
Sylhet 15.9%
Total 24.4%
This item assesses students understanding of information or data presented in two-way
tabular form. The students are expected to understand what do the numbers stand for and
which data needs to be used to answer the question.
_________________________________________________________________________ File Name Nick name Key Format
BAN13GR6M039 Percentage increase 275 CR
Content strand K, A, U Curr Ref
TR1
Curr Ref
TR2
Difficulty Descriptor
Num A 6N2.5 M Find the
increased
number when
percentage
increase is
given
Code 2: 275 students Code 1: 25 (calculates 10% of 250 only) Code 0: Other incorrect responses
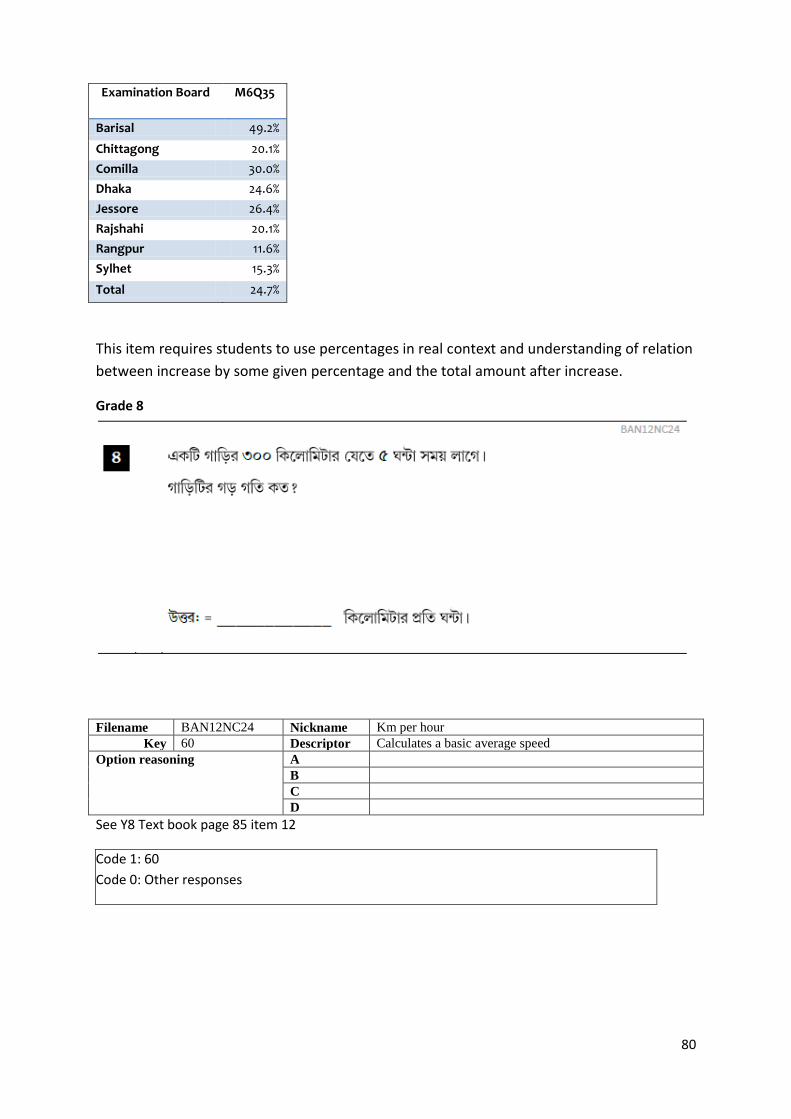
80
Examination Board M6Q35
Barisal 49.2%
Chittagong 20.1%
Comilla 30.0%
Dhaka 24.6%
Jessore 26.4%
Rajshahi 20.1%
Rangpur 11.6%
Sylhet 15.3%
Total 24.7%
This item requires students to use percentages in real context and understanding of relation
between increase by some given percentage and the total amount after increase.
Grade 8
Filename BAN12NC24 Nickname Km per hour
Key 60 Descriptor Calculates a basic average speed
Option reasoning A
B
C
D
See Y8 Text book page 85 item 12
Code 1: 60
Code 0: Other responses
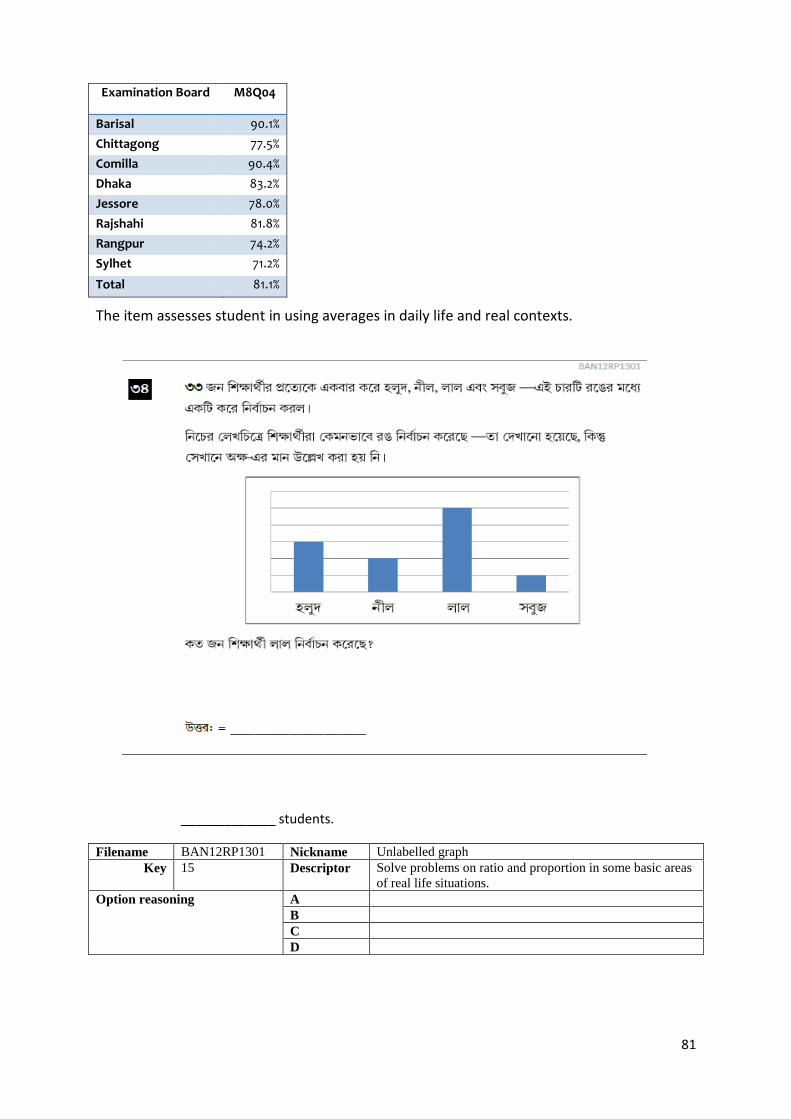
81
Examination Board M8Q04
Barisal 90.1%
Chittagong 77.5%
Comilla 90.4%
Dhaka 83.2%
Jessore 78.0%
Rajshahi 81.8%
Rangpur 74.2%
Sylhet 71.2%
Total 81.1%
The item assesses student in using averages in daily life and real contexts.
_____________ students.
Filename BAN12RP1301 Nickname Unlabelled graph
Key 15 Descriptor Solve problems on ratio and proportion in some basic areas
of real life situations.
Option reasoning A
B
C
D
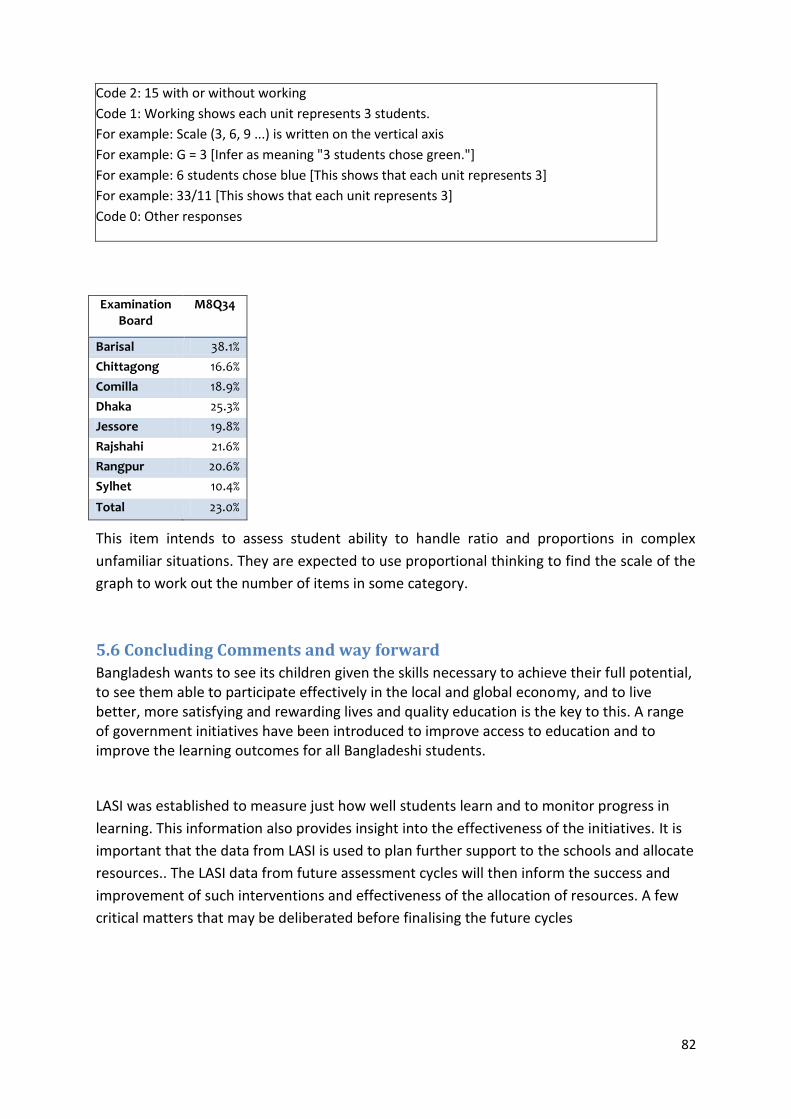
82
Code 2: 15 with or without working
Code 1: Working shows each unit represents 3 students.
For example: Scale (3, 6, 9 ...) is written on the vertical axis
For example: G = 3 [Infer as meaning "3 students chose green."]
For example: 6 students chose blue [This shows that each unit represents 3]
For example: 33/11 [This shows that each unit represents 3]
Code 0: Other responses
Examination
Board M8Q34
Barisal 38.1%
Chittagong 16.6%
Comilla 18.9%
Dhaka 25.3%
Jessore 19.8%
Rajshahi 21.6%
Rangpur 20.6%
Sylhet 10.4%
Total 23.0%
This item intends to assess student ability to handle ratio and proportions in complex
unfamiliar situations. They are expected to use proportional thinking to find the scale of the
graph to work out the number of items in some category.
5.6 Concluding Comments and way forward
Bangladesh wants to see its children given the skills necessary to achieve their full potential, to see them able to participate effectively in the local and global economy, and to live better, more satisfying and rewarding lives and quality education is the key to this. A range of government initiatives have been introduced to improve access to education and to improve the learning outcomes for all Bangladeshi students.
LASI was established to measure just how well students learn and to monitor progress in
learning. This information also provides insight into the effectiveness of the initiatives. It is
important that the data from LASI is used to plan further support to the schools and allocate
resources.. The LASI data from future assessment cycles will then inform the success and
improvement of such interventions and effectiveness of the allocation of resources. A few
critical matters that may be deliberated before finalising the future cycles
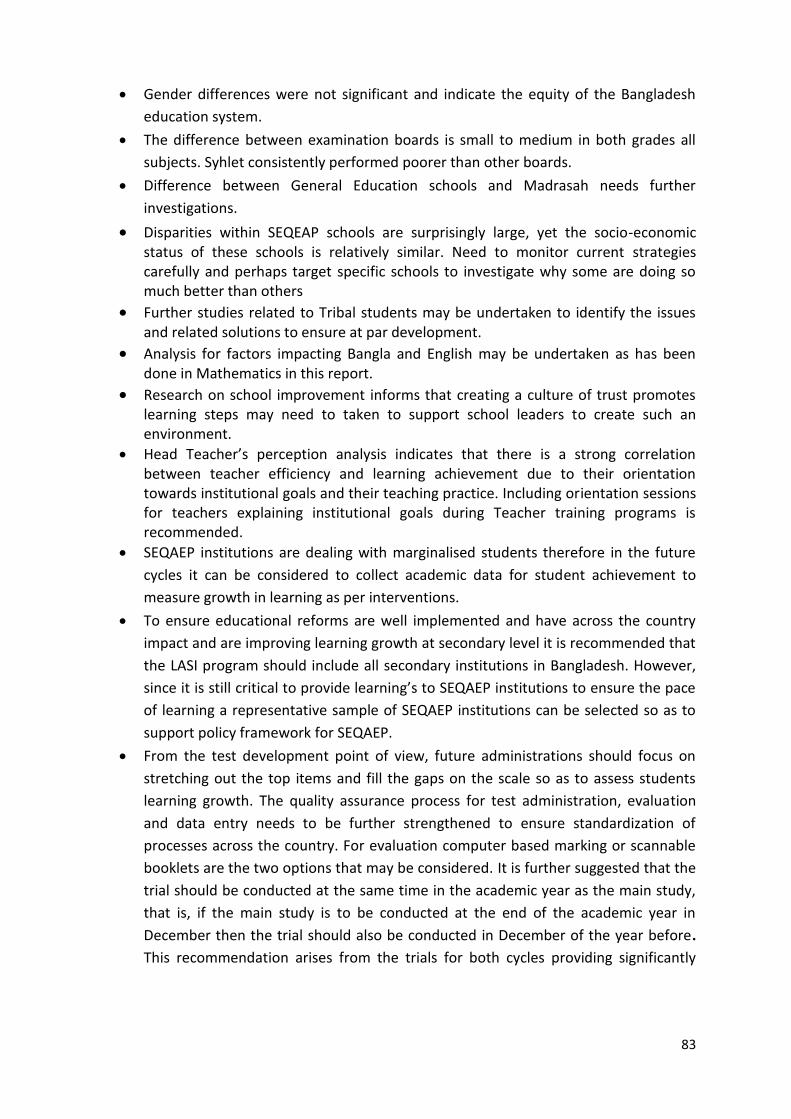
83
Gender differences were not significant and indicate the equity of the Bangladesh
education system.
The difference between examination boards is small to medium in both grades all
subjects. Syhlet consistently performed poorer than other boards.
Difference between General Education schools and Madrasah needs further
investigations.
Disparities within SEQEAP schools are surprisingly large, yet the socio-economic status of these schools is relatively similar. Need to monitor current strategies carefully and perhaps target specific schools to investigate why some are doing so much better than others
Further studies related to Tribal students may be undertaken to identify the issues and related solutions to ensure at par development.
Analysis for factors impacting Bangla and English may be undertaken as has been done in Mathematics in this report.
Research on school improvement informs that creating a culture of trust promotes learning steps may need to taken to support school leaders to create such an environment.
Head Teacher’s perception analysis indicates that there is a strong correlation between teacher efficiency and learning achievement due to their orientation towards institutional goals and their teaching practice. Including orientation sessions for teachers explaining institutional goals during Teacher training programs is recommended.
SEQAEP institutions are dealing with marginalised students therefore in the future
cycles it can be considered to collect academic data for student achievement to
measure growth in learning as per interventions.
To ensure educational reforms are well implemented and have across the country
impact and are improving learning growth at secondary level it is recommended that
the LASI program should include all secondary institutions in Bangladesh. However,
since it is still critical to provide learning’s to SEQAEP institutions to ensure the pace
of learning a representative sample of SEQAEP institutions can be selected so as to
support policy framework for SEQAEP.
From the test development point of view, future administrations should focus on
stretching out the top items and fill the gaps on the scale so as to assess students
learning growth. The quality assurance process for test administration, evaluation
and data entry needs to be further strengthened to ensure standardization of
processes across the country. For evaluation computer based marking or scannable
booklets are the two options that may be considered. It is further suggested that the
trial should be conducted at the same time in the academic year as the main study,
that is, if the main study is to be conducted at the end of the academic year in
December then the trial should also be conducted in December of the year before.
This recommendation arises from the trials for both cycles providing significantly
84
difference estimates of item difficulty from those in the main study. Alternatively, it
can be considered to trial next cycles items with the main study.
Detailed diagnostic information for teachers helps to improve classroom teaching
and achievement. Reporting by sub-scales can provide more detailed information to
the stakeholders of the strengths and weaknesses of students. The current
assessment framework and test design allows assessing the core topics of the
subjects, however it is recommended that the programme is expanded to include
further sub-scale development in the next cycle. It is also recommended that writing
be assessed and reported separately from reading. Writing is an important aspect of
language development and learning and as the results are indicating students are
not performing well in questions that expect them to write, it is recommended the
writing be included in the next cycle of LASI.
Dissemination of LASI results and findings and their relevance for classroom practice,
school planning, and national education policy is recommended. Workshops should
be organised in all districts that provide simplified and straightforward explanations
to teachers of the findings and how NSA information can be used to improve student
learning
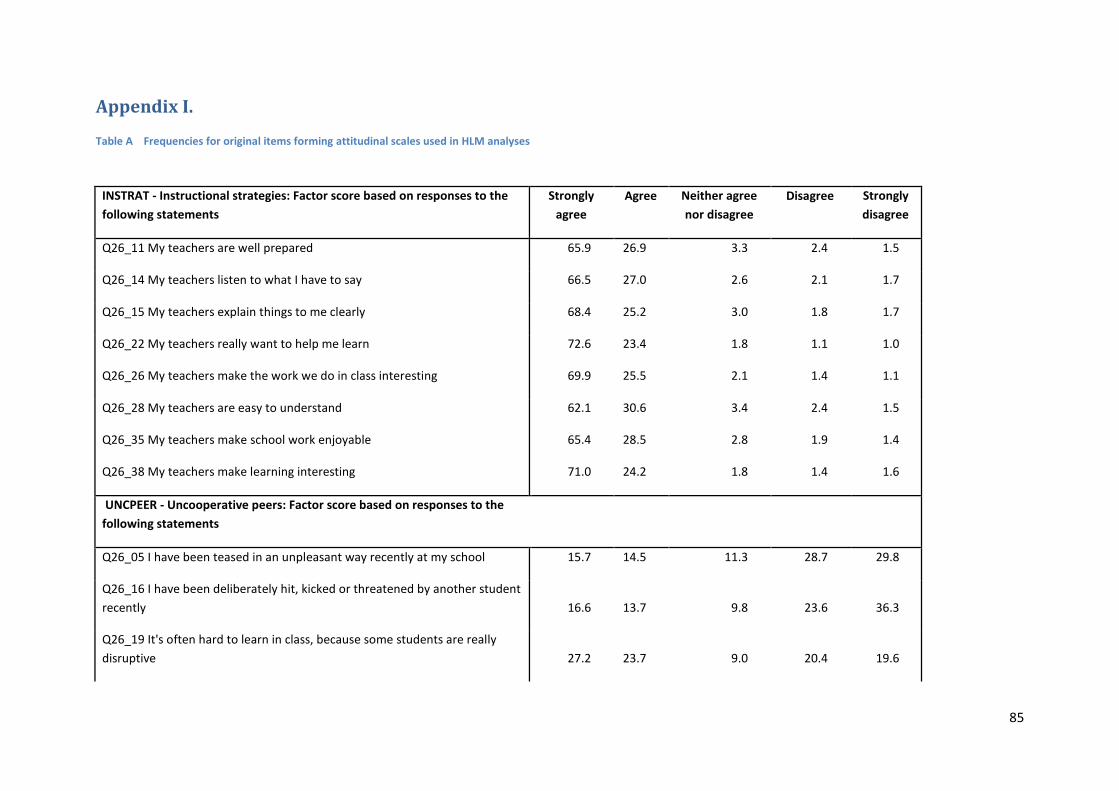
85
Appendix I.
Table A Frequencies for original items forming attitudinal scales used in HLM analyses
INSTRAT - Instructional strategies: Factor score based on responses to the
following statements
Strongly
agree
Agree Neither agree
nor disagree
Disagree Strongly
disagree
Q26_11 My teachers are well prepared 65.9 26.9 3.3 2.4 1.5
Q26_14 My teachers listen to what I have to say 66.5 27.0 2.6 2.1 1.7
Q26_15 My teachers explain things to me clearly 68.4 25.2 3.0 1.8 1.7
Q26_22 My teachers really want to help me learn 72.6 23.4 1.8 1.1 1.0
Q26_26 My teachers make the work we do in class interesting 69.9 25.5 2.1 1.4 1.1
Q26_28 My teachers are easy to understand 62.1 30.6 3.4 2.4 1.5
Q26_35 My teachers make school work enjoyable 65.4 28.5 2.8 1.9 1.4
Q26_38 My teachers make learning interesting 71.0 24.2 1.8 1.4 1.6
UNCPEER - Uncooperative peers: Factor score based on responses to the
following statements
Q26_05 I have been teased in an unpleasant way recently at my school 15.7 14.5 11.3 28.7 29.8
Q26_16 I have been deliberately hit, kicked or threatened by another student
recently 16.6 13.7 9.8 23.6 36.3
Q26_19 It's often hard to learn in class, because some students are really
disruptive 27.2 23.7 9.0 20.4 19.6
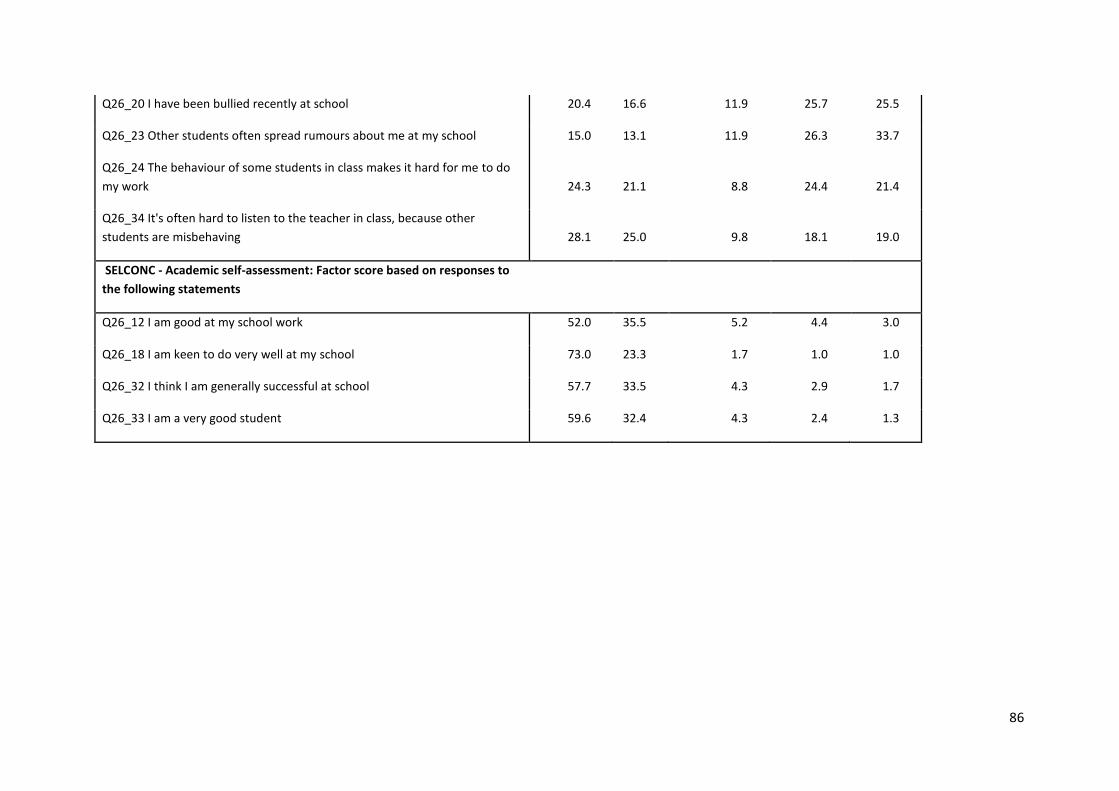
86
Q26_20 I have been bullied recently at school 20.4 16.6 11.9 25.7 25.5
Q26_23 Other students often spread rumours about me at my school 15.0 13.1 11.9 26.3 33.7
Q26_24 The behaviour of some students in class makes it hard for me to do
my work 24.3 21.1 8.8 24.4 21.4
Q26_34 It's often hard to listen to the teacher in class, because other
students are misbehaving 28.1 25.0 9.8 18.1 19.0
SELCONC - Academic self-assessment: Factor score based on responses to
the following statements
Q26_12 I am good at my school work 52.0 35.5 5.2 4.4 3.0
Q26_18 I am keen to do very well at my school 73.0 23.3 1.7 1.0 1.0
Q26_32 I think I am generally successful at school 57.7 33.5 4.3 2.9 1.7
Q26_33 I am a very good student 59.6 32.4 4.3 2.4 1.3

87
References
Bandyopadhyay, S., Cornell, D. G., & Konold, T. R. (2009). Validity of three school climate scales to assess bullying, aggressive attitudes, and help seeking. School Psychology Review, 38(3), 338-355. Bond, L., Butler, H., Thomas, L., Carlin, J., Glover, S., Bowes, G.,& Patton, G. (2007). Social and school connectedness in early secondary school as predictors of late teenage substance use,mental health, and academic outcomes. Journal of Adolescent Health, 40, 357.e9–357.e18. Cohen, J., McCabe, E. M., Michelli, N. M., & Pickeral, T. (2009). School climate: Research, policy, practice, and teacher education. Teachers College Record, 111(1), 180-213.


![RISK ASSESSMENT [ASSESSMENT]](https://img.dokumen.tips/doc/110x75/6212412fca52115ed803cf10/risk-assessment-assessment.jpg)