Embed Size (px)
Citation preview
©2014 International Monetary Fund
IMF Country Report No. 14/51
AUSTRALIA 2013 ARTICLE IV CONSULTATION—STAFF REPORT; PRESS RELEASE; AND STATEMENT BY THE EXECUTIVE DIRECTOR FOR AUSTRALIA
Under Article IV of the IMF’s Articles of Agreement, the IMF holds bilateral discussions with members, usually every year. In the context of the 2013 Article IV consultation with Australia, the following documents have been released and are included in this package: The Staff Report prepared by a staff team of the IMF for the Executive Board’s
consideration on February 10, 2014, following discussions that ended on November 20, 2013, with the officials of Australia on economic developments and policies. Based on information available at the time of these discussions, the staff report was completed on January 24, 2014.
An Informational Annex prepared by the IMF.
A Press Release summarizing the views of the Executive Board as expressed during its February 10, 2014 consideration of the staff report that concluded the Article IV consultation with Australia.
A Statement by the Executive Director for Australia.
The publication policy for staff reports and other documents allows for the deletion of market-sensitive information.
Copies of this report are available to the public from
International Monetary Fund Publication Services PO Box 92780 Washington, D.C. 20090
Telephone: (202) 623-7430 Fax: (202) 623-7201 E-mail: [email protected] Web: http://www.imf.org
Price: $18.00 per printed copy
International Monetary Fund Washington, D.C.
February 2014
AUSTRALIA STAFF REPORT FOR THE 2013 ARTICLE IV CONSULTATION
KEY ISSUES Context. With GDP growth below trend and the investment phase of the mining boom having passed its peak and beginning to decline, a key issue is how Australia can manage the mining-production/export phase and encourage broader-based growth. The main external risks include a slowdown in China over the medium term and surges in global financial market volatility. The pickup in housing market activity, though welcome to date, could pose a future risk if prices accelerate and lead to overshooting.
Near-term macroeconomic policy mix. With the exchange rate still moderately overvalued and weighing on non-mining activity, accommodative monetary policy remains appropriate. Monetary policy should remain the primary macroeconomic tool for managing aggregate demand, although there is fiscal policy space to respond in the event of a deterioration in the outlook.
Medium-term fiscal policy. The government’s aim to return the budget to surplus over the medium term would help rebuild fiscal buffers. Staff’s analysis shows that without increases in revenue this would require sizeable cuts in projected spending.
Financial stability. The financial sector is resilient and has strengthened in recent years, although banks’ reliance on offshore funding will continue. The emphasis on tight lending standards and intensive supervision should help limit financial sector risks.
Transition to broader-based growth. Higher resource exports will make the economy more sensitive to terms of trade shocks, and the floating exchange rate will be an essential buffer. Robust income growth over the past decade was supported by the sharp increase in the terms of trade. As this effect unwinds, a significant pickup in productivity will be needed to maintain growth in living standards.
January 24, 2014
AUSTRALIA
2 INTERNATIONAL MONETARY FUND
Approved By Jerald Schiff and Tamim Bayoumi
Discussions were held in Sydney, Canberra and Melbourne during November 11-20, 2013. The staff team comprised Brian Aitken (Head), Ding Ding, Juan Jauregui, Dan Nyberg, and Alison Stuart (all APD).
CONTENTS
RECENT ECONOMIC DEVELOPMENTS __________________________________________________________ 4
OUTLOOK AND RISKS ____________________________________________________________________________ 5
POLICIES TO SUSTAIN GROWTH ________________________________________________________________ 8
FINANCIAL STABILITY AND MACRO-FINANCIAL RISKS _____________________________________ 11
ASSESSING EXTERNAL STABILITY _____________________________________________________________ 13
ROLE OF THE MINING SECTOR AND SHIFT TO BROADER-BASED GROWTH _______________ 15
STAFF APPRAISAL ______________________________________________________________________________ 16 BOXES 1. Medium-Term Fiscal Consistency ________________________________________________________________ 9 2. External Sector Assessment ____________________________________________________________________ 14 FIGURES 1. Growth Weakened _____________________________________________________________________________ 19 2. Household Vulnerabilities _____________________________________________________________________ 20 3. Inflationary Pressures Moderate _______________________________________________________________ 21 4. Monetary Stance ______________________________________________________________________________ 22 5. Fiscal Stance ___________________________________________________________________________________ 23 6. Comparison of Fiscal Outlook _________________________________________________________________ 24 7. Banking System Developments ________________________________________________________________ 25 8. Financial Market Indicators ____________________________________________________________________ 26 9. Trade and Balance of Payments _______________________________________________________________ 27 10. External Vulnerability _________________________________________________________________________ 28 11. Interconnection and Spillovers _______________________________________________________________ 29
AUSTRALIA
INTERNATIONAL MONETARY FUND 3
TABLES 1. Selected Economic Indicators, 2010-2014 _____________________________________________________ 30 2. Medium-Term Scenario, 2010-2018 ___________________________________________________________ 31 3. Fiscal Accounts, 2010/11-2018/19 _____________________________________________________________ 32 4. Balance of Payments in U.S. Dollars, 2010-2018 _______________________________________________ 33 5. Balance of Payments, 2010-2018 ______________________________________________________________ 34 6. Gross External Debt, 2008-2013 _______________________________________________________________ 35 7. Indicators of External and Financial Vulnerability, 2008-2012 _________________________________ 36 8. Selected Financial Soundness Indicators, 2007-2013 __________________________________________ 37 ANNEXES 1. Risk Assessment Matrix _________________________________________________________________________ 38 2. Housing Market ________________________________________________________________________________ 39 3. External Sector Developments and Prospects __________________________________________________ 46 4. Managing the Transition from the Mining Investment Boom __________________________________ 51 5. Public and External Debt Sustainability Analysis ________________________________________________ 62 6. Main Recommendations of the 2012 Article IV Consultation ___________________________________ 66
AUSTRALIA
4 INTERNATIONAL MONETARY FUND
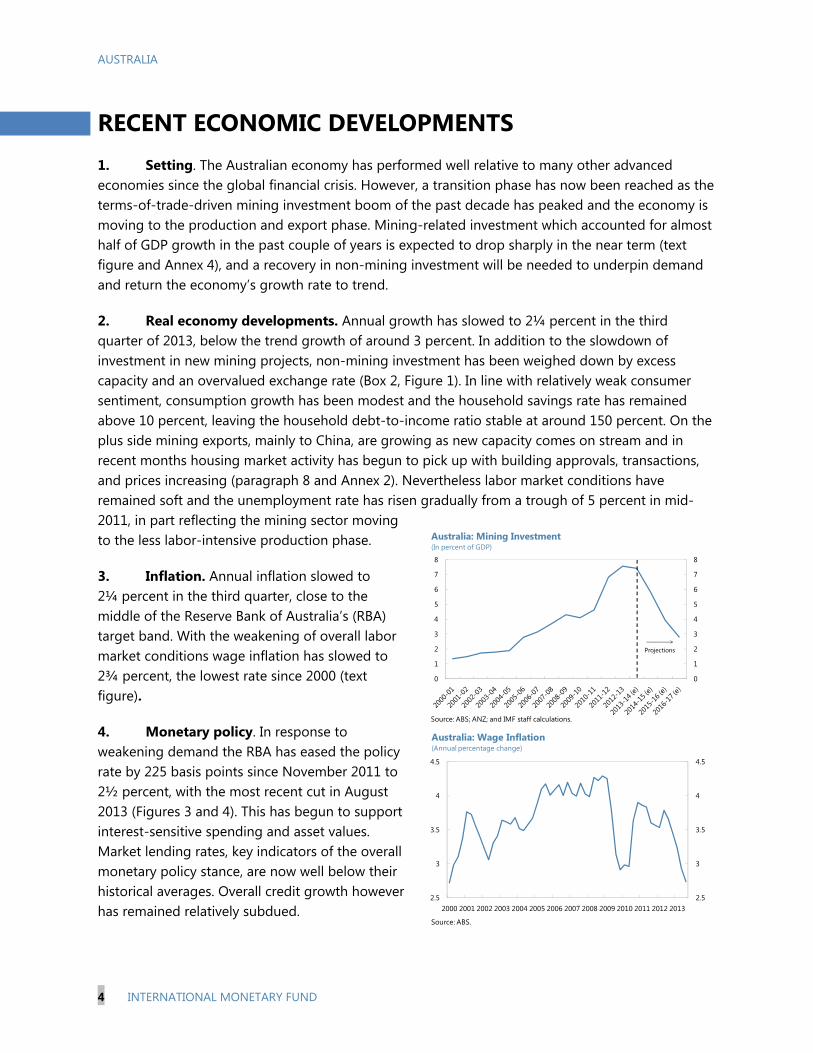
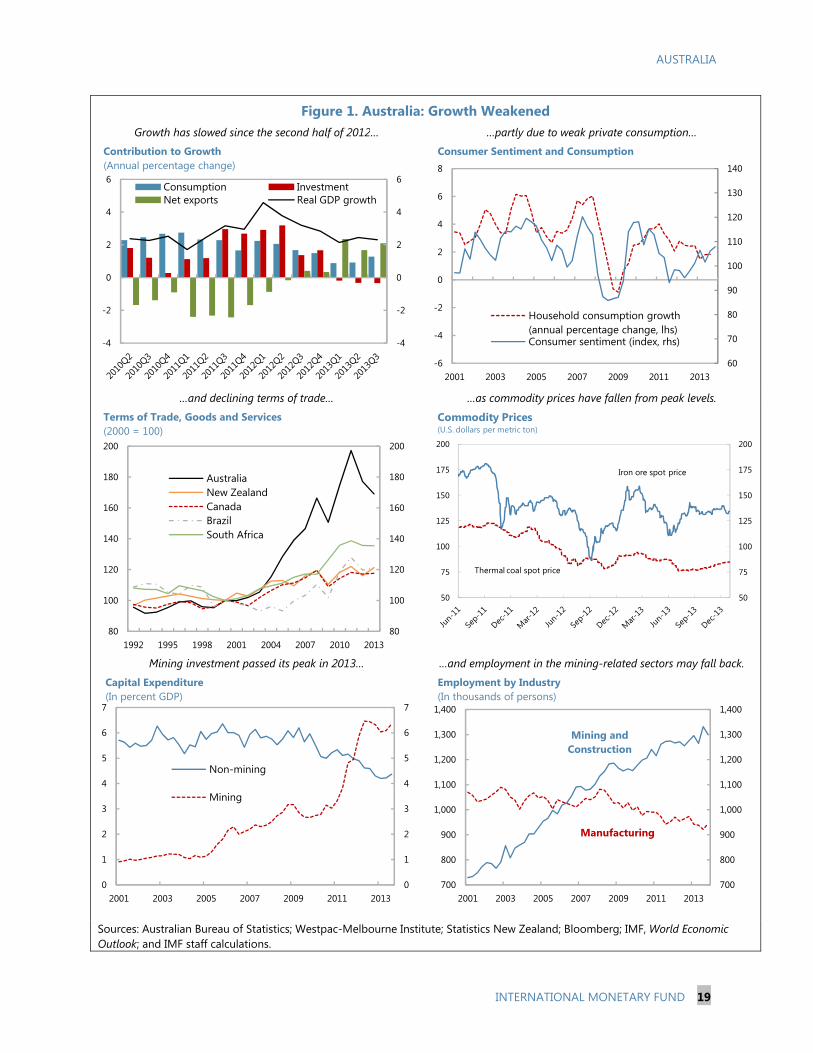
RECENT ECONOMIC DEVELOPMENTS 1. Setting. The Australian economy has performed well relative to many other advanced economies since the global financial crisis. However, a transition phase has now been reached as the terms-of-trade-driven mining investment boom of the past decade has peaked and the economy is moving to the production and export phase. Mining-related investment which accounted for almost half of GDP growth in the past couple of years is expected to drop sharply in the near term (text figure and Annex 4), and a recovery in non-mining investment will be needed to underpin demand and return the economy’s growth rate to trend.
2. Real economy developments. Annual growth has slowed to 2¼ percent in the third quarter of 2013, below the trend growth of around 3 percent. In addition to the slowdown of investment in new mining projects, non-mining investment has been weighed down by excess capacity and an overvalued exchange rate (Box 2, Figure 1). In line with relatively weak consumer sentiment, consumption growth has been modest and the household savings rate has remained above 10 percent, leaving the household debt-to-income ratio stable at around 150 percent. On the plus side mining exports, mainly to China, are growing as new capacity comes on stream and in recent months housing market activity has begun to pick up with building approvals, transactions, and prices increasing (paragraph 8 and Annex 2). Nevertheless labor market conditions have remained soft and the unemployment rate has risen gradually from a trough of 5 percent in mid-2011, in part reflecting the mining sector moving to the less labor-intensive production phase.
3. Inflation. Annual inflation slowed to 2¼ percent in the third quarter, close to the middle of the Reserve Bank of Australia’s (RBA) target band. With the weakening of overall labor market conditions wage inflation has slowed to 2¾ percent, the lowest rate since 2000 (text figure).
4. Monetary policy. In response to weakening demand the RBA has eased the policy rate by 225 basis points since November 2011 to 2½ percent, with the most recent cut in August 2013 (Figures 3 and 4). This has begun to support interest-sensitive spending and asset values. Market lending rates, key indicators of the overall monetary policy stance, are now well below their historical averages. Overall credit growth however has remained relatively subdued.
2.5
3
3.5
4
4.5
2.5
3
3.5
4
4.5
2000 2001 2002 2003 2004 2005 2006 2007 2008 2009 2010 2011 2012 2013
Australia: Wage Inflation(Annual percentage change)
Source: ABS.
0
1
2
3
4
5
6
7
8
0
1
2
3
4
5
6
7
8
Australia: Mining Investment(In percent of GDP)
Source: ABS; ANZ; and IMF staff calculations.
Projections
AUSTRALIA
INTERNATIONAL MONETARY FUND 5
5. Fiscal policy. The budget deficit was reduced from 3 percent of GDP to 1½ percent in 2012/13. The previous government’s goal of returning the budget to surplus last year was held back by slower-than-projected output growth and weaker commodity prices. Revenue fell short of projections as the lower terms of trade together with the persistently strong Australian dollar reduced nominal GDP and dented corporate profitability, with company tax revenue coming in around ½ percent of GDP lower than expected. Capital gains and resource rent taxes were also weak. Spending was somewhat higher than anticipated, exceeding plans by 1¼ percent of GDP.1
6. Recent market and financial sector developments. Aside from some welcome depreciation of the dollar, Australian markets were little affected by the market turbulence following the announcement of prospective Fed tapering in May 2013. The banking system has been performing well, with profitability remaining strong and balance sheets continuing to strengthen (paragraph 17).
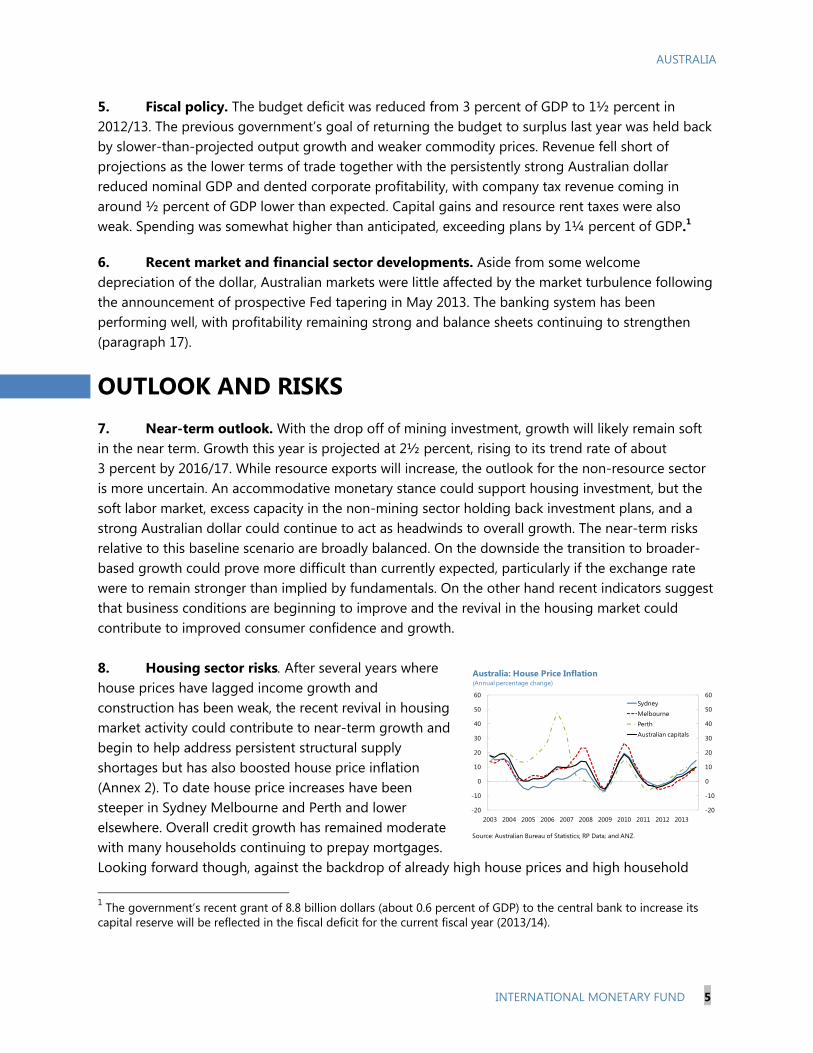
OUTLOOK AND RISKS 7. Near-term outlook. With the drop off of mining investment, growth will likely remain soft in the near term. Growth this year is projected at 2½ percent, rising to its trend rate of about 3 percent by 2016/17. While resource exports will increase, the outlook for the non-resource sector is more uncertain. An accommodative monetary stance could support housing investment, but the soft labor market, excess capacity in the non-mining sector holding back investment plans, and a strong Australian dollar could continue to act as headwinds to overall growth. The near-term risks relative to this baseline scenario are broadly balanced. On the downside the transition to broader-based growth could prove more difficult than currently expected, particularly if the exchange rate were to remain stronger than implied by fundamentals. On the other hand recent indicators suggest that business conditions are beginning to improve and the revival in the housing market could contribute to improved consumer confidence and growth. 8. Housing sector risks. After several years where house prices have lagged income growth and construction has been weak, the recent revival in housing market activity could contribute to near-term growth and begin to help address persistent structural supply shortages but has also boosted house price inflation (Annex 2). To date house price increases have been steeper in Sydney Melbourne and Perth and lower elsewhere. Overall credit growth has remained moderate with many households continuing to prepay mortgages. Looking forward though, against the backdrop of already high house prices and high household
1 The government’s recent grant of 8.8 billion dollars (about 0.6 percent of GDP) to the central bank to increase its capital reserve will be reflected in the fiscal deficit for the current fiscal year (2013/14).
-20
-10
0
10
20
30
40
50
60
-20
-10
0
10
20
30
40
50
60
2003 2004 2005 2006 2007 2008 2009 2010 2011 2012 2013
SydneyMelbournePerthAustralian capitals
Australia: House Price Inflation (Annual percentage change)
Source: Australian Bureau of Statistics; RP Data; and ANZ.
AUSTRALIA
6 INTERNATIONAL MONETARY FUND
debt, there is a risk that rapid house price growth could give rise to expectations-driven, self-reinforcing demand dynamics and price overshooting. In this context there have been some signs that banks have responded to increased demand pressures by increasing mortgage lending to the investor segment of the market (paragraph 20). A sudden house price decline—triggered perhaps by a shock to household incomes or borrowing costs—could reduce consumer confidence and impact overall economic activity. The authorities would need to be prepared to take preventative actions if household credit growth, transactions volume, and prices accelerate.
9. External risks. Australia’s growth prospects remain exposed to external developments (Annex 1). In particular:
A sharp slowdown in growth in China over the medium term and a related sustained decline in commodity prices. Over half of Australia’s exports go to emerging Asia and nearly two thirds are non-rural commodity exports. With the volume of these exports increasing sharply in future years, Australia’s economic outlook will be closely tied to developments in this region. Increases in global supply of Australian export commodities coming on stream are expected to bring about a steady decline in their prices—these projections are built into our baseline scenarios—but a sustained steep decline could have significant implications for Australia’s growth prospects (paragraph 27).
Surges in global financial market volatility related to the exit from unconventional monetary policy. An orderly tightening would likely have a positive impact by weakening the exchange rate and supporting the adjustment of the Australian economy. However, a bumpy exit from unconventional monetary policies and renewed international financial market volatility would likely raise the cost of Australian banks’ wholesale borrowing.
The external and domestic risks are closely interlinked. A hard landing in China could reduce demand for Australia’s mineral exports, worsen the terms of trade, reduce household income and trigger a fall in house prices. These interlinked risks could amplify any given shock as collateral effects further weaken consumer demand and growth, and could in turn lead to a market reassessment of Australia’s growth prospects, and negatively affecting banks’ balance sheets.2
2 The challenge in assessing the impact of an adverse scenario is that it is unlikely that a single risk identified would occur in isolation. Modeling tools aimed at identifying the impact of isolated shocks are not well suited for multiple simultaneous shocks. Bearing in mind these caveats, previous IMF work suggests that a one percent slowdown in China’s investment growth could lower growth in Australia by 0.2 percent (Ahuja and Nabar, IMF Working Paper 12/267). The recent work by Vitek (IMF Working Paper 13/253) estimates that the comovement of output gaps between China and Australia could be relatively weak. But these results are highly uncertain, and the effects on output would likely be bigger for joint shocks and given non-linearities. Rather than focusing on general equilibrium quantitative models, the Treasury estimates the sensitivity of their growth projections directly to terms of trade shocks (paragraph 27). Also, emphasizing forecasting challenges, a recent Treasury working paper looking at estimates of uncertainty around budget forecasts concludes that with a 70 percent confidence interval real GDP growth in 2013-14 is expected to range from 1½ to 3¼ percent.
AUSTRALIA
INTERNATIONAL MONETARY FUND 7
10. Policy space to manage risks. The floating exchange rate provides a key cushion against such shocks. The RBA has some room to respond, and the rapid and effective monetary transmission mechanism in Australia would allow for a nimble policy response should these risks emerge. But with the policy rate currently low at 2½ percent, the scope for monetary policy to offset shocks is limited and a sharp deterioration in the economic outlook would call for additional policy responses. As discussed below, Australia’s modest public debt level gives the authorities the scope to allow automatic stabilizers to operate in full and to temper the pace of budget deficit reduction when needed.
11. Potential Outward Spillovers. With Australia as its most important trade and financial partner, New Zealand is vulnerable to a sharp slowdown in Australia’s economic prospects.3 Beyond the trade linkages, Australian bank subsidiaries constitute 90 percent of New Zealand’s banking system (Figure 11). As subsidiaries rather than branches, however, New Zealand banks are financially ring-fenced, do not rely on their parents for funding, and are well-capitalized with substantial liquidity buffers, although they would likely suffer indirect reputational effects from financial stress in the parent which could affect their access to funding from global wholesale markets.4 Statutory obligations underpin cross-border cooperation between the two countries, improving regulatory and supervisory oversight.
12. Authorities’ views. Recognizing the risks to the domestic economy, the authorities have recently revised down near-term growth projections (currently in line with staff’s). They argued that the sustained reduction in policy rates should continue to support growth in interest-rate sensitive sectors—indeed, recent house price developments had been a not unexpected consequence of this policy, and are providing a boost to housing investment which has been structurally weak for some time. They noted that there has been some increase in mortgage lending, although overall household leverage has not picked up, suggesting that the housing sector has not yet become a near-term risk. Nonetheless they are closely monitoring the situation and believe they have the tools for a targeted and proportionate response to any emerging risks (paragraphs 21 and 22). The strength of the Australian dollar will be a key factor for growth prospects, and in this regard an early exit from unconventional monetary policies abroad is likely to contribute to a lower value for the Australian dollar, which would help facilitate an adjustment to broader-based growth. On the other hand, Australian assets’ relatively high credit ratings make them attractive to foreign investors, and there is a risk that shifts in portfolio preferences could result in capital inflows and put upward pressure on the Australian dollar. The authorities continue to regard a slowdown in China over the
3 There are also close trade and financial linkages with the Pacific Islands (see Global and Regional Spillovers to Pacific Island Countries Sheridan, Niamh ; Tumbarello, Patrizia ; Wu, Yiqun, IMF Working Paper 12/154, June 01, 2012) and these economies would also be affected by developments in Australia. 4 Analysis shows that New Zealand’s banking sector would be resilient in the face of a severe economic shock. A recent stress test conducted jointly by the Reserve Bank of New Zealand and APRA included a 40 percent fall in the world price of New Zealand’s commodity exports, a six-month freeze on wholesale debt markets, a cumulative output loss of 4 percent, a rise in unemployment to 11½ percent, and a fall in house, farm and commercial property prices of 30 percent. The test indicated that banks would still comply with the minimum Tier 1 capital ratio in place at the time of 4 percent (see New Zealand Article IV Consultation 2013, Country Report No. 13/177, Annex 1).
AUSTRALIA
8 INTERNATIONAL MONETARY FUND
medium term and a related fall in commodity prices as the main external risk to the Australian economy. They emphasized the role the floating exchange rate provides as a cushion against such shocks.
POLICIES TO SUSTAIN GROWTH 13. Monetary policy. Staff views the RBA’s monetary policy stance as broadly appropriate. Inflation is within the target range and inflation expectations remain well anchored. With growth currently on the soft side, the real exchange rate still strong, and efforts to reduce the budget deficit likely, monetary policy should remain accommodative and act as the primary macroeconomic tool for managing aggregate demand in the near term.
14. Fiscal policy. Australia's fiscal position compares well to its advanced economy peers, although debt has increased in the aftermath of the global financial crisis (Annex 5). The government considers it a priority to return the budget to surplus to preserve its favorable standing with external creditors against the background of relatively high overall net foreign debt (paragraph 23). To this end, the government has announced the broad aim of returning the budget to a sustained surplus, building to a 1 percent of GDP surplus by 2023/24. A more detailed framework will be established when the government announces its fiscal strategy in May. The government has also pledged to scrap the carbon tax and the mineral resource rent tax which will reduce revenue by about ¼ percentage point of GDP compared to total budget revenues from the mining sector of around 2 percent of GDP. Staff supported the broad aim of improving the budget position over the medium term, which would help rebuild fiscal buffers and increase the policy scope to deal with adverse shocks, but cautioned that it should be done in a way that does not disrupt growth prospects in the near term.
15. Consistency of the fiscal projections. Achieving and sustaining a surplus over the next decade will be challenging in light of current social spending commitments. Staff’s analysis shows that achieving a surplus would require either an increase in revenue or sizeable cuts in projected spending (Box 1). Early decisions on policy changes required to ensure the medium-term consistency of fiscal policy goals would help to preserve policy flexibility.
16. Authorities’ views. While recognizing relatively weak near-term growth prospects, the authorities expected private demand outside the mining sector to increase at a faster pace, though they pointed to the considerable uncertainties around the outlook. The RBA had not ruled out further interest rate cuts, but emphasized that the effects of the reduction in policy rates already made are still being felt. They also noted that foreign exchange intervention remained part of the policy toolkit, although more recently used only at times of market dysfunction. The government is expected to soon articulate its fiscal strategy in more details. To achieve the aim of returning to and maintaining a budget surplus, sizeable cuts in projected spending would be required. Important for this would be the recommendations of the National Commission of Audit’s Review of the efficiency and effectiveness of expenditure and of spending pressures over the medium term.
AUSTRALIA
INTERNATIONAL MONETARY FUND 9
Box 1. Medium-Term Fiscal Consistency
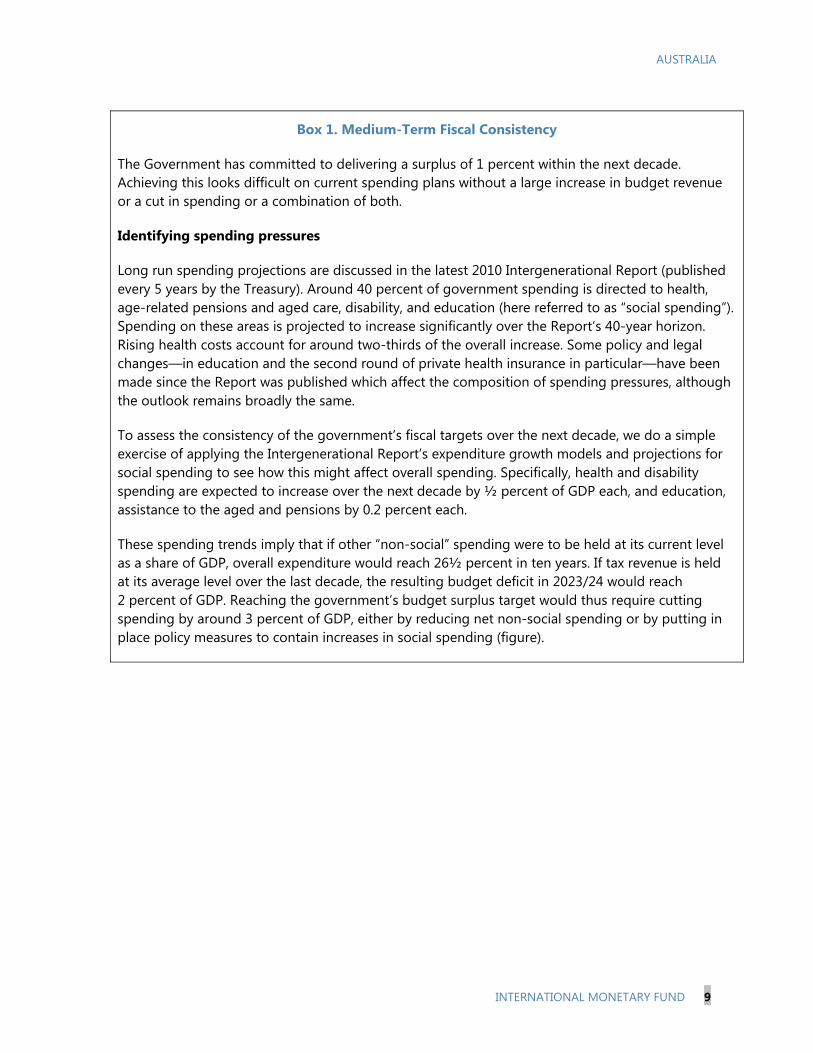
The Government has committed to delivering a surplus of 1 percent within the next decade. Achieving this looks difficult on current spending plans without a large increase in budget revenue or a cut in spending or a combination of both.
Identifying spending pressures
Long run spending projections are discussed in the latest 2010 Intergenerational Report (published every 5 years by the Treasury). Around 40 percent of government spending is directed to health, age-related pensions and aged care, disability, and education (here referred to as “social spending”). Spending on these areas is projected to increase significantly over the Report’s 40-year horizon. Rising health costs account for around two-thirds of the overall increase. Some policy and legal changes—in education and the second round of private health insurance in particular—have been made since the Report was published which affect the composition of spending pressures, although the outlook remains broadly the same.
To assess the consistency of the government’s fiscal targets over the next decade, we do a simple exercise of applying the Intergenerational Report’s expenditure growth models and projections for social spending to see how this might affect overall spending. Specifically, health and disability spending are expected to increase over the next decade by ½ percent of GDP each, and education, assistance to the aged and pensions by 0.2 percent each.
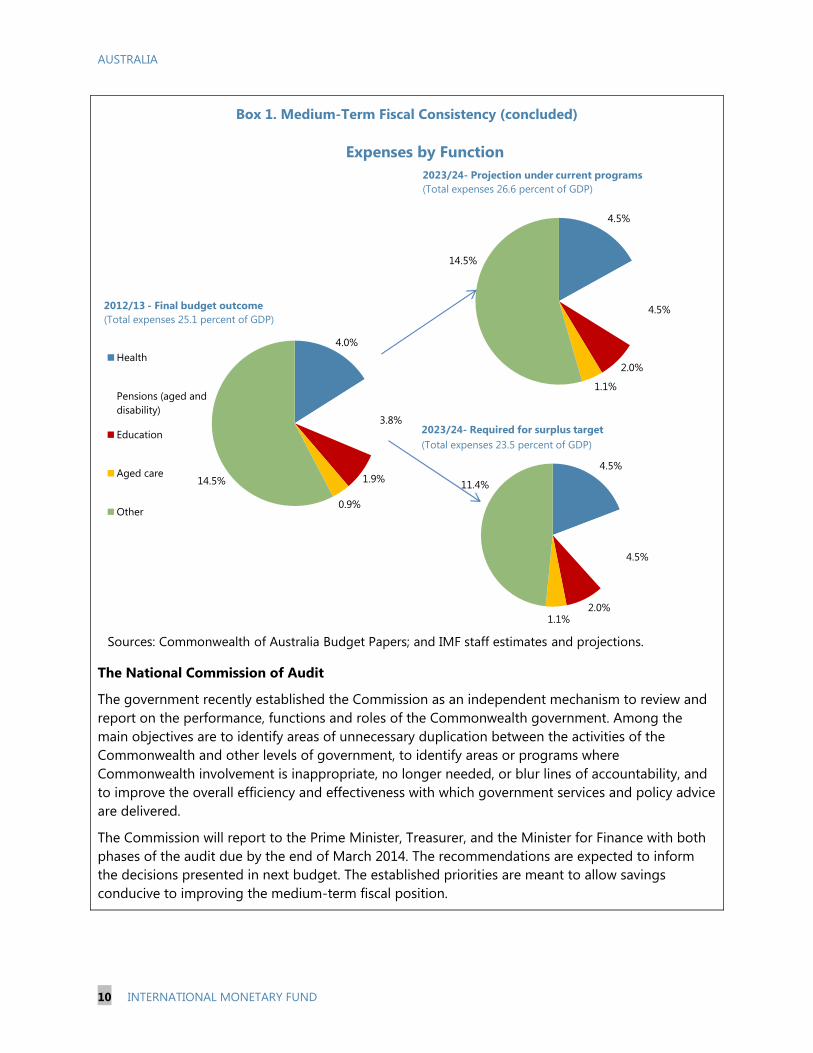
These spending trends imply that if other “non-social” spending were to be held at its current level as a share of GDP, overall expenditure would reach 26½ percent in ten years. If tax revenue is held at its average level over the last decade, the resulting budget deficit in 2023/24 would reach 2 percent of GDP. Reaching the government’s budget surplus target would thus require cutting spending by around 3 percent of GDP, either by reducing net non-social spending or by putting in place policy measures to contain increases in social spending (figure).
AUSTRALIA
10 INTERNATIONAL MONETARY FUND
Expenses by Function
4.0%
3.8%
1.9%
0.9%
14.5%
Health
Pensions (aged and disability)
Education
Aged care
Other
2012/13 - Final budget outcome(Total expenses 25.1 percent of GDP)
4.5%
4.5%
2.0%1.1%
11.4%
2023/24- Required for surplus target(Total expenses 23.5 percent of GDP)
4.5%
4.5%
2.0%
1.1%
14.5%
2023/24- Projection under current programs(Total expenses 26.6 percent of GDP)
Sources: Commonwealth of Australia Budget Papers; and IMF staff estimates and projections.
Box 1. Medium-Term Fiscal Consistency (concluded)
The National Commission of Audit
The government recently established the Commission as an independent mechanism to review and report on the performance, functions and roles of the Commonwealth government. Among the main objectives are to identify areas of unnecessary duplication between the activities of the Commonwealth and other levels of government, to identify areas or programs where Commonwealth involvement is inappropriate, no longer needed, or blur lines of accountability, and to improve the overall efficiency and effectiveness with which government services and policy advice are delivered.
The Commission will report to the Prime Minister, Treasurer, and the Minister for Finance with both phases of the audit due by the end of March 2014. The recommendations are expected to inform the decisions presented in next budget. The established priorities are meant to allow savings conducive to improving the medium-term fiscal position.
AUSTRALIA
INTERNATIONAL MONETARY FUND 11
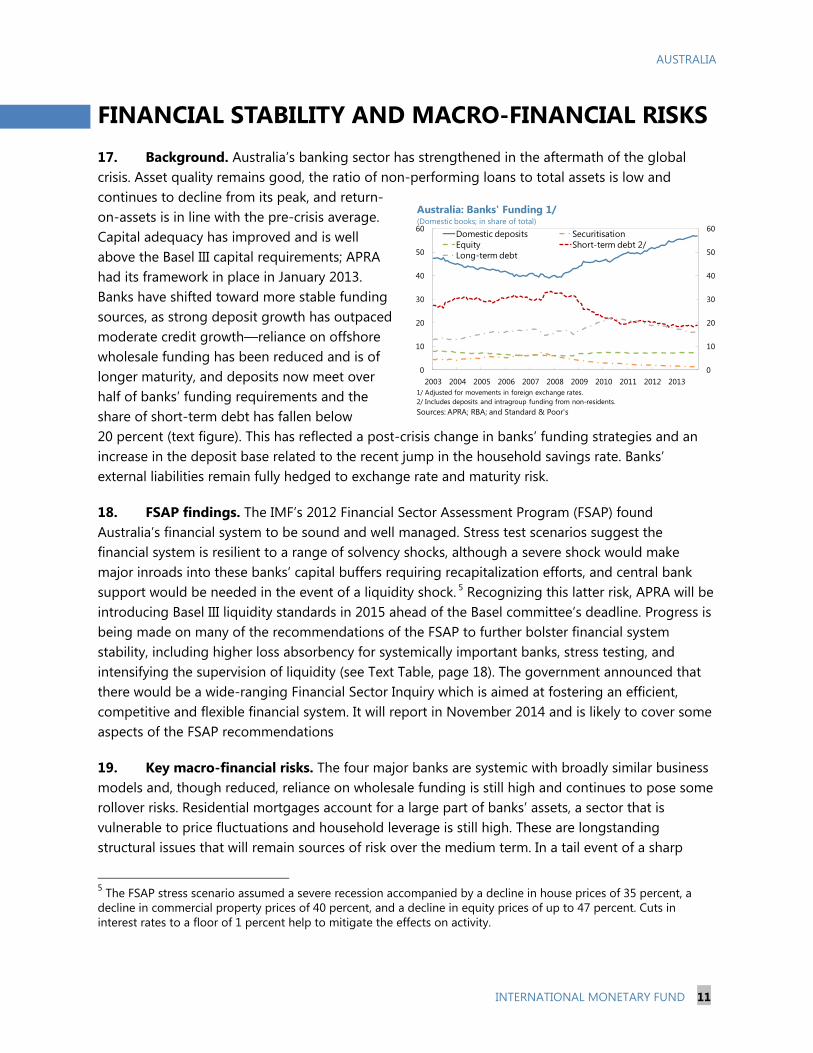
FINANCIAL STABILITY AND MACRO-FINANCIAL RISKS 17. Background. Australia’s banking sector has strengthened in the aftermath of the global crisis. Asset quality remains good, the ratio of non-performing loans to total assets is low and continues to decline from its peak, and return-on-assets is in line with the pre-crisis average. Capital adequacy has improved and is well above the Basel III capital requirements; APRA had its framework in place in January 2013. Banks have shifted toward more stable funding sources, as strong deposit growth has outpaced moderate credit growth—reliance on offshore wholesale funding has been reduced and is of longer maturity, and deposits now meet over half of banks’ funding requirements and the share of short-term debt has fallen below 20 percent (text figure). This has reflected a post-crisis change in banks’ funding strategies and an increase in the deposit base related to the recent jump in the household savings rate. Banks’ external liabilities remain fully hedged to exchange rate and maturity risk.
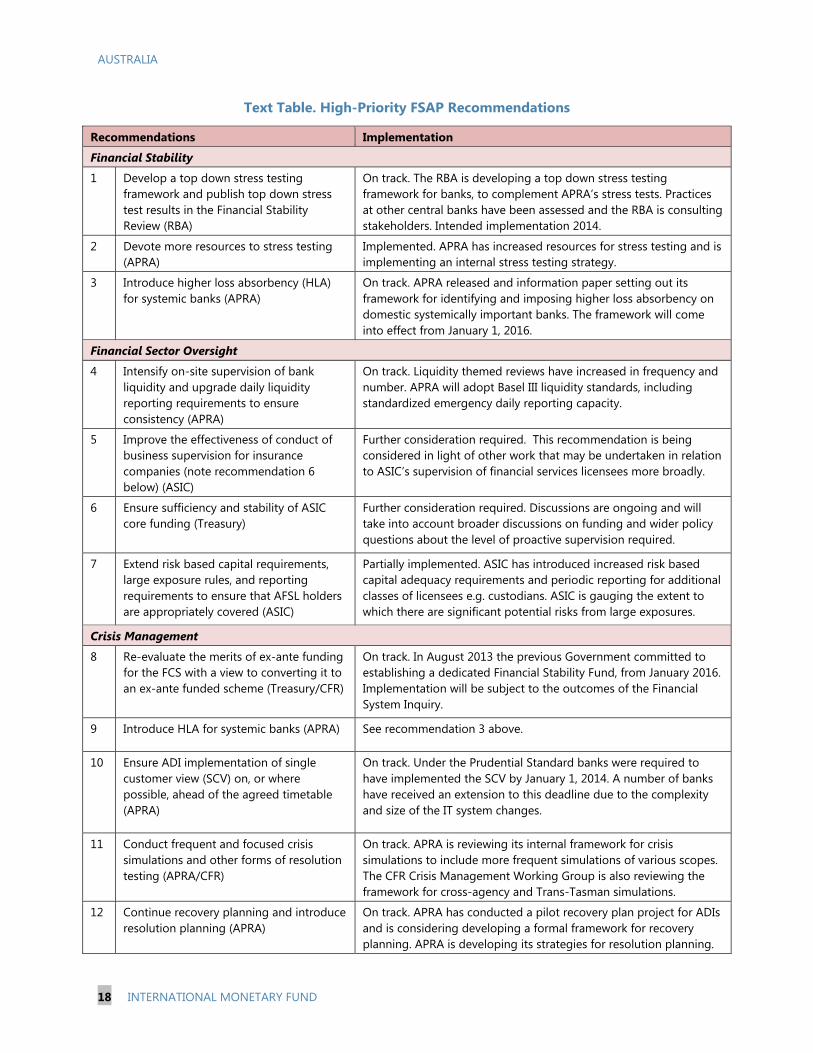
18. FSAP findings. The IMF’s 2012 Financial Sector Assessment Program (FSAP) found Australia’s financial system to be sound and well managed. Stress test scenarios suggest the financial system is resilient to a range of solvency shocks, although a severe shock would make major inroads into these banks’ capital buffers requiring recapitalization efforts, and central bank support would be needed in the event of a liquidity shock. 5 Recognizing this latter risk, APRA will be introducing Basel III liquidity standards in 2015 ahead of the Basel committee’s deadline. Progress is being made on many of the recommendations of the FSAP to further bolster financial system stability, including higher loss absorbency for systemically important banks, stress testing, and intensifying the supervision of liquidity (see Text Table, page 18). The government announced that there would be a wide-ranging Financial Sector Inquiry which is aimed at fostering an efficient, competitive and flexible financial system. It will report in November 2014 and is likely to cover some aspects of the FSAP recommendations
19. Key macro-financial risks. The four major banks are systemic with broadly similar business models and, though reduced, reliance on wholesale funding is still high and continues to pose some rollover risks. Residential mortgages account for a large part of banks’ assets, a sector that is vulnerable to price fluctuations and household leverage is still high. These are longstanding structural issues that will remain sources of risk over the medium term. In a tail event of a sharp
5 The FSAP stress scenario assumed a severe recession accompanied by a decline in house prices of 35 percent, a decline in commercial property prices of 40 percent, and a decline in equity prices of up to 47 percent. Cuts in interest rates to a floor of 1 percent help to mitigate the effects on activity.
0
10
20
30
40
50
60
0
10
20
30
40
50
60
2003 2004 2005 2006 2007 2008 2009 2010 2011 2012 2013
Domestic deposits SecuritisationEquity Short-term debt 2/Long-term debt
Australia: Banks' Funding 1/(Domestic books; in share of total)
1/ Adjusted for movements in foreign exchange rates.2/ Includes deposits and intragroup funding from non-residents.Sources: APRA; RBA; and Standard & Poor's
AUSTRALIA
12 INTERNATIONAL MONETARY FUND
increase in global financial market volatility, banks’ wholesale funding costs would rise and would likely be passed on to corporate and households. While monetary policy could still respond, its scope would be reduced. In these circumstances fiscal policy may need to provide support. Given Australia’s modest public debt, there is space to respond to a significant shock (see annex 5).
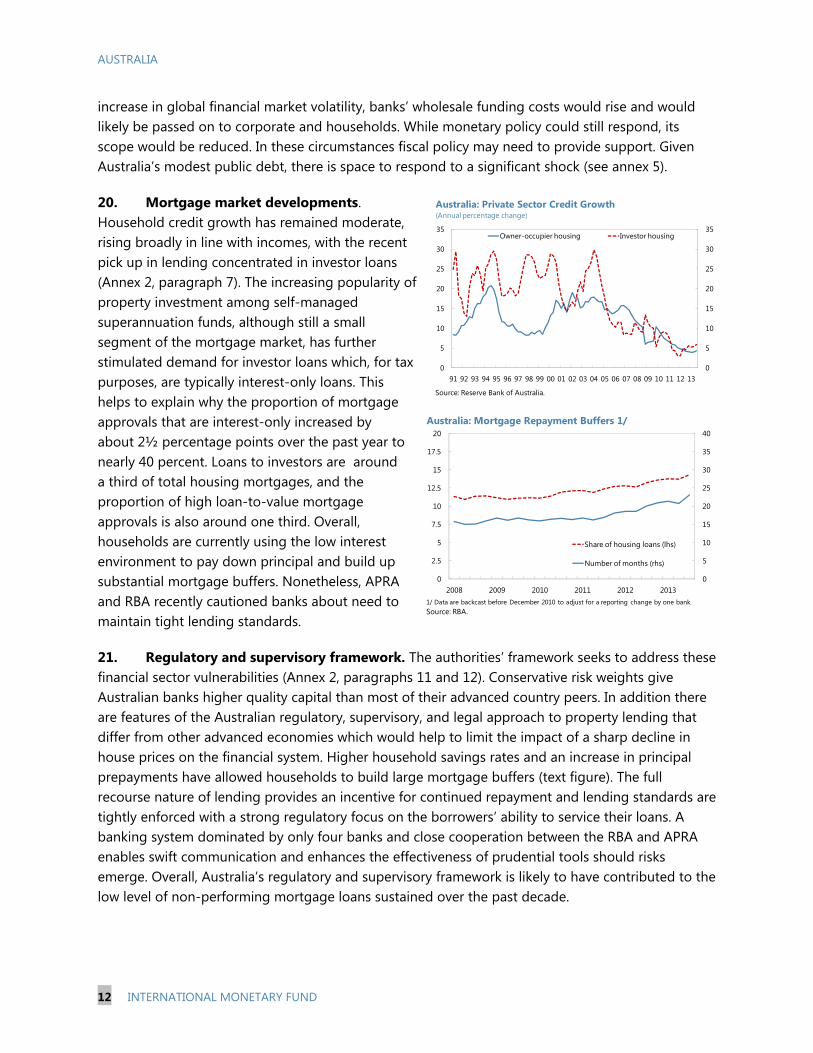
20. Mortgage market developments. Household credit growth has remained moderate, rising broadly in line with incomes, with the recent pick up in lending concentrated in investor loans (Annex 2, paragraph 7). The increasing popularity of property investment among self-managed superannuation funds, although still a small segment of the mortgage market, has further stimulated demand for investor loans which, for tax purposes, are typically interest-only loans. This helps to explain why the proportion of mortgage approvals that are interest-only increased by about 2½ percentage points over the past year to nearly 40 percent. Loans to investors are around a third of total housing mortgages, and the proportion of high loan-to-value mortgage approvals is also around one third. Overall, households are currently using the low interest environment to pay down principal and build up substantial mortgage buffers. Nonetheless, APRA and RBA recently cautioned banks about need to maintain tight lending standards.
21. Regulatory and supervisory framework. The authorities’ framework seeks to address these financial sector vulnerabilities (Annex 2, paragraphs 11 and 12). Conservative risk weights give Australian banks higher quality capital than most of their advanced country peers. In addition there are features of the Australian regulatory, supervisory, and legal approach to property lending that differ from other advanced economies which would help to limit the impact of a sharp decline in house prices on the financial system. Higher household savings rates and an increase in principal prepayments have allowed households to build large mortgage buffers (text figure). The full recourse nature of lending provides an incentive for continued repayment and lending standards are tightly enforced with a strong regulatory focus on the borrowers’ ability to service their loans. A banking system dominated by only four banks and close cooperation between the RBA and APRA enables swift communication and enhances the effectiveness of prudential tools should risks emerge. Overall, Australia’s regulatory and supervisory framework is likely to have contributed to the low level of non-performing mortgage loans sustained over the past decade.
0
5
10
15
20
25
30
35
0
5
10
15
20
25
30
35
91 92 93 94 95 96 97 98 99 00 01 02 03 04 05 06 07 08 09 10 11 12 13
Owner-occupier housing Investor housing
Australia: Private Sector Credit Growth(Annual percentage change)
Source: Reserve Bank of Australia.
0
5
10
15
20
25
30
35
40
0
2.5
5
7.5
10
12.5
15
17.5
20
2008 2009 2010 2011 2012 2013
Share of housing loans (lhs)
Number of months (rhs)
Australia: Mortgage Repayment Buffers 1/
1/ Data are backcast before December 2010 to adjust for a reporting change by one bank.Source: RBA.
AUSTRALIA
INTERNATIONAL MONETARY FUND 13
22. Authorities’ views. The authorities emphasized that should an acceleration in housing price inflation become a risk, their intensive supervisory approach gives them the tools to respond in a more targeted and less distortionary manner than through a more formal macroprudential policy framework. In particular, APRA's supervision involves continuous monitoring and oversight of regulated entities' behavior to ensure that they comply with prudential standards, are in a sound financial condition, and maintain effective governance and risk management systems. APRA follows a proactive and risk-based approach under which regulated entities that pose greater risks receive more intensive supervision. APRA generally prefers to adopt a suasion approach when it identifies weaknesses in lending standards, with communication with management and boards central to the approach. However, APRA can and does also impose prudential capital requirements beyond the minimum requirements of the Basel framework for individual authorized deposit taking institutions with higher risk profiles. The authorities also pointed to a wide range of legal powers that enable direct action where there are threats to financial stability. Coordination between authorities is conducted through the Council of Financial Regulators which includes the Treasury and the Australian Securities and Investments Commission (ASIC) as well as APRA and the RBA. The authorities highlighted this framework’s success in helping cool the housing market following the large run up in house prices in the early 2000s (Annex 2, paragraph 10).
ASSESSING EXTERNAL STABILITY 23. Current Account and external debt. Australia has run current account deficits for most of its history, with deficits averaging around 4 percent of GDP in the last three decades. This has reflected a structural saving-investment imbalance with very high private investment relative to a saving rate which is already high by advanced country standards, resulting in net external liabilities of around 55 percent of GDP (Annex 3). Looking forward, as imports related to mining investment decline and mining export capacity comes on stream, the trade balance should turn to surplus, offset by a widening income account deficit as global interest rates normalize and mining income accruing to foreign investors’ increases. On net the current account deficit is currently expected to remain below 4 percent of GDP over the medium term, stabilizing Australia’s net foreign liability position as a share of GDP. The stock of external debt has become more stable over the past several years—the decline in short-term offshore borrowing by banks and increased foreign holdings of long-term public debt have lengthened the maturity profile, and a major portion of resources sector investment has taken the form of less volatile foreign direct investment.
24. Exchange rate. Despite some recent depreciation the real exchange rate, currently in the range of 89 cents to the U.S. dollar, is 5-10 percent above the level predicted by Australia-specific factors from a medium-term perspective (Box 2). There are a number of factors contributing to the current high level of the Australian dollar, including the substantial capital inflows to fund the mining sector investment, the gap between domestic and foreign interest rates, and portfolio allocation towards Australian dollar assets by foreign institutional investors. If these factors were to ease, possibly triggered by exit from unconventional monetary policies by major advanced economies, the exchange rate would likely depreciate further, supporting the transition of the economy towards more balanced growth. Budget deficit reduction should help take pressure off the
AUSTRALIA
14 INTERNATIONAL MONETARY FUND
dollar over the medium term by boosting national savings, and additional steps to encourage private saving such as the planned increase in the superannuation contribution rate will also help.
Box 2. External Sector Assessment
Despite the recent depreciation the real effective exchange rate remains elevated and is still around 20 percent above the long run average since 1983. The current account deficit narrowed somewhat in 2013 as mining investment has begun to decline from the record levels reached this past year.
Model-based approaches in the IMF’s External Balance Assessment (EBA)1 suggest that Australia’s real exchange rate at the end of 2013 appears overvalued by 5-10 percent and the current account looks around ½ to 1½ percent of GDP weaker than implied by medium-term fundamentals and desirable policies domestically and globally, although the current account gap can be partly attributed to the mining investment boom. These estimates are, however, subject to considerable uncertainty. Cross-country panel regressions indicate that terms of trade gains and Australia’s positive interest rate differentials vis-à-vis other advanced countries have contributed to the high levels of the dollar in recent years. That part of the overvaluation not captured by the fundamental factors may be related to short-term factors including strong portfolio inflows, especially to the official government debt market since 2009.
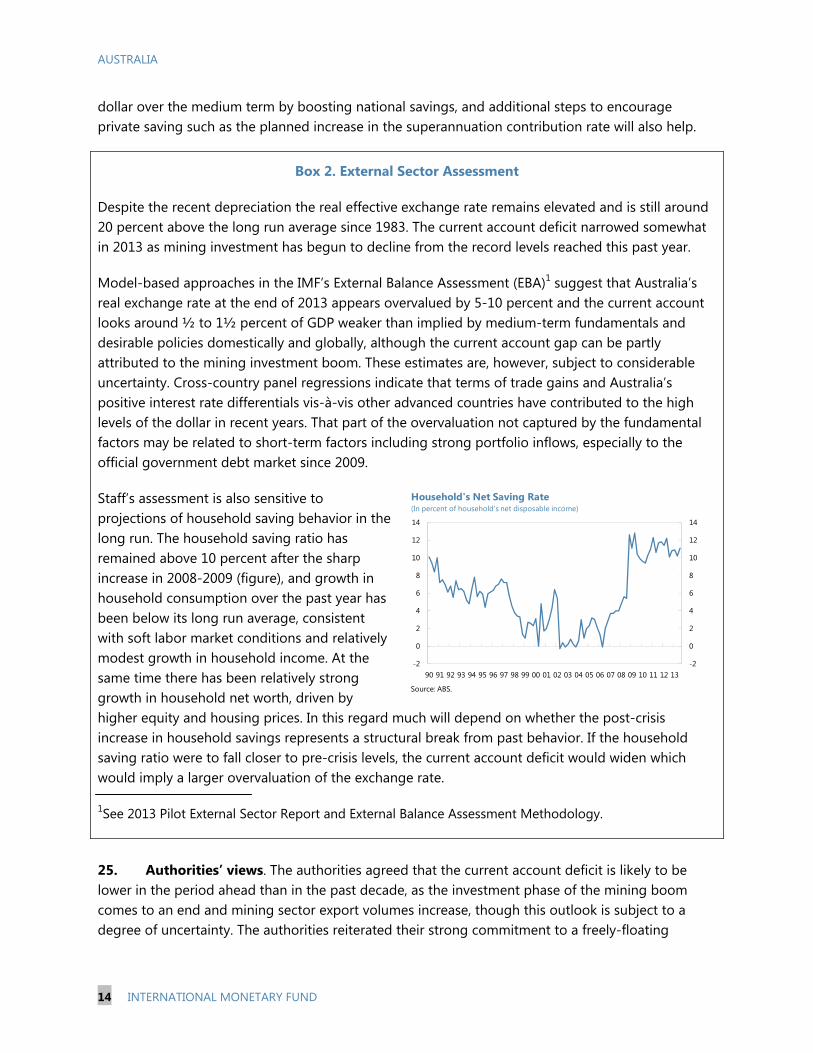
Staff’s assessment is also sensitive to projections of household saving behavior in the long run. The household saving ratio has remained above 10 percent after the sharp increase in 2008-2009 (figure), and growth in household consumption over the past year has been below its long run average, consistent with soft labor market conditions and relatively modest growth in household income. At the same time there has been relatively strong growth in household net worth, driven by higher equity and housing prices. In this regard much will depend on whether the post-crisis increase in household savings represents a structural break from past behavior. If the household saving ratio were to fall closer to pre-crisis levels, the current account deficit would widen which would imply a larger overvaluation of the exchange rate.
1See 2013 Pilot External Sector Report and External Balance Assessment Methodology.
25. Authorities’ views. The authorities agreed that the current account deficit is likely to be lower in the period ahead than in the past decade, as the investment phase of the mining boom comes to an end and mining sector export volumes increase, though this outlook is subject to a degree of uncertainty. The authorities reiterated their strong commitment to a freely-floating
-2
0
2
4
6
8
10
12
14
-2
0
2
4
6
8
10
12
14
90 91 92 93 94 95 96 97 98 99 00 01 02 03 04 05 06 07 08 09 10 11 12 13
Household's Net Saving Rate(In percent of household's net disposable income)
Source: ABS.
AUSTRALIA
INTERNATIONAL MONETARY FUND 15
exchange rate, emphasizing the role it has played in maintaining macroeconomic stability and containing external vulnerabilities—in contrast to past mining booms, the floating exchange rate has helped the economy to absorb a sharp increase in terms of trade without leading to an overheating domestic economy and a spike in inflation. Like staff, they expressed some surprise during consultations that the exchange rate had remained high despite the decline in the terms of trade, although it has depreciated more recently. Going forward, a lower level of the exchange rate would help balance growth in the economy. They noted that despite the level of net foreign liabilities, the economy as a whole has a net foreign currency asset position, and so a nominal exchange rate depreciation would strengthen Australia’s overall balance sheet.
ROLE OF THE MINING SECTOR AND SHIFT TO BROADER-BASED GROWTH 26. Resource investment boom and export prospects. Australia’s terms of trade strengthened to an historic high in 2011 driven by record high global prices for key Australian exports such as coal and iron ore, reflecting strong demand for steel in China (Annex 4). In response mining investment has risen from about 2 percent of GDP in 2002 to more than 8 percent of GDP expected last year. Investments in coal and iron ore drove the early pick up but more recently liquefied natural gas projects (LNG) have increased to meet rising global demand for energy. This year’s peak in investment will be followed by a sharp rise in mining export volumes as investment projects bear fruit—volumes of non-rural commodity exports including coal, iron ore and LNG are projected to grow by more than 30 percent in the next five years. As a result, total mining production’s share in the economy, currently about 10 percent of GDP, could rise by several percentage points over the next several years. Available resource deposits are large and are likely to remain for decades with an increased role of mining as a structural feature of the economy going forward.
27. Sensitivity to terms of trade shocks. The increased resources exports will make the economy more sensitive to terms of trade shocks. However, several factors should help mitigate the direct effects of a decline in the terms of trade. Export volumes for most mining sector projects are relatively inelastic to modest declines in prices, given their competitively low marginal production cost. The floating exchange rate can help buffer shocks by depreciating when the terms of trade fall, making other tradable goods and services more competitive. Since the mining companies have globally distributed shareholdings, the effect on profits will be spread between Australia and abroad. The indirect effects however could be large. The impact of a faster-than-anticipated decline in the terms of trade on nominal output would affect budget revenue more broadly. Income for sectors servicing the mining sector would also be reduced. The impact on domestic and foreign confidence, although difficult to predict, could be significant—consumer confidence would likely be affected and falling profit margins in the economy’s most dynamic sector could lead financial markets to reassess more generally Australia’s prospects and increase the country’s borrowing costs. The Treasury’s sensitivity analysis suggests that absent a depreciation, a permanent fall in terms of trade around
AUSTRALIA
16 INTERNATIONAL MONETARY FUND
4 percent would cause a fall in nominal GDP of ¾ to 1 percent and decrease the underlying budget cash balance by around ¼ percent.
28. Long-run growth. Robust income growth over the past decade has been supported in large part by the unprecedented increase in the terms of trade, which as it unwinds, is likely to detract from income growth going forward. This implies that a significant pickup in labor productivity will be needed to maintain growth in living standards over the coming decade (Annex 4, Box). While productivity in the mining sector should improve as the investments begin yielding results, this will not be enough to maintain current levels of per capita growth, and productivity growth in other sectors will also need to rise. Since Australia has already benefited from sizeable productivity improvements following substantial structural reforms in the 1990s, finding further scope for improvement will not be easy. A shift to broader-based growth would be helped by making the most of the opportunities offered by a growing Asian middle class, which could support demand for Australia’s services exports—in particular health, education, tourism and professional services.
29. Authorities’ views. The authorities agreed that the greater role of mining in the economy had increased Australia’s exposure to terms of trade fluctuations. Australia’s terms of trade have declined by almost 20 percent from their historic peak in 2011, and are expected to decline further over the coming years as global mining capacity increases. For this reason, the government’s medium-term budget revenue projections are based on a significant decline in the terms of trade. They emphasized that despite increased mining exports, the sector will still play a smaller role in Australia’s economy than the service sector, particularly with respect to employment. Finding ways of improving multifactor productivity is regarded as essential for maintaining growth in living standards going forward, and they agreed that this will be challenging. Addressing infrastructure bottlenecks is a key priority, and enhancing the framework for the selection and prioritization of infrastructure projects based on rigorous cost-benefit analysis, and including more involvement by the private sector, would help allow for spending on infrastructure consistent with the government’s deficit reduction goals.
STAFF APPRAISAL 30. Outlook. The Australian economy has reached a transition phase as the terms-of-trade-driven mining investment boom of the past decade has peaked and the economy is moving to the mining production and export phase. Mining-related investment is expected to drop sharply in the near term and a recovery in non-mining investment will be needed to underpin demand and return the economy’s growth rate to trend.
31. Risks. The recent revival in housing market activity is welcome as it could contribute to near-term growth and begin to help address persistent structural supply shortages, but the authorities will need to be prepared to take actions should credit growth and transactions volume pick up sharply to prevent an unsustainable acceleration in house price inflation. The main external risks include a sharp slowdown in growth in China over the medium term and the risk of a surge in global
AUSTRALIA
INTERNATIONAL MONETARY FUND 17
financial market volatility. The authorities have both monetary and fiscal policy space to react if the outlook deteriorates.
32. Monetary policy. Monetary policy should remain accommodative—inflation is within the target range, growth is currently on the soft side, and the real exchange rate is still strong. Monetary policy should act as the primary macroeconomic tool for managing aggregate demand in the near term.
33. Fiscal policy. The government’s aim to return the budget to surplus in the coming years will help rebuild fiscal buffers and increase the policy scope to deal with adverse shocks, but will be challenging in light of current social spending commitments. Cuts in projected spending and/or increased revenues are likely to be needed, and early decisions on policy changes required would help preserve policy flexibility.
34. Financial sector. The banking sector is sound, balance sheets have strengthened over the past year, and stress tests show the major banks would be able to withstand a sizeable shock to output, terms of trade, rising unemployment, and a fall in property prices. The banks remain exposed however to highly leveraged households and rollover risks associated with short-term offshore funding needs. The authorities’ intensive supervisory framework should allow for a targeted response if house price inflation becomes a risk, and there are features of the Australian regulatory and supervisory approach to property lending which would limit the impact of a sharp decline in house prices on the financial system.
35. External stability. Increasing mining exports should improve the trade balance, and the current account deficit should settle at a level that stabilizes Australia’s net foreign liabilities. Prospects for both near-term growth and external sustainability will depend on whether the exchange rate, which currently looks moderately overvalued, moves consistently with Australia’s fundamentals going forward. In this regard monetary policy tightening by major advanced economies would help weaken the dollar and support the transition toward more balanced growth.
36. Medium-term growth prospects. The increased role of the mining sector will make the economy more sensitive to terms of trade shocks. The floating exchange rate will play an essential role in buffering shocks by depreciating when terms of trade fall, making other tradable goods and services more competitive. The key challenge going forward will be finding ways of increasing productivity to maintain growth in Australia’s living standards. Addressing infrastructure bottlenecks in a manner consistent with the government’s deficit reduction goals is a priority.
37. It is recommended that the next article IV consultation be held on the standard 12-month cycle.
AUSTRALIA
18 INTERNATIONAL MONETARY FUND
Text Table. High-Priority FSAP Recommendations
Recommendations Implementation
Financial Stability
1 Develop a top down stress testing framework and publish top down stress test results in the Financial Stability Review (RBA)
On track. The RBA is developing a top down stress testing framework for banks, to complement APRA’s stress tests. Practices at other central banks have been assessed and the RBA is consulting stakeholders. Intended implementation 2014.
2 Devote more resources to stress testing (APRA)
Implemented. APRA has increased resources for stress testing and is implementing an internal stress testing strategy.
3 Introduce higher loss absorbency (HLA) for systemic banks (APRA)
On track. APRA released and information paper setting out its framework for identifying and imposing higher loss absorbency on domestic systemically important banks. The framework will come into effect from January 1, 2016.
Financial Sector Oversight
4 Intensify on-site supervision of bank liquidity and upgrade daily liquidity reporting requirements to ensure consistency (APRA)
On track. Liquidity themed reviews have increased in frequency and number. APRA will adopt Basel III liquidity standards, including standardized emergency daily reporting capacity.
5 Improve the effectiveness of conduct of business supervision for insurance companies (note recommendation 6 below) (ASIC)
Further consideration required. This recommendation is being considered in light of other work that may be undertaken in relation to ASIC’s supervision of financial services licensees more broadly.
6 Ensure sufficiency and stability of ASIC core funding (Treasury)
Further consideration required. Discussions are ongoing and will take into account broader discussions on funding and wider policy questions about the level of proactive supervision required.
7 Extend risk based capital requirements, large exposure rules, and reporting requirements to ensure that AFSL holders are appropriately covered (ASIC)
Partially implemented. ASIC has introduced increased risk based capital adequacy requirements and periodic reporting for additional classes of licensees e.g. custodians. ASIC is gauging the extent to which there are significant potential risks from large exposures.
Crisis Management
8 Re-evaluate the merits of ex-ante funding for the FCS with a view to converting it to an ex-ante funded scheme (Treasury/CFR)
On track. In August 2013 the previous Government committed to establishing a dedicated Financial Stability Fund, from January 2016. Implementation will be subject to the outcomes of the Financial System Inquiry.
9 Introduce HLA for systemic banks (APRA) See recommendation 3 above.
10 Ensure ADI implementation of single customer view (SCV) on, or where possible, ahead of the agreed timetable (APRA)
On track. Under the Prudential Standard banks were required to have implemented the SCV by January 1, 2014. A number of banks have received an extension to this deadline due to the complexity and size of the IT system changes.
11 Conduct frequent and focused crisis simulations and other forms of resolution testing (APRA/CFR)
On track. APRA is reviewing its internal framework for crisis simulations to include more frequent simulations of various scopes. The CFR Crisis Management Working Group is also reviewing the framework for cross-agency and Trans-Tasman simulations.
12 Continue recovery planning and introduce resolution planning (APRA)
On track. APRA has conducted a pilot recovery plan project for ADIs and is considering developing a formal framework for recovery planning. APRA is developing its strategies for resolution planning.
AUSTRALIA
INTERNATIONAL MONETARY FUND 19
Figure 1. Australia: Growth Weakened Growth has slowed since the second half of 2012… …partly due to weak private consumption…
…and declining terms of trade… …as commodity prices have fallen from peak levels.
Mining investment passed its peak in 2013… …and employment in the mining-related sectors may fall back.
Sources: Australian Bureau of Statistics; Westpac-Melbourne Institute; Statistics New Zealand; Bloomberg; IMF, World Economic Outlook; and IMF staff calculations.
-4
-2
0
2
4
6
-4
-2
0
2
4
6Consumption InvestmentNet exports Real GDP growth
Contribution to Growth(Annual percentage change)
60
70
80
90
100
110
120
130
140
-6
-4
-2
0
2
4
6
8
2001 2003 2005 2007 2009 2011 2013
Household consumption growth (annual percentage change, lhs)Consumer sentiment (index, rhs)
Consumer Sentiment and Consumption
80
100
120
140
160
180
200
80
100
120
140
160
180
200
1992 1995 1998 2001 2004 2007 2010 2013
AustraliaNew ZealandCanadaBrazilSouth Africa
Terms of Trade, Goods and Services(2000 = 100)
50
75
100
125
150
175
200
50
75
100
125
150
175
200
Commodity Prices(U.S. dollars per metric ton)
Thermal coal spot price
Iron ore spot price
0
1
2
3
4
5
6
7
0
1
2
3
4
5
6
7
2001 2003 2005 2007 2009 2011 2013
Non-mining
Mining
Capital Expenditure (In percent GDP)
700
800
900
1,000
1,100
1,200
1,300
1,400
700
800
900
1,000
1,100
1,200
1,300
1,400
2001 2003 2005 2007 2009 2011 2013
Mining andConstruction
Manufacturing
Employment by Industry(In thousands of persons)
AUSTRALIA
20 INTERNATIONAL MONETARY FUND
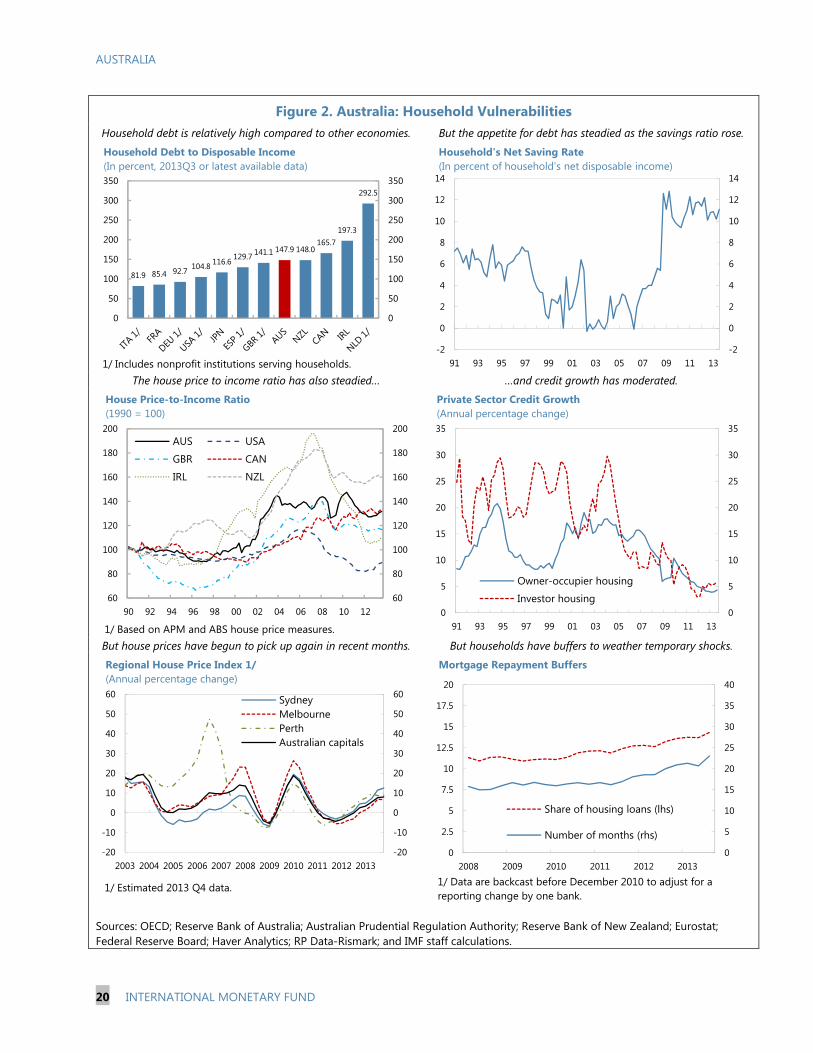
Figure 2. Australia: Household Vulnerabilities Household debt is relatively high compared to other economies. But the appetite for debt has steadied as the savings ratio rose.
The house price to income ratio has also steadied… …and credit growth has moderated.
But house prices have begun to pick up again in recent months. But households have buffers to weather temporary shocks.
Sources: OECD; Reserve Bank of Australia; Australian Prudential Regulation Authority; Reserve Bank of New Zealand; Eurostat; Federal Reserve Board; Haver Analytics; RP Data-Rismark; and IMF staff calculations.
81.9 85.4 92.7 104.8 116.6 129.7 141.1 147.9 148.0165.7
197.3
292.5
0
50
100
150
200
250
300
350
0
50
100
150
200
250
300
350
Household Debt to Disposable Income(In percent, 2013Q3 or latest available data)
1/ Includes nonprofit institutions serving households.-2
0
2
4
6
8
10
12
14
-2
0
2
4
6
8
10
12
14
91 93 95 97 99 01 03 05 07 09 11 13
Household's Net Saving Rate(In percent of household's net disposable income)
60
80
100
120
140
160
180
200
60
80
100
120
140
160
180
200
90 92 94 96 98 00 02 04 06 08 10 12
AUS USA
GBR CAN
IRL NZL
House Price-to-Income Ratio(1990 = 100)
1/ Based on APM and ABS house price measures.0
5
10
15
20
25
30
35
0
5
10
15
20
25
30
35
91 93 95 97 99 01 03 05 07 09 11 13
Owner-occupier housing
Investor housing
Private Sector Credit Growth(Annual percentage change)
-20
-10
0
10
20
30
40
50
60
-20
-10
0
10
20
30
40
50
60
2003 2004 2005 2006 2007 2008 2009 2010 2011 2012 2013
SydneyMelbournePerthAustralian capitals
Regional House Price Index 1/(Annual percentage change)
1/ Estimated 2013 Q4 data.
0
5
10
15
20
25
30
35
40
0
2.5
5
7.5
10
12.5
15
17.5
20
2008 2009 2010 2011 2012 2013
Share of housing loans (lhs)
Number of months (rhs)
Mortgage Repayment Buffers
1/ Data are backcast before December 2010 to adjust for a reporting change by one bank.
AUSTRALIA
INTERNATIONAL MONETARY FUND 21
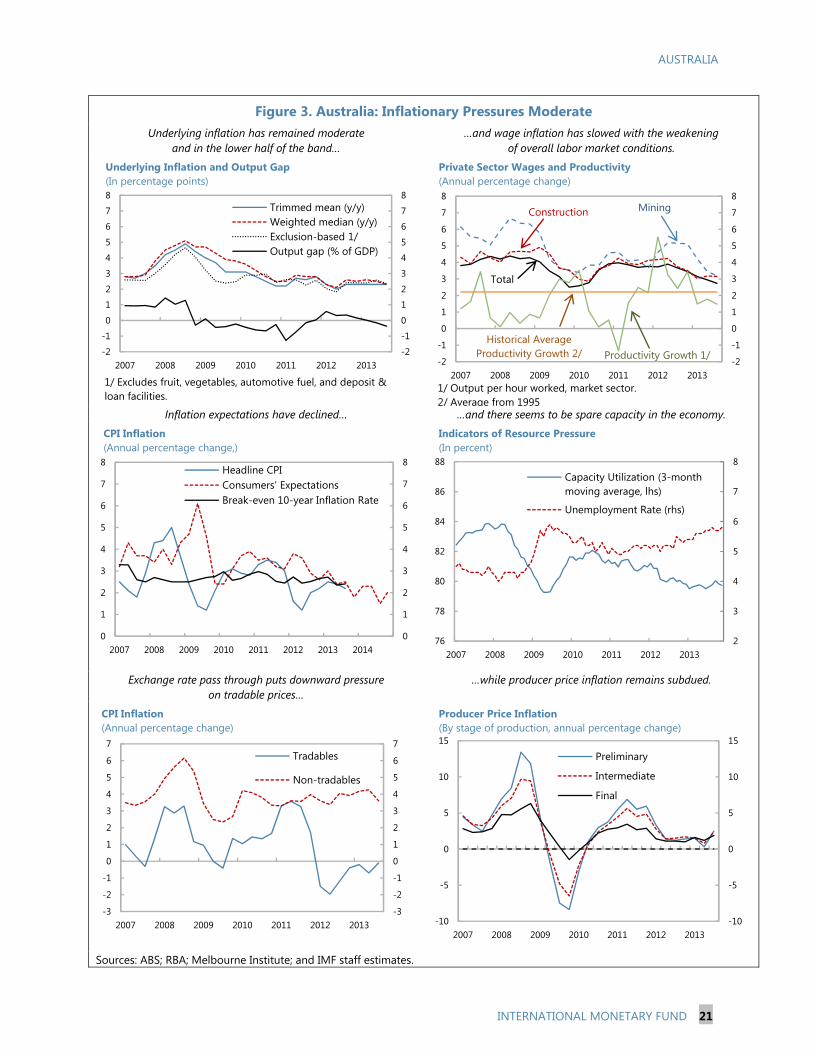
Figure 3. Australia: Inflationary Pressures Moderate Underlying inflation has remained moderate
and in the lower half of the band… …and wage inflation has slowed with the weakening
of overall labor market conditions.
Inflation expectations have declined… …and there seems to be spare capacity in the economy.
Exchange rate pass through puts downward pressure on tradable prices…
…while producer price inflation remains subdued.
Sources: ABS; RBA; Melbourne Institute; and IMF staff estimates.
-2
-1
0
1
2
3
4
5
6
7
8
-2
-1
0
1
2
3
4
5
6
7
8
2007 2008 2009 2010 2011 2012 2013
Trimmed mean (y/y)Weighted median (y/y)Exclusion-based 1/Output gap (% of GDP)
Underlying Inflation and Output Gap(In percentage points)
1/ Excludes fruit, vegetables, automotive fuel, and deposit & loan facilities.
-2
-1
0
1
2
3
4
5
6
7
8
-2
-1
0
1
2
3
4
5
6
7
8
2007 2008 2009 2010 2011 2012 2013
Private Sector Wages and Productivity(Annual percentage change)
1/ Output per hour worked, market sector.2/ Average from 1995
Historical Average Productivity Growth 2/ Productivity Growth 1/
Construction Mining
Total
0
1
2
3
4
5
6
7
8
0
1
2
3
4
5
6
7
8
2007 2008 2009 2010 2011 2012 2013 2014
Headline CPIConsumers' ExpectationsBreak-even 10-year Inflation Rate
CPI Inflation(Annual percentage change,)
2
3
4
5
6
7
8
76
78
80
82
84
86
88
2007 2008 2009 2010 2011 2012 2013
Capacity Utilization (3-month moving average, lhs)
Unemployment Rate (rhs)
Indicators of Resource Pressure(In percent)
-3
-2
-1
0
1
2
3
4
5
6
7
-3
-2
-1
0
1
2
3
4
5
6
7
2007 2008 2009 2010 2011 2012 2013
Tradables
Non-tradables
CPI Inflation(Annual percentage change)
-10
-5
0
5
10
15
-10
-5
0
5
10
15
2007 2008 2009 2010 2011 2012 2013
Preliminary
Intermediate
Final
Producer Price Inflation(By stage of production, annual percentage change)
AUSTRALIA
22 INTERNATIONAL MONETARY FUND
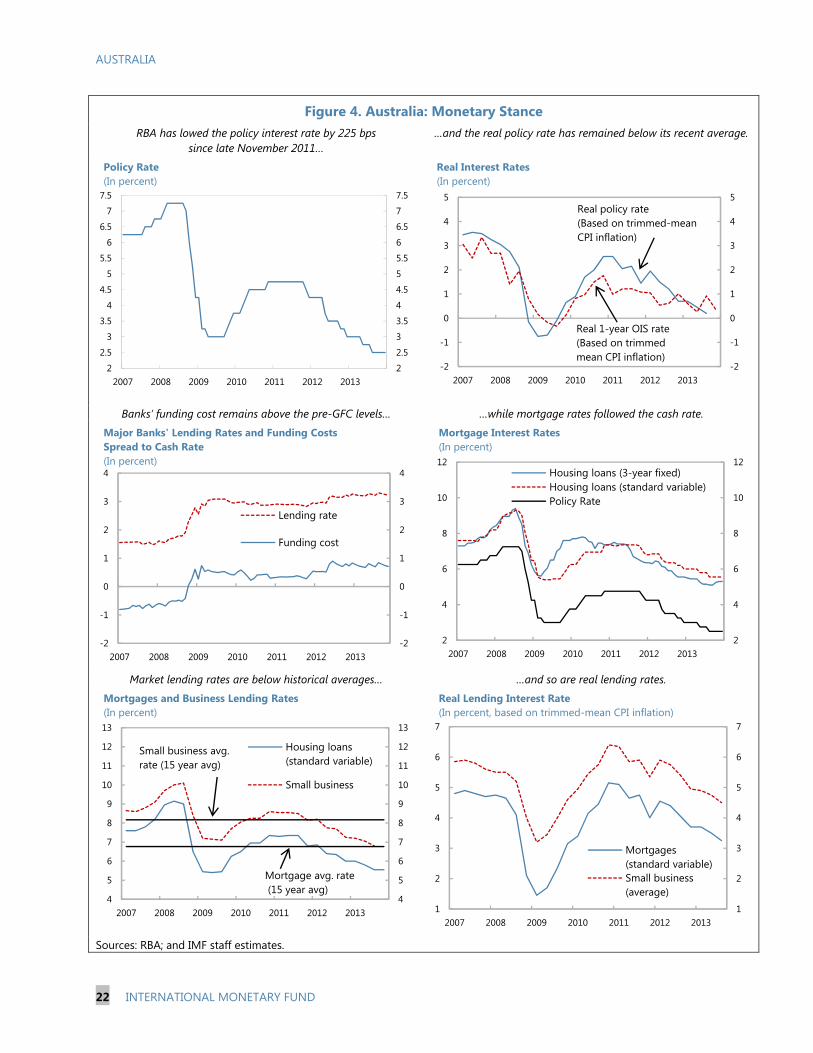
Figure 4. Australia: Monetary Stance RBA has lowed the policy interest rate by 225 bps
since late November 2011… …and the real policy rate has remained below its recent average.
Banks’ funding cost remains above the pre-GFC levels… …while mortgage rates followed the cash rate.
Market lending rates are below historical averages… …and so are real lending rates.
Sources: RBA; and IMF staff estimates.
2
2.5
3
3.5
4
4.5
5
5.5
6
6.5
7
7.5
2
2.5
3
3.5
4
4.5
5
5.5
6
6.5
7
7.5
2007 2008 2009 2010 2011 2012 2013
Policy Rate(In percent)
-2
-1
0
1
2
3
4
5
-2
-1
0
1
2
3
4
5
2007 2008 2009 2010 2011 2012 2013
Real Interest Rates(In percent)
Real policy rate(Based on trimmed-mean CPI inflation)
Real 1-year OIS rate(Based on trimmed mean CPI inflation)
-2
-1
0
1
2
3
4
-2
-1
0
1
2
3
4
2007 2008 2009 2010 2011 2012 2013
Lending rate
Funding cost
Major Banks' Lending Rates and Funding Costs Spread to Cash Rate(In percent)
2
4
6
8
10
12
2
4
6
8
10
12
2007 2008 2009 2010 2011 2012 2013
Housing loans (3-year fixed)Housing loans (standard variable)Policy Rate
Mortgage Interest Rates(In percent)
4
5
6
7
8
9
10
11
12
13
4
5
6
7
8
9
10
11
12
13
2007 2008 2009 2010 2011 2012 2013
Housing loans (standard variable)
Small business
Mortgages and Business Lending Rates(In percent)
Small business avg. rate (15 year avg)
Mortgage avg. rate(15 year avg)
1
2
3
4
5
6
7
1
2
3
4
5
6
7
2007 2008 2009 2010 2011 2012 2013
Mortgages (standard variable)Small business (average)
Real Lending Interest Rate (In percent, based on trimmed-mean CPI inflation)
AUSTRALIA
INTERNATIONAL MONETARY FUND 23
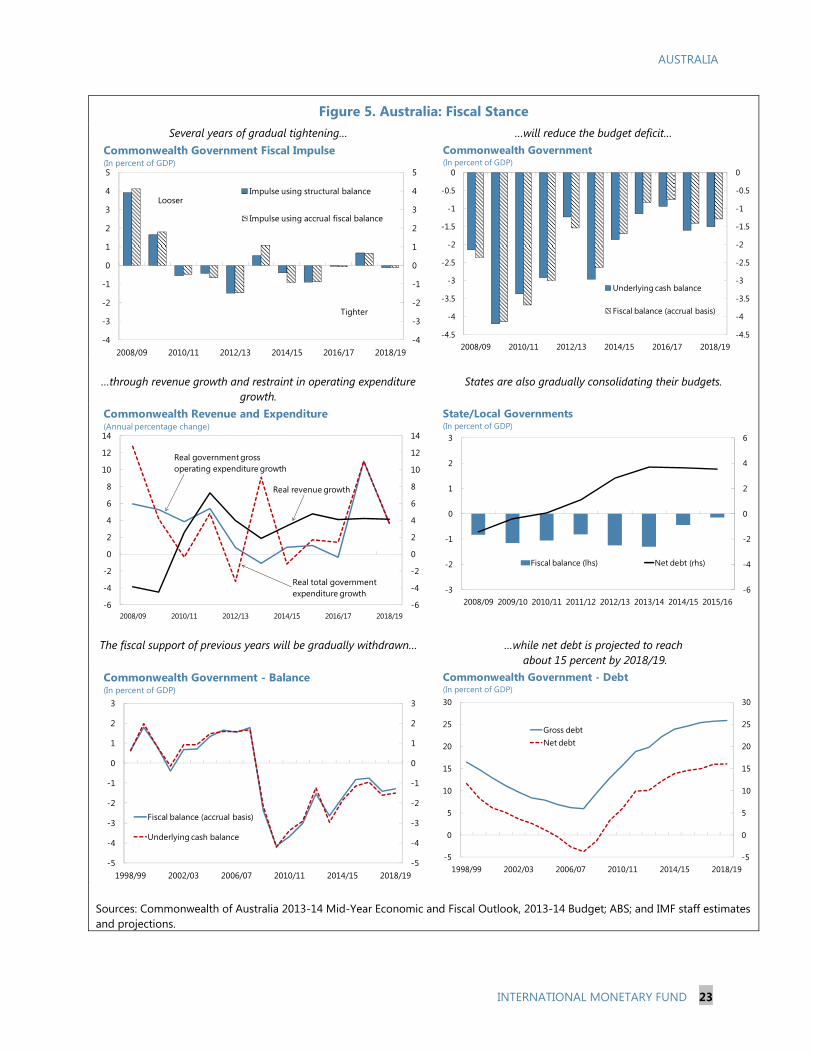
Figure 5. Australia: Fiscal Stance Several years of gradual tightening… …will reduce the budget deficit…
…through revenue growth and restraint in operating expenditure growth.
States are also gradually consolidating their budgets.
The fiscal support of previous years will be gradually withdrawn…
…while net debt is projected to reach
about 15 percent by 2018/19.
Sources: Commonwealth of Australia 2013-14 Mid-Year Economic and Fiscal Outlook, 2013-14 Budget; ABS; and IMF staff estimates and projections.
-4
-3
-2
-1
0
1
2
3
4
5
-4
-3
-2
-1
0
1
2
3
4
5
2008/09 2010/11 2012/13 2014/15 2016/17 2018/19
Impulse using structural balance
Impulse using accrual fiscal balance
Tighter
Looser
Commonwealth Government Fiscal Impulse(In percent of GDP)
-4.5
-4
-3.5
-3
-2.5
-2
-1.5
-1
-0.5
0
-4.5
-4
-3.5
-3
-2.5
-2
-1.5
-1
-0.5
0
2008/09 2010/11 2012/13 2014/15 2016/17 2018/19
Underlying cash balance
Fiscal balance (accrual basis)
Commonwealth Government(In percent of GDP)
-6
-4
-2
0
2
4
6
8
10
12
14
-6
-4
-2
0
2
4
6
8
10
12
14
2008/09 2010/11 2012/13 2014/15 2016/17 2018/19
Real government grossoperating expenditure growth
Real total government expenditure growth
Real revenue growth
Commonwealth Revenue and Expenditure(Annual percentage change)
-6
-4
-2
0
2
4
6
-3
-2
-1
0
1
2
3
2008/09 2009/10 2010/11 2011/12 2012/13 2013/14 2014/15 2015/16
Fiscal balance (lhs) Net debt (rhs)
State/Local Governments(In percent of GDP)
-5
-4
-3
-2
-1
0
1
2
3
-5
-4
-3
-2
-1
0
1
2
3
1998/99 2002/03 2006/07 2010/11 2014/15 2018/19
Fiscal balance (accrual basis)
Underlying cash balance
Commonwealth Government - Balance(In percent of GDP)
-5
0
5
10
15
20
25
30
-5
0
5
10
15
20
25
30
1998/99 2002/03 2006/07 2010/11 2014/15 2018/19
Gross debtNet debt
Commonwealth Government - Debt(In percent of GDP)
AUSTRALIA
24 INTERNATIONAL MONETARY FUND
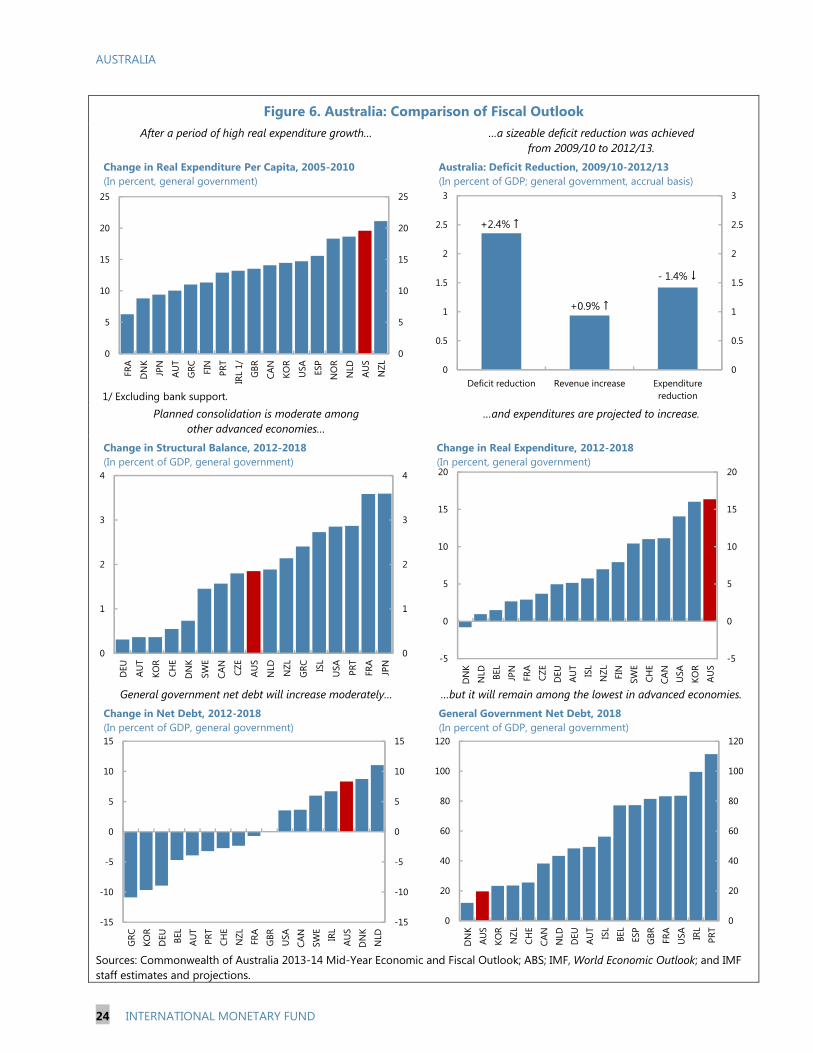
Figure 6. Australia: Comparison of Fiscal Outlook After a period of high real expenditure growth… …a sizeable deficit reduction was achieved
from 2009/10 to 2012/13.
Planned consolidation is moderate among other advanced economies…
…and expenditures are projected to increase.
General government net debt will increase moderately… …but it will remain among the lowest in advanced economies.
Sources: Commonwealth of Australia 2013-14 Mid-Year Economic and Fiscal Outlook; ABS; IMF, World Economic Outlook; and IMF staff estimates and projections.
0
5
10
15
20
25
0
5
10
15
20
25
FRA
DN
K
JPN
AUT
GRC FIN
PRT
IRL
1/
GBR
CAN
KOR
USA ES
P
NO
R
NLD
AUS
NZL
Change in Real Expenditure Per Capita, 2005-2010(In percent, general government)
1/ Excluding bank support.
0
0.5
1
1.5
2
2.5
3
0
0.5
1
1.5
2
2.5
3
Deficit reduction Revenue increase Expenditure reduction
Australia: Deficit Reduction, 2009/10-2012/13(In percent of GDP; general government, accrual basis)
- 1.4% ↓
+2.4% ↑
+0.9% ↑
0
1
2
3
4
0
1
2
3
4
DEU
AUT
KOR
CHE
DN
K
SWE
CAN
CZE
AUS
NLD NZL
GRC IS
L
USA PR
T
FRA
JPN
Change in Structural Balance, 2012-2018(In percent of GDP, general government)
-5
0
5
10
15
20
-5
0
5
10
15
20D
NK
NLD BE
L
JPN
FRA
CZE
DEU
AUT
ISL
NZL FIN
SWE
CHE
CAN
USA
KOR
AUS
Change in Real Expenditure, 2012-2018(In percent, general government)
-15
-10
-5
0
5
10
15
-15
-10
-5
0
5
10
15
GRC
KOR
DEU BE
L
AUT
PRT
CHE
NZL
FRA
GBR
USA
CAN
SWE
IRL
AUS
DN
K
NLD
Change in Net Debt, 2012-2018(In percent of GDP, general government)
0
20
40
60
80
100
120
0
20
40
60
80
100
120
DN
K
AUS
KOR
NZL
CHE
CAN
NLD
DEU
AUT
ISL
BEL
ESP
GBR FRA
USA IR
L
PRT
General Government Net Debt, 2018(In percent of GDP, general government)
AUSTRALIA
INTERNATIONAL MONETARY FUND 25
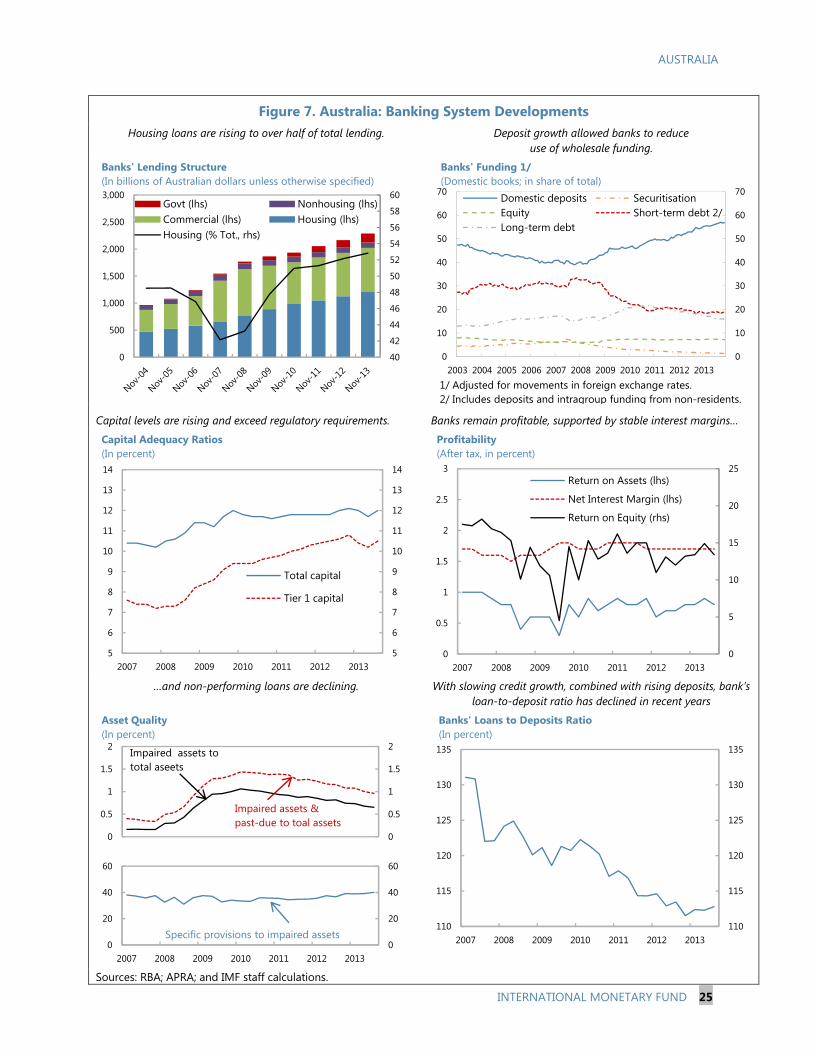
Figure 7. Australia: Banking System Developments Housing loans are rising to over half of total lending. Deposit growth allowed banks to reduce
use of wholesale funding.
Capital levels are rising and exceed regulatory requirements. Banks remain profitable, supported by stable interest margins…
…and non-performing loans are declining. With slowing credit growth, combined with rising deposits, bank’s loan-to-deposit ratio has declined in recent years
Sources: RBA; APRA; and IMF staff calculations.
40
42
44
46
48
50
52
54
56
58
60
0
500
1,000
1,500
2,000
2,500
3,000Govt (lhs) Nonhousing (lhs)Commercial (lhs) Housing (lhs)Housing (% Tot., rhs)
Banks' Lending Structure(In billions of Australian dollars unless otherwise specified)
0
10
20
30
40
50
60
70
0
10
20
30
40
50
60
70
2003 2004 2005 2006 2007 2008 2009 2010 2011 2012 2013
Domestic deposits SecuritisationEquity Short-term debt 2/Long-term debt
Banks' Funding 1/(Domestic books; in share of total)
1/ Adjusted for movements in foreign exchange rates.2/ Includes deposits and intragroup funding from non-residents.
5
6
7
8
9
10
11
12
13
14
5
6
7
8
9
10
11
12
13
14
2007 2008 2009 2010 2011 2012 2013
Total capital
Tier 1 capital
Capital Adequacy Ratios(In percent)
0
5
10
15
20
25
0
0.5
1
1.5
2
2.5
3
2007 2008 2009 2010 2011 2012 2013
Return on Assets (lhs)
Net Interest Margin (lhs)
Return on Equity (rhs)
Profitability(After tax, in percent)
0
0.5
1
1.5
2
0
0.5
1
1.5
2
Asset Quality(In percent)
Impaired assets & past-due to toal assets
Impaired assets to total aseets
0
20
40
60
0
20
40
60
2007 2008 2009 2010 2011 2012 2013
Specific provisions to impaired assets110
115
120
125
130
135
110
115
120
125
130
135
2007 2008 2009 2010 2011 2012 2013
Banks' Loans to Deposits Ratio(In percent)
AUSTRALIA
26 INTERNATIONAL MONETARY FUND
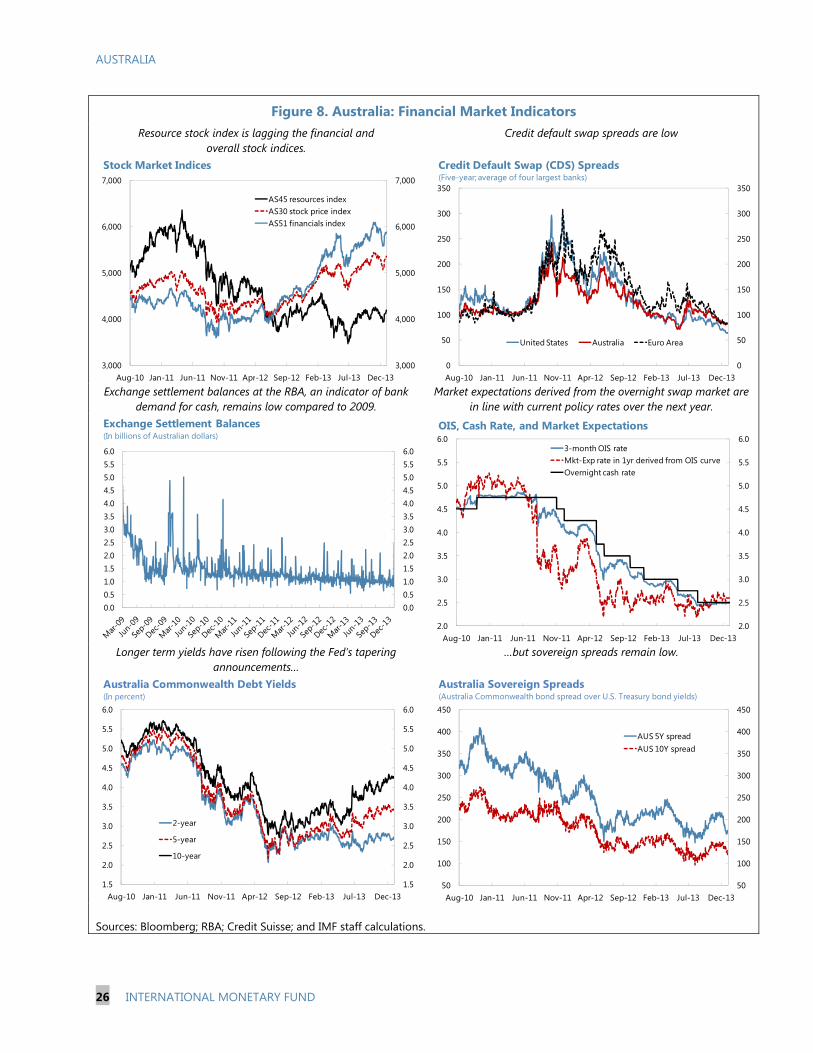
Figure 8. Australia: Financial Market Indicators Resource stock index is lagging the financial and
overall stock indices. Credit default swap spreads are low
Exchange settlement balances at the RBA, an indicator of bank demand for cash, remains low compared to 2009.
Market expectations derived from the overnight swap market are in line with current policy rates over the next year.
Longer term yields have risen following the Fed’s tapering announcements…
…but sovereign spreads remain low.
Sources: Bloomberg; RBA; Credit Suisse; and IMF staff calculations.
3,000
4,000
5,000
6,000
7,000
3,000
4,000
5,000
6,000
7,000
Aug-10 Jan-11 Jun-11 Nov-11 Apr-12 Sep-12 Feb-13 Jul-13 Dec-13
AS45 resources indexAS30 stock price indexAS51 financials index
Stock Market Indices
0
50
100
150
200
250
300
350
0
50
100
150
200
250
300
350
Aug-10 Jan-11 Jun-11 Nov-11 Apr-12 Sep-12 Feb-13 Jul-13 Dec-13
United States Australia Euro Area
Credit Default Swap (CDS) Spreads(Five-year; average of four largest banks)
0.00.51.01.52.02.53.03.54.04.55.05.56.0
0.00.51.01.52.02.53.03.54.04.55.05.56.0
Exchange Settlement Balances(In billions of Australian dollars)
2.0
2.5
3.0
3.5
4.0
4.5
5.0
5.5
6.0
2.0
2.5
3.0
3.5
4.0
4.5
5.0
5.5
6.0
Aug-10 Jan-11 Jun-11 Nov-11 Apr-12 Sep-12 Feb-13 Jul-13 Dec-13
3-month OIS rateMkt-Exp rate in 1yr derived from OIS curveOvernight cash rate
OIS, Cash Rate, and Market Expectations
1.5
2.0
2.5
3.0
3.5
4.0
4.5
5.0
5.5
6.0
1.5
2.0
2.5
3.0
3.5
4.0
4.5
5.0
5.5
6.0
Aug-10 Jan-11 Jun-11 Nov-11 Apr-12 Sep-12 Feb-13 Jul-13 Dec-13
2-year
5-year
10-year
Australia Commonwealth Debt Yields(In percent)
50
100
150
200
250
300
350
400
450
50
100
150
200
250
300
350
400
450
Aug-10 Jan-11 Jun-11 Nov-11 Apr-12 Sep-12 Feb-13 Jul-13 Dec-13
AUS 5Y spreadAUS 10Y spread
Australia Sovereign Spreads(Australia Commonwealth bond spread over U.S. Treasury bond yields)
AUSTRALIA
INTERNATIONAL MONETARY FUND 27
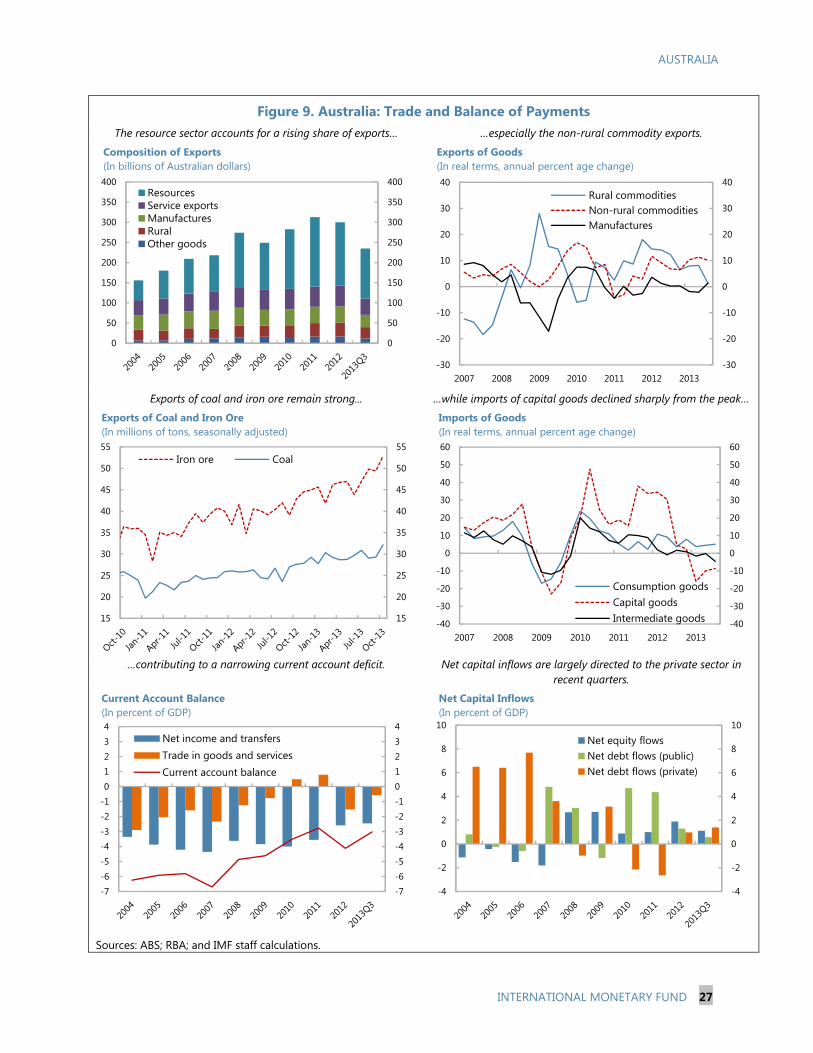
Figure 9. Australia: Trade and Balance of Payments The resource sector accounts for a rising share of exports… …especially the non-rural commodity exports.
Exports of coal and iron ore remain strong... …while imports of capital goods declined sharply from the peak…
…contributing to a narrowing current account deficit. Net capital inflows are largely directed to the private sector in recent quarters.
Sources: ABS; RBA; and IMF staff calculations.
0
50
100
150
200
250
300
350
400
0
50
100
150
200
250
300
350
400ResourcesService exportsManufacturesRuralOther goods
Composition of Exports(In billions of Australian dollars)
-30
-20
-10
0
10
20
30
40
-30
-20
-10
0
10
20
30
40
2007 2008 2009 2010 2011 2012 2013
Rural commoditiesNon-rural commoditiesManufactures
Exports of Goods(In real terms, annual percent age change)
15
20
25
30
35
40
45
50
55
15
20
25
30
35
40
45
50
55Iron ore Coal
Exports of Coal and Iron Ore(In millions of tons, seasonally adjusted)
-40
-30
-20
-10
0
10
20
30
40
50
60
-40
-30
-20
-10
0
10
20
30
40
50
60
2007 2008 2009 2010 2011 2012 2013
Consumption goodsCapital goodsIntermediate goods
Imports of Goods(In real terms, annual percent age change)
-7-6-5-4-3-2-101234
-7-6-5-4-3-2-101234
Net income and transfersTrade in goods and servicesCurrent account balance
Current Account Balance(In percent of GDP)
-4
-2
0
2
4
6
8
10
-4
-2
0
2
4
6
8
10
Net equity flowsNet debt flows (public)Net debt flows (private)
Net Capital Inflows(In percent of GDP)
AUSTRALIA
28 INTERNATIONAL MONETARY FUND
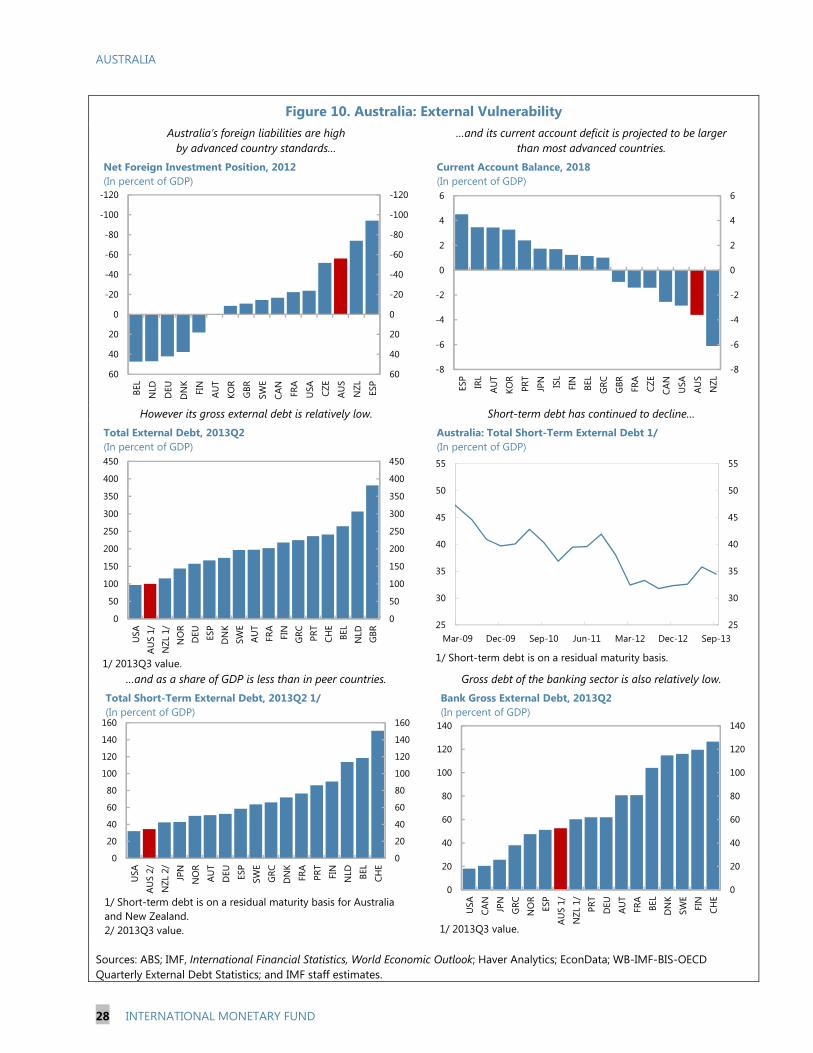
Figure 10. Australia: External Vulnerability Australia’s foreign liabilities are high
by advanced country standards… …and its current account deficit is projected to be larger
than most advanced countries.
However its gross external debt is relatively low. Short-term debt has continued to decline…
…and as a share of GDP is less than in peer countries. Gross debt of the banking sector is also relatively low.
Sources: ABS; IMF, International Financial Statistics, World Economic Outlook; Haver Analytics; EconData; WB-IMF-BIS-OECD Quarterly External Debt Statistics; and IMF staff estimates.
-120
-100
-80
-60
-40
-20
0
20
40
60
-120
-100
-80
-60
-40
-20
0
20
40
60ES
P
NZL
AUS
CZE
USAFRA
CAN
SWE
GBR
KOR
AUT
FIN
DN
K
DEU
NLDBE
L
Net Foreign Investment Position, 2012(In percent of GDP)
-8
-6
-4
-2
0
2
4
6
-8
-6
-4
-2
0
2
4
6
ESP
IRL
AUT
KOR
PRT
JPN ISL
FIN
BEL
GRC GBR FRA
CZE
CAN
USA
AUS
NZL
Current Account Balance, 2018(In percent of GDP)
0
50
100
150
200
250
300
350
400
450
0
50
100
150
200
250
300
350
400
450
USA
AUS
1/N
ZL 1
/N
OR
DEU ES
PD
NK
SWE
AUT
FRA
FIN
GRC PR
TCH
EBE
LN
LDG
BR
Total External Debt, 2013Q2(In percent of GDP)
1/ 2013Q3 value.
25
30
35
40
45
50
55
25
30
35
40
45
50
55
Mar-09 Dec-09 Sep-10 Jun-11 Mar-12 Dec-12 Sep-13
Australia: Total Short-Term External Debt 1/(In percent of GDP)
1/ Short-term debt is on a residual maturity basis.
0
20
40
60
80
100
120
140
160
0
20
40
60
80
100
120
140
160
USA
AUS
2/
NZL
2/
JPN
NO
RAU
T
DEU ES
P
SWE
GRC
DN
KFR
A
PRT
FIN
NLD BE
L
CHE
Total Short-Term External Debt, 2013Q2 1/(In percent of GDP)
1/ Short-term debt is on a residual maturity basis for Australia and New Zealand.2/ 2013Q3 value.
0
20
40
60
80
100
120
140
0
20
40
60
80
100
120
140
USA
CAN
JPN
GRC
NO
RES
P
AUS
1/
NZL
1/
PRT
DEU
AUT
FRA
BEL
DN
K
SWE
FIN
CHE
Bank Gross External Debt, 2013Q2(In percent of GDP)
1/ 2013Q3 value.
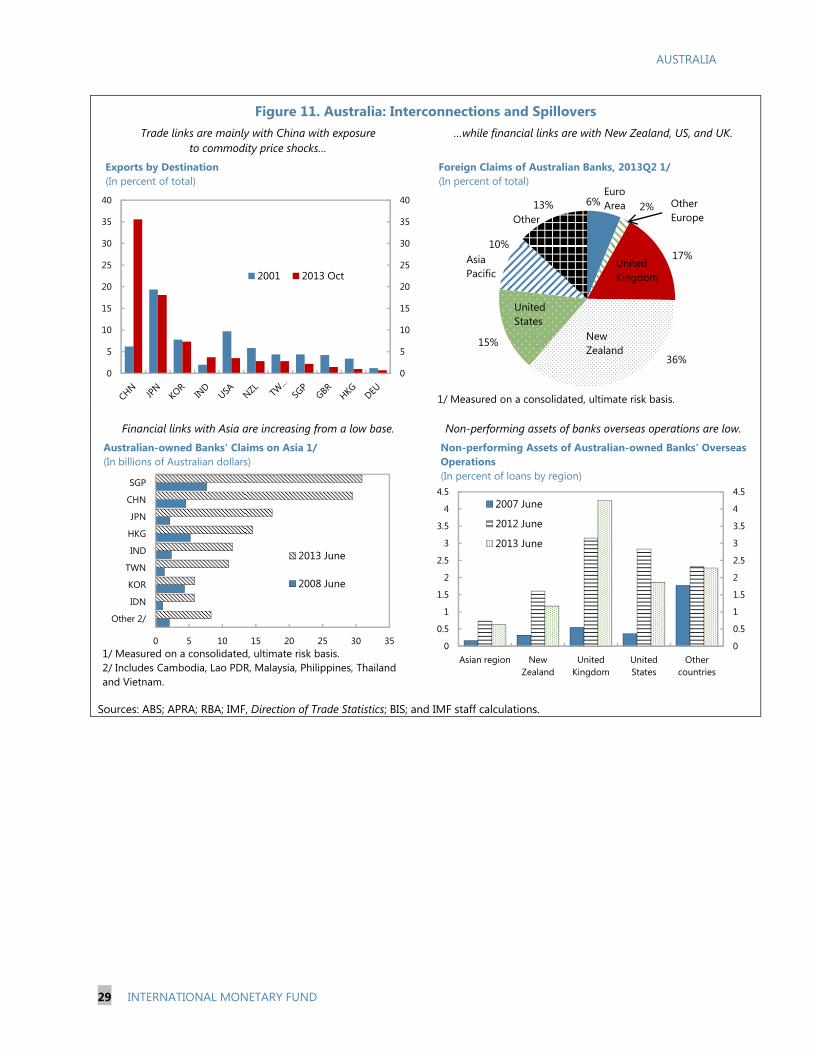
AUSTRALIA
29 INTERNATIONAL MONETARY FUND
Figure 11. Australia: Interconnections and Spillovers Trade links are mainly with China with exposure
to commodity price shocks… …while financial links are with New Zealand, US, and UK.
Financial links with Asia are increasing from a low base.
Non-performing assets of banks overseas operations are low.
Sources: ABS; APRA; RBA; IMF, Direction of Trade Statistics; BIS; and IMF staff calculations.
0
5
10
15
20
25
30
35
40
0
5
10
15
20
25
30
35
40
2001 2013 Oct
Exports by Destination(In percent of total)
6% 2%
17%
36%
15%
10%
13%
Foreign Claims of Australian Banks, 2013Q2 1/(In percent of total)
New Zealand
United Kingdom
United States
AsiaPacific
Other
Euro Area Other
Europe
1/ Measured on a consolidated, ultimate risk basis.
0 5 10 15 20 25 30 35
Other 2/
IDN
KOR
TWN
IND
HKG
JPN
CHN
SGP
2013 June
2008 June
Australian-owned Banks' Claims on Asia 1/(In billions of Australian dollars)
1/ Measured on a consolidated, ultimate risk basis.2/ Includes Cambodia, Lao PDR, Malaysia, Philippines, Thailand and Vietnam.
0
0.5
1
1.5
2
2.5
3
3.5
4
4.5
0
0.5
1
1.5
2
2.5
3
3.5
4
4.5
Asian region New Zealand
United Kingdom
United States
Other countries
2007 June
2012 June
2013 June
Non-performing Assets of Australian-owned Banks' Overseas Operations (In percent of loans by region)
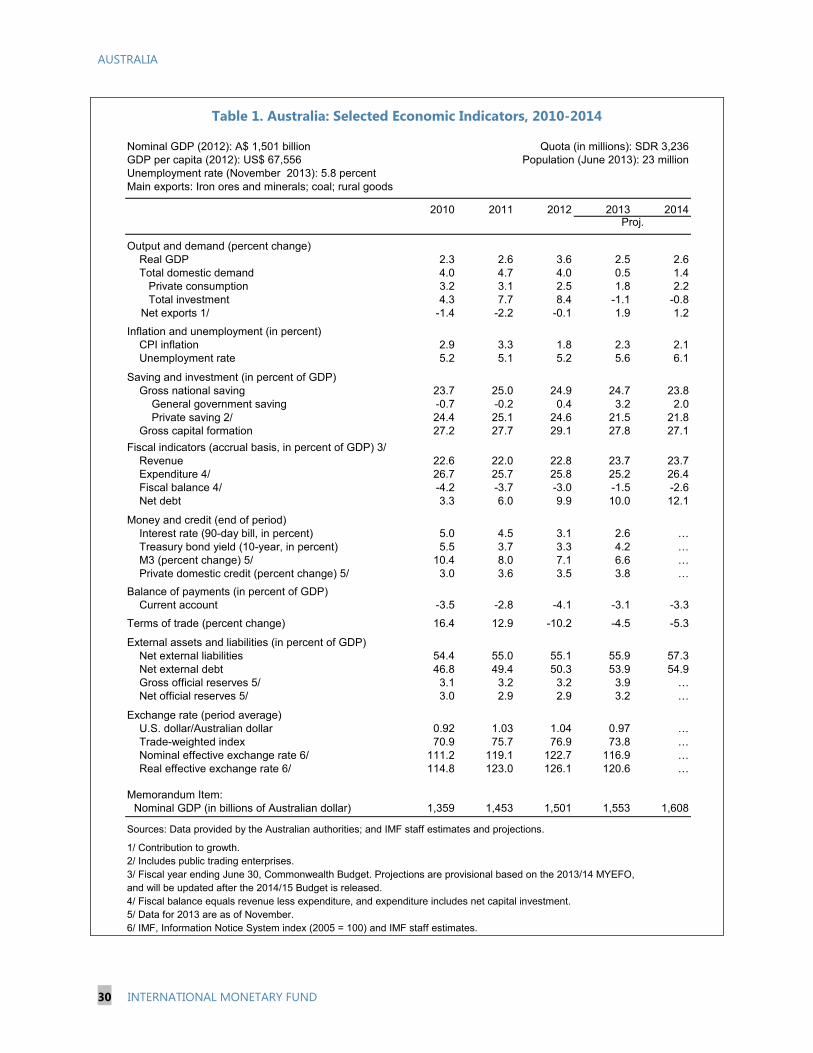
AUSTRALIA
30 INTERNATIONAL MONETARY FUND
Table 1. Australia: Selected Economic Indicators, 2010-2014
Nominal GDP (2012): A$ 1,501 billion Quota (in millions): SDR 3,236GDP per capita (2012): US$ 67,556 Population (June 2013): 23 millionUnemployment rate (November 2013): 5.8 percentMain exports: Iron ores and minerals; coal; rural goods
2010 2011 2012 2013 2014
Output and demand (percent change) Real GDP 2.3 2.6 3.6 2.5 2.6 Total domestic demand 4.0 4.7 4.0 0.5 1.4 Private consumption 3.2 3.1 2.5 1.8 2.2 Total investment 4.3 7.7 8.4 -1.1 -0.8
Net exports 1/ -1.4 -2.2 -0.1 1.9 1.2
Inflation and unemployment (in percent) CPI inflation 2.9 3.3 1.8 2.3 2.1 Unemployment rate 5.2 5.1 5.2 5.6 6.1
Saving and investment (in percent of GDP) Gross national saving 23.7 25.0 24.9 24.7 23.8 General government saving -0.7 -0.2 0.4 3.2 2.0 Private saving 2/ 24.4 25.1 24.6 21.5 21.8 Gross capital formation 27.2 27.7 29.1 27.8 27.1
Fiscal indicators (accrual basis, in percent of GDP) 3/ Revenue 22.6 22.0 22.8 23.7 23.7 Expenditure 4/ 26.7 25.7 25.8 25.2 26.4 Fiscal balance 4/ -4.2 -3.7 -3.0 -1.5 -2.6 Net debt 3.3 6.0 9.9 10.0 12.1
Money and credit (end of period) Interest rate (90-day bill, in percent) 5.0 4.5 3.1 2.6 … Treasury bond yield (10-year, in percent) 5.5 3.7 3.3 4.2 … M3 (percent change) 5/ 10.4 8.0 7.1 6.6 … Private domestic credit (percent change) 5/ 3.0 3.6 3.5 3.8 …
Balance of payments (in percent of GDP) Current account -3.5 -2.8 -4.1 -3.1 -3.3
Terms of trade (percent change) 16.4 12.9 -10.2 -4.5 -5.3
External assets and liabilities (in percent of GDP) Net external liabilities 54.4 55.0 55.1 55.9 57.3 Net external debt 46.8 49.4 50.3 53.9 54.9 Gross official reserves 5/ 3.1 3.2 3.2 3.9 … Net official reserves 5/ 3.0 2.9 2.9 3.2 …
Exchange rate (period average) U.S. dollar/Australian dollar 0.92 1.03 1.04 0.97 … Trade-weighted index 70.9 75.7 76.9 73.8 … Nominal effective exchange rate 6/ 111.2 119.1 122.7 116.9 … Real effective exchange rate 6/ 114.8 123.0 126.1 120.6 …
Memorandum Item:Nominal GDP (in billions of Australian dollar) 1,359 1,453 1,501 1,553 1,608
Sources: Data provided by the Australian authorities; and IMF staff estimates and projections.
1/ Contribution to growth.2/ Includes public trading enterprises. 3/ Fiscal year ending June 30, Commonwealth Budget. Projections are provisional based on the 2013/14 MYEFO, and will be updated after the 2014/15 Budget is released.4/ Fiscal balance equals revenue less expenditure, and expenditure includes net capital investment.5/ Data for 2013 are as of November.6/ IMF, Information Notice System index (2005 = 100) and IMF staff estimates.
Proj.
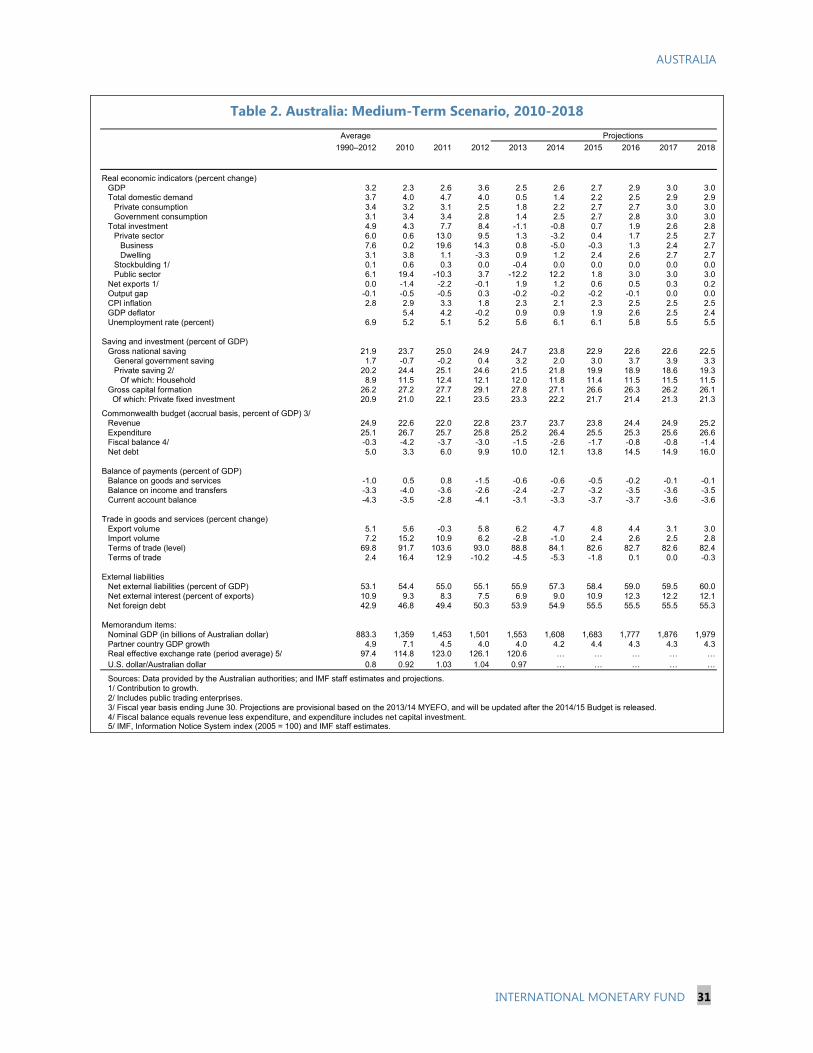
AUSTRALIA
INTERNATIONAL MONETARY FUND 31
Table 2. Australia: Medium-Term Scenario, 2010-2018
Average
1990–2012 2010 2011 2012 2013 2014 2015 2016 2017 2018
Real economic indicators (percent change)GDP 3.2 2.3 2.6 3.6 2.5 2.6 2.7 2.9 3.0 3.0Total domestic demand 3.7 4.0 4.7 4.0 0.5 1.4 2.2 2.5 2.9 2.9
Private consumption 3.4 3.2 3.1 2.5 1.8 2.2 2.7 2.7 3.0 3.0Government consumption 3.1 3.4 3.4 2.8 1.4 2.5 2.7 2.8 3.0 3.0
Total investment 4.9 4.3 7.7 8.4 -1.1 -0.8 0.7 1.9 2.6 2.8Private sector 6.0 0.6 13.0 9.5 1.3 -3.2 0.4 1.7 2.5 2.7
Business 7.6 0.2 19.6 14.3 0.8 -5.0 -0.3 1.3 2.4 2.7Dwelling 3.1 3.8 1.1 -3.3 0.9 1.2 2.4 2.6 2.7 2.7
Stockbulding 1/ 0.1 0.6 0.3 0.0 -0.4 0.0 0.0 0.0 0.0 0.0Public sector 6.1 19.4 -10.3 3.7 -12.2 12.2 1.8 3.0 3.0 3.0
Net exports 1/ 0.0 -1.4 -2.2 -0.1 1.9 1.2 0.6 0.5 0.3 0.2Output gap -0.1 -0.5 -0.5 0.3 -0.2 -0.2 -0.2 -0.1 0.0 0.0CPI inflation 2.8 2.9 3.3 1.8 2.3 2.1 2.3 2.5 2.5 2.5GDP deflator 5.4 4.2 -0.2 0.9 0.9 1.9 2.6 2.5 2.4Unemployment rate (percent) 6.9 5.2 5.1 5.2 5.6 6.1 6.1 5.8 5.5 5.5
Saving and investment (percent of GDP)Gross national saving 21.9 23.7 25.0 24.9 24.7 23.8 22.9 22.6 22.6 22.5
General government saving 1.7 -0.7 -0.2 0.4 3.2 2.0 3.0 3.7 3.9 3.3Private saving 2/ 20.2 24.4 25.1 24.6 21.5 21.8 19.9 18.9 18.6 19.3
Of which: Household 8.9 11.5 12.4 12.1 12.0 11.8 11.4 11.5 11.5 11.5Gross capital formation 26.2 27.2 27.7 29.1 27.8 27.1 26.6 26.3 26.2 26.1 Of which: Private fixed investment 20.9 21.0 22.1 23.5 23.3 22.2 21.7 21.4 21.3 21.3
Commonwealth budget (accrual basis, percent of GDP) 3/ Revenue 24.9 22.6 22.0 22.8 23.7 23.7 23.8 24.4 24.9 25.2Expenditure 25.1 26.7 25.7 25.8 25.2 26.4 25.5 25.3 25.6 26.6Fiscal balance 4/ -0.3 -4.2 -3.7 -3.0 -1.5 -2.6 -1.7 -0.8 -0.8 -1.4Net debt 5.0 3.3 6.0 9.9 10.0 12.1 13.8 14.5 14.9 16.0
Balance of payments (percent of GDP)Balance on goods and services -1.0 0.5 0.8 -1.5 -0.6 -0.6 -0.5 -0.2 -0.1 -0.1Balance on income and transfers -3.3 -4.0 -3.6 -2.6 -2.4 -2.7 -3.2 -3.5 -3.6 -3.5Current account balance -4.3 -3.5 -2.8 -4.1 -3.1 -3.3 -3.7 -3.7 -3.6 -3.6
Trade in goods and services (percent change)Export volume 5.1 5.6 -0.3 5.8 6.2 4.7 4.8 4.4 3.1 3.0Import volume 7.2 15.2 10.9 6.2 -2.8 -1.0 2.4 2.6 2.5 2.8Terms of trade (level) 69.8 91.7 103.6 93.0 88.8 84.1 82.6 82.7 82.6 82.4Terms of trade 2.4 16.4 12.9 -10.2 -4.5 -5.3 -1.8 0.1 0.0 -0.3
External liabilitiesNet external liabilities (percent of GDP) 53.1 54.4 55.0 55.1 55.9 57.3 58.4 59.0 59.5 60.0Net external interest (percent of exports) 10.9 9.3 8.3 7.5 6.9 9.0 10.9 12.3 12.2 12.1Net foreign debt 42.9 46.8 49.4 50.3 53.9 54.9 55.5 55.5 55.5 55.3
Memorandum items:Nominal GDP (in billions of Australian dollar) 883.3 1,359 1,453 1,501 1,553 1,608 1,683 1,777 1,876 1,979Partner country GDP growth 4.9 7.1 4.5 4.0 4.0 4.2 4.4 4.3 4.3 4.3Real effective exchange rate (period average) 5/ 97.4 114.8 123.0 126.1 120.6 … … … … …U.S. dollar/Australian dollar 0.8 0.92 1.03 1.04 0.97 … … … … …
Sources: Data provided by the Australian authorities; and IMF staff estimates and projections.1/ Contribution to growth.2/ Includes public trading enterprises. 3/ Fiscal year basis ending June 30. Projections are provisional based on the 2013/14 MYEFO, and will be updated after the 2014/15 Budget is released.4/ Fiscal balance equals revenue less expenditure, and expenditure includes net capital investment.5/ IMF, Information Notice System index (2005 = 100) and IMF staff estimates.
Projections
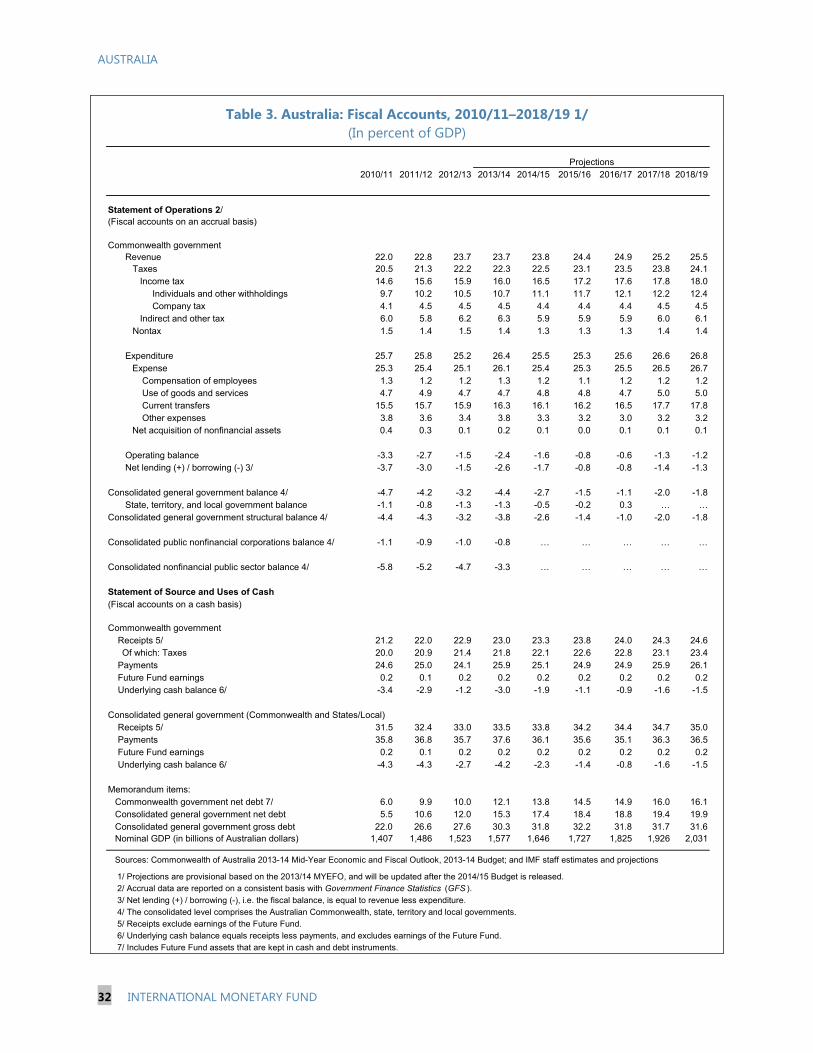
AUSTRALIA
32 INTERNATIONAL MONETARY FUND
Table 3. Australia: Fiscal Accounts, 2010/11–2018/19 1/ (In percent of GDP)
2010/11 2011/12 2012/13 2013/14 2014/15 2015/16 2016/17 2017/18 2018/19
Statement of Operations 2/(Fiscal accounts on an accrual basis)
Commonwealth government Revenue 22.0 22.8 23.7 23.7 23.8 24.4 24.9 25.2 25.5 Taxes 20.5 21.3 22.2 22.3 22.5 23.1 23.5 23.8 24.1 Income tax 14.6 15.6 15.9 16.0 16.5 17.2 17.6 17.8 18.0 Individuals and other withholdings 9.7 10.2 10.5 10.7 11.1 11.7 12.1 12.2 12.4 Company tax 4.1 4.5 4.5 4.5 4.4 4.4 4.4 4.5 4.5 Indirect and other tax 6.0 5.8 6.2 6.3 5.9 5.9 5.9 6.0 6.1 Nontax 1.5 1.4 1.5 1.4 1.3 1.3 1.3 1.4 1.4 Expenditure 25.7 25.8 25.2 26.4 25.5 25.3 25.6 26.6 26.8
Expense 25.3 25.4 25.1 26.1 25.4 25.3 25.5 26.5 26.7 Compensation of employees 1.3 1.2 1.2 1.3 1.2 1.1 1.2 1.2 1.2 Use of goods and services 4.7 4.9 4.7 4.7 4.8 4.8 4.7 5.0 5.0 Current transfers 15.5 15.7 15.9 16.3 16.1 16.2 16.5 17.7 17.8 Other expenses 3.8 3.6 3.4 3.8 3.3 3.2 3.0 3.2 3.2 Net acquisition of nonfinancial assets 0.4 0.3 0.1 0.2 0.1 0.0 0.1 0.1 0.1
Operating balance -3.3 -2.7 -1.5 -2.4 -1.6 -0.8 -0.6 -1.3 -1.2 Net lending (+) / borrowing (-) 3/ -3.7 -3.0 -1.5 -2.6 -1.7 -0.8 -0.8 -1.4 -1.3
Consolidated general government balance 4/ -4.7 -4.2 -3.2 -4.4 -2.7 -1.5 -1.1 -2.0 -1.8 State, territory, and local government balance -1.1 -0.8 -1.3 -1.3 -0.5 -0.2 0.3 … …Consolidated general government structural balance 4/ -4.4 -4.3 -3.2 -3.8 -2.6 -1.4 -1.0 -2.0 -1.8
Consolidated public nonfinancial corporations balance 4/ -1.1 -0.9 -1.0 -0.8 … … … … …
Consolidated nonfinancial public sector balance 4/ -5.8 -5.2 -4.7 -3.3 … … … … …
Statement of Source and Uses of Cash(Fiscal accounts on a cash basis)
Commonwealth government Receipts 5/ 21.2 22.0 22.9 23.0 23.3 23.8 24.0 24.3 24.6
Of which: Taxes 20.0 20.9 21.4 21.8 22.1 22.6 22.8 23.1 23.4 Payments 24.6 25.0 24.1 25.9 25.1 24.9 24.9 25.9 26.1 Future Fund earnings 0.2 0.1 0.2 0.2 0.2 0.2 0.2 0.2 0.2 Underlying cash balance 6/ -3.4 -2.9 -1.2 -3.0 -1.9 -1.1 -0.9 -1.6 -1.5
Consolidated general government (Commonwealth and States/Local) Receipts 5/ 31.5 32.4 33.0 33.5 33.8 34.2 34.4 34.7 35.0 Payments 35.8 36.8 35.7 37.6 36.1 35.6 35.1 36.3 36.5 Future Fund earnings 0.2 0.1 0.2 0.2 0.2 0.2 0.2 0.2 0.2 Underlying cash balance 6/ -4.3 -4.3 -2.7 -4.2 -2.3 -1.4 -0.8 -1.6 -1.5
Memorandum items: Commonwealth government net debt 7/ 6.0 9.9 10.0 12.1 13.8 14.5 14.9 16.0 16.1Consolidated general government net debt 5.5 10.6 12.0 15.3 17.4 18.4 18.8 19.4 19.9Consolidated general government gross debt 22.0 26.6 27.6 30.3 31.8 32.2 31.8 31.7 31.6Nominal GDP (in billions of Australian dollars) 1,407 1,486 1,523 1,577 1,646 1,727 1,825 1,926 2,031
Sources: Commonwealth of Australia 2013-14 Mid-Year Economic and Fiscal Outlook, 2013-14 Budget; and IMF staff estimates and projections
1/ Projections are provisional based on the 2013/14 MYEFO, and will be updated after the 2014/15 Budget is released. 2/ Accrual data are reported on a consistent basis with Government Finance Statistics (GFS ).
3/ Net lending (+) / borrowing (-), i.e. the fiscal balance, is equal to revenue less expenditure. 4/ The consolidated level comprises the Australian Commonwealth, state, territory and local governments. 5/ Receipts exclude earnings of the Future Fund. 6/ Underlying cash balance equals receipts less payments, and excludes earnings of the Future Fund. 7/ Includes Future Fund assets that are kept in cash and debt instruments.
Projections
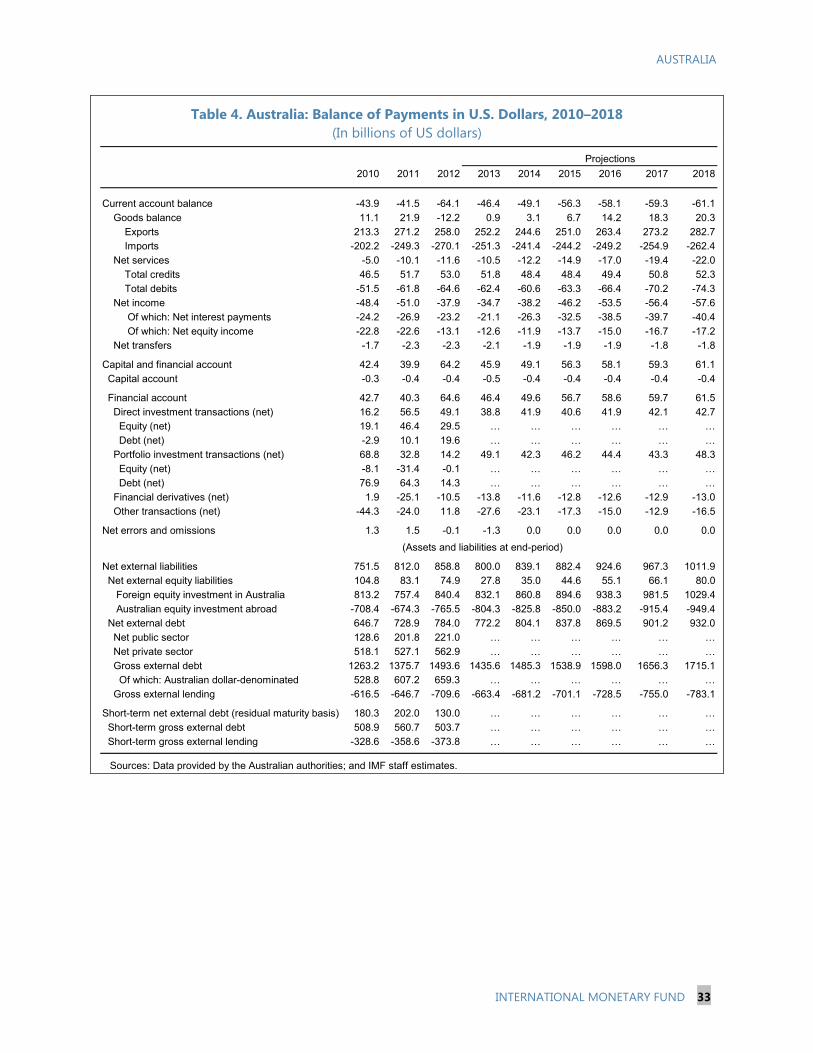
AUSTRALIA
INTERNATIONAL MONETARY FUND 33
Table 4. Australia: Balance of Payments in U.S. Dollars, 2010–2018 (In billions of US dollars)
2010 2011 2012 2013 2014 2015 2016 2017 2018
Current account balance -43.9 -41.5 -64.1 -46.4 -49.1 -56.3 -58.1 -59.3 -61.1
Goods balance 11.1 21.9 -12.2 0.9 3.1 6.7 14.2 18.3 20.3
Exports 213.3 271.2 258.0 252.2 244.6 251.0 263.4 273.2 282.7 Imports -202.2 -249.3 -270.1 -251.3 -241.4 -244.2 -249.2 -254.9 -262.4
Net services -5.0 -10.1 -11.6 -10.5 -12.2 -14.9 -17.0 -19.4 -22.0
Total credits 46.5 51.7 53.0 51.8 48.4 48.4 49.4 50.8 52.3
Total debits -51.5 -61.8 -64.6 -62.4 -60.6 -63.3 -66.4 -70.2 -74.3
Net income -48.4 -51.0 -37.9 -34.7 -38.2 -46.2 -53.5 -56.4 -57.6
Of which: Net interest payments -24.2 -26.9 -23.2 -21.1 -26.3 -32.5 -38.5 -39.7 -40.4
Of which: Net equity income -22.8 -22.6 -13.1 -12.6 -11.9 -13.7 -15.0 -16.7 -17.2 Net transfers -1.7 -2.3 -2.3 -2.1 -1.9 -1.9 -1.9 -1.8 -1.8
Capital and financial account 42.4 39.9 64.2 45.9 49.1 56.3 58.1 59.3 61.1
Capital account -0.3 -0.4 -0.4 -0.5 -0.4 -0.4 -0.4 -0.4 -0.4
Financial account 42.7 40.3 64.6 46.4 49.6 56.7 58.6 59.7 61.5
Direct investment transactions (net) 16.2 56.5 49.1 38.8 41.9 40.6 41.9 42.1 42.7 Equity (net) 19.1 46.4 29.5 … … … … … …
Debt (net) -2.9 10.1 19.6 … … … … … …
Portfolio investment transactions (net) 68.8 32.8 14.2 49.1 42.3 46.2 44.4 43.3 48.3
Equity (net) -8.1 -31.4 -0.1 … … … … … …
Debt (net) 76.9 64.3 14.3 … … … … … …
Financial derivatives (net) 1.9 -25.1 -10.5 -13.8 -11.6 -12.8 -12.6 -12.9 -13.0
Other transactions (net) -44.3 -24.0 11.8 -27.6 -23.1 -17.3 -15.0 -12.9 -16.5
Net errors and omissions 1.3 1.5 -0.1 -1.3 0.0 0.0 0.0 0.0 0.0
Net external liabilities 751.5 812.0 858.8 800.0 839.1 882.4 924.6 967.3 1011.9 Net external equity liabilities 104.8 83.1 74.9 27.8 35.0 44.6 55.1 66.1 80.0
Foreign equity investment in Australia 813.2 757.4 840.4 832.1 860.8 894.6 938.3 981.5 1029.4
Australian equity investment abroad -708.4 -674.3 -765.5 -804.3 -825.8 -850.0 -883.2 -915.4 -949.4
Net external debt 646.7 728.9 784.0 772.2 804.1 837.8 869.5 901.2 932.0
Net public sector 128.6 201.8 221.0 … … … … … …
Net private sector 518.1 527.1 562.9 … … … … … …
Gross external debt 1263.2 1375.7 1493.6 1435.6 1485.3 1538.9 1598.0 1656.3 1715.1 Of which: Australian dollar-denominated 528.8 607.2 659.3 … … … … … …
Gross external lending -616.5 -646.7 -709.6 -663.4 -681.2 -701.1 -728.5 -755.0 -783.1
Short-term net external debt (residual maturity basis) 180.3 202.0 130.0 … … … … … …
Short-term gross external debt 508.9 560.7 503.7 … … … … … …
Short-term gross external lending -328.6 -358.6 -373.8 … … … … … …
Sources: Data provided by the Australian authorities; and IMF staff estimates.
(Assets and liabilities at end-period)
Projections
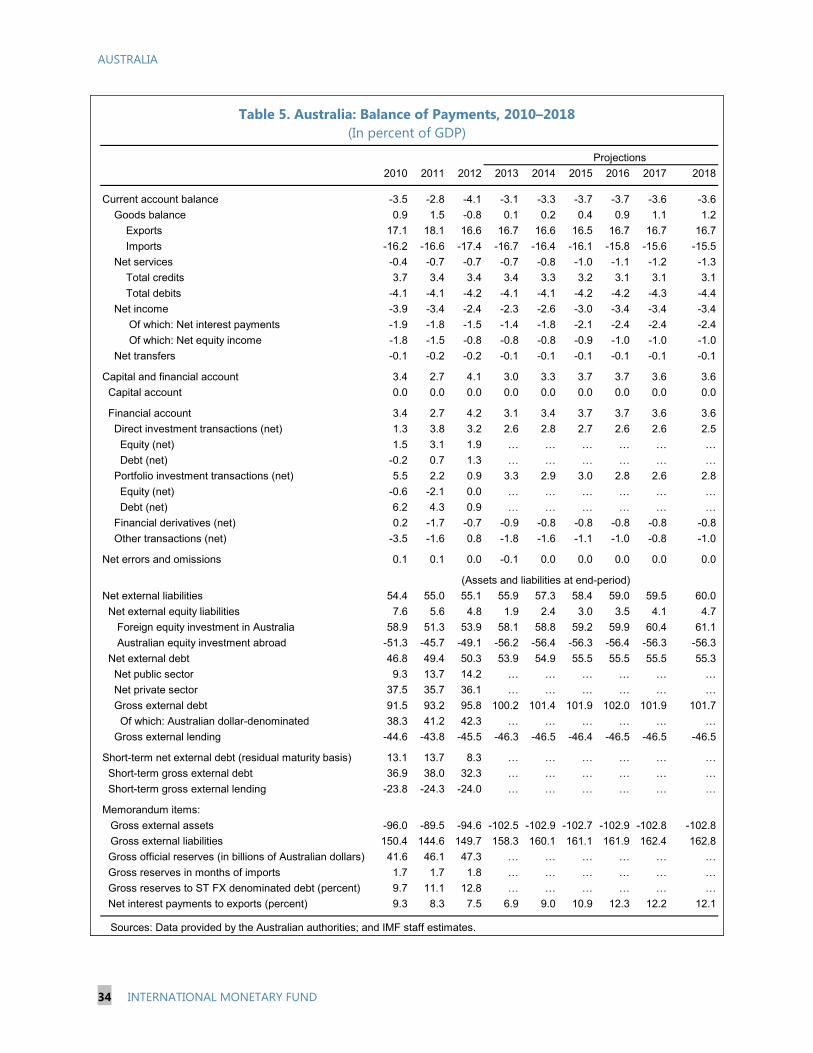
AUSTRALIA
34 INTERNATIONAL MONETARY FUND
Table 5. Australia: Balance of Payments, 2010–2018 (In percent of GDP)
2010 2011 2012 2013 2014 2015 2016 2017 2018
Current account balance -3.5 -2.8 -4.1 -3.1 -3.3 -3.7 -3.7 -3.6 -3.6
Goods balance 0.9 1.5 -0.8 0.1 0.2 0.4 0.9 1.1 1.2
Exports 17.1 18.1 16.6 16.7 16.6 16.5 16.7 16.7 16.7
Imports -16.2 -16.6 -17.4 -16.7 -16.4 -16.1 -15.8 -15.6 -15.5
Net services -0.4 -0.7 -0.7 -0.7 -0.8 -1.0 -1.1 -1.2 -1.3
Total credits 3.7 3.4 3.4 3.4 3.3 3.2 3.1 3.1 3.1
Total debits -4.1 -4.1 -4.2 -4.1 -4.1 -4.2 -4.2 -4.3 -4.4
Net income -3.9 -3.4 -2.4 -2.3 -2.6 -3.0 -3.4 -3.4 -3.4
Of which: Net interest payments -1.9 -1.8 -1.5 -1.4 -1.8 -2.1 -2.4 -2.4 -2.4
Of which: Net equity income -1.8 -1.5 -0.8 -0.8 -0.8 -0.9 -1.0 -1.0 -1.0
Net transfers -0.1 -0.2 -0.2 -0.1 -0.1 -0.1 -0.1 -0.1 -0.1
Capital and financial account 3.4 2.7 4.1 3.0 3.3 3.7 3.7 3.6 3.6
Capital account 0.0 0.0 0.0 0.0 0.0 0.0 0.0 0.0 0.0
Financial account 3.4 2.7 4.2 3.1 3.4 3.7 3.7 3.6 3.6
Direct investment transactions (net) 1.3 3.8 3.2 2.6 2.8 2.7 2.6 2.6 2.5
Equity (net) 1.5 3.1 1.9 … … … … … …
Debt (net) -0.2 0.7 1.3 … … … … … …
Portfolio investment transactions (net) 5.5 2.2 0.9 3.3 2.9 3.0 2.8 2.6 2.8
Equity (net) -0.6 -2.1 0.0 … … … … … …
Debt (net) 6.2 4.3 0.9 … … … … … …
Financial derivatives (net) 0.2 -1.7 -0.7 -0.9 -0.8 -0.8 -0.8 -0.8 -0.8
Other transactions (net) -3.5 -1.6 0.8 -1.8 -1.6 -1.1 -1.0 -0.8 -1.0
Net errors and omissions 0.1 0.1 0.0 -0.1 0.0 0.0 0.0 0.0 0.0
Net external liabilities 54.4 55.0 55.1 55.9 57.3 58.4 59.0 59.5 60.0
Net external equity liabilities 7.6 5.6 4.8 1.9 2.4 3.0 3.5 4.1 4.7
Foreign equity investment in Australia 58.9 51.3 53.9 58.1 58.8 59.2 59.9 60.4 61.1
Australian equity investment abroad -51.3 -45.7 -49.1 -56.2 -56.4 -56.3 -56.4 -56.3 -56.3
Net external debt 46.8 49.4 50.3 53.9 54.9 55.5 55.5 55.5 55.3
Net public sector 9.3 13.7 14.2 … … … … … …
Net private sector 37.5 35.7 36.1 … … … … … …
Gross external debt 91.5 93.2 95.8 100.2 101.4 101.9 102.0 101.9 101.7
Of which: Australian dollar-denominated 38.3 41.2 42.3 … … … … … …
Gross external lending -44.6 -43.8 -45.5 -46.3 -46.5 -46.4 -46.5 -46.5 -46.5
Short-term net external debt (residual maturity basis) 13.1 13.7 8.3 … … … … … …
Short-term gross external debt 36.9 38.0 32.3 … … … … … …
Short-term gross external lending -23.8 -24.3 -24.0 … … … … … …
Memorandum items:
Gross external assets -96.0 -89.5 -94.6 -102.5 -102.9 -102.7 -102.9 -102.8 -102.8
Gross external liabilities 150.4 144.6 149.7 158.3 160.1 161.1 161.9 162.4 162.8
Gross official reserves (in billions of Australian dollars) 41.6 46.1 47.3 … … … … … …
Gross reserves in months of imports 1.7 1.7 1.8 … … … … … …
Gross reserves to ST FX denominated debt (percent) 9.7 11.1 12.8 … … … … … …
Net interest payments to exports (percent) 9.3 8.3 7.5 6.9 9.0 10.9 12.3 12.2 12.1
Sources: Data provided by the Australian authorities; and IMF staff estimates.
Projections
(Assets and liabilities at end-period)
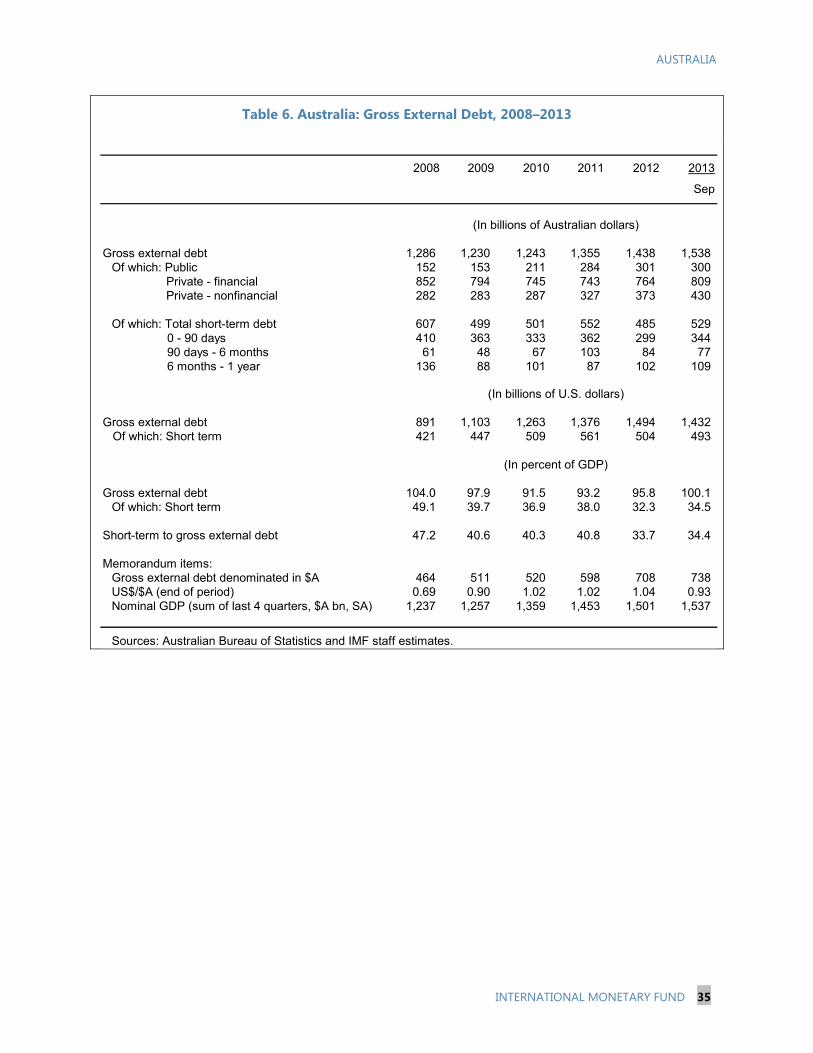
AUSTRALIA
INTERNATIONAL MONETARY FUND 35
Table 6. Australia: Gross External Debt, 2008–2013
2008 2009 2010 2011 2012 2013
Sep
Gross external debt 1,286 1,230 1,243 1,355 1,438 1,538 Of which: Public 152 153 211 284 301 300
Private - financial 852 794 745 743 764 809 Private - nonfinancial 282 283 287 327 373 430
Of which: Total short-term debt 607 499 501 552 485 529 0 - 90 days 410 363 333 362 299 344 90 days - 6 months 61 48 67 103 84 77 6 months - 1 year 136 88 101 87 102 109
Gross external debt 891 1,103 1,263 1,376 1,494 1,432 Of which: Short term 421 447 509 561 504 493
Gross external debt 104.0 97.9 91.5 93.2 95.8 100.1 Of which: Short term 49.1 39.7 36.9 38.0 32.3 34.5
Short-term to gross external debt 47.2 40.6 40.3 40.8 33.7 34.4
Memorandum items:Gross external debt denominated in $A 464 511 520 598 708 738 US$/$A (end of period) 0.69 0.90 1.02 1.02 1.04 0.93 Nominal GDP (sum of last 4 quarters, $A bn, SA) 1,237 1,257 1,359 1,453 1,501 1,537
Sources: Australian Bureau of Statistics and IMF staff estimates.
(In billions of Australian dollars)
(In billions of U.S. dollars)
(In percent of GDP)

AUSTRALIA
36 INTERNATIONAL MONETARY FUND
Table 7. Australia: Indicators of External and Financial Vulnerability, 2008–2012 (In percent of GDP, unless otherwise indicated)
2008 2009 2010 2011 2012
External indicators
Real exports of goods (percent change) 3.8 3.5 7.6 0.3 6.9
Real imports of goods (percent change) 10.2 -9.6 15.4 10.6 6.8
Terms of trade (percent change) 13.2 -9.5 16.4 12.9 -10.2
Current account balance -4.9 -4.6 -3.5 -2.8 -4.1
Capital and financial account balance 4.7 4.6 3.4 2.7 4.1
Of which:
Net portfolio investment 2.7 7.9 5.5 2.2 0.9
Net direct investment 1.6 1.6 1.3 3.8 3.2
Total reserves (in billions of U.S. dollar) 32.9 41.7 42.3 46.8 49.1
In months of imports of goods and services 2.0 2.2 1.7 1.7 1.8
Total net reserves (in billions of U.S. dollar) 33.3 41.4 42.1 43.1 45.7
Net international investment position -56.6 -59.9 -54.4 -55.0 -55.1
Of which:
Net external public sector debt 6.4 5.5 9.3 13.7 14.2
Net external private sector debt 49.2 46.3 37.5 35.7 36.1
Net interest payments to exports (in percent) 10.6 11.6 9.3 8.3 7.5
Nominal effective exchange rate (percent change) -1.7 -4.4 13.8 7.1 3.0
Financial market indicators
General government gross debt (percent of GDP) 11.7 16.7 20.5 24.3 27.6
Interest rates (percent)
3-month T-bill 7.0 3.4 4.7 4.8 3.7
3-month interest rate spread vis-à-vis U.S. 5.6 3.3 4.5 4.8 3.6
10-year government bond 5.8 5.0 5.4 4.9 3.4
Sources: Data provided by the Australian authorities; and IMF staff estimates.
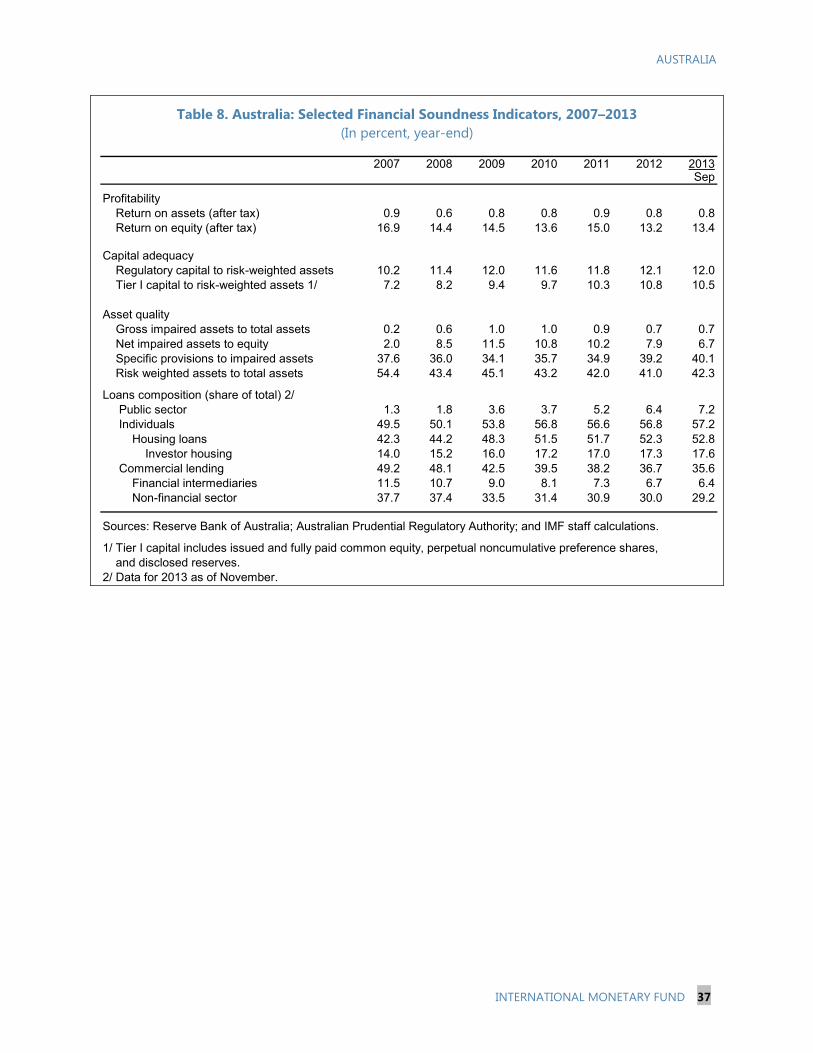
AUSTRALIA
INTERNATIONAL MONETARY FUND 37
Table 8. Australia: Selected Financial Soundness Indicators, 2007–2013 (In percent, year-end)
2007 2008 2009 2010 2011 2012 2013Sep
Profitability Return on assets (after tax) 0.9 0.6 0.8 0.8 0.9 0.8 0.8 Return on equity (after tax) 16.9 14.4 14.5 13.6 15.0 13.2 13.4
Capital adequacy Regulatory capital to risk-weighted assets 10.2 11.4 12.0 11.6 11.8 12.1 12.0 Tier I capital to risk-weighted assets 1/ 7.2 8.2 9.4 9.7 10.3 10.8 10.5
Asset quality Gross impaired assets to total assets 0.2 0.6 1.0 1.0 0.9 0.7 0.7 Net impaired assets to equity 2.0 8.5 11.5 10.8 10.2 7.9 6.7 Specific provisions to impaired assets 37.6 36.0 34.1 35.7 34.9 39.2 40.1 Risk weighted assets to total assets 54.4 43.4 45.1 43.2 42.0 41.0 42.3
Loans composition (share of total) 2/ Public sector 1.3 1.8 3.6 3.7 5.2 6.4 7.2 Individuals 49.5 50.1 53.8 56.8 56.6 56.8 57.2 Housing loans 42.3 44.2 48.3 51.5 51.7 52.3 52.8 Investor housing 14.0 15.2 16.0 17.2 17.0 17.3 17.6 Commercial lending 49.2 48.1 42.5 39.5 38.2 36.7 35.6 Financial intermediaries 11.5 10.7 9.0 8.1 7.3 6.7 6.4 Non-financial sector 37.7 37.4 33.5 31.4 30.9 30.0 29.2
Sources: Reserve Bank of Australia; Australian Prudential Regulatory Authority; and IMF staff calculations.
1/ Tier I capital includes issued and fully paid common equity, perpetual noncumulative preference shares, and disclosed reserves.
2/ Data for 2013 as of November.
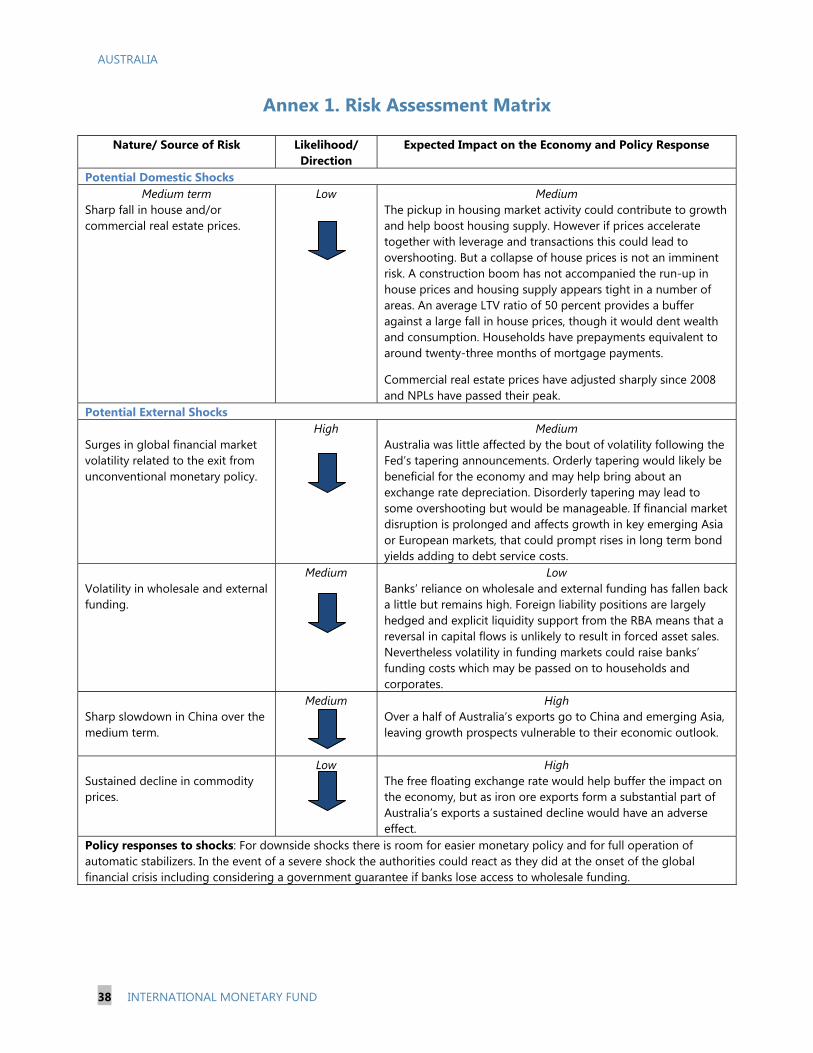
AUSTRALIA
38 INTERNATIONAL MONETARY FUND
Annex 1. Risk Assessment Matrix
Nature/ Source of Risk Likelihood/ Direction
Expected Impact on the Economy and Policy Response
Potential Domestic Shocks Medium term
Sharp fall in house and/or commercial real estate prices.
Low Medium The pickup in housing market activity could contribute to growth and help boost housing supply. However if prices accelerate together with leverage and transactions this could lead to overshooting. But a collapse of house prices is not an imminent risk. A construction boom has not accompanied the run-up in house prices and housing supply appears tight in a number of areas. An average LTV ratio of 50 percent provides a buffer against a large fall in house prices, though it would dent wealth and consumption. Households have prepayments equivalent to around twenty-three months of mortgage payments.
Commercial real estate prices have adjusted sharply since 2008 and NPLs have passed their peak.
Potential External Shocks
Surges in global financial market volatility related to the exit from unconventional monetary policy.
High
Medium Australia was little affected by the bout of volatility following the Fed’s tapering announcements. Orderly tapering would likely be beneficial for the economy and may help bring about an exchange rate depreciation. Disorderly tapering may lead to some overshooting but would be manageable. If financial market disruption is prolonged and affects growth in key emerging Asia or European markets, that could prompt rises in long term bond yields adding to debt service costs.
Volatility in wholesale and external funding.
Medium Low Banks’ reliance on wholesale and external funding has fallen back a little but remains high. Foreign liability positions are largely hedged and explicit liquidity support from the RBA means that a reversal in capital flows is unlikely to result in forced asset sales. Nevertheless volatility in funding markets could raise banks’ funding costs which may be passed on to households and corporates.
Sharp slowdown in China over the medium term.
Medium High Over a half of Australia’s exports go to China and emerging Asia, leaving growth prospects vulnerable to their economic outlook.
Sustained decline in commodity prices.
Low High The free floating exchange rate would help buffer the impact on the economy, but as iron ore exports form a substantial part of Australia’s exports a sustained decline would have an adverse effect.
Policy responses to shocks: For downside shocks there is room for easier monetary policy and for full operation of automatic stabilizers. In the event of a severe shock the authorities could react as they did at the onset of the global financial crisis including considering a government guarantee if banks lose access to wholesale funding.
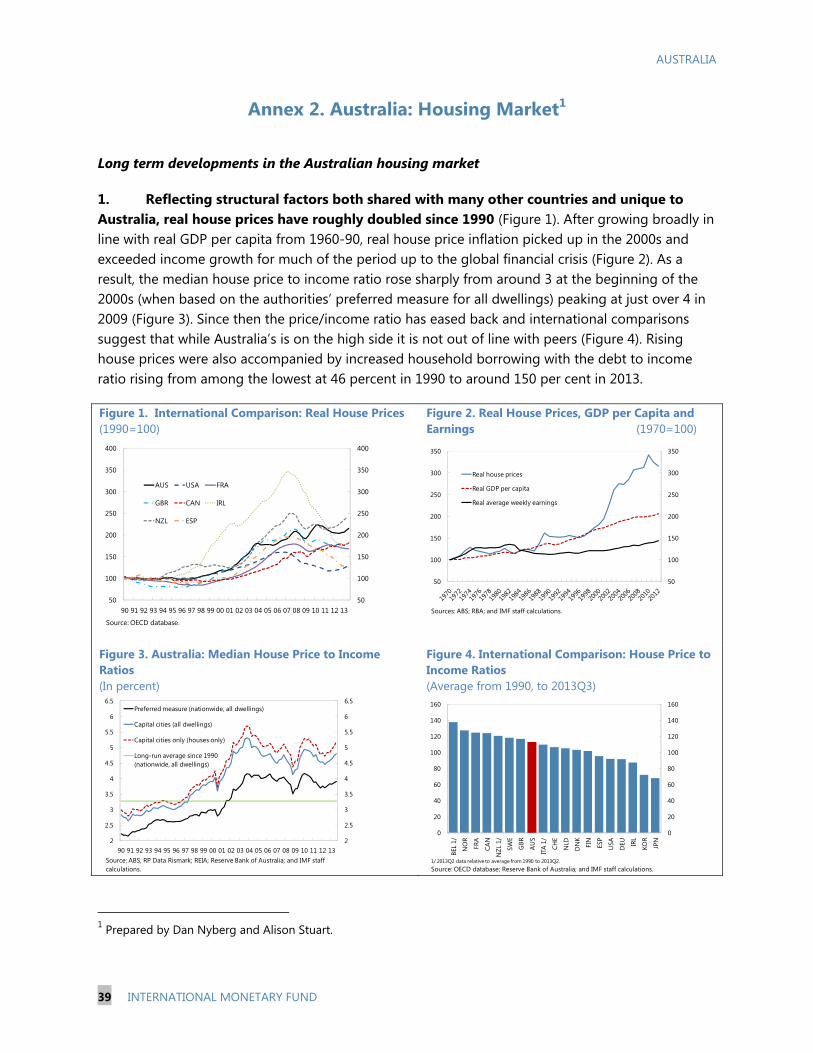
AUSTRALIA
39 INTERNATIONAL MONETARY FUND
Annex 2. Australia: Housing Market1
Long term developments in the Australian housing market
1. Reflecting structural factors both shared with many other countries and unique to Australia, real house prices have roughly doubled since 1990 (Figure 1). After growing broadly in line with real GDP per capita from 1960-90, real house price inflation picked up in the 2000s and exceeded income growth for much of the period up to the global financial crisis (Figure 2). As a result, the median house price to income ratio rose sharply from around 3 at the beginning of the 2000s (when based on the authorities’ preferred measure for all dwellings) peaking at just over 4 in 2009 (Figure 3). Since then the price/income ratio has eased back and international comparisons suggest that while Australia’s is on the high side it is not out of line with peers (Figure 4). Rising house prices were also accompanied by increased household borrowing with the debt to income ratio rising from among the lowest at 46 percent in 1990 to around 150 per cent in 2013.
1 Prepared by Dan Nyberg and Alison Stuart.
Figure 1. International Comparison: Real House Prices (1990=100)
Figure 2. Real House Prices, GDP per Capita and Earnings (1970=100)
Figure 3. Australia: Median House Price to Income Ratios (In percent)
Figure 4. International Comparison: House Price to Income Ratios (Average from 1990, to 2013Q3)
50
100
150
200
250
300
350
400
50
100
150
200
250
300
350
400
90 91 92 93 94 95 96 97 98 99 00 01 02 03 04 05 06 07 08 09 10 11 12 13
AUS USA FRA
GBR CAN IRL
NZL ESP
Source: OECD database.
50
100
150
200
250
300
350
50
100
150
200
250
300
350
Real house prices
Real GDP per capita
Real average weekly earnings
Sources: ABS; RBA; and IMF staff calculations.
2
2.5
3
3.5
4
4.5
5
5.5
6
6.5
2
2.5
3
3.5
4
4.5
5
5.5
6
6.5
90 91 92 93 94 95 96 97 98 99 00 01 02 03 04 05 06 07 08 09 10 11 12 13
Preferred measure (nationwide, all dwellings)
Capital cities (all dwellings)
Capital cities only (houses only)
Long-run average since 1990 (nationwide, all dwellings)
Source: ABS; RP Data Rismark; REIA; Reserve Bank of Australia; and IMF staff calculations.
0
20
40
60
80
100
120
140
160
0
20
40
60
80
100
120
140
160
BEL
1/
NO
R
FRA
CAN
NZL
1/
SWE
GBR
AU
S
ITA
1/
CHE
NLD
DN
K
FIN
ESP
USA
DEU IR
L
KOR
JPN
1/ 2013Q2 data relative to average from 1990 to 2013Q2.Source: OECD database; Reserve Bank of Australia; and IMF staff calculations.
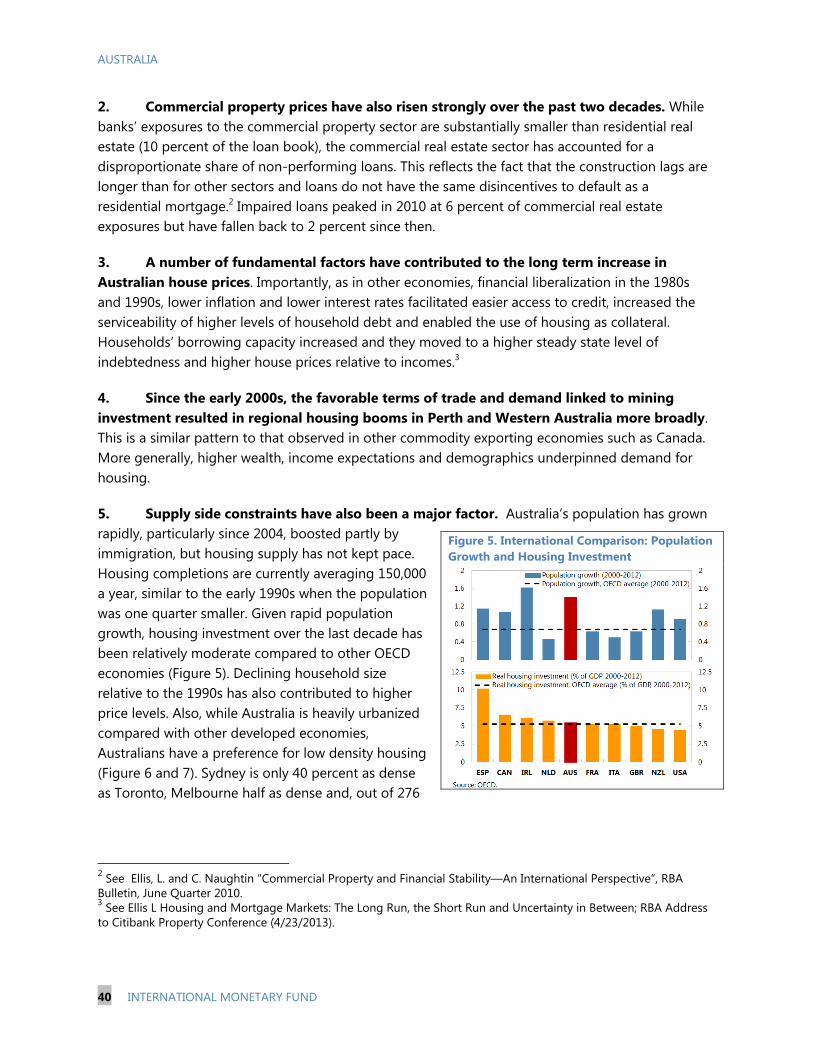
AUSTRALIA
40 INTERNATIONAL MONETARY FUND
2. Commercial property prices have also risen strongly over the past two decades. While banks’ exposures to the commercial property sector are substantially smaller than residential real estate (10 percent of the loan book), the commercial real estate sector has accounted for a disproportionate share of non-performing loans. This reflects the fact that the construction lags are longer than for other sectors and loans do not have the same disincentives to default as a residential mortgage.2 Impaired loans peaked in 2010 at 6 percent of commercial real estate exposures but have fallen back to 2 percent since then.
3. A number of fundamental factors have contributed to the long term increase in Australian house prices. Importantly, as in other economies, financial liberalization in the 1980s and 1990s, lower inflation and lower interest rates facilitated easier access to credit, increased the serviceability of higher levels of household debt and enabled the use of housing as collateral. Households’ borrowing capacity increased and they moved to a higher steady state level of indebtedness and higher house prices relative to incomes.3
4. Since the early 2000s, the favorable terms of trade and demand linked to mining investment resulted in regional housing booms in Perth and Western Australia more broadly. This is a similar pattern to that observed in other commodity exporting economies such as Canada. More generally, higher wealth, income expectations and demographics underpinned demand for housing.
5. Supply side constraints have also been a major factor. Australia’s population has grown rapidly, particularly since 2004, boosted partly by immigration, but housing supply has not kept pace. Housing completions are currently averaging 150,000 a year, similar to the early 1990s when the population was one quarter smaller. Given rapid population growth, housing investment over the last decade has been relatively moderate compared to other OECD economies (Figure 5). Declining household size relative to the 1990s has also contributed to higher price levels. Also, while Australia is heavily urbanized compared with other developed economies, Australians have a preference for low density housing (Figure 6 and 7). Sydney is only 40 percent as dense as Toronto, Melbourne half as dense and, out of 276
2 See Ellis, L. and C. Naughtin “Commercial Property and Financial Stability—An International Perspective”, RBA Bulletin, June Quarter 2010. 3 See Ellis L Housing and Mortgage Markets: The Long Run, the Short Run and Uncertainty in Between; RBA Address to Citibank Property Conference (4/23/2013).
Figure 5. International Comparison: Population Growth and Housing Investment
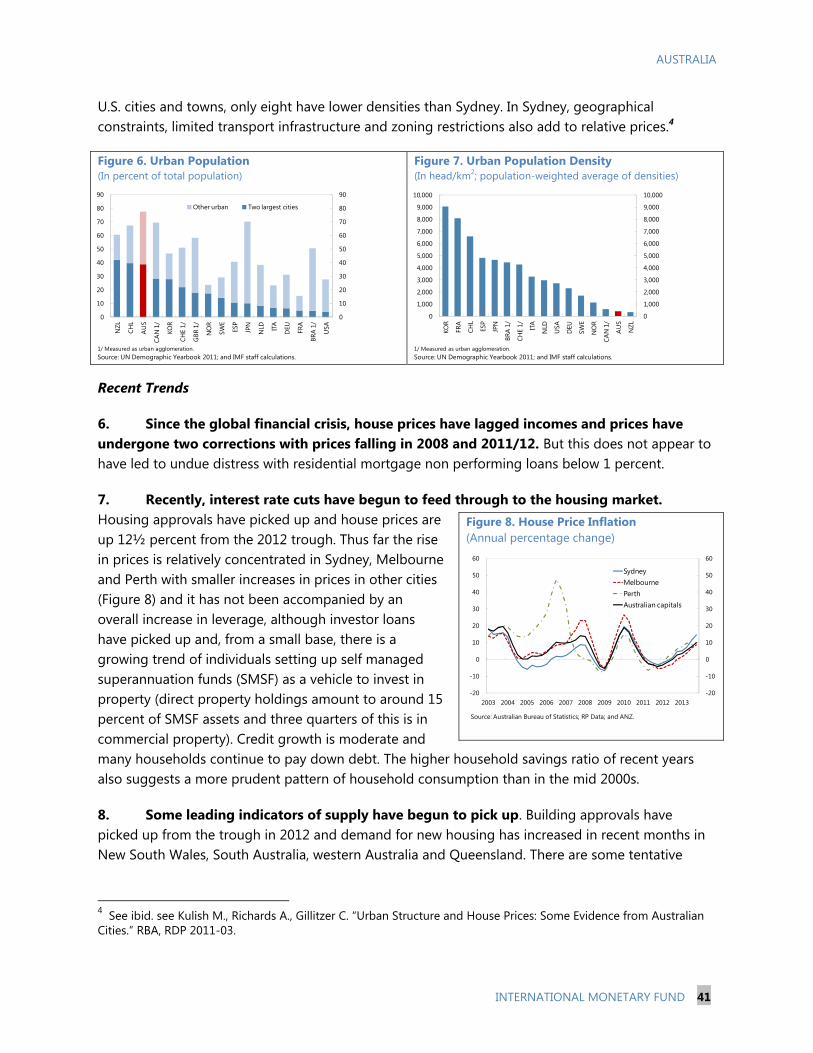
AUSTRALIA
INTERNATIONAL MONETARY FUND 41
U.S. cities and towns, only eight have lower densities than Sydney. In Sydney, geographical constraints, limited transport infrastructure and zoning restrictions also add to relative prices.4
Recent Trends
6. Since the global financial crisis, house prices have lagged incomes and prices have undergone two corrections with prices falling in 2008 and 2011/12. But this does not appear to have led to undue distress with residential mortgage non performing loans below 1 percent.
7. Recently, interest rate cuts have begun to feed through to the housing market. Housing approvals have picked up and house prices are up 12½ percent from the 2012 trough. Thus far the rise in prices is relatively concentrated in Sydney, Melbourne and Perth with smaller increases in prices in other cities (Figure 8) and it has not been accompanied by an overall increase in leverage, although investor loans have picked up and, from a small base, there is a growing trend of individuals setting up self managed superannuation funds (SMSF) as a vehicle to invest in property (direct property holdings amount to around 15 percent of SMSF assets and three quarters of this is in commercial property). Credit growth is moderate and many households continue to pay down debt. The higher household savings ratio of recent years also suggests a more prudent pattern of household consumption than in the mid 2000s.
8. Some leading indicators of supply have begun to pick up. Building approvals have picked up from the trough in 2012 and demand for new housing has increased in recent months in New South Wales, South Australia, western Australia and Queensland. There are some tentative
4 See ibid. see Kulish M., Richards A., Gillitzer C. “Urban Structure and House Prices: Some Evidence from Australian Cities.” RBA, RDP 2011-03.
Figure 6. Urban Population (In percent of total population)
Figure 7. Urban Population Density (In head/km2; population-weighted average of densities)
Figure 8. House Price Inflation (Annual percentage change)
-20
-10
0
10
20
30
40
50
60
-20
-10
0
10
20
30
40
50
60
2003 2004 2005 2006 2007 2008 2009 2010 2011 2012 2013
SydneyMelbournePerthAustralian capitals
Source: Australian Bureau of Statistics; RP Data; and ANZ.
0
10
20
30
40
50
60
70
80
90
0
10
20
30
40
50
60
70
80
90
NZL
CHL
AU
S
CAN
1/
KOR
CHE
1/
GBR
1/
NO
R
SWE
ESP
JPN
NLD ITA
DEU FRA
BRA
1/
USA
Other urban Two largest cities
1/ Measured as urban agglomeration.Source: UN Demographic Yearbook 2011; and IMF staff calculations.
0
1,000
2,000
3,000
4,000
5,000
6,000
7,000
8,000
9,000
10,000
0
1,000
2,000
3,000
4,000
5,000
6,000
7,000
8,000
9,000
10,000
KOR
FRA
CHL
ESP
JPN
BRA
1/
CHE
1/ ITA
NLD
USA
DEU
SWE
NO
R
CAN
1/
AU
S
NZL
1/ Measured as urban agglomeration.Source: UN Demographic Yearbook 2011; and IMF staff calculations.
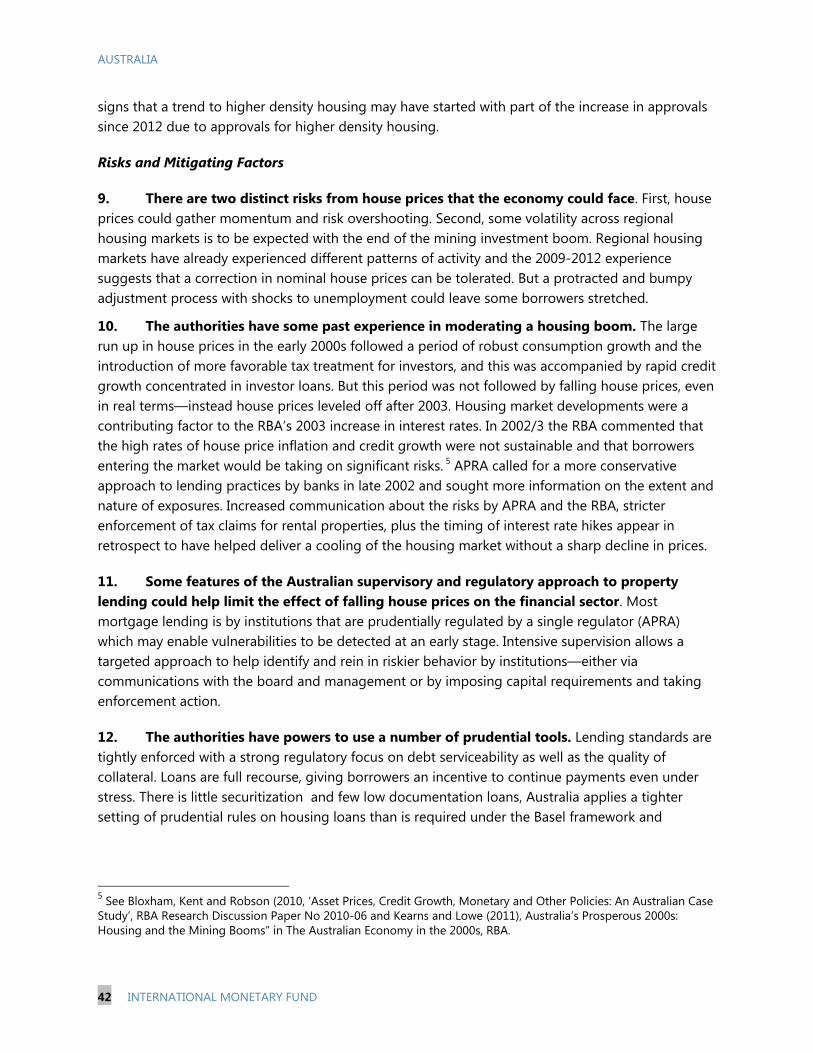
AUSTRALIA
42 INTERNATIONAL MONETARY FUND
signs that a trend to higher density housing may have started with part of the increase in approvals since 2012 due to approvals for higher density housing.
Risks and Mitigating Factors
9. There are two distinct risks from house prices that the economy could face. First, house prices could gather momentum and risk overshooting. Second, some volatility across regional housing markets is to be expected with the end of the mining investment boom. Regional housing markets have already experienced different patterns of activity and the 2009-2012 experience suggests that a correction in nominal house prices can be tolerated. But a protracted and bumpy adjustment process with shocks to unemployment could leave some borrowers stretched.
10. The authorities have some past experience in moderating a housing boom. The large run up in house prices in the early 2000s followed a period of robust consumption growth and the introduction of more favorable tax treatment for investors, and this was accompanied by rapid credit growth concentrated in investor loans. But this period was not followed by falling house prices, even in real terms—instead house prices leveled off after 2003. Housing market developments were a contributing factor to the RBA’s 2003 increase in interest rates. In 2002/3 the RBA commented that the high rates of house price inflation and credit growth were not sustainable and that borrowers entering the market would be taking on significant risks. 5 APRA called for a more conservative approach to lending practices by banks in late 2002 and sought more information on the extent and nature of exposures. Increased communication about the risks by APRA and the RBA, stricter enforcement of tax claims for rental properties, plus the timing of interest rate hikes appear in retrospect to have helped deliver a cooling of the housing market without a sharp decline in prices.
11. Some features of the Australian supervisory and regulatory approach to property lending could help limit the effect of falling house prices on the financial sector. Most mortgage lending is by institutions that are prudentially regulated by a single regulator (APRA) which may enable vulnerabilities to be detected at an early stage. Intensive supervision allows a targeted approach to help identify and rein in riskier behavior by institutions—either via communications with the board and management or by imposing capital requirements and taking enforcement action.
12. The authorities have powers to use a number of prudential tools. Lending standards are tightly enforced with a strong regulatory focus on debt serviceability as well as the quality of collateral. Loans are full recourse, giving borrowers an incentive to continue payments even under stress. There is little securitization and few low documentation loans, Australia applies a tighter setting of prudential rules on housing loans than is required under the Basel framework and
5 See Bloxham, Kent and Robson (2010, ‘Asset Prices, Credit Growth, Monetary and Other Policies: An Australian Case Study’, RBA Research Discussion Paper No 2010-06 and Kearns and Lowe (2011), Australia’s Prosperous 2000s: Housing and the Mining Booms” in The Australian Economy in the 2000s, RBA.
AUSTRALIA
INTERNATIONAL MONETARY FUND 43
institutions’ capital positions are strong.6 APRA has the powers to implement a range of prudential measures—similar to those adopted or under consideration by other economies (see Box)—should they be needed; this could include requiring banks to increase interest sensitivity buffers.
Box: Comparison of Prudential Policies Adopted by Selected Economies
A number of countries have recently adopted a variety of prudential tools to manage risks from rising household indebtedness and house prices after a prolonged period of low interest rates. Some examples are:
Canada. The Canadian system has extensive government backed mortgage insurance. Since 2008 the mortgage insurance rules for high LTV loans have been tightened in variety of ways including by: reducing the maximum amortization period; reducing the LTV ratio for new mortgages, non-owner-occupied properties and mortgage refinancing; reducing the maximum debt service ratio; and tightening other requirements. A guideline for mortgage underwriting practices was issued in 2012 building on the Financial Stability Board Principles for Sound Residential Mortgage Underwriting.
New Zealand. In May 2013 a Memorandum of Understanding was agreed by the Reserve Bank of New Zealand (RBNZ) and the Minister of Finance for macroprudential policy and operating guidelines. In September 2013 the RBNZ introduced higher capital requirements, for high Loan to Value ratio (LTV) housing loans. And, in October, they restricted the amount of high LTV lending (above 80 percent) that banks can take to 10 percent of new mortgage lending. The aim is to introduce a speed limit rather than a ban on high LTV lending. The restriction is seen as a temporary tool which will be removed when imbalances in the housing market are viewed to have abated.
United Kingdom Using its new powers, in June 2013, the Financial Policy Committee (FPC) recommended an assessment of the vulnerability of borrowers and financial institutions to higher interest rates. In November 2013 further measures were implemented or in train. In addition to an earlier announced increase in capital requirements, the authorities announced the removal incentives for household lending via the Funding for Lending Scheme in 2014. New stress tests, including risks arising from housing-related portfolios, will be used to assess capital adequacy. Stronger mortgage underwriting standards will put in place, following the Mortgage Market Review.
Norway, Sweden, and Switzerland are requiring banks to hold more capital against mortgage exposures or have adopted early implementation of the Basel III countercyclical capital buffer. Hong Kong has a debt service cap after a stress test of an applicants’ repayment ability for a 300 basis point rise in interest rates. Hong Kong, Korea, Singapore and some EU countries have restrictions on maximum LTVs, debt service ratios, and/or mortgage terms.
Australia. Banks already hold more capital against higher risk mortgages. Banks typically obtain mortgage insurance for loans to households who take out high LTV mortgages. A feature that distinguishes Australia is that banks include an ‘interest rate buffer’ in their evaluations of loan serviceability. APRA is able to impose restrictions on maximum LTVs but to date has taken the approach of encouraging banks to improve their internal risk management processes in areas such as collateralization and serviceability. Sources: APRA, Canada FSAP 2013, RBNZ Financial Stability Report (11, 2013), Bank of England Financial Stability Report (11 2013).
6 Lenders using the ‘standardized’ approach to capital adequacy are required to hold more capital against higher-risk mortgages than the Basel framework requires. Banks using the ‘advanced’ approach must assume a minimum 20 per cent LGD on mortgages in their risk models, compared to 10 per cent minimum in the Basel framework.
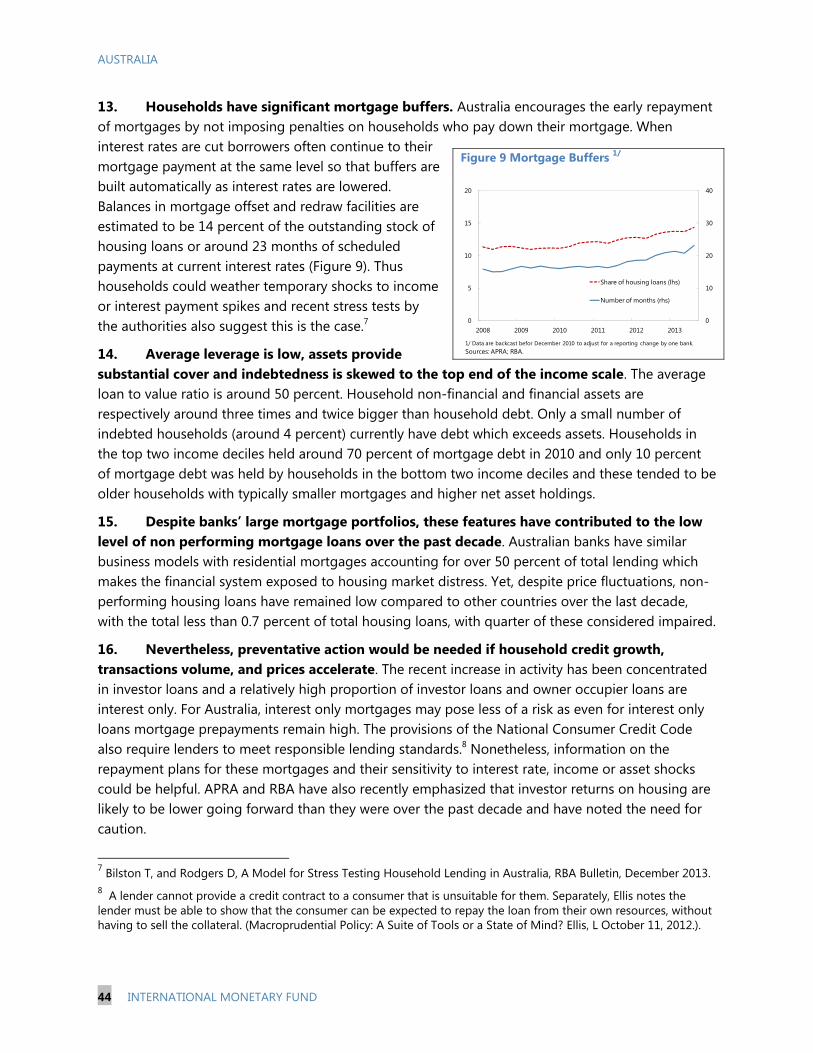
AUSTRALIA
44 INTERNATIONAL MONETARY FUND
13. Households have significant mortgage buffers. Australia encourages the early repayment of mortgages by not imposing penalties on households who pay down their mortgage. When interest rates are cut borrowers often continue to their mortgage payment at the same level so that buffers are built automatically as interest rates are lowered. Balances in mortgage offset and redraw facilities are estimated to be 14 percent of the outstanding stock of housing loans or around 23 months of scheduled payments at current interest rates (Figure 9). Thus households could weather temporary shocks to income or interest payment spikes and recent stress tests by the authorities also suggest this is the case.7
14. Average leverage is low, assets provide substantial cover and indebtedness is skewed to the top end of the income scale. The average loan to value ratio is around 50 percent. Household non-financial and financial assets are respectively around three times and twice bigger than household debt. Only a small number of indebted households (around 4 percent) currently have debt which exceeds assets. Households in the top two income deciles held around 70 percent of mortgage debt in 2010 and only 10 percent of mortgage debt was held by households in the bottom two income deciles and these tended to be older households with typically smaller mortgages and higher net asset holdings.
15. Despite banks’ large mortgage portfolios, these features have contributed to the low level of non performing mortgage loans over the past decade. Australian banks have similar business models with residential mortgages accounting for over 50 percent of total lending which makes the financial system exposed to housing market distress. Yet, despite price fluctuations, non-performing housing loans have remained low compared to other countries over the last decade, with the total less than 0.7 percent of total housing loans, with quarter of these considered impaired.
16. Nevertheless, preventative action would be needed if household credit growth, transactions volume, and prices accelerate. The recent increase in activity has been concentrated in investor loans and a relatively high proportion of investor loans and owner occupier loans are interest only. For Australia, interest only mortgages may pose less of a risk as even for interest only loans mortgage prepayments remain high. The provisions of the National Consumer Credit Code also require lenders to meet responsible lending standards.8 Nonetheless, information on the repayment plans for these mortgages and their sensitivity to interest rate, income or asset shocks could be helpful. APRA and RBA have also recently emphasized that investor returns on housing are likely to be lower going forward than they were over the past decade and have noted the need for caution.
7 Bilston T, and Rodgers D, A Model for Stress Testing Household Lending in Australia, RBA Bulletin, December 2013. 8 A lender cannot provide a credit contract to a consumer that is unsuitable for them. Separately, Ellis notes the lender must be able to show that the consumer can be expected to repay the loan from their own resources, without having to sell the collateral. (Macroprudential Policy: A Suite of Tools or a State of Mind? Ellis, L October 11, 2012.).
Figure 9 Mortgage Buffers 1/
0
10
20
30
40
0
5
10
15
20
2008 2009 2010 2011 2012 2013
Share of housing loans (lhs)
Number of months (rhs)
1/ Data are backcast befor December 2010 to adjust for a reporting change by one bank.Sources: APRA; RBA.
AUSTRALIA
INTERNATIONAL MONETARY FUND 45
References
André C (2010), ‘A Bird’s Eye View of OECD Housing Markets’, OECD Economics Department Working Paper No 746 (OECD, 2010).
Battellino R (2010), ‘Aspects of Australia’s Finances’, Address to Financial Executives International of Australia, Sydney, 15 June.
Berry M, T Dalton and A Nelson (2010), Mortgage Default in Australia: Nature, Causes and Social and Economic Impacts, AHURI Final Report No 145, Australian Housing and Urban Research Institute, Melbourne.
Bloxham P, C Kent and M Robson (2010), ‘Asset Prices, Credit Growth, Monetary and Other Policies: An Australian Case Study’, RBA Research Discussion Paper No 2010-06.
Debelle G (2004), ‘Macroeconomic Implications of Rising Household Debt’, BIS Working Paper No 153.
Ellis, L, (2012) Prudent Mortgage Lending Standards Help Ensure Financial Stability. Address to the Australian Mortgage Conference 2012.
Ellis, L. and C. Naughtin (2010), “Commercial Property and Financial Stability—An International Perspective”, RBA Bulletin, June Quarter 2010.
Ellis L, (2006), Housing and Housing Finance: The View from Australia and Beyond (RBA RDP, 2006-12).
IMF (2012) Australia: Financial System Stability Assessment (12/308).
Kearns, J and P. Lowe (2011), “Australia’s Prosperous 2000s: Housing and the Mining Booms” in The Australian Economy in the 2000s, Reserve Bank of Australia.
Kent C (2013), Recent Developments in the Australian Housing Market. Address to the Australian Institute of Building.
RBA Bulletin (2012), The Distribution of Household Wealth in Australia: Evidence from the 2010 HILDA Survey.
RBA Financial Stability Review (2011) Box C Household Experiences in the Downturn: Evidence from the HILDA Survey.
Stevens G The Cautious Consumer Address to the Anika Foundation Luncheon. July 2011.
Tumbarello P and S Wang (2010), ‘What Drives House Prices in Australia? A Cross-Country Approach’, IMF Working Paper No WP/10/291. (IMF, 2010)
Yates J and S Whelan (2009), Housing Wealth and Consumer Spending, AHURI Final Report No 132, Australian Housing and Urban Research Institute, Melbourne.
Wilkins R and M Wooden (2009), ‘Household Debt in Australia: The Looming Crisis that Isn’t’, The Australian Economic Review, 42(3), pp 358–366.
Wilkins R (2013), Household Debt Dynamics families, Incomes and Jobs, Volume 8, HILDA Survey.
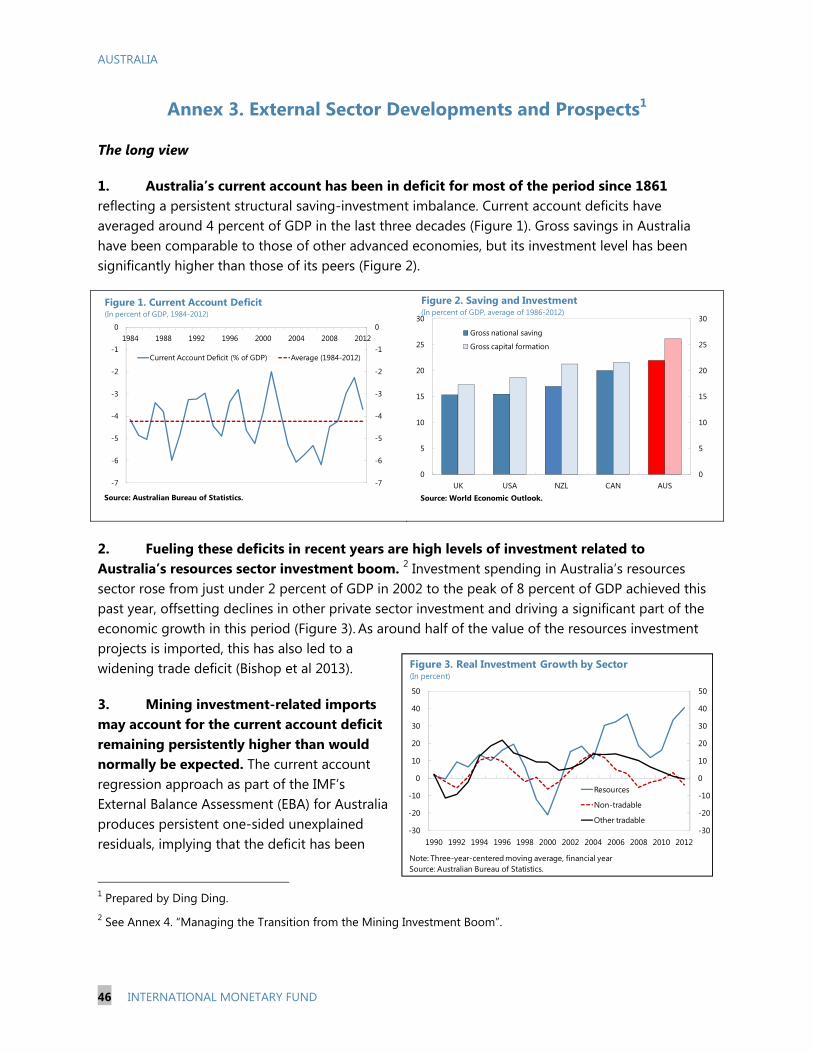
AUSTRALIA
46 INTERNATIONAL MONETARY FUND
Annex 3. External Sector Developments and Prospects1 The long view
1. Australia’s current account has been in deficit for most of the period since 1861 reflecting a persistent structural saving-investment imbalance. Current account deficits have averaged around 4 percent of GDP in the last three decades (Figure 1). Gross savings in Australia have been comparable to those of other advanced economies, but its investment level has been significantly higher than those of its peers (Figure 2).
2. Fueling these deficits in recent years are high levels of investment related to Australia’s resources sector investment boom. 2 Investment spending in Australia’s resources sector rose from just under 2 percent of GDP in 2002 to the peak of 8 percent of GDP achieved this past year, offsetting declines in other private sector investment and driving a significant part of the economic growth in this period (Figure 3). As around half of the value of the resources investment projects is imported, this has also led to a widening trade deficit (Bishop et al 2013).
3. Mining investment-related imports may account for the current account deficit remaining persistently higher than would normally be expected. The current account regression approach as part of the IMF’s External Balance Assessment (EBA) for Australia produces persistent one-sided unexplained residuals, implying that the deficit has been
1 Prepared by Ding Ding. 2 See Annex 4. “Managing the Transition from the Mining Investment Boom”.
-7
-6
-5
-4
-3
-2
-1
0
-7
-6
-5
-4
-3
-2
-1
01984 1988 1992 1996 2000 2004 2008 2012
Current Account Deficit (% of GDP) Average (1984-2012)
Source: Australian Bureau of Statistics.
Figure 1. Current Account Deficit(In percent of GDP, 1984-2012)
0
5
10
15
20
25
30
0
5
10
15
20
25
30
UK USA NZL CAN AUS
Gross national saving
Gross capital formation
Figure 2. Saving and Investment(In percent of GDP, average of 1986-2012)
Source: World Economic Outlook.
-30
-20
-10
0
10
20
30
40
50
-30
-20
-10
0
10
20
30
40
50
1990 1992 1994 1996 1998 2000 2002 2004 2006 2008 2010 2012
Resources
Non-tradable
Other tradable
Figure 3. Real Investment Growth by Sector(In percent)
Note: Three-year-centered moving average, financial yearSource: Australian Bureau of Statistics.
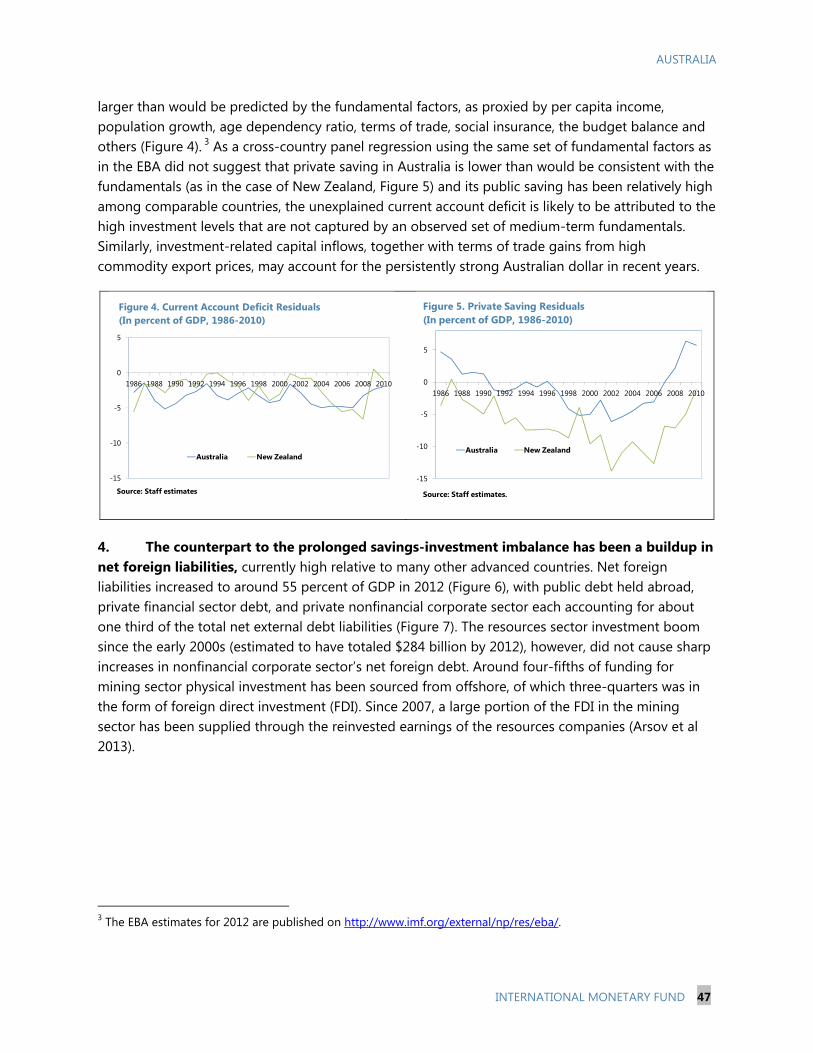
AUSTRALIA
INTERNATIONAL MONETARY FUND 47
larger than would be predicted by the fundamental factors, as proxied by per capita income, population growth, age dependency ratio, terms of trade, social insurance, the budget balance and others (Figure 4). 3 As a cross-country panel regression using the same set of fundamental factors as in the EBA did not suggest that private saving in Australia is lower than would be consistent with the fundamentals (as in the case of New Zealand, Figure 5) and its public saving has been relatively high among comparable countries, the unexplained current account deficit is likely to be attributed to the high investment levels that are not captured by an observed set of medium-term fundamentals. Similarly, investment-related capital inflows, together with terms of trade gains from high commodity export prices, may account for the persistently strong Australian dollar in recent years.
4. The counterpart to the prolonged savings-investment imbalance has been a buildup in net foreign liabilities, currently high relative to many other advanced countries. Net foreign liabilities increased to around 55 percent of GDP in 2012 (Figure 6), with public debt held abroad, private financial sector debt, and private nonfinancial corporate sector each accounting for about one third of the total net external debt liabilities (Figure 7). The resources sector investment boom since the early 2000s (estimated to have totaled $284 billion by 2012), however, did not cause sharp increases in nonfinancial corporate sector’s net foreign debt. Around four-fifths of funding for mining sector physical investment has been sourced from offshore, of which three-quarters was in the form of foreign direct investment (FDI). Since 2007, a large portion of the FDI in the mining sector has been supplied through the reinvested earnings of the resources companies (Arsov et al 2013).
3 The EBA estimates for 2012 are published on http://www.imf.org/external/np/res/eba/.
-15
-10
-5
0
5
1986 1988 1990 1992 1994 1996 1998 2000 2002 2004 2006 2008 2010
Australia New Zealand
Figure 4. Current Account Deficit Residuals(In percent of GDP, 1986-2010)
Source: Staff estimates
-15
-10
-5
0
5
1986 1988 1990 1992 1994 1996 1998 2000 2002 2004 2006 2008 2010
Australia New Zealand
Figure 5. Private Saving Residuals(In percent of GDP, 1986-2010)
Source: Staff estimates.
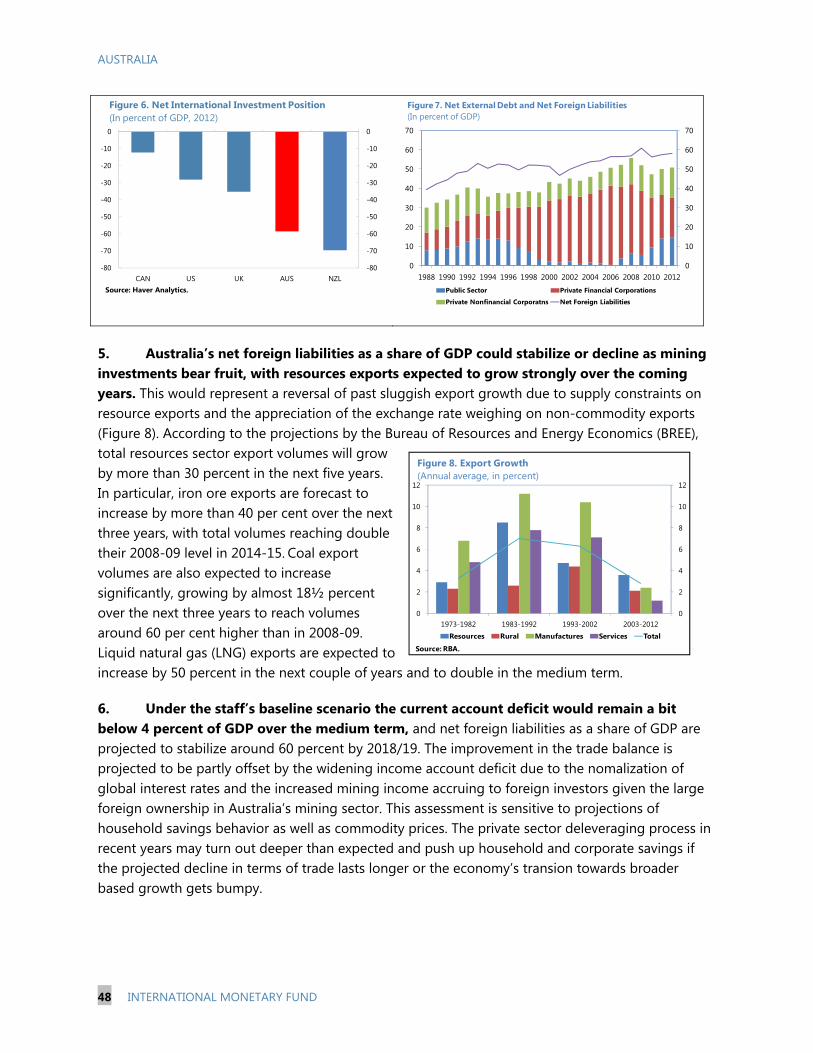
AUSTRALIA
48 INTERNATIONAL MONETARY FUND
5. Australia’s net foreign liabilities as a share of GDP could stabilize or decline as mining investments bear fruit, with resources exports expected to grow strongly over the coming years. This would represent a reversal of past sluggish export growth due to supply constraints on resource exports and the appreciation of the exchange rate weighing on non-commodity exports (Figure 8). According to the projections by the Bureau of Resources and Energy Economics (BREE), total resources sector export volumes will grow by more than 30 percent in the next five years. In particular, iron ore exports are forecast to increase by more than 40 per cent over the next three years, with total volumes reaching double their 2008-09 level in 2014-15. Coal export volumes are also expected to increase significantly, growing by almost 18½ percent over the next three years to reach volumes around 60 per cent higher than in 2008-09. Liquid natural gas (LNG) exports are expected to increase by 50 percent in the next couple of years and to double in the medium term.
6. Under the staff’s baseline scenario the current account deficit would remain a bit below 4 percent of GDP over the medium term, and net foreign liabilities as a share of GDP are projected to stabilize around 60 percent by 2018/19. The improvement in the trade balance is projected to be partly offset by the widening income account deficit due to the nomalization of global interest rates and the increased mining income accruing to foreign investors given the large foreign ownership in Australia’s mining sector. This assessment is sensitive to projections of household savings behavior as well as commodity prices. The private sector deleveraging process in recent years may turn out deeper than expected and push up household and corporate savings if the projected decline in terms of trade lasts longer or the economy’s transion towards broader based growth gets bumpy.
-80
-70
-60
-50
-40
-30
-20
-10
0
-80
-70
-60
-50
-40
-30
-20
-10
0
CAN US UK AUS NZL
Figure 6. Net International Investment Position(In percent of GDP, 2012)
Source: Haver Analytics.
0
10
20
30
40
50
60
70
0
10
20
30
40
50
60
70
1988 1990 1992 1994 1996 1998 2000 2002 2004 2006 2008 2010 2012
Figure 7. Net External Debt and Net Foreign Liabilities(In percent of GDP)
Public Sector Private Financial Corporations
Private Nonfinancial Corporatns Net Foreign Liabilities
0
2
4
6
8
10
12
0
2
4
6
8
10
12
1973-1982 1983-1992 1993-2002 2003-2012
Figure 8. Export Growth (Annual average, in percent)
Resources Rural Manufactures Services Total
Source: RBA.
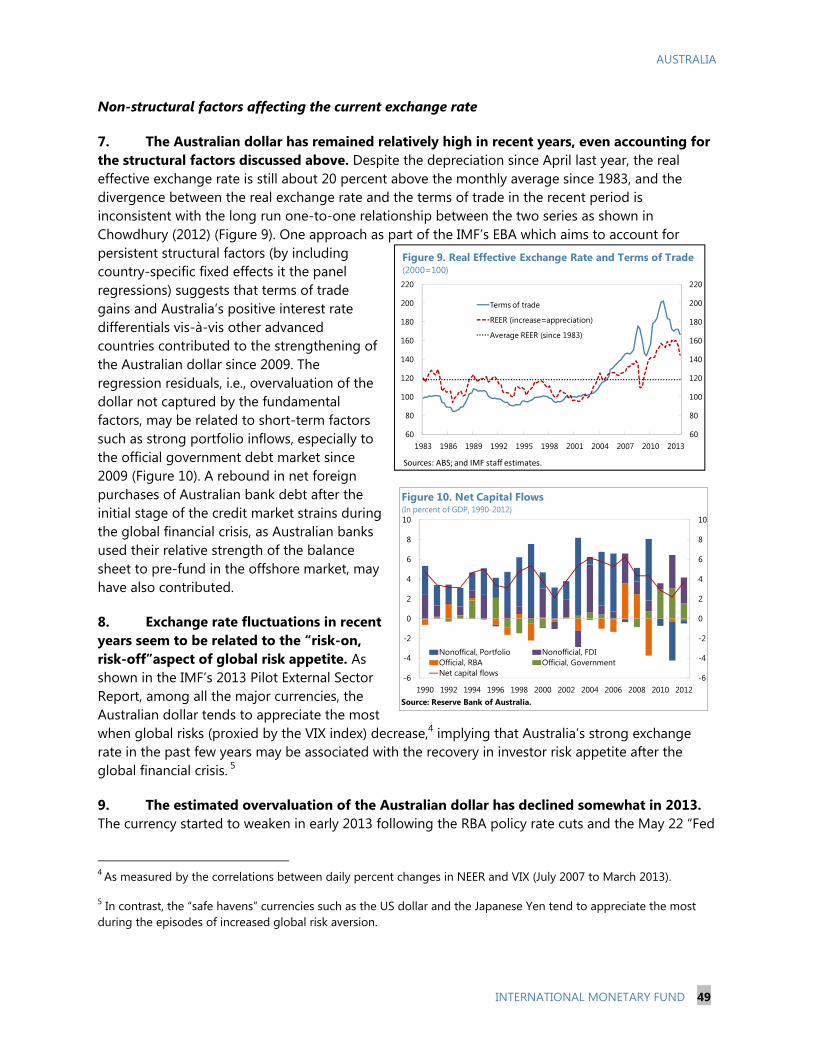
AUSTRALIA
INTERNATIONAL MONETARY FUND 49
Non-structural factors affecting the current exchange rate
7. The Australian dollar has remained relatively high in recent years, even accounting for the structural factors discussed above. Despite the depreciation since April last year, the real effective exchange rate is still about 20 percent above the monthly average since 1983, and the divergence between the real exchange rate and the terms of trade in the recent period is inconsistent with the long run one-to-one relationship between the two series as shown in Chowdhury (2012) (Figure 9). One approach as part of the IMF’s EBA which aims to account for persistent structural factors (by including country-specific fixed effects it the panel regressions) suggests that terms of trade gains and Australia’s positive interest rate differentials vis-à-vis other advanced countries contributed to the strengthening of the Australian dollar since 2009. The regression residuals, i.e., overvaluation of the dollar not captured by the fundamental factors, may be related to short-term factors such as strong portfolio inflows, especially to the official government debt market since 2009 (Figure 10). A rebound in net foreign purchases of Australian bank debt after the initial stage of the credit market strains during the global financial crisis, as Australian banks used their relative strength of the balance sheet to pre-fund in the offshore market, may have also contributed.
8. Exchange rate fluctuations in recent years seem to be related to the “risk-on, risk-off”aspect of global risk appetite. As shown in the IMF’s 2013 Pilot External Sector Report, among all the major currencies, the Australian dollar tends to appreciate the most when global risks (proxied by the VIX index) decrease,4 implying that Australia’s strong exchange rate in the past few years may be associated with the recovery in investor risk appetite after the global financial crisis. 5
9. The estimated overvaluation of the Australian dollar has declined somewhat in 2013. The currency started to weaken in early 2013 following the RBA policy rate cuts and the May 22 “Fed
4 As measured by the correlations between daily percent changes in NEER and VIX (July 2007 to March 2013).
5 In contrast, the “safe havens” currencies such as the US dollar and the Japanese Yen tend to appreciate the most during the episodes of increased global risk aversion.
-6
-4
-2
0
2
4
6
8
10
-6
-4
-2
0
2
4
6
8
10
1990 1992 1994 1996 1998 2000 2002 2004 2006 2008 2010 2012
Nonoffical, Portfolio Nonofficial, FDIOfficial, RBA Official, GovernmentNet capital flows
Figure 10. Net Capital Flows(In percent of GDP, 1990-2012)
Source: Reserve Bank of Australia.
60
80
100
120
140
160
180
200
220
60
80
100
120
140
160
180
200
220
1983 1986 1989 1992 1995 1998 2001 2004 2007 2010 2013
Terms of trade
REER (increase=appreciation)
Average REER (since 1983)
Figure 9. Real Effective Exchange Rate and Terms of Trade(2000=100)
Sources: ABS; and IMF staff estimates.
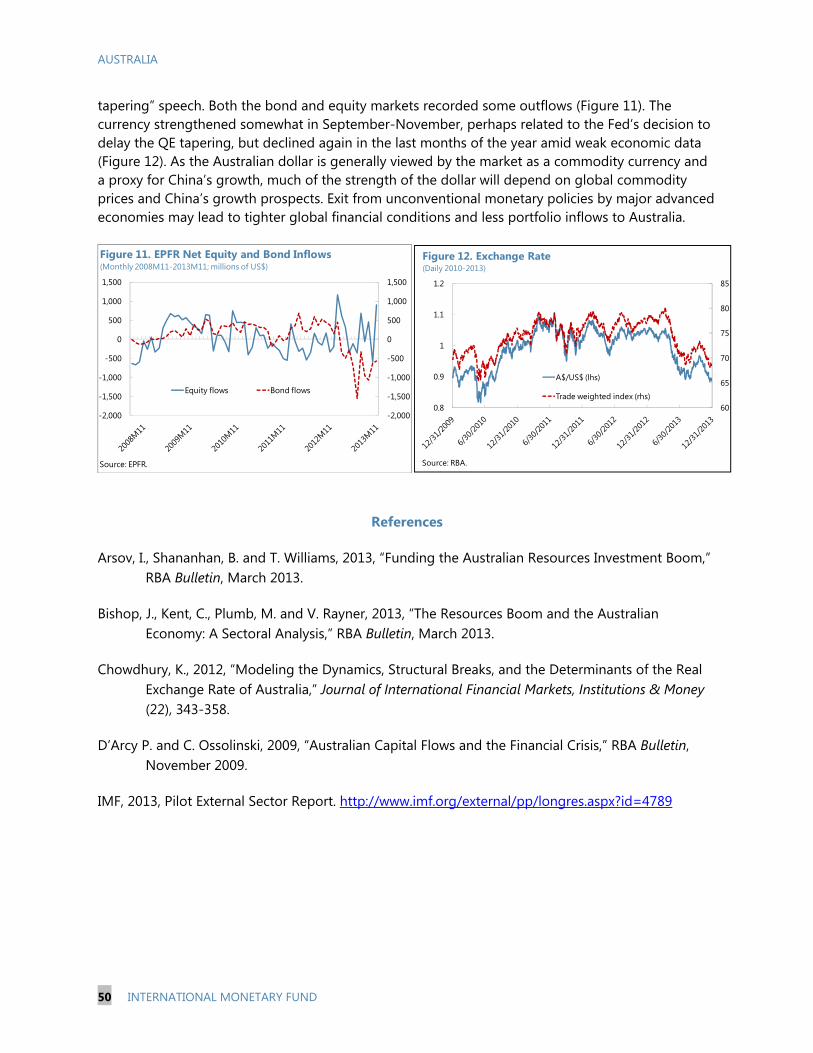
AUSTRALIA
50 INTERNATIONAL MONETARY FUND
tapering” speech. Both the bond and equity markets recorded some outflows (Figure 11). The currency strengthened somewhat in September-November, perhaps related to the Fed’s decision to delay the QE tapering, but declined again in the last months of the year amid weak economic data (Figure 12). As the Australian dollar is generally viewed by the market as a commodity currency and a proxy for China’s growth, much of the strength of the dollar will depend on global commodity prices and China’s growth prospects. Exit from unconventional monetary policies by major advanced economies may lead to tighter global financial conditions and less portfolio inflows to Australia.
References
Arsov, I., Shananhan, B. and T. Williams, 2013, “Funding the Australian Resources Investment Boom,” RBA Bulletin, March 2013.
Bishop, J., Kent, C., Plumb, M. and V. Rayner, 2013, “The Resources Boom and the Australian Economy: A Sectoral Analysis,” RBA Bulletin, March 2013.
Chowdhury, K., 2012, “Modeling the Dynamics, Structural Breaks, and the Determinants of the Real Exchange Rate of Australia,” Journal of International Financial Markets, Institutions & Money (22), 343-358.
D’Arcy P. and C. Ossolinski, 2009, “Australian Capital Flows and the Financial Crisis,” RBA Bulletin, November 2009.
IMF, 2013, Pilot External Sector Report. http://www.imf.org/external/pp/longres.aspx?id=4789
-2,000
-1,500
-1,000
-500
0
500
1,000
1,500
-2,000
-1,500
-1,000
-500
0
500
1,000
1,500
Equity flows Bond flows
Figure 11. EPFR Net Equity and Bond Inflows(Monthly 2008M11-2013M11; millions of US$)
Source: EPFR.
60
65
70
75
80
85
0.8
0.9
1
1.1
1.2
A$/US$ (lhs)
Trade weighted index (rhs)
Figure 12. Exchange Rate(Daily 2010-2013)
Source: RBA.
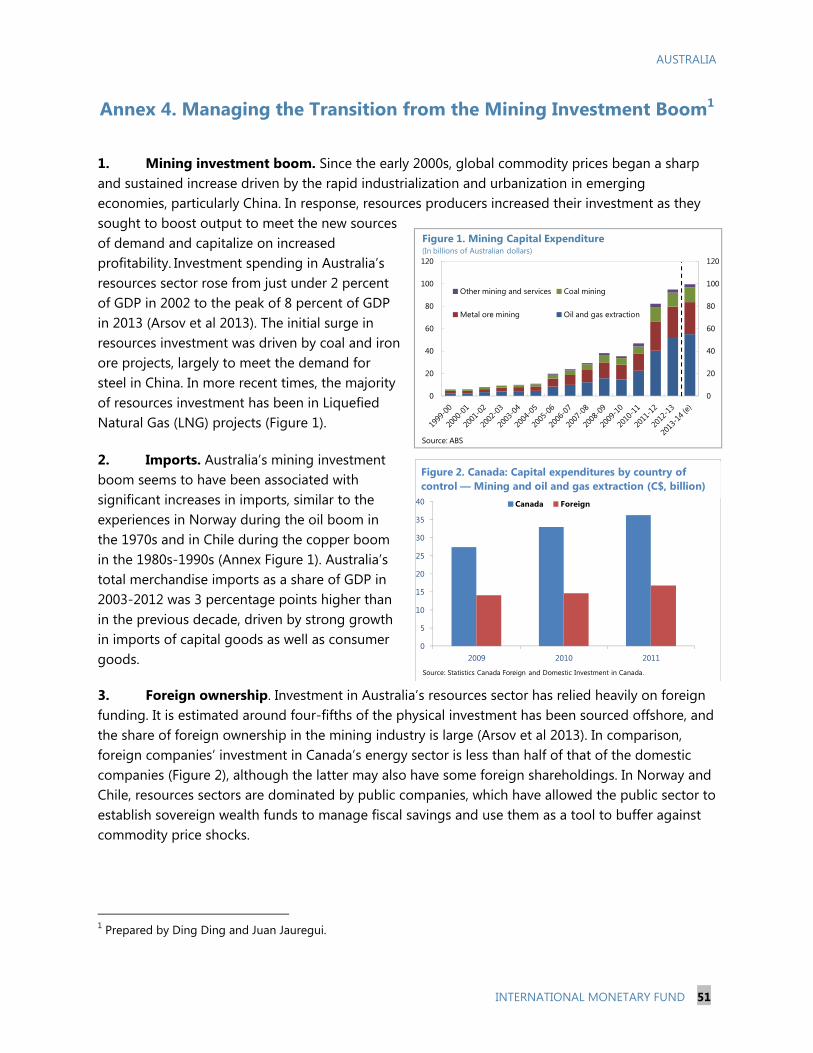
AUSTRALIA
INTERNATIONAL MONETARY FUND 51
Annex 4. Managing the Transition from the Mining Investment Boom1
1. Mining investment boom. Since the early 2000s, global commodity prices began a sharp and sustained increase driven by the rapid industrialization and urbanization in emerging economies, particularly China. In response, resources producers increased their investment as they sought to boost output to meet the new sources of demand and capitalize on increased profitability. Investment spending in Australia’s resources sector rose from just under 2 percent of GDP in 2002 to the peak of 8 percent of GDP in 2013 (Arsov et al 2013). The initial surge in resources investment was driven by coal and iron ore projects, largely to meet the demand for steel in China. In more recent times, the majority of resources investment has been in Liquefied Natural Gas (LNG) projects (Figure 1).
2. Imports. Australia’s mining investment boom seems to have been associated with significant increases in imports, similar to the experiences in Norway during the oil boom in the 1970s and in Chile during the copper boom in the 1980s-1990s (Annex Figure 1). Australia’s total merchandise imports as a share of GDP in 2003-2012 was 3 percentage points higher than in the previous decade, driven by strong growth in imports of capital goods as well as consumer goods.
3. Foreign ownership. Investment in Australia’s resources sector has relied heavily on foreign funding. It is estimated around four-fifths of the physical investment has been sourced offshore, and the share of foreign ownership in the mining industry is large (Arsov et al 2013). In comparison, foreign companies’ investment in Canada’s energy sector is less than half of that of the domestic companies (Figure 2), although the latter may also have some foreign shareholdings. In Norway and Chile, resources sectors are dominated by public companies, which have allowed the public sector to establish sovereign wealth funds to manage fiscal savings and use them as a tool to buffer against commodity price shocks.
1 Prepared by Ding Ding and Juan Jauregui.
0
5
10
15
20
25
30
35
40
2009 2010 2011
Canada Foreign
Figure 2. Canada: Capital expenditures by country of control — Mining and oil and gas extraction (C$, billion)
Source: Statistics Canada Foreign and Domestic Investment in Canada.
0
20
40
60
80
100
120
0
20
40
60
80
100
120
Other mining and services Coal mining
Metal ore mining Oil and gas extraction
Figure 1. Mining Capital Expenditure(In billions of Australian dollars)
Source: ABS
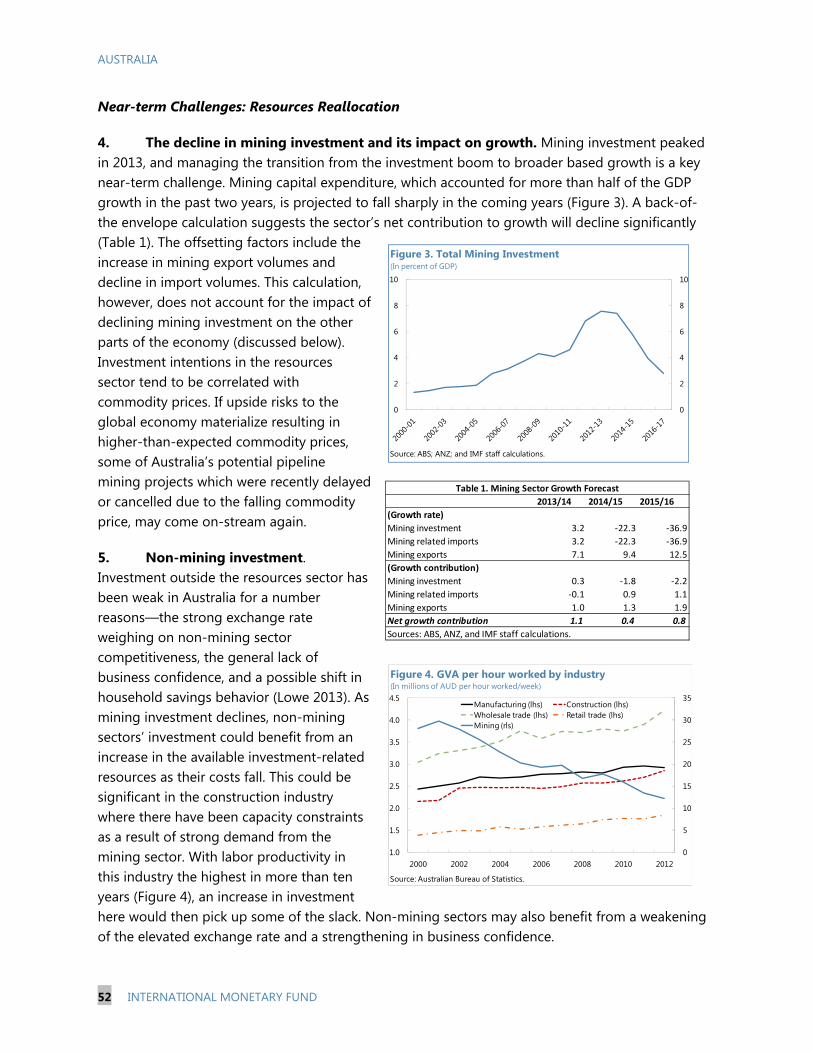
AUSTRALIA
52 INTERNATIONAL MONETARY FUND
Near-term Challenges: Resources Reallocation
4. The decline in mining investment and its impact on growth. Mining investment peaked in 2013, and managing the transition from the investment boom to broader based growth is a key near-term challenge. Mining capital expenditure, which accounted for more than half of the GDP growth in the past two years, is projected to fall sharply in the coming years (Figure 3). A back-of-the envelope calculation suggests the sector’s net contribution to growth will decline significantly (Table 1). The offsetting factors include the increase in mining export volumes and decline in import volumes. This calculation, however, does not account for the impact of declining mining investment on the other parts of the economy (discussed below). Investment intentions in the resources sector tend to be correlated with commodity prices. If upside risks to the global economy materialize resulting in higher-than-expected commodity prices, some of Australia’s potential pipeline mining projects which were recently delayed or cancelled due to the falling commodity price, may come on-stream again.
5. Non-mining investment. Investment outside the resources sector has been weak in Australia for a number reasons—the strong exchange rate weighing on non-mining sector competitiveness, the general lack of business confidence, and a possible shift in household savings behavior (Lowe 2013). As mining investment declines, non-mining sectors’ investment could benefit from an increase in the available investment-related resources as their costs fall. This could be significant in the construction industry where there have been capacity constraints as a result of strong demand from the mining sector. With labor productivity in this industry the highest in more than ten years (Figure 4), an increase in investment here would then pick up some of the slack. Non-mining sectors may also benefit from a weakening of the elevated exchange rate and a strengthening in business confidence.
0
5
10
15
20
25
30
35
1.0
1.5
2.0
2.5
3.0
3.5
4.0
4.5
2000 2002 2004 2006 2008 2010 2012
Manufacturing (lhs) Construction (lhs)Wholesale trade (lhs) Retail trade (lhs)Mining (rls)
Figure 4. GVA per hour worked by industry (In millions of AUD per hour worked/week)
Source: Australian Bureau of Statistics.
0
2
4
6
8
10
0
2
4
6
8
10
Figure 3. Total Mining Investment(In percent of GDP)
Source: ABS; ANZ; and IMF staff calculations.
2013/14 2014/15 2015/16
(Growth rate)
Mining investment 3.2 -22.3 -36.9
Mining related imports 3.2 -22.3 -36.9
Mining exports 7.1 9.4 12.5
(Growth contribution)
Mining investment 0.3 -1.8 -2.2
Mining related imports -0.1 0.9 1.1
Mining exports 1.0 1.3 1.9
Net growth contribution 1.1 0.4 0.8
Sources: ABS, ANZ, and IMF staff calculations.
Table 1. Mining Sector Growth Forecast
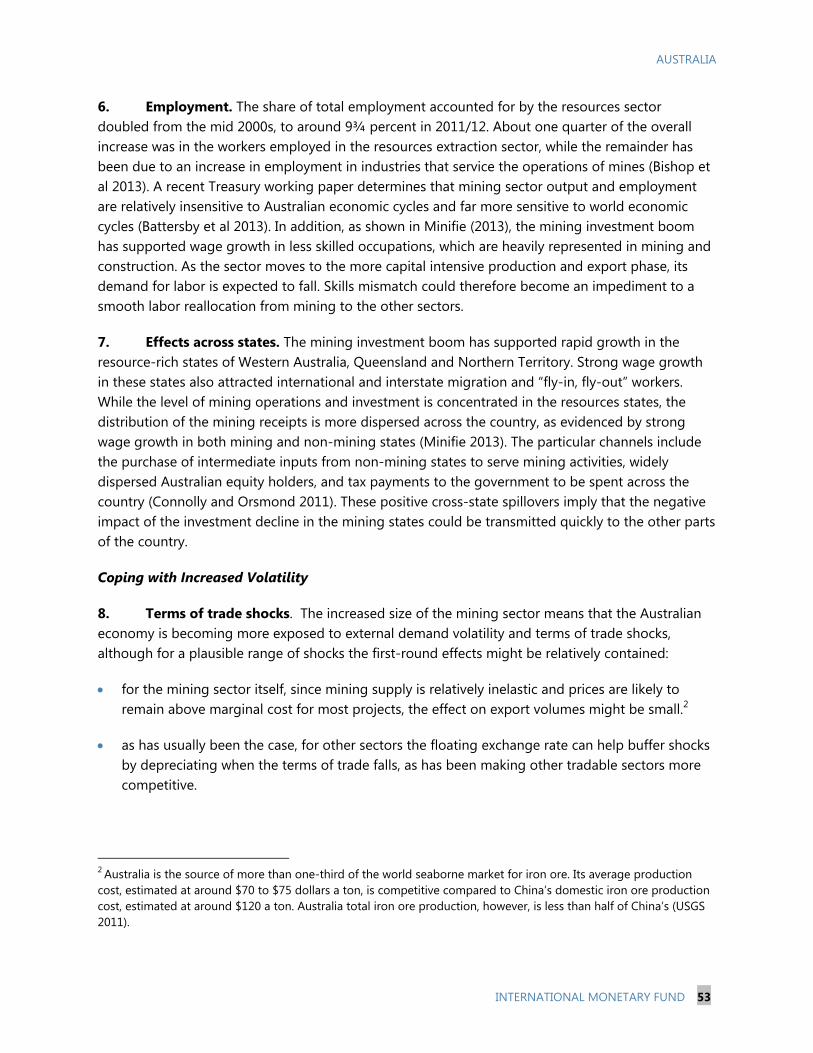
AUSTRALIA
INTERNATIONAL MONETARY FUND 53
6. Employment. The share of total employment accounted for by the resources sector doubled from the mid 2000s, to around 9¾ percent in 2011/12. About one quarter of the overall increase was in the workers employed in the resources extraction sector, while the remainder has been due to an increase in employment in industries that service the operations of mines (Bishop et al 2013). A recent Treasury working paper determines that mining sector output and employment are relatively insensitive to Australian economic cycles and far more sensitive to world economic cycles (Battersby et al 2013). In addition, as shown in Minifie (2013), the mining investment boom has supported wage growth in less skilled occupations, which are heavily represented in mining and construction. As the sector moves to the more capital intensive production and export phase, its demand for labor is expected to fall. Skills mismatch could therefore become an impediment to a smooth labor reallocation from mining to the other sectors.
7. Effects across states. The mining investment boom has supported rapid growth in the resource-rich states of Western Australia, Queensland and Northern Territory. Strong wage growth in these states also attracted international and interstate migration and “fly-in, fly-out” workers. While the level of mining operations and investment is concentrated in the resources states, the distribution of the mining receipts is more dispersed across the country, as evidenced by strong wage growth in both mining and non-mining states (Minifie 2013). The particular channels include the purchase of intermediate inputs from non-mining states to serve mining activities, widely dispersed Australian equity holders, and tax payments to the government to be spent across the country (Connolly and Orsmond 2011). These positive cross-state spillovers imply that the negative impact of the investment decline in the mining states could be transmitted quickly to the other parts of the country.
Coping with Increased Volatility
8. Terms of trade shocks. The increased size of the mining sector means that the Australian economy is becoming more exposed to external demand volatility and terms of trade shocks, although for a plausible range of shocks the first-round effects might be relatively contained:
for the mining sector itself, since mining supply is relatively inelastic and prices are likely to remain above marginal cost for most projects, the effect on export volumes might be small.2
as has usually been the case, for other sectors the floating exchange rate can help buffer shocks by depreciating when the terms of trade falls, as has been making other tradable sectors more competitive.
2 Australia is the source of more than one-third of the world seaborne market for iron ore. Its average production cost, estimated at around $70 to $75 dollars a ton, is competitive compared to China’s domestic iron ore production cost, estimated at around $120 a ton. Australia total iron ore production, however, is less than half of China’s (USGS 2011).
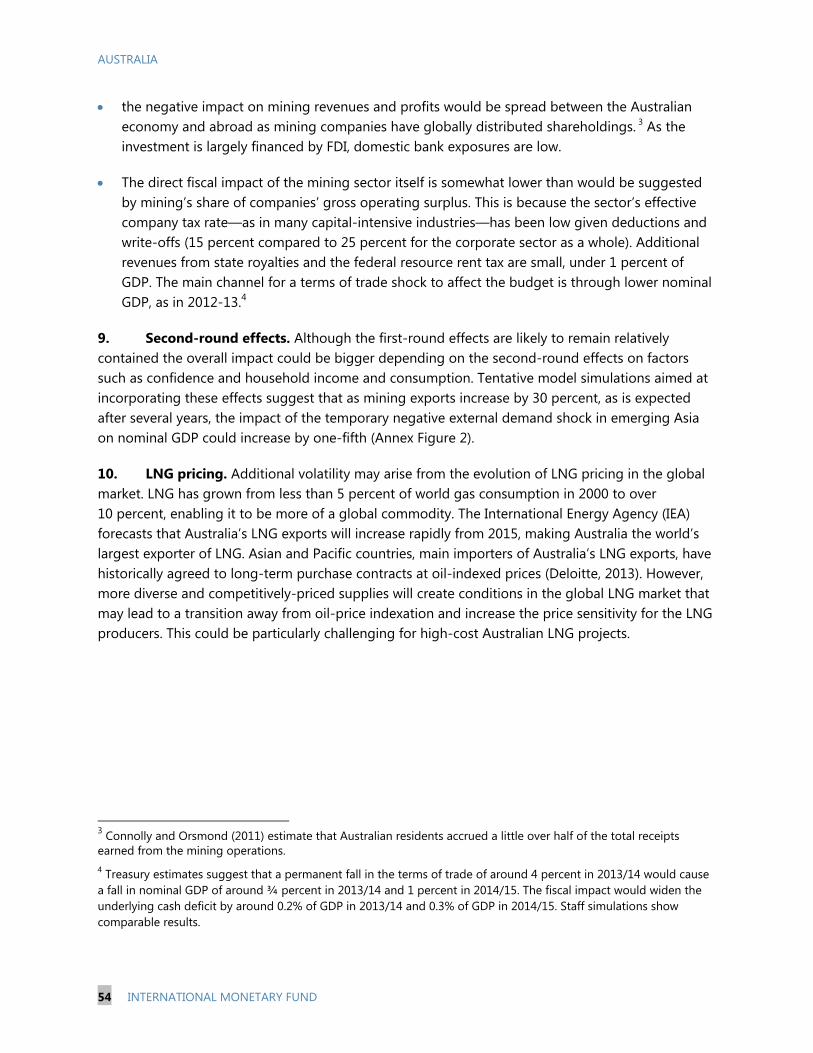
AUSTRALIA
54 INTERNATIONAL MONETARY FUND
the negative impact on mining revenues and profits would be spread between the Australian economy and abroad as mining companies have globally distributed shareholdings. 3 As the investment is largely financed by FDI, domestic bank exposures are low.
The direct fiscal impact of the mining sector itself is somewhat lower than would be suggested by mining’s share of companies’ gross operating surplus. This is because the sector’s effective company tax rate—as in many capital-intensive industries—has been low given deductions and write-offs (15 percent compared to 25 percent for the corporate sector as a whole). Additional revenues from state royalties and the federal resource rent tax are small, under 1 percent of GDP. The main channel for a terms of trade shock to affect the budget is through lower nominal GDP, as in 2012-13.4
9. Second-round effects. Although the first-round effects are likely to remain relatively contained the overall impact could be bigger depending on the second-round effects on factors such as confidence and household income and consumption. Tentative model simulations aimed at incorporating these effects suggest that as mining exports increase by 30 percent, as is expected after several years, the impact of the temporary negative external demand shock in emerging Asia on nominal GDP could increase by one-fifth (Annex Figure 2).
10. LNG pricing. Additional volatility may arise from the evolution of LNG pricing in the global market. LNG has grown from less than 5 percent of world gas consumption in 2000 to over 10 percent, enabling it to be more of a global commodity. The International Energy Agency (IEA) forecasts that Australia’s LNG exports will increase rapidly from 2015, making Australia the world’s largest exporter of LNG. Asian and Pacific countries, main importers of Australia’s LNG exports, have historically agreed to long-term purchase contracts at oil-indexed prices (Deloitte, 2013). However, more diverse and competitively-priced supplies will create conditions in the global LNG market that may lead to a transition away from oil-price indexation and increase the price sensitivity for the LNG producers. This could be particularly challenging for high-cost Australian LNG projects.
3 Connolly and Orsmond (2011) estimate that Australian residents accrued a little over half of the total receipts earned from the mining operations. 4 Treasury estimates suggest that a permanent fall in the terms of trade of around 4 percent in 2013/14 would cause a fall in nominal GDP of around ¾ percent in 2013/14 and 1 percent in 2014/15. The fiscal impact would widen the underlying cash deficit by around 0.2% of GDP in 2013/14 and 0.3% of GDP in 2014/15. Staff simulations show comparable results.
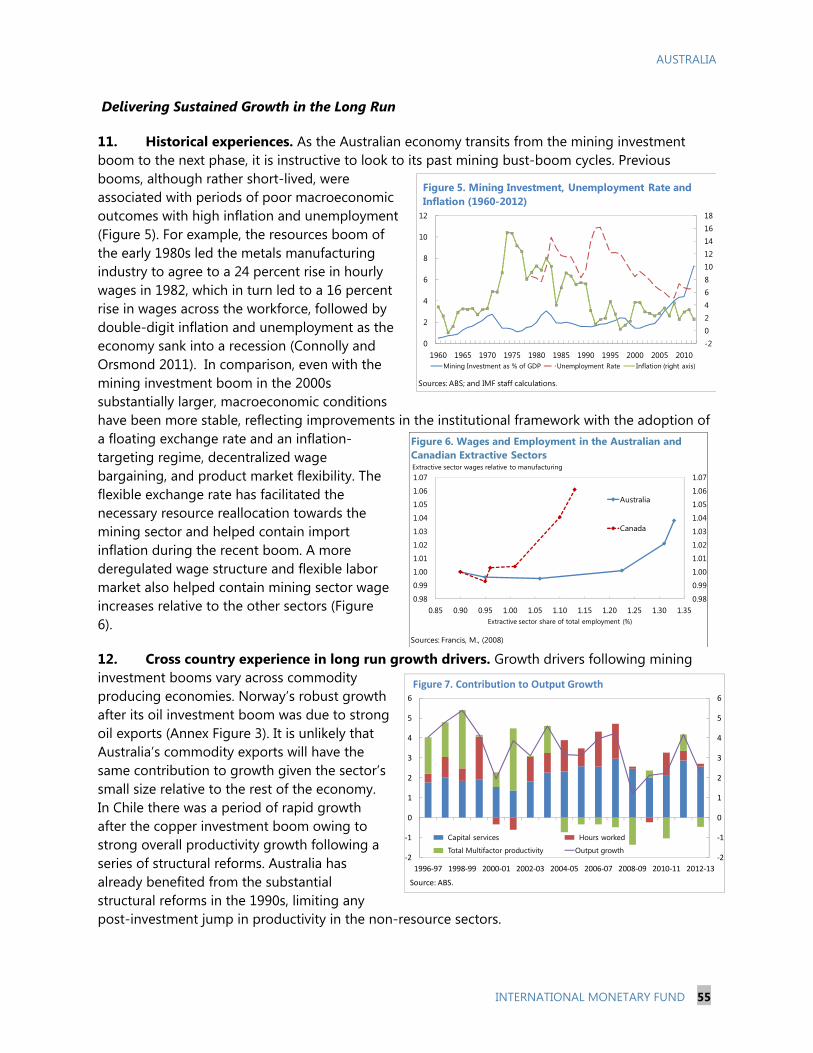
AUSTRALIA
INTERNATIONAL MONETARY FUND 55
Delivering Sustained Growth in the Long Run
11. Historical experiences. As the Australian economy transits from the mining investment boom to the next phase, it is instructive to look to its past mining bust-boom cycles. Previous booms, although rather short-lived, were associated with periods of poor macroeconomic outcomes with high inflation and unemployment (Figure 5). For example, the resources boom of the early 1980s led the metals manufacturing industry to agree to a 24 percent rise in hourly wages in 1982, which in turn led to a 16 percent rise in wages across the workforce, followed by double-digit inflation and unemployment as the economy sank into a recession (Connolly and Orsmond 2011). In comparison, even with the mining investment boom in the 2000s substantially larger, macroeconomic conditions have been more stable, reflecting improvements in the institutional framework with the adoption of a floating exchange rate and an inflation-targeting regime, decentralized wage bargaining, and product market flexibility. The flexible exchange rate has facilitated the necessary resource reallocation towards the mining sector and helped contain import inflation during the recent boom. A more deregulated wage structure and flexible labor market also helped contain mining sector wage increases relative to the other sectors (Figure 6).
12. Cross country experience in long run growth drivers. Growth drivers following mining investment booms vary across commodity producing economies. Norway’s robust growth after its oil investment boom was due to strong oil exports (Annex Figure 3). It is unlikely that Australia’s commodity exports will have the same contribution to growth given the sector’s small size relative to the rest of the economy. In Chile there was a period of rapid growth after the copper investment boom owing to strong overall productivity growth following a series of structural reforms. Australia has already benefited from the substantial structural reforms in the 1990s, limiting any post-investment jump in productivity in the non-resource sectors.
-2024681012141618
0
2
4
6
8
10
12
1960 1965 1970 1975 1980 1985 1990 1995 2000 2005 2010Mining Investment as % of GDP Unemployment Rate Inflation (right axis)
Figure 5. Mining Investment, Unemployment Rate and Inflation (1960-2012)
Sources: ABS; and IMF staff calculations.
0.98
0.99
1.00
1.01
1.02
1.03
1.04
1.05
1.06
1.07
0.98
0.99
1.00
1.01
1.02
1.03
1.04
1.05
1.06
1.07
0.85 0.90 0.95 1.00 1.05 1.10 1.15 1.20 1.25 1.30 1.35Extractive sector share of total employment (%)
Australia
Canada
Figure 6. Wages and Employment in the Australian and Canadian Extractive Sectors
Sources: Francis, M., (2008)
Extractive sector wages relative to manufacturing
-2
-1
0
1
2
3
4
5
6
-2
-1
0
1
2
3
4
5
6
1996-97 1998-99 2000-01 2002-03 2004-05 2006-07 2008-09 2010-11 2012-13
Figure 7. Contribution to Output Growth
Capital services Hours worked
Total Multifactor productivity Output growth
Source: ABS.
AUSTRALIA
56 INTERNATIONAL MONETARY FUND
13. Productivity and potential output over the medium term. In order to deliver sustained growth at a rate around 3 percent in the long run, multifactor productivity growth needs to reverse its declining trend to compensate the likely decline in the growth of capital inputs (Figure 7).5 Some of the productivity gains may come from the mining sector, which has experienced a sharp decline in measured productivity partly due to investment-to-output lags (See Box and Productivity Commission 2009). Staff’s sectoral analysis indicates that as the mining sector’s share in the economy rises, if mining productivity growth increases to above 2 percent and if productivity growth in the other sectors remains at the average level of the last decade, total multifactor productivity growth will rise to near 1 percent, a level consistent with GDP growth at around 3 percent.6
5 Assuming that hours worked grow at the same rate as population at an annual rate around 1.8 percent, capital input grows in line with GDP, and the relative labor and capital income shares remain at their current levels, a 3 percent annual growth rate requires the multifactor productivity (MFP) to grow at 0.7 percent a year, close to the historical average of 1994-2011. 6 A study by the Bureau of Resources and Energy Economics (BREE 2013) finds that after removing the influence of both deposit quality depletion and production lags, the MFP growth rate in Australia’s mining increases from an average annual rate of negative 0.65 to positive 2.5 per cent between 1985-86 and 2009-10.
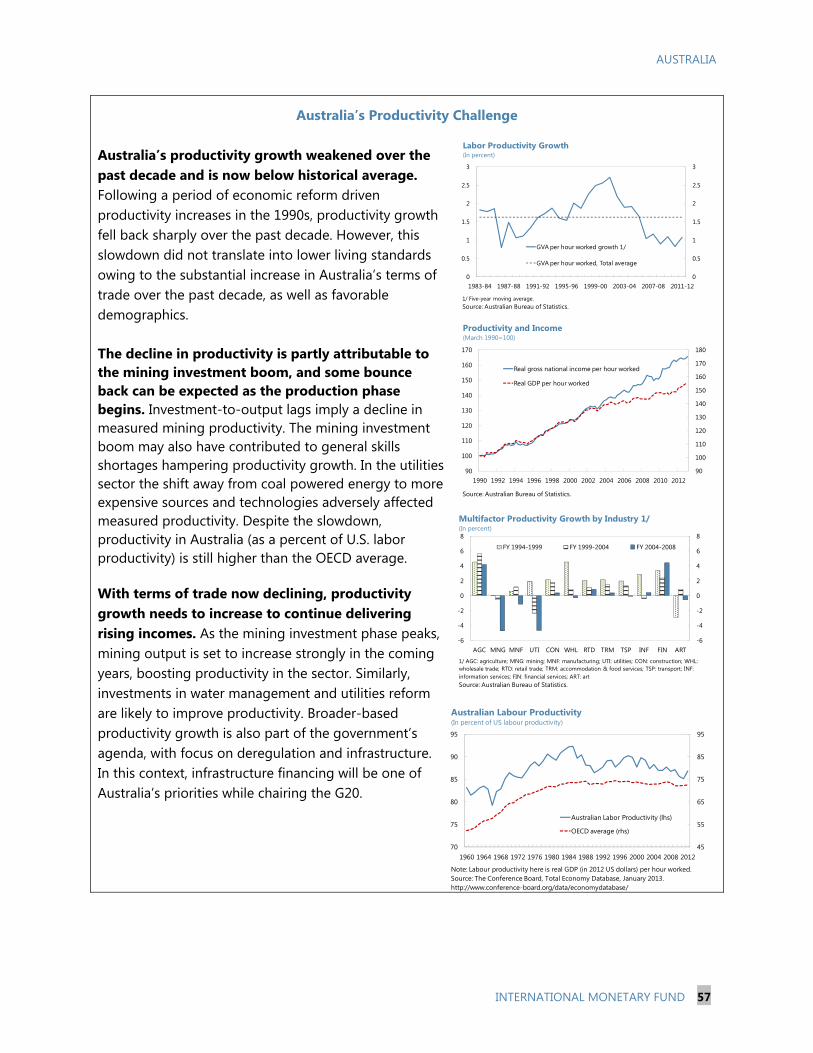
AUSTRALIA
INTERNATIONAL MONETARY FUND 57
Australia’s Productivity Challenge Australia’s productivity growth weakened over the past decade and is now below historical average. Following a period of economic reform driven productivity increases in the 1990s, productivity growth fell back sharply over the past decade. However, this slowdown did not translate into lower living standards owing to the substantial increase in Australia’s terms of trade over the past decade, as well as favorable demographics. The decline in productivity is partly attributable to the mining investment boom, and some bounce back can be expected as the production phase begins. Investment-to-output lags imply a decline in measured mining productivity. The mining investment boom may also have contributed to general skills shortages hampering productivity growth. In the utilities sector the shift away from coal powered energy to more expensive sources and technologies adversely affected measured productivity. Despite the slowdown, productivity in Australia (as a percent of U.S. labor productivity) is still higher than the OECD average.
With terms of trade now declining, productivity growth needs to increase to continue delivering rising incomes. As the mining investment phase peaks, mining output is set to increase strongly in the coming years, boosting productivity in the sector. Similarly, investments in water management and utilities reform are likely to improve productivity. Broader-based productivity growth is also part of the government’s agenda, with focus on deregulation and infrastructure. In this context, infrastructure financing will be one of Australia’s priorities while chairing the G20.
0
0.5
1
1.5
2
2.5
3
0
0.5
1
1.5
2
2.5
3
1983-84 1987-88 1991-92 1995-96 1999-00 2003-04 2007-08 2011-12
GVA per hour worked growth 1/
GVA per hour worked, Total average
Labor Productivity Growth(In percent)
1/ Five-year moving average.Source: Australian Bureau of Statistics.
90
100
110
120
130
140
150
160
170
180
90
100
110
120
130
140
150
160
170
1990 1992 1994 1996 1998 2000 2002 2004 2006 2008 2010 2012
Real gross national income per hour worked
Real GDP per hour worked
Productivity and Income(March 1990=100)
Source: Australian Bureau of Statistics.
45
55
65
75
85
95
70
75
80
85
90
95
1960 1964 1968 1972 1976 1980 1984 1988 1992 1996 2000 2004 2008 2012
Australian Labor Productivity (lhs)
OECD average (rhs)
Note: Labour productivity here is real GDP (in 2012 US dollars) per hour worked.Source: The Conference Board, Total Economy Database, January 2013.http://www.conference-board.org/data/economydatabase/
Australian Labour Productivity(In percent of US labour productivity)
-6
-4
-2
0
2
4
6
8
-6
-4
-2
0
2
4
6
8
AGC MNG MNF UTI CON WHL RTD TRM TSP INF FIN ART
FY 1994-1999 FY 1999-2004 FY 2004-2008
Multifactor Productivity Growth by Industry 1/(In percent)
1/ AGC: agriculture; MNG: mining; MNF: manufacturing; UTI: utilities; CON: construction; WHL: wholesale trade; RTD: retail trade; TRM: accommodation & food services; TSP: transport; INF: information services; FIN: financial services; ART: artSource: Australian Bureau of Statistics.
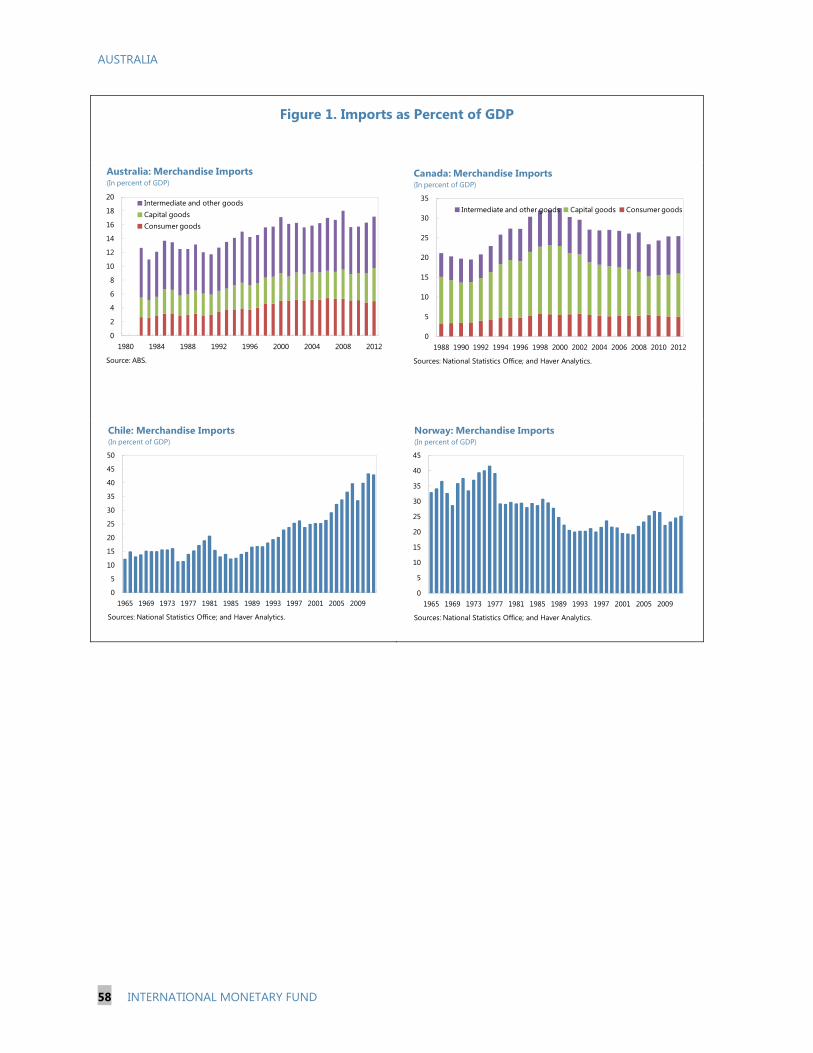
AUSTRALIA
58 INTERNATIONAL MONETARY FUND
Figure 1. Imports as Percent of GDP
0
2
4
6
8
10
12
14
16
18
20
1980 1984 1988 1992 1996 2000 2004 2008 2012
Intermediate and other goodsCapital goodsConsumer goods
Australia: Merchandise Imports(In percent of GDP)
Source: ABS.
0
5
10
15
20
25
30
35
1988 1990 1992 1994 1996 1998 2000 2002 2004 2006 2008 2010 2012
Intermediate and other goods Capital goods Consumer goods
Canada: Merchandise Imports(In percent of GDP)
Sources: National Statistics Office; and Haver Analytics.
0
5
10
15
20
25
30
35
40
45
50
1965 1969 1973 1977 1981 1985 1989 1993 1997 2001 2005 2009
Chile: Merchandise Imports(In percent of GDP)
Sources: National Statistics Office; and Haver Analytics.
0
5
10
15
20
25
30
35
40
45
1965 1969 1973 1977 1981 1985 1989 1993 1997 2001 2005 2009
Sources: National Statistics Office; and Haver Analytics.
Norway: Merchandise Imports(In percent of GDP)
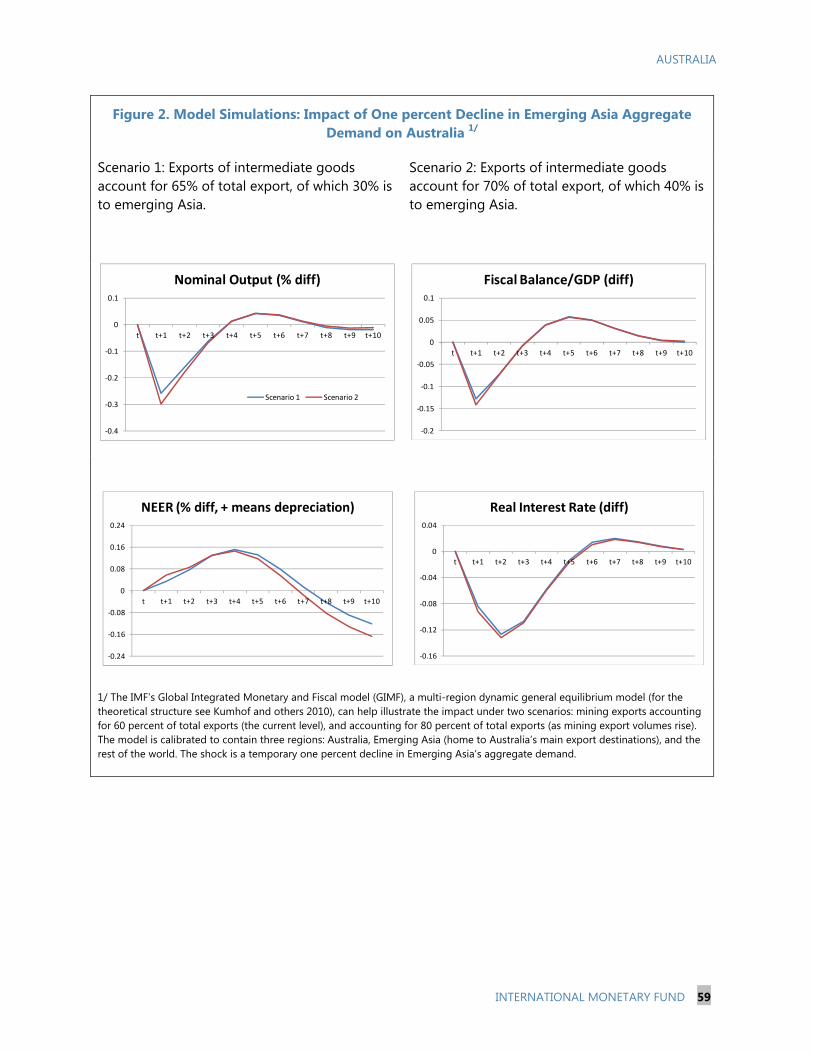
AUSTRALIA
INTERNATIONAL MONETARY FUND 59
Figure 2. Model Simulations: Impact of One percent Decline in Emerging Asia Aggregate Demand on Australia 1/
Scenario 1: Exports of intermediate goods account for 65% of total export, of which 30% is to emerging Asia.
Scenario 2: Exports of intermediate goods account for 70% of total export, of which 40% is to emerging Asia.
1/ The IMF’s Global Integrated Monetary and Fiscal model (GIMF), a multi-region dynamic general equilibrium model (for the theoretical structure see Kumhof and others 2010), can help illustrate the impact under two scenarios: mining exports accounting for 60 percent of total exports (the current level), and accounting for 80 percent of total exports (as mining export volumes rise). The model is calibrated to contain three regions: Australia, Emerging Asia (home to Australia’s main export destinations), and the rest of the world. The shock is a temporary one percent decline in Emerging Asia’s aggregate demand.
-0.4
-0.3
-0.2
-0.1
0
0.1
t t+1 t+2 t+3 t+4 t+5 t+6 t+7 t+8 t+9 t+10
Nominal Output (% diff)
Scenario 1 Scenario 2
-0.2
-0.15
-0.1
-0.05
0
0.05
0.1
t t+1 t+2 t+3 t+4 t+5 t+6 t+7 t+8 t+9 t+10
Fiscal Balance/GDP (diff)
-0.24
-0.16
-0.08
0
0.08
0.16
0.24
t t+1 t+2 t+3 t+4 t+5 t+6 t+7 t+8 t+9 t+10
NEER (% diff, + means depreciation)
-0.16
-0.12
-0.08
-0.04
0
0.04
t t+1 t+2 t+3 t+4 t+5 t+6 t+7 t+8 t+9 t+10
Real Interest Rate (diff)
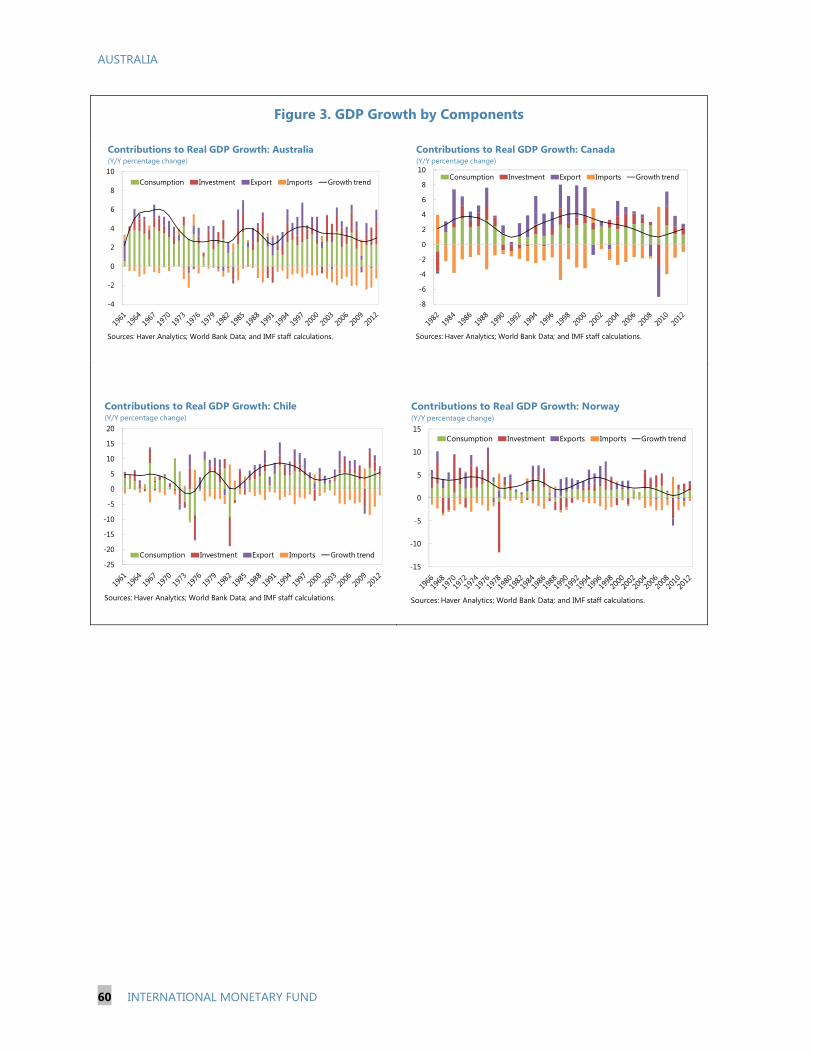
AUSTRALIA
60 INTERNATIONAL MONETARY FUND
Figure 3. GDP Growth by Components
-4
-2
0
2
4
6
8
10Consumption Investment Export Imports Growth trend
Contributions to Real GDP Growth: Australia(Y/Y percentage change)
Sources: Haver Analytics; World Bank Data; and IMF staff calculations.
-8
-6
-4
-2
0
2
4
6
8
10Consumption Investment Export Imports Growth trend
Contributions to Real GDP Growth: Canada(Y/Y percentage change)
Sources: Haver Analytics; World Bank Data; and IMF staff calculations.
-25
-20
-15
-10
-5
0
5
10
15
20
Consumption Investment Export Imports Growth trend
Contributions to Real GDP Growth: Chile(Y/Y percentage change)
Sources: Haver Analytics; World Bank Data; and IMF staff calculations.
-15
-10
-5
0
5
10
15Consumption Investment Exports Imports Growth trend
Contributions to Real GDP Growth: Norway(Y/Y percentage change)
Sources: Haver Analytics; World Bank Data; and IMF staff calculations.
AUSTRALIA
INTERNATIONAL MONETARY FUND 61
References
Arsov, I., Shanahan, B. and T. Williams, 2013, “Funding the Australian Resources Investment Boom,” RBA Bulletin March Quarter 2013.
Battersby, B., Kouparitsas, M. and J. Munro, 2013, “Uncovering the Sources of Sectoral Employment Fluctuations,” Treasury Working Paper, 2013-03.
Bishop, J., Kent, C., Plumb, M. and V. Rayner, 2013, “The Resources Boom and the Australian Economy: A Sectoral Analysis,” RBA Bulletin, March 2013.
BREE (Bureau of Resources and Energy Economics), 2013, “Productivity in the Australian Mining Sector,” March 2013.
Conolly, E., Jaaskela, J. and M. van der Merwe, 2013, “The Performance of Resource-exporting Economies,” RBA Bulletin September Quarter 2013.
Connolly, E. and D. Orsmond, 2011, “The Mining Industry: From Bust to Boom,” RBA Research Discussion Paper 2011-08.
Deloitte, 2013, “Oil and Gas Reality Check 2013 – A Look at the Top Issues facing the Oil and Gas Sector”.
Francis, M., 2008, “Adjusting to the Commodity-Price Boom: The Experiences of Four Industrialized Countries,” Bank of Canada Review, Autumn 2008.
Gross, I., and J. Hansen, 2013, “Reserves of Natural Resources in a Small Open Economy,” RBA Research Discussion Paper 2013-14.
Kumhof, M., D. Laxton, D. Muir, and S. Mursula, 2010, “The Global Integrated Monetary and Fiscal Model (GIMF) – Theoretical Structure,” IMF Working Paper 10/34.
Lowe, P.,2013, “Investment and the Australian Economy,” Address to the CFA Australia Investment Conference, October 2013.
Minifie, J., 2013, “The Mining Boom: Impacts and Prospects,” Grattan Institute, July 2013.
Productivity Commission (PC), 2009, “Australia’s Productivity Performance”.
Stevens, G., 2013, “Economic Policy after the Booms,” Address to the Anika Foundation Luncheon, July 2013.
U.S. Geological Survey (USGS) 2011 Minerals Yearbook.
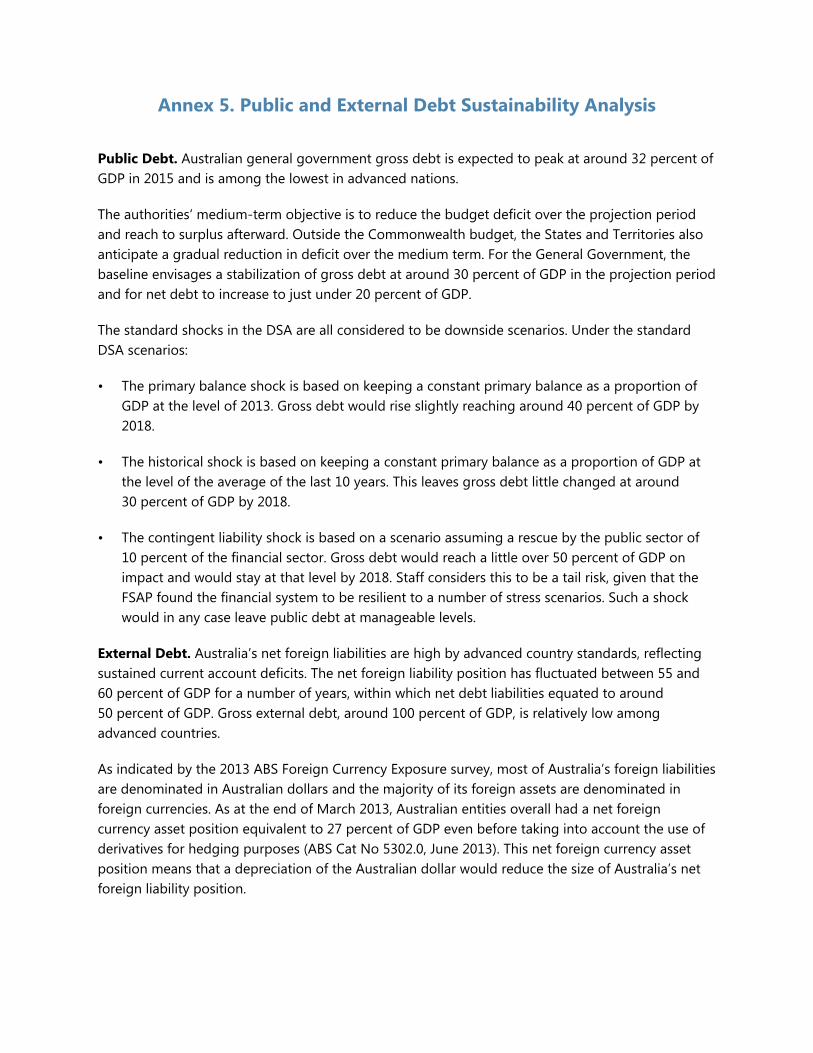
Annex 5. Public and External Debt Sustainability Analysis
Public Debt. Australian general government gross debt is expected to peak at around 32 percent of GDP in 2015 and is among the lowest in advanced nations.
The authorities‘ medium-term objective is to reduce the budget deficit over the projection period and reach to surplus afterward. Outside the Commonwealth budget, the States and Territories also anticipate a gradual reduction in deficit over the medium term. For the General Government, the baseline envisages a stabilization of gross debt at around 30 percent of GDP in the projection period and for net debt to increase to just under 20 percent of GDP.
The standard shocks in the DSA are all considered to be downside scenarios. Under the standard DSA scenarios:
• The primary balance shock is based on keeping a constant primary balance as a proportion of GDP at the level of 2013. Gross debt would rise slightly reaching around 40 percent of GDP by 2018.
• The historical shock is based on keeping a constant primary balance as a proportion of GDP at the level of the average of the last 10 years. This leaves gross debt little changed at around 30 percent of GDP by 2018.
• The contingent liability shock is based on a scenario assuming a rescue by the public sector of 10 percent of the financial sector. Gross debt would reach a little over 50 percent of GDP on impact and would stay at that level by 2018. Staff considers this to be a tail risk, given that the FSAP found the financial system to be resilient to a number of stress scenarios. Such a shock would in any case leave public debt at manageable levels.
External Debt. Australia’s net foreign liabilities are high by advanced country standards, reflecting sustained current account deficits. The net foreign liability position has fluctuated between 55 and 60 percent of GDP for a number of years, within which net debt liabilities equated to around 50 percent of GDP. Gross external debt, around 100 percent of GDP, is relatively low among advanced countries.
As indicated by the 2013 ABS Foreign Currency Exposure survey, most of Australia’s foreign liabilities are denominated in Australian dollars and the majority of its foreign assets are denominated in foreign currencies. As at the end of March 2013, Australian entities overall had a net foreign currency asset position equivalent to 27 percent of GDP even before taking into account the use of derivatives for hedging purposes (ABS Cat No 5302.0, June 2013). This net foreign currency asset position means that a depreciation of the Australian dollar would reduce the size of Australia’s net foreign liability position.
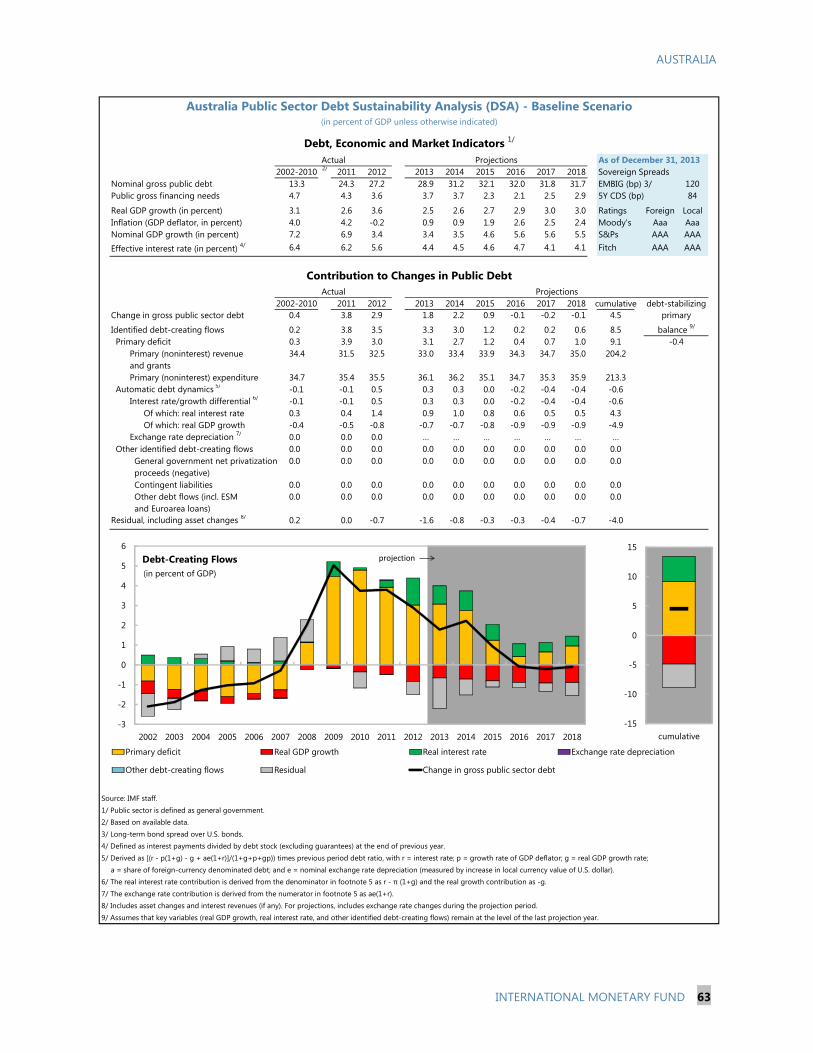
AUSTRALIA
INTERNATIONAL MONETARY FUND 63
As of December 31, 20132/ 2011 2012 2013 2014 2015 2016 2017 2018 Sovereign Spreads
Nominal gross public debt 13.3 24.3 27.2 28.9 31.2 32.1 32.0 31.8 31.7 EMBIG (bp) 3/ 120Public gross financing needs 4.7 4.3 3.6 3.7 3.7 2.3 2.1 2.5 2.9 5Y CDS (bp) 84
Real GDP growth (in percent) 3.1 2.6 3.6 2.5 2.6 2.7 2.9 3.0 3.0 Ratings Foreign LocalInflation (GDP deflator, in percent) 4.0 4.2 -0.2 0.9 0.9 1.9 2.6 2.5 2.4 Moody's Aaa AaaNominal GDP growth (in percent) 7.2 6.9 3.4 3.4 3.5 4.6 5.6 5.6 5.5 S&Ps AAA AAA
Effective interest rate (in percent) 4/ 6.4 6.2 5.6 4.4 4.5 4.6 4.7 4.1 4.1 Fitch AAA AAA
2011 2012 2013 2014 2015 2016 2017 2018 cumulativeChange in gross public sector debt 0.4 3.8 2.9 1.8 2.2 0.9 -0.1 -0.2 -0.1 4.5
Identified debt-creating flows 0.2 3.8 3.5 3.3 3.0 1.2 0.2 0.2 0.6 8.5Primary deficit 0.3 3.9 3.0 3.1 2.7 1.2 0.4 0.7 1.0 9.1
Primary (noninterest) revenue 34.4 31.5 32.5 33.0 33.4 33.9 34.3 34.7 35.0 204.2and grantsPrimary (noninterest) expenditure 34.7 35.4 35.5 36.1 36.2 35.1 34.7 35.3 35.9 213.3
Automatic debt dynamics 5/ -0.1 -0.1 0.5 0.3 0.3 0.0 -0.2 -0.4 -0.4 -0.6Interest rate/growth differential 6/ -0.1 -0.1 0.5 0.3 0.3 0.0 -0.2 -0.4 -0.4 -0.6
Of which: real interest rate 0.3 0.4 1.4 0.9 1.0 0.8 0.6 0.5 0.5 4.3Of which: real GDP growth -0.4 -0.5 -0.8 -0.7 -0.7 -0.8 -0.9 -0.9 -0.9 -4.9
Exchange rate depreciation 7/ 0.0 0.0 0.0 … … … … … … …Other identified debt-creating flows 0.0 0.0 0.0 0.0 0.0 0.0 0.0 0.0 0.0 0.0
General government net privatization 0.0 0.0 0.0 0.0 0.0 0.0 0.0 0.0 0.0 0.0proceeds (negative)Contingent liabilities 0.0 0.0 0.0 0.0 0.0 0.0 0.0 0.0 0.0 0.0Other debt flows (incl. ESM 0.0 0.0 0.0 0.0 0.0 0.0 0.0 0.0 0.0 0.0and Euroarea loans)
Residual, including asset changes 8/ 0.2 0.0 -0.7 -1.6 -0.8 -0.3 -0.3 -0.4 -0.7 -4.0
Source: IMF staff.1/ Public sector is defined as general government.2/ Based on available data.3/ Long-term bond spread over U.S. bonds.4/ Defined as interest payments divided by debt stock (excluding guarantees) at the end of previous year.5/ Derived as [(r - p(1+g) - g + ae(1+r)]/(1+g+p+gp)) times previous period debt ratio, with r = interest rate; p = growth rate of GDP deflator; g = real GDP growth rate;
a = share of foreign-currency denominated debt; and e = nominal exchange rate depreciation (measured by increase in local currency value of U.S. dollar).6/ The real interest rate contribution is derived from the denominator in footnote 5 as r - π (1+g) and the real growth contribution as -g.7/ The exchange rate contribution is derived from the numerator in footnote 5 as ae(1+r). 8/ Includes asset changes and interest revenues (if any). For projections, includes exchange rate changes during the projection period.9/ Assumes that key variables (real GDP growth, real interest rate, and other identified debt-creating flows) remain at the level of the last projection year.
Australia Public Sector Debt Sustainability Analysis (DSA) - Baseline Scenario
-0.4balance 9/
primary
(in percent of GDP unless otherwise indicated)
Debt, Economic and Market Indicators 1/
2002-2010Actual
Projections
Contribution to Changes in Public DebtProjections
2002-2010Actual
debt-stabilizing
-3
-2
-1
0
1
2
3
4
5
6
2002 2003 2004 2005 2006 2007 2008 2009 2010 2011 2012 2013 2014 2015 2016 2017 2018
Debt-Creating Flows
Primary deficit Real GDP growth Real interest rate Exchange rate depreciation
Other debt-creating flows Residual Change in gross public sector debt
projection
(in percent of GDP)
-15
-10
-5
0
5
10
15
cumulative
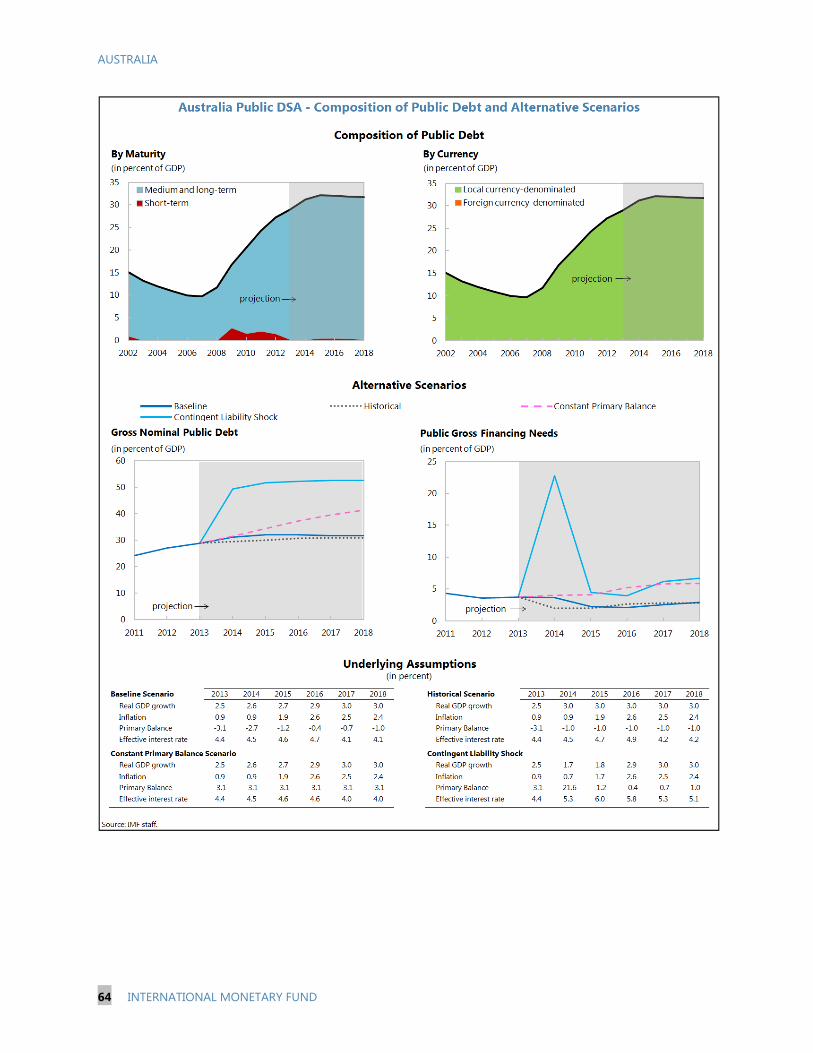
AUSTRALIA
64 INTERNATIONAL MONETARY FUND
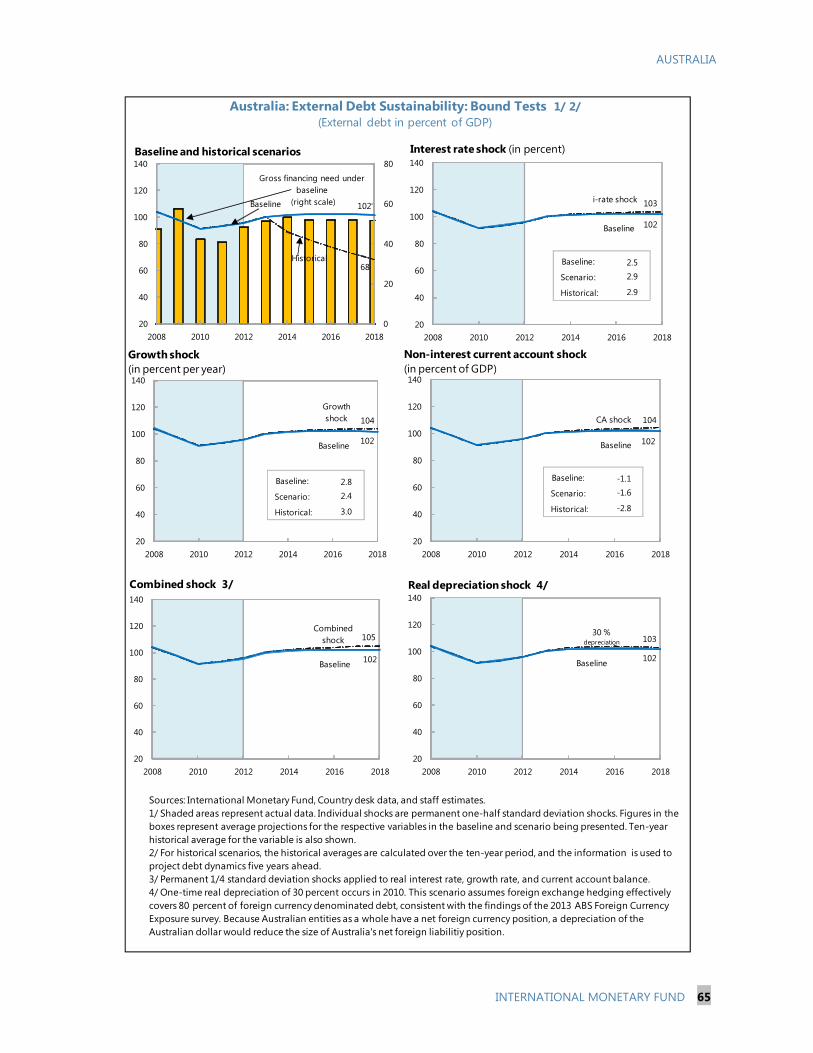
AUSTRALIA
INTERNATIONAL MONETARY FUND 65
i-rate shock 103
Baseline 102
20
40
60
80
100
120
140
2008 2010 2012 2014 2016 2018
Interest rate shock (in percent)
Australia: External Debt Sustainability: Bound Tests 1/ 2/(External debt in percent of GDP)
Sources: International Monetary Fund, Country desk data, and staff estimates.1/ Shaded areas represent actual data. Individual shocks are permanent one-half standard deviation shocks. Figures in the boxes represent average projections for the respective variables in the baseline and scenario being presented. Ten-year historical average for the variable is also shown. 2/ For historical scenarios, the historical averages are calculated over the ten-year period, and the information is used to project debt dynamics five years ahead.3/ Permanent 1/4 standard deviation shocks applied to real interest rate, growth rate, and current account balance.4/ One-time real depreciation of 30 percent occurs in 2010. This scenario assumes foreign exchange hedging effectively covers 80 percent of foreign currency denominated debt, consistent with the findings of the 2013 ABS Foreign Currency Exposure survey. Because Australian entities as a whole have a net foreign currency position, a depreciation of the Australian dollar would reduce the size of Australia's net foreign liabilitiy position.
Historical68
Baseline 102
0
20
40
60
80
20
40
60
80
100
120
140
2008 2010 2012 2014 2016 2018
Baseline and historical scenarios
CA shock 104
Baseline 102
20
40
60
80
100
120
140
2008 2010 2012 2014 2016 2018
Combined shock 105
Baseline 102
20
40
60
80
100
120
140
2008 2010 2012 2014 2016 2018
Combined shock 3/
30 % depreciation 103
Baseline 102
20
40
60
80
100
120
140
2008 2010 2012 2014 2016 2018
Real depreciation shock 4/
Gross financing need under baseline
(right scale)
Non-interest current account shock (in percent of GDP)
Growth shock 104
Baseline 102
20
40
60
80
100
120
140
2008 2010 2012 2014 2016 2018
Baseline:
Scenario:
Historical:
2.5
2.9
2.9
Baseline:
Scenario:
Historical:
2.8
2.4
3.0
Baseline:
Scenario:
Historical:
-1.1
-1.6
-2.8
Growth shock (in percent per year)
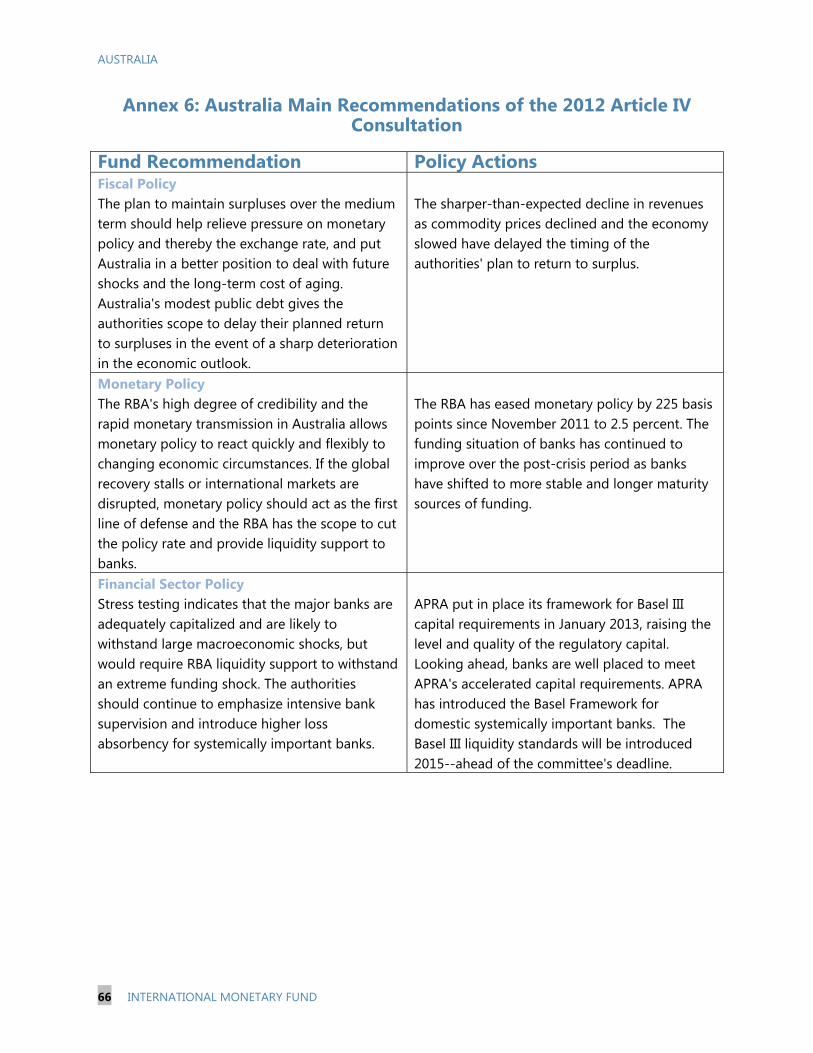
AUSTRALIA
66 INTERNATIONAL MONETARY FUND
Annex 6: Australia Main Recommendations of the 2012 Article IV Consultation
Fund Recommendation Policy ActionsFiscal Policy The plan to maintain surpluses over the medium term should help relieve pressure on monetary policy and thereby the exchange rate, and put Australia in a better position to deal with future shocks and the long-term cost of aging. Australia's modest public debt gives the authorities scope to delay their planned return to surpluses in the event of a sharp deterioration in the economic outlook.
The sharper-than-expected decline in revenues as commodity prices declined and the economy slowed have delayed the timing of the authorities' plan to return to surplus.
Monetary Policy The RBA's high degree of credibility and the rapid monetary transmission in Australia allows monetary policy to react quickly and flexibly to changing economic circumstances. If the global recovery stalls or international markets are disrupted, monetary policy should act as the first line of defense and the RBA has the scope to cut the policy rate and provide liquidity support to banks.
The RBA has eased monetary policy by 225 basis points since November 2011 to 2.5 percent. The funding situation of banks has continued to improve over the post-crisis period as banks have shifted to more stable and longer maturity sources of funding.
Financial Sector Policy Stress testing indicates that the major banks are adequately capitalized and are likely to withstand large macroeconomic shocks, but would require RBA liquidity support to withstand an extreme funding shock. The authorities should continue to emphasize intensive bank supervision and introduce higher loss absorbency for systemically important banks.
APRA put in place its framework for Basel III capital requirements in January 2013, raising the level and quality of the regulatory capital. Looking ahead, banks are well placed to meet APRA's accelerated capital requirements. APRA has introduced the Basel Framework for domestic systemically important banks. The Basel III liquidity standards will be introduced 2015--ahead of the committee's deadline.
AUSTRALIA STAFF REPORT FOR THE 2013 ARTICLE IV CONSULTATION—INFORMATIONAL ANNEX Prepared By
Asia and Pacific Department
FUND RELATIONS ________________________________________________________________________ 2
STATISTICAL ISSUES ______________________________________________________________________ 4
CONTENTS
January 24, 2014
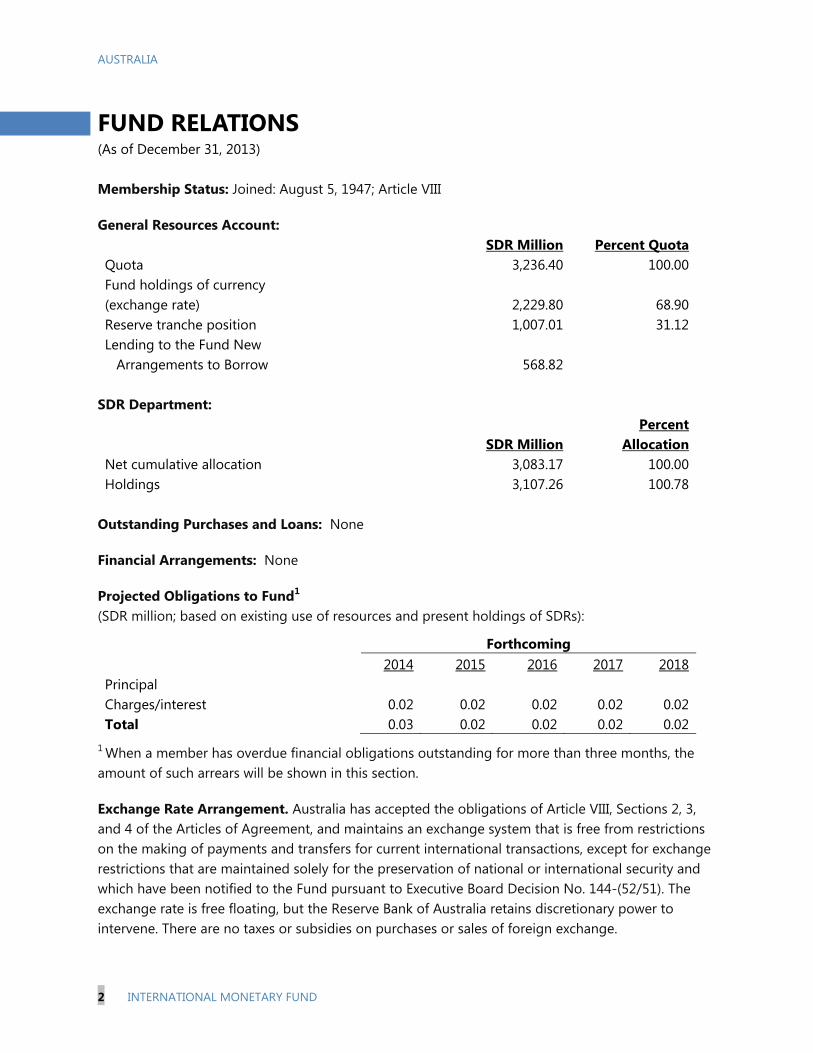
AUSTRALIA
2 INTERNATIONAL MONETARY FUND
FUND RELATIONS (As of December 31, 2013) Membership Status: Joined: August 5, 1947; Article VIII
General Resources Account: SDR Million Percent Quota
Quota 3,236.40 100.00Fund holdings of currency (exchange rate) 2,229.80 68.90Reserve tranche position 1,007.01 31.12Lending to the Fund New Arrangements to Borrow 568.82
SDR Department:
SDR MillionPercent
AllocationNet cumulative allocation 3,083.17 100.00Holdings 3,107.26 100.78
Outstanding Purchases and Loans: None
Financial Arrangements: None
Projected Obligations to Fund1 (SDR million; based on existing use of resources and present holdings of SDRs):
Forthcoming 2014 2015 2016 2017 2018Principal Charges/interest 0.02 0.02 0.02 0.02 0.02Total 0.03 0.02 0.02 0.02 0.02
1 When a member has overdue financial obligations outstanding for more than three months, the amount of such arrears will be shown in this section.
Exchange Rate Arrangement. Australia has accepted the obligations of Article VIII, Sections 2, 3, and 4 of the Articles of Agreement, and maintains an exchange system that is free from restrictions on the making of payments and transfers for current international transactions, except for exchange restrictions that are maintained solely for the preservation of national or international security and which have been notified to the Fund pursuant to Executive Board Decision No. 144-(52/51). The exchange rate is free floating, but the Reserve Bank of Australia retains discretionary power to intervene. There are no taxes or subsidies on purchases or sales of foreign exchange.
AUSTRALIA
INTERNATIONAL MONETARY FUND 3
Restrictions on Capital Transactions. Australia maintains a capital transactions regime that is virtually free of restrictions. Two main restrictions on foreigners require: authorization for significant ownership of Australian corporations; and approval for acquisition of real estate.
Article IV Consultation. Australia is on the 12-month consultation cycle. The 2012 Article IV consultation discussions were held during September 6-20, 2012; the Executive Board discussed the staff report (IMF Country Report No. 12/305) and concluded the consultation on November 12, 2012.
FSAP Participation. The last FSAP Update involved two missions: April 23-May 15 and July 9-24, 2012; the Executive Board discussed the assessment (IMF Country Report No. 12/308) on November 12, 2012.
Fourth Amendment. Australia has accepted the Fourth Amendment to the Articles of Agreement.
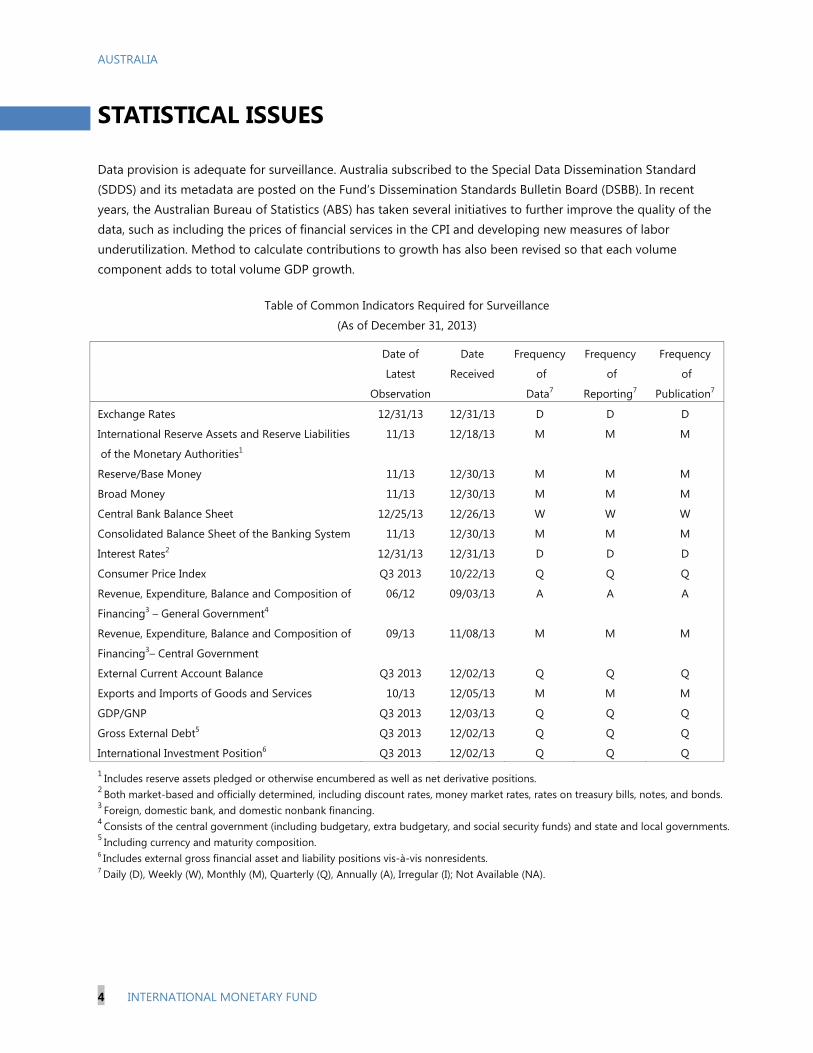
AUSTRALIA
4 INTERNATIONAL MONETARY FUND
STATISTICAL ISSUES Data provision is adequate for surveillance. Australia subscribed to the Special Data Dissemination Standard (SDDS) and its metadata are posted on the Fund’s Dissemination Standards Bulletin Board (DSBB). In recent years, the Australian Bureau of Statistics (ABS) has taken several initiatives to further improve the quality of the data, such as including the prices of financial services in the CPI and developing new measures of labor underutilization. Method to calculate contributions to growth has also been revised so that each volume component adds to total volume GDP growth.
Table of Common Indicators Required for Surveillance
(As of December 31, 2013)
Date of
Latest
Observation
Date
Received
Frequency
of
Data7
Frequency
of
Reporting7
Frequency
of
Publication7
Exchange Rates 12/31/13 12/31/13 D D D
International Reserve Assets and Reserve Liabilities
of the Monetary Authorities1
11/13 12/18/13 M M M
Reserve/Base Money 11/13 12/30/13 M M M
Broad Money 11/13 12/30/13 M M M
Central Bank Balance Sheet 12/25/13 12/26/13 W W W
Consolidated Balance Sheet of the Banking System 11/13 12/30/13 M M M
Interest Rates2 12/31/13 12/31/13 D D D
Consumer Price Index Q3 2013 10/22/13 Q Q Q
Revenue, Expenditure, Balance and Composition of
Financing3 – General Government4
06/12 09/03/13 A A A
Revenue, Expenditure, Balance and Composition of
Financing3– Central Government
09/13 11/08/13 M M M
External Current Account Balance Q3 2013 12/02/13 Q Q Q
Exports and Imports of Goods and Services 10/13 12/05/13 M M M
GDP/GNP Q3 2013 12/03/13 Q Q Q
Gross External Debt5 Q3 2013 12/02/13 Q Q Q
International Investment Position6 Q3 2013 12/02/13 Q Q Q
1 Includes reserve assets pledged or otherwise encumbered as well as net derivative positions. 2 Both market-based and officially determined, including discount rates, money market rates, rates on treasury bills, notes, and bonds. 3 Foreign, domestic bank, and domestic nonbank financing. 4 Consists of the central government (including budgetary, extra budgetary, and social security funds) and state and local governments. 5 Including currency and maturity composition. 6 Includes external gross financial asset and liability positions vis-à-vis nonresidents. 7 Daily (D), Weekly (W), Monthly (M), Quarterly (Q), Annually (A), Irregular (I); Not Available (NA).
Press Release No. 14/53
FOR IMMEDIATE RELEASE
February 12, 2014
IMF Executive Board Concludes 2013 Article IV Consultation with Australia
On February 10, 2014, the Executive Board of the International Monetary Fund (IMF) concluded
the Article IV consultation1 with Australia.
The Australian economy has performed well relative to many other advanced economies since
the global financial crisis. However, a transition phase has now been reached as the terms of
trade driven mining investment boom of the past decade has peaked and the economy is moving
to the production and export phase. Mining-related investment which accounted for almost half
of GDP growth in the past couple of years is expected to drop sharply in the near term, and a
recovery in non-mining investment will be needed to underpin demand and return the economy’s
growth rate to trend.
Annual growth has slowed to 2¼ percent in the third quarter of 2013, below the trend growth of
around 3 percent. In addition to the slowdown of investment in new mining projects, non-mining
investment has been weighed down by excess capacity and an overvalued exchange rate.
Consumption growth has been modest and the household savings rate has remained above 10
percent. On the plus side mining exports are growing as new capacity comes on stream and in
recent months housing market activity has begun to pick up with building approvals,
transactions, and prices increasing. Nevertheless labor market conditions have remained soft and
the unemployment rate has risen. Inflation remains anchored in the Reserve Bank of Australia’s
(RBA) target range.
After several years where house prices have lagged income growth and construction has been
weak, the recent revival in housing market activity could contribute to near-term growth and
begin to help address persistent structural supply shortages but has also boosted house price
inflation. To date overall credit growth has remained moderate with many households continuing
to prepay mortgages. Looking forward though, there is a risk that rapid house price growth could
give rise to expectations-driven, self-reinforcing demand dynamics and price overshooting, and
the authorities would need to be prepared to take preventative actions.
1 Under Article IV of the IMF's Articles of Agreement, the IMF holds bilateral discussions with members, usually
every year. A staff team visits the country, collects economic and financial information, and discusses with officials
the country's economic developments and policies. On return to headquarters, the staff prepares a report, which
forms the basis for discussion by the Executive Board.
International Monetary Fund
700 19th
Street, NW
Washington, D. C. 20431 USA
2
In response to weakening demand the RBA cut its policy interest rate substantially over the last
two years. This has begun to support interest-sensitive spending and asset values. With growth
currently on the soft side, the real exchange rate still strong and efforts to reduce the budget
deficit likely, monetary policy should remain accommodative and act as the primary
macroeconomic tool for managing aggregate demand in the near term. The prospects of tighter
monetary policy in major advanced economies may help weaken the Australian dollar, a key
factor for achieving broader-based growth in the economy.
The budget deficit was reduced from 3 percent of GDP to 1½ percent in 2012/13. The goal of
returning the budget to surplus last year was held back by slower-than-projected output growth
and weaker commodity prices. Revenue fell short of projections as the lower terms of trade
together with the persistently strong Australian dollar reduced nominal GDP and dented
corporate profitability. Spending was also somewhat higher than anticipated. The government
has announced the broad aim of reaching a fiscal surplus in a few years, and the aim of reaching
a 1 percent surplus in a decade. A more detailed framework will be established when the
government announces its fiscal strategy in May.
Executive Board Assessment2
Executive Directors commended the authorities for their sound and prudent macroeconomic
management which has contributed to a strong economic performance in recent years. Directors
noted that the Australian economy rests on solid fundamentals but its near-term outlook remains
vulnerable to terms-of-trade shocks and downside risks. Against this background, they agreed
that the transition to a growth path along which investment in mining plays a lesser role presents
important policy challenges in the period ahead.
Directors considered that the current macroeconomic policy mix is broadly appropriate. With
inflation in the target range, growth below trend, and the real exchange rate on the strong side,
monetary policy should remain accommodative and act as the primary tool for short term
aggregate demand management. Directors also supported the government’s aim to return to
fiscal surplus without undue prejudice to growth to help rebuild fiscal buffers in the coming
years. In this context, they emphasized the usefulness of early decisions on the spending cuts and
revenue increases needed to reach the fiscal objectives.
The financial system remains sound and well managed. Furthermore, the intensive and proactive
supervisory framework limits the likelihood that house price fluctuations will have an adverse
impact on the financial system. Directors observed, however, that banks could be exposed to
highly leveraged households and to rollover risks associated with offshore funding needs.
Accordingly, they encouraged the authorities to remain vigilant.
2 At the conclusion of the discussion, the Managing Director, as Chairman of the Board, summarizes the views of
Executive Directors, and this summary is transmitted to the country's authorities. An explanation of any qualifiers
used in summings up can be found here: http://www.imf.org/external/np/sec/misc/qualifiers.htm.
3
Directors emphasized that Australia’s floating exchange rate has been an important element of its
macroeconomic policy framework and has served the country well by cushioning terms of trade
shocks. They took note of the staff’s assessment that the exchange rate currently appears to be
modestly overvalued in real effective terms.
Directors welcomed the authorities’ plans to embark on a comprehensive new round of structural
reforms. They concurred that renewed efforts to strengthen competition in labor and product
markets as well as to address infrastructure bottlenecks are critical to increase productivity and
further diversify the sources of growth.
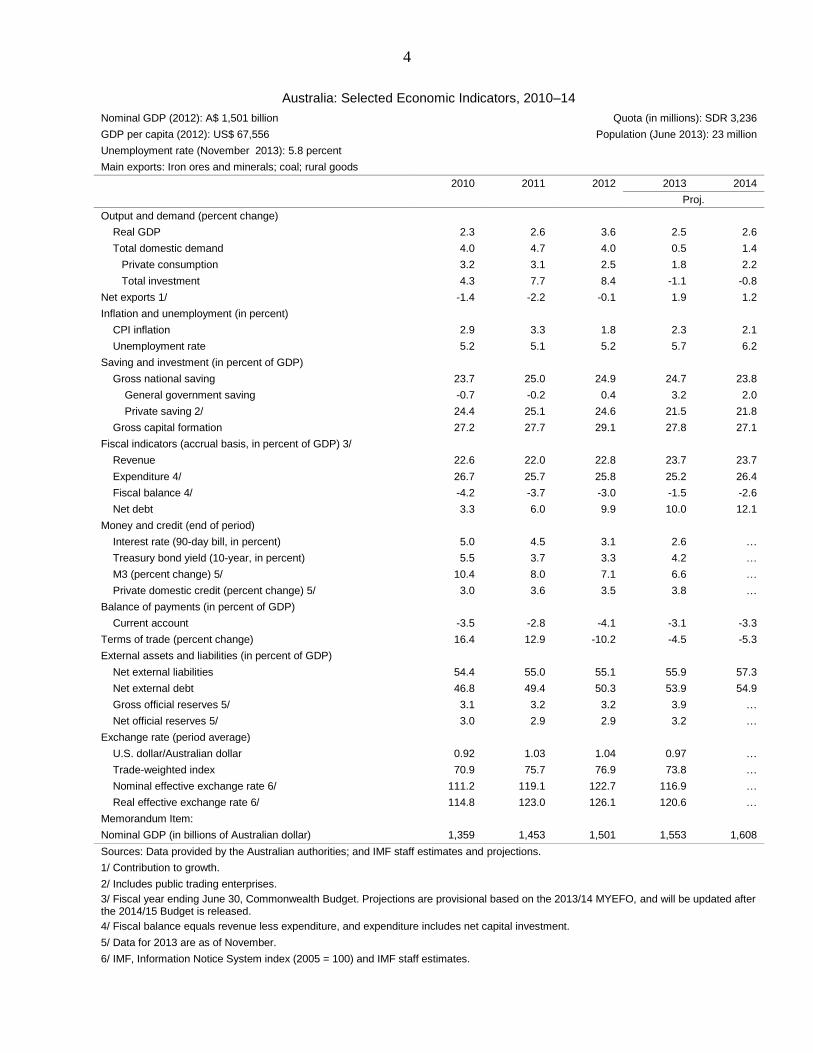
4
Australia: Selected Economic Indicators, 2010–14
Nominal GDP (2012): A$ 1,501 billion Quota (in millions): SDR 3,236
GDP per capita (2012): US$ 67,556 Population (June 2013): 23 million
Unemployment rate (November 2013): 5.8 percent
Main exports: Iron ores and minerals; coal; rural goods
2010 2011 2012 2013 2014
Proj.
Output and demand (percent change)
Real GDP 2.3 2.6 3.6 2.5 2.6
Total domestic demand 4.0 4.7 4.0 0.5 1.4
Private consumption 3.2 3.1 2.5 1.8 2.2
Total investment 4.3 7.7 8.4 -1.1 -0.8
Net exports 1/ -1.4 -2.2 -0.1 1.9 1.2
Inflation and unemployment (in percent)
CPI inflation 2.9 3.3 1.8 2.3 2.1
Unemployment rate 5.2 5.1 5.2 5.7 6.2
Saving and investment (in percent of GDP)
Gross national saving 23.7 25.0 24.9 24.7 23.8
General government saving -0.7 -0.2 0.4 3.2 2.0
Private saving 2/ 24.4 25.1 24.6 21.5 21.8
Gross capital formation 27.2 27.7 29.1 27.8 27.1
Fiscal indicators (accrual basis, in percent of GDP) 3/
Revenue 22.6 22.0 22.8 23.7 23.7
Expenditure 4/ 26.7 25.7 25.8 25.2 26.4
Fiscal balance 4/ -4.2 -3.7 -3.0 -1.5 -2.6
Net debt 3.3 6.0 9.9 10.0 12.1
Money and credit (end of period)
Interest rate (90-day bill, in percent) 5.0 4.5 3.1 2.6 …
Treasury bond yield (10-year, in percent) 5.5 3.7 3.3 4.2 …
M3 (percent change) 5/ 10.4 8.0 7.1 6.6 …
Private domestic credit (percent change) 5/ 3.0 3.6 3.5 3.8 …
Balance of payments (in percent of GDP)
Current account -3.5 -2.8 -4.1 -3.1 -3.3
Terms of trade (percent change) 16.4 12.9 -10.2 -4.5 -5.3
External assets and liabilities (in percent of GDP)
Net external liabilities 54.4 55.0 55.1 55.9 57.3
Net external debt 46.8 49.4 50.3 53.9 54.9
Gross official reserves 5/ 3.1 3.2 3.2 3.9 …
Net official reserves 5/ 3.0 2.9 2.9 3.2 …
Exchange rate (period average)
U.S. dollar/Australian dollar 0.92 1.03 1.04 0.97 …
Trade-weighted index 70.9 75.7 76.9 73.8 …
Nominal effective exchange rate 6/ 111.2 119.1 122.7 116.9 …
Real effective exchange rate 6/ 114.8 123.0 126.1 120.6 …
Memorandum Item:
Nominal GDP (in billions of Australian dollar) 1,359 1,453 1,501 1,553 1,608
Sources: Data provided by the Australian authorities; and IMF staff estimates and projections.
1/ Contribution to growth.
2/ Includes public trading enterprises.
3/ Fiscal year ending June 30, Commonwealth Budget. Projections are provisional based on the 2013/14 MYEFO, and will be updated after the 2014/15 Budget is released.
4/ Fiscal balance equals revenue less expenditure, and expenditure includes net capital investment.
5/ Data for 2013 are as of November.
6/ IMF, Information Notice System index (2005 = 100) and IMF staff estimates.
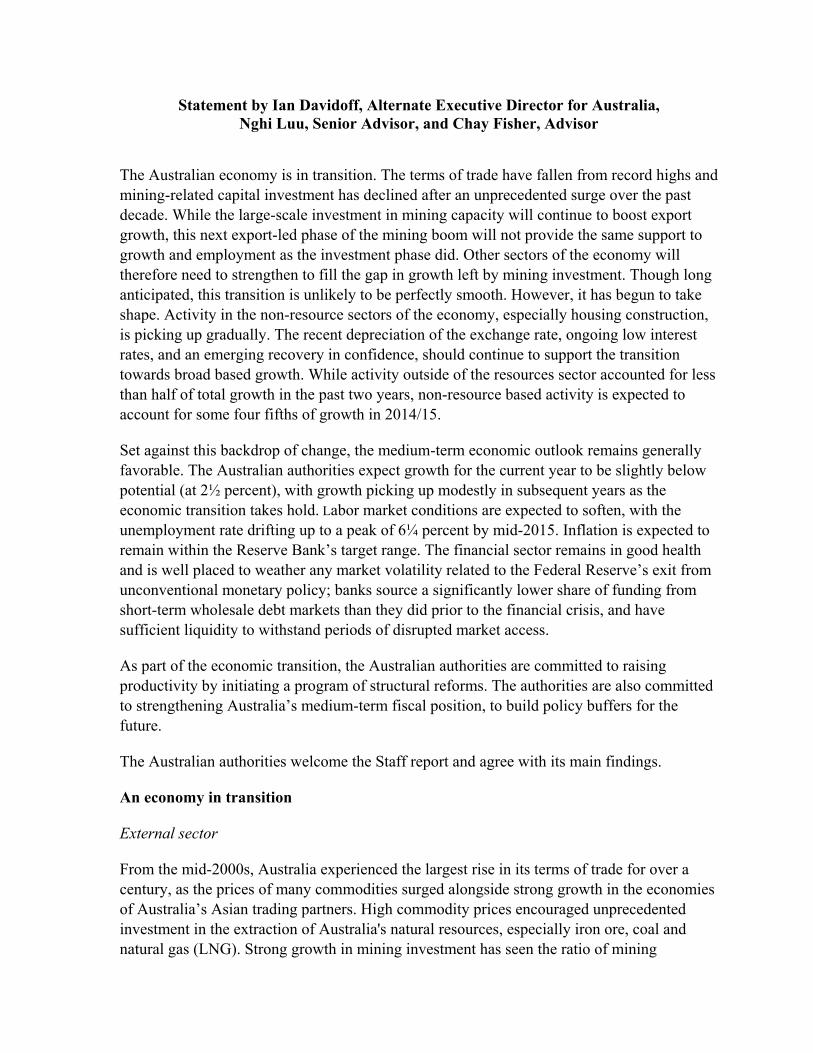
Statement by Ian Davidoff, Alternate Executive Director for Australia, Nghi Luu, Senior Advisor, and Chay Fisher, Advisor
The Australian economy is in transition. The terms of trade have fallen from record highs and mining-related capital investment has declined after an unprecedented surge over the past decade. While the large-scale investment in mining capacity will continue to boost export growth, this next export-led phase of the mining boom will not provide the same support to growth and employment as the investment phase did. Other sectors of the economy will therefore need to strengthen to fill the gap in growth left by mining investment. Though long anticipated, this transition is unlikely to be perfectly smooth. However, it has begun to take shape. Activity in the non-resource sectors of the economy, especially housing construction, is picking up gradually. The recent depreciation of the exchange rate, ongoing low interest rates, and an emerging recovery in confidence, should continue to support the transition towards broad based growth. While activity outside of the resources sector accounted for less than half of total growth in the past two years, non-resource based activity is expected to account for some four fifths of growth in 2014/15.
Set against this backdrop of change, the medium-term economic outlook remains generally favorable. The Australian authorities expect growth for the current year to be slightly below potential (at 2½ percent), with growth picking up modestly in subsequent years as the economic transition takes hold. Labor market conditions are expected to soften, with the unemployment rate drifting up to a peak of 6¼ percent by mid-2015. Inflation is expected to remain within the Reserve Bank’s target range. The financial sector remains in good health and is well placed to weather any market volatility related to the Federal Reserve’s exit from unconventional monetary policy; banks source a significantly lower share of funding from short-term wholesale debt markets than they did prior to the financial crisis, and have sufficient liquidity to withstand periods of disrupted market access.
As part of the economic transition, the Australian authorities are committed to raising productivity by initiating a program of structural reforms. The authorities are also committed to strengthening Australia’s medium-term fiscal position, to build policy buffers for the future.
The Australian authorities welcome the Staff report and agree with its main findings.
An economy in transition
External sector
From the mid-2000s, Australia experienced the largest rise in its terms of trade for over a century, as the prices of many commodities surged alongside strong growth in the economies of Australia’s Asian trading partners. High commodity prices encouraged unprecedented investment in the extraction of Australia's natural resources, especially iron ore, coal and natural gas (LNG). Strong growth in mining investment has seen the ratio of mining
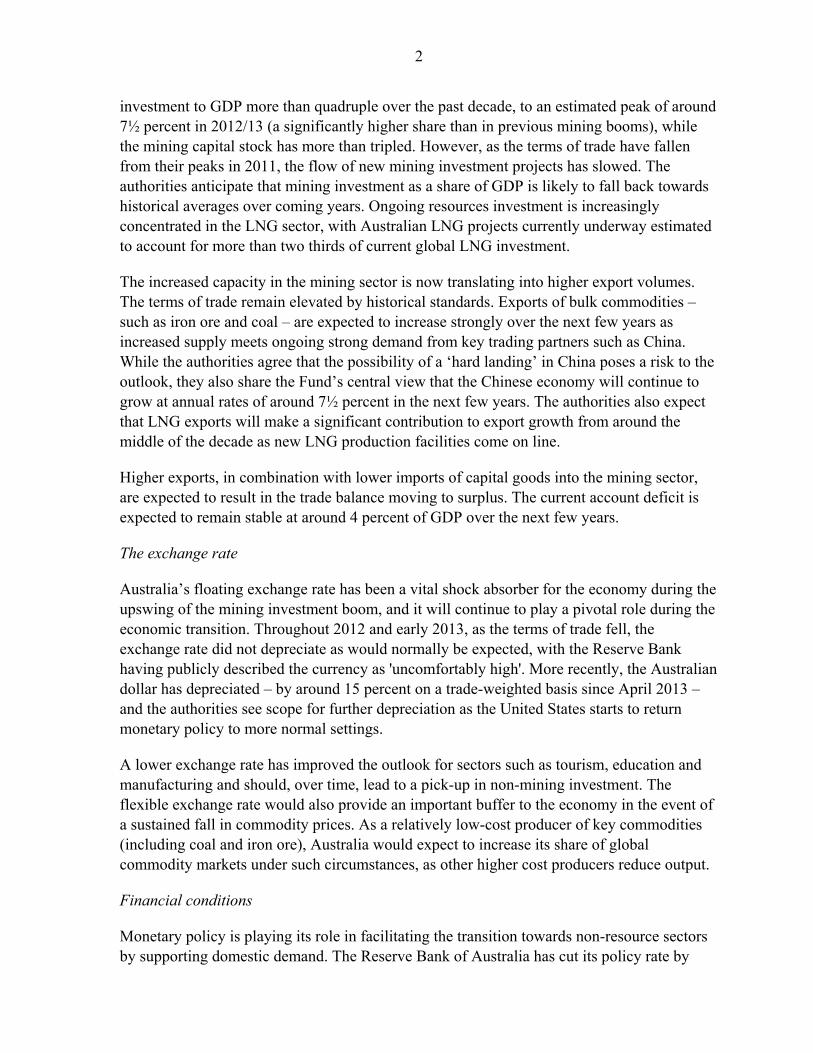
2
investment to GDP more than quadruple over the past decade, to an estimated peak of around 7½ percent in 2012/13 (a significantly higher share than in previous mining booms), while the mining capital stock has more than tripled. However, as the terms of trade have fallen from their peaks in 2011, the flow of new mining investment projects has slowed. The authorities anticipate that mining investment as a share of GDP is likely to fall back towards historical averages over coming years. Ongoing resources investment is increasingly concentrated in the LNG sector, with Australian LNG projects currently underway estimated to account for more than two thirds of current global LNG investment.
The increased capacity in the mining sector is now translating into higher export volumes. The terms of trade remain elevated by historical standards. Exports of bulk commodities – such as iron ore and coal – are expected to increase strongly over the next few years as increased supply meets ongoing strong demand from key trading partners such as China. While the authorities agree that the possibility of a ‘hard landing’ in China poses a risk to the outlook, they also share the Fund’s central view that the Chinese economy will continue to grow at annual rates of around 7½ percent in the next few years. The authorities also expect that LNG exports will make a significant contribution to export growth from around the middle of the decade as new LNG production facilities come on line.
Higher exports, in combination with lower imports of capital goods into the mining sector, are expected to result in the trade balance moving to surplus. The current account deficit is expected to remain stable at around 4 percent of GDP over the next few years.
The exchange rate
Australia’s floating exchange rate has been a vital shock absorber for the economy during the upswing of the mining investment boom, and it will continue to play a pivotal role during the economic transition. Throughout 2012 and early 2013, as the terms of trade fell, the exchange rate did not depreciate as would normally be expected, with the Reserve Bank having publicly described the currency as 'uncomfortably high'. More recently, the Australian dollar has depreciated – by around 15 percent on a trade-weighted basis since April 2013 – and the authorities see scope for further depreciation as the United States starts to return monetary policy to more normal settings.
A lower exchange rate has improved the outlook for sectors such as tourism, education and manufacturing and should, over time, lead to a pick-up in non-mining investment. The flexible exchange rate would also provide an important buffer to the economy in the event of a sustained fall in commodity prices. As a relatively low-cost producer of key commodities (including coal and iron ore), Australia would expect to increase its share of global commodity markets under such circumstances, as other higher cost producers reduce output.
Financial conditions
Monetary policy is playing its role in facilitating the transition towards non-resource sectors by supporting domestic demand. The Reserve Bank of Australia has cut its policy rate by
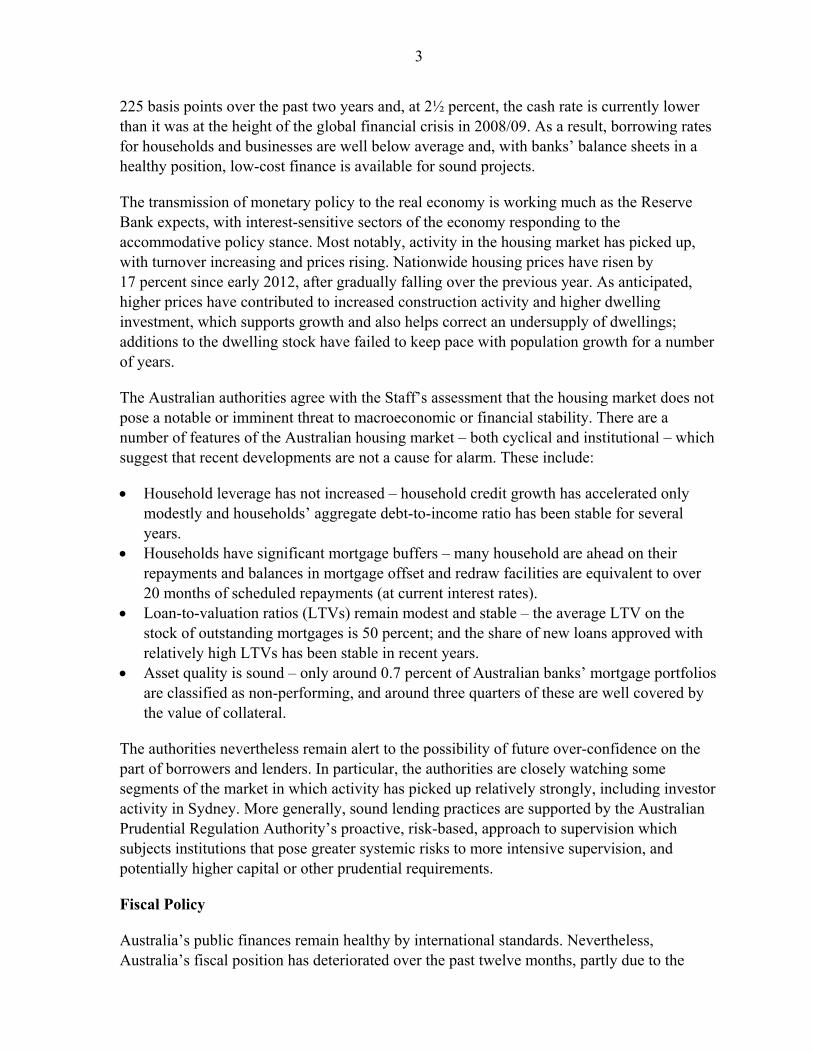
3
225 basis points over the past two years and, at 2½ percent, the cash rate is currently lower than it was at the height of the global financial crisis in 2008/09. As a result, borrowing rates for households and businesses are well below average and, with banks’ balance sheets in a healthy position, low-cost finance is available for sound projects.
The transmission of monetary policy to the real economy is working much as the Reserve Bank expects, with interest-sensitive sectors of the economy responding to the accommodative policy stance. Most notably, activity in the housing market has picked up, with turnover increasing and prices rising. Nationwide housing prices have risen by 17 percent since early 2012, after gradually falling over the previous year. As anticipated, higher prices have contributed to increased construction activity and higher dwelling investment, which supports growth and also helps correct an undersupply of dwellings; additions to the dwelling stock have failed to keep pace with population growth for a number of years.
The Australian authorities agree with the Staff’s assessment that the housing market does not pose a notable or imminent threat to macroeconomic or financial stability. There are a number of features of the Australian housing market – both cyclical and institutional – which suggest that recent developments are not a cause for alarm. These include:
Household leverage has not increased – household credit growth has accelerated only modestly and households’ aggregate debt-to-income ratio has been stable for several years.
Households have significant mortgage buffers – many household are ahead on their repayments and balances in mortgage offset and redraw facilities are equivalent to over 20 months of scheduled repayments (at current interest rates).
Loan-to-valuation ratios (LTVs) remain modest and stable – the average LTV on the stock of outstanding mortgages is 50 percent; and the share of new loans approved with relatively high LTVs has been stable in recent years.
Asset quality is sound – only around 0.7 percent of Australian banks’ mortgage portfolios are classified as non-performing, and around three quarters of these are well covered by the value of collateral.
The authorities nevertheless remain alert to the possibility of future over-confidence on the part of borrowers and lenders. In particular, the authorities are closely watching some segments of the market in which activity has picked up relatively strongly, including investor activity in Sydney. More generally, sound lending practices are supported by the Australian Prudential Regulation Authority’s proactive, risk-based, approach to supervision which subjects institutions that pose greater systemic risks to more intensive supervision, and potentially higher capital or other prudential requirements.
Fiscal Policy
Australia’s public finances remain healthy by international standards. Nevertheless, Australia’s fiscal position has deteriorated over the past twelve months, partly due to the
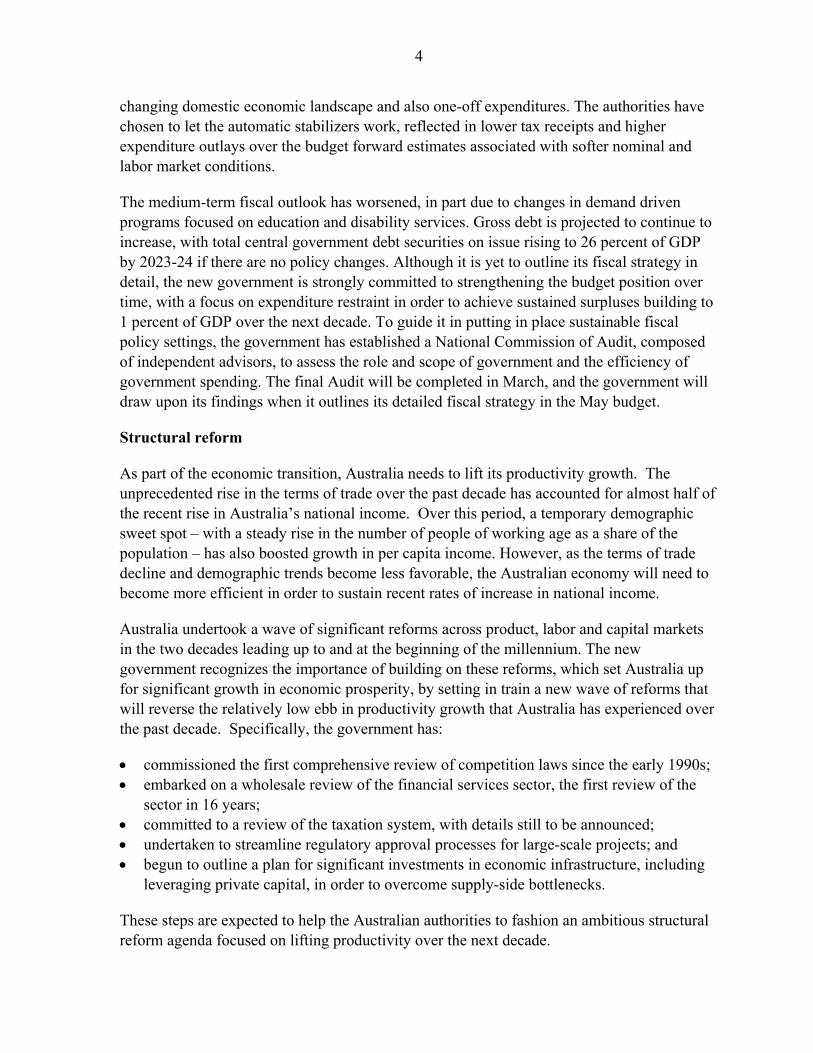
4
changing domestic economic landscape and also one-off expenditures. The authorities have chosen to let the automatic stabilizers work, reflected in lower tax receipts and higher expenditure outlays over the budget forward estimates associated with softer nominal and labor market conditions.
The medium-term fiscal outlook has worsened, in part due to changes in demand driven programs focused on education and disability services. Gross debt is projected to continue to increase, with total central government debt securities on issue rising to 26 percent of GDP by 2023-24 if there are no policy changes. Although it is yet to outline its fiscal strategy in detail, the new government is strongly committed to strengthening the budget position over time, with a focus on expenditure restraint in order to achieve sustained surpluses building to 1 percent of GDP over the next decade. To guide it in putting in place sustainable fiscal policy settings, the government has established a National Commission of Audit, composed of independent advisors, to assess the role and scope of government and the efficiency of government spending. The final Audit will be completed in March, and the government will draw upon its findings when it outlines its detailed fiscal strategy in the May budget.
Structural reform
As part of the economic transition, Australia needs to lift its productivity growth. The unprecedented rise in the terms of trade over the past decade has accounted for almost half of the recent rise in Australia’s national income. Over this period, a temporary demographic sweet spot – with a steady rise in the number of people of working age as a share of the population – has also boosted growth in per capita income. However, as the terms of trade decline and demographic trends become less favorable, the Australian economy will need to become more efficient in order to sustain recent rates of increase in national income.
Australia undertook a wave of significant reforms across product, labor and capital markets in the two decades leading up to and at the beginning of the millennium. The new government recognizes the importance of building on these reforms, which set Australia up for significant growth in economic prosperity, by setting in train a new wave of reforms that will reverse the relatively low ebb in productivity growth that Australia has experienced over the past decade. Specifically, the government has:
commissioned the first comprehensive review of competition laws since the early 1990s; embarked on a wholesale review of the financial services sector, the first review of the
sector in 16 years; committed to a review of the taxation system, with details still to be announced; undertaken to streamline regulatory approval processes for large-scale projects; and begun to outline a plan for significant investments in economic infrastructure, including
leveraging private capital, in order to overcome supply-side bottlenecks.
These steps are expected to help the Australian authorities to fashion an ambitious structural reform agenda focused on lifting productivity over the next decade.