Embed Size (px)
Citation preview
©2014 International Monetary Fund
IMF Country Report No. 14/60
PARAGUAY 2013 ARTICLE IV CONSULTATION—STAFF REPORT; PRESS RELEASE
Under Article IV of the IMF’s Articles of Agreement, the IMF holds bilateral discussions with members, usually every year. In the context of the 2013 Article IV consultation with Paraguay, the following documents have been released and are included in this package: The Staff Report prepared by a staff team of the IMF for the Executive Board’s
consideration on February 14, 2014, following discussions that ended on December 12, 2014, with the officials of Paraguay on economic developments and policies. Based on information available at the time of these discussions, the staff report was completed on January 30, 2014.
An Informational Annex prepared by the IMF.
A Press Release summarizing the views of the Executive Board as expressed during its February 14, 2014 consideration of the staff report that concluded the Article IV consultation with Paraguay.
The following document has been or will be separately released. Selected Issues Paper
The publication policy for staff reports and other documents allows for the deletion of market-sensitive information.
Copies of this report are available to the public from
International Monetary Fund Publication Services PO Box 92780 Washington, D.C. 20090
Telephone: (202) 623-7430 Fax: (202) 623-7201 E-mail: [email protected] Web: http://www.imf.org
Price: $18.00 per printed copy
International Monetary Fund Washington, D.C.
February 2014

PARAGUAY STAFF REPORT FOR THE 2013 ARTICLE IV CONSULTATION
KEY ISSUES
Context: Paraguay has strong economic fundamentals—low debt, sizeable official
reserves, and small fiscal and external imbalances. The main challenge ahead is to
improve social and economic development, while strengthening the macroeconomic
policy framework to cement strong fundamentals. To address these challenges, the
government that assumed office in August 2013 with a strong mandate, has proposed
important reforms and made a solid start by enacting key pieces of legislation—new
taxes, and private-public partnerships (PPPs) and fiscal responsibility laws.
Prospects: Paraguay’s outlook for 2014–18 is favorable with broadly balanced risks,
despite less buoyant external conditions. The economy would continue to be one of the
most dynamic in the region, with growth returning to potential of about 4.5 percent a
year by 2016, inflation in line with the central bank’s target rate and small fiscal and
current account deficits. Consistent with this outlook, a tightening in the policy stance
should take place in the near term, with policies guided by the fiscal responsibility and
incipient inflation targeting frameworks over the medium term.
Cementing sound economic fundamentals: The fiscal responsibility law provides a
sound anchor to underpin fiscal sustainability but stronger budget institutions are
needed to improve the quality of spending along with strengthened tax and customs
administration and capacity to deal with potential risks from PPPs. Civil service and
pension reforms are also needed to further strengthen the fiscal framework. The central
bank has made important advances in implementing an inflation-targeting (IT) regime
along with greater exchange rate flexibility. The focus should remain on steps to achieve
a full-fledged IT regime and on strengthening risk-based bank supervision in line with
international best practices.
Inclusive growth: Success in reducing poverty will depend on ensuring the long-term
sustainability of initiatives underway and on increasing labor market flexibility to reduce
informality as well as improved public enterprises management to bolster access to basic
public services at reasonable cost.
January 30, 2014

PARAGUAY
2 INTERNATIONAL MONETARY FUND
Approved By Charles Kramer
(WHD) and Vikram
Haksar (SPR)
Discussions took place in Asunción during December 2–12, 2013. The
staff team comprised Messrs. U. Fasano (Head), C. Pérez Marulanda,
J. Rodríguez Delgado, J. Yépez Albornoz, K. Ross, Resident
Representative (all WHD), and G. Horman (FAD). They were assisted at
Headquarters by X. Jordan, E. Moreno and E. Tawfik (all WHD) and in
the Field by V. Garay and R. Amat y León (Resident Representative
office). Staff met with Minister Rojas (Finance); Minister Jiménez
(Public Works and Communications); Minister Leite (Industry and
Commerce); Minister Molina (Planning); Central Bank President
Fernández; other government officials; and representatives from
congress, the financial sector, business, donors, and think-tanks.
Mr. J. Corvalán (OED) attended some of the policy discussions.
CONTENTS
CONTEXT_________________________________________________________________________________________ 4
RECENT DEVELOPMENTS _______________________________________________________________________ 5
A. A Strong Recovery Along with Slow Inflation in 2013 __________________________________________ 5
OUTLOOK AND RISKS ___________________________________________________________________________ 7
POLICY DISCUSSIONS _________________________________________________________________________ 11
A. Stronger Fiscal Framework ___________________________________________________________________ 11
B. Monetary and Exchange Rate Policy at the Forefront to Manage Risks _______________________ 13
C. Stronger Supervisory-Regulatory Framework _________________________________________________ 15
D. Promoting Inclusive Growth __________________________________________________________________ 16
STAFF APPRAISAL _____________________________________________________________________________ 17
BOXES
1. Impact of External and Domestic Shocks on Paraguay’s Non-Agricultural Sector______________ 19
2. The Fiscal Responsibility Law __________________________________________________________________ 20
3. The Public-Private Partnerships (PPPs) Law ____________________________________________________ 21
4. The Government’s Strategy to Reduce Extreme Poverty _______________________________________ 22
FIGURES
1. Long Term Growth and Poverty _______________________________________________________________ 23
2. Real Sector Developments, 2009–2013 ________________________________________________________ 24

PARAGUAY
INTERNATIONAL MONETARY FUND 3
3. Fiscal Developments, 2009–2013 ______________________________________________________________ 25
4. Monetary Developments, 2009–2013 __________________________________________________________ 26
5. Balance of Payments Developments, 2009–2013 ______________________________________________ 27
6. Structural Indicators ___________________________________________________________________________ 28
TABLES
1. Legislated Policy Reforms, 2012–13 ___________________________________________________________ 29
2. Selected Economic and Social Indicators ______________________________________________________ 30
3a. Central Government Operations _____________________________________________________________ 31
3b. Central Government Operations (2001 GFSM) _______________________________________________ 32
4. Operations of the Consolidated Public Sector _________________________________________________ 33
5. Summary Accounts of the Central Bank _______________________________________________________ 34
6. Summary Accounts of the Financial System ___________________________________________________ 35
7. Balance of Payments __________________________________________________________________________ 36
8. Indicators of External Vulnerability ____________________________________________________________ 37
ANNEXES
I. Banking Credit Developments _________________________________________________________________ 38
II. Assessing Paraguay’s Potential Growth over the Medium Term _______________________________ 43
III. Balance of Payments Stability Assessment ____________________________________________________ 45
IV. Debt Sustainability Analysis __________________________________________________________________ 51
V. Migration to Full-Fledged Inflation Targeting Regime—Status of Main Recommendations __ 55
VI. 2011 FSAP Status of Main Recommendations ________________________________________________ 58

PARAGUAY
4 INTERNATIONAL MONETARY FUND
CONTEXT
1. Paraguay’s social and economic development has lagged behind the region. In the late
1980s, per capita GDP peaked at 75 percent of the region’s average in part due the construction of
the two hydroelectrical dams,
but declined to about 50 percent
over the following two decades
amid institutional weaknesses
and large deficiencies in basic
infrastructure (ports, river
transportation, utilities and
roads). In the 1990s, a deep
financial crisis wiped out about
half of the banks and per capita
GDP stagnated. This situation
was reversed during much of the
2000s, when the export
commodity boom and
macroeconomic stability brought
about higher productivity and
economic growth. However, limited implementation capacity and fiscal resources—reflecting a small
tax base, low tax rates, and weak tax and customs administration—have continued to constrain
investment and the fight against poverty and (rising) income inequality. On the positive side, the
past two decades have seen the expansion of agricultural and livestock output and processed food
industries—Paraguay has become the 4th
and the 8th
largest exporter of soya bean and meat in the
world, respectively. More recently, export processing zones have attracted a rising number of
companies, mainly to serve the Brazilian market.
2. The government’s reform strategy would buttress growth and reduce poverty. This
strategy rightfully focuses on fostering investment in infrastructure and human capital, improving
the business climate, and modernizing the public sector, including by curbing corruption and tax
evasion while improving transparency and accountability of public resources. The private sector and
foreign companies are expected to play a key role in closing the large infrastructure gap in the
country. In support, the authorities will maintain fiscal discipline and stable low inflation while
further strengthening bank supervision in line with international best practices.
0
2,000
4,000
6,000
8,000
10,000
12,000
1980 1983 1986 1989 1992 1995 1998 2001 2004 2007 2010
Paraguay Peru 1/ LA6
GDP per capita (PPP constant 2005 US dollars) 1980-2012
Source: World Development Indicators; World Bank.
1/ Includes Argentina, Brazil, Bolivia, Chile, Peru, and Uruguay.
PARAGUAY
INTERNATIONAL MONETARY FUND 5
-10
-5
0
5
10
15
20
-10
-5
0
5
10
15
20
2003 2004 2005 2006 2007 2008 2009 2010 2011 2012 2013
Paraguay Paraguay non-agricultural GDP
Source: IMF WEO.
Latin America: Real GDP Growth
(In percent, y/y)
Range of outcomes in Latin America
RECENT DEVELOPMENTS
A. Strong Recovery along with Low Inflation in 2013
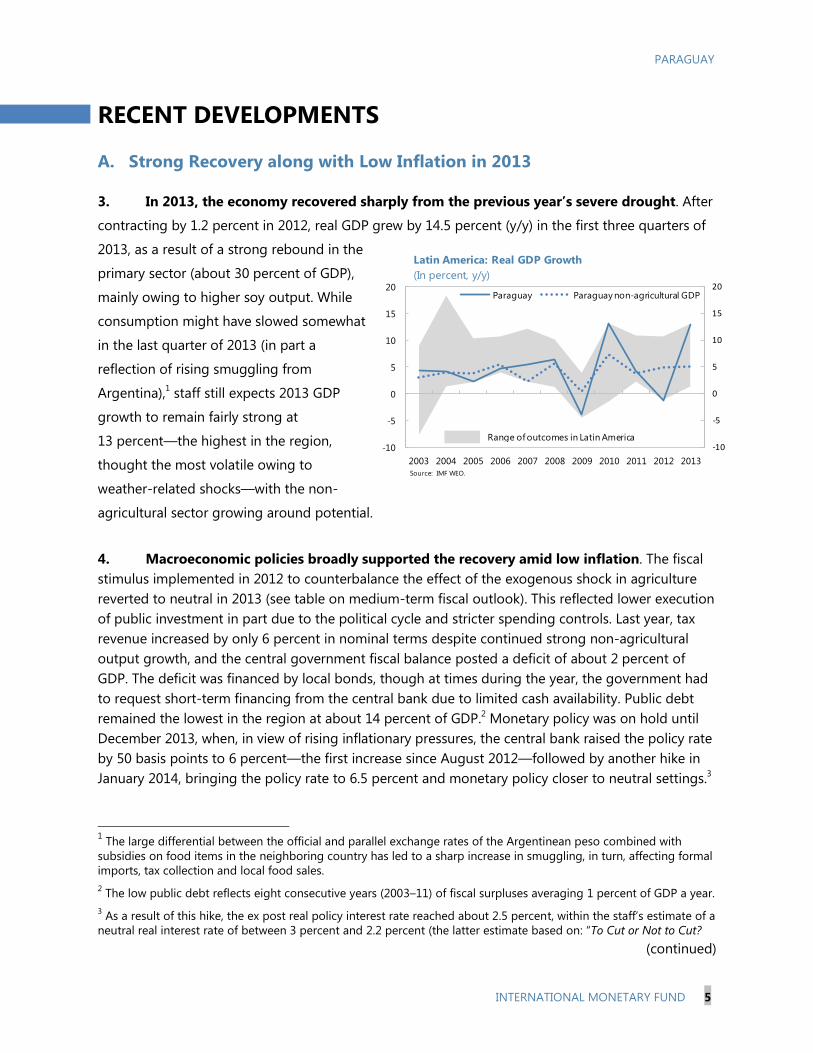
3. In 2013, the economy recovered sharply from the previous year’s severe drought. After
contracting by 1.2 percent in 2012, real GDP grew by 14.5 percent (y/y) in the first three quarters of
2013, as a result of a strong rebound in the
primary sector (about 30 percent of GDP),
mainly owing to higher soy output. While
consumption might have slowed somewhat
in the last quarter of 2013 (in part a
reflection of rising smuggling from
Argentina),1 staff still expects 2013 GDP
growth to remain fairly strong at
13 percent—the highest in the region,
thought the most volatile owing to
weather-related shocks—with the non-
agricultural sector growing around potential.
4. Macroeconomic policies broadly supported the recovery amid low inflation. The fiscal
stimulus implemented in 2012 to counterbalance the effect of the exogenous shock in agriculture
reverted to neutral in 2013 (see table on medium-term fiscal outlook). This reflected lower execution
of public investment in part due to the political cycle and stricter spending controls. Last year, tax
revenue increased by only 6 percent in nominal terms despite continued strong non-agricultural
output growth, and the central government fiscal balance posted a deficit of about 2 percent of
GDP. The deficit was financed by local bonds, though at times during the year, the government had
to request short-term financing from the central bank due to limited cash availability. Public debt
remained the lowest in the region at about 14 percent of GDP.2 Monetary policy was on hold until
December 2013, when, in view of rising inflationary pressures, the central bank raised the policy rate
by 50 basis points to 6 percent—the first increase since August 2012—followed by another hike in
January 2014, bringing the policy rate to 6.5 percent and monetary policy closer to neutral settings.3
1 The large differential between the official and parallel exchange rates of the Argentinean peso combined with
subsidies on food items in the neighboring country has led to a sharp increase in smuggling, in turn, affecting formal
imports, tax collection and local food sales.
2 The low public debt reflects eight consecutive years (2003–11) of fiscal surpluses averaging 1 percent of GDP a year.
3 As a result of this hike, the ex post real policy interest rate reached about 2.5 percent, within the staff’s estimate of a
neutral real interest rate of between 3 percent and 2.2 percent (the latter estimate based on: “To Cut or Not to Cut?
(continued)

PARAGUAY
6 INTERNATIONAL MONETARY FUND
-6
-5
-4
-3
-2
-1
0
1
2
3
4
-6
-5
-4
-3
-2
-1
0
1
2
3
4
2008 2009 2010 2011 2012 2013
Fiscal impulse Non-agricultural output gap Total output gap
Fiscal impulse and output gap 1/
(in percent of potential GDP)
Sources: Ministry of Finance; Central Bank of Paraguay; and Fund staff estimates.
1/ Fiscal impulse measured by the change in the non-grant non-royalty structural primary deficit.
-5
0
5
10
15
20
25
30
35
40
45
50
-5
0
5
10
15
20
25
30
35
40
45
50
2003 2004 2005 2006 2007 2008 2009 2010 2011 2012 2013
Paraguay
Source: IMF WEO.
Latin America: Annual Inflation
(In percent, end of period)
Range of outcomes in Latin America
Paraguay’s inflation picked up pace during 2013 on higher food prices, but end-year inflation
finished lower than expected at 3.7 percent—also below the central bank’s target rate of 5 percent
for the third consecutive year—in part due to a decline in beef prices and a significant increase in
price competition from smuggling food and other products from Argentina favored by the weaker
peso and porous border.
5. The current account balance switched to a surplus in 2013 owing to buoyant
agricultural and meat export volumes. The current account balance reached a surplus of almost
1 percent of GDP despite rising imports and a deterioration in Paraguay’s terms of trade. As a result
and despite lower net capital inflows, net international reserves (NIR) increased by almost US$900
million to US$5.9 billion by end-2013, exceeding a range of reserve coverage indicators. However,
over half of this increase was accounted for by a US$500 million international bond—the country’s
first international sovereign bond—issued in January 2013 to finance infrastructure and energy
projects, along with delays in the implementation of projects to be financed by the bond. External
debt has remained low at about 20 percent of GDP.
6. The banking sector continued to show adequate profitability, liquidity and
capitalization in 2013. The total assets of the banking system have grown significantly since
2007–08 fueled by rapid credit growth, that has slowed down to about 17 percent a year in nominal
terms since end-2012. Loans have remained concentrated on the agriculture and livestock sectors,
which transact mainly in U.S. dollars, but loans for consumption have also grown considerably, albeit
from a small base, now accounting for about 15 percent of total banks’ loan portfolio. Despite the
rapid increase in credit, the loans to deposits ratio has stayed below one and NPL ratios declined to
2.2 percent of total loans in November (Annex I). However, concentration ratios have continued to
That is the (Central Bank’s) Question: In Search of the Neutral Interest Rate in Latin America” by N. Magud and E.
Tsounta, IMF Working Paper WP/12/243).

PARAGUAY
INTERNATIONAL MONETARY FUND 7
increase with the four top banks accounting for 61 percent of total assets by end-2012 from 52
percent in the mid-2000s and lending rates and spreads have remained high.4
7. Congress has supported the government’s reform strategy by approving key laws. To
broaden the tax base, on top of the new personal income tax, Congress approved in October 2013 a
revamped tax on agricultural income and a generalized VAT to include unprocessed agricultural
products. It also recently approved a Fiscal Responsibility law (FRL) which will be applied to the 2015
budget, and Public-Private Partnerships (PPPs) and joint-venture laws to foster private sector
investment in infrastructure as well as the State Financial Administration Modernization law to
improve the government’s cash management. Laws are being drafted to update financial sector
legislation and perk up the business climate (Table 1).
8. The authorities have broadly agreed with policy recommendations in previous Article
IV consultations. In August 2012, the personal income tax became effective, though the minimum
taxable income will be gradually decreased every year through 2019 to expand the taxable base, and
in 2013, the fiscal stimulus was withdrawn. The government that took office in August is
implementing macroeconomic policies and long-term reforms broadly in line with Fund
recommendations. Paraguay has also heavily used Fund technical assistance (TA) across all areas.
Moreover, the authorities have embraced transparency in the discussions by publishing the
concluding statement immediately at the end of WHD missions, including staff’s views and policy
recommendations, which usually receive broad press coverage.
OUTLOOK AND RISKS
9. The staff and authorities broadly agreed with the economic outlook and risks. Reforms
underway together with sustained macroeconomic stability will most likely lead to higher private
investment. That said, it is too early to determine precise amounts, as existing institutional and
structural weaknesses—difficult to overcome in the short run—constitute the main constrains to
faster growth in the near term. The authorities expect that the PPPs and other initiatives will attract a
large participation of the private sector and foreign companies in the government’s ambitious
infrastructure investment plan.5 They also consider that Paraguay’s cost advantage over Brazil (lower
electricity rates, wages and payroll and other taxes) and access to the European market through the
General System of Preferences plus Scheme (GSP+) will continue to draw export-oriented industrial
investment projects into the country.
10. Growth is expected to be in line with medium term potential output, accompanied by
low inflation. Real GDP would grow by 4.8 percent in 2014, supported by continuing dynamism in
4 See Chapter 1 in the accompanying Selected Issues Paper.
5 The government estimates that Paraguay needs some US$1.2 billion (about 4.0 percent of GDP) in investment per
year over the next decade to modernize infrastructure, including transportation and water and energy sectors. The
Ministry of Public Works plans to tender in infrastructure projects US$500 million in 2014, and US$1billion in 2015,
up significantly from an annual execution level of about US$200 million in the past years.
PARAGUAY
8 INTERNATIONAL MONETARY FUND
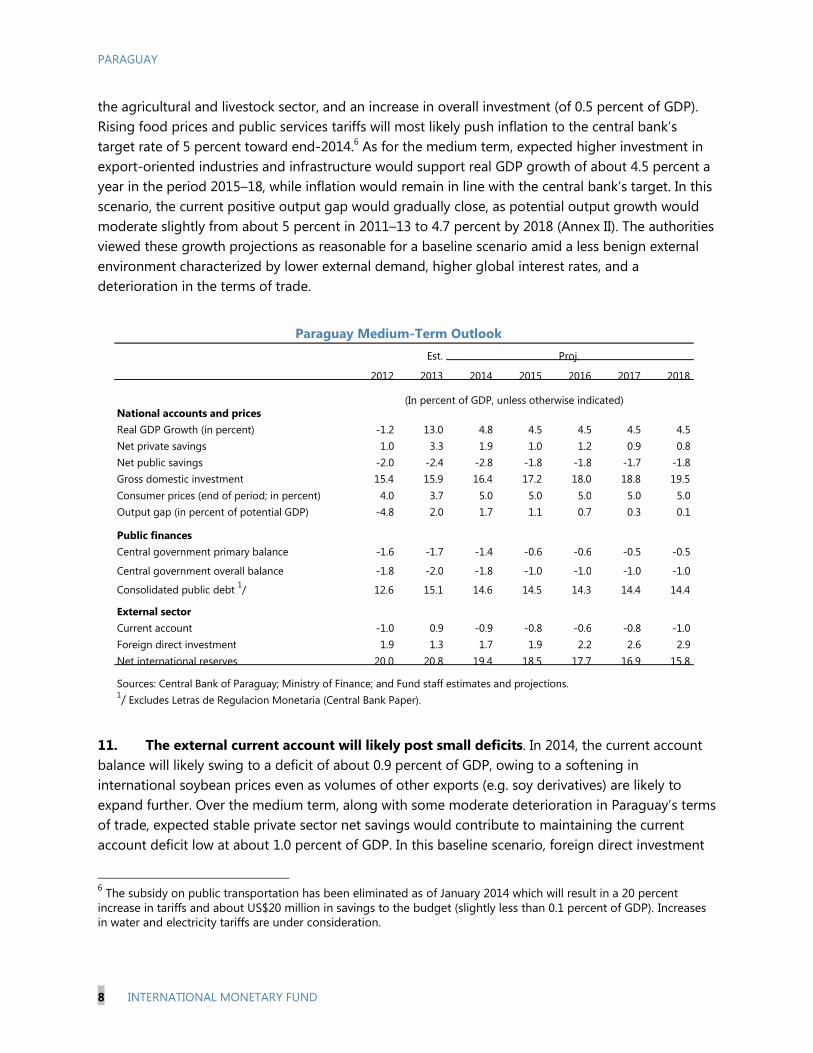
the agricultural and livestock sector, and an increase in overall investment (of 0.5 percent of GDP).
Rising food prices and public services tariffs will most likely push inflation to the central bank’s
target rate of 5 percent toward end-2014.6 As for the medium term, expected higher investment in
export-oriented industries and infrastructure would support real GDP growth of about 4.5 percent a
year in the period 2015–18, while inflation would remain in line with the central bank’s target. In this
scenario, the current positive output gap would gradually close, as potential output growth would
moderate slightly from about 5 percent in 2011–13 to 4.7 percent by 2018 (Annex II). The authorities
viewed these growth projections as reasonable for a baseline scenario amid a less benign external
environment characterized by lower external demand, higher global interest rates, and a
deterioration in the terms of trade.
11. The external current account will likely post small deficits. In 2014, the current account
balance will likely swing to a deficit of about 0.9 percent of GDP, owing to a softening in
international soybean prices even as volumes of other exports (e.g. soy derivatives) are likely to
expand further. Over the medium term, along with some moderate deterioration in Paraguay’s terms
of trade, expected stable private sector net savings would contribute to maintaining the current
account deficit low at about 1.0 percent of GDP. In this baseline scenario, foreign direct investment
6 The subsidy on public transportation has been eliminated as of January 2014 which will result in a 20 percent
increase in tariffs and about US$20 million in savings to the budget (slightly less than 0.1 percent of GDP). Increases
in water and electricity tariffs are under consideration.
Est.
2012 2013 2014 2015 2016 2017 2018
Real GDP Growth (in percent) -1.2 13.0 4.8 4.5 4.5 4.5 4.5 Net private savings 1.0 3.3 1.9 1.0 1.2 0.9 0.8 Net public savings -2.0 -2.4 -2.8 -1.8 -1.8 -1.7 -1.8 Gross domestic investment 15.4 15.9 16.4 17.2 18.0 18.8 19.5
Consumer prices (end of period; in percent) 4.0 3.7 5.0 5.0 5.0 5.0 5.0 Output gap (in percent of potential GDP) -4.8 2.0 1.7 1.1 0.7 0.3 0.1
Public finances Central government primary balance -1.6 -1.7 -1.4 -0.6 -0.6 -0.5 -0.5
Central government overall balance -1.8 -2.0 -1.8 -1.0 -1.0 -1.0 -1.0
Consolidated public debt 1/ 12.6 15.1 14.6 14.5 14.3 14.4 14.4
External sector Current account -1.0 0.9 -0.9 -0.8 -0.6 -0.8 -1.0 Foreign direct investment 1.9 1.3 1.7 1.9 2.2 2.6 2.9
Net international reserves 20.0 20.8 19.4 18.5 17.7 16.9 15.8
Paraguay Medium-Term Outlook
1/ Excludes Letras de Regulacion Monetaria (Central Bank Paper).
Sources: Central Bank of Paraguay; Ministry of Finance; and Fund staff estimates and projections.
National accounts and prices
Proj.
(In percent of GDP, unless otherwise indicated)
PARAGUAY
INTERNATIONAL MONETARY FUND 9
(FDI) would rise to 2.9 percent of GDP by 2018, compared with close to 2.0 percent in recent years,
attracted by rising investment opportunities. This, in turn, would allow the central bank to keep the
reserve coverage ratio within the recommended levels identified in the IMF’s reserve adequacy
metric.
12. Paraguay’s external position appears broadly consistent with medium-term
fundamentals, though some model based estimates suggest a degree of real exchange rate
overvaluation. The staff’s assessment that the guaraní is, on average, about 8 percent above its
equilibrium level reflects largely the results from CGER’s fundamental equilibrium exchange rate
model for Paraguay, complemented by other indicators, such as relative prices and market share
analysis (Annex III). However, after a small depreciation in 2012, the average real effective exchange
rate (REER) appreciation of some 7 percent in 2013 mainly reflected the sharp bilateral nominal
appreciation of the guaraní against the currencies of Argentina and Brazil, since it depreciated
against the U.S. dollar and the Euro following the trend of other currencies in the region. The
authorities believe that the loss of competitiveness with respect to Argentina from recent peso
depreciation would be most likely temporary, as rising inflation has usually eroded these gains in the
past in that country. Moreover, Paraguay maintains an important cost advantage vis-à-vis Brazil.
Also, tighter fiscal settings should facilitate some rebalancing in the medium term and lower
pressure on the real exchange rate. As such, the current account deficit, while widening some, is
projected to remain small over the medium term, amid sizeable foreign reserves, and improvements
underway in infrastructure, which should support the country’s external competitiveness going
forward.
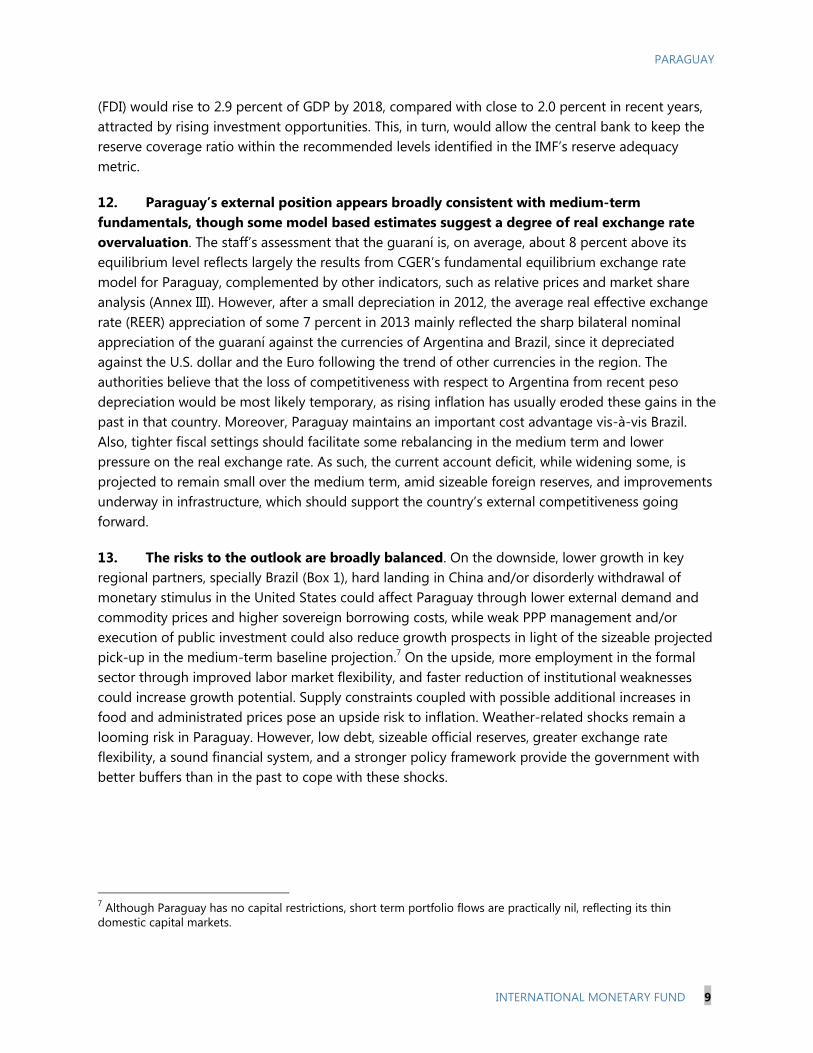
13. The risks to the outlook are broadly balanced. On the downside, lower growth in key
regional partners, specially Brazil (Box 1), hard landing in China and/or disorderly withdrawal of
monetary stimulus in the United States could affect Paraguay through lower external demand and
commodity prices and higher sovereign borrowing costs, while weak PPP management and/or
execution of public investment could also reduce growth prospects in light of the sizeable projected
pick-up in the medium-term baseline projection.7 On the upside, more employment in the formal
sector through improved labor market flexibility, and faster reduction of institutional weaknesses
could increase growth potential. Supply constraints coupled with possible additional increases in
food and administrated prices pose an upside risk to inflation. Weather-related shocks remain a
looming risk in Paraguay. However, low debt, sizeable official reserves, greater exchange rate
flexibility, a sound financial system, and a stronger policy framework provide the government with
better buffers than in the past to cope with these shocks.
7 Although Paraguay has no capital restrictions, short term portfolio flows are practically nil, reflecting its thin
domestic capital markets.
PARAGUAY
10 INTERNATIONAL MONETARY FUND
Paraguay: Risk Assessment Matrix 1/
Shock Direction Relative
Likelihood
Impact Policy Response 2/
Sustained decline in
commodity prices
(triggered by deceleration
of global demand).
↓ Low High Use exchange rate as a shock absorber; reserves
could be used to avoid excessive volatility; flexible
fiscal stimulus should be treated as last resort.
Protracted global financial
volatility (triggered by
prospective exit from
unconventional monetary
policy).
↓ Medium Low Use exchange rate as a shock absorber; reserves
could be used to avoid excessive volatility. Ease of
monetary and macro-prudential policies to ensure
the stability of the domestic financial market.
Regional shock, including
sharp slowdowns in key
partners.
↓ Low/Medium Medium/High Use exchange rate as a shock absorber; reserves
could be used to avoid excessive volatility;
accelerate measures to improve productivity and
business climate to reduce investment cost; ease
monetary and macro-prudential policies to ensure
the stability of the domestic financial market; a
temporary and flexible fiscal stimulus should be
treated as last resort.
Weather-related shock
impact agricultural
exports.
↓ Low High Use exchange rate as a shock absorber; reserves
could be used to avoid excessive volatility.
Strong domestic demand
could lead to overheating.
↑ Low High Accelerate structural measures to reduce supply
constraints; tighten monetary policy, including
through macro-prudential measures, if inflationary
pressures were to arise. A fiscal withdrawal could
be also considered if positive output-gap rises
rapidly.
Weak PPP management
and/or execution of
public investment.
↓ Medium Medium Strengthen public investment monitoring and
selectivity.
1/ The Risk Assessment Matrix (RAM) shows events that could materially alter the baseline path (the scenario most likely to materialize in the view
of IMF staff). The relative likelihood of risks listed is the staff’s subjective assessment of the risks surrounding the baseline (“low” is meant to
indicate a probability below 10 percent, “medium” a probability between 10 and 30 percent, and “high” a probability of 30 percent or more). The
RAM reflects staff views on the source of risks and overall level of concern as of the time of discussions with the authorities in December 2013.
Non-mutually exclusive risks may interact and materialize jointly.
2/ Policy response recommended by staff. Starting in 2015, fiscal response guided by the Fiscal Responsibility law (FRL).
PARAGUAY
INTERNATIONAL MONETARY FUND 11
POLICY DISCUSSIONS
14. Discussions focused on policies and reforms to cement strong economic fundamentals
and promote inclusive growth over the medium term. The authorities broadly agreed with the
policy recommendations and pointed out that the Fund continued support through TA will remain
critical to implement the reform agenda.
15. A policy mix rebalance should take place in the near term. Fiscal policy is expected to be
tightened in 2014 and 2015 to reflect the transition toward a more rigorous fiscal stance under the
FRL. While the 2014 budget recently approved by Congress envisages a deficit of 2.8 percent of
GDP—higher than the 2.2 percent of GDP submitted by the government—staff estimates a lower
deficit (1.8 percent of GDP) as a result of expected lower capital expenditure execution in line with
past experience (60 percent of the budgeted amount), and a further reduction in the deficit (to
1 percent of GDP) in 2015, as the FRL takes effect. Thus, a fiscal withdrawal of close to 1 percent of
GDP would take place in 2014 and 2015, which will also support some external rebalancing.
Monetary policy settings have recently tightened, moving closer to neutral levels. The central bank
stressed that it will continue to adjust the policy rate as necessary to keep inflation near the target
rate of 5 percent.
A. Stronger Fiscal Framework
16. Staff welcomed significant improvements in the fiscal framework. The fiscal
responsibility law provides an effective fiscal anchor, limiting current spending and making fiscal
policy more predictable, though the regulation to implement the law could include more explicit
guidelines for compliance, accountability, and escape clauses (Box 2). In addition, new taxes will add
much needed revenues and contribute to making the tax system more progressive. The
implementation of a Treasury Single Account and the issuance of short-term debt beginning in 2014
under the recently approved State Financial Administration Modernization law, will help use limited
public resources more efficiently, with the Treasury moving from the present system of cash
rationing to a modern cash management system. This, in turn, should eliminate the need for short-
term loans from the central bank as was the case in 2013.
17. Fiscal settings will be guided by the FRL over the medium term. Thus, staff projects the
central government deficit to be, on average, about 1.0 percent of GDP a year in the period 2016–
18, on account of additional increases in tax collection—though less rapidly than envisaged by the
government given weaknesses in tax and customs administration that will take time to overcome—
and restrained growth in current primary spending, in particular the wage bill.8 As a result, the
8 The government estimates the new taxes will likely increase tax collection by 2 percent of GDP over the medium
term, while staff estimate is about half that amount.

PARAGUAY
12 INTERNATIONAL MONETARY FUND
fiscal policy stance is expected to become broadly neutral in the period 2016–18, as the economy
grows around potential (see table below). Financing of these deficits should be manageable through
domestic and/or foreign sources. Solid GDP growth would keep the debt to GDP ratio below
15 percent of GDP (Annex IV).
18. Staff observed that additional efforts are required to strengthen the fiscal policy
framework. Stronger budget institutions (design, control and monitoring) are needed to enhance
the credibility of fiscal policy and improve the quality of spending. Ongoing efforts to implement
results-based budget monitoring are welcome. Despite some progress over the past decade, tax
collection remains relatively low (estimated at about 51 percent of its potential vis-à-vis a regional
average of 71 percent) as a result of limited human and information system resources.9 The tax
agency is not fully prepared to rapidly absorb an increase in taxpayers by about 15 to 20 percent in
the short-run due to the new taxes, hindering the mobilization of additional revenue. Consequently,
it might be necessary to revise some current low tax rates. In this context, the authorities clarified
they are considering raising the VAT on financial services from its current 5 percent to the
10 percent general rate, on top of the recent increase in rural and urban property taxes. Staff
suggested the authorities be cautious on revenue projections and, in line with Fund TA advice,
strengthen tax and customs administration by giving priority to new information and risk
management systems, improving the quality of taxpayer’s registry and controls via database
crosschecks, and enhancing audit and arrears collections systems and procedures.
19. Staff recommended that a civil service and pension reform be part of a medium-term
strategy to further strengthening the fiscal framework. A civil service reform must seek to attract
9 See Fenochietto, R. and Pessino, C. Understanding Countries’ Tax Effort, IMF Working Paper 13/244.
Est.
2012 2013 2014 2015 2016-18 (avg)
Fiscal impulse (- = withdrawal) 3.2 0.1 -0.8 -0.9 0.0
Non-royalty non-grant structural revenue (- = more revenue) -0.6 0.5 -0.4 -0.9 -0.2
of which: tax revenue 2/ -0.2 0.2 -0.4 -0.9 -0.2
Primary expenditure (- = less spending) 4.0 -0.5 -0.5 0.0 0.1
of which:
wages and salaries 3/ 2.2 0.4 -0.9 0.3 -0.4
capital expenditure 0.9 -0.5 -0.1 0.1 0.2
Memo items:
Public capital expenditure (in percent of GDP) 4.8 4.0 4.0 4.1 4.3
Consolidated public debt (in percent of GDP) 12.6 15.1 14.6 14.5 14.4
Overall balance (in percent of GDP) -1.8 -2.0 -1.8 -1.0 -1.0
Primary current expenditure real growth (in percent) 20.7 4.9 2.9 4.0 4.0
Sources: Ministry of Finance, Central Bank of Paraguay and Fund staff estimates and projections.
1/ Central Government, unless otherwise indicated.
2/ For 2015, includes full year impact of recent tax measaures.
3/ Public wages are adjusted in line with the FRL whenever accumulated inflation reaches 10 percent.
Medium-Term Fiscal Outlook 1/
(p.p. of non-agricultural potential GDP; unless otherwise indicated)
Projections

PARAGUAY
INTERNATIONAL MONETARY FUND 13
and maintain qualified personnel at a competitive salary, while at the same time opening the fiscal
space to increase essential social spending. Staff welcomed work under way in the domestic tax and
customs agencies with Fund TA to overhaul human resource policies, including through the creation
of a professional career system. Although the aggregate pension system still generates a small cash
surplus (equivalent to 0.2 percent of GDP in 2013), several pension regimes run deficits of about
0.3 percent of GDP that are covered by the central government. A pension reform is required to
reduce potentially large fiscal liabilities but also to improve national savings and foster development
of domestic capital markets. With the assistance of other multilateral agencies, the authorities are
working on drafting new legislation and establishing a pension regulator.
20. While PPPs offer potential efficiency gains, they can also pose significant fiscal risks.
Although the PPP law seems to provide a sound legal framework to reduce these risks, staff advised
the authorities to first of all focus on strengthening public investment management, planning and
regulatory capacity before engaging in any large PPP project (Box 3). Moreover, staff recommended
including PPP projects in the national public investment system (SNIP) and publishing data on all
contingent liabilities along with the budget documentation to increase transparency and
accountability. Prioritization of PPP infrastructure projects that are likely to have high economic rates
of return, such as roads and energy, will be key to preserving strong growth momentum. The
authorities agreed with these recommendations and pointed out that the regulatory decree under
discussion that will guide the implementation of the PPP law, will clarify many of these issues.
21. Several initiatives are being put in place to speed up investment. A ministerial group
was formed to ease the decision-making process on priority investments while an inter-ministerial
group would remove bureaucratic obstacles and enhance monitoring, particularly of PPP projects.
The authorities are considering outsourcing management of public investment projects in certain
cases, following closely the experience of other countries with this type of initiative. All PPP projects
will be done through international open bids. They also expect that the diverse legal framework in
place—PPPs, joint ventures, leasing, concessions—will facilitate the private sector’s response to new
investment opportunities in infrastructure. Ongoing efforts to improve the business climate by
strengthening the legal protection of investment and drastically reducing red tape will likely further
encourage private and foreign investment.10
B. Monetary and Exchange Rate Policy at the Forefront to Manage Risks
22. The central bank has made significant advances in implementing an inflation-targeting
(IT) regime since 2011, and further steps are in train. In line with Fund TA, recent implemented
measures include publishing a bi-annual inflation report and the minutes of the monetary policy
committee as well as refining liquidity management and monetary policy instruments—daily
10
The Ministry of Industry and Commerce already reduced red tape for all transactions linked to activities in the
export processing zones (EPZ) from weeks to just a few days and additional reductions are envisaged in 2014. For
instance, approval time to establish a new company in an EPZ went down from 50 days to 20 days and a further
reduction to 5 days is expected in 2014.

PARAGUAY
14 INTERNATIONAL MONETARY FUND
liquidity forecasts are now being prepared and actively used as the basis for decisions on liquidity
management operations (Annex V). The central bank has recently introduced an overnight standing
lending and deposit facility, establishing a corridor of ±100 basis points around the policy rate, to
ensure that the overnight interbank rates remain within a predefined corridor and to increase the
flexibility of the commercial banks’ internal liquidity management. The central bank is also moving
reserve requirements (RR) towards an average system (from a fixed amount) within a reserve
maintenance period, which was facilitated by the launching in November of the Real Time Gross
Settlements (RTGS) payments system. This average RR will likely contribute to reducing the need for
banks to maintain excess reserves. In addition, beginning in 2014, the central bank narrowed the
band around the target inflation rate of 5 percent from ±2.5 to ±2.0 percent.
23. The central bank reaffirmed its commitment to complete the transition towards a full-
fledged IT regime in the near term. This regime has been successful in reducing inflation along
with a decline in the exchange rate pass-through (the latter, an important development in a highly
dollarized economy).11
To complete this transition, priority will be given to developing an active
interbank money market by increasing the predictability of central bank operations and available
instruments, further improving communication with market participants and eliminating legal
impediments to secondary markets trading. Reversing the perception of high credit risk among
banks by strengthening bank risk supervision will be also needed to reduce the intermediary role of
the central bank in all interbank transactions. Staff reiterated previous Fund recommendations to
fully recapitalize the central bank with marketable and fungible securities, further strengthening the
recapitalization process initiated in 2012 when the Ministry of Finance offered the central bank
nonmarketable bonds (paying only 0.25 percent a year).
24. Staff endorsed recent steps taken by the central bank to establish a foreign exchange
(FX) policy that is more transparent, better communicated and more consistent with a full-
fledged IT regime. The central bank indicated that since mid-2013, they have followed Fund TA
advice, implementing a more disciplined FX framework by pre-announcing an auction system for the
sale of government dollar proceeds from revenue of the two binational hydroelectrical companies,
including the nature, frequency and size of these sales. This framework has contributed to improving
the predictability about the central bank’s role and participation in the market. FX interventions outside
the pre-announced sales have been limited to offsetting excessive volatility as the exchange rate is
subject to strong seasonal pressures. The authorities confirmed that they adhere to a flexible
exchange rate policy and do not target the level of the exchange rate. Staff indicated that
maintaining exchange rate flexibility will create incentives for the deepening of the incipient
forwards market in Paraguay as the private sector learns to internalize exchange rate risks and this,
in turn, could also contribute to reducing dollarization.
11
According to staff estimates, the exchange rate pass-through declined to 21.5 percent in the period 2000–2013
from 26.7 percent in 2000–2010 (period excluding IT which started in 2011).
PARAGUAY
INTERNATIONAL MONETARY FUND 15
25. Further entrenching the de-dollarization process would strengthen the effectiveness of
the monetary policy framework. After declining during much of the 2000s, dollarization ratios
started to increase in the past few years—at 40 percent for both loans and deposits, they still remain
one of the highest in the region. While cementing macroeconomic stability should instill confidence
in the guaraní, the use of carefully designed macro-prudential tools could also create incentives to
internalize the risks of dollarization, tilt against foreign currency loans and deposits, and enhance
the transmission mechanism. Key steps could include increasing provisioning requirements for
foreign currency loans and the spread in required reserve ratios between foreign and domestic
deposits.12
The authorities agreed that reversing certain macroprudencial measures taken at the
time of the global financial crisis, such as the reduction in banks’ reserve requirements for foreign
currency deposits, could help sustain a gradual de-dollarization process. However, they pointed out
that for the foreseeable future, dollarization would remain a key feature given Paraguay’s openness
and the prominence of the agricultural sector, which trades exclusively in dollars.
C. Stronger Supervisory-Regulatory Framework
26. The supervisory-regulatory framework of the financial system has undergone major
improvements in recent years in line with FSAP recommendations. Staff welcomed ongoing
efforts to align bank and central bank legislation with international best practices in risk-based
supervision and prudential norms, as well as steps to migrate to international accounting standards
(i.e. IFRS) for bank and supervisory reporting (Annex VI). The supervisory approach and soundness of
cooperatives (which account for 20 percent of financial system assets) will be strengthened over a
period of two years beginning in 2014, as a result of new legal requirements (e.g., increased capital
adequacy, provisioning and liquidity requirements and better information reporting). This, in turn,
would facilitate introduction of a liquidity assistance facility and a deposit insurance scheme for
cooperatives in line with FSAP recommendations. Recommended changes to strengthening
cooperatives governance are still pending.
27. Although credit growth has stabilized since end-2012, closer monitoring is warranted
if it accelerates further. The authorities indicated that although banks usually request solid
collateral from their clients (real estate, land, agricultural output which are usually valued below
market prices to reduce risk) or direct salary deductions in the case of consumer loans, a significant
improvement in credit information would take place in the near term by providing up-to-date data
on corporate and household balance sheets to credit registry agencies. Staff indicated that
additional efforts are also needed to strengthen the bank supervisor’s loan classification system by
requiring institutions to properly identify transactions’ terms and credit quality, and to increase
competition in the banking sector to reduce large interest rate spreads.
12
Staff estimates show that by reducing dollarization ratios in loans by 10 percentage points from currently
40 percent, the long-run pass-through from the policy rate to retail interest rates could increase by 14 percentage
points (the current pass-through is 36 percent, well below the regional average of 50 percent). See Chapter 2 in the
accompanying Selected Issues Papers.

PARAGUAY
16 INTERNATIONAL MONETARY FUND
28. Paraguay’s anti-money laundering plan (AML/CFT) launched in June 2013 is being
activated. The authorities’ recent agreement with the Central Bank of Brazil on measures to control
cross-border cash flows is an important step. However, additional efforts are needed to address
legal and operational shortcomings that remain in controlling the cross border physical
transportation of cash and bearer negotiable instruments while corruption continues to be a serious
obstacle for effective actions.
D. Promoting Inclusive Growth
29. Staff commended the government’s focus on reducing poverty. Poverty and inequality
in Paraguay are among the highest the region. Staff endorsed the government’s holistic approach to
tackle key dimensions of poverty supported by sustained strong economic growth (Box 4). These
dimensions include: vulnerability through social safety nets, such as conditional cash transfer
programs; social exclusion through increased access to basic services, such as schooling, health care,
electricity and safe water and sewerage; and economic exclusion through opportunities to increase
earnings via programs to improve rural infrastructure and enhance small-scale farmers’ earnings,
including through a reforestation program. Assuring the long-term sustainability of all these
initiatives will be crucial to succeed in the fight against poverty.
30. Labor market inefficiencies must be addressed to support the development strategy.
The large informal sector in Paraguay has hindered productivity and overall economic growth. To
some extent, this informality has flourished given labor market institutions that are weak by
international standards, with structural rigidities linked to hiring and firing practices and redundancy
costs. Efforts to increase female labor force participation—a large part of the informal sector–– and
to improve the quality of training would also help raise productivity and lower poverty.
31. A public enterprises (PEs) reform is needed to improve both efficiency and access to
basic public services. PEs play an important role in key sectors, and increasing their efficiency can
help ease their capacity constraints that limit investment.13
Public enterprises combined operating
surplus declined from 1.4 percent of GDP in 2011 to about 0.4 percent of GDP in 2013, with their
investment level representing below 10 percent of total expenses. Staff welcomed important steps
taken to strengthen PE monitoring and performance as well as increased transparency in PEs
accounts and audits. While staff agreed with the authorities that it would be ideal to achieve
improvements in cost efficiency before increasing tariff rates to support investment plans, water and
electricity rates will likely need to be raised in the near future, after been fixed for about 11 years.
Staff also advised eliminating the general diesel fuel subsidy, which benefits the agriculture sector
the most. However, any increase in tariffs must be accompanied by targeted safety net measures to
ensure that the most vulnerable are protected. In addition, it would be crucial to establish a long-
13
There are currently ten public enterprises covering electricity distribution, oil distribution (diesel), airports, ports
management, cement, steel blades, railroad, sugar cane production, telecommunications and water and sewage.
PARAGUAY
INTERNATIONAL MONETARY FUND 17
term development plan to make sure that PEs can accommodate the robust growth outlook,
particularly in the energy sector, to avoid bottlenecks.14
STAFF APPRAISAL
32. Staff commends the government’s ambitious agenda of growth-enhancing reforms
and poverty reduction. Paraguay’s per capita income remains significantly below the region
average and income distribution has deteriorated. The reform strategy targets key areas, in
particular closing the large infrastructure gap, to sustain robust economic and productivity growth in
support of Paraguay’s aims to transition to a dynamic emerging market economy over the next
decade. The country’s medium-term look is positive with balanced risks. Critical legislation has been
already enacted, which signals Paraguay’s commitment to address institutional and structural
weaknesses. However, the regulation to implement these laws will need to be executed carefully.
33. A steady implementation of the FRL will be critical to buttress fiscal discipline and
supportive of near term macro management needs. Implementation of the FRL will support a
desirable near term policy mix of tighter fiscal settings and monetary policy settings close to neutral.
Congress and the executive should take advantage of the new fiscal framework to work closer to
ensure that the budget becomes a true macroeconomic planning instrument. As experience is
gained with the implementation of the new framework, some features of the law might need to be
revised to provide more flexibility across economic cycles and to make escape clause more effective
and clear.
34. Additional efforts are needed to cement a stronger fiscal policy framework.
Strengthening budget design, control and monitoring, with a stronger emphasis on results, and a
medium-term expenditure framework should be priorities as much as mobilizing additional
resources. Moreover, strengthening public investment management, planning and the regulatory
capacity will reduce potential fiscal risks associated with PPP projects and ensure that these and all
public projects provide high-quality infrastructure services efficiently. A civil service and pension
reform must be also part of a medium-term strategy to further strengthen the fiscal framework and,
in turn, to open fiscal space to increase essential social spending and reduce potentially large fiscal
liabilities. To bring Paraguay’s tax collections to par with other countries in the region, high level of
informality, tax evasion and exemptions will need to be drastically reduced. To this end, Fund TA
recommendations provide an appropriate reform guide.
35. The central bank’s track record in keeping inflation on target amid greater exchange
rate flexibility is fortifying the credibility of the IT framework. To complete the transition to a
full-fledged IT regime and further enhance the monetary policy transmission mechanism, priority
should be given to developing an active money market while strengthening bank supervision in
14
The lack of infrastructure in electricity distribution and constant outages represent today a constraint to economic
development.
PARAGUAY
18 INTERNATIONAL MONETARY FUND
order to reduce the perception of high credit risk among banks. Macroprudential measures, such as
reversing the decline in banks’ reserve requirements for foreign currency deposits, could help
sustain the de-dollarization process over time. Although credit growth has recently slowed down,
closer monitoring is warranted if it accelerates further, in part through improved credit information
of companies and households. Given uncertainties as the regime transitions, it will be important for
the central bank to remain vigilant to respond to incipient price pressures.
36. Maintaining exchange rate flexibility remains instrumental in cushioning the economy
against potential shocks and supporting the IT regime. While limited foreign exchange
intervention could be necessary to reduce volatility and to contain excessive risks to the balance
sheets in a highly dollarized economy, the exchange rate ought to continue to be driven by
fundamentals. Moreover, maintaining exchange rate flexibility will create incentives for the
deepening of the incipient forwards market in Paraguay as the private sector learns to internalize
exchange rate risks.
37. To succeed in the fight against poverty, it will be crucial to assure the long-term
sustainability of all initiatives underway to address social and economic exclusion. In addition,
labor market inefficiencies together with efforts to increase female labor force participation, will
need to be addressed to reduce informality and lower poverty. Improved public enterprises
management and long-term investment plans will facilitate access to basic public services at
reasonable cost—though increases in certain rates might be unavoidable in the near term despite
ongoing efforts to reduce operating cost.
38. It is recommended that the next Article IV consultation takes place on the standard
12-month cycle.
PARAGUAY
INTERNATIONAL MONETARY FUND 19
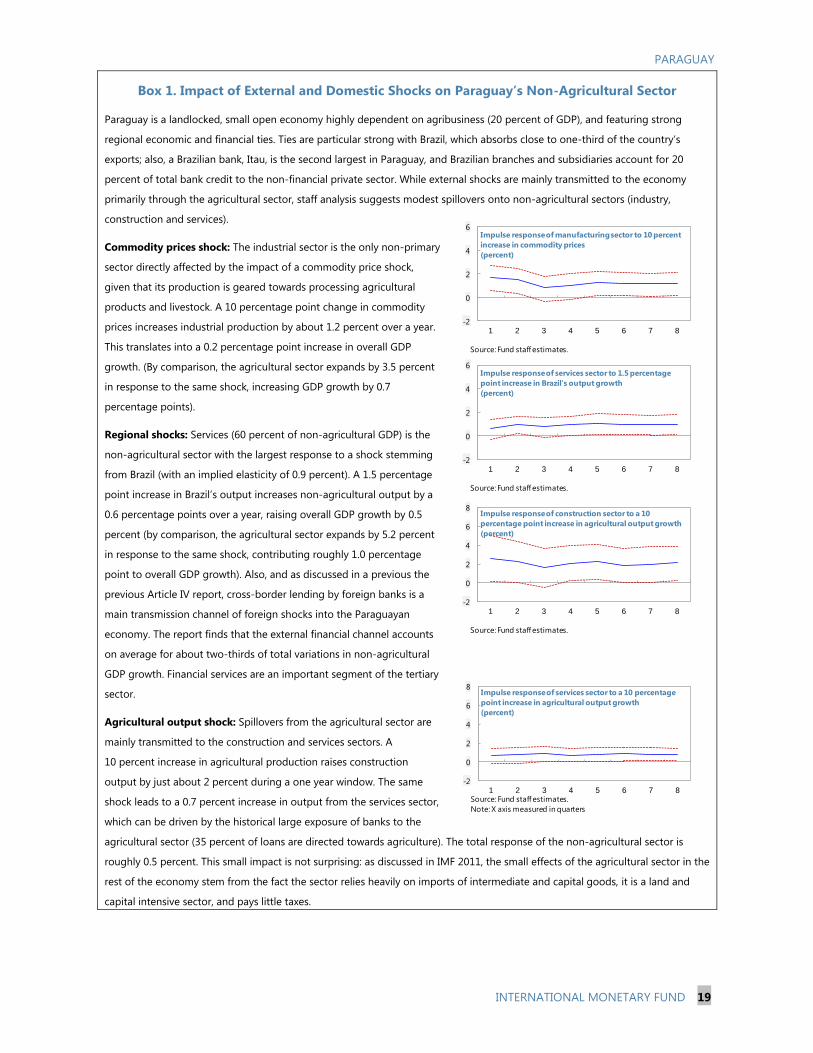
Box 1. Impact of External and Domestic Shocks on Paraguay’s Non-Agricultural Sector
Paraguay is a landlocked, small open economy highly dependent on agribusiness (20 percent of GDP), and featuring strong
regional economic and financial ties. Ties are particular strong with Brazil, which absorbs close to one-third of the country’s
exports; also, a Brazilian bank, Itau, is the second largest in Paraguay, and Brazilian branches and subsidiaries account for 20
percent of total bank credit to the non-financial private sector. While external shocks are mainly transmitted to the economy
primarily through the agricultural sector, staff analysis suggests modest spillovers onto non-agricultural sectors (industry,
construction and services).
Commodity prices shock: The industrial sector is the only non-primary
sector directly affected by the impact of a commodity price shock,
given that its production is geared towards processing agricultural
products and livestock. A 10 percentage point change in commodity
prices increases industrial production by about 1.2 percent over a year.
This translates into a 0.2 percentage point increase in overall GDP
growth. (By comparison, the agricultural sector expands by 3.5 percent
in response to the same shock, increasing GDP growth by 0.7
percentage points).
Regional shocks: Services (60 percent of non-agricultural GDP) is the
non-agricultural sector with the largest response to a shock stemming
from Brazil (with an implied elasticity of 0.9 percent). A 1.5 percentage
point increase in Brazil’s output increases non-agricultural output by a
0.6 percentage points over a year, raising overall GDP growth by 0.5
percent (by comparison, the agricultural sector expands by 5.2 percent
in response to the same shock, contributing roughly 1.0 percentage
point to overall GDP growth). Also, and as discussed in a previous the
previous Article IV report, cross-border lending by foreign banks is a
main transmission channel of foreign shocks into the Paraguayan
economy. The report finds that the external financial channel accounts
on average for about two-thirds of total variations in non-agricultural
GDP growth. Financial services are an important segment of the tertiary
sector.
Agricultural output shock: Spillovers from the agricultural sector are
mainly transmitted to the construction and services sectors. A
10 percent increase in agricultural production raises construction
output by just about 2 percent during a one year window. The same
shock leads to a 0.7 percent increase in output from the services sector,
which can be driven by the historical large exposure of banks to the
agricultural sector (35 percent of loans are directed towards agriculture). The total response of the non-agricultural sector is
roughly 0.5 percent. This small impact is not surprising: as discussed in IMF 2011, the small effects of the agricultural sector in the
rest of the economy stem from the fact the sector relies heavily on imports of intermediate and capital goods, it is a land and
capital intensive sector, and pays little taxes.
-2
0
2
4
6
1 2 3 4 5 6 7 8
Impulse response of manufacturing sector to 10 percent
increase in commodity prices
(percent)
Source: Fund staff estimates.
-2
0
2
4
6
1 2 3 4 5 6 7 8
Impulse response of services sector to 1.5 percentage
point increase in Brazil's output growth
(percent)
Source: Fund staff estimates.
-2
0
2
4
6
8
1 2 3 4 5 6 7 8
Impulse response of construction sector to a 10
percentage point increase in agricultural output growth
(percent)
Source: Fund staff estimates.
-2
0
2
4
6
8
1 2 3 4 5 6 7 8
Impulse response of services sector to a 10 percentage
point increase in agricultural output growth
(percent)
Source: Fund staff estimates.
Note: X axis measured in quarters
PARAGUAY
20 INTERNATIONAL MONETARY FUND
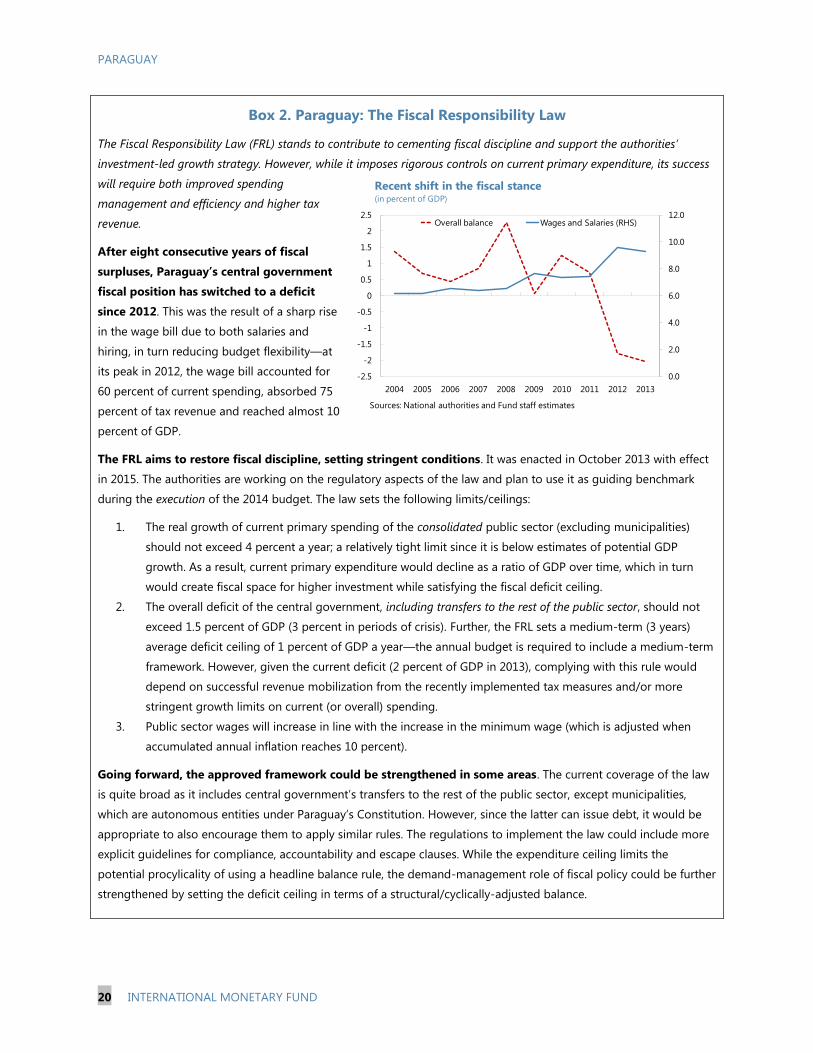
Box 2. Paraguay: The Fiscal Responsibility Law
The Fiscal Responsibility Law (FRL) stands to contribute to cementing fiscal discipline and support the authorities’
investment-led growth strategy. However, while it imposes rigorous controls on current primary expenditure, its success
will require both improved spending
management and efficiency and higher tax
revenue.
After eight consecutive years of fiscal
surpluses, Paraguay’s central government
fiscal position has switched to a deficit
since 2012. This was the result of a sharp rise
in the wage bill due to both salaries and
hiring, in turn reducing budget flexibility—at
its peak in 2012, the wage bill accounted for
60 percent of current spending, absorbed 75
percent of tax revenue and reached almost 10
percent of GDP.
The FRL aims to restore fiscal discipline, setting stringent conditions. It was enacted in October 2013 with effect
in 2015. The authorities are working on the regulatory aspects of the law and plan to use it as guiding benchmark
during the execution of the 2014 budget. The law sets the following limits/ceilings:
1. The real growth of current primary spending of the consolidated public sector (excluding municipalities)
should not exceed 4 percent a year; a relatively tight limit since it is below estimates of potential GDP
growth. As a result, current primary expenditure would decline as a ratio of GDP over time, which in turn
would create fiscal space for higher investment while satisfying the fiscal deficit ceiling.
2. The overall deficit of the central government, including transfers to the rest of the public sector, should not
exceed 1.5 percent of GDP (3 percent in periods of crisis). Further, the FRL sets a medium-term (3 years)
average deficit ceiling of 1 percent of GDP a year—the annual budget is required to include a medium-term
framework. However, given the current deficit (2 percent of GDP in 2013), complying with this rule would
depend on successful revenue mobilization from the recently implemented tax measures and/or more
stringent growth limits on current (or overall) spending.
3. Public sector wages will increase in line with the increase in the minimum wage (which is adjusted when
accumulated annual inflation reaches 10 percent).
Going forward, the approved framework could be strengthened in some areas. The current coverage of the law
is quite broad as it includes central government’s transfers to the rest of the public sector, except municipalities,
which are autonomous entities under Paraguay’s Constitution. However, since the latter can issue debt, it would be
appropriate to also encourage them to apply similar rules. The regulations to implement the law could include more
explicit guidelines for compliance, accountability and escape clauses. While the expenditure ceiling limits the
potential procylicality of using a headline balance rule, the demand-management role of fiscal policy could be further
strengthened by setting the deficit ceiling in terms of a structural/cyclically-adjusted balance.
0.0
2.0
4.0
6.0
8.0
10.0
12.0
-2.5
-2
-1.5
-1
-0.5
0
0.5
1
1.5
2
2.5
2004 2005 2006 2007 2008 2009 2010 2011 2012 2013
Overall balance Wages and Salaries (RHS)
Recent shift in the fiscal stance(in percent of GDP)
Sources: National authorities and Fund staff estimates

PARAGUAY
INTERNATIONAL MONETARY FUND 21
Box 3. Paraguay: The Public-Private Partnerships (PPPs) Law
Paraguay has an ambitious investment plan in infrastructure for the upcoming years. The
recently approved PPPs law is expected to play a key role in encouraging and facilitating private
sector participation in this plan. The government has identified three possible projects to be awarded
through PPPs: the modernization and operation of the Asuncion airport (US$100 million), the
concession of the Asuncion-Ciudad del Este-Encarnacion roads (US$900 million) and the Paraguay
River dredging (US$100 million).
The PPPs law is comprehensive and covers essentially all relevant issues for managing fiscal
risks. It also includes many components of international best practices, such as:
A clear definition of PPPs and a broad institutional scope. The Ministry of Public Works
will be responsible for developing, selecting, awarding and executing transportation projects.
The PPP unit under the Secretaría Técnica de Planificación (STP) will promote, communicate
and coordinate the initiatives in other sectors.
A limit to the government’s exposure to PPP operations. The law states that contingent
and actual liabilities are not to exceed 2 percent of GDP in net present value and not to be
higher than 0.4 percent of GDP in a given year. A Fiduciary Guarantee and Liquidity Fund will
be set to meet contractual obligations derived from PPP projects. The Ministry of Finance will
participate as a gatekeeper throughout project implementation to limit the financial exposure
of the government from PPP operations.
Some aspects of the law could be strengthened and clarified in the upcoming regulatory
decree:
Risk allocation. While allocating risks in each contract allows for some flexibility, it could
make contract renegotiations more difficult given the weak institutional capacity in the
contracting entities at the public sector. Accordingly, regulations of the law should provide
clear guidelines about typical risks (construction, demand and availability). At the same time,
the legal framework should provide guidelines for renegotiating and terminating PPP
contracts.
Fiscal risks. The methodology for accounting and reporting contingent liabilities in the fiscal
accounts and in the budget needs to be better specified in line with international standards.
PARAGUAY
22 INTERNATIONAL MONETARY FUND
Box 4. Paraguay: The Government’s Strategy to Reduce Extreme Poverty
Despite a decline over the past decade, poverty in Paraguay still remains among the highest in the
region. Amid the economic and financial crisis, overall poverty in Paraguay worsened significantly in the
second half of the 1990s and early 2000s reaching a peak of 49.7 percent by 2002. Since then, it has
gradually declined, reaching 32.4 percent in 2011, just slightly below the level achieved in the mid-1990s
(36.1 percent). In contrast, practically no improvement in extreme poverty has taken place, still affecting
in 2011, 18 percent of the population (or 220,000 families, of which 67 percent live in rural areas)
compared with 18.8 percent in the mid-1990s. At the same time, income inequality has continued to
deteriorate over the past decade, in contrast with the trend in the region.
The government’s program “Sembrando Oportunidades” aims to halve extreme poverty to about
9 percent by 2015. Under this program, the poverty reduction would be mainly achieved by providing
opportunities to increase income:
Support small-scale farmers with technical, financial and managerial assistance to improve
their access to markets and the development of value chains. This will be done in part by
expanding the Paraguay Sustainable Agriculture and Rural Development Project (PRODERS), with
an additional financing of US$100 million from the World Bank. The idea is to scale up the
existing project to some of regions in the country with the highest incidence of rural poverty. The
government plans to increase the number of beneficiary families from 50,000 in 2013 to 120,000
in 2014. In addition, it plans to expand income opportunities for families through work in
reforestation activities.
Investment in infrastructure. To generate an alternative source of income for families not
involved in agricultural activities, the government plans to hire rural labor to work in building and
maintaining infrastructure, such as roads, schools, health centers, and water and sewage.
Expansion of conditional cash transfers (CCT) programs. Increase the number of beneficiary
families under the Tekopora program from currently 83,000 to 100,000 to expand access to
education, health care and food security for up to six years.
Increase training and labor opportunities in urban areas. Coordinate with the private sector
to match technical careers and training courses with demand requirements.
PARAGUAY
INTERNATIONAL MONETARY FUND 23
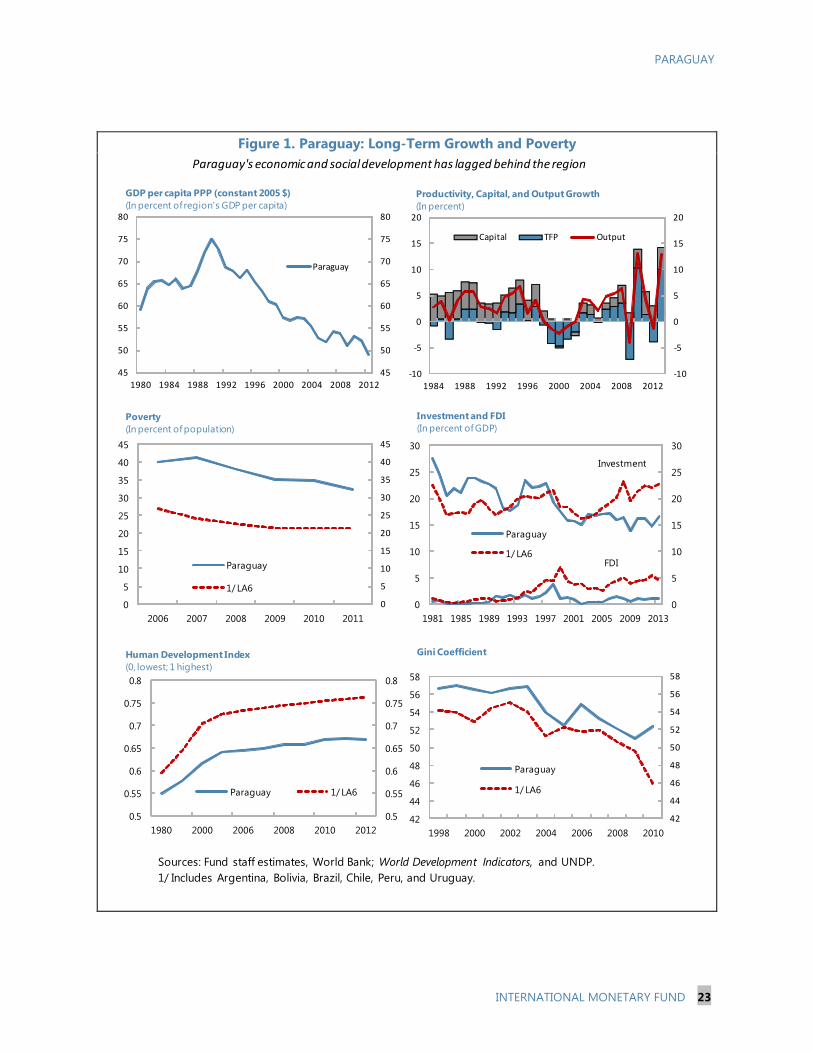
Figure 1. Paraguay: Long-Term Growth and Poverty
0
5
10
15
20
25
30
0
5
10
15
20
25
30
1981 1985 1989 1993 1997 2001 2005 2009 2013
Paraguay
1/ LA6
Investment and FDI
(In percent of GDP)
Investment
FDI
Sources: Fund staff estimates, World Bank; World Development Indicators, and UNDP.
1/ Includes Argentina, Bolivia, Brazil, Chile, Peru, and Uruguay.
0.5
0.55
0.6
0.65
0.7
0.75
0.8
0.5
0.55
0.6
0.65
0.7
0.75
0.8
1980 2000 2006 2008 2010 2012
Paraguay 1/ LA6
Human Development Index
(0, lowest; 1 highest)
45
50
55
60
65
70
75
80
45
50
55
60
65
70
75
80
1980 1984 1988 1992 1996 2000 2004 2008 2012
Paraguay
GDP per capita PPP (constant 2005 $)
(In percent of region's GDP per capita)
42
44
46
48
50
52
54
56
58
42
44
46
48
50
52
54
56
58
1998 2000 2002 2004 2006 2008 2010
Paraguay
1/ LA6
Gini Coefficient
0
5
10
15
20
25
30
35
40
45
0
5
10
15
20
25
30
35
40
45
2006 2007 2008 2009 2010 2011
Paraguay
1/ LA6
Poverty
(In percent of population)
Paraguay's economic and social development has lagged behind the region
-10
-5
0
5
10
15
20
-10
-5
0
5
10
15
20
1984 1988 1992 1996 2000 2004 2008 2012
Capital TFP Output
Productivity, Capital, and Output Growth
(In percent)

PARAGUAY
24 INTERNATIONAL MONETARY FUND
Figure 2. Paraguay: Real Sector Developments, 2009-2013
Sources: Central Bank of Paraguay and Fund staff estimates.
1/ Includes Argentina, Bolivia, Brazil, Chile, Peru, and Uruguay.2/ Excludes fruits and vegetables.
-10
-5
0
5
10
15
20
2009 2010 2011 2012 2013
Non-agro
Agriculture
GDP
Sector Contribution to GDP Growth
(In percent)
-10
-5
0
5
10
15
20
2009 2010 2011 2012 2013
Domestic Demand
Net Exp.
GDP
Demand Side Contribution to GDP Growth
(In percent)
-10
-5
0
5
10
15
20
25
0
2
4
6
8
10
12
Jan-09 Jan-10 Jan-11 Jan-12 Jan-13
Headline
Core 2/
Food, RHS
Inflation
(In percent, y/y)
-4
-2
0
2
4
6
8
10
-4
-3
-2
-1
0
1
2
2009 2010 2011 2012 2013
Non-agricultural output gap
Non-agricultural GDP growth
(cumulative, rhs)
Non-Agricultural GDP Growth and Output Gap
(In percent)
-10
-5
0
5
10
15
20
2009 2010 2011 2012 2013
Paraguay
Max 1/
Min 1/
Real GDP Growth
(In percent)
-20
-15
-10
-5
0
5
10
15
20
25
30
Jan-09 Jan-10 Jan-11 Jan-12 Jan-13
Index of economic activity
Terms-of-trade
Index of Economic Activity
(Cumulative, percent)
Paraguay's economic activity continues to be very
susceptible to terms-of-trade dynamics...
...making GDP growth very volatile (as compared
with the region).
Growth picked up in 2013, driven by the recovery
of the agribusiness sector......and robust external demand.
The non-agricultural output gap has narrowed
somewhat...
...and inflation remains low.

PARAGUAY
INTERNATIONAL MONETARY FUND 25
Figure 3. Paraguay: Fiscal Developments, 2009–2013
Sources: Central Bank of Paraguay, Ministry of Finance and Fund staff calculations.
1/ Excludes electricity royalties and grants. See 2011 Art. IV Staff Report.
2/ Debt service in 2012 includes debt exchange with the central bank.
-2.5
-2
-1.5
-1
-0.5
0
0.5
1
1.5
2
2009 2010 2011 2012 2013
Overall Primary
Primary and Overall Balance, Central Government
(In percent of GDP)
-8
-6
-4
-2
0
2
4
2009 2010 2011 2012 2013
Fiscal Impulse
Structural Primary Balance
Structural Primary Balance and Fiscal Impulse /1
(In percent of non-agricultural potential GDP)
0
5
10
15
20
25
2009 2010 2011 2012 2013
Total revenue Tax revenue
Central Government Revenue
(In percent of GDP)
0
5
10
15
20
25
2009 2010 2011 2012 2013
Rest WagesCapital
Central Government Expenditure
(In percent of GDP )
The overall fiscal balance swung into a deficit in 2012, and
will remain broadly unchanged in 2013...
... leading to a neutral stance in 2013, after two years of
injecting stimuli.
Revenue mobilization has been weak in recent years...... while expenditure has increased driven by wage outlays,
and capital expenditure has remained about constant.
Public debt is relatively low and mostly composed of
external debt...
0
5
10
15
20
25
30
35
40
45
0
1
2
3
4
5
6
2009 2010 2011 2012 2013
Debt service to GDP
Debt service to Tax
Revenue (RHS)
Central Government Debt Service 2/
(In percent )
... and debt service indicators remain relatively low...
0
2
4
6
8
10
12
14
16
18
20
2009 2010 2011 2012 2013
Domestic debt External debt
Consolidated Public Debt
(In percent of GDP)
Real primary expenditure growth (in percent)

PARAGUAY
26 INTERNATIONAL MONETARY FUND
Figure 4. Paraguay: Monetary Developments, 2009–2014
Sources: Central Bank of Paraguay and Fund staff calculations.
0
2
4
6
8
10
12
14
16
2010 2011 2012 2013
Inflation
Policy rate
Average central bank paper rate
Central Bank Paper Rates and Inflation
(In percent)
After a prolonged pause, the central bank increased its policy
rate by a combined 100 bps in December 2013 and January
2014.
Real credit growth has moderated recently but remains
brisk at about 13 percent (y-o-y).
y = 0.4717x + 0.1124
-4
-3
-2
-1
0
1
2
3
4
-4
-3
-2
-1
0
1
2
3
4
-4 -2 0 2 4
Chang
e in
lend
ing
rate
Quarterly change in the policy rate
Pass-through of the Policy Rte, 2010Q1 to 2013Q2
(Change after 1 quarter, in percent))
The pass-through from policy to lending rates remains
low.
-10
0
10
20
30
40
50
60
70
Jan-07 Jan-08 Jan-09 Jan-10 Jan-11 Jan-12 Jan-13
Total (consolidated)
National Currency
Foreign Currency: In USD
Real Private Sector Credit Growth
(In percent, y/y)
-5
0
5
10
15
20
25
30
35
40
Jan-10 Jan-11 Jan-12 Jan-13
Currency Issued M2
Monetary Aggregates
(In percent, y/y)
Growth of monetary aggregates has slowed down
1
2
3
4
5
6
7
8
9
10
11
Jan-10 Jan-11 Jan-12 Jan-13 Jan-14
Actual
inflation
Inflation and Central Bank Target
(In percent)
Band
...and inflation is below the central bank target
-6
-4
-2
0
2
4
6
-6
-4
-2
0
2
4
6
2009 2010 2011 2012 2013
Real Open Market
Operations Rate
NRIR
Real Policy Rate and Neutral Real Interest Rate
(In percent)
bringing the real policy rate close to neutral.
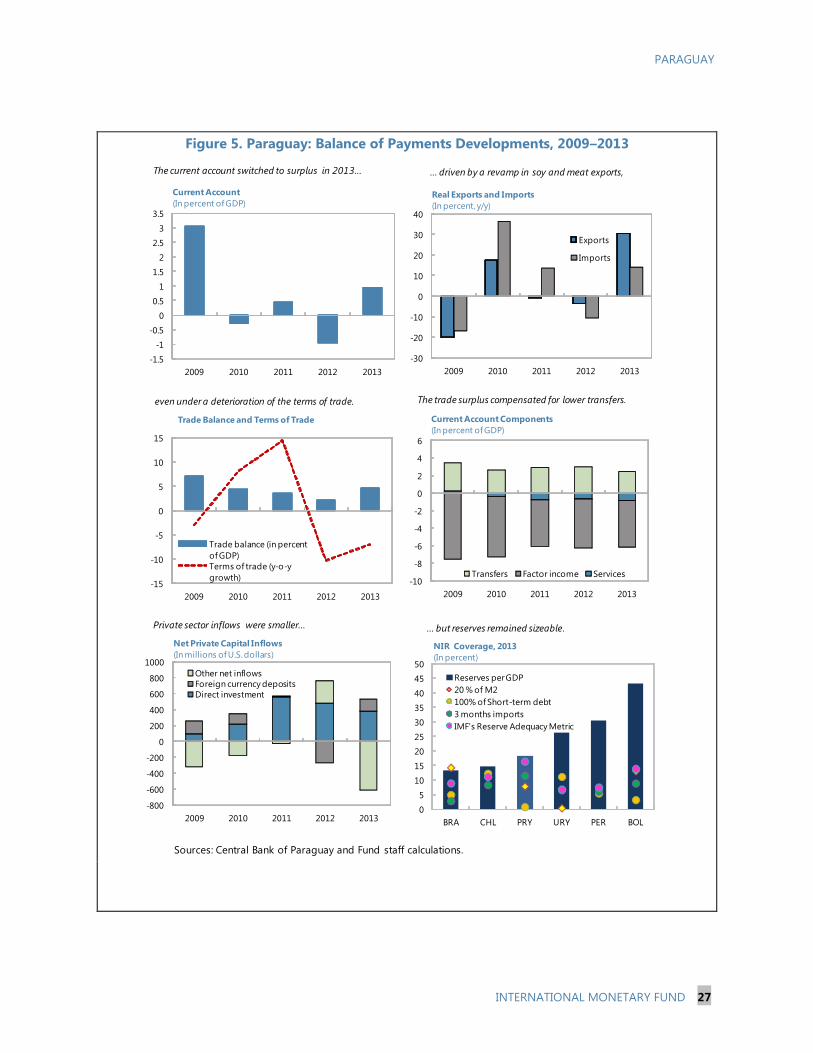
PARAGUAY
INTERNATIONAL MONETARY FUND 27
Figure 5. Paraguay: Balance of Payments Developments, 2009–2013
Sources: Central Bank of Paraguay and Fund staff calculations.
-1.5
-1
-0.5
0
0.5
1
1.5
2
2.5
3
3.5
2009 2010 2011 2012 2013
Current Account
(In percent of GDP)
-15
-10
-5
0
5
10
15
2009 2010 2011 2012 2013
Trade balance (in percent
of GDP)
Terms of trade (y-o-y
growth)
Trade Balance and Terms of Trade
-800
-600
-400
-200
0
200
400
600
800
1000
2009 2010 2011 2012 2013
Other net inflows
Foreign currency deposits
Direct investment
Net Private Capital Inflows
(In millions of U.S. dollars)
-30
-20
-10
0
10
20
30
40
2009 2010 2011 2012 2013
Exports
Imports
Real Exports and Imports
(In percent, y/y)
The current account switched to surplus in 2013... ... driven by a revamp in soy and meat exports,
even under a deterioration of the terms of trade.
Private sector inflows were smaller...
The trade surplus compensated for lower transfers.
... but reserves remained sizeable.
-10
-8
-6
-4
-2
0
2
4
6
2009 2010 2011 2012 2013
Transfers Factor income Services
Current Account Components
(In percent of GDP)
0
5
10
15
20
25
30
35
40
45
50
BRA CHL PRY URY PER BOL
Reserves per GDP
20 % of M2
100% of Short-term debt
3 months imports
IMF's Reserve Adequacy Metric
NIR Coverage, 2013
(In percent)

PARAGUAY
28 INTERNATIONAL MONETARY FUND
Figure 6. Paraguay: Structural Indicators 1/
Quality of Overall Infrastructure
(Score, 1=worst 7=best)
Quality of Electricity Supply
(Score, 1=worst 7=best)
Legal System and Property Rights
(Rating)
Adults with Account at Formal Financial Institution
(In percent of total adult population)
Lack of Financial Restrictions on Capital Account
Transactions
(Quinn, 0-100 sca)
Quality of Education
(Score, 1=worst 7=best)
Several indicators confirm Paraguay's widespread structural weakness
Note: 2012 data used for quality of overall
infrastructure scores.Note: 2012 data used for quality of electricity supply
scores.
Note: Average of 2006-2012 data used for Legal
System & Property Rights ratings. Note: 2010 data used for percentage of adults with an
account at formal fin. inst.
Note: Average of 2007-2011 data used for Lack of
financial restrictions on Capital account transactions
scale.
Note: 2012 data used for quality of education scores.
Source: World Bank.
1/ Countries for comparison include Bolivia, Costa Rica, Ecuador, El Salvador, Guatemala, and Uruguay.

PARAGUAY
INTERNATIONAL MONETARY FUND 29
Table 1. Paraguay: Legislated Policy Reforms, 2012–13
Status Description
1) Fiscal Responsibility Law
Enacted in late October
2013. The government is
working on the regulation
of the law. It will apply as
of 2015.
Introduces a ceiling on: central
government deficit of 1.5% of GDP
(or 1% average in a 3-year period),
current primary expenditures' growth
of 4% in real terms and wage
increases in the public sector in line
with changes in the minimum wage.
2)Public Private Partnership (PPPs)
Law
Enacted in early
November 2013. The
government is working on
the regulation of the law.
Regulates public-private participation
in infraestruture and service projects.
Introduces a trust fund for guarantees
and liquidity of PPP contracts.
3) Joint Ventures Law
Enacted in October 2013.
The government is
working on the regulation
of the law.
Expands the scope of the PPP law to
include more areas for joint venture
projects. Establishes that the local
component has to be at least 25%.
Tax Revenue
4) New Personal Income TaxEnacted in July 2012;
applies as of August 2012.
Income taxed up to 10%. Some
incomes are exempted, such as
pensions; numerous deductions,
including personal expenses and
5) VAT Generalization
Enacted in early October
2013; applies as of Jan.
2014.
Extends VAT of 5% (half of the
general rate) to primary production.
6) New Agricultural Income Tax
Enacted in early October
2013; applies as of Jan.
2014.
Introduces up to a 10% annual tax on
agricultural income (IRAGRO) in
substitution of the IMAGRO which
taxed the size of the landholding.
Annual tax paid in March of the
following year.
Public Financial Management
7)Financial Modernization of the
State
Enacted in October 2013.
Regulations approved;
applies as of Jan. 2014.
Improves liquidity management by
introducing a Treasury Single Account
(TSA) and short-term local debt titles.
8) Superintendence of PensionsDraft Law under study at
the Ministry of Finance.
Improves management, control, and
financial sustainability of the pension
system.
Central Bank
7)Modification of the Central Bank
Law
Draft law under study at
the Central Bank.
Updates the law on the main
functions, objectives and structure of
the central bank.
Financial Sector
9)Modification of the Securities
Market Law
Under discussion in the
Senate.
Update the law on financial markets
innovation and practices. Corrects for
overlapings and introduces security
mechanisms.
10) Modification of the Banking LawDraft law under study at
the Central Bank.
Updates the law to strenghten risk-
based supervision in line with best
international standards.
11) Deposit Guarantee Fund LawProject under study at the
Central Bank.
Updates the law to strenghten control
mechanisms.
Business Climate
12) National Land Directory Law Draft law.Regularizes property ownership of
rural and urban land.
13) Legal Security for Investments LawDraft law under study at
Ministry of Industry.Promotes legal security for investors.
Fiscal Laws
Source: National authorities.

PARAGUAY
30 INTERNATIONAL MONETARY FUND
Table 2. Paraguay: Selected Economic and Social Indicators
Est.2008 2009 2010 2011 2012 2013 2014 2015 2016 2017 2018
Income and prices
Real GDP 6.4 -4.0 13.1 4.3 -1.2 13.0 4.8 4.5 4.5 4.5 4.5
Nominal GDP 16.3 -2.0 20.0 14.6 0.0 15.6 9.7 9.7 9.8 10.1 10.6
Consumer prices (end of period) 7.5 1.9 7.2 4.9 4.0 3.7 5.0 5.0 5.0 5.0 5.0
Nominal exchange rate (Guarani per U.S. dollar, eop) 4,945.0 4,610.0 4,573.8 4,439.9 4,288.8 4,585.0 … … … … …
Monetary sector
Currency issue 15.0 11.3 18.5 11.6 17.5 13.9 10.1 18.1 11.5 11.5 12.1
Credit to private sector 62.0 21.4 37.3 25.8 15.8 17.5 11.9 16.7 9.8 8.0 16.1
Liabilities to private sector 42.4 24.9 19.2 19.4 14.1 20.6 10.6 9.2 -1.2 -10.9 -25.7
External sector
Exports (fob) 29.7 -20.3 35.1 20.7 -7.8 16.0 5.3 5.1 6.3 5.7 5.7
Imports (cif) 44.7 -23.6 44.7 22.9 -5.8 10.1 9.0 4.3 6.0 6.6 6.9
Terms of trade 3.3 -3.0 8.2 14.3 -10.2 -7.0 -9.1 -2.1 1.2 -0.6 -0.8
Real effective exchange rate 1/ 16.3 -7.4 2.8 13.4 -0.3 6.8 … … … … …
Current account 1.0 3.0 -0.3 0.5 -1.0 0.9 -0.9 -0.8 -0.6 -0.8 -1.0
Trade balance 5.7 7.1 4.3 3.5 2.2 4.6 3.1 3.3 3.4 2.9 2.4
Exports 52.6 48.6 50.6 52.3 46.7 47.6 47.8 46.6 45.7 44.7 43.9
Registered 24.1 19.9 21.9 22.8 20.3 25.1 25.1 24.3 23.7 23.0 22.4
Energy 10.5 11.9 9.5 9.4 9.3 8.2 8.1 8.0 7.8 7.7 7.7
Unregistered 17.9 16.8 19.2 20.2 17.2 14.4 14.6 14.4 14.2 14.0 13.9
Imports -46.9 -41.6 -46.4 -48.8 -44.5 -43.0 -44.7 -43.3 -42.3 -41.8 -41.5
o/w Oil imports -7.0 -5.7 -5.2 -6.2 -6.6 -6.3 -6.1 -5.6 -5.2 -4.9 -4.7
Other (export and import of services, income, current transfers) -4.7 -4.0 -4.5 -3.1 -3.2 -3.6 -4.0 -4.1 -4.0 -3.7 -3.4
o/w Remittances 2.2 3.3 2.7 3.0 3.0 2.5 2.3 2.2 2.1 2.0 1.9
Capital account and financial account 0.9 -0.3 1.1 2.0 1.9 1.6 0.5 1.4 1.2 1.4 1.1
General government -0.5 0.1 0.3 -0.2 -0.1 1.7 0.5 1.0 1.0 1.0 1.0
Private sector 1.4 -0.4 0.8 2.3 2.0 -0.1 0.0 0.3 0.1 0.3 0.1
o/w Direct investment 1.1 0.6 1.0 2.3 1.9 1.3 1.7 1.9 2.2 2.6 2.9
Errors and omissions -0.2 2.3 0.9 0.9 -0.9 0.7 0.0 0.0 0.0 0.0 0.0
Net international reserves (in millions of U.S. dollars) 2,876 3,817 4,165 4,971 4,983 5,889 5,763 5,943 6,143.0 6,356 6,403
(Stock in months of next year imports of goods and services) 4.8 4.4 3.9 5.0 4.5 4.9 4.6 4.4 4.3 4.2 4.2
(Stock over total external short term debt) 1.4 1.8 2.0 2.3 2.4 2.8 2.7 2.7 2.7 2.7 2.7
Gross domestic investment 16.4 13.8 16.2 16.2 15.4 15.9 16.4 17.2 18.0 18.8 19.5
Private sector 13.5 9.1 11.8 11.6 9.8 11.1 11.6 12.3 12.9 13.5 14.0
Public sector 3.0 4.7 4.5 4.7 5.6 4.8 4.8 4.9 5.1 5.3 5.6
Gross national saving 17.4 16.8 16.0 16.7 14.4 16.8 15.5 16.4 17.4 18.0 18.5
Private sector 11.7 13.1 11.0 10.6 10.8 14.4 13.5 13.2 14.1 14.3 14.8
Public sector 5.7 3.7 4.9 6.0 3.6 2.5 2.0 3.2 3.4 3.6 3.8
External saving (+) disavings (-) 1.0 3.0 -0.3 0.5 -1.0 0.9 -0.9 -0.8 -0.6 -0.8 -1.0
Central government revenues 15.8 17.5 17.1 17.4 18.9 17.0 17.0 17.8 17.8 17.8 17.9
o/w Tax revenues 10.7 11.6 12.0 12.1 12.7 11.7 12.0 12.8 13.0 13.1 13.2
Central government expenditures 13.5 17.5 15.9 16.7 20.8 19.0 18.9 18.9 18.9 18.9 18.9
o/w Wages and salaries 6.5 7.7 7.3 7.4 9.6 9.3 8.5 8.8 8.2 8.4 7.8
Transfers 3.1 3.7 3.4 3.6 4.4 4.2 4.5 4.1 4.5 4.1 4.4
Capital expenditure 2.4 4.1 3.4 3.9 4.8 4.0 4.0 4.1 4.2 4.3 4.5
Central government primary balance 2.8 0.6 1.6 1.0 -1.6 -1.7 -1.4 -0.6 -0.6 -0.5 -0.5
Central government overall balance 2.3 0.1 1.2 0.7 -1.8 -2.0 -1.8 -1.0 -1.0 -1.0 -1.0
Consolidated public debt (in percent of GDP) 22.8 22.5 18.6 16.2 15.9 20.9 19.1 17.6 17.2 18.3 17.1
o/w external 17.0 15.6 13.3 11.1 10.7 11.7 11.4 11.6 11.7 11.9 12.1
domestic 2.0 2.4 2.0 1.3 1.9 3.3 3.1 2.9 2.7 2.5 2.3
LRM 2/ 3.8 4.5 3.3 3.8 3.3 5.8 4.5 3.1 3 3.8 2.7
Memorandum items:
GDP (in billions of Guaranies) 80,735 79,117 94,934 108,795 108,832 125,856 138,079 151,487 166,274 183,119 202,484
GDP (US$billions) 18.5 15.9 20.7 24.1 24.9 28.4 29.7 32.0 34.8 37.6 40.4
Sources: Central Bank of Paraguay; Ministry of Finance; and Fund staff estimates and projections.
1/ Average annual change; a positive change indicates an appreciation. For 2013, end-September.
2/ Letras de Regulacion Monetaria (Central Bank paper).
(In percent of GDP, unless otherwise indicated)
I. Social and Demographic Indicators
II. Economic Indicators
(Annual percentage change, unless otherwise indicated)
Proj.
Population 2012 (millions) 6.6 Gini index (2011) 52.0
Unemployment rate (2012) 4.9 Life expectancy at birth (2010) 72.3
Percentage of population below the poverty line (2011) 32.4 Adult illiteracy rate (2011) 4.7
Rank in UNDP development index (2012) 111 of 186 GDP per capita (US$, 2012) 3,730.2
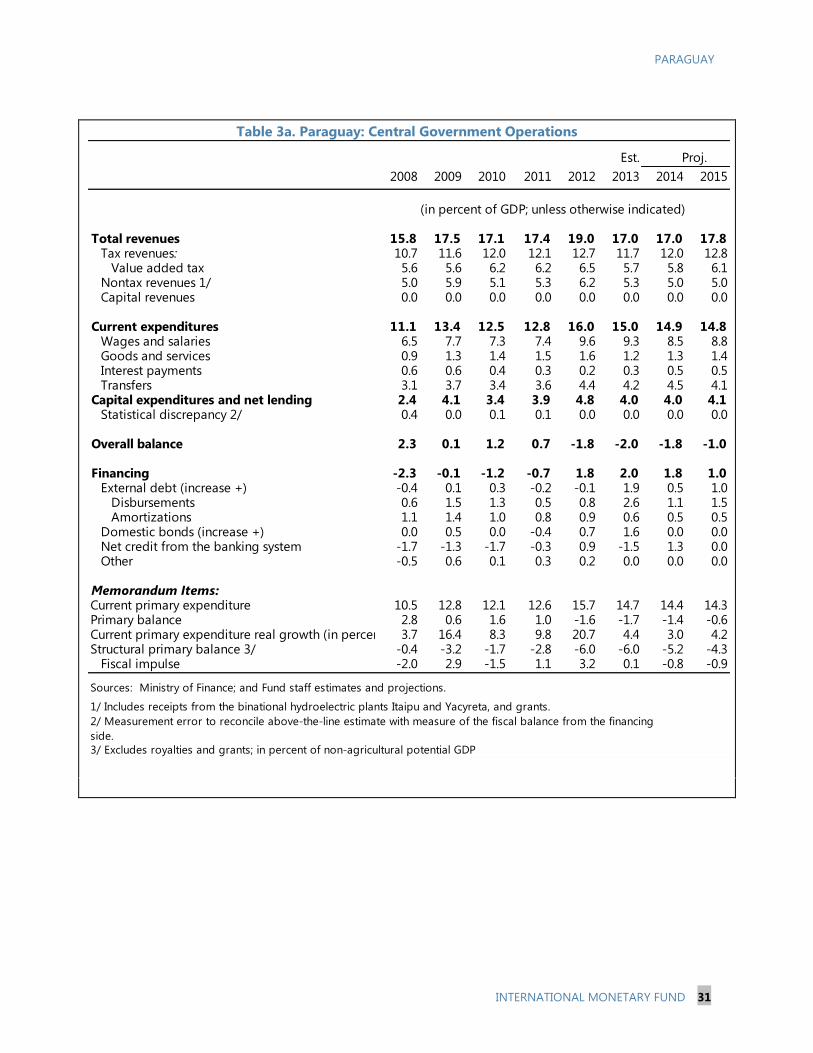
PARAGUAY
INTERNATIONAL MONETARY FUND 31
Table 3a. Paraguay: Central Government Operations
Est.
2008 2009 2010 2011 2012 2013 2014 20152015
Total revenues 15.8 17.5 17.1 17.4 19.0 17.0 17.0 17.8Tax revenues: 10.7 11.6 12.0 12.1 12.7 11.7 12.0 12.8
Value added tax 5.6 5.6 6.2 6.2 6.5 5.7 5.8 6.1Nontax revenues 1/ 5.0 5.9 5.1 5.3 6.2 5.3 5.0 5.0Capital revenues 0.0 0.0 0.0 0.0 0.0 0.0 0.0 0.0
Current expenditures 11.1 13.4 12.5 12.8 16.0 15.0 14.9 14.8Wages and salaries 6.5 7.7 7.3 7.4 9.6 9.3 8.5 8.8Goods and services 0.9 1.3 1.4 1.5 1.6 1.2 1.3 1.4Interest payments 0.6 0.6 0.4 0.3 0.2 0.3 0.5 0.5Transfers 3.1 3.7 3.4 3.6 4.4 4.2 4.5 4.1
Capital expenditures and net lending 2.4 4.1 3.4 3.9 4.8 4.0 4.0 4.1Statistical discrepancy 2/ 0.4 0.0 0.1 0.1 0.0 0.0 0.0 0.0
Overall balance 2.3 0.1 1.2 0.7 -1.8 -2.0 -1.8 -1.0
Financing -2.3 -0.1 -1.2 -0.7 1.8 2.0 1.8 1.0External debt (increase +) -0.4 0.1 0.3 -0.2 -0.1 1.9 0.5 1.0
Disbursements 0.6 1.5 1.3 0.5 0.8 2.6 1.1 1.5Amortizations 1.1 1.4 1.0 0.8 0.9 0.6 0.5 0.5
Domestic bonds (increase +) 0.0 0.5 0.0 -0.4 0.7 1.6 0.0 0.0Net credit from the banking system -1.7 -1.3 -1.7 -0.3 0.9 -1.5 1.3 0.0Other -0.5 0.6 0.1 0.3 0.2 0.0 0.0 0.0
Memorandum Items:Current primary expenditure 10.5 12.8 12.1 12.6 15.7 14.7 14.4 14.3Primary balance 2.8 0.6 1.6 1.0 -1.6 -1.7 -1.4 -0.6Current primary expenditure real growth (in percent) 3.7 16.4 8.3 9.8 20.7 4.4 3.0 4.2Structural primary balance 3/ -0.4 -3.2 -1.7 -2.8 -6.0 -6.0 -5.2 -4.3
Fiscal impulse -2.0 2.9 -1.5 1.1 3.2 0.1 -0.8 -0.9
Sources: Ministry of Finance; and Fund staff estimates and projections.
1/ Includes receipts from the binational hydroelectric plants Itaipu and Yacyreta, and grants.
2/ Measurement error to reconcile above-the-line estimate with measure of the fiscal balance from the financing
side.
3/ Excludes royalties and grants; in percent of non-agricultural potential GDP
(in percent of GDP; unless otherwise indicated)
Proj.
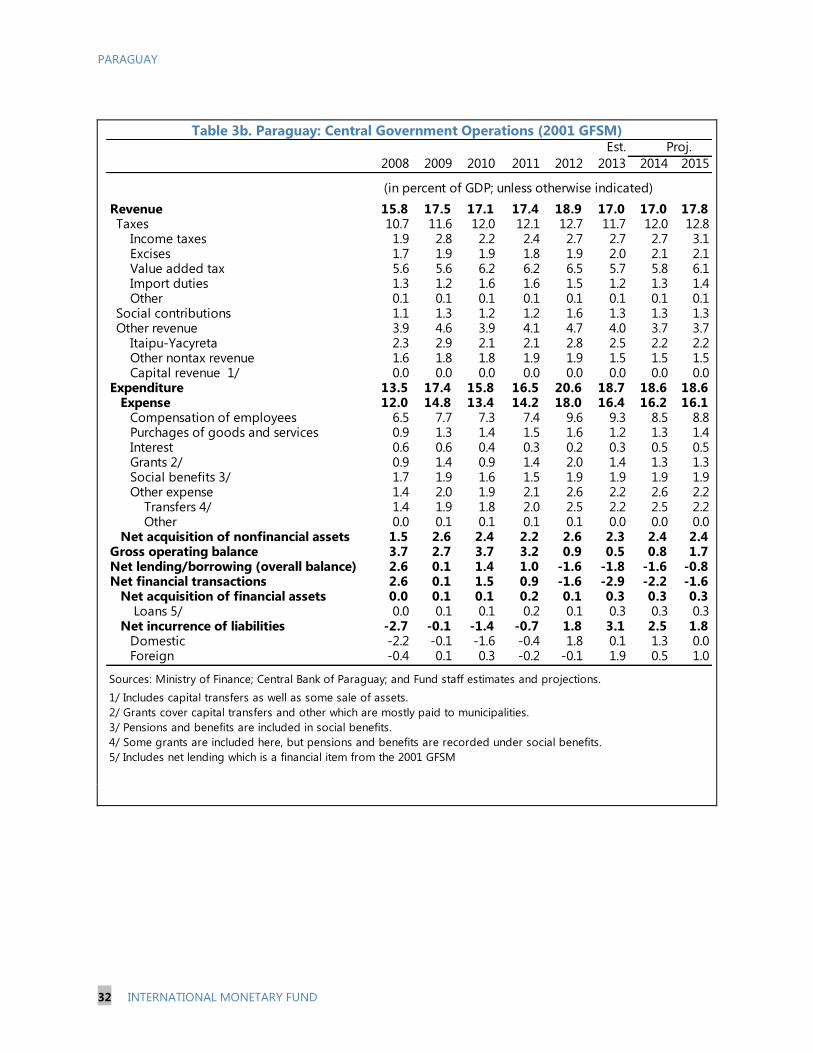
PARAGUAY
32 INTERNATIONAL MONETARY FUND
Table 3b. Paraguay: Central Government Operations (2001 GFSM)
Est.
2008 2009 2010 2011 2012 2013 2014 2015
Revenue 15.8 17.5 17.1 17.4 18.9 17.0 17.0 17.8 Taxes 10.7 11.6 12.0 12.1 12.7 11.7 12.0 12.8 Income taxes 1.9 2.8 2.2 2.4 2.7 2.7 2.7 3.1 Excises 1.7 1.9 1.9 1.8 1.9 2.0 2.1 2.1 Value added tax 5.6 5.6 6.2 6.2 6.5 5.7 5.8 6.1 Import duties 1.3 1.2 1.6 1.6 1.5 1.2 1.3 1.4 Other 0.1 0.1 0.1 0.1 0.1 0.1 0.1 0.1 Social contributions 1.1 1.3 1.2 1.2 1.6 1.3 1.3 1.3 Other revenue 3.9 4.6 3.9 4.1 4.7 4.0 3.7 3.7 Itaipu-Yacyreta 2.3 2.9 2.1 2.1 2.8 2.5 2.2 2.2 Other nontax revenue 1.6 1.8 1.8 1.9 1.9 1.5 1.5 1.5 Capital revenue 1/ 0.0 0.0 0.0 0.0 0.0 0.0 0.0 0.0Expenditure 13.5 17.4 15.8 16.5 20.6 18.7 18.6 18.6 Expense 12.0 14.8 13.4 14.2 18.0 16.4 16.2 16.1 Compensation of employees 6.5 7.7 7.3 7.4 9.6 9.3 8.5 8.8 Purchages of goods and services 0.9 1.3 1.4 1.5 1.6 1.2 1.3 1.4 Interest 0.6 0.6 0.4 0.3 0.2 0.3 0.5 0.5 Grants 2/ 0.9 1.4 0.9 1.4 2.0 1.4 1.3 1.3 Social benefits 3/ 1.7 1.9 1.6 1.5 1.9 1.9 1.9 1.9 Other expense 1.4 2.0 1.9 2.1 2.6 2.2 2.6 2.2 Transfers 4/ 1.4 1.9 1.8 2.0 2.5 2.2 2.5 2.2 Other 0.0 0.1 0.1 0.1 0.1 0.0 0.0 0.0 Net acquisition of nonfinancial assets 1.5 2.6 2.4 2.2 2.6 2.3 2.4 2.4Gross operating balance 3.7 2.7 3.7 3.2 0.9 0.5 0.8 1.7Net lending/borrowing (overall balance) 2.6 0.1 1.4 1.0 -1.6 -1.8 -1.6 -0.8Net financial transactions 2.6 0.1 1.5 0.9 -1.6 -2.9 -2.2 -1.6 Net acquisition of financial assets 0.0 0.1 0.1 0.2 0.1 0.3 0.3 0.3 Loans 5/ 0.0 0.1 0.1 0.2 0.1 0.3 0.3 0.3 Net incurrence of liabilities -2.7 -0.1 -1.4 -0.7 1.8 3.1 2.5 1.8 Domestic -2.2 -0.1 -1.6 -0.4 1.8 0.1 1.3 0.0 Foreign -0.4 0.1 0.3 -0.2 -0.1 1.9 0.5 1.0
Sources: Ministry of Finance; Central Bank of Paraguay; and Fund staff estimates and projections.
1/ Includes capital transfers as well as some sale of assets.
2/ Grants cover capital transfers and other which are mostly paid to municipalities.
3/ Pensions and benefits are included in social benefits.
4/ Some grants are included here, but pensions and benefits are recorded under social benefits.
5/ Includes net lending which is a financial item from the 2001 GFSM
(in percent of GDP; unless otherwise indicated)
Proj.
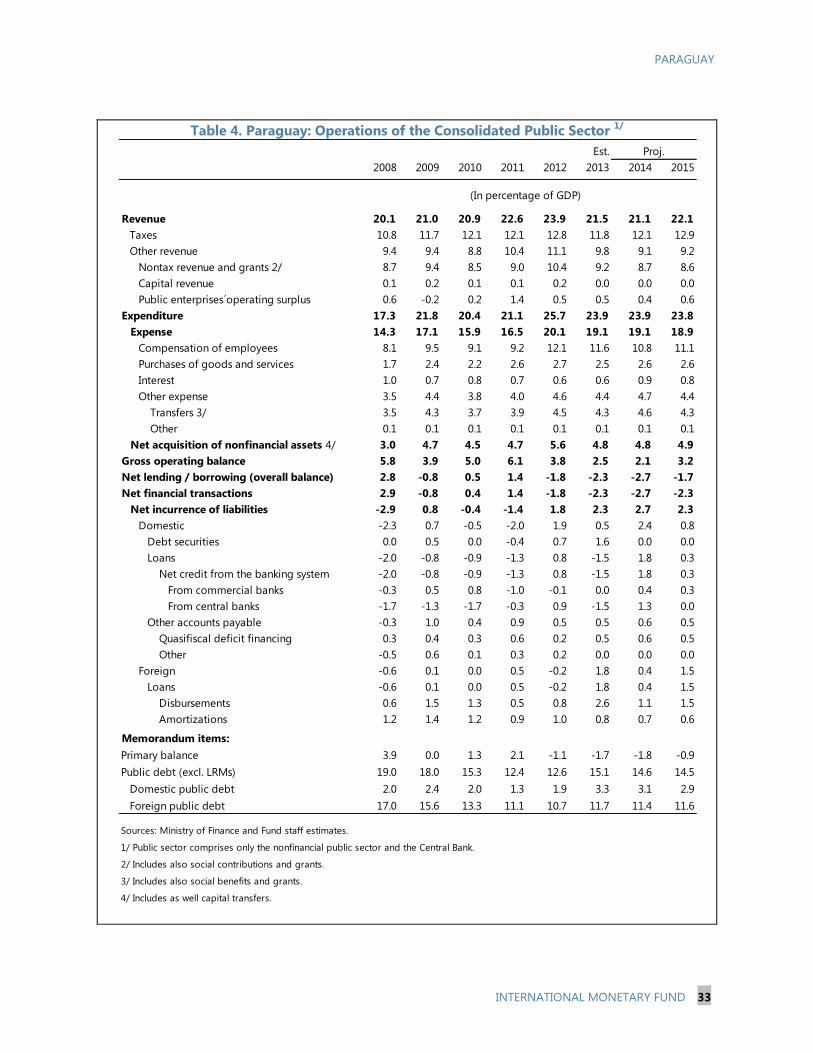
PARAGUAY
INTERNATIONAL MONETARY FUND 33
Table 4. Paraguay: Operations of the Consolidated Public Sector 1/
Est. Proj.
2008 2009 2010 2011 2012 2013 2014 2015
Revenue 20.1 21.0 20.9 22.6 23.9 21.5 21.1 22.1
Taxes 10.8 11.7 12.1 12.1 12.8 11.8 12.1 12.9
Other revenue 9.4 9.4 8.8 10.4 11.1 9.8 9.1 9.2
Nontax revenue and grants 2/ 8.7 9.4 8.5 9.0 10.4 9.2 8.7 8.6
Capital revenue 0.1 0.2 0.1 0.1 0.2 0.0 0.0 0.0
Public enterprises´operating surplus 0.6 -0.2 0.2 1.4 0.5 0.5 0.4 0.6
Expenditure 17.3 21.8 20.4 21.1 25.7 23.9 23.9 23.8
Expense 14.3 17.1 15.9 16.5 20.1 19.1 19.1 18.9
Compensation of employees 8.1 9.5 9.1 9.2 12.1 11.6 10.8 11.1
Purchases of goods and services 1.7 2.4 2.2 2.6 2.7 2.5 2.6 2.6
Interest 1.0 0.7 0.8 0.7 0.6 0.6 0.9 0.8
Other expense 3.5 4.4 3.8 4.0 4.6 4.4 4.7 4.4
Transfers 3/ 3.5 4.3 3.7 3.9 4.5 4.3 4.6 4.3
Other 0.1 0.1 0.1 0.1 0.1 0.1 0.1 0.1
Net acquisition of nonfinancial assets 4/ 3.0 4.7 4.5 4.7 5.6 4.8 4.8 4.9
Gross operating balance 5.8 3.9 5.0 6.1 3.8 2.5 2.1 3.2
Net lending / borrowing (overall balance) 2.8 -0.8 0.5 1.4 -1.8 -2.3 -2.7 -1.7
Net financial transactions 2.9 -0.8 0.4 1.4 -1.8 -2.3 -2.7 -2.3
Net incurrence of liabilities -2.9 0.8 -0.4 -1.4 1.8 2.3 2.7 2.3
Domestic -2.3 0.7 -0.5 -2.0 1.9 0.5 2.4 0.8
Debt securities 0.0 0.5 0.0 -0.4 0.7 1.6 0.0 0.0
Loans -2.0 -0.8 -0.9 -1.3 0.8 -1.5 1.8 0.3
Net credit from the banking system -2.0 -0.8 -0.9 -1.3 0.8 -1.5 1.8 0.3
From commercial banks -0.3 0.5 0.8 -1.0 -0.1 0.0 0.4 0.3
From central banks -1.7 -1.3 -1.7 -0.3 0.9 -1.5 1.3 0.0
Other accounts payable -0.3 1.0 0.4 0.9 0.5 0.5 0.6 0.5
Quasifiscal deficit financing 0.3 0.4 0.3 0.6 0.2 0.5 0.6 0.5
Other -0.5 0.6 0.1 0.3 0.2 0.0 0.0 0.0
Foreign -0.6 0.1 0.0 0.5 -0.2 1.8 0.4 1.5
Loans -0.6 0.1 0.0 0.5 -0.2 1.8 0.4 1.5
Disbursements 0.6 1.5 1.3 0.5 0.8 2.6 1.1 1.5
Amortizations 1.2 1.4 1.2 0.9 1.0 0.8 0.7 0.6
Memorandum items:
Primary balance 3.9 0.0 1.3 2.1 -1.1 -1.7 -1.8 -0.9
Public debt (excl. LRMs) 19.0 18.0 15.3 12.4 12.6 15.1 14.6 14.5
Domestic public debt 2.0 2.4 2.0 1.3 1.9 3.3 3.1 2.9
Foreign public debt 17.0 15.6 13.3 11.1 10.7 11.7 11.4 11.6
Sources: Ministry of Finance and Fund staff estimates.
1/ Public sector comprises only the nonfinancial public sector and the Central Bank.
2/ Includes also social contributions and grants.
3/ Includes also social benefits and grants.
4/ Includes as well capital transfers.
(In percentage of GDP)
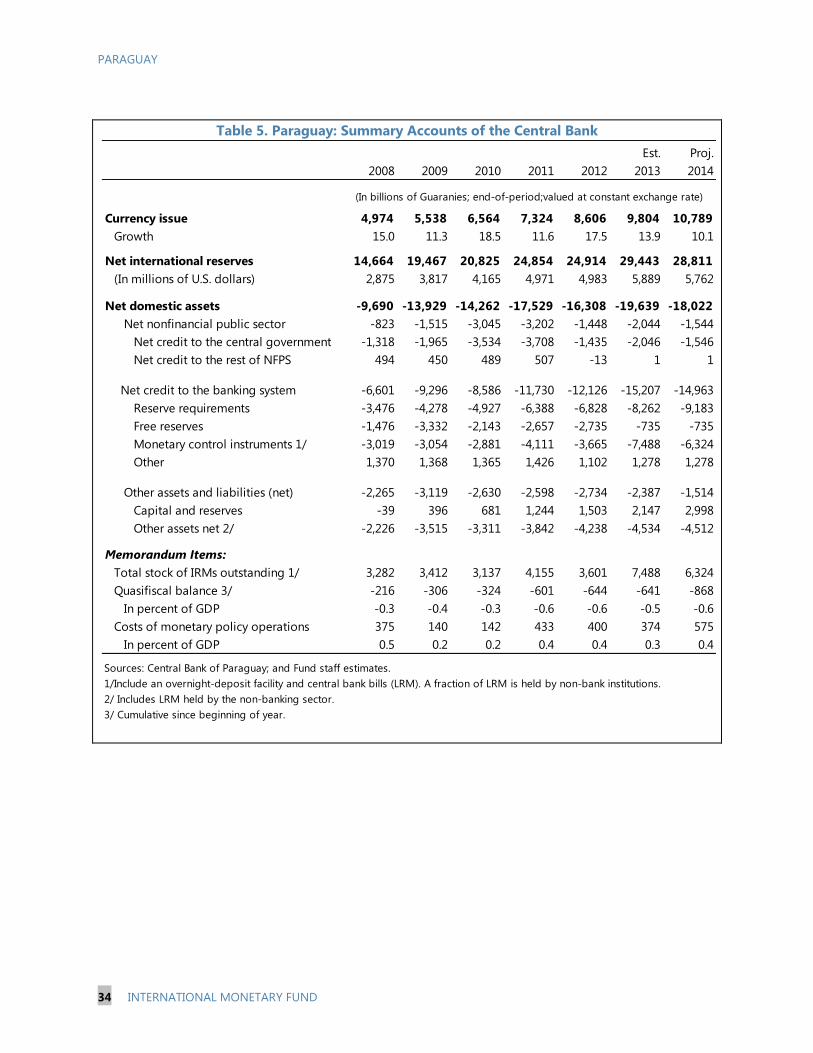
PARAGUAY
34 INTERNATIONAL MONETARY FUND
Table 5. Paraguay: Summary Accounts of the Central Bank
Est. Proj.
2008 2009 2010 2011 2012 2013 2014
Currency issue 4,974 5,538 6,564 7,324 8,606 9,804 10,789
15.0 11.3 18.5 11.6 17.5 13.9 10.1
Net international reserves 14,664 19,467 20,825 24,854 24,914 29,443 28,811
2,875 3,817 4,165 4,971 4,983 5,889 5,762
Net domestic assets -9,690 -13,929 -14,262 -17,529 -16,308 -19,639 -18,022
Net nonfinancial public sector -823 -1,515 -3,045 -3,202 -1,448 -2,044 -1,544
Net credit to the central government -1,318 -1,965 -3,534 -3,708 -1,435 -2,046 -1,546
Net credit to the rest of NFPS 494 450 489 507 -13 1 1
Net credit to the banking system -6,601 -9,296 -8,586 -11,730 -12,126 -15,207 -14,963
Reserve requirements -3,476 -4,278 -4,927 -6,388 -6,828 -8,262 -9,183
Free reserves -1,476 -3,332 -2,143 -2,657 -2,735 -735 -735
Monetary control instruments 1/ -3,019 -3,054 -2,881 -4,111 -3,665 -7,488 -6,324
Other 1,370 1,368 1,365 1,426 1,102 1,278 1,278
Other assets and liabilities (net) -2,265 -3,119 -2,630 -2,598 -2,734 -2,387 -1,514
Capital and reserves -39 396 681 1,244 1,503 2,147 2,998
Other assets net 2/ -2,226 -3,515 -3,311 -3,842 -4,238 -4,534 -4,512
Memorandum Items:
Total stock of IRMs outstanding 1/ 3,282 3,412 3,137 4,155 3,601 7,488 6,324
Quasifiscal balance 3/ -216 -306 -324 -601 -644 -641 -868
In percent of GDP -0.3 -0.4 -0.3 -0.6 -0.6 -0.5 -0.6
Costs of monetary policy operations 375 140 142 433 400 374 575
In percent of GDP 0.5 0.2 0.2 0.4 0.4 0.3 0.4
1/Include an overnight-deposit facility and central bank bills (LRM). A fraction of LRM is held by non-bank institutions.
Growth
(In millions of U.S. dollars)
Sources: Central Bank of Paraguay; and Fund staff estimates.
2/ Includes LRM held by the non-banking sector.
3/ Cumulative since beginning of year.
(In billions of Guaranies; end-of-period;valued at constant exchange rate)
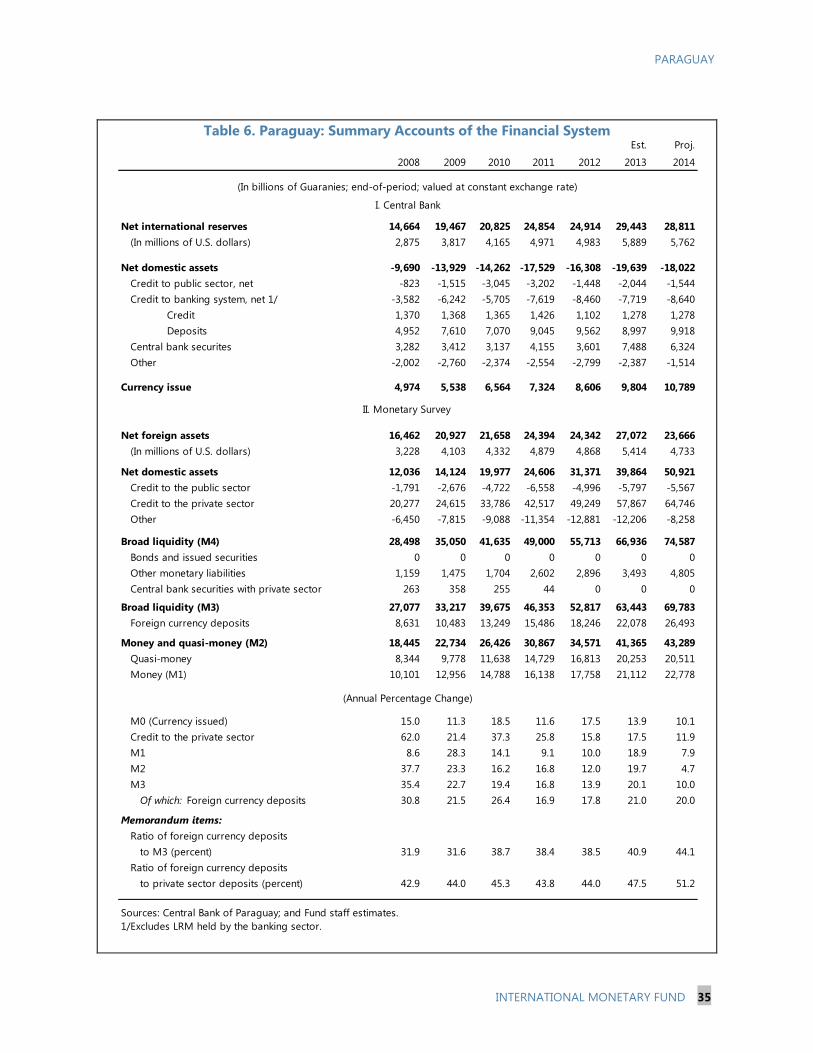
PARAGUAY
INTERNATIONAL MONETARY FUND 35
Table 6. Paraguay: Summary Accounts of the Financial System
Est. Proj.
2008 2009 2010 2011 2012 2013 2014
Net international reserves 14,664 19,467 20,825 24,854 24,914 29,443 28,811
2,875 3,817 4,165 4,971 4,983 5,889 5,762
-9,690 -13,929 -14,262 -17,529 -16,308 -19,639 -18,022
-823 -1,515 -3,045 -3,202 -1,448 -2,044 -1,544
-3,582 -6,242 -5,705 -7,619 -8,460 -7,719 -8,640
Credit 1,370 1,368 1,365 1,426 1,102 1,278 1,278
Deposits 4,952 7,610 7,070 9,045 9,562 8,997 9,918
3,282 3,412 3,137 4,155 3,601 7,488 6,324
-2,002 -2,760 -2,374 -2,554 -2,799 -2,387 -1,514
4,974 5,538 6,564 7,324 8,606 9,804 10,789
16,462 20,927 21,658 24,394 24,342 27,072 23,666
3,228 4,103 4,332 4,879 4,868 5,414 4,733
12,036 14,124 19,977 24,606 31,371 39,864 50,921
-1,791 -2,676 -4,722 -6,558 -4,996 -5,797 -5,567
20,277 24,615 33,786 42,517 49,249 57,867 64,746
-6,450 -7,815 -9,088 -11,354 -12,881 -12,206 -8,258
28,498 35,050 41,635 49,000 55,713 66,936 74,587
0 0 0 0 0 0 0
1,159 1,475 1,704 2,602 2,896 3,493 4,805
263 358 255 44 0 0 0
27,077 33,217 39,675 46,353 52,817 63,443 69,783
8,631 10,483 13,249 15,486 18,246 22,078 26,493
18,445 22,734 26,426 30,867 34,571 41,365 43,289
8,344 9,778 11,638 14,729 16,813 20,253 20,511
10,101 12,956 14,788 16,138 17,758 21,112 22,778
15.0 11.3 18.5 11.6 17.5 13.9 10.1
62.0 21.4 37.3 25.8 15.8 17.5 11.9
8.6 28.3 14.1 9.1 10.0 18.9 7.9
37.7 23.3 16.2 16.8 12.0 19.7 4.7
35.4 22.7 19.4 16.8 13.9 20.1 10.0
30.8 21.5 26.4 16.9 17.8 21.0 20.0
31.9 31.6 38.7 38.4 38.5 40.9 44.1
42.9 44.0 45.3 43.8 44.0 47.5 51.2
1/Excludes LRM held by the banking sector.
Credit to the public sector
Credit to the private sector
Other
I. Central Bank
Net domestic assets
(In millions of U.S. dollars)
Net domestic assets
Credit to public sector, net
Credit to banking system, net 1/
Central bank securites
Other
Currency issue
Net foreign assets
(In millions of U.S. dollars)
II. Monetary Survey
(In billions of Guaranies; end-of-period; valued at constant exchange rate)
Broad liquidity (M4)
Bonds and issued securities
Central bank securities with private sector
Broad liquidity (M3)
Foreign currency deposits
Other monetary liabilities
M2
Credit to the private sector
(Annual Percentage Change)
M1
Money and quasi-money (M2)
Quasi-money
Money (M1)
M0 (Currency issued)
M3
to private sector deposits (percent)
Sources: Central Bank of Paraguay; and Fund staff estimates.
Of which: Foreign currency deposits
Ratio of foreign currency deposits
Memorandum items:
to M3 (percent)
Ratio of foreign currency deposits

PARAGUAY
36 INTERNATIONAL MONETARY FUND
Table 7. Paraguay: Balance of Payments
Est.
2008 2009 2010 2011 2012 2013 2014 2015 2016 2017 2018
Current account 184 482 -57 110 -238 269 -263 -255 -206 -296 -391
Trade balance 1,051 1,124 882 855 556 1,302 919 1,071 1,180 1,107 983
Exports 9,726 7,751 10,469 12,634 11,649 13,510 14,224 14,947 15,891 16,792 17,747
Registered 4,463 3,167 4,534 5,509 5,052 7,106 7,480 7,776 8,248 8,635 9,040
Energy 1,948 1,901 1,967 2,257 2,310 2,314 2,399 2,551 2,720 2,903 3,099
Unregistered 3,315 2,683 3,969 4,867 4,287 4,090 4,345 4,620 4,923 5,254 5,607
Imports -8,675 -6,627 -9,587 -11,779 -11,093 -12,209 -13,305 -13,876 -14,711 -15,685 -16,763
Registered -8,506 -6,497 -9,400 -11,549 -10,756 -11,574 -12,914 -13,465 -14,271 -15,213 -16,256
Of which: Fuel products -1,302 -909 -1,073 -1,507 -1,647 -1,786 -1,816 -1,793 -1,802 -1,836 -1,887
Unregistered -169 -129 -187 -230 -337 -635 -391 -411 -440 -472 -507
Services (net) -155 40 -84 -181 -171 -247 -284 -189 -225 -210 -195
Transport -169 -152 -250 -309 -297 -291 -312 -334 -370 -375 -378
Travel -18 74 72 67 58 16 2 1 3 13 21
Other 33 118 93 62 68 28 25 144 142 152 162
Factor income -1,126 -1,201 -1,412 -1,278 -1,381 -1,494 -1,584 -1,847 -1,896 -1,950 -1,960
Transfers 414 519 557 714 759 708 686 710 735 757 781
Capital and financial account 164 -54 223 490 478 444 137 435 406 509 438
General government -99 11 54 -55 -14 488 144 326 360 378 417
Disbursements 113 231 260 129 198 193 316 495 530 548 600
Amortization -212 -220 -206 -184 -212 -205 -172 -169 -169 -169 -184
Other 0 0 0 0 0 500 0 0 0 0 0
Private sector 1/ 263 -64 169 545 491 -44 -7 109 46 131 21
Direct investment 209 95 216 557 480 382 497 606 778 969 1,184
Foreign currency deposits 77 164 128 17 -268 151 -207 -70 -2 426 693
Other -23 -323 -175 -29 280 -578 -297 -427 -729 -1,264 -1,856
Errors and omissions -40 371 182 206 -228 193 0 0 0 0 0
Overall balance 308 800 348 806 12 906 -126 180 200 213 47Net international reserves (increase -) -389 -942 -348 -806 -12 -906 126 -180 -200 -213 -47
Gross reserves -389 -942 -348 -806 -12 -906 126 -180 -200 -213 -47
Reserve liabilities 0 0 0 0 0 0 0 0 0 0 0
Exceptional financing 81 142 0 0 0 0 0 0 0 0 0
Arrears deferral (+)/clearance (-) 81 142 0 0 0 0 0 0 0 0 0
Memorandum items:
Current account in percent of GDP 1.0 3.0 -0.3 0.5 -1.0 0.9 -0.9 -0.8 -0.6 -0.8 -1.0
Gross reserves (in millions of U.S. dollars) 2,876 3,817 4,165 4,971 4,983 5,889 5,763 5,943 6,143 6,356 6,403
In months of imports of GNFS 4.8 4.4 3.9 5.0 4.5 4.9 4.6 4.4 4.3 4.2 4.2
External public debt in percent of GDP 1/ 17.6 15.7 13.4 11.2 10.7 11.8 11.5 11.6 11.7 11.9 12.1
Debt service in percent of exports GNFS 13.0 17.4 12.6 10.1 11.0 9.1 9.0 8.6 8.1 7.7 7.5
Export volume (percentage change) 5.6 -19.8 17.8 -0.7 -3.7 30.6 7.6 6.1 5.2 5.3 5.3
Import volume (percentage change) 21.7 -17.1 36.5 13.5 -10.4 14.1 6.3 5.7 6.6 6.6 6.5
Terms of trade (percentage change) 3.3 -3.0 8.2 14.3 -10.2 -7.0 -9.1 -2.1 1.2 -0.6 -0.8
Sources: Central Bank of Paraguay and Fund staff estimates.
1/ Based on average exchange rate valuation of GDP.
(In millions of U.S. dollars; unless otherwise indicated)
Proj.

PARAGUAY
INTERNATIONAL MONETARY FUND 37
Table 8. Paraguay:Indicators of External Vulnerability
2008 2009 2010 2011 2012 2013
Monetary and financial indicators
Broad money (M3), percentage change 1/ 35.4 22.7 19.4 16.8 13.9 20.1
Credit to the private sector, real (percentage change) 1/ 50.7 19.2 28.1 19.9 11.4 13.3
Share of nonperforming loans in total loans (percent) 2/ 1.1 1.6 1.3 1.7 2.1 2.2
Average domestic lending rate, real 17.6 23.0 21.5 6.0 11.0 12.0
Central Bank bill yield, real -5.0 0.3 0.8 -0.8 1.8 3.2
International reserves (millions of U.S. dollars) 2,875 3,817 4,165 4,971 4,983 5,889
Central bank foreign short-term liabilities (millions of U.S. dollars) 0.0 1.2 0.0 0.0 0.0 0.0
External indicators
Merchandise exports (percentage change) 29.7 -20.3 35.1 20.7 -7.8 16.0
Merchandise imports (percentage change) 44.7 -23.6 44.7 22.9 -5.8 10.1
Merchandise terms of trade (percentage change) 3.7 -3.3 8.3 24.8 1.3 -7.0
Real effective exchange rate (percentage change) 16.3 -7.4 2.8 13.4 -0.3 5.8
Current account balance (percent of GDP) 1.0 3.0 -0.3 0.5 -1.0 0.9
Capital and financial account (percent of GDP) 0.9 -0.3 1.1 2.0 1.9 1.6
Net foreign direct investment (percent of GDP) 1.1 0.6 1.0 2.3 1.9 1.3
Other net investment (percent of GDP) -0.4 -1.2 -0.2 -0.9 -2.2 -1.8
External public debt (percent of GDP) 2/ 17.6 15.7 13.4 11.2 10.7 11.8
Debt service (in percent of exports GNFS) 13.0 17.4 12.6 10.1 11.0 9.1
Net reserves (in U.S. dollars) 2,876 3,817 4,165 4,971 4,983 5,889
In months of imports of GNFS 4.8 4.4 3.9 5.0 4.5 4.9
Over short-term external debt 3/ 1.4 1.8 2.0 2.3 2.4 2.8
Over foreign currency deposits in domestic banks 2.1 2.6 2.3 3.0 2.8 3.3
deposits in banking system.
2/ Based on end-of-period exchange rate conversion of U.S. dollar-denominated debt.
3/ Private and public external debt with a residual maturity of one year or less. Excludes foreign currency
(In percent of GDP, unless otherwise indicated)
Sources: Central Bank of Paraguay and Fund staff calculations.
1/ Foreign currency components are valued at the accounting exchange rate.

PARAGUAY
38 INTERNATIONAL MONETARY FUND
-40
-20
0
20
40
60
80
-40
-20
0
20
40
60
80
1996 1998 2000 2002 2004 2006 2008 2010 2012
As a share of GDP Percent change, y/y
Region'saverage credit to GDP,
Paraguay: Bank Credit 1/
(In percent)
Sources: Paraguayan Authorities; World Bank's World Development
Indicators; and Fund staff estimates.
1/ Shaded region denotes banking crisis period.
0
20
40
60
80
100
120
140
2007 2008 2009 2010 2011 2012
Other Commerce Industry Consumption Primary sector
Paraguay: Sectoral Distribution of Total Loans
(In percent)
Sources: Paraguayan Authorities; World Bank's World Development
Indicators; and Fund staff estimates.
Annex I. Paraguay: Banking Credit Developments1
1. Total assets of the banking system have grown significantly in recent years fueled by rapid
credit growth.2 Following a sharp decline in the mid-1990s and early 2000s during the banking crises,
credit to the private sector has started to recover and grew briskly since 2007. As a result, credit reached
about 36 percent of GDP in 2013—an increase of almost 20 percentage points of GDP in six years,
catching up to the region’s current average and Paraguay’s credit level prior to the banking crises. All
bank credit categories have experienced strong growth rates but especially consumer loans, which now
represent 15 percent of total credit (compared to 8 percent in 2007).3 Bank loans continue to be mainly
concentrated in the large agriculture and livestock sectors, which account for 1/3 of the banking system’s
total loan portfolio.4 Economic stability, a strengthening of labor markets and a marked reduction in
poverty, have been important factors in increasing the demand for credit by businesses and households
since the mid-2000s.
1 Prepared by J. Yepez.
2 The banking system hold assets equivalent to 77 percent of total system assets, with foreign asset ownership
representing about 45 percent of total bank assets. There are 15 commercial banks, of which three are foreign-
owned and five are majority foreign-owned. The financial system also consists of 12 finance companies, 372
cooperatives, 32 insurance companies, and 5 pension funds, with the rest of financial services entities being financial
warehouses, exchange houses, and second-tier banks.
3Consumer loans are mainly linked to direct salary deposits.
4 Despite the large exposure to the primary sector, recent supply shocks to the sector did not spillover to the
financial system. Risks have been limited by farmers’ large buffers and high profits in recent years and by banks’
strong capital and loss related buffers. Due to the high volatility of growth (agriculture accounts for 20 percent of the
GDP), banks are subject to periodic stress tests.

PARAGUAY
INTERNATIONAL MONETARY FUND 39
2. High credit growth, if continued, could pose risks to the stability of the financial system.
International experience shows that periods of rapid credit expansion have often been associated with
increased macro-financial vulnerabilities. Dell’Ariccia et al. (2012) find that about one in three booms
have been followed by a period of
sub-par growth or a banking crisis.5
These authors classify credit
expansion episodes as credit boom
when the annual growth rate of the
credit-to-GDP ratio exceeds
20 percent. According to this
definition, Paraguay experienced a
credit boom from the last quarter of
2007 up to the first quarter of 2011.
However, the growth of credit
relative to GDP in Paraguay has
moderated during the past couple
of years, shrinking the credit-to-GDP
gap that had emerged during 2006‒11.
3. Despite the rapid increase in credit, the loans to deposits ratio has remained significantly
below the 1.5 benchmark ratio for potential banking crises. Banks in Paraguay rely almost entirely on
deposits. On average, deposits constitute
about 85 percent of total liabilities, most
of them in checking and savings accounts
(60 percent of total deposits). In recent
years, the share of non-deposit funding
to total liabilities has hovered around
13 percent. After a prolonged period of
gradual process of financial de-
dollarization, the process has stalled. As
in the case of deposits, the ratio of
foreign currency denominated credit to
total credit currently stands at about
40 percent (compared to 70 percent in
2000).6
5 Dell’Ariccia, G., D. Igan, L. Laeven, and H. Tong. April 2012. “Policies for Macrofinancial Stability: How to Deal with
Credit Booms” IMF Staff Discussion Note.
6 Owing to limits defined by prudential regulations, banks net open foreign positions are low (there is a net open
position limit of 50 percent of bank capital). Most of foreign currencies denominated loans are directed towards the
agriculture sector, a sector that trades exclusively in dollars.
0.0
0.2
0.4
0.6
0.8
1.0
1.2
0.0
0.2
0.4
0.6
0.8
1.0
1.2
1995 1998 2001 2004 2007 2010 2013
Paraguay: Credit to Deposits Ratio
Source: Central Bank of Paraguay
-50
-40
-30
-20
-10
0
10
20
30
40
50
60
-50
-40
-30
-20
-10
0
10
20
30
40
50
60
1996 1998 2000 2002 2004 2006 2008 2010 2012
Gap 1/ Percent change, y/y
Credit boom threshold 2/
Paraguay: Bank Credit-to-GDP
(In percent)
Sources: Paraguayan Authorities and Fund staff estimates.
1/ The credit-to-GDP GAP is defined as the difference between nominal growth rates of
credit and GDP.
2/ Dell'Ariccia et al. (2012) define a credit boom pisode as a period when the annual growth
rate of credit-to-GDP exceeds 20 percent.
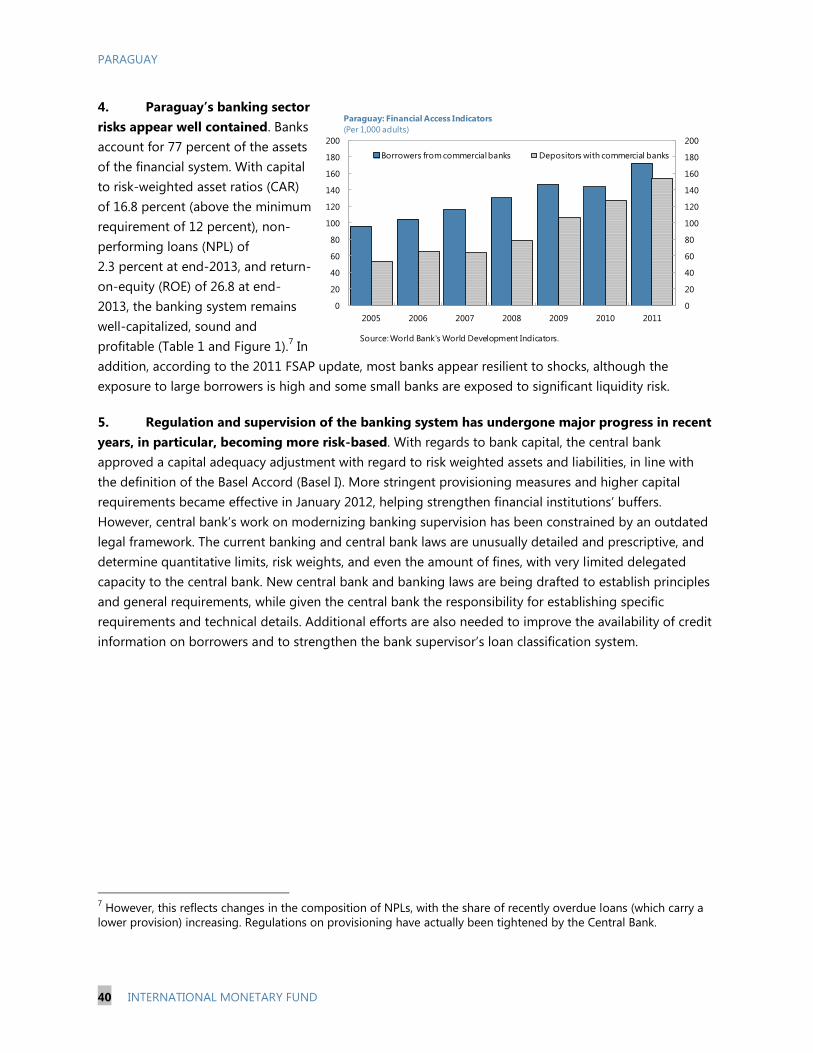
PARAGUAY
40 INTERNATIONAL MONETARY FUND
0
20
40
60
80
100
120
140
160
180
200
0
20
40
60
80
100
120
140
160
180
200
2005 2006 2007 2008 2009 2010 2011
Borrowers from commercial banks Depositors with commercial banks
Paraguay: Financial Access Indicators
(Per 1,000 adults)
Source: World Bank's World Development Indicators.
4. Paraguay’s banking sector
risks appear well contained. Banks
account for 77 percent of the assets
of the financial system. With capital
to risk-weighted asset ratios (CAR)
of 16.8 percent (above the minimum
requirement of 12 percent), non-
performing loans (NPL) of
2.3 percent at end-2013, and return-
on-equity (ROE) of 26.8 at end-
2013, the banking system remains
well-capitalized, sound and
profitable (Table 1 and Figure 1).7 In
addition, according to the 2011 FSAP update, most banks appear resilient to shocks, although the
exposure to large borrowers is high and some small banks are exposed to significant liquidity risk.
5. Regulation and supervision of the banking system has undergone major progress in recent
years, in particular, becoming more risk-based. With regards to bank capital, the central bank
approved a capital adequacy adjustment with regard to risk weighted assets and liabilities, in line with
the definition of the Basel Accord (Basel I). More stringent provisioning measures and higher capital
requirements became effective in January 2012, helping strengthen financial institutions’ buffers.
However, central bank’s work on modernizing banking supervision has been constrained by an outdated
legal framework. The current banking and central bank laws are unusually detailed and prescriptive, and
determine quantitative limits, risk weights, and even the amount of fines, with very limited delegated
capacity to the central bank. New central bank and banking laws are being drafted to establish principles
and general requirements, while given the central bank the responsibility for establishing specific
requirements and technical details. Additional efforts are also needed to improve the availability of credit
information on borrowers and to strengthen the bank supervisor’s loan classification system.
7 However, this reflects changes in the composition of NPLs, with the share of recently overdue loans (which carry a
lower provision) increasing. Regulations on provisioning have actually been tightened by the Central Bank.

PARAGUAY
INTERNATIONAL MONETARY FUND 41
6. Financial deepening has been
accompanied by some financial inclusion.
Mobile money platforms have been an
important tool for spearheading a financial
inclusion process to accompany rapid financial
deepening in Paraguay. At the same time, the
Central Bank of Paraguay with the collaboration
of the World Bank has recently introduced
several programs aimed at expanding access to
financial services and improving consumer’s
financial education. Long-term financial
deepening would be crucial for Paraguay
meeting its large infrastructure and other
developmental needs. Preserving the sustainability of this process will require monitoring the current
credit expansion closely, maintaining banking sector buffers, and continue strengthening financial
supervision.
2007 2008 2009 2010 2011 2012 2013 1/
Capital adequacy and asset quality Regulatory capital to risk-weighted assets 16.9 16.3 16.3 15.4 14.9 16.2 16.8 Nonperforming loans (NPL) to gross loans 1.3 1.1 1.6 1.3 1.7 2.1 2.4 Provisions to nonperforming loans 2/ 78.4 77.7 78.8 74.4 69.1 72.4 69.9
Earnings and Profitability Return on assets (before tax) 3.5 3.9 2.9 2.8 2.7 2.3 2.8 Return on equity (before tax) 30.0 35.6 27.1 27.6 25.7 26.0 26.8
Liquidity Liquid assets to total assets 44.8 36.8 41.0 33.6 32.5 40.5 42.7 Customer deposits to total (noninterbank) loans 173.2 150.8 160.3 131.0 119.0 116.9 122.9
Agricultural distribution of loans to total loans 1/ Agriculture and livestock 36.6 35.7 35.9 32.4 33.0 34.8 34.6 Manufacturing 12.0 11.2 9.3 9.7 9.1 10.0 10.8 Trade 17.4 19.3 19.6 21.1 25.6 23.8 22.9 Services 11.6 10.8 11.5 13.0 8.3 8.7 7.8 Consumer credit 8.4 9.4 10.4 13.1 15.4 15.4 15.9 Financial sector 14.0 13.5 13.1 10.6 8.3 7.0 7.8
Other indicators Foreign-currency-denominated loans to total loans 44.6 42.9 38.5 40.6 43.6 42.3 45.6 Foreign-currency-denominated deposits to total deposits 43.0 44.4 40.3 42.2 39.1 38.8 41.1
Memo items NPL financieras 3/ … … … … 4.3 4.5 5.3 NPL cooperativas 3/ … … … … 4.2 4.3 4.9
Return on equity 3/ Financieras … … … … 17.4 11.9 9.9 Cooperativas … … … … 11.8 12.8 10.9
Sources: Central Bank of Paraguay, IMF FSI database and Fund staff calculations. 1/ For 2013, end-June. 2/ Exclude generic provisions. 3/ For 2013, end-September data.
Paraguay: Selected Financial Soundness Indicators for the Banking Sector (In percent, unless otherwise indicated)
0
5
10
15
20
25
30
0
5
10
15
20
25
30
2002 2004 2006 2008 2010 2012
Total
Consumption
Paraguay: Non-Performing Loans
(In percent of total loans)
Source: Central Bank of Paraguay

PARAGUAY
42 INTERNATIONAL MONETARY FUND
The banking sector has continued to show adequate profitability, liquidity and capitalization in 2013.
0
5
10
15
20
2007 2008 2009 2010 2011 2012 2013
PRY Lat. Am.
Regulatory Capital to Risk-Weighted Assets
(In percent)
0.0
0.5
1.0
1.5
2.0
2.5
3.0
3.5
4.0
4.5
2007 2008 2009 2010 2011 2012 2013
PRY Lat. Am.
Return on Assets
(In percent)
0
5
10
15
20
25
30
35
40
2007 2008 2009 2010 2011 2012 2013
PRY Lat. Am.
Return on Equity
(In percent)
0.0
0.5
1.0
1.5
2.0
2.5
3.0
3.5
4.0
2007 2008 2009 2010 2011 2012 2013
PRY Lat. Am.
Nonperforming Loans to Total Loans
(In percent)
0
50
100
150
200
250
2007 2008 2009 2010 2011 2012 2013
PRY Lat. Am.
Provisions to Nonperforming Loans
(In percent)
Figure A1.1. Paraguay: Banking System Indicators 1/
Sources: Paraguayan Authorities; IMF Financial Indicators; and Fund staff estimates.
1/ End of period data. Data for 2013 corresponds to latest available observation. Regional
aggregates correspond to median values of Argentina, Brazil, Chile, Colombia, Costa Rica, Ecuador,
Mexico, and Peru.
Capital adequacy remains above the regulatory
requirement, and in line with regional levels.
Bank profitability has declined as compared to previous year, but still is among the highest in the region.
After increasing in 2008, NPLs have remained relatively
stable...
Banks in paraguay remain liquid and well capitalized.
...and provisons are declining despite a tightening in their
regulation. .
0
10
20
30
40
50
60
2007 2008 2009 2010 2011 2012 2013
PRY Lat. Am.
Liquid Assets to Total Assets
(In percent)

PARAGUAY
INTERNATIONAL MONETARY FUND 43
Annex II. Assessing Paraguay’s Potential Growth over the Medium Term1
1. The assessment of Paraguay’s long-run potential output growth builds on a standard growth
accounting exercise.2 Specifically, the following Cobb-Douglas production function is estimated:
where is total output, is a technology parameter or TFP, and denote the capital stock and labor
inputs, respectively, and α is the share of capital income in total output (assumed to be 0.3).
2. In this setting, the capital stock evolves according to the following law of motion:
where It is total investment and δ is the depreciation rate of the capital stock. This methodology requires
the estimation of Paraguay’s capital stock.
3. To estimate the capital stock an initial condition is required, which is obtained from the following
steady state relation,
where g is the long-run growth rate of the capital stock. The capital stock of the year 1962,
, is set as the initial condition for the model. Specifically, this is obtained from Eq. (3) using
investment figures for the year 1962, , and setting δ=0.08—a capital depreciation rate of 8 percent
per year—and g is set to 4.2 percent—the average GDP growth rate over the last 60 years, equal to 4.06
percent.3 Over the long run (in the steady state), the growth rate of the capital stock and GDP should
coincide. The capital stock later evolves according to Eq. (2).
4. Results show that over the medium term, maintaining the growth rates in potential GDP of about
5 percent observed in the last five years will require:
Growth of physical capital is expected to accelerate somewhat, reflecting a pickup in investment
of around 3.6 percentage points of GDP between 2013 and 2018—driven primarily by higher
foreign and private domestic investment.
The young labor force is envisaged to continue growing at around 3 percent, with labor continue
to be the main driver for economic growth.
1 Prepared by J. Yepez
2 Based on Acosta-Ormaechea, S. Paraguay—Potential Output Growth and Spillovers from Agriculture, Selected Issues
Paper, Chapter I, 2011, IMF Country Report No. 11/239.
3 The depreciation rate for the capital stock was taken from Fernández Valdovinos, C. and Monge Naranjo, A.
Economic Growth in Paraguay, Economic and Social Study Series, Inter-American Development Bank (May 2004).
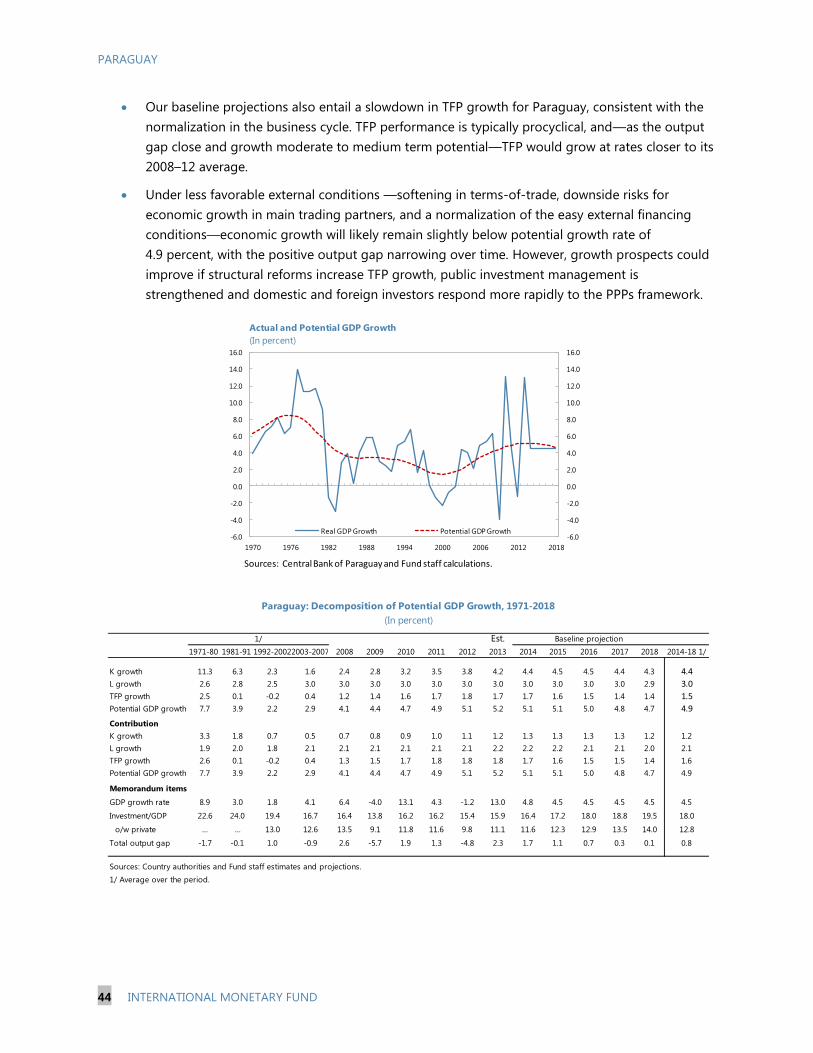
PARAGUAY
44 INTERNATIONAL MONETARY FUND
-6.0
-4.0
-2.0
0.0
2.0
4.0
6.0
8.0
10.0
12.0
14.0
16.0
-6.0
-4.0
-2.0
0.0
2.0
4.0
6.0
8.0
10.0
12.0
14.0
16.0
1970 1976 1982 1988 1994 2000 2006 2012 2018
Actual and Potential GDP Growth
(In percent)
Real GDP Growth Potential GDP Growth
Sources: Central Bank of Paraguay and Fund staff calculations.
Est.
1971-80 1981-91 1992-20022003-2007 2008 2009 2010 2011 2012 2013 2014 2015 2016 2017 2018 2014-18 1/
K growth 11.3 6.3 2.3 1.6 2.4 2.8 3.2 3.5 3.8 4.2 4.4 4.5 4.5 4.4 4.3 4.4
L growth 2.6 2.8 2.5 3.0 3.0 3.0 3.0 3.0 3.0 3.0 3.0 3.0 3.0 3.0 2.9 3.0
TFP growth 2.5 0.1 -0.2 0.4 1.2 1.4 1.6 1.7 1.8 1.7 1.7 1.6 1.5 1.4 1.4 1.5
Potential GDP growth 7.7 3.9 2.2 2.9 4.1 4.4 4.7 4.9 5.1 5.2 5.1 5.1 5.0 4.8 4.7 4.9
Contribution
K growth 3.3 1.8 0.7 0.5 0.7 0.8 0.9 1.0 1.1 1.2 1.3 1.3 1.3 1.3 1.2 1.2
L growth 1.9 2.0 1.8 2.1 2.1 2.1 2.1 2.1 2.1 2.2 2.2 2.2 2.1 2.1 2.0 2.1
TFP growth 2.6 0.1 -0.2 0.4 1.3 1.5 1.7 1.8 1.8 1.8 1.7 1.6 1.5 1.5 1.4 1.6
Potential GDP growth 7.7 3.9 2.2 2.9 4.1 4.4 4.7 4.9 5.1 5.2 5.1 5.1 5.0 4.8 4.7 4.9
Memorandum items
GDP growth rate 8.9 3.0 1.8 4.1 6.4 -4.0 13.1 4.3 -1.2 13.0 4.8 4.5 4.5 4.5 4.5 4.5
Investment/GDP 22.6 24.0 19.4 16.7 16.4 13.8 16.2 16.2 15.4 15.9 16.4 17.2 18.0 18.8 19.5 18.0
o/w private … … 13.0 12.6 13.5 9.1 11.8 11.6 9.8 11.1 11.6 12.3 12.9 13.5 14.0 12.8
Total output gap -1.7 -0.1 1.0 -0.9 2.6 -5.7 1.9 1.3 -4.8 2.3 1.7 1.1 0.7 0.3 0.1 0.8
Sources: Country authorities and Fund staff estimates and projections.
1/ Average over the period.
Baseline projection1/
Paraguay: Decomposition of Potential GDP Growth, 1971-2018
(In percent)
Our baseline projections also entail a slowdown in TFP growth for Paraguay, consistent with the
normalization in the business cycle. TFP performance is typically procyclical, and—as the output
gap close and growth moderate to medium term potential—TFP would grow at rates closer to its
2008–12 average.
Under less favorable external conditions —softening in terms-of-trade, downside risks for
economic growth in main trading partners, and a normalization of the easy external financing
conditions—economic growth will likely remain slightly below potential growth rate of
4.9 percent, with the positive output gap narrowing over time. However, growth prospects could
improve if structural reforms increase TFP growth, public investment management is
strengthened and domestic and foreign investors respond more rapidly to the PPPs framework.
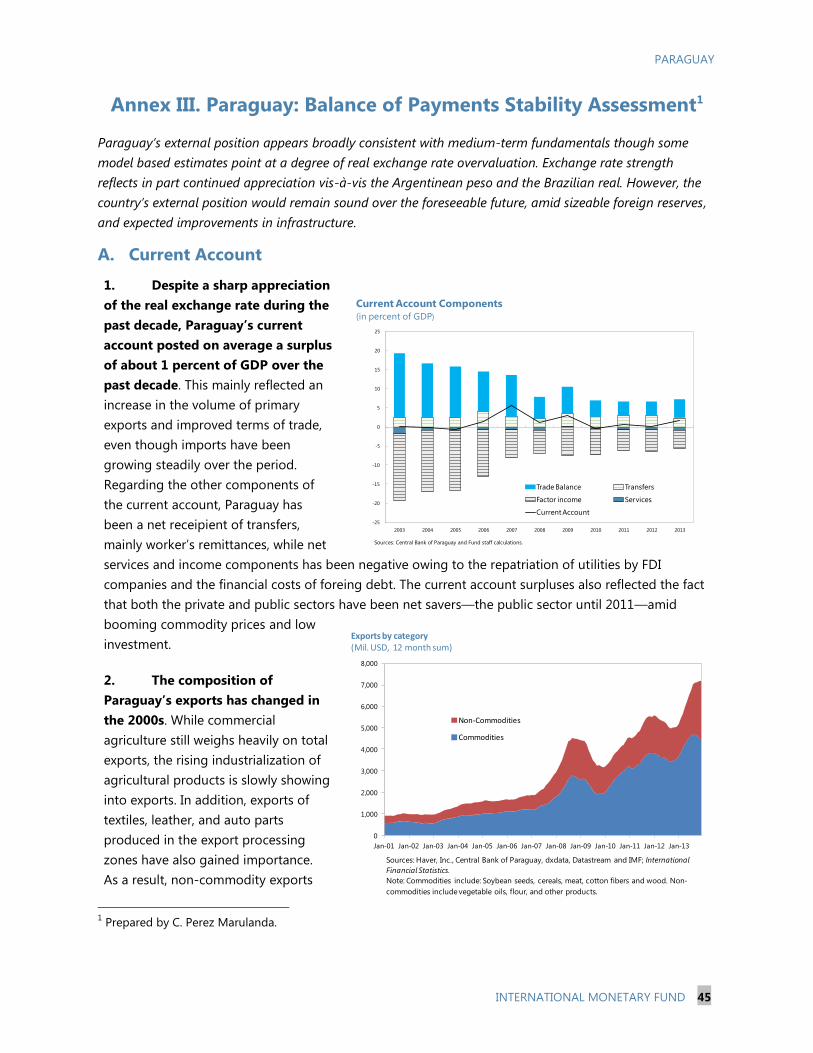
PARAGUAY
INTERNATIONAL MONETARY FUND 45
Annex III. Paraguay: Balance of Payments Stability Assessment1
Paraguay’s external position appears broadly consistent with medium-term fundamentals though some
model based estimates point at a degree of real exchange rate overvaluation. Exchange rate strength
reflects in part continued appreciation vis-à-vis the Argentinean peso and the Brazilian real. However, the
country’s external position would remain sound over the foreseeable future, amid sizeable foreign reserves,
and expected improvements in infrastructure.
A. Current Account
1. Despite a sharp appreciation
of the real exchange rate during the
past decade, Paraguay’s current
account posted on average a surplus
of about 1 percent of GDP over the
past decade. This mainly reflected an
increase in the volume of primary
exports and improved terms of trade,
even though imports have been
growing steadily over the period.
Regarding the other components of
the current account, Paraguay has
been a net receipient of transfers,
mainly worker’s remittances, while net
services and income components has been negative owing to the repatriation of utilities by FDI
companies and the financial costs of foreing debt. The current account surpluses also reflected the fact
that both the private and public sectors have been net savers—the public sector until 2011—amid
booming commodity prices and low
investment.
2. The composition of
Paraguay’s exports has changed in
the 2000s. While commercial
agriculture still weighs heavily on total
exports, the rising industrialization of
agricultural products is slowly showing
into exports. In addition, exports of
textiles, leather, and auto parts
produced in the export processing
zones have also gained importance.
As a result, non-commodity exports
1 Prepared by C. Perez Marulanda.
-25
-20
-15
-10
-5
0
5
10
15
20
25
2003 2004 2005 2006 2007 2008 2009 2010 2011 2012 2013
Trade Balance Transfers
Factor income Services
Current Account
Current Account Components
(in percent of GDP)
Sources: Central Bank of Paraguay and Fund staff calculations.
0
1,000
2,000
3,000
4,000
5,000
6,000
7,000
8,000
Jan-01 Jan-02 Jan-03 Jan-04 Jan-05 Jan-06 Jan-07 Jan-08 Jan-09 Jan-10 Jan-11 Jan-12 Jan-13
Non-Commodities
Commodities
Exports by category(Mil. USD, 12 month sum)
Sources: Haver, Inc., Central Bank of Paraguay, dxdata, Datastream and IMF; International
Financial Statistics.
Note: Commodities include: Soybean seeds, cereals, meat, cotton fibers and wood. Non-
commodities include vegetable oils, flour, and other products.

PARAGUAY
46 INTERNATIONAL MONETARY FUND
-3
-2
-1
0
1
2
3
4
5
6
-3
-2
-1
0
1
2
3
4
5
6
Terms of trade growth Trading partners import
growth
US 10y yield
2009-2013
2014-2018
Paraguay: External Headwinds(in percent; period average)
Sources: WEO, National authorities and Fund staff estimates.
2014 2015 2016 2017 2018
Gross Financing Needs 3.3 3.0 2.7 2.7 2.8
Non interest current account deficit 0.5 0.5 0.3 0.4 0.6
Amortizations 2.4 2.2 2.1 1.9 1.8
Interest payments 1/ 0.3 0.3 0.3 0.3 0.4
Memo Item
FDI 1.7 1.9 2.2 2.6 2.9
Source: Fund staff estimates .
1/Excludes interest payments of binational companies
Paraguay: Medium Term External Gross Financing Needs
(in percent of GDP)
Proj.
increased from 7.7 percent to 12 percent of non agro GDP between 2003 and 2013. Mercosur countries,
in particular Brazil, remain Paraguay’s main trading partners, but their share in total exports has declined
in the past years, while other regions, such as the
European Union, the United States and Russia,
have gained importance. Finally, Paraguay has
also increased its share in global exports markets
during the past decade.
3. The current account balance is
expected to switch to a deficit of about
1 percent of GDP over the medium term
under the baseline scenario and the current
level of the real exchange rate. This weakening
is mainly attributed to a slight deterioration in
the terms of trade and rising import volumes.
The latter is associated with an expected increase
in FDI inflows, mainly into the
agricultural and export oriented
manufacturing sectors, to take
advantage of recent government
reforms and relatively lower cost
than other countries in the region.
The current account balance also
reflects the fact that the private
sector’s net saver position would
narrow due to rising investment
through 2018, though this is in part
offset by increased public sector
savings as fiscal settings are
tightened in the near term consistent
with the requirements of the
new fiscal responsibility law. In
addition, external gross
financing needs are expected to
remain within reasonable levels
in the medium term and
covered to a great extent by
FDI.
0.03
0.03
0.03
0.04
0.04
0.05
2003 2004 2005 2006 2007 2008 2009 2010 2011 2012
Share of World exports(In percent of World exports)
Sources: International Financial Statistics and Fund staff calculations.
.
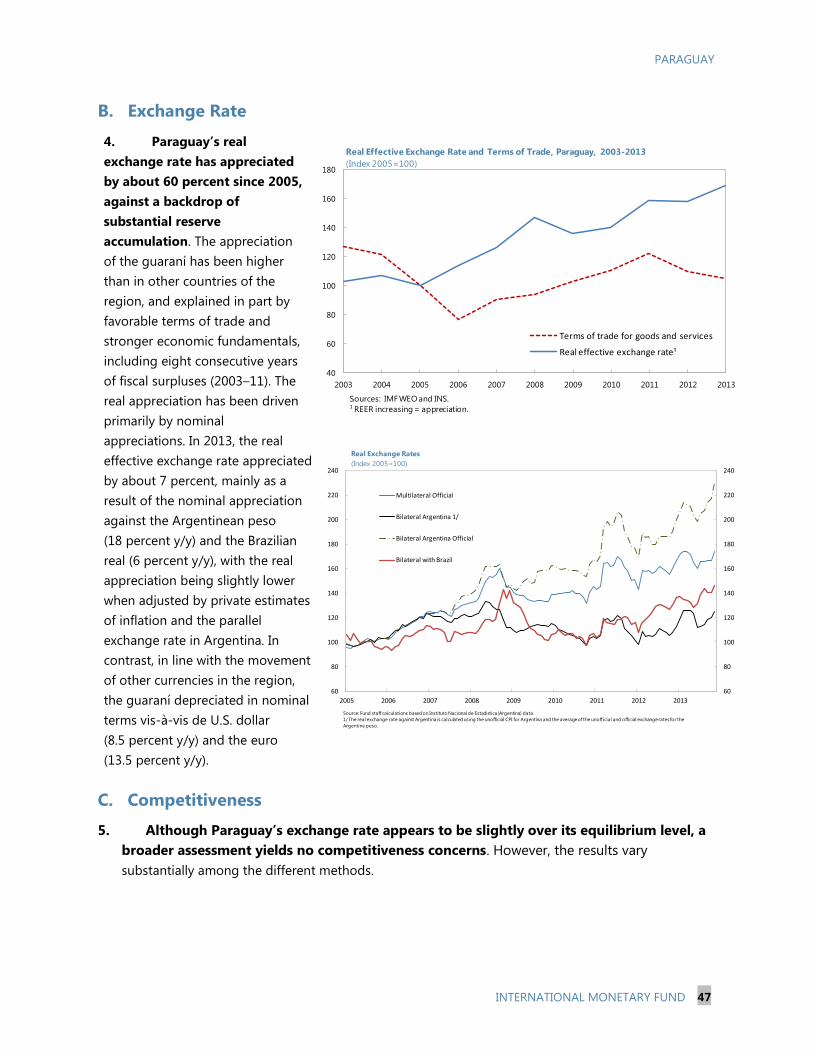
PARAGUAY
INTERNATIONAL MONETARY FUND 47
B. Exchange Rate
4. Paraguay’s real
exchange rate has appreciated
by about 60 percent since 2005,
against a backdrop of
substantial reserve
accumulation. The appreciation
of the guaraní has been higher
than in other countries of the
region, and explained in part by
favorable terms of trade and
stronger economic fundamentals,
including eight consecutive years
of fiscal surpluses (2003–11). The
real appreciation has been driven
primarily by nominal
appreciations. In 2013, the real
effective exchange rate appreciated
by about 7 percent, mainly as a
result of the nominal appreciation
against the Argentinean peso
(18 percent y/y) and the Brazilian
real (6 percent y/y), with the real
appreciation being slightly lower
when adjusted by private estimates
of inflation and the parallel
exchange rate in Argentina. In
contrast, in line with the movement
of other currencies in the region,
the guaraní depreciated in nominal
terms vis-à-vis de U.S. dollar
(8.5 percent y/y) and the euro
(13.5 percent y/y).
C. Competitiveness
5. Although Paraguay’s exchange rate appears to be slightly over its equilibrium level, a
broader assessment yields no competitiveness concerns. However, the results vary
substantially among the different methods.
60
80
100
120
140
160
180
200
220
240
60
80
100
120
140
160
180
200
220
240
2005 2006 2007 2008 2009 2010 2011 2012 2013
Real Exchange Rates
(Index 2005=100)
Multilateral Official
Bilateral Argentina 1/
Bilateral Argentina Official
Bilateral with Brazil
Source: Fund staff calculations based on Instituto Nacional de Estadistica (Argentina) data.
1/ The real exchange rate against Argentina is calculated using the unofficial CPI for Argentina and the average of the unofficial and official exchange rates for the
Argentine peso.
40
60
80
100
120
140
160
180
2003 2004 2005 2006 2007 2008 2009 2010 2011 2012 2013
Terms of trade for goods and services
Real effective exchange rate¹
Sources: IMF WEO and INS.
¹ REER increasing = appreciation.
Real Effective Exchange Rate and Terms of Trade, Paraguay, 2003-2013
(Index 2005=100)

PARAGUAY
48 INTERNATIONAL MONETARY FUND
CGER Methodology (October WEO data)
CA/GDP Norm
Macrobalance approach -1.8 -3.0
External sustainability approach 2.3
Equilibrium REER 24.6
* A positive sign indicates an overvaluation
Paraguay Exchange Rate Assessment *
Sources: IMF, and Fund staff estimates.
-40
-20
0
20
40
60
80
-40
-20
0
20
40
60
80
MB ERER ES
Paraguay: 90 Percent Confidence Intervals
-25
-20
-15
-10
-5
0
5
10
15
20
25
-30
-25
-20
-15
-10
-5
0
5
10
15
20
2003Q2 2004Q3 2005Q4 2007Q1 2008Q2 2009Q3 2010Q4 2012Q1 2013Q2
Relative price competetiveness (positive value indicates ER overvaluation)
External Price Competitiveness(Percent, deviation from average 2003-2013)
Sources: Haver Analytics, Central Bank of Paraguay, and Fund staff calculations.
-40
-30
-20
-10
0
10
20
-30
-25
-20
-15
-10
-5
0
5
10
15
20
25
2005Q1 2006Q1 2007Q1 2008Q1 2009Q1 2010Q1 2011Q1 2012Q1 2013Q1
Substitution ratio (negative values indicate loss of export market position)
External Volume Competitiveness(Percent, deviation from average 2005-2013)
Sources: Haver Analytics, Central Bank of Paraguay, and Fund staff calculations.
CGER Assessment
6. Under the CGER methodologies, the guaraní appears to be slightly above equilibrium
on average by about 8 percent, mostly due to the results under the equilibrium real exchange
rate methodology :
The macroeconomic balance approach (MB)
suggests that the current account deficit
norm is -1.8 percent of GDP, while the
projected underlying current account balance
is -0.4 percent of GDP. The implied result is that the
real exchange rate is slightly undervalued by just
3 percent. However, this result is not statistically
significant.
The external sustainability approach (ES) points that
the net foreign asset (NFA) position, as measured
by the net international investment position, would
stabilize with a current account deficit norm of
0.2 percent. This suggests that the REER is slightly
above equilibrium by only about 2 percent.
Under the equilibrium real exchange rate
methodology (ERER), estimated as a function of
medium-term fundamentals (terms of trade, NFA,
public expenditure, FDI and productivity), the
guaraní appears to be significantly above
equilibrium by 25 percent. However, the
estimated deviation from equilibrium has a high
degree of uncertainty given the wide range of
the confidence interval.
Other Assessments
7. Relative prices and market shares indicators
were also used to assess Paraguay’s
competitiveness. Changes in market shares for
the country’s primary products in major export
markets are measured through the evolution of the
substitution ratio of Paraguayan vs. domestic
products sold in export markets. Changes in
relative prices are measured with respect to local
producer prices in export markets. These
indicators are compared with their respective
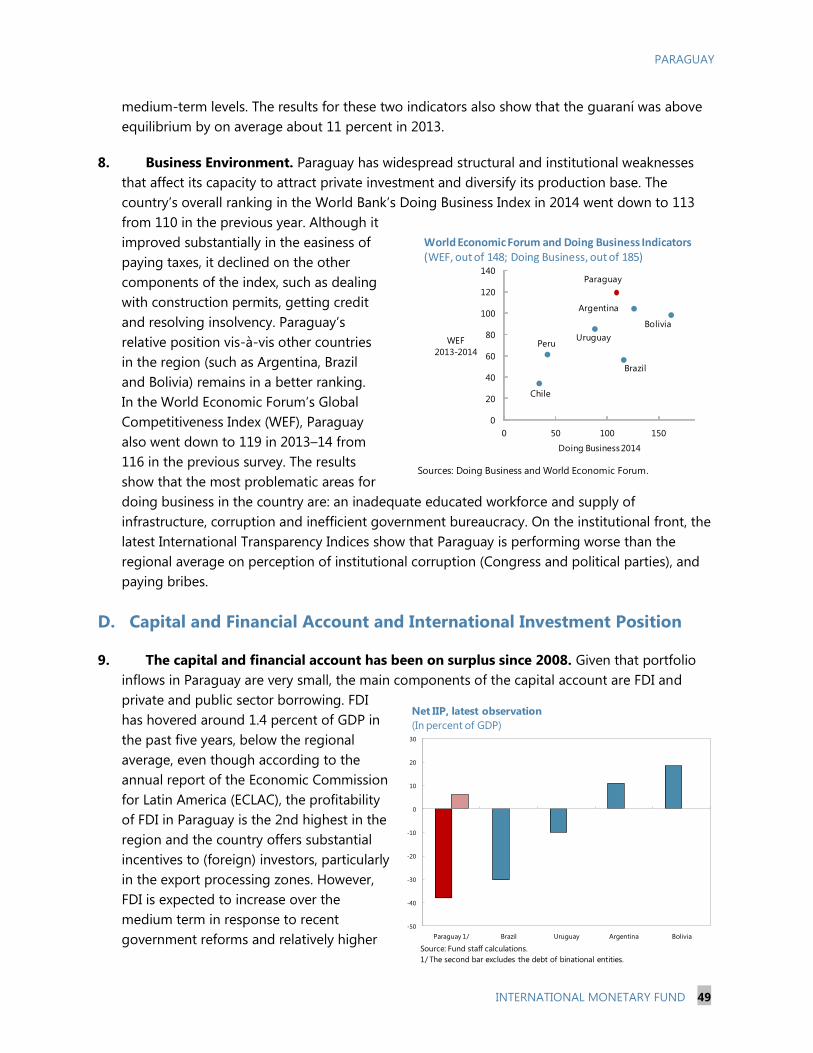
PARAGUAY
INTERNATIONAL MONETARY FUND 49
medium-term levels. The results for these two indicators also show that the guaraní was above
equilibrium by on average about 11 percent in 2013.
8. Business Environment. Paraguay has widespread structural and institutional weaknesses
that affect its capacity to attract private investment and diversify its production base. The
country’s overall ranking in the World Bank’s Doing Business Index in 2014 went down to 113
from 110 in the previous year. Although it
improved substantially in the easiness of
paying taxes, it declined on the other
components of the index, such as dealing
with construction permits, getting credit
and resolving insolvency. Paraguay’s
relative position vis-à-vis other countries
in the region (such as Argentina, Brazil
and Bolivia) remains in a better ranking.
In the World Economic Forum’s Global
Competitiveness Index (WEF), Paraguay
also went down to 119 in 2013–14 from
116 in the previous survey. The results
show that the most problematic areas for
doing business in the country are: an inadequate educated workforce and supply of
infrastructure, corruption and inefficient government bureaucracy. On the institutional front, the
latest International Transparency Indices show that Paraguay is performing worse than the
regional average on perception of institutional corruption (Congress and political parties), and
paying bribes.
D. Capital and Financial Account and International Investment Position
9. The capital and financial account has been on surplus since 2008. Given that portfolio
inflows in Paraguay are very small, the main components of the capital account are FDI and
private and public sector borrowing. FDI
has hovered around 1.4 percent of GDP in
the past five years, below the regional
average, even though according to the
annual report of the Economic Commission
for Latin America (ECLAC), the profitability
of FDI in Paraguay is the 2nd highest in the
region and the country offers substantial
incentives to (foreign) investors, particularly
in the export processing zones. However,
FDI is expected to increase over the
medium term in response to recent
government reforms and relatively higher -50
-40
-30
-20
-10
0
10
20
30
Paraguay 1/ Brazil Uruguay Argentina Bolivia
Net IIP, latest observation
(In percent of GDP)
Source: Fund staff calculations.
1/ The second bar excludes the debt of binational entities.
Sources: Doing Business and World Economic Forum.
0
20
40
60
80
100
120
140
0 50 100 150
WEF
2013-2014
Doing Business 2014
Bolivia
Paraguay
Chile
Brazil
PeruUruguay
Argentina
World Economic Forum and Doing Business Indicators(WEF, out of 148; Doing Business, out of 185)

PARAGUAY
50 INTERNATIONAL MONETARY FUND
production cost in other countries in the region. Among the sectors that are attracting FDI are:
agricultural, metallurgic, and maquila or export processing zones (clothing, shoes and auto
parts).
10. The net international investment position (IIP) has been improving in the past years.
As of 2012, the net position of the IIP was negative equivalent to 37 percent of GDP, compared
to a negative position of 153 percent of GDP in 2005. It is important to highlight that the main
cause of the negative position is the debt of the two binational electricity companies that was
included as a net liability after a change in the national accounts methodology. The stock of this
debt is estimated at US$9 billion (35% of GDP) for 2013. The debt has been declining mainly
because Itaipu’s debt has been repaid by the Paraguayan government with the procedures of
the energy sold to Brazil and is expected to be expire by 2023.
E. Reserve Adequacy
11. Paraguay’s reserve position is within
the suggested adequacy rate. Net
international reserves reached US$5.9
billion at the end- December 2013, an
increase of $0.8 billion from end-2012.
Using the composite reserve adequacy
metric (100–150 percent), the actual level
of reserves is above the recommended
range. For the medium term, the projection
indicates that reserves will cover around 4
months of imports.
0
1
2
3
4
5
6
7
8
0
1
2
3
4
5
6
7
8
2005 2006 2007 2008 2009 2010 2011 2012 2013
Reserve Adequacy ARA Metric(In billions of U.S. dollars)
IMF metric
Gross International
Reserves
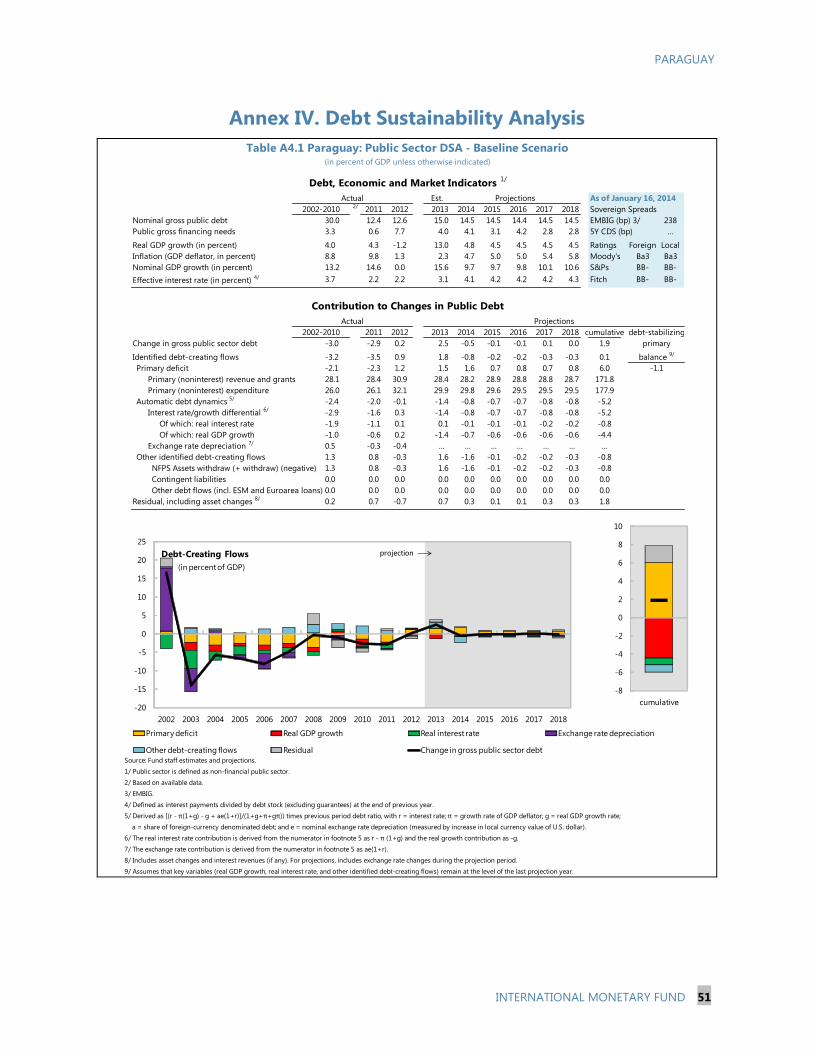
PARAGUAY
INTERNATIONAL MONETARY FUND 51
Annex IV. Debt Sustainability Analysis
Est. As of January 16, 20142/
2011 2012 2013 2014 2015 2016 2017 2018 Sovereign Spreads
Nominal gross public debt 30.0 12.4 12.6 15.0 14.5 14.5 14.4 14.5 14.5 EMBIG (bp) 3/ 238
Public gross financing needs 3.3 0.6 7.7 4.0 4.1 3.1 4.2 2.8 2.8 5Y CDS (bp) …
Real GDP growth (in percent) 4.0 4.3 -1.2 13.0 4.8 4.5 4.5 4.5 4.5 Ratings Foreign Local
Inflation (GDP deflator, in percent) 8.8 9.8 1.3 2.3 4.7 5.0 5.0 5.4 5.8 Moody's Ba3 Ba3
Nominal GDP growth (in percent) 13.2 14.6 0.0 15.6 9.7 9.7 9.8 10.1 10.6 S&Ps BB- BB-
Effective interest rate (in percent) 4/ 3.7 2.2 2.2 3.1 4.1 4.2 4.2 4.2 4.3 Fitch BB- BB-
2011 2012 2013 2014 2015 2016 2017 2018 cumulative
Change in gross public sector debt -3.0 -2.9 0.2 2.5 -0.5 -0.1 -0.1 0.1 0.0 1.9
Identified debt-creating flows -3.2 -3.5 0.9 1.8 -0.8 -0.2 -0.2 -0.3 -0.3 0.1
Primary deficit -2.1 -2.3 1.2 1.5 1.6 0.7 0.8 0.7 0.8 6.0
Primary (noninterest) revenue and grants 28.1 28.4 30.9 28.4 28.2 28.9 28.8 28.8 28.7 171.8
Primary (noninterest) expenditure 26.0 26.1 32.1 29.9 29.8 29.6 29.5 29.5 29.5 177.9
Automatic debt dynamics 5/
-2.4 -2.0 -0.1 -1.4 -0.8 -0.7 -0.7 -0.8 -0.8 -5.2
Interest rate/growth differential 6/
-2.9 -1.6 0.3 -1.4 -0.8 -0.7 -0.7 -0.8 -0.8 -5.2
Of which: real interest rate -1.9 -1.1 0.1 0.1 -0.1 -0.1 -0.1 -0.2 -0.2 -0.8
Of which: real GDP growth -1.0 -0.6 0.2 -1.4 -0.7 -0.6 -0.6 -0.6 -0.6 -4.4
Exchange rate depreciation 7/
0.5 -0.3 -0.4 … … … … … … …
Other identified debt-creating flows 1.3 0.8 -0.3 1.6 -1.6 -0.1 -0.2 -0.2 -0.3 -0.8
NFPS Assets withdraw (+ withdraw) (negative) 1.3 0.8 -0.3 1.6 -1.6 -0.1 -0.2 -0.2 -0.3 -0.8
Contingent liabilities 0.0 0.0 0.0 0.0 0.0 0.0 0.0 0.0 0.0 0.0
Other debt flows (incl. ESM and Euroarea loans) 0.0 0.0 0.0 0.0 0.0 0.0 0.0 0.0 0.0 0.0
Residual, including asset changes 8/
0.2 0.7 -0.7 0.7 0.3 0.1 0.1 0.3 0.3 1.8
Source: Fund staff estimates and projections.
1/ Public sector is defined as non-financial public sector.
2/ Based on available data.
3/ EMBIG.
4/ Defined as interest payments divided by debt stock (excluding guarantees) at the end of previous year.
5/ Derived as [(r - π(1+g) - g + ae(1+r)]/(1+g+π+gπ)) times previous period debt ratio, with r = interest rate; π = growth rate of GDP deflator; g = real GDP growth rate;
a = share of foreign-currency denominated debt; and e = nominal exchange rate depreciation (measured by increase in local currency value of U.S. dollar).
6/ The real interest rate contribution is derived from the numerator in footnote 5 as r - π (1+g) and the real growth contribution as -g.
7/ The exchange rate contribution is derived from the numerator in footnote 5 as ae(1+r).
8/ Includes asset changes and interest revenues (if any). For projections, includes exchange rate changes during the projection period.
9/ Assumes that key variables (real GDP growth, real interest rate, and other identified debt-creating flows) remain at the level of the last projection year.
Table A4.1 Paraguay: Public Sector DSA - Baseline Scenario
-1.1
balance 9/
primary
(in percent of GDP unless otherwise indicated)
Debt, Economic and Market Indicators 1/
2002-2010
Actual
Contribution to Changes in Public Debt
Projections
2002-2010
Actual
debt-stabilizing
Projections
-20
-15
-10
-5
0
5
10
15
20
25
2002 2003 2004 2005 2006 2007 2008 2009 2010 2011 2012 2013 2014 2015 2016 2017 2018
Debt-Creating Flows
Primary deficit Real GDP growth Real interest rate Exchange rate depreciation
Other debt-creating flows Residual Change in gross public sector debt
projection
(in percent of GDP)
-8
-6
-4
-2
0
2
4
6
8
10
cumulative
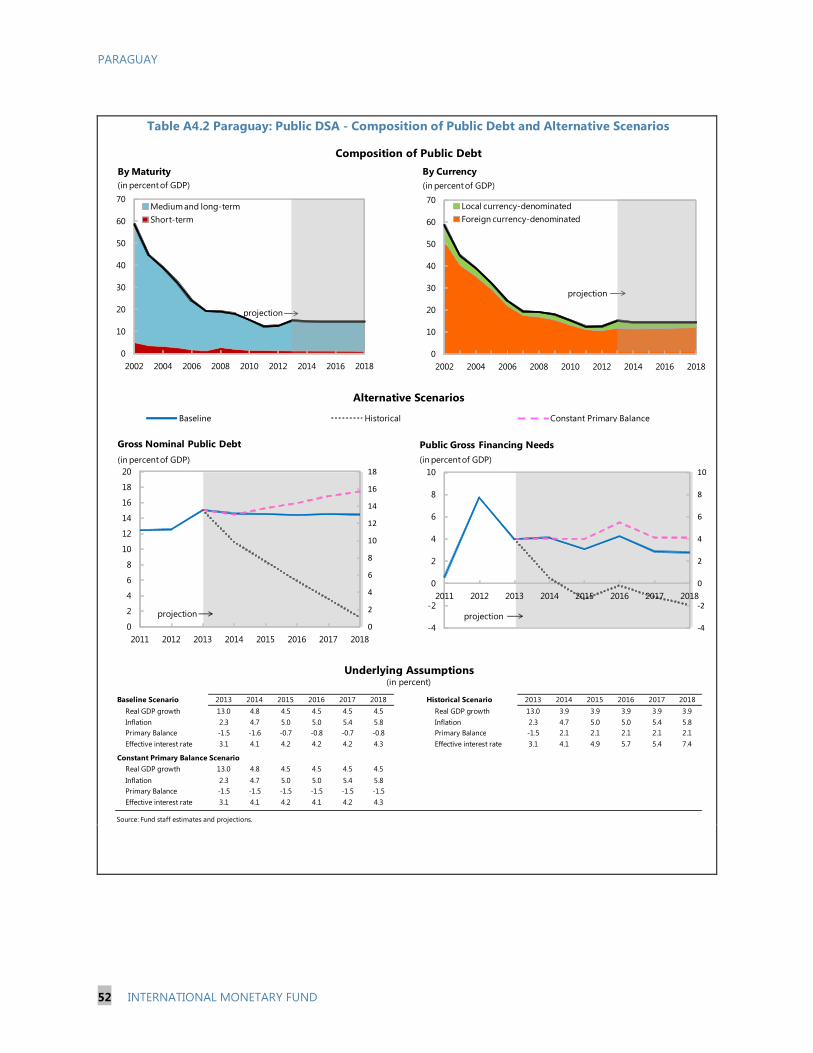
PARAGUAY
52 INTERNATIONAL MONETARY FUND
Baseline Scenario 2013 2014 2015 2016 2017 2018 Historical Scenario 2013 2014 2015 2016 2017 2018
Real GDP growth 13.0 4.8 4.5 4.5 4.5 4.5 Real GDP growth 13.0 3.9 3.9 3.9 3.9 3.9
Inflation 2.3 4.7 5.0 5.0 5.4 5.8 Inflation 2.3 4.7 5.0 5.0 5.4 5.8
Primary Balance -1.5 -1.6 -0.7 -0.8 -0.7 -0.8 Primary Balance -1.5 2.1 2.1 2.1 2.1 2.1
Effective interest rate 3.1 4.1 4.2 4.2 4.2 4.3 Effective interest rate 3.1 4.1 4.9 5.7 5.4 7.4
Constant Primary Balance Scenario
Real GDP growth 13.0 4.8 4.5 4.5 4.5 4.5
Inflation 2.3 4.7 5.0 5.0 5.4 5.8
Primary Balance -1.5 -1.5 -1.5 -1.5 -1.5 -1.5
Effective interest rate 3.1 4.1 4.2 4.1 4.2 4.3
Source: Fund staff estimates and projections.
Underlying Assumptions(in percent)
Table A4.2 Paraguay: Public DSA - Composition of Public Debt and Alternative Scenarios
Alternative Scenarios
Composition of Public Debt
Baseline Historical Constant Primary Balance
0
2
4
6
8
10
12
14
16
18
0
2
4
6
8
10
12
14
16
18
20
2011 2012 2013 2014 2015 2016 2017 2018
Gross Nominal Public Debt
(in percent of GDP)
projection
-4
-2
0
2
4
6
8
10
-4
-2
0
2
4
6
8
10
2011 2012 2013 2014 2015 2016 2017 2018
Public Gross Financing Needs
(in percent of GDP)
projection
0
10
20
30
40
50
60
70
2002 2004 2006 2008 2010 2012 2014 2016 2018
By Maturity
Medium and long-term
Short-term
projection
(in percent of GDP)
0
10
20
30
40
50
60
70
2002 2004 2006 2008 2010 2012 2014 2016 2018
By Currency
Local currency-denominated
Foreign currency-denominated
projection
(in percent of GDP)
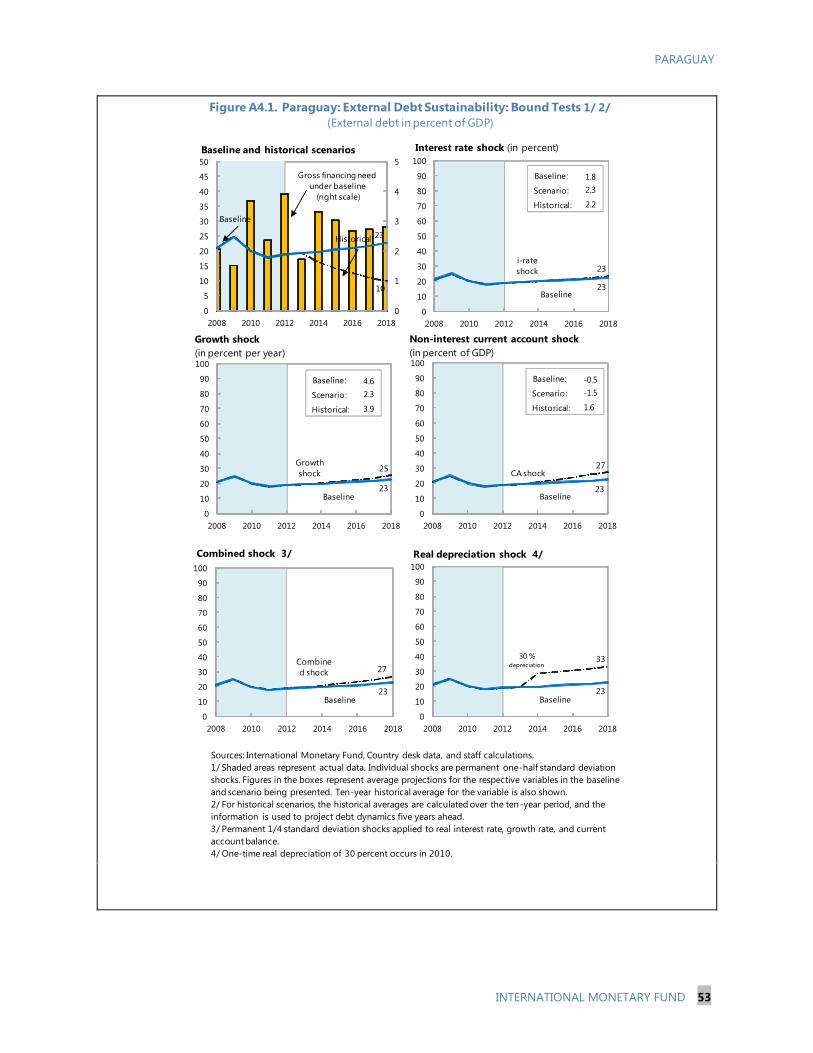
PARAGUAY
INTERNATIONAL MONETARY FUND 53
i-rate
shock 23
Baseline23
0
10
20
30
40
50
60
70
80
90
100
2008 2010 2012 2014 2016 2018
Interest rate shock (in percent)
Figure A4.1. Paraguay: External Debt Sustainability: Bound Tests 1/ 2/
(External debt in percent of GDP)
Sources: International Monetary Fund, Country desk data, and staff calculations.
1/ Shaded areas represent actual data. Individual shocks are permanent one-half standard deviation
shocks. Figures in the boxes represent average projections for the respective variables in the baseline
and scenario being presented. Ten-year historical average for the variable is also shown.
2/ For historical scenarios, the historical averages are calculated over the ten-year period, and the
information is used to project debt dynamics five years ahead.
3/ Permanent 1/4 standard deviation shocks applied to real interest rate, growth rate, and current
account balance.
4/ One-time real depreciation of 30 percent occurs in 2010.
Historical
10
Baseline
23
0
1
2
3
4
5
0
5
10
15
20
25
30
35
40
45
50
2008 2010 2012 2014 2016 2018
Baseline and historical scenarios
CA shock 27
Baseline23
0
10
20
30
40
50
60
70
80
90
100
2008 2010 2012 2014 2016 2018
Combine
d shock 27
Baseline23
0
10
20
30
40
50
60
70
80
90
100
2008 2010 2012 2014 2016 2018
Combined shock 3/
30 % depreciation
33
Baseline23
0
10
20
30
40
50
60
70
80
90
100
2008 2010 2012 2014 2016 2018
Real depreciation shock 4/
Gross financing need
under baseline
(right scale)
Non-interest current account shock
(in percent of GDP)
Growth
shock 25
Baseline23
0
10
20
30
40
50
60
70
80
90
100
2008 2010 2012 2014 2016 2018
Baseline:
Scenario:
Historical:
1.8
2.3
2.2
Baseline:
Scenario:
Historical:
4.6
2.3
3.9
Baseline:
Scenario:
Historical:
-0.5
-1.5
1.6
Growth shock
(in percent per year)
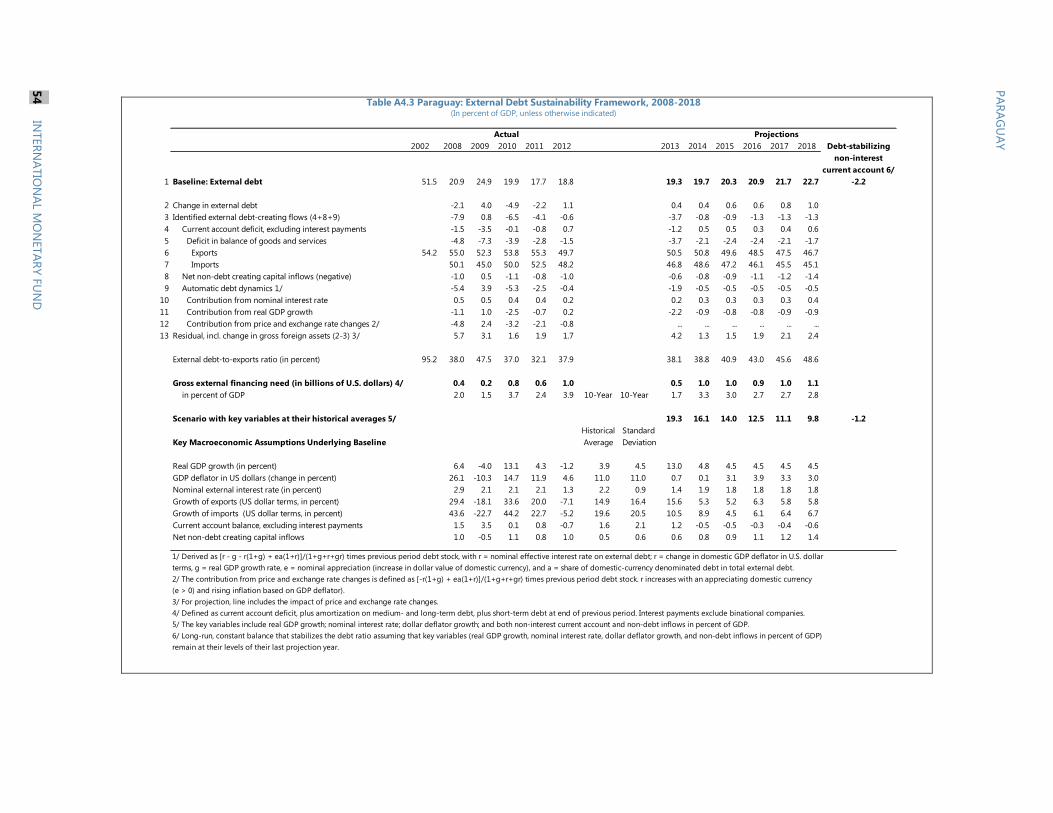
Projections
2002 2008 2009 2010 2011 2012 2013 2014 2015 2016 2017 2018 Debt-stabilizing
non-interest
current account 6/
1 Baseline: External debt 51.5 20.9 24.9 19.9 17.7 18.8 19.3 19.7 20.3 20.9 21.7 22.7 -2.2
2 Change in external debt -2.1 4.0 -4.9 -2.2 1.1 0.4 0.4 0.6 0.6 0.8 1.0
3 Identified external debt-creating flows (4+8+9) -7.9 0.8 -6.5 -4.1 -0.6 -3.7 -0.8 -0.9 -1.3 -1.3 -1.3
4 Current account deficit, excluding interest payments -1.5 -3.5 -0.1 -0.8 0.7 -1.2 0.5 0.5 0.3 0.4 0.6
5 Deficit in balance of goods and services -4.8 -7.3 -3.9 -2.8 -1.5 -3.7 -2.1 -2.4 -2.4 -2.1 -1.7
6 Exports 54.2 55.0 52.3 53.8 55.3 49.7 50.5 50.8 49.6 48.5 47.5 46.7
7 Imports 50.1 45.0 50.0 52.5 48.2 46.8 48.6 47.2 46.1 45.5 45.1
8 Net non-debt creating capital inflows (negative) -1.0 0.5 -1.1 -0.8 -1.0 -0.6 -0.8 -0.9 -1.1 -1.2 -1.4
9 Automatic debt dynamics 1/ -5.4 3.9 -5.3 -2.5 -0.4 -1.9 -0.5 -0.5 -0.5 -0.5 -0.5
10 Contribution from nominal interest rate 0.5 0.5 0.4 0.4 0.2 0.2 0.3 0.3 0.3 0.3 0.4
11 Contribution from real GDP growth -1.1 1.0 -2.5 -0.7 0.2 -2.2 -0.9 -0.8 -0.8 -0.9 -0.9
12 Contribution from price and exchange rate changes 2/ -4.8 2.4 -3.2 -2.1 -0.8 ... ... ... ... ... ...
13 Residual, incl. change in gross foreign assets (2-3) 3/ 5.7 3.1 1.6 1.9 1.7 4.2 1.3 1.5 1.9 2.1 2.4
External debt-to-exports ratio (in percent) 95.2 38.0 47.5 37.0 32.1 37.9 38.1 38.8 40.9 43.0 45.6 48.6
Gross external financing need (in billions of U.S. dollars) 4/ 0.4 0.2 0.8 0.6 1.0 0.5 1.0 1.0 0.9 1.0 1.1
in percent of GDP 2.0 1.5 3.7 2.4 3.9 10-Year 10-Year 1.7 3.3 3.0 2.7 2.7 2.8
Scenario with key variables at their historical averages 5/ 19.3 16.1 14.0 12.5 11.1 9.8 -1.2
Historical Standard
Key Macroeconomic Assumptions Underlying Baseline Average Deviation
Real GDP growth (in percent) 6.4 -4.0 13.1 4.3 -1.2 3.9 4.5 13.0 4.8 4.5 4.5 4.5 4.5
GDP deflator in US dollars (change in percent) 26.1 -10.3 14.7 11.9 4.6 11.0 11.0 0.7 0.1 3.1 3.9 3.3 3.0
Nominal external interest rate (in percent) 2.9 2.1 2.1 2.1 1.3 2.2 0.9 1.4 1.9 1.8 1.8 1.8 1.8
Growth of exports (US dollar terms, in percent) 29.4 -18.1 33.6 20.0 -7.1 14.9 16.4 15.6 5.3 5.2 6.3 5.8 5.8
Growth of imports (US dollar terms, in percent) 43.6 -22.7 44.2 22.7 -5.2 19.6 20.5 10.5 8.9 4.5 6.1 6.4 6.7
Current account balance, excluding interest payments 1.5 3.5 0.1 0.8 -0.7 1.6 2.1 1.2 -0.5 -0.5 -0.3 -0.4 -0.6
Net non-debt creating capital inflows 1.0 -0.5 1.1 0.8 1.0 0.5 0.6 0.6 0.8 0.9 1.1 1.2 1.4
1/ Derived as [r - g - r(1+g) + ea(1+r)]/(1+g+r+gr) times previous period debt stock, with r = nominal effective interest rate on external debt; r = change in domestic GDP deflator in U.S. dollar
terms, g = real GDP growth rate, e = nominal appreciation (increase in dollar value of domestic currency), and a = share of domestic-currency denominated debt in total external debt.
2/ The contribution from price and exchange rate changes is defined as [-r(1+g) + ea(1+r)]/(1+g+r+gr) times previous period debt stock. r increases with an appreciating domestic currency
(e > 0) and rising inflation based on GDP deflator).
3/ For projection, line includes the impact of price and exchange rate changes.
4/ Defined as current account deficit, plus amortization on medium- and long-term debt, plus short-term debt at end of previous period. Interest payments exclude binational companies.
5/ The key variables include real GDP growth; nominal interest rate; dollar deflator growth; and both non-interest current account and non-debt inflows in percent of GDP.
6/ Long-run, constant balance that stabilizes the debt ratio assuming that key variables (real GDP growth, nominal interest rate, dollar deflator growth, and non-debt inflows in percent of GDP)
remain at their levels of their last projection year.
Actual
Table A4.3 Paraguay: External Debt Sustainability Framework, 2008-2018(In percent of GDP, unless otherwise indicated)
PA
RA
GU
AY
54
IN
TER
NA
TIO
NA
L MO
NETA
RY F
UN
D

PARAGUAY
INTERNATIONAL MONETARY FUND 55
Annex V. Paraguay: Migration to Full-Fledged Inflation Targeting Regime—Status of Main Recommendations
Recommendations Status
Monetary Policy Framework
Communicate explicitly that the 5 percent inflation is the
monetary policy target.
Completed
Commit to a medium-term target horizon for the inflation
target.
Completed
Start publishing minutes of the Monetary Policy Committee
(CEOMA) meetings within two weeks after the meetings.
Completed
Improve the content of the Monetary Policy Report (MPR) by
addressing remaining weaknesses related to the horizon of the
inflation projection, scarcity of other projections (e.g., on core
inflation measures), and lack of risk balance analysis
In progress
Develop and discuss with the Board the new research projects
that would include an estimation of (a) a monetary policy
reaction function; (b) an exchange rate pass-through; (c) other
channels of monetary policy transmission mechanisms; and (d)
the long-term real exchange rate.
Completed
Include modeling as an integral part of the discussions between
the members of the Board and BCP staff.
Completed
Revise the Credit Expectations Survey in order to incorporate a
sectoral analysis with additional questions related to various
types of credit.
Completed
Include exchange rate to the interest rate function in the
inflation projection model.
Completed
Develop a better understanding of the monetary policy
transmission mechanism at work with the purpose to enhance
efficacy of the main channels, i.e., interest rate and the
exchange rate pass-through.
Completed
Increase the human resources of the Economics Department in
order to broaden the work on projection models.
In progress
Prepare and disseminate additional forward-looking surveys on
macroeconomic variables and a business confidence index.
In progress
Continue efforts towards full recapitalization of the BCP In progress

PARAGUAY
56 INTERNATIONAL MONETARY FUND
Monetary Operations, Liquidity Management, and Forecasting
Separate the functions of liquidity forecasting and the back-
office.
Completed
After moving to an averaging system of reserve requirements
start forecasting the demand for reserves and extend the
forecasting horizon to 1 month.
In progress
Strengthen efforts toward reducing excess liquidity in the
system and increase the absorption of structural liquidity via
the regular issuance of Monetary Regulation Instruments (IRMs)
and open market operations.
In progress
Introduce the averaging system for the reserve requirements. Near completion
Clearly distinguish the standing lending facility from the BCP’s
function as an LOLR; the separation of facilities should be based
on institutional discretion for access, differences in maturities,
and eligibility of collateral.
Completed
Institute a symmetric corridor system, initially with the width of
200 basis points (difference between the rates of the standing
lending and deposit facilities) around the policy rate.
Completed
Take steps to establish a risk-free benchmark yield curve with
maturities up to 1 year.
Completed
Strengthen the BCP’s supervisory functions in order to ensure
the soundness and stability of the banking sector and to reduce
the existing perception of high counterparty credit risk.
In progress
Maintain the Interbank Liquidity Management (VLI) window, but
limit its tenure to overnight transactions.
Completed
Take measures aimed at removing the legal impediments to
horizontal repo agreements and broader secondary market
trading.
Pending
Foreign Exchange Operations
Clarify the duality of objectives between the sale of government
proceeds and FX interventions, and make a distinction between
the two mechanisms: the auction system for the sale of
government revenues in dollars, and bilateral trades for FX
intervention.
Completed
Pre-announce a monthly program for the sale of government
proceeds and stick to the calendar and fixed amounts.
Completed
Limit FX intervention to exceptional circumstances in order to
enhance the BCP’s credibility in pursuing its policies and its
commitment to having a unique nominal anchor—the inflation
target.
Completed
Consider conducting bilateral transactions via telephone rather
than Datatec in order to strengthen the message given to
Pending

PARAGUAY
INTERNATIONAL MONETARY FUND 57
market participants.
Introduce a channel of communication for verbal intervention,
so-called open mouth operations.
Pending
Encourage a market making agreement, but transact only with
a limited number of participants, who are the BCP
counterparties for FX interventions.
In Progress
Start publishing the reference exchange rate once a day at 1:00
p.m., based on interbank transactions.
Pending

PARAGUAY
58 INTERNATIONAL MONETARY FUND
Annex VI. Paraguay: 2011 FSAP Status of Main Recommendations
Recommendations Status
Macroeconomic Risks: Financial Institutions Soundness and Vulnerabilities
Legislations should adopt a CAR definition consistent with the
Basel Accords (Basel I).
Completed
Proceed with planned introduction of forward looking
provisioning.
In progress
Enhance the regulatory approach to renewed, refinanced, and
restructured operations.
Near completion
Payment and Security Settlement Systems
Approve the draft payment system law to provide legal support
to the new payment system.
Completed
Complete implementation of the new payment system,
including real-time gross settlements, a security repository, and
automated clearing house.
Completed
Financial Sector Oversight
Amend the legal framework to empower the BCP to issue and
develop prudential regulations and to apply due discretion,
thus providing the BCP and the Superintendence with flexibility
to exercise timely risk-based supervision and address evolving
banking sector risks.
In progress
Review the legal framework to avoid suspension of INCOOP’s
corrective actions by ongoing judiciary appeal process to
strengthen INCOOP’s enforcement capacity.
In progress
Align cooperatives’ prudential framework with banking sector
standards, in particular the capital adequacy and provisioning
requirements of large cooperatives.
In progress
Strengthen INCOOP’s governance by instituting appointment
of its Board by the President of the country in accordance with
the fit and proper qualification criteria.
Pending
Set up a committee of all regulators at the highest level with a
clear mandate, technical capacity, and deliverables to
strengthen the coordination between regulators and enhance
financial stability analysis.
In progress
Financial Safety Net and Crisis Resolution Framework
Strengthen the FGD contingency funding to ensure sufficient
capacity to resolve a medium to large scale bank.
Pending
Set up liquidity assistance facility for cooperatives to ensure
effective and timely emergency liquidity assistance. Setup
deposit insurance scheme for cooperatives.
In progress

PARAGUAY
INTERNATIONAL MONETARY FUND 59
Financial Sector Development Agenda
The government should develop and implement a
comprehensive agenda to foster financial inclusion in a
sustainable manner.
Completed
MoF should prepare legislation establishing a dedicated
pension supervisor and undertake actuarial assessments of the
various pension regimes—adhering to international
standards—to anchor their parametric reform.
In progress
Money and Debt Markets and Systemic Liquidity Management
MoF should expedite the planned recapitalization of the central
bank.
Partially Completed
The central bank should enhance its capacity for systemic
liquidity management.
In progress
Credit Information Systems and Creditor Rights Framework
The central bank should prepare legislation establishing a
sound legal framework for the credit reporting industry.
In progress
Submit to parliament the law on organization and coordination
of the registry general and the cadastre, and make electronic
registries for immovable assets fully operational and available
online.
In progress

PARAGUAY
STAFF REPORT FOR THE 2013 ARTICLE IV
CONSULTATION—INFORMATIONAL ANNEX
Prepared By
The Western Hemisphere Department
FUND RELATIONS ________________________________________________________________________ 2
RELATIONS WITH THE WORLD BANK UNDER JMAP ___________________________________ 5
RELATIONS WITH THE INTER-AMERICAN DEVELOPMENT BANK _____________________ 8
STATISTICAL ISSUES ____________________________________________________________________10
CONTENTS
January 30, 2014
29, 2013

PARAGUAY
2 INTERNATIONAL MONETARY FUND
FUND RELATIONS (As of December 31, 2013)
Membership Status: Joined: December 28, 1945 Article VIII
General Resources Account: SDR Million % Quota
Quota 99.90 100.00
Fund holdings of currency 78.43 78.51
Reserve Tranche Position 21.48 21.50
SDR Department: SDR Million % Allocation
Net cumulative allocation 95.19 100.00
Holdings 110.64 116.22
Outstanding Purchases and Loans: None
Latest Financial Arrangements:
Date of Expiration Amount Approved Amount Drawn
Type Arrangement Date (SDR Million) (SDR Million)
Stand-By May 31, 2006 Aug 31, 2008 30.00 0.00
Stand-By Dec 15, 2003 Nov 30, 2005 50.00 0.00
Projected Payments to Fund1/
(SDR Million; based on existing use of resources and present holdings of SDRs):
Forthcoming
2014 2015 2016 2017 2018
Principal
Charges/Interest 0.00 0.00 0.00 0.00 0.00
Total 0.00 0.00 0.00 0.00 0.00
1/When a member has overdue financial obligations outstanding for more than three months, the amount of such
arrears will be shown in this section.
Exchange Rate Arrangement: The currency of Paraguay is the Paraguayan guaraní. The exchange
rate regime is classified de facto as other managed arrangement (the de jure regime is classified as
floating). The exchange rate is determined in the interbank foreign exchange market but the central
bank intervenes in the foreign exchange and monetary markets to smooth out excessive exchange
rate fluctuations due to strong seasonal pressures. The U.S. dollar is the principal intervention
currency. Paraguay has accepted the obligations of Article VIII, Sections 2(a), 3 and 4 of the Fund’s
Articles of Agreement. Its exchange system is free of restrictions on the making of payments and
transfer for current international transactions.

PARAGUAY
INTERNATIONAL MONETARY FUND 3
Article IV Consultation: The Executive Board concluded the 2012 Article IV consultation on
August 2012.
Technical Assistance 2009–13
DPT Purpose Date of Delivery
STA Monetary and Financial Statistics March 2009
FAD Performance Budgeting February 2009
MCM Banking Supervision May 2009
MCM Cooperatives September 2009
MCM Cooperatives September 2009
FAD Medium-Term Fiscal Framework September 2009
FAD Debt Management February 2010
MCM First Issuance Sovereign Bond March 2010
STA Monetary and Financial Statistics April 2010
MCM Banking Supervision April 2010
STA National Accounts August 2010
MCM and WB FSAP/FSSA November 2010
FAD Tax and Customs Administration December 2010
FAD Public-Private Partnerships February 2011
STA National Accounts Statistics March–April 2011
FAD Medium-Term Macro-Fiscal Framework
and Public Investment Management March–April 2011
MCM Monetary Policy, Central Bank Operations,
and Accounting April 2011
FAD Public Transport Subsidies June-July 2011
MCM Financial Soundness Indicators and Financial Oversight November 2011
FAD Improve Fiscal Projections and Financial Planning December 2011
FAD Modernization of the Customs Administration December 2011
FAD Debt and Cash Management March 2012
FAD Tax Policy March 2012
MCM Monetary Policy, Central Bank Operations,
and Accounting April 2012
FAD Tax and Custom Administration December 2012
FAD Debt and Public Investment Management May 2013
MCM/LEG Launching of the AML/CFT June 2013
MCM Inflation Targeting and Central Bank Operations August 2013
FAD Revenue Administration September 2013
FAD Tax Administration December 2013
Safeguards Assessment: Under the Fund's safeguards assessment policy, Central Bank of
Paraguay (BCP) was subject to a full safeguard assessment in respect to the arrangement approved
on May 31, 2006. A safeguards assessment of the BCP was completed in October 2006. The report
stated that while the BCP has made some progress in strengthening the safeguards framework since

PARAGUAY
4 INTERNATIONAL MONETARY FUND
the 2003 safeguards assessment, vulnerabilities remain in certain areas such as financial reporting
and program data reporting to the Fund.
Resident Representative: Mr. Kevin Ross is the regional resident representative since July
2011. He is based in Lima, Peru.

PARAGUAY
INTERNATIONAL MONETARY FUND 5
RELATIONS WITH THE WORLD BANK UNDER JMAP
1. Meeting of teams. The Fund and Bank Paraguay teams met in November 2013 to exchange
views on economic developments in Paraguay, and discuss ongoing work and work plans for the
year ahead. This Annex provides a summary of the discussions.
2. The teams agreed that Paraguay’s macroeconomic policies must be kept broadly
neutral over the medium term. In 2013, the economy recovered sharply from the previous year’s
severe drought. After contracting 1.2 percent in 2012, the economy rebounded to a 13 percent
growth in 2013, as a result of a strong recovery in the primary sector, mainly attributed to higher soy
output. Against this background, macroeconomic policies supported the recovery amid low inflation.
The fiscal stimulus implemented in 2012 to counterbalance the effect of the exogenous shock in
agriculture, reverted to a neutral position in 2013, and is expected to present a modest withdrawal in
2014-15—transition years to a more rigorous fiscal stance under the new Fiscal Responsibility law—
and to remain broadly neutral through the end of projected period (2018). Real GDP would grow by
4.8 percent, supported by continuing dynamism in the agricultural and livestock sector and by
higher overall investment. Although inflation at the end of 2013 was 3.7 percent, rising food prices
and tariffs of public services will most likely push inflation to the central bank target (5 percent) by
end-2014. Monetary policy was more accommodative during much of 2013, but the central bank
raised the policy rate by a total 100 basis points in December 2013 and January 2014, bringing it up
to 6.5 percent and monetary policy to a more neutral position.
3. Over the medium term, policies need to cement economic fundamentals and promote
social development. The fiscal responsibility law provides an adequate anchor to maintain fiscal
sustainability. The central government deficit will most likely decline on average to about 1 percent
of GDP in the period 2015–18, becoming broadly neutral and supporting the gradual closing of the
current positive output gap. Regarding monetary policy, after the recent policy rate hikes, the
central bank stressed that it will continue to adjust it in the period ahead as necessary to keep
inflation within the target. To promote social development and address structural and institutional
weaknesses and rising inequality, the government proposed important reforms and the Congress
approved key laws in 2013 that will be implemented starting in 2014. Going forward, stronger
budget institutions are needed to improve the quality of spending along with strengthened tax and
customs administration. A civil service and pension reforms must be part of a medium term strategy,
along with improved public enterprises management to bolster access to public service.
4. The following reform areas have been identified as critical:
Tax policy and revenue administration reform. Additional tax policy and reforms are
needed to increase low revenues. These include increasing taxation on the financial sector
and revenue collection efficiency while reducing exemptions.
Public financial management. Better budget design, monitoring and control is
needed along with a medium-term expenditure framework are needed to increase the
quality of public spending and improve the allocation of resources.

PARAGUAY
6 INTERNATIONAL MONETARY FUND
Public-Private Partnerships. The recently approved PPP law offers potential efficiency
gains, but it can also increase fiscal risks. It is important to strengthen public investment
management, planning and regulatory capacity. The regulation of the law should provide
clear guidelines for risk allocation and accounting of contingent liabilities.
Financial system. Continue reforms to banking and central bank legislation are
needed to keep bolstering the banking system and strengthening regulation and
supervision. There is also a need to strengthen regulation and supervision for cooperatives
and establishing a safety net for the sector.
Monetary framework. To complete the transition to a full-fledged inflation targeting
regime, the central bank (BCP) would need to develop an active interbank monetary market,
improving communication with market participants and eliminating legal impediments for
secondary markets trading.
5. The division of labor between the teams would be along the following lines:
Tax and customs administration reform. The Fund and the Bank will continue
providing technical assistance (TA) to support authorities’ efforts to reform the tax system
and increasing revenue collection productivity.
Public financial management. The Bank will provide TA on strengthening the
corporate governance of public enterprises. The Fund will provide TA on strengthening the
medium-term budget framework and cash management.
Monetary framework. The Fund plans to provide TA on further strengthening
monetary operations and transitioning to an inflation targeting regime.
Money Laundering. The Fund will provide TA to implement the plan on money
laundering and control of terrorism financing.
Medium-term debt management. The Fund’s will continue providing TA to develop a
medium-term debt strategy so as to reduce domestic debt servicing costs and promote the
development of a domestic government debt market.
Infrastructure and Logistics. The Bank will provide TA on infrastructure and logistics
required for the implementation of PPPs.
Poverty assessment and support. The Bank will provide TA on equity assessment and
poverty support. An approved loan of U$100 million will be used to expand the coverage of
the Paraguay Sustainable Agriculture and Rural Development Project.
Education and social programs. The Bank will provide TA on education programs,
social assistance, and rural and agricultural development.
Pensions. The Bank will continue providing TA to improve the pension system
supervision, including with best practices.
Growth volatility. The Bank will provide TA on mechanisms to mitigate the impact of
growth volatility.
6. Work programs. The table below lists the teams’ work programs for the year ahead.

PARAGUAY
INTERNATIONAL MONETARY FUND 7
Work Programs of the World Bank and IMF Teams
Title Products Provisional
Timing of
Missions
Expected Delivery Date
Bank Work Program
Country Partnership Strategy
Public expenditure review
Spring 2014
Spring 2014
November 2013. Pending
dissemination.
TA on volatility analysis Spring 2014 March 2014
TA on strengthening pension
supervision
Spring 2014 Spring 2014
TA on Equity Assessment and
poverty support
Spring 2014 May 2014
TA strengthening tax
administration and SOE
corporate governance
Spring 2014 July 2014
TA on education programs
EW Land Reform Report
February 2014
Spring 2014
December 2014
January 2014. Pending
dissemination.
TA on Infrastructure and
Logistics PPP
Spring 2014 Fall 2014
Fund Work Program
Article IV Consultation
TA medium-term budget
framework
December 2013
February 2014
February 2014
April 2014
TA to strengthen risk based
AML/CFT supervision
April 2014 June 2014
TA on IT implementation March 2014 June 2014
TA on revenue administration March 2014 May 2014
TA on STA issues (ROSC) February 2014 April 2014

PARAGUAY
8 INTERNATIONAL MONETARY FUND
RELATIONS WITH THE INTER-AMERICAN
DEVELOPMENT BANK
(As of December 31, 2013)
The Inter-American Development Bank’s Board of Executive Directors approved in 2009 the Country
Strategy with Paraguay (2009–2013).1 Sovereign-guaranteed lending under the program was
expected to reach approximately US$1 billion.
Under the Strategy, the national authorities and the Bank identified the following priority sectors in
which the IDB Group would focus both its financial and non-financial products and services: (i)
transport; (ii) energy; (iii) water, sanitation, and solid waste; (iv) agriculture and tourism; (v) climate
change; (vi) health; (vii) education; (viii) institutional capacity; (ix) financial sector; and (x) urban
development. Regarding the Bank’s private sector operations, the Bank approved loans and
technical assistance in the foreign trade and social responsibility sectors, which derived to an
increase in approval of loans to companies: US$28 million in 2010, US$52 million in 2011,
US$9 million in 2012 and US$132 million in 2013.
The strategic areas were selected taking into account the following objectives: (i) strengthen the
governability and institutional capacity at the public sector to increase efficiency and transparency;
(ii) create the basis for sustainable growth, increasing regional and global integration to promote
private investment and improve competitiveness; and (iii) reduce poverty and improve the quality of
life of the poor by developing human capital and giving access to basic services.
As of December 31, 2013, the Bank’s portfolio in Paraguay included loans for the financing of 25
projects. The lending portfolio amounts to US$866 million, of which US$544 million are pending
disbursement. Disbursements in 2014 are expected to total US$74 million. The current portfolio
includes lending to support the Government in the following sectors: infrastructure, social, public
sector institutional strengthening, competitiveness, and regional integration. The portfolio also
includes loans to the private sector for US$203 million. In 2013, the Bank approved loans to the
public sector in the areas of transport and investment promotion.
1 A new strategy covering the period 2014–18 is under discussion.

PARAGUAY
INTERNATIONAL MONETARY FUND 9
Financial Relations with the Inter-American Development Bank
1
(In millions of U.S. dollars)
Loan Transactions
2006 2007 2008 2009 2010 2011 2012 2013 2014
Disbursement 67.2 67.8 85.6 91.3 240.3 91.4 102.8 142.4 73.4
Amortization 66.7 88.1 94.3 91.3 96.2 94.5 91 83.9 97.7
Net Loan Flows 0.5 -20.3 -8.7 0 144.1 -3.1 11.8 58.5 -24.3
Source
Source: Inter-American Development Bank. 1/
Only loans with sovereign guarantee are considered.
PARAGUAY
10 INTERNATIONAL MONETARY FUND
STATISTICAL ISSUES
(As of December 2013)
Assessment of Data Adequacy for Surveillance
General: Data provision to the Fund has some shortcomings, but is broadly adequate for
surveillance. Following a data ROSC mission in January–February 2006, the authorities’ response to
the report and the mission’s recommendations were published on the Fund’s website on June 30,
2006. The country is a GDDS participant.
1. National Accounts: National accounts estimates, broadly consistent with the guidelines of
the 1993 SNA, were released in 2005. However, no comprehensive regular program for data
collection through economic surveys exists (an industrial survey was conducted in 2002). An
economic census was undertaken in 2011. Source data for nonfinancial services, household
consumption, and changes in inventories are insufficient. Major areas of concern include: (i) the
1994 reference year needs to be updated; (ii) excessive use is made of fixed coefficients for value
added and household consumption; (iii) changes in inventories are obtained residually; (iv) informal
activities are not monitored; and (v) supply and use tables have been compiled only until 1997.
Annual GDP meets GDDS recommendations, and QNA meets DSSD timeliness requirements (90
days). Several STA missions on the compilation of quarterly national accounts (QNA) were fielded in
August 2007, August 2008, November 2009 and March-April 2011. QNA series were published in
December 2010. The STA mission of March-April 2011 assisted the authorities in outlining a work
program for updating the national accounts’ base year.
2. Labor market: Since the introduction of a regular household survey in 1998, the coverage
and quality of employment and unemployment statistics have improved significantly. Since 2010,
data are released on a quarterly basis, although the latter covers the Asuncion area only. The last
available observation for the quarterly series is the third quarter of 2013, whereas the annual data
for 2012 has just been released in September 2013.
3. Prices statistics: Both the consumer (CPI) and producer price indices (PPI) are reported on
a regular and timely basis. Since January 2008, the Central Bank of Paraguay (BCP) has been using a
new CPI index based on the 2005–06 household budget survey (Dec. 2007=100). The geographic
coverage of the CPI is limited to Greater Asunción (the capital and metropolitan area) and
expenditure weights are representative of the consumption patterns of urban households. The PPI
has a base weight period of June 2010 and its basket (185 items) is representative of current
national output; electricity, water, and gas are not covered.
4. The data ROSC mission found that the resources are insufficient for real sector
statistics and constrain further development, particularly the full adoption of the 1993 SNA.
The authorities have been trying to address these resource shortcomings in the context of the
recent compilation of a new CPI and the production of QNA series. A new ROSC mission has been
scheduled for February 2014.
PARAGUAY
INTERNATIONAL MONETARY FUND 11
5. Government finance statistics: The Government finance statistics (GFS) used for internal
purposes and for reporting to WHD is broadly consistent with the recommendations of the Manual
on Government Finance Statistics 1986 (GFSM 1986). The authorities have not yet prepared a plan to
migrate to the Government Finance Statistics Manual 2001 (GFSM 2001). Monthly data are available
for the central administration (budgetary central government). The asset position of the social
security system is available on a daily basis. Statistics on the central administration include data of
the Postal Service Directorate (a nonfinancial public corporation) and the statistics of the
nonfinancial public sector include data of financial public corporations ––four employer social
insurance schemes. These social insurance schemes are treated as financial corporations in the
monetary and financial accounts. Data on medium and long-term external debt are reliable and
available on a monthly basis. Domestic debt data are available on request, but need to be fully
integrated with the external debt database. Deficiencies remain in recording short-term supplier and
commercial credit of the public sector. Moreover, there is a discrepancy in the fiscal data reported
by the monetary and fiscal authorities. Measures are being taken to make reporting more
transparent.
Annual data covering general government for 2011 have been reported for publication in the 2012
edition of the GFS Yearbook. However, since 1994 no outstanding debt data and no breakdowns for
expenditure by function have been provided for publication in the GFS Yearbook. Monthly and
quarterly data are not reported for publication in IFS.
6. Balance of payments: The classification of the balance of payments and the international
investment position (IIP) follows the recommendations of the Balance of Payments Manual,
5thedition. Quarterly data on balance of payments and the IIP are available from 2001 onwards, and
are reported only once a year to STA for publication in the IFS. In May-2013, the CBP revised the
BOP and IIP time series to exclude transactions and positions between residents and the bi-national
hydroelectric energy enterprises, they are now considered 50% residents. Improvements have been
made in the quality of the data on capital flows, especially in the coverage of foreign direct
investment, and in the recording of external debt transactions. Special studies by the central bank
have improved the estimation methods for remittances of Paraguayans abroad and unregistered
trade transactions, but serious deficiencies remain.
Also, there are deficiencies in the area of private capital outflows, which are difficult to register due
to Paraguay’s open capital account. An STA mission on Balance of Payments Statistics assisted the
BCP in November 2006 in implementing recommendations of the ROSC mission. In particular, the
mission focused on: (1) assessing the surveys used to capture data on services, direct investment,
nonfinancial private sector portfolio investment, and other investment; (2) reviewing and updating
the statistical techniques used to calculate unrecorded trade; (3) reassessing the treatment of the
binational hydroelectric energy enterprises in the external sector accounts; and (4) reviewing and
preparing a preliminary template for reporting data on international reserves and foreign currency
liquidity.
7. Monetary and financial statistics: Paraguay reports monetary data for the central bank
and other depository corporations (ODCs) using the standardized report forms (SRFs). An integrated

PARAGUAY
12 INTERNATIONAL MONETARY FUND
monetary database meeting the data needs of the BCP, STA, and WHD is in operation Data on credit
cooperatives, which account for around ¼ of deposits and loans of the banking sector, are now
included in the ODCs with data beginning in December 2008. The Superintendence of Banks reports
11 of the 12 core and 7 of the 13 encouraged financial soundness indicators for deposit takers to
STA on a month basis.

Paraguay: Table of Common Indicators Required for Surveillance
(As of January, 2014)
Date of
Latest
Observation
Date
Received
Frequency
of Data1
Frequency of
Reporting1
Frequency of
Publication1
Memo Items 9
Data Quality–
Methodological
Soundness10
Data Quality–
Accuracy and
Reliability11
Exchange Rates Daily Daily D D D
International Reserve Assets and Reserve Liabilities of the Monetary
Authorities2
Daily Daily D D D
Reserve/Base Money Dec. 2013 Dec. 2013 M M M O, LNO, LO, O O, O, O, LO,L O
Broad Money Dec. 2013 Dec. 2013 M M M
Central Bank Balance Sheet Dec. 2013 Dec. 2013 M M M
Consolidated Balance Sheet of the Banking System Dec. 2013 Dec. 2013 M M M
Interest Rates3 Dec. 2013 Dec. 2013 W W M
Consumer Price Index Dec. 2013 Dec. 2013 M M M O, LO, O, O O, LO, LNO, O, LO
Revenue, Expenditure, Balance and Composition of Financing4 –
General Government5
Dec. 2013 Dec. 2013 M M M LO, LO, LO, LO LO, LNO, O, LO, LO
Stock of Central Government and Central Government-Guaranteed
Debt6
Dec. 2013 Dec. 2013 M M M
External Current Account Balance Q3 2013 Nov. 2013 Q Q Q O, LO, LO, LO LO, O, LO, LO, LO
Exports and Imports of Goods and Services7 Q3 2013 Nov. 2013 Q Q Q
GDP/GNP Q3 2013 Nov. 2013 Q Q Q O, LO, LO, LO LO, O, LNO, O, LO
Gross External Debt Q3 2013 Nov. 2013 M M M
International Investment Position8 Q3 2013 Nov. 2013 Q Q Q
1 Daily (D), Weekly (W), Monthly (M), Quarterly (Q), Annually (A); Irregular (I); Not Available (NA).
2 Any reserve assets that are pledged or otherwise encumbered should be specified separately. Also, data should comprise short-term liabilities linked to a foreign currency but settled by other
means as well as the notional values of financial derivatives to pay and to receive foreign currency, including those linked to a foreign currency but settled by other means. 3 Both market-based and officially-determined, including discount rates, money market rates, rates on treasury bills, notes and bonds.
4 Foreign, domestic bank, and domestic nonbank financing.
5 The general government consists of the central government (budgetary funds, extra budgetary funds, and social security funds) and state and local governments.
6 Guaranteed non-financial public sector debt. Including currency and maturity composition.
7 Monthly frequencies for goods only.
8 Includes external gross financial asset and liability positions vis-à-vis nonresidents.
9 Reflects the assessment provided in the data ROSC (published on June 30, 2006, and based on the findings of the mission that took place during January–February, 2006) for the dataset
corresponding to the variable in each row. The assessment indicates whether international standards concerning concepts and definitions, scope, classification/sectorization, and basis for
recording are fully observed (O); largely observed (LO); largely not observed (LNO); not observed (NO); and not available (NA). 10
Same as footnote 9, except referring to international standards concerning source data, assessment of source data, statistical techniques, assessment and validation of intermediate data and
statistical outputs, and revision studies. 11
Same as footnote 9, except referring to international standards concerning source data, statistical techniques, assessment and validation of source data, assessment and validation of
intermediate data and statistical outputs, and revision studies.
INTER
NA
TIO
NA
L MO
NETA
RY F
UN
D
11
PA
RA
GU
AY

Press Release No. 14/61
FOR IMMEDIATE RELEASE
February 14, 2014
IMF Executive Board Concludes 2013 Article IV Consultation with Paraguay
On February 14, 2014, the Executive Board of the International Monetary Fund (IMF) concluded the Article IV Consultation with Paraguay.1 Paraguay enjoyed robust economic growth in the past decade, on the heels of the export commodity boom, and supported by prudent macroeconomic policy implementation. Despite weather-related shocks hitting the key agribusiness sector, the economy has grown at an average rate of 4.7 percent a year since 2003 compared with about 2 percent the previous decade. Robust growth has been accompanied by declining inflation, particularly since 2011 when the central bank adopted inflation targeting. Despite the acceleration in growth in the 2000s, poverty and inequality in Paraguay remain among the highest in the region. Activity rebounded to an estimated 13 percent in 2013 as the agricultural sector recovered sharply from the previous year’s severe drought. Rising agricultural output led to higher exports and a surplus of close to 1 percent of GDP in the external current account, despite a deterioration in the terms of trade. Non-agricultural activity has been less volatile, growing at about potential in the past two years, underpinned by rising consumption. End-2013 inflation fell to 3.7 percent—below the central bank’s inflation target rate of 5 percent—despite increasing food prices. Private sector credit growth has slowed to about 17 percent in nominal terms since end-2012, with loans concentrated on the agricultural sector; consumer credit has also grown rapidly, albeit from a low base. Paraguay’s banking sector remains well capitalized and profitable, with low nonperforming loans. Macroeconomic policies broadly supported the recovery. Fiscal spending under the stimulus implemented in 2012 decelerated in 2013 due to stricter spending controls, though the central
1 Under Article IV of the IMF's Articles of Agreement, the IMF holds bilateral discussions with members, usually
every year. A staff team visits the country, collects economic and financial information, and discusses with officials
the country's economic developments and policies. On return to headquarters, the staff prepares a report, which
forms the basis for discussion by the Executive Board. At the conclusion of the discussion, the Managing Director,
as Chairman of the Board, summarizes the views of Executive Directors, and this summary is transmitted to the
country's authorities. An explanation of any qualifiers used in the summing up can be found here:
http://www.imf.org/external/np/sec/misc/qualifiers.htm.
International Monetary Fund
700 19th Street, NW
Washington, D. C. 20431 USA

2
government deficit increased slightly to about 2 percent of GDP from 1.8 percent in 2012 as tax revenue remained modest. Monetary policy was on hold during much of 2013 until the central bank raised the policy rate by 100 basis points over December 2013 and January 2014, in light of incipient inflationary pressures. The outlook for 2014 is positive. Growth should be strong at 4.8 percent, underpinned by continued dynamism in the agricultural sector and rising infrastructure investment. Annual inflation will likely increase to the central bank’s target rate of 5 percent. The fiscal deficit should remain low, under the introduction of the recently approved Fiscal Responsibility Law. The external current balance would revert to a small deficit amid slightly deteriorating terms of trade and rising import volumes. Overall, the risks to this outlook are balanced. The main downside risks stem from regional growth and global borrowing conditions, while upside risks include faster-than-expected progress in reforms. Executive Board Assessment2 Executive Directors welcomed Paraguay’s recent economic recovery and favorable outlook, underpinned by strong economic policies and fundamentals, with low debt, sizeable official reserves, and small fiscal and external imbalances. Directors noted that the key challenge ahead is to improve social and economic development, while strengthening the macroeconomic policy framework. They took positive note of the authorities’ ambitious reform agenda and the critical legislation that has already been enacted to address institutional and structural weaknesses. Directors emphasized that resolute implementation of these laws and continued sound macroeconomic policies are necessary to reduce poverty and foster broad-based sustainable growth. Directors welcomed the strengthening of the fiscal framework. The fiscal responsibility law provides a sound anchor to underpin fiscal sustainability. They encouraged the authorities to make the framework stronger, by further improving the quality of government spending, strengthening tax and customs administration, and enhancing the capacity to deal with potential risks from public-private partnerships. Civil service and pension reforms are also needed. Directors welcomed the authorities’ prudent monetary policy stance and the advances made in implementing an inflation-targeting regime. They encouraged additional steps to complete the transition towards a full-fledged inflation-targeting regime, including developing an active interbank money market, strengthening risk-based bank supervision, and updating financial sector legislation. Maintaining exchange rate flexibility and greater efforts to reduce dollarization will strengthen the monetary policy framework and help cushion the economy against potential shocks. Over the medium term, macroeconomic policies should be guided by the fiscal
2 At the conclusion of the discussion, the Managing Director, as Chairman of the Board, summarizes the views of
Executive Directors, and this summary is transmitted to the country's authorities. An explanation of any qualifiers
used in summings up can be found here: http://www.imf.org/external/np/sec/misc/qualifiers.htm.

3
responsibility law and inflation-targeting frameworks. Directors called for steps to address the remaining deficiencies in the anti-money laundering regime.
Directors agreed that reducing poverty and inequality is a priority. They encouraged the authorities to sustain all the initiatives underway to promote social and economic inclusion while protecting vulnerable groups through social safety nets. Reform efforts should particularly focus on improving the business climate, addressing labor market inefficiencies, and increasing female labor participation as well as human capital investment. Improved public enterprises management will also facilitate access to basic public services at reasonable cost.

4
Paraguay: Selected Economic and Social Indicators I. Social and Demographic Indicators
Population 2012 (millions) 6.6 Gini index (2011) 52.0 Unemployment rate (2012) 4.9 Life expectancy at birth (2010) 72.3 Percentage of population below the poverty line (2011) 32.4 Adult illiteracy rate (2011) 4.7
Rank in UNDP development index (2012) 111 of 186 GDP per capita (US$, 2012) 3,730.2
II. Economic Indicators Est. Proj.
2008 2009 2010 2011 2012 2013 2014
(Annual percentage change, unless otherwise indicated)
Income and prices
Real GDP 6.4 -4.0 13.1 4.3 -1.2 13.0 4.8
Nominal GDP 16.3 -2.0 20.0 14.6 0.0 15.6 9.7
Consumer prices (end of period) 7.5 1.9 7.2 4.9 4.0 3.7 5.0
Nominal exchange rate (Guarani per U.S. dollar, eop) 4,945.0 4,610.0 4,573.8 4,439.9 4,288.8 4,585.0 …
Monetary sector
Currency issue 15.0 11.3 18.5 11.6 17.5 13.9 10.1
Credit to private sector 62.0 21.4 37.3 25.8 15.8 17.5 11.9
Liabilities to private sector 42.4 24.9 19.2 19.4 14.1 20.6 10.6 External sector
Exports (fob) 29.7 -20.3 35.1 20.7 -7.8 16.0 5.3
Imports (cif) 44.7 -23.6 44.7 22.9 -5.8 10.1 9.0
Terms of trade 3.3 -3.0 8.2 14.3 -10.2 -7.0 -9.1
Real effective exchange rate 1/ 16.3 -7.4 2.8 13.4 -0.3 6.8 …
(In percent of GDP, unless otherwise indicated) Current account 1.0 3.0 -0.3 0.5 -1.0 0.9 -0.9
Trade balance 5.7 7.1 4.3 3.5 2.2 4.6 3.1 Exports 52.6 48.6 50.6 52.3 46.7 47.6 47.8
Imports -46.9 -41.6 -46.4 -48.8 -44.5 -43.0 -44.7
Capital account and financial account 0.9 -0.3 1.1 2.0 1.9 1.6 0.5
General government -0.5 0.1 0.3 -0.2 -0.1 1.7 0.5
Private sector 1.4 -0.4 0.8 2.3 2.0 -0.1 0.0
o/w Direct investment 1.1 0.6 1.0 2.3 1.9 1.3 1.7
Net international reserves (in millions of U.S. dollars) 2,876 3,817 4,165 4,971 4,983 5,889 5,763
(Stock in months of next year imports of goods and services) 4.8 4.4 3.9 5.0 4.5 4.9 4.6
Gross domestic investment 16.4 13.8 16.2 16.2 15.4 15.9 16.4 Private sector 13.5 9.1 11.8 11.6 9.8 11.1 11.6
Public sector 3.0 4.7 4.5 4.7 5.6 4.8 4.8
Gross national saving 17.4 16.8 16.0 16.7 14.4 16.8 15.5
Private sector 11.7 13.1 11.0 10.6 10.8 14.4 13.5
Public sector 5.7 3.7 4.9 6.0 3.6 2.5 2.0 Central government revenues 15.8 17.5 17.1 17.4 18.9 17.0 17.0
o/w Tax revenues 10.7 11.6 12.0 12.1 12.7 11.7 12.0
Central government expenditures 13.5 17.5 15.9 16.7 20.8 19.0 18.9
o/w Wages and salaries 6.5 7.7 7.3 7.4 9.6 9.3 8.5
Central government overall balance 2.3 0.1 1.2 0.7 -1.8 -2.0 -1.8
Consolidated public debt (in percent of GDP) 2/ 22.8 22.5 18.6 16.2 15.9 20.9 19.1
Memorandum items:
GDP (in billions of Guaranies) 80,735 79,117 94,934 108,795 108,832 125,856 138,079
GDP (US$billions) 18.5 15.9 20.7 24.1 24.9 28.4 29.7
Sources: Central Bank of Paraguay, Ministry of Finance; and IMF staff estimates and projections.
1/ Average annual change; a positive change indicates an appreciation. For 2013, end-November. 2/ Includes letras de Regulacion Monetaria (Central Bank paper).