Embed Size (px)
Citation preview

0
The Epidemiology of Communicable Diseases in the Winnipeg Health Region
communicable diseases
2011-2016 PUBLISHED OCTOBER 2017
Population Health Surveillance Team Population and Public Health Program

1 WRHA THE EPIDEMIOLOGY OF COMMUNICABLE DISEASES IN THE WINNIPEG HEALTH REGION
PU
BLISHED Someday
The Epidemiology of Communicable Diseases in
the Winnipeg Health Region
Population Health Surveillance Team
Population and Public Health
Program, WRHA
ACKNOWLEDGEMENTS
This report details the descriptive
epidemiology of select communicable
diseases in the Winnipeg Health Region.
Special gratitude is extended to the following
individuals:
Public Health Nurses: investigation and management of reportable communicable diseases, including detailed collection of and entry of surveillance data within iPHIS.
Communicable Disease Coordinators: public health nursing leadership, direction and oversight regarding the collection of surveillance data
Medical Officer of Health/Team Manager: public health clinical leadership and oversight
FOR FURTHER INFORMATION
For comments or inquiries concerning the material in this publication, contact [email protected].
Suggested Citation: Winnipeg Regional Health Authority, Population Health Surveillance Team. The Epidemiology of Communicable Diseases in the Winnipeg Health Region, 2011-2016. Winnipeg, 2017

WRHA THE EPIDEMIOLOGY OF COMMUNICABLE DISEASES IN THE WINNIPEG HEALTH REGION 2
THE WINNIPEG HEALTH REGION (WHR)
• The largest health region in the province of Manitoba with a population of 743,397 in 2014, more than half of the total provincial population.
• Includes the capital city of Winnipeg, and the rural municipalities of East St. Paul and West St. Paul.
• For planning and management purposes, the WHR is divided into 12 community areas.
• The Winnipeg Regional Health Authority (WRHA) is responsible for the delivery of acute care, public health and other community services to the residents of the WHR.
• In 2012, the Churchill Health Region became an operating division of the WRHA; however, residents of Churchill are not included in this surveillance report.

3 WRHA THE EPIDEMIOLOGY OF COMMUNICABLE DISEASES IN THE WINNIPEG HEALTH REGION
TABLE OF CONTENTS TABLE OF CONTENTS ....................................................................................................................... 3
TABLES ......................................................................................................................................... 4 FIGURES ....................................................................................................................................... 8
EXECUTIVE SUMMARY ................................................................................................................... 11 INTRODUCTION ............................................................................................................................. 12 METHODS ...................................................................................................................................... 12
DATA SOURCE AND CASE DEFINITIONS .................................................................................... 12 INCLUSION/EXCLUSION CRITERIA ............................................................................................. 13 VARIABLE DEFINITIONS ............................................................................................................. 13 STATISTICAL METHODS ............................................................................................................. 13 LIMITATIONS ............................................................................................................................. 14
RESULTS ......................................................................................................................................... 15 ENTERIC, FOOD, AND WATERBORNE DISEASES ............................................................................ 16
AMEBIASIS ................................................................................................................................. 19 CAMPYLOBACTERIOSIS ............................................................................................................. 27 CRYPTOSPORIDIOSIS ................................................................................................................. 35 GIARDIASIS ................................................................................................................................ 39 LISTERIOSIS ................................................................................................................................ 47 SALMONELLOSIS........................................................................................................................ 49 SHIGELLOSIS .............................................................................................................................. 57 TYPHOID FEVER ......................................................................................................................... 60 VEROTOXIGENIC E.COLI ............................................................................................................ 61
RESPIRATORY AND DIRECT CONTACT DISEASES ........................................................................... 69 BLASTOMYCOSIS ....................................................................................................................... 71 CREUTZFELDT-JAKOB DISEASE .................................................................................................. 71 MENINGOCOCCAL INVASIVE DISEASE ....................................................................................... 71 INVASIVE PNEUMOCOCCAL ...................................................................................................... 73
VACCINE PREVENTABLE DISEASES ................................................................................................. 81 DIPHTHERIA ............................................................................................................................... 83 HAEMOPHILUS INFLUENZAE NON-SEROTYPE B INVASIVE DISEASE ......................................... 83 HEPATITIS B ............................................................................................................................... 84 MUMPS ..................................................................................................................................... 87 PERTUSSIS ................................................................................................................................. 95 RUBELLA .................................................................................................................................. 103
VECTORBORNE AND ZOONOTIC DISEASES .................................................................................. 104 ANAPLASMOSIS ....................................................................................................................... 106 BRUCELLOSIS ........................................................................................................................... 106 LYME ........................................................................................................................................ 107 MALARIA ................................................................................................................................. 115 WEST NILE VIRUS .................................................................................................................... 123
EMERGING INFECTIOUS DISEASES .............................................................................................. 124 Zika Virus ................................................................................................................................. 124
APPENDIX A – Common and technical names of reportable diseases under The Manitoba Public Health Act .................................................................................................................................... 125

WRHA THE EPIDEMIOLOGY OF COMMUNICABLE DISEASES IN THE WINNIPEG HEALTH REGION 4
TABLES AND FIGURES
TABLES
TABLE 1: Number and crude rate of cases, select reportable diseases, WHR, 2011-2016........................................................................................................................................... 15 TABLE 2: Frequency, crude and age-standardized rates (per 100,000 people), enteric, food, and waterborne diseases, by community area, WHR (2011-2016) ........................ 17 TABLE 3: Frequency, crude and age-standardized rates (per 100,000 people), Amebiasis, WHR (2011-2016).............................................................................................................. 20 TABLE 4: Frequency and age-specific rates (per 100,000 people), Amebiasis, by age group, WHR (2016) ........................................................................................................... 22 TABLE 5: Frequency and age-specific rates (per 100,000 people), Amebiasis, by age group, WHR (2011-2015) .................................................................................................. 24 TABLE 6: Frequency and proportion, Amebiasis, by month, WHR (2011-2016) .............. 25 TABLE 7: Frequency, crude and age-standardized rates (per 100,000 people), Amebiasis, by community area, WHR (2011-2016) ............................................................................ 26 TABLE 8: Frequency, crude and age-standardized rates (per 100,000 people), Campylobacteriosis, WHR (2011-2016) ............................................................................ 28 TABLE 9: Frequency and age-specific rates (per 100,000 people), Campylobacteriosis, by age group, WHR (2016) ..................................................................................................... 30 TABLE 10: Frequency and age-specific rates (per 100,000 people), Campylobacteriosis, by age group, WHR (2011-2015)....................................................................................... 32 TABLE 11: Frequency and proportion, Campylobacteriosis, by month, WHR (2011-2016)........................................................................................................................................... 33 TABLE 12: Frequency, crude and age-standardized rates (per 100,000 people), Campylobacteriosis, by community area, WHR (2011-2016) ........................................... 34 TABLE 13: Frequency and crude rates (per 100,000 people), Cryptosporidiosis, WHR (2011-2016) ....................................................................................................................... 35 TABLE 14: Frequency and age-specific rates (per 100,000 people), Cryptosporidiosis, by age group, WHR (2011-2016) ........................................................................................... 36 TABLE 15: Frequency and proportion, Cryptosporidiosis, by month, WHR (2011-2016) 37 TABLE 16: Frequency and crude rates (per 100,000 people), Cryptosporidiosis, by community area, WHR (2011-2016) ................................................................................. 37 TABLE 17: Frequency, crude and age-standardized rates (per 100,000 people), Giardiasis, WHR (2011-2016).............................................................................................................. 40 TABLE 18: Frequency and age-specific rates (per 100,000 people), Giardiasis, by age group, WHR (2016) ........................................................................................................... 42 TABLE 19: Frequency and age-specific rates (per 100,000 people), Giardiasis, by age group, WHR (2011-2015) .................................................................................................. 44 TABLE 20: Frequency and proportion, Giardiasis, by month, WHR (2011-2016) ............. 45 TABLE 21: Frequency, crude and age-standardized rates (per 100,000 people), Giardiasis, by community area, WHR (2011-2016) ............................................................................ 46 TABLE 22: Frequency, Listeriosis, WHR (2011-2016) ........................................................ 47

5 WRHA THE EPIDEMIOLOGY OF COMMUNICABLE DISEASES IN THE WINNIPEG HEALTH REGION
TABLE 23: Frequency, crude and age-standardized rates (per 100,000 people), Salmonellosis, WHR (2011-2016) ...................................................................................... 50 TABLE 24: Frequency and age-specific rates (per 100,000 people), Salmonellosis, by age group, WHR (2016) ........................................................................................................... 52 TABLE 25: Frequency and age-specific rates (per 100,000 people), Salmonellosis, by age group, WHR (2011-2015) .................................................................................................. 54 TABLE 26: Frequency and proportion, Salmonellosis, by month, WHR (2011-2016) ...... 55 TABLE 27: Frequency, crude and age-standardized rates (per 100,000 people), Salmonellosis, by community area, WHR (2011-2016) .................................................... 56 TABLE 28: Frequency and crude rates (per 100,000 people), Shigellosis, WHR (2011-2016) ................................................................................................................................. 57 TABLE 29: Frequency and age-specific rates (per 100,000 people), Shigellosis, by age group, WHR (2011-2016) .................................................................................................. 58 TABLE 30: Frequency and proportion, Shigellosis, by month, WHR (2011-2016) ............ 59 TABLE 31: Frequency, Shigellosis, by community area, WHR (2011-2016) ...................... 59 Table 32: Frequency, Typhoid Fever, WHR (2011-2016) .................................................. 60 TABLE 33: Frequency, crude and age-standardized rates (per 100,000 people), Verotoxigenic E.coli, WHR (2011-2016) ............................................................................ 62 TABLE 34: Frequency and age-specific rates (per 100,000 people), Verotoxigenic, E.coli by age group, WHR (2016) ................................................................................................ 64 TABLE 35: Frequency and age-specific rates (per 100,000 people), Verotoxigenic E.coli, by age group, WHR (2011-2015 ........................................................................................ 66 TABLE 36: Frequency and proportion, Verotoxigenic E.coli, by month, WHR (2011-2016)........................................................................................................................................... 67 TABLE 37: Frequency, crude and age-standardized rates (per 100,000 people), Verotoxigenic E.coli, by community area, WHR (2011-2016) .......................................... 68 TABLE 38: Frequency, crude and age-standardized rates (per 100,000 people), diseases transmitted by direct contact or respiratory routes, by community area, WHR (2011-2016) ................................................................................................................................. 70 TABLE 39: Frequency and crude rates (per 100,000 people), Blastomycosis, WHR (2011-2016) ................................................................................................................................. 71 TABLE 40: Frequency, Creutzfeldt - Jakob disease, WHR (2011-2016) ............................ 71 TABLE 41: Frequency, Meningococcal Invasive Disease, WHR (2011-2016) .................... 71 TABLE 42: Frequency, crude and age-standardized rates (per 100,000 people), Invasive Pneumococcal, WHR (2011-2016) .................................................................................... 74 TABLE 43: Frequency and age-specific rates (per 100,000 people), Invasive Pneumococcal, by age group, WHR (2016) ...................................................................... 76 TABLE 44: Frequency and age-specific rates (per 100,000 people), Invasive Pneumococcal, by age group, WHR (2011-2015) ............................................................. 78 TABLE 45: Frequency and proportion, Invasive Pneumococcal, by community area, WHR (2011-2016) ....................................................................................................................... 79 TABLE 46: Frequency, crude and age-standardized rates (per 100,000 people), Invasive Pneumococcal, by community area, WHR (2011-2016) ................................................... 80
WRHA THE EPIDEMIOLOGY OF COMMUNICABLE DISEASES IN THE WINNIPEG HEALTH REGION 6
TABLE 47: Frequency, crude and age-standardized rates (per 100,000 people), vaccine preventable diseases, by community area, WHR (2011-2016) ........................................ 82 TABLE 48: Frequency, Diphtheria, WHR (2011-2016) ...................................................... 83 TABLE 49: Frequency, Haemophilus influenzae non-serotype B invasive disease, WHR (2011-2016) ....................................................................................................................... 83 TABLE 50: Frequency and crude rates (per 100,000 people), Hepatitis B, WHR (2011-2016) ................................................................................................................................. 84 TABLE 51: Frequency and age-specific rates (per 100,000 people), Hepatitis B, by age group, WHR (2011-2016) .................................................................................................. 85 TABLE 52: Frequency and proportion, Hepatitis B, by month, WHR (2011-2016) ........... 86 Table 53: Frequency, Hepatitis B, by community area, WHR (2011-2016) ...................... 86 TABLE 54: Frequency, crude and age-standardized rates (per 100,000 people), Mumps, WHR (2011-2016).............................................................................................................. 88 TABLE 55: Frequency and age-specific rates (per 100,000 people), Mumps, by age group, WHR (2016) ....................................................................................................................... 90 TABLE 56: Frequency and age-specific rates (per 100,000 people), Mumps, by age group, WHR (2011-2015).............................................................................................................. 92 TABLE 57: Frequency and proportion, Mumps, by month, WHR (2011-2016) ................ 93 TABLE 58: Frequency, crude and age-standardized rates (per 100,000 people), Mumps, by community area, WHR (2011-2016) ............................................................................ 94 TABLE 59: Frequency, crude and age-standardized rates (per 100,000 people), Pertussis, WHR (2011-2016).............................................................................................................. 96 TABLE 60: Frequency and age-specific rates (per 100,000 people), Pertussis, by age group, WHR (2016) ........................................................................................................... 98 TABLE 61: Frequency and age-specific rates (per 100,000 people), Pertussis, by age group, WHR (2011-2015) ................................................................................................ 100 TABLE 62: Frequency and proportion, Pertussis, by month, WHR (2011-2016) ............ 101 Table 63: Frequency, crude and age-standardized rates (per 100,000 people), Pertussis, by community area, WHR (2011-2016) .......................................................................... 102 TABLE 64: Frequency, Rubella, WHR (2011-2016) .......................................................... 103 TABLE 65: Frequency, crude and age-standardized rates (per 100,000 people) by community area, vectorborne and zoonotic diseases, WHR (2011-2016) ..................... 105 TABLE 66: Frequency, Anaplasmosis, WHR (2011-2016) ............................................... 106 TABLE 67: Frequency, Brucellosis, WHR (2011-2016) .................................................... 106 TABLE 68: Frequency, crude and age-standardized rates (per 100,000 people), Lyme, WHR (2011-2016)............................................................................................................ 108 TABLE 69: Frequency and age-specific rates (per 100,000 people), Lyme, by age group, WHR (2016) ..................................................................................................................... 110 TABLE 70: Frequency and age-specific rates (per 100,000 people), Lyme, by age group, WHR (2011-2015)............................................................................................................ 112 TABLE 71: Frequency and proportion, Lyme, by month, WHR (2011-2016) .................. 113 TABLE 72: Frequency, crude and age-standardized rates (per 100,000 people), Lyme, by community area, WHR (2011-2016) ............................................................................... 114

7 WRHA THE EPIDEMIOLOGY OF COMMUNICABLE DISEASES IN THE WINNIPEG HEALTH REGION
TABLE 73: Frequency, crude and age-standardized rates (per 100,000 people), Malaria, WHR (2011-2016)............................................................................................................ 116 TABLE 74: Frequency and age-specific rates (per 100,000 people), Malaria, by age group, WHR (2016) ..................................................................................................................... 118 TABLE 75: Frequency and age-specific rates (per 100,000 people), Malaria, by age group, WHR (2011-2015)............................................................................................................ 120 TABLE 76: Frequency and proportion, Malaria, by month, WHR (2011-2016) .............. 121 TABLE 77: Frequency, crude and age-standardized rates (per 100,000 people), Malaria, by community area, WHR (2011-2016) .......................................................................... 122 TABLE 78: Frequency and crude rates (per 100,000 people), West Nile Virus, WHR (2011-2016) ............................................................................................................................... 123

WRHA THE EPIDEMIOLOGY OF COMMUNICABLE DISEASES IN THE WINNIPEG HEALTH REGION 8
FIGURES
FIGURE 1: Age-standardized rates (per 100,000 people), enteric, food, and waterborne diseases, by community area, WHR (2011-2016) ............................................................. 16 FIGURE 2: Age-standardized rates (per 100,000 people), Amebiasis, WHR (2011-2016) 19 FIGURE 3: Age-specific rates (per 100,000 people), Amebiasis, by age group and gender, WHR (2016) ....................................................................................................................... 21 FIGURE 4: Age-specific rates (per 100,000 people), Amebiasis, by age group and gender, WHR (2011-2015).............................................................................................................. 23 FIGURE 5: Frequency, Amebiasis, by month, WHR (2016 vs. 2011-2015 mean) ............. 25 FIGURE 6: Age-standardized rates (per 100,000 people), Amebiasis, by community area, WHR (2011-2016).............................................................................................................. 26 FIGURE 7: Age-standardized rates (per 100,000 people), Campylobacteriosis, WHR (2011-2016) ....................................................................................................................... 27 FIGURE 8: Age-specific rates (per 100,000 people), Campylobacteriosis, by age group and gender, WHR (2016) .................................................................................................. 29 FIGURE 9: Age-specific rates (per 100,000 people), Campylobacteriosis, by age group and gender, WHR (2011-2015) ......................................................................................... 31 FIGURE 10: Frequency, Campylobacteriosis, by month, WHR (2016 vs. 2011-2015 mean)........................................................................................................................................... 33 FIGURE 11: Age-standardized rates (per 100,000 people), Campylobacteriosis, by community area, WHR (2011-2016) ................................................................................. 34 FIGURE 12: Age-standardized rates (per 100,000 people), Giardiasis, WHR (2011-2016)........................................................................................................................................... 39 FIGURE 13: Age-specific rates (per 100,000 people), Giardiasis, by age group and gender, WHR (2016) ....................................................................................................................... 41 FIGURE 14: Age-specific rates (per 100,000 people), Giardiasis, by age group and gender, WHR (2011-2015).............................................................................................................. 43 FIGURE 15: Frequency, Giardiasis, by month, WHR (2016 vs. 2011-2015 mean) ........... 45 FIGURE 16: Age-standardized rates (per 100,000 people), Giardiasis, by community area, WHR (2011-2016).............................................................................................................. 46 FIGURE 17: Age-standardized rates (per 100,000 people), Salmonellosis, WHR (2011-2016) ................................................................................................................................. 49 FIGURE 18: Age-specific rates (per 100,000 people), Salmonellosis, by age group and gender, WHR (2016) ......................................................................................................... 51 FIGURE 19: Age-specific rates (per 100,000 people), Salmonellosis, by age group and gender, WHR (2011-2015) ................................................................................................ 53 FIGURE 20: Frequency, Salmonellosis, by month, WHR (2016 vs. 2011-2015 mean) ...... 55 FIGURE 21: Age-standardized rates (per 100,000 people), Salmonellosis, by community area, WHR (2011-2016) .................................................................................................... 56 FIGURE 22: Age-standardized rates (per 100,000 people), Verotoxigenic E.coli, WHR (2011-2016) ....................................................................................................................... 61

9 WRHA THE EPIDEMIOLOGY OF COMMUNICABLE DISEASES IN THE WINNIPEG HEALTH REGION
FIGURE 23: Age-specific rates (per 100,000 people), Verotoxigenic E.coli, by age group and gender, WHR (2016) .................................................................................................. 63 FIGURE 24: Age-specific rates (per 100,000 people), Verotoxigenic E.coli, by age group and gender, WHR (2011-2015) ......................................................................................... 65 FIGURE 25: Frequency, Verotoxigenic E.coli, by month, WHR (2016 vs. 2011-2015 mean)........................................................................................................................................... 67 FIGURE 26: Age-standardized rates (per 100,000 people), Verotoxigenic E.coli, by community area, WHR (2011-2016) ................................................................................. 68 FIGURE 27: Age-standardized rates (per 100,000 people), diseases transmitted by direct contact and respiratory routes, by community area, WHR (2011-2016) ......................... 69 FIGURE 28: Age-standardized rates (per 100,000 people), Invasive Pneumococcal, WHR (2011-2016) ....................................................................................................................... 73 FIGURE 29: Age-specific rates (per 100,000 people), Invasive Pneumococcal, by age group and gender, WHR (2016) ........................................................................................ 75 FIGURE 30: Age-specific rates (per 100,000 people), Invasive Pneumococcal, by age group and gender, WHR (2011-2016) ............................................................................... 77 FIGURE 31: Frequency, Invasive Pneumococcal, by month, WHR (2016 vs. 2011-2015 mean) ................................................................................................................................ 79 FIGURE 32: Age-standardized rates (per 100,000 people), Invasive Pneumococcal, by community area, WHR (2011-2016) ................................................................................. 80 FIGURE 33: Age-standardized rates (per 100,000 people), vaccine preventable diseases, by community area, WHR (2011-2016) ............................................................................ 81 FIGURE 34: Age-standardized rates (per 100,000 people), Mumps, WHR (2011-2016) .. 87 FIGURE 35: Age-specific rates (per 100,000 people), Mumps, by age group and gender, WHR (2016) ....................................................................................................................... 89 FIGURE 36: Age-specific rates (per 100,000 people), Mumps, by age group and gender, WHR (2011-2015).............................................................................................................. 91 FIGURE 37: Frequency, Mumps, by month, WHR (2016 vs. 2011-2015 mean) ............... 93 FIGURE 38: Age-standardized rates (per 100,000 people), Mumps, by community area, WHR (2011-2016).............................................................................................................. 94 FIGURE 39: Age-standardized rates (per 100,000 people), Pertussis, WHR (2011-2016) 95 FIGURE 40: Age-specific rates (per 100,000 people), Pertussis, by age group and gender, WHR (2016) ....................................................................................................................... 97 FIGURE 41: Age-specific rates (per 100,000 people), Pertussis, by age group and gender, WHR (2011-2015).............................................................................................................. 99 FIGURE 42: Frequency, Pertussis, by month, WHR (2016 vs. 2011-2015 mean) ........... 101 FIGURE 43: Age-standardized rates (per 100,000 people), Pertussis, by community area, WHR (2011-2016)............................................................................................................ 102 FIGURE 44: Age-standardized rates (per 100,000 people), vectorborne and zoonotic diseases, by community area, WHR (2011-2016) ........................................................... 104 FIGURE 45: Age-standardized rates (per 100,000 people), Lyme, WHR (2011-2016).... 107 FIGURE 46: Age-specific rates (per 100,000 people), Lyme, by age group and gender, WHR (2016) ..................................................................................................................... 109

WRHA THE EPIDEMIOLOGY OF COMMUNICABLE DISEASES IN THE WINNIPEG HEALTH REGION 10
FIGURE 47: Age-specific rates (per 100,000 people), Lyme, by age group and gender, WHR (2011-2015)............................................................................................................ 111 FIGURE 48: Frequency, Lyme, by month, WHR (2016 vs. 2011-2015 mean) ................. 113 FIGURE 49: Age-standardized rates (per 100,000 people), Lyme, by community area, WHR (2011-2016)............................................................................................................ 114 FIGURE 50: Age-standardized rates (per 100,000 people), Malaria, WHR (2011-2016) 115 FIGURE 51: Age-specific rates (per 100,000 people), Malaria, by age group and gender, WHR (2016) ..................................................................................................................... 117 FIGURE 52: Age-specific rates (per 100,000 people), Malaria, by age group and gender, WHR (2011-2016)............................................................................................................ 119 FIGURE 53: Frequency, Malaria, by month, WHR (2016 vs. 2011-2015 mean) ............. 121 FIGURE 54: Age-standardized rates (per 100,000 people), Malaria, by community area, WHR (2011-2016)............................................................................................................ 122

11 WRHA THE EPIDEMIOLOGY OF COMMUNICABLE DISEASES IN THE WINNIPEG HEALTH REGION
EXECUTIVE SUMMARY This report, The epidemiology of communicable diseases in the
Winnipeg Health Region 2011-2016, provides a regional
surveillance summary of select infections/diseases listed as
reportable under The Manitoba Public Health Act (with the
exception of influenza, tuberculosis, and sexually transmitted
and blood-borne infections as they are reported elsewhere).
The report is divided into five broad disease categories (i)
Enteric, food, and waterborne diseases (ii) Respiratory and
direct contact diseases (iii) Vaccine preventable diseases, and
(iv) Vector-borne and zoonotic diseases, and iv) Emerging
infectious diseases. Within each section, diseases are presented
separately with the type of analysis based on the number of
cases reported in 2016. As this is a technical surveillance
report, results are limited to statistical tabulations by age, sex,
and geographical data.
This report contains the most current description of the broad
patterns of communicable diseases in the Winnipeg Health
Region and is intended to provide evidence to inform the
planning of programs and policies for prevention.

WRHA THE EPIDEMIOLOGY OF COMMUNICABLE DISEASES IN THE WINNIPEG HEALTH REGION 12
INTRODUCTION
This report focuses on communicable
diseases and infections that are notifiable in
Manitoba under The Public Health Act1 (with
the exception of influenza, tuberculosis, and
sexually transmitted and blood-borne
infections, which are reported elsewhere).
Communicable diseases (CD) are investigated
and managed by a team of Public Health
Nurses, Public Health Inspectors,
Communicable Disease Coordinators and
Medical Officers of Health/Team Managers,
and analyzed by Population Health
Surveillance epidemiologists, with the primary
goal of reducing the transmission and spread
of CDs, and ensuring public safety.
As the prevention, treatment, and
management of communicable diseases
remains a priority for the Winnipeg Regional
Health Authority (WRHA), epidemiologic
information at the regional level is essential
for program and planning purposes.
Therefore, this report provides the most up-
to-date information available on the
descriptive epidemiology of select
communicable diseases in the Winnipeg
Health Region (WHR).
1 http://www.gov.mb.ca/health/publichealth/act.html
METHODS
DATA SOURCE AND CASE DEFINITIONS
Case definitions, reporting requirements and
guidelines for case management and contact
investigation are outlined in the provincial
disease management protocols2. Laboratory
and clinical case reports are submitted by
laboratories and health care providers to
Manitoba Health; and subsequently referred
to Regional Health Authorities for follow-up.
Upon receipt of a referral, and for the
duration of follow-up, regional public health
nurses collect standardized case and contact
information through client interviews, and by
reviewing hospital and laboratory records.
Information collected on each client includes
sociodemographic information (e.g., birth
date, gender, address of residence) as well as
clinical information (e.g., results of microbial
testing). Data are entered into the regional
public health information system (iPHIS), a
Web-based application that facilitates
charting of information on patients with
select notifiable communicable diseases
(Appendix A) among residents of the WHR or
for clients whose care is managed by the
WHR.
2
http://www.gov.mb.ca/health/publichealth/cdc/protocol/index.h
tml, Assessed December 12, 2014

13 WRHA THE EPIDEMIOLOGY OF COMMUNICABLE DISEASES IN THE WINNIPEG HEALTH REGION
INCLUSION/EXCLUSION CRITERIA
All confirmed cases of select notifiable
communicable diseases reported among
residents of the WHR at the time of diagnosis
between January 1, 2011 and December 31,
2016 were included in the analysis.
Anaplasmosis and Babesiosis were added to
The Public Health Act on January 1, 2015 and
as such only have two years of data available.
Cases with unknown gender and those with a
missing or invalid postal code were excluded.
VARIABLE DEFINITIONS
Infections were assigned to a calendar year
based on epidate (defined as the earliest of
specimen collection date and date reported
to public health). Age of the client at the time
of infection was defined using birth date and
epidate, and age groups were assigned based
on standard convention. Infections were
assigned to community areas (CAs) using
postal code of residence at time of testing
and the 2014 Manitoba postal code
conversion file.
STATISTICAL METHODS
Annual crude rates of communicable diseases
were calculated using the corresponding
year’s mid-point WHR population as the
denominator. Population data were derived
from the Manitoba Health Insurance Registry
and provided (in electronic format) by
Manitoba Health. Population counts for 2015
and 2016 were not available at the time of
analysis; therefore, 2014 population counts
were used for all rate calculations involving
communicable diseases reported in 2015 and
2016.
Rates were directly age-standardized to the
2006 Canadian population (provided by
Statistics Canada) and 95% confidence
intervals were calculated using the Tiwari et
al.3 formula. All analyses, including mapping,
were completed using StataMP 13 (StataCorp,
College Station, TX).
Communicable diseases with less than or
equal to 5 cases reported in 2016 were not
analyzed in detail, but total case counts for
these diseases were included in Table 1, and
within overall case counts where applicable
(such as under category totals). For diseases
with less than or equal to 15 cases, graphical
analysis was not completed and standardized
rates were not calculated as small case counts
may result in unstable rates and decrease the
usefulness of any comparisons within or
between groups.
3 Tiwari RC, Clegg LX, Zou Z. Efficient interval estimation for
age-adjusted cancer rates. Stat Methods Med Res.
2006;15:547-569.
WRHA THE EPIDEMIOLOGY OF COMMUNICABLE DISEASES IN THE WINNIPEG HEALTH REGION 14
LIMITATIONS
There are a number of limitations to consider
when interpreting the findings. The
surveillance data used for this analysis do not
permit exploration of populations defined by
factors other than geography, age, and sex. As
a result, analyses exploring other variables
such as education, income or behavioural risk
factors could not be readily undertaken.
Due to different standardization methods and
the choice of standard populations, age-
standardized rates may differ from other
published reports. Rates for single years by
small geographic areas can result in rates
being calculated based on a small number of
cases. These rates are unstable and should be
interpreted with caution. Rates may be
influenced by changes in testing practices and
patterns over time. Sharp increases in rates
in a time period may due to disease
outbreaks, which are not highlighted in this
report.
The number of reported cases is a fraction of
the actual count as it is limited to those
individuals who seek medical attention and
who have samples submitted for testing.
Despite these limitations, this report provides
timely, important and quantifiable insights
into select communicable diseases in the
WHR population to inform the planning of
programs and policies for prevention.

15 WRHA THE EPIDEMIOLOGY OF COMMUNICABLE DISEASES IN THE WINNIPEG HEALTH REGION
RESULTS
2016 2011-2015
Category Disease No. Crude Rate No. Crude Rate
Enteric, Food, and Waterborne Diseases
Amebiasis 19 2.6 102 2.8
Campylobacteriosis 67 9.0 362 9.9
Cryptosporidiosis 10 1.3 75 2.1
Giardiasis 70 9.4 275 7.5
Listeriosis, invasive disease 2 - 12 0.3
Salmonellosis 136 18.3 529 14.5
Shigellosis 8 1.1 65 1.8
Typhoid Fever 5 - 21 0.6
Verotoxigenic E.coli infection 19 2.6 73 2.0
Respiratory and Direct Contact Diseases
Blastomycosis 8 1.1 1 -
Creutzfeldt-Jakob Disease 1 - 3 -
Meningococcal Invasive disease 3 - 5 -
Pneumococcal Disease, Invasive 46 6.2 342 9.4
Group B strep (neonatal) 1 - - -
Vaccine Preventable Diseases
Diphtheria 3 - 6 0.2 Haemophilus influenzae non-Serotype B Invasive Disease 4 - 29 0.8
Hepatitis B* 13 1.7 19 0.5
Mumps 89 12.0 12 0.3
Pertussis 36 4.8 36 1.0
Rubella 2 - 3 -
Vector-Borne and Zoonotic Diseases
Anaplasmosis 3 - 4 -
Brucellosis 1 - 2 -
Lyme Disease 17 2.3 45 1.2
Malaria 16 2.2 79 2.2
Q Fever 1 - 0 -
West Nile Virus 8 1.1 18 0.5
Emerging Infectious Diseases
Zika Virus 6 0.8 - -
Reportable diseases with zero cases in 2016 are not included in this report Rates were not calculated for cell counts less than 5; rate denominator is 100,000 people *includes acute infections only
TABLE 1: Number and crude rate of cases, select reportable diseases, WHR, 2011-2016

WRHA THE EPIDEMIOLOGY OF COMMUNICABLE DISEASES IN THE WINNIPEG HEALTH REGION 16
ENTERIC, FOOD, AND WATERBORNE DISEASES This section of the report provides an overview of select diseases that enter the body as a result of eating or drinking contaminated foods or liquids and result in gastrointestinal infection or intoxication. A total of 1,878 cases fell in this category between 2011 and 2016, with the highest infection rates in the Downtown (54.6/100,000 people) and River Heights (53.4/100,000 people) community areas (Figure 1; Table 2).
FIGURE 1: Age-standardized rates (per 100,000 people), enteric, food, and
waterborne diseases, by community area, WHR (2011-2016)

17 WRHA THE EPIDEMIOLOGY OF COMMUNICABLE DISEASES IN THE WINNIPEG HEALTH REGION
Number Crude Rate Age-Standardized
Rate 95%CI
Community area St. James 133 37.1 37.7 31.5 - 44.8 Assiniboine South 88 41.6 41.8 33.3 - 51.7 Fort Garry 255 51.2 50.8 44.7 - 57.4 St. Vital 159 38.4 38.3 32.5 - 44.7 St. Boniface 146 42.1 41.5 35.1 - 48.9 Transcona 77 33.7 33.4 26.3 - 41.8 River East 224 38.6 38.3 33.4 - 43.7 Seven Oaks 155 35.1 34.8 29.6 - 40.8 Inkster 69 33.9 32.0 24.9 - 40.6 Point Douglas 107 38.1 37.9 30.9 - 46.0 Downtown 284 58.1 54.6 48.4 - 61.4 River Heights 181 53.3 53.4 45.7 - 62.0 Total 1,878 42.8 42.3 40.4 - 44.3
TABLE 2: Frequency, crude and age-standardized rates (per 100,000 people), enteric, food, and waterborne diseases, by community area, WHR (2011-2016)

WRHA THE EPIDEMIOLOGY OF COMMUNICABLE DISEASES IN THE WINNIPEG HEALTH REGION 18

19 WRHA THE EPIDEMIOLOGY OF COMMUNICABLE DISEASES IN THE WINNIPEG HEALTH REGION
AMEBIASIS
FIGURE 2: Age-standardized rates (per 100,000 people), Amebiasis, WHR (2011-2016)

WRHA THE EPIDEMIOLOGY OF COMMUNICABLE DISEASES IN THE WINNIPEG HEALTH REGION 20
Total
Number Crude Rate Age-Standardized Rate 95%CI
2011 22 3.1 3.1 1.9 - 4.6 2012 27 3.7 3.8 2.5 - 5.6 2013 13 1.8 1.8 1.0 - 3.1 2014 22 3.0 3.0 1.9 - 4.6 2015 18 2.4 2.4 1.4 - 3.7 2016 19 2.6 2.5 1.5 - 3.9 Total 121 2.8 2.8 2.3 - 3.3
a) Females
Number Crude Rate Age-Standardized Rate 95%CI
2011 9 2.5 2.4 1.1 - 4.6 2012 11 3.0 3.1 1.6 - 5.6 2013 7 1.9 1.9 0.8 - 4.0 2014 9 2.4 2.5 1.1 - 4.7 2015 5 1.3 1.3 0.4 - 3.1 2016 8 2.1 2.1 0.9 - 4.2 Total 49 2.2 2.2 1.6 - 2.9
b) Males
Number Crude Rate Age-Standardized Rate 95%CI
2011 13 3.7 3.6 1.9 - 6.2 2012 16 4.5 4.6 2.6 - 7.4 2013 6 1.7 1.8 0.6 - 3.8 2014 13 3.6 3.6 1.9 - 6.2 2015 13 3.6 3.4 1.8 - 5.8 2016 11 3.0 2.9 1.5 - 5.3 Total 72 3.3 3.3 2.6 - 4.2
TABLE 3: Frequency, crude and age-standardized rates (per 100,000 people), Amebiasis, WHR
(2011-2016)

21 WRHA THE EPIDEMIOLOGY OF COMMUNICABLE DISEASES IN THE WINNIPEG HEALTH REGION
FIGURE 3: Age-specific rates (per 100,000 people), Amebiasis, by age group and gender,
WHR (2016)

WRHA THE EPIDEMIOLOGY OF COMMUNICABLE DISEASES IN THE WINNIPEG HEALTH REGION 22
a) Total
Number Age-Specific Rate 95%CI
Age group 0-4 1 2.4 0.1 - 13.4 5-9 2 4.8 0.6 - 17.5 10-19 1 1.1 0.0 - 6.2 20-29 7 6.3 2.5 - 13.0 30-39 3 2.9 0.6 - 8.4 40-49 2 2.0 0.2 - 7.2
0.0 - 5.3 0.0 - 7.3 0.0 - 7.4 1.5 - 7.0
50-59 1 1.0 60-69 1 1.3 70+ 1 1.3 Total 19 2.6
b) Females
Number Age-Specific Rate 95%CI
Age group 0-4 0 0.0 0.0 - 18.3 5-9 1 4.9 0.1 - 27.5 10-19 1 2.3 0.1 - 12.9 20-29 4 7.3 2.0 - 18.6
0.0 - 10.6 0.1 - 11.1 0.0 - 7.0 0.0 - 9.2 0.0 - 8.3 0.9 - 4.2
30-39 1 1.9 40-49 1 2.0 50-59 0 0.0 60-69 0 0.0 70+ 0 0.0 Total 8 2.1
c) Males
Number Age-Specific Rate 95%CI
Age group 0-4 1 4.7 0.1 - 26.2 5-9 1 4.7 0.1 - 26.4 10-19 0 0.0 0.0 - 8.0 20-29 3 5.3 1.1 - 15.6
0.5 - 14.0 0.1 - 11.1 0.0 - 10.7 0.1 - 15.3 0.1 - 18.2 1.5 - 5.4
30-39 2 3.9 40-49 1 2.0 50-59 1 1.9 60-69 1 2.8 70+ 1 3.3 Total 11 3.0
TABLE 4: Frequency and age-specific rates (per 100,000 people), Amebiasis, by age group,
WHR (2016)

23 WRHA THE EPIDEMIOLOGY OF COMMUNICABLE DISEASES IN THE WINNIPEG HEALTH REGION
FIGURE 4: Age-specific rates (per 100,000 people), Amebiasis, by age group and gender,
WHR (2011-2015)

WRHA THE EPIDEMIOLOGY OF COMMUNICABLE DISEASES IN THE WINNIPEG HEALTH REGION 24
a) Total
Number Age-Specific Rate 95%CI
Age group 0-4 4 2.0 0.5 - 5.0 5-9 8 4.0 1.7 - 7.8 10-19 13 2.9 1.6 - 5.0 20-29 26 4.8 3.2 - 7.1 30-39 26 5.1 3.4 - 7.5 40-49 15 3.0 1.7 - 4.9 50-59 8 1.6 0.7 - 3.1 60-69 0 0.0 0.0 - 1.0 70+ 2 0.5 0.1 - 2.0 Total 102 2.8 2.3 - 3.4
b) Females
Number Age-Specific Rate 95%CI
Age group 0-4 1 1.0 0.0 - 5.6 5-9 1 1.0 0.0 - 5.6 10-19 7 3.2 1.3 - 6.7 20-29 11 4.1 2.0 - 7.3 30-39 9 3.5 1.6 - 6.7 40-49 6 2.4 0.9 - 5.2 50-59 4 1.5 0.4 - 4.0 60-69 0 0.0 0.0 - 1.9 70+ 2 0.9 0.1 - 3.3 Total 41 2.2 1.6 - 3.0
c) Males
Number Age-Specific Rate 95%CI
Age group 0-4 3 2.9 0.6 - 8.4 5-9 7 6.8 2.7 - 14.0 10-19 6 2.6 1.0 - 5.7 20-29 15 5.5 3.1 - 9.1 30-39 17 6.8 4.0 - 10.9 40-49 9 3.6 1.6 - 6.7 50-59 4 1.6 0.4 - 4.0 60-69 0 0.0 0.0 - 2.1 70+ 0 0.0 0.0 - 2.5 Total 61 3.4 2.6 - 4.4
TABLE 5: Frequency and age-specific rates (per 100,000 people), Amebiasis, by age group,
WHR (2011-2015)

25 WRHA THE EPIDEMIOLOGY OF COMMUNICABLE DISEASES IN THE WINNIPEG HEALTH REGION
2016 2011-2015 Total No. % No. % No. %
Month January 2 10.5 8 7.8 10 8.3 February 1 5.3 3 2.9 4 3.3 March 2 10.5 12 11.8 14 11.6 April 1 5.3 7 6.7 8 6.6 May 1 5.3 9 8.8 10 8.3 June 2 10.5 11 10.8 13 10.7 July 2 10.5 9 8.8 11 9.1 August 3 15.8 10 9.8 13 10.7 September 1 5.3 11 10.8 12 9.9 October 0 0.0 11 10.8 11 9.1 November 1 5.3 6 5.9 7 5.8 December 3 15.8 5 4.9 8 6.6
FIGURE 5: Frequency, Amebiasis, by month, WHR (2016 vs. 2011-2015 mean)
TABLE 6: Frequency and proportion, Amebiasis, by month, WHR (2011-2016)

WRHA THE EPIDEMIOLOGY OF COMMUNICABLE DISEASES IN THE WINNIPEG HEALTH REGION 26
Number Crude Rate Age-Standardized Rate 95%CI
Community area St. James 2 0.6 0.7 0.1 - 2.4 Assiniboine South 1 0.5 0.5 0.0 - 2.7 Fort Garry 17 3.4 3.3 1.9 - 5.4 St. Vital 5 1.2 1.3 0.4 - 3.0 St. Boniface 5 1.4 1.4 0.5 - 3.4 Transcona 2 0.9 0.9 0.1 - 3.1 River East 17 2.9 3.1 1.8 - 4.9 Seven Oaks 25 5.7 5.6 3.6 - 8.3 Inkster 8 3.9 3.8 1.6 - 7.5 Point Douglas 6 2.1 2.1 0.8 - 4.5 Downtown 26 5.3 5.1 3.3 - 7.5 River Heights 7 2.1 1.9 0.8 - 4.0 Total 121 2.8 2.8 2.3 - 3.3
FIGURE 6: Age-standardized rates (per 100,000 people), Amebiasis, by community area, WHR (2011-
2016)
TABLE 7: Frequency, crude and age-standardized rates (per 100,000 people), Amebiasis, by
community area, WHR (2011-2016)

27 WRHA THE EPIDEMIOLOGY OF COMMUNICABLE DISEASES IN THE WINNIPEG HEALTH REGION
CAMPYLOBACTERIOSIS
FIGURE 7: Age-standardized rates (per 100,000 people), Campylobacteriosis, WHR (2011-
2016)
WRHA THE EPIDEMIOLOGY OF COMMUNICABLE DISEASES IN THE WINNIPEG HEALTH REGION 28
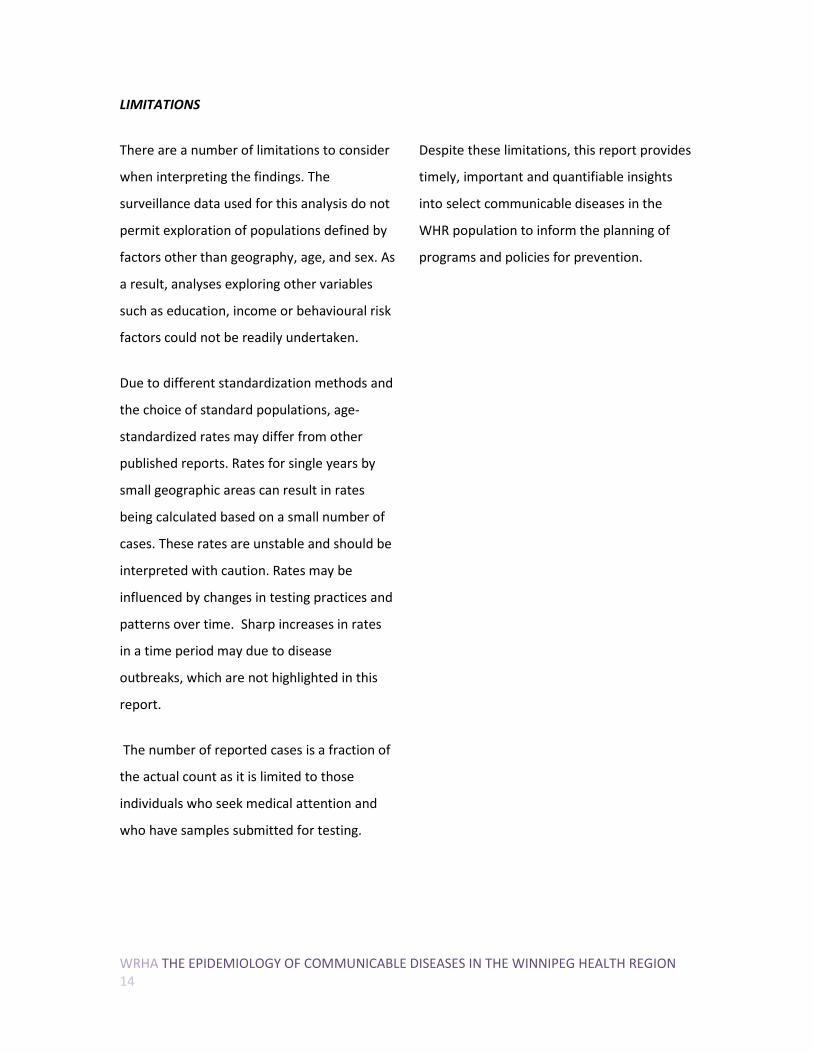
a) Total
Number Crude Rate Age-Standardized Rate 95%CI
2011 125 17.6 17.4 14.5 - 20.8 2012 74 10.3 10.2 8.0 - 12.8 2013 68 9.3 9.1 7.0 - 11.5 2014 50 6.7 6.5 4.8 - 8.6 2015 45 6.1 6.0 4.4 - 8.0 2016 67 9.0 8.9 6.9 - 11.3 Total 429 9.8 9.6 8.7 - 10.6
b) Females
Number Crude Rate Age-Standardized Rate 95%CI
2011 69 19.0 18.8 14.6 - 23.8 2012 37 10.1 9.7 6.8 - 13.4 2013 42 11.3 11.1 8.0 - 15.0 2014 26 6.9 6.7 4.4 - 9.9 2015 23 6.1 5.9 3.7 - 8.9 2016 37 9.8 9.7 6.8 - 13.4 Total 234 10.5 10.3 9.0 - 11.7
c) Males
Number Crude Rate Age-Standardized Rate 95%CI
2011 56 16.2 16.1 12.1 - 20.9 2012 37 10.5 10.4 7.3 - 14.4 2013 26 7.2 7.0 4.6 - 10.3 2014 24 6.6 6.4 4.1 - 9.5 2015 22 6.0 6.0 3.8 - 9.1 2016 30 8.2 8.1 5.4 - 11.5 Total 195 9.0 8.9 7.7 - 10.3
TABLE 8: Frequency, crude and age-standardized rates (per 100,000 people),
Campylobacteriosis, WHR (2011-2016)

29 WRHA THE EPIDEMIOLOGY OF COMMUNICABLE DISEASES IN THE WINNIPEG HEALTH REGION
FIGURE 8: Age-specific rates (per 100,000 people), Campylobacteriosis, by age group and gender,
WHR (2016)

WRHA THE EPIDEMIOLOGY OF COMMUNICABLE DISEASES IN THE WINNIPEG HEALTH REGION 30
a) Total
Number Age-Specific Rate 95%CI
Age group 0-4 5 12.1 3.9 - 28.2 5-9 0 0.0 0.0 - 8.9 10-19 3 3.4 0.7 - 9.8 20-29 8 7.2 3.1 - 14.2 30-39 8 7.7 3.3 - 15.2 40-49 9 9.0 4.1 - 17.1 50-59 14 13.4 7.3 - 22.4 60-69 13 17.1 9.1 - 29.2 70+ 7 9.3 3.7 - 19.2 Total 67 9.0 7.0 - 11.4
b) Female
Number Age-Specific Rate 95%CI
Age group 0-4 1 5.0 0.1 - 27.7 5-9 0 0.0 0.0 - 18.2 10-19 2 4.6 0.6 - 16.7 20-29 3 5.5 1.1 - 15.9 30-39 7 13.4 5.4 - 27.5 40-49 4 8.0 2.2 - 20.5 50-59 8 15.2 6.6 - 30.0 60-69 9 22.6 10.3 - 42.8 70+ 3 6.8 1.4 - 19.7 Total 37 9.8 6.9 - 13.5
c) Male
Number Age-Specific Rate 95%CI
Age group 0-4 4 18.8 5.1 - 48.1 5-9 0 0.0 0.0 - 17.5 10-19 1 2.2 0.1 - 12.1 20-29 5 8.9 2.9 - 20.8 30-39 1 1.9 0.0 - 10.8 40-49 5 10.0 3.2 - 23.3 50-59 6 11.5 4.2 - 25.0 60-69 4 11.0 3.0 - 28.2 70+ 4 13.0 3.6 - 33.4 Total 30 8.2 5.5 - 11.7
TABLE 9: Frequency and age-specific rates (per 100,000 people), Campylobacteriosis, by age
group, WHR (2016)

31 WRHA THE EPIDEMIOLOGY OF COMMUNICABLE DISEASES IN THE WINNIPEG HEALTH REGION
FIGURE 9: Age-specific rates (per 100,000 people), Campylobacteriosis, by age group and
gender, WHR (2011-2015)

WRHA THE EPIDEMIOLOGY OF COMMUNICABLE DISEASES IN THE WINNIPEG HEALTH REGION 32
a) Total
Number Age-Specific Rate 95%CI
Age group 0-4 22 10.8 6.7 - 16.3 5-9 10 5.0 2.4 - 9.1 10-19 22 4.9 3.1 - 7.5 20-29 71 13.2 10.3 - 16.6 30-39 43 8.5 6.2 - 11.5 40-49 52 10.3 7.7 - 13.5 50-59 65 12.6 9.7 - 16.1 60-69 39 10.7 7.6 - 14.6 70+ 38 10.3 7.3 - 14.2 Total 362 9.9 8.9 - 11.0
b) Female
Number Age-Specific Rate 95%CI
Age group 0-4 11 11.0 5.5 - 19.7 5-9 6 6.1 2.2 - 13.2 10-19 14 6.5 3.5 - 10.9 20-29 38 14.2 10.0 - 19.5 30-39 18 7.1 4.2 - 11.2 40-49 28 11.1 7.3 - 16.0 50-59 35 13.5 9.4 - 18.8 60-69 22 11.5 7.2 - 17.5 70+ 25 11.4 7.4 - 16.9 Total 197 10.6 9.2 - 12.2
c) Male
Number Age-Specific Rate 95%CI
Age group 0-4 11 10.5 5.3 - 18.8 5-9 4 3.9 1.1 - 9.9 10-19 8 3.5 1.5 - 6.9 20-29 33 12.2 8.4 - 17.1 30-39 25 10.0 6.5 - 14.7 40-49 24 9.5 6.1 - 14.1 50-59 30 11.7 7.9 - 16.7 60-69 17 9.8 5.7 - 15.6 70+ 13 8.7 4.7 - 15.0 Total 165 9.2 7.9 - 10.7
TABLE 10: Frequency and age-specific rates (per 100,000 people), Campylobacteriosis, by age
group, WHR (2011-2015)

33 WRHA THE EPIDEMIOLOGY OF COMMUNICABLE DISEASES IN THE WINNIPEG HEALTH REGION
2016 2011-2015 Total No. % No. % No. %
Month January 4 6.0 21 5.8 25 5.8 February 4 6.0 23 6.4 27 6.3 March 3 4.5 32 8.8 35 8.2 April 5 7.5 17 4.7 22 5.1 May 4 6.0 12 3.3 16 3.7 June 9 13.4 31 8.6 40 9.3 July 8 12.0 42 11.6 50 11.7 August 13 19.4 69 19.1 82 19.1 September 8 12.0 41 11.3 49 11.4 October 3 4.5 31 8.6 34 7.9 November 3 4.5 23 6.4 26 6.1 December 3 4.5 20 5.5 23 5.4
FIGURE 10: Frequency, Campylobacteriosis, by month, WHR (2016 vs. 2011-2015 mean)
TABLE 11: Frequency and proportion, Campylobacteriosis, by month, WHR (2011-2016)

WRHA THE EPIDEMIOLOGY OF COMMUNICABLE DISEASES IN THE WINNIPEG HEALTH REGION 34
Number Crude Rate Age-Standardized Rate 95%CI
Community area St. James 36 10.0 9.9 6.9 - 13.8 Assiniboine South 30 14.2 13.7 9.1 - 19.8 Fort Garry 58 11.6 11.6 8.8 - 15.1 St. Vital 32 7.7 7.5 5.1 - 10.6 St. Boniface 35 10.1 9.8 6.8 - 13.6 Transcona 19 8.3 8.6 5.2 - 13.4 River East 48 8.3 8.0 5.9 - 10.6 Seven Oaks 23 5.2 5.2 3.3 - 7.8 Inkster 14 6.9 6.5 3.6 - 11.0 Point Douglas 23 8.2 8.2 5.2 - 12.5 Downtown 52 10.6 10.5 7.8 - 13.8 River Heights 59 17.4 16.9 12.8 - 21.9 Total 429 9.8 9.6 8.7 - 10.6
FIGURE 11: Age-standardized rates (per 100,000 people), Campylobacteriosis, by community
area, WHR (2011-2016)
TABLE 12: Frequency, crude and age-standardized rates (per 100,000 people),
Campylobacteriosis, by community area, WHR (2011-2016)

35 WRHA THE EPIDEMIOLOGY OF COMMUNICABLE DISEASES IN THE WINNIPEG HEALTH REGION
CRYPTOSPORIDIOSIS
a) Total
Number Crude Rate
2011 9 1.3 2012 11 1.5 2013 7 1.0 2014 40 5.4 2015 8 1.1 2016 10 1.3 Total 85 1.9
b) Females
Number Crude Rate
2011 5 1.4 2012 7 1.9 2013 5 1.3 2014 18 4.8 2015 5 1.3 2016 2 0.5 Total 42 1.9
c) Males
Number Crude Rate
2011 4 1.2 2012 4 1.1 2013 2 0.6 2014 22 6.0 2015 3 0.8 2016 8 2.2 Total 43 2.0
TABLE 13: Frequency and crude rates (per 100,000 people), Cryptosporidiosis, WHR (2011-
2016)

WRHA THE EPIDEMIOLOGY OF COMMUNICABLE DISEASES IN THE WINNIPEG HEALTH REGION 36
a) Total
2016 2011-2015
Number Age-Specific Rate Number Age-Specific Rate
Age group 0-4 0 0.0 16 7.8 5-9 3 7.2 6 3.0 10-19 1 1.1 14 3.1 20-29 4 3.6 15 2.8 30-39 2 1.9 11 2.2 40-49 0 0.0 9 1.8 50-59 0 0.0 1 0.2 60-69 0 0.0 2 0.5 70+ 0 0.0 1 0.3 Total 10 1.3 75 2.1
b) Females
Number Age-Specific Rate Number Age-Specific Rate
Age group 0-4 0 0.0 5 5.0 5-9 0 0.0 2 2.0 10-19 0 0.0 6 2.8 20-29 1 1.8 12 4.5 30-39 1 1.9 9 3.5 40-49 0 0.0 4 1.6 50-59 0 0.0 1 0.4 60-69 0 0.0 1 0.5 70+ 0 0.0 0 0.0 Total 2 0.5 40 2.2
c) Males
Number Age-Specific Rate Number Age-Specific Rate
Age group 0-4 0 0.0 11 10.5 5-9 3 14.2 4 3.9 10-19 1 2.2 8 3.5 20-29 3 5.3 3 1.1 30-39 1 1.9 2 0.8 40-49 0 0.0 5 2.0 50-59 0 0.0 0 0.0 60-69 0 0.0 1 0.6 70+ 0 0.0 1 0.7 Total 8 2.2 35 2.0
TABLE 14: Frequency and age-specific rates (per 100,000 people), Cryptosporidiosis, by age
group, WHR (2011-2016)

37 WRHA THE EPIDEMIOLOGY OF COMMUNICABLE DISEASES IN THE WINNIPEG HEALTH REGION
Total No. %
Month
January 4 4.7 February 4 4.7 March 6 7.1 April 4 4.7 May 1 1.2 June 3 3.5 July 6 7.1 August 12 14.1 September 28 32.9 October 10 11.8 November 6 7.1 December 1 1.2
Number Crude Rate
Community area St. James 7 2.0 Assiniboine South 6 2.8 Fort Garry 13 2.6 St. Vital 16 3.9 St. Boniface 8 2.3 Transcona 5 2.2 River East 9 1.6 Seven Oaks 7 1.6 Inkster 1 0.5 Point Douglas 5 1.8 Downtown 4 0.8 River Heights 4 1.2 Total 85 1.9
TABLE 15: Frequency and proportion, Cryptosporidiosis, by month, WHR (2011-2016)
TABLE 16: Frequency and crude rates (per 100,000 people), Cryptosporidiosis, by community
area, WHR (2011-2016)

WRHA THE EPIDEMIOLOGY OF COMMUNICABLE DISEASES IN THE WINNIPEG HEALTH REGION 38

39 WRHA THE EPIDEMIOLOGY OF COMMUNICABLE DISEASES IN THE WINNIPEG HEALTH REGION
GIARDIASIS
FIGURE 12: Age-standardized rates (per 100,000 people), Giardiasis, WHR (2011-2016)

WRHA THE EPIDEMIOLOGY OF COMMUNICABLE DISEASES IN THE WINNIPEG HEALTH REGION 40
a) Total
Number Crude Rate Age-Standardized Rate
95%CI
2011 60 8.5 8.6 6.5 - 11.0 2012 59 8.2 8.3 6.3 - 10.7 2013 44 6.0 6.0 4.4 - 8.1 2014 50 6.7 6.7 5.0 - 8.9 2015 62 8.3 8.3 6.4 - 10.7 2016 70 9.4 9.3 7.3 - 11.8 Total 345 7.9 7.9 7.1 - 8.8
b) Female
Number Crude Rate Age-Standardized Rate
95%CI
2011 28 7.7 8.1 5.4 - 11.7 2012 22 6.0 6.2 3.8 - 9.3 2013 10 2.7 2.7 1.3 - 5.0 2014 22 5.8 6.1 3.8 - 9.2 2015 17 4.5 4.6 2.7 - 7.4 2016 25 6.6 6.6 4.2 - 9.7 Total 124 5.5 5.7 4.7 - 6.8
c) Male
Number Crude Rate Age-Standardized Rate
95%CI
2011 32 9.2 9.1 6.2 - 12.8 2012 37 10.5 10.4 7.3 - 14.3 2013 34 9.5 9.3 6.4 - 13.0 2014 28 7.7 7.3 4.8 - 10.6 2015 45 12.3 12.1 8.8 - 16.2 2016 45 12.3 12.1 8.8 - 16.2 Total 221 10.3 10.1 8.8 - 11.5
TABLE 17: Frequency, crude and age-standardized rates (per 100,000 people), Giardiasis,
WHR (2011-2016)
41 WRHA THE EPIDEMIOLOGY OF COMMUNICABLE DISEASES IN THE WINNIPEG HEALTH REGION
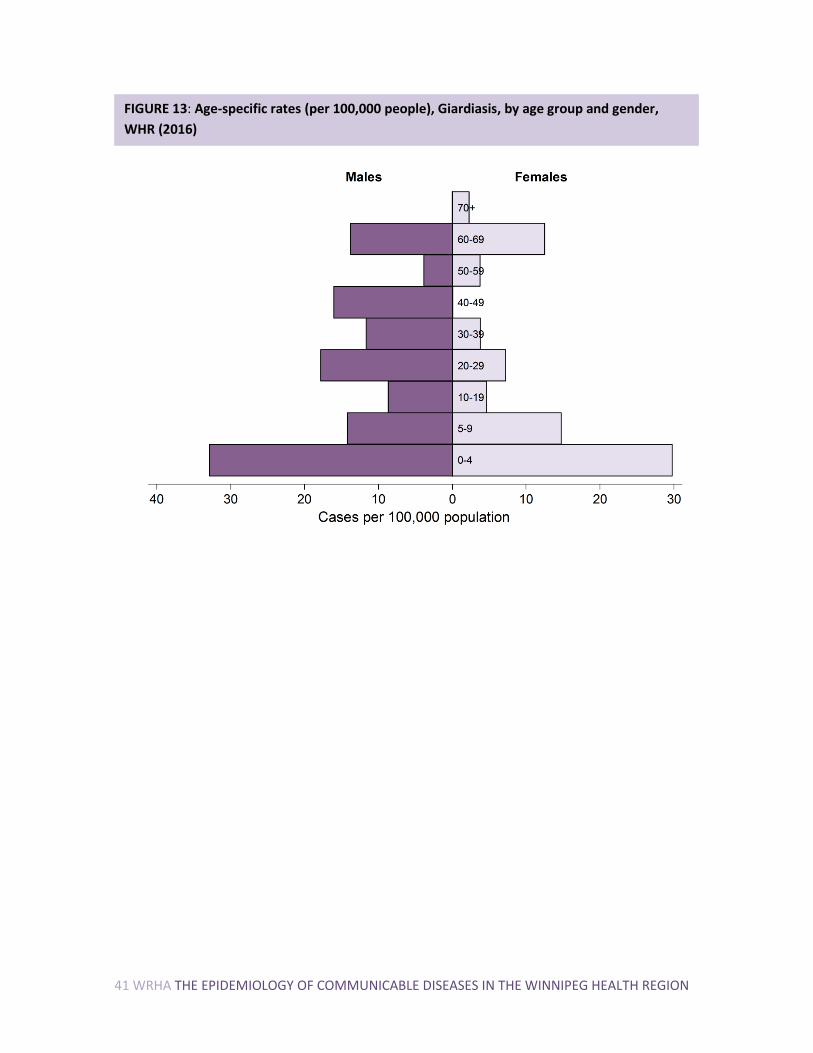
FIGURE 13: Age-specific rates (per 100,000 people), Giardiasis, by age group and gender,
WHR (2016)

WRHA THE EPIDEMIOLOGY OF COMMUNICABLE DISEASES IN THE WINNIPEG HEALTH REGION 42
a) Total
Number Age-Specific Rate 95%CI
Age group 0-4 13 31.4 16.7 - 53.6 5-9 6 14.5 5.3 - 31.6 10-19 6 6.7 2.5 - 14.6 20-29 14 12.6 6.9 - 21.1 30-39 8 7.7 3.3 - 15.2 40-49 8 8.0 3.5 - 15.8 50-59 4 3.8 1.0 - 9.8 60-69 10 13.1 6.3 - 24.1 70+ 1 1.3 0.0 - 7.4 Total 70 9.4 7.3 - 11.9
b) Females
Number Age-Specific Rate 95%CI
Age group 0-4 6 29.8 10.9 - 64.8 5-9 3 14.8 3.0 - 43.2 10-19 2 4.6 0.6 - 16.7 20-29 4 7.3 2.0 - 18.6 30-39 2 3.8 0.5 - 13.8 40-49 0 0.0 0.0 - 7.4 50-59 2 3.8 0.5 - 13.7 60-69 5 12.5 4.1 - 29.3 70+ 1 2.3 0.1 - 12.5 Total 25 6.6 4.3 - 9.8
c) Males
Number Age-Specific Rate 95%CI
Age group 0-4 7 32.9 13.2 - 67.7 5-9 3 14.2 2.9 - 41.5 10-19 4 8.7 2.4 - 22.3 20-29 10 17.8 8.5 - 32.8 30-39 6 11.6 4.3 - 25.3 40-49 8 16.0 6.9 - 31.5 50-59 2 3.8 0.5 - 13.8 60-69 5 13.8 4.5 - 32.1 70+ 0 0.0 0.0 - 12.0 Total 45 12.3 9.0 - 16.5
TABLE 18: Frequency and age-specific rates (per 100,000 people), Giardiasis, by age group,
WHR (2016)

43 WRHA THE EPIDEMIOLOGY OF COMMUNICABLE DISEASES IN THE WINNIPEG HEALTH REGION
FIGURE 14: Age-specific rates (per 100,000 people), Giardiasis, by age group and gender,
WHR (2011-2015)

WRHA THE EPIDEMIOLOGY OF COMMUNICABLE DISEASES IN THE WINNIPEG HEALTH REGION 44
a) Total
Number Age-Specific Rate 95%CI
Age group
0-4 72 35.2 27.6 - 44.3 5-9 48 23.8 17.5 - 31.5 10-19 28 6.3 4.2 - 9.1 20-29 30 5.6 3.8 - 7.9 30-39 35 6.9 4.8 - 9.6 40-49 26 5.1 3.4 - 7.5 50-59 16 3.1 1.8 - 5.0 60-69 17 4.7 2.7 - 7.5 70+ 3 0.8 0.2 - 2.4 Total 275 7.5 6.7 - 8.5
b) Females
Number Age-Specific Rate 95%CI
Age group
0-4 26 26.0 17.0 - 38.1 5-9 19 19.3 11.6 - 30.1 10-19 12 5.5 2.9 - 9.7 20-29 9 3.4 1.5 - 6.4 30-39 11 4.3 2.2 - 7.7 40-49 9 3.6 1.6 - 6.7 50-59 6 2.3 0.9 - 5.0 60-69 6 3.1 1.2 - 6.9 70+ 1 0.5 0.0 - 2.5 Total 99 5.3 4.3 - 6.5
c) Males
Number Age-Specific Rate 95%CI
Age group
0-4 46 44.0 32.2 - 58.7 5-9 29 28.1 18.8 - 40.4 10-19 16 7.0 4.0 - 11.3 20-29 21 7.8 4.8 - 11.9 30-39 24 9.6 6.1 - 14.3 40-49 17 6.7 3.9 - 10.7 50-59 10 3.9 1.9 - 7.2 60-69 11 6.3 3.2 - 11.3 70+ 2 1.3 0.2 - 4.9 Total 176 9.8 8.4 - 11.4
TABLE 19: Frequency and age-specific rates (per 100,000 people), Giardiasis, by age group,
WHR (2011-2015)
45 WRHA THE EPIDEMIOLOGY OF COMMUNICABLE DISEASES IN THE WINNIPEG HEALTH REGION
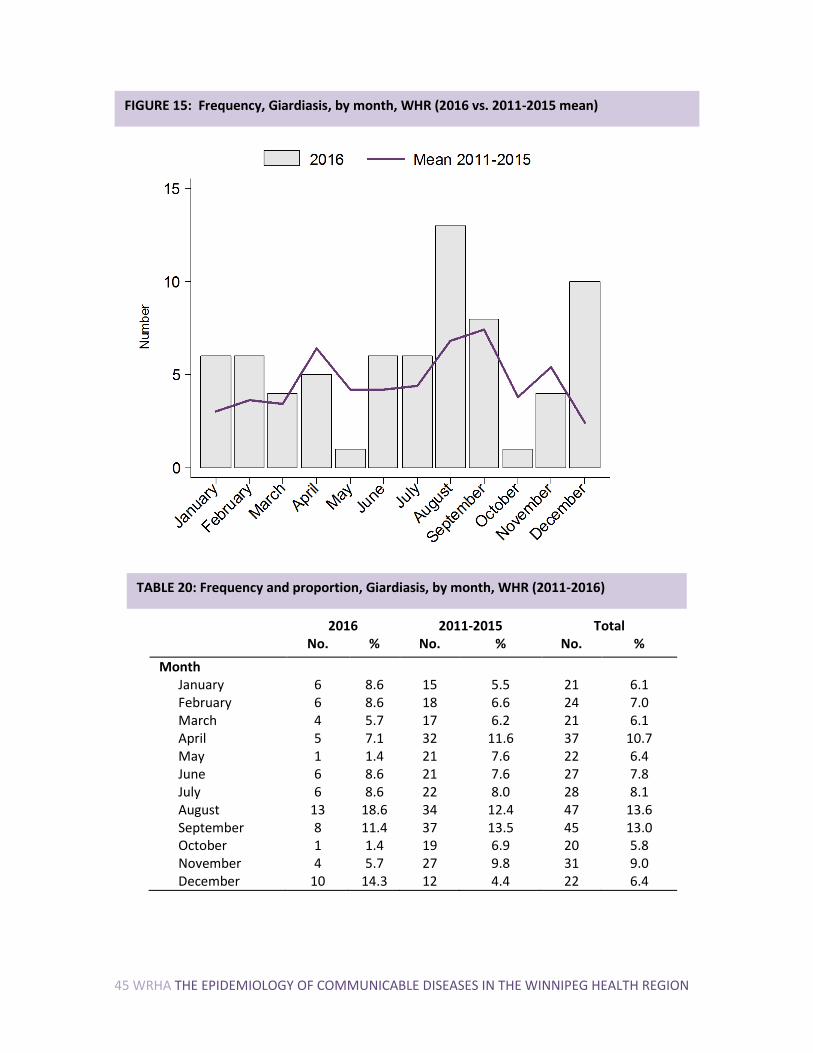
2016 2011-2015 Total No. % No. % No. %
Month January 6 8.6 15 5.5 21 6.1 February 6 8.6 18 6.6 24 7.0 March 4 5.7 17 6.2 21 6.1 April 5 7.1 32 11.6 37 10.7 May 1 1.4 21 7.6 22 6.4 June 6 8.6 21 7.6 27 7.8 July 6 8.6 22 8.0 28 8.1 August 13 18.6 34 12.4 47 13.6 September 8 11.4 37 13.5 45 13.0 October 1 1.4 19 6.9 20 5.8 November 4 5.7 27 9.8 31 9.0 December 10 14.3 12 4.4 22 6.4
FIGURE 15: Frequency, Giardiasis, by month, WHR (2016 vs. 2011-2015 mean)
TABLE 20: Frequency and proportion, Giardiasis, by month, WHR (2011-2016)

WRHA THE EPIDEMIOLOGY OF COMMUNICABLE DISEASES IN THE WINNIPEG HEALTH REGION 46
Number Crude Rate Age-Standardized Rate 95%CI
Community area
St. James 7 2.0 2.3 0.9 - 4.6 Assiniboine South 6 2.8 3.4 1.2 - 7.2 Fort Garry 13 2.6 2.5 1.3 - 4.4 St. Vital 16 3.9 4.0 2.3 - 6.5 St. Boniface 8 2.3 2.4 1.0 - 4.6 Transcona 5 2.2 2.1 0.7 - 4.9 River East 9 1.6 1.6 0.7 - 3.0 Seven Oaks 7 1.6 1.6 0.6 - 3.3 Inkster 1 0.5 0.4 0.0 - 2.6 Point Douglas 5 1.8 1.6 0.5 - 3.9 Downtown 4 0.8 0.7 0.2 - 1.9 River Heights 4 1.2 1.2 0.3 - 3.1 Total 85 1.9 1.9 1.5 - 2.4
FIGURE 16: Age-standardized rates (per 100,000 people), Giardiasis, by community area,
WHR (2011-2016)
TABLE 21: Frequency, crude and age-standardized rates (per 100,000 people), Giardiasis, by
community area, WHR (2011-2016)

47 WRHA THE EPIDEMIOLOGY OF COMMUNICABLE DISEASES IN THE WINNIPEG HEALTH REGION
LISTERIOSIS
Number
Year 2011 3 2012 3 2013 1 2014 2 2015 3 2016 2 Total 14
TABLE 22: Frequency, Listeriosis, WHR (2011-2016)

WRHA THE EPIDEMIOLOGY OF COMMUNICABLE DISEASES IN THE WINNIPEG HEALTH REGION 48

49 WRHA THE EPIDEMIOLOGY OF COMMUNICABLE DISEASES IN THE WINNIPEG HEALTH REGION
SALMONELLOSIS
FIGURE 17: Age-standardized rates (per 100,000 people), Salmonellosis, WHR (2011-2016)

WRHA THE EPIDEMIOLOGY OF COMMUNICABLE DISEASES IN THE WINNIPEG HEALTH REGION 50
a) Total
Number Crude Rate Age-Standardized Rate 95%CI
2011 88 12.4 12.2 9.8 - 15.1 2012 98 13.6 13.3 10.8 - 16.3 2013 120 16.4 16.2 13.4 - 19.4 2014 109 14.7 14.4 11.8 - 17.3 2015 114 15.3 15.0 12.4 - 18.0 2016 136 18.3 18.0 15.1 - 21.3 Total 665 15.1 14.9 13.8 - 16.1
b) Females
Number Crude Rate Age-Standardized Rate 95%CI
2011 49 13.5 13.1 9.7 - 17.3 2012 38 10.3 10.2 7.2 - 14.0 2013 55 14.8 14.5 10.9 - 18.9 2014 61 16.1 15.7 12.0 - 20.2 2015 63 16.7 16.2 12.4 - 20.7 2016 82 21.7 21.1 16.8 - 26.2 Total 348 15.6 15.2 13.6 - 16.9
c) Males
Number Crude Rate Age-Standardized Rate
95%CI
2011 39 11.2 11.1 7.9 - 15.2 2012 60 17.0 16.7 12.7 - 21.5 2013 65 18.1 17.9 13.8 - 22.8 2014 48 13.1 12.9 9.5 - 17.1 2015 51 14.0 13.6 10.1 - 18.0 2016 54 14.8 14.5 10.9 - 19.0 Total 317 14.7 14.5 12.9 - 16.1
TABLE 23: Frequency, crude and age-standardized rates (per 100,000 people), Salmonellosis,
WHR (2011-2016)

51 WRHA THE EPIDEMIOLOGY OF COMMUNICABLE DISEASES IN THE WINNIPEG HEALTH REGION
FIGURE 18: Age-specific rates (per 100,000 people), Salmonellosis, by age group and gender, WHR
(2016)

WRHA THE EPIDEMIOLOGY OF COMMUNICABLE DISEASES IN THE WINNIPEG HEALTH REGION 52
a) Total
Number Age-Specific Rate 95%CI
Age group 0-4 15 36.2 20.3 - 59.7 5-9 9 21.7 9.9 - 41.3 10-19 6 6.7 2.5 - 14.6 20-29 21 18.9 11.7 - 28.9 30-39 17 16.4 9.5 - 26.2 40-49 11 11.0 5.5 - 19.7 50-59 23 21.9 13.9 - 32.9 60-69 15 19.7 11.0 - 32.5 70+ 19 25.3 15.2 - 39.5 Total 136 18.3 15.3 - 21.6
b) Females
Number Age-Specific Rate 95%CI
Age group 0-4 7 34.8 14.0 - 71.6 5-9 6 29.6 10.9 - 64.4 10-19 4 9.2 2.5 - 23.7 20-29 11 20.0 10.0 - 35.8 30-39 8 15.3 6.6 - 30.1 40-49 6 12.0 4.4 - 26.1 50-59 18 34.2 20.3 - 54.1 60-69 9 22.6 10.3 - 42.8 70+ 13 29.3 15.6 - 50.0 Total 82 21.7 17.3 – 26.9
c) Males
Number Age-Specific Rate 95%CI
Age group 0-4 8 37.6 16.2 - 74.0 5-9 3 14.2 2.9 - 41.5 10-19 2 4.3 0.5 - 15.7 20-29 10 17.8 8.5 - 32.8 30-39 9 17.5 8.0 - 33.1 40-49 5 10.0 3.2 - 23.3 50-59 5 9.6 3.1 - 23.3 60-69 6 16.5 6.1 - 35.9 70+ 6 19.6 7.2 - 42.6 Total 54 14.8 11.1 - 19.3
TABLE 24: Frequency and age-specific rates (per 100,000 people), Salmonellosis, by age
group, WHR (2016)
53 WRHA THE EPIDEMIOLOGY OF COMMUNICABLE DISEASES IN THE WINNIPEG HEALTH REGION
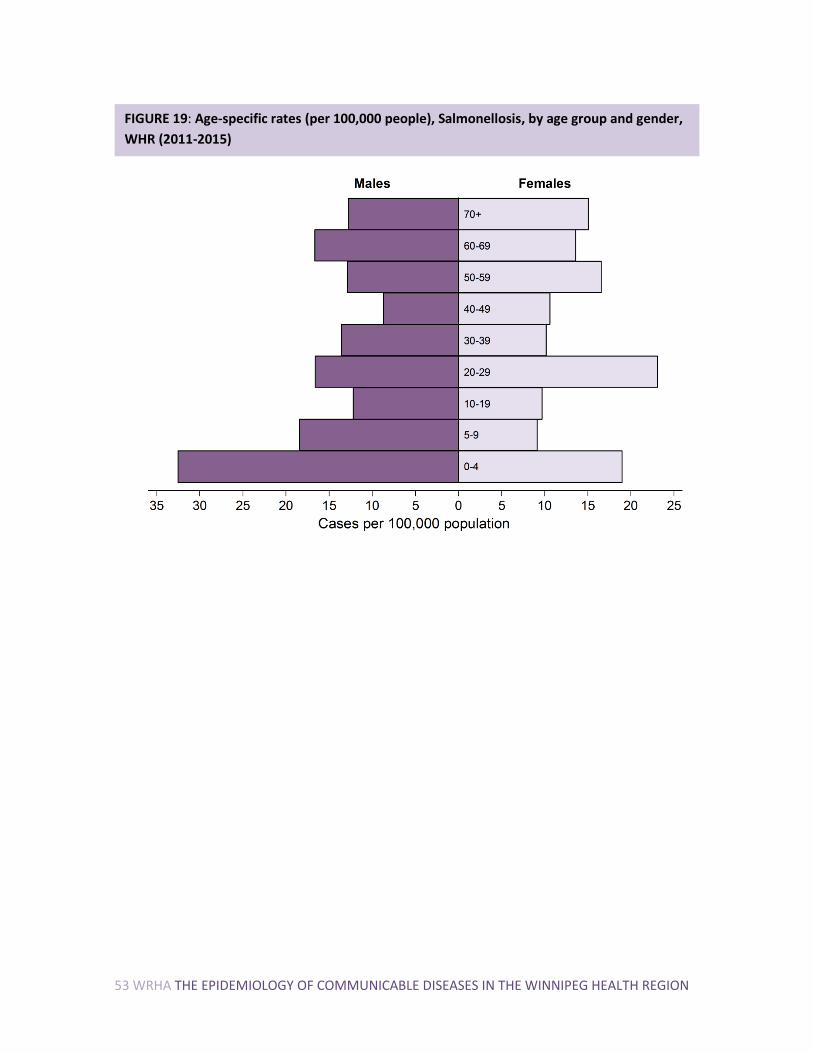
FIGURE 19: Age-specific rates (per 100,000 people), Salmonellosis, by age group and gender,
WHR (2011-2015)

WRHA THE EPIDEMIOLOGY OF COMMUNICABLE DISEASES IN THE WINNIPEG HEALTH REGION 54
a) Total
Number Age-Specific Rate 95%CI
Age group
0-4 53 25.9 19.4 - 33.9 5-9 28 13.9 9.2 - 20.0 10-19 49 11.0 8.1 - 14.5 20-29 107 19.9 16.3 - 24.0 30-39 60 11.9 9.1 - 15.3 40-49 49 9.7 7.2 - 12.8 50-59 76 14.8 11.6 - 18.5 60-69 55 15.1 11.4 - 19.6 70+ 52 14.1 10.6 - 18.6 Total 529 14.5 13.3 - 15.8
b) Females
Number Age-Specific Rate 95%CI
Age group
0-4 19 19.0 11.4 - 29.7 5-9 9 9.1 4.2 - 17.3 10-19 21 9.7 6.0 - 14.8 20-29 62 23.1 17.7 - 29.6 30-39 26 10.2 6.7 - 15.0 40-49 27 10.7 7.0 - 15.5 50-59 43 16.6 12.0 - 22.4 60-69 26 13.6 8.9 - 20.0 70+ 33 15.1 10.4 - 21.2 Total 266 14.3 12.6 - 16.1
c) Males
Number Age-Specific Rate 95%CI
Age group
0-4 34 32.5 22.5 - 45.5 5-9 19 18.4 11.1 - 28.8 10-19 28 12.2 8.1 - 17.6 20-29 45 16.6 12.1 - 22.2 30-39 34 13.6 9.4 - 19.0 40-49 22 8.7 5.4 - 13.1 50-59 33 12.9 8.9 - 18.1 60-69 29 16.7 11.2 - 23.9 70+ 19 12.8 7.7 - 20.0 Total 263 14.7 13.0 - 16.6
TABLE 25: Frequency and age-specific rates (per 100,000 people), Salmonellosis, by age
group, WHR (2011-2015)

55 WRHA THE EPIDEMIOLOGY OF COMMUNICABLE DISEASES IN THE WINNIPEG HEALTH REGION
2016 2011-2015 Total No. % No. % No. %
Month January 10 7.4 46 8.7 56 8.4 February 12 8.8 50 9.5 62 9.3 March 17 12.5 56 10.6 73 11.0 April 17 12.5 46 8.7 63 9.5 May 10 7.4 36 6.8 46 6.9 June 14 10.3 39 7.4 53 8.0 July 7 5.2 57 10.8 64 9.6 August 17 12.5 53 10.0 70 10.5 September 6 4.4 47 8.9 53 8.0 October 13 9.6 27 5.1 40 6.0 November 5 3.7 36 6.8 41 6.2 December 8 5.9 36 6.8 44 6.6
FIGURE 20: Frequency, Salmonellosis, by month, WHR (2016 vs. 2011-2015 mean)
TABLE 26: Frequency and proportion, Salmonellosis, by month, WHR (2011-2016)

WRHA THE EPIDEMIOLOGY OF COMMUNICABLE DISEASES IN THE WINNIPEG HEALTH REGION 56
Number Crude Rate Age-Standardized Rate 95%CI
Community area St. James 55 15.3 15.5 11.6 - 20.3 Assiniboine South 26 12.3 11.4 7.3 - 16.9 Fort Garry 96 19.3 19.2 15.5 - 23.5 St. Vital 65 15.7 15.2 11.8 - 19.5 St. Boniface 64 18.4 18.2 14.0 - 23.3 Transcona 35 15.3 14.9 10.4 - 20.8 River East 85 14.6 14.5 11.5 - 17.9 Seven Oaks 62 14.0 13.8 10.6 - 17.8 Inkster 18 8.8 8.6 5.0 - 13.7 Point Douglas 44 15.7 16.2 11.7 - 21.9 Downtown 57 11.7 11.0 8.3 - 14.3 River Heights 58 17.1 16.8 12.6 - 21.8 Total 665 15.1 14.9 13.8 - 16.1
FIGURE 21: Age-standardized rates (per 100,000 people), Salmonellosis, by community area,
WHR (2011-2016)
TABLE 27: Frequency, crude and age-standardized rates (per 100,000 people), Salmonellosis,
by community area, WHR (2011-2016)

57 WRHA THE EPIDEMIOLOGY OF COMMUNICABLE DISEASES IN THE WINNIPEG HEALTH REGION
SHIGELLOSIS
a) Total
Number Crude Rate
2011 14 2.0 2012 15 2.1 2013 14 1.9 2014 11 1.5 2015 11 1.5 2016 8 1.1 Total 73 1.7
b) Females
Number Crude Rate
2011 5 1.4 2012 4 1.1 2013 7 1.9 2014 4 1.1 2015 7 1.9 2016 6 1.6 Total 33 1.5
c) Males
Number Crude Rate
2011 9 2.6 2012 11 3.1 2013 7 1.9 2014 7 1.9 2015 4 1.1 2016 2 0.5 Total 40 1.9
TABLE 28: Frequency and crude rates (per 100,000 people), Shigellosis, WHR (2011-2016)

WRHA THE EPIDEMIOLOGY OF COMMUNICABLE DISEASES IN THE WINNIPEG HEALTH REGION 58
a) Total
2016 2011-2015
Number Age-Specific Rate Number Age-Specific Rate
Age group 0-4 0 0.0 9 4.4 5-9 0 0.0 9 4.5 10-19 0 0.0 5 1.1 20-29 2 1.8 14 2.6 30-39 0 0.0 6 1.2 40-49 1 1.0 9 1.8 50-59 3 2.9 4 0.8 60-69 0 0.0 4 1.1 70+ 2 2.7 5 1.4 Total 8 1.1 65 1.8
b) Females
Number Age-Specific Rate Number Age-Specific Rate
Age group 0-4 0 0.0 3 3.0 5-9 0 0.0 2 2.0 10-19 0 0.0 3 1.4 20-29 1 1.8 7 2.6 30-39 0 0.0 3 1.2 40-49 1 2.0 2 0.8 50-59 2 3.8 2 0.8 60-69 0 0.0 2 1.0 70+ 2 4.5 3 1.4 Total 6 1.6 27 1.5
c) Males
Number Age-Specific Rate Number Age-Specific Rate
Age group 0-4 0 0.0 6 5.7 5-9 0 0.0 7 6.8 10-19 0 0.0 2 0.9 20-29 1 1.8 7 2.6 30-39 0 0.0 3 1.2 40-49 0 0.0 7 2.8 50-59 1 1.9 2 0.8 60-69 0 0.0 2 1.1 70+ 0 0.0 2 1.3 Total 2 0.5 38 2.1
TABLE 29: Frequency and age-specific rates (per 100,000 people), Shigellosis, by age group, WHR (2011-2016)

59 WRHA THE EPIDEMIOLOGY OF COMMUNICABLE DISEASES IN THE WINNIPEG HEALTH REGION
Total No. %
Month January 3 4.1 February 9 12.3 March 9 12.3 April 10 13.7 May 6 8.2 June 4 5.5 July 5 6.9 August 11 15.1 September 5 6.9 October 5 6.9 November 3 4.1 December 3 4.0
Number
Community area St. James-Assiniboia 2 Assiniboine South 4 Fort Garry 14 St. Vital 4 St. Boniface 9 Transcona 3 River East 8 Seven Oaks 2 Inkster 2 Point Douglas 1 Downtown 15 River Heights 9 Total 73
TABLE 30: Frequency and proportion, Shigellosis, by month, WHR (2011-2016)
TABLE 31: Frequency, Shigellosis, by community area, WHR (2011-2016)

WRHA THE EPIDEMIOLOGY OF COMMUNICABLE DISEASES IN THE WINNIPEG HEALTH REGION 60
TYPHOID FEVER
Number
2011 7 2012 6 2013 2 2014 2 2015 4 2016 5 Total 26
Table 32: Frequency, Typhoid Fever, WHR (2011-2016)

61 WRHA THE EPIDEMIOLOGY OF COMMUNICABLE DISEASES IN THE WINNIPEG HEALTH REGION
VEROTOXIGENIC E.COLI
FIGURE 22: Age-standardized rates (per 100,000 people), Verotoxigenic E.coli, WHR (2011-
2016)

WRHA THE EPIDEMIOLOGY OF COMMUNICABLE DISEASES IN THE WINNIPEG HEALTH REGION 62
a) Total
Number Crude Rate Age-Standardized Rate
95%CI
2011 23 3.2 3.2 2.0 - 4.8 2012 17 2.4 2.4 1.4 - 3.8 2013 8 1.1 1.1 0.5 - 2.1 2014 14 1.9 1.9 1.0 - 3.2 2015 11 1.5 1.5 0.7 - 2.6 2016 19 2.6 2.6 1.5 - 4.0 Total 92 2.1 2.1 1.7 - 2.6
b) Females
Number Crude Rate Age-Standardized Rate
95%CI
2011 13 3.6 3.5 1.8 - 6.0 2012 10 2.7 2.8 1.3 - 5.2 2013 5 1.3 1.3 0.4 - 3.1 2014 6 1.6 1.7 0.6 - 3.6 2015 4 1.1 1.1 0.3 - 2.8 2016 11 2.9 3.1 1.5 - 5.4 Total 49 2.2 2.2 1.6 - 2.9
c) Males
Number Crude Rate Age-Standardized Rate
95%CI
2011 10 2.9 2.8 1.3 - 5.2 2012 7 2.0 2.0 0.8 - 4.2 2013 3 0.8 0.8 0.2 - 2.4 2014 8 2.2 2.2 0.9 - 4.2 2015 7 1.9 1.8 0.7 - 3.7 2016 8 2.2 2.1 0.9 - 4.1 Total 43 2.0 1.9 1.4 - 2.6
TABLE 33: Frequency, crude and age-standardized rates (per 100,000 people), Verotoxigenic
E.coli, WHR (2011-2016)

63 WRHA THE EPIDEMIOLOGY OF COMMUNICABLE DISEASES IN THE WINNIPEG HEALTH REGION
FIGURE 23: Age-specific rates (per 100,000 people), Verotoxigenic E.coli, by age group and
gender, WHR (2016)

WRHA THE EPIDEMIOLOGY OF COMMUNICABLE DISEASES IN THE WINNIPEG HEALTH REGION 64
a) Total
Number Age-Specific Rate 95%CI
Age group 0-4 2 4.8 0.6 - 17.4 5-9 1 2.4 0.1 - 13.5 10-19 3 3.4 0.7 - 9.8 20-29 5 4.5 1.5 - 10.5 30-39 5 4.8 1.6 - 11.2 40-49 1 1.0 0.0 - 5.6 50-59 1 1.0 0.0 - 5.3 60-69 1 1.3 0.0 - 7.3 70+ 0 0.0 0.0 - 4.9 Total 19 2.6 1.5 - 4.0
b) Females
Number Age-Specific Rate 95%CI
Age group 0-4 1 5.0 0.1 - 27.7 5-9 0 0.0 0.0 - 18.2 10-19 2 4.6 0.6 - 16.7 20-29 2 3.6 0.4 - 13.1 30-39 4 7.6 2.1 - 19.5 40-49 1 2.0 0.1 - 11.1 50-59 0 0.0 0.0 - 7.0 60-69 1 2.5 0.1 - 14.0 70+ 0 0.0 0.0 - 8.3 Total 11 2.9 1.5 - 5.2
c) Males
Number Age-Specific Rate 95%CI
Age group 0-4 1 4.7 0.1 - 26.2 5-9 1 4.7 0.1 - 26.4 10-19 1 2.2 0.1 - 12.1 20-29 3 5.3 1.1 - 15.6 30-39 1 1.9 0.0 - 10.8 40-49 0 0.0 0.0 - 7.4 50-59 1 1.9 0.0 - 10.7 60-69 0 0.0 0.0 - 10.2 70+ 0 0.0 0.0 - 12.0 Total 8 2.2 0.9 - 4.3
TABLE 34: Frequency and age-specific rates (per 100,000 people), Verotoxigenic E.coli, by age
group, WHR (2016)

65 WRHA THE EPIDEMIOLOGY OF COMMUNICABLE DISEASES IN THE WINNIPEG HEALTH REGION
FIGURE 24: Age-specific rates (per 100,000 people), Verotoxigenic E.coli, by age group and
gender, WHR (2011-2015)

WRHA THE EPIDEMIOLOGY OF COMMUNICABLE DISEASES IN THE WINNIPEG HEALTH REGION 66
a) Total
Number Age-Specific Rate 95%CI
Age group 0-4 7 3.4 1.4 - 7.1 5-9 9 4.5 2.0 - 8.5 10-19 10 2.2 1.1 - 4.1 20-29 18 3.3 2.0 - 5.3 30-39 12 2.4 1.2 - 4.2 40-49 4 0.8 0.2 - 2.0 50-59 8 1.6 0.7 - 3.1 60-69 1 0.3 0.0 - 1.5 70+ 4 1.1 0.3 - 2.8 Total 73 2.0 1.6 - 2.5
b) Females
Number Age-Specific Rate 95%CI
Age group 0-4 4 4.0 1.1 - 10.2 5-9 3 3.0 0.6 - 8.9 10-19 7 3.2 1.3 - 6.7 20-29 9 3.4 1.5 - 6.4 30-39 5 2.0 0.6 - 4.6 40-49 2 0.8 0.1 - 2.9 50-59 5 1.9 0.6 - 4.5 60-69 1 0.5 0.0 - 2.9 70+ 2 0.9 0.1 - 3.3 Total 38 2.0 1.4 - 2.8
c) Males
Number Age-Specific Rate 95%CI
Age group 0-4 3 2.9 0.6 - 8.4 5-9 6 5.8 2.1 - 12.7 10-19 3 1.3 0.3 - 3.8 20-29 9 3.3 1.5 - 6.3 30-39 7 2.8 1.1 - 5.8 40-49 2 0.8 0.1 - 2.9 50-59 3 1.2 0.2 - 3.4 60-69 0 0.0 0.0 - 2.1 70+ 2 1.3 0.2 - 4.9 Total 35 2.0 1.4 - 2.7
TABLE 35: Frequency and age-specific rates (per 100,000 people), Verotoxigenic E.coli, by age group, WHR (2011-2015
67 WRHA THE EPIDEMIOLOGY OF COMMUNICABLE DISEASES IN THE WINNIPEG HEALTH REGION
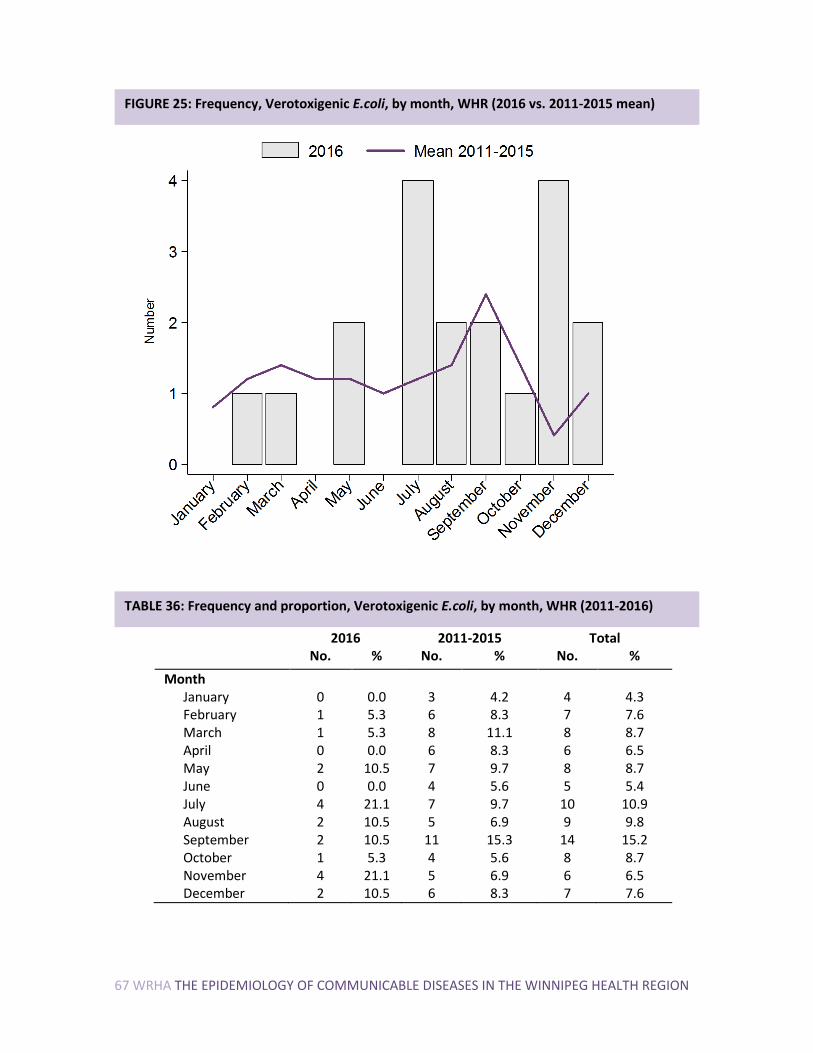
2016 2011-2015 Total No. % No. % No. %
Month January 0 0.0 3 4.2 4 4.3 February 1 5.3 6 8.3 7 7.6 March 1 5.3 8 11.1 8 8.7 April 0 0.0 6 8.3 6 6.5 May 2 10.5 7 9.7 8 8.7 June 0 0.0 4 5.6 5 5.4 July 4 21.1 7 9.7 10 10.9 August 2 10.5 5 6.9 9 9.8 September 2 10.5 11 15.3 14 15.2 October 1 5.3 4 5.6 8 8.7 November 4 21.1 5 6.9 6 6.5 December 2 10.5 6 8.3 7 7.6
FIGURE 25: Frequency, Verotoxigenic E.coli, by month, WHR (2016 vs. 2011-2015 mean)
TABLE 36: Frequency and proportion, Verotoxigenic E.coli, by month, WHR (2011-2016)

WRHA THE EPIDEMIOLOGY OF COMMUNICABLE DISEASES IN THE WINNIPEG HEALTH REGION 68
Number Crude Rate Age-Standardized Rate 95%CI
Community area St. James 5 1.4 1.5 0.5 - 3.4 Assiniboine South 9 4.3 4.8 2.1 - 9.0 Fort Garry 12 2.4 2.1 1.1 - 3.8 St. Vital 11 2.7 2.7 1.4 - 4.9 St. Boniface 5 1.4 1.5 0.5 - 3.4 Transcona 3 1.3 1.3 0.3 - 3.8 River East 16 2.8 2.8 1.6 - 4.6 Seven Oaks 7 1.6 1.6 0.6 - 3.2 Inkster 5 2.5 2.2 0.7 - 5.3 Point Douglas 7 2.5 2.5 1.0 - 5.2 Downtown 7 1.4 1.3 0.5 - 2.7 River Heights 5 1.5 1.5 0.5 - 3.6 Total 92 2.1 2.1 1.7 - 2.6
FIGURE 26: Age-standardized rates (per 100,000 people), Verotoxigenic E.coli, by community
area, WHR (2011-2016)
TABLE 37: Frequency, crude and age-standardized rates (per 100,000 people), Verotoxigenic
E.coli, by community area, WHR (2011-2016)

69 WRHA THE EPIDEMIOLOGY OF COMMUNICABLE DISEASES IN THE WINNIPEG HEALTH REGION
RESPIRATORY AND DIRECT CONTACT DISEASES This section of the report provides an overview of select diseases transmitted by direct contact or respiratory routes. A total of 433 cases fell under this category in the WHR between 2011 and 2016 representing a standardized rate of 9.9/100,000. The highest infection rates were observed in Downtown (23.7/100,000 people) and Point Douglas (22.7/100,000 people) CAs (Figure 27; Table 38).
FIGURE 27: Age-standardized rates (per 100,000 people), diseases transmitted by direct
contact and respiratory routes, by community area, WHR (2011-2016)

WRHA THE EPIDEMIOLOGY OF COMMUNICABLE DISEASES IN THE WINNIPEG HEALTH REGION 70
Number Crude Rate Age-Standardized Rate
95%CI
Community area St. James 31 8.6 8.2 5.6 - 11.8 Assiniboine South 20 9.5 7.6 4.6 - 12.1 Fort Garry 20 4.0 4.1 2.5 - 6.3 St. Vital 30 7.2 6.9 4.7 - 9.9 St. Boniface 29 8.4 8.1 5.4 - 11.6 Transcona 13 5.7 5.8 3.1 - 9.9 River East 45 7.8 7.6 5.5 - 10.1 Seven Oaks 28 6.3 6.3 4.2 - 9.1 Inkster 22 10.8 11.3 7.0 - 17.1 Point Douglas 61 21.7 22.7 17.3 - 29.3 Downtown 108 22.1 23.7 19.4 - 28.6 River Heights 26 7.7 7.1 4.6 - 10.4 Total 433 9.9 9.7 8.8 - 10.7
TABLE 38: Frequency, crude and age-standardized rates (per 100,000 people), diseases
transmitted by direct contact or respiratory routes, by community area, WHR (2011-2016)

71 WRHA THE EPIDEMIOLOGY OF COMMUNICABLE DISEASES IN THE WINNIPEG HEALTH REGION
BLASTOMYCOSIS
Number Crude Rate
2011 0 0.0
2012 1 0.1
2013 0 0.0
2014 0 0.0
2015 0 0.0
2016 8 1.1
Total 9 0.2
CREUTZFELDT-JAKOB DISEASE
Number
year 2011 0 2012 0 2013 0 2014 3 2015 0 2016 1 Total 4
MENINGOCOCCAL INVASIVE DISEASE
Number
year 2011 1 2012 0 2013 4 2014 0 2015 1 2016 3 Total 9
TABLE 39: Frequency and crude rates (per 100,000 people), Blastomycosis, WHR (2011-2016)
TABLE 40: Frequency, Creutzfeldt - Jakob disease, WHR (2011-2016)
TABLE 41: Frequency, Meningococcal Invasive Disease, WHR (2011-2016)

WRHA THE EPIDEMIOLOGY OF COMMUNICABLE DISEASES IN THE WINNIPEG HEALTH REGION 72

73 WRHA THE EPIDEMIOLOGY OF COMMUNICABLE DISEASES IN THE WINNIPEG HEALTH REGION
INVASIVE PNEUMOCOCCAL
FIGURE 28: Age-standardized rates (per 100,000 people), Invasive Pneumococcal, WHR (2011-2016)

WRHA THE EPIDEMIOLOGY OF COMMUNICABLE DISEASES IN THE WINNIPEG HEALTH REGION 74
a) Total
Number Crude Rate Age-Standardized Rate
95%CI
2011 78 11.0 10.9 8.6 - 13.6 2012 87 12.1 11.9 9.5 - 14.7 2013 57 7.8 7.6 5.8 - 9.9 2014 67 9.0 8.8 6.8 - 11.2 2015 53 7.1 7.2 5.4 - 9.4 2016 46 6.2 6.0 4.4 - 8.0 Total 388 8.8 8.7 7.9 - 9.6
b) Females
Number Crude Rate Age-Standardized Rate
95%CI
2011 34 9.4 8.9 6.2 - 12.5 2012 53 14.4 14.0 10.5 - 18.4 2013 25 6.7 6.0 3.9 - 8.9 2014 31 8.2 7.9 5.4 - 11.3 2015 32 8.5 8.5 5.8 - 12.1 2016 25 6.6 6.3 4.1 - 9.4 Total 200 8.9 8.6 7.4 - 9.9
c) Males
Number Crude Rate Age-Standardized Rate
95%CI
2011 44 12.7 12.9 9.4 - 17.4 2012 34 9.6 9.8 6.8 - 13.7 2013 32 8.9 9.0 6.2 - 12.7 2014 36 9.9 9.9 6.9 - 13.7 2015 21 5.7 6.0 3.7 - 9.2 2016 21 5.7 5.6 3.5 - 8.6 Total 188 8.7 8.8 7.6 - 10.2
TABLE 42: Frequency, crude and age-standardized rates (per 100,000 people), Invasive
Pneumococcal, WHR (2011-2016)

75 WRHA THE EPIDEMIOLOGY OF COMMUNICABLE DISEASES IN THE WINNIPEG HEALTH REGION
FIGURE 29: Age-specific rates (per 100,000 people), Invasive Pneumococcal, by age group
and gender, WHR (2016)

WRHA THE EPIDEMIOLOGY OF COMMUNICABLE DISEASES IN THE WINNIPEG HEALTH REGION 76
a) Total
Number Age-Specific Rate 95%CI
Age group 0-4 8 19.3 8.3 - 38.0 5-9 2 4.8 0.6 - 17.5 10-19 1 1.1 0.0 - 6.2 20-29 5 4.5 1.5 - 10.5 30-39 2 1.9 0.2 - 6.9 40-49 4 4.0 1.1 - 10.2 50-59 7 6.7 2.7 - 13.8 60-69 11 14.4 7.2 - 25.8 70+ 6 8.0 2.9 - 17.4 Total 46 6.2 4.5 - 8.3
b) Females
Number Age-Specific Rate 95%CI
Age group 0-4 2 9.9 1.2 - 35.9 5-9 0 0.0 0.0 - 18.2 10-19 1 2.3 0.1 - 12.9 20-29 4 7.3 2.0 - 18.6 30-39 1 1.9 0.0 - 10.6 40-49 4 8.0 2.2 - 20.5 50-59 5 9.5 3.1 - 22.2 60-69 5 12.5 4.1 - 29.3 70+ 3 6.8 1.4 - 19.7 Total 25 6.6 4.3 - 9.8
c) Males
Number Age-Specific Rate 95%CI
Age group 0-4 6 28.2 10.3 - 61.3 5-9 2 9.5 1.1 - 34.2 10-19 0 0.0 0.0 - 8.0 20-29 1 1.8 0.0 - 9.9 30-39 1 1.9 0.0 - 10.8 40-49 0 0.0 0.0 - 7.4 50-59 2 3.8 0.5 - 13.8 60-69 6 16.5 6.1 - 35.9 70+ 3 9.8 2.0 - 28.6 Total 21 5.7 3.6 - 8.8
TABLE 43: Frequency and age-specific rates (per 100,000 people), Invasive Pneumococcal, by
age group, WHR (2016)
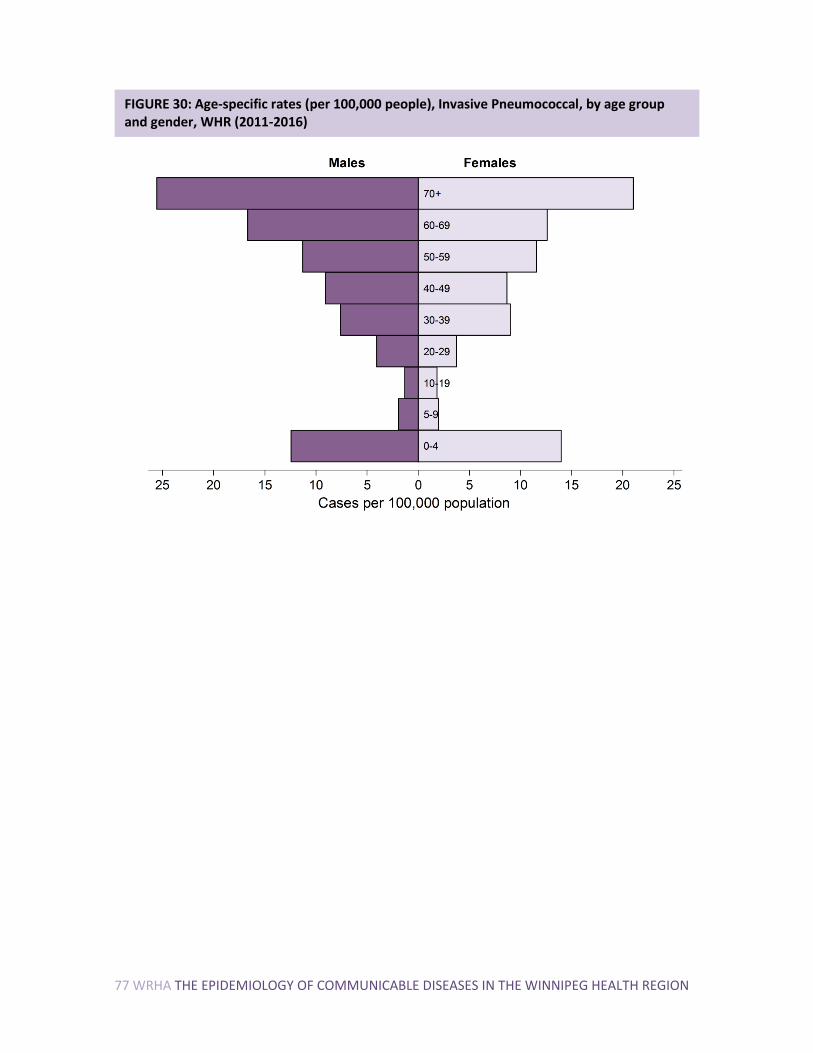
77 WRHA THE EPIDEMIOLOGY OF COMMUNICABLE DISEASES IN THE WINNIPEG HEALTH REGION
FIGURE 30: Age-specific rates (per 100,000 people), Invasive Pneumococcal, by age group and gender, WHR (2011-2016)

WRHA THE EPIDEMIOLOGY OF COMMUNICABLE DISEASES IN THE WINNIPEG HEALTH REGION 78
a) Total
Number Age-Specific Rate 95%CI
Age group
0-4 27 13.2 8.7 - 19.2 5-9 4 2.0 0.5 - 5.1 10-19 7 1.6 0.6 - 3.2 20-29 21 3.9 2.4 - 6.0 30-39 42 8.3 6.0 - 11.2 40-49 45 8.9 6.5 - 11.9 50-59 59 11.5 8.7 - 14.8 60-69 53 14.5 10.9 - 19.0 70+ 84 22.9 18.2 - 28.3 Total 342 9.4 8.4 - 10.4
b) Females
Number Age-Specific Rate 95%CI
Age group
0-4 14 14.0 7.7 - 23.5 5-9 2 2.0 0.2 - 7.3 10-19 4 1.8 0.5 - 4.7 20-29 10 3.7 1.8 - 6.9 30-39 23 9.0 5.7 - 13.6 40-49 22 8.7 5.4 - 13.2 50-59 30 11.6 7.8 - 16.5 60-69 24 12.6 8.1 - 18.7 70+ 46 21.0 15.4 - 28.0 Total 175 9.4 8.1 - 10.9
c) Males
Number Age-Specific Rate 95%CI
Age group
0-4 13 12.4 6.6 - 21.3 5-9 2 1.9 0.2 - 7.0 10-19 3 1.3 0.3 - 3.8 20-29 11 4.1 2.0 - 7.3 30-39 19 7.6 4.6 - 11.8 40-49 23 9.1 5.8 - 13.6 50-59 29 11.3 7.6 - 16.3 60-69 29 16.7 11.2 - 23.9 70+ 38 25.6 18.1 - 35.1 Total 167 9.3 8.0 - 10.9
TABLE 44: Frequency and age-specific rates (per 100,000 people), Invasive Pneumococcal, by
age group, WHR (2011-2015)

79 WRHA THE EPIDEMIOLOGY OF COMMUNICABLE DISEASES IN THE WINNIPEG HEALTH REGION
2016 2011-2015 Total No. % No. % No. %
Month January 0 0.0 45 13.2 45 11.6 February 3 6.5 27 7.9 30 7.7 March 10 21.7 36 10.5 46 11.9 April 3 6.5 42 12.3 45 11.6 May 4 8.7 45 13.2 49 12.6 June 5 10.9 26 7.6 31 8.0 July 2 4.4 14 4.1 16 4.1 August 2 4.4 13 3.8 15 3.9 September 0 0.0 20 5.9 20 5.2 October 4 8.7 25 7.3 29 7.5 November 4 8.7 28 8.2 32 8.3 December 9 19.6 21 6.1 30 7.7
FIGURE 31: Frequency, Invasive Pneumococcal, by month, WHR (2016 vs. 2011-2015 mean)
TABLE 45: Frequency and proportion, Invasive Pneumococcal, by community area, WHR
(2011-2016)

WRHA THE EPIDEMIOLOGY OF COMMUNICABLE DISEASES IN THE WINNIPEG HEALTH REGION 80
Number Crude Rate Age-Standardized Rate 95%CI
Community area St. James 26 7.2 7.0 4.5 - 10.3 Assiniboine South 17 8.0 6.4 3.6 - 10.5 Fort Garry 19 3.8 3.9 2.3 - 6.1 St. Vital 26 6.3 6.0 3.9 - 8.8 St. Boniface 25 7.2 7.0 4.5 - 10.3 Transcona 11 4.8 5.0 2.5 - 8.9 River East 40 6.9 6.7 4.7 - 9.1 Seven Oaks 24 5.4 5.4 3.4 - 8.0 Inkster 21 10.3 10.8 6.6 - 16.5 Point Douglas 54 19.2 20.4 15.3 - 26.7 Downtown 101 20.7 22.1 18.0 - 26.9 River Heights 24 7.1 6.6 4.2 - 9.8 Total 388 8.8 8.7 7.9 - 9.6
FIGURE 32: Age-standardized rates (per 100,000 people), Invasive Pneumococcal, by
community area, WHR (2011-2016)
TABLE 46: Frequency, crude and age-standardized rates (per 100,000 people), Invasive
Pneumococcal, by community area, WHR (2011-2016)

81 WRHA THE EPIDEMIOLOGY OF COMMUNICABLE DISEASES IN THE WINNIPEG HEALTH REGION
VACCINE PREVENTABLE DISEASES This section of the report provides an overview of select diseases that are preventable by routine immunization. A total of 264 cases fell under this category between 2009 and 2014 in the WHR. The highest rate was observed in Point Douglas (11.8/100,000 people).
FIGURE 33: Age-standardized rates (per 100,000 people), vaccine preventable diseases, by
community area, WHR (2011-2016)

WRHA THE EPIDEMIOLOGY OF COMMUNICABLE DISEASES IN THE WINNIPEG HEALTH REGION 82
Number Crude Rate Age-Standardized Rate 95%CI
Community area St. James 20 5.6 6.0 3.6 - 9.2 Assiniboine South 13 6.1 6.6 3.5 - 11.2 Fort Garry 30 6.0 5.4 3.6 - 7.7 St. Vital 19 4.6 4.6 2.8 - 7.2 St. Boniface 12 3.5 3.5 1.8 - 6.1 Transcona 13 5.7 5.4 2.8 - 9.2 River East 34 5.9 5.9 4.1 - 8.2 Seven Oaks 15 3.4 3.3 1.9 - 5.5 Inkster 11 5.4 5.2 2.6 - 9.5 Point Douglas 37 13.2 11.8 8.2 - 16.4 Downtown 39 8.0 7.6 5.4 - 10.5 River Heights 21 6.2 5.9 3.6 - 9.1 Total 264 6.0 5.9 5.2 - 6.6
TABLE 47: Frequency, crude and age-standardized rates (per 100,000 people), vaccine
preventable diseases, by community area, WHR (2011-2016)

83 WRHA THE EPIDEMIOLOGY OF COMMUNICABLE DISEASES IN THE WINNIPEG HEALTH REGION
DIPHTHERIA
Number
year 2011 1 2012 0 2013 1 2014 0 2015 4 2016 3 Total 9
HAEMOPHILUS INFLUENZAE NON-SEROTYPE B INVASIVE DISEASE
Number
year 2011 9 2012 5 2013 6 2014 8 2015 5 2016 4 Total 37
TABLE 48: Frequency, Diphtheria, WHR (2011-2016)
TABLE 49: Frequency, Haemophilus influenzae non-serotype B invasive disease, WHR (2011-
2016)

WRHA THE EPIDEMIOLOGY OF COMMUNICABLE DISEASES IN THE WINNIPEG HEALTH REGION 84
HEPATITIS B
a) Total
Number Crude Rate
2011 7 1.0
2012 2 0.3
2013 2 0.3
2014 1 0.1
2015 7 0.9
2016 13 1.7
Total 32 0.7
b) Females
Number Crude Rate
2011 1 0.3
2012 1 0.3
2013 0 0.0
2014 1 0.3
2015 2 0.5
2016 3 0.8
Total 8 0.4
c) Males
Number Crude Rate
2011 6 1.7
2012 1 0.3
2013 2 0.6
2014 0 0.0
2015 5 1.4
2016 10 2.7
Total 24 1.1
TABLE 50: Frequency and crude rates (per 100,000 people), Hepatitis B, WHR (2011-2016)

85 WRHA THE EPIDEMIOLOGY OF COMMUNICABLE DISEASES IN THE WINNIPEG HEALTH REGION
a) Total
2016 2011-2015
Number Age-Specific Rate Number Age-Specific Rate
Age group 0-4 0 0.0 0 0.0 5-9 0 0.0 0 0.0 10-19 0 0.0 1 0.2 20-29 2 1.8 2 0.4 30-39 5 4.8 6 1.2 40-49 5 5.0 2 0.4 50-59 1 1.0 5 1.0 60-69 0 0.0 2 0.5 70+ 0 0.0 1 0.3 Total 13 1.7 19 0.5
b) Females
Number Age-Specific Rate Number Age-Specific Rate
Age group 0-4 0 0.0 0 0.0 5-9 0 0.0 0 0.0 10-19 0 0.0 0 0.0 20-29 1 1.8 1 0.4 30-39 1 1.9 1 0.4 40-49 1 2.0 0 0.0 50-59 0 0.0 2 0.8 60-69 0 0.0 1 0.5 70+ 0 0.0 0 0.0 Total 3 0.8 5 0.3
c) Males
Number Age-Specific Rate Number Age-Specific Rate
Age group 0-4 0 0.0 0 0.0 5-9 0 0.0 0 0.0 10-19 0 0.0 1 0.4 20-29 1 1.8 1 0.4 30-39 4 7.8 5 2.0 40-49 4 8.0 2 0.8 50-59 1 1.9 3 1.2 60-69 0 0.0 1 0.6 70+ 0 0.0 1 0.7 Total 10 2.7 14 0.8
TABLE 51: Frequency and age-specific rates (per 100,000 people), Hepatitis B, by age group,
WHR (2011-2016)

WRHA THE EPIDEMIOLOGY OF COMMUNICABLE DISEASES IN THE WINNIPEG HEALTH REGION 86
Total No. %
Month January 1 3.1
February 2 6.3
March 1 3.1
April 1 3.1
May 5 15.6
June 5 15.6
July 1 3.1
August 4 12.5
September 4 12.5
October 2 6.3
November 4 12.5
December 2 6.3
Number
Community area St. James 2 Assiniboine South 1 Fort Garry 2 St. Vital 1 St. Boniface 0 Transcona 1 River East 3 Seven Oaks 2 Inkster 1 Point Douglas 10 Downtown 8 River Heights 1 Total 32
TABLE 52: Frequency and proportion, Hepatitis B, by month, WHR (2011-2016)
Table 53: Frequency, Hepatitis B, by community area, WHR (2011-2016)

87 WRHA THE EPIDEMIOLOGY OF COMMUNICABLE DISEASES IN THE WINNIPEG HEALTH REGION
MUMPS
FIGURE 34: Age-standardized rates (per 100,000 people), Mumps, WHR (2011-2016)

WRHA THE EPIDEMIOLOGY OF COMMUNICABLE DISEASES IN THE WINNIPEG HEALTH REGION 88
a) Total
Number Crude Rate Age-Standardized Rate 95%CI
2011 2 0.3 0.3 0.0 - 1.1 2012 6 0.8 0.8 0.3 - 1.8 2013 1 0.1 0.1 0.0 - 0.8 2014 0 0.0 0.0 0.0 - 0.5 2015 3 0.4 0.4 0.1 - 1.1 2016 89 12.0 11.3 9.1 - 14.0 Total 101 2.3 2.2 1.8 - 2.7
b) Females
Number Crude Rate Age-Standardized Rate 95%CI
2011 0 0.0 0.0 0.0 - 1.0 2012 4 1.1 1.1 0.3 - 2.8 2013 0 0.0 0.0 0.0 - 1.0 2014 0 0.0 0.0 0.0 - 1.0 2015 2 0.5 0.5 0.1 - 1.7 2016 33 8.7 8.8 6.0 - 12.3 Total 39 1.7 1.7 1.2 - 2.4
c) Males
Number Crude Rate Age-Standardized Rate 95%CI
2011 2 0.6 0.6 0.1 - 2.1 2012 2 0.6 0.6 0.1 - 2.0 2013 1 0.3 0.3 0.0 - 1.6 2014 0 0.0 0.0 0.0 - 1.0 2015 1 0.3 0.3 0.0 - 1.6 2016 56 15.3 13.8 10.4 - 18.0 Total 62 2.9 2.6 2.0 - 3.4
TABLE 54: Frequency, crude and age-standardized rates (per 100,000 people), Mumps, WHR (2011-2016)

89 WRHA THE EPIDEMIOLOGY OF COMMUNICABLE DISEASES IN THE WINNIPEG HEALTH REGION
FIGURE 35: Age-specific rates (per 100,000 people), Mumps, by age group and gender, WHR
(2016)

WRHA THE EPIDEMIOLOGY OF COMMUNICABLE DISEASES IN THE WINNIPEG HEALTH REGION 90
a) Total
Number Age-Specific Rate 95%CI
Age group 0-4 0 0.0 0.0 - 8.9 5-9 0 0.0 0.0 - 8.9 10-19 20 22.4 13.7 - 34.6 20-29 55 49.5 37.3 - 34.4 30-39 10 9.6 4.6 - 17.7 40-49 3 3.0 0.6 - 8.8 50-59 1 1.0 0.0 - 5.3 60-69 0 0.0 0.0 - 4.8 70+ 0 0.0 0.0 - 4.9 Total 89 12.0 9.6 - 14.7
b) Females
Number Age-Specific Rate 95%CI
Age group 0-4 0 0.0 0.0 - 18.3 5-9 0 0.0 0.0 - 18.2 10-19 9 20.8 9.5 - 39.5 20-29 16 29.1 16.6 - 47.2 30-39 5 9.5 3.1 - 22.3 40-49 3 6.0 1.2 - 17.5 50-59 0 0.0 0.0 - 7.0 60-69 0 0.0 0.0 - 9.2 70+ 0 0.0 0.0 - 8.3 Total 33 8.7 6.0 - 12.3
c) Males
Number Age-Specific Rate 95%CI
Age group 0-4 0 0.0 0.0 - 17.3 5-9 0 0.0 0.0 - 17.5 10-19 11 23.9 11.9 - 42.8 20-29 39 69.5 49.4 - 95.0 30-39 5 9.7 3.1 - 22.6 40-49 0 0.0 0.0 - 7.4 50-59 1 1.9 0.0 - 10.7 60-69 0 0.0 0.0 - 10.2 70+ 0 0.0 0.0 - 12.0 Total 56 15.3 11.6 - 19.9
TABLE 55: Frequency and age-specific rates (per 100,000 people), Mumps, by age group,
WHR (2016)

91 WRHA THE EPIDEMIOLOGY OF COMMUNICABLE DISEASES IN THE WINNIPEG HEALTH REGION
FIGURE 36: Age-specific rates (per 100,000 people), Mumps, by age group and gender, WHR
(2011-2015)

WRHA THE EPIDEMIOLOGY OF COMMUNICABLE DISEASES IN THE WINNIPEG HEALTH REGION 92
a) Total
Number Age-Specific Rate 95%CI
Age group
0-4 0 0.0 0.0 - 1.8 5-9 0 0.0 0.0 - 1.8 10-19 3 0.7 0.1 - 2.0 20-29 2 0.4 0.0 - 1.3 30-39 3 0.6 0.1 - 1.7 40-49 1 0.2 0.0 - 1.1 50-59 2 0.4 0.0 - 1.4 60-69 0 0.0 0.0 - 1.0 70+ 1 0.3 0.0 - 1.5 Total 12 0.3 0.2 - 0.6
b) Females
Number Age-Specific Rate 95%CI
Age group
0-4 0 0.0 0.0 - 3.7 5-9 0 0.0 0.0 - 3.7 10-19 1 0.5 0.0 - 2.6 20-29 2 0.7 0.1 - 2.7 30-39 1 0.4 0.0 - 2.2 40-49 0 0.0 0.0 - 1.5 50-59 1 0.4 0.0 - 2.2 60-69 0 0.0 0.0 - 1.9 70+ 1 0.5 0.0 - 2.5 Total 6 0.3 0.1 - 0.7
c) Males
Number Age-Specific Rate 95%CI
Age group
0-4 0 0.0 0.0 - 3.5 5-9 0 0.0 0.0 - 3.6 10-19 2 0.9 0.1 - 3.1 20-29 0 0.0 0.0 - 1.4 30-39 2 0.8 0.1 - 2.9 40-49 1 0.4 0.0 - 2.2 50-59 1 0.4 0.0 - 2.2 60-69 0 0.0 0.0 - 2.1 70+ 0 0.0 0.0 - 2.5 Total 6 0.3 0.1 - 0.7
TABLE 56: Frequency and age-specific rates (per 100,000 people), Mumps, by age group,
WHR (2011-2015)

93 WRHA THE EPIDEMIOLOGY OF COMMUNICABLE DISEASES IN THE WINNIPEG HEALTH REGION
2016 2011-2015 Total No. % No. % No. %
Month January 0 0.0 5 41.7 5 5.0 February 0 0.0 2 16.7 2 2.0 March 0 0.0 0 0.0 0 0.0 April 0 0.0 0 0.0 0 0.0 May 1 1.1 0 0.0 1 1.0 June 0 0.0 0 0.0 0 0.0 July 0 0.0 2 16.7 2 2.0 August 0 0.0 0 0.0 0 0.0 September 1 1.1 2 16.7 3 3.0 October 30 33.7 0 0.0 30 29.7 November 28 31.5 0 0.0 28 27.8 December 29 32.6 1 8.3 30 29.7
FIGURE 37: Frequency, Mumps, by month, WHR (2016 vs. 2011-2015 mean)
TABLE 57: Frequency and proportion, Mumps, by month, WHR (2011-2016)
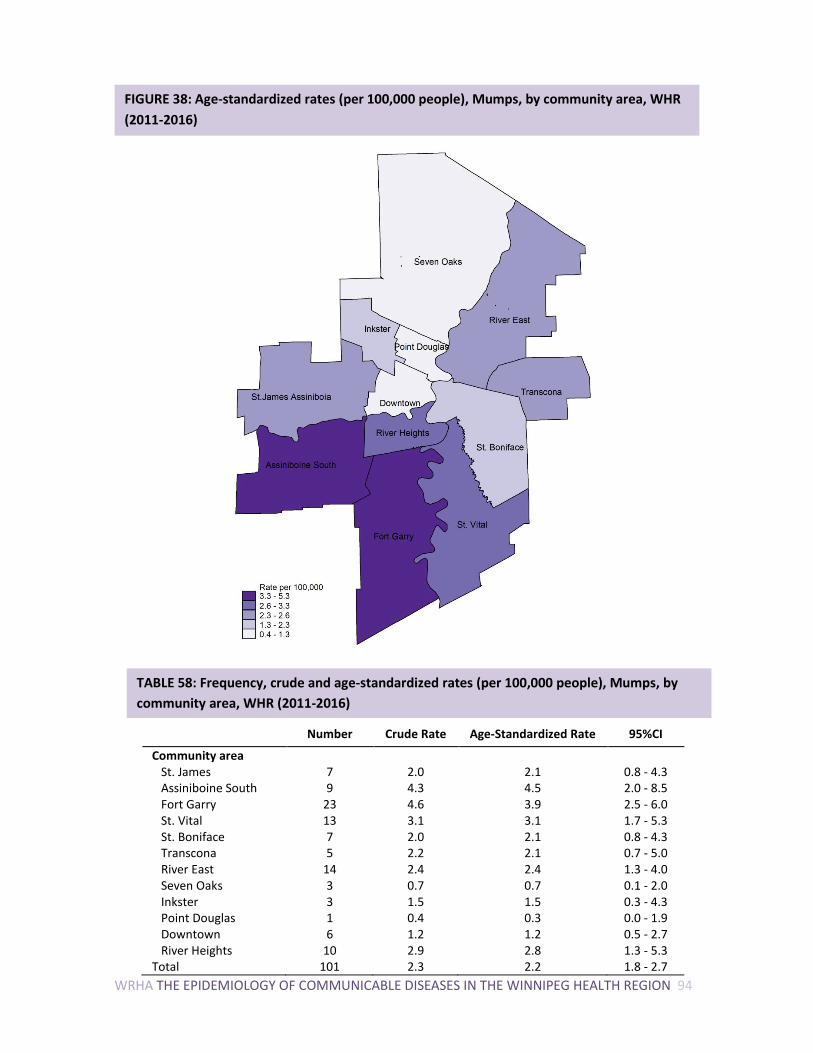
WRHA THE EPIDEMIOLOGY OF COMMUNICABLE DISEASES IN THE WINNIPEG HEALTH REGION 94
Number Crude Rate Age-Standardized Rate 95%CI
Community area St. James 7 2.0 2.1 0.8 - 4.3 Assiniboine South 9 4.3 4.5 2.0 - 8.5 Fort Garry 23 4.6 3.9 2.5 - 6.0 St. Vital 13 3.1 3.1 1.7 - 5.3 St. Boniface 7 2.0 2.1 0.8 - 4.3 Transcona 5 2.2 2.1 0.7 - 5.0 River East 14 2.4 2.4 1.3 - 4.0 Seven Oaks 3 0.7 0.7 0.1 - 2.0 Inkster 3 1.5 1.5 0.3 - 4.3 Point Douglas 1 0.4 0.3 0.0 - 1.9 Downtown 6 1.2 1.2 0.5 - 2.7 River Heights 10 2.9 2.8 1.3 - 5.3 Total 101 2.3 2.2 1.8 - 2.7
FIGURE 38: Age-standardized rates (per 100,000 people), Mumps, by community area, WHR
(2011-2016)
TABLE 58: Frequency, crude and age-standardized rates (per 100,000 people), Mumps, by
community area, WHR (2011-2016)

95 WRHA THE EPIDEMIOLOGY OF COMMUNICABLE DISEASES IN THE WINNIPEG HEALTH REGION
PERTUSSIS
FIGURE 39: Age-standardized rates (per 100,000 people), Pertussis, WHR (2011-2016)

WRHA THE EPIDEMIOLOGY OF COMMUNICABLE DISEASES IN THE WINNIPEG HEALTH REGION 96
a) Total
Number Crude Rate Age-Standardized Rate 95%CI
2011 7 1.0 0.9 0.4 - 1.9 2012 18 2.5 2.5 1.5 - 3.9 2013 1 0.1 0.1 0.0 - 0.7 2014 5 0.7 0.7 0.2 - 1.6 2015 5 0.7 0.6 0.2 - 1.5 2016 36 4.8 4.8 3.4 - 6.6 Total 72 1.6 1.6 1.3 - 2.0
b) Females
Number Crude Rate Age-Standardized Rate 95%CI
2011 4 1.1 1.1 0.3 - 2.8 2012 7 1.9 2.0 0.8 - 4.1 2013 0 0.0 0.0 0.0 - 1.0 2014 3 0.8 0.8 0.2 - 2.3 2015 3 0.8 0.8 0.2 - 2.3 2016 20 5.3 5.5 3.3 - 8.4 Total 37 1.7 1.7 1.2 - 2.3
c) Males
Number Crude Rate Age-Standardized Rate 95%CI
2011 3 0.9 0.8 0.2 - 2.4 2012 11 3.1 2.9 1.5 - 5.3 2013 1 0.3 0.3 0.0 - 1.5 2014 2 0.5 0.5 0.1 - 1.9 2015 2 0.5 0.5 0.1 - 1.9 2016 16 4.4 4.2 2.4 - 6.8 Total 35 1.6 1.5 1.1 - 2.1
TABLE 59: Frequency, crude and age-standardized rates (per 100,000 people), Pertussis, WHR (2011-2016)

97 WRHA THE EPIDEMIOLOGY OF COMMUNICABLE DISEASES IN THE WINNIPEG HEALTH REGION
FIGURE 40: Age-specific rates (per 100,000 people), Pertussis, by age group and gender, WHR
(2016)

WRHA THE EPIDEMIOLOGY OF COMMUNICABLE DISEASES IN THE WINNIPEG HEALTH REGION 98
a) Total
Number Age-Specific Rate 95%CI
Age group 0-4 24 57.9 37.1 - 86.2 5-9 1 2.4 0.1 - 13.5 10-19 7 7.8 3.2 - 16.2 20-29 0 0.0 0.0 - 3.3 30-39 0 0.0 0.0 - 3.5 40-49 1 1.0 0.0 - 5.6 50-59 2 1.9 0.2 - 6.9 60-69 1 1.3 0.0 - 7.3 70+ 0 0.0 0.0 - 4.9 Total 36 4.8 3.4 - 6.7
b) Females
Number Age-Specific Rate 95%CI
Age group 0-4 14 69.5 38.0 - 116.6 5-9 1 4.9 0.1 - 27.5 10-19 4 9.2 2.5 - 23.7 20-29 0 0.0 0.0 - 6.7 30-39 0 0.0 0.0 - 7.0 40-49 0 0.0 0.0 - 7.4 50-59 0 0.0 0.0 - 7.0 60-69 1 2.5 0.1 - 14.0 70+ 0 0.0 0.0 - 8.3 Total 20 5.3 3.2 - 8.2
c) Males
Number Age-Specific Rate 95%CI
Age group 0-4 10 46.9 22.5 - 86.3 5-9 0 0.0 0.0 - 17.5 10-19 3 6.5 1.3 - 19.0 20-29 0 0.0 0.0 - 6.6 30-39 0 0.0 0.0 - 7.2 40-49 1 2.0 0.1 - 11.1 50-59 2 3.8 0.5 - 13.8 60-69 0 0.0 0.0 - 10.2 70+ 0 0.0 0.0 - 12.0 Total 16 4.4 2.5 - 7.1
TABLE 60: Frequency and age-specific rates (per 100,000 people), Pertussis, by age group, WHR (2016)

99 WRHA THE EPIDEMIOLOGY OF COMMUNICABLE DISEASES IN THE WINNIPEG HEALTH REGION
FIGURE 41: Age-specific rates (per 100,000 people), Pertussis, by age group and gender, WHR
(2011-2015)

WRHA THE EPIDEMIOLOGY OF COMMUNICABLE DISEASES IN THE WINNIPEG HEALTH REGION 100
a) Total
Number Age-Specific Rate 95%CI
Age group 0-4 25 12.2 7.9 - 18.0 5-9 3 1.5 0.3 - 4.3 10-19 4 0.9 0.2 - 2.3 20-29 3 0.6 0.1 - 1.6 30-39 1 0.2 0.0 - 1.1 40-49 0 0.0 0.0 - 0.7 50-59 0 0.0 0.0 - 0.7 60-69 0 0.0 0.0 - 1.0 70+ 0 0.0 0.0 - 1.0 Total 36 1.0 0.7 - 1.4
b) Females
Number Age-Specific Rate 95%CI
Age group 0-4 11 11.0 5.5 - 19.7 5-9 1 1.0 0.0 - 5.6 10-19 2 0.9 0.1 - 3.3 20-29 2 0.7 0.1 - 2.7 30-39 1 0.4 0.0 - 2.2 40-49 0 0.0 0.0 - 1.5 50-59 0 0.0 0.0 - 1.4 60-69 0 0.0 0.0 - 1.9 70+ 0 0.0 0.0 - 1.7 Total 17 0.9 0.5 - 1.5
c) Males
Number Age-Specific Rate 95%CI
Age group 0-4 14 13.4 7.3 - 22.5 5-9 2 1.9 0.2 - 7.0 10-19 2 0.9 0.1 - 3.1 20-29 1 0.4 0.0 - 2.1 30-39 0 0.0 0.0 - 1.5 40-49 0 0.0 0.0 - 1.5 50-59 0 0.0 0.0 - 1.4 60-69 0 0.0 0.0 - 2.1 70+ 0 0.0 0.0 - 2.5 Total 19 1.1 0.6 - 1.7
TABLE 61: Frequency and age-specific rates (per 100,000 people), Pertussis, by age group,
WHR (2011-2015)

101 WRHA THE EPIDEMIOLOGY OF COMMUNICABLE DISEASES IN THE WINNIPEG HEALTH REGION
2016 2011-2015 Total No. % No. % No. %
Month January 2 5.6 1 2.8 3 4.2 February 2 5.6 0 0.0 2 2.8 March 2 5.6 0 0.0 2 2.8 April 2 5.6 2 5.6 4 5.6 May 1 2.8 5 13.9 6 8.3 June 0 0.0 4 11.1 4 5.6 July 6 16.7 1 2.8 7 9.7 August 8 22.2 4 11.1 12 16.7 September 9 25.0 4 11.1 13 18.1 October 2 5.6 8 22.2 10 13.9 November 0 0.0 3 8.3 3 4.2 December 2 5.6 4 11.1 6 8.3
FIGURE 42: Frequency, Pertussis, by month, WHR (2016 vs. 2011-2015 mean)
TABLE 62: Frequency and proportion, Pertussis, by month, WHR (2011-2016)

WRHA THE EPIDEMIOLOGY OF COMMUNICABLE DISEASES IN THE WINNIPEG HEALTH REGION 102
Number Crude Rate Age-Standardized Rate 95%CI
Community area St. James 3 0.8 1.0 0.2 - 2.8 Assiniboine South 2 0.9 1.1 0.1 - 3.9 Fort Garry 2 0.4 0.4 0.1 - 1.5 St. Vital 2 0.5 0.5 0.1 - 1.8 St. Boniface 1 0.3 0.3 0.0 - 1.6 Transcona 6 2.6 2.4 0.9 - 5.3 River East 10 1.7 1.8 0.9 - 3.3 Seven Oaks 7 1.6 1.5 0.6 - 3.1 Inkster 5 2.5 2.0 0.7 - 4.9 Point Douglas 16 5.7 4.2 2.4 - 7.0 Downtown 14 2.9 2.5 1.4 - 4.3 River Heights 4 1.2 1.2 0.3 - 3.2 Total 72 1.6 1.6 1.3 - 2.0
FIGURE 43: Age-standardized rates (per 100,000 people), Pertussis, by community area, WHR
(2011-2016)
Table 63: Frequency, crude and age-standardized rates (per 100,000 people), Pertussis, by
community area, WHR (2011-2016)

103 WRHA THE EPIDEMIOLOGY OF COMMUNICABLE DISEASES IN THE WINNIPEG HEALTH REGION
RUBELLA
Number
Year 2011 1 2012 1 2013 0 2014 0 2015 1 2016 2 Total 5
TABLE 64: Frequency, Rubella, WHR (2011-2016)
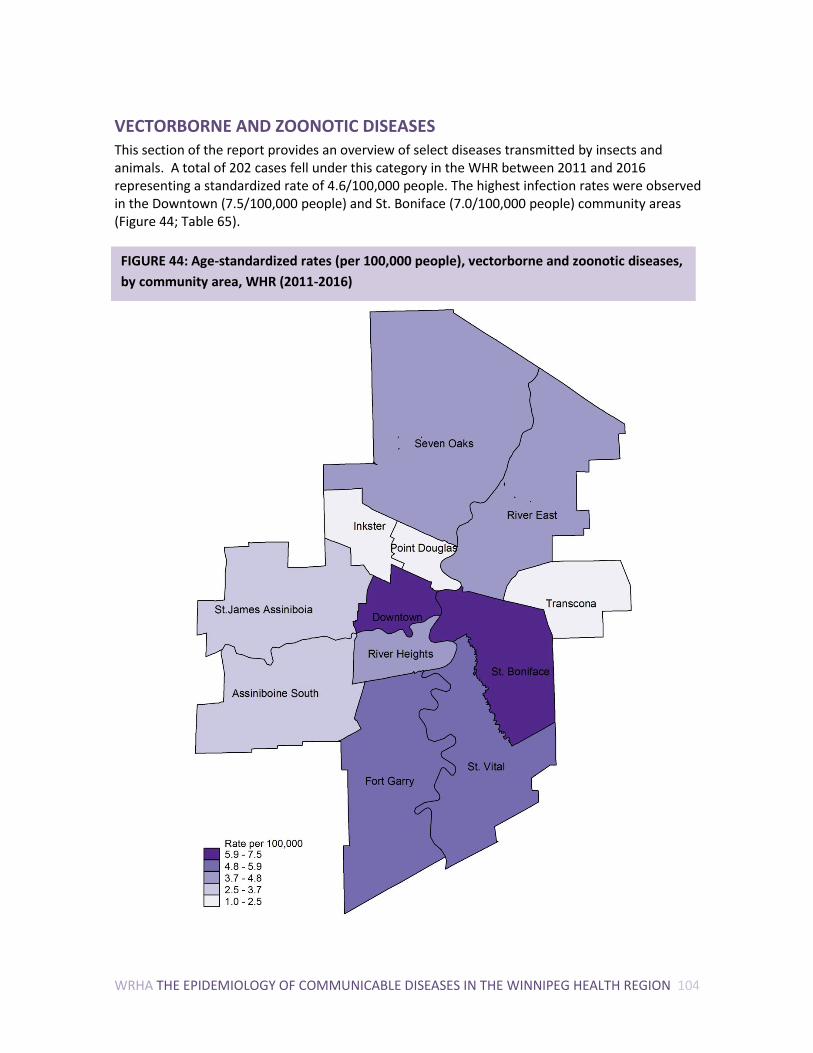
WRHA THE EPIDEMIOLOGY OF COMMUNICABLE DISEASES IN THE WINNIPEG HEALTH REGION 104
VECTORBORNE AND ZOONOTIC DISEASES This section of the report provides an overview of select diseases transmitted by insects and animals. A total of 202 cases fell under this category in the WHR between 2011 and 2016 representing a standardized rate of 4.6/100,000 people. The highest infection rates were observed in the Downtown (7.5/100,000 people) and St. Boniface (7.0/100,000 people) community areas (Figure 44; Table 65).
FIGURE 44: Age-standardized rates (per 100,000 people), vectorborne and zoonotic diseases,
by community area, WHR (2011-2016)

105 WRHA THE EPIDEMIOLOGY OF COMMUNICABLE DISEASES IN THE WINNIPEG HEALTH REGION
Number Crude Rate
Age-Standardized Rate 95%CI
Community area St. James 10 2.8 3.0 1.4 - 5.4 Assiniboine South 8 3.8 3.7 1.6 - 7.5 Fort Garry 26 5.2 5.3 3.4 - 7.7 St. Vital 24 5.8 5.9 3.7 - 8.7 St. Boniface 24 6.9 7.0 4.5 - 10.4 Transcona 6 2.6 2.5 0.9 - 5.6 River East 28 4.8 4.8 3.2 - 6.9 Seven Oaks 17 3.8 3.8 2.2 - 6.1 Inkster 5 2.5 2.2 0.7 - 5.4 Point Douglas 3 1.1 1.0 0.2 - 3.0 Downtown 37 7.6 7.5 5.3 - 10.4 River Heights 14 4.1 3.9 2.1 - 6.6 Total 202 4.6 4.6 4.0 - 5.3
TABLE 65: Frequency, crude and age-standardized rates (per 100,000 people) by community
area, vectorborne and zoonotic diseases, WHR (2011-2016)

WRHA THE EPIDEMIOLOGY OF COMMUNICABLE DISEASES IN THE WINNIPEG HEALTH REGION 106
ANAPLASMOSIS
Number
Year 2011 - 2012 - 2013 - 2014 - 2015 4 2016 3 Total 7
BRUCELLOSIS
Number
year 2011 1 2012 0 2013 1 2014 0 2015 0 2016 1 Total 3
TABLE 66: Frequency, Anaplasmosis, WHR (2011-2016)
TABLE 67: Frequency, Brucellosis, WHR (2011-2016)

107 WRHA THE EPIDEMIOLOGY OF COMMUNICABLE DISEASES IN THE WINNIPEG HEALTH REGION
LYME
FIGURE 45: Age-standardized rates (per 100,000 people), Lyme, WHR (2011-2016)

WRHA THE EPIDEMIOLOGY OF COMMUNICABLE DISEASES IN THE WINNIPEG HEALTH REGION 108
a) Total
Number Crude Rate Age-Standardized Rate 95%CI
2011 1 0.1 0.1 0.0 - 0.8 2012 7 1.0 1.0 0.4 - 2.0 2013 11 1.5 1.5 0.7 - 2.7 2014 14 1.9 1.8 1.0 - 3.1 2015 12 1.6 1.6 0.9 - 2.9 2016 17 2.3 2.3 1.3 - 3.7 Total 62 1.4 1.4 1.1 - 1.8
b) Females
Number Crude Rate Age-Standardized Rate 95%CI
2011 0 0.0 0.0 0.0 - 1.0 2012 1 0.3 0.3 0.0 - 1.5 2013 6 1.6 1.6 0.6 - 3.4 2014 2 0.5 0.5 0.1 - 2.0 2015 1 0.3 0.3 0.0 - 1.5 2016 6 1.6 1.7 0.6 - 3.6 Total 16 0.7 0.7 0.4 - 1.2
c) Males
Number Crude Rate Age-Standardized Rate 95%CI
2011 1 0.3 0.3 0.0 - 1.6 2012 6 1.7 1.7 0.6 - 3.8 2013 5 1.4 1.5 0.5 - 3.4 2014 12 3.3 3.2 1.7 - 5.7 2015 11 3.0 3.1 1.5 - 5.5 2016 11 3.0 3.0 1.5 - 5.4 Total 46 2.1 2.2 1.6 - 2.9
TABLE 68: Frequency, crude and age-standardized rates (per 100,000 people), Lyme, WHR
(2011-2016)

109 WRHA THE EPIDEMIOLOGY OF COMMUNICABLE DISEASES IN THE WINNIPEG HEALTH REGION
FIGURE 46: Age-specific rates (per 100,000 people), Lyme, by age group and gender, WHR
(2016)

WRHA THE EPIDEMIOLOGY OF COMMUNICABLE DISEASES IN THE WINNIPEG HEALTH REGION 110
a) Total
Number Age-Specific Rate 95%CI
Age group 0-4 0 0.0 0.0 - 8.9 5-9 1 2.4 0.1 - 13.5 10-19 5 5.6 1.8 - 13.0 20-29 1 0.9 0.0 - 5.0 30-39 2 1.9 0.2 - 6.9 40-49 0 0.0 0.0 - 3.7 50-59 2 1.9 0.2 - 6.9 60-69 6 7.9 2.9 - 17.1 70+ 0 0.0 0.0 - 4.9 Total 17 2.3 1.3 - 3.7
b) Females
Number Age-Specific Rate 95%CI
Age group 0-4 0 0.0 0.0 - 18.3 5-9 0 0.0 0.0 - 18.2 10-19 3 6.9 1.4 - 20.3 20-29 0 0.0 0.0 - 6.7 30-39 1 1.9 0.0 - 10.6 40-49 0 0.0 0.0 - 7.4 50-59 0 0.0 0.0 - 7.0 60-69 2 5.0 0.6 - 18.1 70+ 0 0.0 0.0 - 8.3 Total 6 1.6 0.6 - 3.5
c) Males
Number Age-Specific Rate 95%CI
Age group 0-4 0 0.0 0.0 - 17.3 5-9 1 4.7 0.1 - 26.4 10-19 2 4.3 0.5 - 15.7 20-29 1 1.8 0.0 - 9.9 30-39 1 1.9 0.0 - 10.8 40-49 0 0.0 0.0 - 7.4 50-59 2 3.8 0.5 - 13.8 60-69 4 11.0 3.0 - 28.2 70+ 0 0.0 0.0 - 12.0 Total 11 3.0 1.5 - 5.4
TABLE 69: Frequency and age-specific rates (per 100,000 people), Lyme, by age group, WHR
(2016)

111 WRHA THE EPIDEMIOLOGY OF COMMUNICABLE DISEASES IN THE WINNIPEG HEALTH REGION
FIGURE 47: Age-specific rates (per 100,000 people), Lyme, by age group and gender, WHR (2011-2015)

WRHA THE EPIDEMIOLOGY OF COMMUNICABLE DISEASES IN THE WINNIPEG HEALTH REGION 112
a) Total
Number Age-Specific Rate 95%CI
Age group 0-4 1 0.5 0.0 - 2.7 5-9 1 0.5 0.0 - 2.8 10-19 4 0.9 0.2 - 2.3 20-29 3 0.6 0.1 - 1.6 30-39 6 1.2 0.4 - 2.6 40-49 7 1.4 0.6 - 2.8 50-59 6 1.2 0.4 - 2.5 60-69 12 3.3 1.7 - 5.8 70+ 5 1.4 0.4 - 3.2 Total 45 1.2 0.9 - 1.6
b) Females
Number Age-Specific Rate 95%CI
Age group 0-4 0 0.0 0.0 - 3.7 5-9 1 1.0 0.0 - 5.6 10-19 1 0.5 0.0 - 2.6 20-29 0 0.0 0.0 - 1.4 30-39 1 0.4 0.0 - 2.2 40-49 1 0.4 0.0 - 2.2 50-59 2 0.8 0.1 - 2.8 60-69 4 2.1 0.6 - 5.4 70+ 0 0.0 0.0 - 1.7 Total 10 0.5 0.3 - 1.0
c) Males
Number Age-Specific Rate 95%CI
Age group 0-4 1 1.0 0.0 - 5.3 5-9 0 0.0 0.0 - 3.6 10-19 3 1.3 0.3 - 3.8 20-29 3 1.1 0.2 - 3.2 30-39 5 2.0 0.6 - 4.7 40-49 6 2.4 0.9 - 5.2 50-59 4 1.6 0.4 - 4.0 60-69 8 4.6 2.0 - 9.1 70+ 5 3.4 1.1 - 7.8 Total 35 2.0 1.4 - 2.7
TABLE 70: Frequency and age-specific rates (per 100,000 people), Lyme, by age group, WHR
(2011-2015)

113 WRHA THE EPIDEMIOLOGY OF COMMUNICABLE DISEASES IN THE WINNIPEG HEALTH REGION
2016 2011-2015 Total No. % No. % No. %
Month January 0 0.0 0 0.0 0 0.0 February 0 0.0 0 0.0 0 0.0 March 0 0.0 1 2.2 1 1.6 April 0 0.0 2 4.4 2 3.2 May 1 5.9 0 0.0 1 1.6 June 2 11.8 4 8.9 6 9.7 July 1 5.9 7 15.6 8 12.9 August 5 29.4 6 13.3 11 17.7 September 1 5.9 11 24.4 12 19.4 October 3 17.7 9 20.0 12 19.4 November 3 17.7 2 4.4 5 8.1 December 1 5.9 3 6.7 4 6.5
FIGURE 48: Frequency, Lyme, by month, WHR (2016 vs. 2011-2015 mean)
TABLE 71: Frequency and proportion, Lyme, by month, WHR (2011-2016)

WRHA THE EPIDEMIOLOGY OF COMMUNICABLE DISEASES IN THE WINNIPEG HEALTH REGION 114
Number Crude Rate Age-Standardized Rate 95%CI
Community area St. James 2 0.6 0.6 0.1 - 2.2 Assiniboine South 6 2.8 2.8 1.0 - 6.2 Fort Garry 7 1.4 1.5 0.6 - 3.1 St. Vital 9 2.2 2.0 0.9 - 3.8 St. Boniface 6 1.7 1.7 0.6 - 3.7 Transcona 3 1.3 1.3 0.3 - 3.7 River East 12 2.1 2.0 1.1 - 3.6 Seven Oaks 8 1.8 1.8 0.8 - 3.6 Inkster 0 0.0 0.0 0.0 - 1.9 Point Douglas 0 0.0 0.0 0.0 - 1.4 Downtown 3 0.6 0.7 0.1 - 2.0 River Heights 6 1.8 1.7 0.6 - 3.9 Total 62 1.4 1.4 1.1 - 1.8
FIGURE 49: Age-standardized rates (per 100,000 people), Lyme, by community area, WHR
(2011-2016)
TABLE 72: Frequency, crude and age-standardized rates (per 100,000 people), Lyme, by
community area, WHR (2011-2016)

115 WRHA THE EPIDEMIOLOGY OF COMMUNICABLE DISEASES IN THE WINNIPEG HEALTH REGION
MALARIA
FIGURE 50: Age-standardized rates (per 100,000 people), Malaria, WHR (2011-2016)

WRHA THE EPIDEMIOLOGY OF COMMUNICABLE DISEASES IN THE WINNIPEG HEALTH REGION 116
a) Total
Number Crude Rate Age-Standardized Rate 95%CI
2011 19 2.7 2.7 1.6 - 4.2 2012 13 1.8 1.8 1.0 - 3.1 2013 11 1.5 1.5 0.8 - 2.7 2014 18 2.4 2.4 1.4 - 3.9 2015 18 2.4 2.5 1.5 - 3.9 2016 16 2.2 2.1 1.2 - 3.4 Total 95 2.2 2.2 1.8 - 2.7
b) Females
Number Crude Rate Age-Standardized Rate 95%CI
2011 6 1.7 1.7 0.6 - 3.7 2012 5 1.4 1.4 0.4 - 3.2 2013 2 0.5 0.6 0.1 - 2.0 2014 3 0.8 0.8 0.2 - 2.4 2015 2 0.5 0.6 0.1 - 2.1 2016 4 1.1 1.0 0.3 - 2.5 Total 22 1.0 1.0 0.6 - 1.5
c) Males
Number Crude Rate Age-Standardized Rate 95%CI
2011 13 3.7 3.7 2.0 - 6.3 2012 8 2.3 2.2 0.9 - 4.4 2013 9 2.5 2.5 1.1 - 4.7 2014 15 4.1 4.0 2.3 - 6.7 2015 16 4.4 4.3 2.5 - 7.0 2016 12 3.3 3.1 1.6 - 5.5 Total 73 3.4 3.3 2.6 - 4.2
TABLE 73: Frequency, crude and age-standardized rates (per 100,000 people), Malaria, WHR (2011-2016)

117 WRHA THE EPIDEMIOLOGY OF COMMUNICABLE DISEASES IN THE WINNIPEG HEALTH REGION
FIGURE 51: Age-specific rates (per 100,000 people), Malaria, by age group and gender,
WHR (2016)

WRHA THE EPIDEMIOLOGY OF COMMUNICABLE DISEASES IN THE WINNIPEG HEALTH REGION 118
a) Total
Number Age-Specific Rate 95%CI
Age group 0-4 5 12.1 3.9 - 28.2 5-9 0 0.0 0.0 - 8.9 10-19 2 2.2 0.3 - 8.1 20-29 5 4.5 1.5 - 10.5 30-39 1 1.0 0.0 - 5.4 40-49 1 1.0 0.0 - 5.6 50-59 2 1.9 0.2 - 6.9 60-69 0 0.0 0.0 - 4.8 70+ 0 0.0 0.0 - 4.9 Total 16 2.2 1.2 - 3.5
b) Females
Number Age-Specific Rate 95%CI
Age group 0-4 1 5.0 0.1 - 27.7 5-9 0 0.0 0.0 - 18.2 10-19 0 0.0 0.0 - 8.5 20-29 3 5.5 1.1 - 15.9 30-39 0 0.0 0.0 - 7.0 40-49 0 0.0 0.0 - 7.4 50-59 0 0.0 0.0 - 7.0 60-69 0 0.0 0.0 - 9.2 70+ 0 0.0 0.0 - 8.3 Total 4 1.1 0.3 - 2.7
c) Males
Number Age-Specific Rate 95%CI
Age group 0-4 4 18.8 5.1 - 48.1 5-9 0 0.0 0.0 - 17.5 10-19 2 4.3 0.5 - 15.7 20-29 2 3.6 0.4 - 12.9 30-39 1 1.9 0.0 - 10.8 40-49 1 2.0 0.1 - 11.1 50-59 2 3.8 0.5 - 13.8 60-69 0 0.0 0.0 - 10.2 70+ 0 0.0 0.0 - 12.0 Total 12 3.3 1.7 - 5.7
TABLE 74: Frequency and age-specific rates (per 100,000 people), Malaria, by age group,
WHR (2016)

119 WRHA THE EPIDEMIOLOGY OF COMMUNICABLE DISEASES IN THE WINNIPEG HEALTH REGION
FIGURE 52: Age-specific rates (per 100,000 people), Malaria, by age group and
gender, WHR (2011-2016)

WRHA THE EPIDEMIOLOGY OF COMMUNICABLE DISEASES IN THE WINNIPEG HEALTH REGION 120
a) Total
Number Age-Specific Rate 95%CI
Age group 0-4 6 2.9 1.1 - 6.4 5-9 4 2.0 0.5 - 5.1 10-19 13 2.9 1.6 - 5.0 20-29 16 3.0 1.7 - 4.8 30-39 14 2.8 1.5 - 4.7 40-49 16 3.2 1.8 - 5.1 50-59 9 1.7 0.8 - 3.3 60-69 0 0.0 0.0 - 1.0 70+ 1 0.3 0.0 - 1.5 Total 79 2.2 1.7 - 2.7
b) Females
Number Age-Specific Rate 95%CI
Age group 0-4 2 2.0 0.2 - 7.2 5-9 1 1.0 0.0 - 5.6 10-19 3 1.4 0.3 - 4.1 20-29 2 0.7 0.1 - 2.7 30-39 4 1.6 0.4 - 4.0 40-49 4 1.6 0.4 - 4.0 50-59 1 0.4 0.0 - 2.2 60-69 0 0.0 0.0 - 1.9 70+ 1 0.5 0.0 - 2.5 Total 18 1.0 0.6 - 1.5
c) Males
Number Age-Specific Rate 95%CI
Age group 0-4 4 3.8 1.0 - 9.8 5-9 3 2.9 0.6 - 8.5 10-19 10 4.4 2.1 - 8.0 20-29 14 5.2 2.8 - 8.7 30-39 10 4.0 1.9 - 7.3 40-49 12 4.7 2.4 - 8.3 50-59 8 3.1 1.3 - 6.2 60-69 0 0.0 0.0 - 2.1 70+ 0 0.0 0.0 - 2.5 Total 61 3.4 2.6 - 4.4
TABLE 75: Frequency and age-specific rates (per 100,000 people), Malaria, by age
group, WHR (2011-2015)

121 WRHA THE EPIDEMIOLOGY OF COMMUNICABLE DISEASES IN THE WINNIPEG HEALTH REGION
2016 2011-2015 Total No. % No. % No. %
Month January 3 18.8 5 6.3 8 8.4 February 0 0.0 6 7.6 6 6.3 March 0 0.0 5 6.3 5 5.3 April 0 0.0 1 1.3 1 1.1 May 4 25.0 12 15.2 16 16.8 June 1 6.3 8 10.1 9 9.5 July 1 6.3 3 3.8 4 4.2 August 3 18.8 10 12.7 13 13.7 September 2 12.5 12 15.2 14 14.7 October 0 0.0 7 8.9 7 7.4 November 0 0.0 6 7.6 6 6.3
December 2 12.5 4 5.1 6 6.3
FIGURE 53: Frequency, Malaria, by month, WHR (2016 vs. 2011-2015 mean)
TABLE 76: Frequency and proportion, Malaria, by month, WHR (2011-2016)

WRHA THE EPIDEMIOLOGY OF COMMUNICABLE DISEASES IN THE WINNIPEG HEALTH REGION 122
Number Crude Rate Age-Standardized Rate 95%CI
Community area St. James 3 0.8 1.0 0.2 - 2.7 Assiniboine South 0 0.0 0.0 0.0 - 1.8 Fort Garry 15 3.0 2.9 1.6 - 4.8 St. Vital 6 1.4 1.6 0.6 - 3.5 St. Boniface 17 4.9 5.0 2.9 - 8.0 Transcona 1 0.4 0.4 0.0 - 2.2 River East 11 1.9 1.9 0.9 - 3.4 Seven Oaks 6 1.4 1.3 0.5 - 2.8 Inkster 2 1.0 0.8 0.1 - 3.2 Point Douglas 1 0.4 0.3 0.0 - 1.9 Downtown 30 6.1 6.0 4.0 - 8.6 River Heights 3 0.9 0.9 0.2 - 2.6 Total 95 2.2 2.2 1.8 - 2.7
FIGURE 54: Age-standardized rates (per 100,000 people), Malaria, by community area, WHR
(2011-2016)
TABLE 77: Frequency, crude and age-standardized rates (per 100,000 people), Malaria, by community area, WHR (2011-2016)

123 WRHA THE EPIDEMIOLOGY OF COMMUNICABLE DISEASES IN THE WINNIPEG HEALTH REGION
WEST NILE VIRUS
Number Crude Rate
2011 0 0.0
2012 13 1.8
2013 2 0.3
2014 1 0.1
2015 2 0.3
2016 8 1.1
Total 26 0.6
TABLE 78: Frequency and crude rates (per 100,000 people), West Nile Virus,
WHR (2011-2016)
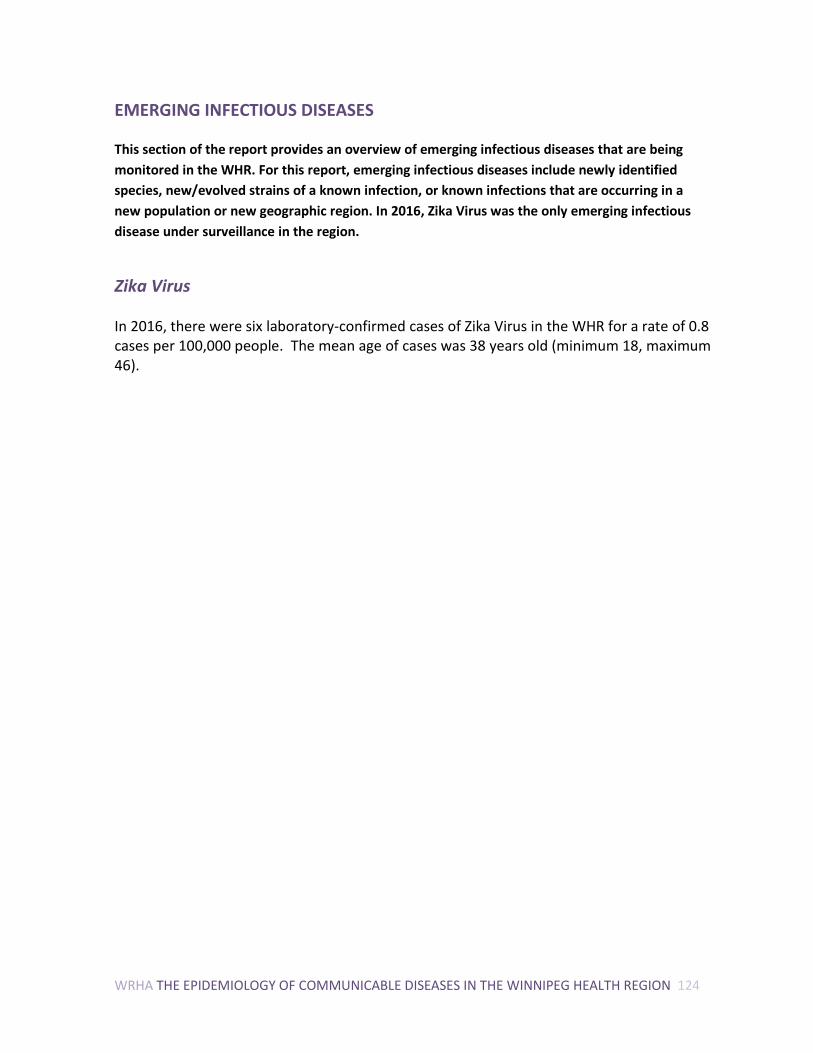
WRHA THE EPIDEMIOLOGY OF COMMUNICABLE DISEASES IN THE WINNIPEG HEALTH REGION 124
EMERGING INFECTIOUS DISEASES
This section of the report provides an overview of emerging infectious diseases that are being
monitored in the WHR. For this report, emerging infectious diseases include newly identified
species, new/evolved strains of a known infection, or known infections that are occurring in a
new population or new geographic region. In 2016, Zika Virus was the only emerging infectious
disease under surveillance in the region.
Zika Virus
In 2016, there were six laboratory-confirmed cases of Zika Virus in the WHR for a rate of 0.8 cases per 100,000 people. The mean age of cases was 38 years old (minimum 18, maximum 46).

125 WRHA THE EPIDEMIOLOGY OF COMMUNICABLE DISEASES IN THE WINNIPEG HEALTH REGION
APPENDICES
APPENDIX A – Common and technical names of reportable diseases under The Manitoba Public Health Act
Common name Scientific or technical name of disease or its
infectious agent Included
Rational for exclusion
AIDS Acquired Immunodeficiency syndrome X
Not captured in iPHIS
Amebiasis Entamoeba histolytica √
Anaplasmosis (human granulocytic anaplasmosis)
Anaplasma phagocytophilum √
Anthrax Bacillus anthrasis √
Babesiosis Babesia species √
Benign tumour of the brain or central nervous system
Benign tumour of the brain or central nervous system X
Not captured in iPHIS
Blastomycosis Blastomyces dermatitidis √
Botulism Clostridium botulinum √
Brucellosis Brucella species √
Campylobacteriosis Camplylobacter species √
Cancer or malignant neoplasm Cancer or malignant neoplasm X
Not captured in iPHIS
Chancroid Haemophilus ducreyi X
Not captured in iPHIS
Chlamydia Chlamydia trachomatis (including LGV) X
Not captured in iPHIS
Cholera Vibrio cholerae, subgroup O1 O139 or other toxigenic only √
Clostridium difficile associated diarrhea
Clostridium difficile toxin X
Not captured in iPHIS
Congenital Rubella Infection/Syndrome
Rubella virus √
Creutzfeldt-Jakob Disease, Classic and Variant
Creutzfeldt-Jakob Disease prion √
Cryptosporidiosis Cryptosporidium species √
Cyclospora Cyclospora cayetanensis √
Diphtheria
toxin-producing Corynebacterium species: Dipheriae, ulcerans, pseudotuberculosis √
Giardiasis Giardia lamblia, intestinalis, duodenalis √
Gonorrhea Neisseria gonorrhoaea X
Not captured in iPHIS
+Haemophilus influenzae Haemophilus influenzae √

WRHA THE EPIDEMIOLOGY OF COMMUNICABLE DISEASES IN THE WINNIPEG HEALTH REGION 126
Common name Scientific or technical name of disease or its
infectious agent Included
Rational for exclusion
Serotype B Invasive Disease (serotype B)
+Haemophilus influenzae non-Serotype B Invasive Disease
Haemophilus influenzae (non serotype B) √
Hantavirus Pulmonary Syndrome
Hantavirus √
Hepatitis A Hepatitis A virus √
Hepatitis B Hepatitis B virus √
Hepatitis C Hepatitis C virus X
Not captured in iPHIS
HIV Human Immunodeficiency virus X
Not captured in iPHIS
Influenza, Laboratory Confirmed Influenza virus X
Reported elsewhere
Legionellosis Legionella species √
Leprosy Mycobacterium leprae √
Listeriosis invasive disease Listeria monocytogenes in normally sterile tissue √
Lyme Disease Borrelia burgdorferi √
Malaria Plasmodium species √
Measles Measles virus √
Meningococcal invasive disease Neisseria meningitidis √
Mumps Mumps virus √ Pertussis Bordetella pertussis √
Plague Yersinia pestis √
Pneumococcal Disease, Invasive Streptococcus pneumoniae √
Poliomyelitis Poliovirus √
Q fever Coxiella burnetii √
Rabies Rabies virus √
Rubella Rubella virus √
Salmonellosis Salmonella species, excluding S. typhi √
Severe Acute Respiratory Infection (SARI)
Severe Acute Respiratory Infection √
Shigellosis Shigella species √
Smallpox Variola major & minor virus √
Streptococcal Invasive Disease (Group A)
Streptococcus pyogenes √
Streptococcal Invasive Disease of the newborn (Group B)
Streptococcus agalactiae √
Syphilis (All categories) Treponema pallidum pallidum X
Not captured in iPHIS
Tetanus Clostridium tetani √
Tuberculosis Mycobacterium X Reported

127 WRHA THE EPIDEMIOLOGY OF COMMUNICABLE DISEASES IN THE WINNIPEG HEALTH REGION
Common name Scientific or technical name of disease or its
infectious agent Included
Rational for exclusion
tuberculosis, africanum, canetti, caprae, microti, pinnipedi, bovis
elsewhere
Tularemia Francisella tularensis √
Typhoid Fever Salmonella typhi √
Verotoxigenic Escherichia coli infection
Verotoxin-producing strains of E.coli √
Viral Hemorrhagic Fever Crimean Congo, Lassa, Ebola, Marburg, Rift Valley √
West Nile Virus (WNV) West Nile Virus √
Yellow Fever Yellow Fever Virus √

WRHA THE EPIDEMIOLOGY OF COMMUNICABLE DISEASES IN THE WINNIPEG HEALTH REGION 128 WRHA WINIPEG HEALTH REGION INJURY REPORT, 2000–2010 1
200-2010 PUBLISHED MARCH 2014