Embed Size (px)
Citation preview


Editor in Chief Anny Ratnawati
Managing EditorAri Wahyuni
EditorsMeriyam Megia S.Made Arya WijayaAgung WidiadiDwi PudjiastutiAgus KuswantoroPurwiyantoAhmad NawawiR. Bambang ArisaptoAnggiat SitanggangPurwantoKartika SupriyonoDyah KusumawatiLusijanto ErfanWawan Sunarjo
AfrizalEristianingsihMariatul Aini
ContributorsRice KrisnawatiAminullahKurnia KhairiSunawan Agung S.Hendra KurniawanSudadiTeguh RahayuM. Indra Zakaria T.Achmad ZunaidiMujibudda’wahPuji WibowoArief Masdi
Graphic Design and PhotograferSatya SusantoMulyanto
Dana HadiSis Sabani
SecretariatRini ArivianiTriana AmbarsariAsrukhil ImroIhsan MaulanaAhmad PurwoBayu Segara Rachmat ApriansyahMujono BasukiNiken Ajeng LestariEko WidyasmoroEko PrasetyoArfan udi WinasisTinton DitisramaEko Agus Rianto
Photographs Courtesy ofWarta Anggaran
Publication Team

5THE INDONESIANBUDGET OVERVIEW 2010
Daftar IsiContents
Sambutan Direktur Jenderal AnggaranRemarks From The Director General Of Budget
Ringkasan EksekutifExecutive Summary
Bab I : Rencana Pembangunan Jangka Menengah Nasional (RPJMN) 2010-2014Capter I : The 2010-2014 National Medium-Term Development Plan
Bab II : Anggaran Pendapatan Dan Belanja Negara (APBN) Tahun 2010Capter II :The 2010 Indonesian Budget
Bab III : Sistem PenganggaranCapter III : The Budget System
Bab IV : Isu-Isu AktualCapter IV : Actual IssuE
1. Kebijakan Pembatasan Subsidi Bahan Bakar Minyak (BBM) : Potensi Manfaat Dan Risikonya, Serta Rekomendasi Tindak Lanjutnya
1. Fuel (BBM) Subsidy Limitation Policy: Its Potential Benefits And Risks General
2. Penerapan Reward Dan Punishment Stimulus Fiskal2. Application Of Reward And Punishment In Fiscal Stimulus
3. Pengalihan Pajak Bumi Dan Bangunan Dan Bea Perolehan Hak Atas Tanah Dan Bangunan Menjadi Pajak Kabupaten/Kota
3. The Diversion Of Land And Building Tax (PBB) And Duties On Land And BuildiNg Transfers (BPHTB) To Become Regency/City Taxes
4. Peranan Rekening Migas Dalam Optimalisasi Pendapatan Negara4. The Roles Of Oil And Gas Account In The Optimization Of State Revenues
5. Fasilitas Likuiditas Pembiayaan Perumahan Sebuah Upaya Pemerintah Untuk Mempercepat Pemenuhan Kebutuhan Rumah Bagi Masyarakat Berpenghasilan Rendah
5. Housing Finance Liquidity Facility: An Effort Of The Government To Accelerate The Fulfillment Of Housing Need For Low-Income Communities
5
7
13
23
55
107
135
137
155
175
187
195
DAFTAR ISI
CONTENTS

6 THE INDONESIANBUDGET OVERVIEW 2010
6. Dampak Krisis Yunani TerhadAp APBN6. The Impact Of The Greek Crisis On The Indonesian Economy
Appendix
211
235

SAMBUTANDIREKTUR JENDERAL ANGGARAN
REMARKS FROM THE DIRECTOR GENERAL OF BUDGET


9THE INDONESIANBUDGET OVERVIEW 2010
Seperti juga tahun 2009 yang penuh
dengan warna naik turunnya perekonomian, dunia
maupun domestik, tahun 2010 merupakan tahun
yang sarat dengan tantangan. Secara khusus
tahun 2010 merupakan tahun pertama Kabinet
Indonesia Bersatu II menjalankan periode kedua
pemerintahan di bawah pimpinan Presiden Susilo
Bambang Yudhoyono dan Wakil Presiden Boediono.
Sebagaimana amanat UU No. 25 Tahun 2004 tentang
Sistem Perencanaan Pembangunan Nasional, maka
tiga bulan setelah pelantikan Presiden dibuat suatu
Rencana Pembangunan Jangka Menengah Nasional
(RPJMN) yang merupakan penjabaran dari visi, misi
dan program Presiden.
Program pembangunan lima tahun ke depan
memiliki lima agenda utama pembangunan nasional
tahun 2010 – 2014, yaitu: (1) pembangunan ekonomi
dan peningkatan kesejahteraan rakyat; (2) perbaikan
tata kelola pemerintahan; (3) penegakan pilar
demokrasi; (4) penegakan hukum dan pemberantasan
Similar to 2009, in which the global and
domestic economy was full of ups and downs,
2010 is also a year that is full of challenges. On a
special note, 2010 is the first year of the 2nd United
Indonesia Cabinet in running its second term of
office under President Susilo Bambang Yudhoyono
and Vice President Boediono. As mandated by Law
No. 25 of 2004 regarding the National Development
Planning System, three months after the Presidential
inauguration, the National Medium-Term
Development Plan (RPJMN) must be formulated as
an explanation of the President’s vision, missions and
programs.
The development programs for the next
five years have five main agendas for 2010-2014
national development, namely: (1) economic
development and enhancement of public welfare;
(2) improvement of governance; (3) enforcement of
the pillars of democracy; (4) law enforcement and
SAMBUTANDIREKTUR JENDERAL ANGGARAN
REMARKS FROMTHE DIRECTOR GENERAL OF BUDGET

10 THE INDONESIANBUDGET OVERVIEW 2010
korupsi; dan (5) pembangunan yang inklusif dan
berkeadilan. Menjadi dasar bagi Direktorat Jenderal
Anggaran (DJA) dalam perencanaan penganggaran
sehingga mampu menunjang pencapaian program
pembangunan nasional lima tahun ke depan.
Pada saat yang sama, DJA juga mempunyai
agenda reformasi penganggaran yang secara
terus menerus disempurnakan. Tidak terbatas
pada pelaksanaan tiga pilar sistem penganggaran
yang merupakan amanat UU No. 17 Tahun 2003
tentang Keuangan Negara yaitu Penganggaran
Terpadu, Kerangka Pengeluaran Jangka Menengah
dan Penganggaran Berbasis Kinerja, namun juga
perangkat yang akan menunjang pelaksanaan tiga
pilar tersebut, seperti pemberlakuan mekanisme
reward and punishment yang mulai diberlakukan
bagi Kementerian Negara/Lembaga (K/L) penerima
stimulus fiskal.
Sistem penganggaran yang baik juga
perlu ditunjang dengan peraturan-peraturan yang
responsif terhadap perkembangan keadaan. Hal ini
antara lain yang mendorong DJA untuk melakukan
revisi UU No. 20 Tahun 1997 tentang Penerimaan
Negara Bukan Pajak, dimana pada tahun 2010 telah
masuk dalam salah satu Program Legislasi Nasional.
Penerbitan buku Sekilas Penganggaran
Indonesia Tahun 2010 ini tidak hanya mengupas
hal-hal di atas tetapi juga menyampaikan isu-
corruption eradication; and (5) inclusive and fair
development. which serve as a foundation for the
Directorate General of Budget (DJA) in planning the
Indonesian Budget so as to be able to support the
achievement of the national development program
for the next five years.
In the meantime, the DJA also has a
budgeting reform agenda which undergoes
continuous improvement. It is not only limited to
the implementation of the three pillars of budgeting
system as mandated by Law No. 17 of 2003
regarding State Finance, namely Unified Budgeting,
the Medium-Term Expenditure Framework and
Performance-Based Budgeting, but also included the
equipment which will support the implementation
of these three pillars, such as the application of a
reward and punishment mechanism that will begin
to be implemented at State Ministries/Agencies (K/L)
which receive fiscal stimulus.
A good budgeting system also needs to
be supported by regulations that are responsive to
developing conditions. This, among other things,
encourages the DJA to undertake revisions to Law
No. 20 of 1997 regarding Non-Tax State Revenue,
where in 2010 it has been included as one of the
National Legislative Programs.
Other than discussing the above issues,
the 2010 Indonesian Budgeting in Brief (Sekilas
Penganggaran Indonesia Tahun 2010) also explores
SAMBUTAN DIREKTUR JENDERAL ANGGARAN | REMARKS FROM THE DIRECTOR GENERAL OF BUDGETING

11THE INDONESIANBUDGET OVERVIEW 2010
contemporary issues, such as (i) Fuel (BBM) Subsidy
Limitiation Policy; (ii) Application of Reward and
Punishment In Fiscal Stimulus; (iii) The Diversion
Of Land And Building Tax (PBB) And Duties On
Land And Building Transfers (BPHTB) To Become
Regency/City Taxes; (iv) The Roles Of Oil And Gas
Account In The Optimization Of State Revenues;
and (v) Housing Finance Liquidity Facility: An Effort
Of The Government To Accelerate The Fulfillment
Of Housing Need For Low-Income Communities.
Furthermore, we also hope that this book can
broaden the knowledge of our Stakeholders, as well
as the DJA employees in carrying out their day-to-day
tasks. Therefore, the description of the 2010-2014
RPJMN is placed at the beginning of the book, and
followed by the discussion on the 2010 Indonesian
Budget and the 2010 Indonesian Revised Budget.
The implementation of Budgeting Reform that is
initiated simultaneously this year is also presented as
one of the main topics. We hope that, despite all
of the constraints, we will relentlessly continue the
implementation of budgeting reforms until the ideal
condition is achieved.
Despite our best efforts, we realize that
this book is not without any shortcomings. For that
reason, we are happy to receive any constructive
suggestions and criticisms from all of the readers. We
believe these will serve to enhance the performance
of both the DJA and the Government as a whole.
isu aktual lain, seperti (i) Kebijakan Pembatasan
Subsidi Bahan Bakar Minyak (BBM); (ii) Penerapan
Reward dan Punishment Stimulus Fiskal; (iii)
Pengalihan Pajak Bumi Dan Bangungan Dan Bea
Perolehan Hak Atas Tanah Dan Bangunan Menjadi
Pajak Kabupaten/Kota; (iv) Peranan Rekening
Migas Dalam Optimalisasi Pendapatan Negara;
dan (v) Fasilitas Likuiditas Pembiayaan Perumahan
Sebuah Upaya Pemerintah Untuk Mempercepat
Pemenuhan Kebuutuhan Rumah Bagi Masyarakat
Berpenghasilan Rendah. Buku ini kami harapkan
dapat membuka wawasan seluruh stakeholder
termasuk pegawai DJA dalam melaksanakan tugas
sehari-hari. Karena itulah penjabaran RPJMN 2010 -
2014 diletakkan pada awal bahasan, dan kemudian
diikuti dengan bahasan mengenai APBN dan APBN-P
2010. Pelaksanaan Reformasi Penganggaran yang
dimulai secara serentak pada tahun ini, juga tetap
kami sajikan sebagai salah satu topik utama. Kami
berharap, dengan segala kendala yang dihadapi, kita
tetap melangkah maju dalam menjalankan reformasi
penganggaran sehingga kita akan sampai pada
kondisi yang ideal.
Kami menyadari bahwa masih ada
kekurangan dalam penyusunan buku ini. Untuk
itu, dengan besar hati kami akan selalu menerima
segala saran dan kritik yang membangun dari semua
pembaca. Kami percaya, apa yang disampaikan
bertujuan untuk meningkatkan kinerja, baik DJA
SAMBUTAN DIREKTUR JENDERAL ANGGARAN | REMARKS FROM THE DIRECTOR GENERAL OF BUDGETING

12 THE INDONESIANBUDGET OVERVIEW 2010
maupun pemerintahan secara keseluruhan.
Saya memberikan penghargaan kepada
semua pihak yang telah membantu penerbitan
buku ini, khususnya kepada Tim Penyusun. Semoga
apa yang kita kerjakan bermanfaat dan menjadi
pendorong untuk berbuat lebih baik lagi. Selamat
membaca.
Direktur Jenderal Anggaran
Director General,
Anny Ratnawati
I extend my appreciation to all parties who
have assisted with the publication of this book,
particularly to the Team of Authors. I hope that what
we have done will be beneficial and prompt us to do
things better. Happy reading.

RINGKASAN EKSEKUTIF
EXECUTIVE SUMMARY


15THE INDONESIANBUDGET OVERVIEW 2010
The 2010 Indonesian Budget is the first annual budget
planning document in the series of implementing the
2010-2014 Medium-Term National Development
Plan, which is a manifestation of the new Government
administration’s work priority for the 5 year-period,
following the democratic elections which were held
in mid-2009. In line with the national policy that has
been set at the beginning of new administration, and
in line with the medium-term planning documents,
the Indonesian Budget for the 2010 fiscal year is aimed
at: (1) improving all of the public welfare programs;
(2) continuing the fiscal stimulus program through
infrastructure, agricultural and energy development,
and labor-intensive projects; (3) encouraging business
world recovery, including through the granting of tax
and import duty incentives; (4) continuing bureaucratic
reform; (5) enhancing defense equipment; and (6)
maintaining the education budget to be at least 20
percent of the Indonesian Budget.
The first section of this book will present a
description of the 2010-2014 Medium-Term National
Anggaran Pendapatan dan Belanja Negara (APBN)
tahun 2010 merupakan dokumen perencanaan
anggaran tahunan pertama dari rangkaian
pelaksanaan Rencana Pemerintah Jangka Menengah
Nasional 2010-2014, yang merupakan manifestasi
dari prioritas kerja Pemerintahan baru selama 5
tahun kedepan setelah diselenggarakannya pesta
demokrasi pada pertengahan tahun 2009. Sejalan
dengan kebijakan nasional yang telah ditetapkan
pada awal pemerintahan yang baru serta searah
dengan dokumen perencanaan jangka menengah,
APBN tahun anggaran 2010 diarahkan untuk (1)
meningkatkan seluruh program kesejahteraan rakyat;
(2) melanjutkan program stimulus fiskal melalui
pembangunan infrastruktur, pertanian dan energi,
serta proyek padat karya; (3) mendorong pemulihan
dunia usaha, termasuk melalui pemberian insentif
perpajakan dan bea masuk; (4) meneruskan reformasi
birokrasi; (5) memperbaiki alutsista; serta (6) menjaga
anggaran pendidikan minimal 20 persen dari APBN.
Bagian pertama buku ini menyajikan uraian mengenai
Rencana Pembangunan Jangka Menengah Nasional
RINGKASAN EKSEKUTIF
EXECUTIVE SUMMARY

16 THE INDONESIANBUDGET OVERVIEW 2010
Development Plan (RPJMN), containing the five main
agendas of National Development for 2010-2014,
namely: (1) economic development and public welfare
improvement; (2) improvements to Governance;
(3) enforcement of the pillars of democracy; (4)
law enforcement and corruption eradication; and
(5) inclusive and fair development. To facilitate the
application and measurement of the success of
national development, these five main agendas will
be described in further detail, based on sector priority
and territorial development priority.
The second section of this book highlights the fiscal
policy for 2010, as is reflected in the 2010 Indonesian
Budget, for policies in the fields of revenue,
expenditures, and policies in the finance sector, in the
framework of the achievement of various targets in
the Indonesian Budget. This section will also examine
the Medium-Term Budget Framework (MTBF). The
development of the MTBF is aimed to realize fiscal
sustainability and debt sustainability through the
projection of the Indonesian Budget posture and
medium-term policies. At the end of this second
section, the reasons that led the Government to
accelerate the submission of the 2010 Indonesian
Revised Budget will be described.
The third section of this book will examine the
development of the budgeting system. Budgeting
reform was begun in fiscal year 2005 as mandated
by Law No. 17 of 2003 regarding State Finance.
There are three budget preparation approaches
being applied in the new budgeting system, namely:
(RPJMN) 2010-2014 yang memuat lima agenda
utama Pembangunan Nasional tahun 2010-2014,
yaitu: (1) pembangunan ekonomi dan peningkatan
kesejahteraan rakyat; (2) Perbaikan tata kelola
pemerintahan; (3) penegakan pilar demokrasi; (4)
penegakan hukum dan pemberantasan korupsi; dan
(5) pembangunan yang inklusif dan berkeadilan. Untuk
memudahkan penerapan dan pengukuran tingkat
keberhasilan pembangunan nasional, kelima agenda
utama tersebut diuraikan lebih lanjut berdasarkan
prioritas bidang dan prioritas pembangunan
kewilayahan.
Bagian kedua buku ini mengupas kebijakan fiskal
tahun 2010 yang tercermin dalam APBN 2010, baik
kebijakan dibidang pendapatan negara, belanja
negara, maupun kebijakan di bidang pembiayaan
dalam rangka pencapaian berbagai target dalam APBN.
Bagian ini juga membahas kerangka APBN Jangka
Menengah (Medium Term Budget Framework/MTBF).
Penyusunan MTBF tersebut bertujuan mewujudkan
kesinambungan fiskal (fiscal sustainability) dan
kesinambungan utang (debt sustainability) melalui
proyeksi postur APBN dan kebijakan jangka menengah.
Pada akhir bagian kedua ini, diuraikan alasan yang
menyebabkan Pemerintah melakukan percepatan
pengajuan APBN-P tahun 2010.
Bagian ketiga buku ini membahas mengenai
perkembangan sistem penganggaran. Reformasi
penganggaran mulai dilaksanakan pada tahun
anggaran 2005 sesuai dengan amanat UU No 17 tahun
2003 tentang Keuangan Negara. Ada tiga pendekatan
penyusunan anggaran yang diterapkan pada sistem
RINGKASAN EKSEKUTIF | EXECUTIVE SUMMARY

17THE INDONESIANBUDGET OVERVIEW 2010
integrated budgeting, performance-based budgeting,
and the medium-term expenditure framework. The
classification being used now is differentiated by
function, organization, and type of expenditure.
Another matter which is described in this section
is a budgeting process that covers preparation,
implementation, and accountability of the budget.
Entering 2010, the steps which are to taken in
comprehensively implementing performance-based
budgeting for fiscal year 2011 are outlined. At the
end of the third section, the direction of the budgeting
system development is explained, beginning from
the first phase of the implementation stage in 2005,
and the second phase, lasting from 2010 to 2014,
covering activities that have been carried out in 2010,
followed by efforts to consolidate the implementation
of budgeting reforms in 2012 and 2013. The
third phase, the completion stage, is scheduled to
commence in 2015.
The closing section of this book examines actual issues
related to budgeting in 2010.
The first issue is the Fuel Oil (BBM) Subsidy Limitation
Policy.
Subsidy expenditure, including the fuel oil subsidy,
is one very important component of the Indonesian
budget. This can be seen from the development of
its magnitude, its proportion to expenditures, and
its ratio to GDP, which tends to be significant in the
Indonesian Budget. The strategic position of this
subsidy, in addition to being seen from the state
penganggaran baru yaitu meliputi penganggaran
terpadu, penganggaran berbasis kinerja, dan
kerangka pengeluaran jangka menengah. Sedangkan
klasifikasi yang digunakan dibedakan menurut fungsi,
organisasi, dan jenis belanja. Hal lain yang dijelaskan di
bagian ini adalah proses penganggaran yang meliputi
penyusunan, pelaksanaan, dan pertanggungjawaban
anggaran. Memasuki tahun 2010, diuraikan
langkah-langkah yang telah dilakukan dalam rangka
penerapan penganggaran berbasis kinerja secara
utuh di tahun anggaran 2011. Di akhir bagian ketiga,
dijelaskan arah perkembangan sistem penganggaran
yang diawali dari fase pertama tahap penerapan
yaitu tahun 2005 dan fase kedua yaitu tahun 2010
sampai dengan 2014 yang meliputi kegiatan yang
telah dilaksanakan di tahun 2010 yang diikuti
dengan upaya pemantapan penerapan reformasi
penganggaran di tahun 2012 dan 2013. Fase ketiga
yang merupakan tahap penyempurnaan dijadwalkan
mulai dilaksanakan pada tahun 2015.
Bagian akhir buku ini membicarakan isu-isu aktual
yang berkaitan dengan penganggaran di tahun
2010.
Isu Pertama, Kebijakan Pembatasan Subsidi Bahan
Bakar Minyak (BBM)
Belanja subsidi termasuk subsidi BBM merupakan salah
satu komponen APBN yang sangat penting. Hal ini
terlihat dari perkembangan besarannya, proporsinya
terhadap belanja, dan rasionya terhadap PDB, yang
cenderung signifikan terhadap APBN. Posisi strategis
subsidi selain dilihat dari sisi keuangan negara, juga
ditinjau dari efektivitas tujuan, keadilan penerima,
RINGKASAN EKSEKUTIF | EXECUTIVE SUMMARY

18 THE INDONESIANBUDGET OVERVIEW 2010
finance standpoint, is also viewed in terms of the
effectiveness of its objectives, fairness for the recipients,
as well as the processes and mechanisms for subsidy
allocation. The current discourse is the reason which
led to this writing being made, namely that the fuel oil
subsidy policy was being eliminated for the medium
and upper economic groups, while other economic
groups are still receive the subsidy. Therefore, this
writing is divided into several sub-topics that cover the
developments of subsidy spending, and the impact of
fuel oil subsidy limitations on the national economy at
the macro and micro levels, on recipient communities,
and on the government. This writing concludes with
some important notes of recommendation.
The second issue is the application of Reward and
Punishment fiscal stimulus.
Observing the global crisis which took place from
2008-2009, the Government, together with the
House of Representatives, considered it was necessary
to take special measures through a fiscal stimulus
policy in 2009. These measures were accompanied
by a reward and punishment system for the K/Ls
which received fiscal stimulus allocations. This writing
presents complete information on the background
situation, the fiscal stimulus policy, the fiscal stimulus
implementation, the application of rewards and
punishments, as well as some problems being faced.
The third issue is the Diversion of Land and Building
Tax (PBB) and Duties on Land and Building Transfer
(BPHTB) to become Regency/City Taxes.
The stipulations of Law No. 28 of 2009 in lieu of Law
No. 18 of 1997 as amended by Law No. 34 of 2000
serta proses dan mekanisme penyaluran subsidi.
Alasan yang mendorong lahirnya tulisan ini adanya
wacana terkini yaitu kebijakan pencabutan subsidi
BBM bagi golongan ekonomi menengah ke atas,
sementara golongan ekonomi lain tetap mendapatkan
subsidi. Untuk itu, tulisan ini dibagi menjadi beberapa
sub bahasan yang meliputi perkembangan belanja
subsidi, dampak pembatasan subsidi BBM bagi
perekonomian nasional secara makro dan mikro, bagi
masyarakat penerima, maupun bagi pemerintah.
Tulisan ini ditutup dengan beberapa catatan penting
yang bersifat rekomendasi.
Isu Kedua, Penerapan Reward dan punishment
stimulus fiskal
Mencermati krisis global yang terjadi pada tahun
2008-2009, Pemerintah bersama DPR merasa perlu
mengambil langkah-langkah khusus melalui kebijakan
stimulus fiskal di tahun 2009. Langkah tersebut
diiringi dengan adanya reward dan punishment bagi
K/L yang mendapat alokasi stimulus fiskal. Tulisan ini
menyajikan informasi yang komplit mengenai latar
belakang, kebijakan stimulus fiskal, pelaksanaan
stimulus fiskal, penerapan reward dan punishment
serta beberapa permasalahan yang dihadapi.
Isu Ketiga, Pengalihan Pajak Bumi dan Bangunan (PBB)
dan Bea Perolehan Hak atas Tanah dan Bangunan
(BPHTB) menjadi Pajak Kabupaten/Kota
Penetapan UU no 28 Tahun 2009 sebagai pengganti
UU Nomor 18 Tahun 1997 sebagaimana telah diubah
RINGKASAN EKSEKUTIF | EXECUTIVE SUMMARY

19THE INDONESIANBUDGET OVERVIEW 2010
has provided a fundamental change, namely with the
diversion of 2 types of central taxes to new taxes for
the regencies/cities, namely the PBB and the BPHTB.
The diversion of PBB-P2 will become effective as of
the 1st of January, 2014, while the BPHTB will be
conducted starting on the 1st of January, 2011. This
writing describes the theoretical basis of diverting
of PBB and BPHTB to become Regional Taxes, the
policies underlying the diverting of those taxes, and its
implications for central and regional finances.
The fourth issue is the Role of the Oil and Gas
Account in Revenue Optimization.
Oil and gas revenues are still the mainstay of Non-
Tax Revenues (PNBP). This can be seen from the
composition of oil and gas resource revenues, which
reach two-thirds of the total of non-tax revenues.
Given that oil and gas natural resource revenues have
unique characteristics, one of which is its mechanism
where receipts must first be deposited into the
Ministry of finance bank account with the Bank of
Indonesia, this section tries to describe types of oil
and gas revenues as well as the roles and functions of
the oil and natural gas account. From this writing, it
becomes evident that BPMIGAS, PSC, and Pertamina
are the parties which play important parts to support
the implementation of the DJA in optimizing state
revenue resources from the oil and gas sector.
The fifth issue is the Housing Financing Liquidity
Facility.
The availability of housing which is widely and evenly
distributed is an important aspect in improving
the productivity of production sector. Towards that
dengan UU Nomor 34 tahun 2000 telah memberikan
perubahan yang mendasar yaitu dengan dialihkannya
2 jenis pajak pusat menjadi pajak baru bagi kabupaten/
kota, yaitu PBB dan BPHTB. Pengalihan PBB-P2 efektif
diberlakukan mulai 1 Januari 2014 sedangkan BPHTB
dilakukan mulai 1 Januari 2011. Tulisan ini mencoba
menjelaskan mengenai landasan teoritis pengalihan
PBB dan BPHTB menjadi Pajak Daerah, kebijakan yang
mendasari pengalihan tersebut, serta implikasinya
bagi keuangan pusat dan daerah.
Isu Keempat, Peranan Rekening Migas dalam
Optimalisasi Pendapatan Negara.
Penerimaan migas masih menjadi andalan dari
Penerimaan Negara Bukan Pajak (PNBP). Hal ini terlihat
dari komposisi penerimaan SDA migas yang mencapai
dua pertiga dari total PNBP. Mengingat penerimaan
SDA migas memiliki karakteristik yang unik, yaitu salah
satu mekanisme penerimaannya harus terlebih dahulu
disetor ke rekening kementerian keuangan di Bank
Indonesia, maka bagian ini mencoba menguraikan
jenis penerimaan migas, peranan berikut fungsi
rekening migas. Dari tulisan tersebut, terlihat bahwa
BPMIGAS, KKKS, dan Pertamina merupakan pihak-
pihak yang menjadi bagian penting yang menunjang
pelaksanaan DJA dalam mengoptimalkan sumber
pendapatan negara dari sektor migas.
Isu Kelima, Fasilitas Likuiditas Pembiayaan Perumahan
Ketersediaan perumahan secara luas dan merata
merupakan aspek penting dalam meningkatkan
produktivitas sektor produksi. Untuk itu, Pemerintah
telah menetapkan sasaran pembangunan perumahan
RINGKASAN EKSEKUTIF | EXECUTIVE SUMMARY

20 THE INDONESIANBUDGET OVERVIEW 2010
end, the Government has set a goal of housing
development in the 2010-2014 RPJMN documents.
This writing provides a comprehensive analysis on
housing development, as seen from the policy,
objectives and problems, Simple and Healthy House
Ownership Credit (KPRSH), and an explanation on
the issuance of the Housing Finance Liquidity Facility
(FLPP) Policy.
The sixth issue is the Impacts of Greek Crisis on the
Indonesian Budget.
In general, this section examines the development
of the global crisis which began spreading in 2008.
However, this writing highlights a specific case which
has become an important issue in the world economy,
namely the occurrence of the Greek crisis. It is feared
that the impacts of the Greek crisis will spread to
Indonesia through several transmission channels,
namely trade, banking, and the financial market.
The extent of the impact of the Greek crisis on the
Indonesian Budget is presented in the concluding
theme.
dalam dokumen RPJMN 2010-2014. Tulisan ini
memberikan analisis tentang pembangunan
perumahan secara komprehensif baik dari kebijakan,
sasaran dan permasalahannya, subsidi Kredit
Pemilikan Rumah Sederhana Sehat (KPRSh) serta
penjelasan tentang terbitnya Kebijakan Fasilitas
Likuiditas Pembiayaan Perumahan (FLPP).
Isu Keenam, Dampak Krisis Yunani Terhadap APBN
Secara umum, bagian ini mengulas perkembangan
krisis global yang mulai menjalar di tahun 2008.
Namun tulisan ini mencermati kasus spesifik yang
menjadi isu penting di perekonomian dunia yaitu
terjadinya krisis Yunani. Dampak dari krisis Yunani
tersebut dikhawatirkan akan merembet ke Indonesia
melalui beberapa jalur transmisi yaitu perdagangan,
perbankan, dan pasar keuangan. Seberapa jauh
pengaruh krisis Yunani terhadap APBN menjadi sajian
penutup tema ini.
RINGKASAN EKSEKUTIF | EXECUTIVE SUMMARY


23THE INDONESIANBUDGET OVERVIEW 2010
Rencana Pembangunan Jangka Menengah
Nasional (RPJMN) 2010-2014 merupakan
penjabaran dari Visi, Misi, dan Program Presiden
yang penyusunannya berpedoman pada Rencana
Pembangunan Jangka Panjang Nasional (RPJPN)
2005-2025. RPJMN 2010-2014 ini selanjutnya
menjadi pedoman bagi kementerian/lembaga dalam
menyusun Rencana Strategis kementerian/lembaga
(Renstra-KL) dan menjadi bahan pertimbangan bagi
pemerintah daerah dalam menyusun/menyesuaikan
rencana pembangunan daerahnya masing-masing
dalam rangka pencapaian sasaran pembangunan
nasional. Untuk pelaksanaan lebih lanjut, RPJMN
akan dijabarkan ke dalam Rencana Kerja Pemerintah
(RKP) yang akan menjadi pedoman bagi penyusunan
Rancangan Anggaran Pendapatan dan Belanja Negara
(RAPBN).
Tema yang dicanangkan dalam penyusunan Rencana
Pembangunan Jangka Menengah Nasional (RPJMN)
tahun 2010-2014 adalah “Terwujudnya Indonesia
yang Sejahtera, Demokratis, dan Berkeadilan”.
Untuk mencapai visi tersebut, maka misi Pemerintah
The 2010-2014 National Medium-Term Development
Plan (RPJMN) is an explanation of the President’s
Vision, Mission and Program, the formulation of
which is guided by the 2005-2025 National Long-Term
Development Plan (RPJPN). The 2010-2014 RPJMN is
used as guideline for the ministries/agencies in the
formulation of the Strategic Plans of ministries/agencies
(Renstra-KL) and as material for consideration for the
regional governments in the formulation/adjustment
of their respective regional development plans, in
respect to the achievement of national development
objectives. To be implemented further, the RPJMN will
be referred to in the making of the Government Work
Plan (RKP), which will be used the as guideline in the
formulation of the Proposed Budget (RAPBN).
The theme in the formulation of the 2010-2014
National Medium-Term Development Plan (RPJMN)
is “The Realization of a Prosperous, Democratic
and Fair Indonesia”. In order to achieve this vision,
the Government’s mission in the 2010-2014 period
RENCANA PEMBANGUNAN JANGKA MENENGAH NASIONAL (RPJMN) 2010-2014
THE 2010-2014 NATIONAL MEDIUM-TERM DEVELOPMENT PLAN
1BABCAPTER

24 THE INDONESIANBUDGET OVERVIEW 2010
dalam periode 2010-2014 diarahkan untuk
mewujudkan Indonesia yang lebih sejahtera, aman
dan damai, serta meletakkan fondasi yang lebih
kuat bagi Indonesia yang adil dan demokratis. Dalam
mewujudkan visi dan misi pembangunan nasional
2010-2014 tersebut, Pemerintah telah menetapkan
lima agenda utama pembangunan nasional tahun
2010-2014, yaitu: (1) Pembangunan ekonomi dan
peningkatan kesejahteraan rakyat; (2) Perbaikan tata
kelola pemerintahan; (3) Penegakan pilar demokrasi;
(4) Penegakkan hukum dan pemberantasan korupsi;
dan (5) Pembangunan yang inklusif dan berkeadilan.
Dalam rangka mewujudkan visi dan misi 2010-2014
tersebut, perlu dirumuskan dan dijabarkan lebih
operasional ke dalam sejumlah prioritas pembangunan
sehingga lebih mudah diimplementasikan dan diukur
tingkat keberhasilannya. Selanjutnya, prioritas
pembangunan nasional tersebut dijabarkan lebih
lanjut berdasarkan prioritas bidang dan prioritas
pembangunan kewilayahan. Berikut akan diuraikan
mengenai prioritas pembangunan nasional, prioritas
bidang, dan prioritas pembangunan kewilayahan .
I. Prioritas Pembangunan Nasional
Dalam RPJMN 2010-2014 terdapat 11 prioritas
nasional yang ditetapkan berdasarkan tantangan
pembangunan nasional yang dihadapi saat ini dan
dengan memperhatikan program dan kegiatan
pokok yang disusun oleh K/L dan Pemerintah daerah
yang bersifat realistis, penting dan mendesak untuk
dilaksanakan, serta memiliki dampak nyata, terukur
is directed towards realize a more prosperous, safe
and peaceful Indonesia, and to establish a firmer
foundation for a fair and democratic Indonesia. In
achieving the 2010-2014 national development
vision and mission, the Government has determined
five main agendas for national development from
2010-2014, namely: (1) Economic development and
enhancement of public welfare; (2) Improvement of
governance; (3) Upholding the pillars of democracy;
(4) Law enforcement and corruption eradication; and
(5) Inclusive and fair development.
In regard to the achievement of the 2010-2014 vision
and mission, a number of development priorities
need to be formulated and explained; in this way it
will be easier to implement the vision and mission and
to measure the level of success. Then, the national
development priorities are explained further, based on
fields of priority and regional development priorities.
The national development priorities, fields of priority,
and regional development priorities are described as
follows:
I. National Development Priorities
In the 2010-2014 RPJMN there are 11 national
priorities which have been formulated based on the
national development challenges that are currently
being faced, and by taking into account the main
programs and activities, as formulated by the K/L and
Regional Governments, that are realistic, important,
urgently need to be implemented, and have real,
RENCANA PEMBANGUNAN JANGKA MENENGAH NASIONAL (RPJMN) 2010-2014 | THE 2010-2014 NATIONAL MEDIUM-TERM DEVELOPMENT PLAN

25THE INDONESIANBUDGET OVERVIEW 2010
dan langsung dirasakan oleh masyarakat, yaitu: (1)
reformasi birokrasi dan tata kelola; (2) pendidikan;
(3) kesehatan; (4) penanggulangan kemiskinan; (5)
ketahanan pangan; (6) infrastruktur; (7) iklim investasi
dan usaha; (8) energi; (9) lingkungan hidup dan
bencana; (10) daerah tertinggal, terdepan, terluar,
dan pascakonflik; serta (11) kebudayaan, kreativitas,
dan inovasi teknologi.
Prioritas 1: Reformasi Birokrasi dan Tata Kelola
Pemantapan tata kelola pemerintahan yang lebih
baik melalui terobosan kinerja secara terpadu, penuh
integritas, akuntabel, taat kepada hukum yang
berwibawa, dan transparan. Peningkatan kualitas
pelayanan publik yang ditopang oleh efisiensi struktur
pemerintah di pusat dan di daerah, kapasitas pegawai
pemerintah yang memadai, dan data kependudukan
yang baik. Oleh karena itu, substansi inti dari reformasi
birokrasi dan tata kelola adalah sebagai berikut :
- Konsolidasi struktural dan peningkatan kapasitas
kementerian/lembaga yang menangani aparatur
Negara dan restrukturisasi lembaga pemerintah
lainnya;
- Penataan otonomi daerah;
- Penyempurnaan pengelolaan PNS;
- Percepatan harmonisasi dan sinkronisasi peraturan
perundang-undangan di tingkat pusat dan
daerah;
- Penetapan dan penerapan sistem Indikator Kinerja
Utama Pelayanan Publik yang selaras antara
pemerintah pusat dan pemerintah daerah;
- Peningkatan integrasi dan integritas penerapan
measured and direct impacts for society, namely: (1)
governance and bureaucratic reform; (2) education;
(3) health; (4) poverty reduction; (5) food security; (6)
infrastructure; (7) investment and business climate; (8)
energy; (9) environmental issues and disasters; (10)
underdeveloped, leading, outermost and post-conflict
areas; and (11) culture, creativity, and technological
innovation.
Priority 1: Governance and Bureaucratic Reform
This consists of improved governance stabilization
through integrated performance breakthroughs that
are full of integrity, accountable, comply with the law,
and are transparent. Increased quality of public service
supported by efficiency of the government structure
at the central and regional levels, adequate capacity of
government employees, and good population data.
Therefore, the core substance of governance and
bureaucratic reforms are as follows:
- Structural consolidation and enhancement of the
capacity of ministries/agencies that manage the
state apparatus and the restructuring of other
government institutions;
- Structuring of regional autonomy;
- Improvement of civil servant management;
- Accelerated harmonization and synchronization of
laws and regulations at the central and regional
levels;
- Determination and application of Public Service Key
Performance Indicators system that is in harmony
between the central and regional governments;
- Enhanced integration and integrity of the
RENCANA PEMBANGUNAN JANGKA MENENGAH NASIONAL (RPJMN) 2010-2014 | THE 2010-2014 NATIONAL MEDIUM-TERM DEVELOPMENT PLAN

26 THE INDONESIANBUDGET OVERVIEW 2010
dan penegakan hukum oleh seluruh lembaga dan
aparat hukum;
- Penetapan Nomor Induk Kependudukan (NIK) dan
pengembangan Sistem Informasi dan Administrasi
Kependudukan (SIAK) dengan aplikasi pertama
pada kartu tanda penduduk selambat-lambatnya
pada 2011.
Prioritas 2: Pendidikan
Peningkatan akses pendidikan yang berkualitas,
terjangkau, relevan, dan efisien menuju terangkatnya
kesejahteraan hidup rakyat, kemandirian, keluhuran
budi pekerti, dan karakter bangsa yang kuat.
Pembangunan bidang pendidikan diarahkan demi
tercapainya pertumbuhan ekonomi yang didukung
keselarasan antara ketersediaan tenaga terdidik
dengan kemampuan menciptakan lapangan kerja atau
kewirausahaan dan menjawab tantangan kebutuhan
tenaga kerja. Oleh karena itu, substansi inti program
aksi bidang pendidikan adalah sebagai berikut:
- Meningkatnya akses pendidikan dasar-
menengah;
- Peningkatan Angka Partisipasi Kasar pendidikan
tinggi dari18% di 2009 menjadi 25% di 2014;
- Penerapan metodologi pendidikan yang
menyeluruh yaitu memperhatikan kemampuan
sosial, watak, budi pekerti, kecintaan terhadap
budaya-bahasa Indonesia;
- Pemberdayaan peran kepala sekolah sebagai
manajer sistem pendidikan yang unggul, revitalisasi
application and enforcement of the laws by all law
institutions and apparatuses;
- Determination of the Single Identity Number
(Nomor Induk Kependudukan/NIK) and
development of the Demographic Administration
and Information System (Sistem Informasi and
Administrasi Kependudukan/SIAK) whose first
application on ID cards is to be done by 2011 at
the latest.
Priority 2: Education
This consists of increased access to quality, affordable,
relevant and efficient education towards increased
public welfare, self-sufficiency, noble character and
strong national character. Development in the field
of education is directed towards the achievement
of economic development which is supported by
harmony between the availability of educators and the
ability to create employment or entrepreneurship, as
well as to answer the challenges of manpower needs.
Therefore, the core substance of the action program
in the field of education is as follows:
- Increased access to elementary and secondary
education;
- Increased Approximate Participation Figure of
higher education from 18% in 2009 to 25% in
2014;
- Application of a comprehensive education
methodology, which is done by taking into account
social capacity, character, disposition and love for
Indonesian culture and language;
- Empowerment of the role of headmasters as high-
RENCANA PEMBANGUNAN JANGKA MENENGAH NASIONAL (RPJMN) 2010-2014 | THE 2010-2014 NATIONAL MEDIUM-TERM DEVELOPMENT PLAN

27THE INDONESIANBUDGET OVERVIEW 2010
peran pengawas sekolah sebagai entitas quality
assurance, mendorong aktivasi peran Komite
Sekolah untuk menjamin keterlibatan pemangku
kepentingan dalam proses pembelajaran, dan
Dewan Pendidikan di tingkat Kabupaten;
- Penataan ulang kurikulum sekolah yang dibagi
menjadi kurikulum tingkat nasional, daerah, dan
sekolah;
- Peningkatan kualitas guru, pengelolaan dan
layanan sekolah, antara lain melalui program
remediasi kemampuan mengajar guru dan
penerapan sistem evaluasi kinerja profesional
tenaga pengajar.
Prioritas 3: Kesehatan
Titik berat pembangunan bidang kesehatan melalui
pendekatan preventif, tidak hanya kuratif, melalui
peningkatan kesehatan masyarakat dan lingkungan
di antaranya dengan perluasan penyediaan air
bersih, pengurangan wilayah kumuh sehingga secara
keseluruhan dapat meningkatkan angka harapan
hidup dari 70,7 tahun pada 2009 menjadi 72,0 tahun
pada 2014, dan pencapaian keseluruhan sasaran
Millenium Development Goals (MDGs) tahun 2015.
Oleh karena itu, substansi inti program aksi bidang
kesehatan adalah sebagai berikut:
- Pelaksanaan Program Kesehatan Preventif Terpadu
yang meliputi pemberian imunisasi dasar kepada
90% balita pada 2014; Penyediaan akses sumber
air bersih yang menjangkau 67% penduduk dan
akses terhadap sanitasi dasar berkualitas yang
quality educational system managers; revitalization
of the role of school supervisor as quality assurance
entities, encouraging the activation of the role of
the School Committee to ensure the involvement
of stakeholders in the learning process, including
the Education Board at the District level;
- Restructuring of the school curriculum into
national, regional and school curriculum divisions;
- Enhancement of teacher quality, school
management and services, including through
remediation programs of teacher teaching ability
and the application of an educators’ professional
performance evaluation system.
Priority 3: Health
The development in the field of health is to emphasize
the preventive approach, not just curative approaches,
through enhanced social and environmental health.
This is done, among other things, through the wider
provision of clean water and the reduction of slum
areas, which is to enhance life expectancy from
70.7 years in 2009 to 72.0 years in 2014, and the
achievement of the overall objectives of the 2015
Millennium Development Goals (MDGs). Therefore,
the core substance of the action program in the field
of health is as follows:
- Implementation of the Integrated Preventive
Health Program, consisting of the provision of basic
immunization to 90% of children under the age of
five (balita) in 2014; provision of access to sources
of clean water that reach 67% of the population,
RENCANA PEMBANGUNAN JANGKA MENENGAH NASIONAL (RPJMN) 2010-2014 | THE 2010-2014 NATIONAL MEDIUM-TERM DEVELOPMENT PLAN
28 THE INDONESIANBUDGET OVERVIEW 2010
menjangkau 75% penduduk sebelum 2014;
Penurunan tingkat kematian ibu saat melahirkan
dari 307 per 100.000 kelahiran pada 2008 menjadi
118 pada 2014, serta tingkat kematian bayi dari
34 per 1.000 kelahiran pada 2008 menjadi 24
pada 2014;
- Peningkatan kualitas dan jangkauan layanan KB
melalui 23.500 klinik pemerintah dan swasta
selama 2010-2014;
- Ketersediaan dan peningkatan kualitas layanan
rumah sakit berakreditasi internasional di minimal
5 kota besar di Indonesia dengan target 3 kota
pada 2012 dan 5 kota pada 2014;
- Pemberlakuan Daftar Obat Esensial Nasional
sebagai dasar pengadaan obat di seluruh Indonesia
dan pembatasan harga obat generik bermerek
pada 2010;
- Penerapan Asuransi Kesehatan Nasional untuk
seluruh keluarga miskin dengan cakupan 100%
pada 2011 dan diperluas secara bertahap untuk
keluarga Indonesia lainnya antara 2012-2014.
Prioritas 4: Penanggulangan Kemiskinan
Penurunan tingkat kemiskinan absolut dari 14,1%
pada 2009 menjadi 8-10% pada 2014 dan perbaikan
distribusi pendapatan dengan pelindungan sosial
yang berbasis keluarga, pemberdayaan masyarakat
dan perluasan kesempatan ekonomi masyarakat yang
berpendapatan rendah. Oleh karena itu, substansi inti
program aksi penanggulangan kemiskinan adalah
sebagai berikut:
and access to quality basic sanitation that reaches
75% of the population before 2014; a decreased
maternal mortality rate from 307 per 100,000 live
births in 2008 to 118 (per 100,000 live births) in
2014; and a decreased infant mortality rate from
34 per 1,000 live births in 2008 to 24 (per 1,000
live births) in 2014;
- Increased quality and coverage of Family Planning
(KB) services through 23,500 government and
private clinics in 2010-2014;
- Availability and increased quality of internationally
accredited hospital services in a minimum of 5
major cities in Indonesia, with the target of 3 cities
in 2012 and 5 cities in 2014;
- Imposition of the National Essential Medicine List
as a basis of medicine procurement throughout
Indonesia, and price limitations on branded generic
medicine in 2010;
- Application of National Health Insurance for all
poor families with 100% coverage in 2011, and
gradually extended to include other Indonesian
families in 2012-2014.
Priority 4: Poverty Reduction
This consists of a reduction of the absolute poverty
level from 14.1% in 2009 to 8-10% in 2014 and
improvement of income distribution, using: family-
based social protection, community empowerment
and broader economic opportunity for the low-income
segment of the public. Therefore, the core substance
of the action program in the field of poverty reduction
is as follows:
RENCANA PEMBANGUNAN JANGKA MENENGAH NASIONAL (RPJMN) 2010-2014 | THE 2010-2014 NATIONAL MEDIUM-TERM DEVELOPMENT PLAN

29THE INDONESIANBUDGET OVERVIEW 2010
- Integrasi program perlindungan sosial berbasis
keluarga yang mencakup program Bantuan
Langsung Tunai (BLT), bantuan pangan, jaminan
sosial bidang kesehatan, beasiswa bagi anak
keluarga berpendapatan rendah, Pendidikan Anak
Usia Dini (PAUD), dan Parenting Education mulai
2010 dan program keluarga harapan diperluas
menjadi program nasional mulai 2011-2012;
- Penambahan anggaran Program Nasional
Pemberdayaan Masyarakat (PNPM) Mandiri,
pemenuhan Bantuan Langsung Masyarakat (BLM)
Rp 3 miliar per kecamatan untuk minimal 30%
kecamatan termiskin di pedesaan, dan integrasi
secara selektif PNPM Pendukung;
- Pelaksanaan penyempurnaan mekanisme
penyaluran KUR mulai 2010 dan perluasan
cakupan KUR mulai 2011;
- Revitalisasi Komite Nasional Penanggulangan
Kemiskinan di bawah koordinasi Wakil Presiden,
penggunaan unified database untuk penetapan
sasaran program mulai 2009-2010, dan penerapan
system monitoring dan evaluasi yang akurat
sebagai dasar keputusan dan alokasi anggaran.
Prioritas 5: Ketahanan Pangan
Peningkatan ketahanan pangan dan lanjutan
revitalisasi pertanian untuk mewujudkan kemandirian
pangan, peningkatan daya saing produk pertanian,
peningkatan pendapatan petani, serta kelestarian
- Integration of a family-based social protection
program that includes: Unconditional Cash
Transfer (Bantuan Langsung Tunai/BLT) program,
a food program, social security in the field of
health, scholarships for children from low-income
families, Early Childhood Education, and Parenting
Education starting in 2010, as wells as expanding
the hopeful family program (program keluarga
harapan) to a national program, starting in 2011-
2012;
- Additional budget for the National Program for the
Community Empowerment (PNPM), fulfillment of
the Community Direct Assistance (BLM) of Rp.3
billion per sub-district for a minimum of 30% of
the poorest sub-districts in rural areas, and selective
integration of Supporting PNPM;
- Improved mechanism of KUR (people’s business
credit program) disbursement starting in 2010,
and expanded KUR coverage starting in 2011;
- Revitalization of the National Committee for
Poverty Reduction under the coordination of the
Vice President, the use of a unified database for
determinating program objectives, starting in
2009-2010, and the application of an accurate
monitoring and evaluation system as a basis in
decision-making and budget allocation.
Priority 5: Food Security
This consists of the enhancement of food security
and the continuation of agricultural revitalization to
realize food self-reliance, increased competitiveness of
agricultural products, increased farmers’ income, and
RENCANA PEMBANGUNAN JANGKA MENENGAH NASIONAL (RPJMN) 2010-2014 | THE 2010-2014 NATIONAL MEDIUM-TERM DEVELOPMENT PLAN

30 THE INDONESIANBUDGET OVERVIEW 2010
lingkungan dan sumber daya alam. Peningkatan
pertumbuhan Produk domestik Bruto (PDB) sektor
pertanian sebesar 3,7% per tahun dan Indeks Nilai
Tukar Petani sebesar 115-120 pada 2014. Oleh karena
itu, substansi inti program aksi ketahanan pangan
adalah sebagai berikut:
- Penataan regulasi untuk menjamin kepastian
hukum atas lahan pertanian, pengembangan areal
pertanian baru seluas 2 juta hektar, penertiban
serta optimalisasi penggunaan lahan terlantar;
- Pembangunan dan pemeliharaan sarana
transportasi dan angkutan, pengairan, jaringan
listrik, serta teknologi komunikasi dan sistem
informasi nasional yang melayani daerah-daerah
sentra produksi pertanian demi peningkatan
kuantitas dan kualitas produksi serta kemampuan
pemasarannya;
- Peningkatan upaya penelitian dan pengembangan
bidang pertanian yang mampu menciptakan
benih unggul dan hasil penelitian lainnya menuju
kualitas dan produktivitas hasil pertanian nasional
yang tinggi;
- Dorongan untuk investasi pangan, pertanian,
dan industri perdesaan berbasis produk lokal
oleh pelaku usaha dan pemerintah, penyediaan
pembiayaan yang terjangkau, serta sistem subsidi
yang menjamin ketersediaan benih varietas
unggul yang teruji, pupuk, teknologi dan sarana
pasca panen yang sesuai secara tepat waktu, tepat
jumlah, dan terjangkau;
- Peningkatan kualitas gizi dan keanekaragaman
environmental and natural resource protection. There
should be growth of the Gross Domestic Product
(GDP) in the agriculture sector of 3.7% per year and
a Farmer’s Term of Trade Index of 115-120 in 2014.
Therefore, the core substance of the action program
in the field of food security is as follows:
- Regulatory arrangements to ensure legal certainty
on agricultural lands, the development of new
agricultural areas of 2 million hectares, and the
clearance and optimizing of the utilization of
unused lands;
- Development and maintenance of means of
transportation, irrigation, electricity network,
communication technology and national
information system that serve centers for
agricultural production, in order to enhance the
production quantity and quality as well as the
marketing capacity;
- Enhanced agricultural research and development
that is able to produce high quality seed and
other research outcomes towards high quality and
productivity for national agricultural products;
- Stimulus for local product-based rural industries,
agriculture, and food investment by business
actors and the government, provision of affordable
financing, and a subsidy system that ensures the
timely availability of the right quantity of affordable
tested high-quality seed, appropriate fertilizers,
technology and post-harvest facilities;
- Enhanced nutritional quality and food diversity
RENCANA PEMBANGUNAN JANGKA MENENGAH NASIONAL (RPJMN) 2010-2014 | THE 2010-2014 NATIONAL MEDIUM-TERM DEVELOPMENT PLAN

31THE INDONESIANBUDGET OVERVIEW 2010
pangan melalui peningkatan pola pangan
harapan;
- Pengambilan langkah-langkah kongkrit terkait
adaptasi dan antisipasi sistem pangan dan
pertanian terhadap perubahan iklim.
Prioritas 6: Infrastruktur
Pembangunan infrastruktur nasional yang
memiliki daya dukung dan daya gerak terhadap
pertumbuhan ekonomi dan sosial yang berkeadilan
dan mengutamakan kepentingan masyarakat
umum di seluruh bagian negara kepulauan Republik
Indonesia dengan mendorong partisipasi masyarakat.
Oleh karena itu, substansi inti program aksi bidang
infrastruktur adalah sebagai berikut:
- Konsolidasi kebijakan penanganan dan
pemanfaatan tanah untuk kepentingan umum
secara menyeluruh di bawah satu atap dan
pengelolaan tata ruang secara terpadu;
- Penyelesaian pembangunan Lintas Sumatera,
Jawa, Bali, Kalimantan, Sulawesi, Nusa Tenggara
Barat, Nusa Tenggara Timur, dan Papua sepanjang
total 19.370 km pada 2014;
- Pembangunan jaringan prasarana dan penyediaan
sarana transportasi antarmoda dan antarpulau
yang terintegrasi sesuai dengan Sistem Transportasi
Nasional dan Cetak Biru Transportasi Multimoda
dan penurunan tingkat kecelakaan transportasi
sehingga pada 2014 lebih kecil dari 50% keadaan
saat ini;
- Pembangunan 685.000 Rumah Sederhana Sehat
Bersubsidi, 180 Rusunami dan 650 twin block
through an enhanced ideal dietary pattern (pola
pangan harapan);
- Tangible measures related to the adaptation and
anticipation of a food safety system and the
agricultural system against climate change.
Priority 6: Infrastructure
This consists of the development of national
infrastructure that is capable of supporting and
driving fair economic and social development, and
which prioritizes the public interests in all regions
of the Republic of Indonesia by encouraging public
participation. Therefore, the core substance of the
action program in the field of infrastructure is as
follows:
- Overall policy consolidation of land management
and utilization for the public interest under one-
roof and integrated zoning management;
- Completion of the construction of Cross-Sumatra,
Java, Bali, Kalimantan, Sulawesi, West Nusa
Tenggara, East Nusa Tenggara and Papua roads of
19,370 km in 2014;
- Development of an infrastructure network and the
provision of integrated inter-modal and inter-island
means of transportation in accordance with the
National Transportation System and Multimodal
Transportation Blueprint, and a reduction of the
rate of transportation accidents in 2014 to lower
than 50% of the current level;
- Development of 685,000 Subsidized Simple
and Healthy Houses (RSSB), 180 Subsidized
RENCANA PEMBANGUNAN JANGKA MENENGAH NASIONAL (RPJMN) 2010-2014 | THE 2010-2014 NATIONAL MEDIUM-TERM DEVELOPMENT PLAN

32 THE INDONESIANBUDGET OVERVIEW 2010
berikut fasilitas pendukung kawasan permukiman
yang dapat menampung 836.000 keluarga yang
kurang mampu pada 2012;
- Penyelesaian pembangunan prasarana
pengendalian banjir, diantaranya Banjir Kanal
Timur Jakarta sebelum 2012 dan penanganan
secara terpadu Daerah Aliran Sungai Bengawan
Solo sebelum 2013;
- Penuntasan pembangunan jaringan serat optik
di Indonesia bagian timur sebelum 2013 dan
maksimalisasi tersedianya akses komunikasi data
dan suara bagi seluruh rakyat;
- Perbaikan sistem dan jaringan transportasi di 4
kota besar (Jakarta, Bandung, Surabaya, Medan)
sesuai dengan Cetak Biru Transportasi Perkotaan,
termasuk penyelesaian pembangunan angkutan
kereta listrik di Jakarta (Mass Rapid Transit/MRT
dan Monorail) selambat-lambatnya 2014.
Prioritas 7: Iklim Investasi dan Iklim Usaha
Peningkatan investasi melalui perbaikan kepastian
hukum, penyederhanaan prosedur, perbaikan sistem
informasi, dan pengembangan Kawasan Ekonomi
Khusus (KEK). Oleh karena itu, substansi inti program
aksi bidang iklim investasi dan iklim usaha adalah
sebagai berikut:
- Reformasi regulasi secara bertahap di tingkat
nasional dan daerah sehingga terjadi harmonisasi
peraturan perundang-undangan yang tidak
menimbulkan ketidakjelasan dan inkonsistensi
Apartments (Rusunami) and 650 twin blocks, as
well as a housing area supporting facilities that can
accommodate 836,000 poor families in 2012;
- Completion of the development of the flood
control infrastructure, including the Jakarta East
Canal (Banjir Kanal Timur) before 2012, and
integrated management of the Bengawan Solo
Watershed before 2013;
- Completion of the development of a fiber optic
network in eastern Indonesia before 2013, and
maximizing the availability of data and voice
communication access for the public;
- Improvement of the transportation network
and system in 4 major cities (Jakarta, Bandung,
Surabaya, Medan) in accordance with the Urban
Transportation Blueprint, including completion of
the development of electric train in Jakarta (Mass
Rapid Transit/MRT and Monorail) by 2014 at the
latest.
Priority 7: Investment and Business Climate
This consists of the enhancement of investment
through improved legal certainty, procedure
simplification, improvement of information systems,
and the development of Special Economic Zones (KEK).
Therefore, the core substance of the action program
in the field of investment and business climate is as
follows:
- Gradual regulatory reform at the national and
regional levels, so that there will be a harmonization
of the rules and regulations, and so that they will
not cause uncertainty or inconsistency in their
RENCANA PEMBANGUNAN JANGKA MENENGAH NASIONAL (RPJMN) 2010-2014 | THE 2010-2014 NATIONAL MEDIUM-TERM DEVELOPMENT PLAN

33THE INDONESIANBUDGET OVERVIEW 2010
dalam implementasinya;
- Penerapan sistem pelayanan informasi dan
perizinan investasi secara elektronik (SPSIE) pada
Pelayanan Terpadu Satu Pintu (PTSP) di beberapa
kota yang dimulai di Batam, pembatalan perda
bermasalah dan pengurangan biaya untuk
memulai usaha seperti Tanda Daftar Perusahaan
(TDP) dan Surat Ijin Usaha Perdagangan (SIUP);
- Pengembangan dan penetapan Sistem Logistik
Nasional yang menjamin kelancaran arus barang
dan mengurangi biaya transaksi/ekonomi biaya
tinggi;
- Beroperasinya secara penuh National Single
Window (NSW) untuk impor (sebelum Januari
2010) dan ekspor. Percepatan realisasi proses
penyelesaian bea cukai di luar pelabuhan dengan
implementasi tahap pertama Custom Advanced
Trade System (CATS) di dry port Cikarang;
- Pengembangan Kawasan Ekonomi Khusus (KEK)
di 5 (lima) lokasi melalui skema Public-Private
Partnership sebelum 2012;
- Sinkronisasi kebijakan ketenagakerjaan dan iklim
usaha dalam rangka memperluas penciptaan
lapangan kerja.
Prioritas 8: Energi
Pencapaian ketahanan energi nasional yang
menjamin kelangsungan pertumbuhan nasional
melalui restrukturisasi kelembagaan dan optimalisasi
implementation;
- The application of an electronic investment
licensing and information service system (SPSIE)
in the One Roof Integrated Service Center (PTSP)
center in several cities, starting from Batam, the
revocation of problematic regional regulations and
the reduction of business startup costs, such as
Company Registration (Tanda Daftar Perusahaan/
TDP) and Business Licenses (Surat Ijin Usaha
Perdagangan/SIUP);
- The development and determination of a National
Logistic System that ensures the smooth flow of
goods and reduces transaction costs/high-cost
economy;
- Full operation of a National Single Window (NSW)
for imports (before January 2010) and exports.
Accelerated realization of the customs and excise
settlement process outside of the port, with the
first stage of implementation of the Custom
Advanced Trade System (CATS) at the Cikarang
dry port;
- Development of Special Economic Zones (KEK) in
5 (five) locations through Public-Private Partnership
schemes before 2012;
- Synchronization between the manpower policy
and the business climate in order to increase job
creation.
Priority 8: Energy
This consists of the achievement of national energy
security that ensures the continuation of national
growth through institutional restructuring and the
RENCANA PEMBANGUNAN JANGKA MENENGAH NASIONAL (RPJMN) 2010-2014 | THE 2010-2014 NATIONAL MEDIUM-TERM DEVELOPMENT PLAN

34 THE INDONESIANBUDGET OVERVIEW 2010
pemanfaatan energi alternatif seluas-luasnya. Oleh
karena itu, substansi inti program aksi bidang energi
adalah sebagai berikut:
- Pengambilan kewenangan atas kebijakan energi
ke dalam Kantor Presiden untuk memastikan
penanganan energi nasional yang terintegrasi
sesuai dengan Rencana Induk Energi Nasional;
- Transformasi dan konsolidasi BUMN bidang energy
dimulai dari PLN dan Pertamina yang selesai
selambat-lambatnya 2010 dan diikuti oleh BUMN
lainnya;
- Peningkatan kapasitas pembangkit listrik sebesar
rata-rata 3.000 MW per tahun mulai 2010 dengan
rasio elektrifikasi yang mencakup 62% pada 2010
dan 80% pada 2014; dan produksi minyak bumi
sebesar lebih dari 1,01 juta barrel per hari mulai
2014;
- Peningkatan pemanfaatan energi terbarukan
termasuk energy alternatif geothermal sehingga
mencapai 2.000 MW pada 2012 dan 5.000
MW pada 2014 dan dimulainya produksi coal
bed methane untuk membangkitkan listrik pada
2011 disertai pemanfaatan potensi tenaga surya,
microhydro, serta nuklir secara bertahap;
- Revitalisasi industri pengolah hasil ikutan/turunan
minyak bumi dan gas sebagai bahan baku industri
tekstil, pupuk dan industri hilir lainnya;
- Perluasan program konversi minyak tanah ke
gas sehingga mencakup 42 juta Kepala Keluarga
pada 2010; penggun aan gas alam sebagai bahan
bakar angkutan umum perkotaan di Palembang,
Surabaya, dan Denpasar.
optimized use of alternative energy. Therefore, the
core substance of the action program in the field of
energy is as follows:
- The authority to make the energy policy is in the
hand of the President’s Office in order to ensure
that integrated national energy management in
accordance with the National Energy Master Plan;
- Transformation and consolidation of State-Owned
Enterprises (SOEs) in the field of energy, starting
from PLN and Pertamina, that are completed by
2010 at the latest, followed by other SOEs;
- Increased power plant capacity at an average of
3,000 MW per year, starting in 2010, with an
electrification ratio of 62% in 2010 and 80% in
2014; and oil production of more than 1.01 million
barrels per day starting in 2014;
- Increased utilization of renewable energy, including
geothermal, in order to reach 2,000 MW in 2012
and 5,000 MW in 2014, and starting production
of coal bed methane in order to generate power in
2011, as well as the gradual utilization of the solar,
micro-hydro, and nuclear power potential;
- Revitalization of the processing industry for oil
and gas derivative products such as raw material
for textiles, fertilizer and other downstream
industries;
- Expansion of the kerosene-to-gas conversion
program to cover 42 million families in 2010;
the use of natural gas as fuel for urban public
transportation in Palembang, Surabaya, and
Denpasar.
RENCANA PEMBANGUNAN JANGKA MENENGAH NASIONAL (RPJMN) 2010-2014 | THE 2010-2014 NATIONAL MEDIUM-TERM DEVELOPMENT PLAN

35THE INDONESIANBUDGET OVERVIEW 2010
Prioritas 9: Lingkungan Hidup dan Pengelolaan
Bencana
Konservasi dan pemanfaatan lingkungan
hidup mendukung pertumbuhan ekonomi
dan kesejahteraan yang keberlanjutan, disertai
penguasaan dan pengelolaan risiko bencana untuk
mengantisipasi perubahan iklim. Oleh karena itu,
substansi inti program aksi bidang lingkungan hidup
dan pengelolaan bencana adalah sebagai berikut:
- Peningkatan keberdayaan pengelolaan lahan
gambut, peningkatan hasil rehabilitasi seluas
500,000 ha per tahun, dan penekanan laju
deforestasi secara sungguh-sungguh;
- Penurunan beban pencemaran lingkungan melalui
pengawasan ketaatan pengendalian pencemaran
air limbah dan emisi di 680 kegiatan industri dan
jasa pada 2010 dan terus berlanjut; Penurunan
jumlah hotspot kebakaran hutan sebesar 20% per
tahun dan penurunan tingkat polusi keseluruhan
sebesar 50% pada 2014; Penghentian kerusakan
lingkungan di 11 Daerah Aliran Sungai yang rawan
bencana mulai 2010 dan seterusnya;
- Penjaminan berjalannya fungsi Sistem Peringatan
Dini Tsunami (Tsunami Early Warning System/TEWS)
dan Sistem Peringatan Dini Cuaca (Meteorological
Early Warning System/MEWS) mulai 2010 dan
seterusnya, serta Sistem Peringatan Dini Iklim
(Climate Early Warning System/CEWS) pada 2013;
- Peningkatan kemampuan penanggulangan
bencana.
Priority 9: Environmental Issues and Disaster
Management
This consists of the conservation and utilization of
the environment to support sustainable welfare and
economic growth, along with disaster risk management
and control to anticipate climate change. Therefore,
the core substance of the action program in the field
of environmental issues and disaster management is
as follows:
- Enhancement of peat soil management,
enhancement of the rehabilitation result of
500,000 ha per year, and a reduction of the
deforestation rate;
- Reduction of environmental pollution through
supervision of compliance with wastewater and
emission pollution control in 680 industrial and
service activities in 2010, and continuing from
then on; a reduction of the number of forest fire
hotspots of 20% per year, and a reduction of the
overall pollution level of 50% in 2014; halting
environmental damage in 11 disaster-prone
watersheds, starting in 2010 and continuing from
then on;
- Guaranteed functioning of the Tsunami Early
Warning System (TEWS) and Meteorological Early
Warning System (MEWS) starting in 2010, and
continuing from then on, and the Climate Early
Warning System (CEWS) in 2013;
- Enhancement of disaster management capacity.
RENCANA PEMBANGUNAN JANGKA MENENGAH NASIONAL (RPJMN) 2010-2014 | THE 2010-2014 NATIONAL MEDIUM-TERM DEVELOPMENT PLAN

36 THE INDONESIANBUDGET OVERVIEW 2010
Prioritas 10: Daerah Tertinggal, Terdepan, Terluar,
dan Pasca-Konflik
Program aksi untuk daerah tertinggal, terdepan, terluar,
dan pascakonflik ditujukan untuk pengutamaan
dan penjaminan pertumbuhan di daerah tertinggal,
terdepan, terluar serta keberlangsungan kehidupan
damai di wilayah pascakonflik dengan substansi inti
sebagai berikut:
- Pelaksanaan kebijakan khusus dalam bidang
infrastruktur dan pendukung kesejahteraan lainnya
yang dapat mendorong pertumbuhan di daerah
tertinggal, terdepan, terluar, dan pascakonflik
selambat-lambatnya dimulai pada 2011;
- Pembentukan kerja sama dengan negara-negara
tetangga dalam rangka pengamanan wilayah dan
sumber daya kelautan;
- Penyelesaian pemetaan wilayah perbatasan RI
dengan Malaysia, Papua Nugini, Timor Leste, dan
Filipina pada 2010;
- Pengentasan daerah tertinggal di sedikitnya 50
kabupaten paling lambat 2014.
Prioritas 11: Kebudayaan, Kreativitas, dan Inovasi
Teknologi
Pengembangan dan perlindungan kebhinekaan
budaya, karya seni, dan ilmu serta apresiasinya, untuk
memperkaya khazanah artistik dan intelektual bagi
tumbuh mapannya jati diri dan kemampuan adaptif
kompetitif bangsa yang disertai pengembangan
inovasi, ilmu pengetahuan, dan teknologi yang
dilandasi oleh keunggulan Indonesia sebagai negara
maritim dan kepulauan. Oleh karena itu, substansi
Priority 10: Underdeveloped, Leading, Outermost,
and Post-Conflict Areas
The action program for underdeveloped, leading,
outermost and post-conflict areas is aimed at
prioritizing and ensuring growth in underdeveloped,
leading, and outermost areas as well as having
sustainable peaceful life in post-conflict areas, with
the core substance as follows:
- Implementation of a special policy in the field of
infrastructure, and other welfare supporting policies
that can stimulate growth in underdeveloped,
leading, outermost and post-conflict areas, starting
in 2011 at the latest;
- Establishment of cooperation with neighboring
countries in regards to safeguarding marine areas
and resources;
- Completion of mapping of the border area of
Indonesia and Malaysia, Papua New Guinea, Timor
Leste and the Philippine in 2010;
- Alleviation of underdeveloped areas in at least 50
districts by 2014 at the latest.
Priority 11: Culture, Creativity, and Technological
Innovation
This consists of the development and protection of
cultural diversity, works of art, and science, as well as
their appreciation, to enrich artistic and intellectual
treasures for the development of national character
and competitive and adaptive ability, along with the
development of innovation, science and technology
that is based on Indonesia’s advantage as a maritime
and archipelago country. Therefore, the core substance
RENCANA PEMBANGUNAN JANGKA MENENGAH NASIONAL (RPJMN) 2010-2014 | THE 2010-2014 NATIONAL MEDIUM-TERM DEVELOPMENT PLAN

37THE INDONESIANBUDGET OVERVIEW 2010
inti program aksi bidang kebudayaan, kreativitas, dan
inovasi teknologi adalah sebagai berikut:
- Penetapan dan pembentukan pengelolaan terpadu
untuk pengelolaan cagar budaya, revitalisasi
museum dan perpustakaan di seluruh Indonesia
ditargetkan sebelum Oktober 2011;
- Penyediaan sarana yang memadai bagi
pengembangan, pendalaman dan pagelaran seni
budaya di kota besar dan ibu kota kabupaten
selambat-lambatnya Oktober 2012;
- Pengembangan kapasitas nasional untuk
pelaksanaan penelitian, penciptaan dan inovasi
dan memudahkan akses dan penggunaannya
oleh masyarakat luas;
- Peningkatan perhatian dan kesertaan pemerintah
dalam program-program seni budaya yang diinisiasi
oleh masyarakat dan mendorong berkembangnya
apresiasi terhadap kemajemukan budaya;
- Peningkatan keunggulan komparatif menjadi
keunggulan kompetitif yang mencakup
pengelolaan sumber daya maritim menuju
ketahanan energi, pangan, dan antisipasi
perubahan iklim; dan pengembangan penguasaan
teknologi dan kreativitas pemuda.
Di samping sebelas prioritas nasional tersebut di atas,
upaya untuk mewujudkan visi dan misi Pembangunan
Nasional juga melalui pencapaian prioritas nasional
lainnya di bidang politik, hukum, dan keamanan, di
bidang perekonomian, dan di bidang kesejahteraan
rakyat. Di bidang politik, hukum, dan keamanan,
antara lain mencakup: (a) pelaksanaan koordinasi
of the action program in the fields of culture, creativity,
and technological innovation is as follows:
- The determination and establishment of integrated
management for culturally protected areas, the
revitalization of museums and libraries throughout
Indonesia are targeted to be complete before
October 2011;
- Provision of adequate facilities for art and culture
development, the deepening and holding of art
performances in major cities and regency capitals
by October 2012 at the latest;
- Development of the national capacity for research,
creation, innovation, and the provision of easy
access to their use by the general public;
- Enhanced government attention and involvement
in art and culture programs initiated by the public,
and encouraging an appreciation of cultural
diversity;
- Enhancement of comparative advantage into
competitive advantage, including for maritime
resource management towards energy and food
security, and anticipation of climate change; and
the development of technological mastery by and
youth creativity.
In addition to these eleven national priorities, the effort
to achieve the National Development vision and mission
is also carried out through the achievement of other
national priorities in the fields of politics, law, security,
economy, and public welfare. In the fields of politics,
law and security there is to be: (a) coordination on
the mechanism of terrorism management procedures;
RENCANA PEMBANGUNAN JANGKA MENENGAH NASIONAL (RPJMN) 2010-2014 | THE 2010-2014 NATIONAL MEDIUM-TERM DEVELOPMENT PLAN

38 THE INDONESIANBUDGET OVERVIEW 2010
terhadap mekanisme prosedur penanganan terorisme;
(b) pelaksaan program deradikalisasi untuk menangkal
terorisme; (c) peningkatan peran Republik Indonesia
dalam mewujudkan perdamaian dunia. Sementara
itu, prioritas di bidang perekonomian mencakup
antara lain: (a) pelaksanaan pengembangan
industri sesuai dengan Peraturan Presiden Nomor
28 Tahun 2008 tentang Kebijakan Industri
Nasional; (b) peningkatan peran dan kemampuan
Republik Indonesia dalam diplomasi perdagangan
internasional. Di bidang kesejahteraan rakyat, antara
lain mencakup: (a) pelaksanaan ibadah haji yang tertib
dan lancar paling lambat pada 2010; (b) peningkatan
kerukunan umat beragama melalui pembentukan
dan peningkatan efektivitas Forum Kerukunan Umat
Beragama (FKUB); (c) peningkatan jumlah wisatawan
mancanegara dan wisatawan nusantara sebesar 20%
secara bertahap dalam 5 tahun.
II. Prioritas Pembangunan BidangPembangunan Nasional dilakukan secara menyeluruh
di berbagai bidang kehidupan masyarakat. Untuk itu,
perencanaan pembangunan nasional dikelompokkan
ke dalam 9 (sembilan) bidang pembangunan
menurut Rencana Pembangunan Jangka Panjang
Nasional 2005-2025, yaitu: (1) bidang sosial budaya
dan kehidupan beragama; (2) bidang ekonomi; (3)
bidang ilmu pengetahuan dan teknologi; (4) bidang
sarana dan prasarana; (5) bidang Politik; (6) bidang
pertahanan dan keamanan; (7) bidang hukum dan
aparatur; (8) bidang wilayah dan tataruang; (9) bidang
sumber daya alam dan lingkungan hidup. Sasaran dan
(b) implementation of a de-radicalization program to
deter terrorism; and (c) enhancement of the role of
the Republic of Indonesia in creating world peace.
Meanwhile, the priorities in the field of economy
include: (a) implementation of industrial development
in accordance with Presidential Regulation Number 28
of 2008 regarding the National Industry Policy; and (b)
enhancement of the role and capacity of the Republic
of Indonesia in international trade diplomacy. Priorities
in the field of public welfare include: (a) smooth and
orderly implementation of the hajj pilgrimage by 2010
at the latest; (b) enhancement of harmony between
religious followers through the establishment and
enhanced effectiveness of the Inter-Religious Harmony
Forum (Forum Kerukunan Umat Beragama/FKUB); and
(c) a gradual 20% increase in the number of foreign
and domestic tourists.
II. Field Development PrioritiesNational development is carried out comprehensively
in various fields of social life. Therefore, national
development planning is grouped into 9 (nine)
development fields based on the 2005-2025 National
Long-Term Development Plan, namely: (1) the fields of
social/culture affairs and religious life; (2) the economic
field; (3) the science and technology field; (4) the field
of facilities and infrastructure; (5) the political field; (6)
the defense and security field; (7) the field of laws and
apparatus; (8) the regional and zoning field; and (9)
the field of natural resources and the environment.
The policy direction and objectives of each field are
RENCANA PEMBANGUNAN JANGKA MENENGAH NASIONAL (RPJMN) 2010-2014 | THE 2010-2014 NATIONAL MEDIUM-TERM DEVELOPMENT PLAN

39THE INDONESIANBUDGET OVERVIEW 2010
arah kebijakan dari masing-masing bidang tersebut
adalah sebagai berikut.
1. Bidang Sosial Budaya dan kehidupan
beragama
Pembangunan bidang sosial budaya dan kehidupan
beragama diarahkan untuk mencapai sasaran
peningkatan kualitas sumberdaya manusia yang
ditandai dengan meningkatnya indeks pembangunan
manusia (IPM) dan indeks pembangunan gender
(IPG) yang didukung oleh tercapainya penduduk
tumbuh seimbang; serta makin kuatnya jati diri dan
karakter bangsa. Pembangunan bidang sosial budaya
dan kehidupan beragama pada tahun 2010−2014
diprioritaskan pada pengendalian kuantitas penduduk,
peningkatan akses dan kualitas pelayanan kesehatan,
peningkatan akses dan kualitas pelayanan pendidikan,
peningkatan partisipasi pemuda, budaya dan prestasi
olahraga, peningkatan kualitas kehidupan beragama,
dan penguatan jati diri bangsa dan pelestarian
budaya, peningkatan akses dan kualitas pelayanan
kesejahteraan sosial, peningkatan kesetaraan gender
dan pemberdayaan perempuan, serta perlindungan
anak.
2. Bidang ekonomi
Dalam bidang ekonomi, sasaran pembangunan
ditujukan antara lain untuk: (1) pertumbuhan realisasi
investasi nonmigas yang berasal dari total Penanaman
Modal Dalam Negeri (PMDN) dan Penanaman Modal
Asing (PMA) sekitar 15,0 persen sampai dengan 18,6
persen per tahun; (2) pertumbuhan ekspor nonmigas
as follow.
1. The Field of Social/Culture Affairs and
Religious Life
Development in the field of social/culture affairs
and religious life is directed towards achieving the
objectives of increased quality of human resource,
marked by increases in the human development index
(HDI) and gender development index (GDI), supported
by balanced population growth, as well as strong
national character. The priority of development in the
field of social/culture affairs and religious life in 2010-
2014 is control of population levels, enhancement of
access to and quality of health services, enhancement
of access to and quality of education services,
enhancement of youth participation, cultural and
sporting achievements, enhancement of the quality
of religious life, strengthening of national character
and cultural preservation, enhancement of access to
and quality of social welfare services, enhancement
of gender equality and women’s empowerment, and
child protection.
2. The Field of the Economy
In the field of the economy, the development
objectives are: (1) increased realization of non-
oil and gas investment originating from the total
Domestic Investment and Foreign Investment, of
around 15.0 percent to 18.6 percent annually; (2)
gradual development of non-oil and gas exports to
RENCANA PEMBANGUNAN JANGKA MENENGAH NASIONAL (RPJMN) 2010-2014 | THE 2010-2014 NATIONAL MEDIUM-TERM DEVELOPMENT PLAN

40 THE INDONESIANBUDGET OVERVIEW 2010
secara bertahap meningkat menjadi sebesar 14,5-
16,5 persen pada tahun 2014; (3) menciptakan
dan memantapkan stabilitas ekonomi terhadap
kemungkinan timbulnya gejolak ekonomi, baik
yang berasal dari luar maupun dari dalam negeri.
Berdasarkan sasaran tersebut, maka arah kebijakan
pembangunan di bidang ekonomi dalam periode
2010-2014 antara lain adalah : (1) mendorong
penanaman modal asing bagi peningkatan daya
saing perekonomian nasional; serta meningkatkan
kapasitas infrastruktur fisik dan pendukung yang
memadai; (2) peningkatan daya saing produk ekspor
nonmigas melalui diversifikasi pasar serta peningkatan
keberagaman dan kualitas produk; (3) memelihara
stabilitas harga dalam negeri dan nilai tukar rupiah
melalui koordinasi, penyelarasan dan sinergi kebijakan
moneter dan fiskal, sektor keuangan, serta sektor riil
untuk menciptakan pengelolaan ekonomi secara
sehat dan berkelanjutan.
3. Bidang ilmu pengetahuan dan teknologi
Dalam periode 2010-2014, kebijakan pembangunan
bidang Iptek diarahkan kepada : (1) meningkatkan
kapasitas dan kapabilitas kelembagaan litbang dan
lembaga; (2) meningkatkan kapasitas dan kapabilitas
sumber daya iptek untuk menghasilkan produktivitas
litbang yang berdayaguna bagi sektor produksi
dan meningkatkan budaya inovasi serta kreativitas
nasional; (3) mengembangkan dan memperkuat
jejaring kelembagaan baik peneliti di lingkup nasional
maupun internasional untuk mendukung peningkatan
produktivitas litbang dan peningkatan pendayagunaan
around 14.5-16.5 percent in 2014; and (3) creating
and reinforcing economic stability against possible
economic upheaval, either from within or outside of
the country. Based on the above objectives, the policy
directions of development in the field of the economy
for the 2010-2014 period are: (1) encouraging
foreign investment for increased national economic
competitiveness; and enhancing adequate capacity
of the physical and supporting infrastructures; (2)
increased competitiveness of non-oil and gas export
products through market diversification and increased
product diversity and quality; and (3) maintaining the
stability of domestic prices and the rupiah exchange
rate through the coordination, harmonization and
synergy of monetary and fiscal policies, the financial
sector, and real sector to create healthy and sustainable
economic management.
3. The Field of Science and Technology
In the 2010-2014 period, the development policy for
science and technology is directed at: (1) enhancing the
capacity and capability of research and development
institutions; (2) enhancing the capacity and capability
of human resources in the field of science and
technology to have research and development
productivity that is effective for the production
sector and for increasing national innovation and
culture of creativity; (3) developing and strengthening
an institutional network for researchers at the
national and international level to support increased
RENCANA PEMBANGUNAN JANGKA MENENGAH NASIONAL (RPJMN) 2010-2014 | THE 2010-2014 NATIONAL MEDIUM-TERM DEVELOPMENT PLAN

41THE INDONESIANBUDGET OVERVIEW 2010
litbang nasional; (4) meningkatkan kreativitas dan
produktivitas litbang untuk ketersediaan teknologi
yang dibutuhkan oleh industri dan masyarakat serta
menumbuhkan budaya kreativitas masyarakat; (5)
meningkatkan pendayagunaan iptek dalam sektor
produksi untuk peningkatan perekonomian nasional
dan penghargaan terhadap iptek dalam negeri.
Dengan arah kebijakan Iptek tersebut di atas, maka
strategi pembangunan Iptek dilaksanakan melalui
dua prioritas pembangunan yaitu Penguatan Sistem
Inovasi Nasional (SIN) dan peningkatan penelitian,
pengembangan, dan Penerapan Iptek (P3 Iptek).
4. Bidang sarana dan prasarana
Sasaran umum pembangunan sarana dan prasarana
lima tahun ke depan antara lain: (a) meningkatnya
kuantitas dan kualitas berbagai sarana dan
prasarana penunjang pembangunan; (b) terjaminnya
ketersediaan aksesibilitas masyarakat terhadap jasa
pelayanan sarana dan prasarana; (c) meningkatnya
ketahanan energi terutama diversifikasi energi yang
menjamin keberlangsungan dan jumlah pasokan
energi di seluruh Indonesia, serta (d) meningkatnya
penggunaan renewable energy dan energi yang bersih
dan ekonomis; dan meningkatnya efisiensi konsumsi
dan penghematan energi baik di lingkungan industri
rumah tangga, industri besar maupun transportasi.
research and development productivity as well as
increasing the productive use of national research
and development; (4) enhancing the creativity and
productivity of research and development in order
to provide the technology needed by industry and
the public, as well as developing a culture of creativity
in society; and (5) enhancing the productive use of
science and technology in the production sector in
order to increase the national economy, as well as
an appreciation of domestic science and technology.
With the above policy directions, the development
strategy in the field of science and technology is
carried out through two development priorities, which
are the Strengthening of National Innovation System
(Sistem Inovasi Nasional/SIN) and the enhancement of
research, development and the application of science
and technology (P3 Iptek).
4. The Field of Infrastructure
The general development objectives in the field of
facilities and infrastructure for the next five years are:
(a) increased quantity and quality of various facilities
and infrastructures in support of development; (b)
the guaranteed availability of public accessibility to
facilities and infrastructure services; (c) enhanced
energy security, particularly energy diversification that
ensures the sustainability and quantity of the energy
supply throughout Indonesia; and (d) the increased
use of renewable energy and clean and economical
energy; and increased consumption efficiency and
energy conservation in household industries, big
industries and the transportation sector. Based on
RENCANA PEMBANGUNAN JANGKA MENENGAH NASIONAL (RPJMN) 2010-2014 | THE 2010-2014 NATIONAL MEDIUM-TERM DEVELOPMENT PLAN

42 THE INDONESIANBUDGET OVERVIEW 2010
Berdasarkan sasaran tersebut, maka prioritas bidang
pembangunana sarana dan prasarana dalam lima
tahun ke depan adalah : (1) meningkatkan pelayanan
sarana dan prasarana sesuai dengan standar pelayanan
minimal; (2) mendukung peningkatan daya saing
sektor riil; (3) meningkatkan kerjasama Pemerintah
dan swasta.
5. Bidang Politik
Pembangunan bidang politik, baik politik dalam
negeri maupun luar negeri dalam periode 2010-2014
diarahkan untuk mencapai sasaran peningkatan
kualitas demokrasi dan kualitas diplomasi Indonesia,
dengan arah kebijakan : (1) Meningkatkan kapasitas
dan akuntabilitas lembaga-lembaga demokrasi;
(2) Menjaga dan menciptakan iklim kondusif yang
menjamin kebebasan sipil dan penghormatan
terhadap hak-hak politik rakyat dan perkembangan
demokrasi di Indonesia; (3) Meningkatkan peran
informasi dan komunikasi; (4) Meningkatkan
peran dan kepemimpinan Indonesia dalam ASEAN
dan pembentukan Komunitas ASEAN 2015; (5)
Meningkatkan peran Indonesia untuk turut menjaga
keamanan nasional dan menciptakan perdamaian
dunia; (6) Meningkatkan kinerja diplomasi
perbatasan; (7) Meningkatkan kualitas pelayanan
dan perlindungan terhadap Warga Negara Indonesia
(WNI)/Badan Hukum Indonesia (BHI) diluar negeri;
dan (8) Meningkatkan citra positif Indonesia melalui
pemajuan demokrasi, HAM, lingkungan hidup, dan
perlindungan kekayaan budaya.
these objectives, the development priorities in the field
of facilities and infrastructure for the next five years
are: (1) enhancing facility and infrastructure services
in accordance with the minimum service standard; (2)
supporting increased real sector competitiveness; and
(3) enhancing cooperation between the Government
and the private sector.
5. The Field of Politics
Development in the field of politics, both domestic
and foreign, in the 2010-2014 period, is directed
at achieving the objective of increased quality of
Indonesian democracy and diplomacy, with the
following policy directions: (1) Increasing the capacity
and accountability of democratic institutions; (2)
Maintaining and creating a conducive climate that
guarantees civil liberty and respect for the political rights
of the people, and the development of democracy in
Indonesia; (3) Enhancing the role of information and
communication; (4) Enhancing the role and leadership
of Indonesia in ASEAN and the establishment of the
2015 ASEAN Community; (5) Enhancing the role
of Indonesia in maintaining national security and
creating world peace; (6) Enhancing diplomatic
performance regarding border matters; (7) Increasing
the quality of service and protections for Indonesian
Citizens and Indonesian Legal Entities abroad; and (8)
Enhancing the positive image of Indonesia through
the advancement of democracy, human rights, the
environment and the protection of cultural heritage.
RENCANA PEMBANGUNAN JANGKA MENENGAH NASIONAL (RPJMN) 2010-2014 | THE 2010-2014 NATIONAL MEDIUM-TERM DEVELOPMENT PLAN

43THE INDONESIANBUDGET OVERVIEW 2010
6. Bidang pertahanan dan keamanan
Dalam bidang pertahanan dan keamanan, sasaran
pembangunan ditujukan antara lain untuk : (1)
terwujudnya postur dan struktur pertahanan sebesar
25-27,5% dari kekuatan pokok minimum (minimum
essential force) yang mampu melaksanakan operasi
gabungan dan memiliki efek penggentar; (2)
terdayagunakannya industri pertahanan nasional bagi
kemandirian pertahanan; (3) menurunnya tingkat
kejahatan (criminal rate) yang meliputi kejahatan
konvensional, transnasional, kontingensi, serta
kekerasan terhadap perempuan dan anak menjadi
sekitar 105-95 kejadian per 100.000 penduduk; dan
(4) terpantaunya dan terdeteksinya potensi tindak
terorisme dan meningkatnya kemampuan dan
keterpaduan dalam pencegahan dan penanggulangan
tindak terorisme. Berdasarkan sasaran tersebut, maka
kebijakan pembangunan pertahanan dan keamanan
di arahkan pada : (1) modernisasi alutsista serta
penggantian alutsista yang umur tehnisnya sudah
tua dan membahayakan keselamatan prajurit; (2)
peningkatan profesionalisme prajurit, yang diiringi
dengan peningkatan kesejahteraan prajurit; (3)
percepatan pembentukan komponen bela negara;(4)
peningkatan kualitas dan kuantitas pos pertahanan
dan keamaanan di wilayah perbatasan dan pulau
terdepan (terluar) beserta penggelaran prajurit TNI dan
Polri; (5) pendayagunaan industri pertahanan nasional
bagi kemandirian pertahanan, melalui penyusunan
cetak biru beserta Road Map, peningkatan Penelitian
dan Pengembangan, serta dukungan pendanaannya.
6. The Field of Defense and Security
In the field defense and security, the development
objectives are aimed at: (1) the realization of a defense
posture and structure of 25-27.5% of the minimum
essential force that is able to carry out joint operations
and has a deterrence effect; (2) the productive use
of the national defense industry for defense self-
reliance; (3) reducing the crime rate, consisting of
conventional, transnational, contingency crimes and
violence against women and children to around 105-
95 cases per 100,000 people; and (4) supervising and
detecting potential acts of terrorism and enhancing
capacities and improving the ability to prevent and
combat acts of terrorism. Based on these objectives,
the development policy in the field of defense and
security is directed towards: (1) the modernization of
the main equipment in the arsenal system (alutsista)
and replacement of old alutsista that can endanger
the safety of the soldiers; (2) Increasing soldiers’
professionalism, along with enhancing the welfare
of the soldiers; (3) the accelerated establishment of
defense components; (4) enhancing the quality and
quantity of defense and security stations in the border
areas and leading islands, along with the deployment
of Army and Police personnel; (5) the productive use
of the national defense industry for defense self-
reliance, through the formulation of a blueprint and
road map, enhancement of research and technology
and funding support.
RENCANA PEMBANGUNAN JANGKA MENENGAH NASIONAL (RPJMN) 2010-2014 | THE 2010-2014 NATIONAL MEDIUM-TERM DEVELOPMENT PLAN

44 THE INDONESIANBUDGET OVERVIEW 2010
7. Bidang hukum dan aparatur
Sasaran pembangunan bidang hukum dan aparatur
ditujukan untuk mewujudkan peningkatan
penyelenggaraan tata kelola pemerintahan yang baik
yang mencerminkan supremasi hukum dan penegakan
hak asasi manusia dan didukung oleh aparatur
Negara yang bersih, berwibawa, bertanggung jawab
serta professional. Kebijakan pembangunan dibidang
hukum dan aparatur tersebut diarahkan pada
perbaikan tata kelola pemerintahan yang baik, dengan
strategi sebagai berikut: (1) peningkatan efektivitas
peraturan perundang-undangan; (2) peningkatan
kinerja lembaga di bidang hukum; (3) peningkatan
penghormatan, pemajuan, dan penegakan HAM;
(4) peningkatan penyelenggaraan pemerintahan
yang bersih dan bebas korupsi, kolusi dan nepotisme
(KKN); (5) peningkatan kualitas pelayanan publik;
(6) peningkatan kapasitas dan akuntabilitas kinerja
birokrasi; (7) pemantapan pelaksanaan reformasi
birokrasi.
8. Bidang wilayah dan tataruang
Rencana Pembangunan Jangka Menengah (RPJMN)
dalam Pembangunan Bidang Wilayah dan Tata Ruang
pada tahun 2010 - 2014, dilaksanakan dengan
tujuan untuk mengurangi kesenjangan wilayah, yang
dilaksanakan melalui 3 (tiga) arah kebijakan dan
strategi utama, yaitu (1) pelaksanaan pengendalian
dan pelaksanaan penataan ruang, (2) koordinasi dan
integrasi pembangunan wilayah, baik dalam lingkup
perkotaan dan perdesaan, maupun dalam lingkup
kawasan-kawasan prioritas (kawasan-kawasan
7. The Field of Law and Apparatus
The development objective in the field of law and
apparatus is aimed at realizing enhanced good
governance that reflects the supremacy of the
law and the enforcement of human rights, all
of which is supported by a clean, authoritative,
accountable and professional state apparatus. The
policy of the development in the field of law and
apparatus is directed towards the improvement of
good governance, with the following strategies: (1)
increasing the effectiveness of laws and regulations;
(2) enhancing the performance of law institutions;
(3) increasing respect for the advancement and
enforcement of human rights; (4) enhancing good
governance that is free from corruption, collusion and
nepotism (KKN); (5) improving the quality of public
services; (6) improving the capacity and accountability
of bureaucratic performance; and (7) stabilizing the
implementation of bureaucratic reforms.
8. The Field of Regional and Spatial Planning
Issues
The Medium-Term Development Plan (RPJMN) in
the development of the regional and zoning field in
2010-2014 is implemented with the goal of reducing
regional disparity, which is carried out through 3 (three)
policy directions and main strategies, namely: (1)
zoning implementation and control; (2) coordination
and integration of regional development, either in
the scope of urban-rural areas or priorities areas
(strategic, underdeveloped, border, and disaster-prone
RENCANA PEMBANGUNAN JANGKA MENENGAH NASIONAL (RPJMN) 2010-2014 | THE 2010-2014 NATIONAL MEDIUM-TERM DEVELOPMENT PLAN

45THE INDONESIANBUDGET OVERVIEW 2010
strategis, kawasan tertinggal, kawasan perbatasan,
dan daerah rawan bencana), yang diperkuat dengan
(3) penyelenggaraan desentralisasi dan pemerintahan
daerah.
9. Bidang sumber daya alam (SDA) dan
lingkungan hidup (LH)
Sasaran pokok yang ingin dicapai dalam pembangunan
SDA dan LH pada RPJMN 2010-2014 secara umum
adalah meningkatnya kontribusi pembangunan SDA
dan LH terhadap pertumbuhan ekonomi nasional dan
kontribusi terhadap penyerapan tenaga kerja Pertanian,
Perikanan dan Kehutanan (PPK) di perdesaan, serta
meningkatkan sumbangan ekspor dari sektor PPK.
Selain itu, sasaran pembangunan SDA dan LH lainnya
adalah menjaga kondisi SDA dan LH seperti saat ini
atau meningkat kualitasnya. Kebijakan pembangunan
SDA dan LH dalam RPJM 2010-2014 diarahkan
untuk: (1) mendukung pembangunan perekonomian
nasional terutama dalam meningkatkan pertumbuhan
ekonomi, mewujudkan daya saing ekonomi dan
meningkatkan kesejahteraan masyarakat; serta
(2) meningkatkan pengelolaan sumber daya alam
dan pelestarian lingkungan hidup untuk mencapai
pembangunan yang berkelanjutan.
III. Prioritas Pembangunan Kewilayahan
Salah satu misi dalam Rencana Pembangunan Jangka
Panjang Nasional (RPJPN) 2005 – 2025 adalah
areas), supported by (3) decentralization and regional
government.
9. The Field of Natural Resources and the
Environment
In general, the main objectives to be achieved in
natural resource and environmental development in
the 2010-2014 RPJMN are: an increased contribution
of natural resources and environmental development
to national economic growth; the contribution to
the employment of agricultural, fishery and forestry
manpower in rural areas; and increased export
contributions from the agricultural, fishery and
forestry sectors. In addition to this, the other objective
is maintaining or enhancing the quality of the current
condition of natural resources and the environment.
The policy of development in the field of natural
resources and the environment in the 2010-2014
RPJM is directed towards: (1) supporting national
economic development, particularly by increasing
economic growth, realizing economic competitiveness
and enhancing public welfare; and (2) enhancing
natural resource management and environmental
conservation to achieve sustainable development.
III. Regional Development Priorities
One of the missions in the 2005-2025 National Long-
RENCANA PEMBANGUNAN JANGKA MENENGAH NASIONAL (RPJMN) 2010-2014 | THE 2010-2014 NATIONAL MEDIUM-TERM DEVELOPMENT PLAN

46 THE INDONESIANBUDGET OVERVIEW 2010
terwujudnya pembangunan yang lebih merata dan
berkeadilan ditandai oleh tingkat pembangunan yang
makin merata ke seluruh wilayah diwujudkan dengan
peningkatan kualitas hidup dan kesejahteraan
masyarakat, termasuk berkurangnya kesenjangan
antarwilayah dalam kerangka Negara Kesatuan
Republik Indonesia. Untuk itu, strategi dan arah
kebijakan pembangunan kewilayahan adalah sebagai
berikut :
- Mendorong pertumbuhan wilayah-wilayah
potensial di luar Jawa-Bali dan Sumatera dengan
tetap menjaga momentum pertumbuhan di
wilayah Jawa-Bali dan Sumatera;
- Meningkatan keterkaitan antarwilayah melalui
peningkatan perdagangan antarpulau untuk
mendukung perekonomian domestik;
- Meningkatkan daya saing daerah melalui
pengembangan sektor-sektor unggulan di tiap
wilayah;
- Mendorong percepatan pembangunan daerah
tertinggal, kawasan strategis dan cepat tumbuh,
kawasan perbatasan, kawasan terdepan, kawasan
terluar, dan daerah rawan bencana;
- Mendorong pengembangan wilayah laut dan
sektor-sektor kelautan.
Sejalan dengan pelaksanaan 11 prioritas nasional,
arah dan kebijakan pengembangan kewilayahan
ditujukan untuk mewujudkan sasaran-sasaran 11
prioritas nasional sejalan dengan isu strategis yang
ada di setiap wilayah.
Term Development Plan (RPJPN) is the realization of
more equally-distributed and fair development, marked
by a more equally distributed development level to all
areas, which is realized through an enhanced quality
of life and welfare of the people, including reduced
interregional disparity within the framework of the
Unitary State of the Republic of Indonesia. Hence, the
strategy and policy direction of regional development
is as follows:
- Encouraging the growth of potential regions
outside of Java-Bali and Sumatra by maintaining
growth momentum in the Java-Bali and Sumatra
regions;
- Enhancing interregional linkages through increased
inter-island trade in order to support the domestic
economy;
- Enhancing regional competitiveness through the
development of leading sectors in each region;
- Encouraging the accelerated development of
underdeveloped, strategic and fast-growth, border,
leading, outermost, and disaster-prone areas;
- Encouraging the development of maritime areas
and fishery sectors.
In line with the implementation of the 11 national
priorities, the direction and policy of regional
development are aimed at realizing the objectives of
the the 11 national priorities in line with the strategic
issues in each region.
RENCANA PEMBANGUNAN JANGKA MENENGAH NASIONAL (RPJMN) 2010-2014 | THE 2010-2014 NATIONAL MEDIUM-TERM DEVELOPMENT PLAN

47THE INDONESIANBUDGET OVERVIEW 2010
1. Pengembangan Wilayah Sumatera
Sesuai dengan Rencana Tata Ruang Wilayah Nasional
(RTRWN), pengembangan wilayah Sumatera diarahkan
antara lain untuk (1) memantapkan interaksi antar-
kawasan pesisir timur, kawasan tengah, dan kawasan
pesisir barat Sumatera melalui pengembangan sistem
jaringan transportasi darat, laut, dan transportasi
udara lintas Sumatera yang handal; (2) mendorong
berfungsinya pusat-pusat permukiman perkotaan
sebagai pusat pelayanan jasa koleksi dan distribusi
di Pulau Sumatera; (3) mengembangkan akses
bagi daerah terisolir dan pulau-pulau kecil di pesisir
barat dan timur Sumatera sebagai sentra produksi
perikanan, pariwisata, minyak dan gas bumi ke pusat
kegiatan industri pengolahan serta pusat pemasaran
lintas pulau dan lintas negara; (4) mempertahankan
kawasan lindung sekurang-kurangnya 40% dari
luas Pulau Sumatera dalam rangka mengurangi
resiko dampak bencana lingkungan yang dapat
mengancam keselamatan masyarakat dan aset-aset
sosial-ekonominya yang berbentuk prasarana, baik
pusat permukiman maupun kawasan budidaya; (5)
mengembangkan komoditas unggulan wilayah yang
memiliki daya saing tinggi melalui kerjasama lintas
sektor dan lintas wilayah provinsi dalam pengelolaan
dan pemasarannya dalam rangka mendorong
kemandirian akses ke pasar global dengan mengurangi
ketergantungan pada negara-negara tetangga.
2. Pengembangan Wilayah Jawa-Bali
Sementara itu, pengembangan wilayah Jawa-Bali
diarahkan antara lain untuk: (1) mempertahankan
1. Development of the Sumatra Region
In accordance with the National and Regional Spatial
Plan (Rencana Tata Ruang Wilayah Nasional/RTRWN),
the development of the Sumatra region is directed
towards: (1) stabilizing interaction among the east
coast region, middle region, and west coast region of
Sumatra through the development of a reliable cross-
Sumatra land, sea and air transportation network
system; (2) encouraging the function of urban
housing centers as service centers for collection and
distribution services on Sumatra Island; (3) developing
access for isolated areas and small islands on the west
and east coast of Sumatra, as production centers
of fishery, tourism, oil and gas, to inter-island and
inter-country centers of the processing industry and
marketing; (4) maintaining protected areas of at
least 40% of the area of Sumatra Island in order to
reduce the risk of impact from environmental disasters
that can endanger the safety of the public and their
social-economic assets in the form of infrastructures,
including both housing centers and cultivation areas;
and (5) developing regional leading commodities that
are highly competitive through inter-sectoral and inter-
area cooperation in their management and marketing,
in order to encourage self-reliance in terms of access
to the global market by reducing dependency on
neighboring countries.
2. Development of the Java-Bali Region
Meanwhile, the development of the Java-Bali region is
directed towards: (1) maintaining the Java-Bali Islands
RENCANA PEMBANGUNAN JANGKA MENENGAH NASIONAL (RPJMN) 2010-2014 | THE 2010-2014 NATIONAL MEDIUM-TERM DEVELOPMENT PLAN

48 THE INDONESIANBUDGET OVERVIEW 2010
Pulau Jawa-Bali sebagai lumbung pangan
nasional melalui berbagai upaya menetapkan dan
mempertahankan kawasan produksi pangan; (2)
mempertahankan dan merehabilitasi kawasan
lindung yang semakin terdesak oleh kegiatan
budidaya hingga mencapai luasan minimal 30% dari
keseluruhan luas Wilayah Pulau Jawa-Bali, khususnya
di Pulau Jawa bagian selatan dan Pulau Bali bagian
tengah; (3) mempertahankan sumber-sumber air
dan merehabilitasi daerah resapan air untuk menjaga
ketersedian air sepanjang tahun; (4) mengendalikan
pertumbuhan pusat-pusat permukiman perkotaan dan
perdesaan yang berpotensi mengganggu kawasan-
kawasan yang rawan bencana serta mengancam
keberadaan kawasan lindung dan kawasan produksi
pangan melalui pengendalian aspek kependudukan
dan kegiatan sosial ekonominya; (5) mengendalikan
secara ketat pengembangan industri hingga
ambang batas toleransi lingkungan yang aman bagi
keberlanjutan pembangunan.
3. Pengembangan Wilayah Kalimantan
Untuk wilayah Kalimantan, pengembangannya antara
lain diarahkan untuk: (1) memelihara dan memulihkan
kawasan-kawasan yang berfungsi lindung dan kritis
lingkungan dalam rangka mendukung keberlanjutan
pemanfaatan sumber daya kehutanan, pertambangan,
dan pertanian, serta sumberdaya kelautan, pesisir dan
pulau-pulau kecil, serta mengurangi resiko dampak
bencana alam; (2) mendayagunakan posisi strategis
secara geografis yang berdekatan dengan Negara
bagian Malaysia di Sarawak dan Sabah dalam kerangka
as the national food estate, through various efforts to
determine and maintain food production areas; (2)
maintaining and rehabilitating protected areas being
exploited by cultivation activity, to reach a minimum
level of 30% of the total area of the Bali-Java Islands,
especially in the southern part of Java Island and the
middle part of Bali Island; (3) maintaining water sources
and rehabilitating water absorption areas to preserve
the availability of water all year long; (4) controlling
the growth of urban and rural housing centers that
have the potential to disturb disaster-prone areas
and endanger the existence of protected areas and
food production areas as done through control of the
population aspect and their social/economic activities;
and (5) tightly limiting industrial development to an
environmentally tolerated threshold that is safe for the
sustainability of the development.
3. Development of the Kalimantan Region
For the Kalimantan region, development is
directed towards: (1) maintaining and recovering
environmentally protected and critical areas, in order
to support the sustainable utilization of forestry,
mining, agricultural resources, fisheries, coastal and
small islands resources, as well as to reduce the risk
of the impact of natural disasters; (2) productively
using the geographical strategic position that is
close to the Malaysian states of Sarawak and Sabah
in regards to sub-regional economic cooperation
RENCANA PEMBANGUNAN JANGKA MENENGAH NASIONAL (RPJMN) 2010-2014 | THE 2010-2014 NATIONAL MEDIUM-TERM DEVELOPMENT PLAN

49THE INDONESIANBUDGET OVERVIEW 2010
kerjasama ekonomi subregional BIMP-EAGA (Brunei
Darussalam – Indonesia – Malaysia – Phillippines East
ASEAN Growth Area); (3) mendorong percepatan
penanganan kawasan perbatasan antar Negara
dengan negara Malaysia di Serawak dan Sabah sebagai
beranda depan wilayah Negara Kesatuan Republik
Indonesia di Pulau Kalimantan; (4) meningkatkan
aksesibilitas internal wilayah Pulau Kalimantan untuk
mewujudkan sinergi pengembangan potensi wilayah
dan pemerataan tingkat perkembangan antar wilayah
melalui percepatan fungsionalisasi jaringan jalan lintas
Kalimantan secara terpadu dengan pengembangan
jaringan angkutan sungai, angkutan laut, jaringan
jalan rel kereta api dan angkutan udara; (5) mendorong
peran kawasan andalan sebagai penggerak
pengembangan ekonomi wilayah Kalimantan.
4. Pengembangan Wilayah Sulawesi
Selanjutnya, pengembangan wilayah Sulawesi
diarahkan antara lain untuk: (1) mendorong
perkembangan peran Pulau Sulawesi sebagai salah
satu wilayah yang memiliki peluang-peluang eksternal
cukup besar; (2) mengembangkan komoditas
unggulan Pulau Sulawesi yang memiliki daya saing
tinggi melalui kerjasama lintas sektor dan lintas wilayah
provinsi dalam pengelolaan dan pemasarannya;
(3) memprioritaskan kawasan-kawasan tertinggal
dan kawasan perbatasan dalam rangka pencapaian
pemerataan tingkat perkembangan antar wilayah,
termasuk pengembangan pulau-pulau kecil dan gugus
kepulauan; (4) memanfaatkan potensi sumber daya di
darat dan laut secara optimal serta mengatasi potensi
of BIMP-EAGA (Brunei Darussalam – Indonesia
– Malaysia – Philippines East ASEAN Growth Area);
(3) encouraging the accelerated settlement of border
areas with Malaysia in Serawak and Sabah as the
“front porch” of the Unitary State of the Republic
of Indonesia on Kalimantan Island; (4) enhancing
the internal accessibility of Kalimantan Island areas
to realize a synergy of potential area development
and equality of the inter-area development level
through accelerated functioning of an integrated
cross-Kalimantan network, with the development of a
river, sea, train and air transportation network; and (5)
encouraging the role of leading regions as drivers of
economic development in the Kalimantan region.
4. Development of the Sulawesi Region
Next, development of the Sulawesi region is directed
towards: (1) encouraging the development of the role
of Sulawesi Island as one of the regions possessing large
external potential; (2) developing Sulawesi’s leading
highly-competitive commodities through inter-sectoral
and inter-regional cooperation in management and
marketing; (3) prioritizing the underdeveloped and
border areas in regards to the achievement of equal
interregional development, including the development
of small islands and archipelago islands; (4) optimally
utilizing the potential of land and sea resources and
handling the potential for interregional conflict that
exists in several territorial water and land areas; and
(5) maintaining the existence of centers for national
RENCANA PEMBANGUNAN JANGKA MENENGAH NASIONAL (RPJMN) 2010-2014 | THE 2010-2014 NATIONAL MEDIUM-TERM DEVELOPMENT PLAN

50 THE INDONESIANBUDGET OVERVIEW 2010
konflik lintas wilayah provinsi yang terjadi di beberapa
wilayah perairan dan daratan; (5) mempertahankan
keberadaan sentra-sentra produksi pangan nasional,
khususnya bagi sawah-sawah beririgasi teknis dari
ancaman konversi lahan.
5. Pengembangan Wilayah Nusa Tenggara
Pengembangaan wilayah Nusa Tenggara diarahkan
antara lain untuk: (1) mengembangkan kota-kota di
kawasan pesisir sebagai pusat pelayanan kegiatan
industri kemaritiman terpadu sebagai sektor basis
yang didukung oleh prasarana dan sarana yang
memadai, khususnya transportasi, energi, dan sumber
daya air; (2) mengembangkan wilayah darat, laut,
pesisir, dan pulau-pulau kecil sebagai satu kesatuan
wilayah Kepulauan Nusa Tenggara melalui kegiatan
pemanfaatan dan pengendalian pemanfaatan ruang
yang terpadu didukung oleh prasarana dan sarana
yang memadai; (3) meningkatkan aksesibilitas antar
kota-kota pesisir yang menghubungkan poros Banda
Aceh–Atambua, sehingga membentuk keterkaitan
sosial ekonomi yang kuat; (4) meningkatkan
keterkaitan pengembangan antarkawasan (Kawasan
Andalan dan Kawasan Andalan Laut) untuk
mengoptimalkan potensi wisata budaya dan wisata
alam, termasuk wisata bahari; (5) menetapkan
fokus spesialisasi penanganan komoditas unggulan
termasuk pemasarannya, yang berorientasi ekspor,
dengan mengutamakan pengelolaan sumberdaya
alam terbarukan berdasarkan prinsip kemanfaatan
bersama baik antarwilayah maupun antarkawasan.
food production, particularly for technically irrigated
paddy fields against the threat of land conversion.
5. Development of the Nusa Tenggara Region
Development of the Nusa Tenggara region is directed
towards: (1) developing cities in coastal areas as
centers for integrated maritime industrial activity, as
the base sector that is supported by adequate facilities
and infrastructure, particularly transportation, energy
and water resources; (2) developing land, sea, coastal
areas and small islands as a single Nusa Tenggara
Islands area, through integrated zoning utilization and
control of zoning utilization supported by adequate
facilities and infrastructure; (3) enhancing accessibility
among the coastal cities that connect the Banda
Aceh-Atambua route; thus there will be strong social/
economic connections; (4) enhancing interregional
development linkages (Leading Regions and Maritime
Leading Regions) to optimize the cultural and natural
tourism potential, including maritime tourism;
and (5) determining the specialization focus of
leading commodities, including marketing, that are
export-oriented, by prioritizing the management of
renewable natural resources based on the principle of
joint usefulness, both inter-regional and inter-area.
RENCANA PEMBANGUNAN JANGKA MENENGAH NASIONAL (RPJMN) 2010-2014 | THE 2010-2014 NATIONAL MEDIUM-TERM DEVELOPMENT PLAN

51THE INDONESIANBUDGET OVERVIEW 2010
6. Pengembangan Wilayah Maluku
pengembangan wilayah Maluku diarahkan untuk:
(1) mengembangkan kota-kota pesisir sebagai pusat
pelayanan kegiatan industri kemaritiman terpadu
yang merupakan sektor basis dengan dukungan
prasarana dan sarana yang memadai, khususnya
tansportasi, energi, dan sumber daya air; (2)
mengembangkan wilayah darat, laut, pesisir, dan
pulau-pulau kecil sebagai satu kesatuan wilayah
Kepulauan Maluku melalui kegiatan pemanfaatan
dan pengendalian pemanfaatan ruang yang
terpadu didukung oleh prasarana dan sarana yang
memadai; (3) mempertahankan kawasan konservasi
untuk menjamin daya dukung lingkungan yang
optimal bagi pengembangan wilayah; (4) memacu
pertumbuhan ekonomi wilayah Kepulauan Maluku
melalui pengembangan sektor-sektor unggulan yang
berbasis sumber daya setempat dan meningkatkan
keterkaitan antarpusat-pusat pertumbuhan di darat,
pesisir, dan pulau-pulau kecil; (5) memanfaatkan
sumber daya alam secara produktif dan efisien, agar
terhindar dari pemborosan sehingga dapat memberi
manfaat sebesar-besarnya berdasarkan prinsip-prinsip
kelestarian; serta (6) meningkatkan ketersediaan,
kualitas, dan memperluas jangkauan pelayanan
prasarana dasar, khususnya transportasi laut dan
udara yang didukung oleh transportasi antar moda
secara terpadu dan optimal dengan mengikutsertakan
dunia usaha.
7. Pengembangan Wilayah Papua
Pengembangaan wilayah Papua diarahkan antara lain
6. Development of the Maluku Region
Development of the Maluku region is directed
towards: (1) developing cities in coastal areas as
centers for integrated maritime industrial activity, as
the base sector that is supported by adequate facilities
and infrastructure, particularly transportation, energy
and water resources; (2) developing land, sea, coastal
areas and small islands as a single Maluku Islands,
through integrated zoning utilization and control of
zoning utilization supported by adequate facilities and
infrastructure; (3) maintaining conservation areas to
ensure optimum environmental support capacity for
regional development; (4) accelerating the economic
growth in the Maluku Island region through the
development of local resource-based leading sectors
and enhancing linkages among growth centers in
land, coastal areas and small islands; (5) the productive
and efficient utilization of natural resources, in order
to avoid waste, as this will give optimum benefits
based on sustainable principles; and (6) increasing
the availability, quality and expansion of coverage for
basic infrastructure services, particularly sea and air
transportation, supported by integrated and optimum
inter-modal transportation through the involvement
of the business world.
7. Development of the Papua Region
Development of the Papua region is directed towards:
RENCANA PEMBANGUNAN JANGKA MENENGAH NASIONAL (RPJMN) 2010-2014 | THE 2010-2014 NATIONAL MEDIUM-TERM DEVELOPMENT PLAN

52 THE INDONESIANBUDGET OVERVIEW 2010
untuk: (1) mendukung peningkatan serta memperkuat
persatuan, kesatuan dan keutuhan kehidupan bangsa
dan pertahanan negara; (2) menempatkan hak ulayat
dalam penataan ruang sebagai salah satu upaya
untuk mempertahankan nilai-nilai sosial budaya
setempat; (3) memanfaatkan sumber daya alam
dan lingkungan hidup secara produktif dan efisien
agar terhindar dari pemborosan dan penurunan
daya dukung lingkungan sehingga dapat memberi
manfaat sebesar-besarnya berdasarkan prinsip-prinsip
kelestarian dan berkelanjutan; (4) mempertahankan
kawasan lindung sekurang-kurangnya 50 persen dari
luas wilayah Pulau Papua; (5) memacu pertumbuhan
ekonomi wilayah Pulau Papua melalui pengembangan
sektor-sektor unggulan yang berbasis sumber daya
setempat dan meningkatkan keterkaitan antarpusat-
pusat pertumbuhan.
(1) supporting the improvement and strengthening
of unity, integrity of national life and state defense;
(2) placing the indigenous land rights (hak ulayat)
in the zoning arrangement as one of the efforts to
maintain local social and cultural values; (3) utilizing
natural resources and the environment in a productive
and efficient manner in order to avoid waste, thus
providing optimum benefits based on the principles
of sustainability and conservation; (4) maintaining
protected areas of at least 50 percent of the Papua
Island region; and (5) accelerating the economic
growth in the Papua Island region through the
development of local resource-based leading sectors
and enhancing linkages among growth centers.
RENCANA PEMBANGUNAN JANGKA MENENGAH NASIONAL (RPJMN) 2010-2014 | THE 2010-2014 NATIONAL MEDIUM-TERM DEVELOPMENT PLAN


55THE INDONESIANBUDGET OVERVIEW 2010
The formulation of The Indonesian Budget is based
on the provisions of Article 23 Paragraph (1) of the
1945 Constitution that has been amended to Article
23 Paragraph (1), Paragraph (2), and Paragraph (3)
of the fourth amendment to the 1945 Constitution,
and refers to provisions as set forth in Law Number
17 of 2003 regarding State Finance. Specifically for
the 2010 Budget, besides referring to the above
provisions, its formulation is also to be guided by
the 2010 Government Work Plan, Macroeconomic
Framework, and the 2010 Fiscal Policy Highlights as
agreed on in the preliminary discussion between the
Government and the House of Representatives of the
Republic of Indonesia on June 17, 2009.
Macro Economic Assumptions and the 2010 Fiscal Policy HighlightsThe 2010 Budget is calculated based on basic
macroeconomic assumptions that are expected to
occur in 2010. The basic macroeconomic assumptions
Penyusunan Anggaran dan Pendapatan Belanja
Negara (APBN) didasarkan pada ketentuan pasal
23 ayat (1) Undang-Undang Dasar 1945 yang telah
diubah menjadi pasal 23 ayat (1), ayat (2), dan ayat (3)
UUD 1945 amendemen keempat dan mengacu pada
ketentuan yang tertuang dalam Undang-undang
Nomor 17 Tahun 2003 tentang Keuangan Negara.
Selanjutnya khusus untuk APBN Tahun Anggaran
2010 selain mengacu pada ketentuan di atas,
penyusunannya juga dilakukan dengan berpedoman
kepada Rencana Kerja Pemerintah (RKP) Tahun
2010, Kerangka Ekonomi Makro, dan Pokok-pokok
Kebijakan Fiskal tahun 2010 sebagaimana telah
disepakati dalam pembicaraan pendahuluan antara
Pemerintah dan Dewan Perwakilan Rakyat Republik
Indonesia tanggal 17 Juni 2009 yang lalu.
Asumsi Makro dan Pokok-Pokok Kebijakan Fiskal Tahun 2010Perhitungan besaran APBN 2010 dihitung berdasarkan
asumsi dasar ekonomi makro yang diperkirakan
akan terjadi pada tahun 2010. Asumsi-asumsi dasar
ANGGARAN PENDAPATAN DAN BELANJA NEGARA (APBN) TAHUN 2010
THE 2010 INDONESIAN BUDGET
2BABCHAPTER

56 THE INDONESIANBUDGET OVERVIEW 2010
in 2010 can be seen in Table 1:
The fiscal policy in the year 2010 is directed towards
the achievement of two fundamental things, namely:
(1) supporting the recovery of the national economy
by continuing the fiscal stimulus program; and (2)
maintaining the education budget ratio at a 20 percent
minimum. At technical level, the fiscal policy to support
the national economy is carried out through policy
implementation in the form of the provision of tax
incentives and increasing expenditure stimulus, which
are aimed at increasing the public’s purchasing power
and the development of labor-intensive infrastructure.
Furthermore, the 2010 fiscal policy is also directed at
improving the achievement of various targets in The
Indonesian Budget, both qualitative and quantitative.
The 2010 Budget is a transitional Budget from the
previous Government and House of Representatives
ekonomi makro dalam tahun 2010 dapat dilihat
dalam Tabel 1 berikut:
Kebijakan fiskal pada tahun 2010 diarahkan
untuk pencapaian dua hal mendasar, yaitu: (1)
mendukung pemulihan perekonomian nasional
dengan melanjutkan program stimulus fiskal; dan (2)
mempertahankan rasio anggaran pendidikan minimal
20 persen. Dalam tataran teknis, kebijakan fiskal untuk
mendukung pemulihan ekonomi nasional dijalankan
melalui pelaksanaan kebijakan berupa pemberian
insentif perpajakan dan peningkatan stimulus belanja
negara yang ditujukan untuk meningkatkan daya beli
masyarakat dan pembangunan infrastruktur padat
karya. Selain itu, kebijakan fiskal pada tahun 2010
juga diarahkan untuk meningkatkan pencapaian
berbagai target dalam APBN, baik yang bersifat
kualitatif maupun kuantitatif.
APBN 2010 merupakan APBN transisi dari Pemerintah
Economic Indicators The 2010 State Budget
1. Economic Growth (%) 5.5
2. Inflation (%) 5.0
3. Exchange Rate (Rp/US$) 10,000
4. 3-Month SBI Rate (%) 6.5
5. Oil Price (US$/barrel) 65.0
6. Oil Lifting (million barrels/day) 0.965
Source: Ministry of Finance
Table 1Basic Macroeconomic Assumptions, 2010
ANGGARAN PENDAPATAN DAN BELANJA NEGARA (APBN) TAHUN 2010 | THE 2010 INDONESIAN BUDGET
57THE INDONESIANBUDGET OVERVIEW 2010
to Government and House of Representatives elected
in the 2009 General Election. The 2010 Budget is
formulated in regard to “Recovery of the National
Economy and Safeguarding the People’s Welfare” in
accordance with the theme of the 2010 Government
Work Plan. In line with this development theme, the
2010 fiscal policy highlights are directed towards: (1)
continuing/enhancing all public welfare programs;
(2) continuing fiscal stimulus programs through the
development of infrastructure, agriculture and energy,
and labor-intensive projects; (3) encouraging business
world recovery, including provisions for tax and import
duty incentives; (4) continuing bureaucratic reforms:
(5) improving the primary weapon system (alutsista);
and (6) maintaining the education budget at a
minimum of 20 percent of total Budget.
Next, for meeting the tax revenue targets in 2010,
several tax policy measures will be undertaken,
including: (1) reduction of the corporate income tax
(PPh) tariff from 28.0 percent to 25.0 percent, in
accordance with the mandate of the Amendment
to the Income Tax Law (UU PPh); (2) a provision of
a Corporate Income Tax facility for public companies,
of 5.0 percent below the normal tariff; (3) taxes
borne by government (DTP) policy, including in the
form of the value added tax (VAT) and import duty
subsidies for certain sectors; and fiscal incentives in
the effort to encourage oil and gas upstream business
activities; (4) implementation of the amendment to
the Value Added Law; and (5) continuing reforms and
modernization of tax administration.
dan DPR sebelumnya ke Pemerintahan dan DPR hasil
Pemilihan Umum tahun 2009. APBN 2010 disusun
dalam rangka “Pemulihan Perekonomian Nasional dan
Pemeliharaan Kesejahteraan Rakyat” sesuai dengan
tema Rencana Kerja Pemerintah tahun 2010. Sejalan
dengan tema pembangunan tersebut, maka pokok-
pokok kebijakan fiskal tahun 2010 diarahkan untuk:
(1) meneruskan/meningkatkan seluruh program
kesejahteraan rakyat; (2) melanjutkan program
stimulus fiskal melalui pembangunan infrastruktur,
pertanian dan energi, serta proyek padat karya; (3)
mendorong pemulihan dunia usaha, termasuk melalui
pemberian insentif perpajakan dan bea masuk; (4)
meneruskan reformasi birokrasi; (5) memperbaiki alat
utama sistem senjata (alutsista); serta (6) menjaga
anggaran pendidikan minimal 20 persen dari APBN.
Selanjutnya, dalam memenuhi target penerimaan
perpajakan di tahun 2010, maka akan dilakukan
beberapa langkah kebijakan pajak yang diantaranya
meliputi: (1) penurunan tarif pajak penghasilan
(PPh) Badan dari 28,0 persen menjadi 25,0 persen
sesuai amanat Amendemen Undang-undang Pajak
Penghasilan (UU PPh); (2) pemberian fasilitas PPh
Badan untuk perusahaan masuk bursa sebesar 5,0
persen dari tarif normal; (3) kebijakan pajak ditanggung
Pemerintah (DTP) antara lain dalam bentuk subsidi
pajak pertambahan nilai (PPN) dan bea masuk untuk
sektor tertentu, serta insentif fiskal dalam upaya
memacu kegiatan usaha hulu migas; (4) pelaksanaan
amendemen Undang-undang Pertambahan Nilai;
serta (5) melanjutkan reformasi dan modernisasi
ANGGARAN PENDAPATAN DAN BELANJA NEGARA (APBN) TAHUN 2010 | THE 2010 INDONESIAN BUDGET

58 THE INDONESIANBUDGET OVERVIEW 2010
In the field of customs and excises, the policies to be
taken in 2010 include: (1) provision of customs facilities
with a nominal tariff for most favorable nation (MFN)
of 7.5 percent, a common effective preferential tariff
(CEPT) of 2.0 percent, ASEAN-Korea at 2.6 percent,
ASEAN-China at 3.8 percent, and Indonesia-Japan
at 4.0 percent; (2) provision of incentives in order
to support trade and industry policies; (3) increased
excise tariffs in line with the rate of inflation; (4)
increased excise tariff of beverages containing
domestic ethyl alcohol (MMEA) and ethyl alcohol
(EA); (5) simplification of excise tariff and classification
for cigarette manufacturers; (6) improved supervision
of tax banderole; (7) provision of various facilities of
import duty exemption and relief; (8) application of a
non-tariff policy that is oriented towards control of the
import of goods and the use of domestic products;
(9) adjustment of export duty tariffs based on the
development of the international crude palm oil (CPO)
price; and (10) continuing the bureaucratic reform and
modernization of customs services.
In the field of non-tax revenue (PNBP), the policies to
be taken in 2010 are: (1) increasing natural resource
production that is supported by fiscal incentives; (2)
developing new and renewable energy as alternative
energy; (3) improving PNBP service functions at
ministries/agencies (K/Ls); (4) improving the regulations
regarding the PNBP tariff at K/Ls; and (5) applying a
payout ratio policy in the dividend disbursement of
State-Owned Enterprises (SOEs) amounting to 5.0 to
administrasi pajak.
Di bidang kepabeanan dan cukai, kebijakan yang
akan ditempuh di tahun 2010, diantaranya dalam
bentuk: (1) pemberian fasilitas kepabeanan dengan
tarif nominal most favorable nation (MFN) 7,5 persen,
common effective preferential tariff (CEPT) 2,0 persen,
ASEAN Korea 2,6 persen, ASEAN-China 3,8 persen, dan
Indonesia-Jepang 4,0 persen; (2) pemberian insentif
dalam rangka mendukung kebijakan perdagangan
dan industri; (3) kenaikan tarif cukai seiring dengan
laju tingkat inflasi; (4) kenaikan tarif cukai minuman
mengandung ethyl alcohol (MMEA) dan ethyl alcohol
(EA) dalam negeri; (5) penyederhanaan tarif cukai
dan golongan produsen rokok; (6) peningkatan
pengawasan pita cukai; (7) pemberian berbagai
fasilitas pembebasan dan keringanan bea masuk;
(8) penerapan kebijakan non-tarif yang berorientasi
pada pengendalian barang impor dan penggunaan
produksi dalam negeri; (9) penyesuaian tarif bea
keluar berdasarkan perkembangan harga crude palm
oil (CPO) internasional; dan (10) melanjutkan langkah
reformasi birokrasi dan modernisasi kantor pelayanan
kepabeanan.
Di bidang penerimaan negara bukan pajak (PNBP),
kebijakan yang akan ditempuh di tahun 2010
diantaranya adalah: (1) meningkatkan produksi sumber
daya alam yang didukung dengan insentif fiskal; (2)
mengembangkan energi baru dan terbarukan sebagai
energi alternatif; (3) meningkatkan fungsi pelayanan
pada PNBP kementerian/lembaga (K/L); (4) melakukan
penyempurnaan peraturan mengenai tarif PNBP pada
K/L, serta (5) menerapkan kebijakan pay out ratio
ANGGARAN PENDAPATAN DAN BELANJA NEGARA (APBN) TAHUN 2010 | THE 2010 INDONESIAN BUDGET

59THE INDONESIANBUDGET OVERVIEW 2010
55.0 percent, with an exception for SOEs with loss
accumulation, and SOEs in the insurance, forestry, and
plantation sectors.
In terms of expenditures, the increased expenditure
budget for K/Ls in 2010 is mainly to support several
policies, including (1) improving the welfare of the state
apparatus and retirees through the provision of the
annual salary bonus, increased salary, a basic pension
of 5 (five) percent, and increased food allowances; (2)
continuing/enhancing all public welfare programs,
such as the national program for community
empowerment (PNPM), School Operational Assistance
(BOS), Public Health Assurances (Jamkesmas), Rice for
the Poor (Raskin), and the Family Hope Program (PKH);
(3) continuing the development of infrastructure in
the fields of transportation, agriculture and energy
and other labor-intensive projects; (4) encouraging
industrial revitalization and business world recovery;
(5) continuing bureaucratic reform in order to realize
good governance and improved public services;
(6) increasing the operational, maintenance and
procurement budget for alutsista; (7) maintaining the
education budget at a minimum of 20.0 percent of
expenditures; and (8) enhancing the quality of natural
resource management and the capacity for climate
change management.
In general, the policy direction in the field of transfers
to regions in 2010 includes: (1) reducing the fiscal
gap between the central and regional governments
and among the regions; (2) supporting those activities
that are national development priorities which are
penarikan dividen Badan Usaha Milik Negara (BUMN)
sebesar 5,0 persen hingga 55,0 persen, terkecuali
untuk BUMN dengan akumulasi rugi, sektor asuransi,
kehutanan, dan perkebunan.
Di sisi belanja negara, kenaikan anggaran belanja
K/L dalam tahun 2010 terutama untuk mendukung
beberapa kebijakan, antara lain: (1) memperbaiki
kesejahteraan aparatur negara dan pensiunan melalui
pemberian gaji ke 13, kenaikan gaji dan pensiun
pokok sebesar 5 (lima) persen, serta kenaikan uang
makan dan lauk pauk; (2) meneruskan/meningkatkan
seluruh program kesejahteraan rakyat, seperti
program nasional pemberdayaan masyarakat
(PNPM), bantuan operasional sekolah (BOS), jaminan
kesehatan masyarakat (Jamkesmas), beras miskin
(Raskin), dan program keluarga harapan (PKH); (3)
melanjutkan pembangunan infrastruktur transportasi,
pertanian, energi, dan proyek padat karya lainnya;
(4) mendorong revitalisasi industri dan pemulihan
dunia usaha; (5) meneruskan reformasi birokrasi guna
mewujudkan tata kelola Pemerintahan yang baik dan
peningkatan pelayanan publik; (6) meningkatkan
anggaran operasional, pemeliharaan, dan pengadaan
alutsista; (6) mempertahankan anggaran pendidikan
minimal 20,0 persen dari belanja negara; dan (7)
meningkatkan kualitas pengelolaan sumber daya
alam dan kapasitas penanganan perubahan iklim.
Arah kebijakan di bidang transfer ke daerah secara
umum pada tahun 2010 antara lain dengan: (1)
mengurangi kesenjangan fiskal antara pusat dan
daerah serta antardaerah; (2) mendukung kegiatan-
kegiatan yang menjadi prioritas pembangunan nasional
ANGGARAN PENDAPATAN DAN BELANJA NEGARA (APBN) TAHUN 2010 | THE 2010 INDONESIAN BUDGET

60 THE INDONESIANBUDGET OVERVIEW 2010
under the regional governments; (3) increasing public
accessibility to basic social economy facilities and
infrastructures in the regions; and reducing the public
service disparity among regions; (4) increasing regional
capacity in taking advantage of regional economic
potentials; and (5) increasing regional competitiveness
through infrastructural development.
The financing policy to be taken in 2010 includes: (1)
seeking soft loans; (2) prioritizing the issuance of rupiah
Government Securities (SBN) in the domestic market;
(3) opening access to sources of financing in the
international market; (4) withdrawing stand-by loans
as committed to by international financial institutions
and which have not been realized in 2009.
Based on the 2010 macro assumptions and fiscal
policies highlights, the amount of the 2010 Budget is
planned as follows: (1) revenue and grants at Rp949.7
trillion (15.9 percent of the GDP); (2) expenditures
at Rp1,046.7 trillion (17.5 percent of the GDP); (3) a
budget deficit of Rp98.0 trillion (1.6 percent of the
GDP); and (4) budget financing of Rp98.0 trillion (1.6
percent of the GDP).
A summary of the details regarding the amounts of
revenue and grants, expenditures, the budget deficit,
and budget financing for the 2010 Budget can be
seen in Table 2.
yang menjadi urusan daerah; (3) meningkatkan
aksesibilitas publik terhadap prasarana dan sarana
sosial ekonomi dasar di daerah, dan pengurangan
kesenjangan pelayanan publik antardaerah; (4)
meningkatkan kemampuan daerah dalam menggali
potensi ekonomi daerah; serta (5) meningkatkan daya
saing daerah melalui pembangunan infrastruktur.
Kebijakan pembiayaan yang akan ditempuh di tahun
2010 diantaranya: (1) mengupayakan pinjaman
dengan persyaratan lunak; (2) mengutamakan
penerbitan surat berharga negara (SBN) rupiah di pasar
dalam negeri; (3) membuka akses sumber pembiayaan
di pasar internasional; (4) menarik pinjaman siaga
yang telah menjadi komitmen lembaga keuangan
internasional dan belum dapat direalisasikan di tahun
2009.
Berdasarkan besaran asumsi makro dan pokok-pokok
kebijakan fiskal tahun 2010, maka besaran APBN 2010
direncanakan sebagai berikut: (1) pendapatan negara
dan hibah Rp949,7 triliun (15,9 persen terhadap PDB);
(2) belanja negara Rp1.047,7 triliun (17,5 persen
terhadap PDB); (3) defisit anggaran Rp98,0 triliun (1,6
persen terhadap PDB); dan (4) pembiayaan anggaran
Rp98,0 triliun (1,6 persen terhadap PDB).
Lebih lanjut mengenai besaran pendapatan negara
dan hibah, belanja negara, defisit anggaran, dan
pembiayaan anggaran APBN tahun 2010 secara
ringkas dapat dilihat pada Tabel 2.
ANGGARAN PENDAPATAN DAN BELANJA NEGARA (APBN) TAHUN 2010 | THE 2010 INDONESIAN BUDGET

61THE INDONESIANBUDGET OVERVIEW 2010
Revenue and GrantsIn 2010, revenue and grants are targeted to reach
Rp949.7 trillion, which is Rp.78.7 trillion or 9.0 percent
higher than the 2009 Revised Budget, which reached
Rp871.0 trillion. The target consists of domestic
revenues of Rp948.1 trillion and grant revenues
of Rp1.5 trillion. The higher target for revenue and
grants mainly comes from tax revenues in line with
increased social awareness and compliance, increased
number of taxpayers, and the modernization of tax
Pendapatan Negara dan HibahDalam tahun 2010, pendapatan negara dan hibah
ditargetkan mencapai Rp949,7 triliun, lebih tinggi
Rp78,7 triliun atau 9,0 persen apabila dibandingkan
dengan Anggaran Pendapatan dan Belanja Negara
Perubahan (APBN-P) tahun 2009 yang mencapai
Rp871,0 triliun. Target tersebut terdiri dari penerimaan
dalam negeri sebesar Rp948,1 triliun dan penerimaan
hibah sebesar Rp1,5 triliun. Lebih tingginya target
pendapatan negara dan hibah tersebut terutama
Source: Ministry of Finance
Table 2Summary of the 2010 Indonesian Budget
(trillion Rupiah)
Uraian
2009 2010
Budget% of GDP
Revised Budget
% of GDP
Budget% of GDP
A. State Revenue and Grant 985.7 18.5 871.0 16.1 949.7 15.9
I. Domestic Revenues 984.8 18.5 870.0 16.1 948.1 15.9
1. Tax Revenues 725.8 13.6 652.0 12.1 742.7 12.4
2. Non Tax State revenues (PNBP) 258.9 4.9 218.0 4.0 205.4 3.4
II. Grant 0.9 0.0 1.0 0.0 1.5 0.0
B. State Expenditures 1,037.1 19.5 1,000.8 18.5 1,047.7 17.5
I. Central Government Expenditures 716.4 13.4 691.5 12.8 725.2 12.1
1. K/L Expenditures 322.3 6.1 314.7 5.8 340.1 5.7
2. Non K/L Expenditures 394.1 7.4 376.8 7.0 385.1 6.4
II. Transfer to Regional 320.7 6.0 309.3 5.7 322.4 5.4
1. Balance Fund 297.0 5.6 285.1 5.3 306.0 5.1
2.Special Autonomy and Adjustment Fund
23.7 0.4 24.3 0.4 16.4 0.3
C. Budget Surplus/Deficit (A - B) (51.3) (1.0) (129.8) (2.4) (98.0) (1.6)
D. Financing (I + II) 51.3 1.0 129.8 2.4 98.0 1.6
I. Domestic Financing 60.8 1.1 142.6 2.6 107.9 1.8
II. Foreign Financing (Net) (9.4) (0.2) (12.7) (0.2) (9.9) (0.2)
ANGGARAN PENDAPATAN DAN BELANJA NEGARA (APBN) TAHUN 2010 | THE 2010 INDONESIAN BUDGET

62 THE INDONESIANBUDGET OVERVIEW 2010
administration, as well as the implementation of a tax
reform program.
Domestic RevenuesThe 2010 domestic revenue is targeted to reach
Rp948.1 trillion. This target is an increase of Rp78.2
trillion or 9.0 percent compared to the 2009 Revised
Budget, which reached Rp870.0 trillion. From that
amount, the tax revenue is estimated to reach Rp742.7
trillion or 78.3 percent of the total domestic revenue,
while non-tax revenue (PNBP) is estimated to reach
Rp205.4 trillion or 21.7 percent of the total domestic
revenue.
Tax RevenueThe highlight of general tax policy in 2010 is a
continuation of the general tax policy of the previous
years. In general, the 2010 general tax policy consists
of tax extensification, tax intensification, and post-
sunset policy programs. In addition to this, since mid-
2009 the Government decided to continue tax reform
through Phase II tax reform.
The 2010 tax revenue is targeted to reach Rp742.7
trillion. This is Rp90.8 trillion or 13.9 percent higher
than the 2009 Revised Budget that reached Rp652.0
berasal dari penerimaan perpajakan seiring dengan
meningkatnya kesadaran dan kepatuhan masyarakat,
meningkatnya jumlah wajib pajak, dan modernisasi
administrasi perpajakan, serta diterapkannya program
reformasi perpajakan.
Penerimaan Dalam NegeriPenerimaan dalam negeri tahun 2010 ditargetkan
mencapai Rp948,1 triliun. Target tersebut meningkat
sebesar Rp78,2 triliun atau 9,0 persen apabila
dibandingkan dengan APBN-P tahun 2009 yang
mencapai Rp870,0 triliun. Dari jumlah tersebut,
penerimaan perpajakan diperkirakan mencapai
Rp742,7 triliun atau 78,3 persen dari total penerimaan
dalam negeri, sedangkan PNBP diperkirakan mencapai
Rp205,4 triliun atau 21,7 persen dari total penerimaan
dalam negeri.
Penerimaan PerpajakanPokok-pokok kebijakan umum perpajakan dalam
tahun 2010 merupakan kelanjutan dari kebijakan
umum perpajakan tahun-tahun sebelumnya. Secara
garis besar, kebijakan umum perpajakan tahun
2010 mencakup program ekstensifikasi perpajakan,
program intensifikasi perpajakan, dan program
kegiatan pasca sunset policy. Di samping itu, sejak
pertengahan tahun 2009, Pemerintah memutuskan
untuk terus melanjutkan reformasi perpajakan melalui
reformasi perpajakan jilid II.
Penerimaan perpajakan dalam tahun 2010 ditargetkan
mencapai Rp742,7 triliun. Target tersebut lebih tinggi
Rp90,8 triliun atau 13,9 persen dibandingkan dengan
ANGGARAN PENDAPATAN DAN BELANJA NEGARA (APBN) TAHUN 2010 | THE 2010 INDONESIAN BUDGET

63THE INDONESIANBUDGET OVERVIEW 2010
trillion. In general, there are 3 (three) main factors
that influenced the tax revenue increase, namely:
(1) a relatively better national economic condition
as reflected by higher economic growth in 2010; (2)
continuation of the tax reform program; and (3) higher
social awareness to carry out their tax obligations.
Income Tax (PPh)In line with the estimated improved national economic
condition, the PPh receipts in 2010 is targeted to reach
Rp351.0 trillion, an increase of Rp10.7 trillion over the
PPh income from the 2009 Revised Budget, which
reached Rp340.2 trillion.
In 2010, the oil and gas PPh is targeted to reach
Rp47.0 trillion, a decrease of Rp2.0 trillion or 4.1
percent compared to the 2009 Revised Budget, which
reached Rp49.0 trillion. This decrease was due to an
estimated strengthening of the rupiah exchange rate
against the US dollar in 2010.
The non-oil and gas PPh in 2010 is targeted to reach
Rp303.9 trillion. This target is an increase of Rp12.8
trillion or 4.4 percent compared to the non-oil and
gas PPh revenue in the 2009 Revised Budget, which
reached Rp291.2 trillion.
APBN-P tahun 2009 yang mencapai Rp652,0 triliun.
Secara umum, terdapat 3 (tiga) faktor utama yang
mempengaruhi peningkatan penerimaan perpajakan
yaitu: (1) relatif membaiknya kondisi perekonomian
nasional yang tercermin dari lebih tingginya
pertumbuhan ekonomi 2010; (2) dilanjutkannya
program reformasi perpajakan; dan (3) semakin
tingginya kesadaran masyarakat untuk melaksanakan
kewajiban perpajakan.
Pajak Penghasilan (PPh)Sejalan dengan perkiraan membaiknya kondisi
perekonomian nasional, penerimaan PPh dalam
tahun 2010 ditargetkan mencapai Rp351,0 triliun,
naik Rp10,7 triliun apabila dibandingkan dengan
penerimaan PPh dalam APBN-P tahun 2009 yang
mencapai Rp340,2 triliun.
Dalam tahun 2010, penerimaan PPh migas ditargetkan
mencapai Rp47,0 triliun, turun sebesar Rp2,0 triliun
atau 4,1 persen apabila dibandingkan dengan APBN-P
tahun 2009 yang mencapai Rp49,0 triliun. Penurunan
tersebut lebih disebabkan oleh menguatnya perkiraan
nilai tukar rupiah terhadap dolar Amerika Serikat di
tahun 2010.
PPh nonmigas dalam tahun 2010 ditargetkan
mencapai Rp303,9 triliun. Target tersebut lebih tinggi
Rp12,8 triliun atau 4,4 persen apabila dibandingkan
dengan penerimaan PPh nonmigas dalam APBN-P
tahun 2009 yang mencapai Rp291,2 triliun.
ANGGARAN PENDAPATAN DAN BELANJA NEGARA (APBN) TAHUN 2010 | THE 2010 INDONESIAN BUDGET

64 THE INDONESIANBUDGET OVERVIEW 2010
Value-Added Tax (VAT) and Sales Tax on Luxury Goods (PPnBM)
The VAT and PPnBM revenue in 2010 is targeted
to reach Rp269.5 trillion, which is Rp66.5 trillion or
32.7 percent higher than the 2009 Revised Budget
of Rp203.1 trillion. This target has taken into account
the potential loss from the implementation of the
amendment to the VAT Law. However, improved
tax administration, enhanced taxpayer compliance,
continuation of tax reforms and increased domestic
consumption are expected to reduce the potential
loss.
Land and Building Tax (PBB) and Duties on Land and Building Transfer (BPHTB)The PBB revenue in 2010 is targeted to reach Rp26.5
trillion. This target is Rp2.6 trillion or 11.1 percent
higher than the 2009 Revised Budget, where it reached
Rp23.9 trillion. This increase is mainly influenced by
the increased Tax Object Selling Price (NJOP) on land
and buildings and increased oil and gas upstream
business activities. In more detail, PBB revenue in 2010
consists of rural PBB of Rp1.0 trillion, urban PBB of
Rp7.4 trillion, plantation PBB of Rp0.8 trillion, forestry
PBB of Rp0.3 trillion, oil and gas mining PBB of Rp16.7
trillion, and general mining PBB of Rp0.3 trillion.
Meanwhile, BPHTB revenue in 2010 is targeted to
reach Rp7.4 trillion. This amount is an increase of
Pajak Pertambahan Nilai (PPN) dan Pajak Penjualan atas Barang Mewah (PPnBM)Penerimaan PPN dan PPnBM dalam tahun 2010
ditargetkan mencapai Rp269,5 triliun, lebih tinggi
Rp66,5 triliun atau 32,7 persen apabila dibandingkan
dengan APBN-P tahun 2009 yang mencapai Rp203,1
triliun. Target tersebut telah memperhitungkan
potential loss dari diterapkannya amendemen
Undang-undang PPN. Namun demikian, perbaikan
administrasi perpajakan, peningkatan kepatuhan
wajib pajak, dilanjutkannya reformasi perpajakan serta
meningkatnya konsumsi dalam negeri diharapkan
dapat mengurangi potential loss tersebut.
Pajak Bumi dan Bangunan (PBB) dan Bea Perolahan Hak atas Tanah dan Bangunan (BPHTB)Penerimaan PBB dalam tahun 2010 ditargetkan
mencapai Rp26,5 triliun. Target tersebut lebih tinggi
Rp2,6 triliun atau 11,1 persen apabila dibandingkan
dengan APBN-P tahun 2009 yang mencapai Rp23,9
triliun. Peningkatan tersebut terutama dipengaruhi
oleh meningkatnya Nilai Jual Obyek Pajak (NJOP) atas
tanah dan bangunan serta meningkatnya kegiatan
usaha hulu migas. Secara lebih rinci, penerimaan PBB
tahun 2010 terdiri dari PBB pedesaan Rp1,0 triliun, PBB
perkotaan Rp7,4 triliun, PBB perkebunan Rp0,8 triliun,
PBB kehutanan Rp0,3 triliun, PBB pertambangan
migas Rp16,7 triliun, dan PBB pertambangan umum
Rp0,3 triliun.
Sementara itu, penerimaan BPHTB tahun 2010
ANGGARAN PENDAPATAN DAN BELANJA NEGARA (APBN) TAHUN 2010 | THE 2010 INDONESIAN BUDGET

65THE INDONESIANBUDGET OVERVIEW 2010
Rp0.4 trillion or 5.9 percent compared to the 2009
Revised Budget, which reached Rp7.0 trillion.
ExciseBy considering economic growth, retail price policy,
and an increase of excise tariffs of 5.0 - 10.0 percent,
then the excise revenue in 2010 is targeted to reach
Rp57.3 trillion. Compared to the 2009 Revised Budget,
which reached Rp54.5 trillion, this target is an increase
of Rp2.7 trillion or 5.0 percent.
Other TaxesOther tax revenue in 2010 is targeted to reach Rp3.9
trillion. Compared to the estimated realization in 2009
that reached Rp3.3 trillion, this is an increase of Rp0.6
trillion or 18.5 percent. The increase mainly resulted
from an increase in the number of transactions using
duty stamps.
Import DutyImport duty revenue in 2010 is targeted to reach
Rp19.6 trillion. This target is determined by taking
into account domestic economic growth, the rupiah
exchange rate, the average effective tariff, paid
foreign exchange rate, and increased commitment
of international trade cooperation through the Free
Trade Area (FTA) scheme. Compared to the import
ditargetkan mencapai Rp7,4 triliun. Jumlah tersebut
meningkat Rp0,4 triliun atau 5,9 persen apabila
dibandingkan dengan APBN-P tahun 2009 yang
mencapai Rp7,0 triliun.
CukaiDengan mempertimbangkan pertumbuhan ekonomi,
kebijakan harga jual eceran, dan peningkatan tarif
cukai sebesar 5,0 - 10,0 persen, maka penerimaan
cukai dalam tahun 2010 ditargetkan mencapai Rp57,3
triliun. Jika dibandingkan dengan APBN-P tahun 2009
yang mencapai Rp54,5 triliun, maka target tersebut
mengalami peningkatan sebesar Rp2,7 triliun atau
meningkat 5,0 persen.
Pajak LainnyaPenerimaan pajak lainnya dalam tahun 2010 ditargetkan
mencapai Rp3,9 triliun. Apabila dibandingkan dengan
perkiraan realisasi tahun 2009 yang mencapai Rp3,3
triliun, maka terjadi peningkatan sebesar Rp0,6 triliun
atau meningkat 18,5 persen. Peningkatan tersebut
terutama disebabkan oleh meningkatnya transaksi
yang menggunakan materai.
Bea MasukPenerimaan bea masuk tahun 2010 ditargetkan
mencapai Rp19,6 triliun. Target tersebut ditetapkan
dengan mempertimbangkan pertumbuhan ekonomi
dalam negeri, nilai tukar rupiah, tarif efektif rata-
rata, nilai devisa bayar, dan bertambahnya komitmen
kerjasama perdagangan internasional melalui skim
Free Trade Area (FTA). Apabila dibandingkan dengan
ANGGARAN PENDAPATAN DAN BELANJA NEGARA (APBN) TAHUN 2010 | THE 2010 INDONESIAN BUDGET

66 THE INDONESIANBUDGET OVERVIEW 2010
duty in the 2009 Revised Budget that reached Rp18.6
trillion, the estimated import duty revenue in 2010 is
an increase of Rp0.9 trillion or 5.1 percent. The target
import duty of Rp19.6 trillion includes the provision of
an import duty facility borne by the Government (BM-
DTP) of Rp3.0 trillion.
Export DutyExport duty revenue in 2010 will be highly influenced
by the trade of Crude Palm Oil (CPO) and its derivative
products. Therefore, Government policy on CPO
business administration, whether in the form of the
tariff, export benchmark price (HPE), assumption of
the rupiah exchange rate, or the export volume of
CPO and its derivative products, will highly influence
the target of export duty revenue. By considering the
above factors, the export duty revenue in 2010 is
targeted to reach Rp7.6 trillion. This is an increase of
Rp6.2 trillion or 445.4 percent compared to the 2009
Revised Budget, where it was only Rp1.4 trillion.
For further information on the proportion of tax
revenue in the 2010 Budget, refer to Graphic 1.
bea masuk dalam APBN-P tahun 2009 yang mencapai
Rp18,6 triliun, maka perkiraan penerimaan bea
masuk tahun 2010 meningkat sebesar Rp0,9 triliun
atau 5,1 persen. Target bea masuk sebesar Rp19,6
triliun tersebut sudah termasuk pemberian fasilitas
pembayaran bea masuk ditanggung Pemerintah (BM-
DTP) sebesar Rp3,0 trliun.
Bea KeluarPenerimaan bea keluar dalam tahun 2010 akan
sangat dipengaruhi oleh hasil perdagangan Crude
Palm Oil (CPO) dan produk turunannya. Oleh karena
itu, kebijakan Pemerintah atas tataniaga CPO baik
berupa tarif, harga patokan ekspor (HPE), asumsi
nilai tukar rupiah maupun volume ekspor CPO dan
produk turunannya akan sangat memengaruhi target
penerimaan bea keluar. Dengan mempertimbangkan
faktor-faktor tersebut, maka penerimaan bea keluar
dalam tahun 2010 ditargetkan mencapai Rp7,6
triliun. Target tersebut meningkat Rp6,2 triliun atau
445,4 persen apabila dibandingkan dengan APBN-P
tahun 2009 yang hanya mencapai Rp1,4 triliun.
Lebih lanjut mengenai proporsi penerimaan perpajakan
APBN tahun 2010 dapat dilihat pada Grafik 1.
ANGGARAN PENDAPATAN DAN BELANJA NEGARA (APBN) TAHUN 2010 | THE 2010 INDONESIAN BUDGET

67THE INDONESIANBUDGET OVERVIEW 2010
Non-Tax Revenues (PNBP)
In 2010, PNBP is expected to give a more optimum
contribution as a source of domestic revenue. In the
2010 Budget, the role of natural resource revenue
still dominates, particularly from oil and gas revenue.
Based on the stated macro assumptions, especially
the Indonesian Crude Price (ICP), the rupiah exchange
rate against US Dollar, and oil lifting/production, the
2010 PNBP is targeted to reach Rp205.4 trillion. This
target is a decrease of Rp12.6 trillion or 5.8 percent
compared to the estimated realization in 2009, due
to decreased oil and gas natural resource revenue
related to the strengthening of the rupiah exchange
rate assumption in 2010.
Penerimaan Negara Bukan Pajak (PNBP)Dalam tahun 2010, PNBP diharapkan dapat
memberikan kontribusi yang lebih optimal sebagai
sumber penerimaan dalam negeri. Dalam APBN
2010, peranan penerimaan SDA masih mendominasi,
terutama dari penerimaan migas. Berdasarkan
asumsi makro yang ditetapkan, terutama indikator
Indonesian Crude Price (ICP), nilai tukar rupiah
terhadap dollar Amerika Serikat, dan produksi/lifting
minyak bumi, maka PNBP 2010 ditargetkan sebesar
Rp205,4 triliun. Target PNBP tersebut mengalami
penurunan sebesar Rp12,6 triliun atau 5,8 persen jika
dibandingkan dengan perkiraan realisasi tahun 2009,
yang disebabkan oleh penurunan penerimaan SDA
migas terkait dengan penguatan asumsi nilai tukar
rupiah dalam tahun 2010.
ANGGARAN PENDAPATAN DAN BELANJA NEGARA (APBN) TAHUN 2010 | THE 2010 INDONESIAN BUDGET

68 THE INDONESIANBUDGET OVERVIEW 2010
Policies and measures to be taken by the Government
to achieve the 2010 PNBP target include: (1)
optimizing revenues from the oil and gas sector
through an increase of crude oil lifting/production
as well as efficiency in cost recovery; (2) increasing
the production of mining and mineral commodities
and the improvement of regulations in the mining
sector; (3) taking advantage of the revenue potentials
in the field of forestry while still considering the
environmental conservation program; (4) optimizing
SOE dividends while still considering increasing SOE
efficiency and performance through investment
(capital expenditure) optimization; and (5) improving
PNBP service and administration performance in the
K/L’s.
Natural ResourcesIn 2010, natural resource revenue is targeted to
reach Rp132.0 trillion, a decrease of Rp6.6 trillion or
4.8 percent compared to the estimated realization in
2009. As the main source of PNBP, natural resource
revenue is targeted to provide 64.3 percent of the
PNBP. Most of the natural resource revenues, 91.3
percent, are from oil and gas natural resource revenue,
and the remaining 8.7 percent are from non-oil and
gas natural resource revenue.
Revenue of the Government’s Share of SOE ProfitsSOE dividends in 2010 are targeted to reach Rp24.0
trillion or 11.7 percent of the total PNBP. The target is
Kebijakan dan langkah-langkah yang akan ditempuh
Pemerintah dalam mencapai target PNBP tahun
2010, antara lain: (1) mengoptimalkan penerimaan
dari sektor migas melalui peningkatan produksi/
lifting minyak mentah dan efisiensi dalam cost
recovery; (2) meningkatkan produksi komoditas
tambang dan mineral serta perbaikan peraturan
di sektor pertambangan; (3) menggali potensi
penerimaan di sektor kehutanan dengan tetap
mempertimbangkan program kelestarian lingkungan
hidup; (4) mengoptimalkan dividen BUMN dengan
tetap mempertimbangkan peningkatan efisiensi dan
kinerja BUMN melalui optimalisasi investasi (Capital
Expenditure); dan (5) meningkatkan kinerja pelayanan
dan administrasi pada PNBP K/L.
Sumber Daya Alam (SDA)Dalam tahun 2010, penerimaan SDA ditargetkan
mencapai Rp132,0 triliun, menurun sebesar Rp6,6
triliun atau 4,8 persen dibandingkan dengan perkiraan
realisasinya pada tahun 2009. Sebagai sumber utama
PNBP, penerimaan SDA ditargetkan memberikan
kontribusi terhadap PNBP sebesar 64,3 persen.
Sebagian besar penerimaan SDA tersebut bersumber
dari penerimaan SDA migas sebesar 91,3 persen
dan sisanya sebesar 8,7 persen dari penerimaan SDA
nonmigas.
Penerimaan Bagian Pemerintah atas Laba BUMNDividen BUMN dalam tahun 2010 ditargetkan sebesar
Rp24,0 triliun atau 11,7 persen terhadap total PNBP.
ANGGARAN PENDAPATAN DAN BELANJA NEGARA (APBN) TAHUN 2010 | THE 2010 INDONESIAN BUDGET

69THE INDONESIANBUDGET OVERVIEW 2010
a decrease of Rp4.6 trillion or 16.1 percent compared
to the estimated SOE dividends in 2009. This
lower revenue target is mainly due to a decrease in
estimated SOE net profits, especially from major SOEs
such as PT Pertamina and banking sector SOEs. The
estimated SOE dividends in 2010 are Rp10.0 trillion
(43.5 percent) from PT Pertamina, Rp4.0 trillion (17.4
percent) from banking sector SOEs, and the remaining
39.1 percent from SOEs in other sectors.
In order to maintain SOE performance, as well as to
optimize the revenue from SOE dividends in 2010, the
Government will utilize several policies, including: (a)
determination of a pay-out ratio of 0-25 percent for
insurance sector SOEs; specifically for PT Jamsostek,
PT Taspen, PT Askes, and PT Asabri the pay-out
ratio policy is determined to be 0 (zero) percent; (b)
a pay-out ratio of 0 (zero) percent for forestry SOEs,
related to the forest conservation efforts in Indonesia;
(c) a pay-out ratio of 0 (zero) percent for profitable
SOEs with loss accumulation; (d) a pay-out ratio
of 0–60 percent for profitable SOEs without loss
accumulation; (e) a pay-out ratio of 10-25 percent for
SOEs that implement Government projects in the field
of infrastructure, such as PT Angkasa Pura (I and II), PT
Pelindo (I and IV), and PT Bio Farma; (f) determination
of special dividends for SOEs with windfall profits;
(g) do not withdraw dividends for profitable SOEs
having cash flow difficulties; (h) improvement of SOE
performance through optimizing investment (capital
expenditure), for the consolidation of working capital;
Target tersebut lebih rendah sebesar Rp4,6 triliun atau
16,1 persen apabila dibandingkan dengan perkiraan
dividen BUMN tahun 2009. Lebih rendahnya target
penerimaan tersebut terutama disebabkan oleh
penurunan perkiraan laba bersih BUMN terutama dari
BUMN besar seperti PT Pertamina dan BUMN sektor
perbankan. Perkiraan dividen BUMN tahun 2010
tersebut berasal dari PT Pertamina sebesar Rp10,0
triliun (43,5 persen), BUMN sektor perbankan Rp4,0
triliun (17,4 persen), dan sisanya sebesar 39,1 persen
berasal dari BUMN sektor lainnya.
Guna menjaga kinerja BUMN sekaligus optimalisasi
penerimaan dari dividen BUMN di tahun 2010,
Pemerintah akan mengambil beberapa kebijakan
antara lain (a) penetapan pay-out ratio 0-25 persen
untuk BUMN sektor asuransi, khusus PT Jamsostek, PT
Taspen, PT Askes, dan PT Asabri diterapkan kebijakan
pay-out ratio 0 (nol) persen; (b) penetapan pay-out
ratio 0 (nol) persen untuk BUMN kehutanan, terkait
dengan upaya pelestarian hutan di Indonesia; (c)
penetapan pay-out ratio 0 (nol) persen untuk BUMN
laba dengan akumulasi rugi; (d) penetapan pay-out
ratio 0-60 persen untuk BUMN laba tanpa akumulasi
rugi; (e) penetapan pay-out ratio 10-25 persen untuk
BUMN yang menjalankan proyek Pemerintah di
bidang infrastruktur, seperti PT Angkasa Pura (I dan II),
PT Pelindo (I dan IV), dan PT Bio Farma; (f) penetapan
dividen spesial untuk BUMN dengan laba windfall;
(g) tidak menarik dividen bagi BUMN laba namun
mengalami kesulitan cash flow; (h) peningkatan
kinerja BUMN melalui optimalisasi investasi (capex),
untuk konsolidasi modal kerja; dan (i) melakukan
ANGGARAN PENDAPATAN DAN BELANJA NEGARA (APBN) TAHUN 2010 | THE 2010 INDONESIAN BUDGET

70 THE INDONESIANBUDGET OVERVIEW 2010
and (i) SOE restructuring and rightsizing, in accordance
with Presidential Instruction Number 5 of 2008.
Other PNBPIn 2010, the target of other PNBP is estimated to
reach Rp39.9 trillion, a decrease of Rp5.0 trillion or
11.1 percent compared to the estimated realization of
other PNBP in 2009 of Rp44.9 trillion.
In regard with the achievement of the 2010 PNBP
target, particularly from several K/Ls as the largest
contributors of Other PNBP, several measures will
be undertaken by K/Ls in the form of optimization
and effectiveness of PNBP collection. Below is an
explanation regarding PNBP targets from several K/Ls
as the largest contributors of Other PNBP, along with
the policies to be taken.
Further details regarding the proportions of non-tax
revenue can be seen in Graphic 2.
GrantsIn 2010, grant revenue is targeted to be Rp1.5 trillion,
an increase of Rp0.5 trillion compared to the estimated
realization of grant revenue in 2009 of Rp1.0 trillion.
The main factor influencing the increase of grants is
mainly from the commitment of multilateral agencies
and donor countries in assisting the Indonesian
Government’s programs related to climate change.
Furthermore, Government policy through the
improvement of administration systems and the
application of a system that requires all grant revenues
to be recorded in The Indonesian Budget (on budget)
program restrukturisasi dan rightsizing BUMN, sesuai
dengan Inpres Nomor 5 Tahun 2008.
PNBP LainnyaDalam tahun 2010, target PNBP lainnya diperkirakan
mencapai Rp39,9 triliun, mengalami penurunan
sebesar Rp5,0 triliun atau 11,1 persen jika
dibandingkan dengan perkiraan realisasi PNBP lainnya
tahun 2009 sebesar Rp44,9 triliun.
Dalam rangka pencapaian target PNBP tahun
2010, khususnya yang berasal dari beberapa K/L
penyumbang terbesar PNBP Lainnya, berbagai upaya
akan dilakukan oleh masing-masing K/L berupa
kebijakan optimalisasi dan efektifitas pungutan PNBP.
Berikut ini adalah penjelasan mengenai pencapaian
target PNBP dari beberapa K/L penyumbang terbesar
PNBP lainnya berikut kebijakan yang akan dilakukan.
Lebih lanjut mengenai proporsi penerimaan negara
bukan pajak, dapat dilihat pada Grafik 2.
HibahDalam tahun 2010, penerimaan hibah ditargetkan
sebesar Rp1,5 triliun, meningkat sebesar Rp0,5 triliun
dibandingkan dengan perkiraan realisasi penerimaan
hibah tahun 2009 sebesar Rp1,0 triliun.
Faktor utama yang berpengaruh dalam peningkatan
hibah tersebut terutama bersumber dari komitmen
lembaga multilateral dan negara donor dalam
membantu program Pemerintah Indonesia terkait
dengan isu perubahan iklim (climate change). Di
samping itu, kebijakan Pemerintah melalui perbaikan
sistem administrasi dan penerapan sistem yang
ANGGARAN PENDAPATAN DAN BELANJA NEGARA (APBN) TAHUN 2010 | THE 2010 INDONESIAN BUDGET

71THE INDONESIANBUDGET OVERVIEW 2010
is also effective to optimize grant revenue and improve
the accountability of grant utilization reports.
Furthermore, details on revenue and grants in 2010
can be seen in Table 3.
ExpenditureCentral Government ExpendituresThe budget allocation policy for central government
expenditure in the 2010 Budget is designed to support
efforts in the “Recovery of the National Economy and
Safeguarding of People’s Welfare” in accordance
with the theme of the 2010 Government Work Plan
(RKP).
The 2010 RKP is formulated based on the direction of
the 2nd National Medium-Term Development Plan (2nd
RPJMN) taken from the 2005-2025 National Long-
mewajibkan semua penerimaan hibah dicatat dalam
APBN (on budget) juga efektif dalam mengoptimalkan
penerimaan hibah dan meningkatkan akuntabilitas
laporan penggunaan dana hibah.
Selanjutnya, lebih detail mengenai pendapatan negara
dan hibah tahun 2010 dapat dilihat pada Tabel 3.
Belanja NegaraBelanja Pemerintah PusatKebijakan alokasi anggaran belanja Pemerintah
pusat dalam APBN tahun 2010, dirancang untuk
mendukung upaya “Pemulihan Perekonomian
Nasional dan Pemeliharaan Kesejahteraan Rakyat”
sesuai dengan tema Rencana Kerja Pemerintah (RKP)
Tahun 2010.
Penyusunan RKP Tahun 2010 disusun berdasarkan arah
Rencana Pembangunan Jangka Menengah Nasional
ke-2 (RPJMN ke-2) dari Rencana Pembangunan Jangka
ANGGARAN PENDAPATAN DAN BELANJA NEGARA (APBN) TAHUN 2010 | THE 2010 INDONESIAN BUDGET

72 THE INDONESIANBUDGET OVERVIEW 2010
Table 3Revenue and Grant, 2009-2010
(trillion Rupiah)
Item
2009 2010
Revised State
Budget
% of GDP
State Budget
% of GDP
State Revenue and Grant 871.0 16.1 949.7 15.9
I. Domestic Revenue 870.0 16.0 948.1 15.9
1. Tax Revenue 652.0 12.1 742.7 12.4
a. Domestic Tax 631.9 11.7 715.6 12.0
i. Income Tax 340.2 6.3 351.0 5.9
1. Oil and Gas 49.0 0.9 47.0 0.8
2. Non Oil and Gas 291.2 5.4 303.9 5.1
ii. Value Added Tax 203.1 3.8 269.5 4.5
iii. Land and Building Tax 23.9 0.4 26.5 0.4
iv. BPHTB 7.0 0.1 7.4 0.1
v. Excise 54.5 1.0 57.3 1.0
vi. Other Taxes 3.3 0.1 3.9 0.1
b. International Trade Tax 20.0 0.4 27.2 0.5
i. Import Duty 18.6 0.3 19.6 0.3
ii. Export Duty 1.4 0.0 7.6 0.1
2. Non Tax State Revenue 218.1 4.0 205.4 3.4
a. Natural Resource Revenue 138.7 2.6 132.0 2.2
i. Oil and Gas 127.7 2.4 120.5 2.0
ii. Non Oil and Gas 10.9 0.2 11.5 0.2
b. Share on SOE Profit 28.6 0.5 24.0 0.4
c. Other PNBP 44.9 0.8 39.9 0.7
d. BLU Revenue 5.9 0.1 9.5 0.2
II. Grant 1.0 0.0 1.5 0.0
Source: Ministry of Finance
ANGGARAN PENDAPATAN DAN BELANJA NEGARA (APBN) TAHUN 2010 | THE 2010 INDONESIAN BUDGET

73THE INDONESIANBUDGET OVERVIEW 2010
Term Development Plan (RPJPN), which is directed
towards further stabilizing Indonesian restructuring in
all fields, with an emphasis on the improvement of
human resource quality, including the development
of science and technology and increasing economic
competitiveness.
In accordance with the national development
theme and priorities in the 2010 RKP, the budget
allocations for central government expenditures
in the 2010 Budget will focus on: (1) continuing/
improving all public welfare programs, such as
PNPM, BOS, Jamkesmas, Raskin, PKH, and various
other subsidies; (2) continuing the development of
infrastructure, agriculture, and energy as well as labor-
intensive projects and fiscal stimulus if necessary; (3)
encouraging industrial revitalization, business world
recovery, including provisions for tax and import duty
incentives; (4) continuing bureaucratic reform; (5)
increasing the operational budget; (5) maintaining
and procuring alutsista; (6) maintaining an education
budget of 20 percent; and (7) improving the capacity
for natural resource management and the capacity for
climate change management, including for disaster
risk reduction.
Based on the above policies, in the 2010 Budget the
budget allocation for central government expenditure
is planned to be Rp725.2 trillion (12.1 percent of
the GDP). This is an increase of Rp33.7 trillion or
4.9 percent compared to the estimated realization
of central government expenditure budget in 2009
of Rp691.5 trillion (12.9 percent of the GDP). The
increased budget allocation for central government
Panjang Nasional (RPJPN) 2005-2025, yang ditujukan
untuk lebih memantapkan penataan kembali
Indonesia di segala bidang dengan menekankan
peningkatan kualitas sumber daya manusia, termasuk
pengembangan kemampuan ilmu dan teknologi serta
peningkatan daya saing perekonomian.
Sesuai dengan tema dan prioritas pembangunan
nasional dalam RKP 2010 tersebut, alokasi anggaran
belanja Pemerintah pusat dalam APBN tahun 2010
akan difokuskan untuk: (1) meneruskan/meningkatkan
seluruh program kesejahteraan rakyat seperti PNPM,
BOS, Jamkesmas, Raskin, PKH, dan berbagai subsidi
lainnya; (2) melanjutkan pembangunan infrastruktur,
pertanian, dan energi, serta proyek padat karya
dan stimulus fiskal bila diperlukan; (3) mendorong
revitalisasi industri, pemulihan dunia usaha termasuk
melalui pemberian insentif perpajakan dan bea masuk;
(4) meneruskan reformasi birokrasi; (5) meningkatkan
anggaran operasional, pemeliharaan dan pengadaan
alutsista; (6) menjaga anggaran pendidikan tetap 20
persen, dan (7) meningkatkan kapasitas pengelolaan
sumber daya alam dan kapasitas penanganan
perubahan iklim, termasuk dalam pengurangan resiko
bencana.
Berdasarkan kebijakan tersebut di atas, dalam APBN
tahun 2010, alokasi anggaran belanja Pemerintah
pusat direncanakan sebesar Rp725,2 triliun (12,1
persen dari PDB). Jumlah ini berarti mengalami
peningkatan sebesar Rp33,7 triliun atau 4,9 persen
bila dibandingkan dengan perkiraan realisasi
anggaran belanja Pemerintah pusat dalam tahun
2009 sebesar Rp691,5 triliun (12,8 persen dari PDB).
ANGGARAN PENDAPATAN DAN BELANJA NEGARA (APBN) TAHUN 2010 | THE 2010 INDONESIAN BUDGET

74 THE INDONESIANBUDGET OVERVIEW 2010
expenditures in the 2010 Budget is related to the need
for state administration, namely the budget need for
state administration related to the number of personnel
and their welfare level. In addition to this, the volume
of the central government expenditure budget in the
2010 Budget is also influenced by the budget need for
capital expenditures for infrastructure development in
various fields, in order to drive and stimulate economic
activities, the subsidies budget (both energy and
non-energy subsidies), social assistance expenditure,
fulfillment of obligations in the payment of domestic
and foreign debt interest, membership contributions
in various international financial institutions, and
various other strategic expenditures.
Central Government Expenditures by OrganizationThe budget allocation for central government
expenditures in the 2010 Budget, determined to
amount to Rp699.7 trillion (11.6 percent of the GDP),
will be allocated for K/L expenditures amounting to
Rp340.1 trillion (5.7 percent of the GDP), and non-
K/L expenditures (budget portion for the state general
treasurer) amounting to Rp385.1 trillion (6.4 percent of
the GDP). The budget allocation for K/L expenditures
in the 2010 Budget increases Rp25.4 trillion or 8.1
percent compared to the K/L expenditure budget
in the 2009 Revised Budget of Rp314.7 trillion (5.8
percent of the GDP).
Kenaikan alokasi anggaran belanja Pemerintah pusat
dalam APBN tahun 2010 tersebut berkaitan dengan
kebutuhan penyelenggaraan Pemerintahan negara,
yaitu kebutuhan anggaran untuk penyelenggaraan
administrasi Pemerintahan yang terkait dengan
jumlah pegawai dan tingkat kesejahteraannya. Selain
itu, volume anggaran belanja Pemerintah pusat
dalam APBN tahun 2010 tersebut juga dipengaruhi
oleh kebutuhan anggaran belanja modal untuk
pembangunan infrastruktur di berbagai bidang guna
menggerakkan dan mendorong kegiatan ekonomi,
beban anggaran subsidi (baik subsidi energi maupun
subsidi nonenergi), belanja bantuan sosial, serta
pemenuhan kewajiban pembayaran bunga utang
dalam negeri dan luar negeri, iuran keanggotaan
berbagai lembaga keuangan internasional, dan
berbagai belanja strategis lainnya.
Belanja Pemerintah Pusat Menurut OrganisasiAlokasi anggaran belanja Pemerintah pusat dalam
APBN tahun 2010 yang ditetapkan sebesar Rp699,7
triliun (11,6 persen terhadap PDB), akan dialokasikan
masing-masing untuk belanja K/L sebesar Rp340,1
triliun (5,7 persen terhadap PDB), dan belanja non-K/L
(bagian anggaran bendahara umum negara) sebesar
Rp385,1 triliun (6,4 persen terhadap PDB). Alokasi
anggaran belanja K/L dalam APBN tahun 2010
tersebut berarti mengalami peningkatan sebesar
Rp25,4 triliun atau 8,1 persen bila dibandingkan
dengan anggaran belanja K/L dalam APBN-P tahun
2009 sebesar Rp314,7 triliun (5,8 persen terhadap
PDB).
ANGGARAN PENDAPATAN DAN BELANJA NEGARA (APBN) TAHUN 2010 | THE 2010 INDONESIAN BUDGET

75THE INDONESIANBUDGET OVERVIEW 2010
In that regard, the policy on expenditure budget
allocation to finance various development programs
and activities which are to be implemented by the K/
Ls will be more directed towards various development
activities that can effectively give direct impact and/
or contribution in accelerating the achievement of
development objectives. Furthermore, fund allocations
in the K/Ls are directed in accordance with the duties,
functions, and estimated capacities of each K/L in
implementing their development programs.
In 2010 six K/Ls were selected as the pilot projects
to start using the performance-based budgeting
approach in the planning and budgeting process,
namely: the Ministry of National Education, the
Ministry of Finance, the Ministry of Health, the Ministry
of Public Works, the Ministry of Agriculture, and the
Ministry of National Development Planning/National
Development Planning Agency. It is expected that all
K/Ls will implement performance-based budgeting in
2011.
The implementation of Performance-Based Budgeting
and the Medium-Term Expenditure Framework is
preceded by Program and Activity Restructuring,
which is to be carried out in 2010. In regards to the
program/activity restructuring, there are 8 stages to be
undertaken, namely: (1) determination of K/L vision
and mission in accordance with the K/L’s strategic plan,
duties and functions, (2) formulation of K/L strategic
objectives (K/L outcome), (3) program restructuring
Berkaitan dengan itu, kebijakan alokasi anggaran
belanja bagi pembiayaan berbagai program
dan kegiatan pembangunan yang dilaksanakan
oleh K/L akan lebih diarahkan pada berbagai
kegiatan pembangunan yang secara efektif dapat
memberikan dampak dan/atau kontribusi langsung
dalam mempercepat pencapaian sasaran-sasaran
pembangunan. Selain itu, alokasi pendanaan pada
K/L diarahkan sesuai dengan tugas dan fungsi-
nya, serta perkiraan kapasitas masing-masing K/L
dalam mengimplementasikan program-program
pembangunan.
Dalam tahun 2010, terdapat enam K/L yang dipilih
sebagai pilot project untuk mulai menggunakan
pendekatan anggaran berbasis kinerja dalam
proses perencanaan dan penganggarannya, yaitu:
Kementerian Pendidikan Nasional, Kementerian
Keuangan, Kementerian Kesehatan, Kementerian
Pekerjaan Umum, Kementerian Pertanian, serta
Kementerian Negara PPN/Badan Perencanaan
Pembangunan Nasional. Sedangkan pada tahun
2011, diharapkan semua K/L akan melaksanakan
anggaran berbasis kinerja tersebut.
Penerapan Performance Based Budgeting dan
Medium Term Expenditure Framework diawali
dengan Restrukturisasi Program dan Kegiatan
yang dilakukan pada tahun 2010. Dalam rangka
restrukturisasi program/kegiatan, terdapat 8 tahapan
yang akan dilakukan yaitu : (1) penetepan visi dan misi
K/L sesui dengan rencana strategis, tugas serta fungsi
K/L, (2) perumusan sasaran strategis K/L (outcome
K/L), (3) restrukturisasi program yang bersumber dari
ANGGARAN PENDAPATAN DAN BELANJA NEGARA (APBN) TAHUN 2010 | THE 2010 INDONESIAN BUDGET

76 THE INDONESIANBUDGET OVERVIEW 2010
for the duties and functions in each Echelon I of every
K/L, (4) formulation of program outcomes based
on Echelon I visions and missions, (5) determination
of program key performance indicators (KPI), (6)
formulation of activity per echelon II/working unit in
accordance with the main duties and functions of each
echelon II/working unit, (7) determination of activity
output based on core business unit, (8) determination
of activity performance indicators that will be carried
out through quantity, quality and price approaches.
The results of the restructuring will be implemented in
2011 for all K/Ls.
Central Government Expenditure by FunctionIn accordance with the mandate of Article 11
Paragraph (5) of Law Number 17 of 2003 regarding
State Finance, the budget allocation for central
government expenditures in The Indonesian Budget is
detailed according to 11 functions. The classification
of the central government expenditure budget by
function is aimed at describing government duties in
carrying out its service functions in order to achieve
the national development goals. These functions are:
(1) General public service; (2) defense; (3) public order
and safety; (4) economy affairs; (5) environmental
protection; (6) housing and communities ammenities;
(7) health; (8) tourism and culture; (9) religious affairs;
(10) education; and (11) social protection.
In the 2010 Budget, the central government
expenditure budget by function is still dominated
tugas dan fungsi di masing-masing eselon I setiap
K/L, (4) perumusan outcome program berdasarkan
visi dan misi Eselon I, (5) penetapan indikator kinerja
utama (IKU) program, (6) perumusan kegiatan per
eselon II/Satker sesuai dengan tupoksi eselon II/Satker,
(7) penetapan output kegiatan berdasarkan core
business unit, (8) penetapan indikator kinerja kagiatan
yang akan dilakukan melalui pendekatan kuantitas,
kualitas dan harga. Hasil restrukturisasi tersebut akan
diberlakukan tahun 2011 untuk seluruh K/L.
Belanja Pemerintah Pusat Menurut FungsiSesuai dengan amanat pasal 11 ayat (5) Undang-undang
Nomor 17 tahun 2003 tentang Keuangan Negara,
alokasi anggaran belanja Pemerintah pusat dalam APBN
dirinci ke dalam 11 fungsi. Pengklasifikasian anggaran
belanja Pemerintah pusat menurut fungsi tersebut
bertujuan untuk menggambarkan tugas Pemerintah
dalam melaksanakan fungsi-fungsi pelayanan dalam
rangka mencapai tujuan pembangunan nasional.
Fungsi-fungsi tersebut mencakup: (1) pelayanan
umum; (2) pertahanan; (3) ketertiban dan keamanan;
(4) ekonomi; (5) lingkungan hidup; (6) perumahan
dan fasilitas umum; (7) kesehatan; (8) pariwisata
dan budaya; (9) agama; (10) pendidikan; dan (11)
perlindungan sosial.
Dalam APBN tahun 2010, alokasi belanja Pemerintah
pusat berdasarkan fungsi masih didominasi oleh
fungsi pelayanan umum sebesar Rp495,3 triliun (68,3
ANGGARAN PENDAPATAN DAN BELANJA NEGARA (APBN) TAHUN 2010 | THE 2010 INDONESIAN BUDGET

77THE INDONESIANBUDGET OVERVIEW 2010
by the general public service function amounting to
Rp495.3 trillion (68.3 percent), followed by education
function at Rp84.1 trillion (11.6 percent), economy
affairs function at Rp57.4 trillion (7.9 percent), defense
function at Rp21.0 trillion (2.9 percent), housing and
communities ammenities function of Rp20.9 trillion
(2.9 percent), health function of Rp18.0 trillion (2.5
percent), public order and safety function of Rp14.9
trillion (2.1 percent), while the rest, Rp13.6 trillion
(1.9 percent), is distributed to other functions, such
as the environmental protection, tourism and culture,
religious affairs and social protection functions.
Further details on the proportion of central government
expenditure by function can be seen in Graphic 3.
persen), yang kemudian diikuti secara berturut-turut
oleh fungsi pendidikan sebesar Rp84,1 triliun (11,6
persen), fungsi ekonomi sebesar Rp57,4 triliun (7,9
persen), fungsi pertahanan sebesar Rp21,0 triliun
(2,9 persen), fungsi perumahan dan fasilitas umum
sebesar Rp20,9 triliun (2,9 persen), fungsi kesehatan
sebesar Rp18,0 triliun (2,5 persen), fungsi ketertiban
dan keamanan sebesar Rp14,9 triliun (2,1 persen),
sedangkan sisanya sebesar Rp13,6 triliun (1,9 persen)
tersebar pada fungsi-fungsi lainnya, seperti fungsi
lingkungan hidup, fungsi pariwisata dan budaya,
fungsi agama dan fungsi perlindungan sosial.
Lebih lanjut mengenai proporsi belanja Pemerintah
pusat menurut fungsi, dapat dilihat pada Grafik 3.
ANGGARAN PENDAPATAN DAN BELANJA NEGARA (APBN) TAHUN 2010 | THE 2010 INDONESIAN BUDGET

78 THE INDONESIANBUDGET OVERVIEW 2010
Central Government Expenditure by TypeBased on Law Number 17 of 2003 regarding State
Finance it is explained that the details of expenditures,
including the central government expenditure
budget, by type of expenditure consists of: personnel
expenditure, material expenditure, capital expenditure,
interest payment, subsidies, grant expenditure, social
assistance, and other expenditures.
The budget allocation for central government
expenditures in the 2010 Budget amounts to Rp725.2
trillion, around 22.1 percent will be allocated for
personnel expenditures, 14.8 percent for material
expenditures, 11.3 percent for capital expenditures,
15.9 percent for interest payment, 21.8 percent for
subsidies, 1.0 percent for grant expenditures, 8.9
percent for social assistance, and 4.2 percent for other
expenditures. From this composition it can be seen
that the allocation of central government expenditures
is still dominated by non-discretionary expenditures,
consisting of personnel expenditure, interest payment,
subsidies and a fraction of the material expenditure.
The rest are discretionary expenditures, namely capital
expenditure, grant expenditure, social assistance, part
of material expenditure, and other expenditures.
Personnel ExpenditureIn the 2010 Budget, the budget allocation for
personnel expenditure is determined to amount to
Belanja Pemerintah Pusat Menurut JenisBerdasarkan Undang-undang Nomor 17 Tahun
2003 tentang Keuangan Negara dijelaskan bahwa
rincian belanja negara termasuk anggaran belanja
Pemerintah pusat menurut jenis belanja terdiri dari
belanja pegawai, belanja barang, belanja modal,
pembayaran bunga utang, subsidi, belanja hibah,
bantuan sosial, dan belanja lain-lain.
Dari alokasi anggaran belanja Pemerintah pusat dalam
APBN 2010 sebesar Rp725,2 triliun, sekitar 22,1
persen akan dialokasikan untuk belanja pegawai,
sekitar 14,8 persen untuk belanja barang, sekitar
11,3 persen untuk belanja modal, sekitar 15,9 persen
untuk pembayaran bunga utang, sekitar 21,8 persen
untuk subsidi, sekitar 1,0 persen untuk belanja hibah,
sekitar 8,9 persen untuk bantuan sosial, dan sekitar
4,2 persen untuk belanja lain-lain. Dari komposisi
tersebut, terlihat bahwa alokasi belanja pemerintah
pusat masih didominasi oleh pengeluaran yang sifatnya
wajib (non discretionary expenditure), yang meliputi
belanja pegawai, pembayaran bunga utang, subsidi,
dan sebagian belanja barang. Sedangkan sisanya
merupakan belanja tidak mengikat (discretionary
expenditure), yaitu belanja modal, belanja hibah,
bantuan sosial, sebagian belanja barang dan belanja
lain-lain.
Belanja PegawaiDalam APBN tahun 2010, alokasi anggaran untuk
belanja pegawai ditetapkan sebesar Rp160,4 triliun
ANGGARAN PENDAPATAN DAN BELANJA NEGARA (APBN) TAHUN 2010 | THE 2010 INDONESIAN BUDGET

79THE INDONESIANBUDGET OVERVIEW 2010
Rp160.4 trillion or 2.7 percent of the GDP. This means
an increase of Rp26.7 trillion or 19.9 percent compared
to the estimated realization of personnel expenditure in
2009 of Rp133.7 trillion (2.5 percent of the GDP). This
is mainly related to various policy measures taken by
the Government within the framework of bureaucratic
reform, both in improving and maintaining the
welfare of the government apparatus and retirees and
in enhancing public service quality. The increase of
the budget allocation for the personnel expenditure
in 2010 occurs in all personnel expenditure items,
namely budget allocation for salaries and allowance
expenditures, budget allocations for honorariums,
vacations, overtime work, etc, and budget allocations
for social contributions.
Material ExpenditureThe budget allocation for material expenditure in the
2010 Budget is determined to amount to Rp107.1
trillion or 1.8 percent of the GDP. This means an
increase of Rp21.6 trillion or 25.3 percent compared to
the estimated realization of the material expenditure
budget in 2009 of Rp85.5 trillion (1.6 percent of the
GDP). The budget allocation for material expenditure
is mainly directed towards: (1) maintaining the
smooth implementation of Government operational
activity, services to the public, and asset maintenance,
including the provision of operational expenditures for
new working units; and (2) provision of funds for travel
costs in order to support main duties. Furthermore,
the budget allocation for material expenditures has
atau 2,7 persen terhadap PDB. Jumlah ini berarti
mengalami peningkatan sebesar Rp26,7 triliun atau
19,9 persen bila dibandingkan dengan perkiraan
realisasi belanja pegawai dalam tahun 2009 sebesar
Rp133,7 triliun (2,5 persen terhadap PDB). Hal
ini terutama berkaitan dengan berbagai langkah
kebijakan yang diambil Pemerintah dalam kerangka
reformasi birokrasi, baik dalam memperbaiki dan
menjaga kesejahteraan aparatur Pemerintah dan
pensiunan maupun dalam meningkatkan kualitas
pelayanan publik. Peningkatan alokasi anggaran
belanja pegawai dalam tahun 2010 tersebut, terjadi
pada semua pos belanja pegawai yaitu alokasi
anggaran untuk belanja gaji dan tunjangan, alokasi
anggaran untuk honorarium, vakasi, lembur dan lain-
lain, serta alokasi anggaran untuk kontribusi sosial.
Belanja BarangAlokasi anggaran belanja barang dalam APBN tahun
2010 ditetapkan sebesar Rp107,1 triliun atau 1,8
persen terhadap PDB. Jumlah ini, berarti mengalami
peningkatan sebesar Rp21,6 triliun atau 25,3 persen
bila dibandingkan dengan perkiraan realisasi anggaran
belanja barang dalam tahun 2009 sebesar Rp85,5
triliun (1,6 persen terhadap PDB). Alokasi anggaran
belanja barang tersebut, terutama diarahkan untuk:
(1) menjaga kelancaran penyelenggaraan kegiatan
operasional Pemerintahan, pelayanan kepada
masyarakat, dan pemeliharaan aset, termasuk
penyediaan belanja operasional bagi satuan kerja
baru; dan (2) penyediaan dana untuk biaya perjalanan
dalam rangka mendukung tugas pokok. Di samping
ANGGARAN PENDAPATAN DAN BELANJA NEGARA (APBN) TAHUN 2010 | THE 2010 INDONESIAN BUDGET

80 THE INDONESIANBUDGET OVERVIEW 2010
also taken into account efficiency carried out by the
Government in the maintenance of state assets/
properties, and an incremental increase by considering
the inflation rate. The material expenditure budget
in the 2010 Budget is allocated for material and
services expenditures, maintenance expenditures,
travel expenditures, and Public Service Agency (BLU)
expenditures.
Capital ExpenditureIn order to support the achievement of the development
objectives in accordance with the development policy
direction, theme and priorities in the 2010 RKP, the
budget allocation for capital expenditures in the 2010
Budget is determined to amount to Rp82.2 trillion or
1.4 percent of the GDP. This is an increase of Rp8.8
trillion or 12.0 percent compared to the estimated
realization of the capital expenditure budget in 2009 of
Rp73.4 trillion (1.4 percent of the GDP). The increased
budget allocation for capital expenditures in the 2010
Budget is in line with the effort to accelerate quality
economic growth that is carried out through: (1) the
provision of basic infrastructure development (roads,
bridges, ports, power plants) to support the targeted
achievement of economic growth and improvement
of public welfare; (2) the provision of infrastructure
development in the field of agriculture (irrigation, land
optimizing/conservation/reclamation, and agribusiness
development) to support the achievement of the food
security program; (3) infrastructure development
in regard to post-natural disaster rehabilitation and
itu, alokasi anggaran belanja barang juga telah
memperhitungkan efisiensi yang dilaksanakan oleh
Pemerintah dalam pemeliharaan aset/barang milik
negara, serta kenaikan secara incremental dengan
mempertimbangkan tingkat inflasi. Alokasi anggaran
belanja barang dalam APBN tahun 2010 tersebut
dialokasikan untuk anggaran belanja barang dan jasa,
belanja pemeliharaan, belanja perjalanan, dan belanja
Badan Layanan Umum (BLU).
Belanja ModalDalam rangka mendukung tercapainya sasaran-
sasaran pembangunan sesuai dengan arah kebijakan,
tema dan prioritas pembangunan dalam RKP tahun
2010, alokasi anggaran belanja modal dalam APBN
tahun 2010 ditetapkan mencapai Rp82,2 triliun atau
1,4 persen terhadap PDB. Jumlah ini, mengalami
peningkatan sebesar Rp8,8 triliun, atau 12,0 persen
bila dibandingkan dengan perkiraan realisasi anggaran
belanja modal tahun 2009 sebesar Rp73,4 triliun (1,4
persen terhadap PDB). Peningkatan alokasi anggaran
belanja modal dalam APBN tahun 2010 tersebut,
sejalan dengan upaya percepatan pertumbuhan
ekonomi yang berkualitas yang dilakukan antara lain
melalui: (1) penyediaan pembangunan infrastruktur
dasar (jalan, jembatan, pelabuhan, pembangkit
tenaga listrik) untuk mendukung pencapaian target
pertumbuhan ekonomi dan perbaikan kesejahteraan
rakyat; (2) penyediaan pembangunan infrastruktur
pertanian (irigasi, optimalisasi/konservasi/ reklamasi
lahan, dan pengembangan agrobisnis) untuk
mendukung pencapaian program ketahanan pangan;
ANGGARAN PENDAPATAN DAN BELANJA NEGARA (APBN) TAHUN 2010 | THE 2010 INDONESIAN BUDGET

81THE INDONESIANBUDGET OVERVIEW 2010
reconstruction, and Sidoarjo mud management; and
(4) priority given to fund multi-year activities in order
to support financing sustainability.
Interest PaymentBy considering several variables that are the basis
for calculation, including: (1) assumption of rupiah
exchange rate against US dollar, (2) the 3-month
SBI rate and London Interbank Offered Rate (LIBOR);
(3) outstanding debt; and (4) estimated new debt
in 2010, then in the budget allocation for interest
payment in the 2010 Budget is planned to reach
Rp115.6 trillion (1.9 percent of the GDP). The planned
interest payment in the 2010 Budget is an increase
of Rp6.0 trillion or 5.5 percent compared to the
estimated realization of interest payment in 2009 of
Rp109.6 trillion (2.0 percent of the GDP).
From the planned interest payment in the 2010
Budget amounting to Rp115.6 trillion, around 67.0
percent or Rp77.4 trillion (1.3 percent of the GDP) is
for the payment of domestic debt interest, while the
remaining 33.0 percent or Rp38.2 trillion is for the
payment of foreign debt interest. Compared to the
estimated realization of payment of domestic debt
interest in 2009 amounting to Rp70.7 trillion, the
payment of domestic debt interest in the 2010 Budget
increased Rp6.7 trillion or 9.5 percent. This increase is
mainly due to increased financing needs, the sources
(3) pengembangan infrastruktur dalam rangka
rehabilitasi dan rekonstruksi paska bencana alam, dan
penanggulangan lumpur Sidoarjo; serta (4) prioritas
diberikan untuk pendanaan kegiatan multiyears guna
mendukung kesinambungan pembiayaan.
Pembayaran Bunga UtangDengan memperhitungkan beberapa variabel yang
mendasari perhitungannya, antara lain: (1) asumsi
nilai tukar rupiah terhadap dolar Amerika, (2) tingkat
suku bunga SBI 3 bulan dan tingkat bunga London
Interbank Offered Rate (LIBOR); (3) outstanding
utang; serta (4) perkiraan pinjaman baru dalam tahun
2010, maka alokasi anggaran untuk pembayaran
bunga utang dalam APBN tahun 2010 direncanakan
mencapai Rp115,6 triliun (1,9 persen terhadap PDB).
Rencana pembayaran bunga utang dalam APBN tahun
2010 tersebut, berarti lebih tinggi Rp6,0 triliun, atau
5,5 persen apabila dibandingkan dengan perkiraan
realisasi pembayaran bunga utang dalam tahun 2009
sebesar Rp109,6 triliun (2,0 persen terhadap PDB).
Dari rencana pembayaran bunga utang dalam APBN
tahun 2010 sebesar Rp115,6 triliun tersebut, sekitar
67,0 persen atau sebesar Rp77,4 triliun (1,3 persen
terhadap PDB) merupakan pembayaran bunga utang
dalam negeri, sedangkan sisanya sebesar 33,0 persen
atau Rp38,2 triliun merupakan pembayaran bunga
utang luar negeri. Pembayaran bunga utang dalam
negeri dalam APBN tahun 2010 tersebut apabila
dibandingkan dengan perkiraan realisasi pembayaran
bunga utang dalam negeri dalam tahun 2009 sebesar
Rp70,7 triliun, berarti menunjukkan peningkatan
ANGGARAN PENDAPATAN DAN BELANJA NEGARA (APBN) TAHUN 2010 | THE 2010 INDONESIAN BUDGET

82 THE INDONESIANBUDGET OVERVIEW 2010
of which are from domestic loans, especially from the
issuance of domestic Government Securities (SBN)
supported by standby loans. Meanwhile, payment of
foreign debt interest in the 2010 Budget is planned to
reach Rp38.2 trillion (0.7 percent of the GDP), meaning
a decrease of Rp0.7 trillion or 1.9 percent compared
to the estimated realization on the payment of foreign
debt interest in 2009 of Rp38.9 trillion (0.7 percent of
the GDP). This lower payment of foreign debt interest
is mainly due to a strengthened estimation of the
average rupiah exchange rate against the US dollar,
from an average of Rp10,600/US$1 in 2009 to an
estimated average of Rp.10,000/US$1 in 2010.
Subsidy ExpenditureIn the 2010 Budget, the budget allocation for subsidy
expenditure is planned to reach Rp157.8 trillion (2.6
percent of the GDP), which means a decrease of Rp0.3
trillion or 0.2 percent compared to the estimated
realization of subsidy expenditure in 2009 of Rp158.1
trillion. Most of the overall budget allocations for
subsidy expenditures in the 2010 Budget are planned
to be channeled to energy subsidies, namely fuel
subsidies of Rp68.7 trillion (43.5 percent) and electricity
subsidies of Rp37.8 trillion (24.0 percent), while the
remaining 32.5 percent will be channeled for non-
energy subsidies, namely: (1) a food subsidy of Rp11.4
trillion; (1) fertilizer subsidy of Rp14.8 trillion; (3) seed
sebesar Rp6,7 triliun, atau 9,5 persen. Peningkatan
tersebut terutama disebabkan oleh meningkatnya
kebutuhan pembiayaan yang bersumber dari utang
dalam negeri terutama dari penerbitan SBN dalam
negeri yang didukung dengan pinjaman siaga.
Sementara itu, pembayaran bunga utang luar negeri
dalam APBN tahun 2010 direncanakan mencapai
Rp38,2 triliun (0,7 persen PDB), yang berarti lebih
rendah Rp0,7 triliun atau 1,9 persen bila dibandingkan
dengan perkiraan realisasi pembayaran bunga utang
luar negeri dalam tahun 2009 sebesar Rp38,9 triliun
(0,7 persen PDB). Lebih rendahnya pembayaran bunga
utang luar negeri tersebut terutama disebabkan oleh
menguatnya perkiraan rata-rata nilai tukar rupiah
terhadap dolar Amerika Serikat yakni dari rata-rata
Rp10.600/US$1 dalam tahun 2009 dan diperkirakan
menjadi rata-rata Rp10.000/US$1 pada tahun 2010.
Belanja SubsidiDalam APBN 2010, alokasi anggaran belanja untuk
subsidi direncanakan mencapai Rp157,8 triliun (2,6
persen terhadap PDB), yang berarti turun sebesar
Rp0,3 triliun atau 0,2 persen bila dibandingkan
dengan perkiraan realisasi anggaran belanja subsidi
dalam tahun 2009 sebesar Rp158,1 triliun. Sebagian
besar dari keseluruhan alokasi anggaran belanja
subsidi dalam APBN tahun 2010 direncanakan akan
disalurkan untuk subsidi energi, yaitu subsidi BBM
sebesar Rp68,7 triliun (43,5 persen), dan subsidi
listrik sebesar Rp37,8 triliun (24,0 persen), sedangkan
sisanya, yaitu sebesar 32,5 persen akan disalurkan
untuk subsidi non-energi, yaitu: (1) subsidi pangan
ANGGARAN PENDAPATAN DAN BELANJA NEGARA (APBN) TAHUN 2010 | THE 2010 INDONESIAN BUDGET

83THE INDONESIANBUDGET OVERVIEW 2010
subsidy of Rp1.6 trillion; (4) public service obligation
(PSO) assistance/subsidy of Rp1.4 trillion; (5) subsidy
for program loan interest of Rp5.3 trillion; and (6) a
tax subsidy of Rp16.9 trillion.
Grant ExpenditureIn the 2010 Budget, the budget allocation for grant
expenditures is determined to amount to Rp7,192.0
billion. This means an increase of Rp7,160.6 billion
compared to the estimated realization of grant
expenditure in 2009 of Rp31.6 billion. The budget
allocation for grant expenditures in the 2010 Budget
includes sub-grants to Regional Governments in
the development of the Jakarta Mass Rapid Transit
(MRT) Project amounting to Rp34.4 billion, grants for
elementary education of Rp57.6 billion, and Central
Government grants to Regional Governments of
Rp7.1 trillion. The signing of a Sub-Grant Agreement
(naskah perjanjian penerusan hibah/NPPH) has been
carried out between the government and the Japan
International Cooperation Agency (JICA) on 25 March
2009, while the source of the JICA loan is LA No. IP-
536.
Social AssistanceIn the 2010 Budget, budget allocation for social
assistance is determined to amount to Rp64.3 trillion
or 1.1 percent of the GDP. This means a decrease
of Rp13.6 trillion or 17.5 percent compared to the
estimated realization of social assistance in 2009 of
sebesar Rp11,4 triliun; (2) subsidi pupuk sebesar
Rp14,8 triliun; (3) subsidi benih sebesar Rp1,6 triliun;
(4) bantuan/subsidi public service obligation (PSO)
sebesar Rp1,4 triliun; (5) subsidi bunga kredit program
sebesar Rp5,3 triliun; dan (6) subsidi pajak sebesar
Rp16,9 triliun.
Belanja HibahDalam APBN tahun 2010, alokasi anggaran belanja
hibah ditetapkan sebesar Rp7.192,0 miliar. Jumlah ini,
berarti mengalami peningkatan sebesar Rp7.160,6
miliar bila dibandingkan dengan perkiraan realisasi
anggaran belanja hibah dalam tahun 2009 sebesar
Rp31,6 miliar. Alokasi anggaran belanja hibah dalam
APBN tahun 2010 tersebut antara lain, merupakan
penerusan hibah kepada Pemerintah Daerah dalam
rangka pembangunan Jakarta Mass Rapid Transit
(MRT) Project sebesar Rp34,4 miliar, hibah untuk
pendidikan dasar Rp57,6 miliar, dan hibah Pemerintah
Pusat kepada Pemerintah daerah Rp7,1 triliun.
Penandatanganan naskah perjanjian penerusan hibah
(NPPH) telah dilakukan oleh Pemerintah dengan Japan
International Cooperation Agency (JICA) pada tanggal
25 Maret 2009 dengan sumber dari pinjaman JICA LA
No. IP-536.
Bantuan SosialDalam APBN tahun 2010, alokasi anggaran bantuan
sosial ditetapkan sebesar Rp64,3 triliun atau 1,1
persen terhadap PDB. Jumlah ini, berarti mengalami
penurunan sebesar Rp13,6 triliun atau 17,5 persen
bila dibandingkan dengan perkiraan realisasi bantuan
ANGGARAN PENDAPATAN DAN BELANJA NEGARA (APBN) TAHUN 2010 | THE 2010 INDONESIAN BUDGET

84 THE INDONESIANBUDGET OVERVIEW 2010
Rp77.9 trillion (1.4 percent of the GDP). This budget
allocation consists of: (1) fund allocation for natural
disaster management amounting to Rp3.0 trillion, and
(2) a social assistance allocation that is channeled to
the public through various K/Ls amounting to Rp61.3
trillion.
Other ExpendituresThe budget allocation for other expenditure in the
2010 Budget is determined to amount to Rp30.7
trillion or 0.5 percent of the GDP. This means a
decrease of Rp22.6 trillion or 42.4 percent compared
to the estimated realization of other expenditures
in 2009 of Rp53.3 trillion (1.0 percent of the GDP).
The lower budget allocation for other expenditures in
2010 compared to the estimated realization in 2009
is on account of the fund allocation for the general
elections and the Direct Cash Assistance (BLT) no
longer being accommodated in the 2010 Budget.
The budget allocation for other expenditures in 2010
consists of: (1) a fiscal risk reserve fund amounting to
Rp8.6 trillion; and (2) other expenditures of Rp22.1
trillion.
Further details about the proportion of Central
government expenditures by type can be seen in
Graphic 4.
sosial dalam tahun 2009 sebesar Rp77,9 triliun (1,4
persen terhadap PDB). Alokasi anggaran bantuan
sosial dalam tahun 2010 tersebut, terdiri dari: (1)
alokasi dana penanggulangan bencana alam sebesar
Rp3,0 triliun, dan (2) alokasi bantuan sosial yang
disalurkan kepada masyarakat melalui berbagai K/L
sebesar Rp61,3 triliun.
Belanja Lain-lainAlokasi anggaran belanja lain-lain dalam APBN tahun
2010 ditetapkan sebesar Rp30,7 triliun, atau 0,5
persen terhadap PDB. Jumlah ini, berarti mengalami
penurunan sebesar Rp22,6 triliun, atau 42,4 persen
bila dibandingkan dengan perkiraan realisasi anggaran
belanja lain-lain dalam tahun 2009 sebesar Rp53,3
triliun (1,0 persen terhadap PDB). Lebih rendahnya
alokasi anggaran belanja lain-lain dalam tahun 2010
tersebut dibandingkan dengan perkiraan realisasinya
dalam tahun 2009, berkaitan dengan tidak lagi
ditampungnya alokasi pendanaan untuk Pemilu dan
bantuan langsung tunai (BLT) yang dalam tahun 2009
menyerap anggaran cukup besar. Alokasi anggaran
belanja lain-lain dalam tahun 2010 tersebut terdiri
dari: (1) dana cadangan risiko fiskal sebesar Rp8,6
triliun; dan (2) belanja lainnya Rp22,1 triliun.
Lebih lanjut mengenai proporsi belanja Pemerintah
pusat menurut jenis, dapat dilihat pada Grafik 4.
ANGGARAN PENDAPATAN DAN BELANJA NEGARA (APBN) TAHUN 2010 | THE 2010 INDONESIAN BUDGET

85THE INDONESIANBUDGET OVERVIEW 2010
Transfers to Regions
The policy on Transfers to Regions in 2010 will be
focused on: (1) reducing the fiscal imbalance between
central and regional governments (vertical fiscal
imbalance) and among regions (horizontal fiscal
imbalance); (2) improving the quality of public services
in the regions and reducing public service imbalances
among regions; (3) supporting fiscal sustainability
in respect to macroeconomic policy; (4) improving
regional capacity in eliciting regional economic
potentials; (5) increasing efficiency in the utilization of
national resources; and (6) improving synchronization
between the national development plan and regional
development plans.
In order to support the policy direction of the Transfers
Transfer ke Daerah
Kebijakan Transfer ke Daerah pada tahun 2010 akan
lebih dipertajam untuk: (1) mengurangi kesenjangan
fiskal antara pusat dan daerah (vertical fiscal imbalance)
dan antardaerah (horizontal fiscal imbalance); (2)
meningkatkan kualitas pelayanan publik di daerah
dan mengurangi kesenjangan pelayanan publik
antardaerah; (3) mendukung kesinambungan fiskal
nasional (fiscal sustainability) dalam rangka kebijakan
ekonomi makro; (4) meningkatkan kemampuan
daerah dalam menggali potensi ekonomi daerah; (5)
meningkatkan efisiensi pemanfaatan sumber daya
nasional; serta (6) meningkatkan sinkronisasi antara
rencana pembangunan nasional dengan rencana
pembangunan daerah.
Guna mendukung arah kebijakan Transfer ke Daerah
ANGGARAN PENDAPATAN DAN BELANJA NEGARA (APBN) TAHUN 2010 | THE 2010 INDONESIAN BUDGET

86 THE INDONESIANBUDGET OVERVIEW 2010
to Regions, the budget allocation for Transfers to
Regions in the 2010 Budget is planned to amount to
Rp322.4 trillion or 5.3 percent of the GDP. Nominally,
this is an increase of Rp13.1 trillion or 4.2 percent
compared to the estimated realization of Transfers to
Regions in the 2009 Revised Budget of Rp309.3 trillion.
From the total amount of Transfers to Regions in the
2010 Budget, around 95.9 percent is for the balance
fund allocation, and the remaining approximately 4.1
percent is for special autonomy and the adjustment
fund.
Balance FundIn the 2010 Budget, the balance fund allocation is
planned to amount to Rp306.02 trillion or 5.1 percent
of the GDP. Nominally, this is an increase of Rp20.97
trillion or 7.36 percent compared to the estimated
realization of the balance fund in the 2009 Revised
Budget of Rp285.0 trillion. From the total balance
fund allocation, 26.6 percent is the revenue sharing
fund, 66.5 percent is the general allocation fund, and
6.9 percent is the specific allocation fund.
Revenue Sharing FundIn the 2010 Budget, the allocation for the revenue
sharing fund (RSF) is planned to reach Rp81.4 trillion
(1.3 percent of the GDP), or Rp7.6 trillion higher
than the RSF realization in the 2009 Revised Budget
of Rp73.8 trillion (1.3 percent of the GDP). The RSF
tersebut, dalam APBN tahun 2010, alokasi anggaran
Transfer ke Daerah direncanakan sebesar Rp322,4
triliun atau 5,3 persen terhadap PDB. Secara nominal,
jumlah tersebut berarti mengalami kenaikan Rp13,1
triliun atau 4,2 persen dari realisasi anggaran Transfer
ke Daerah yang diperkirakan dalam APBN-P tahun
2009 sebesar Rp309,3 triliun. Dari jumlah alokasi
anggaran Transfer ke Daerah dalam APBN tahun
2010 tersebut, sekitar 95,9 persen merupakan
alokasi dana perimbangan, dan sisanya sekitar 4,1
persen merupakan alokasi dana otonomi khusus dan
penyesuaian.
Dana PerimbanganDalam APBN tahun 2010, alokasi dana perimbangan
direncanakan sebesar Rp306,02 triliun atau 5,1 persen
terhadap PDB. Secara nominal, jumlah tersebut berarti
mengalami peningkatan sebesar Rp20,97 triliun atau
7,36 persen dari realisasi dana perimbangan yang
diperkirakan dalam APBN-P tahun 2009 sebesar
Rp285,0 triliun. Dari jumlah alokasi dana perimbangan
tersebut, sebesar 26,6 persen merupakan dana bagi
hasil, sebesar 66,5 persen merupakan dana alokasi
umum, dan sebesar 6,9 persen merupakan dana
alokasi khusus.
Dana Bagi Hasil (DBH)Dalam APBN 2010, alokasi DBH direncanakan
mencapai Rp81,4 triliun (1,3 persen terhadap PDB),
atau secara nominal lebih tinggi Rp7,6 triliun dari
realisasi DBH yang diperkirakan dalam APBN-P tahun
2009 sebesar Rp73,8 triliun (1,3 persen terhadap
ANGGARAN PENDAPATAN DAN BELANJA NEGARA (APBN) TAHUN 2010 | THE 2010 INDONESIAN BUDGET

87THE INDONESIANBUDGET OVERVIEW 2010
allocation in 2010 consists of a Tax RSF allocation of
57.6 percent and a natural resource RSF allocation of
42.4 percent.
Based on the tax revenue sharing plan, and by taking
into account the applicable provisions regarding Tax
RSF, the Tax RSF allocation in the 2010 Budget is
planned to reach Rp46.9 trillion (0.8 percent of the
GDP), or Rp8.3 trillion higher than the estimated
realization of Tax RSF in the 2009 Revised Budget of
Rp38.6 trillion.
In line with the revenues from oil and gas natural
resources, general mining natural resources, forestry
natural resources, and fishery natural resources,
and by taking into account the provision of revenue
sharing of natural resources, then in the 2010 Budget
the allocation for natural resource RSF is planned to be
Rp34.5 trillion, including part of the underpaid oil and
gas RSF of 2008 amounting to Rp2.0 trillion, or Rp0.8
trillion lower than the estimated realization of natural
resource RSF in the 2009 Revised Budget of Rp35.3
trillion. The lower natural resource RSF allocation in
the 2010 Proposed Budget is due to a lower target for
oil and gas revenue sharing.
General Allocation Fund (DAU)The DAU allocation in the 2010 Budget is planned
to be 26 percent of the NDP or Rp192.5 trillion (3.2
percent of the GDP). This is an increase of Rp6.1 trillion
compared to the 2009 DAU allocation of Rp186.4
trillion. From the DAU allocation in the 2010 Budget,
PDB). Alokasi DBH tahun 2010 tersebut terdiri dari
alokasi DBH Pajak sebesar 57,6 persen dan alokasi
DBH SDA sebesar 42,4 persen.
Berdasarkan pada rencana penerimaan perpajakan
yang dibagihasilkan, dan memperhatikan ketentuan-
ketentuan mengenai DBH Pajak yang berlaku, maka
alokasi DBH Pajak dalam APBN 2010 direncanakan
mencapai Rp46,9 triliun (0,8 persen terhadap PDB),
atau lebih tinggi Rp8,3 triliun dari realisasi DBH Pajak
dalam APBN-P 2009 yang diperkirakan sebesar
Rp38,6 triliun.
Sejalan dengan penerimaan yang berasal dari SDA
minyak bumi dan gas bumi, SDA pertambangan
umum, SDA kehutanan, dan SDA perikanan, serta
dengan memperhatikan ketentuan pembagian
DBH SDA tersebut, maka dalam APBN tahun 2010,
alokasi DBH SDA direncanakan sebesar Rp34,5 triliun,
termasuk sebagian kurang bayar DBH migas tahun
2008 sebesar Rp2,0 triliun, atau lebih rendah Rp0,8
triliun dari realisasi DBH SDA dalam APBN-P tahun
2009, yang diperkirakan sebesar Rp35,3 triliun.
Lebih rendahnya alokasi DBH SDA dalam RAPBN
2010 tersebut disebabkan oleh lebih rendahnya
target penerimaan minyak bumi dan gas bumi yang
dibagihasilkan.
Dana Alokasi Umum (DAU)Alokasi DAU dalam APBN 2010 direncanakan
sebesar 26 persen dari PDN neto, atau mencapai
Rp192,5 triliun (3,2 persen terhadap PDB). Jumlah
tersebut, secara nominal lebih tinggi Rp6,1 triliun jika
dibandingkan dengan alokasi DAU dalam tahun 2009
ANGGARAN PENDAPATAN DAN BELANJA NEGARA (APBN) TAHUN 2010 | THE 2010 INDONESIAN BUDGET

88 THE INDONESIANBUDGET OVERVIEW 2010
Rp19.2 trillion (10 percent of total national DAU) will
be distributed to provinces and Rp173.2 trillion (90
percent of total national DAU) will be distributed
to districts/cities. The 2009 DAU allocation will be
transferred to regional funds in the beginning of every
month, amounting to 1/12 of the total allocation.
Specific Allocation Fund (DAK)The DAK allocation in the 2010 Budget is planned to
amount Rp21.1 trillion (0.3 percent of the GDP), which
means a decrease of Rp3.7 trillion or 14.9 percent
from the DAK allocation in the 2009 Revised Budget
of Rp24.8 trillion. In the 2010 Proposed Budget, there
is planned budget reallocation from the Ministry of
Marine Affairs and Fisheries to Marine Affairs and
Fisheries DAK amounting to Rp275.0 billion, from
the Ministry of Underdeveloped Areas Development
to Rural Facilities and Infrastructure DAK amounting
to Rp100 billion, and from the Ministry of Agriculture
amounting to Rp200.0 billion.
Special Autonomy and Adjustment FundThe implementation of the special autonomy fund
is a mandate of Law Number 35 of 2008 regarding
the Enactment of Government Regulation in Lieu of
Law Number 1 of 2008 regarding the Amendment
to Law Number 21 of 2001 regarding Special
Autonomy for Papua Province and Law Number 11
of 2006 regarding the Aceh Government. In the 2009
sebesar Rp186,4 triliun. Alokasi DAU dalam APBN
2010 tersebut, sebesar Rp19,2 triliun (10 persen dari
total DAU nasional) akan didistribusikan untuk provinsi
dan sebesar Rp173,2 triliun (90 persen dari total DAU
nasional) akan didistribusikan kepada kabupaten/
kota. Alokasi DAU tahun 2009 akan ditransfer ke kas
daerah setiap awal bulan sebesar 1/12 dari besaran
alokasi.
Dana Alokasi Khusus (DAK)Alokasi DAK dalam APBN 2010 direncanakan sebesar
Rp21,1 triliun (0,3 persen terhadap PDB), yang
berarti turun sebesar Rp3,7 triliun atau 14,9 persen
dari alokasi DAK dalam APBN-P tahun 2009 sebesar
Rp24,8 triliun. Dalam RAPBN 2010, direncanakan ada
pengalihan anggaran dari Kementerian Kelautan dan
Perikanan ke DAK bidang Kelautan dan Perikanan
sebesar Rp275,0 miliar, dari Kementerian Negara
Pembangunan Daerah Tertinggal ke DAK bidang
Sarana dan Prasarana Perdesaan sebesar Rp100 miliar,
serta dari Kementerian Pertanian sebesar Rp200,0
miliar.
Dana Otonomi Khusus dan PenyesuaianImplementasi Dana Otsus merupakan amanat dari UU
Nomor 35 Tahun 2008 tentang Penetapan Perpu Nomor
1 Tahun 2008 tentang Perubahan atas UU Nomor 21
Tahun 2001 tentang Otonomi Khusus bagi Provinsi
Papua menjadi undang-undang dan UU Nomor 11
Tahun 2006 tentang Pemerintahan Aceh. Dalam APBN
2009, dialokasikan Dana Otonomi Khusus sebesar 2
ANGGARAN PENDAPATAN DAN BELANJA NEGARA (APBN) TAHUN 2010 | THE 2010 INDONESIAN BUDGET

89THE INDONESIANBUDGET OVERVIEW 2010
Budget, 2 percent of the Special Autonomy Fund is
allocated from the national DAU to Papua and West
Papua Provinces, the utilization of which is prioritized
for education and health, and 2 percent of national
DAU for the NAD Province, the utilization of which
is directed to fund infrastructure development and
maintenance, empowerment of the people’s economy,
poverty alleviation, and funding for education, social
and health needs. In addition to this, in regard to
the implementation of special autonomy in Papua
and West Papua Provinces, additional funds are also
allocated for infrastructure, the amount of which is
agreed upon by the Government and the DPR, and
the utilization of which is prioritized for infrastructure
development. In this connection, the allocation of the
Special Autonomy Fund in the 2010 Budget is planned
to be around Rp9.1 trillion.
The proportion of transfers to regions can be seen in
Graphic 5.
Next, the amount of the expenditure budget in 2009
persen dari DAU nasional untuk Provinsi Papua dan
Papua Barat, yang penggunaannya diutamakan untuk
pendanaan pendidikan dan kesehatan, dan 2 persen
dari DAU nasional untuk Provinsi NAD, yang diarahkan
penggunaannya untuk mendanai pembangunan dan
pemeliharaan infrastruktur, pemberdayaan ekonomi
rakyat, pengentaskan kemiskinan, serta pendanaan
pendidikan, sosial, dan kesehatan. Di samping
itu, dalam rangka pelaksanaan otonomi khusus
kepada Provinsi Papua dan Provinsi Papua Barat juga
dialokasikan dana tambahan untuk infrastruktur, yang
besarannya disepakati antara Pemerintah dengan
DPR, yang penggunaannya diutamakan untuk
pendanaan pembangunan infrastruktur. Berkaitan
dengan hal tersebut, alokasi Dana Otsus dalam APBN
2010 direncanakan sekitar Rp9,1 triliun.
Mengenai proporsi transfer ke daerah, dapat dilihat
pada Grafik 5.
Selanjutnya, mengenai besaran anggaran belanja
ANGGARAN PENDAPATAN DAN BELANJA NEGARA (APBN) TAHUN 2010 | THE 2010 INDONESIAN BUDGET

90 THE INDONESIANBUDGET OVERVIEW 2010
negara tahun 2009 dan 2010 dapat dilihat pada
Tabel 4.
Pembiayaan Defisit AnggaranDalam tahun 2010, defisit APBN ditargetkan
sebesar Rp98,0 triliun atau 1,6 persen terhadap
PDB. Defisit tersebut akan dibiayai dari pembiayaan
and 2010 can be seen in Table 4.
Budget Deficit FinancingIn 2010, The Indonesian Budget deficit is targeted
to amount Rp98.0 trillion or 1.6 percent of the GDP.
The deficit will be financed from debt and non-debt
Table 4Expenditure, 2009-2010
(trillion Rupiah)
Item
2009 2010
Revised Budget
% to GDP
Budget% to GDP
I. Central Government Expenditure 691.5 12.8 725.2 12.1 1. Personnel Expenditure 133.7 2.5 160.4 2.7 2. Material Expenditure 85.5 1.6 107.1 1.8 3. Capital Expenditure 73.4 1.4 82.2 1.4 4. Interest Payment 109.6 2.0 115.6 1.9 5. Subsidy 158.1 2.9 157.8 2.6 6. Grant Expenditure 0.0 0.0 7.2 0.1 7. Social Assistance 77.9 1.4 64.3 1.1 8. Other Expenditure 53.3 1.0 30.7 0.5 II. Transfer to Regional 309.3 5.7 322.4 5.4 1. Balance Fund 285.1 5.3 306.0 5.1 a. Revenue Sharing Fund 73.8 1.4 81.4 1.4 b. General Allocation Fund 186.4 3.5 203.5 3.4 c. Specific Allocation Fund 24.8 0.5 21.1 0.4 2. Special Autonomy and Adjustment Fund 24.3 0.4 16.4 0.3 a. Special Autonomy Fund 9.5 0.2 9.1 0.2 b. Adjustment Fund 14.7 0.3 7.3 0.1
Source: Ministry of Finance
ANGGARAN PENDAPATAN DAN BELANJA NEGARA (APBN) TAHUN 2010 | THE 2010 INDONESIAN BUDGET

91THE INDONESIANBUDGET OVERVIEW 2010
financing with a composition of 2.5 percent non-
debt (Rp2.5 trillion) and 97.5 percent debt (Rp95.5
trillion).
.
Non-Debt FinancingSources of non-debt financing in 2010 are a little bit
different from the sources of financing in previous
years. In 2010, domestic banking financing from
the Accumulated Budget Surplus (SAL) is planned
to be just Rp1.0 trillion, considering SAL utilization’s
high need for cash in the beginning of the year.
Furthermore, financing through the reforestation fund
is planned to be Rp0.6 trillion, the same amount as
the budget in the 2009 Revised Budget. Meanwhile
financing through SOE privatization is not planned to
be budgeted due to financial market conditions that
are not yet fully conducive.
Therefore, budget financing from non-debt sources
in the 2010 Budget is planned to be Rp2.5 trillion or
2.5 percent of the total planned budget financing
of Rp98.0 trillion. This shows that non-debt budget
financing in the 2010 Budget is decreasing around
Rp40.7 trillion or 94.2 percent compared to the target
in the 2009 Revised Budget of Rp43.2 trillion. Non-
debt budget financing in the 2010 Budget consists of:
(1) domestic banking through RDI of Rp5.5 trillion, (2)
asset management proceeds of Rp1.2 trillion, and (3)
Government investment fund and SOE restructuring
of negative Rp3.9 trillion, (4) a contingency fund of
Rp1.1 trillion, and (5) financing reserves of Rp0.9
trillion.
yang bersumber dari utang dan nonutang dengan
komposisi 2,5 persen nonutang (Rp2,5 triliun) dan
97,5 persen dari utang (Rp95,5 triliun).
Pembiayaan Non UtangSumber pembiayaan nonutang pada tahun 2010
tersebut sedikit berbeda dibandingkan dengan
pembiayaan tahun-tahun sebelumnya. Pada tahun
2010, pembiayaan perbankan dalam negeri yang
bersumber dari Sisa Anggaran Lebih (SAL) direncanakan
hanya sebesar Rp1,0 triliun mengingat besarnya
kebutuhan penggunaan SAL untuk kebutuhan kas
pada awal tahun. Selain itu, pembiayaan melalui
dana reboisasi direncanakan sebesar Rp0,6 triliun
sama besarnya seperti anggaran pada APBN-P 2009.
Sementara itu pembiayaan melalui privatisasi BUMN
direncanakan tidak dianggarkan karena kondisi pasar
keuangan yang belum sepenuhnya kondusif.
Dengan demikian maka pembiayaan anggaran yang
berasal dari nonutang dalam APBN 2010 direncanakan
hanya sebesar Rp2,5 triliun atau 2,5 persen dari total
pembiayaan anggaran yang direncanakan sebesar
Rp98,0 triliun. Hal tersebut menunjukkan bahwa
pembiayaan anggaran nonutang dalam APBN 2010
menurun sebesar Rp40,7 triliun atau 94,2 persen
apabila dibandingkan dengan target dalam APBN-P
2009 sebesar Rp43,2 triliun. Pembiayaan anggaran
nonutang dalam APBN 2010, terdiri dari: (1) perbankan
dalam negeri melalui RDI sebesar Rp5,5 triliun, (2) hasil
pengelolaan aset Rp1,2 triliun, serta (3) dana investasi
Pemerintah dan restrukturisasi BUMN negatif Rp3,9
triliun, (4) dana kontingensi Rp1,1 triliun, (5) cadangan
pembiayaan Rp0,9 triliun.
ANGGARAN PENDAPATAN DAN BELANJA NEGARA (APBN) TAHUN 2010 | THE 2010 INDONESIAN BUDGET

92 THE INDONESIANBUDGET OVERVIEW 2010
Debt FinancingDebt financing is targeted to amount to Rp95.5
trillion, consisting of net foreign debt of negative
Rp9.9 trillion, domestic debt of Rp1.0 trillion and
net SBN issuance of Rp104.4 trillion, backed up by
standby loans. Compared to the 2009 Revised Budget,
debt financing in 2010 is increasing by Rp9.0 trillion or
around 10.4 percent.
Further details about the amount of budget financing
can be seen in Table 5.
Pembiayaan UtangPembiayaan utang ditargetkan sebesar Rp95,5 triliun
yang terdiri dari pinjaman luar negeri neto sebesar
negatif Rp9,9 triliun, pinjaman dalam negeri sebesar
Rp1,0 triliun dan penerbitan SBN neto sebesar
Rp104,4 triliun, yang di back-up oleh pinjaman siaga.
Jika dibandingkan dengan APBN-P tahun 2009 maka
pembiayaan utang tahun 2010 meningkat sebesar
Rp9,0 triliun atau sekitar 10,4 persen.
Lebih lanjut mengenai besaran pembiayaan anggaran
dapat dilihat pada Tabel 5.
Table 5Budget Financing, 2009-2010
(trillion Rupiah)
item The 2009 Revised Budget
The 2010 Budget
I. Non Debt 43.2 2.5
1. Domestic Banking 56.6 7.1
2. Privatization Revenue 0.0 0.0
3. Asset Management Outcome (0.2) 1.2
4.Government Investment Fund and capital participation (PMN)
(12.1) (3.9)
5. Contingency Fund (1.0) (1.1)
6. Financing Reserve 0.0 (0.9)
II. Debt 86.5 95.5
1. State Securities (net) 99.3 104.4
2. Debt (12.7) (8.9)
i. Foreign Debt (12.7) (9.9)
ii. Domestic Debt 0.0 1.0 Source: Ministry of Finance
ANGGARAN PENDAPATAN DAN BELANJA NEGARA (APBN) TAHUN 2010 | THE 2010 INDONESIAN BUDGET

93THE INDONESIANBUDGET OVERVIEW 2010
The Medium-Term Budget Framework (MTBF)
The medium-term budget framework (MTBF) is
information regarding the medium-term revenue,
expenditure and financing framework that is openly
presented to the public. The MTBF presents a
summary on the: (1) projection of macroeconomic
indicators that become the basis in the formulation
of the Proposed Budget, (2) Budget priorities, (3)
the goals and objectives to be achieved by the
Government through fiscal policy in the future, and
(4) projection of financing sources available in the next
3-5 years. The projected figures specified in the MTBF
will be updated and adjusted every year in line with
the developments of macroeconomic condition and
various other Government fiscal policies.
With the existence of the MTBF it is expected that
the Government will be able to harmonize planning
and budgeting, including between expenditure needs
and policy as well as the funding alternatives. The
formulation of the MTBF to achieve the targets of
medium-term development is carried out based on
the projection of medium-term macro assumptions
and medium-term policies in the fields of revenue,
expenditure and financing.
In the determination of the medium-term macro
assumption framework, the Government always
considers internal and external factors. The internal
factors influencing national macroeconomic in the
Kerangka APBN Jangka Menengah (Medium Term Budget Framework/ MTBF)Kerangka APBN Jangka Menengah atau medium
term budget framework (MTBF) merupakan informasi
mengenai kerangka penerimaan, belanja, dan
pembiayaan dalam jangka menengah yang disajikan
secara terbuka kepada publik. MTBF menyajikan
ringkasan mengenai: (1) proyeksi indikator ekonomi
makro yang menjadi dasar penyusunan RAPBN, (2)
prioritas APBN, (3) sasaran dan tujuan yang hendak
dicapai Pemerintah melalui kebijakan fiskal ke
depan, dan (4) proyeksi mengenai sumber-sumber
pembiayaan yang tersedia dalam jangka waktu 3-5
tahun ke depan. Angka-angka proyeksi yang termuat
dalam MTBF, setiap tahun akan diperbaharui dan
disesuaikan dengan perkembangan kondisi ekonomi
makro dan berbagai kebijakan fiskal Pemerintah
lainnya.
Dengan adanya MTBF diharapkan Pemerintah
dapat menyelaraskan antara perencanaan dengan
penganggaran, termasuk juga antara kebutuhan
dengan kebijakan belanja negara serta alternatif
pendanaannya. Penyusunan MTBF untuk mencapai
target pembangunan jangka menengah dilakukan
berdasarkan proyeksi asumsi makro jangka
menengah dan kebijakan jangka menengah di bidang
pendapatan, belanja dan pembiayaan.
Dalam penetapan kerangka asumsi makro
jangka menengah, Pemerintah senantiasa
mempertimbangkan faktor internal dan eksternal.
Faktor internal yang memengaruhi kinerja ekonomi
ANGGARAN PENDAPATAN DAN BELANJA NEGARA (APBN) TAHUN 2010 | THE 2010 INDONESIAN BUDGET

94 THE INDONESIANBUDGET OVERVIEW 2010
medium term are: (1) controlled fiscal consolidation
in order to support fiscal sustainability, (2) higher DIPA
absorption, (3) a continually decreasing loan to GDP
ratio, and (4) increasing infrastructure development.
Meanwhile, the external factors are estimated
to be quite conducive for the development of
macroeconomic, namely: (1) an international economy
that is estimated to grow at a moderate level, (2) an
international crude oil price that is estimated to be
relatively stable, (3) the inflation rate and interest
rate in the US are estimated to be better in 2009 and
2010, and (4) a relatively stable inflation rate of trade
partner countries.
Based on the above factors, the projections of the
medium-term macro assumptions can be seen in
Table 6.
makro nasional dalam jangka menengah, antara
lain: (1) tetap terkendalinya konsolidasi fiskal guna
mendukung fiscal sustainability; (2) penyerapan
DIPA yang diupayakan semakin tinggi; (3) rasio
utang terhadap PDB yang semakin menurun; dan
(4) pembangunan infrastruktur yang semakin
meningkat. Sedangkan faktor eksternal diperkirakan
cukup kondusif bagi perkembangan ekonomi makro
nasional, yaitu: (1) ekonomi internasional yang
diperkirakan tumbuh pada level yang moderat; (2)
harga minyak mentah internasional yang diperkirakan
cenderung relatif stabil; (3) laju inflasi dan suku bunga
di Amerika Serikat diperkirakan cenderung membaik
pada tahun 2009 dan 2010; serta (4) laju inflasi
negara-negara mitra dagang yang relatif stabil.
Berdasarkan faktor-faktor tersebut di atas, proyeksi
asumsi makro jangka menengah dapat dilihat pada
Tabel 6.
Table 6Medium-Term Macro Assumption Framework
Item 2010 Budget 2011 2012 2013 2014
1. Economic Growth (%) 5.5 6.2 6.8 7.3 7.7
2. Inflation (%) 5.0 6.0 6.0 5.5 5.5
3. 3-Month SBI (%) 6.5 7.5 7.5 7.0 7.0
4. Rupiah Exchange Rate (Rp/US$) 10,000 9,750 9,750 9,850 9,850
5. ICP (US$/barrel) 65.0 70.0 75.0 80.0 85.0
6. Oil Lifting (MBCD) 965.0 970.0 990.0 1,000.0 1,000.0
Source: Ministry of Finance
ANGGARAN PENDAPATAN DAN BELANJA NEGARA (APBN) TAHUN 2010 | THE 2010 INDONESIAN BUDGET
95THE INDONESIANBUDGET OVERVIEW 2010
In addition to the projection of medium-term macro
assumptions, the formulation of the MTBF is also
influenced by medium-term policy in the fields of
revenue, expenditure and financing. Medium-term
policies in the field of revenue include tax, customs
and excises as well as PNBP policies. Policies in the
field of tax include: (1) administrative reform; (2) legal
reform; and (3) reform in the field of the supervising
and taking advantage of potentials. Meanwhile,
policies in the field of customs and excises include: (1)
expansion of priority line; (2) provision of easy customs
services; (3) smuggling eradication; (4) illegal excise
eradication; and (5) the implementation of a code of
ethics through reward and punishment.
Meanwhile, policies in the field of PNBP are carried
out by: (1) encouraging the investment climate in oil
and gas upstream activity; (2) improving cost recovery
provision; (3) optimizing non-oil and gas natural
resource revenue, coming from general mining,
forestry and geothermal activity; (4) evaluating and
improving the regulations, system, procedures and
management of K/L’s PNBP; (5) enhancing supervision
on the implementation of PNBP collection and
depositing to the treasury; and (6) enhancing efficiency
and effectiveness in grant management and utilization
in order to meet budget financing needs.
The central government expenditure policy is directed
towards: (1) increasing employees’ welfare; (2)
improving the quality of public services; (3) fulfilling
the obligations to third parties; (4) maintaining the
price stability of strategic commodities; (5) continuing
Di samping proyeksi asumsi makro jangka menengah,
penyusunan MTBF juga dipengaruhi oleh kebijakan
jangka menengah di bidang pendapatan, belanja
dan pembiayaan. Kebijakan jangka menengah di
bidang pendapatan meliputi kebijakan perpajakan,
kepabeanan dan cukai, serta PNBP. Kebijakan di
bidang perpajakan meliputi: (1) reformasi di bidang
administrasi; (2) reformasi di bidang perundang-
undangan; dan (3) reformasi di bidang pengawasan
dan penggalian potensi. Sementara itu kebijakan di
bidang kepabeanan dan cukai meliputi: (1) perluasan
jalur prioritas; (2) pemberian kemudahan pelayanan
kepabeanan; (3) pemberantasan penyeludupan; (4)
pemberantasan cukai ilegal; dan (5) penerapan kode
etik melalui reward and punishment.
Sementara itu kebijakan di bidang PNBP dilakukan
antara lain dengan: (1) mendorong iklim investasi
kegiatan hulu migas; (2) perbaikan ketentuan cost
recovery; (3) mengoptimalkan penerimaan SDA non
migas, meliputi pertambangan umum, kehutanan
dan panas bumi; (4) mengevaluasi dan memperbaiki
peraturan, sistem, prosedur, dan tata kelola PNBP K/L;
(5) meningkatkan pengawasan terhadap pelaksanaan
pemungutan dan penyetoran PNBP ke kas negara; dan
(6) meningkatkan efisiensi dan efektifitas pengelolaan
dan pemanfaatan hibah guna memenuhi kebutuhan
pembiayaan anggaran.
Kebijakan belanja Pemerintah pusat diarahkan
untuk: (1) meningkatkan kesejahteraan pegawai; (2)
meningkatkan kualitas pelayanan publik; (3) memenuhi
kewajiban kepada pihak ketiga; (4) menjaga stabilitas
harga komoditas strategis; (5) melanjutkan program
ANGGARAN PENDAPATAN DAN BELANJA NEGARA (APBN) TAHUN 2010 | THE 2010 INDONESIAN BUDGET

96 THE INDONESIANBUDGET OVERVIEW 2010
poverty alleviation programs, to give protection to the
public and to improve food security; (6) improving
infrastructure quantity and quality; and (7) providing
appropriate and measured stimulus to the economy.
In medium-term planning, the policy on transfers to
regions still emphasizes maintaining the consistency
and sustainability of the fiscal decentralization
consolidation process as an effort to reinforce the
implementation of regional autonomy. In addition
to being prioritized to reduce the fiscal imbalance
between the central and regional government (vertical
fiscal imbalance) and among regions (horizontal fiscal
imbalance), the policy is also prioritized to reduce
public service provision gaps among regions and
to enhance the quality of expenditure allocation to
regions.
The policy direction of medium-term financing
emphasizes: (1) improved utilization of domestic
financing sources; (2) gradual reduction of the stock
of debt; and (3) loan disbursement with minimum
cost and risk. Furthermore, the medium-term
Government policy is also directed towards realizing
fiscal sustainability and debt sustainability. The effort to
reduce the stock of foreign debt is carried out through
the reduction of outstanding loans, both in terms of
percentage to GDP and in terms of nominal amount.
This is meant to improve fiscal strength, enhance the
level of trust and certainty in fiscal management ability
in facing the dynamic global economy.
pengentasan kemiskinan, memberikan perlindungan
kepada masyarakat, dan meningkatkan ketahanan
pangan; (6) meningkatkan kuantitas dan kualitas
infrastruktur; serta (7) memberikan stimulus pada
perekonomian secara tepat dan terukur.
Dalam perencanaan jangka menengah, kebijakan
transfer ke daerah masih ditekankan untuk menjaga
konsistensi dan kesinambungan proses konsolidasi
desentralisasi fiskal sebagai upaya pemantapan
penyelenggaraan otonomi daerah. Kebijakan
tersebut selain diprioritaskan untuk mengurangi
kesenjangan fiskal antara pusat dan daerah (vertical
fiscal imbalance), dan antar daerah (horizontal fiscal
imbalance), juga mengurangi kesenjangan pelayanan
publik antar daerah (public service provision gap),
serta ditujukan untuk meningkatkan kualitas alokasi
belanja ke daerah.
Arah kebijakan pembiayaan dalam jangka menengah
dititikberatkan pada: (1) peningkatan pemanfaatan
sumber-sumber pembiayaan dalam negeri; (2)
penurunan stok utang secara bertahap; dan (3)
penarikan pinjaman dengan biaya dan risiko yang
minimal. Selain itu, kebijakan Pemerintah jangka
menengah juga diarahkan untuk mewujudkan
kesinambungan fiskal (fiscal sustainability) dan
kesinambungan utang (debt sustainability). Upaya
penurunan stok utang luar negeri dilakukan dengan
penurunan outstanding-nya, baik secara persentase
terhadap PDB maupun secara nominal. Hal tersebut
dimaksudkan untuk memperkokoh ketahanan fiskal,
meningkatkan derajat kepercayaan dan kepastian akan
kemampuan pengelolaan fiskal dalam menghadapi
ANGGARAN PENDAPATAN DAN BELANJA NEGARA (APBN) TAHUN 2010 | THE 2010 INDONESIAN BUDGET

97THE INDONESIANBUDGET OVERVIEW 2010
The estimated amount of The Indonesian Budget in
the medium-term framework can be seen in Table 7.
ACCELERATED SUBMISSION OF THE 2010 REVISED BUDGET
Since the end of 2009 and the beginning of the 2010
Budget implementation, the Government continues
to undertake monitoring on (i) the development
of the global and domestic economy, (ii) the
implementation of the 2009 Revised Budget, and
(iii) the implementation of the 2010 Budget. From
the results of the monitoring, it is deemed that the
national economic performance in 2009 was able to
survive the pressure of global crisis as compared to
the economic performance of many other countries
impacted by the crisis. In terms of macro economy,
the stronger rupiah exchange rate, especially in the
dinamika perekonomian global.
Perkiraan besaran APBN dalam kerangka jangka
menengah dapat dilihat dalam Tabel 7.
PERCEPATAN PENGAJUAN ANGGARAN PENDAPATAN DAN BELANJA NEGARA PERUBAHAN (APBN-P) TAHUN 2010Sejak akhir tahun 2009 dan awal pelaksanaan APBN
2010, Pemerintah terus melakukan pemantauan (i)
perkembangan perekonomian global dan domestik,
(ii) pelaksanaan APBN-P 2009, serta (iii) pelaksanaan
APBN 2010. Dari hasil pemantauan tersebut, dinilai
kinerja perekonomian nasional tahun 2009 mampu
bertahan dari tekanan krisis global, bila dibandingkan
dengan kinerja banyak negara lainnya yang terkena
imbas krisis. Dari sisi ekonomi makro, kembali
menguatnya nilai tukar rupiah terutama di semester II
2009 dan rendahnya tingkat inflasi telah memberikan
dampak positif terhadap penurunan tingkat suku
Table 7Medium-Term Budget Framework (percent of GDP)
Item 2010 Budget 2011 2012 2013 2014
A. State Revenue and Grants 15.7 15.7 16.1 16.5 17.0
B. State Expenditures 17.3 17.6 17.6 17.9 18.2
C. Primary Balance 0.3 0.3 0.3 0.5 0.6
D. General Balance (1.6) (1.9) (1.6) (1.4) (1.2)
E. Financing 1.6 1.9 1.6 1.4 1.2
Source: Ministry of Finance
ANGGARAN PENDAPATAN DAN BELANJA NEGARA (APBN) TAHUN 2010 | THE 2010 INDONESIAN BUDGET

98 THE INDONESIANBUDGET OVERVIEW 2010
bunga SBI. Perkembangan indikator tersebut, serta
kebijakan Pemerintah yang antisipatif dan responsif
telah ikut mendukung pencapaian pertumbuhan
ekonomi yang tetap positif dan relatif tinggi dalam
tahun 2009. Di lain pihak, tingkat inflasi dapat
dikendalikan.
Terkait dengan realisasi APBN-P 2009, pencapaian
perekonomian nasional serta kondisi ekonomi global
juga berdampak pada pencapaian besaran APBN-
P 2009. Secara keseluruhan realisasi APBN-P 2009
dapat dikelola dengan baik, yang tercermin dari
realisasi defisit APBN-P 2009 yang mencapai sebesar
Rp88,6 triliun (1,6 persen PDB), jauh lebih rendah dari
targetnya sebesar Rp129,8 triliun (2,4 persen PDB).
Hal ini sebagai konsekuensi dari realisasi pendapatan
negara dan hibah yang mencapai 97,4 persen
dari targetnya, sedangkan realisasi belanja negara
mencapai 93,7 persen dari pagunya. Di lain pihak,
realisasi pembiayaan mencapai sebesar Rp112,6
triliun, sehingga dalam tahun 2009 dihasilkan surplus
pembiayaan anggaran (SILPA) sebesar Rp24,0 triliun.
Dari hasil evaluasi kinerja ekonomi di tahun 2009
serta melihat perkembangan perekonomian dan
pembangunan di tahun 2010, Pemerintah memandang
perlu untuk melakukan perubahan terhadap APBN
2010. Adapun dasar hukum dari perubahan APBN
2010 adalah pasal 27 Undang-Undang Nomor 47
Tahun 2009 tentang APBN 2010 yang dalam ayat
(1) mengamanatkan bahwa Pemerintah mengajukan
RUU tentang Perubahan atas APBN Tahun Anggaran
second semester of 2009, and the low inflation rate
have given a positive impact on the reduction of
the SBI rate. The development of the indicators and
the anticipative and responsive Government policy
has also supported the achievement of positive and
relatively high economic growth in 2009. Also, the
inflation rate could be controlled.
In relation to the realization of the 2009 Revised Budget,
national economic achievements and the condition of
the global economy have also had an impact on the
achievement of the 2009 Revised Budget. Overall,
the realization of the 2009 Revised Budget was well-
managed, as seen from the deficit realization of the
2009 Revised Budget that reached Rp88.6 trillion (1.6
percent of the GDP), which is lower than the target of
Rp129.8 trillion (2.4 percent of the GDP). This was a
consequence of the realization of revenue and grants,
which reached 97.4 percent of the target, while the
realization of expenditures reached 93.7 percent
of the ceiling. Also, financing realization reached
Rp112.6 trillion; thus, in 2009 there was a financing
surplus (SILPA) of Rp24.0 trillion.
From the evaluation result of economic performance
in 2009 and by seeing the development of the
economy and development in 2010, the Government
deemed it necessary to make an amendment to the
2010 Budget. The legal basis of the amendment to
the 2010 Budget is Article 27 of Law Number 47
of 2009 regarding the 2010 Indonesian Budget,
where in Paragraph (1) the Government is mandates
to introduce a Bill on the Amendment to the 2010
ANGGARAN PENDAPATAN DAN BELANJA NEGARA (APBN) TAHUN 2010 | THE 2010 INDONESIAN BUDGET

99THE INDONESIANBUDGET OVERVIEW 2010
Budget in the following cases:
a. development of the macro economy is not in
accordance with the assumption used in the
2010 Budget;
b. changes of fiscal policy highlights;
c. conditions that require budget reallocation
among organizational units, among programs,
and/or among types of expenditure;
d. conditions that cause the surplus budget of the
previous fiscal years to be used to finance the
2010 budget.
Within that framework, the amendment to the 2010
Budget is aimed at: (a) anticipating the changes of
macroeconomic indicators in 2010; (b) maintaining
the price stability of domestic material and services;
and (c) accelerating the implementation of national
development priority programs in 2010 and in the
medium term. The revision to the 2010 Budget is
comprehensively undertaken in order to accommodate
all changes in revenue, expenditures, as well as budget
deficit and financing.
Considering the developments of world and domestic
economy throughout 2009 and up to the latest
developments, it was estimated that the assumptions
of basic macroeconomic figures used as a reference
in the calculation of the amount of the 2010 Budget
were no longer suitable. In order to update the
macroeconomic basic assumptions and make them
more realistic, the macroeconomic basic assumptions
used in the 2010 Revised Budget are as follows: (1)
economic growth is estimated to grow at 5.8 percent,
2010 apabila terjadi:
a. perkembangan ekonomi makro yang tidak sesuai
dengan asumsi yang digunakan dalam APBN
tahun anggaran 2010;
b. perubahan pokok-pokok kebijakan fiskal;
c. keadaan yang menyebabkan harus dilakukan
pergeseran anggaran antarunit organisasi,
antarprogram, dan/atau antarjenis belanja;
d. keadaan yang menyebabkan saldo anggaran
lebih tahun-tahun anggaran sebelumnya harus
digunakan untuk pembiayaan anggaran 2010.
Dalam kerangka tersebut, perubahan APBN 2010
ditujukan antara lain untuk: (a) mengantisipasi
perubahan indikator ekonomi makro dalam tahun
2010; (b) menjaga stabilitas harga barang dan jasa
di dalam negeri; serta (c) mempercepat pelaksanaan
program-program prioritas pembangunan nasional
dalam tahun 2010 dan jangka menengah. Perubahan
APBN 2010 tersebut dilakukan secara menyeluruh
guna menampung seluruh perubahan dalam
pendapatan, belanja, serta defisit dan pembiayaan
anggaran.
Memperhatikan perkembangan ekonomi dunia dan
domestik sepanjang tahun 2009 dan perkembangan
terkini, besaran asumsi dasar ekonomi makro yang
digunakan sebagai acuan perhitungan besaran
APBN 2010 diperkirakan tidak sesuai lagi. Dalam
rangka memutakhirkan asumsi dasar ekonomi makro
agar lebih realistis, dalam APBN-P 2010 asumsi
dasar ekonomi makro adalah sebagai berikut: (1)
pertumbuhan ekonomi diperkirakan tetap tumbuh
sebesar 5,8 persen, (2) tingkat inflasi meningkat
ANGGARAN PENDAPATAN DAN BELANJA NEGARA (APBN) TAHUN 2010 | THE 2010 INDONESIAN BUDGET

100 THE INDONESIANBUDGET OVERVIEW 2010
menjadi 5,3 persen, (3) rata-rata suku bunga SBI-
3 bulan tetap 6,5 persen, (4) nilai tukar menguat
menjadi sekitar Rp9.200 per US$, (5) harga minyak
mentah Indonesia rata-rata meningkat menjadi
US$80 per barel, dan (6) lifting minyak tetap sebesar
0,965 juta barel per hari.
Selanjutnya, berdasarkan perubahan asumsi makro
tersebut, maka postur APBN 2010 juga perlu
disesuaikan sebagai berikut.
Dalam APBN-P 2010 pendapatan negara dan hibah
diperkirakan menjadi Rp992,4 triliun, atau 4,2 persen
lebih tinggi dari target APBN 2010 sebesar Rp949,7
triliun. Perubahan tersebut terjadi, baik terhadap
rencana penerimaan perpajakan maupun PNBP. Di
sisi penerimaan perpajakan, penyesuaian besaran
targetnya dilakukan atas dasar perubahan proyeksi
indikator ekonomi makro dalam APBN-P 2010, serta
pencapaian realisasi penerimaan perpajakan pada
tahun 2009. Perubahan asumsi dasar ekonomi makro
tahun 2010 yang mempengaruhi besaran penerimaan
perpajakan terutama adalah perubahan proyeksi nilai
tukar rupiah terhadap dolar Amerika Serikat. Selain itu,
realisasi penerimaan perpajakan dalam tahun 2009
yang mengalami pergeseran dari targetnya dalam
APBN-P 2009, juga diakomodasikan untuk menjadi
dasar (baseline) perhitungan proyeksi penerimaan
perpajakan yang baru dalam tahun 2010.
Sementara itu, PNBP diperkirakan mengalami
peningkatan berkaitan dengan lebih tingginya
asumsi harga minyak mentah Indonesia sebagai
dasar perhitungan penerimaan SDA migas, dan
kenaikan target penerimaan bagian pemerintah atas
(2) an inflation rate increase to 5.3 percent, (3) an
average 3-month SBI rate remaining at 6.5 percent,
(4) an exchange rate increases to Rp9,200 per US$, (5)
an average Indonesian crude price increase to US$80
per barrel, and (6) oil lifting remaining at 0.965 million
barrels per day.
Next, based on the revised macro assumptions, the
posture of the 2010 Budget needs to be adjusted as
follows.
In the 2010 Revised Budget, revenue and grants is
estimated to be Rp992.4 trillion, or 4.2 percent higher
than the target in the 2010 Budget of Rp949.7 trillion.
This revision applies both to tax revenue as well as the
non-tax revenue plan. In terms of tax revenue, the
adjustment to the target amount was made based on
the revision of macroeconomic indicator projections in
the 2010 Revised Budget, as well as the achievement
of tax revenue realization in 2009. In particular, the
revised macroeconomic basic assumption in 2010 that
influences the amount of tax revenue is the revised
projection of the rupiah exchange rate against the US
dollar. In addition to this, the realization of tax revenue
in 2009 that underwent a shift from the target in the
2009 Revised Budget is also accommodated to be
used as baseline in the calculation of new tax revenue
projections in 2010.
Meanwhile, PNBP is estimated to increase related
to the higher assumption of the Indonesian crude
price as a baseline in the calculation of oil and gas
natural resource revenue, and an increased target
of government share of SOE profits, based on the
ANGGARAN PENDAPATAN DAN BELANJA NEGARA (APBN) TAHUN 2010 | THE 2010 INDONESIAN BUDGET

101THE INDONESIANBUDGET OVERVIEW 2010
estimation of improved SOE financial performance in
2009.
In terms of expenditures, the ceiling revision was
due to the combination of new additions to the
expenditure budget with budget reallocation. The
addition of the expenditure budget to the 2010
Revised Budget is from the increase to the Central
Government expenditure budget and the increased
budget for transfers to regions. Changes to the central
government expenditure budget in the 2010 Revised
Budget were influenced by several factors. First was
changes to macroeconomic assumptions, particularly
the higher projection of the oil price to USD 80/
barrel, creating a higher energy subsidy budget.
Second was the Government policy to maintain the
price stability of material and services, which is done
by maintaining the current fuel prices, adjustment
of fertilizer MRP and electricity basic tariff, provision
of tax incentives, adjustment of food subsidies in
the form of additional subsidized rice allocations for
targeted households, adjustment of the rice purchase
price, and the cooking oil subsidy. The main purpose
of the price stabilization policy is to maintain the
availability of goods and services so that they can be
easy to find while still maintaining price and quality.
Third is to accommodate the expenditure budget
for development priority programs that have not yet
been accommodated in Law Number 47 of 2009
regarding the 2010 Indonesian Budget. This is forth in
Presidential Instruction Number 1 of 2010 regarding
the Accelerated Implementation of 2010 National
Development Priorities. Furthermore, in the 2010
laba BUMN berdasarkan perkiraan perbaikan kinerja
keuangan BUMN di tahun 2009.
Di sisi belanja negara, perubahan pagu berasal dari
kombinasi penambahan anggaran belanja negara
baru, dan realokasi anggaran. Penambahan anggaran
belanja negara dalam APBN-P 2010 tersebut
bersumber dari penambahan anggaran belanja
Pemerintah pusat, dan penambahan anggaran transfer
ke daerah. Perubahan anggaran belanja Pemerintah
pusat dalam APBN-P 2010 dipengaruhi oleh beberapa
faktor. Pertama, perubahan asumsi ekonomi makro,
khususnya proyeksi harga minyak yang lebih tinggi
ke USD80/barel, yang mengakibatkan bertambahnya
anggaran subsidi energi. Kedua, kebijakan Pemerintah
untuk menjaga stabilitas harga barang dan jasa, yaitu
dengan mempertahankan harga BBM seperti saat
ini, penyesuaian kebijakan HET pupuk dan tarif dasar
listrik, pemberian insentif perpajakan, penyesuaian
subsidi pangan dalam bentuk penambahan alokasi
beras bersubsidi untuk rumah tangga sasaran dan
penyesuaian harga pembelian beras, serta subsidi
minyak goreng. Tujuan utama kebijakan stabilisasi
harga tersebut diarahkan agar kebutuhan barang
dan jasa dapat dijaga ketersediaannya, mudah
diperoleh, serta dengan kualitas dan harga yang
terjaga. Ketiga, menampung anggaran belanja untuk
program-program prioritas pembangunan yang
belum diakomodasikan dalam UU Nomor 47 Tahun
2009 tentang APBN Tahun 2010. Sebagaimana
tertuang dalam Inpres Nomor 1 Tahun 2010 tentang
Percepatan Pelaksanaan Prioritas Pembangunan
Nasional Tahun 2010. Selain itu, dalam APBN-P 2010
ANGGARAN PENDAPATAN DAN BELANJA NEGARA (APBN) TAHUN 2010 | THE 2010 INDONESIAN BUDGET

102 THE INDONESIANBUDGET OVERVIEW 2010
juga dialokasikan dana untuk program rehabilitasi
dan rekonstruksi pasca bencana di Jawa Barat dan
Sumatera Barat. Keempat, menjaga rasio anggaran
pendidikan tetap 20 persen.
Sementara itu, pada belanja transfer ke daerah,
tambahan anggaran dalam APBN-P 2010 bersumber
dari kenaikan dana bagi hasil akibat kenaikan target
PNBP SDA Migas yang sebagian dibagihasilkan,
serta membayar kekurangan alokasi dana bagi hasil
migas pada tahun-tahun sebelumnya. Di samping itu,
transfer ke daerah juga meningkat berkaitan dengan
pengalihan hibah ke daerah, yang semula ditampung
di belanja Pemerintah pusat.
Tambahan kebutuhan pendanaan belanja tersebut
selain dipenuhi dari realokasi belanja yang sudah
tersedia, juga dipenuhi dari sumber-sumber
pendanaan lainnya, baik dari sisi penerimaan maupun
dari sisi pembiayaan. Secara keseluruhan tambahan
belanja negara yang dibutuhkan diperkirakan
mencapai sebesar Rp78,5 triliun, sehingga dalam
APBN-P 2010 belanja negara diperkirakan menjadi
Rp1.126,1 triliun.
Dengan target pendapatan negara dan hibah sebesar
Rp992,4 triliun dan perkiraan belanja negara sebesar
Rp1.126,1 triliun, dalam APBN-P 2010 terjadi defisit
anggaran sebesar Rp133,7 triliun (2,1 persen terhadap
PDB). Apabila dibandingkan dengan defisit anggaran
dalam APBN 2010 yang mencapai sebesar Rp98,0 triliun
(1,6 persen terhadap PDB), defisit anggaran dalam
APBN-P 2010 tersebut berarti 36,5 persen lebih tinggi.
Rencana penambahan defisit anggaran dalam APBN-P
2010 tersebut paling tidak mempertimbangkan pada
Revised Budget, there are funds allocated for post-
disaster rehabilitation and reconstruction in West Java
and West Sumatra. Fourth is to maintain an education
budget ratio of 20 percent.
Meanwhile, in the transfers to regional governments,
the additional budget in the 2010 Revised Budget
is from an increased revenue-sharing fund, due to
increased targets of oil and gas natural resource PNBP,
and to pay the underpaid fund allocation for oil and
gas products in the previous years. Moreover, transfers
to regions also increased related to sub-grants to
regions, which were initially accommodated in central
government expenditures.
In addition to being fulfilled from the available
expenditure reallocation, the additional expenditure
funding need is also being met from other funding
sources, both in terms of revenue and financing.
Overall, the additional expenditures needed are
estimated to reach Rp78.5 trillion, thus the 2010
Revised Budget is estimated to amount Rp1,126.1
trillion.
With the target of revenue and grants of Rp992.4
trillion and estimated expenditures of Rp1,126.1
trillion, then in the 2010 Revised Budget there is a
budget deficit of Rp133.7 trillion (2.1 percent of the
GDP). The budget deficit in the 2010 Revised Budget
is 36.5 percent higher compared to the budget deficit
in the 2010 Budget that reaches Rp98.0 trillion (1.6
percent of the GDP). The plan for the additional
budget deficit in the 2010 Revised Budget has
considered at least two factors. First is being able to
ANGGARAN PENDAPATAN DAN BELANJA NEGARA (APBN) TAHUN 2010 | THE 2010 INDONESIAN BUDGET

103THE INDONESIANBUDGET OVERVIEW 2010
implement priority programs in order to accelerate
the achievement of development targets, in order to
maintain price stability for domestic goods and prices,
and to enhance protection for the society. Second
is that the additional deficit can still be tolerated at
a safe limit and is in accordance with the laws and
regulations. The sources of financing sought are to be
mainly from domestic sources.
Meanwhile, budget financing in the 2010 Revised
Budget is planned to amount to Rp133.7 trillion. This
means a 36.5 percent increase over the initial target in
the 2010 Budget of Rp98.0 trillion. The budget plan
for budget financing in the 2010 Revised Budget,
in addition to being utilized to finance the budget
deficit, is also meant to accommodate financing
needs in regard to the addition of the Government
investment fund (including the education endowment
fund) and state capital participation in order to
support infrastructure development, development of
public business credit, and the development of simple
housing. In addition to coming from additional foreign
debt disbursements, the source of budget financing
in the 2010 Revised Budget is from the use of 2009
SILPA and the use of SAL of the previous years.
Further details regarding the summary of the 2010
Budget and Revised Budget can be seen in Table 8.
dua faktor. Pertama, dapat melaksanakan program-
program prioritas guna mempercepat pencapaian
target-target pembangunan, menjaga stabilitas harga
barang dan jasa di dalam negeri, serta meningkatkan
perlindungan pada masyarakat. Kedua, kenaikan
tambahan defisit masih ditolerir dalam batas yang
aman dan sesuai dengan ketentuan perundang-
undangan, serta sumber pembiayaannya diupayakan
dominan dari dalam negeri.
Sementara itu, pembiayaan anggaran dalam APBN-
P 2010 direncanakan sebesar Rp133,7 triliun, yang
berarti 36,5 persen lebih tinggi dari target semula
dalam APBN 2010 sebesar Rp98,0 triliun. Rencana
anggaran pembiayaan anggaran dalam APBN-
P 2010 tersebut selain akan digunakan untuk
membiayai defisit anggaran, juga dimaksudkan untuk
menampung kebutuhan pembiayaan dalam rangka
penambahan dana investasi Pemerintah (termasuk
untuk dana abadi pendidikan) dan penyertaan
modal negara untuk mendukung pembangunan
infrastruktur, pengembangan kredit usaha rakyat, dan
pembangunan perumahan sederhana. Selain berasal
dari penambahan penarikan pinjaman luar negeri,
sumber pembiayaan anggaran dalam APBN-P tahun
2010 sebagian besar akan dipenuhi dari penggunaan
SILPA 2009 dan SAL tahun-tahun sebelumnya.
Lebih lanjut mengenai ringkasan APBN dan APBN-P
2010 dapat dilihat pada Tabel 8.
ANGGARAN PENDAPATAN DAN BELANJA NEGARA (APBN) TAHUN 2010 | THE 2010 INDONESIAN BUDGET

104 THE INDONESIANBUDGET OVERVIEW 2010
TABLE 8 SUMMARY OF THE 2010 BUDGET AND REVISED BUDGET
(trillion Rupiah)
Item BUDGET REVISED BUDGET
A. REVENUE AND GRANT 949.7 992.4
I. DOMESTIC REVENUE 948.1 990.5
1. TAX REVENUE 742.7 743.3
a. Domestic Tax 715.5 720.8
b. International Trade Tax 27.2 22.6
2. NON TAX REVENUE 205.4 247.2
a. Natural Resource Revenue 132.0 164.7
1) Oil and Gas Natural Resource 120.5 151.7
2) Non Oil and Gas 11.5 13.0
b. Share on SOE Profit 24.0 29.5
c. Other PNBP 39.9 43.5
d. BLU Revenue 9.5 9.5
II. GRANT 1.5 1.9
B. EXPENDITURE 1,047.7 1,126.1
I. CENTRAL GOVERNMENT EXPENDITURE (K/L & NON K/L) 725.2 781.5
1. K/L Expenditure 340.1 366.1
2. Non K/L Expenditure 385.1 415.4
a.l a. Interest Payment 115.6 105.7
1) Domestic Loan 77.4 71.9
2) Foreign Loan 38.2 33.8
b. Subsidy 157.8 201.3
1) Energy Subsidy 106.5 144.0
2) Non Energy Subsidy 51.3 57.3
c. Other Expenditure 30.7 32.9
II. TRANSFER TO REGIONAL 322.4 344.6
1. Balance Fund 306.0 314.4
a. Revenue Sharing Fund 81.4 89.6
b. General Allocation Fund 203.5 203.6
c. Specific Allocation Fund 21.1 21.1
2. Special Autonomy and Adjustment Fund 16.4 30.2
C. BUDGET SURPLUS/DEFICIT (A-B) (98.0) (133.7)
%Deficit of GDP) (1.6) (2.1)
D. FINANCING (I+II) 98.0 133.7
I. DOMESTIC FINANCING 107.9 133.9
II. FOREIGN FINANCING (net) (9.9) (0.2)
Source: Ministry of Finance
ANGGARAN PENDAPATAN DAN BELANJA NEGARA (APBN) TAHUN 2010 | THE 2010 INDONESIAN BUDGET


107THE INDONESIANBUDGET OVERVIEW 2010
Budget reforms, which began in 2005, have
been mandated by Law No. 17 of 2003 regarding
State Finance. The spirit of reform was initiated with
the implementation of the new budgeting system,
which should be carried out by the Government (both
by the Central Government, in this case the Ministries/
Agencies (K/L) and Regional Governments).
The implementation of the new budgeti
system is aimed at improving the budgeting process
in the public sector. The improvement requires the
Government to focus on the performance to be
achieved and the budget allocated for programs/
activities that are to be implemented. Subsequently,
the House of Representatives or Regional Legislative
Councils (DPR/DPRD) as the public representatives will
discuss and determine the benefits/outcomes gained
from the program/activity implementation, as well as
the budget (acquired from tax) as the Government’s
performance contract.
The legal bases for the formulation of The
Reformasi penganggaran yang mulai
dilaksanakan pada tahun 2005, telah diamanatkan
oleh Undang-undang (UU) No. 17 Tahun 2003 tentang
Keuangan Negara. Semangat reformasi tersebut
ditandai dengan penerapan sistem penganggaran
baru yang harus dilakukan oleh Pemerintah (baik
Pemerintah Pusat dalam hal ini Kementerian Negara/
Lembaga (K/L) dan Pemerintah Daerah).
Penerapan sistem penganggaran baru
tersebut dimaksudkan untuk memperbaiki proses
penganggaran di sektor publik. Perbaikan tersebut
mengharuskan Pemerintah untuk fokus kepada
kinerja yang akan dicapai beserta anggaran yang
dialokasikan pada program/kegiatan yang akan
dilaksanakan. Selanjutnya Dewan Perwakilan Rakyat
atau Dewan Perwakilan Rakyat Daerah (DPR/DPRD)
sebagai representasi rakyat/publik akan membahas
dan menetapkan manfaat/hasil yang diperoleh atas
pelaksananaan program/kegiatan yang dilakukan
beserta anggarannya (yang diperoleh dari pajak)
sebagai kontrak kinerja Pemerintah.
Landasan hukum yang digunakan dalam
SISTEM PENGANGGARAN
THE BUDGET SYSTEM
3BABCHAPTER

108 THE INDONESIANBUDGET OVERVIEW 2010
Indonesian Budget as the main product of the budget
system are:
1. The 1945 Constitution of the Republic of
Indonesia and its Amendments;
2. Law No. 17 of 2003 regarding State Finance;
3. Law No. 1 of 2004 regarding State Treasury;
4. Law No. 15 of 2004 regarding the Auditing of
State Finance Management and Accountability;
5. Law No. 32 of 2004 regarding Regional
Governments;
6. Law No. 33 of 2004 regarding Central and
Regional Governments Financial Balance;
7. Government Regulation No. 20 of 2004 regarding
Government Work Plans;
8. Government Regulation No. 21 of 2004 regarding
the Formulation of Work Plan and Budget of
Ministries/Agencies.
The implementation of the new budgeting
system is in line with the term of the Budget
implementation (usually called a fiscal year). The fiscal
year initially ran from 1 April until 31 March of the next
year; it now runs from 1 January until 31 December.
This change is meant to adjust to international practice,
so that Indoesian Budget can be compared to those of
other countries.
The following paper and description will
penyusunan Anggaran Pendapatan dan Belanja
Negara (APBN) yang merupakan produk utama sistem
anggaran (negara) adalah:
1. Undang-Undang Dasar 1945 beserta
Amandemennya;
2. Undang-Undang Nomor 17 tahun 2003 tentang
Keuangan Negara;
3. Undang-Undang Nomor 1 Tahun 2004 tentang
Perbendaharaan Negara;
4. Undang-Undang No.15 tahun 2004 tentang
Pemeriksaan Pengelolaan dan Tanggung Jawab
Keuangan Negara;
5. Undang-Undang No.32 Tahun 2004 tentang
Pemerintahan Daerah;
6. Undang-Undang No.33 Tahun 2004 tentang
Perimbangan Keuangan Pemerintah Pusat dan
Pemerintah Daerah;
7. Peraturan Pemerintah No. 20 tahun 2004 tentang
Rencana Kerja Pemerintah;
8. Peraturan Pemerintah No.21 tahun 2004 tentang
Penyusunan Rencana Kerja dan Anggaran
Kementerian Negara/Lembaga.
Penerapan sistem penganggaran baru
tersebut sejalan dengan waktu pelaksanaan APBN
(biasa disebut sebagai tahun anggaran). Semula
tahun anggaran dimulai pada tanggal 1 April sampai
dengan 31 Maret tahun berikutnya, menjadi tanggal
1 Januari sampai dengan 31 Desember. Perubahan
tersebut menyesuaikan dengan praktek internasional
sehingga APBN kita dapat dibandingkan dengan
negara-negara lainnya.
Tulisan dan uraian berikut ini memfokuskan
SISTEM PENGANGGARAN | THE BUDGETING SYSTEM

109THE INDONESIANBUDGET OVERVIEW 2010
focus on the implementation and development of
the budget system in Central Government. Why?
Although the budget system and the principles used
by the Central and Regional Governments are the
same, at the operational level, the implementation
of budget systems by Regional Governments is
somewhat different1.
Approaches in Budget Formulation The new budget system as previously
described requires the Government to focus on the
performances to be achieved, as well as the budget
allocated for programs/activities that are implemented
through the formulation of budget documents. The
document commonly known as Work Plan and
Budget of Ministries/Agencies (RKA-KL) contains
information on policy and the budget allocation
impact for the society. The information set forth in the
RKA-KL includes:
a. An explanation of K/L policy in regard to the
achievement of measurable outcomes in
accordance with their respecitve missions in the
form of programs;
b. Annual activities to be implemented as a part
1 The legal basis of budgeting planning, which is Law No.
17 of 2003, is used as guideline in the state financial
management, both by central and regional governments.
In operational terms, the Central Government (in this case
K/L) uses the guidelines of the Regulation of the Minister
of Finance regarding RKA-KL Formulation and Review, while
the Regional Government is guided by a Regulation of the
Minister of Home Affairs.
pada penerapan dan pengembangan sistem
penganggaran pada Pemerintah Pusat. Mengapa?
Meskipun sistem penganggaran dan prinsip-prinsip
yang digunakan sama antara Pemerintah Pusat
dengan Pemerintah Daerah, tetapi penerapan sistem
penganggaran Pemerintah Daerah pada tataran
operasional agak sedikit berbeda1.
Pendekatan Penyusunan Anggaran Gambaran mengenai sistem penganggaran
baru sebagaimana uraian sebelumnya yang
mengharuskan Pemerintah untuk fokus kepada
kinerja yang akan dicapai beserta anggaran yang
dialokasikan pada program/kegiatan dilaksanakan
melalui penyusunan dokumen penganggaran.
Dokumen tersebut lebih dikenal dengan nama
Rencana Kerja dan Anggaran Kementerian Negara/
Lembaga (RKA-KL) yang berisikan informasi kebijakan
beserta dampak alokasi anggarannya bagi masyarakat.
Informasi yang dinyatakan dalam RKA-KL meliputi:
a. Penjabaran kebijakan K/L dalam rangka
pencapaian hasil yang terukur sesuai misinya
dalam bentuk program;
b. Keluaran kegiatan tahunan yang akan
1. Dasar hukum perencanaan penganggaran berupa UU No.17
tahun 2003 digunakan sebagai pedoman bagi pengelolaan
keuangan Negara baik Pemerintah Pusat maupun Pemerintah
Daerah. Pada tataran operasional Pemerintah Pusat (dalam
hal ini K/L) menggunakan pedoman Peraturan Menteri
Keuangan tentang Penyusunan dan Penelaahan RKA-KL.
Sedangkan Pemerintah Daerah berpedoman pada Peraturan
Menteri Dalam Negeri.
SISTEM PENGANGGARAN | THE BUDGETING SYSTEM

110 THE INDONESIANBUDGET OVERVIEW 2010
of the achievement of program measured
objectives;
c. Resources needed to implement the activity.
The formulation of the RKA-KL document
uses a unified budgeting approach, Medium-Term
Expenditure Framework (MTEF) budgeting, and
Performance-Based Budgeting (PBB).
Unified BudgetingUnified budgeting is the formulation of an
annual financial plan that is carried out in integrated
manner for all types of expenditures, in order to
implement government activities that are based on
the principle of in found allocation efficiency.
Unified budgeting is carried out by integrating
the routine and development budgets during the
initial stage, which is a part of the long-term effort
to make the budget more performance-oriented. The
integration aspect is also closely related to program/
activity planning, as set forth in the Government Work
Plan (RKP).
Based on this, it can be concluded that the
unified budgeting approach is the prerequisite for
the application of performance-based budgeting.
Therefore, in the formulation of work plans, K/Ls must
consider:
1. Integrated Management of activities;
2. Integration of types of expenditure under one
dilaksanakan sebagai bagian pencapaian sasaran
terukur program;
c. Sumber daya yang dibutuhkan untuk melaksakan
kegiatan.
Penyusunan dokumen RKA-KL tersebut
menggunakan pendekatan penganggaran terpadu,
penganggaran dalam Kerangka Pengeluaran Jangka
Menengah (KPJM) dan Penganggaran Berbasis Kinerja
(PBK).
Penganggaran TerpaduPenganggaran terpadu adalah penyusunan
rencana keuangan tahunan yang dilakukan
secara terintegrasi untuk seluruh jenis belanja
guna melaksanakan kegiatan pemerintahan yang
didasarkan pada prinsip pencapaian efisiensi alokasi
dana.
Penerapan anggaran terpadu dilakukan
dengan mengintegrasikan anggaran rutin dan
anggaran pembangunan sebagai tahapan awal yang
merupakan bagian dari upaya jangka panjang untuk
membawa penganggaran menjadi lebih berorientasi
kepada kinerja. Aspek keterpaduan juga terkait erat
dengan perencanaan program/kegiatan sebagaimana
tertuang dalam Rencana Kerja Pemerintah (RKP).
Berdasarkan hal tersebut dapat disimpulkan
bahwa pendekatan penganggaran terpadu merupakan
prasyarat penerapan penganggaran berbasis kinerja.
Oleh karena itu pada saat penyusunan rencana kerja,
K/L harus memperhatikan:
1. Keterpaduan pengelola kegiatan;
2. Keterpaduan jenis belanja dalam satu kegiatan;
SISTEM PENGANGGARAN | THE BUDGETING SYSTEM

111THE INDONESIANBUDGET OVERVIEW 2010
single activity;
3. Integration of programs/activities in line with the
function of a K/L;
4. Integration of programs/activities between K/Ls;
5. Integration of programs/activities either between
regional governments or between regional
governments and the central government.
The application of the unified budgeting
approach in the budget formulation (RKA-KL) is meant
to result in the integration of programs/activities,
type of expenditures, and budget management.
The purpose is to realize budget efficiency, as there
will be no funding duplication in programs/activities
or duplication of interest among budget managers,
as was the case in the period before the 2005 fiscal
year. The differences between the implementation of
dual budgeting and unified budgeting are shown in
Diagram 1.
3. Keterpaduan antar program/ kegiatan sesuai
fungsi dari suatu K/L;
4. Keterpaduan program / kegiatan antar K/L;
5. Keterpaduan program/kegiatan baik antar
pemerintah daerah maupun pemerintah pusat.
Penerapan pendekatan penganggaran
terpadu dalam penyusunan anggaran (RKA-KL)
hendak mewujudkan keterpaduan program/kegiatan,
jenis belanja, dan pengelola anggaran. Tujuannya
agar terwujud efisiensi anggaran, karena tidak ada
duplikasi pendanaan pada program/kegiatan dan
duplikasi kepentingan antara pengelola anggaran
sebagaimana terjadi pada masa sebelum tahun
anggaran 2005. Perbedaan wujud penerapan antara
penganggaran terpisah (dual budgeting) dengan
penganggaran terpadu (unified budget) sebagaimana
Diagram 1.
Diagram 1. Differences between Dual Budget and Unified Budget
DUAL BUDGET
Head of Office (Routine Budget)
Program
Activity - Basic Activity- Supporting Activity
Head of Project (Development Budget)
Program
Project – National Priority
MAK Routine Budget- Personnel
Expenditure- Goods Expenditure- Other Expenditure- Travel Expenditure
MAK Development Budget Capital Expenditure
Activity Sectoral Approach
1
2
UNIFIED BUDGET
Head of Office / KPA
Program
Activity- Basic Activity
Salary PaymentOffice Operational & Maintenance
Activity National Priority
Supporting
MAK : there is no utilization overlapping between one MAK and the other.
Institutional Functional Approach
1
2
SISTEM PENGANGGARAN | THE BUDGETING SYSTEM

112 THE INDONESIANBUDGET OVERVIEW 2010
Medium-Term Expenditure Framework (MTEF)
The Medium-term expenditure framework is
a policy-based budgeting approach where the policy
decision are made within the perspective of more than
one fiscal year, by considering the cost implication of
the decision in the following years as set forth in the
forward estimates.
The above definition of MTEF shows that there
are 2 (two) main issues related to its implementation:
high policy credibility; and reliable fiscal policy. High
policy credibility can be achieved if a K/L has flexibility
in determining its policy and priorities and the same
time, information regarding available resources.
Information on the resource availability is meant to
reduce uncertainty in terms of the provision of funds
in the future, and to finance various new policies
by taking into account the implication of the new
policies on fiscal sustainability. Hence, a K/L can focus
on policies that can be financed, and in the end fiscal
discipline can be maintained. The ideal illustration of
the implementation of MTEF is shown in Diagram 2.
In other words, the purposes of applying
MTEF to budget formulation are:
1. To improve fiscal discipline and sustainability
by developing a consistent and realistic fund
Penganggaran dalam Kerangka Pengeluaran Jangka
Menengah (KPJM)
Kerangka pengeluaran jangka menengah
adalah pendekatan penganggaran berdasarkan
kebijakan, dengan pengambilan keputusan terhadap
kebijakan tersebut dilakukan dalam perspektif lebih
dari satu tahun anggaran, dengan mempertimbangkan
implikasi biaya keputusan yang bersangkutan pada
tahun berikutnya yang dituangkan dalam prakiraan
maju.
Pengertian KPJM tersebut di atas
menunjukkan bahwa ada 2 (dua) hal pokok terkait
dengan penerapannya: kredibiltas kebijakan yang
tinggi; dan kebijakan fiskal yang handal. Kredibiltas
kebijakan yang tinggi dapat tercapai apabila K/L
mempunyai fleksibilitas dalam penentuan kebijakan
dan prioritasnya. Pada saat yang bersamaan K/
L mempunyai informasi mengenai sumber daya
yang tersedia. Informasi atas ketersediaan sumber
daya tersebut dimaksudkan untuk mengurangi
ketidakpastian penyediaan dana di masa yang akan
datang, serta untuk membiayai berbagai kebijakan
baru dengan memperhitungkan implikasi kebijakan
baru terhadap kesinambungan fiskal. Dengan
demikian K/L dapat memusatkan perhatian pada
kebijakan yang dapat dibiayai, dan pada akhirnya
disiplin fiskal terjaga. Gambaran ideal penerapan
KPJM dimaksud sebagaimana Diagram 2.
Dengan kata lain bahwa tujuan penerapan
KPJM dalam penyusunan anggaran adalah:
1. Meningkatkan keseimbangan makroekonomi
dengan mengembangkan kerangka ketersediaan
SISTEM PENGANGGARAN | THE BUDGETING SYSTEM

113THE INDONESIANBUDGET OVERVIEW 2010
availability framework;
2. To improve allocation of funds in line with the
priorities to be achieved;
3. To enhance the certainty of allocations for multiyear
needs;
4. To provide hard budget constrains for
expenditures.
Diagram 2. Ideal Framework of MTEF
Implementation
Below is a description of the successful
application of MTEF `in 2 (two) countries in
supporting fiscal discipline, which in turn supports
fiscal sustainability. After the application of MTEF in
dana yang konsisten dan realistis;
2. Memperbaiki alokasi pendanaan sesuai dengan
prioritas yang hendak dicapai;
3. Meningkatkan kepastian akan alokasi atas
kebutuhan yang bersifat multiyears;
4. Memberi hard budget constraint untuk belanja.
Diagram 2. Kerangka Ideal Penerapan KPJM
Berikut ini diuraikan keberhasilan penerapan
KPJM di 2 (dua) negara dalam mendukung disiplin
fiskal yang pada gilirannya mendukung adanya
kesinambungan fiskal (fiscal sustainability). Defisit
5
1. To enhance the macroeconomic balance by developing a consistent and realistic
fund availability framework;
2. To improve fund allocation in line with the priorities to be achieved;
3. To enhance the certainty of allocations for multiyear needs;
4. To provide hard budget constrains for expenditures.
Diagram 2. Ideal Framework of MTEF Implementation
Below is a description of the successful application of MTEF `in 2 (two)
countries in supporting fiscal discipline, which in turn supports fiscal sustainability.
After the application of MTEF in its budgeting process, Sweden underwent significant
changes in terms of expenditure budget deficit. Initially the deficit was 10.8% of the
Gross Domestic Product in 1994; it then became a surplus of 4.8% in 2001. British
government investment underwent a significant increase from 20 billion pounds in
1997 to 31 billion pounds in 2003 after the application of MTEF2.
Performance-Based Budgeting (PBB)
2 Reformasi Sistem Penganggaran: Konsep dan Implementasi 2005 – 2007 (2006) , Directorate General of Budgeting, footnotes No. 19 and 20, page 45.
Long Term Development Plan
RPJM Renstra KL
RKP RK -KL
Program Kegiatn Output Outcome
Visi
Visi Presiden
“Performance -based budget”
20 years
5 years
1 years
KPJM
RKA -KL (APBN)
1)
3)
5)
Nasional
1) : Translated 2) : Summarized 3) : Indication of Founding
1)
4)
1)
1)
4) : Certainty of Funding
5)5)1)
5) : Obtain
3)
2)
2)
6) : Forward Projection
RPJM Renstra KL
RKP RK -KL
Program Activity Output Outcome
National
Vision ofThe President
“Performance -based budget”
20
5 t
1 t
KPJM
RKA -KL (APBN)
1)
3)
5)
Vision
1) 2) 3)
1)
4)
1)
1)
4)
5)5)1)
5)
3)
2)
2)
6)
to
achieve
SISTEM PENGANGGARAN | THE BUDGETING SYSTEM

114 THE INDONESIANBUDGET OVERVIEW 2010
the budget process, Sweden underwent significant
changes in terms of expenditure budget deficit.
Initially in 1994 the deficit was 10.8% of the Gross
Domestic Product in 2001; it then became a surplus of
4.8%. In Britain government investment underwent
a significant increase from 20 billion pounds in 1997
to 31 billion pounds in 2003 after the application of
MTEF2.
Performance-Based Budgeting (PBB)
Performance-based budgeting is a budget
formulation concept that considers the linkage
between funding and the expected outputs and
outcomes, including efficiency in the achievement of
outcomes and outputs.
The formulation of a performance-based
budget requires performance indicators, cost standards
and a performance evaluation of every program and \
activity. A performance indicator is a brief description
illustrating a performance to be measured in the
implementation of a program/activity. A cost standard
is the price per output unit that is used as a tool
to measure efficiency. Meanwhile, performance
evaluation is a measuring device to see whether or not
a planned strategy or program/activity has succeeded/
failed in achieving the stated goals.
2 Reformasi Sistem Penganggaran: Konsep dan Implementasi
2005 – 2007 (2006) , Directorate General of Budgeting,
footnotes No. 19 and 20, page 45.
anggaran belanja negara Swedia setelah penerapan
KPJM dalam proses penganggarannya mengalami
perubahan yang mendasar (significant), semula defisit
10,8 % dari Product Domestic Bruto pada tahun 1994,
menjadi surplus 4,8 % pada tahun 2001. Investasi
pemerintah Inggris mengalami peningkatan secara
significant dari 20 miliar pounds pada tahun 1997,
menjadi 31 miliar pounds pada tahun 2003 setelah
penerapan KPJM2.
Penganggaran Berbasis Kinerja (PBK)
Penganggaran berbasis kinerja merupakan
konsep penyusunan anggaran yang memperhatikan
keterkaitan antara pendanaan dengan keluaran
dan hasil yang diharapkan, termasuk efisiensi dalam
pencapaian hasil dan keluaran tersebut.
Penyusunan anggaran berbasis kinerja
memerlukan adanya indikator kinerja, standar biaya
dan evaluasi kinerja dari setiap program dan jenis
kegiatan. Indikator kinerja merupakan uraian ringkas
yang menggambarkan suatu kinerja yang akan diukur
terhadap pelaksanaan suatu program/kegiatan.
Standar biaya merupakan harga per satuan keluaran
atau kegiatan yang digunakan sebagai alat ukur
efisiensi. Sedangkan evaluasi kinerja merupakan alat
ukur untuk melihat apakah suatu strategi, program/
kegiatan yang direncanakan berhasil/gagal dalam
mencapai tujuan yang telah ditentukan.
2 Buku Reformasi Sistem Penganggaran : Konsep dan
Implementasi 2005 – 2007 (2006) , Direktorat Jenderal
Anggaran, keterangan catatan kaki no. 19 dan 20, halaman
45.
SISTEM PENGANGGARAN | THE BUDGETING SYSTEM

115THE INDONESIANBUDGET OVERVIEW 2010
The determination of a performance
indicator must be clear, in line with the achievement
of organizational goals, funds must be available
as well as an adequate basis or foundation, and its
success can be monitored. Budget formulation that
refers to a performance indicator is reflected in a
measurable output unit. This approach emphasizes
that K/L programs and activities must be directed
towards achieving the stated output and outcome in
accordance with the RKP.
The formulation and determination of
performance indicators is important as a part of
the performance information presented by the
Government to the DPR/DPRD. The DPR/DPRD as
public representatives can examine whether the public
funds have been effectively and efficiently utilized by
the Government in the interest of the public.
The realization of a performance indicator
must be evaluated. In addition to being a tool to
assess the success of a program/activity, performance
evaluation is also meant as a source of information
to improve the formulation of performance indicators
and targets in the future.
With the respect to expenditure efficiency,
budgeting also needs to determine the method of cost
calculation for every output unit and to take common
costs3 into account. The result of this is a cost standard
that is used to estimate the budget allocation needed
3 A cost resulting from the joint utilization of a facility to produce several outputs
Penetapan suatu indikator kinerja harus jelas
(clear), sejalan dengan pencapaian tujuan organisasi,
tersedia biayanya, mempunyai dasar yang cukup atau
argumentasi untuk ditetapkan (adequate), dan dapat
dimonitor keberhasilannya. Penyusunan anggaran
yang mengacu kepada indikator kinerja dicerminkan
dalam satuan keluaran yang terukur. Pendekatan ini
menekankan bahwa program dan kegiatan K/L harus
diarahkan untuk mencapai hasil dan keluaran yang
telah ditetapkan sesuai dengan RKP.
Perumusan dan penetapan indikator kinerja
merupakan suatu hal yang penting sebagai bagian
dari informasi kinerja yang disampaikan Pemerintah
kepada DPR/DPRD. DPR/DPRD sebagai representasi
rakyat dapat mencermati apakah uang yang berasal
dari publik telah digunakan oleh Pemerintah secara
efektif dan efisien untuk kepentingan publik.
Capaian suatu indikator kinerja yang telah
ditetapkan perlu dievaluasi realisasinya. Evaluasi
kinerja disamping sebagai alat (tools) untuk melihat
keberhasilan program/kegiatan, juga dimaksudkan
sebagai sumber informasi untuk memperbaiki
perumusan indikator kinerja dan target pada masa
yang akan datang.
Dalam rangka efisiensi belanja, penerapan
penganggaran perlu menentukan metode
perhitungan biaya untuk masing-masing unit keluaran
dan memperhitungkan biaya bersama (common
cost)3. Hasilnya merupakan standar biaya yang
3 suatu biaya yang diakibatkan oleh pemanfaatan fasilitas secara bersama untuk menghasilkan beberapa keluaran
SISTEM PENGANGGARAN | THE BUDGETING SYSTEM

116 THE INDONESIANBUDGET OVERVIEW 2010
by a program/activity.
The implementation of performance-based
budgeting is carried out through the following steps
or conditions:
1. Prioritizing the achievement of outputs and
outcomes
2. Having certain objective to be achieved;
3. Having a linkage between activity output and
program objective (cascade); and
4. Having clearlines of accountability in terms of
persons in charge for the success of a program.
The ideal illustration of appliying PBB to the budget
process is seen through the existence of a close
linkage between target performance (in the form
of performance indicators, outcome and output)
the budget allocation, and person in charge of the
program/activity, as shown in Diagram 3.
Budget ClassificationIn addition to using the budgeting approaches
as described above, the budget formulation carried
out by a K/L in the RKA-KL document also uses
budget classifications. The budget classifications are:
classification by function, by organization and by type
of expenditure.
Classification by Organization
Classification by organization is classification
of expenditure budget allocations in line with the
digunakan untuk memperkirakan alokasi anggaran
yang diperlukan oleh suatu program/kegiatan.
Wujud penerapan penganggaran berbasis
kinerja dilakukan melalui langkah atau kondisi:
1. Mengutamakan upaya pencapaian hasil kerja
(output) dan dampak (outcome);
2. Adanya sasaran tertentu yang hendak dicapai;
3. Adanya keterkaitan output kegiatan dan sasaran
program (cascade); dan
4. Adanya kepastian penanggung jawab keberhasilan
suatu program.
Gambaran ideal penerapan PBK dalam penganggaran
terlihat adanya keterkaitan yang erat antara target
kinerja (terwujud dalam bentuk indikator kinerja,
outcome, dan output) dengan alokasi anggarannya,
serta penanggung jawab program/kegiatan,
sebagaimana Diagram 3.
Klasifikasi AnggaranPenyusunan anggaran yang dilakukan oleh K/
L dalam dokumen RKA-KL disamping menggunakan
pendekatan penganggaran sebagaimana uraian
tersebut di atas, juga menggunakan klasifikasi
anggaran. Klasifikasi anggaran yang digunakan
adalah klasifikasi menurut fungsi, organisasi, dan jenis
belanja.
Klasifikasi Menurut Organisasi
Klasifikasi organisasi merupakan
pengelompokan alokasi anggaran belanja sesuai
SISTEM PENGANGGARAN | THE BUDGETING SYSTEM

117THE INDONESIANBUDGET OVERVIEW 2010
organizational structure of Ministries/Agencies (K/Ls).
The organizational level is the K/L that is established
to undertake certain duties based on the 1945
Constitution and applicable laws and regulations. A
K/L may consist of organizational units (Echelon I Units).
Such an organizational unit is supported by work units
that are responsible for undertaking activities from the
Echelon I unit’s program or Government policy, and
which function as Authorized Budget Users (Kuasa
Pengguna Anggaran).
The classification of budget expenditures
by organization is called a Budget Account (Bagian
Anggaran – BA) that can be divided into 2 (two)
groups. First is the K/L Budget Portion, hereinafter
referred to as BA-KL, which is a group of budget
allocations that are authorized to the Minister/Head of
dengan struktur organisasi Kementerian Negara/
Lembaga (K/L). Tentunya, tingkatan organisasi ini
adalah K/L yang dibentuk untuk melaksanakan tugas
tertentu berdasarkan UUD 1945 dan peraturan
perundangan yang berlaku. Suatu K/L bisa terdiri dari
unit-unit organisasi (Unit Eselon I) yang merupakan
bagian dari suatu K/L. Unit organisasi ini didukung
oleh satuan kerja (Satker) yang bertanggungjawab
melaksanakan kegiatan dari program unit eselon
I atau kebijakan Pemerintah dan berfungsi sebagai
Kuasa Pengguna Anggaran.
Klasifikasi anggaran belanja berdasarkan
organisasi menurut K/L disebut Bagian Anggaran (BA)
yang dapat dibagi dalam 2 (dua) kelompok. Pertama,
Bagian Anggaran K/L yang selanjutnya disebut BA-KL
adalah kelompok alokasi anggaran yang dikuasakan
Diagram 3. Performance and Budget
SISTEM PENGANGGARAN | THE BUDGETING SYSTEM
PBB : Performance and Budget Link
NATIONAL LEVEL MINISTRIES/AGENCIES
PRIORITIESECHELON I
ECHELON II /WORK UNITPRIORITIES FOCUS
PRIORITIESACTIVITIES
PRIORITIESACTIVITIES
ACTIVITIES BASED ONTASK AND FINCTION
OUTPUT ANDVOLUME OUTPUTOUTPUT AND
VOLUME OUTPUT
PERFORMANCE TARGET
PERFORMANCE TARGET
TOTAL Rp
TOTAL Rp
PROGRAM
PERFORMANCEINDICATOR
NATIONAL PERFORMANCE INDICATOR
· Function and Sub Function;· Priorities on Non-priorities.
TOTAL Rp
NATIONALPERFORMANCE INCATOR
TOTAL RpTOTAL Rp
PERFORMANCE INDICATORPERFORMANCE
INDICATOR

118 THE INDONESIANBUDGET OVERVIEW 2010
an Agency as the Budget User. Second is the General
Treasurer Budget Portion, hereinafter referred to as
BA-BUN, which is a group of budget allocations that
are managed by the Minister of Finance as the Fiscal
Administrator.
K/L organizational unit as described above
is an Echelon I Unit responsible for the achievement
of program objectives/outcomes and for coordinating
activity implementation done by work units.
Classification by Function
Budget classification by function details
budget expenditures by function and sub-function as
follows:
1. Function
Function is a materialization of governmental
duties in certain fields that are carried out in
order to achieve national development goals.
Classification by function in The Indonesian
Budget is divided into 11 (eleven) functions.
2. Sub-function
Sub-function is a further detailing of function and
is divided into 79 (seventy nine) sub-functions.
The application of classification by function is
linked to a programs that will be implemented by K/Ls
in line with their main duties. A program supports one
of the functions/sub-functions and such program can
be implemented concurrently by several K/Ls.
kepada Menteri/Pimpinan Lembaga selaku Pengguna
Anggaran. Kedua, Bagian Anggaran Bendahara
Umum Negara, yang selanjutnya disebut BA-BUN
adalah kelompok alokasi anggaran yang dikelola oleh
Menteri Keuangan selaku Pengelola Fiskal.
Sedangkan yang dimaksud dengan unit
organisasi pada K/L sebagaimana uraian tersebut di
atas adalah Unit Eselon I yang bertanggung jawab
atas pencapaian sasaran program/hasil (outcome) dan
pengkoordinasian atas pelaksanaan kegiatan oleh
satuan kerja.
Klasifikasi Menurut Fungsi
Klasifikasi anggaran menurut fungsi merinci
anggaran belanja menurut fungsi dan sub fungsi
sebagai berikut:
1. Fungsi
Fungsi adalah perwujudan tugas kepemerintahan
di bidang tertentu yang dilaksanakan dalam
rangka mencapai tujuan pembangunan nasional.
Klasifikasi fungsi yang digunakan dalam APBN
dibagi dalam 11 (sebelas) fungsi.
2. Subfungsi
Sub fungsi merupakan penjabaran lebih lanjut
dari fungsi dan terinci ke dalam 79 (tujuh puluh
sembilan) sub fungsi.
Penerapan klasifikasi menurut fungsi
tersebut dikaitkan dengan program-program yang
dilaksanakan oleh K/L sesuai dengan tugas pokoknya.
Suatu program mendukung salah satu fungsi/
subfungsi dan program dimaksud dapat dilaksanakan
SISTEM PENGANGGARAN | THE BUDGETING SYSTEM

119THE INDONESIANBUDGET OVERVIEW 2010
A Program is a classification of K/L policy in
certain fields that is implemented in the form of one
or several activities, by using the available resources to
achieve measurable outcomes in line with its mission,
and which is carried out by an institution or society
in coordination with the concerned K/L. Therefore,
a program description must clearly show the linkage
with the underlying policy, and must have clear
and measurable performance objectives in order to
support the achievement of policy goals. A program
can be further detailed in the form of activities.
An Activity is a part of a program that is
carried out by one or several work units as part of
the achievement of the measurable objectives of
a program, which consists of a number of resource
deployment actions, whether in terms of personnel
(human resource), goods, capital including equipment
and technology, funds, or a combination of some or
all types of resources as input to produce output in the
form of goods/services.
Economic Classification (Type of Expenditure)
Economic classification or type of expenditure
is used in budgeting documents, whether in budget
formulation, budget implementation or in budget
reporting/accountability. However, the use of type
of expenditure in those documents has different
purposes. In relation to the budget formulation
sekaligus oleh beberapa K/L.
Program adalah penjabaran kebijakan K/L
di bidang tertentu yang dilaksanakan dalam bentuk
upaya yang berisi satu atau beberapa kegiatan dengan
menggunakan sumber daya yang disediakan untuk
mecapai hasil yang terukur sesuai dengan misinya
yang dilaksanakan instansi atau masyarakat dalam
koordinasi K/L yang bersangkutan. Dengan demikian,
rumusan program harus secara jelas menunjukkan
keterkaitan dengan kebijakan yang mendasarinya,
memiliki sasaran kinerja yang jelas dan terukur untuk
mendukung upaya pencapaian tujuan kebijakan yang
bersangkutan. Suatu program dijabarkan lebih lanjut
dalam bentuk kegiatan.
Kegiatan adalah bagian dari program yang
dilaksanakan oleh satu atau beberapa satuan kerja
sebagai bagaian dari pencapaian sasaran terukur pada
suatu program yang terdiri dari sekumpulan tindakan
pengerahan sumber daya baik yang berupa personil
(sumber daya manusia), barang, modal termasuk
peralatan dan teknologi, dana, atau kombinasi dari
beberapa atau semua jenis sumber daya tersebut
sebagai masukan (input) untuk menghasilkan keluaran
(output) dalam bentuk barang/jasa.
Klasifikasi Ekonomi (Jenis Belanja)
Klasifikasi ekonomi atau jenis belanja
digunakan dalam dokumen penganggaran baik dalam
proses penyusunan anggaran, pelaksanan anggaran,
dan pertangungjawaban/pelaporan anggaran.
Namun penggunaan jenis belanja dalam dokumen
tersebut mempunyai tujuan berbeda. Dalam kaitan
SISTEM PENGANGGARAN | THE BUDGETING SYSTEM

120 THE INDONESIANBUDGET OVERVIEW 2010
process, the purpose of using type of expenditure
is to find out the distribution of budget allocations
according to types of expenditure.
In budget formulation (RKA-KL), the use of
type of expenditure refers to the Regulation of the
Minister of Finance regarding the Chart of Accounts
(Bagan Akun Standar/BAS) with technical explanation
in the Technical Bulletin of the Government Accounting
Standard Committee (Komite Standar Akuntansi
Pemerintah - KSAP).
Types of expenditure used in the RKA-KL
formulation are as follows: Personnel Expenditures,
Goods Expenditures, Capital Expenditures, Loan
Interest, Subsidies, Social Assistance, Grants, and
Other Expenditures.
Budgeting ProcessFormulation
The budgeting process, as shown in Figure 1,
is explained as follows:
1. The Minister of Planning and the Minister of
Finance will issue a Joint Circular regarding
Indicative Ceilings, which is an estimation of K/L
budget ceilings for each program, as a reference
in the formulation of K/L work plans. Based on
the national priorities and the indicative ceilings,
Ministries/Agencies will set the work plans for the
following fiscal year.
2. Based on the result of discussions between the
Government and the House of Representatives
regarding fiscal policy principles, macro economy
proses penyusunan anggaran tujuan penggunaan
jenis belanja ini dimaksudkan untuk mengetahui
pendistribusian alokasi anggaran kedalam jenis–jenis
belanja.
Dalam penyusunan anggaran (RKA-KL)
penggunaan jenis belanja mengacu pada Peraturan
Menteri Keuangan (PMK) mengenai Bagan Akun
Standar (BAS) dengan penjelasan teknis pada Buletin
Teknis Komite Standar Akuntansi Pemerintah (KSAP).
Jenis-jenis belanja yang digunakan dalam
penyusunan RKA-KL adalah berikut: Belanja Pegawai,
Belanja Barang, Belanja Modal, Bunga Utang, Subsidi,
Bantuan sosial, Hibah, dan Belanja lain-lain.
Proses PenganggaranPenyusunan
Proses penyusunan APBN, sebagaimana
terlihat dalam diagram 1, adalah sebagai berikut:
1. Menteri Perencanaan dan Menteri Keuangan
menetapkan Surat Edaran Bersama (SEB)
tentang Pagu Indikatif, yang merupakan ancar-
ancar pagu anggaran K/L untuk setiap program
sebagai acuan dalam penyusunan rencana kerja
K/L. Berdasarkan prioritas pembangunan dan
pagu indikatif, Kementerian Negara/Lembaga
menyusun rencana kerja untuk tahun anggaran
berikutnya.
2. Berdasarkan hasil pembahasan antara Pemerintah
dengan DPR terhadap pokok-pokok kebijakan
fiskal, kerangka ekonomi makro, dan RKP
SISTEM PENGANGGARAN | THE BUDGETING SYSTEM

121THE INDONESIANBUDGET OVERVIEW 2010
and RKP, the Ministry of Finance will establish a
Circular of Temporary Ceilings containing budget
ceilings for every program for each respective
ministry/agency.
Diagram 1. Process of Budget Formulation
3. After receiving the decision on temporary ceilings
through the Circular of the Minister of Finance in
mid-June, the ministries/agencies formulate the
RKA-KL, using the Government Work Plan as a
guideline and taking the following approach: (a)
Medium-Term Expenditure Framework; (b) Unified
Budget; and (c) Performance-based Budgeting.
The work plan will consist of the vision, missions,
Menteri Keuangan menetapkan Surat Edaran (SE)
pagu sementara yang berisikan pagu anggaran
tiap program untuk masing-masing kementerian
negara/lembaga.
Diagram 1. Proses Penyusunan APBN
3. Setelah menerima keputusan mengenai pagu
sementara melalui SE Menteri Keuangan
pada pertengahan bulan Juni, Kementerian
Negara/Lembaga menyusun RKA-KL dengan
berpedoman pada Rencana Kerja Pemerintah
dan menggunakan pendekatan: (a) Kerangka
Pengeluaran Jangka Menengah; (b) Penganggaran
Terpadu; dan (c) Penganggaran Berbasis Kinerja.
11
FIGURE OF FORMULATION PROCESS FOR WORK PLAN AND BUDGETS OF LINE MINISTRIES/ AGENCIES
JANUARY – APRIL
Strategic Plan of Line
MinistriesKL
SEPTEMBER - DECEMBER
PRESIDENTIAL DECREE ON THE STATE BUDGET
DETAIL
MAY-AUGUST
General Policy and Budget Priority
EXAMINATION OF CONSISTENCY WITH BUDGET PRIORITY
Discussion on Fiscal Policy Principles &Government Work Plan (RKP)
Discussion onRKA-KL
DISCUSSION ON
PROPOSED
APPROVAL
HOUSE OF REPRESEN-
TATIVES
CABINET/PRESIDENT
PLANNING MINISTRIES
FINANCIAL MINISTRIES
Line Ministries/ Agencies
(4)
(7)
(8) (9)
(5)
(2)
(6)
(11)
(12)
Work Plan of Line
Ministries
AS THE PROGRAM PRIORITY AND INDICATIVE CEILING
(1)(14)
(13)
(10)
(3)
Local Government
EXAMINATION TO COMPARE
WITH RKP
DRAFT OF PRESIDENTIAL DECREE ON
STATE BUDGET DETAIL
LAW OF STATE
BUDGET
FINANCIAL NOTE AND OF
STATE BUDGET DRAFT AND
ATTACHMENT
STATE BUDGET DRAFT (RKAKLCOMPILATION)AS THE
TEMPORARY CEILING
CONCEPT OF BUDGET
IMPLEMENTATIONDOCUMENT
BUDGET RKA-KL
3. After receiving the decision on temporary ceilings through the Circular of the
Minister of Finance in mid-June, the state ministries/agencies formulate the RKA-
KL, using the Government Work Plan as a guideline and taking the following
approach: (a) Medium-Term Expenditure Framework; (b) Unified Budget; and (c)
Performance-based Budgeting.
The work plan will consist of the vision, missions, objectives, policies, programs,
expected outcomes, activities and planned outputs. Meanwhile, the budget will
indicate the cost for each program and activity, which will be specified by type of
expenditure, forward estimates for the following year, and the sources and target
of state ministry’s/agency’s revenues.
4. The K/Ls will discuss the RKA-KL together with the related commissions in the
DPR, and the result will be submitted to the Ministry of Finance and the Ministry
of Planning by July at the latest.
5. The Ministry of Finance will examine whether the RKA-KL, which is the
discussion result with the DPR, is in line with the Circular of the Ministry of
Finance regarding Temporary Ceilings, the Forward Estimates that have been
approved in the previous fiscal year, and the stated cost standards. Meanwhile, the
IMPLEMENTATIONDOCUMENT
SISTEM PENGANGGARAN | THE BUDGETING SYSTEM

122 THE INDONESIANBUDGET OVERVIEW 2010
objectives, policies, programs, expected outcomes,
activities and planned outputs. Meanwhile, the
budget will indicate the cost for each program
and activity, which will be specified by type of
expenditure, forward estimates for the following
year, and the sources and target of ministry’s/
agency’s revenues.
4. The K/Ls will discuss the RKA-KL together with
the related commissions in the DPR, and the
result will be submitted to the Ministry of Finance
and the Ministry of Planning by July at the latest.
5. The Ministry of Finance will examine whether the
RKA-KL, which is the discussion result with the
DPR, is in line with the Circular of the Ministry
of Finance regarding Temporary Ceilings, the
Forward Estimates that have been approved
in the previous fiscal year, and the stated cost
standards. Meanwhile, the Ministry of Planning
will examine whether the RKA-KL, which is the
discussion result with the DPR, is in line with the
RKP.
6. The Ministry of Finance will then compile the
RKA-KL that has been reviewed and will be used
as Appendix to the Proposed Budget.
7. The Cabinet Meeting will discuss the Appendix
to the Proposed Budget along with the Financial
Note and the Proposed Budget. This stage will be
conducted by mid-August at the latest.
8. The Government will submit The Indonesian
Dalam rencana kerja diuraikan visi, misi, tujuan,
kebijakan, program, hasil yang diharapkan,
kegiatan dan keluaran yang direncanakan.
Sedangkan di dalam anggaran diuraikan biaya
untuk masing-masing program dan kegiatan
serta dirinci menurut jenis belanja, prakiraan maju
untuk tahun berikutnya serta sumber dan target
pendapatan K/L yang bersangkutan.
4. K/L membahas RKA-KL bersama-sama dengan
komisi terkait DPR dan hasilnya disampaikan
kepada Kementerian Keuangan dan Kementerian
Perencanaan selambat-lambatnya pada bulan
Juli.
5. Kementerian Keuangan akan menelaah kesesuaian
antara RKA-KL hasil pembahasan bersama
DPR dengan Surat Edaran Menteri Keuangan
tentang Pagu Sementara, Prakiraan Maju yang
telah disetujui tahun anggaran sebelumnya dan
standar biaya yang telah ditetapkan. Sedangkan
Kementerian Perencanaan akan menelaah
kesesuaian antara RKA-KL hasil pembahasan
bersama DPR dengan RKP.
6. Kementerian Keuangan selanjutnya menghimpun
RKA-KL yang telah di telaah dan digunakan
sebagai Lampiran RAPBN.
7. Sidang Kabinet membahas Lampiran RAPBN
bersama-sama dengan Nota Keuangan dan
RAPBN. Tahapan ini dilakukan selambat-
lambatnya pertengahan bulan Agustus.
8. Pemerintah menyampaikan RUU APBN, Nota
SISTEM PENGANGGARAN | THE BUDGETING SYSTEM

123THE INDONESIANBUDGET OVERVIEW 2010
Budget Bill, Financial Note and the Appendixes to
the DPR. The DPR will then undertake discussion
on the Proposed Budget with the Government.
9. The outcome of the discussion on the Proposed
Budget is the enactment of Budget Law by the
end of October at the latest.
10. The Ministry of Finance formulates the draft of
the Presidential Regulation regarding the Details
of The Indonesian Budget, based on the RKA-
KL that has been approved by the DPR, to be
submitted to the President.
11. The President stipulates the Presidential Regulation
regarding the Details of The Indonesian Budget
by the end of November at the latest.
12. The K/Ls formulate the concept of the Budget
Implementation Registration Form (DIPA) based
on the Presidential Regulation regarding the
Details of The Indonesian Budget, which is
submitted to the Minister of Finance (c.q. the
Directorate General of Treasury) as the Treasurer
by the second week of December at the latest.
13. The Minister of Finance c.q. the Directorate
General of Treasury approves the DIPA by the 31st
of December at the latest.
14. The DIPA, which has been approved, is the budget
implementation document that is effective
starting on January 1st.
Budget Implementation
Law No. 17 of 2003 explicitly sets forth
the authority of the Minister of Finance as the
Keuangan, dan Lampirannya kepada DPR.
Selanjutnya DPR melaklukan pembahasan RAPBN
dengan Pemerintah.
9. Hasil pembahasan RAPBN adalah ditetapkannya
Undang-Undang APBN selambat-lambatnya
pada akhir bulan Oktober.
10. Kementerian Keuangan menyusun rancangan
Peraturan Presiden (Perpres) tentang Rincian
APBN berdasarkan RKA-KL yang telah disepakati
DPR untuk diajukan kepada Presiden.
11. Presiden menetapkan Perpres tentang Rincian
APBN selambat-lambatnya akhir bulan
November.
12. K/L menyusun konsep dokumen pelaksanaan
anggaran (DIPA) berdasarkan Perpres tentang
Rincian APBN dan disampaikan kepada Menteri
Keuangan (c.q. Ditjen Perbendaharaan) selaku
Bendahara Umum Negara selambat-lambatnya
minggu kedua bulan Desember .
13. Menteri Keuangan c.q. Direktur Jenderal
Perbendaharaan mengesahkan DIPA selambat-
lambatnya tanggal 31 Desember.
14. DIPA yang telah disahkan merupakan dokumen
pelaksanaan anggaran yang berlaku efektif mulai
tanggal 1 Januari.
Pelaksanaan Anggaran
Undang-Undang No. 17 Tahun 2003
menetapkan secara tegas kewenangan Menteri
SISTEM PENGANGGARAN | THE BUDGETING SYSTEM

124 THE INDONESIANBUDGET OVERVIEW 2010
Chief Financial Officer who has the authority and is
responsible for the management of state assets and
obligations; while the Minister/Head of Agency is
the Chief Operational Officer who has the authority
and is responsible for government implementation in
accordance with duties and functions. In other words,
there is a separation between administrative authority
and treasury-related authority.
Administrative authority consists of: making
binding commitments or other activity that will
result in incurring state revenues or expenditures;
conducting evaluations and invoicing of bills submitted
to ministries/agencies related to the realization of
those commitments; and issuing payment orders or
collecting revenues arising as a consequence of the
budget implementation.
The Minister of Finance, who also acts as the
Treasurer and other officials appointed as Proxies of
the Treasurer are not only authorized in the matter
of state revenue and expenditure, but also have the
right to undertake monitoring and evaluation (monev)
on the revenue and expenditure. The monev report is
used as one of the materials in making the financial
management policy.
Accountability
Law 17 of 2003 states that the budget
implementation accountability report is submitted in
Keuangan sebagai Chief Financial Officer yang
berwenang dan bertanggung jawab atas pengelolaan
asset dan kewajiban Negara, sementara Menteri/
Pimpinan Lembaga merupakan Chief Operational
Officer yang berwenang dan bertanggung jawab
atas penyelenggaraan pemerintahan sesuai dengan
tugas dan fungsi masing-masing. Dengan kata lain,
ada pemisahan antara pemegang kewenangan
administratif dengan pemegang kewenangan
kebendaharaan.
Kewenangan administratif meliputi
melakukan perikatan atau tindakan-tindakan
lain yang mengakibatkan terjadinya penerimaan
dan pengeluaran negara, melakukan pengujian
dan pembebanan tagihan yang diajukan kepada
kementerian negara/lembaga sehubungan dengan
realisasi perikatan tersebut, serta memerintahkan
pembayaran atau menagih penerimaan yang timbul
sebagai akibat pelaksanaan anggaran.
Menteri Keuangan yang juga selaku
Bendahara Umum Negara dan pejabat lain yang
ditunjuk sebagai Kuasa Bendahara Umum Negara
bukan hanya berwenang dalam hal penerimaan dan
pengeluaran Negara, namun juga berhak melakukan
monitoring-evaluasi (monev) terhadap penerimaan
dan pengeluaran tersebut. Hasil laporan monev
digunakan sebagai salah satu bahan pengambilan
kebijakan pengelolaan keuangan negara.
Pertanggungjawaban
UU No. 17 tahun 2003 menetapkan bahwa
laporan pertanggungjawaban pelaksanaan APBN
SISTEM PENGANGGARAN | THE BUDGETING SYSTEM
125THE INDONESIANBUDGET OVERVIEW 2010
the form of a financial report consisting of the budget
realization report, balance sheet, cash flow report,
and notes on the financial report, that are formulated
in accordance with the government accounting
standard. The Government financial report must
meet the principle of timeliness and must follow the
government accounting standard.
This report will be audited by the Indonesian
Audit Board (BPK) and is presented to the DPR within
6 (six) months at the latest, after the end of the
concerned fiscal year. This is regulated in Law No. 15
of 2004, which states that in order to realize state
financial management in accordance with what is
stipulated in Law No. 17 of 2003 and Law No. 1 of
2004, an audit must be undertaken by an independent
and autonomous Indonesian Audit Board (BPK), as set
forth in Article 23(e) of the 1945 Constitution.
The BPK audit report is submitted to the
DPR and the Government. In regard to the report on
financial audit, the result of the audit will be used by
the government to make any necessary corrections and
adjustments. The government is given an opportunity
to respond to the findings and conclusion set forth in
the report. In the case that the auditor finds any illegal
issues, Law No. 15 of 2004 obligates the BPK to report
it to the authorities in accordance with the laws and
regulations.
In regard to transparency and enhancement
of public participation, the Law stipulates that every
audit report submitted to the legislative is declared
disampaikan dalam bentuk laporan keuangan yang
terdiri dari laporan realisasi anggaran, neraca, laporan
arus kas dan catatan atas laporan keuangan yang
disusun sesuai dengan standar akuntansi pemerintah.
Laporan keuangan pemerintah harus memenuhi
prinsip-prinsip tepat waktu dan mengikuti standar
akuntansi pemerintah.
Laporan tersebut akan diperiksa oleh Badan
Pemeriksa Keuangan dan disampaikan kepada DPR
selambat-lambatnya 6 (enam) bulan setelah tahun
anggaran yang bersangkutan berakhir. Hal ini diatur
dalam UU No. 15/2004, yang menyatakan bahwa
untuk mewujudkan pengelolaan keuangan Negara
sesuai dengan yang ditentukan dalam UU No. 17/2003
serta UU No. 1/2004, perlu dilakukan pemeriksaan
oleh satu Badan Pemeriksa Keuangan (BPK) yang
bebas dan mandiri sebagaimana telah ditetapkan
dalam pasal 23 (e) UUD 1945.
Laporan hasil pemeriksaan BPK disampaikan
kepada DPR dan Pemerintah. Dalam hal laporan
hasil pemeriksaan keuangan, hasil pemeriksaan
akan digunakan oleh Pemerintah untuk melakukan
koreksi dan penyesuaian yang diperlukan. Pemerintah
diberi kesempatan untuk menanggapi temuan dan
kesimpulan yang dikemukakan dalam laporan. Apabila
pemeriksa menemukan unsur pidana, Undang-
Undang No. 15/2004 mewajibkan BPK melaporkan
kepada instansi berwenang sesuai dengan peraturan
perundang-undangan.
Dalam rangka transparansi dan peningkatan
partisipasi publik, Undang-Undang menetapkan
bahwa setiap laporan hasil pemeriksaan yang sudah
SISTEM PENGANGGARAN | THE BUDGETING SYSTEM

126 THE INDONESIANBUDGET OVERVIEW 2010
open to the public.
Application and Development of the Budgeting
System in 2010
In line with Planning and Budgeting reform,
beginning in the 2010 fiscal year several changes have
been made, including:
1. Implementation of Unified Budgeting
a. De-concentration and Assistance Duties
Formulation of RKA-KL related to de-
concentration and assistance duties refers
to the Regulation of Minister of Finance No.
156/PMk.07/2008 regarding the Guidelines
on De-Concentration and Assistance Duties
Fund Management. There is a fundamental
thing to be considered in relation to the
allocation of de-concentration/assistance duty
budget, namely the need to clearly link the
activities in regard to de-concentration and
assistance duties and the duties and functions
of regional work units that implement the
duties based on the RKP reference.
b. The formulation of RKA-KL for Public Service
Agencies (BLUs) refers in particular to the
Regulation of the Minister of Finance No
44/PMK.05/2009 regarding the Business
Plan and Budget (RBA). Several matters to
be considered in the formulation of BLU
budget:
• The BLU formulates annual RBA by
referring to business strategy;
disampaikan kepada lembaga perwakilan, dinyatakan
terbuka untuk umum.
Penerapan dan Pengembangan Sistem
Penganggaran Tahun 2010
Sejalan dengan reformasi Perencanaan dan
Penganggaran, memasuki TA 2010 telah dilakukan
beberapa penambahan meliputi :
1. Penerapan Penganggaran Terpadu
a. Tugas Dekonsentrasi dan Tugas Pembantuan
Penyusunan RKA-KL berkenaan dengan
tugas dekonsentrasi dan tugas pembantuan
mengacu pada Peraturan Menteri Keuangan
No.156/PMK.07/2008 tentang Pedoman
Pengelolaan Dana Dekonsentrasi dan Dana
Tugas Pembantuan. Ada hal mendasar
yang perlu diperhatikan berkaitan dengan
pengalokasian anggaran dekonsentrasi/tugas
pembantuan yaitu perlunya mengkaitkan
secara jelas kegiatan-kegiatan dalam rangka
tugas dekonsentrasi dan tugas pembantuan
dengan tugas-fungsi unit kerja daerah yang
melaksanakan berdasarkan acuan RKP.
b. Penyusunan RKA-KL khusus untuk Badan
Layanan Umum (BLU) mengacu pada
Peraturan Menteri Keuangan No.44/
PMK.05/2009 tentang Rencana Bisnis dan
Anggaran (RBA). Beberapa hal yang perlu
diperhatikan dalam penyusunan anggaran
BLU antara lain:
• BLUmenyusunRBA tahunandengan
mengacu pada strategi bisnis;
SISTEM PENGANGGARAN | THE BUDGETING SYSTEM

127THE INDONESIANBUDGET OVERVIEW 2010
• The RBA is formulated based on:
performance basis and accruals
orientation, cost calculation based on
the type of service; the revenue need
and capacity estimated to be received
from the society.
c. Accommodating the implementation of
a gender-responsive budget. A Gender-
Responsive Budget means a budget that
accommodates 2 (two) things:
• fairness for women and men (by
considering the role and gender
relation) in getting access, benefits
(from the development program),
participation in the decision making
process and control over resources.
• equalityforwomenandmeninterms
of the opportunities in selecting
and enjoying the outcomes of
development.
In the 2010 fiscal year there are 11 (eleven)
K/Ls that have implemented GRB in some of
their budget allocations.
2. Application of the medium-term expenditure
framework (MTEF)
MTEF is a budgeting model to bridge the policy,
planning and budgeting. The MTEF model is
formulated as a budget planning instrument to
achieve certain targets/objectives formulated
• RBAdisusunberdasarkan:Basiskinerja
dan perhitungan biaya menurut
jenis layanannya; kebutuhan dan
kemampuian pendapatan yang
diperkirakan akan diterima dari
masyarakat; dan berbasis akrual.
c. Mengakomodir penerapan anggaran resposif
gender. Yang disebut dengan anggaran
responsif gender adalah anggaran yang
memberi/mengakomodasi terhadap 2 (dua)
hal:
• keadilan bagi perempuan dan laki-
laki (dengan mempertimbangkan
peran dan hubungan gendernya)
dalam memperoleh akses, manfaat
(dari program pembangunan),
berpartisispasi dalam proses
pengambilan keputusan dan kontrol
terhadap sumber-sumber daya.
• kesetaraanbagiperempuandan laki-
laki dalam kesempatan/peluang dalam
memilih dan dalam menikmati hasil
pembangunan.
Pada tahun anggaran 2010 terdapat 11
(sebelas) K/L yang telah melaksanakan ARG
pada sebagian alokasi anggarannya.
2. Penerapan pengeluaran dengan prespektif jangka
menengah (KPJM)
KPJM adalah model penganggaran untuk
menjembatani antara kebijakan, perencanaan
dan penganggaran. Model KPJM disusun
sebagai instrumen perencanaan penganggaran
SISTEM PENGANGGARAN | THE BUDGETING SYSTEM

128 THE INDONESIANBUDGET OVERVIEW 2010
as measurable performance indicators to be
achieved within a period of more than one fiscal
year.
Considering that the MTEF project will be
implemented starting in the 2011 Fiscal Year,
the preparations mainly consist of in regard to its
implementation mapping and categorization of
activities. The purpose of this is to classify types of
activity based on the medium-term expenditure
framework, namely: basic activities4; base-line or
on going activities5, and activities categorized as
new initiative activity6.
3. Performance-Based Budgeting
In regard to the comprehensive implementation
of performance-based budgeting, there are
several steps that have been carried out in the
2010 fiscal year, namely:
a. Formulation of programs, activities, Key
Performance Indicators (KPI), outcomes,
Activity Performance Indicators, and output
statements based on restructuring results
4 Activities that are aimed at bureaucratic operations and
contain budget allocations for salaries, allowances, and asset
maintenance costs. This allocation is not discussed with the
DPR but the DPR is only informed about this allocation.
5 Activity in which the performance has been agreed for 3
or 5 years, and the budget allocation is based on a priority
scale.
6 Activity that is outside of the base line activity. The budget
allocation is in accordance with the available fiscal space.
untuk mencapai suatu target / sasaran tertentu
yang telah dirumuskan sebagai indikator kinerja
terukur yang akan dicapai dalam kurun waktu
yang lebih dari satu tahun anggaran.
Mengingat konsep KPJM tersebut akan diterapkan
mulai Tahun Anggaran 2011 maka, persiapan
yang dilakukan dalam rangka implementasinya
adalah pemetaan kegiatan-kegiatan yang
dilakasanakan dan pemilahan kegiatan. Hal ini
dimaksudkan agar dapat dikelompokkan jenis
kegiatan berdasarkan kerangka pengeluaran
jangka menengah, berupa: kegiatan dasar4;
kegiatan yang merupakan base line5, dan kegiatan
yang dapat dikategorikan sebagai kegiatan new
initiative6.
3. Penganggaran Berbasis Kinerja
Dalam rangka penerapan penganggaran berbasis
kinerja secara utuh, ada beberapa langkah yang
telah dilakukan pada tahun anggaran 2010
berupa:
a. Perumusan program, kegiatan, IKU, outcome,
IKK, dan pernyataan kinerja berdasarkan
hasil restrukturisasi yang telah dilakukan
pada tahun 2009;
4 Kegiatan ditujukan untuk operasional birokrasi dan berisikan
alokasi anggaran gaji dan tunjangan, serta untuk biaya
pemeliharaan asset. Alokasi ini tidak didiskusikan dengan
DPR tetapi hanya untuk diketahui.
5 Kegiatan yang kinerjanya telah disepakati untuk kurun
waktu 3 atau 5 tahun dan alokasi anggaran menyertainya
sesuai skala prioritas.
6 Kegiatan yang muncul di luar kegiatan yang merupakan
base line. Alokasi anggaran kegiatan tersebut sesuai dengan
fiscal space yang ada.
SISTEM PENGANGGARAN | THE BUDGETING SYSTEM
129THE INDONESIANBUDGET OVERVIEW 2010
undertaken in 2009;
b. Workshops and socialization regarding
program and activity restructuring;
c. Preparing the application of the Work Plan,
Strategic Plan, and RKA-KL together with the
Ministry of Planning.
Direction of Budgeting System Development
As a follow up to the enactment of Law
Number 17 of 2003 regarding Public Finance, State
Finance management, particularly the budget system,
has undergone significant changes. In accordance
with the mandate as set forth in Law No. 17 of
2003, and in accordance with the best practices and
good governance principles in Budget management
the Government is obligated to implement 3 (three)
approaches, namely: unified budgeting, medium-
term expenditure framework and performance-based
budgeting, and 3 (three) classifications, namely:
classification by function, by organization and by
economic or expenditure. To carry out the mandate,
there are 3 (three) implementation stages:
(i) phase I : socialization stage (carried out from 2005
– 2009);
(ii) phase II : reinforcement stage (carried out from
2010 - 2014); and
(iii) phase III: improvement stage (scheduled to be
started in 2015).
b. Workshop dan sosialisasi mengenai
restrukturisasi program dan kegiatan;
c. Mempersiapkan aplikasi Renja, Renstra,
dan RKA-KL bersama Kementerian
Perencanaan.
Arah Pengembangan Sistem Penganggaran
Sebagai tindak lanjut dengan terbitnya
Undang-Undang Nomor 17 Tahun 2003 tentang
Keuangan Negara, maka pengelolaan Keuangan
Negara khususnya sistem penganggaran mengalami
perubahan yang sangat mendasar. Sesuai amanah
yang tertuang dalam UU No. 17 Tahun 2003 di
atas, maka dalam pengelolaan anggaran Negara,
Pemerintah diwajibkan untuk menerapkan 3 (tiga)
pendekatan yaitu : penganggaran terpadu, kerangka
pengeluaran jangka menengah dan penganggaran
berbasis kinerja, dan 3 (tiga) klasifikasi anggaran yaitu
klasifikasi menurut fungsi, organisasi dan ekonomi
atau jenis belanja sesuai dengan prinsip-prinsip best
practices dan good governance. Untuk melaksanakan
amanah dimaksud, ditempuh melalui 3 (tiga) fase
tahapan penerapan yaitu :
(i) fase I : tahap pengenalan (dilaksanakan dalam
kurun waktu 2005 s,.d. 2009);
(ii) fase II : tahap pemantapan (dilaksanakan dalam
kurun waktu 2010 s.d. 2014); dan
(iii) fase III : tahap penyempurnaan (dijadwalkan mulai
tahun 2015).
SISTEM PENGANGGARAN | THE BUDGETING SYSTEM

130 THE INDONESIANBUDGET OVERVIEW 2010
The first momentum of budgeting reform was
initiated in 2005 with the focus of implementing a
Unified Budget, which was carried out by integrating
Routine and Development Budgets, unifying budget
documents (which were initially in the form of DIK,
DIP, SKO) into DIPA and applying budget classification
(by function, by organization and by type of
expenditure) and establishing the Work Unit as the
executor and clear lines of accountability persons in
charge of activities. In line with this, the 2006 DIPA
was first issued before the current fiscal year; thus,
it could be used directly at the beginning of the
fiscal year. Then, in 2006, the Cost Standard was
introduced in the budget allocation, both the General
Cost Standard and the Specific Cost Standard, and
the MTEF concept was also introduced. In 2007,
there was a synchronization of function/sub-function/
program/activity implementation, starting from the
planning process to budgeting process, improvement
of IT support in the budgeting process, comparative
studies to several countries, introduction of the MTEF
concept to the DPR, and the improvement of the Cost
Standard. In 2009, a review was undertaken on the
result of implementation over the 5 years of budgeting
reform. Based on the result of the evaluation of
the achievements of development programs in the
first phase, and by considering the results of studies
previously conducted, it was then concluded that the
implementation of budgeting reform needed to be
improved and developed by improving the system
through the structuring of the Programs and Activities
to be implemented by each K/L.
Momentum pertama pelaksanaan reformasi
penganggaran dimulai pada tahun 2005 dengan
focus penerapan Penganggaran Terpadu (unified
budget) yakni dengan mengintegrasikan Anggaran
Rutin dan Anggaran Pembangunan, menyatukan
dokumen anggaran (yang semula berupa DIK, DIP,
SKO) menjadi DIPA dan penerapan klasifikasi anggaran
(menurut fungsi, organisasi dan jenis belanja) serta
pembentukan Satuan Kerja sebagai unit pelaksana
dan penanggung jawab kegiatan. Sejalan dengan hal
ini, untuk pertama kalinya DIPA TA 2006 diterbitkan
sebelum tahun anggaran berjalan sehingga langsung
dapat digunakan pada awal tahun anggaran.
Selanjutnya pada tahun 2006, mulai diperkenalkan
Standar Biaya dalam pengalokasian anggaran baik
Standar Biaya Umum maupun Standar Biaya Khusus,
dan pengenalan konsep KPJM. Pada tahun 2007,
dilaksanakan sinkronisasi penerapan fungsi/subfungsi/
program/kegiatan mulai dari proses perencanaan
sampai dengan penganggaran, menyempurnakan
dukungan IT dalam proses penganggaran, studi
banding ke beberapa negara, memperkenalkan
konsep KPJM kepada DPR, dan menyempurnakan
Standar Biaya. Pada tahun 2009 dilaksanakan review
terhadap hasil penerapan selama 5 tahun reformasi
penganggaran. Berdasarkan hasil evaluasi terhadap
capaian kinerja program-program pembangunan pada
fase yang pertama serta dengan mempertimbangkan
hasil studi yang telah dilaksanakan, maka disimpulkan
penerapan reformasi penganggaran perlu ditingkatkan
dan dikembangkan dengan menyempurnakan sistem
melalui penataan Program dan Kegiatan yang akan
SISTEM PENGANGGARAN | THE BUDGETING SYSTEM

131THE INDONESIANBUDGET OVERVIEW 2010
The second momentum of the budget
reform process was implemented in 2009, through
the publication of Guidelines on Planning and
Budget Reform, which was jointly formulated by
the Ministry of National Planning/Bappenas and the
Ministry of Finance. The reform guidelines explicitly
stated the direction of budget reform in Indonesia,
its implementation process, and its schedule and
implementation stages (roadmap).
In reference to the above reform guidelines, several
activities have been carried out, including:
(i) determination of 6 (six) Ministries/Agencies as
pilots project for the application of Performance-
Based Budgeting (PBB) and the Medium-Term
Expenditure Framework (MTEF),
(ii) implementation of Program and Activity
restructuring, including the formulation
of Outcomes, Outputs and performance
indicators, and the
(iii) formulation of a new format of RKA-KL and a
RKA-KL application system that will begin to be
used in the 2011 fiscal year to facilitate the full
implementation of PBB and MTEF by all K/Ls.
In the second phase, 2010-2014, reform emphasis is
the effort to reinforce the implementation of budget
reform while also complying with the mandate of Law
No. 17 of 2003. In 2010 (until 18 May 2010), several
dilaksanakan oleh setiap K/L.
Momentum kedua proses reformasi
penganggaran dilaksanakan pada tahun 2009 yakni
dengan diterbitkannya buku Pedoman Reformasi
Perencanaan dan Penganggaran yang disusun
bersama oleh Kementerian Negara Perencanaan
Nasional/Bappenas dan Kementerian Keuangan.
Dalam buku pedoman reformasi tersebut secara
eksplisit dijelaskan kemana arah pengembangan
reformasi penganggaran di Indonesia, bagaimana
proses penerapannya termasuk jadwal dan tahapan
penerapannya (roadmap).
Dengan mengacu pada buku pedoman reformasi di
atas, berbagai kegiatan telah dilaksanakan antara lain :
(i) penetapan 6 (enam) Kementerian Negara/
Lembaga sebagai pilot project untuk penerapan
Penganggaran Berbasis Kinerja (PBK) dan
Kerangka Pengeluaran Jangka Menengah
(KPJM),
(ii) pelaksanaan restrukturisasi Program dan
Kegiatan termasuk perumusan Outcome,
Output maupun indikator kinerjanya, dan
(iii) penyusunan format baru RKA-KL dan sistem
aplikasi RKA-KL yang akan digunakan mulai
tahun anggaran 2011 untuk memfasilitasi
penerapan PBK dan KPJM secara penuh untuk
seluruh K/L.
Memasuki fase kedua dalam kurun waktu 2010
sampai dengan 2014, fokus penerapan ditekankan
pada bagaimana upaya untuk pemantapan penerapan
reformasi penganggaran namun tetap sesuai dengan
SISTEM PENGANGGARAN | THE BUDGETING SYSTEM
132 THE INDONESIANBUDGET OVERVIEW 2010
amanah UU No. 17 Tahun 2003. Pada tahun 2010
(sampai dengan tanggal 18 Mei 2010), beberapa
kegiatan telah dilaksanakan meliputi :
(i) restrukturisasi program dan kegiatan untuk
seluruh K/L termasuk rumusan Outcome,
Output, indikator kinerja dengan pendekatan
struktur organisasi dan tugas fungsi masing-
masing unit organisasi secara spesifik.
(ii) Penetapan pagu APBN jangka menengah,
diikuti penetapan pagu K/L dalam jangka
menengah.
(iii) Penerapan reward and punishment system
khususnya berkaitan dengan pelaksanaan
stimulus fiskal pada tahun 2009.
(iv) Pengembangan IT dalam pengelolaan
Keuangan melalui proyek SPAN (Sistem
Perbendaharaan dan Anggaran Negara).
(v) Penyempurnaan format RKA-KL dengan
mengintegrasikan informasi kinerja disamping
informasi Keuangan yang akan diterapkan
mulai tahun anggaran 2011.
(vi) Melakukan revisi Peraturan Pemerintah No. 21
Tahun 2004 tentang Penyusunan RKA-KL.
Selain berbagai kegiatan di atas, saat ini juga
terus dikembangkan upaya-upaya dalam rangka
pemantapan penerapan reformasi penganggaran
serta menjawab tantangan ke depan antara lain :
(i) Pengembangan dan penerapan penyusunan
dan penelaahan RKA-K/L secara on-line system
activities have been conducted, including:
(i) program and activity restructuring for all K/
Ls, including the formulation of Outcomes,
Outputs and performance indicators, using
the organizational structure approach and
the duties and specific functions of every
organizational unit.
(ii) Determination of medium-term Indonesian
Budget ceilings, followed by the determination
of medium-term K/L ceilings.
(iii) Application of a reward and punishment system,
particularly related to the implementation of
fiscal stimulus in 2009.
(iv) Development of IT in Finance management
through the SPAN (Sistem Perbendaharaan
dan Anggaran Negara – Indonesian Budget
and Treasury System) project
(v) Improvement of the RKA-KL format by
integrating performance information in addition
to financial information, which will begin to be
implemented in the 2011 fiscal year.
(vi) Revision of Government Regulation No. 21 of
2004 regarding Formulation of the RKA-KL.
In addition to the above activities, various
efforts are also currently being undertaken in order
to reinforce the implementation of budgeting reforms
and to answer future challenges, including:
(i) Development and application of online RKA-
KL formulation and review, planned to be
SISTEM PENGANGGARAN | THE BUDGETING SYSTEM

133THE INDONESIANBUDGET OVERVIEW 2010
yang direncanakan mulai diperkenalkan untuk
Tahun Anggaran 2012.
(ii) Penerapan Reward and Punishment System
dalam pengalokasian anggaran dengan
mengacu pada hasil evaluasi atas pencapaian
kinerja K/L, mulai diperkenalkan untuk Tahun
Anggaran 2012.
(iii) Pengintegrasian database perencanaan,
penganggaran, pelaksanaan dan pelaporan
melalui pembangunan SPAN Project,
diharapkan mulai efektif pada tahun 2013.
(iv) Meningkatkan efisiensi belanja negara
melalui penyempurnaan costing methodology
dan penerapan efficiency dividend, mulai
diterapkan untuk tahun 2013.
`
introduced in the 2012 Fiscal Year.
(ii) Application of a Reward and Punishment
System in budget allocation, by referring to the
results of the evaluation of the achievements
of K/L performance, which will be introduced
in the 2012 Fiscal Year.
(iii) Integration of planning, budgeting,
implementation and the reporting database
through the development of the SPAN Project,
which is expected to be effective in 2013.
(iv) Enhance state expenditure efficiency through
improvement of costing methodology and
application of efficiency dividend, which will to
be implemented in 2013.
SISTEM PENGANGGARAN | THE BUDGETING SYSTEM

134 THE INDONESIANBUDGET OVERVIEW 2010


137THE INDONESIANBUDGET OVERVIEW 2010
Belanja subsidi termasuk subsidi BBM merupakan
salah satu komponen Anggaran Pendapatan dan
Belanja (APBN) yang sangat penting. Kenyataan
tersebut antara lain tercermin dari perkembangan
besarannya, proporsinya terhadap belanja negara,
dan rasionya terhadap PDB, yang cenderung signifikan
dalam APBN. Dalam periode 2005-2010, proporsi
belanja subsidi BBM terhadap belanja negara masing-
masing mencapai rata-rata lebih dari 10 persen,
sedangkan rasionya terhadap PDB rata-rata mencapai
sekitar 1,5 persen. Subsidi, yang pengertiannya secara
ekonomi merupakan “Pemberian Pemerintah kepada
sektor swasta untuk memberikan manfaat kepada
masyarakat (Weber : Kamus Bahasa Inggris), atau
pembayaran Pemerintah kepada perusahaan atau
rumah tangga yang menyediakan atau mengkonsumsi
komoditas (Samuelson : Economics)”, penyediaan
dan pencabutannya terkait dengan berbagai aspek
strategis kehidupan berbangsa dan bernegara. Secara
garis besar, pemberian subsidi diarahkan untuk
meningkatkan kesejahteraan masyarakat sasarannya,
antara lain dengan cara mendorong kegiatan ekonomi
Subsidy expenditures, including the fuel subsidy,
are a very important component of the Indonesian
Budget (APBN). This tax is reflected by, among other
things, the growth of its total amount, its proportion
to total expenditures, and its ratio to the GDP, which
has tended to feature significantly in the Indonesian
Budget. From 2005-2010, the proportion of the fuel
subsidy expenditure to total expenditures, respectively,
reached over 10 percent on average, whereas its
ratio to the EDP reached around 1.5 percent on
average. Subsidy, in economic terms, is defined as
“A granting of the Government to the private sector
to give benefits to the community (Weber: English
Dictionary), or payment of the Government to firms
or households who provide or consume a commodity
(Samuelson: Economics)”. Its provision and withdrawal
relates to various strategic aspects of national and
state life. Overall, subsidy granting is directed to
improve the welfare of target communities, such as
by means of encouraging economic activities related
to commodities that are subsidized through decreases
of prices paid by the consumers and/or increased
KEBIJAKAN PEMBATASAN SUBSIDIBAHAN BAKAR MINYAK (BBM) :
POTENSI MANFAAT DAN RISIKONYA UMUM
FUEL (BBM) SUBSIDY LIMITATION POLICY: POTENTIAL BENEFITS AND RISKS
138 THE INDONESIANBUDGET OVERVIEW 2010
terkait komoditas yang disubsidi melalui penurunan
harga yang harus dibayar oleh konsumen dan/atau
naiknya penerimaan dan keuntungan dari produsen.
Subsidi, meskipun secara nominal dapat
diterima oleh konsumen berupa penurunan nilai
yang harus dibayar untuk barang konsumsinya (dari
P menjadi (P-S)) untuk komoditi bersubsidi, atau
oleh produsen berupa kenaikan nilai yang diterima
dari hasil penjualan produksinya (dari P menjadi
(P+S)), namun penerima manfaat sesungguhnya
sangat tergantung pada kondisi permintaan dan
penawaran pasar. Pada kondisi pasar yang ada, dapat
terjadi bahwa subsidi yang sesungguhnya diberikan
kepada konsumen, melalui mekanisme pasar justru
dinikmati oleh produsen, atau diberikan kepada
kelompok pendapatan rendah tetapi justru dinikmati
oleh kelompok pendapatan tinggi. Secara ekonomi,
meskipun dalam hal tertentu memang diperlukan
dan dapat memberikan manfaat tertentu, pemberian
subsidi menimbulkan beberapa konsekuensi negatif
khususnya terkait dengan masalah inefisiensi alokasi
sumber daya ekonomi (resources misallocation)
nasional dan beban anggarannya. Dari sisi alokasi
sumber daya ekonomi, selain menimbulkan inefisiensi
alokasi (kehilangan nilai tambah) yang bersumber
dari konsumsi yang berlebih (over consumption),
subsidi juga dapat menimbulkan eksternalitas negatif
(marginal damage/ negative externality) berupa
kerusakan lingkungan karena polusi.
Beberapa hal penting dan strategis
menyangkut subsidi antara lain adalah bahwa
dari sisi keuangan negara, subsidi (termasuk biaya
revenue and profits of producers.
Although subsidies can nominally be
received by the consumers in the form of decreased
payable value for their consumable goods (from P to
(P-S)) for subsidized commodities, or by producers
in the form of increased value received from their
production sales outcomes (from P to become (P+S)),
the beneficiaries really depend on market supply and
demand conditions. In existing market conditions, it
is likely that a subsidy that is actually to be granted
to the consumers, through the market mechanism,
will eventually be enjoyed by the producers, or to
be granted to low-income groups but eventually
enjoyed by the high-income group. Economically,
though in certain cases it is indeed required and
can provide certain benefits, subsidy granting has
resulted in some negative consequences, particularly
related to the matter of national economic resources
allocation inefficiency (resources misallocation) and
its budget burden. From the economic resources
allocation standpoint, in addition to resulting in
allocation inefficiency (loss of added value) sourced
from over-consumption, a subsidy can also result in
marginal damage/negative externality in the form of
environmental damages due to pollution.
Several important and strategic matters relating
to subsidies are, among other things, that from the
state finance standpoint, subsidies (including their
KEBIJAKAN PEMBATASAN SUBSIDI BAHAN BAKAR MINYAK (BBM) : POTENSI MANFAAT DAN RISIKONYA UMUM FUEL (BBM) SUBSIDY LIMITATION POLICY: ITS POTENTIAL BENEFITS AND RISKS GENERAL

139THE INDONESIANBUDGET OVERVIEW 2010
penyelenggaraannya) berdampak pada perlunya
penyediaan dana untuk membelanjainya yang
dalam kondisi keuangan negara yang terbatas
dapat memaksa terjadinya realokasi sumberdana
dari jenis belanja lain, yang kemungkinan dapat
menghasilkan nilai tambah yang lebih tinggi. Selain
itu, dari pendekatan efektivitas tujuan dan keadilan
penerimanya, proses dan mekanisme penyaluran
subsidi juga merupakan komponen strategis yang
harus dipikirkan. Tahap selanjutnya, adalah dalam
hal subsidi tersebut sudah dialokasikan secara rutin
dalam APBN dan diterima oleh berbagai kalangan
masyarakat serta merupakan bagian dari keputusan
ekonomi sehari-hari, kemudian karena alasan tertentu
akan dikurangi nilainya atau dihapus, maka respon
terhadap hal tersebut juga harus disikapi dengan
sangat hati-hati. Hal itu karena pemberian subsidi
pada dasarnya telah mengubah perilaku ekonomi
(economic behavior) masyarakat terkait, yang apabila
telah terjadi dalam jangka panjang akan memerlukan
energi ekstra untuk mengembalikannya, apalagi kalau
perubahannya menuju titik yang lebih rendah.
Dalam pelaksanaan APBN tahun anggaran
2010, sempat terdapat wacana mengenai kebijakan
pengurangan subsidi bahan bakar minyak (BBM)
secara terbatas, dalam arti yang dikurangi adalah
penerima subsidi dari kelompok tertentu termasuk
pemilik motor. Ketika wacana tersebut diluncurkan,
ternyata banyak mendapat respon yang negatif dari
masyarakat. Wacana terkini yang berkembang di
masyarakat terkait subsidi BBM adalah pencabutan
subsidi BBM bagi golongan ekonomi menengah
management costs) affect the need for fund provision
to public finance it, which, due to the limited financial
condition of the state, may force the occurrence
of reallocation of sources of funds from another
expenditure types, which will likely result in higher
added value. In addition to this, from the aspect of
its effectiveness of objectives and fairness of receipts,
the process and mechanism of subsidy distribution is
also a strategic component which should be kept in
mind. In the next stage, in the case that the subsidy
has been allocated regularly in the Indonesian Budget
and received by various circles of the community and
which forms a part of the daily economic decisions,
and which for certain reasons will be reduced in value
or written off, then the responses which will be taken
must also be taken into account with extra care. This
is due to the fact that a subsidy granting has basically
changed the economic behavior of the relevant
community, which, if it takes place over the long-term,
will need extra energy to return them; even more so if
the change is directed towards a lower point.
In the implementation of the Indonesian Budget
for the 2010 budget year, there has been some
discourse on the fuel subsidy decrease policy on a
limited basis, meaning what is to be reduced is the
number of subsidy receivers from certain groups,
including motorcycle owners. When such a discourse
was released, it received many negative responses
from the community. The latest discourse developing
in the community related to the fuel subsidy is the
revocation of the fuel subsidy for medium and higher
KEBIJAKAN PEMBATASAN SUBSIDI BAHAN BAKAR MINYAK (BBM) : POTENSI MANFAAT DAN RISIKONYA UMUM FUEL (BBM) SUBSIDY LIMITATION POLICY: ITS POTENTIAL BENEFITS AND RISKS GENERAL

140 THE INDONESIANBUDGET OVERVIEW 2010
ke atas, sementara golongan ekonomi lain tetap
dapat menerima subsidi. Ide tersebut terkesan ideal,
karena pemberian subsidi diharapkan menjadi lebih
adil, dalam arti yang diharapkan menikmati adalah
golongan yang memang memerlukan. Potensi masalah
yang muncul dari wacana kebijakan tersebut adalah
dalam hal implementasinya, mengingat kebijakan
tersebut merupakan langkah diskriminasi harga
(Price Discrimination), yang untuk kesuksesannya
memerlukan prakondisi tertentu yang sulit dipenuhi.
Apabila kebijakan tersebut tetap dijalankan tanpa
dipenuhinya prakondisi yang diperlukan, maka tujuan
utama dari kebijakan tersebut, yaitu pengurangan
beban belanja subsidi bagi Pemerintah, tidak akan
tercapai secara efektif. Dengan latar belakang berbagai
aspek dari subsidi tersebut, maka dalam kesempatan
ini Penulis bermaksud menyampaikan pandangan
dasar mengenai beberapa hal penting terkait dengan
subsidi. Mengingat belanja utama subsidi Pemerintah
adalah subsidi BBM, dan penerapannya menimbulkan
beberapa penilaian yang kurang mengenai efektivitas
dan kegunaannya maka dalam beberapa bagian
Penulis akan menggunakan ilustrasi subsidi BBM.
PERKEMBANGAN BELANJA SUBSIDI
Dari tahun ke tahun, anggaran belanja subsidi
cenderung berkembang, baik dalam jenis komoditas
yang disubsidi maupun besaran alokasinya. Dari segi
jenis, belanja subsidi terdiri dari dua kelompok besar,
yaitu subsidi energi yang terdiri dari subdisi BBM dan
subsidi listrik, dan subsidi non energi. Subsidi non energi
yang utamanya berupa subsidi pangan dan subsidi
economic groups, while other groups will still receive
the subsidy. Such an idea comes across as ideal,
because the subsidy granting will expectably be fairer,
meaning that those who will enjoy it are the really
needy groups. The potential problem incurred from
such a policy discourse is in terms of its implementation,
in view of that such a policy is a Price Discrimination,
which, for its success, will require certain preconditions
that are difficult to meet. If such a policy continues
to be conducted without meeting the required
preconditions, then the main objectives of the policy,
namely to decrease the subsidy expenditure burden on
the Government, will not achieved effectively. With a
background of various aspects in connection with the
subsidy, then, on this occasion the writer intends to
give a basic view of some important matters related
to subsidies. Considering that the main expenditure
of Government subsidies is for the fuel subsidy, and
its application will result in some poor assessments
concerning its effectiveness and usage, then in some
sections the writer will use fuel subsidy illustrations.
DEVELOPMENT OF SUBSIDY EXPENDITURES
From year to year, the subsidy expenditure
budget has tended to grow, both in terms of the type
of commodities that are subsidized and in allocation
amount. From the type aspect, subsidy expenditures
consist of two major groups, namely the energy
subsidy, consisting of the fuel subsidy and electricity
subsidy, and the non-energy subsidy. The non-energy
KEBIJAKAN PEMBATASAN SUBSIDI BAHAN BAKAR MINYAK (BBM) : POTENSI MANFAAT DAN RISIKONYA UMUM FUEL (BBM) SUBSIDY LIMITATION POLICY: ITS POTENTIAL BENEFITS AND RISKS GENERAL

141THE INDONESIANBUDGET OVERVIEW 2010
kredit program, dalam tahun 2005 hingga tahun
2010 telah berkembang jenis sasarannya menjadi
subsidi pangan, subsidi pupuk, subsidi benih, subsidi
untuk public service obligation (PSO), subsidi kredit
program, subsidi pajak, dan dalam tahun 2008 bahkan
dialokasikan untuk untuk subsidi kedele. Selanjutnya,
subsidi BBM sejak tahun 2006 dialokasikan untuk
komoditas premium, kerosene dan solar, sementara
sampai dengan tahun 2005 juga ada alokasi subsidi
BBM untuk minyak diesel dan minyak bakar. Dari
tiga komoditas tersebut, alokasi subsidi BBM terbesar
sejak tahun 2006 adalah untuk premium, kemudian
solar, dan terakhir adalah kerosene. Hal tersebut
terkait dengan tingginya volume konsumsi premium
yang rata-rata mencapai lebih dari 40 persen dari total
konsumsi BBM bersubsidi.
Dari segi proporsinya terhadap belanja
negara, alokasi belanja subsidi BBM mengalami
fluktuasi antara 4,80 persen terhadap belanja negara
(2009) hingga mencapai 18,76 persen terhadap
belanja negara (2005). Bila dikaitkan dengan sasaran
penerima manfaatnya, maka belanja subsidi per
kapita juga mengalami fluktuasi dari Rp 195.300 per
kapita per tahun (2009) hingga mencapai Rp 610.700
per kapita per tahun (2008). Data tentang beberapa
indikator terkait belanja subsidi BBM dalam periode
2005-2010 disajikan dalam tabel berikut ini.
Selanjutnya, apabila belanja subsidi BBM
tersebut dibandingkan dengan beberapa jenis belanja
prioritas lainnya seperti belanja modal, belanja
kemiskinan, atau belanja infrastruktur, nampak
bahwa belanja subsidi BBM tersebut cukup siginifikan
subsidy that is basically in the form of food subsidy
and program credit subsidy, from 2005 to 2010 has
developed in its target type to: food subsidy, fertilizer
subsidy, seed subsidy, subsidy for public service
obligations (PSO), program credit subsidy, tax subsidy,
and in 2008 it was even allocated for a soybean
subsidy. Furthermore, since 2006, the fuel subsidy
was allocated for premium, kerosene and diesel oil
commodities, while until 2005 there was also a fuel
subsidy allocation for diesel oil and kerosene. Of
these three commodities, the largest allocation of
the fuel subsidy since 2006 has been for premium
fuel, followed by diesel oil, and the last is kerosene.
That relates to the high volume of premium fuel
consumption that on average over 40 percent of total
subsidized fuel consumption.
From its proportion of state expenditures, the
fuel subsidy expenditure allocation fluctuated from
4.80 percent of the state expenditure (2009) to 18.76
percent of the state expenditure (2005). If related to
its beneficiary targets, then the subsidy expenditures
per capita also fluctuated from Rp195,300 per capita
per year (2009) to Rp610,700 per capita per year
(2008). Data on some indicators related to fuel subsidy
expenditures in the 2005-2010 period are presented
in the table below.
Furthermore, if the fuel subsidy expenditure
is compared to some other types of priority
expenditures, such as capital expenditure, poverty
expenditure, or infrastructure expenditure, it seems
that the fuel subsidy expenditure is sufficiently
KEBIJAKAN PEMBATASAN SUBSIDI BAHAN BAKAR MINYAK (BBM) : POTENSI MANFAAT DAN RISIKONYA UMUM FUEL (BBM) SUBSIDY LIMITATION POLICY: ITS POTENTIAL BENEFITS AND RISKS GENERAL

142 THE INDONESIANBUDGET OVERVIEW 2010
jumlahnya. Dalam periode 2005-2008 belanja
subsidi BBM menunjukkan jumlah yang lebih besar
dari belanja modal, belanja kemiskinan, dan belanja
infrastruktur. Belanja subsidi BBM baru menunjukkan
peran yang agak menurun dalam periode 2009-2010
sehingga jumlahnya sudah lebih kecil dari belanja
modal dan belanja infrastruktur, namun dalam tahun
2010 masih lebih besar dari belanja kemiskinan.
Perbandingan beberapa jenis belanja tersebut
disampaikan dalam tabel di bawah ini. Kondisi
tersebut mengindikasikan bahwa pembatasan subsidi
BBM, kemudian mengalihkan hasil penghematannya
kepada salah satu jenis belanja prioritas tersebut, akan
dapat memberikan nilai tambah yang berarti.
significant in amount. In the 2005-2008 period, the
fuel subsidy expenditure showed an amount larger
than the capital expenditure, the poverty expenditure,
and the infrastructure expenditure. The fuel subsidy
expenditure only showed a rather decreasing
role in the 2009-2010 period, so much so that its
amount was less than the capital expenditure and
the infrastructure expenditure, but in 2010 it is still
larger than the poverty expenditure. A comparison of
these types of expenditures is presented in the table
below. Such a condition indicates that a fuel subsidy
limitation, with a shift in saving results to one of the
priority expenditure types, will be able to provide
significant added value.
Table 1Some Indicators of Fuel Subsidy Expenditure, 2005 - 2010
(Billions of Rupiah)
2005 2006 2007 2008 2009 2010
Fuel Subsidy Expenditure (billions of rupiah) 95.598,55 64.212,1 83.792,3 139.106,7 45.039,4 88.890,8
Proportions of Fuel Subsidy Expenditure to state expenditure (%)
18,76 9,63 11,06 14,11 4,80 7,89
Fuel Subsidy Expenditure Per capita (millions of
rupiah/year)436,1 289,1 372,6 610,7 195,3 380,7
Fuel Subsidy (Rp per liter) 1.600,0 1.714,4 2.167,1 3.648,2 1.216,9 2.435,0
Notes: - 2010: Indonesian Revised Budget data
KEBIJAKAN PEMBATASAN SUBSIDI BAHAN BAKAR MINYAK (BBM) : POTENSI MANFAAT DAN RISIKONYA UMUM FUEL (BBM) SUBSIDY LIMITATION POLICY: ITS POTENTIAL BENEFITS AND RISKS GENERAL

143THE INDONESIANBUDGET OVERVIEW 2010
DAMPAK PEMBATASAN SUBSIDI BBM
Pembatasan, yang dapat berarti pengurangan
atau pen ghapusan, subsidi BBM dapat menimbulkan
beberapa dampak ekonomi, baik positif atau negatif
dapat dinilai secara sangat relatif, tergantung pada
posisi di mana penilainya berada. Secara garis besar,
pencabutan subsidi BBM dapat menimbulkan dampak
tertentu, baik bagi perekonomian nasional secara
makro dan mikro, masyarakat penerima, maupun
Pemerintah.
Perekonomian Nasional Bagi perekonomian nasional secara makro,
pembatasan subsidi BBM yang tidak diikuti dengan
realokasi oleh Pemerintah terhadap belanja subsidi
EFFECTS OF THE FUEL SUBSIDY LIMITATION
A limitation, which can be defined as a reduction
or elimination of the fuel subsidy, may result in several
economic effects, either positive or negative, which
can be assessed, depending on the position taken by
the assessor. Overall, the revocation of the fuel subsidy
can result in certain effects, both for the national
economy at the macro and micro levels, the recipient
community, and the Government.
The National Economy At the macro level of the national economy,
a fuel subsidy limitation which is not followed by a
reallocation by the Government against such a subsidy
2005 2006 2007 2008 2009 2010
Fuel Subsidy Expenditure (billions of rupiah)
95.598,55 64.212,1 83.792,3 139.106,7 45.039,4 88.890,8
Capital Expenditure 32.888,8 54.951,9 64.288,7 72.772,5 75.870,8 101.650,2
Poverty Expenditure - 42.126,9 51.232,1 60.597,7 71.001,0 66.047,9
Infrastructure Expenditure 26.114,2 54.003,6 59.814,4 78.657,2 91.344,4 110.060,7
Notes : - 2010: Indonesian Revised Budget data
Table 2Comparison of Fuel Subsidy Expenditure and Some Priority Expenditures,
2005 – 2010(Billions of Rupiah)
KEBIJAKAN PEMBATASAN SUBSIDI BAHAN BAKAR MINYAK (BBM) : POTENSI MANFAAT DAN RISIKONYA UMUM FUEL (BBM) SUBSIDY LIMITATION POLICY: ITS POTENTIAL BENEFITS AND RISKS GENERAL

144 THE INDONESIANBUDGET OVERVIEW 2010
tersebut kepada kegiatan domestik lain, dengan
analisis sederhana dapat dilihat dampaknya pada
naiknya indeks harga dan inflasi serta turunnya
output nasional. Secara kronologis, penjelasan
mengenai dampak dari pembatasan subsidi BBM
dapat diterangkan secara terbalik melalui dampak
dari adanya subsidi BBM sebagai berikut. Dengan
adanya subsidi berarti bahwa sebagian harga barang
yang diperjualbelikan ditanggung oleh Pemerintah,
sehingga keputusan membeli dan menjual barang
tersebut akan lebih tinggi karena didasarkan pada
harga bersubsidi, yang berarti lebih rendah bagi
konsumen dan lebih tinggi bagi produsen. Semakin
besar nilai subsidinya, maka akan semakin besar juga
dampak yang dapat ditimbulkannya. Dengan adanya
pembatasan subsidi, harga barang akan kembali
seperti harga pasar, dalam arti lebih tinggi bagi
konsumen dan lebih rendah bagi produsen. Dampak
sederhana dari hal tersebut adalah menurunnya minat
membeli dari konsumen dan minat menjual bagi
produsen. Secara agregat, pembatasan subsidi akan
menurunkan volume transaksi, menaikkan harga, dan
menurunkan output nasional (pertumbuhan ekonomi).
Muara selanjutnya dari kondisi tersebut dapat berupa
penurunan kesempatan kerja dan meningkatnya
jumlah penduduk miskin. Namun apabila dana yang
berhasil dihemat dari pembatasan subsidi tersebut
dialokasikan pada kegiatan yang lebih memberikan
nilai tambah, baik bagi produksi nasional dan/atau
penanggulangan kemiskinan, maka dampak negatif
dari pencabutan subsidi tersebut akan dikompensasi
dengan besaran nilai tambah yang lebih tinggi.
expenditure to other domestic activities, through
simple analysis, will have an impact which can be seen
by an increased price index and inflation and decreased
national output. Chronologically, an explanation of the
effects of the fuel subsidy limitation can be explained
on a reverse basis, through the impacts from the
existence of the fuel subsidy, as follows. The existence
of the subsidy means that a part of price of the
transacted goods is borne by the Government, so that
the decision to buy and sell the goods will be higher
because of a reliance on the subsidized price, meaning
a lower price for the consumer and a higher price for
the producer. The larger the subsidy value, the larger
the incurred impact. With the existence of a subsidy
limitation, the price of goods will return to the market
value, in the meaning that there will be a higher price
for the consumer and a lower price for the producer.
The simple effect from that is the decrease of interest
in buying from the consumer and interest in selling to
the producer. Aggregately, the subsidy limitation will
decrease the transaction volume, increase the price,
and decrease the national output (economic growth).
The next ramification of such a condition can be in the
form of a decrease in employment opportunities and
increase in the number of poor. However, if the funds
that are successfully saved from the subsidy limitation
are allocated to activities that will provide more
added value, for both national production and/or
poverty alleviation, then the negative impacts of such
a subsidy revocation will be compensated with the
higher added value. On the other hand, a fuel subsidy
limitation that will reduce a significant part of related
KEBIJAKAN PEMBATASAN SUBSIDI BAHAN BAKAR MINYAK (BBM) : POTENSI MANFAAT DAN RISIKONYA UMUM FUEL (BBM) SUBSIDY LIMITATION POLICY: ITS POTENTIAL BENEFITS AND RISKS GENERAL
145THE INDONESIANBUDGET OVERVIEW 2010
Di sisi lain, pembatasan subsidi BBM yang berarti akan
menurunkan sebagian besar tingkat aktivitas ekonomi
terkait, dapat mempunyai konsekuensi positif, antara
lain berupa turunnya tingkat kemacetan lalu lintas,
penurunan tingkat emisi gas rumah kaca (GRK), dan
meningkatnya tingkat kesehatan masyarakat.
Dari sudut perekonomian nasional secara
mikro, melalui kronologis yang sama, terdapatnya
subsidi BBM berdampak pada terjadinya inefisiensi
alokasi sumber daya ekonomi sebagai akibat dari
terdapatnya distorsi keputusan ekonomi optimal.
Inefisiensi tersebut berupa kehilangan nilai tambah
ekonomi (dead weight loss) karena adanya perubahan
keputusan ekonomi dengan adanya subsidi, dari
keputusan optimal menuju keputusan tidak optimal.
Dengan adanya subsidi BBM, maka akan terjadi (1)
konsumsi yang berlebihan atas BBM, (2) realokasi
sumber daya dari kegiatan ekonomi lain yang tidak
mengandung unsur subsidi BBM menuju kegiatan yang
mengandung unsur subsidi BBM, atau dari kegiatan
ekonomi yang mengandung sedikit unsur subsidi BBM
menuju kegiatan ekonomi yang mengandung unsur
subsidi BBM lebih banyak, dan (3) terdapatnya potensi
ekspor (penyelundupan) BBM bersubsidi ke luar negeri
bila subsidi tersebut menimbulkan perbedaan harga
yang memberikan insentif bagi kegiatan tersebut. Bila
kemudian subsidi tersebut dibatasi, maka dampak-
dampak seperti tersebut di atas akan berganti dengan
kondisi sebaliknya.
economic level can have positive consequences,
such as in the form of decreased traffic congestion,
decreased greenhouse gas (GRK) emission levels, and
an increase in community health level.
From the national economy micro level
standpoint, through the same chronology, the
existence of a fuel subsidy affects the occurrence
of economic resource allocation inefficiency, as a
result of the existence of a distortion to the optimal
economic decision. Such inefficiency takes the form
of a loss of economic added value (dead weight loss)
due to the existence of economic decision changes
on account of the existence of the subsidy, from the
optimal decision to an inoptimal decision. With the
existence of the fuel subsidy, there will be: (1) excessive
consumption of fuel, (2) reallocation of resources
from other economic activities that do not contain
fuel subsidy elements towards activities that contain
fuel subsidy elements, or from economic activities that
contain few fuel subsidy elements towards economic
activities that contain more fuel subsidy elements,
and (3) availability of potential export (smuggling) of
subsidized fuel abroad if the subsidy results in a price
difference that gives an incentive to that activity. If
later the subsidy is limited, then the aforesaid impacts
will change with the reverse occurring.
KEBIJAKAN PEMBATASAN SUBSIDI BAHAN BAKAR MINYAK (BBM) : POTENSI MANFAAT DAN RISIKONYA UMUM FUEL (BBM) SUBSIDY LIMITATION POLICY: ITS POTENTIAL BENEFITS AND RISKS GENERAL
146 THE INDONESIANBUDGET OVERVIEW 2010
Masyarakat Penerima Ketika Pemerintah memutuskan untuk
memberikan subsidi BBM, maka lewat manapun
subsidi tersebut disalurkan, besaran dampak manfaat
yang diterima oleh masyarakat sangat tergantung
pada mekanisme pasar dari BBM tersebut. Selain
itu, karena BBM merupakan barang yang sangat
strategis dalam arti merupakan komponen produksi
dari hampir semua jenis barang/jasa, maka dampak
turunannya juga sangat siginifikan bagi keputusan
ekonomi terkait. Faktor penting yang merupakan
penentu dari besaran manfaat yang diterima tersebut
adalah besaran pemakaian dari BBM beserta elastisitas
permintaan dan penawaran dari masing-masing
penerima subsidi tersebut. Terkait dengan kondisi
tersebut, pihak yang memakai BBM dalam volume
yang makin besar dengan permintaan yang makin
inelastis akan menerima manfaat yang lebih besar
dari subsidi. Sebaliknya, pihak yang memakai BBM
dalam volume yang makin kecil dengan permintaan
yang makin elastis akan menerima manfaat yang
lebih kecil dari subsidi. Kondisi tersebut berlaku,
baik pada sisi perusahaan selaku produsen maupun
pada sisi rumah tangga selaku konsumen. Perbedaan
prinsipnya, manfaat akhir yang akan diperoleh
perusahaan berupa keuntungan (profit), sementara
yang diperoleh rumah tangga berupa kepuasan
(utility). Terkait dengan kondisi tersebut, dalam sub
berikutnya disampaikan ilustrasi numeris mengenai
dampak pengurangan subsidi, agar dapat diperoleh
gambaran yang lebih jelas mengenai latar belakang
mengapa pembatasan subsidi sering merupakan
The Recipient Community When the Government decides to give a fuel
subsidy, then, regardless of the channel where the
subsidy is given, the amount of benefit effects to be
received by the community highly depends on market
mechanism of that fuel. In addition to this, since fuel is
a very strategic commodity in the meaning it consists
of production components from nearly all of types of
goods/services, then it will consequently also be very
significant for the relevant economic decision. The
important factor which determines the amount of
benefits to be received is the consumption amount of
fuel together with the elasticity of supply and demand
of the respective subsidy recipient. Related to such a
condition, parties who use fuel in increasingly larger
volumes with demand that is increasingly inelastic will
receive larger benefits from the subsidy. Contrarily,
parties who use fuel in increasingly smaller volumes
with demand that is increasingly elastic will receive
smaller benefits from the subsidy. Such a condition
prevails both in the company side as the producer
and in the household side as the consumer. The
principle difference is that the final benefit to be
obtained by the company is in the form of profits,
while the households will receive them in the form
of satisfaction (utility). Related to such a condition,
the next section will present numerical illustrations
concerning the effects of subsidy reduction, in order
to obtain a clearer depiction of the background as to
why the subsidy limitation frequently constitutes a very
dilemmatic decision. This illustration will be made by
using consumer hospitalization programming in the
KEBIJAKAN PEMBATASAN SUBSIDI BAHAN BAKAR MINYAK (BBM) : POTENSI MANFAAT DAN RISIKONYA UMUM FUEL (BBM) SUBSIDY LIMITATION POLICY: ITS POTENTIAL BENEFITS AND RISKS GENERAL

147THE INDONESIANBUDGET OVERVIEW 2010
keputusan yang sangat dilematis. Ilustrasi dimaksud
akan dilakukan dengan menggunakan programasi
optimalisasi konsumen dalam rangka melihat dampak
dari pembatasan subsidi terhadap konsumen dengan
pendapatan yang berbeda. Sebagai ilustrasi dari
dampak perbedaan pendapatan terhadap besaran
manfaat yang diterima, berikut ini disampaikan hasil
dari programasi optimalisasi konsumen untuk dua
orang konsumen dengan tingkat pendapatan yang
berbeda. Secara lebih rinci, kondisi dari dua konsumen
tersebut adalah sebagai berikut :
− Konsumen : A dan B
− U = kepuasan/utility
− X = BBM
− Y = kombinasi barang nonsubsidi untuk
golongan ekonomi lemah
− Z = kombinasi barang nonsubsidi untuk
golongan ekonomi kuat
− I = pendapatan I A = Rp 1 juta per bulan; IB = Rp
10 juta per bulan
− Fungsi konsumsi dari dua konsumen tersebut
adalah U = X0,5Y0,5
− P = harga rata-rata PX = Rp 10, PY = Rp 10 +
0,1 PX, PZ = Rp 20 + 0,05X
− Besaran subsidi adalah Rp 2 per unit BBM
Dengan data tersebut, setelah dilakukan
pemograman optimalisasi kepuasan untuk masing-
masing konsumen, dapat diketahui dampak hipotesis
dari pencabutan subsidi bagi dua orang konsumen
dengan pendapatan yang berbeda tersebut. Rincian
hasil perhitungan tersebut disajikan dalam tabel 3.
framework of seeing the effects of subsidy limitation on
consumers with different income levels. As illustration
of the income difference effect on the amount of
benefit received presented below is the outcome of
the consumer hospitalization programming to two
consumers with different income levels. In more detail,
the condition of both consumers is as follows:
− Consumers: A and B
− U = satisfaction/utility
− X = fuel
− Y = combined non-subsidized goods to the
economically weak group
− Z = combined non-subsidized goods to the
economically strong group
− I = income I A = Rp1 million per month; IB =
Rp10 million per month
− Consumption function of the two consumers is
U = X0,5Y0,5
− P = average price PX = Rp 10, PY = Rp 10 + 0,1
PX, PZ = Rp 20 + 0,05X
− Amount of subsidy is Rp2 per unit of fuel
With the aforesaid data, after utility optimalization
programming has been conducted to the respective
consumers, the hypothetical impact of the subsidy
revocation on the two consumers with different
incomes can be known. Details of the calculation
results are presented in Table 3 below.
KEBIJAKAN PEMBATASAN SUBSIDI BAHAN BAKAR MINYAK (BBM) : POTENSI MANFAAT DAN RISIKONYA UMUM FUEL (BBM) SUBSIDY LIMITATION POLICY: ITS POTENTIAL BENEFITS AND RISKS GENERAL

148 THE INDONESIANBUDGET OVERVIEW 2010
Hasil perhitungan seperti disajikan dalam
tabel di atas menunjukkan bahwa konsumen dengan
pendapatan yang lebih tinggi (B) mengkonsumsi
dengan jumlah yang lebih besar dibanding konsumen
dengan pendapatan lebih rendah (A) untuk masing-
masing barang konsumsinya. Pada kondisi dengan
subsidi, A mengkonsumsi barang dengan kombinasi
BBM (X) sebanyak 62,5 unit dan non BBM (Y)
sebanyak 46,3 unit, sementara B mengkonsumsi
dengan kombinasi BBM (X) sebesar 626,6 unit dan
non BBM (Z) sebanyak 251,9 unit. Ketika itu, kepuasan
yang diperoleh B juga lebih tinggi dibanding yang
diperoleh A, yaitu masing-masing 397,3 unit dan 53,8
unit. Konsekuensi dari kondisi tersebut adalah bahwa
nilai subsidi total yang dinikmati oleh B lebih besar
daripada nilai subsidi yang dinikmati oleh A, yaitu Rp
1.253.100,0 per bulan dibanding Rp 125.100,0 per
bulan.
The calculation result as presented in the
table above shows that the consumer with the
higher income (B) consumes a larger amount than
the consumer with the lower income (A) for each of
their consumption goods. In the condition of having
the subsidy, A consumes goods with a combination
of 62.5 fuel units (X) and 46.3 non- fuel units (Y),
while B consumes with a combination 626.6 fuel
units (X) and 251.9 non- fuel units (Z). At that point,
the satisfaction (utility) obtained by B is also higher
than those obtained by A, namely 397.3 units and
53.8 units, respectively. The consequence of that
condition is that the total subsidy value enjoyed by B
is larger than the subsidy value enjoyed by A, namely
Rp1,253,100.0 per month compared to Rp125,100.0
per month.
Table 3Hypothetical Effects of a BBM Subsidy Elimination on Consumer Welfare
KEBIJAKAN PEMBATASAN SUBSIDI BAHAN BAKAR MINYAK (BBM) : POTENSI MANFAAT DAN RISIKONYA UMUM FUEL (BBM) SUBSIDY LIMITATION POLICY: ITS POTENTIAL BENEFITS AND RISKS GENERAL
Description
A (Customers with low to medium incomes) B (Customers with medium to high incomes)
Income (IDR 000)
Fuel Oil Price (IDR 000)
Prices of Non-Fuel Goods (IDR 000)
Consumption (Unit)
Utility
Subsidy Value Received (IDR 000)
Income (IDR 000)
Fuel Price (IDR 000)
Prices of Non-Fuel Goods (IDR 000)
Consumption (Unit)
Utility
Subsidy Value Received (IDR 000)
Fuel (X)
Non Fuel (Y)
Fuel (X)
Non Fuel (Y)
With subsidy 1.000,0 8,0 10,8 62,5 46,3 53,8 125,1 10.000,0 8,0 19,9 626,6 251,9 397,3 1.253,1Without Subsidy 1.000,0 10,0 11,0 50,0 45,5 47,7 0,0 10.000,0 10,0 20,1 499,9 244,0 349,2 0,0Total Sacrifice -6,1 -125,1 -48,1 -1.253,1Relative Sacrifice -11,31 -12,10
Compensastion of incomes to maintain welfare
263,87 1.303,5
Gross Government Saving
125,06 1.253,1
Net Government Saving 1.114,3

149THE INDONESIANBUDGET OVERVIEW 2010
Selanjutnya, bila subsidi sebesar Rp 2 per unit
dicabut, maka dua konsumen tersebut akan mengalami
penurunan daya beli, sehingga menurunkan volume
konsumsinya menjadi 499,9 unit BBM dan 244,0 unit
non BBM untuk B, sementara A mengkonsumsi 50
unit BBM dan 45,5 unit non BBM. Sejalan dengan
dengan itu, tingkat kepuasan yang dinikmati oleh
kedua konsumen juga mengalami penurunan, yaitu
masing-masing menjadi 349,2 unit untuk B dan 47,7
unit untuk A. Sementara itu, karena Pemerintah tidak
memberikan subsidi BBM, maka baik A maupun B
tidak menikmati subsidi BBM.
Hal penting yang perlu diperhatikan dari
ilustrasi di atas adalah masalah pengorbanan (sacrifice)
dari masing-masing konsumen ketika Pemerintah
mencabut subsidi BBM. Sesuai dengan kondisinya,
pengorbanan dalam nilai rupiah subsidi untuk B lebih
besar dari pengorbanan untuk A, masing-masing
senilai Rp 1.253.000,0 per bulan dan Rp 125.100,0
per bulan. Selain itu, pengorbanan dalam pengertian
kepuasan yang hilang juga masih sejalan dengan
kondisi pendapatannya, yaitu B (48,1 unit) lebih
tinggi daripada A (6,1 unit). Bila hanya dilihat dari
kondisi tersebut, nampak bahwa konsumen dengan
pendapatan yang lebih tinggi mengalami pengorbanan
lebih banyak sesuai dengan pendapatannya. Hal
itu terjadi baik pada volume konsumsi, nilai rupiah
subsidi, maupun total utility. Yang berbeda adalah
apabila dilihat dari pengorbanan realtifnya (relative
sacrifice), yaitu persentase kehilangan kepuasan
dibanding dengan kepuasan totalnya, maka nampak
bahwa dua konsumen dengan pendapatan yang
Furthermore, if the subsidy amounting to
Rp2 per unit is revoked, then the two consumers will
experience a decrease in their purchasing power, so
that decreasing their consumption volume to 499.9
units of fuel and 244.0 units of non-fuel for B, while
A consumes 50 fuel units and 45.5 non-fuel units. In
line with that, the satisfaction level enjoyed by the two
consumers will also decrease, namely, to 349.2 units
for B and 47.7 units for A respectively. Meanwhile,
since the Government gives no fuel subsidy, then both
A and B do not enjoy a fuel subsidy.
The important thing to pay attention to from
the aforesaid illustration is the sacrifice made by each
of the consumers when the Government revokes the
fuel subsidy. In accordance with its condition, the
sacrifice in rupiah value of the subsidy for B is larger
than the sacrifice for A, equal to Rp 1,253,000.0 per
month and Rp125,100.0 per month respectively.
In addition to this, sacrifice in the meaning of utility
(satisfaction) lost is also still in a line with their income
condition, namely that B (48.1 units) is higher than A
(6.1 units). If viewed merely form such a condition,
it seems that the consumers with higher income
sacrifice more in accordance with their income. This
occurs both in consumption volume, rupiah value of
the subsidy, and total utility. The difference is if viewed
from their relative sacrifice, namely the percentage of
utility loss compared to their total utility. In this case
it seems that the two consumers with far different
incomes have nearly the same relative sacrifice value.
Thus, the important factor to take into consideration in
KEBIJAKAN PEMBATASAN SUBSIDI BAHAN BAKAR MINYAK (BBM) : POTENSI MANFAAT DAN RISIKONYA UMUM FUEL (BBM) SUBSIDY LIMITATION POLICY: ITS POTENTIAL BENEFITS AND RISKS GENERAL

150 THE INDONESIANBUDGET OVERVIEW 2010
jauh berbeda tersebut mempunyai nilai pengorbanan
relative yang hampir sama. Dengan demikian,
faktor penting yang harus dipertimbangkan dalam
kaitannya dengan kebijakan pencabutan subsidi
adalah pengorbanan relatifnya, yang mencerminkan
perasaan kehilangannya, bukan pengorbanan
totalnya. Oleh karena itu, tidak tepat kalau dikatakan
bahwa pembatasan subsidi akan menimbulkan
dampak yang lebih dirasakan oleh golongan ekonomi
menengah ke atas.
Selanjutnya, agar kebijakan pembatasan
belanja subsidi BBM tersebut bisa dianggap sebagai
kebijakan yang baik/sukses dari pandangan kebijakan
publik, maka Pemerintah harus melakukan kebijakan
tindak lanjut dari kebijakan tersebut. Tindak lanjut
tersebut harus dirumuskan dan ditempuh agar
Pemerintah mampu mempertahankan kondisi pareto
optimal dari perekonomian secara keseluruhan,
atau paling tidak meminimalisir dampak negatifnya.
Salah satu program tindak lanjut yang penting
adalah pemberian kompensasi kepada masyarakat
yang paling menderita sebagai akibat dari kebijakan
tersebut, yaitu kelompok ekonomi lemah. Terkait
dengan pemberian kompensasi, kepada A dapat
diberikan kompensasi berupa transfer dalam bentuk
lain (kas atau subsidi untuk barang Y) dengan besaran
yang mampu mengembalikan kepuasan total pada
tingkat ketika subsidi diberikan (Hicksian model),
atau besaran yang mampu mengembalikan volume
konsumsi BBM kembali ke tingkat ketika disubsidi
(kepuasan total meningkat) seperti diusulkan oleh
Slutsky (slutsky model). Untuk itu, pengukuran dan
relation to the subsidy revocation policy is the relative
sacrifice, which reflects the feeling of loss rather than
the total sacrifice. Therefore, it is improper to say that
the subsidy limitation will result in impacts that will be
felt more by medium and upper economic groups.
Furthermore, to allow the fuel subsidy
expenditure limitation to be deemed as a good/
successful policy from public policy view, then the
Government must conduct follow-up policies on
such a policy. Such a follow-up must be formulated
and undertaken in order that the Government will
be able to maintain the pareto optimal condition of
the economy on the whole, or at least to minimize its
negative impacts. One important follow-up program
is the granting of compensation to the communities
which suffer most as a result of that policy, namely the
economically weak group. Related to compensation
granting, A can be given compensation in the form of
transfers of other forms (cash or subsidy to goods Y)
with an amount that is able to recover the total utility
to a level when the subsidy is given (Hicksian model),
or an amount that is able to return the consumption
volume of fuel back to a level when being subsidized
(total utility increases) as proposed by Slutsky (slutsky
model). For that purpose, the measurement and
calculation of this compensation amount is also a
serious matter. If this is carried out successfully, then
KEBIJAKAN PEMBATASAN SUBSIDI BAHAN BAKAR MINYAK (BBM) : POTENSI MANFAAT DAN RISIKONYA UMUM FUEL (BBM) SUBSIDY LIMITATION POLICY: ITS POTENTIAL BENEFITS AND RISKS GENERAL

151THE INDONESIANBUDGET OVERVIEW 2010
penghitungan mengenai besaran kompensasi ini juga
merupakan hal yang serius. Bila hal tersebut dilakukan
dengan berhasil, maka pencabutan subsidi tersebut
akan memberikan hasil seperti yang diharapkan, dan
konsumen golongan ekonomi lemah tidak mengalami
kondisi worse off, tetapi bahkan better off.
Pemerintah Terkait dengan wacana pembatasan belanja
subsidi BBM, Pemerintah perlu menyusun rencana
strategis, dari tahap perencanaan, implementasi, dan
tindak lanjutnya. Di sisi perencanaan, Pemerintah
perlu mempertimbangkan dengan matang setiap
langkah dari rencana tersebut, antara lain mengenai
seberapa besar besaran subsidi yang mau dibatasi,
kapan mulai dibatasi, bahan bakar jenis apa yang
akan dibatasi subsidinya, serta memperhitungkan
segala dampak dan langkah penanggulangannya.
Dalam tahap perencanaan ini juga perlu dipikirkan
agar pencabutan subsidi tersebut dapat memberikan
manfaat yang sebesar-besarnya bagi kemakmuran
rakyat banyak, bukannya justru menimbulkan belanja
jenis lain yang nilai tambahnya atau kualitasnya sama
atau bahkan lebih rendah daripada subsidi BBM.
Dalam tahap implementasinya, salah satu
hal penting yang perlu diperhatikan adalah strategi
ekonomi mikronya, dimana sebaiknya pembatasan
tersebut tidak menggunakan strategi diskriminasi
harga (price discrimination). Hal itu karena prakondisi
(asumsi) untuk berhasilnya penerapan diskriminasi
harga, yaitu pemisahan wilayah pasar secara tegas,
nampaknya sulit untuk dipenuhi oleh komoditas
the subsidy revocation will give the desired results,
and the economically weak consumer group will not
experience a condition which is worse off, but better
off.
The Government Related to the fuel subsidy expenditure
limitation discourse, the Government needs to
develop a strategic plan for the planning stage,
implementation, and follow up stages. On the
planning side, the Government needs to thoroughly
consider every step of that plan, among other things,
concerning what amount of the subsidy to be limited,
when the limitation starts, what kinds of fuels are to be
limited under the subsidy, and takes into account all of
its impacts and mitigation steps. In the planning stage
it is also necessary to think how the subsidy revocation
can give maximum benefits to public welfare, rather
than causing either type of expenditure to have the
same or even lower added value or quality than the
fuel subsidy.
In its implementation stage, one important
thing to pay attention to is the micro economic
strategy, in which the limitation should not use
a price discrimination strategy. This is due to the
preconditions (assumptions) for the success of the
price discrimination application, namely the explicit
separation of market area, which is seemly difficult
to be met by fuel and similar commodities. Thus,
KEBIJAKAN PEMBATASAN SUBSIDI BAHAN BAKAR MINYAK (BBM) : POTENSI MANFAAT DAN RISIKONYA UMUM FUEL (BBM) SUBSIDY LIMITATION POLICY: ITS POTENTIAL BENEFITS AND RISKS GENERAL

152 THE INDONESIANBUDGET OVERVIEW 2010
BBM dan sejenisnya. Dengan demikian, penerapan
diskriminasi harga, apakah itu antar wilayah, antar
kelompok pembeli, atau antar waktu; selain akan
memerlukan biaya ekstra yang besar dan permanen
untuk implementasinya (misalnya untuk smart
card), juga cenderung mengalami kebocoran
sehingga efektifitasnya relatif rendah. Dengan
demikian, pembatasan subsidi melalui penerapan
diskriminasi harga, kemungkinan besar tidak akan
memberikan hasil penghematan anggaran sebesar
yang diperkirakan. Namun, apabila memang akan
dilaksanakan, diskriminasi harga tersebut dapat
diimplementasikan menurut jenisnya.
Dengan dicabutnya belanja subsidi BBM,
dampak utama yang dirasakan Pemerintah adalah
terhapusnya, seluruh atau sebagian, beban belanja
subsidi BBM dari APBN. Sehubungan dengan itu
Pemerintah harus menyusun rencana strategis untuk
tindak lanjutnya. Langkah pertama yang sebaiknya
ditempuh Pemerintah adalah meng”earmark” dana
yang bisa dihemat dari pembatasan subsidi tersebut,
dan mengalokasikannya untuk kepentingan sesuai
sasaran yang ditetapkan khususnya kegiatan yang bisa
menambah ketersediaan energi dan/atau kebutuhan
akan BBM dan subsidinya, seperti pengembangan
sumber daya energi, pengembangan jasa transportasi
massa, dan lain-lain. Dana yang telah di”earmark”
tersebut, sebagian harus digunakan untuk memberikan
kompensasi kepada kelompok ekonomi lemah seperti
disampaikan pada sub sebelumnya. Selanjutnya, untuk
tahun-tahun selanjutnya selama dibutuhkan, sejalan
dengan penerapan kerangka pembangunan jangka
the application of price discrimination, regardless of
inter-area, inter-buyer groups, or interim, in addition
to requiring large extra and permanent costs for its
implementation (such as for smart cards), will also
tend to experience leakage, so that its effectiveness
will be relatively low. Thus, subsidy limitation though
the application of price discrimination will most
likely not give budget savings as much as expected.
However, if it is indeed to be implemented, the price
discrimination can be implemented according to its
type.
With the revocation of the fuel subsidy
expenditure, the main impact felt by the Government
will be the elimination of all or part of the fuel subsidy
expenditure burden from the Indonesian Budget.
In that relation, the Government must develop a
strategic plan for its follow up. The first step that
should be taken by the Government is to “earmark”
funds that can be saved from that subsidy limitation,
and allocate them to the purposes according to the
determined targets, particularly for activities that will
be able to increase the availability of energy and/
or the need for fuel and its subsidation, such as for
energy resource development, mass transportation
service development, and others. These “earmarked”
funds, must be partly used to provide compensation
to the economically weak groups as described in the
previous section. Furthermore, for the following years,
as long as required, in line with the application of the
medium-term development framework (KPJM), the
KEBIJAKAN PEMBATASAN SUBSIDI BAHAN BAKAR MINYAK (BBM) : POTENSI MANFAAT DAN RISIKONYA UMUM FUEL (BBM) SUBSIDY LIMITATION POLICY: ITS POTENTIAL BENEFITS AND RISKS GENERAL

153THE INDONESIANBUDGET OVERVIEW 2010
Government must place a program that is financed
from the earmark of subsidy expenditure savings as a
baseline program, until its goals have been attained.
Alternative uses of funds resulting from the fuel
subsidy savings that can be considered are, among
others, (1) to investment in the energy (electricity)
sector in order to decrease the electricity subsidy
burden in the future, (2) to increase expenditures for
several priority programs in the framework of fiscal
stimulus, particularly infrastructures that can make
fuel use more efficient, and (3) to develop a mass
transportation system. Through these steps, it is
expected that the subsidy limitation policy will be able
to provide positive added value.
IMPORTANT NOTES From the aforesaid description, some important
notes can be made, as follows:
1. The fuel subsidy expenditure is a significant
component from the amount side, however it
tends to be inefficient in its allocation;
2. The fuel subsidy allocation tends to give more
benefits to economically weaker community
groups in terms of its nominal value and its utility
level;
3. Subsidy limitations cause absolute loss effects
(absolute sacrifice) that are larger to the community
groups with medium and higher incomes, but the
relative loss effect (relative sacrifice) is experienced
by the two community groups at a level that tends
to be equal;
menengah (KPJM), Pemerintah harus menempatkan
program yang dibiayai dari earmark penghematan
belanja subsidi tersebut sebagai program baseline,
hingga sasarannya sudah tercapai. Alternatif
penggunaan dana hasil penghematan subsidi BBM
yang dapat dipertimbangkan antara lain adalah (1)
untuk investasi di bidang energi (listrik) dalam rangka
mengurangi beban subsidi listrik di masa depan, (2)
untuk menambah belanja beberapa program prioritas
dalam rangka stimulus fiskal khususnya infrastruktur
yang dapat mengefisienkan penggunaan BBM, dan
(3) pengembangan sistem transportasi massa. Melalui
langkah tersebut, diharapkan bahwa kebijakan
pembatasan subsidi akan dapat memberikan nilai
tambah yang positif.
CATATAN PENTINGDari ulasan yang disampaikan di atas, dapat diambil
beberapa catatan penting sebagai berikut :
1. Belanja subsidi BBM merupakan komponen
yang siginifikan dari sisi besarannya, akan tetapi
cenderung inefisien dalam alokasinya;
2. Alokasi subsidi BBM cenderung memberikan
manfaat yang lebih besar bagi kelompok
masyarakat golongan ekonomi yang lebih
kuat dalam hal nilai nominalnya dan tingkat
kepuasannnya;
3. Pembatasan subsidi mengakibatkan dampak
kehilangan yang secara absolute (absolute sacrifice)
lebih besar bagi kelompok masyarakat pendapatan
menengah ke atas, tetapi secara relative (relative
sacrifice) dialami oleh semua kelompok masyarakat
KEBIJAKAN PEMBATASAN SUBSIDI BAHAN BAKAR MINYAK (BBM) : POTENSI MANFAAT DAN RISIKONYA UMUM FUEL (BBM) SUBSIDY LIMITATION POLICY: ITS POTENTIAL BENEFITS AND RISKS GENERAL

154 THE INDONESIANBUDGET OVERVIEW 2010
pada tingkat yang cenderung sama;
4. Bila pembatasan subsidi BBM jadi dilaksanakan,
sebaiknya Pemerintah meng-earmark dana dari
penghematan tersebut dan digunakan untuk
(a) memberikan kompensasi bagi kelompok
masyarakat ekonomi lemah agar tidak mengalami
kondisi worse off atau justru menimbulkan kondisi
better off, (b) investasi yang bisa memberikan
nilai tambah dalam jangka panjang khususnya
terkait dengan pemenuhan kebutuhan energi
masyarakat, dan (c) menambah belanja prioritas;
5. Dalam hal pembatasan tersebut bersifat sebagian,
untuk efektivitasnya, agar dihindarkan penerapan
strategi diskriminasi harga (price discrimination).
4. If the fuel subsidy limitation is indeed implemented,
the Government should earmark the funds
gained from such savings and use them to: (a)
compensate the economically weak community
groups to prevent them from experiencing a worse
off condition or even create a better off condition,
(b) investments that are able to give added value
in the long-term, particularly those related to the
satisfaction of the energy needs of the community,
and (c) increase the priority expenditures;
5. In case the limitation is partial in nature, to be
effective the application of a price discrimination
strategy should be avoided.
KEBIJAKAN PEMBATASAN SUBSIDI BAHAN BAKAR MINYAK (BBM) : POTENSI MANFAAT DAN RISIKONYA UMUM FUEL (BBM) SUBSIDY LIMITATION POLICY: ITS POTENTIAL BENEFITS AND RISKS GENERAL

155THE INDONESIANBUDGET OVERVIEW 2010
PENDAHULUAN
Peranan pemerintah khususnya melalui instrumen
kebijakan fiskal dalam perekonomian nasional
sangat penting. Pada saat mekanisme pasar tidak
berjalan sebagaimana mestinya di tengah-tengah
distribusi pendapatan yang tidak seimbang, maka
Pemerintah perlu melakukan intervensi untuk
dapat meningkatkan aggregate demand. Keynes,
salah seorang ekonom terkenal, sudah sejak lama
menyatakan tentang pentingnya peranan pemerintah
tersebut khususnya di tengah krisis. Dia berpendapat
bahwa apabila perekonomian dalam keadaan resesi,
maka masyarakat tidak akan percaya kepada pasar
sehingga Pemerintah harus melakukan penyelamatan
agar tidak terjadi kehancuran pasar.
Pada tulisan ini, akan dijabarkan krisis ekonomi dunia
yang terjadi di tahun 2008-2009 dan memaksa
pemerintah bersama-sama DPR mengambil langkah-
langkah khusus melalui kebijakan stimulus fiskal
serta melihat secara detil reward and punishment
yang untuk pertama kalinya diterapkan terhadap
stimulus fiskal di tahun 2009. Selanjutnya juga akan
INTRODUCTION
The Government’s role, particularly through the use
of fiscal policy instruments in the national economy, is
very important. When the market mechanism reaches
a deadlock regarding an imbalanced distribution of
income, then the Government needs to intervene in
order to be able to increase the aggregate demand.
Keynes, a well-known economist, long ago pointed
out the importance of such a government role,
particularly in times of crisis. He suggested that if the
economy is in a recession, then the community will
not believe in the market; therefore, the Government
must conduct a rescue operation to prevent the
market from collapsing.
This writing will elaborate on the world economic
crisis which occurred from 2008-2009, which forced
the government and the House of Representatives
(DPR) to take special steps through a fiscal stimulus
policy, and to see in detail the reward and punishment
system that was applied for the first time to the fiscal
stimulus in 2009. Afterwards, some problems to face
PENERAPAN REWARD DAN PUNISHMENT STIMULUS FISKAL
APPLICATION OF REWARD AND PUNISHMENT IN FISCAL STIMULUS

156 THE INDONESIANBUDGET OVERVIEW 2010
disampaikan beberapa permasalahan yang dihadapi
serta pelajaran yang dapat dipetik dari penerapan
reward and punishment stimulus fiskal di tahun
2009.
LATAR BELAKANG
Krisis ekonomi global pada tahun 2008 yang dipicu
oleh krisis sektor perumahan di AS dimulai sejak
tahun 2007 terus berlangsung di tahun 2008.
Krisis yang menyebabkan menurunnya kinerja
perekonomian dunia secara drastis pada tahun 2008
tersebut diperkirakan masih akan terus berlanjut
bahkan akan meningkat intensitasnya di tahun 2009.
Perlambatan pertumbuhan ekonomi dunia, selain
menyebabkan volume perdagangan global pada
tahun 2009 merosot tajam, juga akan berdampak
pada banyaknya industri besar yang menjadi
bangkrut, terjadinya penurunan kapasitas produksi
serta meningkatnya jumlah pengangguran dunia.
Hal ini tentu saja menimbulkan kecemasan akan
terjadinya krisis keuangan global sebagaimana great
depression yang terjadi di tahun 1930-an. Beberapa
negara di dunia bahkan telah melakukan sejumlah
langkah-langkah penyelamatan termasuk dengan
rasionalisasi perbankan. Hal ini diperlukan mengingat
krisis tersebut dapat berkembang dari krisis keuangan
menjadi krisis kepercayaan.
Bagi negara-negara berkembang, krisis ini berpotensi
untuk merusak fundamental perekonomian dan
memicu terjadinya krisis ekonomi yang lebih parah.
Kekhawatiran atas dampak negatif pelemahan
ekonomi global terhadap perekonomian di negara-
and lessons to be learned from the application of this
reward and punishment system of fiscal stimulus in
2009 will be presented.
BACKGROUND
The global economic crisis in 2008, which was
triggered by the housing sector crisis in US, began in
2007 and continued in 2008. This Crisis, which caused
a dramatic decrease in world economic performance
in 2008, was predicted to continue and even increase
in intensity in 2009. The slowdown of world economic
growth, in addition to causing global trade volume to
drop sharply in 2009, will also bankrupt many large
industries, see production capacity decreases, and
lead to increases in world unemployment figures. The
occurrence of this global monetary crisis has certainly
caused anxiety, as did the great depression which
occurred in 1930’s. Some countries have even taken
a number of rescue measures, including through
means of banking rationalization. This is necessary
considering that such a crisis could develop from a
monetary crisis into confidence crisis.
For the developing countries, this crisis has a potential
to damage economic fundamentals and to trigger
the occurrence of a worse economic crisis. This
fear of negative impacts from the global economic
weakening the economy in developing countries has
PENERAPAN REWARD DAN PUNISHMENT STIMULUS FISKAL | APPLICATION OF REWARD AND PUNISHMENT IN FISCAL STIMULUS

157THE INDONESIANBUDGET OVERVIEW 2010
negara berkembang ini, telah memberikan tekanan
pada mata uang seluruh dunia, termasuk Indonesia.
Indonesia sebagai bagian dari perekonomian dunia
juga tidak dapat terlepas dari dampak perlemahan
ekonomi dunia tersebut. Dampak negatif yang
paling cepat dirasakan sebagai akibat dari krisis
perekonomian global adalah pada sektor keuangan
melalui aspek sentimen psikologis maupun akibat
merosotnya likuiditas global. Harga saham di Bursa
Efek Indonesia (BEI) turun mencapai sekitar 50,0
persen seiring depresiasi nilai tukar rupiah dengan
volatilitas yang meningkat. Sepanjang tahun 2008,
nilai tukar rupiah telah terdepresiasi sebesar 17,5
persen. Kecenderungan volatilitas nilai tukar rupiah
tersebut diperkirakan masih akan berlanjut hingga
tahun 2009 dengan masih berlangsungnya upaya
penurunan utang dari lembaga keuangan global.
Berbagai kondisi tersebut di atas diperkirakan akan
berpengaruh signifikan terhadap perlambatan
pertumbuhan ekonomi, penyediaan kesempatan kerja,
dan upaya pengurangan kemiskinan. Pertumbuhan
ekonomi diperkirakan akan menurun ke level 4,5
persen terutama disebabkan oleh (1) perlambatan
investasi yang diperkirakan mencapai 4,0 persen,
lebih rendah dari perkiraan sebelumnya sebesar 7,5
persen, antara lain berasal dari penanaman modal
asing (PMA) dan investasi portofolio; dan (2) kinerja
ekspor yang melambat dari perkiraan sebelumnya
7,8 persen menjadi nol persen. Penurunan ekspor
tersebut juga diikuti oleh penurunan produksi,
sehingga pada akhirnya pengurangan tenaga kerja
(PHK) sulit dihindari.
put pressure on all currencies throughout the world,
including in Indonesia.
Similarly, Indonesia, as part of the world economy,
could not avoid this weakening impact on world
economics. The negative impact which was perceived
most quickly as being a result of the global economic
crisis was in the monetary sector, through both
the psychological sentiment aspect and as a result
of decreased global liquidity. Share prices in the
Indonesia Stock Exchange (ISX) decreased by around
50.0 percent in a line with the increased volatility of
rupiah exchange rate depreciation. Over 2008, the
rupiah exchange rate depreciated by 17.5 percent. It
was predicted that this tendency of rupiah exchange
rate volatility would continue until 2009, accompanied
by the ongoing efforts to reduce debts from global
financial institutions.
It is expected that these various conditions as described
above will cause a significant slowdown in economic
growth, the provision employment opportunities,
and poverty alleviation efforts. Economic growth will
predictably decrease to a level 4.5 percent, which is
specifically caused by: (1) an investment slowdown
that is predicted to be 4.0 percent, lower than the
previous forecast of 7.5 percent, originating from,
among other things, foreign investments (PMA)
and portfolio investments; and (2) slower export
performance, down from the previous forecast of
7.8 percent to zero percent. This export decrease was
also followed by a decrease in production, making it
difficult to avoid employment terminations (PHK).
PENERAPAN REWARD DAN PUNISHMENT STIMULUS FISKAL | APPLICATION OF REWARD AND PUNISHMENT IN FISCAL STIMULUS

158 THE INDONESIANBUDGET OVERVIEW 2010
Dengan berbagai perkembangan tersebut,
peningkatan pengangguran tenaga kerja dan jumlah
masyarakat miskin merupakan akibat berikutnya yang
akan segera dialami oleh perekonomian nasional. Saat
itu, fenomena pemutusan hubungan kerja (PHK) telah
terjadi pada industri-industri yang berorientasi ekspor,
menyusul kemudian rencana PHK pada industri tekstil
dan produk tekstil (TPT) dan kertas, dan rencana
merumahkan tenaga kerja pada industri perkayuan
dan industri perkebunan. Selain itu, resesi global juga
akan mengakibatkan PHK atas sebagian dari tenaga
kerja Indonesia (TKI) di luar negeri, dan pemulangan
mereka ke Indonesia. Hal ini tentu akan menambah
berat tekanan pada pasar tenaga kerja di Indonesia,
sekaligus juga akan mengurangi pendapatan devisa
dari penghasilan mereka di luar negeri.
KEBIJAKAN STIMULUS FISKAL
Dalam rangka memperkecil dampak negatif dari
krisis keuangan global tersebut, Pemerintah perlu
melakukan langkah-langkah penyesuaian darurat di
bidang fiskal, guna menyelamatkan perekonomian
nasional tahun 2009 dari krisis global, antara lain
dengan memperluas program stimulus ekonomi
melalui APBN 2009, melakukan perubahan terhadap
beberapa asumsi ekonomi makro yang dirasakan
sudah tidak lagi realistis, dan penyesuaian berbagai
besaran pendapatan negara, belanja negara, serta
defisit dan pembiayaan anggaran. Salah satu langkah
yang ditempuh pemerintah adalah melalui program
stimulus fiskal.
Kebijakan stimulus fiskal untuk countercyclical yang
With these various developments, the next
consequence to be imminently experienced by the
national economy was increased unemployment
and increased number of poor. At that time, layoffs
occurred in export-oriented industries, followed later
by the layoff plans in the textile and textile product
(TPT) and paper industries, and the layoff plan in the
timber industry and plantation industries. In addition
to this, the global recession will also cause the
termination of some Indonesian labour (TKI) abroad,
and their repatriation to Indonesia. This will certainly
increase the pressure on labor market in Indonesia,
while at the same time reducing foreign exchange
revenues from their income abroad.
FISCAL STIMULUS POLICY
In the framework of reducing the negative impacts of
the global monetary crisis, the Government needs to
take emergence adjustment steps in the fiscal sector,
in order to save the national economy in 2009 from
the global crisis, by means of, among other things:
expanding the economic stimulus program through
the 2009 Indonesian Budget, making changes to some
macro economic assumptions that are perceived as no
longer being realistic, and the adjustment of various
amounts of revenues, expenditures, and budget deficit
and financing. One step taken by the government is
through the fiscal stimulus program.
The countercyclical fiscal stimulus policy that was
PENERAPAN REWARD DAN PUNISHMENT STIMULUS FISKAL | APPLICATION OF REWARD AND PUNISHMENT IN FISCAL STIMULUS

159THE INDONESIANBUDGET OVERVIEW 2010
diambil Pemerintah pada dasarnya dimaksudkan
untuk :
1. Mempertahankan daya beli masyarakat;
2. Membenahi sektor keuangan dan pasar modal;
3. Melakukan optimalisasi APBN
Kebijakan stimulus fiskal tersebut diterapkan baik
pada sisi pendapatan (melalui income tax) maupun
pada sisi belanja (spending) dengan tujuan :
(a) mempertahankan dan/atau meningkatkan
daya beli masyarakat untuk dapat menjaga laju
pertumbuhan konsumsi di atas 4,0 persen;
(b) mencegah PHK dan meningkatkan daya
tahan dan daya saing usaha menghadapi krisis
ekonomi dunia; dan
(c) menangani dampak PHK dan mengurangi
tingkat pengangguran dengan meningkatkan
belanja infrastruktur padat karya.
Disisi pendapatan, peningkatan daya beli masyarakat
dilakukan melalui penurunan tarif PPh Orang
Pribadi dan kenaikan penghasilan tidak kena pajak,
pemberian subsidi harga untuk obat generik, dan PPN
untuk produk akhir ditanggung Pemerintah (DTP),
penurunan harga BBM, kenaikan gaji PNS, TNI, Polri
dan pensiunan, guru/dosen, dan pemberian bantuan
langsung tunai (BLT). Peningkatan daya saing dan
daya tahan usaha ditempuh melalui penurunan tarif
PPh Badan dan perusahaan terbuka, pemberian
fasilitas bea masuk DTP, PPh pasal 21 dan 25 DTP, PPN
DTP, potongan tarif listrik untuk industri, penurunan
harga solar, subsidi bunga bagi perusahaan air bersih,
taken by the Government is basically aimed at:
1. Maintaining the public’s purchasing power;
2. Rearranging the monetary and capital market
sectors;
3. Optimizing the Indonesian Budget
The fiscal stimulus policy is applied to both the income
side (through the income tax) and the spending side,
with the following purposes:
(a) To maintain and/or increase the community’s
purchasing power in order to be able to
maintain the consumption growth rate above
4.0 percent;
(b) To prevent layoffs (PHK) and to improve the
endurance and competitiveness of businesses
in facing to the world economic crisis; and
(c) To address the PHK impacts and to decrease
unemployment levels by increasing labor-
intensive infrastructure expenditures.
On the income side, the improvement of the
community’s purchasing power is conducted through:
decreasing Individual Income Tax (PPh) rates and
increasing non-taxable incomes; granting of a price
subsidy for generic medicines; VAT (PPN) for final
products borne by the Government (DTP); decreasing
fuel oil prices; increasing salaries for Civil Servants (PNS),
Indonesian Military (TNI), Indonesian Police (Polri) and
pensioners, and teachers/lecturers; and the granting of
Direct Cash Assistance (BLT). The increase of business
competitiveness and endurance is undertaken by:
decreasing the PPh rate for Corporations and publicly-
traded companies, granting of import duty facilities of
PENERAPAN REWARD DAN PUNISHMENT STIMULUS FISKAL | APPLICATION OF REWARD AND PUNISHMENT IN FISCAL STIMULUS
160 THE INDONESIANBUDGET OVERVIEW 2010
dan penyertaan modal negara (PMN) dalam rangka
kredit usaha rakyat.
Sedangkan dari sisi belanja, penciptaan lapangan kerja
dan penanggulangan dampak PHK perlu dilakukan
melalui penambahan anggaran untuk infrastruktur
yang terkait dengan bencana alam, jalan, jembatan,
irigasi, jaringan kereta api, percepatan penyelesaian
infrastruktur lanjutan, instalasi pengolahan air
minum, transmisi dan gardu induk listrik, infrastruktur
pasar, rumah sakit, serta revitalisasi dan rehabilitasi
pergudangan.
Stimulus fiskal disisi belanja tersebut selanjutnya
ditentukan atau dibatasi untuk program/kegiatan
dengan kriteria umum sebagai berikut:
1. Program/kegiatan harus menciptakan lapangan
kerja yang signifikan;
2. Hasilnya seketika dan dapat diselesaikan dalam
tahun 2009;
3. Memenuhi sasaran Inpres Nomor 5 Tahun 2008
tentang Fokus Program Ekonomi 2008-2009;
4. Harus melengkapi sistem jaringan infrastruktur
agar lebih efisien;
5. Program/kegiatan yang dipilih merupakan bagian
dari rencana strategis pemerintah;
6. Timely, targeted dan temporary.
Untuk menjamin agar pelaksanaan kegiatan dapat
mencapai targetnya, maka selain kriteria umum
tersebut diatas, juga ditetapkan kriteria pelaksanaan
DTP, PPh articles 21 and 25 of DTP, PPN DTP, electricity
rate discount for industry, decreased diesel oil prices,
interest subsidy to clean water companies, and capital
participation (PMN) in the framework of the people’s
business credit program.
On the spending side, the creation of job opportunities
and the mitigation of the impact of layoffs needs to
be conducted through: increasing the budget for
infrastructure related to natural disasters, roads,
bridges, irrigation, railways, acceleration of advanced
infrastructure completion, drinking water treatment
plants, electricity transmission and main relay stations,
market infrastructure, hospitals, and warehousing
revitalization and rehabilitation.
The fiscal stimulus for the spending side was later
determined or limited to programs/activities with the
following general criteria:
1. The program/activity must create significant job
opportunities;
2. Its result is immediate and can be completed in
2009;
3. Meeting the goals of Presidential Instruction
(Inpres) Number 5 of 2008 regarding Focus of the
2008-2009 Economic Program;
4. Must be equipped with an infrastructure network
system for more efficiency;
5. The selected program/activity is part of the
government strategic plan; and
6. Is timely, targeted and temporary.
In order to ensure that the implementation of activities
will attain the goals, then, in addition to the aforesaid
general criteria, the criteria of activity implementation
PENERAPAN REWARD DAN PUNISHMENT STIMULUS FISKAL | APPLICATION OF REWARD AND PUNISHMENT IN FISCAL STIMULUS

161THE INDONESIANBUDGET OVERVIEW 2010
kegiatan yaitu :
1. Kegiatan sudah memiliki desain atau dapat
menyiapkan desain secara cepat;
2. Kegiatan tersebut sudah tidak tersangkut masalah
tanah;
3. Dipastikan dapat terserap pada tahun 2009.
Kriteria tersebut penting mengingat dana stimulus
fiskal harus bisa dilaksanakan secara cepat dan
direalisasikan tepat waktu agar multiplier effect-nya
terhadap perekonomian dapat segera dirasakan.
Karena itu, untuk menjaga agar pelaksanaan kegiatan
serta pencairan dana dapat terlaksana, Pemerintah
juga menerapkan sistem Reward and Punishment
untuk pertama kalinya dalam pelaksanaan APBN,
sebagaimana tercantum dalam pasal 11A UU No.26
Tahun 2009 tentang Perubahan atas Undang-Undang
No.41 Tahun 2008 tentang APBN TA 2009.
PELAKSANAAN STIMULUS FISKAL DAN
PENERAPAN REWARD AND PUNISHMENT
Sebagai langkah awal perencanaan stimulus
fiskal, Pemerintah diwakili Menteri Keuangan pada
tanggal 23 Februari 2009 mengajukan usulan
penyesuaian atas APBN 2009 kepada Panitia
Anggaran DPR berkaitan dengan perkembangan
krisis keuangan global beserta langkah-langkah
darurat yang diperlukan. Tindakan Pemerintah
tersebut sejalan dengan Pasal 23 UU No. 41 tahun
2008 tentang APBN 2009, yang menyebutkan bahwa
dalam keadaan darurat pemerintah dengan pertujuan
DPR dapat menempuh langkah-langkah yang
are also established, namely:
1. The activity has had a design or can prepare the
design quickly;
2. The activity is not already entangled in any land
problem;
3. Is ascertained to be able to be absorbed in
2009.
These criteria are important, considering that the fiscal
stimulus funds must be able to be implemented quickly
and realized on time to allow its multiplier effects for
the economy to be felt immediately. Therefore, in
order to ensure that the activity implementation and
fund withdrawal can be realized, the Government
also applied a Reward and Punishment system for the
first time in the Indonesian Budget implementation,
as specified in Article 11A of Law No. 26 of 2009
regarding the Amendment to Law No. 41 of 2008 on
the Indonesian Budget for the 2009 Fiscal Year.
IMPLEMENTATION OF FISCAL STIMULUS AND THE
APPLICATION OF REWARD AND PUNISHMENT
As a preliminary step of the fiscal stimulus
planning, the Government, represented by the
Minister of finance, on the 23rd of February 2009
submitted the 2009 Indonesian Budget adjustment
proposal of to the Budget Committee of the House
of Representatives, related to the development of the
global monetary crisis and emergency steps needed
to be taken. This step taken by the Government
was in line with Article 23 of Law No. 41 of 2008
regarding the 2009 Indonesian Budget, which states
that in emergency situations the government, with
PENERAPAN REWARD DAN PUNISHMENT STIMULUS FISKAL | APPLICATION OF REWARD AND PUNISHMENT IN FISCAL STIMULUS

162 THE INDONESIANBUDGET OVERVIEW 2010
dipandang perlu untuk mengatasi keadaan darurat.
Bentuk usulan adalah penyesuaian APBN 2009 dan
program stimulus fiskal. Sebagaimana diatur pasal 23,
persetujuan DPR adalah keputusan yang tertuang di
dalam kesimpulan Rapat Kerja Panitia Anggaran DPR
RI dengan pemerintah yang dilakukan dalam waktu
1 x 24 jam sejak diterimannya usulan Pemerintah.
Waktu yang sempit menunjukkan sifat mendesaknya
program stimulus fiskal dimaksud.
Panitia Anggaran DPR pada tanggal 24
Februari 2009 mendukung adanya penyesuaian
APBN 2009 dan Program stimulus fiskal yang diajukan
Pemerintah. Bahkan, disepakati adanya tambahan
belanja dari semula yang diusulkan pemerintah sebesar
Rp10,2 triliun menjadi Rp12,2 triliun (dari stimulus
fiskal di bidang perpajakan dan belanja semula
Rp71,3 triliun menjadi Rp73,3 triliun). Disamping itu,
disepakati pula adanya lampiran yang memuat daftar
kementerian/lembaga yang mendapatkan tambahan
belanja berikut kegiatan atau obyek infrastruktur dan
lokasi untuk beberapa kegiatan di beberapa propinsi/
kabupaten.
Menindaklanjuti kesepakatan tersebut
dikeluarkan Surat Edaran Menteri Keuangan
No.812/MK.02/2009 tanggal 27 Februari 2009 yang
menginformasikan kepada kementerian/lembaga
yang mendapatkan alokasi stimulus fiskal, berupa
(i) pemberitahuan besaran alokasi, dan (ii) meminta
the approval of the House of Representatives (DPR),
can take steps that it deems necessary to overcome
the emergency situation. The form of the proposal
is an adjustment to the 2009 Indonesian Budget
and the fiscal stimulus program. As provided for in
Article 23, approval of the House of Representatives
is a decision that is contained in the conclusion of
the Work Meeting of the Budget Committee of the
House of Representative with the government, which
is convened within 24 hours as of the receipt of the
Government’s proposal. The narrow time indicates the
urgency of the fiscal stimulus program in question.
On the 24th of February 2009, the Budget
Committee of the House of Representatives supported
the adjustment of the 2009 Indonesian Budget and the
Fiscal stimulus program proposed by the Government.
It was even agreed to increase spending of the
amount proposed by the government from Rp10.2
trillion to Rp12.2 trillion (from the fiscal stimulus in
taxation and spending sector from Rp71.3 trillion to
Rp73.3 trillion). In addition to this, it was also agreed
to have attachments that contained a list of ministries/
institutions that will receive additional expenditures,
together with the activities or infrastructure objects
and locations for some activities in some provinces/
regencies.
Following up these agreements, the Circular
of the Minister of Finance No.812/MK.02/2009 dated
the 27th of February 2009 was issued, informing the
ministries/agencies of the receipt of fiscal stimulus
allocations, in the form of: (i) notices of allocation
amounts, and (ii) requests for the relevant ministries/
PENERAPAN REWARD DAN PUNISHMENT STIMULUS FISKAL | APPLICATION OF REWARD AND PUNISHMENT IN FISCAL STIMULUS
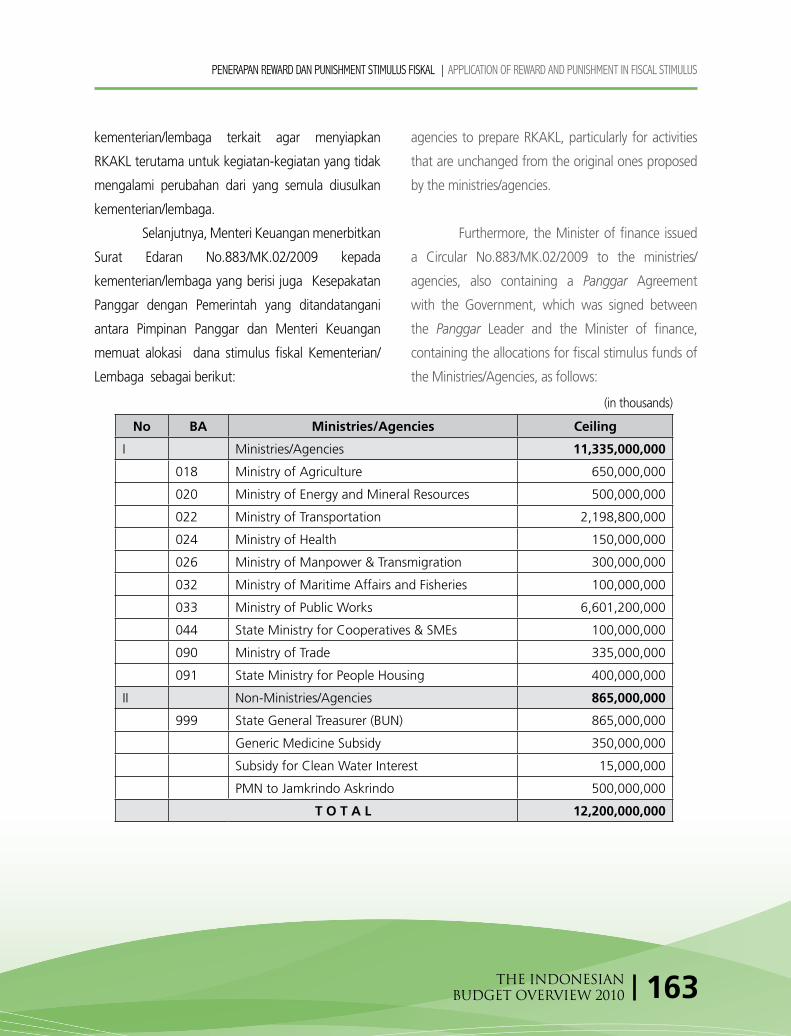
163THE INDONESIANBUDGET OVERVIEW 2010
kementerian/lembaga terkait agar menyiapkan
RKAKL terutama untuk kegiatan-kegiatan yang tidak
mengalami perubahan dari yang semula diusulkan
kementerian/lembaga.
Selanjutnya, Menteri Keuangan menerbitkan
Surat Edaran No.883/MK.02/2009 kepada
kementerian/lembaga yang berisi juga Kesepakatan
Panggar dengan Pemerintah yang ditandatangani
antara Pimpinan Panggar dan Menteri Keuangan
memuat alokasi dana stimulus fiskal Kementerian/
Lembaga sebagai berikut:
agencies to prepare RKAKL, particularly for activities
that are unchanged from the original ones proposed
by the ministries/agencies.
Furthermore, the Minister of finance issued
a Circular No.883/MK.02/2009 to the ministries/
agencies, also containing a Panggar Agreement
with the Government, which was signed between
the Panggar Leader and the Minister of finance,
containing the allocations for fiscal stimulus funds of
the Ministries/Agencies, as follows:
No BA Ministries/Agencies Ceiling
I Ministries/Agencies 11,335,000,000
018 Ministry of Agriculture 650,000,000
020 Ministry of Energy and Mineral Resources 500,000,000
022 Ministry of Transportation 2,198,800,000
024 Ministry of Health 150,000,000
026 Ministry of Manpower & Transmigration 300,000,000
032 Ministry of Maritime Affairs and Fisheries 100,000,000
033 Ministry of Public Works 6,601,200,000
044 State Ministry for Cooperatives & SMEs 100,000,000
090 Ministry of Trade 335,000,000
091 State Ministry for People Housing 400,000,000
II Non-Ministries/Agencies 865,000,000
999 State General Treasurer (BUN) 865,000,000
Generic Medicine Subsidy 350,000,000
Subsidy for Clean Water Interest 15,000,000
PMN to Jamkrindo Askrindo 500,000,000
T O T A L 12,200,000,000
PENERAPAN REWARD DAN PUNISHMENT STIMULUS FISKAL | APPLICATION OF REWARD AND PUNISHMENT IN FISCAL STIMULUS
(in thousands)

164 THE INDONESIANBUDGET OVERVIEW 2010
Untuk penyelesaian SAPSK dana stimulus
fiskal dalam prakteknya cukup bervariasi, SAPSK
Stimulus fiskal 2009 yang pertama kali ditetapkan
(23 Maret 2009) adalah SAPSK untuk Kementerian
Perumahan Rakyat. Sedangkan SAPSK terakhir yang
ditetapkan tanggal 7 November 2009 adalah SAPSK
untuk Kementerian Pertanian (BA 18) dan SAPSK
terakhir pada BA BUN (BA 999) untuk alokasi pada
bantuan langsung/subsidi pupuk (20 November
2009).
Secara lengkap tanggal penyelesaiannya
adalah sebagai berikut Kementerian Pertanian (7
November 2009), Kementerian Energi dan Sumber
Daya Mineral (24 Maret 2009), Kementerian
Perhubungan (11 Juni 2009), Kementerian Kesehatan
(31 Maret 2009), Kementerian Tenaga Kerja dan
Transmigrasi (8 April 2009), Kementerian Kelautan
dan Perikanan (30 April 2009), Kementerian Pekerjaan
Umum (1 Juni 2009), Kementerian Negara Koperasi &
UKM (20 Maret 2009), Kementerian Perdagangan (3
Juni 2009), Kementerian Negara Perumahan Rakyat
(23 Maret 2009), Subsidi Obat Generik (1 Mei 2009),
Subsidi Bunga Air Bersih (11 Juni 2009), PMN kepada
Jamkrindo Askrindo – KUR (11 November 2009),
Bantuan langsung Benih Unggul (19 November 2009),
dan bantuan langsung pupuk (20 November 2009).
Terdapat pemblokiran anggaran stimulus
fiskal dalam dokumen SAPSK yang telah diterbitkan
tersebut sebagai berikut:
In practice, the completion of the Budget
Per Work Unit (SAPSK) of fiscal stimulus funds varies
considerably. The SAPSK of the 2009 fiscal stimulus
which was stipulated for the first time (23 March 2009)
is the SAPSK for the Ministry of People’s Housing.
Whereas, the last SAPSK that was stipulated on the
7th of November 2009 was SAPSK for the Ministry
of Agriculture (BA 18), and the last SAPSK in the BA
BUN (BA 999) was an allocation for the fertilizer direct
assistance/subsidy (20 November 2009).
In all, the completion dates were as follows:
The Ministry of Agriculture (7 November 2009), the
Ministry of Energy and Mineral Resources (24 March
2009), the Ministry of Transportation (11 June 2009),
the Ministry of Health (31 March 2009), the Ministry
of Manpower and Transmigration (8 April 2009), the
Ministry of Maritime Affairs and Fisheries (30 April
2009), the Ministry of Public Works (1 June 2009), the
Ministry for Cooperatives & SMEs (20 March 2009),
the Ministry of Trade (3 June 2009), the Ministry of
People’s Housing (23 March, 2009), the Generic
Medicine Subsidy (1 May 2009), the Subsidy for
Clean Water Interest (11th of June, 2009), the PMN
to Jamkrindo Askrindo – KUR (11 November 2009),
Direct Assistance for Superior Seeds (19 November
2009), and fertilizer direct assistance (20 November
2009).
There was a blocking of the fiscal stimulus
budget in the SAPSK documents that have been
issued, as follows:
PENERAPAN REWARD DAN PUNISHMENT STIMULUS FISKAL | APPLICATION OF REWARD AND PUNISHMENT IN FISCAL STIMULUS

165THE INDONESIANBUDGET OVERVIEW 2010
No BA Ministries/Agencies Ceiling Blocked Reason
I Ministries/Agencies 11,335,000,000 109,284,239
018 Ministry of Agriculture 650,000,000 0
020 Ministry of Energy and Mineral Resources 500,000,000 3,788,666
Efficiency from the remaining study results in the Microhydro Electricity Generators that originates from the difference of cost standards
022 Ministry of Transportation 2,198,800,000 32,615,482Not completed with supporting data, efficiency result
024 Ministry of Health 150,000,000 70,669Remaining study results (efficiency) of building construction
026 Ministry of Manpower and Transmigration 300,000,000 61,616,711
Activity duplication with BPN2TKI and not completed with supporting data
032 Ministry of Maritime Affairs and Fisheries 100,000,000 0
033 Ministry of Public Works 6,601,200,000 1,619,711Escalation fund not completed with audit of BPKP and supporting data
044 State Ministry for Cooperatives & SMEs 100,000,000 9,400,000
Remaining study results (efficiency) of costs standard difference
090 Ministry of Trade 335,000,000 173,000
091 State Ministry for People’s Housing 400,000,000 0
II Non-Ministries/Agencies 865,000,000 15,000,000
999 State General Treasurer (BUN) 865,000,000 15,000,000
Generic Medicine Subsidy 350,000,000
Subsidy for Clean Water Interest 15,000,000 15,000,000
Waiting for activity proposal from K/L and government regulation on subsidy
PMN to Jamkrindo Askrindo 500,000,000
T O T A L 12,200,000,000 124,284,239
PENERAPAN REWARD DAN PUNISHMENT STIMULUS FISKAL | APPLICATION OF REWARD AND PUNISHMENT IN FISCAL STIMULUS
(in thousands)

166 THE INDONESIANBUDGET OVERVIEW 2010
Dari jumlah blokir di atas, terdapat beberapa
usul pencairan blokir yang dapat disetujui diantaranya
Kementerian Tenaga Kerja dan Transmigrasi sebesar
Rp1.616.711.000,- dan Kementerian Negara Koperasi
dan UKM sebesar Rp9.400.000.000,-.
Dalam pelaksanaannya, program stimulus
fiskal dilakukan sebagai reward and punishment.
Penerapan reward and punishment pada program
stimulus fiskal tahun 2009, diatur dalam Undang-
Undang Nomor 26 tahun 2009 tentang APBN-P 2009,
pada pasal 11 A ayat (3), (4), dan (5) sebagai berikut:
3) Kementerian dan Lembaga (K/L) termasuk
propinsi dan kabupaten/kota yang melaksanakan
tugas pembantuan/dekonsentrasi yang tidak
sepenuhnya melaksanakan belanja stimulus fiskal
tahun 2009 sebagaimana telah ditetapkan, akan
menjadi faktor pengurang dalam penetapan
alokasi anggaran pada tahun berikutnya.
4) Ketentuan tersebut pada ayat (3) berlaku juga
bagi propinsi dan kabupaten/kota yang menerima
bantuan teknis dan pendanaan stimulus fiskal
dalam rangka mendukung pelaksanaan urusan/
tugas pemerintah daerah.
5) Faktor pengurang dalam penetapan alokasi
anggaran bagi kementerian/lembaga/propinsi/
kabupaten/kota yang tidak dapat memberikan
alasan yang dapat dipertanggungjawabkan
adalah sebesar sisa anggaran stimulus fiskal yang
tidak terserap.
From the aforesaid blocking, there were
several proposals for reduction of blocking that could
be approved, such as, the Ministry of Manpower and
Transmigration amounting to Rp1,616,711,000 and
the Ministry for Cooperatives and SMEs amounting to
Rp9,400,000,000.
In its implementation, the fiscal stimulus
program was implemented as a reward and
punishment system. Application of the reward and
punishment system on the 2009 fiscal stimulus
program is regulated in Law Number 26 of 2009
regarding the 2009 Indonesian Revised Budget, in
Article 11 A Paragraphs (3), (4), and (5) as follows:
3) The Ministries and Agencies (K/L), including
provinces and regencies/cities, that perform
seconded tasks/deconcentration which do not
fully conduct the 2009 fiscal stimulus spending
as prescribed will become a reducing factor in
the determination of budget allocations in the
following year.
4) The provision as referred to in Paragraph (3) above
also applies to the provinces and the regencies/
cities that receive technical and finance assistance
of fiscal stimulus in the framework of supporting
implementation of affairs/tasks of the regional
governments.
5) The reducing factor in the determination of budget
allocations to the ministries/agencies/provinces/
regencies/cities that fail to give justifiable reasons
is equal to the remaining budget of fiscal stimulus
not absorbed.
Such a ceiling reduction is conducted by the
PENERAPAN REWARD DAN PUNISHMENT STIMULUS FISKAL | APPLICATION OF REWARD AND PUNISHMENT IN FISCAL STIMULUS

167THE INDONESIANBUDGET OVERVIEW 2010
Pengurangan pagu tersebut dilakukan Pemerintah
melalui pemotongan pagu belanja RKA-KL/
transfer ke daerah. Pelaksanaan pemotongan
pagu belanja sebagaimana dimaksud diatur lebih
lanjut oleh Pemerintah.
Dalam Undang-Undang No. 47/2009 tentang
APBN 2010, hal yang sama diatur pada pasal 14 ayat
(1) s/d (8) dengan penambahan ketentuan berupa
pengurangan pagu harus dilaporkan dalam APBN-P
2010 dan atau LKPP 2010. Sebagai tindak lanjut
Undang-undang tersebut telah dikeluarkan Peraturan
Menteri Keuangan No.220/PMK.02/2009 tentang
Tata Cara Pemotongan/Pengurangan Pagu Belanja
Kementerian Negara/Lembaga dan Pagu Alokasi
Transfer Ke Daerah TA 2010 Yang Tidak Sepenuhnya
Melaksanakan Kegiatan Stimulus Fiskal TA 2009 .
Dalam Permenkeu tersebut dijabarkan pada Pasal
3 alasan yang tidak dapat dipertanggungjawabkan
adalah sebagai berikut:
a. Tidak dipenuhinya kriteria-kriteria kegiatan yang
dapat dibiayai dengan anggaran stimulus fiskal
Tahun Anggaran 2009 yaitu adanya permasalahan
pengadaan/penyiapan tanah dan/atau desain
kegiatan.
b. Tidak diikutinya peraturan perundang-undangan
di bidang pengadaan barang/jasa pemerintah;
c. Keterlambatan penunjukkan kepala satuan kerja
dan/atau pelaksana kegiatan;
d. Tidak termasuk sisa tender;dan/atau
e. Bukan akibat keadaan kahar (force majeure).
Government through a deduction of the spending
ceiling of the Work Planned Budget of Ministries/
Agencies (RKA-KL) or /transfer to the regions.
Implementation of spending ceiling deductions
as referred to above is regulated further by the
Government.
In Law No. 47 of 2009 regarding the 2010
Indonesian Budget, the same matter is provided for
in Article 14 Paragraphs (1) through (8) by means of
an addition of a provision that the ceiling reduction
must be reported in the 2010 Indonesian Revised
Budget and or the 2010 LKPP. As a follow-up to
such a law, a Regulation of the Minister of Finance
(Permenkeu) No.220/PMK.02/2009 has been issued
regarding procedures for Deductions/Reductions of
Expenditure Ceilings of the Ministries/Agencies and
Transfer Allocation Ceilings To Regions in FY 2010
That Did Not Fully Conduct Fiscal Stimulus Activities in
FY 2009. In that Permenkeu, Article 3 elaborates that
the justifiable reasons are as follows:
a. Not meeting criteria of activities that can be
financed with the fiscal stimulus budget of Fiscal
Year 2009, namely the existence of problems in
land procurement/preparation and/or activity
design.
b. Not complying with statutory regulations in
the field of procurement of goods/services for
government purposes;
c. Delays in the appointment of the work unit head
and/or the activity executor;
d. Not falling within the remaining tender; and/or
e. Not resulting from events of force majeure.
PENERAPAN REWARD DAN PUNISHMENT STIMULUS FISKAL | APPLICATION OF REWARD AND PUNISHMENT IN FISCAL STIMULUS

168 THE INDONESIANBUDGET OVERVIEW 2010
Adapun perhitungan dalam pemotongan/
pengurangan pagu belanja kementerian berdasarkan
pada Laporan Realisasi Kegiatan dan Anggaran
Stimulus Fiskal 2009. Bagi kementerian yang
menangani kegiatan dan anggaran stimulus fiskal
TA 2009 menghimpun/mengkonsolidasi LRKA-SF
2009 untuk satuan kerja pusat/vertikal kementerian
negara/lembaga yang bersangkutan dan provinsi/
kabupaten/kota yang melaksanakan kegiatan tugas
pembantuan/dekonsentrasi dan menyampaikannya
kepada Direktorat Jenderal Anggaran paling lambat
tanggal 31 Januari 2010. Sedangkan kementerian
yang menangani kegiatan dan anggaran stimulus
fiskal TA 2009 menghimpun/mengkonsolidasi LRKA-
SF 2009 provinsi/kabupaten/kota yang menerima
bantuan teknis dan pendanaan stimulus fiskal dalam
rangka mendukung pelaksanaan urusan/tugas
pemerintah daerah menyampaikannya kepada
Direktorat Jenderal Perimbangan Keuangan paling
lambat tanggal 31 Januari 2010
Apabila Kuasa Pengguna Anggaran Satuan
kerja dan provinsi/kabupaten/kota penerima dana
stimulus fiskal TA 2009 tidak menyampaikan LRKA-
SF 2009 sesuai waktu yang telah ditentukan, maka
data realisasi anggaran stimulus fiskal yang digunakan
adalah data yang tersedia pada Bendahara Umum
Negara (BUN).
Setelah LRKA-SF 2009 dan data dari
Direktorat Jenderal Perbendaharaan tersusun,
Direktorat Jenderal Anggaran dan Direktorat Jenderal
Perimbangan Keuangan membuat rekomendasi
pemotongan/pengurangan pagu belanja kementerian
The calculation of the expenditure ceiling
deduction/reduction of the ministries is based on
the Report of the Realization of Activities and 2009
Fiscal Stimulus Budget. For the ministries who work
with fiscal stimulus activities and the FY 2009 budget,
they shall consolidate the 2009 LRKA-SF for the
central/vertical work units of the relevant ministry/
agency, and the provinces/regencies/cities which
conduct seconding/deconcentration activities shall
submit them to the Director General of Budget not
later than the 31st of January, 2010. Whereas, the
ministries which work with activities and budget of
the FY 2009 fiscal stimulus shall consolidate the 2009
LRKA-SF of the provinces/regencies/cities that receive
technical and finance assistance of fiscal stimulus, in
order to support implementation of affairs/tasks of
the regional governments, and shall submit them to
the Director General of fiscal Balance not later than
the 31 January 2010.
If the Budget User Proxy of Work Unit and
the province/regency/city which receive the FY 2009
fiscal stimulus funds failed to submit the 2009 LRKA-
SF within the determined period, then the data of
fiscal stimulus budget realization to be used is the
data available from the General Treasurer (BUN).
Once the 2009 LRKA-SF and data from the
Director General of Treasury has been prepared, the
Director General of Budget and the Director General
of Fiscal Balance shall make a recommendation of
deduction/reductions to expenditure ceilings of the
PENERAPAN REWARD DAN PUNISHMENT STIMULUS FISKAL | APPLICATION OF REWARD AND PUNISHMENT IN FISCAL STIMULUS

169THE INDONESIANBUDGET OVERVIEW 2010
negara/lembaga dan pagu alokasi transfer ke daerah
pada provinsi/kabupaten/kota kepada Menteri
Keuangan.
Selanjutnya Menteri Keuangan menetapkan
surat edaran mengenai pemotongan/pengurangan
pagu belanja/pagu transfer alokasi ke daerah TA
2010 bagi kementerian negara/lembaga/provinsi/
kabupaten/kota yang tidak sepenuhnya melaksanakan
belanja stimulus fiskal TA 2009.
Sementara itu penilaian dari DJA dan
DJPK yang telah mendapatkan persetujuan Menteri
Keuangan telah menjadi dasar dikeluarkannya
Surat Edaran Nomor SE-82/MK.02/2010 tentang
Pemotongan/Pengurangan Pagu Belanja Kementerian
Negara/Lembaga dan Pagu Alokasi Transfer ke Daerah
TA 2010 yang Tidak Sepenuhnya Melaksanakan
Kegiatan Stimulus Fiskal TA 2009, dengan penetapan
sebagai berikut:
ministries/agencies and the transfer allocation ceilings
to regions in the provinces/regencies/cities to the
Minister of finance.
Furthermore, the Minister of finance issues
a circular letter on expenditure ceiling deductions/
reductions/ transfer allocation ceilings to regions for FY
2010 to the ministries/agencies/provinces/regencies/
cities which did not fully implement the fiscal stimulus
spending in FY 2009.
Meanwhile, the assessment from the
Directorate General of Budget (DJA) and the
Directorate General of Fiscal Balance (DJPK) which
has obtained the approval of the Minister of finance
becomes the basis for the issuance of Circular Number
SE-82/MK.02/2010 regarding Deductions/Reductions
of Expenditure Ceilings of the Ministries/Agencies and
Transfer Allocation Ceilings to the Regions in FY 2010
That Did not Fully Perform Fiscal Stimulus Activities in
FY 2009, with the following stipulations:
CodeState Ministries/ Agencies
Budget Allocation
Budget Blocked
Budget Ceiling after Blocking
LRKA-SF FY 2009
Unrealized Balance
Deducted/ Reduced
018 Ministry of Agriculture 260,000,000 11,353,339 248,646,661 240,077,907 8,568,754
020
Ministry of Energy and Mineral Resources
500,000,000 3,788,666 496,211,334 491,713,160 4,498,174
022 Ministry of Transportation 2,198,800,000 35,651,273 2,163,148,727 2,099,859,095 63,289,632 11,150,862
024 Ministry of Health 150,000,000 70,669 149,929,331 149,782,527 146,805 0
PENERAPAN REWARD DAN PUNISHMENT STIMULUS FISKAL | APPLICATION OF REWARD AND PUNISHMENT IN FISCAL STIMULUS
(in thousands)

170 THE INDONESIANBUDGET OVERVIEW 2010
Ketentuan pemotongan/pengurangan pagu
tersebut diperkuat dalam UU No. 2 tahun 2010
tentang Perubahan Atas Undang-Undang Nomor 47
Tahun 2009 tentang APBN TA 2010 Pasal 14 A yang
menetapkan pagu kementerian tahun anggaran 2010
yang dipotong dan dikurangi sebagai berikut:
a. Kementerian Perhubungan sebesar
Rp11.150.862.000,00, dan
b. Kementerian Tenaga Kerja dan Transmigrasi
sebesar Rp916.100.000,00
Perbedaan jumlah pemotongan pada SE-
82/MK.02/2010 dengan UU No. 2 Tahun 2010
disebabkan Satker pada Kementerian Koperasi
dan UKM yang mendapatkan dana stimulus fiskal
The aforesaid provisions on ceiling
deductions/reductions were confirmed in Law No. 2 of
2010 regarding the Amendment to Law Number 47
of 2009 on the FY 2010 Indonesian Budget in Article
14 A, which sets out that the ministerial ceilings for
fiscal year 2010 are to be deducted and reduced as
follows:
a. The Ministry of Transportation amounting to
Rp11,150,862,000 and
b. The Ministry of Manpower and Transmigration
amounting to Rp916,100,000
The difference of the deduction amount in
the SE-82/MK.02/2010 and in Law No. 2 of 2010 is
due to the Work Units in the Ministry of Cooperatives
and SMEs which received fiscal stimulus funds in FY
026
Ministry of Manpower and Transmigration
300,000,000 0 300,000,000 256,508,366 43,491,634 916,100
032
Ministry of Maritime Affairs and Fisheries
100,000,000 0 100,000,000 96,825,119 3,174,881 0
033 Ministry of Public Works 6,601,200,000 86,386,334 6,514,813,666 6,449,391,996 65,421,670 0
044
State Ministry for Cooperatives & SMEs
100,000,000 0 100,000,000 93,644,356 6,355,644 1,000,000
090 Ministry of Trade 335,000,000 173,000 334,827,000 324,280,428 10,546,572 0
091State Ministry for People’s Housing
400,000,000 0 400,000,000 398,040,383 1,959,617 0
Total 10,945,000,000 137,423,281 10,807,576,719 10,600,123,336 207,453,383 13,066,962
PENERAPAN REWARD DAN PUNISHMENT STIMULUS FISKAL | APPLICATION OF REWARD AND PUNISHMENT IN FISCAL STIMULUS

171THE INDONESIANBUDGET OVERVIEW 2010
pada TA 2010 tidak lagi mendapatkan alokasi dana
dekonsentrasi/pembantuan sehingga pemotongan/
pengurangan dana sebesar Rp1.000.000.000,- tidak
dapat dilakukan. Disamping itu terjadi pergeseran
alokasi anggaran stimulus fiskal pada Kementerian
Pertanian sebesar Rp390.000.000.000,- untuk subsidi
pupuk.
BEBERAPA PERMASALAHAN
Meski sudah direncanakan dengan matang dengan
kriteria yang jelas dan terukur, namun pada prakteknya,
pelaksanaan program stimulus fiskal masih mengalami
hambatan dan kendala baik dari sisi perencanaan,
penganggaran maupun pelaksanaannya. Beberapa
permasalahan yang dihadapi antara lain :
1. Adanya perbedaan pandangan antara Pemerintah
dengan DPR
Hal ini terjadi dalam perumusan kegiatan
yang dapat dibiayai dengan stimulus fiskal
maupun dalam menentukan lokasi pelaksanaan
kegiatan. Akibatnya, pelaksanaan kegiatan pada
beberapa K/L mengalami kendala karena belum
mendapatkan persetujuan DPR.
2. Usulan proyek/kegiatan yang belum memenuhi
kriteria yang disyaratkan
Meski kriteria stimulus fiskal sudah ditentukan
secara terukur, tetapi masih ada kegiatan
yang ternyata belum memenuhi kriteria yang
disyaratkan untuk dilaksanakan melalui stimulus
fiskal 2009, baik kriteria umum maupun kriteria
khusus. Hal ini tentu saja menjadi hambatan
dalam pelaksanaannya sehingga mempengaruhi
2010 and were no longer receiving deconcentration/
seconding fund allocations, so the fund deduction/
reduction amounting to Rp1,000,000,000 could not
be made. In addition to this, there was a fiscal stimulus
budget allocation shift in the Ministry of Agriculture
amounting to Rp390,000,000,000 for the fertilizer
subsidy.
SOME PROBLEMS
Though it has been planned thoroughly with clear
and measured performance, still in practice the
implementation of the fiscal stimulus program still
experienced some restrictions and constraints, from
the planning, budgeting and implementation aspects.
Some problems faced were, among other things:
1. Existence of different views between the
Government and the House of Representatives
This occurs in formulation of activities that can
be financed by fiscal stimulus and in determining
the activity implementation location. As a result,
activity implementation in some K/Ls experienced
constraints because of not having obtained the
approval of the House of Representatives.
2. Project/activity proposals that have not met the
required criteria
Although the fiscal stimulus criteria have been
determined on a measured basis, there are still
some activities that in fact have not met the
required criteria for implementation through the
2009 fiscal stimulus, for both general and specific
criteria. This certainly becomes a restriction in its
implementation, affecting budget absorption
PENERAPAN REWARD DAN PUNISHMENT STIMULUS FISKAL | APPLICATION OF REWARD AND PUNISHMENT IN FISCAL STIMULUS

172 THE INDONESIANBUDGET OVERVIEW 2010
realisasi penyerapan anggaran di lapangan.
3. Adanya perubahan lokasi dan alokasi dana
stimulus fiskal
Beberapa lokasi kegiatan yang semula sudah
disepakati dan dicantumkan dalam kesimpulan
rapat kerja antara Pemerintah dengan DPR
pada akhirnya tidak dapat dilaksanakan
karena kendala teknis di lapangan, sehingga
pemerintah harus mengusulkan kembali lokasi
kegiatan untuk mendapatkan persetujuan DPR.
Dengan demikian, pelaksanaan kegiatan juga
akan tertunda dan menjadi hambatan dalam
pelaksanaannya.
4. Masih adanya K/L yang tidak sepenuhnya
melaksanakan kegiatan
Selain karena belum memenuhi kriteria yang
sudah ditentukan, beberapa proyek tertunda
karena kekhawatiran serta kehati-hatian para
pelaksana kegiatan di lapangan agar tidak
terganjal masalah hukum di kemudian hari.
Disamping itu, proses penetapan surat edaran
menteri keuangan tentang pemotongan anggaran
bagi K/L yang tidak sepenuhnya melaksanakan
kegiatan stimulus fiskal juga tidak berlangsung tanpa
hambatan. Masalah utama yang dihadapi adalah
proses rekonsiliasi data realisasi anggaran antara
DJA, DJPB dan data yang bersumber dari K/L cukup
menyita waktu. Data yang akurat dibutuhkan dalam
mengambil kesimpulan yang relevan agar tidak
menimbulkan komplain dari K/L di kemudian hari.
realization in the field.
3. The existence of changes of locations and
allocation of fiscal stimulus funds
In the end, some activity locations that formerly
have been agreed and listed in the conclusion of
the working meeting between the Government
and the House of Representatives could not be
implemented due to technical constraints in the
field, so that the government must repropose the
activities location for the approval of the House
of Representatives. Thus, activity implementation
will also be delayed and become restriction in its
implementation.
4. There are still K/Ls that do not fully perform the
activities
Besides not yet meeting the determined
criteria, some projects are delayed due to the
apprehension and carefulness of the activity
implementers in the field, to avoid from being
stuck with legal problems in the future.
In addition to this, the stipulation process of the circular
of the Minister of finance on the deduction of budget
for K/Ls which did not fully perform fiscal stimulus
activities did not also take place without restrictions.
The main problem faced was that the reconciliation
process of budget realization data among the DJA,
the Directorate General of Treasury (DJPB) and
data sourced from the K/Ls was considerably time-
consuming. Accurate data are required in making
relevant conclusions in order not to cause complaints
from the K/Ls in the future.
PENERAPAN REWARD DAN PUNISHMENT STIMULUS FISKAL | APPLICATION OF REWARD AND PUNISHMENT IN FISCAL STIMULUS

173THE INDONESIANBUDGET OVERVIEW 2010
KESIMPULAN
Program Stimulus Fiskal yang diterapkan
pemerintah di tahun 2009 telah menjadi bantalan yang
kokoh bagi Indonesia dalam menghadapi guncangan
krisis ekonomi dunia yang telah terjadi. Program ini
berhasil dijalankan dengan baik oleh pemerintah
dengan dukungan DPR dan masyarakat pada
umumnya. Hal ini tidak terlepas dari ketatnya kriteria
yang digunakan dalam penentuan kegiatan stimulus
fiskal serta penerapan reward and punishment dalam
pelaksanaan stimulus fiskal tersebut.
Reward dan punishment merupakan suatu
cara dalam memotivasi Kementerian/Lembaga
dalam meningkatkan prestasi atau kinerjanya. Kedua
pendekatan ini cukup lama dikenal dalam dunia
kerja maupun dunia pendidikan. Reward merupakan
ganjaran, hadiah, penghargaan atau imbalan.
Dalam konsep manajemen, reward menjadi salah
satu alat untuk meningkatkan motivasi. Reward
dalam penganggaran bertujuan agar Kementerian/
Lembaga menjadi lebih giat dalam memperbaiki
atau meningkatkan prestasi yang telah dicapainya.
Sementara punishment diartikan sebagai hukuman
atau sanksi. Jika reward merupakan bentuk
reinforcement yang positif, maka punishment sebagai
bentuk reinforcement yang negatif. Punishment
dalam penganggaran yang diberikan secara tepat dan
bijak bisa menjadi alat motivasi pada Kementerian/
Lembaga untuk lebih meningkatkan kinerjanya.
Metode ini sebenarnya bersifat pedagogies, yaitu
untuk memperbaiki/merubah mindset maupun
perilaku dalam implementasi penganggaran menuju
CONCLUSIONS
The fiscal stimulus program that was
implemented by the Government in 2009 has served
a basis of study for Indonesia in facing the world
economic crisis that occurred. This program has been
successfully implemented by the Government with
support of the House of Representatives and the
Public. This cannot be separated from the tight criteria
used in determining the fiscal stimulus activities and
the application of the reward and punishment system
in the implementation of the fiscal stimulus.
The reward and punishment system is one
method in motivating the Ministries/Agencies in
improving their achievements or performance. These
two approaches have been known for a sufficiently
long time in the employment world and the education
world. A Reward is an incentive, prize, award or return.
In the management concept, a reward becomes one
of tools to improve motivation. A Reward in budgeting
is aimed so that the Ministries/Agencies become more
intense in repairing or improving their achievements. A
punishment means a penalty or sanction. If a reward is
a form of positive reinforcement, then a punishment is
as a form of negative reinforcement. A Punishment in
budgeting that is given properly and wisely can serve
as a motivational tool for the Ministries/Agencies to
improve their performance. This method is actually
pedagogic in nature, namely to repair/change the
mindset and behaviour in budgeting implementation
to be better, disciplined, efficient, effective, healthy
and accountable.
PENERAPAN REWARD DAN PUNISHMENT STIMULUS FISKAL | APPLICATION OF REWARD AND PUNISHMENT IN FISCAL STIMULUS
174 THE INDONESIANBUDGET OVERVIEW 2010
kearah yang lebih baik, disiplin, efisien, efektif, sehat
dan penuh tanggungjawab.
Program stimulus fiskal dilakukan melalui
reward and punishment diharapkan dapat
meningkatkan motivasi pada kementerian/lembaga
untuk dapat selalu meningkatkan kinerja yang
telah dicapainya. Sehingga terbangun motivasi
kementerian/lembaga untuk merencanakan dan
menggunakan anggaran secara tepat guna, tepat
sasaran sesuai kaidah penganggaran yang berlaku.
Pencapaian target sasaran atas penggunaan anggaran
secara efisien dan efektif akan berdampak pada
reward terhadap Kementerian/Lembaga. Namun,
sebaliknya apabila kementerian/lembaga tidak dapat
menggunakan anggaran secara maksimal, efektif
dan efisien dalam rangka pencapaian target sasaran
yang telah ditetapkan maka terhadap Kementerian/
Lembaga tersebut akan terkena punishment yang
diantaranya berupa pemotongan/pengurangan pagu
anggaran.
Pelaksanaan reward and punishment
pada program stimulus fiskal, dari sisi jumlah dana
pemotongan sebagai wujud punishment hanya
sekitar 0,1% dari pagu yang ada sehingga secara
keseluruhan pemanfaatan anggaran telah mendekati
pada target sasaran yang telah ditetapkan. Dengan
demikian dalam konteks penganggaran stimulus
fiskal, reward and punishment tersebut telah
dapat menjadi alat untuk membangun motivasi
Kementerian/Lembaga agar lebih meningkatkan
kinerja dan tanggungjawabnya dalam pemanfaatan
anggaran.
The fiscal stimulus program implemented
through the reward and punishment system is
expected to be able to improve motivation in the
ministries/agencies, so that they always improve
on their performance. Thus, motivation for the
ministries/agencies will be built into the plan and
they will use the budget in a proper and targeted
basis, in accordance with the prevailing budgeting
principles. The achievement of targeted goal of using
the budget efficiently and effectively will affect the
rewards for the Ministries/Agencies. However, on the
contrary, if a ministry/agency cannot use the budget
maximally, effectively and efficiently in the framework
of achieving the determined targets, then the relevant
Ministry/Agency will have a punishment imposed that
takes the form of, among other things, budget ceiling
deductions/reductions.
Implementation of the reward and
punishment system in fiscal stimulus program, from
the deduction fund amount standpoint as a realization
of punishment, was only around 0.1% of the existing
ceiling. Thus, as a whole, the budget utilization has
approached the determined targets. Therefore, in the
context of fiscal stimulus budgeting, the reward and
punishment system has been able to become a tool
to build motivation of the Ministries/Agencies in order
to improve their performance and responsibilities
regarding budget utilization.
PENERAPAN REWARD DAN PUNISHMENT STIMULUS FISKAL | APPLICATION OF REWARD AND PUNISHMENT IN FISCAL STIMULUS

175THE INDONESIANBUDGET OVERVIEW 2010
PENDAHULUANDalam rangka mengoptimalkan efektifitas
pelaksanaan pembangunan daerah, maka
penyelenggaraan pembangunan daerah harus benar-
benar sesuai dengan aspirasi, kebutuhan dan prioritas
daerah. Untuk itulah kebijakan otonomi daerah
dan desentralisasi fiskal adalah pilihan yang paling
tepat, karena telah menempatkan motor penggerak
pembangunan pada tingkatan pemerintahan yang
paling dekat dengan masyarakat, yaitu pemerintah
daerah.
Salah satu instrumen utama yang digunakan dalam
pelaksanaan desentralisasi fiskal adalah pemberian
kewenangan kepada pemerintah daerah untuk
memungut pajak (taxing power). Kebijakan pemberian
kewenangan kepada pemerintah daerah untuk
memungut pajak daerah masih sangat terbatas, hal
tersebut tercermin dari kontribusi Pendapatan Asli
Daerah (PAD) terhadap Anggaran Pendapatan dan
Belanja Daerah (APBD) yang belum optimal, khususnya
bagi kabupaten/kota. Secara nominal, pada tahun
2008 dan 2009 jumlah keseluruhan PAD untuk
INTRODUCTIONIn order to maximize the effectiveness of regional
development implementation, regional development
management must be in conformity with the
aspirations, needs and priorities of the regions. For
that purpose, regional autonomy and the fiscal
decentralization policy is the most appropriate choice,
because these place the driving motor of development
at the government level which is nearest to the
community, namely local governments.
One of the main instruments used in the implementation
of fiscal decentralization is the granting of authority to
the local governments to impose taxes (taxing power).
The policy of granting authority to local governments
to impose regional taxes is still very limited. This is
reflected from the contribution of Regional-Originated
Revenues (PAD) to the Regional Government Budget
(APBD) not being optimal, particularly for regencies/
cities. Nominally, in 2008 and 2009, the total PAD
for provinces/regencies/cities were, respectively, Rp54
trillion (15.6 percent of total APBD Revenues) and
PENGALIHAN PAJAK BUMI DAN BANGUNAN DAN BEA PEROLEHAN HAK ATAS TANAH DAN
BANGUNAN MENJADI PAJAK KABUPATEN/KOTA
THE DIVERSION OF LAND AND BUILDING TAX (PBB) AND DUTIES ON LAND AND BUILDING TRANSFERS
(BPHBT) TO BECOME REGENCY/CITY TAXES

176 THE INDONESIANBUDGET OVERVIEW 2010
provinsi/kabupaten/kota masing-masing sebesar
Rp54 triliun (15,6 persen dari total Pendapatan APBD)
dan Rp62,6 triliun (16,5 persen dari total Pendapatan
APBD). Dalam rangka penguatan taxing power
daerah, pada tanggal 18 Agustus 2009 Pemerintah
bersama-sama DPR RI telah mengundangkan UU
tentang Pajak Daerah dan Retribusi Daerah, yang
lebih dikenal dengan singkatan UU PDRD, yaitu UU
Nomor 28 Tahun 2009 sebagai pengganti UU Nomor
18 Tahun 1997 sebagaimana telah diubah dengan
UU Nomor 34 Tahun 2000.
Penyempurnaan UU PDRD tersebut menjadi
momentum penting pemberian otonomi yang seluas-
luasnya dalam bidang ekonomi dan fiskal. Pengesahan
UU PDRD ini sangat strategis dan mendasar di bidang
desentralisasi fiskal, karena terdapat perubahan
kebijakan yang cukup fundamental dalam penataan
kembali hubungan perimbangan keuangan antara
Pusat dan Daerah. Selama ini hubungan perimbangan
keuangan antara Pusat dan Daerah dirasakan kurang
memenuhi rasa keadilan suatu daerah, terlebih pada
daerah-daerah penghasil yang mempunyai potensi
sumber daya alam yang melimpah. Selain itu, hal ini
dimaksudkan agar daerah dapat memungut sumber-
sumber pendapatannya secara optimal sesuai dengan
potensi tiap-tiap daerah.
Pada hakikatnya, penerapan UU PDRD mempunyai
beberapa tujuan, antara lain: pertama, memberikan
kewenangan yang lebih besar kepada daerah
dalam perpajakan dan retribusi sejalan dengan
semakin besarnya tanggung jawab daerah dalam
Rp62.6 trillion (16.5 percent of total APBD Revenues).
In the framework of strengthening regional taxing
power, on the 18th of August 2009 the Government,
together with the House of Representatives, has
promulgated the Law of Regional Tax and Regional
Retribution, better known as the Law of PDRD, namely
Law Number 28 Of 2009 in lieu of Law Number 18 Of
1997 as Amended by Law Number 34 of 2000.
The rectification of the Law of PDRD has become
an important momentum for granting maximum
autonomy in the economic and fiscal sectors. The
ratification of this PDRD Law is very strategic and
fundamental for the fiscal decentralization sector, as
there has been a considerably fundamental change of
policy in the rearrangement of the financial sharing
relationship between the Central and Regional
Governments. So far, the financial sharing relationship
between the Central and Regional Governments
was perceived as not meeting the feeling of equity
among regions, especially for productive regions that
have abundant natural resource potential. In addition
to this, the intention is that the regions will able to
optimally take advantage of their income sources,
according to their respective potential.
Essentially, the application of the Law of PDRD has
several objectives, including: first, to give more
authority to regions in taxation and retribution, in
a line with the increasingly greater responsibility of
regions to implement government administration and
PENGALIHAN PAJAK BUMI DAN BANGUNAN DAN BEA PEROLEHAN HAK ATAS TANAH DAN BANGUNAN MENJADI PAJAK KABUPATEN/KOTATHE DIVERSION OF LAND AND BUILDING TAX (PBB) AND DUTIES ON LAND AND BUILDING TRANSFERS (BPHBT) TO BECOME REGENCY/CITY TAXES
177THE INDONESIANBUDGET OVERVIEW 2010
penyelenggaraan pemerintahan dan pelayanan kepada
masyarakat; kedua, meningkatkan akuntabilitas daerah
dalam penyediaan layanan dan penyelenggaraan
pemerintahan dan sekaligus memperkuat otonomi
daerah; serta ketiga, memberikan kepastian bagi
dunia usaha mengenai jenis-jenis pungutan daerah
dan sekaligus memperkuat dasar hukum pemungutan
pajak daerah dan retribusi daerah.
Salah satu perubahan yang mendasar yang terdapat
dalam UU PDRD tersebut adalah dialihkannya 2 jenis
pajak pusat menjadi pajak baru bagi kabupaten/
kota, yaitu Pajak Bumi dan Bangunan Perdesaan dan
Perkotaan (PBB-P2) dan Bea Perolehan Hak atas Tanah
dan Bangunan (BPHTB). Berdasarkan Pasal 182 UU
Nomor 28 Tahun 2009, pengalihan BPHTB menjadi
pajak kabupaten/kota dilakukan mulai 1 Januari
2011, sementara PBB-P2 efektif diberlakukan mulai 1
Januari 2014.
LANDASAN TEORITIS PENGALIHAN PBB DAN BPHTB MENJADI PAJAK DAERAHBerdasarkan pengalaman internasional, kebanyakan
negara maju melimpahkan urusan pajak properti (jika
di Indonesia pajak properti tersebut adalah seperti PBB
dan BPHTB), kepada pemerintah daerah.
Alasan yang paling umum, kenapa PBB dan BPHTB
berubah menjadi pajak daerah adalah karena (i)
manfaat dari pengeluaran-pengeluaran yang didanai
oleh pajak yang mereka bayar di dalam suatu kerangka
kerja akuntabilitas dan transparansi, (ii) ditinjau dari
kriteria pajak daerah, yaitu dari kesesuaian, keadilan
services to the community; second, to improve the
accountability of the regions in service rendition and
government administration, while at the same time to
strengthen regional autonomy; and third, to provide
certainty to the businesses on the types of regional
levies, while at the same time strengthen the legal
basis for the imposition of regional taxes and regional
retribution.
One of the fundamental changes in the Law of PDRD is
the diverting of 2 types of central tax to new taxes for
the regencies/cities, namely the Land and Building Tax
of Rural and Urban Sectors (PBB-P2) and the Duties on
Land and Building Transfers (BPHTB). Based on Article
182 of Law Number 28 of 2009, the diverting of the
BPHTB to become regency/city taxes will commence
on the 1st of January 2011, while the PBB-P2 will come
into effect as of the 1st of January, 2014.
THE THEORETICAL BASIS OF THE DIVERSION OF PBB AND BPHTB TO BECOME REGIONAL TAXESBased on international experiences, most of the
developed counties delegate property tax affairs to
the local governments (in Indonesia, the property tax
is equivalent to PBB and BPHTB).
The most common reasons for why the PBB and BPHTB
were changed to become regional taxes are, because:
(i) the benefits of expenses financed by taxes they pay
in the framework of accountability and transparency,
(ii) as viewed from regional tax criteria, namely from
properness, equity and compatibility, as regional
PENGALIHAN PAJAK BUMI DAN BANGUNAN DAN BEA PEROLEHAN HAK ATAS TANAH DAN BANGUNAN MENJADI PAJAK KABUPATEN/KOTATHE DIVERSION OF LAND AND BUILDING TAX (PBB) AND DUTIES ON LAND AND BUILDING TRANSFERS (BPHBT) TO BECOME REGENCY/CITY TAXES

178 THE INDONESIANBUDGET OVERVIEW 2010
dan kecocokan, sebagai pajak daerah (obyek pajak
tidak berpindah-pindah), (iii) ditinjau dari aspek
tujuannya, yaitu untuk meningkatkan sumber
penerimaan daerah. Namun demikian, di negara-
negara, dimana Pemerintahan Daerah dan PBB
daerah memegang peranan penting, tidak semua
PBB dipungut oleh Pemerintah Daerah. Di beberapa
negara, seperti Latvia dan Chili, PBB lebih banyak
menjadi pajak Pusat daripada pajak Daerah1.
Selanjutnya, KJ Davey mengatakan bahwa:
Pajak atas harta tetap, akan lebih tepat kalau
pengenaannya dilakukan oleh pemerintah daerah. Hal
ini karena: (1) sifat objek yang dikenakan pajak sangat
jelas lokasinya, (2) pajak tersebut melekat pada suatu
bidang tanah atau bangunan yang tidak disangkal lagi
merupakan bagian dari daerah tersebut. Berkaitan
dengan itu, pemberian sumber-sumber pendapatan
tertentu kepada pemerintah daerah mempunyai dua
keuntungan potensial. Pertama, baik bagi otonomi
daerah karena alokasi pendapatan tidak diarahkan
sesuai dengan pola-pola pengeluaran, sehingga
pemerintah daerah mempunyai kebebasan untuk
menentukan penggunaan hasil pendapatan tersebut.
Pemerintah daerah mempunyai kebebasan sepenuhnya
untuk mengatur mengenai pertanggungjawaban,
tarif dan kriteria pengenaan di lapangan pajak yang
diberikan, sehingga benar-benar tercapai keleluasaan
untuk memilih tingkat-tingkat perpajakan dan
pembelanjaan yang dikehendaki. Kedua, pendapatan
1 ”Strategi dan Peta Riwayat Pelimpahan Wewenang Pajak Bumi dan Bangunan”,
seri Desentralisasi Fiskal di Indonesia, Januari 2010.
tax (immovable tax objects), (iii) as viewed from its
objective aspect, namely to increase regional revenue
sources. However, in countries where the Regional
Governments and Regional PBB play important roles,
not all of PBB are collected by the local government.
In some countries, such as Latvia and Chili, the PBB
become central Tax more than regional Tax1.
Further, KJ Davey points out that:
Tax on immovable properties, will be more proper if
imposed by the local government. This is due to: (1)
characteristic of the object on which tax is imposed is
very clear in its location, (2) the tax attaches to a plot of
land or building that is inevitably a part of the region.
In that relation, the granting of certain income sources
to the local government has two potential benefits.
First, it is good for regional autonomy because the
revenue allocation is not directed according to the
expense patterns, so the local government has
freedom to determine the use of the income proceeds.
The local government has full freedom to control the
responsibility, rate and criteria of imposition in the tax
field given, so that the freedom to choose taxation
rates and expenditures as desired is really achieved.
Second, this revenue enables the local government to
optimize the collection of its revenues, so that it is able
to contribute fully to the national tax effort. In any
case, in the event of any failure of local governments
1 “Strategi dan Peta Riwayat Pelimpahan Wewenang Pajak
Bumi dan Bangunan”, seri Desentralisasi Fiskal di Indonesia,
January 2010.
PENGALIHAN PAJAK BUMI DAN BANGUNAN DAN BEA PEROLEHAN HAK ATAS TANAH DAN BANGUNAN MENJADI PAJAK KABUPATEN/KOTATHE DIVERSION OF LAND AND BUILDING TAX (PBB) AND DUTIES ON LAND AND BUILDING TRANSFERS (BPHBT) TO BECOME REGENCY/CITY TAXES
179THE INDONESIANBUDGET OVERVIEW 2010
tersebut memungkinkan pemerintah daerah
mengoptimalkan pemungutan pendapatannya,
sehingga dapat memberikan sumbangan sepenuhnya
terhadap upaya perpajakan nasional (national tax
effort). Minimal, jika terjadi kegagalan pemerintah
daerah dalam menggali lapangan pajak sebagaimana
mestinya, maka tidak akan memberikan beban
tambahan terhadap anggaran Negara2.
Sementara itu, Bambang Brodjonegoro juga
menegaskan bahwa tanah dan bangunan layak
dikelola sendiri oleh setiap daerah. Atas dasar
itu, daerah layak menerima hasil pungutan yang
berbasiskan tanah dan bangunan, yakni PBB dan
BPHTB. Pengalihan hasil pungutan PBB dan BPHTB
dibutuhkan oleh daerah untuk membiayai program-
program yang dapat memberikan stimulus pada
pengembangan investasi di wilayahnya3.
KEBIJAKAN PENGALIHAN PBB DAN BPHTB MENJADI PAJAK KABUPATEN/KOTAKebijakan pengalihan PBB dan BPHTB di Indonesia
ditandai dengan terbitnya UU Nomor 28 tahun
2009 tentang Pajak Daerah dan Retribusi Daerah
pada tanggal 18 Agustus 2009. Menurut Pasal 182
UU Nomor 28 tahun 2009 terdapat 2 jenis pajak
pusat yang akan dialihkan menjadi pajak baru bagi
kabupaten/kota, yaitu Pajak Bumi dan Bangunan
2 KJ Davey, “Pembiayaan Pemerintahan Daerah”, UI-Press,
1988, hal. 82 dan 258.
3 Bambang Brodjonegoro, “BPHTB Jadi Penerimaan Daerah “,
Harian Kompas, tanggal 15 Desember 2008.
to explore the tax field properly, there will not be
any additional burden on the Central goverment
Budget2.
Meanwhile, Bambang Brodjonegoro also points out
that it is reasonable for lands and buildings to be
managed on their own by each region. On this basis,
the regions deserve the proceeds of land and building-
based levies, namely PBB and BPHTB. The diversion
of proceeds of PBB and BPHTB imposition is needed
by the regions to finance programs that are able to
stimulate the investment development in their areas3.
POLICY OF PBB AND BPHTB DIVERSION TO BECOME REGENCY/CITY TAXES PBB and BPHTB diversion policy in Indonesia was
marked by the issuance of Law Number 28 of 2009
regarding Regional Tax and Regional Retribution on
the 18th of August, 2009. According to Article 182 of
Law Number 28 of 2009, there are 2 types of central
tax to be diverted into new taxes to the regencies/
cities, namely, the Land and Building Tax of Rural and
2 KJ Davey, “Pembiayaan Pemerintah Daerah”, UI-Press,
1988, pp 82 and 258.
3 Bambang Brodjonegoro, “BPHTB Jadi Penerimaan Daerah “,
Kompas daily newspaper, 15 December, 2008.
PENGALIHAN PAJAK BUMI DAN BANGUNAN DAN BEA PEROLEHAN HAK ATAS TANAH DAN BANGUNAN MENJADI PAJAK KABUPATEN/KOTATHE DIVERSION OF LAND AND BUILDING TAX (PBB) AND DUTIES ON LAND AND BUILDING TRANSFERS (BPHBT) TO BECOME REGENCY/CITY TAXES

180 THE INDONESIANBUDGET OVERVIEW 2010
Perdesaan dan Perkotaan (PBB-P2) dan Bea Perolehan
Hak atas Tanah dan Bangunan (BPHTB). Pengalihan
BPHTB menjadi pajak kabupaten/kota dilakukan
mulai 1 Januari 2011, sementara PBB Pedesaan dan
Perkotaan efektif diberlakukan mulai 1 Januari 2014.
Kebijakan pengalihan PBB dan BPHTB ke dalam
pajak daerah pada dasarnya dilatarbelakangi oleh
pertimbangan bahwa kedua jenis pajak tersebut lebih
tepat sebagai pajak daerah, serta pengalihan tersebut
juga netral terhadap fiskal (neutral fiscal) nasional,
sebagaimana dapat dilihat pada Bagan 1.
Di samping itu, sifat dari objek pajak PBB-P2 dan BPHTB
tersebut tidak mobile, bersifat lokal, dan sebagian
besar hasilnya telah diserahkan kepada daerah,
bahkan boleh dikatakan hampir keseluruhan hasilnya
sudah diserahkan kepada daerah, sebagaimana yang
tercermin pada Bagan 2 dan Bagan 3. Berdasarkan
Urban Sectors (PBB-P2) and the Duties on Land and
Building Transfers (BPHTB). The diverting of BPHTB to
become a regency/city tax will be conducted as of the
1st of January 2011, while Rural and Urban PBB shall
become effective as of the 1st of January, 2014. The
PBB and BPHTB diversion into regional tax policy is
principally backed by the consideration that these two
types of tax are more proper to be regional taxes, and
such a diverting is also fiscally neutral at the national
level, as can be seen in Chart 1.
In addition to this, these PBB-P2 and BPHTB tax
objects are immobile, local in nature, and most of
their proceeds have been delivered to the regions, and
it can even be said that nearly all of its proceeds have
been delivered to the regions, as reflected in Chart
2 and Chart 3. Based on the provisions in Article 12
PENGALIHAN PAJAK BUMI DAN BANGUNAN DAN BEA PEROLEHAN HAK ATAS TANAH DAN BANGUNAN MENJADI PAJAK KABUPATEN/KOTATHE DIVERSION OF LAND AND BUILDING TAX (PBB) AND DUTIES ON LAND AND BUILDING TRANSFERS (BPHBT) TO BECOME REGENCY/CITY TAXES
CHART I : PBB and BPH + B Diversion
Central Goverment
BPHTB BPHTB
PBB Sector :ØRuralØUrbanØFarmØForestryØMining
Bacground :w Characteristics of PBB-P2 Quality as Regional Tax - Immobile - The tax benefit-link local accountability - Best practice in many countries
PBB of Rural and Urban Sectors (PBB-P2)
Regencies/Cities
Start 1st January 2014
Start 1st January 2011

181THE INDONESIANBUDGET OVERVIEW 2010
ketentuan Pasal 12 ayat (1), (2), dan (3) UU Nomor 33
Tahun 2004 serta Pasal 5 dan Pasal 6 PP Nomor 55
Tahun 2005, bagian daerah atas PBB sebesar 10 persen
untuk pemerintah pusat, dan selebihnya sebesar 90
persen untuk daerah, dengan rincian sebesar 16,2
persen untuk provinsi, 64,8 persen untuk kabupaten/
kota, serta 9 persen untuk biaya pemungutan yang
dibagi untuk daerah. Adapun bagian yang 10 persen
untuk Pusat, sebenarnya dikembalikan secara merata
ke seluruh kabupaten/kota sebesar 6,5 persen,
sedangkan sisanya sebesar 3,5 persen untuk insentif
daerah yang menyetor PBB yang melebihi target.
Demikian pula, berdasarkan ketentuan Pasal 12 ayat
(4) dan (5) UU Nomor 33 Tahun 2004 serta Pasal 7
PP Nomor 55 Tahun 2005, bagian daerah atas BPHTB
ditetapkan sekitar 80 persen dari BPHTB adalah milik
daerah, dengan rincian 16 persen untuk provinsi dan
64 persen untuk kabupaten/kota, sedangkan sisanya
Paragraphs (1), (2), and (3) of Law Number 33 Of 2004
and Articles 5 and Article 6 of Government Regulation
(PP) Number 55 of 2005, PBB sharing is divided as
follows: 10 percent for the central government, with
the remaining 90 percent for the regions, which is
broken down into 16.2 percent for provinces, 64.8
percent for regencies/cities, and 9 percent for a shared
collection for regions. As to the 10 percent sharing for
the Central Government, this is in fact returned to all
regencies/cities at a rate of 6.5 percent, whereas the
remaining 3.5 percent is for incentives to regions that
pay PBB exceeding the target.
Similarly, based on the provisions in Article 12
Paragraphs (4) and (5) of Law Number 33 of 2004
and Article 7 of PP Number 55 of 2005, the share
of BPHTB for regions is stipulated as follows: around
80 percent of the BPHTB belongs to regions, which
is broken down into 16 percent for provinces and 64
PENGALIHAN PAJAK BUMI DAN BANGUNAN DAN BEA PEROLEHAN HAK ATAS TANAH DAN BANGUNAN MENJADI PAJAK KABUPATEN/KOTATHE DIVERSION OF LAND AND BUILDING TAX (PBB) AND DUTIES ON LAND AND BUILDING TRANSFERS (BPHBT) TO BECOME REGENCY/CITY TAXES
CHART 2 : REVENUE - SHARING OF PBB
PBB PBB
CentralGoverment
10% CentralGoverment
20%
Equally Shared to Regencies/Cities 6,5 %
Equally Shared to Regencies/
Cities
Regencies/Cities
Provinces16,2 % Provinces
Regencies/Cities Incen-tives 6,5 %
Regencies/Cities 64,8 %
Tax Fee64,8 %
RegionalGoverment
90%
RegionalGoverment
80%
Law Number 33 of 2004 regarding Revenue Sharing between the Central Govermment and Regional Goverment
Goverment Regulation Number 55 of 2005 regarding Shared Funds
Law Number 33 of 2004 regarding Revenue Sharing between the Central Govermment and Regional Goverment
Goverment Regulation Number 55 of 2005 regarding Shared Funds
CHART 3 : REVENUE - SHARING OF BPHTB

182 THE INDONESIANBUDGET OVERVIEW 2010
sebesar 20 persen yang disetor ke pusat akan disebar
kembali secara merata ke seluruh kabupaten/kota.
IMPLIKASI PENGALIHAN PBB DAN BPHTB MENJADI PAJAK KABUPATEN/KOTAPBB dan BPHTB disalurkan melalui APBN sebagai
dana bagi hasil (DBH) kepada pemerintah provinsi
dan kabupaten/kota guna membantu mengatasi
ketidakseimbangan vertikal (vertical fiscal imbalance).
Penyaluran DBH tersebut diatur dalam UU Nomor
33 Tahun 2004 tentang Perimbangan Keuangan
Pemerintah Pusat dan Pemerintahan Daerah serta PP
Nomor 55 Tahun 2005 tentang Dana Perimbangan.
Hingga tahun 2010, PBB dan BPHTB masih merupakan
pajak Pusat yang diselenggarakan oleh Direktorat
Jenderal Pajak, Kementerian Keuangan. PBB dibagi
menjadi lima sektor, yaitu sektor perkotaan, sektor
perdesaan, sektor perkebunan, sektor kehutanan,
dan sektor pertambangan. Dari kelima jenis PBB
tersebut, PBB yang akan dialihkan menjadi pajak
kabupaten/kota meliputi PBB sektor perkotaan dan
sektor perdesaan (PBB-P2).
Pengalihan PBB-P2 dan BPHTB dari pajak pusat menjadi
pajak kabupaten/kota pada dasarnya bersifat netral
terhadap fiskal (neutral fiscal) nasional sebagaimana
yang ditunjukkan dari hasil simulasi terhadap data
APBN-P 2010 pada Tabel 1.
Di samping itu, pengalihan PBB-P2 dan BPHTB
menjadi pajak kabupaten/kota juga berimplikasi
mengurangi ketimpangan keuangan secara vertikal.
percent for regencies/cities, whereas the remaining 20
percent that is paid to the central government will be
returned to all of the regencies/cities.
IMPLICATION OF PBB AND BPHTB DIVERSION TO BECOME REGENCY/CITY TAXESPBB and BPHTB are distributed through the
Indonesian Budget as revenue sharing fund (DBH) to
the province and regency/city governments, in order
to assist in overcoming any vertical fiscal imbalance.
DBH distribution is regulated by Law Number 33 of
2004 regarding Revenue Sharing between the Central
Government and Regional Governments as well as PP
Number 55 of 2005 regarding Shared Funds.
Until 2010, PBB and BPHTB still constitute central taxes
which are managed by the Directorate General of Tax
of the Finance Ministry. PBB is divided into five sectors,
namely the urban sector, rural sector, plantation
sector, forestry sector, and mining sector. Of these five
types of PBB, the ones that will be diverted to become
regency/city taxes are through the PBB of the urban
sector and rural sector (PBB-P2).
Diversion of PBB-P2 and BPHTB from central tax to
become regency/city tax is principally fiscally neutral
in nature at the national level, as indicated from the
result of a simulation on the 2010 Indonesian Revised
Budget data in Table 1.
In addition to this, PBB-P2 and BPHTB diversion
to become regency/city tax also has an effect on
reducing vertical fiscal imbalances. From the result of
PENGALIHAN PAJAK BUMI DAN BANGUNAN DAN BEA PEROLEHAN HAK ATAS TANAH DAN BANGUNAN MENJADI PAJAK KABUPATEN/KOTATHE DIVERSION OF LAND AND BUILDING TAX (PBB) AND DUTIES ON LAND AND BUILDING TRANSFERS (BPHBT) TO BECOME REGENCY/CITY TAXES

183THE INDONESIANBUDGET OVERVIEW 2010
Dari hasil simulasi terhadap data APBN-P 2010 seperti
yang ditunjukkan pada Tabel 2, Tabel 3 dan Bagan
4, maka implikasi dari pengalihan PBB-P2 dan BPHTB
menjadi pajak kabupaten/kota terhadap keuangan
secara vertikal adalah:
(a) APBN menjadi berkurang, karena keseluruhan
dari PBB-P2 dan BPHTB diserahkan kepada
the simulation on 2010 Indonesian Revised Budget
data, as shown in Table 2, Table 3 and Chart 4, the
implications of the PBB-P2 and BPHTB diversion to
become regency/city tax on fiscal vertically are:
(a) The Indonesian Budget decreases, because all of
the PBB-P2 and BPHTB are delivered entirely to
the regencies/cities;
PENGALIHAN PAJAK BUMI DAN BANGUNAN DAN BEA PEROLEHAN HAK ATAS TANAH DAN BANGUNAN MENJADI PAJAK KABUPATEN/KOTATHE DIVERSION OF LAND AND BUILDING TAX (PBB) AND DUTIES ON LAND AND BUILDING TRANSFERS (BPHBT) TO BECOME REGENCY/CITY TAXES
CHART 4 :Implication of PBB-P2 and BPHTB Diversion on
Public Finance
The IndoneisanBudget = (-)
Revenues1. PBB-P2=02. BPHTB=0
1. Provincial Government Sharing of PBB-P2=16,2%2. Provincial Government Sharing of BPHTB=16%
The Regency/City Government Budget=(+)
Transfer of region1. Revenues Sharing of PBB-P2=02. BPHTB=0
DJP Share from PBB-P2tax fee=0
TheProvincial
GovernmentBudget = (-)

184 THE INDONESIANBUDGET OVERVIEW 2010
kabupaten/kota;
(b) APBD Provinsi menjadi berkurang, karena 16,2
persen dari PBB-P2 dan 16 persen dari BPHTB
yang merupakan bagian provinsi diserahkan
kepada kabupaten/kota;
(c) APBD kabupaten/kota menjadi naik, karena PBB-
P2 dan BPHTB seluruhnya dialihkan menjadi pajak
kabupaten/kota.
Dampak lainnya dari pengalihan PBB-P2 dan BPHTB
adalah akan memberi keuntungan kepada daerah-
daerah yang relatif kaya. Hal ini karena daerah-
daerah yang relatif kaya pada umumnya memiliki
perkembangan ekonomi yang cukup pesat, sehingga
memberikan kontribusi yang cukup besar bagi
penerimaan daerah-daerah kaya tersebut. Sementara,
daerah-daerah yang relatif miskin akan kehilangan
sebagian pendapatannya, karena tidak lagi memiliki
akses ke dana bagi hasil PBB-P2 dan BPHTB, yang
pada umumnya mencapai ó,5 persen dari PBB-P2
dan 20 persen dari BPHTB. Dengan demikian, secara
horizontal, akan menciptakan terjadinya ketimpangan
keuangan antara pemerintah daerah yang relatif kaya
dengan pemerintah daerah yang relatif miskin.
Implikasi lain dari pengalihan PBB-P2 dan BPHTB
adalah beberapa UU dan peraturan yang terkait
dengan PBB dan BPHTB perlu disempurnakan dan
direvisi, antara lain meliputi:
1. UU Nomor 12 Tahun 1994 tentang Perubahan
atas UU Nomor 12 Tahun 1985 tentang Pajak
Bumi dan Bangunan;
2. UU Nomor 32 Tahun 2004 tentang Pemerintahan
Daerah;
(b) The Provincial Government Budgets decrease,
because 16.2 percent of the PBB-P2 and 16
percent of the BPHTB that are the share of the
province are delivered to regencies/cities;
(c) The Regency/ City Government Budgets increase,
because the PBB-P2 and the BPHTB are all diverted
to become regency/city taxes.
Another effect of the PBB-P2 and BPHTB diverting
is it will give benefits to relatively rich regions. This
is because relatively rich regions generally have
sufficiently rapid economic development, which will
provide sufficiently large contributions to the revenues
of these rich regions. Meanwhile, the relatively poor
regions will lose part of their revenues, due to not
having more access to the PBB-P2 and BPHTB revenue
sharing fund, which in general reaches ó.5 percent
of the PBB-P2 and 20 percent of the BPHTB. Thus,
horizontally, this will create a fiscal imbalance between
the relatively rich local governments and the relatively
poor local governments.
Another implication of the PBB-P2 and BPHTB diversion
is that some Laws and regulation related to PBB and
BPHTB need to be rectified and revised, including:
1. Law Number 12 of 1994 regarding the
Amendment to Law Number 12 of 1985 on Land
and Building Tax;
2. Law Number 32 of 2004 regarding Regional
Government;
PENGALIHAN PAJAK BUMI DAN BANGUNAN DAN BEA PEROLEHAN HAK ATAS TANAH DAN BANGUNAN MENJADI PAJAK KABUPATEN/KOTATHE DIVERSION OF LAND AND BUILDING TAX (PBB) AND DUTIES ON LAND AND BUILDING TRANSFERS (BPHBT) TO BECOME REGENCY/CITY TAXES

185THE INDONESIANBUDGET OVERVIEW 2010
3. UU Nomor 33 Tahun 2004 tentang Perimbangan
Keuangan antara Pemerintah Pusat dan
Pemerintahan Daerah;
4. PP Nomor 55 Tahun 2005 tentang Dana
Perimbangan; serta
5. UU Nomor 38 Tahun 2007 tentang Pembagian
Urusan Pemerintahan antara Pemerintah,
Pemerintah Daerah Provinsi, dan Pemerintah
Daerah Kabupaten/Kota.
SIMPULAN• KebijakanpengalihanPBB-P2danBPHTBmenjadi
pajak daerah ditandai dengan terbitnya UU
Nomor 28 tahun 2009 tentang Pajak Daerah
dan Retribusi Daerah pada tanggal 18 Agustus
2009. Berdasarkan UU dimaksud, pengalihan
BPHTB menjadi pajak kabupaten/kota dilakukan
mulai 1 Januari 2011, sementara PBB-P2 efektif
diberlakukan mulai 1 Januari 2014.
• LatarbelakangkebijakanpengalihanPBB-P2dan
BPHTB adalah: (a) kedua jenis pajak tersebut lebih
tepat sebagai pajak daerah karena pengalihan
PBB-P2 dan BPHTB bersifat netral terhadap
fiskal (neutral fiscal) nasional; (b) sifat dari objek
pajak keduanya tidak mobile dan bersifat lokal;
dan (c) sebagian besar hasilnya telah diserahkan
kepada daerah, bahkan boleh dikatakan hampir
keseluruhan hasilnya sudah diserahkan kepada
daerah.
• Implikasi pengalihan PBB-P2 dan BPHTB: (a)
bersifat netral terhadap fiskal (neutral fiscal)
nasional; (b) secara vertikal, akan mengurangi
3. Law Number 33 of 2004 regarding Revenue
Sharing between the Central Government and
Regional Governments;
4. PP Number 55 of 2005 regarding Shared Funds;
and
5. Law Number 38 of 2007 regarding the Division
of Governance Affairs between the Government,
the Provincial Governments, and the District/
Municipal Governments.
CONCLUSIONS • ThedivertingofPBB-P2andBPHTB tobecome
regional tax policy was marked by the issuance of
Law Number 28 of 2009 regarding Regional Tax
and Regional Retribution on the 18th of August
2009. Based on that Law, BPHTB diversion to
become regency/city taxes shall be conducted
beginning of the 1st of January 2011, while the
PBB-P2 shall come into effect as of the 1st of
January 2014.
• BackgroundofthePBB-P2andBPHTBdiversion
policy consists of: (a) the two types of tax are
more properly regional taxes, because the PBB-P2
and BPHTB diversion is fiscally neutral in nature
at the national level; (b) these two tax objects are
immobile and local in nature; and (c) most of their
proceeds have been delivered to the regions, and
it can be said that nearly all of their proceeds have
been delivered to the regions.
• ImplicationsofPBB-P2andBPHTBdiversion: (a)
fiscally neutral in nature at the national level;
(b) vertically, it will reduce the fiscal imbalance
PENGALIHAN PAJAK BUMI DAN BANGUNAN DAN BEA PEROLEHAN HAK ATAS TANAH DAN BANGUNAN MENJADI PAJAK KABUPATEN/KOTATHE DIVERSION OF LAND AND BUILDING TAX (PBB) AND DUTIES ON LAND AND BUILDING TRANSFERS (BPHBT) TO BECOME REGENCY/CITY TAXES
186 THE INDONESIANBUDGET OVERVIEW 2010
ketimpangan keuangan antara Pemerintah Pusat
dan Pemerintah Provinsi dengan Pemerintah
Kabupaten/Kota; (c) memberi keuntungan
kepada daerah-daerah yang relatif kaya karena
memiliki perkembangan ekonomi yang cukup
pesat, sementara daerah-daerah yang relatif
miskin akan kehilangan sebagian pendapatannya
karena tidak lagi memiliki akses ke DBH PBB-P2,
yang pada umumnya mencapai ó,5 persen dari
PBB-P2 dan 20 persen dari BPHTB, sehingga
secara horizontal, akan menciptakan terjadinya
ketimpangan keuangan antara pemerintah
daerah yang relatif kaya dengan pemerintah
daerah yang relatif miskin (horizontal fiscal
imbalance); serta (d) ke depan, beberapa UU dan
peraturan yang terkait dengan PBB dan BPHTB
perlu disempurnakan dan direvisi.
• DengandialihkannyaPBB-P2danBPHTBmenjadi
pajak kabupaten/kota diharapkan pemerintah
kabupaten/kota dapat mengoptimalkan
pemungutan pendapatannya, dan
membelanjakannya untuk sebesar-besarnya bagi
kepentingan dan kesejahteraan rakyatnya.
between the Central Government and the
Provincial Governments and District/Municipal
Governments; (c) giving benefits to relatively
rich regions because of their sufficiently rapid
economic development, while the relatively poor
regions will lose of a part of their revenues due
to not having more access to DBH PBB-P2, which
in general reaches ó.5 percent of the PBB-P2 and
20 percent of the BPHTB, which horizontally will
create a fiscal imbalance between the relatively
rich local governments and the relatively poor
local governments (horizontal fiscal imbalance);
and (d) in the future, some Laws and Regulations
related to PBB and BPHTB need to be rectified
and revised.
• Upon diverting the PBB-P2 and the BPHTB
to become regency/city taxes, expectably the
district/municipal governments will be able to
optimize their revenue collection, and to spend
them for the maximum interests and welfare of
their people.
PENGALIHAN PAJAK BUMI DAN BANGUNAN DAN BEA PEROLEHAN HAK ATAS TANAH DAN BANGUNAN MENJADI PAJAK KABUPATEN/KOTATHE DIVERSION OF LAND AND BUILDING TAX (PBB) AND DUTIES ON LAND AND BUILDING TRANSFERS (BPHBT) TO BECOME REGENCY/CITY TAXES

187THE INDONESIANBUDGET OVERVIEW 2010
PNBP yang berasal dari penerimaan sumber daya alam
(SDA) tetap menjadi primadona dalam APBN, terutama
yang bersumber dari pengelolaan minyak dan gas
bumi. UU No. 2 Tahun 2010 tentang perubahan APBN
TA 2010, menetapkan target PNBP SDA migas tahun
2010 sebesar Rp164,73 trilyun atau dua pertiga dari
total PNBP. Jumlah tersebut mengalami kenaikan 31%
lebih dari capaian PNBP SDA migas TA 2009.
Berbeda dengan jenis PNBP yang lain, PNBP SDA
migas mempunyai karakteristik yang unik. Pertama,
sebagian PNBP SDA migas tidak langsung disetorkan
oleh wajib bayar ke Rekening Kas Umum Negara,
namun terlebih dulu disetorkan ke Rekening No.
600.000411 (Rekening Departemen Keuangan/Hasil
Minyak Perjanjian Karya Production Sharing) pada
Bank Indonesia. Hal ini berkaitan dengan earning
process pendapatan SDA migas yang terlebih
Non-Tax Revenues (PNBP) that originate from natural
resource revenues (SDA) are still the most important
part of the Indonesian Budget, particularly those
coming from oil and gas management. Law No. 2 of
2010 regarding the Amendment to the Indonesian
Budget for FY 2010 sets the target of 2010 Non-Tax
Revenues of Natural Resource Revenues from oil and
gas at Rp164.73 trillion or two-thirds of the total Non-
Tax Revenues. That number is an increase of 31%
compared to the achievement of Non-Tax Revenues
of Natural Resource Revenues from oil and gas in FY
2009.
Unlike other kinds of Non-Tax Revenues, the Non-Tax
Revenues of Natural Resource Revenues from oil and
gas has unique characteristics. First, part of Non-Tax
Revenues of Natural Resource Revenues from oil and
gas is not deposited directly by taxpayers to the General
Treasury Bank Account, but is first deposited to Bank
Account No. 600.000411 (the Ministry of Finance’s
Bank Account/Proceeds from Oil from Production
Sharing Work Agreements) in the Bank of Indonesia.
PERANAN REKENING MIGAS DALAM OPTIMALISASI PENDAPATAN NEGARA
THE ROLES OF OIL AND GAS ACCOUNT IN THE OPTIMIZATION OF STATE REVENUES

188 THE INDONESIANBUDGET OVERVIEW 2010
dahulu memperhitungkan kewajiban pemerintah
dalam pengelolaan kegiatan hulu migas. Kedua,
sebagian PNBP SDA migas tidak berasal dari setoran
tunai melainkan dari pembayaran subsidi energi
yang disetorkan kembali ke kas negara sebagai
penyelesaian kewajiban Pertamina dalam kegiatan
hulu migas (offset).
Peraturan Menteri Keuangan No. 113/PMK.02/2009
tentang Rekening Minyak dan Gas Bumi mengatur
bahwa Rekening No. 600.000411 merupakan
rekening dalam valuta USD untuk menampung
seluruh penerimaan dan membayar pengeluaran
terkait kegiatan usaha hulu migas. Penerimaan negara
yang ditampung dalam rekening tersebut terdiri dari
: (i) PPh migas, (ii) bagian pemerintah dari sumber
daya alam berupa hasil penjualan minyak mentah,
hasil penjualan gas alam, dan overlifting Kontraktor
Kontrak Kerjasama (KKKS), dan (iii) penerimaan
lainnya terkait kegiatan hulu migas antara lain berupa
bonus-bonus dan transfer material.
PPh migas merupakan pendapatan perpajakan yang
dikelola oleh Direktorat Jenderal Anggaran, namun
dilaporkan sebagai pendapatan Direktorat Jenderal
Pajak. PPh tersebut merupakan PPh minyak bumi dan
gas alam yang disetor KKKS sesuai dengan ketentuan
perundang-undangan. Bagian pemerintah dari sumber
This relates to the earning process of Natural Resource
Revenues from oil and gas revenues which first take
into account the government’s obligations in Oil and
Gas upstream activity management. Second, part of
the Non-Tax Revenues of Natural Resource Revenues
from oil and gas does not originate from cash deposits,
but from energy subsidy payments that are deposited
back to the Treasury as the settlement of Pertamina’s
obligations in Oil and Gas upstream activity (offset).
Regulation of the Minister of Finance No. 113/
PMK.02/2009 regarding the Oil and Natural Gas
Account provides that Bank Account No. 600.000411
is a bank account denominated in USD currency for the
purpose of accommodating all revenues and payment
expenses related to oil and gas upstream business
activities. The revenues which are accommodated in
that bank account consist of: (i) Income tax (PPh) on
oil and gas, (ii) the government’s portion of natural
resources in the form of proceeds from the sale of
crude oils, proceeds from the sale of natural gas,
and overlifting of Cooperation Contract Contractor
(KKKS), and (iii) other revenues related to oil and
gas upstream activities, such as those in the form of
bonuses and material transfers.
PPh on oil and gas is tax revenue which is managed
by the Directorate General of Budget, but reported
as revenue of the Directorate General of Tax. Such a
PPh is PPh on natural oil and natural gas that is paid
by the KKKS in accordance with the provisions of
law. The government portion of the natural resources
PERANAN REKENING MIGAS DALAM OPTIMALISASI PENDAPATAN NEGARA | THE ROLES OF OIL AND GAS ACCOUNT IN THE OPTIMIZATION OF STATE REVENUES
189THE INDONESIANBUDGET OVERVIEW 2010
daya alam dikelompokkan ke dalam pendapatan PNBP
SDA, masing-masing dengan kode akun 421111
(minyak bumi) dan 421211 (gas bumi). Kedua jenis
pendapatan tersebut dibagihasilkan ke daerah dalam
rangka desentralisasi fiskal. Sedangkan penerimaan
lainnya kegiatan hulu migas merupakan kelompok
PNBP lainnya dengan kode akun 423439 yang tidak
dibagihasilkan kepada pemerintah daerah.
Adapun pengeluaran yang dilakukan melalui Rekening
Migas tersebut berupa penyelesaian kewajiban
Pemerintah terkait kegiatan usaha hulu minyak dan
gas bumi, yaitu:
a) Pembayaran perpajakan minyak dan gas bumi,
terdiri dari:
• PajakBumidanBangunan(PBB);
• Reimbursement Pajak Pertambahan Nilai
(PPN); dan
• PajakDaerah.
b) Pembayaran di luar perpajakan, terdiri dari:
• DomesticMarketObligation(DMO)fee;
• Underlifting KKKS;dan
• Feekegiatanhuluminyakdangasbumi.
Laporan Keuangan Pemerintah Pusat (Audited) TA
2009 mencatat bahwa pendapatan negara yang
disumbangkan melalui pemindahbukuan dana dari
rekening migas ke Rekening Kas Umum Negara (KUN),
memperlihatkan angka-angka sebagai berikut.
is grouped into the Non-Tax Revenues of Natural
Resources Revenues from oil and gas, with account
codes 421111 (petroleum) and 421211 (natural gas),
respectively. These two types of revenue are shared to
the regions in the framework of fiscal decentralization.
Meanwhile, other revenues of oil and gas upstream
activities are grouped into other Non-Tax Revenues,
with account code 423439, which is not to be shared
to the regional governments.
The expenses spent through the Oil and Gas Account
are in the form of the settlement of Government
obligations related to oil and natural gas upstream
business activities, namely:
a) Payment for oil and natural gas taxes, consisting
of:
• LandandBuildingTax(PBB);
• Reimbursement of Value Added Tax (VAT);
and
• RegionalTax.
b) Payments other than taxations, consisting of:
• DomesticMarketObligation(DMO)fees;
• UnderliftingofKKKS;and
• Fees of oil and natural gas upstream
activities.
The Financial Statement of the Central Government
(Audited) for FY 2009 noted that the revenues that
were contributed by fund transfers from the Oil and
Gas account to the General Treasury (KUN) Bank
Account had the following amounts.
PERANAN REKENING MIGAS DALAM OPTIMALISASI PENDAPATAN NEGARA | THE ROLES OF OIL AND GAS ACCOUNT IN THE OPTIMIZATION OF STATE REVENUES

190 THE INDONESIANBUDGET OVERVIEW 2010
*) Pendapatan minyak mentah (DMO) tidak diproses
melalui rekening migas
Pendapatan negara yang diproses melalui rekening
migas sebesar Rp72.976,69 miliar, dimana 63,80%
dibukukan sebagai pendapatan perpajakan (PPh),
sedangkan sisanya, sebesar 36,20% merupakan
PNBP. Pajak penghasilan yang terkait dengan kegiatan
hulu migas pada tahun 2009 tercatat sebesar
Rp170.356,43 miliar dimana 27,33% disumbangkan
dari rekening migas. Sementara PNBP migas yang
tercatat sebesar Rp134.531,30 miliar, hampir 20%-
*) Crude oil income (DMO) is not processed through
the Oil and Gas account
The revenue processed through the Oil and Gas account
amounted to Rp72,976.69 billion, 63.80% of which
is rewarded as tax revenue (PPh), while the remaining
36.20% is Non-Tax Revenues. Income tax related to
Oil and Gas upstream activities in 2009 amounting to
a recorded Rp170,356.43 billion, 27.33% of which is
contributed from the Oil and Gas account. Meanwhile,
the amount of recorded Non-Tax Revenues from Oil
and Gas came to Rp134,531.30 billion, nearly 20% of
Description RealizationRemitance from Oil & Gas
AccountAchievement
Revenue Tax
Income Tax of Petroleum Rp18,360,480,065,849 Rp15,620,430,593,159 85.08%
Income Tax of Natural Gas Rp31,683,194,144,689 Rp30,742,781,513,515 97.03%
Income Tax Artilce 25 Rp120,312,764,156,957 Rp190,351,308,102 0.16%
Total PPh related to oil and gas upstream activities
Rp170,356,438,367,495 Rp46,553,563,414,776 27.33%
Non Tax State Revenue (PNBP)
Petroleum Income Rp90,055,956,098,737 Rp1,936,707,526,760 2.15%
Natural Gas Income Rp35,696,003,511,595 Rp24,408,672,437,414 68.38%
Crude Oil Income (DMO)* Rp6,800,558,328,077 0 0.00%
Other Incomes of Oil and Gas Upstream Activities
Rp1,978,787,170,081 Rp77,748,886,838 3.93%
Total PNBP related to oil and gas upstream activities
Rp134,531,305,108,490 Rp26,423,128,851,012 19.64%
Total State Income related to oil and gas upstream ac
Rp 304,887,743,475,985 Rp 72,976,692,265,787 23.94%
Source: LKPP FY 2 009 (Audited)
Table 1Realization of State Income Originating from Transfer From the Oil and Gas
Account to the KUN Account, Fiscal Year 2009
PERANAN REKENING MIGAS DALAM OPTIMALISASI PENDAPATAN NEGARA | THE ROLES OF OIL AND GAS ACCOUNT IN THE OPTIMIZATION OF STATE REVENUES

191THE INDONESIANBUDGET OVERVIEW 2010
nya diproses melalui pemindahbukuan dari rekening
migas ke rekening KUN. Secara keseluruhan,
sebanyak hampir 24% dari total pendapatan negara
yang terkait dengan kegiatan hulu migas, diproses
melalui rekening migas no. 600.000411.
Sampai dengan 30 Juni 2010, realisasi pendapatan
negara yang berasal dari earning process pada
rekening migas dapat diikhtisarkan sebagai berikut.
*) Pendapatan minyak mentah (DMO) tidak diproses
melalui rekening migas
which is processed through transfers from the Oil and
Gas account to the KUN account. Overall, nearly 24%
of the total revenue related to Oil and Gas upstream
activities are processed through the Oil and Gas bank
account (No. 600.000411).
As of the 30th of June, 2010, the realization of revenues
originating from the earning process in the Oil and
Gas account can be summarized as follows.
*) Crude oil income (DMO) is not processed through
the Oil and Gas account
Description RealizationRemitance from Migas Account
Achievement
Income Tax
Income Tax on Natural Oil Rp 12,917,927,325,637 Rp 12,917,927,325,637 100.00%
Income Tax of Natural Gas Rp 17,720,922,627,913 Rp 17,720,922,627,913 100.00%
Total PPh related to oil and gas upstream activities Rp 30,638,849,953,550 Rp 30,638,849,953,550 100.00%
Non Tax State Revenue
Natural Oil Income Rp 48,348,584,787,989 Rp 3,384,975,569,966 7.00%
Natural Gas Income Rp 11,110,503,122,656 Rp 11,110,503,122,656 100.00%
Crude Oil Income (DMO)* Rp 4,709,534,200,647 Rp - 0.00%
Other Incomes of Oil and Gas Upstream Activities Rp 149,155,337,156 Rp 149,155,337,156 100.00%
Total PNBP related to oil and gas upstream activities Rp 64,317,777,448,448 Rp 14,644,634,029,778 22.77%
Total State Income related to oil and gas upstream activit Rp 94,956,627,401,998 Rp 45,283,483,983,328 47.69%
Table 2Realization of State Income Originating from Transfers From the Oil and Gas
Account to KUN AccountSemester I, 2010
Source: Directorate Non-Tax State Revenues 2010
PERANAN REKENING MIGAS DALAM OPTIMALISASI PENDAPATAN NEGARA | THE ROLES OF OIL AND GAS ACCOUNT IN THE OPTIMIZATION OF STATE REVENUES

192 THE INDONESIANBUDGET OVERVIEW 2010
Data tersebut di atas menggambarkan bahwa earning
process penerimaan negara pada rekening migas
selama periode enam bulan pertama tahun 2010
telah menyumbangkan hampir 50% pendapatan
negara yang terkait dengan kegiatan hulu migas.
Seluruh pendapatan PPh migas pada periode tersebut
diproses melalui rekening migas, sementara lebih dari
seperlima PNBP migas berasal dari pemindahbukuan
rekening ini.
Dengan demikian, earning process atas penerimaan
negara yang bersumber dari kegiatan hulu migas
menjadi salah satu tahapan yang cukup krusial.
Keterlambatan atas pemrosesan dan perhitungan
pendapatan negara baik untuk PPh maupun PNBP
berpotensi menunda lebih dari seperlima capaian
pendapatan negara yang terkait dengan pengelolaan
SDA migas.
Disamping berfungsi sebagai kontributor pendapatan
negara, rekening migas juga diperuntukkan sebagai
media penyelesaian kewajiban pemerintah dalam
pelaksanaan kegiatan hulu migas. Sebagaimana
diketahui bahwa dalam skema production sharing
contract (PSC), KKKS memperoleh insentif berupa
pembebasan dari segala bentuk kewajiban
perpajakan, kecuali Pajak Penghasilan Orang Pribadi.
Oleh karena itu, kewajiban Pajak Bumi dan Bangunan
(PBB), Pajak Pertambahan Nilai (PPN), dan Pajak
Penghasilan Badan, akan diperhitungkan dengan
setoran bagian pemerintah. Seluruh kewajiban
tersebut ditambah dengan kewajiban pemerintah
The above data illustrates that the earning process of
revenues in the Oil and Gas account during the first
six months of 2010 has contributed nearly 50% of
revenues related to Oil and Gas upstream activities.
All of PPh on Oil and Gas revenues in that period were
processed through the Oil and Gas account, while
more than one-fifth of Non-Tax Revenues from Oil
and Gas originated from transfers of this account.
Thus, the earning process of revenues originating
from Oil and Gas upstream activity is a considerably
crucial stage. Delays in the processing and calculating
of revenues for both PPh and Non-Tax Revenues
can potentially delay more than one-fifth of the
achievement of revenues related to the Natural
Resources from oil and gas management.
In addition to serving as a contributor of revenue, the
Oil and Gas account is also intended to be a media
for the settlement of Government obligations in the
implementation of Oil and Gas upstream activities.
As is known, in the production sharing contract (PSC)
scheme, the KKKS receive incentives in the form of
exemptions from any form of taxation obligations,
except for Individual Income Tax. Therefore, the Land
and Building Tax (PBB), Value-Added Tax (VAT) and
Income Tax for Corporate obligations will be calculated
along with the government’s portion of payments. All
of these obligations, combined with other obligations
of the Government, such as Upstream Oil and Gas
PERANAN REKENING MIGAS DALAM OPTIMALISASI PENDAPATAN NEGARA | THE ROLES OF OIL AND GAS ACCOUNT IN THE OPTIMIZATION OF STATE REVENUES

193THE INDONESIANBUDGET OVERVIEW 2010
lainnya seperti anggaran BPMIGAS, fee penjual, dan
underlifting, menjadi faktor pengurang di dalam
perhitungan pendapatan negara. Oleh karena itu,
pendapatan kotor yang disetor ke rekening migas
setelah dikurangi dengan faktor pengurang tersebut
di atas, akan disetorkan ke rekening KUN sebagai
pendapatan negara (net) dalam bentuk PPh maupun
PNBP.
Selama tahun 2009, pengeluaran negara yang
dilakukan melalui rekening migas guna menyelesaikan
kewajiban kontraktual pemerintah dan kewajiban
lainnya sektor migas sebesar Rp58.228,66 miliar.
Sementara itu, realisasi pengeluaran negara terkait
kegiatan hulu migas selama semestar I/2010 sebesar
Rp15.413,02 miliar. Apabila dibandingkan dengan
total pendapatan negara sektor migas yang diproses
melalui rekening migas, maka realisasi pengeluaran
negara tersebut pada tahun 2009 dan semester
I/2010, masing-masing mencapai 79,79% dan
34,04%. Tingginya pengeluaran negara tersebut
terutama berasal dari reimbursement PPN atas
pembelian barang-barang dan jasa yang digunakan
dalam pengelolaan kegiatan hulu migas.
Keandalan earning process dalam perhitungan
pendapatan dan pengeluaran negara tersebut di atas,
pada akhirnya sangat tergantung dengan data-data
yang diperoleh dari BPMIGAS dan KKKS, terutama
Pertamina, yang merupakan penyumbang terbesar
di dalam penerimaan migas. Proses penelitian dan
verifikasi serta konfirmasi dengan pihak-pihak
terkait, menjadi bagian penting dalam pelaksanaan
Supervisory Agency (BPMIGAS) budget, selling
fees, and underlifting, become reducing factors
in calculating revenues. Therefore, gross revenues
deposited to the Oil and Gas account, after the
deduction of the aforesaid reducing factors, will be
deposited to the KUN account as revenue (net) in the
form of both PPh and Non-Tax Revenues.
During 2009, expenses that were made through the
Oil and Gas account in order to settle contractual
obligations of the government and other obligations
of the Oil and Gas sector amounted to Rp58,228.66
billion. Meanwhile, the realization of expenses related
to Oil and Gas upstream activities during Semester I of
2010 amounted to Rp15,413.02 billion. If compared
to total revenue of the Oil and Gas sector that was
processed through the Oil and Gas account, then, the
realization of those expenses in 2009 and Semester I
of 2010, reached, 79.79% and 34.04% respectively.
That high level of expenses specifically originated
from VAT reimbursement on the purchase of goods
and services used in Oil and Gas upstream activity
management.
The reliability of the earning process in the calculation of
revenues and expenses as described above, ultimately,
depends highly on data obtained from BPMIGAS and
the KKKS, particularly Pertamina, which is the largest
contributor of Oil and Gas revenues. The investigation
and verification processes and making confirmations
with the related parties is an important part in the
PERANAN REKENING MIGAS DALAM OPTIMALISASI PENDAPATAN NEGARA | THE ROLES OF OIL AND GAS ACCOUNT IN THE OPTIMIZATION OF STATE REVENUES

194 THE INDONESIANBUDGET OVERVIEW 2010
performance of the tasks of the Directorate General
of Budget, in order to optimize the sources of revenue
in question.
tugas Direktorat Jenderal Anggaran dalam rangka
mengoptimalkan sumber-sumber pendapatan negara
dimaksud.
PERANAN REKENING MIGAS DALAM OPTIMALISASI PENDAPATAN NEGARA | THE ROLES OF OIL AND GAS ACCOUNT IN THE OPTIMIZATION OF STATE REVENUES

195THE INDONESIANBUDGET OVERVIEW 2010
PENDAHULUAN
Pembangunan infrastruktur adalah bagian
integral dari pembangunan nasional. Infrastruktur
merupakan roda penggerak pertumbuhan ekonomi.
Pembangunan infrastruktur sektor transportasi
merupakan tulang punggung pola distribusi,
baik barang maupun penumpang. Sementara
itu, infrastruktur lainnya seperti kelistrikan dan
telekomunikasi terkait erat dengan upaya modernisasi
bangsa, dan penyediaannya merupakan salah satu
aspek terpenting untuk meningkatkan produktivitas
sektor produksi. Demikian juga, ketersediaan sarana
perumahan dan permukiman secara luas dan
merata, serta pengelolaan sumber daya air yang
berkelanjutan menentukan tingkat kesejahteraan
masyarakat. Berkurangnya kualitas dan pelayanan
serta tertundanya pembangunan infrastruktur baru
dapat menghambat laju pembangunan nasional.
Rehabilitasi dan pembangunan kembali berbagai
INTRODUCTION
Infrastructure development is an integral part of
national development. Infrastructure is the wheel which
drives economic growth. Infrastructure development
of the transportation sector is the backbone of the
distribution pattern, for both freight and passengers.
Meanwhile, other infrastructure, such as electricity
and telecommunication, is closely related to national
modernization efforts, and its provision is one of the
most important aspects for increasing the productivity
of the production sector. Likewise, the availability of
housing and settlement facilities which are widely and
evenly distributed, and sustainable water resource
management determine the welfare level of the
community. The decreased quality and services and
delayed new infrastructure development can reduce
the national development rate. Rehabilitation and
rebuilding of various damaged infrastructure, and
increasing capacities and new facilities will require a
FASILITAS LIKUIDITAS PEMBIAYAAN PERUMAHAN:SEBUAH UPAYA PEMERINTAH UNTUK MEMPERCEPAT
PEMENUHAN KEBUTUHAN RUMAH BAGI MASYARAKAT BERPENGHASILAN RENDAH
HOUSING FINANCE LIQUIDITY FACILITY:AN EFFORT OF THE GOVERNMENT TO ACCELERATE THE
FULFILLMENT OF HOUSING NEED FOR LOW-INCOME COMMUNITIES

196 THE INDONESIANBUDGET OVERVIEW 2010
infrastruktur yang rusak, serta peningkatan kapasitas
dan fasilitas baru akan menyerap biaya yang sangat
besar, sehingga tidak mungkin dapat dipikul oleh
pemerintah sendiri. Untuk itu, mencari solusi
inovatif guna menanggulangi masalah perawatan
dan perbaikan infrastruktur yang rusak, termasuk
diantaranya infrastruktur perumahan merupakan
masalah yang mendesak untuk diselesaikan.
KEBIJAKAN PEMBANGUNAN PERUMAHAN
Sebagai bagian dari pembangunan infrastruktur
yang merupakan salah satu prioritas pembangunan
nasional, kebijakan Pemerintah dalam pembangunan
perumahan secara nasional senantiasa tercantum
dalam dokumen perencanaan nasional. Di dalam
Rencana Pembangunan Jangka Panjang 2005-
2025, kebijakan pembangunan perumahan beserta
prasarana dan sarana pendukungnya, meliputi :
1. penyelenggaraan pembangunan perumahan
yang berkelanjutan, memadai, layak, dan
terjangkau oleh daya beli masyarakat
serta didukung oleh prasarana dan sarana
permukiman yang mencukupi dan berkualitas
yang dikelola secara profesional, kredibel,
mandiri, dan efisien;
2. penyelenggaraan pembangunan perumahan
beserta prasarana dan sarana pendukungnya
yang mandiri mampu membangkitkan potensi
pembiayaan yang berasal dari masyarakat dan
pasar modal, menciptakan lapangan kerja, serta
meningkatkan pemerataan dan penyebaran
pembangunan; dan
huge cost, making it impossible to be sustained by the
government alone. For that reason, seeking innovative
solutions in order to overcome the problems in the
maintenance and repair of the damages infrastructure,
including housing infrastructure, is an urgent problem
to solve.
HOUSING DEVELOPMENT POLICY
With infrastructure development being a part of the
national development priorities, the Government’s
national policy in housing development is always listed
in the national planning documents. In the Long-
Term Development Plan of 2005-2025, the policy of
housing development together with its supporting
facilities and infrastructures, include:
1. the implementation of housing development
is maintained in a sustainable, adequate,
reasonable, and affordable to the buying
power of the community and is supported by
sufficient and quality settlement facilities and
infrastructures that are managed professionally,
credibly, independently, and efficiently;
2. the implementation of housing development
together with their supporting facilities and
infrastructures, that are independent and able
to raise financing potential originating from
the community and capital market, create
employment, and increase the even distribution
and spread of development; and
FASILITAS LIKUIDITAS PEMBIAYAAN PERUMAHAN: SEBUAH UPAYA PEMERINTAH UNTUK MEMPERCEPAT PEMENUHAN KEBUTUHAN RUMAH BAGI MASYARAKAT BERPENGHASILAN RENDAHHOUSING FINANCE LIQUIDITY FACILITY: AN EFFORT OF THE GOVERNMENT TO ACCELERATE THE FULFILLMENT OF HOUSING NEED FOR LOW-INCOME COMMUNITIES

197THE INDONESIANBUDGET OVERVIEW 2010
3. pembangunan perumahan beserta prasarana
dan sarana pendukungnya yang memperhatikan
fungsi dan keseimbangan lingkungan hidup.
SASARAN PEMBANGUNAN PERUMAHAN
Di dalam RPJMN 2005-2009, sasaran pembangunan
perumahan yang hendak dicapai oleh Pemerintah,
antara lain adalah: (1) pemenuhan kebutuhan hunian
bagi masyarakat melalui terciptanya pasar primer
yang sehat, efisien, akuntabel, tidak diskriminatif,
dan terjangkau oleh seluruh lapisan masyarakat yang
didukung oleh sistem pembiayaan perumahan jangka
panjang yang market friendly, efisien, dan akuntabel,
(2) terbentuknya pola subsidi yang tepat sasaran,
tidak mendistorsi pasar, akuntabel, dan mempunyai
kepastian dalam hal ketersediaan dana setiap tahun,
(3) terbentuknya pola pembiayaan untuk perbaikan
dan pembangunan rumah baru yang berbasis
swadaya masyarakat. Hasil pencapaian dari sasaran
pembangunan perumahan tahun 2005-2009 dapat
dilihat dalam tabel 1 berikut ini.
3. housing development with its supporting
facilities and infrastructures should take into
consideration the function and balance of the
living environment.
HOUSING DEVELOPMENT TARGETS
In the RPJMN 2005-2009, the targets of housing
development to be achieved by the Government,
are : (1) to fulfill of the need for settlements for
the community through the creation of a primary
market that is healthy, efficient, accountable,
non-discriminative, and affordable to all of the
community strata, supported by a long-term housing
finance system that is market-friendly, efficient, and
accountable, (2) to establish of a subsidy pattern that
is on-target, not distorting the market, accountable,
and having certainty in terms of fund availability every
year, (3) to establish of a finance pattern for the repair
and development of new houses that is done on a
community self-sufficiency basis. The results of the
achievements of the housing development targets for
2005-2009 can be seen in Table 1 below.
No. Description Quantity (units)
1
2
3
4
Inhabitable new house development
Leased Simple Storied House Development
Owned Simple Storied House development/repair facilitation
Self-support housing development/repair facilitation
1,331,580
37,709
6,716
3,659,037
Total 5,035,042
FASILITAS LIKUIDITAS PEMBIAYAAN PERUMAHAN: SEBUAH UPAYA PEMERINTAH UNTUK MEMPERCEPAT PEMENUHAN KEBUTUHAN RUMAH BAGI MASYARAKAT BERPENGHASILAN RENDAHHOUSING FINANCE LIQUIDITY FACILITY: AN EFFORT OF THE GOVERNMENT TO ACCELERATE THE FULFILLMENT OF HOUSING NEED FOR LOW-INCOME COMMUNITIES
Table 1Achievement of Housing Development 2005-2009

198 THE INDONESIANBUDGET OVERVIEW 2010
Sementara itu, di dalam RPJMN 2010-2014 sasaran
pembangunan perumahan adalah tersedianya akses
bagi masyarakat terhadap perumahan, baik perumahan
baru maupun peningkatan kualitas perumahan dan
lingkungan perumahan, serta kepastian hukum bagi
5,6 juta rumah tangga. Untuk mewujudkan sasaran
pembangunan perumahan tersebut, Pemerintah
menargetkan untuk membangun 685.000 rumah
sederhana sehat bersubsidi, 180 rusunami dan 650
twin block berikut fasilitas pendukung kawasan
permukiman yang dapat menampung 836.000
keluarga yang kurang mampu.
PERMASALAHAN DALAM PEMBANGUNAN
PERUMAHAN
Untuk menyediakan rumah sehat sederhana
bagi masyarakat, sampai dengan akhir tahun
2009, Pemerintah masih menghadapi beberapa
permasalahan pokok, yaitu :
Pertama, penyediaan rumah yang masih terbatas,
jauh dari kebutuhan masyarakat. Jumlah kekurangan
rumah (backlog) meningkat dari 5,8 juta unit pada
tahun 2004 menjadi 7,4 juta unit pada tahun 2009.
Akumulasi backlog diperkirakan akan terus terjadi
akibat pertumbuhan 710.000 rumah tangga baru per
tahun.
Kedua, masih terdapat rumah tangga yang
menempati rumah tidak layak huni. Pada tahun 2007
masih terdapat 9,25 persen rumah tangga yang
menempati rumah dengan kondisi rusak dan 0,87
persen dengan kondisi rusak berat.
Ketiga, jaminan kepastian bermukim (secure tenure)
Meanwhile, in the 2010-2014 RPJMN, the housing
development target is the availability of access for the
community to housing, both new housing and the
upgrading of housing and the housing environment,
and legal certainty for 5.6 million households. In
order to realize the aforesaid housing development
targets, the Government has targeted construction
of 685,000 subsidized healthy simple houses, 180
Apartement property (rusunami) and 650 twin blocks,
with supporting facilities in the settlement area that
are able to accommodate 836,000 poor families.
PROBLEMS IN HOUSING DEVELOPMENT
In order to make healthy simple houses available to
the community, until the end of 2009 the Government
was still facing some major problems, namely:
First, the continued limited availability of houses
which are far from what is need by communities.
The total backlog of needed house increased from
5.8 million units in 2004 to 7.4 million units in 2009.
Accumulation of this backlog is predicted continously
as a result of the growth of 710,000 new households
per year.
Second, there are still families living in uninhabitable
houses. In 2007 there were still 9.25 percent of families
that lived in damaged houses and 0.87 percent of
seriously-damaged houses.
Third, secure tenure is still weak. At the end of 2007
FASILITAS LIKUIDITAS PEMBIAYAAN PERUMAHAN: SEBUAH UPAYA PEMERINTAH UNTUK MEMPERCEPAT PEMENUHAN KEBUTUHAN RUMAH BAGI MASYARAKAT BERPENGHASILAN RENDAHHOUSING FINANCE LIQUIDITY FACILITY: AN EFFORT OF THE GOVERNMENT TO ACCELERATE THE FULFILLMENT OF HOUSING NEED FOR LOW-INCOME COMMUNITIES

199THE INDONESIANBUDGET OVERVIEW 2010
masih lemah. Pada akhir tahun 2007 masih terdapat
22,06 persen rumah tangga yang menempati rumah
milik sendiri tanpa bukti hukum berupa sertifikat BPN,
girik, maupun akta jual beli.
Keempat, semakin meluasnya permukiman kumuh.
Upaya peningkatkan kualitas permukiman belum
dapat mengurangi laju pertumbuhan luas permukiman
kumuh. Dengan peningkatan 1,37 persen per tahun,
luas permukiman kumuh meningkat dari 54.000 ha
pada tahun 2004 menjadi 57.800 ha pada tahun
2009.
Berbagai permasalahan pokok yang dihadapi
Pemerintah dalam pembangunan perumahan di
atas, pada dasarnya disebabkan oleh berbagai faktor
berikut:
Pertama, akses masyarakat berpenghasilan rendah
terhadap penguasaan dan legalitas lahan terbatas.
Tingginya laju pertumbuhan penduduk di perkotaan,
keterbatasan lahan perumahan dan permukiman,
serta peningkatan harga lahan semakin mempersulit
akses masyarakat untuk menempati hunian yang
layak dan terjangkau di perkotaan. Demikian juga,
tingginya biaya pengurusan serta keterbatasan
informasi terhadap prosedur sertifikasi dan rencana
tata ruang mengakibatkan sebagian masyarakat
menempati rumah tanpa memiliki bukti legalitas
pemanfaatan lahan dan bangunan serta tidak sesuai
dengan rencana tata ruang.
Kedua, akses masyarakat terhadap pembiayaan
perumahan terbatas. Upaya fasilitasi pembangunan
perumahan oleh Pemerintah masih menghadapi
there were still 22.06 percent of families that lived in
houses without legal evidence of ownership in the
form of certificates of BPN, girik, and deeds of sales
and purchase.
Fourth, the increasing growth of slum settlements.
Efforts of improving the quality of settlements could
not reduce the growth rate of slum settlement areas.
With an increase of 1.37 percent per year, the area
of slum settlements had increased from 54,000 ha in
2004 to 57,800 ha in 2009.
Various major problems were being faced by the
Government in the aforesaid housing development
area are basically caused by various factors, as
follows:
First, access of low-income communities to the control
and legality of lands is limited. The high-population
growth rate in urban areas, limited housing and
settlement lands, and also the increased price of land
make it increasingly difficult for the community access
more difficult to occupy reasonable and affordable
settlements in urban areas. Likewise, the high cost of
administration and limited information on certification
procedures and the zoning plan have led some people
to occupy houses without possessing evidonce of
legality of land and building utilization which does not
comply with the zoning plan.
Second, community access to housing finance is
limited. Efforts of housing development facilitation
by the Government is still facing limited budget
FASILITAS LIKUIDITAS PEMBIAYAAN PERUMAHAN: SEBUAH UPAYA PEMERINTAH UNTUK MEMPERCEPAT PEMENUHAN KEBUTUHAN RUMAH BAGI MASYARAKAT BERPENGHASILAN RENDAHHOUSING FINANCE LIQUIDITY FACILITY: AN EFFORT OF THE GOVERNMENT TO ACCELERATE THE FULFILLMENT OF HOUSING NEED FOR LOW-INCOME COMMUNITIES

200 THE INDONESIANBUDGET OVERVIEW 2010
kendala keterbatasan anggaran pembangunan
perumahan dan subsidi bagi masyarakat
berpenghasilan rendah, belum termanfaatkannya
alternatif sumber pembiayaan, masih minimnya
kerjasama pemerintah-swasta, serta masih rendahnya
partisipasi serta kapasitas lembaga penyalur subsidi
kredit mikro pembangunan perumahan.
Ketiga, kelembagaan penyelenggaraan
pembangunan perumahan dan permukiman belum
mantap. Penyerahan kewenangan pembangunan
perumahan yang menjadi urusan wajib pemerintah
daerah belum disertai dengan peningkatan kapasitas
kelembagaan dan kualitas SDM serta perangkat
organisasi penyelenggara dalam memenuhi standar
pelayanan minimal di bidang pembangunan
perumahan.
SUBSIDI KPRSh
Mulai tahun 2005 Pemerintah mengalokasikan dana
subsidi Kredit Pemilikan Rumah Sederhana Sehat
(KPRSh) mulai tahun 2005, yang ditujukan untuk
mengatasi berbagai permasalahan pembangunan
perumahan, terutama daya beli masyarakat
berpenghasilan rendah (MBR) untuk membeli rumah
yang layak. Selain itu, alokasi dana subsidi KPRSh juga
ditujukan untuk : (1) mendorong laju pembangunan
perumahan untuk menjaga kelangsungan penyediaan
perumahan dan permukiman, mengingat perumahan
dan permukiman merupakan salah satu kebutuhan
dasar manusia dan merupakan faktor penting dalam
peningkatan harkat dan martabat manusia, (2)
masyarakat, khususnya masyarakat berpenghasilan
constraints for housing development and subsidies
to low-income communities, the underutilization of
sources of alternative financing, continued minimal
government-private sector cooperation, and the
continued low participation and capacity of subsidy
distributing institutions in the area of housing
development micro-credit.
Third, institutions conducting housing and settlement
development are not well-established yet. The transfer
of authority of housing development to become
a required duty of the regional governments, has
not yet been accompanied by the enhancement of
institutional capacity for HR quality and executing
organization apparatuses in fulfilling the minimum
service standards in the housing development sector.
Healthy Simple Houses Ownership Credit
(KPRSh) Subsidy
Starting in 2005, the Government has allocated subsidy
funds for Healthy Simple Houses Ownership Credit
(Kredit Pemilikan Rumah Sederhana Sehat/KPRSh).
That is aimed at solving various housing development
problems, particularly the buying power in the low-
income community (MBR) to buy proper houses. In
addition to this, the KPRSh subsidy fund allocation is
also aimed at: (1) boosting the housing development
rate to maintain the continuity of the provision of
housing and settlements, in viewing housing and
settlements as one of the basic needs of human
beings and an important factor in the improvement
of the dignity and status of human beings, (2) the
FASILITAS LIKUIDITAS PEMBIAYAAN PERUMAHAN: SEBUAH UPAYA PEMERINTAH UNTUK MEMPERCEPAT PEMENUHAN KEBUTUHAN RUMAH BAGI MASYARAKAT BERPENGHASILAN RENDAHHOUSING FINANCE LIQUIDITY FACILITY: AN EFFORT OF THE GOVERNMENT TO ACCELERATE THE FULFILLMENT OF HOUSING NEED FOR LOW-INCOME COMMUNITIES
201THE INDONESIANBUDGET OVERVIEW 2010
rendah, masih belum mampu tinggal di rumah yang
layak dan sehat tanpa adanya dukungan Pemerintah.
Melalui subsidi, bantuan dapat diberikan dalam
bentuk subsidi bunga, subsidi pembangunan/
perbaikan rumah, maupun subsidi uang muka.
Alokasi dana subsidi KPRSh setiap tahun cenderung
semakin membesar, seiring dengan peningkatan
kebutuhan masyarakat untuk bisa memiliki rumah
dengan harga jangka terjangkau. Alokasi subsidi
KPRSh, berturut-turut dari tahun 2005-2010 adalah
Rp252,0 miliar, Rp252,0 miliar, Rp300 miliar, Rp800,0
miliar, Rp2.513,6 miliar dan Rp3.099,0 miliar.
Melalui alokasi dana subsidi KPRSh tersebut,
Pemerintah memberikan subsidi kepada masyarakat
untuk membantu menurunkan angsuran yang harus
dibayar masyarakat melalui pengurangan suku bunga
angsuran dalam kurun waktu tertentu. Sedangkan
dalam subsidi membangun atau memperbaiki
rumah, Pemerintah membantu menambah dana
pembangunan atau perbaikan rumah, sehingga
dapat menurunkan pagu kredit yang akan diangsur
setiap bulan. Jenis dan alokasi untuk subsidi KPRSh
dapat berubah-ubah setiap tahunnya, tergantung
kebutuhan dan ketersediaan dana. Namun demikian,
alokasi terbesar subdidi KPRSh, biasanya diprioritaskan
untuk subsidi selisih bunga. Kelemahan skema subsidi
KPRSh adalah apabila jangka waktu subsidi telah
selesai, dan masa peminjaman belum selesai, maka
masyarakat harus membayar sesuai dengan bunga
komersial perbankan.
Sebagaimana sifat belanja dalam APBN yang
dialokasikan hanya untuk satu tahun anggaran,
community, particularly the low-income community,
are still unable to live in proper and healthy houses
without the support of the Government.
Through the subsidy, assistance can be given in the
form of interest subsidy, house development/repair
subsidy, and down-payment subsidy. The KPRSh
subsidy fund allocation tends to get higher from
year to year, in line with the increased community
need to be able to own house at affordable prices.
The KPRSh subsidy allocations, from 2005 to 2010,
are, respectively, Rp252.0 billion, Rp252.0 billion,
Rp300 billion, Rp800.0 billion, Rp2,513.6 billion and
Rp3,099.0 billion.
Through such KPRSh subsidy fund allocation, the
Government gave the community subsidies to assist
in decreasing installment payments, payable to the
community through the reduction of the installment
interest rate within a certain period. Whereas,
for the subsidy for building or repairing houses,
the Government assisted by increasing the house
development or repair funds, enabling a reduction of
the credit ceiling to be implemented every month. The
type and allocation of the KPRSh subsidies can vary
every year, depending on the needs and availability of
funds. However, the largest allocation of the KPRSh
subsidy is usually prioritized for the interest-difference
subsidy. The disadvantage of the KPRSh subsidy
scheme is if the subsidy period expires, and the loan
period does not expire. Then the community must pay
according to the banking commercial interest rate.
The expenditure characteristic in the Indonesian
FASILITAS LIKUIDITAS PEMBIAYAAN PERUMAHAN: SEBUAH UPAYA PEMERINTAH UNTUK MEMPERCEPAT PEMENUHAN KEBUTUHAN RUMAH BAGI MASYARAKAT BERPENGHASILAN RENDAHHOUSING FINANCE LIQUIDITY FACILITY: AN EFFORT OF THE GOVERNMENT TO ACCELERATE THE FULFILLMENT OF HOUSING NEED FOR LOW-INCOME COMMUNITIES

202 THE INDONESIANBUDGET OVERVIEW 2010
demikian juga dengan subsidi bunga. Apabila dana
yang dialokasikan dalam APBN atau APBN-P dalam
1 tahun anggaran tidak dapat terserap seluruhnya,
maka dana subsidi tersebut tidak bisa dipakai untuk
tahun berikutnya dan masuk sebagai bagian dari Saldo
Anggaran Lebih (SAL). Di dalam pelaksanaannya,
karena berbagai kendala di lapangan dana subsidi
KPRSh yang dialokasikan dalam APBN atau APBN-P
tidak selalu dapat terserap seluruhnya. Apabila hal
tersebut terjadi, maka penyerapan dana yang rendah
oleh masyarakat dalam memanfaatkan alokasi
dana subsidi APBN, akan semakin memperberat
upaya pecapaian target pembangunan perumahan.
Perbandingan antara alokasi dana subsidi KPRSH dan
realisasinya dapat dilihat pada grafik 1 berikut ini.
Budget is only allocated for one fiscal year, likewise
is the interest subsidy. If the funds allocated in the
Indonesian Budget or the Indonesian Revised Budget
in 1 fiscal year cannot be used completely, then the
subsidy funds cannot be utilized for the next year
or included as a part of Cumulated Budget Surplus
(Saldo Anggaran Lebih/SAL). In its implementation,
due to various constraints in the field, the KPRSh
subsidy funds allocated in the Indonesian Budget
or the Indonesian Revised Budget cannot always
be utilized entirely. If this is the case, then the loan
fund absorption by the community in utilizing the
Indonesian Budget subsidy fund allocation will
increasingly accelerate the efforts of achieving the
housing development targets. A comparison between
the KPRSh subsidy fund allocation and its realization
can be seen in Graph 1 below.
9
0%
20%
40%
60%
80%
100%
120%
0
500
1,000
1,500
2,000
2,500
3,000
2005 2006 200 2008 2009
[ % ][ Billions of Rupiah]
Indonesian Revised Budget LKPP % LKPP to Indonesian RevisedBudget
Graph 1
Allocation and Realization of KPRSh Subsidy 2005-2009
31%
44%
100% 100% 100%
FASILITAS LIKUIDITAS PEMBIAYAAN PERUMAHAN: SEBUAH UPAYA PEMERINTAH UNTUK MEMPERCEPAT PEMENUHAN KEBUTUHAN RUMAH BAGI MASYARAKAT BERPENGHASILAN RENDAHHOUSING FINANCE LIQUIDITY FACILITY: AN EFFORT OF THE GOVERNMENT TO ACCELERATE THE FULFILLMENT OF HOUSING NEED FOR LOW-INCOME COMMUNITIES

203THE INDONESIANBUDGET OVERVIEW 2010
DASAR HUKUM PERUBAHAN KEBIJAKAN
Pola subsidi bunga dan subsidi uang muka yang belum
efektif untuk mendukung pembiayaan perumahan,
mengharuskan Pemerintah untuk mencari terobosan
baru guna mempercepat laju pembangunan
perumahan bagi masyarakat berpenghasilan
rendah. Kewajiban Pemerintah untuk menyediakan
perumahan yang layak bagi masyarakat, serta
perlunya Pemerintah untuk melakukan perubahan
dan terobosan kebijakan perubahan sebenarnya
juga telah diamanahkan oleh berbagai peraturan
perundangan yang ada, antara lain:
Pertama, Perubahan Kedua UUD Negara RI tahun
1945 pasal 28 H, ayat (1), yang mengatur “Setiap
orang berhak hidup sejahtera lahir dan batin,
bertempat tinggal, dan mendapatkan lingkungan
hidup yang baik dan sehat serta berhak memperoleh
pelayanan kesehatan.”
Kedua, UU No. 39 Tahun 1999 tentang Hak Asasi
Manusia pasal 40 yang mengatur “Setiap orang
berhak untuk bertempat tinggal serta berkehidupan
yang layak.”
Ketiga, UU No. 17 Tahun 2007 tentang Rencana
Pembangunan Jangka Panjang, Bab II.2 huruf D
5 yang mengatur ”Memenuhi kebutuhan hunian
bagi masyarakat untuk mewujudkan kota tanpa
permukiman kumuh adalah dengan :
• Menyempurnakan pola subsidi sektor
perumahan yang tepat sasaran, transparan,
akuntabel, khususnya subsidi bagi masyarakat
berpenghasilan rendah (MBR).
• Melakukan penguatan swadaya masyarakat
LEGAL BASIS OF POLICY CHANGE
The interest subsidy and down-payment subsidy
pattern, which is not yet effective in supporting
housing finance, requires the Government to seek
new breakthroughs in order to accelerate the housing
development rate for the low-income community. The
obligation of the Government to provide reasonable
housing to the community, and the necessity of the
Government to make changes and breakthroughs
by amending policies has in fact been mandated by
various existing statutory regulations, such as:
First, The Second Amendment to the 1945 Indonesian
Constitution, Article 28 H, Paragraph (1), which says
“Each person has the right to a life of well-being in
body and mind, to a place to dwell, to enjoy a good
and healthy environment, and to receive medical
care.”
Second, Law No. 39 of 1999 regarding Human Rights
in Article 40 says “Each person has the right to a place
to dwell to live a reasonable life.”
Third, Law No. 17 of 2007 regarding the Long-Term
Development Plan, in Chapter II.2 letter D 5 says
“Fulfilling the need for dwellings for the community
to have a city without slum settlements, is done by
means of:
• Perfecting the subsidy pattern of the housing
sector to make it on-target, transparent,
accountable, particularly for subsidies to the low-
income community (MBR).
• Implementing community self-sufficiency
FASILITAS LIKUIDITAS PEMBIAYAAN PERUMAHAN: SEBUAH UPAYA PEMERINTAH UNTUK MEMPERCEPAT PEMENUHAN KEBUTUHAN RUMAH BAGI MASYARAKAT BERPENGHASILAN RENDAHHOUSING FINANCE LIQUIDITY FACILITY: AN EFFORT OF THE GOVERNMENT TO ACCELERATE THE FULFILLMENT OF HOUSING NEED FOR LOW-INCOME COMMUNITIES

204 THE INDONESIANBUDGET OVERVIEW 2010
dalam pembangunan rumah melalui fasilitas
kredit mikro perumahan, fasilitasi untuk
pemberdayaan masyarakat dan bantek kepada
kelompok masyarakat”.
FASILITAS LIKUIDITAS PEMBIAYAAN
PERUMAHAN
Terbitnya kebijakan fasilitas likuiditas pembiayaan
perumahan (FLPP) sebagai penyempurnaan kebijakan
subsidi KPRSh, pada dasarnya dilandasi pertimbangan
:
1. Kemampuan/daya beli masyarakat masih sangat
terbatas dan kenaikan penghasilan/ pendapatan
setiap tahunnya tidak signifikan dibandingkan
dengan laju inflasi per tahun;
2. Dengan skema subsidi, suku bunga yang
dikenakan pada masyarakat masih cukup
tinggi;
3. Optimalisasi pemanfaatan dana APBN di tengah-
tengah kondisi keterbatasan keuangan negara;
4. Pemupukan dana perumahan dalam jangka
panjang;
5. Daya tarik bagi sumber dana lain untuk berperan
dalam pembiayaan perumahan (integrasi
sumber-sumber pembiayaan)
Kebijakan FLPP tersebut secara resmi telah disampaikan
Menteri Negara Perumahan Rakyat kepada Menteri
Keuangan pada bulan Januari 2010 untuk dapat
ditampung dalam APBN-P 2010. Kebijakan FLPP
juga telah memperoleh dukungan Komisi V DPR RI
serta persetujuan Badan Anggaran DPR RI dalam
pembahasan Rancangan APBN Perubahan 2010.
strengthening in house development through:
the housing micro-credit facility, facilitating
community empowerment and technical
assistance to community groups”.
HOUSING FINANCE LIQUIDITY FACILITY
The issuance of the housing finance liquidity facility
(FLPP) policy as an improvement of the KPRSh
subsidy policy, is basically based on the following
considerations:
1. The buying power of the community is still very
limited and the increase of income/earnings
every year is not significant if it is compared to
the annual inflation rate;
2. With the subsidy scheme, the interest rates
imposed on the community are still high;
3. Optimization of Indonesian Budget funds in the
limited state finance condition;
4. Housing fund fostering in the long-term;
5. Attractiveness for other fund sources to
participate in housing finance (integration of
financing sources)
The aforesaid FLPP Policy has formally been brought
forward by the Minister for People Housing to
the Minister of Finance in January 2010, to be
accommodated in the 2010 Indonesian Revised
Budget. The FLPP policy has also received support
from Commission V of the Indonesian House of
Representative (DPR) and has received approval
FASILITAS LIKUIDITAS PEMBIAYAAN PERUMAHAN: SEBUAH UPAYA PEMERINTAH UNTUK MEMPERCEPAT PEMENUHAN KEBUTUHAN RUMAH BAGI MASYARAKAT BERPENGHASILAN RENDAHHOUSING FINANCE LIQUIDITY FACILITY: AN EFFORT OF THE GOVERNMENT TO ACCELERATE THE FULFILLMENT OF HOUSING NEED FOR LOW-INCOME COMMUNITIES

205THE INDONESIANBUDGET OVERVIEW 2010
Perbandingan skema subsidi KPRSh dibandingkan
dengan fasilitas likuiditas pembiayaan perumahan,
dapat dilihat pada tabel berikut ini.
Satu keunggulan dari skema FLPP dibandingkan
dengan skema subsidi adalah tekad Pemerintah untuk
mengenakan bunga yang rendah (1 digit) selama masa
peminjaman. Namun hal tersebut sangat tergantung
dari komposisi dana FLPP yang akan dipadukan dengan
dana perbankan dan tingkat suku bunga pinjaman
Bank pelaksana kepada BLU PPP. Semakin besar dana
FLPP yang disalurkan kepada Bank Pelaksana dan
semakin rendah bunga yang dikenakan kepada Bank
from the Budget Board of the Indonesian House
of Representative in the discussion on the 2010
Indonesian Revised Proposed Budget. A comparison
of the KPRSh subsidy and housing finance liquidity
facility schemes can be seen in the table below.
One advantage of the FLPP scheme over the subsidy
scheme is the commitment of the Government to
impose a low interest rate (1 digit) during the loan
term. However, that highly depends on composition
of FLPP funds to be combined with the banking funds,
and the borrowing interest rate of the Executive Bank
to the BLU PPP. The larger the amount of FLPP funds
are distributed to the Executive Bank and the lower
the interest rates are imposed to the Executive Bank,
Table 2Comparison of KPRSh Subsidy and FLPP Scheme
No Description Subsidy Scheme FLPP Scheme
1 Term Limited, defined term Along the loan terms
2 Interest rateSubsidized interest within certain period a continued with commercial interest rate (relevant bank)
Interest rate is determined one digit throughout the loan term (fixed rate)
3 InstallmentsDuring subsidy period< 1/3 of income, and onward possibly> 1/3 of income depending on commercial interest
During loan term< 1/3 of income
4 Indonesian Budget Subsidy expenditure, valid for 1 year Finance Account, can be utilized/ draw down in the next year stage
5 Indonesian Budget Continuously, with amounts increasing progressively
In certain period, progressive decrease can be sought for
6 Fund Source Indonesian Budget Can withdraw other fund sources
7 Benefits received by the Community Equivalent to 8.5 million rupiah Equivalent to 19 million rupiah
FASILITAS LIKUIDITAS PEMBIAYAAN PERUMAHAN: SEBUAH UPAYA PEMERINTAH UNTUK MEMPERCEPAT PEMENUHAN KEBUTUHAN RUMAH BAGI MASYARAKAT BERPENGHASILAN RENDAHHOUSING FINANCE LIQUIDITY FACILITY: AN EFFORT OF THE GOVERNMENT TO ACCELERATE THE FULFILLMENT OF HOUSING NEED FOR LOW-INCOME COMMUNITIES

206 THE INDONESIANBUDGET OVERVIEW 2010
Pelaksana, maka suku bunga pinjaman KPRSh kepada
masyarakat dapat ditekan. Dalam tabel 3 berikut,
dapat dilihat salah satu simulasi dana FLPP dan dana
Bank Pelaksana yang diharapkan dapat menghasilkan
bunga yang rendah kepada masyarakat.
Sesuai dengan penjelasan angka 17 Pasal 22, ayat (3)
UU Nomor 2 Tahun 2010 tentang Perubahan atas UU
Nomor 47 tahun 2009 tentang APBN Tahun Anggaran
2010, alokasi dana FLPP dalam APBN-P 2010 berasal
dari realokasi subsidi bunga kredit program untuk
kredit pemilikan rumah sehat sederhana (KPRSh).
Dalam penjelasan UU Nomor 2 Tahun 2010 tersebut
dinyatakan bahwa kebijakan alokasi dana FLPP
termasuk bagian dari kebijakan investasi Pemerintah.
Dengan demikian, pelaksanaan kebijakan FLPP harus
tunduk pada Peraturan Pemerintah Nomor 1 Tahun
2008 tentang Investasi Pemerintah.
then the KPRSh loan interest rate to the community
can be decreased. In Table 3 below, you can see one
simulation of FLPP funds and the Executive Bank funds
that are expected will be able to generate low interest
rates for the community.
In accordance with the explanation of Number 17
Article 22, Paragraph (3) of Law Number 2 of 2010
regarding the Amendment to Law Number 47 of
2009 regarding the Indonesian Budget for the 2010
Fiscal year, the allocation of FLPP funds in the 2010
Indonesian Revised Budget originates from the
reallocation of interest subsidies of program credit
for healthy simple house ownership credit (KPRSh). In
the explanation of Law Number 2 of 2010, it is stated
that the FLPP fund allocation policy shall form a part
of the investment policy of the Government. Thus,
implementation of the FLPP policy shall be subject to
Table 3 Simulation of of KPRSh Interest Rate Calculation through FLPP Scheme
NO. DESCRIPTION SHARE RATE Weight average Ratio (WAR)Housing Finance Center 72.20% 0.50% 0.36%
Executive Bank 27.80% 8.84% 2.46%
CoF = Cost of Fund 2.82%
A.1 Cost of Loanable Fund (100/94 * COF) 3.00%
2 Overhead Cost 2,50%
3 Risk Premium 1.00%
B. Sub Total (1+2+3) 6.50%
C. Spread 1.50%
KPRSh Interest Rate(B+C) 8.00%
FASILITAS LIKUIDITAS PEMBIAYAAN PERUMAHAN: SEBUAH UPAYA PEMERINTAH UNTUK MEMPERCEPAT PEMENUHAN KEBUTUHAN RUMAH BAGI MASYARAKAT BERPENGHASILAN RENDAHHOUSING FINANCE LIQUIDITY FACILITY: AN EFFORT OF THE GOVERNMENT TO ACCELERATE THE FULFILLMENT OF HOUSING NEED FOR LOW-INCOME COMMUNITIES

207THE INDONESIANBUDGET OVERVIEW 2010
Mengingat kebijakan FLPP merupakan kebijakan baru,
tentunya kebijakan tersebut tidak serta merta dapat
menghapus/menggantikan kebijakan sebelumnya,
yaitu subsidi KPRSh. Masa transisi tersebut diharapkan
selesai dalam 2 tahun, yaitu tahun 2010 dan 2011, dan
untuk selanjutnya diharapkan kebijakan FLPP dapat
diterapkan secara penuh. Pada tahun 2010, dari dana
subsidi KPRSh sebesar Rp3.099,1 miliar, pada APBN-
P 2010, sebagian diantaranya yaitu Rp2.683,0 miliar,
direalokasikan ke skema FLPP (pembiayaan) sedangkan
Rp416,1 miliar tetap dialokasikan melalui skema subsidi
(belanja). Pada tahun 2011, diharapkan dana subsidi
kredit program tersebut semakin mengecil, dan untuk
selanjutnya pendanaan pembangunan perumahan
untuk masyarakat berpenghasilan menengah bawah
(MBM) dan masyarakat berpenghasilan rendah (MBR)
dapat dipenuhi melalui skema FLPP.
Sebagai persiapan pelaksanaan kebijakan FLPP, saat
ini telah terbit Peraturan Menteri Keuangan Nomor
130/PMK.05/2010 tentang Tata Cara Penyediaan,
Pencairan dan Pertanggungjawaban Dana FLPP. Dalam
PMK tersebut Menteri Keuangan selaku Bendahara
Umum Negara (BUN) ditetapkan sebagai Pengguna
Anggaran (PA) atas dana FLPP, sementara Pemimpin
Satker BLU pada Kementerian Perumahan Rakyat
adalah Kuasa Pengguna Anggaran (KPA) nya. Selain
itu, dalam PMK tersebut satker BLU pada Kementerian
Perumahan Rakyat ditetapkan sebagai pengelola dana
FLPP. Satker BLU dimaksud sesuai dengan Keputusan
Menteri Keuangan Nomor 290/KMK.05/2010 adalah
Government Regulation Number 1 of 2008 regarding
Government Investment.
Seeing that the FLPP policy is a new policy, certainly
that policy shall not suddenly eliminate/supersede
prior policy, namely the KPRSh subsidy. The transitional
period is expected to end in 2 years, namely in 2010
and 2011, and after then the FLPP policy is expected
to be able to be applied fully. In 2010, for the KPRSh
subsidy funds amounting to Rp3,099.1 billion, in the
2010 Indonesian Revised Budget, a fraction of them,
namely Rp2,683.0 billion, have been reallocated to the
FLPP scheme (financing) while Rp416.1 billion remains
allocated through the subsidy scheme (expenditure).
In 2011, the program credit subsidy fund is expected
to be increasingly smaller, and afterward the housing
development financing for the medium and lower
income communities (MBM) and low-income
community (MBR) can be fulfilled through the FLPP
scheme.
As a preparation of the FLPP policy implementation,
at present the Regulation of the Minister of Finance
Number 130/PMK.05/2010 regarding the Procedures
for the Provision, Draw-Down and Accountability of
FLPP Funds has been issued. In this Finance Minister
Regulation the Minister of Finance, acting as the
General Treasurer (BUN), is designated as the Budget
User (PA) of the FLPP funds, while the Leader of Work
Unit of Public Service Agency (Satker BLU) in the
Ministry of People’s Housing is its Budget User Proxy
(KPA). In addition to this, in this Finance Minister
Regulation, the Satker BLU in the Ministry of People’s
Housing is designated to be the FLPP fund manager.
FASILITAS LIKUIDITAS PEMBIAYAAN PERUMAHAN: SEBUAH UPAYA PEMERINTAH UNTUK MEMPERCEPAT PEMENUHAN KEBUTUHAN RUMAH BAGI MASYARAKAT BERPENGHASILAN RENDAHHOUSING FINANCE LIQUIDITY FACILITY: AN EFFORT OF THE GOVERNMENT TO ACCELERATE THE FULFILLMENT OF HOUSING NEED FOR LOW-INCOME COMMUNITIES

208 THE INDONESIANBUDGET OVERVIEW 2010
Pusat Pembiayaan Perumahan (PPP).
Secara garis besar, pola pencairan dana menurut PMK
tersebut adalah sebagai berikut:
Pertama, Pemimpin Satker BLU pada Kementerian
Perumahan Rakyat selaku KPA melalui Menteri
Perumahan Rakyat mengajukan usulan dana FLPP
kepada Direktur Jenderal Anggaran.
Kedua, Berdasarkan usulan tersebut, Dirjen Anggaran
menerbitkan Surat Penetapan Satuan Anggaran Per
Satuan Kerja (SP-SAPSK) dan menyampaikannya ke
Dirjen Perbendaharaan dan Pemimpin Satker BLU
pada Kementerian Perumahan Rakyat.
Ketiga, Berdasarkan SP-SAPSK tersebut, Pemimpin
Satker BLU menyampaikan konsep Daftar Isian
Pelaksanaan Anggaran (DIPA) kepada Dirjen
Perbendaharaan untuk mendapat pengesahan, yang
selanjutnya menjadi dasar pencairan dalam rangka
penyaluran FLPP.
Keempat, Pagu dana FLPP dalam DIPA merupakan
batas pengeluaran tertinggi yang tidak boleh
dilampaui, dan pelaksanaannya harus dapat
dipertanggungjawabkan.
PENUTUP
Kebijakan FLPP dalam jangka panjang diharapkan
dapat membantu Pemerintah untuk mewujudkan
sasaran pembangunan perumahan sebagaimana
The Satker BLU in question, according to the Decree
of the Minister of Finance Number 290/KMK.05/2010
is the Housing Finance Center (PPP).
In outline form, the fund draw-down patterns
according to the Finance Minister Regulation are as
follows:
First, the Leader of the Satker BLU in the Ministry
of People’s Housing as the Budget User Proxy (KPA)
through the Minister of People’s Housing submits a
proposal of FLPP funding to the Director General of
Budget.
Second, based on such a proposal, the Director
General of Budget issues a Stipulation Letter of Budget
Unit Per Work Unit (SP-SAPSK) and submits it to the
Dir. Gen. of Treasury and the Leader of the Satker BLU
in the Ministry of People’s Housing.
Third, Based on the aforesaid SP-SAPSK, the
Leader of the Satker BLU submits the draft Budget
implementation Registration Form (DIPA) to the Dir.
Gen. of Treasury for legalization, that later becomes
the basis for drawdown in the framework of FLPP
distribution.
Fourth, The FLPP fund ceiling in the DIPA is the upper
limit of expenditure that shall not be exceeded, and its
implementation must be accounted for.
CLOSING REMARKS
The FLPP policy in the long term is expected to be
able to assist the Government to realize the housing
development targets as mandated in the 2010-2014
FASILITAS LIKUIDITAS PEMBIAYAAN PERUMAHAN: SEBUAH UPAYA PEMERINTAH UNTUK MEMPERCEPAT PEMENUHAN KEBUTUHAN RUMAH BAGI MASYARAKAT BERPENGHASILAN RENDAHHOUSING FINANCE LIQUIDITY FACILITY: AN EFFORT OF THE GOVERNMENT TO ACCELERATE THE FULFILLMENT OF HOUSING NEED FOR LOW-INCOME COMMUNITIES

209THE INDONESIANBUDGET OVERVIEW 2010
RPJM. However, in the short-term, particularly in the
transitional period, the implementation of the KPRSh
program will be delayed, because the FLPP scheme
that will be stipulated for 2010 still needs several
implementing regulations in order to allow it run
properly. Such regulations are particularly necessary
to provide for the division of tasks and obligations
of many parties related to the implementation of the
FLPP policy.
In addition to this, in view of the larger amount
of funds received by the community through the
imposition of low loan interest rates during the loan
term, then, in the initial stage the FLPP policy will
decrease the KPRSH granting target, and even further
in long term, after the community’s funds begin to be
repaid, the KPRSH granting target can be increased
gradually, and the Indonesian Budget burden is also
expected to continually decrease.
diamanahkan dalam RPJM 2010-2014. Namun
demikian, dalam jangka pendek, terutama dalam
masa transisi, pelaksanaan program KPRSh akan
melambat, karena skema FLPP yang baru akan
diterapkan dalam tahun 2010 masih membutuhkan
beberapa peraturan pelaksanaan, agar dapat berjalan
dengan baik. Peraturan tersebut, terutama diperlukan
untuk mengatur pembagian tugas dan kewajiban
berbagai pihak yang terkait dengan pelaksanaan
kebijakan FLPP.
Selain itu, mengingat lebih besarnya dana yang
diterima oleh masyarakat melalui pengenaan
suku bunga pinjaman yang rendah selama masa
peminjaman, maka pada tahap awal kebijakan FLPP
akan menurunkan target pemberian KPRSH, dan
selanjutnya dalam jangka panjang, setelah dana
masyarakat mulai dikembalikan, target pemberian
KPRSH secara bertahap dapat ditingkatkan kembali,
dan beban APBN juga diharapkan akan semakin
berkurang.
FASILITAS LIKUIDITAS PEMBIAYAAN PERUMAHAN: SEBUAH UPAYA PEMERINTAH UNTUK MEMPERCEPAT PEMENUHAN KEBUTUHAN RUMAH BAGI MASYARAKAT BERPENGHASILAN RENDAHHOUSING FINANCE LIQUIDITY FACILITY: AN EFFORT OF THE GOVERNMENT TO ACCELERATE THE FULFILLMENT OF HOUSING NEED FOR LOW-INCOME COMMUNITIES

210 THE INDONESIANBUDGET OVERVIEW 2010
FASILITAS LIKUIDITAS PEMBIAYAAN PERUMAHAN: SEBUAH UPAYA PEMERINTAH UNTUK MEMPERCEPAT PEMENUHAN KEBUTUHAN RUMAH BAGI MASYARAKAT BERPENGHASILAN RENDAHHOUSING FINANCE LIQUIDITY FACILITY: AN EFFORT OF THE GOVERNMENT TO ACCELERATE THE FULFILLMENT OF HOUSING NEED FOR LOW-INCOME COMMUNITIES
211THE INDONESIANBUDGET OVERVIEW 2010
Dalam dunia yang semakin terintegrasi
dengan globalisasi, Indonesia tak bisa lepas dari
perkembangan situasi dunia. Proses pembangunan
ekonomi juga mengalami pasang surut sejalan
dengan kondisi perekonomian dunia. Setelah krisis
ekonomi 1997–1998, perekonomian Indonesia secara
perlahan mengalami proses pemulihan. Dalam periode
2000–2004, perekonomian tumbuh rata-rata 4,49
persen per tahun dan pada tahun 2004 pertumbuhan
ekonomi masih sebesar 5,1 persen. Proses akselerasi
laju pertumbuhan ekonomi terus terjadi hingga tahun
2008. Dalam periode 2005–2008, ekonomi tumbuh
rata-rata sebesar 5,7 persen per tahun. Percepatan
laju pertumbuhan ekonomi juga diikuti oleh
penurunan angka kemiskinan dan pengangguran
terbuka. Di tengah membaiknya ekonomi domestik,
pada tahun 2008 Indonesia Indonesia dihadapkan
kepada berbagai persoalan eksternal yang sedikit
banyak mempengaruhi percepatan perbaikan kondisi
perekonomian. Gejolak sub-prime mortgage di
Amerika Serikat telah membawa dampak kepada
melambatnya pertumbuhan ekonomi Amerika Serikat
In a world which is increasingly integrated
through globalization, Indonesia cannot be separated
from developments in the world situation. The
economic development process also has its ups and
downs, in line with world economic conditions. After
the economic crisis from 1997-1998, Indonesia’s
economy underwent a process of recovery. In the 2000-
2004 period, the economy grew at an average of 4.49
percent annually, and in 2004 economic growth was
still at 5.1 percent. The economic growth acceleration
process continued until 2008. In the period from 2005-
2008, the economy grew an average 5.7 percent
per year. The economic acceleration rate was also
followed by reductions in poverty and unemployment
rates. Amid the improving domestic economy, in 2008
Indonesia was faced with various external problems
that influenced economic improvement acceleration.
The sub-prime mortgage turmoil in the United States
has had the impact of slowing down the economic
growth of the United States, which in turn has had
an impact on the global economic slowdown, also
affecting Indonesia. However, although it has not
DAMPAK KRISIS YUNANI TERHADAP PEREKONOMIAN INDONESIA
THE IMPACT OF THE GREEK CRISIS ON THE INDONESIAN ECONOMY

212 THE INDONESIANBUDGET OVERVIEW 2010
yang pada gilirannya membawa dampak kepada
perlambatan ekonomi dunia, termasuk Indonesia.
Namun demikian, meskipun tidak lepas dari imbas
krisis global, Indonesia merupakan salah satu dari tiga
negara yang memiliki kinerja ekonomi terbaik setelah
China dan India. Di tengah-tengah kondisi ekonomi
global yang belum sepenuhnya pulih, perekonomian
nasional mampu berakselerasi dan tetap dapat
tumbuh positif di tahun 2009 sebesar 4,5 persen.
Disaat kondisi perekonomian global mulai
membaik, perhatian dunia kembali mengarah ke
Eropa, dimana Yunani tengah mengalami krisis
kepercayaan terhadap kemampuan fiskal Pemerintah
untuk membiayai defisit fiskal. Hal ini terjadi akibat
kebijakan fiskal yang sangat ekspansif dengan tingkat
defisit anggaran yang sangat tinggi dan dalam
jangka waktu lama, yang menyebabkan krisis utang
negara (sovereign debt crises). Dunia mewaspadai
kemungkinan imbas krisis utang dan keuangan di
Yunani dapat menurunkan kepercayaan pasar dan
stabilitas keuangan di kawasan Eurozone. Selain itu,
kondisi Yunani diperburuk oleh ketidakstabilan politik
dan tingginya pengangguran yang pada akhir 2009
mencapai 10,3 persen sementara berdasarkan data
terakhir jumlah tersebut meningkat menjadi 11,7
persen. Kondisi ini secara tidak langsung berdampak
pada stabilitas ekonomi Yunani yang tercermin
dari meningkatnya CDS (Currency Debt Swap),
yield obligation sovereign dan penurunan rating.
Tidak menutup kemungkinan, krisis di Yunani akan
menular pada Negara-negara tetangga yang memiliki
karakteristik sama yang disebut negara-negara PIIGS
avoided the effects of the global crisis, Indonesia
was one of three countries with the best economic
performance after China and India. Amid the global
economic condition that has not yet fully recovered,
the national economy was able to accelerate and still
able to grow positively in 2009 at 4.5 percent.
When the global economic condition began to
improve, the world’s attention was drawn back to
Europe, where Greece is experiencing a confidence
crisis in the fiscal ability of the Government to
finance the fiscal deficit. This happened as a result
of a highly expansionary fiscal policy with a very high
budget deficit level for an extended period, which
led to a state debt crisis (sovereign debt crisis). The
world was wary of the possible impact that the debt
and financial crisis in Greece might reduce market
confidence and financial stability in the Eurozone. In
addition to this, the Greek condition is exacerbated
by political instability and high unemployment, which
stood at 10.3 percent at the end of 2009, while based
on the latest data that number has increased to 11.7
percent. This condition indirectly affects the stability
of the Greek economy as reflected from the increased
CDS (Currency Debt Swap), yield on sovereign
obligations, and impairment rating. It is likely that
the crisis in Greece will spread to the neighboring
countries that have similar characteristics, namely
those known as PIIGS (Portugal, Ireland, Italy, Greece
and Spain) countries. Therefore its impact on the EU
region needs to receive attention. Compared to other
zones that were affected by economic crisis, recovery
DAMPAK KRISIS YUNANI TERHADAP PEREKONOMIAN INDONESIA | THE IMPACT OF THE GREEK CRISIS ON THE INDONESIAN ECONOMY

213THE INDONESIANBUDGET OVERVIEW 2010
(Portugal, Ireland, Italy, Greece and Spain), sehingga
dampaknya bagi kawasan UE perlu mendapat
perhatian. Dibandingkan kawasan lain yang terkena
krisis ekonomi, pemulihan di kawasan eropa masih
lemah. Salah satu penyebabnya adalah dalamnya
dampak krisis global terhadap perekonomian dan
sektor keuangan Eropa. Hal ini dapat dilihat dari
perekonomian di eurozone yang dalam tahun 2009
mengalami kontraksi sebesar 4,1 persen. Sementara
pada tahun 2010, disaat perekonomian mulai
pulih dan berakselerasi, eurozone diperkirakan
hanya mampu tumbuh 1,7 persen, paling rendah
dibandingkan wilayah lain (WEO update, Oktober
2010). Gambaran berbagai krisis yang menerpa
Indonesia dan dampaknya bagi perekonomian dapat
dilihat dalam penjelasan di bawah ini.
Krisis Ekonomi dan Dampaknya terhadap Indonesia Krisis Nilai Tukar 1997 Krisis yang terjadi pada tahun 1997 dipicu oleh
depresiasi mata uang Bath Thailand. Kinerja ekonomi
nasional mengalami kemunduran dan berlanjut dalam
skala yang lebih luas dan intensitas yang lebih tinggi.
Krisis nilai tukar, krisis perbankan, krisis utang luar
negeri swasta, dan berbagai peristiwa politik dan sosial
yang kurang menguntungkan telah menyebabkan
krisis ekonomi di Indonesia. Pertumbuhan ekonomi
tahun 1998 anjlok ke level -13,1% dari 4,7% pada
tahun 1997, Rupiah terdepresiasi 244%, dari rata-
rata Rp2.909/USD pada tahun 1997 menjadi rata-rata
Rp10.014/USD pada tahun 1998, Inflasi melonjak ke
in the Eurozone is still weak. One of its causes is the
severe impact of the global crisis on the economy
and financial sector of Europe. This can be seen from
the economy in Eurozone that, in 2009, experienced
a contraction of 4.1 percent. While in 2010, when
the economy began to recover and accelerate, the
Eurozone was only able to grow 1.0 percent, the
lowest compared to other regions (WEO Update,
July 2010). An illustration of various crises that hit
Indonesia and their impacts on its economy can be
seen in the explanation below.
Economic Crises and Their Impacts on Indonesia Exchange Rate Crisis in 1997The crisis that occurred in 1997 was triggered by a
depreciation of the Thai Bath currency. National
economic performance worsened and it continued
on a broader scale and with higher intensity. The
exchange rate crisis, banking crisis, private foreign
debt crisis, and various distressed political and social
occurrences caused an economic crisis in Indonesia.
Economic growth in 1998 fell as low as -13.1%,
down from 4.7% in 1997. The Rupiah depreciated
by 244%, from an average Rp2,909/USD in 1997 to
an average Rp10,014/USD in 1998. Inflation soared
to a rate of 77.6% (y-o-y) in 1998, up from 11.1%
DAMPAK KRISIS YUNANI TERHADAP PEREKONOMIAN INDONESIA | THE IMPACT OF THE GREEK CRISIS ON THE INDONESIAN ECONOMY

214 THE INDONESIANBUDGET OVERVIEW 2010
angka 77,6% (y-o-y) pada tahun 1998, dari 11.1%
pada tahun 1997. Selain itu suku bunga SBI 3 bulan
juga naik tajam dari 12,3% pada tahun 1997 menjadi
50,0% pada tahun 1998. Ekonomi nasional pada
masa ini berada dalam keadaan yang tidak stabil
(disequilibrium). Krisis tahun 1997 yang bermula dari
krisis nilai tukar yang terjadi di beberapa negara Asia
merupakan suatu gambaran yang nyata, bagaimana
suatu kejadian (shock) di suatu negara dapat ditularkan
ke negara-negara lain. Krisis nilai tukar di Asia bermula
dari krisis mata uang Thailand, kemudian merambat
ke Filipina, Malaysia, Indonesia dan Korea Selatan.
Krisis moneter dan penyebabnyaKrisis moneter tahun 1997 tidak semata-mata hanya
berasal dari fundamental ekonomi Indonesia yang
lemah, tetapi terutama berasal dari utang luar negeri
swasta yang cukup besar sehingga nilai tukar dollar
AS mengalami overshooting sangat jauh dari nilai
sebenarnya. Bank Dunia melihat adanya empat sebab
utama yang bersama-sama membuat krisis menuju
ke arah kebangkrutan (World Bank, 1998, pp. 1.7 -
1.11). Yang pertama adalah akumulasi utang swasta
luar negeri yang cepat dari tahun 1992 hingga Juli
1997, lebih kurang 95% dari total kenaikan utang luar
negeri berasal dari sektor swasta ini, dan jatuh tempo
rata-ratanya hanyalah 18 bulan. Bahkan selama empat
tahun terakhir utang luar negeri pemerintah jumlahnya
menurun. Sebab kedua adalah kelemahan pada
sistim perbankan. Ketiga adalah masalah governance,
termasuk kemampuan pemerintah menangani dan
mengatasi krisis, yang kemudian menjelma menjadi
in 1997. In addition to this, the SBI 3-monthly interest
rate also rose sharply from 12.3% in 1997 to 50.0%
in 1998. The national economy during this time was in
an unstable (disequilibrium) state. The 1997 crisis that
began from the exchange rate crisis which occurred
in several Asian countries is a real picture of how an
occurrence (shock) in one country can be transmitted
to others. The exchange rate crisis in Asia began from
the Thai currency crisis, and then was transmitted to
the Philippines, Malaysia, Indonesia and South Korea.
The Monetary Crisis and Its Causes The 1997 monetary crisis did not merely originate
from the weak economic fundamental condition in
Indonesia, but mainly came from sustainable private
foreign debt, so that the U.S. Dollar exchange rate
experienced overshooting which was very far from the
real one. The World Bank sees four main causes that
have jointly created a crisis leading to a bankruptcy
(World Bank, 1998, pp. 1.7 - 1.11). The first is the fast
accumulation of foreign private debts from 1992 to
July 1997, approximately 95% of the total increase
of this foreign debt coming from the private sector,
and their maturity being 18 months on average.
Even during the last four years, the amount of
government foreign debt declined. The second cause
is weaknesses in the banking system. The third cause is
the governance problem, including the government’s
ability to handle and cope with the crisis, which later
turned into a confidence crisis and reluctance of the
DAMPAK KRISIS YUNANI TERHADAP PEREKONOMIAN INDONESIA | THE IMPACT OF THE GREEK CRISIS ON THE INDONESIAN ECONOMY

215THE INDONESIANBUDGET OVERVIEW 2010
krisis kepercayaan dan keengganan donor untuk
menawarkan bantuan finansial dengan cepat. Yang
keempat adalah ketidak pastian politik menghadapi
Pemilu yang lalu dan pertanyaan mengenai kesehatan
Presiden Soeharto pada waktu itu.
Dampak krisis moneter bagi IndonesiaPada umumnya, semua permasalahan dalam krisis
ekonomi berputar-putar sekitar kurs nilai tukar valas,
khususnya dollar AS, yang melambung tinggi jika
dihadapkan dengan pendapatan masyarakat dalam
rupiah yang tetap, bahkan dalam beberapa hal turun
ditambah PHK, padahal harga dari banyak barang
naik cukup tinggi, kecuali sebagian sektor pertanian
dan ekspor. Dampak dari semua hal tersebut terhadap
APBN terutama adalah kesulitan menutup defisit
APBN, melonjaknya pembayaran utang dan bunga
utang luar negeri dalam rupiah, melonjaknya subsidi
BBM dan listrik. Selain itu di sector swasta banyak
perusahaan tutup atau mengurangi produksinya
karena tidak bisa menjual barangnya dan beban
utang yang tinggi, PHK di mana-mana, dan investasi
menurun karena impor barang modal menjadi
mahal. Dampak lain adalah laju inflasi yang tinggi
yang disebabkan oleh foreign exchange induced
inflation. Sebagai dampak dari krisis ekonomi yang
berkepanjangan ini, pada Oktober 1998 jumlah
keluarga miskin diperkirakan meningkat menjadi 7,5
juta, sehingga perlu dilancarkan program-program
untuk menunjang mereka yang dikenal sebagai social
safety net. Meningkatnya jumlah penduduk miskin
donors to offer financial assistance quickly. The fourth
cause is political uncertainty in facing the past election
and questions about the health of President Suharto
at that time.
Impacts of the Monetary Crisis on IndonesiaIn general, all the problems in the economic crisis
revolved around the exchange rates of foreign
currencies, particularly the U.S. Dollar, that soared
high when confronted with the fixed income in
rupiah that is constant, and even decreasing in some
cases combined with layoffs. Yet the price of many
goods increased high enough, except for a part of the
agricultural sector and exports. The impact of all of
this on the Indonesian Budget was, mainly, difficulty to
cover the budget deficit, the shooting up of payments
for foreign debts and interest in rupiah, and the
shooting up of fuel and electricity subsidies. In addition
to this, in the private sector, many companies closed
down or cut their production because of inability to
sell their goods and the high debt burden, there were
widespread layoffs, and investment declined since
the importation of capital goods became expensive.
Another impact was the high inflation rate caused by
foreign exchange-induced inflation. As a result of this
prolonged economic crisis, the number of poor families
in October 1998 was estimated to have increased to
7.5 million, thus it was necessary to launch programs
to support them, known as a social safety net. The
increasing number of poor people is inseparable from
DAMPAK KRISIS YUNANI TERHADAP PEREKONOMIAN INDONESIA | THE IMPACT OF THE GREEK CRISIS ON THE INDONESIAN ECONOMY

216 THE INDONESIANBUDGET OVERVIEW 2010
tidak terlepas dari jatuhnya nilai tukar rupiah yang
tajam, sehingga menyebabkan terjadinya kesenjangan
antara penghasilan yang berkurang karena PHK.
Krisis Ekonomi Global Perlemahan ekonomi global pada tahun 2009 dipicu
oleh terjadinya krisis subprime mortgage di pasar
keuangan Amerika Serikat dan pasar keuangan
beberapa negara maju lainnya pada pertengahan
tahun 2007, telah memberikan imbas pada kondisi
perekonomian dunia. Berbeda dengan krisis nilai tukar
tahun 1997 yang episentrumnya di Asia termasuk
Indonesia, krisis subprime mortgage ini episentrumnya
berada di Amerika Serikat sehingga dampaknya
sangat terasa di hampir semua Negara di dunia
mengingat besarnya peran perekonomian negara-
negara maju di pasar global. Gejolak perekonomian
negara-negara tersebut telah menciptakan tekanan
bagi perekonomian negara lain. Gejolak yang pada
awalnya terjadi di pasar keuangan telah meluas
hingga turut mengganggu kinerja sektor riil dan
pertumbuhan ekonomi global terutama di negara-
negara maju.
Krisis Global dan penyebabnyaKrisis keuangan global yang terjadi saat ini sangat
terkait erat dengan kondisi perekonomian Amerika
yang memburuk. Krisis keuangan yang terjadi di
Amerika Serikat telah berkembang menjadi masalah
yang serius. Goncangan yang terjadi pada Amerika
Serikat tersebut dipastikan akan memberikan dampak
terhadap perekonomian dunia. Gejolak perekonomian
the sharp drop in the rupiah exchange rate, resulting
in a gap among incomes which decreased due to
employment terminations (layoffs).
Global Economic Crisis The weakening global economy in 2009, triggered
by the subprime mortgage crisis in the U.S. financial
markets and the financial markets of several other
developed countries in mid-2007, has impacted
world economic conditions. Unlike the exchange
rate crisis in 1997, the epicenter of which was Asia,
including Indonesia, this subprime mortgage crisis
has its epicenter in the United States, so that its
remarkable effects are felt in almost all countries
in the world, considering the pivotal role played by
the economies of developed countries in the global
market. The economic upheaval of these countries
has put pressure on the economies of other countries.
The upheaval that initially occurred in the financial
market has expanded, now interfering with the
performance of the real sector and global economic
growth, particularly in advanced countries.
The Global Crisis and Its Causes The global financial crisis that is presently taking place
relates very closely to the deteriorating condition of
the United States economy. The financial crisis that
occurred in the United States has grown into a serious
problem. It is believed that the shock that occurred in
the United States will have an impact on the world
economy. The economic upheaval that occurred in
DAMPAK KRISIS YUNANI TERHADAP PEREKONOMIAN INDONESIA | THE IMPACT OF THE GREEK CRISIS ON THE INDONESIAN ECONOMY
217THE INDONESIANBUDGET OVERVIEW 2010
yang terjadi di Amerika Serikat telah mempengaruhi
stabilitas ekonomi global di beberapa kawasan. Krisis
keuangan yang terjadi di Amerika Serikat bermula dari
krisis kredit perumahan. Amerika Serikat pada tahun
1925 telah menetapkan undang-undang mengenai
Mortgage (Perumahan) yang berkaitan dengan
sektor properti, termasuk memberikan kemudahan
bagi kredit kepemilikan rumah. Kemudahan tersebut
juga terjadi pada saat harga properti di AS sedang
mengalami kenaikan sehingga mengakibatkan
tingginya tingkat spekulasi di sektor ini. Permasalahan
muncul ketika banyak lembaga keuangan pemberi
kredit properti di Amerika Serikat menyalurkan
kredit kepada masyarakat yang sebenarnya secara
finansial tidak layak memperoleh kredit yaitu kepada
masyarakat yang tidak memiliki kemampuan ekonomi
untuk memenuhi kredit yang mereka lakukan. Situasi
tersebut memicu terjadinya kredit macet di sektor
properti (subprime mortgage). Kredit macet di sektor
properti tersebut mengakibatkan efek domino yang
mengarah pada bangkrutnya beberapa lembaga
keuangan di Amerika Serikat. Hal ini dikarenakan
lembaga pembiayaan sektor properti umumnya
meminjam dana jangka pendek dari pihak lain yang
umumnya adalah lembaga keuangan. Jaminan yang
diberikan perusahaan pembiayaan kredit properti
adalah surat utang (subprime mortgage securities)
yang dijual kepada lembaga-lembaga investasi dan
investor di berbagai negara. Padahal, surat utang
tersebut tidak ditopang dengan jaminan debitor yang
memiliki kemampuan membayar kredit perumahan
yang baik. Dengan adanya tunggakan kredit properti,
the United States has affected the stability of the
global economy in some regions. The financial crisis
that occurred in the United States stemmed from
housing credit. In 1925, the United States set laws on
Mortgage (Housing), relating to the property sector,
including providing facilitation for home ownership
credit. Such a facilitation also occurred when property
prices in the US were increasing, resulting in a high
level of speculation in this sector. Problems arose when
many financial institutions that provide property credit
in the United States gave loans to the communities
which are, actually, not financially feasible to receive
the loans, namely to the communities which have no
economic ability to repay the loans they took. Such
a situation lead to bad debts in the property sector,
triggering the occurrence of nonperforming loans
in the property sector (subprime mortgage). Such
nonperforming loans in the property sector resulted
in a domino effect that led to the bankruptcy of
some financial institutions in the United States. This is
because property sector finance institutions generally
borrow short-term funds from other parties, usually
financial institutions. Guarantees given by property
credit finance companies are securities (subprime
mortgage securities) that were sold to investment
institutions and investors in various countries.
However, in fact, these securities were not backed by
guarantees of debtors who have the ability to properly
repay the housing loans. With the existence of
overdue property loans, the finance companies could
not fulfill their obligations to the financial institutions,
both investment banks and asset management firms.
DAMPAK KRISIS YUNANI TERHADAP PEREKONOMIAN INDONESIA | THE IMPACT OF THE GREEK CRISIS ON THE INDONESIAN ECONOMY
218 THE INDONESIANBUDGET OVERVIEW 2010
perusahaan pembiayaan tidak bisa memenuhi
kewajibannya kepada lembaga-lembaga keuangan,
baik bank investasi maupun asset management.
Hal tersebut mempengaruhi likuiditas pasar modal
maupun sistem perbankan. Kondisi tersebut
mengarah kepada terjadinya pengeringan likuiditas
lembaga-lembaga keuangan akibat tidak memiliki
dana aktiva untuk membayar kewajiban yang ada.
Ketidakmampuan membayar kewajiban tersebut
membuat lembaga keuangan yang memberikan
pinjaman terancam kebangkrutan. Kondisi yang
dihadapi lembaga-lembaga keuangan besar di
Amerika Serikat mempengaruhi likuiditas lembaga
keuangan yang lain,baik yang berada di Amerika
Serikat maupun di luar Amerika Serikat terutama
lembaga yang menginvestasikan uangnya melalui
instrumen lembaga keuangan besar di Amerika
Serikat. Disinilah krisis keuangan global bermula.
Dampak krisis global bagi IndonesiaSepanjang tahun 2008, masyarakat dunia telah
dihadapkan pada kenyataan bahwa tekanan
pada kinerja perekonomian terus meningkat dan
lebih berat dari yang diperkirakan sebelumnya.
Laju pertumbuhan ekonomi di berbagai negara
menunjukkan perlambatan yang signifikan. Dampak
penurunan laju pertumbuhan ekonomi tersebut pada
awalnya terjadi di negara-negara maju dan kemudian
meluas ke negara-negara berkembang. Hal ini antara
lain dipengaruhi oleh besarnya peran pasar negara-
negara maju terhadap produk-produk ekspor Negara
That affected the liquidity of capital markets and the
banking system. Such a condition led to occurrence
of a liquidity shortfall at the financial institutions,
due to not having asset funds to pay the existing
obligations. Such an inability to pay obligations put
the financial institutions that provided the loans in
danger of bankruptcy. The condition faced by major
financial institutions in the United States affected
the liquidity of other financial institutions, both
those located inside and outside the United States,
particularly institutions that invest their funds through
large financial institutions in the United States. This is
where the global financial crisis began.
Impacts of the Global Crisis on Indonesia Throughout 2008, the international community was
faced with the fact that the pressure on economic
performance was continuously increasing and
becoming more severe than previously forecasted.
The economic growth rate in many countries
showed a significant slowdown. The impact of the
economic growth rate decrease initially occurred in
the developed countries, and later extended to the
developing countries. This was partly influenced by
the major role of the markets of developed countries
on the exported products of the developing countries,
DAMPAK KRISIS YUNANI TERHADAP PEREKONOMIAN INDONESIA | THE IMPACT OF THE GREEK CRISIS ON THE INDONESIAN ECONOMY
219THE INDONESIANBUDGET OVERVIEW 2010
berkembang, serta arus modal dan investasi negara
maju ke negara-negara berkembang. Dari pola yang
ada, secara umum dapat diduga bahwa penurunan
pertumbuhan ekonomi terutama terjadi pada negara-
negara dengan peran ekspor cukup besar dalam
perekonomian nasionalnya. Negara-negara dengan
karakteristik tersebut mengalami pukulan terberat
akibat penurunan kinerja ekspor yang disebabkan
oleh melemahnya permintaan (demand) dari negara-
negara maju. Sementara bagi Indonesia, dampak krisis
global sudah mulai terlihat pada triwulan IV 2008
yang ditunjukkan oleh menurunnya pertumbuhan
ekonomi terkait dengan menurunnya pertumbuhan
ekspor barang dan jasa sebagai akibat melemahnya
harga minyak, serta menurunnya permintaan
komoditi ekspor nasional. Di pasar keuangan terjadi
koreksi cukup tajam pada harga-harga saham,
terdepresiasinya rupiah dan meningkatnya imbal hasil
(yield) SUN di pasar obligasi. Indonesia merupakan
salah satu dari tiga negara yang memiliki kinerja
ekonomi terbaik setelah China dan India yang
perekonomiannya masih mampu tumbuh positif di
tahun 2009 sebesar 4,5 persen. Di sisi fiskal, dampak
krisis global menyebabkan terjadinya perubahan
asumsi dasar yang berdampak pada penyesuaian
postur APBN 2009. Penerimaan perpajakan dan PNBP
mengalami penurunan dari yang ditetapkan dalam
APBN 2009 selain karena menurunnya pertumbuhan
ekonomi, juga karena adanya kebijakan fiskal
dalam bentuk pemotongan tarif pajak penghasilan
pasal 21. Selain itu, turunnya realisasi harga minyak
dibandingkan dengan asumsi dalam tahun 2009 di
as well as the capital and investment flows from the
developed countries to the developing countries. From
the existing pattern, in general it can be presumed
that the decline of economic growth mainly occurred
in countries where exports play a significant role
in their national economy. Countries with these
characteristics suffered the heaviest blow from the
export performance decrease due to weak demand
from the developed countries. While for Indonesia,
the impact of the global crisis began to appear in the
fourth quarter of 2008, as was seen by the decreased
growth of the economy associated with the decreased
growth of the export of goods and services as a result
of lower oil prices, and the declining demand for
national export commodities. In financial markets
there was a sufficiently sharp correction to stock
prices, rupiah depreciation, and increased yields of
SUN in the bond market. Indonesia is one of three
countries that had the best economic performance,
after China and India, whose economy was still able
to grow positively in 2009 at 4.5 percent. On the fiscal
side, the impact of the global crisis led to change in the
basic assumptions that affect the posture adjustment
of the 2009 Indonesian Budget. Tax revenues and
non-tax revenues declined from those that had been
determined in the 2009 Indonesian Budget, in part
due to the decrease in economic growth, and because
of the existence of a fiscal policy in the form of an
income tax rate deduction in Article 21. In addition
to this, the lower oil price realization compared to the
assumptions in 2009, on one hand, will reduce the
fuel oil subsidy; however, on the other hand, it will also
DAMPAK KRISIS YUNANI TERHADAP PEREKONOMIAN INDONESIA | THE IMPACT OF THE GREEK CRISIS ON THE INDONESIAN ECONOMY

220 THE INDONESIANBUDGET OVERVIEW 2010
satu sisi akan mengurangi subsidi BBM namun disisi
lain juga akan menurunkan pajak migas. Dampak krisis
lainnya adalah berkurangnya kemampuan pendanaan
pemerintah untuk peningkatan pembangunan
infrastruktur karena sebagian dananya dialokasikan
untuk mengatasi dampak krisis dalam bentuk stimulus
fiskal. Defisit APBN yang meningkat juga membuat
Pemerintah harus menambah pinjaman luar negeri.
Krisis YunaniYunani bergabung secara resmi menjadi Negara Uni
Eropa sejak tahun 2002. Negara yang menjadi anggota
Uni Eropa, secara ketat diawasi sektor keuangannya
oleh bank Sentral Eropa. Dalam pengawasan
tersebut, negara-negara anggota UE termasuk Yunani
harus mematuhi beberapa kesepakatan kebijakan
bersama seperti batas maksimum defisit anggaran
yaitu sebesar 3 persen dari Produk Domestik Bruto
(PDB), tingkat inflasi yang rendah, dan tingkat suku
bunga yang berada pada kisaran Negara-negara uni
eropa secara keseluruhan, meskipun kenyataannya
kebijakan tersebut tidak sepenuhnya diikuti oleh
anggotanya. Tingkat defisit fiskal Yunani pada tahun
2009 mencapai 13,6 % PDB atau lebih tinggi dari
syarat yang ditetapkan oleh uni eropa. Defisit fiskal
Yunani yang melebihi batas aman UE telah terjadi
sejak sebelum menjadi anggota UE. Dengan tabungan
domestic yang rendah (dibawah 10%), Pemerintah
Yunani mau tidak mau sangat tergantung pada
utang luar negeri. Adanya program stimulus fiskal
yang semula bertujuan untuk memperbaiki kondisi
perekonomian domestik justru menjadi bumerang
reduce oil and gas taxes. Another impact of these crises
is the decreased funding ability of the government to
improve of infrastructure development, because a part
of their funds are allocated to cope with the impact
of the crisis in the form of fiscal stimulus. The rising
Indonesian Budget deficit also leads the Government
to increase foreign loans.
The Greek Crisis Greece officially joined the European Union in 2002.
The financial sector of countries that are members
of the European Union are strictly supervised by the
European Central Bank. Under this supervision, the EU
member countries, including Greece, must comply with
some joint policy agreements, such as: the maximum
limit for the budget deficit, namely to 3 percent of the
Gross Domestic Product (GDP), low inflation level and
interest rate that is within the range of the European
Union countries as a whole, despite that such a policy
is in fact not fully followed by its members. Greece’s
fiscal deficit level in 2009 reached 13.6% of the GDP,
higher than the requirement set by the European
Union. The Greek fiscal deficit that exceeded the EU
safety limit has been going on since before it was an
EU member. With low domestic savings (below 10%),
the Greece government inevitably depends highly
on foreign debt. The existence of a fiscal stimulus
program which was originally intended to improve the
condition of domestic economy has even backfired
and worsened the government’s fiscal position in line
with the increasingly declining revenues due to the
DAMPAK KRISIS YUNANI TERHADAP PEREKONOMIAN INDONESIA | THE IMPACT OF THE GREEK CRISIS ON THE INDONESIAN ECONOMY

221THE INDONESIANBUDGET OVERVIEW 2010
dan semakin memperburuk posisi fiskal Pemerintah
sejalan dengan semakin menurunnya pendapatan
negara akibat krisis global. Kondisi tersebut telah
mengakibatkan melonjaknya defisit hingga mencapai
13,6 % PDB. Jumlah ini hampir dua kali lipat defisit
tahun 2008. Sejalan dengan itu, utang pemerintah
meningkat tajam hingga mencapai 115,1% di akhir
tahun 2009. Primary balance juga meningkat lebih
dua kali lipat dalam kurun waktu 2008-2009. Hal
ini semakin memperlihatkan fiscal space Pemerintah
semakin sempit ditengah penurunan pendapatan
Negara.
Krisis kepercayaan yang melanda Yunani
turut berdampak pada kondisi pasar keuangan. Hal
tersebut diperburuk dengan semakin berlarut-larutnya
pencairan bantuan yang berasal dari Negara-negara
UE dan IMF serta tidak adanya jaminan roll over utang
yang akan jatuh tempo. Memburuknya kondisi pasar
keuangan tersebut dapat dilihat dari peningkatan
tajam CDS (Currency Debt Swap) obligasi Pemerintah
10 tahun Yunani yang mencapai titik tertingginya
980,3 bps pada tanggal 24 Juni 2010. Yield obligasi
global crisis. This condition has resulted in the deficit
skyrocketing to reach 13.6% of the GDP. This amount
is almost double the deficit in 2008. Accordingly,
government debts rose sharply to 115.1% at the end
of 2009. The primary balance also increased more
than double in the 2008-2009 period. This further
shows that the Government fiscal space is increasingly
narrow amid the decline of revenues.
The confidence crisis that swept Greece also affected
financial market conditions. This was exacerbated by
the prolonged draw-down of assistance originating
from EU countries and the IMF, and the absence of
debt rollover guarantee to come at payment time.
Such a worsening financial market condition can be
seen from the sharp increase in the CDS (Currency
Debt Swap) of the 10-year Greek government bonds,
which reached its highest point of 980.3 bps on the
24th of June, 2010. The yield of Greek government
Financial Indicators of the Greek Government
Indicator 2007 2008 2009
2010
Fiscal Deficit (%PDB) -5.1 -7.7 -13.6 -9.3
Primary Balance (%PDB) -0.9 -3.1 -8.5 -4.0
Revenue (%PDB) 39.7 39,1 36.9 39.0
Expenditure (%PDB) 45.0 46.8 50.4 48.4
Government Debts (% PDB) 95.7 99.2 115.1 124.9
Source: Eurostat
DAMPAK KRISIS YUNANI TERHADAP PEREKONOMIAN INDONESIA | THE IMPACT OF THE GREEK CRISIS ON THE INDONESIAN ECONOMY

222 THE INDONESIANBUDGET OVERVIEW 2010
pemerintah Yunani juga meningkat cukup drastis
hingga mencapai 12,4%. Austerity package yang
diluncurkan oleh Pemerintah Yunani untuk menekan
pelebaran defisit ternyata tidak memberikan
pengaruh yang signifikan terhadap pergerakan
yield dan CDS, bahkan pergerakan yield dan CDS
cenderung semakin meningkat. Hal ini terus berlanjut
meskipun IMF dan UE telah mengumumkan paket
bantuan. Krisis kepercayaan yang semakin berlanjut
tersebut telah mengakibatkan lembaga rating seperti
Fitch, Moody’s dan S&P melakukan downgrade atas
sovereign rating Yunani. Moody’s bahkan pada 15
Juni 2010, menurunkan rating kredit Yunani empat
level menjadi Ba1 atau junk (tidak layak untuk
investasi). Penurunan rating ini lantaran tingginya
risiko pertumbuhan ekonomi akibat penghematan
terkait pemberian paket bantuan Uni Eropa dan Dana
Moneter Internasional (IMF) sebesar 110 miliar atau
setara US$ 134,5 miliar. Penurunan rating Yunani
ke posisi junk sebelumnya telah dilakukan oleh S&P.
Downgrade yang dilakukan oleh Moody’s tersebut
diperkirakan akan semakin menekan surat utang
Yunani sementara negara tersebut sedang berjuang
keluar dari krisis lewat pemangkasan anggaran.
Krisis Yunani apabila tidak dapat diatasi dengan baik
berpotensi untuk menyebar ke kawasan euro maupun
kawasan lainnya. Negara-negara yang mempunyai
potensi besar untuk tertular adalah negara-negara
PIIGS yang memiliki karakter sama. Secara umum,
negara-negara PIIGS menghadapi permasalahan
dengan defisit fiskal dan defisit perdagangan. Negara-
bonds also increased quite dramatically to 12.4%.
The austerity package that was launched by the
Greek government to suppress the widening deficit
apparently did not have a significant influence on the
movement of yield and the CDS, and the yield and
CDS movement tended to increase even further. This
has continued despite the fact that the IMF and the
EU have announced the assistance package. Such
a continuing confidence crisis has resulted in rating
agencies such as Fitch, Moody’s and S&P downgrading
the Greek sovereign rating. Moody’s, on the 15th of
June 2010, even lowered its credit rating by four levels
to Ba1 of Junk (not feasible for investment). This rating
decrease was a result of the high risk of economic
growth due to savings, related to the provision of the
assistance packages of the EU and the International
Monetary Fund (IMF) amounting to 110 billion,
equivalent to US$134.5 billion. The downgrading of
the Greek rating to “junk” was done earlier by S&P. It
is predicted that the downgrading which was done by
Moody’s will place more pressure on Greek securities
at the time when that country is struggling to escape
the crisis through budget cuts.
The Greek Crisis, if not addressed properly, can
potentially spread to the Eurozone and other zones.
Countries with great potential to be affected are
PIIGS countries, which have the same characteristics.
In general, PIIGS countries face problems with the
fiscal deficits and trade deficits. These countries also
have current account deficits, with the largest deficit
DAMPAK KRISIS YUNANI TERHADAP PEREKONOMIAN INDONESIA | THE IMPACT OF THE GREEK CRISIS ON THE INDONESIAN ECONOMY

223THE INDONESIANBUDGET OVERVIEW 2010
negara tersebut juga memiliki current account deficit,
dengan defisit terbesar dialami oleh Yunani dan
Portugal. Seperti halnya Yunani, negara-negara PIIGS
tersebut juga memiliki masalah dengan inflasi dan
tingkat pengangguran yang cukup tinggi. Dengan
kondisi tersebut, jika tidak waspada maka negara-
negara tersebut dapat terjerumus dalam krisis yang
sama dengan Yunani. Jika hal tersebut terjadi, bukan
tidak mungkin kawasan euro secara keseluruhan juga
akan tertular, mengingat negara-negara PIIGS tersebut
menyumbang 37% PDB euro. Hal ini akan cukup
berbahaya bagi kawasan asia pasifik karena eurozone
memiliki keterkaitan yang cukup kuat dengan
ekonomi dan keuangan global serta perekonomian di
kawasan asia pasifik, termasuk Indonesia.
Transmisi Krisis Secara teori, transmisi krisis dapat terjadi
melalui tiga jalur utama yaitu (1) jalur perdagangan;
(2) jalur perbankan; dan (3) jalur pasar keuangan.
Dari ketiga jalur tersebut rambatan melalui pasar
keuangan merupakan jalur penularan yang paling
cepat sementara dua jalur lainnya kemungkinan
tertular melalui kawasan euro yang memiliki hubungan
perdagangan dan keuangan yang lebih besar dengan
perekonomian global termasuk dengan kawasan asia
pasifik.
Transmisi melalui jalur perdagangan Meskipun memiliki hubungan dagang yang cukup erat
dengan kawasan euro, namun perdagangan antara
experienced by Greece and Portugal. Like Greece, the
PIIGS countries also have problems with inflation and
high unemployment. Under such conditions, if not
vigilant then these countries could fall into the same
crisis as Greece. If this happens, it is not impossible
that the Eurozone will be infected as a whole, given
that the PIIGS countries contribute 37% of the Euro’s
GDP. This will be quite dangerous to the Asia Pacific
region because the Eurozone has a considerably strong
relationship with the global economy and finance in
the Asia Pacific region, including Indonesia.
Transmission of the Crisis Theoretically, crisis transmission can occur through
three main routes, namely: (1) the trade route, (2)
banking route, and (3) financial market route. From the
third route, propagation through the financial market
is the fastest transmission route, while the two other
routes are possible to be transmitted to Eurozone,
which has large trade and financial relationships with
the global economy, including with the Asia Pacific
region.
Transmission through Trade Routes
Despite having fairly close trade relations with the
Eurozone, trade between Indonesia and Greece
DAMPAK KRISIS YUNANI TERHADAP PEREKONOMIAN INDONESIA | THE IMPACT OF THE GREEK CRISIS ON THE INDONESIAN ECONOMY

224 THE INDONESIANBUDGET OVERVIEW 2010
Indonesia dengan Yunani relatif kecil dibandingkan
dengan negara-negara mitra dagang utama eropa
seperti Jerman, Inggris dan Perancis. Apalagi jika
dibandingkan dengan mitra dagang utama lainnya
seperti Jepang dan Amerika Serikat. Nilai perdagangan
Indonesia dan Yunani hanya sebesar US$198.486,8
ribu atau 0,09 persen dari total nilai perdagangan
pada tahun 2009, sedangkan persentase nilai
perdagangan Indonesia dengan Jerman, Inggris
dan Perancis mencapai masing-masing sebesar 2,2
persen, 1,08 persen dan 1,2 persen dari total nilai
transaksi perdagangan Indonesia. Nilai tersebut masih
relatif kecil jika dibandingkan dengan Jepang dan
Amerika Serikat yang mencapai 13,3 persen dan 8,4
persen. Sangat masuk akal jika pada tahun 2009
saat terjadi krisis yang melanda Amerika Serikat dan
sebagian besar Negara dunia termasuk Jepang nilai
perdagangan Indonesia ikut terpukul. Kondisi ini
berbeda dengan kondisi krisis yang melanda Yunani di
awal tahun 2010, nilai perdagangan Indonesia relatif
tidak terpengaruh, bahkan hingga september 2010,
neraca perdagangan Indonesia masih surplus.
Transmisi melalui jalur perbankan
Indonesia memiliki hubungan yang relatif erat dan
kuat dengan eurozone namun tidak begitu dengan
Yunani. Ketergantungan perbankan Indonesia
terhadap eurozone sebesar 43,6%, sedangkan
dengan Yunani perbankan Indonesia berdasarkan
data dari BIS tidak memiliki ketergantungan karena
dari total foreign claim Indonesia tidak ada yang
berasal dari Yunani. Diantara negara-negara PIIGS,
is relatively small compared with the countries of
Europe’s major trading partners, such as Germany
and France. This is even more so if compared to
other major trading partners like Japan and the
United States. Indonesia-Greece trade value was only
US$198,486.8 thousand, or 0.09 percent of total
trade value in 2009. Meanwhile, Indonesia’s trade
value with Germany and France reached 2.2 percent
and 1.2 percent, respectively. Those values are still
relatively small if compared to Japan and the United
States, which reached 13.3 percent and 8.4 percent.
It makes sense that if in 2009, when the crisis hit
the United States and most countries of the world,
including Japan, that Indonesia’s trade value was also
hit. In contrast to the condition of crisis that hit Greece
in early 2010,
Indonesia’s trade value is relatively unaffected.
Transmission Through Banking Routes
Indonesia has a relatively close and strong relationship
with the Eurozone, but not so must with Greece.
Dependence of Indonesian banking with the
Eurozone is 43.6%, while with Greece the Indonesian
banking, based on data from the BIS, does not have
a dependency because of the total foreign claims of
Indonesia, none come from Greece. Among the PIIGS
countries, only Italy has a banking relationship with
DAMPAK KRISIS YUNANI TERHADAP PEREKONOMIAN INDONESIA | THE IMPACT OF THE GREEK CRISIS ON THE INDONESIAN ECONOMY

225THE INDONESIANBUDGET OVERVIEW 2010
hanya Italia yang memiliki hubungan perbankan
dengan Indonesia meskipun nilainya sangat kecil.
Dari total foreign claim Indonesia, hanya 1,6% yang
berasal dari Italia. Ketergantungan perbankan
Indonesia yang cukup tinggi selain terhadap eurozone
adalah Amerika Serikat dan Jepang yang masing-
masing mencapai 15,2% dan 13,6%. Oleh sebab itu,
apabila Amerika Serikat dan Jepang mengalami krisis
seperti yang terjadi pada tahun 2008-2009 maka
cukup masuk akal apabila Indonesia juga merasakan
pengaruhnya. Sementara krisis Yunani tidak begitu
terasa pengaruhnya karena tidak ada keterkaitan
Indonesia, although its value is very small. Of the total
foreign claims of Indonesia, only 1.6% comes from
Italy. Indonesian banking dependence is sufficiently
high on the United States and Japan, respectively
reaching 15.2% and 13.6%, in addition to such
dependence on the Eurozone. Therefore, if the United
States and Japan are in a crisis, as happened in 2008-
2009, it is reasonable for Indonesia to also feel its
impact. Meanwhile, the Greek crisis had a much less
pronounced effect because of no direct relationship
between Indonesian banking and Greece. The Greek
crisis will only have impact if the crisis is not tackled
Trade Transactions(in thousands of US$)
Countries 2007 2008 20092010
Jan -Juli
Japan 30,159,470.70 42,871,871.40 28,418,459.20 23,295,803.00
United States 16,401,404.10 20,916,939.20 17,933,955.60 13,362,705.00
Germany 4,298,035.6 5,533,952.7 4,700,197.3 3,236,280.00
UK 2,108,149.8 2,614,438.8 2,303,988.7 1,554,673.0
France 2,246,597.9 2,628,242.7 2,503,313.6 1,343,815.0
Greece 262,842.5 242,302.3 198,486.8 130,478.0
World 188,574,300.0 266,217,700.0 213,339,300.0 208,078,500.0
Countries 2007 2008 20092010
Jan-Jul
Japan 15.99 16.10 13.32 11.20
United States 8.70 7.86 8.41 6.42 Germany 2.28 2.08 2.20 1.56 UK 1.12 0.98 1.08 0.75 France 1.19 0.99 1.17 0.65 Greece 0.14 0.09 0.09 0.06 World 100.00 100.00 100.00 100.00
Source : Ministry of Trade
DAMPAK KRISIS YUNANI TERHADAP PEREKONOMIAN INDONESIA | THE IMPACT OF THE GREEK CRISIS ON THE INDONESIAN ECONOMY

226 THE INDONESIANBUDGET OVERVIEW 2010
langsung antara perbankan Indonesia dengan
Yunani. Krisis Yunani baru akan terasa pengaruhnya
apabila krisis tersebut tidak segera ditanggulangi dan
menyebar di eurozone.
Transmisi melalui pasar keuangan
Di pasar keuangan, yang merupakan jalur penularan
krisis paling cepat, sentimen negatif krisis Yunani
tidak terlalu mempengaruhi Indonesia. Berdasarkan
perkembangan terkini, Indeks saham Indonesia
(IHSG), Yield surat utang Pemerintah maupun CDS
Obligasi 10 tahun Pemerintah masih dalam kondisi
stabil. IHSG bergerak stabil pada kisaran 2.500 an
bahkan telah menguat hingga level di atas 3.000 poin.
Demikian juga dengan Yield SUN 10 tahun yang terus
membaik pada posisi di bawah 8 persen atau turun
lebih dari 17 persen dari posisi akhir tahun 2009. CDS
obligasi Pemerintah 10 tahun juga semakin membaik
dan mencapai 208,7 bps atau turun lebih dari 5
persen dari posisi akhir tahun 2009. Kondisi tersebut
berbeda dengan kondisi Yunani yang sejak awal tahun
2010 terus mengalami pemburukan. CDS obligasi
Pemerintah 10 tahun meningkat hampir 200 persen.
Kondisi tersebut telah mempengaruhi biaya dana
untuk meningkatkan utang baru dan meningkatkan
risiko refinancing utang.
Dampak Krisis Yunani terhadap APBNKrisis fiskal yang mengancam beberapa negara
Eropa (Yunani, Portugal, Italia dan Spanyol), tidak
immediately and spreads in the Eurozone.
Transmission Through Financial Markets In the financial market, which is the fastest route
of the crisis transmission, the negative sentiment of
Greek crisis has not affected Indonesia very much.
Based on the latest developments, the Indonesian
stock index (CSPI), Yield of Government securities,
and the CDS 10-years government bonds are still in a
stable condition. The CSPI remains stable in the 2,500
range and has even strengthened to a level above
3,000 points. Likewise, the Yield of 10-year SUN
continuously improves its position below 8 percent or
decreases by more than 17 percent from the position
at the end of 2009. The CDS 10-year government
bonds are also getting better and reaching 208.7 bps
or decreasing more than 5 percent from their position
at the end of 2009. Such a condition differs from the
Greek condition, which has been worsening since the
beginning of 2010. The CDS 10-year government
bonds increased almost 200 percent. That condition
has affected the funding cost by increasing new debts
and increased the debt refinancing risk.
Impacts of the Greece Crisis on the Indonesian BudgetThe fiscal crisis in Europe, particularly in Greece,
that threatens some European countries (Greece,
DAMPAK KRISIS YUNANI TERHADAP PEREKONOMIAN INDONESIA | THE IMPACT OF THE GREEK CRISIS ON THE INDONESIAN ECONOMY

227THE INDONESIANBUDGET OVERVIEW 2010
Consolidated Foreign Claims of Reporting Banks, End December 2009(value in millions of US$)
Countries Total
Foreign Claims
European Banks Germany France Portugal Ireland Italy Greece Spain Japan USA
EU 16,021,597 10,403,344 2,059,423 2,300,816 110,957 433,562 652,440 60,752 734,359 797,293 1,236,500
Germany 2,102,261 1,293,596 - 292,944 4,618 36,351 274,883 5,908 51,020 148,707 146,919
Portugal 285,766 240,639 47,377 44,739 - 5,431 6,740 105 86,083 4,224 4,955
Ireland 871,802 638,294 183,757 804 21,516 - 18,357 804 15,664 30,188 58,553
Italy 1,414,358 1,029,381 189,675 511,449 5,203 46,258 - 710 46,786 53,085 53,794
Greece 236,211 188,780 45,003 75,172 9,746 8,464 6,924 - 1,273 6,389 16,647
Spain 1,150,578 856,107 237,983 219,636 28,075 30,225 31,101 434 - 27,986 52,696
Asia Pacific 1,407,891 684,941 97,848 108,078 515 3,447 16,370 2,997 5,371 142,148 293,997
- China 298,804 124,677 20,830 15,359 - - 2,378 14 3,685 37,092 58,258
- Indonesia 75,831 33,068 6,730 3,402 1 - 1,239 - 62 11,520 10,321
Countries Total
Foreign Claims
European Banks Germany France Portugal Ireland Italy Greece Spain Japan USA
EU 16,021,597 64.9 12.9 14.4 0.7 2.7 4.1 0.4 4.6 5.0 7.7
Germany 2,102,261 61.5 - 13.9 0.2 1.7 13.1 0.3 2.4 7.1 7.0
Portugal 285,766 84.2 16.6 15.7 - 1.9 2.4 0.0 30.1 1.5 1.7
Ireland 871,802 73.2 21.1 0.1 2.5 - 2.1 0.1 1.8 3.5 6.7
Italy 1,414,358 72.8 13.4 36.2 0.4 3.3 - 0.1 3.3 3.8 3.8
Greece 236,211 79.9 19.1 31.8 4.1 3.6 2.9 - 0.5 2.7 7.0
Spain 1,150,578 74.4 20.7 19.1 2.4 2.6 2.7 0.0 - 2.4 4.6
Asia Pacific 1,407,891 48.7 6.9 7.7 0.0 0.2 1.2 0.2 0.4 10.1 20.9
- China 298,804 41.7 7.0 5.1 - - 0.8 0.0 1.2 12.4 19.5
- Indonesia 75,831 43.6 8.9 4.5 0.0 - 1.6 - 0.1 15.2 13.6
source : Bank for International Settlement
DAMPAK KRISIS YUNANI TERHADAP PEREKONOMIAN INDONESIA | THE IMPACT OF THE GREEK CRISIS ON THE INDONESIAN ECONOMY

228 THE INDONESIANBUDGET OVERVIEW 2010
berdampak secara langsung bagi sustainibilitas dan
kinerja perekonomian Indonesia. Hal ini disebabkan
peran langsung dari negara-negara tersebut terhadap
perekonomian Indonesia relatif kecil. Peran total
ekspor Indonesia pada keempat negara tersebut dari
tahun 2005 sampai 2009 rata-rata hanya sebesar
3,02%. Dengan demikian gejolak di negara-negara
tersebut tidak akan berdampak besar bagi kinerja
total ekspor Indonesia. Demikian juga dilihat dari
kegiatan investasi (Foreign Direct Investment/FDI)
dari keempat negara tersebut yang relatif kecil di
Indonesia. Rata-rata total porsi investasi keempat
negara tersebut kurang dari 1 persen terhadap total
investasi. Khusus untuk Yunani, dari sisi perdagangan,
nilai perdagangan Indonesia dan Yunani pada
tahun 2009 hanya sebesar US$198.486,8 ribu atau
0,09 persen dari total nilai transaksi perdagangan
sementara untuk periode Januari-Juli 2010 mencapai
US$130,478,0 ribu atau 0,06 persen dari total nilai
transaksi perdagangan sedangkan dari sisi jalur
perbankan, berdasarkan data dari BIS Indonesia tidak
memiliki ketergantungan terhadap Yunani karena dari
total foreign claim Indonesia tidak ada yang berasal
dari Yunani. Dari data-data diatas dapat disimpulkan
bahwa peran langsung negara-negara PIIGS khususnya
Yunani relatif kecil terhadap perekonomian Indonesia
sehingga tidak berdampak bagi kesinambungan dan
kinerja perekonomian Indonesia dengan demikian
dampaknya terhadap APBN juga sangat minim.
Namun demikian, Pemerintah akan terus memantau
perkembangan yang terjadi pada negara-negara
tersebut. Apabila terjadi perluasan krisis ke negara-
Portugal, Italy and Spain), did not directly affect the
sustainability and performance of the Indonesian
economy. This is due to the relatively minor direct role
played by these countries in the Indonesian economy.
The role of Indonesia’s total exports in the four
countries from 2005 to 2009 averaged only 3.02%.
Thus, turmoil in these countries will not largely affect
the performance of Indonesia’s total exports. Similarly,
investing activities (Foreign Direct Investment/FDI) from
the four countries is relatively small in Indonesia. The
average total investment portion of the four countries
is less than 1 percent of total investment. Particularly
for Greece, from the trade side, the value of trade
between Indonesia and Greece only amounted to
US$198,486.8 thousand, or 0.09 percent of total trade
value in 2009. Meanwhile, from the banking channel
side, based on data from BIS Indonesia, there is no
dependence on Greece, because from the Indonesian
total foreign claims, none came from Greece. From
the above data, it can be concluded that the direct
role played by the PIIGS countries, particularly Greece,
is relatively small for the Indonesian economy, so
that there is no impact on the sustainability and
performance of the Indonesian economy. Thus, its
impact on the Indonesian Budget is also very minimal.
However, the Government will continue to monitor
developments in these countries. In the event of the
spread of the crisis to other countries, particularly
to the large countries of Europe, there will certainly
be an impact on the global and domestic economy.
In this case, global cooperation as well as domestic
development strategies will be prepared to mitigate
DAMPAK KRISIS YUNANI TERHADAP PEREKONOMIAN INDONESIA | THE IMPACT OF THE GREEK CRISIS ON THE INDONESIAN ECONOMY

229THE INDONESIANBUDGET OVERVIEW 2010
negara lainnya terutama negara-negara besar Eropa,
tentu akan berdampak pada perekonomian global
dan domestik. Dalam hal ini, kerja sama global dan
juga strategi pembangunan domestik akan disiapkan
untuk memitigasi dampak negatif pada ekonomi
domestik yang mungkin terjadi
Dari sisi fiscal kondisi fiskal Indonesia saat ini masih
terjaga dan pondasi makro ekonomi masih kuat meski
dampak krisis di Eropa khususnya Yunani tetap harus
diwaspadai. Kredibilitas Pemerintah, kesinambungan
fiskal yang terjaga dan konsolidasi fiskal yang realistis
akan menjadi faktor penting dalam meredam
transmisi gejolak di pasar keuangan yang merupakan
jalur penularan krisis paling cepat. Sampai dengan
triwulan III 2010, sumber penerimaan APBN masih
cukup bagus di mana realisasi penerimaan perpajakan
mencapai Rp689.376,6 miliar (14,6%PDB) atau 68,48
persen APBN-P 2010. Jumlah ini lebih tinggi dari
realisasi penerimaan perpajakan tahun sebelumnya
yang hanya mencapai 66,3 persen. Selain itu, realisasi
pembiayaan juga telah mencapai 57,2 persen dari
target APBN-P 2010 dengan kelebihan pembiayaan
sebesar Rp131,9 triliun. Asumsi Dasar ekonomi
makro APBN yang menjadi dasar perhitungan APBN
sampai saat ini masih bergerak pada kisaran yang
aman. Ekonomi Indonesia tumbuh 5,8 persen dalam
triwulan III 2010, dengan inflasi 5,8 persen dan Suku
bunga SBI 3 bulan rata-rata mencapai 6,6 persen.
Sementara nilai tukar rata-rata Rp9.128/US$ dengan
indikasi terus menguat. Pemulihan ekonomi global
telah mendorong meningkatnya permintaan minyak
dunia sehingga ICP juga mengalami peningkatan
any negative impacts on the domestic economy which
may occur.
Indonesia’s fiscal condition is presently being
maintained, and the macro-economic foundation is
still strong, although the impact of the crisis in Europe,
particularly in Greece, calls for caution. Government
credibility, maintaining fiscal sustainability, and realistic
fiscal consolidation will be important factors in reducing
the transmission turmoil in the financial market, which
is the fastest route for crisis transmission. In the first
semester of 2010, the Indonesian Budget revenue
sources are still quite good, in which the realization
of tax revenue reached approximately 45.4 percent
of the 2010 Indonesian Revised Budget, or higher
than the realized tax revenue of the previous year,
which was 44.3 percent. In addition to this, financing
also reached 40.9 percent of the target of the 2010
Indonesian Revised Budget, with surplus financing
amounting to Rp102.6 trillion. The Basic Macro-
Economic Assumptions underlying the calculation of
the budget are until now still fluctuating within a safe
range. The Indonesian economy grew 5.9 percent
in the first semester of 2010, with inflation at 5.05
percent and the 3-monthly SBI interest rates reaching
6.6 percent. Meanwhile, the average exchange rate
is Rp9,193/US$, with indications it will continue to
strengthen. The global economic recovery has led to
the increase of world oil demand, so that the world oil
DAMPAK KRISIS YUNANI TERHADAP PEREKONOMIAN INDONESIA | THE IMPACT OF THE GREEK CRISIS ON THE INDONESIAN ECONOMY

230 THE INDONESIANBUDGET OVERVIEW 2010
hingga mencapai rata-rata US$77,1/barel dengan
lifting minyak rata-rata 951,4 MBOPD (Perkiraan
Desember 2009 – September 2010). Selanjutnya
untuk mengantisipasi krisis ke depan, Pemerintah
telah menyiapkan dana cadangan risiko fiskal yang
dapat digunakan apabila terjadi perubahan asumsi
ekonomi makro yang menjadi dasar perhitungan
APBN.
PenutupBerbagai krisis yang menerpa Indonesia, telah
menyadarkan kita betapa pentingnya menjaga
kesinambungan fiskal. Kesinambungan fiskal
yang tidak terjamin akan menjadi ancaman bagi
perbaikan makroekonomi. Kesinambungan fiskal
sangat bergantung pada kemampuan Pemerintah
untuk memperoleh sumber penerimaan pajak melaui
pertumbuhan ekonomi, dan efisiensi kebutuhan
anggaran, Tidak terjaminnya kesinambungan fiskal
akan meningkatkan country risk yang pada gilirannya
akan meningkatkan risiko serta tingkat bunga sehingga
price and the ICP increased to an average of US$78.0
per barrel, with oil lifting of an average 0.959 MBCD
(December 2009 - May 2010). Furthermore, in order to
anticipate future crises, the Government has prepared
a fiscal risk reserve fund that can be used if there is
a change of macro-economic assumptions underlying
the Indonesian Budget calculation.
Closing Remarks The various crises that have hit Indonesia have
made us aware of the importance of maintaining
fiscal sustainability. Insecure fiscal sustainability will
be a threat to macroeconomic improvement. Fiscal
sustainability highly depends on the Government’s
ability to obtain tax revenue sources through economic
growth and budget requirement efficiency. The
unsecured fiscal sustainability will increase the country
risk, which in turn will increase the risks and the
interest rate, thus inhibiting the entry of investments.
Fiscal sustainability and Government credibility which
Financial Indicators of the Indonesian Government
Indicator 2007 2008 2009Indonesian
Revised Budget 2010
s.d Triwulan I
II
Fiscal Surplus/(Deficit) (%PDB) -1,3 -0,1 -2,4 -2,1 1,2
Primary Balance (%PDB) 0.8 1,7 0,1 -0,4 2,6
Revenue(%PDB) 17,9 19,8 15,1 15,9 14,6
Expenditure(%PDB) 19,1 19,9 16,7 18,0 13,4
Government Debts (% PDB) 35,0 33,0 28,0 27,8 35,0*
Source: Ministry of FinanceKeterangan : *berdasarkan angka sangat-sangat sementara realisasi utang pemerintah s.d 30 September 2010
DAMPAK KRISIS YUNANI TERHADAP PEREKONOMIAN INDONESIA | THE IMPACT OF THE GREEK CRISIS ON THE INDONESIAN ECONOMY

231THE INDONESIANBUDGET OVERVIEW 2010
is accompanied with a realistic fiscal consolidation
policy is an important factor in reducing turmoil and
transmission in the financial markets. The impacts of a
crisis can also be minimized with prompt international
responses, as occurred in the Greek crisis.
Learning from the current world economic crisis
and Indonesia’s economic crisis in 1997-1998, the
Indonesian economy should be built continuously
by relying on domestic sources of growth and on a
territorial basis. Globalization must be able to be
utilized and managed so as not to be a threatening
factor or risk to the economic prosperity of Indonesia.
For that purpose, we need to improve the quality of
policies, strengthen the bureaucratic institutions and
be able to anticipate changes that may occur through
flexible policies and instruments.
Nowadays, even though the global economic and
Eurozone conditions have begun to improve, in
order to restore the global economic condition to the
condition before the crisis, a solid recovery needs to be
conducted and powerful implementation is necessary
for 4 (four) pillars, namely: (1) continuing financial
sector reform; (2) Reducing fiscal risks; (3) Improving
the smooth flow of credit and banking intermediary
functions and (4) Overcoming the challenges of capital
flow volatility.
BibliographyBank of Indonesia, Perkembangan Ekonomi, Keuangan
menghambat masuknya investasi. Kesinambungan
fiskal dan kredibilitas Pemerintah yang disertai
dengan kebijakan konsolidasi fiskal yang realistis
merupakan faktor penting dalam meredam gejolak
dan rambatan di pasar keuangan. Dampak krisis juga
dapat diminimalisir dengan respon internasional yang
cepat sebagaimana yang terjadi dalam krisis Yunani.
Belajar dari krisis ekonomi dunia saat ini dan krisis
ekonomi Indonesia tahun 1997–1998, maka
perekonomian Indonesia harus terus dibangun
dengan bertumpu pada sumber-sumber pertumbuhan
domestik dan berbasis kewilayahan. Globalisasi harus
dapat dimanfaatkan dan dikelola sehingga tidak
menjadi faktor ancaman dan risiko bagi kesejahteraan
ekonomi Indonesia. Untuk itu, kita perlu memperbaiki
kualitas kebijakan, memperkuat institusi birokrasi dan
mampu mengantisipasi perubahan yang mungkin
terjadi dengan fleksibilitas kebijakan dan instrumen.
Saat ini, meskipun kondisi perekonomian global
dan Eurozone sudah mulai membaik, namun untuk
mengembalikan kondisi ekonomi global kepada
kondisi sebelum krisis perlu dilakukan recovery
yang solid dan perlu implementasi yang kuat atas
4 (empat) pilar yaitu: (1) melanjutkan reformasi
sektor keuangan; (2) Mengurangi risiko fiskal ; (3)
Meningkatkan kelancaran aliran kredit dan fungsi
intermediary perbankan dan (4) Mengatasi tantangan
volatilitas aliran modal.
Daftar PustakaBank Indonesia, Perkembangan Ekonomi, Keuangan
dan Kerjasama Internasional Triwulan I 2010.
DAMPAK KRISIS YUNANI TERHADAP PEREKONOMIAN INDONESIA | THE IMPACT OF THE GREEK CRISIS ON THE INDONESIAN ECONOMY

232 THE INDONESIANBUDGET OVERVIEW 2010
dan Kerjasama Internasional Triwulan I 2010.
Departemen Keuangan RI, Nota Keuangan dan
Rancangan Anggaran Pendapatan dan Belanja Negara
Tahun Anggaran 1999/2000.
Pidato Presiden tentang Penyampaian Nota Keuangan
dan RAPBN Tahun Anggaran 2011.
Pemerintah RI, Nota Keuangan dan Anggaran
Pendapatan dan Belanja Negara Perubahan Tahun
Anggaran 2009.
M. Chatib Basri, CGI, Utang dan Kesinambungan
Fiskal, Kompas 24 Januari 2005.
Pemerintah RI, Mengatasi Dampak Krisis Global
Melalui Program Stimulus Fiskal APBN 2009.
Pemerintah RI, Nota Keuangan dan Anggaran
Pendapatan dan Belanja Negara Tahun Anggaran
2010.
DAMPAK KRISIS YUNANI TERHADAP PEREKONOMIAN INDONESIA | THE IMPACT OF THE GREEK CRISIS ON THE INDONESIAN ECONOMY


235THE INDONESIANBUDGET OVERVIEW 2010
DET
AIL
S O
F TH
E LI
NE
MIN
ISTR
IES/
AG
ENCI
ES B
UD
GET
OF
2010
BY F
UN
CTIO
NS
AN
D S
UB-
FUN
CTIO
NS
in t
hous
ands
of
rupi
ah
FUN
CTI
ON
S A
ND
SU
B-FU
NC
TIO
NS
PERS
ON
NEL
EX
PEN
-D
ITU
RES
GO
OD
S EX
PEN
DI-
TURE
S C
API
TAL
EXPE
ND
I-TU
RES
SO
CIA
L A
SSIS
T-A
NC
ESTO
TAL
01
GEN
ERA
L SE
RVIC
E 7
0,62
3,21
1,42
9 3
1,27
3,31
9,58
3 8
,012
,737
,962
3
16,8
44,3
52
110
,226
,113
,326
0
1.01
EX
ECU
TIV
E A
ND
LEG
ISLA
TIV
E, F
INA
NC
IAL
AN
D F
ISC
AL
MA
TTER
, AN
D IN
TERN
ATI
ON
AL
AFF
AIR
S 7
0,60
9,45
1,52
4 2
9,55
3,21
9,52
8 5
,993
,457
,305
5
,741
,045
1
06,1
61,8
69,4
02
0
1.03
GEN
ERA
L SE
RVIC
E -
7
0,63
1,61
1 4
45,7
04,3
89
-
516
,336
,000
0
1.04
BA
SIC
RES
EARC
H A
ND
DEV
ELO
PMEN
T O
F SC
IEN
CE
AN
D T
ECH
NO
LOG
Y
13,
759,
905
1,0
32,4
93,5
29
467
,152
,240
4
7,00
0 1
,513
,452
,674
0
1.06
REG
ION
AL
DEV
ELO
PMEN
T -
5
24,2
20,7
40
540
,904
,210
1
9,00
0,00
0 1
,084
,124
,950
0
1.90
OTH
ER G
ENER
AL
SERV
ICES
-
9
2,75
4,17
5 5
65,5
19,8
18
292
,056
,307
9
50,3
30,3
00
02
D
EFEN
CE
20,
269,
995
8,9
61,2
94,2
62
11,
986,
656,
279
-
20,
968,
220,
536
0
2.01
STA
TE D
EFEN
SE
12,
984,
054
8,7
16,6
22,2
00
4,7
78,4
50,0
04
-
13,
508,
056,
258
0
2.02
DEF
ENSE
SU
PPO
RT
-
166
,443
,852
7
,094
,677
,190
-
7
,261
,121
,042
0
2.03
FO
REIG
N M
ILIT
ARY
ASS
ISTA
NC
E 3
,825
,649
3
7,89
6,41
1 -
-
4
1,72
2,06
0
0
2.04
DEF
ENSE
RES
EARC
H A
ND
DEV
ELO
PMEN
T 7
31,4
92
20,
519,
599
107
,898
,485
-
1
29,1
49,5
76
0
2.90
OTH
ER D
EFEN
SE
2,7
28,8
00
19,
812,
200
5,6
30,6
00
-
28,
171,
600
03
ORD
ER A
ND
SEC
URI
TY
-
8,3
81,0
72,9
18
6,5
44,9
59,3
66
-
14,
926,
032,
284
0
3.01
PO
LIC
E D
EPA
RTM
ENT
-
5,7
60,7
88,4
25
4,4
04,4
48,1
36
-
10,
165,
236,
561
0
3.02
DIS
AST
ER M
AN
AG
EMEN
T -
6
,796
,196
3
41,6
06,1
04
-
348
,402
,300
0
3.03
LEG
AL
DEV
ELO
PMEN
T -
2
,613
,488
,297
1
,798
,905
,126
-
4
,412
,393
,423
04
EC
ON
OM
Y
570
,727
,143
1
7,83
0,77
6,91
7 3
5,50
1,44
4,76
3 3
,455
,876
,974
5
7,35
8,82
5,79
7
0
4.01
TRA
DE,
DEV
ELO
PMEN
T O
F BU
SIN
ESS,
CO
OP-
ERA
TIV
E A
ND
SM
E 1
80,9
63,7
43
1,1
16,8
73,7
63
85,
939,
428
191
,757
,428
1
,575
,534
,362
0
4.02
MA
NPO
WER
-
1
,134
,972
,129
2
27,8
14,7
33
7,3
87,9
25
1,3
70,1
74,7
87
0
4.03
AG
RIC
ULT
URE
, FO
REST
RY, F
ISH
ERY
AN
D
MA
RIN
E 2
4,60
0 4
,610
,892
,828
1
,256
,399
,425
3
,248
,080
,061
9
,115
,396
,914
FUN
CTIO
NS
AN
D S
UB-
FUN
CTIO
NS
PERS
ON
NEL
EX-
PEN
DIT
URE
SG
OO
DS
EXPE
ND
I-TU
RES
CAPI
TAL
EXPE
ND
I-TU
RES
SOCI
AL
ASS
IS-
TAN
CES
TOTA
L

236 THE INDONESIANBUDGET OVERVIEW 2010
0
4.04
IRR
IGA
TIO
N
-
1,1
87,2
19,3
67
4,3
29,0
88,4
55
-
5,5
16,3
07,8
22
0
4.05
FU
EL A
ND
EN
ERG
Y
19,
478,
500
299
,017
,622
3
,470
,534
,814
-
3
,789
,030
,936
0
4.06
MIN
ING
1
65,2
00,0
00
1,6
96,9
59,0
41
698
,936
,255
-
2
,561
,095
,296
0
4.07
IN
DU
STRY
AN
D C
ON
STRU
CTI
ON
1
97,7
41,1
59
1,2
52,8
27,5
63
167
,807
,332
6
,000
,000
1
,624
,376
,054
0
4.08
TRA
NSP
ORT
ATI
ON
-
4
,209
,321
,754
2
4,97
6,87
3,13
9 -
2
9,18
6,19
4,89
3
0
4.09
TEL
ECO
MM
UN
ICA
TIO
N
4,9
80,0
41
2,0
55,2
37,9
57
285
,108
,514
2
,651
,560
2
,347
,978
,072
0
4.90
OTH
ER E
CO
NO
MY
2
,339
,100
2
67,4
54,8
93
2,9
42,6
68
-
272
,736
,661
05
E
NV
IRO
NM
ENT
45,
991,
000
3,9
46,4
89,6
00
3,8
90,3
15,3
03
6,4
32,5
00
7,8
89,2
28,4
03
0
5.01
WA
STE
MA
NA
GEM
ENT
-
43,
282,
040
460
,087
,960
-
5
03,3
70,0
00
0
5.03
PO
LLU
TIO
N M
AN
AG
EMEN
T -
1
47,9
89,8
86
6,9
54,9
70
-
154
,944
,856
0
5.04
NA
TURA
L RE
SOU
RCE
CO
NSE
RVA
TIO
N
45,
991,
000
1,9
53,0
04,4
10
2,7
40,9
30,2
53
6,4
32,5
00
4,7
46,3
58,1
63
0
5.05
SPA
TIA
L A
ND
LA
ND
-
1
,630
,567
,380
6
52,4
33,1
71
-
2,2
83,0
00,5
51
0
5.90
OTH
ER E
NV
IRO
NM
ENT
-
171
,645
,884
2
9,90
8,94
9 -
2
01,5
54,8
33
06
H
OU
SIN
G A
ND
PU
BLIC
FA
CIL
ITY
-
4
,729
,648
,366
4
,691
,771
,171
1
1,48
5,20
5,29
9 2
0,90
6,62
4,83
6
0
6.01
HO
USI
NG
DEV
ELO
PMEN
T -
3
34,6
64,8
51
1,0
65,3
73,5
73
-
1,4
00,0
38,4
24
0
6.02
EM
POW
ERM
ENT
OF
RESI
DEN
TIA
L C
OM
MU
-N
ITY
-
1
,070
,602
,067
4
09,6
53,7
55
1,7
46,1
98,5
00
3,2
26,4
54,3
22
0
6.03
PRO
VIS
ION
OF
DRI
NK
ING
WA
TER
-
506
,346
,489
2
,498
,299
,211
2
61,4
08,0
00
3,2
66,0
53,7
00
0
6.90
OTH
ER H
OU
SIN
G A
ND
PU
BLIC
FA
CIL
ITY
-
2
,818
,034
,959
7
18,4
44,6
32
9,4
77,5
98,7
99
13,
014,
078,
390
07
HEA
LTH
1
,107
,704
,271
8
,459
,988
,026
2
,819
,923
,189
5
,614
,214
,436
1
8,00
1,82
9,92
2
0
7.01
MED
ICIN
E A
ND
HEA
LTH
SU
PPLI
ES
-
1,2
23,6
88,8
94
155
,206
,642
-
1
,378
,895
,536
0
7.02
IN
DIV
IDU
AL
HEA
LTH
SER
VIC
E 1
,087
,910
,527
4
,075
,844
,396
1
,835
,470
,627
4
,003
,352
,715
1
1,00
2,57
8,26
5
0
7.03
PU
BLIC
HEA
LTH
SER
VIC
E 1
9,79
3,74
4 1
,209
,366
,733
4
73,4
53,6
75
1,6
09,0
84,0
81
3,3
11,6
98,2
33
0
7.04
PO
PULA
TIO
N A
ND
FA
MILY
PLA
NN
ING
-
6
90,4
58,9
37
1,4
67,5
63
-
691
,926
,500
0
7.05
HEA
LTH
RES
EARC
H A
ND
DEV
ELO
PMEN
T -
1
26,5
71,6
69
33,
700,
171
-
160
,271
,840
0
7.90
OTH
ER H
EALT
H
-
1,1
34,0
57,3
97
320
,624
,511
1
,777
,640
1
,456
,459
,548
08
T
OU
RISM
AN
D C
ULT
URE
-
1
,285
,050
,320
8
8,52
1,83
6 4
2,49
3,92
1 1
,416
,066
,077
0
8.01
DEV
ELO
PMEN
T O
F TO
URI
SM A
ND
CU
LTU
RE
-
779
,726
,394
7
9,47
5,22
5 1
4,16
0,00
0 8
73,3
61,6
19
0
8.02
DEV
ELO
PMEN
T O
F Y
OU
TH A
ND
SPO
RT
-
6,4
60,0
00
-
-
6,4
60,0
00
FUN
CTIO
NS
AN
D S
UB-
FUN
CTIO
NS
PERS
ON
NEL
EX-
PEN
DIT
URE
SG
OO
DS
EXPE
ND
I-TU
RES
CAPI
TAL
EXPE
ND
I-TU
RES
SOCI
AL
ASS
IS-
TAN
CES
TOTA
L

237THE INDONESIANBUDGET OVERVIEW 2010
0
8.03
DEV
ELO
PMEN
T O
F PU
BLIS
HIN
G A
ND
BRO
AD
-C
AST
ING
-
1
18,4
36,6
47
8,8
58,8
90
28,
333,
921
155
,629
,458
0
8.05
DEV
ELO
PMEN
T O
F S
UPE
RIO
R SP
ORT
S -
3
80,4
27,2
79
187
,721
-
3
80,6
15,0
00
09
R
ELIG
ION
-
5
44,8
37,6
92
125
,708
,923
2
42,5
29,0
85
913
,075
,700
0
9.01
EN
HA
NC
EMEN
T O
F RE
LIG
IOU
S LI
FE
-
496
,269
,142
1
19,1
94,6
33
194
,471
,225
8
09,9
35,0
00
0
9.02
REL
IGIO
US
LIFE
HA
RMO
NY
-
1
6,50
2,48
8 4
,769
,652
9
,227
,860
3
0,50
0,00
0
0
9.03
REL
IGIO
N R
ESEA
RCH
AN
D D
EVEL
OPM
ENT
-
30,
209,
062
1,6
44,6
38
1,1
80,0
00
33,
033,
700
0
9.90
OTH
ER R
ELIG
IOU
S SE
RVIC
E -
1
,857
,000
1
00,0
00
37,
650,
000
39,
607,
000
10
E
DU
CA
TIO
N
17,
662,
088,
903
20,
015,
428,
562
8,4
17,3
17,9
71
37,
991,
653,
086
84,
086,
488,
522
1
0.01
EA
RLY
AG
E ED
UC
ATI
ON
-
3
17,5
42,0
17
618
,500
8
12,0
42,6
83
1,1
30,2
03,2
00
1
0.02
ELE
MEN
TARY
ED
UC
ATI
ON
2
5,52
3,32
6 2
,431
,716
,586
7
73,3
65,3
76
28,
336,
516,
692
31,
567,
121,
980
1
0.03
SEC
ON
DA
RY E
DU
CA
TIO
N
69,
078,
281
1,0
41,9
02,1
83
408
,111
,678
4
,046
,807
,621
5
,565
,899
,763
1
0.04
NO
N-F
ORM
AL
AN
D IN
FORM
AL
EDU
CA
TIO
N
37,
787,
621
369
,709
,816
4
1,45
8,98
6 6
06,9
54,6
03
1,0
55,9
11,0
26
1
0.05
SER
VIC
E ED
UC
ATI
ON
2
16,8
00
175
,407
,044
1
5,76
0,55
6 1
,068
,500
1
92,4
52,9
00
1
0.06
HIG
HER
ED
UC
ATI
ON
6
,435
,587
,619
1
0,24
3,54
8,64
4 6
,683
,237
,421
1
,371
,889
,512
2
4,73
4,26
3,19
6
1
0.07
ASS
ISTA
NC
E SE
RVIC
E TO
ED
UC
ATI
ON
1
1,07
4,88
8,27
6 3
,930
,011
,364
2
41,7
90,8
54
2,4
62,8
71,1
50
17,
709,
561,
644
1
0.08
REL
IGIO
US
EDU
CA
TIO
N
-
305
,527
,386
1
6,13
2,53
1 2
18,0
68,8
16
539
,728
,733
1
0.09
ED
UC
ATI
ON
RES
EARC
H A
ND
DEV
ELO
PMEN
T 1
9,00
6,98
0 4
39,4
89,0
09
3,6
27,2
82
135
,433
,509
5
97,5
56,7
80
1
0.10
DEV
ELO
PMEN
T O
F Y
OU
TH A
ND
SPO
RT
-
760
,574
,513
2
33,2
14,7
87
-
993
,789
,300
11
S
OC
IAL
PRO
TEC
TIO
N
-
1,2
24,4
78,6
45
96,
181,
631
2,1
35,9
96,7
10
3,4
56,6
56,9
86
1
1.04
SO
CIA
L PR
OTE
CTI
ON
AN
D S
ERV
ICE
FOR
CH
IL-
DRE
N A
ND
FA
MILY
-
2
81,8
87,3
07
1,3
69,7
62
475
,399
,872
7
58,6
56,9
41
1
1.05
WO
MEN
EM
POW
ERM
ENT
-
81,
536,
651
339
,607
1
0,69
0,75
0 9
2,56
7,00
8
1
1.06
SO
CIA
L G
UID
AN
CE
AN
D C
OU
NSE
LIN
G
-
224
,539
,799
2
6,75
5,36
2 3
07,8
12,9
39
559
,108
,100
1
1.08
SO
CIA
L A
SSIS
TAN
CE
AN
D S
ECU
RITY
-
4
59,9
18,9
01
47,
747,
050
1,3
20,2
88,1
49
1,8
27,9
54,1
00
1
1.09
SO
CIA
L PR
OTE
CTI
ON
RES
EARC
H A
ND
DEV
EL-
OPM
ENT
-
72,
937,
144
7,9
01,9
80
504
,000
8
1,34
3,12
4
1
1.90
OTH
ER S
OC
IAL
PRO
TEC
TIO
N
-
103
,658
,843
1
2,06
7,87
0 2
1,30
1,00
0 1
37,0
27,7
13
T O
T A
L
90,
029,
992,
741
106
,652
,384
,891
8
2,17
5,53
8,39
4 6
1,29
1,24
6,36
3 3
40,1
49,1
62,3
89
FUN
CTIO
NS
AN
D S
UB-
FUN
CTIO
NS
PERS
ON
NEL
EX-
PEN
DIT
URE
SG
OO
DS
EXPE
ND
I-TU
RES
CAPI
TAL
EXPE
ND
I-TU
RES
SOCI
AL
ASS
IS-
TAN
CES
TOTA
L
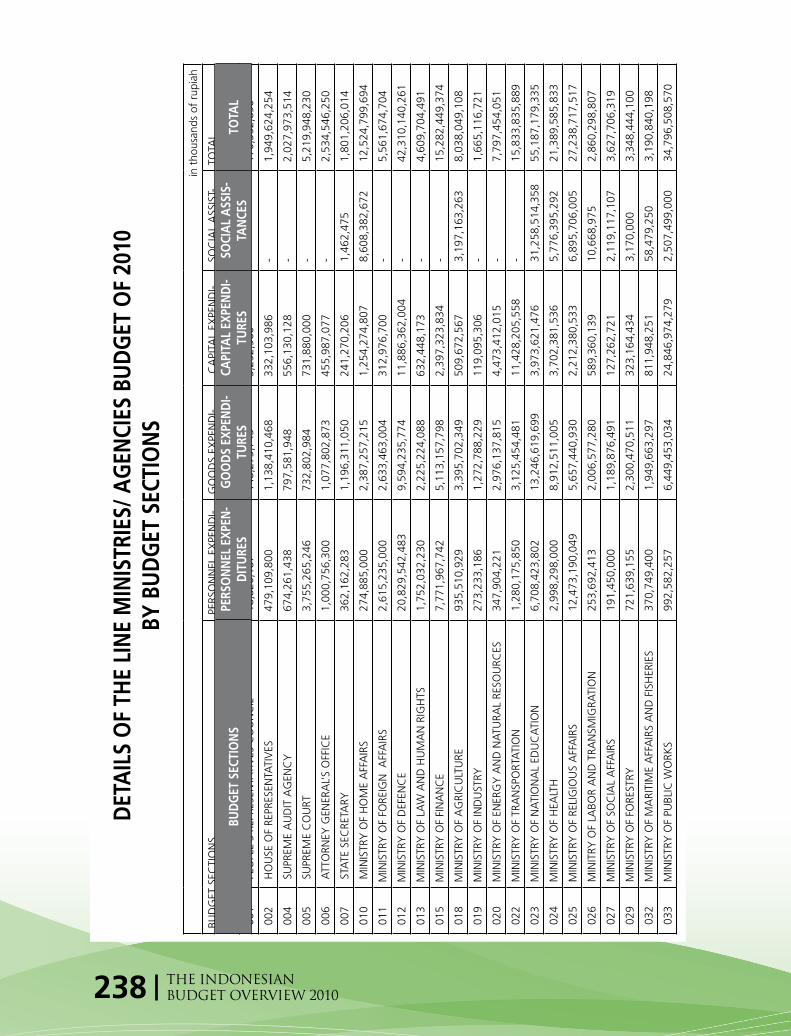
238 THE INDONESIANBUDGET OVERVIEW 2010
in t
hous
ands
of
rupi
ah
BUD
GET
SEC
TIO
NS
PERS
ON
NEL
EX
PEN
DI-
TURE
SG
OO
DS
EXPE
ND
I-TU
RES
CA
PITA
L EX
PEN
DI-
TURE
S S
OC
IAL
ASS
IST-
AN
CES
TOTA
L
001
P
EOPL
E’S
REPR
ESEN
TATI
VES
CO
UN
CIL
1
8,82
6,18
7 1
48,2
73,7
43
3,2
52,9
60
-
170
,352
,890
002
H
OU
SE O
F RE
PRES
ENTA
TIV
ES
479
,109
,800
1
,138
,410
,468
3
32,1
03,9
86
-
1,9
49,6
24,2
54
004
S
UPR
EME
AU
DIT
AG
ENC
Y
674
,261
,438
7
97,5
81,9
48
556
,130
,128
-
2
,027
,973
,514
005
S
UPR
EME
CO
URT
3
,755
,265
,246
7
32,8
02,9
84
731
,880
,000
-
5
,219
,948
,230
006
A
TTO
RNEY
GEN
ERA
L’S
OFF
ICE
1,0
00,7
56,3
00
1,0
77,8
02,8
73
455
,987
,077
-
2
,534
,546
,250
007
S
TATE
SEC
RETA
RY
362
,162
,283
1
,196
,311
,050
2
41,2
70,2
06
1,4
62,4
75
1,8
01,2
06,0
14
010
M
INIS
TRY
OF
HO
ME
AFF
AIR
S 2
74,8
85,0
00
2,3
87,2
57,2
15
1,2
54,2
74,8
07
8,6
08,3
82,6
72
12,
524,
799,
694
011
M
INIS
TRY
OF
FORE
IGN
AFF
AIR
S 2
,615
,235
,000
2
,633
,463
,004
3
12,9
76,7
00
-
5,5
61,6
74,7
04
012
M
INIS
TRY
OF
DEF
ENC
E 2
0,82
9,54
2,48
3 9
,594
,235
,774
1
1,88
6,36
2,00
4 -
4
2,31
0,14
0,26
1
013
M
INIS
TRY
OF
LAW
AN
D H
UM
AN
RIG
HTS
1,7
52,0
32,2
30
2,2
25,2
24,0
88
632
,448
,173
-
4
,609
,704
,491
015
M
INIS
TRY
OF
FIN
AN
CE
7,7
71,9
67,7
42
5,1
13,1
57,7
98
2,3
97,3
23,8
34
-
15,
282,
449,
374
018
M
INIS
TRY
OF
AG
RIC
ULT
URE
935
,510
,929
3
,395
,702
,349
5
09,6
72,5
67
3,1
97,1
63,2
63
8,0
38,0
49,1
08
019
M
INIS
TRY
OF
IND
UST
RY 2
73,2
33,1
86
1,2
72,7
88,2
29
119
,095
,306
-
1
,665
,116
,721
020
M
INIS
TRY
OF
ENER
GY
AN
D N
ATU
RAL
RESO
URC
ES 3
47,9
04,2
21
2,9
76,1
37,8
15
4,4
73,4
12,0
15
-
7,7
97,4
54,0
51
022
M
INIS
TRY
OF
TRA
NSP
ORT
ATI
ON
1,2
80,1
75,8
50
3,1
25,4
54,4
81
11,
428,
205,
558
-
15,
833,
835,
889
023
M
INIS
TRY
OF
NA
TIO
NA
L ED
UC
ATI
ON
6,7
08,4
23,8
02
13,
246,
619,
699
3,9
73,6
21,4
76
31,
258,
514,
358
55,
187,
179,
335
024
M
INIS
TRY
OF
HEA
LTH
2,9
98,2
98,0
00
8,9
12,5
11,0
05
3,7
02,3
81,5
36
5,7
76,3
95,2
92
21,
389,
585,
833
025
M
INIS
TRY
OF
RELI
GIO
US
AFF
AIR
S 1
2,47
3,19
0,04
9 5
,657
,440
,930
2
,212
,380
,533
6
,895
,706
,005
2
7,23
8,71
7,51
7
026
M
INIT
RY O
F LA
BOR
AN
D T
RAN
SMIG
RATI
ON
253
,692
,413
2
,006
,577
,280
5
89,3
60,1
39
10,
668,
975
2,8
60,2
98,8
07
027
M
INIS
TRY
OF
SOC
IAL
AFF
AIR
S 1
91,4
50,0
00
1,1
89,8
76,4
91
127
,262
,721
2
,119
,117
,107
3
,627
,706
,319
029
M
INIS
TRY
OF
FORE
STRY
721
,639
,155
2
,300
,470
,511
3
23,1
64,4
34
3,1
70,0
00
3,3
48,4
44,1
00
032
M
INIS
TRY
OF
MA
RITI
ME
AFF
AIR
S A
ND
FIS
HER
IES
370
,749
,400
1
,949
,663
,297
8
11,9
48,2
51
58,
479,
250
3,1
90,8
40,1
98
033
M
INIS
TRY
OF
PUBL
IC W
ORK
S 9
92,5
82,2
57
6,4
49,4
53,0
34
24,
846,
974,
279
2,5
07,4
99,0
00
34,
796,
508,
570
DET
AIL
S O
F TH
E LI
NE
MIN
ISTR
IES/
AG
ENCI
ES B
UD
GET
OF
2010
BY
BU
DG
ET S
ECTI
ON
S
BUD
GET
SEC
TIO
NS
PERS
ON
NEL
EXP
EN-
DIT
URE
SG
OO
DS
EXPE
ND
I-TU
RES
CAPI
TAL
EXPE
ND
I-TU
RES
SOCI
AL
ASS
IS-
TAN
CES
TOTA
L

239THE INDONESIANBUDGET OVERVIEW 2010
034
C
OO
RDIN
ATI
NG
MIN
ISTR
Y F
OR
LEG
AL,
PO
LITI
CA
L,
AN
D S
ECU
RITY
AFF
AIR
S 1
9,60
4,57
1 1
27,5
83,8
83
61,
659,
096
-
208
,847
,550
035
C
OO
RDIN
ATI
NG
MIN
ISTR
Y F
OR
THE
ECO
NO
MY
10,
000,
000
96,
985,
492
4,4
17,9
31
-
111
,403
,423
036
C
OO
RDIN
ATI
NG
MIN
ISTR
Y O
F PE
OPL
E’S
WEL
FARE
14,
511,
895
78,
754,
441
7,9
01,9
80
-
101
,168
,316
040
M
INIS
TRY
OF
CU
LTU
RE A
ND
TO
URI
SM 2
40,7
14,0
84
1,0
55,9
48,4
00
305
,742
,095
1
4,16
0,00
0 1
,616
,564
,579
041
ST
ATE
MIN
ISTR
Y F
OR
STA
TE O
WN
ED E
NTE
RPRI
SES
19,
000,
000
86,
065,
926
9,1
37,1
84
-
114
,203
,110
042
ST
ATE
MIN
ISTR
Y F
OR
RESE
ARC
H A
ND
TEC
HN
OLO
GY
29,
121,
137
274
,411
,787
3
31,9
81,1
45
-
635
,514
,069
043
ST
ATE
MIN
ISTR
Y F
OR
ENV
IRO
NM
ENTA
L PR
OTE
CTI
ON
42,
208,
871
348
,725
,903
1
3,44
1,14
4 -
4
04,3
75,9
18
044
ST
ATE
MIN
STRY
CO
OPE
RATI
VES
AN
D S
MA
LL A
ND
M
EDIU
M E
NTE
RPRI
SES
51,
118,
900
478
,841
,152
1
8,18
8,16
5 1
85,7
57,4
28
733
,905
,645
047
ST
ATE
MIN
ISTR
Y F
OR
WO
MEN
’S E
MPO
WER
MEN
T 1
1,64
7,94
9 1
19,5
55,2
11
2,3
01,3
46
-
133
,504
,506
048
ST
ATE
MIN
ISTR
Y F
OR
AD
MIN
ISTR
ATI
VE
REFO
RM 1
8,04
0,44
1 1
03,1
84,1
63
2,5
26,4
87
-
123
,751
,091
050
ST
ATE
INTE
LLIG
ENC
E A
GEN
CY
65,
252,
520
729
,520
,125
1
91,0
93,3
75
-
985
,866
,020
051
ST
ATE
CO
DES
AG
ENC
Y 3
8,72
4,09
7 6
8,09
5,57
4 3
93,0
09,7
68
-
499
,829
,439
052
N
ATI
ON
AL
DEF
ENC
E BO
ARD
6,2
32,5
90
21,
134,
030
2,8
02,5
90
-
30,
169,
210
054
C
ENTR
AL
BURE
AU
OF
STA
TIST
ICS
611
,376
,800
4
,090
,307
,926
3
47,3
63,4
94
-
5,0
49,0
48,2
20
055
M
INIS
TRY
OF
NA
TIO
NA
L D
EVEL
OPM
ENT
PLA
NN
ING
/ BA
PPEN
AS
42,
814,
190
501
,845
,987
1
3,65
1,39
3 -
5
58,3
11,5
70
056
N
ATI
ON
AL
LAN
D A
FFA
IRS
AG
ENC
Y 9
86,4
11,1
06
1,5
20,4
55,2
45
437
,751
,695
-
2
,944
,618
,046
057
N
ATI
ON
AL
LIBR
ARY
32,
814,
200
248
,885
,031
6
1,85
4,66
2 -
3
43,5
53,8
93
059
M
INIS
TRY
OF
CO
MM
UN
ICA
TIO
N A
ND
INFO
RMA
TIO
N 1
73,7
60,8
67
2,3
10,8
48,3
24
296
,379
,321
3
0,98
5,48
1 2
,811
,973
,993
060
IN
DO
NES
IAN
NA
TIO
NA
L PO
LIC
E 1
7,69
0,96
1,56
4 5
,817
,047
,933
3
,686
,943
,614
-
2
7,19
4,95
3,11
1
063
N
ATI
ON
AL
AG
ENC
Y O
F FO
OD
AN
D D
RUG
CO
NTR
OL
156
,502
,626
3
16,3
33,8
87
154
,892
,917
-
6
27,7
29,4
30
064
N
ATI
ON
AL
DEF
ENC
E A
GEN
CY
23,
098,
080
84,
858,
197
97,
570,
637
3,0
20,0
00
208
,546
,914
065
C
API
TAL
INV
ESTM
ENT
CO
ORD
INA
TIN
G A
GEN
CY
3
2,99
6,74
7 2
96,9
06,1
19
35,
064,
844
-
364
,967
,710
066
N
ATI
ON
AL
NA
RCO
TIC
S A
GEN
CY
1
1,73
0,00
0 2
03,8
79,9
35
131
,261
,615
-
3
46,8
71,5
50
067
ST
ATE
MIN
ISTR
Y F
OR
AC
CEL
ERA
TIO
N O
F D
EVEL
OP-
MEN
T IN
BA
CK
WA
RDS
REG
ION
S 7
,081
,609
3
51,4
03,0
31
165
,495
,276
4
03,1
83,3
84
927
,163
,300
BUD
GET
SEC
TIO
NS
PERS
ON
NEL
EXP
EN-
DIT
URE
SG
OO
DS
EXPE
ND
I-TU
RES
CAPI
TAL
EXPE
ND
I-TU
RES
SOCI
AL
ASS
IS-
TAN
CES
TOTA
L

240 THE INDONESIANBUDGET OVERVIEW 2010
068
N
ATI
ON
AL
FAM
ILY P
LAN
NIN
G C
OO
RDIN
ATI
NG
BO
ARD
174
,458
,000
1
,042
,244
,236
1
7,30
0,96
4 -
1
,234
,003
,200
074
N
ATI
ON
AL
CO
MM
ISIO
N F
OR
HU
MA
N R
IGH
TS 1
7,08
2,90
9 3
8,75
3,80
8 2
,249
,203
-
5
8,08
5,92
0
075
G
EOPH
YSI
CA
L A
ND
MET
EREO
LOG
ICA
L A
GEN
CY
186
,071
,464
3
52,9
96,1
98
326
,111
,623
-
8
65,1
79,2
85
076
G
ENER
AL
ELEC
TIO
NS
CO
MM
ISSI
ON
2
64,0
19,4
54
594
,688
,585
1
02,7
53,4
17
-
961
,461
,456
077
ST
ATE
CO
NST
ITU
TIO
NA
L C
OU
RT
9,6
14,6
70
147
,591
,736
1
2,29
0,20
0 -
1
69,4
96,6
06
078
IN
DO
NES
IAN
FIN
AN
CIA
L TR
AN
SAC
TIO
N R
EPO
RTS
AN
D A
NA
LYSI
S C
ENTE
R 2
4,10
4,16
8 4
9,82
4,22
8 3
9,98
4,51
2 -
1
13,9
12,9
08
079
IN
DO
NES
IAN
INST
ITU
TE O
F SC
IEN
CES
209
,279
,998
2
61,7
78,0
06
25,
123,
080
-
496
,181
,084
080
N
ATI
ON
AL
ATO
MIC
EN
ERG
Y A
GEN
CY
194
,956
,133
1
58,2
31,8
81
53,
610,
815
-
406
,798
,829
081
A
GEN
CY
FO
R TH
E A
SSES
SMEN
T A
ND
APP
LIC
ATI
ON
O
F TE
CH
NO
LOG
Y 1
46,9
86,9
48
309
,146
,573
7
1,87
2,87
6 6
,000
,000
5
34,0
06,3
97
082
N
ATI
ON
AL
SPA
CE
AN
D A
VIA
TIO
N A
GEN
CY
60,
160,
685
136
,950
,879
3
1,91
9,04
2 -
2
29,0
30,6
06
083
N
ATI
ON
AL
CO
ORD
INA
TIN
G A
GEN
CY
FO
R SU
RVEY
S A
ND
MA
PPIN
G 3
3,72
0,00
0 1
33,6
71,8
01
275
,612
,542
-
4
43,0
04,3
43
084
N
ATI
ON
AL
STA
ND
ARD
IZA
TIO
N A
GEN
CY
9,3
78,9
42
51,
695,
061
523
,300
-
6
1,59
7,30
3
085
N
UC
LEA
R EN
ERG
Y R
EGU
LATO
RY A
GEN
CY
20,
476,
400
34,
089,
613
2,7
25,9
19
-
57,
291,
932
086
ST
ATE
AD
MIN
ISTR
ATI
ON
AG
ENC
Y
32,
944,
348
122
,145
,845
4
0,93
0,74
0 -
1
96,0
20,9
33
087
N
ATI
ON
AL
ARC
HIV
ES 2
6,03
9,16
7 5
5,69
3,09
7 2
2,68
2,64
0 -
1
04,4
14,9
04
088
N
ATI
ON
AL
CIV
IL S
ERV
ICE
AG
ENC
Y 1
57,0
74,7
10
112
,540
,041
1
68,0
36,4
19
-
437
,651
,170
089
D
EVEL
OPM
ENT
FIN
AN
CE
CO
MPT
ROLL
ER 2
90,5
03,9
00
334
,754
,500
1
6,88
0,55
0 -
6
42,1
38,9
50
090
M
INIS
TRY
OF
TRA
DE
211
,732
,436
9
26,7
52,5
29
88,
701,
367
6,0
00,0
00
1,2
33,1
86,3
32
091
ST
ATE
MIN
ISTR
Y F
OR
PUBL
IC H
OU
SIN
G 2
5,50
0,00
0 3
68,7
15,2
59
336
,903
,160
1
73,4
00,0
00
904
,518
,419
092
ST
ATE
MIN
ISTR
Y F
OR
YO
UTH
AN
D S
PORT
AFF
AIR
S 2
2,25
2,00
0 1
,282
,208
,892
2
49,3
98,5
68
-
1,5
53,8
59,4
60
093
C
ORR
UPT
ION
ERA
DIC
ATI
ON
CO
MM
ISSI
ON
165
,996
,849
1
72,8
17,6
33
87,
565,
949
-
426
,380
,431
095
RE
GIO
NA
L RE
PRES
ENTA
TIV
ES’ C
OU
NC
IL 1
35,6
56,8
60
300
,049
,074
3
3,85
3,52
8 -
4
69,5
59,4
62
100
ST
ATE
JU
DIC
IAL
CO
MM
ISSI
ON
6
,283
,934
5
0,93
9,63
8 1
,250
,000
-
5
8,47
3,57
2
103
N
ATI
ON
AL
CO
ORD
INA
TIO
N B
OA
RD F
OR
DIS
AST
ER
MA
NA
GEM
ENT
11,
033,
884
132
,874
,624
5
9,15
3,57
2 1
9,00
0,00
0 2
22,0
62,0
80
BUD
GET
SEC
TIO
NS
PERS
ON
NEL
EXP
EN-
DIT
URE
SG
OO
DS
EXPE
ND
I-TU
RES
CAPI
TAL
EXPE
ND
I-TU
RES
SOCI
AL
ASS
IS-
TAN
CES
TOTA
L

241THE INDONESIANBUDGET OVERVIEW 2010
104
N
ATI
ON
AL
BOA
RD F
OR
PLA
CIN
G A
ND
PRO
TEC
TIN
G
THE
IND
ON
ESIA
N W
ORK
ERS
27,
840,
994
205
,814
,649
1
4,96
3,49
7 4
,900
,000
2
53,5
19,1
40
105
SI
DO
ARJ
O M
UD
DIS
AST
ER M
AN
AG
EMEN
T BO
ARD
(B
PLS)
12,
444,
755
150
,342
,555
1
,045
,487
,977
7
,815
,353
1
,216
,090
,640
106
A
GEN
CY
FO
R G
OV
ERN
MEN
T G
OO
DS/
SERV
ICES
PR
OC
URE
MEN
T PO
LIC
Y
14,
230,
300
87,
328,
296
8,1
90,3
74
466
,320
1
10,2
15,2
90
107
N
ATI
ON
AL
SAR
AG
ENC
Y
90,
719,
000
133
,385
,996
3
41,6
06,1
04
-
565
,711
,100
108
C
OM
MIS
SIO
N F
OR
THE
SUPE
RVIS
ION
OF
BUSI
NES
S C
OM
PETI
TIO
N
32,
812,
018
45,
565,
890
3,9
35,9
92
-
82,
313,
900
T O
T A
L
90,
029,
992,
741
106
,652
,384
,891
8
2,17
5,53
8,39
4 6
1,29
1,24
6,36
3 3
40,1
49,1
62,3
89
BUD
GET
SEC
TIO
NS
PERS
ON
NEL
EXP
EN-
DIT
URE
SG
OO
DS
EXPE
ND
I-TU
RES
CAPI
TAL
EXPE
ND
I-TU
RES
SOCI
AL
ASS
IS-
TAN
CES
TOTA
L

242 THE INDONESIANBUDGET OVERVIEW 2010
in t
hous
ands
of
rupi
ah
BU
DG
ET S
ECTI
ON
S A
ND
PR
OG
RA
MS
PER
SON
NEL
EX
PEN
DI-
TUR
ES
GO
OD
S EX
-PE
ND
ITU
RES
CA
PITA
L EX
-PE
ND
ITU
RES
SO
CIA
L A
S-SI
STA
NC
ESTO
TAL
001
P
EOPL
E’S
CO
NSU
LTA
TIV
E C
OU
NC
IL
18,
826,
187
148
,273
,743
3
,252
,960
-
1
70,3
52,8
90
01.
01.0
1 D
EMO
CRA
CY
INST
ITU
TIO
NA
L EN
FORC
EMEN
T A
ND
IM
PRO
VEM
ENT
PRO
GRA
M
-
109
,155
,400
1
00,0
00
-
109
,255
,400
01.
01.0
9 G
OO
D G
OV
ERN
AN
CE
IMPL
EMEN
TATI
ON
PRO
GRA
M
18,
826,
187
36,
241,
003
-
-
55,
067,
190
01.
01.1
3 A
PPA
RATU
S RE
SOU
RCE
MA
NA
GEM
ENT
PRO
GRA
M
-
2,7
28,0
00
-
-
2,7
28,0
00
01.
01.1
7 S
TATE
APP
ARA
TUS
MEA
NS
AN
D F
AC
ILIT
Y IN
CRE
ASE
PR
OG
RAM
-
1
49,3
40
3,1
52,9
60
-
3,3
02,3
00
002
H
OU
SE O
F RE
PRES
ENTA
TIV
ES
479
,109
,800
1
,138
,410
,468
3
32,1
03,9
86
-
1,9
49,6
24,2
54
01.
01.0
1 D
EMO
CRA
CY
INST
ITU
TIO
NA
L EN
FORC
EMEN
T A
ND
IM
PRO
VEM
ENT
PRO
GRA
M
-
688
,105
,900
-
-
6
88,1
05,9
00
01.
01.0
9 G
OO
D G
OV
ERN
AN
CE
IMPL
EMEN
TATI
ON
PRO
GRA
M
479
,109
,800
3
46,4
34,4
65
9,4
50,2
89
-
834
,994
,554
01.
01.1
0 S
TATE
APP
ARA
TUS
AC
CO
UN
TABI
LITY
AN
D S
UPE
RVIS
ION
IN
CRE
ASE
PRO
GRA
M
-
7,1
84,4
00
564
,000
-
7
,748
,400
01.
01.1
3 A
PPA
RATU
S RE
SOU
RCE
MA
NA
GEM
ENT
PRO
GRA
M
-
6,6
50,4
00
-
-
6,6
50,4
00
01.
01.1
7 S
TATE
APP
ARA
TUS
MEA
NS
AN
D F
AC
ILIT
Y IN
CRE
ASE
PR
OG
RAM
-
9
0,03
5,30
3 3
22,0
89,6
97
-
412
,125
,000
004
S
UPR
EME
AU
DIT
AG
ENC
Y
674
,261
,438
7
97,5
81,9
48
556
,130
,128
-
2
,027
,973
,514
01.
01.0
9 G
OO
D G
OV
ERN
AN
CE
IMPL
EMEN
TATI
ON
PRO
GRA
M
674
,261
,438
2
67,3
10,4
76
-
-
941
,571
,914
01.
01.1
0 S
TATE
APP
ARA
TUS
AC
CO
UN
TABI
LITY
AN
D S
UPE
RVIS
ION
IN
CRE
ASE
PRO
GRA
M
-
375
,901
,900
4
,000
,000
-
3
79,9
01,9
00
01.
01.1
2 A
DM
INIS
TRA
TIO
N A
ND
INST
ITU
TIO
NA
L M
AN
AG
EMEN
T PR
OG
RAM
-
5
1,66
2,00
0 1
,858
,000
-
5
3,52
0,00
0
01.
01.1
3 A
PPA
RATU
S RE
SOU
RCE
MA
NA
GEM
ENT
PRO
GRA
M
-
50,
586,
630
2,3
38,7
70
-
52,
925,
400
01.
01.1
7 S
TATE
APP
ARA
TUS
MEA
NS
AN
D F
AC
ILIT
Y IN
CRE
ASE
PR
OG
RAM
-
4
6,20
5,84
2 5
47,9
33,3
58
-
594
,139
,200
DET
AIL
S O
F TH
E LI
NE
MIN
ISTR
IES/
AG
ENC
IES
OF
2010
BY
BU
DG
ET S
ECTI
ON
S A
ND
PR
OG
RA
MS
BUD
GET
SEC
TIO
NS
AN
D P
ROG
RAM
SPE
RSO
NN
EL
EXPE
ND
I-TU
RES
GO
OD
S EX
-PE
ND
ITU
RES
CAPI
TAL
EX-
PEN
DIT
URE
SSO
CIA
L A
S-SI
STA
NCE
STO
TAL

243THE INDONESIANBUDGET OVERVIEW 2010
BUD
GET
SEC
TIO
NS
AN
D P
ROG
RAM
SPE
RSO
NN
EL
EXPE
ND
I-TU
RES
GO
OD
S EX
-PE
ND
ITU
RES
CAPI
TAL
EX-
PEN
DIT
URE
SSO
CIA
L A
S-SI
STA
NCE
STO
TAL
01.
01.2
0 S
TATE
FIN
AN
CIA
L SE
CU
RITY
AN
D R
EVEN
UE
INC
RASE
PR
OG
RAM
-
1
,950
,000
-
-
1
,950
,000
01.
01.2
2 ST
ATE
FIN
AN
CIA
L A
CC
OU
NTA
NC
Y F
OU
ND
ING
PRO
-G
RAM
-
3
,965
,100
-
-
3
,965
,100
005
S
UPR
EME
CO
URT
3
,755
,265
,246
7
32,8
02,9
84
731
,880
,000
-
5
,219
,948
,230
01.
01.0
9 G
OO
D G
OV
ERN
AN
CE
IMPL
EMEN
TATI
ON
PRO
GRA
M
3,7
55,2
65,2
46
512
,591
,284
-
-
4
,267
,856
,530
01.
01.1
0 S
TATE
APP
ARA
TUS
AC
CO
UN
TABI
LITY
AN
D S
UPE
RVIS
ION
IN
CRE
ASE
PRO
GRA
M
-
15,
011,
700
-
-
15,
011,
700
01.
01.1
3 A
PPA
RATU
S RE
SOU
RCE
MA
NA
GEM
ENT
PRO
GRA
M
-
7,2
00,0
00
-
-
7,2
00,0
00
03.
03.0
1 L
AW
PLA
NN
ING
PRO
GRA
M
-
5,0
00,0
00
-
-
5,0
00,0
00
03.
03.0
2 L
AW
EST
ABL
ISH
MEN
T PR
OG
RAM
-
2
,000
,000
-
-
2
,000
,000
03.
03.0
3 H
UM
AN
RIG
HTS
AN
D L
AW
AW
ARE
NES
S IN
CRE
ASE
PR
OG
RAM
-
1
,000
,000
-
-
1
,000
,000
03.
03.0
4 L
AW
ASS
ISTA
NC
E A
ND
SER
VIC
E IN
CRE
ASE
PRO
GRA
M
-
42,
681,
000
-
-
42,
681,
000
03.
03.0
5 P
ERFO
RMA
NC
E IN
CRE
ASE
PRO
GRA
M O
F C
OU
RT IN
STI-
TUTI
ON
S A
ND
OTH
ER L
AW
EN
FORC
MEN
T IN
STIT
UTI
ON
S
-
-
731
,880
,000
-
7
31,8
80,0
00
03.
03.0
6 H
UM
AN
RIG
HTS
AN
D L
AW
EN
FORC
EMEN
T PR
OG
RAM
-
1
15,8
19,0
00
-
-
115
,819
,000
03.
03.0
7 Q
UA
LITY
INC
REA
SE P
ROG
RAM
FO
R LA
W P
ROFE
SSIO
N
-
31,
000,
000
-
-
31,
000,
000
11.
05.0
1 C
HIL
DRE
N A
ND
GEN
DER
MA
INST
REA
MIN
G IN
STIT
U-
TIO
NA
L RE
INFO
RCEM
ENT
PRO
GRA
M
-
500
,000
-
-
5
00,0
00
006
A
TTO
RNEY
GEN
ERA
L’S
OFF
ICE
1,0
00,7
56,3
00
1,0
77,8
02,8
73
455
,987
,077
-
2
,534
,546
,250
01.
01.0
9 G
OO
D G
OV
ERN
AN
CE
IMPL
EMEN
TATI
ON
PRO
GRA
M
1,0
00,7
56,3
00
421
,862
,746
9
78,9
04
-
1,4
23,5
97,9
50
03.
03.0
1 L
AW
PLA
NN
ING
PRO
GRA
M
-
2,0
00,0
00
-
-
2,0
00,0
00
03.
03.0
3 H
UM
AN
RIG
HTS
AN
D L
AW
AW
ARE
NES
S IN
CRE
ASE
PR
OG
RAM
-
1
1,00
0,00
0 -
-
1
1,00
0,00
0
03.
03.0
4 L
AW
ASS
ISTA
NC
E A
ND
SER
VIC
E IN
CRE
ASE
PRO
GRA
M
-
4,0
00,0
00
-
-
4,0
00,0
00
03.
03.0
5 P
ERFO
RMA
NC
E IN
CRE
ASE
PRO
GRA
M O
F C
OU
RT IN
-ST
ITU
TIO
NS
AN
D O
THER
LA
W E
NFO
RCEM
ENT
INST
ITU
-TI
ON
S
-
24,
407,
727
455
,008
,173
-
4
79,4
15,9
00
03.
03.0
6 H
UM
AN
RIG
HTS
AN
D L
AW
EN
FORC
EMEN
T PR
OG
RAM
-
5
44,4
25,1
00
-
-
544
,425
,100
03.
03.0
7 Q
UA
LITY
INC
REA
SE P
ROG
RAM
OF
LAW
PRO
FESS
ION
-
6
9,10
7,30
0 -
-
6
9,10
7,30
0

244 THE INDONESIANBUDGET OVERVIEW 2010
BUD
GET
SEC
TIO
NS
AN
D P
ROG
RAM
SPE
RSO
NN
EL
EXPE
ND
I-TU
RES
GO
OD
S EX
-PE
ND
ITU
RES
CAPI
TAL
EX-
PEN
DIT
URE
SSO
CIA
L A
S-SI
STA
NCE
STO
TAL
11.
05.0
1 C
HIL
DRE
N A
ND
GEN
DER
MA
INST
REA
MIN
G IN
STIT
U-
TIO
NA
L RE
INFO
RCEM
ENT
PRO
GRA
M
-
1,0
00,0
00
-
-
1,0
00,0
00
007
S
TATE
SEC
RETA
RY
362
,162
,283
1
,196
,311
,050
2
41,2
70,2
06
1,4
62,4
75
1,8
01,2
06,0
14
01.
01.0
5 IN
TERN
ATI
ON
AL
CO
OPE
RATI
ON
INC
REA
SE P
ROG
RAM
-
2
,100
,000
-
-
2
,100
,000
01.
01.1
0 S
TATE
APP
ARA
TUS
AC
CO
UN
TABI
LITY
AN
D S
UPE
RVIS
ION
IN
CRE
ASE
PRO
GRA
M
-
1,4
66,4
00
-
-
1,4
66,4
00
01.
01.1
2 A
DM
INIS
TRA
TIO
N A
ND
INST
ITU
TIO
NA
L M
AN
AG
EMEN
T PR
OG
RAM
-
7
,798
,188
9
,982
,512
-
1
7,78
0,70
0
01.
01.1
3 A
PPA
RATU
S RE
SOU
RCE
MA
NA
GEM
ENT
PRO
GRA
M
-
15,
199,
300
-
-
15,
199,
300
01.
01.1
5 PU
BLIC
SER
VIC
E Q
UA
LITY
INC
REA
SE P
ROG
RAM
-
1
79,9
51,5
70
55,
726,
124
-
235
,677
,694
01.
01.1
7 S
TATE
APP
ARA
TUS
MEA
NS
AN
D F
AC
ILIT
Y IN
CRE
ASE
PR
OG
RAM
-
7
,531
,759
1
59,2
48,8
41
-
166
,780
,600
01.
01.1
9 G
OV
ERN
AN
CE
AN
D S
TATE
LEA
DER
SHIP
IMPL
EMEN
TA-
TIO
N P
ROG
RAM
3
62,1
62,2
83
979
,827
,611
9
,248
,951
1
,462
,475
1
,352
,701
,320
08.
01.0
2 C
ULT
URE
PRO
PERT
Y M
AN
AG
EMEN
T PR
OG
RAM
-
1
,780
,542
3
,119
,458
-
4
,900
,000
08.
03.0
1 C
OM
MU
NIC
ATI
ON
, IN
FORM
ATI
ON
, AN
D M
ASS
MED
IA
DEV
ELO
PMEN
T PR
OG
RAM
-
6
55,6
80
3,9
44,3
20
-
4,6
00,0
00
010
M
INIS
TRY
OF
HO
ME
AFF
AIR
S 2
74,8
85,0
00
2,3
87,2
57,2
15
1,2
54,2
74,8
07
8,6
08,3
82,6
72
12,
524,
799,
694
01.
01.0
1 D
EMO
CRA
CY
INST
ITU
TIO
NA
L EN
FORC
EMEN
T A
ND
IM
PRO
VEM
ENT
PRO
GRA
M
-
43,
500,
000
-
-
43,
500,
000
01.
01.0
3 P
OLI
TIC
AL
PRO
CES
S IM
PRO
VEM
ENT
PRO
GRA
M
-
20,
000,
000
-
-
20,
000,
000
01.
01.0
6 N
ATI
ON
AL
UN
ITY
AN
D E
NTI
TY C
OM
MIT
MEN
T IN
-C
REA
SE P
ROG
RAM
-
1
1,50
0,00
0 -
-
1
1,50
0,00
0
01.
01.0
7 P
EOPL
E A
ND
STA
TE R
ELA
TIO
NSH
IP M
AN
AG
EMEN
T PR
OG
RAM
-
1
,258
,100
-
-
1
,258
,100
01.
01.0
9 G
OO
D G
OV
ERN
AN
CE
IMPL
EMEN
TATI
ON
PRO
GRA
M
274
,885
,000
2
20,2
00,4
43
7,0
13,8
01
-
502
,099
,244
01.
01.1
0 S
TATE
APP
ARA
TUS
AC
CO
UN
TABI
LITY
AN
D S
UPE
RVIS
ION
IN
CRE
ASE
PRO
GRA
M
-
24,
819,
900
-
-
24,
819,
900
01.
01.1
2 A
DM
INIS
TRA
TIO
N A
ND
INST
ITU
TIO
NA
L M
AN
AG
EMEN
T PR
OG
RAM
-
2
2,07
1,70
0 5
30,8
00
-
22,
602,
500
01.
01.1
7 S
TATE
APP
ARA
TUS
MEA
NS
AN
D F
AC
ILIT
Y IN
CRE
ASE
PR
OG
RAM
-
-
2
25,8
07,7
00
-
225
,807
,700

245THE INDONESIANBUDGET OVERVIEW 2010
BUD
GET
SEC
TIO
NS
AN
D P
ROG
RAM
SPE
RSO
NN
EL
EXPE
ND
I-TU
RES
GO
OD
S EX
-PE
ND
ITU
RES
CAPI
TAL
EX-
PEN
DIT
URE
SSO
CIA
L A
S-SI
STA
NCE
STO
TAL
01.
03.0
1 P
OPU
LATI
ON
PO
LIC
Y C
ON
FORM
ITY
PRO
GRA
M
-
6,7
07,4
00
45,
000
-
6,7
52,4
00
01.
03.0
2 P
OPU
LATI
ON
AD
MIN
ISTR
ATI
ON
MA
NA
GEM
ENT
PR-
GRA
M
-
48,
474,
211
445
,659
,389
-
4
94,1
33,6
00
01.
06.0
1 N
EW A
UTO
NO
MO
US
REG
ION
MA
NA
GEM
ENT
PRO
-G
RAM
-
5
,989
,000
1
1,00
0 -
6
,000
,000
01.
06.0
2 L
AW
AN
D R
EGU
LATI
ON
MA
NA
GEM
ENT
PRO
GRA
M O
N
DEC
ENTR
ALI
ZATI
ON
AN
D R
EGIO
NA
L A
UTO
NO
MY
-
1
1,98
0,00
0 2
0,00
0 -
1
2,00
0,00
0
01.
06.0
4 P
ROG
RAM
OF
INC
REA
SIN
G C
OO
PERA
TIO
NS
BETW
EEN
RE
GIO
NA
L G
OV
ERN
MEN
TS
-
9,1
60,0
00
40,
000
-
9,2
00,0
00
01.
06.0
5 P
ROG
RAM
OF
REG
ION
AL
GO
VER
NM
ENT
INST
ITU
TIO
N-
AL
CA
PAC
ITY
INC
REA
SE
-
202
,294
,896
2
71,4
06,9
04
-
473
,701
,800
01.
06.0
6 P
ROG
RAM
OF
REG
ION
AL
GO
VER
NM
ENT
FIN
AN
CIA
L C
APA
CIT
Y IN
CRE
ASE
-
3
9,12
9,00
0 4
,575
,000
-
4
3,70
4,00
0
01.
06.0
7 L
OC
AL
ECO
NO
MIC
DEV
ELO
PMEN
T PR
OG
RAM
-
2
2,22
8,00
0 7
3,00
0 -
2
2,30
1,00
0
01.
06.0
8 P
ROG
RAM
OF
INC
REA
SIN
G T
HE
PRO
FESS
ION
ALI
SM O
F RE
GIO
NA
L G
OV
ERN
MEN
T A
PPA
RATU
S
-
64,
619,
350
160
,000
-
6
4,77
9,35
0
01.
06.1
0 P
OST
-CO
NFL
ICT
TERR
ITO
RY R
EHA
BILI
TATI
ON
PRO
GRA
M
-
12,
000,
000
-
-
12,
000,
000
03.
01.0
5 P
UBL
IC O
RDER
LIN
ESS
AN
D S
ECU
RITY
MA
INTE
NA
NC
E PR
OG
RAM
-
6
,919
,155
2
87,9
45
-
7,2
07,1
00
03.
03.0
2 L
AW
EST
ABL
ISH
MEN
T PR
OG
RAM
-
2
,803
,900
4
5,00
0 -
2
,848
,900
05.
05.0
1 T
ERRI
TORI
AL
MA
NA
GEM
ENT
PRO
GRA
M
-
7,2
30,0
00
400
,000
-
7
,630
,000
06.
90.0
1 B
ORD
ERLA
ND
DEV
ELO
PMEN
T PR
OG
RAM
-
4
4,63
2,28
9 1
45,8
90,9
11
-
190
,523
,200
06.
90.0
2 D
EVEL
OPM
ENT
PRO
GRA
M F
OR
FAST
GRO
WIN
G A
ND
ST
RATE
GIC
TER
RITO
RIES
-
9
,970
,000
3
0,00
0 -
1
0,00
0,00
0
06.
90.0
3 D
EVEL
OPM
ENT
PRO
GRA
M F
OR
BAC
KW
ARD
ARE
AS
-
40,
941,
983
90,
157,
250
96,
983,
767
228
,083
,000
06.
90.0
8 D
EVEL
OPM
ENT
PRO
GRA
M O
F C
ON
STRU
CTI
ON
INTE
R-C
ON
NEC
TIO
N B
ETW
EEN
CIT
IES
-
11,
814,
000
186
,000
-
1
2,00
0,00
0
06.
90.0
9 R
URA
L EM
POW
ERM
ENT
INC
REA
SE P
ROG
RAM
-
1
,446
,292
,018
6
0,46
8,07
7 8
,511
,398
,905
1
0,01
8,15
9,00
0
08.
03.0
1 C
OM
MU
NIC
ATI
ON
, IN
FORM
ATI
ON
, AN
D M
ASS
MED
IA
DEV
ELO
PMEN
T PR
OG
RAM
-
1
6,63
3,17
0 1
,422
,030
-
1
8,05
5,20
0
10.
05.0
1 O
FFIC
IAL
DU
TY T
RAIN
ING
PRO
GRA
M
-
34,
088,
700
45,
000
-
34,
133,
700

246 THE INDONESIANBUDGET OVERVIEW 2010
BUD
GET
SEC
TIO
NS
AN
D P
ROG
RAM
SPE
RSO
NN
EL
EXPE
ND
I-TU
RES
GO
OD
S EX
-PE
ND
ITU
RES
CAPI
TAL
EX-
PEN
DIT
URE
SSO
CIA
L A
S-SI
STA
NCE
STO
TAL
011
M
INIS
TRY
OF
FORE
IGN
AFF
AIR
S 2
,615
,235
,000
2
,633
,463
,004
3
12,9
76,7
00
-
5,5
61,6
74,7
04
01.
01.0
2 IN
DO
NES
IAN
DIP
LOM
AC
Y O
PTIM
ALI
ZATI
ON
AN
D F
OR-
EIG
N P
OLI
TIC
AL
FIRM
NES
S PR
OG
RAM
2
,579
,628
,268
2
,402
,750
,536
-
-
4
,982
,378
,804
01.
01.0
4 C
OM
MIT
MEN
T FI
RMN
ESS
PRO
GRA
M F
OR
WO
RLD
PE
AC
E -
1
1,38
0,00
0 -
-
1
1,38
0,00
0
01.
01.0
5 IN
TERN
ATI
ON
AL
CO
OPE
RATI
ON
INC
REA
SE P
ROG
RAM
5
,753
,524
1
45,0
35,0
76
-
-
150
,788
,600
01.
01.1
0 S
TATE
APP
ARA
TUS
AC
CO
UN
TABI
LITY
AN
D S
UPE
RVIS
ION
IN
CRE
ASE
PRO
GRA
M
4,9
27,6
34
16,
498,
166
-
-
21,
425,
800
01.
01.1
2 A
DM
INIS
TRA
TIO
N A
ND
INST
ITU
TIO
NA
L M
AN
AG
EMEN
T PR
OG
RAM
-
5
,200
,000
-
-
5
,200
,000
01.
01.1
3 A
PPA
RATU
S RE
SOU
RCE
MA
NA
GEM
ENT
PRO
GRA
M
24,
925,
574
49,
498,
226
-
-
74,
423,
800
01.
01.1
5 Q
UA
LITY
INC
REA
SE P
ROG
RAM
FO
R PU
BLIC
SER
VIC
ES
-
3,1
01,0
00
-
-
3,1
01,0
00
01.
01.1
7 S
TATE
APP
ARA
TUS
MEA
NS
AN
D F
AC
ILIT
Y IN
CRE
ASE
PR
OG
RAM
-
-
3
12,9
76,7
00
-
312
,976
,700
012
M
INIS
TRY
OF
DEF
ENC
E 2
0,82
9,54
2,48
3 9
,594
,235
,774
1
1,88
6,36
2,00
4 -
4
2,31
0,14
0,26
1
01.
01.0
9 G
OO
D G
OV
ERN
AN
CE
IMPL
EMEN
TATI
ON
PRO
GRA
M
20,
809,
272,
488
620
,953
,937
-
-
2
1,43
0,22
6,42
5
02.
01.0
1 IN
TEG
RATI
VE
DEF
ENC
E D
EVEL
OPM
ENT
PRO
GRA
M
-
2,1
84,6
28,8
68
297
,934
,332
-
2
,482
,563
,200
02.
01.0
2 L
AN
D D
EFEN
CE
DEV
ELO
PMEN
T PR
OG
RAM
1
2,98
4,05
4 2
,512
,321
,299
1
,118
,636
,347
-
3
,643
,941
,700
02.
01.0
3 M
ARI
TIM
E D
EFEN
CE
DEV
ELO
PMEN
T PR
OG
RAM
-
1
,429
,677
,079
1
,624
,717
,621
-
3
,054
,394
,700
02.
01.0
4 A
IR D
EFEN
CE
DEV
ELO
PMEN
T PR
OG
RAM
-
1
,290
,476
,530
1
,669
,891
,370
-
2
,960
,367
,900
02.
01.0
5 IN
DO
NES
IAN
TER
RITO
RIA
L U
NIT
Y M
AIN
TEN
AN
CE
AN
D
SOV
EREI
GN
TY E
NFO
RCEM
ENT
PRO
GRA
M
-
1,2
75,2
78,6
00
45,
146,
400
-
1,3
20,4
25,0
00
02.
01.0
6 S
TATE
SA
CRI
FIC
E D
EVEL
OPM
ENT
PRO
GRA
M
-
24,
239,
824
22,
123,
934
-
46,
363,
758
02.
02.0
1 D
EFEN
CE
STRA
TEG
Y A
ND
SY
STEM
DEV
ELO
PMEN
T PR
OG
RAM
-
4
0,82
8,14
2 3
86,3
74,3
52
-
427
,202
,494
02.
02.0
2 D
EFEN
CE
IND
UST
RY D
EVEL
OPM
ENT
PRO
GRA
M
-
109
,111
,600
6
,705
,500
,248
-
6
,814
,611
,848
02.
03.0
1 IN
TERN
ATI
ON
AL
MIL
ITA
RY C
OO
PERA
TIO
N P
ROG
RAM
3
,825
,649
3
7,89
6,41
1 -
-
4
1,72
2,06
0
02.
04.0
1 D
EFEN
CE
DEV
ELO
PMEN
T A
ND
RES
EARC
H P
ROG
RAM
7
31,4
92
13,
211,
284
10,
406,
800
-
24,
349,
576
02.
90.0
1 IN
DO
NES
IAN
MIL
ITA
RY D
EVO
TIO
N P
ROG
RAM
2
,728
,800
1
9,81
2,20
0 5
,630
,600
-
2
8,17
1,60
0
10.
06.0
1 H
IGH
ER E
DU
CA
TIO
N P
ROG
RAM
-
3
5,80
0,00
0 -
-
3
5,80
0,00
0
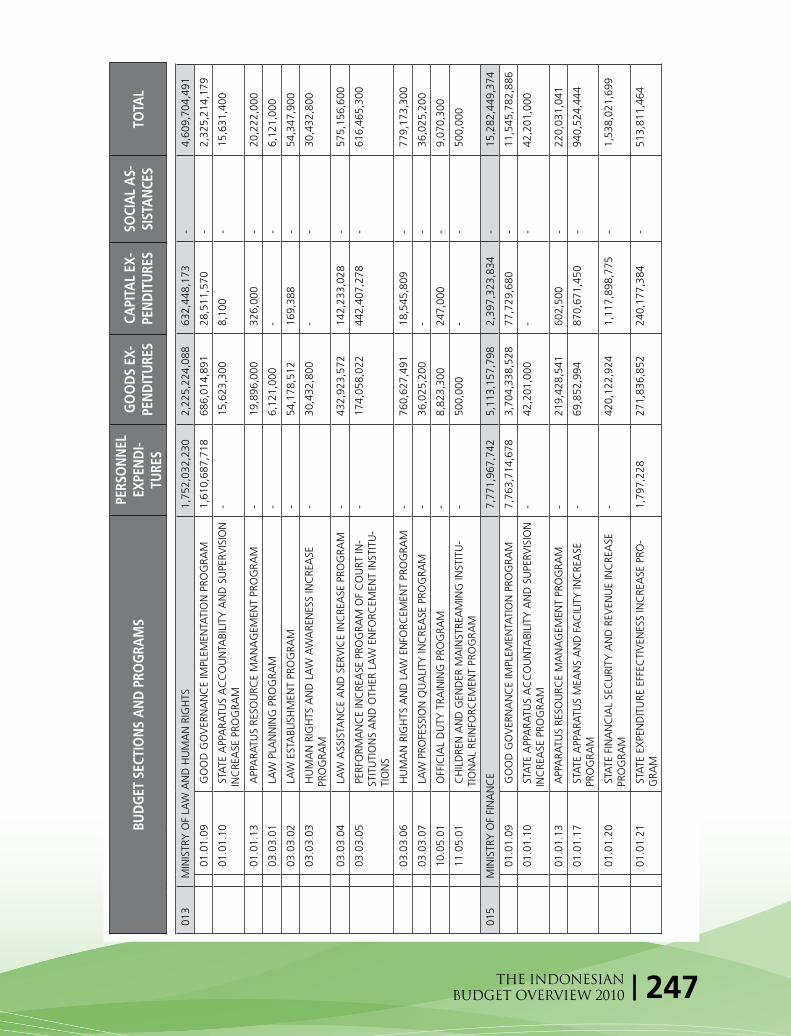
247THE INDONESIANBUDGET OVERVIEW 2010
BUD
GET
SEC
TIO
NS
AN
D P
ROG
RAM
SPE
RSO
NN
EL
EXPE
ND
I-TU
RES
GO
OD
S EX
-PE
ND
ITU
RES
CAPI
TAL
EX-
PEN
DIT
URE
SSO
CIA
L A
S-SI
STA
NCE
STO
TAL
013
M
INIS
TRY
OF
LAW
AN
D H
UM
AN
RIG
HTS
1
,752
,032
,230
2
,225
,224
,088
6
32,4
48,1
73
-
4,6
09,7
04,4
91
01.
01.0
9 G
OO
D G
OV
ERN
AN
CE
IMPL
EMEN
TATI
ON
PRO
GRA
M
1,6
10,6
87,7
18
686
,014
,891
2
8,51
1,57
0 -
2
,325
,214
,179
01.
01.1
0 S
TATE
APP
ARA
TUS
AC
CO
UN
TABI
LITY
AN
D S
UPE
RVIS
ION
IN
CRE
ASE
PRO
GRA
M
-
15,
623,
300
8,1
00
-
15,
631,
400
01.
01.1
3 A
PPA
RATU
S RE
SOU
RCE
MA
NA
GEM
ENT
PRO
GRA
M
-
19,
896,
000
326
,000
-
2
0,22
2,00
0
03.
03.0
1 L
AW
PLA
NN
ING
PRO
GRA
M
-
6,1
21,0
00
-
-
6,1
21,0
00
03.
03.0
2 L
AW
EST
ABL
ISH
MEN
T PR
OG
RAM
-
5
4,17
8,51
2 1
69,3
88
-
54,
347,
900
03.
03.0
3 H
UM
AN
RIG
HTS
AN
D L
AW
AW
ARE
NES
S IN
CRE
ASE
PR
OG
RAM
-
3
0,43
2,80
0 -
-
3
0,43
2,80
0
03.
03.0
4 L
AW
ASS
ISTA
NC
E A
ND
SER
VIC
E IN
CRE
ASE
PRO
GRA
M
-
432
,923
,572
1
42,2
33,0
28
-
575
,156
,600
03.
03.0
5 P
ERFO
RMA
NC
E IN
CRE
ASE
PRO
GRA
M O
F C
OU
RT IN
-ST
ITU
TIO
NS
AN
D O
THER
LA
W E
NFO
RCEM
ENT
INST
ITU
-TI
ON
S
-
174
,058
,022
4
42,4
07,2
78
-
616
,465
,300
03.
03.0
6 H
UM
AN
RIG
HTS
AN
D L
AW
EN
FORC
EMEN
T PR
OG
RAM
-
7
60,6
27,4
91
18,
545,
809
-
779
,173
,300
03.
03.0
7 L
AW
PRO
FESS
ION
QU
ALI
TY IN
CRE
ASE
PRO
GRA
M
-
36,
025,
200
-
-
36,
025,
200
10.
05.0
1 O
FFIC
IAL
DU
TY T
RAIN
ING
PRO
GRA
M
-
8,8
23,3
00
247
,000
-
9
,070
,300
11.
05.0
1 C
HIL
DRE
N A
ND
GEN
DER
MA
INST
REA
MIN
G IN
STIT
U-
TIO
NA
L RE
INFO
RCEM
ENT
PRO
GRA
M
-
500
,000
-
-
5
00,0
00
015
M
INIS
TRY
OF
FIN
AN
CE
7,7
71,9
67,7
42
5,1
13,1
57,7
98
2,3
97,3
23,8
34
-
15,
282,
449,
374
01.
01.0
9 G
OO
D G
OV
ERN
AN
CE
IMPL
EMEN
TATI
ON
PRO
GRA
M
7,7
63,7
14,6
78
3,7
04,3
38,5
28
77,
729,
680
-
11,
545,
782,
886
01.
01.1
0 S
TATE
APP
ARA
TUS
AC
CO
UN
TABI
LITY
AN
D S
UPE
RVIS
ION
IN
CRE
ASE
PRO
GRA
M
-
42,
201,
000
-
-
42,
201,
000
01.
01.1
3 A
PPA
RATU
S RE
SOU
RCE
MA
NA
GEM
ENT
PRO
GRA
M
-
219
,428
,541
6
02,5
00
-
220
,031
,041
01.
01.1
7 S
TATE
APP
ARA
TUS
MEA
NS
AN
D F
AC
ILIT
Y IN
CRE
ASE
PR
OG
RAM
-
6
9,85
2,99
4 8
70,6
71,4
50
-
940
,524
,444
01.
01.2
0 S
TATE
FIN
AN
CIA
L SE
CU
RITY
AN
D R
EVEN
UE
INC
REA
SE
PRO
GRA
M
-
420
,122
,924
1
,117
,898
,775
-
1
,538
,021
,699
01.
01.2
1 S
TATE
EX
PEN
DIT
URE
EFF
ECTI
VEN
ESS
INC
REA
SE P
RO-
GRA
M
1,7
97,2
28
271
,836
,852
2
40,1
77,3
84
-
513
,811
,464

248 THE INDONESIANBUDGET OVERVIEW 2010
BUD
GET
SEC
TIO
NS
AN
D P
ROG
RAM
SPE
RSO
NN
EL
EXPE
ND
I-TU
RES
GO
OD
S EX
-PE
ND
ITU
RES
CAPI
TAL
EX-
PEN
DIT
URE
SSO
CIA
L A
S-SI
STA
NCE
STO
TAL
01.
01.2
2 S
TATE
FIN
AN
CIA
L A
CC
OU
NTA
NC
Y F
OU
ND
ING
PRO
-G
RAM
-
2
5,40
8,44
6 4
00,0
00
-
25,
808,
446
01.
01.2
3 F
INA
NC
IAL
INST
ITU
TIO
NA
L D
EVEL
OPM
ENT
PRO
GRA
M
-
30,
103,
165
31,
304,
220
-
61,
407,
385
01.
01.2
4 F
INA
NC
IAL
SEC
TOR
AN
D E
CO
NO
MIC
STA
BILI
TY P
RO-
GRA
M
-
90,
260,
866
8,3
94,9
22
-
98,
655,
788
01.
01.2
5 D
EBT
FIN
AN
CIN
G A
ND
MA
NA
GEM
ENT
PRO
GRA
M
-
36,
112,
723
423
,665
-
3
6,53
6,38
8
01.
01.2
6 B
UD
GET
SY
STEM
IMPL
EMEN
TATI
ON
EN
FORC
EMEN
T PR
OG
RAM
-
9
,426
,433
-
-
9
,426
,433
01.
01.2
8 E
FFEC
TIV
ENES
S IN
CRE
ASE
PRO
GRA
M O
N S
TATE
PRO
P-ER
TY M
AN
AG
EMEN
T
-
155
,459
,870
1
0,96
0,63
0 -
1
66,4
20,5
00
10.
06.0
1 H
IGH
ER E
DU
CA
TIO
N P
ROG
RAM
6
,455
,836
3
8,60
5,45
6 3
8,76
0,60
8 -
8
3,82
1,90
0
018
M
INIS
TRY
OF
AG
RIC
ULT
URE
9
35,5
10,9
29
3,3
95,7
02,3
49
509
,672
,567
3
,197
,163
,263
8
,038
,049
,108
01.
01.0
9 G
OO
D G
OV
ERN
AN
CE
IMPL
EMEN
TATI
ON
PRO
GRA
M
889
,642
,934
3
59,0
63,7
43
1,2
23,7
33
-
1,2
49,9
30,4
10
01.
01.1
0 S
TATE
APP
ARA
TUS
AC
CO
UN
TABI
LITY
AN
D S
UPE
RVIS
ION
IN
CRE
ASE
PRO
GRA
M
-
31,
610,
025
1,4
86,9
75
-
33,
097,
000
04.
03.0
3 A
GRI
BUSI
NES
S D
EVEL
OPM
ENT
PRO
GRA
M
-
291
,125
,462
3
6,16
4,14
1 1
77,1
89,0
22
504
,478
,625
04.
03.0
4 F
OO
D D
EFEN
CE
INC
REA
SE P
ROG
RAM
1
3,20
0 1
,433
,456
,206
3
24,9
26,7
14
1,2
42,8
60,9
09
3,0
01,2
57,0
29
04.
03.0
8 F
ARM
ER P
ROSP
ERIT
Y IN
CRE
ASE
PRO
GRA
M
-
1,2
55,7
43,8
85
145
,771
,179
1
,772
,813
,380
3
,174
,328
,444
10.
03.0
1 P
OST
-ELE
MEN
TARY
ED
UC
ATI
ON
PRO
GRA
M
8,7
26,1
64
6,8
18,4
84
-
4,2
99,9
52
19,
844,
600
10.
06.0
1 H
IGH
ER E
DU
CA
TIO
N P
ROG
RAM
3
7,12
8,63
1 1
7,88
4,54
4 9
9,82
5 -
5
5,11
3,00
0
019
M
INIS
TRY
OF
IND
UST
RY
273
,233
,186
1
,272
,788
,229
1
19,0
95,3
06
-
1,6
65,1
16,7
21
01.
01.1
0 S
TATE
APP
ARA
TUS
AC
CO
UN
TABI
LITY
AN
D S
UPE
RVIS
ION
IN
CRE
ASE
PRO
GRA
M
4,8
03,1
63
15,
091,
337
13,
500
-
19,
908,
000
01.
01.1
3 A
PPA
RATU
S RE
SOU
RCE
MA
NA
GEM
ENT
PRO
GRA
M
14,
348,
632
84,
256,
948
6,7
04,5
15
-
105
,310
,095
01.
01.1
7 S
TATE
APP
ARA
TUS
MEA
NS
AN
D F
AC
ILIT
Y IN
CRE
ASE
PR
OG
RAM
-
4
34,8
71
7,7
27,7
29
-
8,1
62,6
00
03.
03.0
2 L
AW
EST
ABL
ISH
MEN
T PR
OG
RAM
-
7
,914
,000
8
6,00
0 -
8
,000
,000
04.
07.0
2 S
MA
LL A
ND
MED
IUM
IND
UST
RIES
DEV
ELO
PMEN
T PR
OG
RAM
1
5,73
0,79
4 2
64,6
51,6
21
32,
110,
634
-
312
,493
,049
04.
07.0
3 IN
DU
STRI
AL
TEC
HN
OLO
GY
CA
PABI
LITY
INC
REA
SE
PRO
GRA
M
122
,322
,648
2
68,9
42,5
66
41,
877,
441
-
433
,142
,655

249THE INDONESIANBUDGET OVERVIEW 2010
BUD
GET
SEC
TIO
NS
AN
D P
ROG
RAM
SPE
RSO
NN
EL
EXPE
ND
I-TU
RES
GO
OD
S EX
-PE
ND
ITU
RES
CAPI
TAL
EX-
PEN
DIT
URE
SSO
CIA
L A
S-SI
STA
NCE
STO
TAL
04.
07.0
4 IN
DU
STRI
AL
STRU
CTU
RE M
AN
AG
EMEN
T PR
OG
RAM
5
9,68
7,71
7 5
94,9
01,2
94
20,
011,
339
-
674
,600
,350
10.
03.0
1 P
OST
-ELE
MEN
TARY
ED
UC
ATI
ON
PRO
GRA
M
23,
410,
634
11,
126,
847
2,6
67,6
25
-
37,
205,
106
10.
06.0
1 H
IGH
ER E
DU
CA
TIO
N P
ROG
RAM
3
2,92
9,59
8 2
5,46
8,74
5 7
,896
,523
-
6
6,29
4,86
6
020
M
INIS
TRY
OF
ENER
GY
AN
D N
ATU
RAL
RESO
URC
ES
347
,904
,221
2
,976
,137
,815
4
,473
,412
,015
-
7
,797
,454
,051
01.
01.1
0 S
TATE
APP
ARA
TUS
AC
CO
UN
TABI
LITY
AN
D S
UPE
RVIS
ION
IN
CRE
ASE
PRO
GRA
M
8,7
54,0
00
94,
691,
900
6,2
25,5
00
-
109
,671
,400
01.
01.1
3 A
PPA
RATU
S RE
SOU
RCE
MA
NA
GEM
ENT
PRO
GRA
M
52,
195,
000
108
,584
,643
1
6,02
4,00
0 -
1
76,8
03,6
43
01.
01.1
5 P
UBL
IC S
ERV
ICE
QU
ALI
TY IN
CRE
ASE
PRO
GRA
M
43,
303,
201
420
,663
,431
7
9,23
1,49
2 -
5
43,1
98,1
24
01.
04.0
1 T
ECH
NO
LOG
Y A
ND
SC
IEN
CE
DEV
ELO
PMEN
T A
ND
RE
SEA
RCH
PRO
GRA
M
5,9
00,5
20
28,
151,
527
8,8
62,5
36
-
42,
914,
583
03.
03.0
2 L
AW
EST
ABL
ISH
MEN
T PR
OG
RAM
-
2
1,24
1,84
7 -
-
2
1,24
1,84
7
04.
05.0
1 Q
UA
LITY
INC
REA
SE P
ROG
RAM
FO
R EL
ECTR
ICIT
Y
MEA
NS
AN
D F
AC
ILIT
IES
1
5,00
0,00
0 5
3,74
0,13
2 3
,214
,033
,168
-
3
,282
,773
,300
04.
05.0
2 Q
UA
LITY
INC
REA
SE P
ROG
RAM
FO
R EN
ERG
Y M
EAN
S A
ND
FA
CIL
ITY
SER
VIC
ES
-
65,
417,
050
173
,960
,950
-
2
39,3
78,0
00
04.
05.0
3 D
EVEL
OPM
ENT
AN
D C
ON
TRO
L PR
OG
RAM
OF
ENER
GY
TE
CH
NO
LOG
Y A
ND
APP
LIC
ATI
ON
4
,478
,500
2
8,02
2,32
0 1
4,53
9,88
0 -
4
7,04
0,70
0
04.
05.0
4 C
OM
PLIA
NC
E PR
OG
RAM
FO
R TH
E RE
STRU
CTU
RIZA
TIO
N
AN
D R
EFO
RM O
F EN
ERG
Y M
EAN
S A
ND
FA
CIL
ITIE
S
-
46,
297,
800
-
-
46,
297,
800
04.
05.0
5 A
CC
ESSI
BILI
TY IN
CRE
ASE
PRO
GRA
M O
F RE
GIO
NA
L G
OV
ERN
MEN
TS, C
OO
PERA
TIV
ES, A
ND
TH
E PU
BLIC
TO
TH
E EN
ERG
Y M
EAN
S A
ND
FA
CIL
ITY
SER
VIC
ES
-
28,
265,
184
61,
750,
816
-
90,
016,
000
04.
05.0
6 C
OM
PLIA
NC
E PR
OG
RAM
FO
R TH
E RE
STRU
CTU
RIZA
TIO
N
AN
D R
EFO
RM O
F EL
ECTR
ICIT
Y M
EAN
S A
ND
FA
CIL
ITIE
S
-
17,
590,
000
-
-
17,
590,
000
04.
05.0
8 D
EVEL
OPM
ENT
AN
D C
ON
TRO
L PR
OG
RAM
OF
ELEC
-TR
ICIT
Y T
ECH
NO
LOG
Y A
ND
APP
LIC
ATI
ON
-
5
1,53
5,13
6 6
,200
,000
-
5
7,73
5,13
6
04.
06.0
1 F
OU
ND
ING
PRO
GRA
M F
OR
CO
AL
AN
D M
INER
AL
MIN
-IN
G B
USI
NES
SES
8
5,05
4,90
0 9
24,2
98,0
95
625
,262
,268
-
1
,634
,615
,263
04.
06.0
2 F
OU
ND
ING
PRO
GRA
M F
OR
OIL
AN
D G
AS
MIN
ING
BU
SI-
NES
S
80,
145,
100
769
,470
,946
7
3,67
3,98
7 -
9
23,2
90,0
33
05.
03.0
1 E
NV
IRO
NM
ENT
POLL
UTI
ON
CO
NTR
OL
PRO
GRA
M
-
910
,558
-
-
9
10,5
58

250 THE INDONESIANBUDGET OVERVIEW 2010
BUD
GET
SEC
TIO
NS
AN
D P
ROG
RAM
SPE
RSO
NN
EL
EXPE
ND
I-TU
RES
GO
OD
S EX
-PE
ND
ITU
RES
CAPI
TAL
EX-
PEN
DIT
URE
SSO
CIA
L A
S-SI
STA
NCE
STO
TAL
05.
04.0
1 N
ATU
RAL
RESO
URC
E C
ON
SERV
ATI
ON
AN
D P
ROTE
C-
TIO
N P
ROG
RAM
-
1
7,13
1,00
5 1
1,50
0,00
0 -
2
8,63
1,00
5
05.
04.0
3 C
APA
CIT
Y D
EVEL
OPM
ENT
PRO
GRA
M F
OR
ENV
IRO
N-
MEN
T A
ND
NA
TURA
L RE
SOU
RCE
MA
NA
GEM
ENT
4
5,99
1,00
0 1
67,7
77,2
05
7,7
07,7
22
-
221
,475
,927
05.
90.0
1 IN
FORM
ATI
ON
AC
CES
S A
ND
QU
ALI
TY IN
CRE
ASE
PRO
-G
RAM
FO
R N
ATU
RAL
RESO
URC
ES A
ND
EN
VIR
ON
MEN
T
-
27,
848,
372
10,
715,
360
-
38,
563,
732
10.
06.0
1 H
IGH
ER E
DU
CA
TIO
N P
ROG
RAM
7
,082
,000
1
04,5
00,6
64
163
,724
,336
-
2
75,3
07,0
00
022
M
INIS
TRY
OF
TRA
NSP
ORT
ATI
ON
1
,280
,175
,850
3
,125
,454
,481
1
1,42
8,20
5,55
8 -
1
5,83
3,83
5,88
9
01.
01.0
9 G
OO
D G
OV
ERN
AN
CE
IMPL
EMEN
TATI
ON
PRO
GRA
M
1,1
65,9
67,1
06
812
,642
,189
2
0,73
0,28
9 -
1
,999
,339
,584
01.
01.1
0 S
TATE
APP
ARA
TUS
AC
CO
UN
TABI
LITY
AN
D S
UPE
RVIS
ION
IN
CRE
ASE
PRO
GRA
M
-
36,
384,
005
2,6
43,4
95
-
39,
027,
500
01.
01.1
3 A
PPA
RATU
S RE
SOU
RCE
MA
NA
GEM
ENT
PRO
GRA
M
-
52,
992,
230
146
,318
,770
-
1
99,3
11,0
00
01.
01.1
7 S
TATE
APP
ARA
TUS
MEA
NS
AN
D F
AC
ILIT
Y IN
CRE
ASE
PR
OG
RAM
-
4
1,21
5,65
7 3
7,23
5,14
3 -
7
8,45
0,80
0
01.
90.0
3 N
AD
AN
D N
IAS
REC
ON
STRU
CTI
ON
AN
D R
EHA
BILI
TA-
TIO
N P
ROG
RAM
-
1
2,37
9,10
2 1
70,9
27,9
98
-
183
,307
,100
04.
08.0
3 T
RAFF
IC M
AN
S A
ND
FA
CIL
ITY
DEV
ELO
PMEN
T PR
O-
GRA
M
-
16,
701,
457
375
,001
,843
-
3
91,7
03,3
00
04.
08.0
4 T
RAN
SPO
RTA
TIO
N S
ERV
ICE
AC
CES
SIBI
LITY
INC
REA
SE
PRO
GRA
M
-
52,
989,
000
68,
450,
000
-
121
,439
,000
04.
08.0
5 M
AIN
TEN
AN
CE
AN
D R
EHA
BILI
TATI
ON
PRO
GRA
M F
OR
TRA
FFIC
MEA
NS
AN
D F
AC
ILIT
IES
-
7
50,0
00
31,
645,
000
-
32,
395,
000
04.
08.0
6 T
RAIN
SER
VIC
E A
CC
ESSI
LIBI
LITY
INC
REA
SE P
ROG
RAM
-
7
99,0
75
135
,058
,825
-
1
35,8
57,9
00
04.
08.0
7 T
RAIN
MEA
NS
AN
D F
AC
ILIT
Y D
EVEL
OPM
ENT
AN
D
INC
REA
SE P
ROG
RAM
-
1
0,75
5,08
0 3
,452
,593
,660
-
3
,463
,348
,740
04.
08.0
8 T
RAIN
MEA
NS
AN
D F
AC
ILIT
Y R
EHA
BILI
TATI
ON
PRO
-G
RAM
-
-
4
0,71
8,90
0 -
4
0,71
8,90
0
04.
08.0
9 R
EFO
RM A
ND
RES
TRU
CTU
RIZA
TIO
N P
ROG
RAM
OF
TRA
IN IN
STIT
UTI
ON
-
6
,233
,100
3
7,64
7,50
0 -
4
3,88
0,60
0
04.
08.1
0 R
ESTR
UC
TURI
ZATI
ON
PRO
GRA
M O
F TR
AFF
IC M
EAN
S A
ND
INST
ITU
TIO
N
-
29,
369,
620
37,
105,
080
-
66,
474,
700
04.
08.1
1 M
ARI
TIM
E TR
AN
SPO
RTA
TIO
N D
EVEL
OPM
ENT
PRO
-G
RAM
-
3
12,7
52,6
45
2,3
77,7
91,8
55
-
2,6
90,5
44,5
00

251THE INDONESIANBUDGET OVERVIEW 2010
BUD
GET
SEC
TIO
NS
AN
D P
ROG
RAM
SPE
RSO
NN
EL
EXPE
ND
I-TU
RES
GO
OD
S EX
-PE
ND
ITU
RES
CAPI
TAL
EX-
PEN
DIT
URE
SSO
CIA
L A
S-SI
STA
NCE
STO
TAL
04.
08.1
2 M
AIN
TEN
AN
CE
AN
D R
EHA
BILI
TATI
ON
PRO
GRA
M O
F M
ARI
TIM
E TR
AN
SPO
RTA
TIO
N M
EAN
S
-
90,
000,
000
68,
615,
000
-
158
,615
,000
04.
08.1
3 R
ESTR
UC
TURI
ZATI
ON
PRO
GRA
M O
F M
ARI
TIM
E TR
AN
S-PO
RTA
TIO
N R
EGU
LATI
ON
S A
ND
INST
ITU
TIO
N
-
569
,285
,722
1
1,17
0,37
8 -
5
80,4
56,1
00
04.
08.1
4 A
SDP
MEA
NS
AN
D F
AC
ILIT
Y D
EVEL
OPM
ENT
PRO
GRA
M
-
145
,218
,823
8
51,7
61,5
77
-
996
,980
,400
04.
08.1
5 R
EHA
BILI
TATI
ON
PRO
GRA
M F
OR
RIV
ER, L
AK
E, A
ND
C
ROSS
OV
ER P
ORT
FA
CIL
ITIE
S
-
-
43,
455,
200
-
43,
455,
200
04.
08.1
6 R
ESTR
UC
TURI
ZATI
ON
AN
D R
EFO
RM P
ROG
RAM
OF
ASD
P IN
STIT
UTI
ON
-
4
,825
,600
1
9,93
0,00
0 -
2
4,75
5,60
0
04.
08.1
7 A
IR T
RAN
SPO
RTA
TIO
N D
EVEL
OPM
ENT
PRO
GRA
M
-
295
,169
,274
2
,370
,099
,026
-
2
,665
,268
,300
04.
08.1
8 R
EHA
BILI
TATI
ON
AN
D M
AIN
TEN
AA
NC
E PR
OG
RAM
OF
AIR
TRA
NSP
ORT
ATI
ON
-
-
2
41,0
78,2
00
-
241
,078
,200
04.
08.1
9 R
ESTR
CU
TURI
ZATI
ON
PRO
GRA
M O
F A
IR T
RAN
SPO
RTA
-TI
ON
REG
ULA
TIO
NS
AN
D IN
STIT
UTI
ON
-
2
48,5
90,4
00
139
,383
,465
-
3
87,9
73,8
65
04.
08.2
0 IN
TER-
CIT
IES
TRA
NSP
ORT
ATI
ON
DEV
ELO
PMEN
T PR
O-
GRA
M
-
57,
357,
800
12,
543,
000
-
69,
900,
800
04.
08.2
1 T
RAN
SPO
RTA
TIO
N D
EVEL
OPM
ENT
AN
D R
ESEA
RCH
PR
OG
RAM
-
1
4,23
6,32
8 4
2,34
0,87
2 -
5
6,57
7,20
0
10.
06.0
1 H
IGH
ER E
DU
CA
TIO
N P
ROG
RAM
1
14,2
08,7
44
314
,807
,374
6
93,9
60,4
82
-
1,1
22,9
76,6
00
023
M
INIS
TRY
OF
NA
TIO
NA
L ED
UC
ATI
ON
6
,708
,423
,802
1
3,24
6,61
9,69
9 3
,973
,621
,476
31
,258
,514
,358
5
5,18
7,17
9,33
5
01.
01.1
0 S
TATE
APP
ARA
TUS
AC
CO
UN
TABI
LITY
AN
D S
UPE
RVIS
ION
IN
CRE
ASE
PRO
GRA
M
22,
394,
568
82,
326,
579
6,9
12,8
50
189
,250
1
11,8
23,2
47
01.
01.1
3 A
PPA
RATU
S RE
SOU
RCE
MA
NA
GEM
ENT
PRO
GRA
M
-
15,
000,
000
-
-
15,
000,
000
01.
01.1
7 S
TATE
APP
ARA
TUS
MEA
NS
AN
D F
AC
ILIT
Y IN
CRE
ASE
PR
OG
RAM
-
-
1
0,00
0,00
0 -
1
0,00
0,00
0
01.
04.0
1 T
ECH
NO
LOG
Y A
ND
SC
IEN
CE
DEV
ELO
PMEN
T A
ND
RE
SEA
RCH
PRO
GRA
M
-
105
,000
,000
-
-
1
05,0
00,0
00
10.
01.0
1 E
ARL
Y A
GE
CH
ILD
REN
ED
UC
ATI
ON
PRO
GRA
M
-
308
,301
,117
6
18,5
00
776
,012
,183
1
,084
,931
,800
10.
02.0
1 N
INE-
YEA
R BA
SIC
LEA
RNIN
G O
BLIG
ATI
ON
PRO
GRA
M
25,
523,
326
1,3
48,0
20,7
27
44,
969,
833
24,4
02,9
63,0
94
25,
821,
476,
980
10.
03.0
1 P
OST
-ELE
MEN
TARY
ED
UC
ATI
ON
PRO
GRA
M
17,
642,
726
752
,163
,745
1
8,34
0,36
8 3
,542
,315
,019
4
,330
,461
,858
10.
04.0
1 N
ON
-FO
RMA
L ED
UC
ATI
ON
PRO
GRA
M
37,
787,
621
357
,239
,521
4
0,24
8,38
6 5
72,3
28,7
98
1,0
07,6
04,3
26

252 THE INDONESIANBUDGET OVERVIEW 2010
BUD
GET
SEC
TIO
NS
AN
D P
ROG
RAM
SPE
RSO
NN
EL
EXPE
ND
I-TU
RES
GO
OD
S EX
-PE
ND
ITU
RES
CAPI
TAL
EX-
PEN
DIT
URE
SSO
CIA
L A
S-SI
STA
NCE
STO
TAL
10.
06.0
1 H
IGH
ER E
DU
CA
TIO
N P
ROG
RAM
6
,166
,958
,811
8
,277
,454
,068
3
,736
,472
,779
1
,071
,832
,904
1
9,25
2,71
8,56
2
10.
07.0
1 T
EAC
HER
AN
D E
DU
CA
TIO
NA
L EM
PLO
YEE
QU
ALI
TY
INC
REA
SE P
ROG
RAM
2
74,6
96,2
70
1,1
06,1
26,0
09
97,
779,
361
639
,975
,091
2
,118
,576
,731
10.
07.0
2 L
IBRA
RY F
OU
ND
ING
AN
D R
EAD
ING
CU
LTU
RE D
EVEL
OP-
MEN
T PR
OG
RAM
-
2
4,51
2,82
5 4
87,1
75
8,0
00,0
00
33,
000,
000
10.
07.0
3 E
DU
CA
TIO
NA
L SE
RVIC
E M
AN
AG
EMEN
T PR
OG
RAM
1
44,4
13,5
00
424
,075
,499
1
4,16
4,94
2 9
8,81
4,51
0 6
81,4
68,4
51
10.
09.0
1 E
DU
CA
TIO
NA
L D
EVEL
OPM
ENT
AN
D R
ESEA
RCH
PRO
-G
RAM
1
9,00
6,98
0 4
39,4
89,0
09
3,6
27,2
82
135
,433
,509
5
97,5
56,7
80
11.
05.0
1 C
HIL
DRE
N A
ND
GEN
DER
MA
INST
REA
MIN
G IN
STIT
U-
TIO
NA
L RE
INFO
RCEM
ENT
PRO
GRA
M
-
6,9
10,6
00
-
10,
650,
000
17,
560,
600
024
M
INIS
TRY
OF
HEA
LTH
2
,998
,298
,000
8
,912
,511
,005
3
,702
,381
,536
5
,776
,395
,292
2
1,38
9,58
5,83
3
01.
01.0
9 G
OO
D G
OV
ERN
AN
CE
IMPL
EMEN
TATI
ON
PRO
GRA
M
1,8
90,5
93,7
29
520
,628
,230
3
0,50
9,79
0 -
2
,441
,731
,749
01.
01.1
0 S
TATE
APP
ARA
TUS
AC
CO
UN
TABI
LITY
AN
D S
UPE
RVIS
ION
IN
CRE
ASE
PRO
GRA
M
-
50,
539,
540
1,6
94,1
60
-
52,
233,
700
01.
01.1
3 A
PPA
RATU
S RE
SOU
RCE
MA
NA
GEM
ENT
PRO
GRA
M
-
57,
309,
940
850
,000
-
5
8,15
9,94
0
06.
02.0
1 H
EALT
HY
EN
VIR
ON
MEN
T PR
OG
RAM
-
2
76,8
88,0
51
2,9
04,1
71
76,
707,
500
356
,499
,722
07.
01.0
1 H
EALT
H S
UPP
LY A
ND
MED
ICIN
E PR
OG
RAM
-
9
59,2
00,3
36
752
,500
-
9
59,9
52,8
36
07.
02.0
1 IN
DIV
IDU
AL
HEA
LTH
EFF
ORT
PRO
GRA
M
1,0
87,9
10,5
27
4,0
75,8
44,3
96
1,8
35,4
70,6
27
4,0
03,3
52,7
15
11,
002,
578,
265
07.
03.0
2 P
EOPL
E EM
POW
ERM
ENT
AN
D H
EALT
H P
ROM
OTI
ON
PR
OG
RAM
-
9
6,34
5,18
7 2
76,0
00
204
,000
9
6,82
5,18
7
07.
03.0
3 P
EOPL
E H
EALT
H E
FFO
RT P
ROG
RAM
-
4
84,6
11,2
31
83,
311,
258
1,4
42,7
34,8
51
2,0
10,6
57,3
40
07.
03.0
4 D
ISEA
SE E
RAD
ICA
TIO
N A
ND
PRE
VEN
TIO
N P
ROG
RAM
1
9,79
3,74
4 4
00,5
78,0
46
388
,848
,127
1
,800
,000
8
11,0
19,9
17
07.
03.0
5 P
EOPL
E N
UTR
ITIO
N IM
PRO
VEM
ENT
PRO
GRA
M
-
227
,832
,269
1
,018
,290
1
64,3
45,2
30
393
,195
,789
07.
05.0
1 H
EALT
H D
EVEL
OPM
ENT
AN
D R
ESEA
RCH
PRO
GRA
M
-
126
,571
,669
3
3,70
0,17
1 -
1
60,2
71,8
40
07.
90.0
1 H
EALT
H R
ESO
URC
E PR
OG
RAM
-
5
28,1
48,9
43
161
,236
,790
1
,777
,640
6
91,1
63,3
73
07.
90.0
2 H
EALT
H D
EVEL
OPM
ENT
MA
NA
GEM
ENT
AN
D P
OLI
CY
PR
OG
RAM
-
6
05,9
08,4
54
159
,387
,721
-
7
65,2
96,1
75
10.
06.0
1 H
IGH
ER E
DU
CA
TIO
N P
ROG
RAM
-
5
02,1
04,7
13
1,0
02,4
21,9
31
85,
473,
356
1,5
90,0
00,0
00

253THE INDONESIANBUDGET OVERVIEW 2010
BUD
GET
SEC
TIO
NS
AN
D P
ROG
RAM
SPE
RSO
NN
EL
EXPE
ND
I-TU
RES
GO
OD
S EX
-PE
ND
ITU
RES
CAPI
TAL
EX-
PEN
DIT
URE
SSO
CIA
L A
S-SI
STA
NCE
STO
TAL
025
M
INIS
TRY
OF
RELI
GIO
US
AFF
AIR
S 1
2,47
3,19
0,04
9 5
,657
,440
,930
2
,212
,380
,533
6,
895,
706,
005
27,
238,
717,
517
01.
01.0
9 G
OO
D G
OV
ERN
AN
CE
IMPL
EMEN
TATI
ON
PRO
GRA
M
1,8
17,4
11,5
43
493
,269
,079
1
0,60
5,20
0 -
2
,321
,285
,822
01.
01.1
0 S
TATE
APP
ARA
TUS
AC
CO
UN
TABI
LITY
AN
D S
UPE
RVIS
ION
IN
CRE
ASE
PRO
GRA
M
-
3,8
99,2
58
100
,742
-
4
,000
,000
01.
01.1
2 A
DM
INIS
TRA
TIO
N A
ND
INST
ITU
TIO
NA
L M
AN
AG
EMEN
T PR
OG
RAM
-
2
,047
,065
4
52,9
35
-
2,5
00,0
00
01.
01.1
3 A
PPA
RATU
S RE
SOU
RCE
MA
NA
GEM
ENT
PRO
GRA
M
-
16,
338,
551
1,5
58,2
49
-
17,
896,
800
01.
01.1
5 P
UBL
IC S
ERV
ICE
QU
ALI
TY IN
CRE
ASE
PRO
GRA
M
-
27,
087,
578
1,4
12,4
22
-
28,
500,
000
01.
01.1
7 S
TATE
APP
ARA
TUS
MEA
NS
AN
D F
AC
ILIT
Y IN
CRE
ASE
PR
OG
RAM
-
4
84,0
56
94,
510,
344
-
94,
994,
400
08.
02.0
2 Y
OU
TH P
ART
ICIP
ATI
ON
INC
REA
SE A
ND
FO
UN
DIN
G
PRO
GRA
M
-
700
,000
-
-
7
00,0
00
09.
01.0
1 R
ELIG
IOU
S LI
VIN
G S
ERV
ICE
INC
REA
SE P
ROG
RAM
-
4
82,4
63,6
70
118
,943
,883
8
4,19
2,64
7 6
85,6
00,2
00
09.
01.0
2 P
ROG
RAM
OF
INC
REA
SIN
G T
HE
UN
DER
STA
ND
ING
, C
OM
PREH
ENSI
ON
, PRA
CTI
CE,
AN
D D
EVEL
OPM
ENT
OF
RELI
GIO
US
VALU
ES
-
13,
805,
472
250
,750
1
10,2
78,5
78
124
,334
,800
09.
02.0
1 P
ROG
RAM
OF
INC
REA
SIN
G T
HE
HA
RMO
NY
BET
WEE
N
RELI
GIO
NS
-
1
6,50
2,48
8 4
,769
,652
9
,227
,860
3
0,50
0,00
0
09.
03.0
1 R
ELIG
ION
DEV
ELO
PMEN
T A
ND
RES
EARC
H P
ROG
RAM
-
3
0,20
9,06
2 1
,644
,638
1
,180
,000
3
3,03
3,70
0
09.
90.0
1 D
EVEL
OPM
ENT
PRO
GRA
M O
F RE
LIG
IOU
S ED
UC
ATI
ON
-A
L IN
STIT
UTI
ON
S A
ND
REL
IGIO
US
SOC
IAL
AG
ENC
IES
-
1
,857
,000
1
00,0
00
37,
650,
000
39,
607,
000
10.
01.0
1 E
ARL
Y A
GE
CH
ILD
REN
ED
UC
ATI
ON
AL
PRO
GRA
M
-
9,2
40,9
00
-
36,
030,
500
45,
271,
400
10.
02.0
1 L
EARN
ING
OBL
IGA
TIO
N P
ROG
RAM
OF
NIN
E-Y
EAR
BASI
C E
DU
CA
TIO
N
-
1,0
83,6
95,8
59
728
,395
,543
3
,933
,553
,598
5
,745
,645
,000
10.
03.0
1 P
OST
-ELE
MEN
TARY
ED
UC
ATI
ON
AL
PRO
GRA
M
-
224
,373
,102
3
64,5
09,4
48
500
,192
,650
1
,089
,075
,200
10.
04.0
1 N
ON
-FO
RMA
L ED
UC
ATI
ON
AL
PRO
GRA
M
-
12,
470,
295
1,2
10,6
00
34,
625,
805
48,
306,
700
10.
06.0
1 H
IGH
ER E
DU
CA
TIO
N P
ROG
RAM
-
7
57,9
34,5
61
793
,489
,487
2
14,5
83,2
52
1,7
66,0
07,3
00
10.
07.0
1 T
EAC
HER
AN
D E
DU
CA
TIO
NA
L EM
PLO
YEE
QU
ALI
TY
INC
REA
SE P
ROG
RAM
-
1
,647
,095
,765
3
6,43
2,50
1 1
,700
,984
,569
3
,384
,512
,835
10.
07.0
3 E
DU
CA
TIO
NA
L SE
RVIC
E M
AN
AG
EMEN
T PR
OG
RAM
1
0,65
5,77
8,50
6 5
26,1
60,5
33
37,
861,
608
15,
096,
980
11,
234,
897,
627
10.
08.0
1 R
ELIG
IOU
S ED
UC
ATI
ON
INC
REA
SE P
ROG
RAM
-
3
05,5
27,3
86
16,
132,
531
218
,068
,816
5
39,7
28,7
33

254 THE INDONESIANBUDGET OVERVIEW 2010
BUD
GET
SEC
TIO
NS
AN
D P
ROG
RAM
SPE
RSO
NN
EL
EXPE
ND
I-TU
RES
GO
OD
S EX
-PE
ND
ITU
RES
CAPI
TAL
EX-
PEN
DIT
URE
SSO
CIA
L A
S-SI
STA
NCE
STO
TAL
11.
05.0
1 C
HIL
DRE
N A
ND
GEN
DER
MA
INST
REA
MIN
G IN
STIT
U-
TIO
NA
L RE
INFO
RCEM
ENT
PRO
GRA
M
-
2,2
79,2
50
-
40,
750
2,3
20,0
00
026
M
INIS
TRY
OF
LABO
R A
ND
TRA
NSM
IGRA
TIO
N
253
,692
,413
2
,006
,577
,280
5
89,3
60,1
39
10,
668,
975
2,8
60,2
98,8
07
01.
01.0
9 G
OO
D G
OV
ERN
AN
CE
IMPL
EMEN
TATI
ON
PRO
GRA
M
253
,692
,413
1
78,9
47,1
80
238
,067
4
5,00
0 4
32,9
22,6
60
01.
01.1
0 S
TATE
APP
ARA
TUS
AC
CO
UN
TABI
LITY
AN
D S
UPE
RVIS
ION
IN
CRE
ASE
PRO
GRA
M
-
24,
630,
900
-
-
24,
630,
900
01.
01.1
3 A
PPA
RATU
S RE
SOU
RCE
MA
NA
GEM
ENT
PRO
GRA
M
-
22,
401,
200
20,
000
-
22,
421,
200
01.
01.1
7 S
TATE
APP
ARA
TUS
MEA
NS
AN
D F
AC
ILIT
Y IN
CRE
ASE
PR
OG
RAM
-
4
,523
,800
1
9,98
6,70
0 -
2
4,51
0,50
0
01.
04.0
3 T
ECH
NO
LOG
Y A
ND
SC
IEN
CE
DEV
ELO
PMEN
T A
ND
RE
SEA
RCH
PRO
GRA
M
-
17,
501,
473
1,5
10,1
27
47,
000
19,
058,
600
04.
02.0
1 L
ABO
R PR
OD
UC
TIV
ITY
AN
D Q
UA
LITY
INC
REA
SE P
RO-
GRA
M
-
377
,063
,002
1
82,1
84,6
45
-
559
,247
,647
04.
02.0
3 L
ABO
R IN
STIT
UTI
ON
AL
DEV
ELO
PMEN
T A
ND
PRO
TEC
-TI
ON
PRO
GRA
M
-
226
,205
,196
4
,341
,279
1
,569
,925
2
32,1
16,4
00
04.
02.0
4 J
OB
OPP
ORT
UN
ITY
DEV
ELO
PMEN
T A
ND
EX
TEN
SIO
N
PRO
GRA
M
-
344
,665
,488
2
6,43
6,81
2 9
18,0
00
372
,020
,300
06.
90.0
1 B
ORD
ERLA
ND
DEV
ELO
PMEN
T PR
OG
RAM
-
7
1,55
9,23
8 3
3,84
6,76
2 5
0,00
0 1
05,4
56,0
00
06.
90.0
2 F
AST
GRO
WIN
G A
ND
STR
ATE
GIC
ARE
AS
DEV
ELO
P-M
ENT
PRO
GRA
M
-
292
,810
,377
9
0,45
3,52
3 2
,133
,800
3
85,3
97,7
00
06.
90.0
3 B
AC
KW
ARD
S RE
GIO
NS
DEV
ELO
PMEN
T PR
OG
RAM
-
4
46,2
69,4
26
230
,342
,224
5
,905
,250
6
82,5
16,9
00
027
M
INIS
TRY
OF
SOC
IAL
AFF
AIR
S 1
91,4
50,0
00
1,1
89,8
76,4
91
127
,262
,721
2
,119
,117
,107
3
,627
,706
,319
01.
01.0
9 G
OO
D G
OV
ERN
AN
CE
IMPL
EMEN
TATI
ON
PRO
GRA
M
191
,450
,000
2
07,5
06,2
36
2,7
04,2
70
558
,000
4
02,2
18,5
06
01.
01.1
0 S
TATE
APP
ARA
TUS
AC
CO
UN
TABI
LITY
AN
D S
UPE
RVIS
ION
IN
CRE
ASE
PRO
GRA
M
-
14,
399,
900
881
,900
-
1
5,28
1,80
0
01.
01.1
3 A
PPA
RATU
S RE
SOU
RCE
MA
NA
GEM
ENT
PRO
GRA
M
-
28,
954,
400
-
-
28,
954,
400
01.
01.1
7 S
TATE
APP
ARA
TUS
MEA
NS
AN
D F
AC
ILIT
Y IN
CRE
ASE
PR
OG
RAM
-
2
98,2
31
36,
525,
769
-
36,
824,
000
10.
05.0
1 O
FFIC
IAL
DU
TY T
RAIN
ING
PRO
GRA
M
-
17,
309,
500
200
,000
1
,068
,500
1
8,57
8,00
0
11.
04.0
1 E
MPO
WER
MEN
T PR
OG
RAM
FO
R TH
E PO
OR,
ISO
LATE
D
TRA
DIT
ION
AL
CO
MM
UN
ITY
(KA
T), A
ND
PEO
PLE
WIT
H
WEL
FARE
PRO
BLEM
S
-
120
,148
,628
3
80,5
00
475
,399
,872
5
95,9
29,0
00

255THE INDONESIANBUDGET OVERVIEW 2010
BUD
GET
SEC
TIO
NS
AN
D P
ROG
RAM
SPE
RSO
NN
EL
EXPE
ND
I-TU
RES
GO
OD
S EX
-PE
ND
ITU
RES
CAPI
TAL
EX-
PEN
DIT
URE
SSO
CIA
L A
S-SI
STA
NCE
STO
TAL
11.
05.0
1 C
HIL
DRE
N A
ND
GEN
DER
MA
INST
REA
MIN
G IN
STIT
U-
TIO
NA
L RE
INFO
RCEM
ENT
PRO
GRA
M
-
2,1
20,6
00
-
-
2,1
20,6
00
11.
06.0
1 S
OC
IAL
WEL
FARE
REH
ABI
LITA
TIO
N A
ND
SER
VIC
E PR
O-
GRA
M
-
193
,606
,849
2
6,75
5,36
2 3
07,1
78,1
89
527
,540
,400
11.
06.0
2 Q
UA
LITY
INC
REA
SE P
ROG
RAM
FO
R SO
CIA
L W
ELFA
RE
CO
UN
SELI
NG
-
2
5,20
9,35
0 -
6
34,7
50
25,
844,
100
11.
08.0
1 S
OC
IAL
WEL
FARE
GU
ARA
NTE
E A
ND
ASS
ISTA
NC
E PR
OG
RAM
-
4
55,4
29,0
54
47,
747,
050
1,3
12,4
72,7
96
1,8
15,6
48,9
00
11.
09.0
1 S
OC
IAL
WEL
FARE
DEV
ELO
PMEN
T A
ND
RES
EARC
H
PRO
GRA
M
-
21,
234,
900
-
504
,000
2
1,73
8,90
0
11.
90.0
1 D
EVEL
OPM
ENT
PRO
GRA
M O
F SO
CIA
L PR
OTE
CTI
ON
SY
STEM
-
5
,977
,700
-
-
5
,977
,700
11.
90.0
2 E
MPO
WER
MEN
T PR
OG
RAM
FO
R SO
CIA
L W
ELFA
RE
INST
ITU
TIO
NS
-
9
7,68
1,14
3 1
2,06
7,87
0 2
1,30
1,00
0 1
31,0
50,0
13
029
M
INIS
TRY
OF
FORE
STRY
7
21,6
39,1
55
2,3
00,4
70,5
11
323
,164
,434
3
,170
,000
3
,348
,444
,100
01.
01.0
9 G
OO
D G
OV
ERN
AN
CE
IMPL
EMEN
TATI
ON
PRO
GRA
M
721
,639
,155
4
92,1
15,4
01
7,4
88,1
94
-
1,2
21,2
42,7
50
01.
01.1
0 S
TATE
APP
ARA
TUS
AC
CO
UN
TABI
LITY
AN
D S
UPE
RVIS
ION
IN
CRE
ASE
PRO
GRA
M
-
21,
046,
350
2,3
15,7
50
-
23,
362,
100
01.
04.0
1 T
ECH
NO
LOG
Y A
ND
SC
IEN
CE
DEV
ELO
PMEN
T A
ND
RE
SEA
RCH
PRO
GRA
M
-
96,
733,
499
26,
093,
101
-
122
,826
,600
03.
01.0
9 D
OM
ESTI
C S
ECU
RITY
EN
FORC
EMEN
T PR
OG
RAM
-
9
6,39
4,73
2 1
5,63
3,96
8 -
1
12,0
28,7
00
04.
03.0
2 E
NFO
RCEM
NET
PRO
GRA
M F
OR
FORE
STRY
RES
OU
RCE
POTE
NTI
AL
USE
-
3
03,1
79,3
29
26,
218,
771
-
329
,398
,100
05.
04.0
1 N
ATU
RAL
RESO
URC
E C
ON
SERV
ATI
ON
AN
D P
ROTE
C-
TIO
N P
ROG
RAM
-
3
30,6
33,5
13
156
,891
,887
-
4
87,5
25,4
00
05.
04.0
2 R
EHA
BILI
TATI
ON
AN
D R
ECO
VER
Y P
ROG
RAM
FO
R N
ATU
RAL
RESO
URC
E RE
SERV
ES
-
728
,271
,707
3
6,52
0,89
3 -
7
64,7
92,6
00
05.
04.0
3 D
EVEL
OPM
ENT
PRO
GRA
M F
OR
THE
CA
PAC
ITY
OF
ENV
IRO
NM
ENT
AN
D N
ATU
RAL
RESO
URC
E M
AN
AG
E-M
ENT
-
54,
892,
182
16,
124,
468
3,1
70,0
00
74,
186,
650
05.
90.0
1 IN
FORM
ATI
ON
AC
CES
S A
ND
QU
ALI
TY IN
CRE
ASE
PRO
-G
RAM
OF
NA
TURA
L RE
SOU
RCE
AN
D E
NV
IRO
NM
ENT
-
1
20,8
37,5
19
13,
290,
081
-
134
,127
,600

256 THE INDONESIANBUDGET OVERVIEW 2010
BUD
GET
SEC
TIO
NS
AN
D P
ROG
RAM
SPE
RSO
NN
EL
EXPE
ND
I-TU
RES
GO
OD
S EX
-PE
ND
ITU
RES
CAPI
TAL
EX-
PEN
DIT
URE
SSO
CIA
L A
S-SI
STA
NCE
STO
TAL
10.
03.0
1 P
OST
-ELE
MEN
TARY
ED
UC
ATI
ON
AL
PRO
GRA
M
-
12,
481,
705
12,
518,
295
-
25,
000,
000
10.
05.0
1 O
FFIC
IAL
DU
TY T
RAIN
ING
PRO
GRA
M
-
43,
884,
574
10,
069,
026
-
53,
953,
600
032
M
INIS
TRY
OF
MA
RITI
ME
AFF
AIR
S A
ND
FIS
HER
IES
370
,749
,400
1
,949
,663
,297
8
11,9
48,2
51
58,
479,
250
3,1
90,8
40,1
98
01.
01.0
9 G
OO
D G
OV
ERN
AN
CE
IMPL
EMEN
TATI
ON
PRO
GRA
M
328
,206
,176
2
40,1
34,1
30
1,4
58,6
94
-
569
,799
,000
01.
01.1
0 S
TATE
APP
ARA
TUS
AC
CO
UN
TABI
LITY
AN
D S
UPE
RVI-
SIO
N IN
CRE
ASE
PRO
GRA
M
-
30,
577,
148
799
,452
-
3
1,37
6,60
0
01.
01.1
3 A
PPA
RATU
S RE
SOU
RCE
MA
NA
GEM
ENT
PRO
GRA
M
-
9,4
49,1
00
-
-
9,4
49,1
00
01.
01.1
7 S
TATE
APP
ARA
TUS
MEA
NS
AN
D F
AC
ILIT
Y IN
CRE
ASE
PR
OG
RAM
-
4
,040
,070
5
4,25
0,09
5 -
5
8,29
0,16
5
01.
04.0
1 T
ECH
NO
LOG
Y A
ND
SC
IEN
CE
DEV
ELO
PMEN
T A
ND
RE
SEA
RCH
PRO
GRA
M
-
66,
065,
217
1,2
23,0
55
-
67,
288,
272
04.
03.0
5 M
ARI
TIM
E RE
SOU
RCE
MA
NA
GEM
ENT
AN
D D
EVEL
OP-
MEN
T PR
OG
RAM
-
3
48,3
31,0
37
130
,828
,963
-
4
79,1
60,0
00
04.
03.0
6 F
ISH
ERY
RES
OU
RCE
DEV
ELO
PMEN
T PR
OG
RAM
1
1,40
0 9
47,1
15,6
35
583
,993
,431
5
5,21
6,75
0 1
,586
,337
,216
04.
09.0
3 M
AST
ERY
AN
D D
EVEL
OPM
ENT
PRO
GRA
M O
N T
HE
APP
LIC
ATI
ON
AN
D T
ECH
NO
LOG
Y O
F IN
FORM
ATI
ON
A
ND
TEC
HN
OLO
GY
-
37,
148,
215
970
,750
-
3
8,11
8,96
5
05.
04.0
1 N
ATU
RAL
RESO
URC
E C
ON
SERV
ATI
ON
AN
D P
ROTE
C-
TIO
N P
ROG
RAM
-
2
0,26
9,00
0 5
31,0
00
-
20,
800,
000
05.
04.0
2 R
EHA
BILI
TATI
ON
AN
D R
ECO
VER
Y P
ROG
RAM
FO
R N
ATU
RAL
RESO
URC
E RE
SERV
ES
-
162
,980
,902
1
7,07
6,59
8 3
,262
,500
1
83,3
20,0
00
05.
05.0
1 T
ERRI
TORI
AL
MA
NA
GEM
ENT
PRO
GRA
M
-
4,9
10,0
00
90,
000
-
5,0
00,0
00
10.
03.0
1 P
OST
-ELE
MEN
TARY
ED
UC
ATI
ON
AL
PRO
GRA
M
19,
298,
757
34,
938,
300
10,
075,
942
-
64,
312,
999
10.
06.0
1 H
IGH
ER E
DU
CA
TIO
N P
ROG
RAM
2
3,23
3,06
7 4
3,70
4,54
3 1
0,65
0,27
1 -
7
7,58
7,88
1
033
M
INIS
TRY
OF
PUBL
IC W
ORK
S 9
92,5
82,2
57
6,4
49,4
53,0
34
24,
846,
974,
279
2,5
07,4
99,0
00
34,
796,
508,
570
01.
01.0
9 G
OO
D G
OV
ERN
AN
CE
IMPL
EMEN
TATI
ON
PRO
GRA
M
992
,582
,257
5
02,8
63,8
78
1,8
61,3
77
-
1,4
97,3
07,5
12
01.
01.1
0 S
TATE
APP
ARA
TUS
AC
CO
UN
TABI
LITY
AN
D S
UPE
RVI-
SIO
N IN
CRE
ASE
PRO
GRA
M
-
23,
050,
000
3,1
50,0
00
-
26,
200,
000
01.
01.1
2 A
DM
INIS
TRA
TIO
N A
ND
INST
ITU
TIO
NA
L M
AN
AG
E-M
ENT
PRO
GRA
M
-
81,
806,
604
1,4
93,8
95
-
83,
300,
499
01.
01.1
3 A
PPA
RATU
S RE
SOU
RCE
MA
NA
GEM
ENT
PRO
GRA
M
-
89,
658,
945
5,0
41,6
84
-
94,
700,
629

257THE INDONESIANBUDGET OVERVIEW 2010
BUD
GET
SEC
TIO
NS
AN
D P
ROG
RAM
SPE
RSO
NN
EL
EXPE
ND
I-TU
RES
GO
OD
S EX
-PE
ND
ITU
RES
CAPI
TAL
EX-
PEN
DIT
URE
SSO
CIA
L A
S-SI
STA
NCE
STO
TAL
01.
01.1
5 P
UBL
IC S
ERV
ICE
QU
ALI
TY IN
CRE
ASE
PRO
GRA
M
-
68,
005,
267
19,
453,
513
-
87,
458,
780
01.
01.1
7 S
TATE
APP
ARA
TUS
MEA
NS
AN
D F
AC
ILIT
Y IN
CRE
ASE
PR
OG
RAM
-
1
7,32
2,53
3 6
80,0
00
-
18,
002,
533
01.
03.0
3 P
EOPL
E EM
POW
ERM
ENT
PRO
GRA
M
-
15,
450,
000
-
-
15,
450,
000
01.
04.0
1 T
ECH
NO
LOG
Y A
ND
SC
IEN
CE
DEV
ELO
PMEN
T A
ND
RE
SEA
RCH
PRO
GRA
M
-
74,
539,
234
13,
097,
066
-
87,
636,
300
01.
06.0
7 L
OC
AL
ECO
NO
MIC
DEV
ELO
PMEN
T PR
OG
RAM
-
1
3,22
7,94
2 8
5,27
2,05
8 -
9
8,50
0,00
0
01.
90.0
3 N
AD
AN
D N
IAS
CO
NTR
UC
TIO
N A
ND
REH
ABI
LITA
TIO
N
-
26,
874,
980
394
,492
,220
-
4
21,3
67,2
00
04.
04.0
1 D
EVEL
OPM
ENT,
MA
NA
GEM
ENT,
AN
D C
ON
SERV
ATI
ON
PR
OG
RAM
FO
R RI
VER
S, L
AK
ES, A
ND
OTH
ER W
ATE
R RE
SOU
RCES
-
436
,890
,583
1
,793
,072
,639
-
2
,229
,963
,222
04.
04.0
3 D
EVEL
OPM
ENT
AN
D M
AN
AG
EMEN
T PR
OG
RAM
FO
R IR
RIG
ATI
ON
NET
WO
RKS,
SW
AM
PS, A
ND
OTH
ER W
A-
TERI
NG
NET
WO
RKS
-
750
,328
,784
2
,536
,015
,816
-
3
,286
,344
,600
04.
08.0
1 R
OA
D A
ND
BRI
DG
E M
AIN
TEN
AN
CE/
REH
ABI
LITA
TIO
N
PRO
GRA
M
-
1,4
92,3
42,9
95
4,1
82,2
46,7
70
-
5,6
74,5
89,7
65
04.
08.0
2 R
OA
D A
ND
BRI
DG
E D
EVEL
OPM
ENT/
IMPR
OV
EMEN
T PR
OG
RAM
-
6
90,2
67,1
66
9,8
81,7
69,0
58
-
10,
572,
036,
224
05.
01.0
1 D
EVEL
OPM
ENT
PRO
GRA
M F
OR
DRA
INA
GE
AN
D
WA
STE
MA
NA
GEM
ENT
PERF
ORM
AN
CE
-
3
5,78
2,04
0 4
59,5
87,9
60
-
495
,370
,000
05.
01.0
2 IN
STIT
UTI
ON
AL
DEV
ELO
PMEN
T PR
OG
RAM
-
7
,500
,000
5
00,0
00
-
8,0
00,0
00
05.
04.0
4 C
OA
STA
L SA
FETY
AN
D F
LOO
D C
ON
TRO
L PR
OG
RAM
-
1
63,9
92,2
66
1,7
87,8
07,0
16
-
1,9
51,7
99,2
82
05.
05.0
1 T
ERRI
TORI
AL
MA
NA
GEM
ENT
PRO
GRA
M
-
283
,250
,100
1
7,03
8,60
0 -
3
00,2
88,7
00
06.
01.0
1 H
OU
SIN
G D
EVEL
OPM
ENT
PRO
GRA
M
-
210
,971
,241
8
04,2
64,0
83
-
1,0
15,2
35,3
24
06.
02.0
2 E
MPO
WER
MEN
T PR
OG
RAM
FO
R H
OU
SIN
G C
OM
-M
UN
ITY
-
6
14,5
07,3
16
331
,749
,584
1
,496
,091
,000
2
,442
,347
,900
06.
03.0
1 M
AN
AG
EMEN
T A
ND
PRO
VIS
ION
PRO
GRA
M F
OR
STA
ND
ARD
WA
TER
-
35,
642,
525
1,0
60,9
93,8
75
-
1,0
96,6
36,4
00
06.
03.0
2 P
ERFO
RMA
NC
E D
EVEL
OPM
ENT
PRO
GRA
M F
OR
DRI
NK
ING
WA
TER
AN
D W
AST
E W
ATE
R M
AN
AG
EMEN
T -
4
70,7
03,9
64
1,4
37,3
05,3
36
261
,408
,000
2
,169
,417
,300
06.
90.0
1 B
ORD
ERLA
ND
DEV
ELO
PMEN
T PR
OG
RAM
-
2
5,05
0,00
0 1
6,65
0,00
0 -
4
1,70
0,00
0

258 THE INDONESIANBUDGET OVERVIEW 2010
BUD
GET
SEC
TIO
NS
AN
D P
ROG
RAM
SPE
RSO
NN
EL
EXPE
ND
I-TU
RES
GO
OD
S EX
-PE
ND
ITU
RES
CAPI
TAL
EX-
PEN
DIT
URE
SSO
CIA
L A
S-SI
STA
NCE
STO
TAL
06.
90.0
2 D
EVEL
OPM
ENT
PRO
GRA
M F
OR
FAST
GRO
WIN
G A
ND
ST
RATE
GIC
TER
RITO
RIES
-
1
,691
,000
-
-
1
,691
,000
06.
90.0
3 B
AC
KW
ARD
REG
ION
S D
EVEL
OPM
ENT
PRO
GRA
M
-
11,
701,
665
148
,335
-
1
1,85
0,00
0
06.
90.0
6 M
ETRO
POLI
TAN
AN
D B
IG C
ITIE
S D
EVEL
OPM
ENT
CO
N-
TRO
LLIN
G P
ROG
RAM
-
7
,000
,000
8
,000
,000
-
1
5,00
0,00
0
06.
90.0
7 R
URA
L M
EAN
S A
ND
FA
CIL
ITIE
S IN
CRE
ASE
PRO
GRA
M
-
200
,393
,200
3
50,0
00
750
,000
,000
9
50,7
43,2
00
06.
90.0
8 D
EVEL
OPM
ENT
PRO
GRA
M F
OR
THE
DEV
ELO
PMEN
T IN
TERC
ON
NEC
TIO
N B
ETW
EEN
CIT
IES
-
1
2,00
0,00
0 -
-
1
2,00
0,00
0
06.
90.1
0 M
EDIU
M A
ND
SM
ALL
CIT
IES
DEV
ELO
PMEN
T PR
O-
GRA
M
-
32,
770,
000
1,2
80,0
00
-
34,
050,
000
08.
03.0
1 C
OM
MU
NIC
ATI
ON
, IN
FORM
ATI
ON
, AN
D M
ASS
ME-
DIA
DEV
ELO
PMEN
T PR
OG
RAM
-
1
0,28
0,35
0 6
79,5
50
-
10,
959,
900
10.
05.0
1 O
FFIC
IAL
DU
TY T
RAIN
ING
PRO
GRA
M
-
3,6
95,8
38
611
,362
-
4
,307
,200
10.
06.0
1 H
IGH
ER E
DU
CA
TIO
N P
ROG
RAM
-
3
9,89
2,61
8 2
,362
,482
-
4
2,25
5,10
0
034
C
OO
RDIN
ATI
NG
MIN
ISTR
Y F
OR
LEG
AL,
PO
LITI
CA
L, A
ND
SEC
URI
TY A
F-FA
IRS
19,
604,
571
127
,583
,883
6
1,65
9,09
6 -
2
08,8
47,5
50
01.
01.0
6 N
ATI
ON
AL
UN
ITY
AN
D E
NTI
TY C
OM
MIT
MEN
T IN
-C
REA
SE P
ROG
RAM
-
5
3,00
0,00
0 -
-
5
3,00
0,00
0
01.
01.0
9 G
OO
D G
OV
ERN
AN
CE
IMPL
EMEN
TATI
ON
PRO
GRA
M
19,
604,
571
39,
288,
379
388
,500
-
5
9,28
1,45
0
01.
01.1
7 S
TATE
APP
ARA
TUS
MEA
NS
AN
D F
AC
ILIT
Y IN
CRE
ASE
PR
OG
RAM
-
2
95,5
04
61,
270,
596
-
61,
566,
100
03.
01.0
9 D
OM
ESTI
C S
ECU
RITY
EN
FORC
EMEN
T PR
OG
RAM
-
3
5,00
0,00
0 -
-
3
5,00
0,00
0
035
C
OO
RDIN
ATI
NG
MIN
ISTR
Y F
OR
THE
ECO
NO
MY
1
0,00
0,00
0 9
6,98
5,49
2 4
,417
,931
-
1
11,4
03,4
23
01.
01.0
9 G
OO
D G
OV
ERN
AN
CE
IMPL
EMEN
TATI
ON
PRO
GRA
M
10,
000,
000
22,
177,
662
4,2
19,7
61
-
36,
397,
423
01.
01.2
4 F
INA
NC
IAL
SEC
TOR
AN
D E
CO
NO
MIC
STA
BILI
ZATI
ON
PR
OG
RAM
-
1
6,39
3,38
0 1
06,6
20
-
16,
500,
000
04.
01.0
5 M
ICRO
, SM
ALL
, AN
D M
EDIU
M E
NTE
RPRI
SES
CLI
MA
TE
ESTA
BLIS
HM
ENT
PRO
GRA
M
-
9,2
00,0
00
-
-
9,2
00,0
00
04.
01.0
6 E
XPO
RT D
EVEL
OPM
ENT
AN
D IN
CRE
ASE
PRO
GRA
M
-
9,5
00,0
00
-
-
9,5
00,0
00
04.
01.1
2 E
FFIC
IEN
CY
INC
REA
SE P
ROG
RAM
ON
DO
MES
TIC
TR
AD
ING
-
1
,200
,000
-
-
1
,200
,000

259THE INDONESIANBUDGET OVERVIEW 2010
BUD
GET
SEC
TIO
NS
AN
D P
ROG
RAM
SPE
RSO
NN
EL
EXPE
ND
I-TU
RES
GO
OD
S EX
-PE
ND
ITU
RES
CAPI
TAL
EX-
PEN
DIT
URE
SSO
CIA
L A
S-SI
STA
NCE
STO
TAL
04.
03.0
3 A
GRI
BUSI
NES
S D
EVEL
OPM
ENT
PRO
GRA
M
-
7,8
00,0
00
-
-
7,8
00,0
00
04.
03.0
4 F
OO
D D
EFEN
CE
INC
REA
SE P
ROG
RAM
-
7
,200
,000
-
-
7
,200
,000
04.
05.0
5 A
CC
ESSI
BILI
TY IN
CRE
ASE
PRO
GRA
M O
F RE
GIO
NA
L G
OV
ERN
MEN
TS, C
OO
PERA
TIV
ES, A
ND
TH
E PU
BLIC
ON
EN
ERG
Y M
EAN
S A
ND
FA
CIL
ITY
SER
VIC
ES
-
8,1
50,0
00
50,
000
-
8,2
00,0
00
04.
06.0
2 F
OU
ND
ING
PRO
GRA
M F
OR
OIL
AN
D G
AS
MIN
ING
EN
TERP
RISE
S
-
3,1
90,0
00
-
-
3,1
90,0
00
05.
04.0
2 R
EHA
BILI
TATI
ON
AN
D R
ECO
VER
Y P
ROG
RAM
ON
N
ATU
RAL
RESO
URC
E RE
SERV
ES
-
1,1
30,0
00
20,
000
-
1,1
50,0
00
06.
90.0
2 D
EVEL
OPM
ENT
PRO
GRA
M F
OR
STRA
TEG
IC A
ND
FA
ST
GRO
WIN
G T
ERRI
TORI
ES
-
11,
044,
450
21,
550
-
11,
066,
000
036
C
OO
RDIN
ATI
NG
MIN
ISTR
Y O
F PE
OPL
E’S
WEL
FARE
1
4,51
1,89
5 7
8,75
4,44
1 7
,901
,980
-
1
01,1
68,3
16
01.
01.0
9 G
OO
D G
OV
ERN
AN
CE
IMPL
EMEN
TATI
ON
PRO
GRA
M
14,
511,
895
27,
052,
197
-
-
41,
564,
092
11.
09.0
2 D
EVEL
OPM
ENT
AN
D H
ARM
ON
IZA
TIO
N P
ROG
RAM
ON
PE
OPL
E W
ELFA
RE P
OLI
CIE
S
-
51,
702,
244
7,9
01,9
80
-
59,
604,
224
040
M
INIS
TRY
OF
CU
LTU
RE A
ND
TO
URI
SM
240
,714
,084
1
,055
,948
,400
3
05,7
42,0
95
14,
160,
000
1,6
16,5
64,5
79
01.
01.0
9 G
OO
D G
OV
ERN
AN
CE
IMPL
EMEN
TATI
ON
PRO
GRA
M
204
,047
,668
1
27,0
02,4
56
12,
358,
233
-
343
,408
,357
01.
01.1
0 S
TATE
APP
ARA
TUS
AC
CO
UN
TABI
LITY
AN
D S
UPE
RVI-
SIO
N IN
CRE
ASE
PRO
GRA
M
-
17,
270,
000
750
,000
-
1
8,02
0,00
0
01.
01.1
2 A
DM
INIS
TRA
TIO
N A
ND
INST
ITU
TIO
NA
L M
AN
AG
E-M
ENT
PRO
GRA
M
-
77,
393,
439
3,8
35,8
64
-
81,
229,
303
08.
01.0
1 C
ULT
URE
VA
LUES
DEV
ELO
PMEN
T PR
OG
RAM
-
5
0,44
6,36
6 3
,553
,634
-
5
4,00
0,00
0
08.
01.0
2 M
AN
AG
EMEN
T PR
OG
RAM
FO
R C
ULT
URE
PRO
PERT
IES
-
1
06,4
02,3
91
40,
300,
309
-
146
,702
,700
08.
01.0
3 M
AN
AG
EMEN
T PR
OG
RAM
FO
R C
ULT
URE
VA
RIET
IES
-
6
6,89
7,31
9 5
,522
,100
-
7
2,41
9,41
9
08.
01.0
4 D
EVEL
OPM
ENT
PRO
GRA
M F
OR
TOU
RISM
MA
RKET
ING
-
4
23,7
50,0
81
2,5
89,4
19
-
426
,339
,500
08.
01.0
5 D
EVEL
OPM
ENT
PRO
GRA
M F
OR
TOU
RISM
DES
TIN
A-
TIO
N
-
95,
071,
500
21,
268,
500
14,
160,
000
130
,500
,000
08.
01.0
6 P
ART
NER
SHIP
DEV
ELO
PMEN
T PR
OG
RAM
-
2
5,94
0,00
0 6
0,00
0 -
2
6,00
0,00
0
10.
06.0
1 H
IGH
ER E
DU
CA
TIO
N P
ROG
RAM
3
6,66
6,41
6 6
5,77
4,84
8 2
15,5
04,0
36
-
317
,945
,300
041
S
TATE
MIN
ISTR
Y F
OR
STA
TE O
WN
ED E
NTE
RPRI
SES
19,
000,
000
86,
065,
926
9,1
37,1
84
-
114
,203
,110

260 THE INDONESIANBUDGET OVERVIEW 2010
BUD
GET
SEC
TIO
NS
AN
D P
ROG
RAM
SPE
RSO
NN
EL
EXPE
ND
I-TU
RES
GO
OD
S EX
-PE
ND
ITU
RES
CAPI
TAL
EX-
PEN
DIT
URE
SSO
CIA
L A
S-SI
STA
NCE
STO
TAL
01.
01.0
9 G
OO
D G
OV
ERN
AN
CE
IMPL
EMEN
TATI
ON
PRO
GRA
M
19,
000,
000
16,
861,
856
344
,954
-
3
6,20
6,81
0
01.
01.1
0 S
TATE
APP
ARA
TUS
AC
CO
UN
TABI
LITY
AN
D S
UPE
RVI-
SIO
N IN
CRE
ASE
PRO
GRA
M
-
1,2
80,6
00
-
-
1,2
80,6
00
01.
01.1
5 IN
CRE
ASE
PRO
GRA
M F
OR
PUBL
IC S
ERV
ICE
QU
ALI
TY
-
12,
461,
370
4,7
92,2
30
-
17,
253,
600
01.
01.1
7 S
TATE
APP
ARA
TUS
MEA
NS
AN
D F
AC
ILIT
Y IN
CRE
ASE
PR
OG
RAM
-
-
4
,000
,000
-
4
,000
,000
04.
90.0
4 D
EVEL
OPM
ENT
AN
D F
OU
ND
ING
PRO
GRA
M F
OR
STA
TE-O
WN
ED E
NTE
RPRI
SES
-
5
5,46
2,10
0 -
-
5
5,46
2,10
0
042
S
TATE
MIN
ISTR
Y F
OR
RESE
ARC
H A
ND
TEC
HN
OLO
GY
2
9,12
1,13
7 2
74,4
11,7
87
331
,981
,145
-
6
35,5
14,0
69
01.
01.0
9 G
OO
D G
OV
ERN
AN
CE
IMPL
EMEN
TATI
ON
PRO
GRA
M
29,
121,
137
48,
444,
980
1,8
40,6
52
-
79,
406,
769
01.
01.1
0 S
TATE
APP
ARA
TUS
AC
CO
UN
TABI
LITY
AN
D S
UPE
RVI-
SIO
N IN
CRE
ASE
PRO
GRA
M
-
1,9
86,5
00
13,
500
-
2,0
00,0
00
01.
01.1
3 A
PPA
RATU
S RE
SOU
RCE
MA
NA
GEM
ENT
PRO
GRA
M
-
1,5
00,0
00
-
-
1,5
00,0
00
01.
01.1
7 S
TATE
APP
ARA
TUS
MEA
NS
AN
D F
AC
ILIT
Y IN
CRE
ASE
PR
OG
RAM
-
7
,271
,046
9
,836
,254
-
1
7,10
7,30
0
01.
04.0
1 T
ECH
NO
LOG
Y A
ND
SC
IEN
CE
RESE
ARC
H A
ND
DEV
EL-
OPM
ENT
PRO
GRA
M
-
39,
512,
128
242
,087
,872
-
2
81,6
00,0
00
01.
04.0
2 T
ECH
NO
LOG
Y A
ND
SC
IEN
CE
USE
AN
D D
IFU
SSIO
N
PRO
GRA
M
-
57,
021,
666
26,
978,
334
-
84,
000,
000
01.
04.0
3 E
NFO
RCEM
ENT
PRO
GRA
M F
OR
TEC
HN
OLO
GY
AN
D
SCIE
NC
E IN
STIT
UTI
ON
S
-
94,
754,
467
9,6
45,5
33
-
104
,400
,000
04.
07.0
1 C
APA
CIT
Y IN
CRE
ASE
PRO
GRA
M F
OR
THE
TEC
HN
OL-
OG
Y A
ND
SC
IEN
CE
OF
PRO
DU
CTI
ON
SY
STEM
-
2
3,92
1,00
0 4
1,57
9,00
0 -
6
5,50
0,00
0
043
S
TATE
MIN
ISTR
Y F
OR
ENV
IRO
NM
ENTA
L PR
OTE
CTI
ON
4
2,20
8,87
1 3
48,7
25,9
03
13,
441,
144
-
404
,375
,918
01.
01.0
9 G
OO
D G
OV
ERN
AN
CE
IMPL
EMEN
TATI
ON
PRO
GRA
M
42,
208,
871
51,
144,
020
1,7
40,8
29
-
95,
093,
720
01.
01.1
7 S
TATE
APP
ARA
TUS
MEA
NS
AN
D F
AC
ILIT
Y IN
CRE
ASE
PR
OG
RAM
-
3
3,35
5 1
,966
,645
-
2
,000
,000
05.
03.0
2 E
NV
IRO
NM
ENT
DA
MA
GE
AN
D P
OLL
UTI
ON
CO
NTR
OL
PRO
GRA
M
-
145
,636
,978
5
,997
,320
-
1
51,6
34,2
98
05.
04.0
1 N
ATU
RAL
RESO
URC
E C
ON
SERV
ATI
ON
AN
D P
ROTE
C-
TIO
N P
ROG
RAM
-
1
3,47
7,20
0 4
4,00
0 -
1
3,52
1,20
0

261THE INDONESIANBUDGET OVERVIEW 2010
BUD
GET
SEC
TIO
NS
AN
D P
ROG
RAM
SPE
RSO
NN
EL
EXPE
ND
I-TU
RES
GO
OD
S EX
-PE
ND
ITU
RES
CAPI
TAL
EX-
PEN
DIT
URE
SSO
CIA
L A
S-SI
STA
NCE
STO
TAL
05.
04.0
3 C
APA
CIT
Y D
EVEL
OPM
ENT
PRO
GRA
M F
OR
THE
MA
N-
AG
EMEN
T O
F N
ATU
RAL
RESO
URC
ES A
ND
EN
VIR
ON
-M
ENT
-
122
,247
,400
2
,955
,300
-
1
25,2
02,7
00
05.
90.0
1 IN
FORM
ATI
ON
AC
CES
S A
ND
QU
ALI
TY IN
CRE
ASE
PRO
-G
RAM
ON
NA
TURA
L RE
SOU
RCES
AN
D E
NV
IRO
NM
ENT
-
1
1,30
0,00
0 4
01,0
00
-
11,
701,
000
10.
05.0
1 O
FFIC
IAL
DU
TY T
RAIN
ING
PRO
GRA
M
-
4,8
86,9
50
336
,050
-
5
,223
,000
044
S
TATE
MIN
ISTR
Y F
OR
CO
OPE
RATI
VES
AN
D S
MA
LL T
O M
EDIU
M E
NTE
R-PR
ISES
5
1,11
8,90
0 4
78,8
41,1
52
18,
188,
165
185
,757
,428
7
33,9
05,6
45
01.
01.0
9 G
OO
D G
OV
ERN
AN
CE
IMPL
EMEN
TATI
ON
PRO
GRA
M
51,
118,
900
41,
118,
821
1,1
25,2
62
-
93,
362,
983
01.
01.1
0 S
TATE
APP
ARA
TUS
AC
CO
UN
TABI
LITY
AN
D S
UPE
RVI-
SIO
N IN
CRE
ASE
PRO
GRA
M
-
2,0
00,0
00
-
-
2,0
00,0
00
01.
01.1
2 A
DM
INIS
TRA
TIO
N A
ND
INST
ITU
TIO
NA
L M
AN
AG
E-M
ENT
PRO
GRA
M
-
7,0
00,0
00
-
-
7,0
00,0
00
01.
01.1
3 A
PPA
RATU
S RE
SOU
RCE
MA
NA
GEM
ENT
PRO
GRA
M
-
2,5
00,0
00
-
-
2,5
00,0
00
01.
01.1
5 Q
UA
LITY
INC
REA
SE P
ROG
RAM
FO
R PU
BLIC
SER
VIC
ES
-
2,7
87,1
30
1,2
12,8
70
-
4,0
00,0
00
01.
01.1
7 S
TATE
APP
ARA
TUS
MEA
NS
AN
D F
AC
ILIT
Y IN
CRE
ASE
PR
OG
RAM
-
2
02,2
00
3,2
97,8
00
-
3,5
00,0
00
04.
01.0
5 C
LIM
ATE
EST
ABL
ISH
MEN
T PR
OG
RAM
FO
R M
ICRO
, SM
ALL
, AN
D M
EDIU
M E
NTE
RPRI
SES
-
39,
103,
821
596
,141
3
00,0
00
39,
999,
962
04.
01.0
8 E
NTE
RPRE
NEU
RSH
IP A
ND
SM
ALL
MED
IUM
EN
TER-
PRIS
E C
OM
PETI
TIV
E SU
PERI
ORI
TIES
DEV
ELO
PMEN
T PR
OG
RAM
-
32,
437,
572
355
,000
4
7,35
7,42
8 8
0,15
0,00
0
04.
01.0
9 B
USI
NES
S SU
PPO
RTIN
G S
YST
EM D
EVEL
OPM
ENT
PRO
GRA
M F
OR
MIC
RO, S
MA
LL, A
ND
MED
IUM
EN
TER-
PRIS
ES
-
239
,637
,608
1
1,43
0,49
2 5
,100
,000
2
56,1
68,1
00
04.
01.1
0 Q
UA
LITY
INC
REA
SE P
ROG
RAM
OF
CO
OPE
RATI
VE
INST
ITU
TIO
NS
-
17,
880,
000
120
,000
-
1
8,00
0,00
0
04.
01.1
1 E
MPO
WER
MEN
T PR
OG
RAM
FO
R M
ICRO
-SC
ALE
EN
TERP
RISE
S
-
93,
206,
100
18,
500
133
,000
,000
2
26,2
24,6
00
11.
05.0
1 C
HIL
DRE
N A
ND
GEN
DER
MA
INST
REA
MIN
G IN
STIT
U-
TIO
NA
L RE
INFO
RCEM
ENT
PRO
GRA
M
-
967
,900
3
2,10
0 -
1
,000
,000
047
S
TATE
MIN
ISTR
Y F
OR
WO
MEN
’S E
MPO
WER
MEN
T 1
1,64
7,94
9 1
19,5
55,2
11
2,3
01,3
46
-
133
,504
,506

262 THE INDONESIANBUDGET OVERVIEW 2010
BUD
GET
SEC
TIO
NS
AN
D P
ROG
RAM
SPE
RSO
NN
EL
EXPE
ND
I-TU
RES
GO
OD
S EX
-PE
ND
ITU
RES
CAPI
TAL
EX-
PEN
DIT
URE
SSO
CIA
L A
S-SI
STA
NCE
STO
TAL
01.
01.0
9 G
OO
D G
OV
ERN
AN
CE
IMPL
EMEN
TATI
ON
PRO
GRA
M
11,
647,
949
19,
704,
288
1,4
10,1
69
-
32,
762,
406
11.
04.0
2 C
HIL
DRE
N P
ROTE
CTI
ON
AN
D W
ELFA
RE IN
CRE
ASE
PR
OG
RAM
-
1
6,21
6,93
0 2
42,0
70
-
16,
459,
000
11.
04.0
4 H
ARM
ON
IZA
TIO
N P
ROG
RAM
FO
R C
HIL
DRE
N A
ND
W
OM
EN Q
UA
LITY
INC
REA
SE P
OLI
CIE
S
-
16,
779,
400
341
,600
-
1
7,12
1,00
0
11.
05.0
1 C
HIL
DRE
N A
ND
GEN
DER
MA
INST
REA
MIN
G IN
STIT
U-
TIO
NA
L RE
INFO
RCEM
ENT
PRO
GRA
M
-
45,
215,
100
199
,000
-
4
5,41
4,10
0
11.
05.0
2 W
OM
EN P
ROTE
CTI
ON
AN
D L
IFE
QU
ALI
TY IN
CRE
ASE
PR
OG
RAM
-
2
1,63
9,49
3 1
08,5
07
-
21,
748,
000
048
S
TATE
MIN
ISTR
Y F
OR
AD
MIN
ISTR
ATI
VE
REFO
RM
18,
040,
441
103
,184
,163
2
,526
,487
-
1
23,7
51,0
91
01.
01.0
9 G
OO
D G
OV
ERN
AN
CE
IMPL
EMEN
TATI
ON
PRO
GRA
M
18,
040,
441
46,
349,
263
331
,787
-
6
4,72
1,49
1
01.
01.1
0 S
TATE
APP
ARA
TUS
AC
CO
UN
TABI
LITY
AN
D S
UPE
RVI-
SIO
N IN
CRE
ASE
PRO
GRA
M
-
12,
785,
700
17,
000
-
12,
802,
700
01.
01.1
2 A
DM
INIS
TRA
TIO
N A
ND
INST
ITU
TIO
NA
L M
AN
AG
E-M
ENT
PRO
GRA
M
-
8,9
73,0
00
26,
700
-
8,9
99,7
00
01.
01.1
3 A
PPA
RATU
S RE
SOU
RCE
MA
NA
GEM
ENT
PRO
GRA
M
-
14,
597,
800
168
,500
-
1
4,76
6,30
0
01.
01.1
5 Q
UA
LITY
INC
REA
SE P
ROG
RAM
FO
R PU
BLIC
SER
VIC
ES
-
18,
018,
000
273
,500
-
1
8,29
1,50
0
01.
01.1
7 S
TATE
APP
ARA
TUS
MEA
NS
AN
D F
AC
ILIT
Y IN
CRE
ASE
PR
OG
RAM
-
7
91,0
00
1,7
09,0
00
-
2,5
00,0
00
01.
06.1
3 R
EGIO
NA
L FO
UN
DIN
G P
ROG
RAM
-
1
,669
,400
-
-
1
,669
,400
050
S
TATE
INTE
LLIG
ENC
E A
GEN
CY
6
5,25
2,52
0 7
29,5
20,1
25
191
,093
,375
-
9
85,8
66,0
20
01.
01.0
6 N
ATI
ON
AL
UN
ITY
AN
D E
NTI
TY C
OM
MIT
MEN
T IN
-C
REA
SE P
ROG
RAM
-
7
0,19
3,40
0 -
-
7
0,19
3,40
0
01.
01.0
9 G
OO
D G
OV
ERN
AN
CE
IMPL
EMEN
TATI
ON
PRO
GRA
M
65,
252,
520
25,
915,
085
383
,515
-
9
1,55
1,12
0
03.
01.0
4 S
ECU
RITY
PO
TEN
TIA
L EM
POW
ERM
ENT
PRO
GRA
M
-
29,
751,
000
-
-
29,
751,
000
03.
01.0
6 S
TATE
SEC
URI
TY D
EVEL
OPM
ENT,
SA
FETY
, AN
D IN
VES
-TI
GA
TIO
N P
ROG
RAM
-
5
88,0
44,4
40
190
,709
,860
-
7
78,7
54,3
00
10.
05.0
1 O
FFIC
IAL
DU
TY T
RAIN
ING
PRO
GRA
M
-
15,
616,
200
-
-
15,
616,
200
051
S
TATE
CO
DES
AG
ENC
Y
38,
724,
097
68,
095,
574
393
,009
,768
-
4
99,8
29,4
39
01.
01.0
9 G
OO
D G
OV
ERN
AN
CE
IMPL
EMEN
TATI
ON
PRO
GRA
M
38,
724,
097
28,
583,
712
8,8
04,9
77
-
76,
112,
786

263THE INDONESIANBUDGET OVERVIEW 2010
BUD
GET
SEC
TIO
NS
AN
D P
ROG
RAM
SPE
RSO
NN
EL
EXPE
ND
I-TU
RES
GO
OD
S EX
-PE
ND
ITU
RES
CAPI
TAL
EX-
PEN
DIT
URE
SSO
CIA
L A
S-SI
STA
NCE
STO
TAL
03.
01.0
7 S
TATE
SEC
RET
SEC
URI
TY D
EVEL
OPM
ENT
PRO
GRA
M
-
26,
283,
480
380
,802
,073
-
4
07,0
85,5
53
10.
05.0
1 O
FFIC
IAL
DU
TY T
RAIN
ING
PRO
GRA
M
-
13,
228,
382
3,4
02,7
18
-
16,
631,
100
052
N
ATI
ON
AL
DEF
ENC
E BO
ARD
6
,232
,590
2
1,13
4,03
0 2
,802
,590
-
3
0,16
9,21
0
01.
01.0
9 G
OO
D G
OV
ERN
AN
CE
IMPL
EMEN
TATI
ON
PRO
GRA
M
6,2
32,5
90
4,6
29,9
20
-
-
10,
862,
510
02.
02.0
1 D
EVEL
OPM
ENT
PRO
GRA
M F
OR
DEF
ENC
E ST
RATE
GY
A
ND
SY
STEM
-
1
6,50
4,11
0 2
,802
,590
-
1
9,30
6,70
0
054
C
ENTR
AL
BURE
AU
OF
STA
TIST
ICS
611
,376
,800
4
,090
,307
,926
3
47,3
63,4
94
-
5,0
49,0
48,2
20
01.
01.0
9 G
OO
D G
OV
ERN
AN
CE
IMPL
EMEN
TATI
ON
PRO
GRA
M
611
,376
,800
1
92,4
95,9
20
-
-
803
,872
,720
01.
01.1
7 S
TATE
APP
ARA
TUS
MEA
NS
AN
D F
AC
ILIT
Y IN
CRE
ASE
PR
OG
RAM
-
4
,138
,706
2
95,2
34,9
94
-
299
,373
,700
01.
01.2
7 S
TATI
STIC
S D
EVEL
OPM
ENT
AN
D C
OM
PLIA
NC
E PR
O-
GRA
M
-
3,8
80,4
94,6
00
52,
128,
500
-
3,9
32,6
23,1
00
10.
05.0
1 O
FFIC
IAL
DU
TY T
RAIN
ING
PRO
GRA
M
-
13,
178,
700
-
-
13,
178,
700
055
M
INIS
TRY
OF
NA
TIO
NA
L D
EVEL
OPM
ENT
PLA
NN
ING
/BA
PPEN
AS
42,
814,
190
501
,845
,987
1
3,65
1,39
3 -
5
58,3
11,5
70
01.
01.0
9 G
OO
D G
OV
ERN
AN
CE
IMPL
EMEN
TATI
ON
PRO
GRA
M
42,
814,
190
100
,053
,380
-
-
1
42,8
67,5
70
01.
01.1
0 S
TATE
APP
ARA
TUS
AC
CO
UN
TABI
LITY
AN
D S
UPE
RVI-
SIO
N IN
CRE
ASE
PRO
GRA
M
-
3,5
00,0
00
-
-
3,5
00,0
00
01.
01.1
2 A
DM
INIS
TRA
TIO
N A
ND
INST
ITU
TIO
NA
L M
AN
AG
E-M
ENT
PRO
GRA
M
-
250
,874
,800
9
85,1
00
-
251
,859
,900
01.
01.1
3 A
PPA
RATU
S RE
SOU
RCE
MA
NA
GEM
ENT
PRO
GRA
M
-
139
,940
,900
7
4,00
0 -
1
40,0
14,9
00
01.
01.1
7 S
TATE
APP
ARA
TUS
MEA
NS
AN
D F
AC
ILIT
Y IN
CRE
ASE
PR
OG
RAM
-
7
,476
,907
1
2,59
2,29
3 -
2
0,06
9,20
0
056
N
ATI
ON
AL
LAN
D A
FFA
IRS
AG
ENC
Y
986
,411
,106
1
,520
,455
,245
4
37,7
51,6
95
-
2,9
44,6
18,0
46
01.
01.0
9 G
OO
D G
OV
ERN
AN
CE
IMPL
EMEN
TATI
ON
PRO
GRA
M
907
,321
,600
2
07,9
52,1
03
1,3
78,7
57
-
1,1
16,6
52,4
60
01.
01.1
0 S
TATE
APP
ARA
TUS
AC
CO
UN
TABI
LITY
AN
D S
UPE
RVI-
SIO
N IN
CRE
ASE
PRO
GRA
M
-
4,3
75,5
88
485
,012
-
4
,860
,600
01.
01.1
3 A
PPA
RATU
S RE
SOU
RCE
MA
NA
GEM
ENT
PRO
GRA
M
-
8,3
07,1
00
156
,500
-
8
,463
,600
01.
01.1
7 S
TATE
APP
ARA
TUS
MEA
NS
AN
D F
AC
ILIT
Y IN
CRE
ASE
PR
OG
RAM
-
-
2
3,33
6,90
0 -
2
3,33
6,90
0
05.
05.0
3 LA
ND
MA
NA
GEM
ENT
PRO
GRA
M -
1
,285
,249
,504
4
00,1
59,4
76
-
1,6
85,4
08,9
80

264 THE INDONESIANBUDGET OVERVIEW 2010
BUD
GET
SEC
TIO
NS
AN
D P
ROG
RAM
SPE
RSO
NN
EL
EXPE
ND
I-TU
RES
GO
OD
S EX
-PE
ND
ITU
RES
CAPI
TAL
EX-
PEN
DIT
URE
SSO
CIA
L A
S-SI
STA
NCE
STO
TAL
10.
05.0
1 O
FFIC
IAL
DU
TY T
RAIN
ING
PRO
GRA
M
-
2,2
71,1
00
34,
900
-
2,3
06,0
00
10.
06.0
1 H
IGH
ER E
DU
CA
TIO
N P
ROG
RAM
-
1
2,29
9,85
0 1
2,20
0,15
0 -
2
4,50
0,00
0
057
N
ATI
ON
AL
LIBR
ARY
3
2,81
4,20
0 2
48,8
85,0
31
61,
854,
662
-
343
,553
,893
01.
01.0
9 G
OO
D G
OV
ERN
AN
CE
IMPL
EMEN
TATI
ON
PRO
GRA
M
32,
814,
200
31,
763,
771
1,1
35,7
22
-
65,
713,
693
01.
01.1
3 A
PPA
RATU
S RE
SOU
RCE
MA
NA
GEM
ENT
PRO
GRA
M
-
5,6
42,3
32
857
,668
-
6
,500
,000
01.
01.1
7 S
TATE
APP
ARA
TUS
MEA
NS
AN
D F
AC
ILIT
Y IN
CRE
ASE
PR
OG
RAM
-
-
1
,734
,200
-
1
,734
,200
08.
01.0
1 C
ULT
URE
VA
LUES
DEV
ELO
PMEN
T PR
OG
RAM
-
2
,634
,070
2
,365
,930
-
5
,000
,000
08.
01.0
2 C
ULT
URE
PRO
PERT
Y M
AN
AG
EMEN
T PR
OG
RAM
-
6
,804
,125
6
95,8
75
-
7,5
00,0
00
10.
07.0
2 R
EAD
ING
CU
LTU
RE A
ND
LIB
RARY
FO
UN
DIN
G D
EVEL
-O
PMEN
T PR
OG
RAM
-
2
02,0
40,7
33
55,
065,
267
-
257
,106
,000
059
M
INIS
TRY
OF
CO
MM
UN
ICA
TIO
N A
ND
INFO
RMA
TIO
N
173
,760
,867
2
,310
,848
,324
2
96,3
79,3
21
30,
985,
481
2,8
11,9
73,9
93
01.
01.0
9 G
OO
D G
OV
ERN
AN
CE
IMPL
EMEN
TATI
ON
PRO
GRA
M
168
,564
,026
1
05,3
65,9
10
6,9
04,4
84
-
280
,834
,420
01.
01.1
0 S
TATE
APP
ARA
TUS
AC
CO
UN
TABI
LITY
AN
D S
UPE
RVI-
SIO
N IN
CRE
ASE
PRO
GRA
M
-
9,7
43,5
00
-
-
9,7
43,5
00
01.
01.1
2 A
DM
INIS
TRA
TIO
N A
ND
INST
ITU
TIO
NA
L M
AN
AG
E-M
ENT
PRO
GRA
M
-
7,1
83,0
35
78,
165
-
7,2
61,2
00
01.
01.1
3 A
PPA
RATU
S RE
SOU
RCE
MA
NA
GEM
ENT
PRO
GRA
M
-
18,
503,
884
908
,516
-
1
9,41
2,40
0
01.
01.1
6 Q
UA
LITY
INC
REA
SE P
ROG
RAM
FO
R PU
BLIC
INFO
RMA
-TI
ON
SER
VIC
ES
-
79,
804,
300
217
,500
-
8
0,02
1,80
0
01.
01.1
7 S
TATE
APP
ARA
TUS
MEA
NS
AN
D F
AC
ILIT
Y IN
CRE
ASE
PR
OG
RAM
-
3
50,0
00
10,
179,
700
-
10,
529,
700
04.
09.0
1 C
OM
PLIA
NC
E PR
OG
RAM
ON
PO
ST A
ND
TEL
EMA
TIC
S RE
STRU
CTU
RIZA
TIO
N
-
354
,482
,666
1
0,15
6,31
1 2
,591
,560
3
67,2
30,5
37
04.
09.0
2 Q
UA
LITY
INC
REA
SE, E
QU
AL
DIS
TRIB
UTI
ON
, AN
D D
E-V
ELO
PMEN
T PR
OG
RAM
ON
TH
E M
EAN
S A
ND
FA
CIL
I-TI
ES O
F PO
ST A
ND
TEL
EMA
TIC
S
4,9
80,0
41
1,5
59,1
98,5
81
158
,765
,114
6
0,00
0 1
,723
,003
,736
04.
09.0
3 D
EVEL
OPM
ENT
AN
D M
AST
ERY
PRO
GRA
M F
OR
THE
APP
LIC
ATI
ON
AN
D T
ECH
NO
LOG
Y O
F IN
FORM
ATI
ON
A
ND
CO
MM
UN
ICA
TIO
N
-
90,
095,
361
107
,043
,339
-
1
97,1
38,7
00

265THE INDONESIANBUDGET OVERVIEW 2010
BUD
GET
SEC
TIO
NS
AN
D P
ROG
RAM
SPE
RSO
NN
EL
EXPE
ND
I-TU
RES
GO
OD
S EX
-PE
ND
ITU
RES
CAPI
TAL
EX-
PEN
DIT
URE
SSO
CIA
L A
S-SI
STA
NCE
STO
TAL
08.
03.0
1 C
OM
MU
NIC
ATI
ON
, IN
FORM
ATI
ON
, AN
D M
ASS
ME-
DIA
DEV
ELO
PMEN
T PR
OG
RAM
-
8
1,75
6,54
7 1
,637
,532
2
8,33
3,92
1 1
11,7
28,0
00
10.
05.0
1 O
FFIC
IAL
DU
TY T
RAIN
ING
PRO
GRA
M
216
,800
4
,364
,540
4
88,6
60
-
5,0
70,0
00
060
IN
DO
NES
IAN
NA
TIO
NA
L PO
LIC
E 1
7,69
0,96
1,56
4 5
,817
,047
,933
3
,686
,943
,614
-
2
7,19
4,95
3,11
1
01.
01.0
9 G
OO
D G
OV
ERN
AN
CE
IMPL
EMEN
TATI
ON
PRO
GRA
M
17,
690,
961,
564
1,0
06,3
16,0
39
-
-
18,
697,
277,
603
03.
01.0
1 P
OLI
CE
HU
MA
N R
ESO
URC
E D
EVEL
OPM
ENT
PRO
-G
RAM
-
2
78,7
94,9
00
-
-
278
,794
,900
03.
01.0
2 P
OLI
CE
MEA
NS
AN
D F
AC
ILIT
Y D
EVEL
OPM
ENT
PRO
-G
RAM
-
1
41,8
11,2
43
3,6
86,9
43,6
14
-
3,8
28,7
54,8
57
03.
01.0
3 O
RDER
LIN
ESS
AN
D S
ECU
RITY
STR
ATE
GY
DEV
ELO
P-M
ENT
PRO
GRA
M
-
71,
305,
300
-
-
71,
305,
300
03.
01.0
4 S
ECU
RITY
PO
TEN
TIA
L EM
POW
ERM
ENT
PRO
GRA
M
-
169
,103
,200
-
-
1
69,1
03,2
00
03.
01.0
5 P
UBL
IC O
RDER
LIN
ESS
AN
D S
ECU
RITY
MA
INTE
NA
NC
E PR
OG
RAM
-
3
,540
,987
,151
-
-
3
,540
,987
,151
03.
01.1
0 C
RIM
INA
L ST
UD
Y A
ND
INV
ESTI
GA
TIO
N P
ROG
RAM
-
5
78,2
96,9
00
-
-
578
,296
,900
03.
01.1
2 O
RDER
LIN
ESS
AN
D S
ECU
RITY
CO
OPE
RATI
ON
PRO
-G
RAM
-
3
0,43
3,20
0 -
-
3
0,43
3,20
0
063
N
ATI
ON
AL
AG
ENC
Y F
OR
FOO
D A
ND
DRU
G C
ON
TRO
L 1
56,5
02,6
26
316
,333
,887
1
54,8
92,9
17
-
627
,729
,430
01.
01.0
9 G
OO
D G
OV
ERN
AN
CE
IMPL
EMEN
TATI
ON
PRO
GRA
M
156
,502
,626
5
0,06
6,62
9 4
38,7
75
-
207
,008
,030
01.
01.1
0 S
TATE
APP
ARA
TUS
AC
CO
UN
TABI
LITY
AN
D S
UPE
RVI-
SIO
N IN
CRE
ASE
PRO
GRA
M
-
1,7
78,7
00
-
-
1,7
78,7
00
07.
01.0
2 F
OO
D A
ND
DRU
G C
ON
TRO
L PR
OG
RAM
-
2
58,5
87,1
77
154
,165
,623
-
4
12,7
52,8
00
07.
01.0
3 IN
DO
NES
IAN
ORI
GIN
AL
DRU
G D
EVEL
OPM
ENT
PRO
-G
RAM
-
5
,901
,381
2
88,5
19
-
6,1
89,9
00
064
N
ATI
ON
AL
DEF
ENC
E A
GEN
CY
2
3,09
8,08
0 8
4,85
8,19
7 9
7,57
0,63
7 3
,020
,000
2
08,5
46,9
14
01.
01.0
9 G
OO
D G
OV
ERN
AN
CE
IMPL
EMEN
TATI
ON
PRO
GRA
M
23,
098,
080
32,
849,
882
78,
952
3,0
20,0
00
59,
046,
914
01.
01.1
0 S
TATE
APP
ARA
TUS
AC
CO
UN
TABI
LITY
AN
D S
UPE
RVI-
SIO
N IN
CRE
ASE
PRO
GRA
M
-
2,0
00,0
00
-
-
2,0
00,0
00
01.
01.1
3 A
PPA
RATU
S RE
SOU
RCE
MA
NA
GEM
ENT
PRO
GRA
M
-
34,
350,
000
-
-
34,
350,
000

266 THE INDONESIANBUDGET OVERVIEW 2010
BUD
GET
SEC
TIO
NS
AN
D P
ROG
RAM
SPE
RSO
NN
EL
EXPE
ND
I-TU
RES
GO
OD
S EX
-PE
ND
ITU
RES
CAPI
TAL
EX-
PEN
DIT
URE
SSO
CIA
L A
S-SI
STA
NCE
STO
TAL
01.
04.0
1 S
CIE
NC
E A
ND
TEC
HN
OLO
GY
RES
EARC
H A
ND
DEV
EL-
OPM
ENT
PRO
GRA
M
-
8,3
50,0
00
-
-
8,3
50,0
00
02.
04.0
2 N
ATI
ON
AL
DEF
ENC
E D
EVEL
OPM
ENT
PRO
GRA
M
-
7,3
08,3
15
97,
491,
685
-
104
,800
,000
065
C
API
TAL
INV
ESTM
ENT
CO
ORD
INA
TIN
G B
OA
RD
32,
996,
747
296
,906
,119
3
5,06
4,84
4 -
3
64,9
67,7
10
01.
01.0
9 G
OO
D G
OV
ERN
AN
CE
IMPL
EMEN
TATI
ON
PRO
GRA
M
32,
996,
747
31,
665,
923
-
-
64,
662,
670
01.
01.1
5 Q
UA
LITY
INC
REA
SE P
ROG
RAM
ON
PU
BLIC
SER
VIC
ES
-
89,
606,
124
32,
526,
976
-
122
,133
,100
04.
90.0
1 IN
VES
TMEN
T C
LIM
ATE
AN
D IN
VES
TMEN
T RE
ALI
ZA-
TIO
N IN
CRE
ASE
PRO
GRA
M
-
62,
365,
028
2,2
77,1
72
-
64,
642,
200
04.
90.0
2 IN
VES
TMEN
T C
OO
PERA
TIO
N A
ND
PRO
MO
TIO
N IN
-C
REA
SE P
ROG
RAM
-
1
13,2
69,0
44
260
,696
-
1
13,5
29,7
40
066
N
ATI
ON
AL
NA
RCO
TIC
S A
GEN
CY
1
1,73
0,00
0 2
03,8
79,9
35
131
,261
,615
-
3
46,8
71,5
50
01.
01.0
9 G
OO
D G
OV
ERN
AN
CE
IMPL
EMEN
TATI
ON
PRO
GRA
M
11,
730,
000
24,
732,
611
1,1
90,9
39
-
37,
653,
550
03.
01.0
8 P
REV
ENTI
ON
AN
D E
RAD
ICA
TIO
N F
OR
DRU
G A
BUSE
A
ND
BLA
CK
MA
RKET
-
1
67,6
63,7
24
130
,070
,676
-
2
97,7
34,4
00
08.
02.0
2 Y
OU
TH P
ART
ICIP
ATI
ON
INC
REA
SE A
ND
FO
UN
DIN
G
PRO
GRA
M
-
5,7
60,0
00
-
-
5,7
60,0
00
11.
06.0
1 S
OC
IAL
PRO
SPER
ITY
REH
ABI
LITA
TIO
N A
ND
SER
VIC
E PR
OG
RAM
-
5
,723
,600
-
-
5
,723
,600
067
S
TATE
MIN
ISTR
Y F
OR
THE
AC
CEL
ERA
TIO
N O
F D
EVEL
OPM
ENT
IN B
AC
K-
WA
RD R
EGIO
NS
7,0
81,6
09
351
,403
,031
1
65,4
95,2
76
403
,183
,384
9
27,1
63,3
00
01.
01.0
9 G
OO
D G
OV
ERN
AN
CE
IMPL
EMEN
TATI
ON
PRO
GRA
M
7,0
81,6
09
31,
907,
291
-
-
38,
988,
900
01.
01.1
2 A
DM
INIS
TRA
TIO
N A
ND
INST
ITU
TIO
NA
L M
AN
AG
E-M
ENT
PRO
GRA
M
-
78,
300,
000
-
-
78,
300,
000
01.
01.1
7 S
TATE
APP
ARA
TUS
MEA
NS
AN
D F
AC
ILIT
Y IN
CRE
ASE
PR
OG
RAM
-
-
5
,000
,000
-
5
,000
,000
01.
06.0
7 L
OC
AL
ECO
NO
MIC
DEV
ELO
PMEN
T PR
OG
RAM
-
4
2,95
7,32
4 1
28,0
42,6
76
-
171
,000
,000
01.
90.0
3 N
AD
AN
D N
IAS
REC
ON
STRU
CTI
ON
AN
D R
EHA
BILI
TA-
TIO
N
-
53,
500,
093
99,
600
292
,056
,307
3
45,6
56,0
00
06.
90.0
1 B
ORD
ERLA
ND
ARE
AS
DEV
ELO
PMEN
T PR
OG
RAM
-
7
,647
,000
3
2,35
3,00
0 -
4
0,00
0,00
0
06.
90.0
4 B
AC
KW
ARD
REG
ION
S D
EVEL
OPM
ENT
PRO
GRA
M
-
83,
000,
000
-
-
83,
000,
000
06.
90.0
7 R
URA
L M
EAN
S A
ND
FA
CIL
ITIE
S IN
CRE
ASE
PRO
GRA
M
-
18,
603,
067
-
88,
396,
933
107
,000
,000

267THE INDONESIANBUDGET OVERVIEW 2010
BUD
GET
SEC
TIO
NS
AN
D P
ROG
RAM
SPE
RSO
NN
EL
EXPE
ND
I-TU
RES
GO
OD
S EX
-PE
ND
ITU
RES
CAPI
TAL
EX-
PEN
DIT
URE
SSO
CIA
L A
S-SI
STA
NCE
STO
TAL
06.
90.0
9 E
MPO
WER
MEN
T IN
CRE
ASE
PRO
GRA
M F
OR
RURA
L C
OM
MU
NIT
IES
-
3
5,48
8,25
6 -
2
2,73
0,14
4 5
8,21
8,40
0
068
N
ATI
ON
AL
FAM
ILY P
LAN
NIN
G C
OO
RDIN
ATI
NG
BO
ARD
1
74,4
58,0
00
1,0
42,2
44,2
36
17,
300,
964
-
1,2
34,0
03,2
00
01.
01.0
9 G
OO
D G
OV
ERN
AN
CE
IMPL
EMEN
TATI
ON
PRO
GRA
M
174
,458
,000
1
32,5
76,3
61
4,3
21,0
39
-
311
,355
,400
01.
01.1
0 S
TATE
APP
ARA
TUS
AC
CO
UN
TABI
LITY
AN
D S
UPE
RVI-
SIO
N IN
CRE
ASE
PRO
GRA
M
-
4,0
00,0
00
-
-
4,0
00,0
00
01.
01.1
3 A
PPA
RATU
S RE
SOU
RCE
MA
NA
GEM
ENT
PRO
GRA
M
-
84,
576,
026
197
,274
-
8
4,77
3,30
0
01.
01.1
7 S
TATE
APP
ARA
TUS
MEA
NS
AN
D F
AC
ILIT
Y IN
CRE
ASE
PR
OG
RAM
-
4
,414
,342
1
0,92
7,65
8 -
1
5,34
2,00
0
07.
04.0
1 P
LAN
NED
FA
MILY
PRO
GRA
M
-
562
,153
,125
1
65,9
75
-
562
,319
,100
07.
04.0
2 T
EEN
REP
ROD
UC
TIO
N H
EALT
H P
ROG
RAM
-
3
4,80
5,40
0 6
,000
-
3
4,81
1,40
0
07.
04.0
3 IN
STIT
UTI
ON
AL
ENFO
RCEM
ENT
PRO
GRA
M F
OR
QU
AL-
ITY
SM
ALL
FA
MIL
IES
-
9
3,50
0,41
2 1
,295
,588
-
9
4,79
6,00
0
11.
04.0
5 F
AM
ILY E
MPO
WER
MEN
T A
ND
DEF
ENC
E PR
OG
RAM
-
1
26,2
18,5
70
387
,430
-
1
26,6
06,0
00
074
N
ATI
ON
AL
CO
MM
ISSI
ON
FO
R H
UM
AN
RIG
HTS
1
7,08
2,90
9 3
8,75
3,80
8 2
,249
,203
-
5
8,08
5,92
0
01.
01.0
9 G
OO
D G
OV
ERN
AN
CE
IMPL
EMEN
TATI
ON
PRO
GRA
M
17,
082,
909
9,9
69,5
41
54,
270
-
27,
106,
720
03.
03.0
1 L
AW
PLA
NN
ING
PRO
GRA
M
-
2,3
56,8
19
100
,814
-
2
,457
,633
03.
03.0
3 A
WA
REN
ESS
INC
REA
SE P
ROG
RAM
ON
LA
W A
ND
HU
-M
AN
RIG
HTS
-
6
,489
,993
3
71,4
82
-
6,8
61,4
75
03.
03.0
5 P
ERFO
RMA
NC
E IN
CRE
ASE
PRO
GRA
M F
OR
CO
URT
S A
ND
OTH
ER L
AW
EN
FORC
EMEN
T IN
STIT
UTI
ON
S
-
6,6
26,6
34
1,1
43,2
63
-
7,7
69,8
97
03.
03.0
6 L
AW
AN
D H
UM
AN
RIG
HTS
EN
FORC
EMEN
T PR
OG
RAM
-
1
0,38
3,33
4 5
61,2
12
-
10,
944,
546
11.
04.0
4 P
OLI
CY
HA
RMO
NIZ
ATI
ON
PRO
GRA
M F
OR
CH
ILD
REN
A
ND
WO
MEN
QU
ALI
TY IN
CRE
ASE
-
2
,523
,779
1
8,16
2 -
2
,541
,941
11.
05.0
1 C
HIL
DRE
N A
ND
GEN
DER
MA
INST
REA
MIN
G IN
STIT
U-
TIO
NA
L RE
INFO
RCEM
ENT
PRO
GRA
M
-
403
,708
-
-
4
03,7
08
075
M
ETER
EOLO
GIC
AL,
CLI
MA
TOLO
GIC
AL
AN
D G
EOPH
YSI
CA
L A
GEN
CY
1
86,0
71,4
64
352
,996
,198
3
26,1
11,6
23
-
865
,179
,285
01.
01.0
9 G
OO
D G
OV
ERN
AN
CE
IMPL
EMEN
TATI
ON
PRO
GRA
M
179
,209
,174
1
63,4
83,5
12
-
-
342
,692
,686
01.
01.1
0 S
TATE
APP
ARA
TUS
AC
CO
UN
TABI
LITY
AN
D S
UPE
RVI-
SIO
N IN
CRE
ASE
PRO
GRA
M
-
1,3
85,3
00
947
,500
-
2
,332
,800

268 THE INDONESIANBUDGET OVERVIEW 2010
BUD
GET
SEC
TIO
NS
AN
D P
ROG
RAM
SPE
RSO
NN
EL
EXPE
ND
I-TU
RES
GO
OD
S EX
-PE
ND
ITU
RES
CAPI
TAL
EX-
PEN
DIT
URE
SSO
CIA
L A
S-SI
STA
NCE
STO
TAL
01.
01.1
3 A
PPA
RATU
S RE
SOU
RCE
MA
NA
GEM
ENT
PRO
GRA
M
-
14,
136,
100
650
,000
-
1
4,78
6,10
0
01.
01.1
7 S
TATE
APP
ARA
TUS
MEA
NS
AN
D F
AC
ILIT
Y IN
CRE
ASE
PR
OG
RAM
-
-
1
10,0
00,0
00
-
110
,000
,000
04.
08.2
2 M
ETER
EOLO
GIC
AL,
CLI
MA
TOLO
GIC
AL
AN
D G
EO-
PHY
SIC
AL
FOU
ND
ING
AN
D D
EVEL
OPM
ENT
PRO
GRA
M
-
168
,432
,676
2
10,8
54,5
23
-
379
,287
,199
10.
06.0
1 H
IGH
ER E
DU
CA
TIO
N P
ROG
RAM
6
,862
,290
5
,558
,610
3
,659
,600
-
1
6,08
0,50
0
076
G
ENER
AL
ELEC
TIO
N C
OM
MIS
SIO
N
264
,019
,454
5
94,6
88,5
85
102
,753
,417
-
9
61,4
61,4
56
01.
01.0
1 D
EMO
CRA
CY
INST
ITU
TIO
NA
L EN
FORC
EMEN
T A
ND
IM
PRO
VEM
ENT
PRO
GRA
M
-
45,
451,
087
465
,246
-
4
5,91
6,33
3
01.
01.0
3 P
OLI
TIC
AL
PRO
CES
S IM
PRO
VEM
ENT
PRO
GRA
M
-
37,
856,
460
117
,876
-
3
7,97
4,33
6
01.
01.0
9 G
OO
D G
OV
ERN
AN
CE
IMPL
EMEN
TATI
ON
PRO
GRA
M
264
,019
,454
4
41,6
60,6
01
842
,375
-
7
06,5
22,4
30
01.
01.1
0 S
TATE
APP
ARA
TUS
AC
CO
UN
TABI
LITY
AN
D S
UPE
RVI-
SIO
N IN
CRE
ASE
PRO
GRA
M
-
10,
000,
000
-
-
10,
000,
000
01.
01.1
3 A
PPA
RATU
S RE
SOU
RCE
MA
NA
GEM
ENT
PRO
GRA
M
-
31,
377,
913
684
,310
-
3
2,06
2,22
3
01.
01.1
7 S
TATE
APP
ARA
TUS
MEA
NS
AN
D F
AC
ILIT
Y IN
CRE
ASE
PR
OG
RAM
-
-
1
00,0
00,0
00
-
100
,000
,000
03.
03.0
4 L
AW
ASS
ISTA
NC
E A
ND
SER
VIC
E IN
CRE
ASE
PRO
GRA
M
-
19,
879,
390
120
,610
-
2
0,00
0,00
0
04.
09.0
3 M
AST
ERY
AN
D D
EVEL
OPM
ENT
PRO
GRA
M F
OR
THE
APP
LIC
ATI
ON
AN
D T
ECH
NO
LOG
Y O
F IN
FORM
ATI
ON
A
ND
TEC
HN
OLO
GY
-
8,4
63,1
34
523
,000
-
8
,986
,134
077
S
TATE
CO
NST
ITU
TIO
NA
L C
OU
RT
9,6
14,6
70
147
,591
,736
1
2,29
0,20
0 -
1
69,4
96,6
06
01.
01.0
9 G
OO
D G
OV
ERN
AN
CE
IMPL
EMEN
TATI
ON
PRO
GRA
M
9,6
14,6
70
80,
359,
536
150
,000
-
9
0,12
4,20
6
01.
01.1
3 A
PPA
RATU
S RE
SOU
RCE
MA
NA
GEM
ENT
PRO
GRA
M
-
5,0
00,0
00
-
-
5,0
00,0
00
01.
01.1
7 S
TATE
APP
ARA
TUS
MEA
NS
AN
D F
AC
ILIT
Y IN
CRE
ASE
PR
OG
RAM
-
-
1
0,00
0,00
0 -
1
0,00
0,00
0
03.
03.0
3 A
WA
REN
ESS
INC
REA
SE P
ROG
RAM
ON
LA
W A
ND
HU
-M
AN
RIG
HTS
-
2
4,38
6,40
0 -
-
2
4,38
6,40
0
03.
03.0
5 P
ERFO
RMA
NC
E IN
CRE
ASE
PRO
GRA
M F
OR
CO
URT
S A
ND
OTH
ER L
AW
EN
FORC
EMEN
T IN
STIT
UTI
ON
S
-
12,
821,
800
2,1
40,2
00
-
14,
962,
000
03.
03.0
6 L
AW
AN
D H
UM
AN
RIG
HTS
EN
FORC
EMEN
T PR
OG
RAM
-
2
2,68
0,00
0 -
-
2
2,68
0,00
0
03.
03.0
7 L
AW
PRO
FESS
ION
QU
ALI
TY IN
CRE
ASE
PRO
GRA
M
-
2,3
44,0
00
-
-
2,3
44,0
00

269THE INDONESIANBUDGET OVERVIEW 2010
BUD
GET
SEC
TIO
NS
AN
D P
ROG
RAM
SPE
RSO
NN
EL
EXPE
ND
I-TU
RES
GO
OD
S EX
-PE
ND
ITU
RES
CAPI
TAL
EX-
PEN
DIT
URE
SSO
CIA
L A
S-SI
STA
NCE
STO
TAL
078
C
ENTE
R FO
R TH
E RE
PORT
ING
AN
D A
NA
LYSI
S O
F FI
NA
NC
IAL
TRA
NSA
C-
TIO
NS
24,
104,
168
49,
824,
228
39,
984,
512
-
113
,912
,908
01.
01.0
9 G
OO
D G
OV
ERN
AN
CE
IMPL
EMEN
TATI
ON
PRO
GRA
M
24,
104,
168
25,
801,
740
3,2
99,5
00
-
53,
205,
408
01.
01.2
4 E
CO
NO
MY
AN
D F
INA
NC
IAL
SEC
TOR
STA
BILI
ZATI
ON
PR
OG
RAM
-
2
4,02
2,48
8 3
6,68
5,01
2 -
6
0,70
7,50
0
079
IN
DO
NES
IAN
INST
ITU
TE O
F SC
IEN
CES
2
09,2
79,9
98
261
,778
,006
2
5,12
3,08
0 -
4
96,1
81,0
84
01.
01.0
9 G
OO
D G
OV
ERN
AN
CE
IMPL
EMEN
TATI
ON
PRO
GRA
M
209
,279
,998
1
01,9
13,1
01
7,2
13,6
85
-
318
,406
,784
01.
01.1
0 S
TATE
APP
ARA
TUS
AC
CO
UN
TABI
LITY
AN
D S
UPE
RVI-
SIO
N IN
CRE
ASE
PRO
GRA
M
-
500
,000
-
-
5
00,0
00
01.
04.0
1 S
CIE
NC
E A
ND
TEC
HN
OLO
GY
DEV
ELO
PMEN
T A
ND
RE
SEA
RCH
PRO
GRA
M
-
84,
977,
599
5,3
22,4
01
-
90,
300,
000
01.
04.0
2 S
CIE
NC
E A
ND
TEC
HN
OLO
GY
USE
AN
D D
IFFU
SIO
N
PRO
GRA
M
-
15,
000,
000
-
-
15,
000,
000
01.
04.0
3 S
CIE
NC
E A
ND
TEC
HN
OLO
GY
INSI
TUTI
ON
AL
EMPO
W-
ERM
ENT
PRO
GRA
M
-
32,
702,
524
10,
871,
776
-
43,
574,
300
05.
04.0
1 N
ATU
RAL
RESO
URC
E C
ON
SERV
ATI
ON
AN
D P
ROTE
C-
TIO
N P
ROG
RAM
-
2
6,68
4,78
2 1
,715
,218
-
2
8,40
0,00
0
080
N
ATI
ON
AL
ATO
MIC
EN
ERG
Y A
GEN
CY
1
94,9
56,1
33
158
,231
,881
5
3,61
0,81
5 -
4
06,7
98,8
29
01.
01.0
9 G
OO
D G
OV
ERN
AN
CE
IMPL
EMEN
TATI
ON
PRO
GRA
M
190
,893
,907
9
8,88
3,69
3 4
,166
,593
-
2
93,9
44,1
93
01.
01.1
0 S
TATE
APP
ARA
TUS
AC
CO
UN
TABI
LITY
AN
D S
UPE
RVI-
SIO
N IN
CRE
ASE
PRO
GRA
M
-
405
,000
3
45,0
00
-
750
,000
01.
01.1
3 A
PPA
RATU
S RE
SOU
RCE
MA
NA
GEM
ENT
PRO
GRA
M
-
2,1
31,4
00
389
,000
-
2
,520
,400
01.
01.1
7 S
TATE
APP
ARA
TUS
MEA
NS
AN
D F
AC
ILIT
Y IN
CRE
ASE
PR
OG
RAM
-
8
75,2
50
3,0
74,7
50
-
3,9
50,0
00
01.
04.0
1 R
ESEA
RCH
AN
D D
EVEL
OPM
ENT
PRO
GRA
M F
OR
SCI-
ENC
E A
ND
TEC
HN
OLO
GY
-
1
7,01
2,82
0 1
6,78
7,18
0 -
3
3,80
0,00
0
01.
04.0
2 D
IFFU
SIO
N A
ND
USE
PRO
GRA
M F
OR
SCIE
NC
E A
ND
TE
CH
NO
LOG
Y
-
16,
241,
516
1,6
87,5
33
-
17,
929,
049
01.
04.0
3 S
CIE
NC
E A
ND
TEC
HN
OLO
GY
INST
ITU
TIO
NA
L EN
-FO
RCEM
ENT
PRO
GRA
M
-
16,
008,
894
19,
341,
106
-
35,
350,
000
04.
07.0
1 C
APA
CIT
Y IN
CRE
ASE
PRO
GRA
M F
OR
TH
E SC
IEN
CE
AN
D T
ECH
NO
LOG
Y O
F PR
OD
UC
TIO
N S
YST
EM
-
3,4
72,9
08
4,8
27,0
92
-
8,3
00,0
00

270 THE INDONESIANBUDGET OVERVIEW 2010
BUD
GET
SEC
TIO
NS
AN
D P
ROG
RAM
SPE
RSO
NN
EL
EXPE
ND
I-TU
RES
GO
OD
S EX
-PE
ND
ITU
RES
CAPI
TAL
EX-
PEN
DIT
URE
SSO
CIA
L A
S-SI
STA
NCE
STO
TAL
05.
03.0
2 E
NV
IRO
NM
ENT
DA
MA
GE
AN
D P
OLL
UTI
ON
CO
NTR
OL
PRO
GRA
M
-
1,4
42,3
50
957
,650
-
2
,400
,000
10.
06.0
1 H
IGH
ER E
DU
CA
TIO
N P
ROG
RAM
4
,062
,226
1
,758
,050
2
,034
,911
-
7
,855
,187
081
A
GEN
CY
FO
R TH
E A
SSES
SMEN
T A
ND
APP
LIC
ATI
ON
OF
TEC
HN
OLO
GY
1
46,9
86,9
48
309
,146
,573
7
1,87
2,87
6 6
,000
,000
5
34,0
06,3
97
01.
01.0
9 G
OO
D G
OV
ERN
AN
CE
IMPL
EMEN
TATI
ON
PRO
GRA
M
146
,986
,948
1
06,0
21,3
59
1,9
30,5
90
-
254
,938
,897
01.
01.1
0 S
TATE
APP
ARA
TUS
AC
CO
UN
TABI
LITY
AN
D S
UPE
RVI-
SIO
N IN
CRE
ASE
PRO
GRA
M
-
1,2
93,0
00
32,
000
-
1,3
25,0
00
01.
01.1
3 A
PPA
RATU
S RE
SOU
RCE
MA
NA
GEM
ENT
PRO
GRA
M
-
3,9
83,0
00
17,
000
-
4,0
00,0
00
01.
01.1
7 S
TATE
APP
ARA
TUS
MEA
NS
AN
D F
AC
ILIT
Y IN
CRE
ASE
PR
OG
RAM
-
4
59,8
25
5,5
40,1
75
-
6,0
00,0
00
01.
04.0
1 R
ESEA
RCH
AN
D D
EVEL
OPM
ENT
PRO
GRA
M F
OR
SCI-
ENC
E A
ND
TEC
HN
OLO
GY
-
8
6,97
5,87
5 1
5,69
4,92
5 -
1
02,6
70,8
00
01.
04.0
2 D
IFFU
SIO
N A
ND
USE
PRO
GRA
M F
OR
SCIE
NC
E A
ND
TE
CH
NO
LOG
Y
-
11,
347,
900
1,6
52,1
00
-
13,
000,
000
01.
04.0
3 S
CIE
NC
E A
ND
TEC
HN
OLO
GY
INST
ITU
TIO
NA
L EN
-FO
RCEM
ENT
PRO
GRA
M
-
9,9
27,4
40
19,
804,
260
-
29,
731,
700
04.
07.0
1 C
APA
CIT
Y IN
CRE
ASE
PRO
GRA
M F
OR
THE
SCIE
NC
E A
ND
TEC
HN
OLO
GY
OF
PRO
DU
CTI
ON
SY
STEM
-
8
9,13
8,17
4 2
7,20
1,82
6 6
,000
,000
1
22,3
40,0
00
082
N
ATI
ON
AL
SPA
CE
AN
D A
VIA
TIO
N A
GEN
CY
6
0,16
0,68
5 1
36,9
50,8
79
31,
919,
042
-
229
,030
,606
01.
01.0
9 G
OO
D G
OV
ERN
AN
CE
IMPL
EMEN
TATI
ON
PRO
GRA
M
60,
160,
685
31,
610,
725
-
-
91,
771,
410
01.
01.1
0 S
TATE
APP
ARA
TUS
AC
CO
UN
TABI
LITY
AN
D S
UPE
RVI-
SIO
N IN
CRE
ASE
PRO
GRA
M
-
911
,400
-
-
9
11,4
00
01.
01.1
3 A
PPA
RATU
S RE
SOU
RCE
MA
NA
GEM
ENT
PRO
GRA
M
-
5,0
00,0
00
-
-
5,0
00,0
00
01.
04.0
1 R
ESEA
RCH
AN
D D
EVEL
OPM
ENT
PRO
GRA
M F
OR
SCI-
ENC
E A
ND
TEC
HN
OLO
GY
-
5
3,04
8,13
5 2
7,95
1,86
5 -
8
1,00
0,00
0
01.
04.0
2 D
IFFU
SIO
N A
ND
USE
PRO
GRA
M F
OR
SCIE
NC
E A
ND
TE
CH
NO
LOG
Y
-
23,
825,
229
812
,667
-
2
4,63
7,89
6
01.
04.0
3 S
CIE
NC
E A
ND
TEC
HN
OLO
GY
INST
ITU
TIO
NA
L EN
-FO
RCEM
ENT
PRO
GRA
M
-
17,
805,
390
2,9
04,5
10
-
20,
709,
900

271THE INDONESIANBUDGET OVERVIEW 2010
BUD
GET
SEC
TIO
NS
AN
D P
ROG
RAM
SPE
RSO
NN
EL
EXPE
ND
I-TU
RES
GO
OD
S EX
-PE
ND
ITU
RES
CAPI
TAL
EX-
PEN
DIT
URE
SSO
CIA
L A
S-SI
STA
NCE
STO
TAL
04.
07.0
1 C
APA
CIT
Y IN
CRE
ASE
PRO
GRA
M F
OR
THE
SCIE
NC
E A
ND
TEC
HN
OLO
GY
OF
PRO
DU
CTI
ON
SY
STEM
-
1
,800
,000
2
00,0
00
-
2,0
00,0
00
05.
05.0
1 T
ERRI
TORI
AL
MA
NA
GEM
ENT
PRO
GRA
M
-
2,9
50,0
00
50,
000
-
3,0
00,0
00
083
N
ATI
ON
AL
CO
ORD
INA
TIN
G A
GEN
CY
FO
R SU
RVEY
S A
ND
MA
PPIN
G
33,
720,
000
133
,671
,801
2
75,6
12,5
42
-
443
,004
,343
01.
01.0
5 IN
TERN
ATI
ON
AL
CO
OPE
RATI
ON
INC
REA
SE P
ROG
RAM
-
3
70,0
00
-
-
370
,000
01.
01.0
9 G
OO
D G
OV
ERN
AN
CE
IMPL
EMEN
TATI
ON
PRO
GRA
M
33,
720,
000
13,
273,
580
368
,320
-
4
7,36
1,90
0
01.
01.1
0 S
TATE
APP
ARA
TUS
AC
CO
UN
TABI
LITY
AN
D S
UPE
RVI-
SIO
N IN
CRE
ASE
PRO
GRA
M
-
2,2
61,0
22
69,
800
-
2,3
30,8
22
01.
01.1
2 A
DM
INIS
TRA
TIO
N A
ND
INST
ITU
TIO
NA
L M
AN
AG
E-M
ENT
PRO
GRA
M
-
5,6
92,2
15
613
,852
-
6
,306
,067
01.
01.1
3 A
PPA
RATU
S RE
SOU
RCE
MA
NA
GEM
ENT
PRO
GRA
M
-
2,1
05,8
20
669
,180
-
2
,775
,000
01.
01.1
5 Q
UA
LITY
INC
REA
SE P
ROG
RAM
FO
R PU
BLIC
SER
VIC
ES
-
1,9
46,6
00
828
,400
-
2
,775
,000
01.
01.1
7 S
TATE
APP
ARA
TUS
MEA
NS
AN
D F
AC
ILIT
Y IN
CRE
ASE
PR
OG
RAM
-
1
,230
,262
2
,231
,421
-
3
,461
,683
01.
04.0
1 R
ESEA
RCH
AN
D D
EVEL
OPM
ENT
PRO
GRA
M F
OR
SCI-
ENC
E A
ND
TEC
HN
OLO
GY
-
1
,295
,399
9
2,10
1 -
1
,387
,500
01.
04.0
2 D
IFFU
SIO
N A
ND
USE
PRO
GRA
M F
OR
SCIE
NC
E A
ND
TE
CH
NO
LOG
Y
-
8,5
24,0
52
10,
441,
600
-
18,
965,
652
04.
03.0
5 M
ARI
TIM
E RE
SOU
RCE
MA
NA
GEM
ENT
AN
D D
EVEL
OP-
MEN
T PR
OG
RAM
-
1
6,94
1,27
4 8
,496
,226
-
2
5,43
7,50
0
05.
04.0
1 N
ATU
RAL
RESO
URC
E C
ON
SERV
ATI
ON
AN
D P
ROTE
C-
TIO
N P
ROG
RAM
-
4
,925
,918
2
,161
,581
-
7
,087
,499
05.
05.0
1 T
ERRI
TORI
AL
ARR
AN
GEM
ENT
PRO
GRA
M
-
46,
977,
776
234
,695
,095
-
2
81,6
72,8
71
05.
90.0
1 IN
FORM
ATI
ON
AC
CES
S A
ND
QU
ALI
TY IN
CRE
ASE
PRO
-G
RAM
FO
R N
ATU
RAL
RESO
URC
E A
ND
EN
VIR
ON
MEN
T
-
11,
659,
993
5,5
02,5
08
-
17,
162,
501
06.
90.0
1 B
ORD
ERLA
ND
ARE
AS
DEV
ELO
PMEN
T PR
OG
RAM
-
7
,356
,990
8
,267
,000
-
1
5,62
3,99
0
08.
03.0
1 C
OM
MU
NIC
ATI
ON
, IN
FORM
ATI
ON
, AN
D M
ASS
ME-
DIA
DEV
ELO
PMEN
T PR
OG
RAM
-
9
,110
,900
1
,175
,458
-
1
0,28
6,35
8
084
N
ATI
ON
AL
AG
ENC
Y F
OR
STA
ND
ARD
IZA
TIO
N
9,3
78,9
42
51,
695,
061
523
,300
-
6
1,59
7,30
3
01.
01.0
9 G
OO
D G
OV
ERN
AN
CE
IMPL
EMEN
TATI
ON
PRO
GRA
M
9,3
78,9
42
14,
770,
740
380
,000
-
2
4,52
9,68
2

272 THE INDONESIANBUDGET OVERVIEW 2010
BUD
GET
SEC
TIO
NS
AN
D P
ROG
RAM
SPE
RSO
NN
EL
EXPE
ND
I-TU
RES
GO
OD
S EX
-PE
ND
ITU
RES
CAPI
TAL
EX-
PEN
DIT
URE
SSO
CIA
L A
S-SI
STA
NCE
STO
TAL
01.
01.1
0 S
TATE
APP
ARA
TUS
AC
CO
UN
TABI
LITY
AN
D S
UPE
RVI-
SIO
N IN
CRE
ASE
PRO
GRA
M
-
500
,000
-
-
5
00,0
00
01.
04.0
2 D
IFFU
SIO
N A
ND
USE
PRO
GRA
M F
OR
SCIE
NC
E A
ND
TE
CH
NO
LOG
Y
-
1,0
00,0
00
-
-
1,0
00,0
00
04.
01.0
6 E
XPO
RT D
EVEL
OPM
ENT
AN
D IN
CRE
ASE
PRO
GRA
M
-
1,2
92,8
00
-
-
1,2
92,8
00
04.
07.0
1 C
APA
CIT
Y IN
CRE
ASE
PRO
GRA
M F
OR
THE
SCIE
NC
E A
ND
TEC
HN
OLO
GY
OF
PRO
DU
CTI
ON
SY
STEM
-
1
,000
,000
-
-
1
,000
,000
04.
07.0
3 C
APA
BILI
TY IN
CRE
ASE
PRO
GRA
M F
OR
IND
UST
RIA
L TE
CH
NO
LOG
Y
-
5,0
00,0
00
-
-
5,0
00,0
00
04.
90.0
3 N
ATI
ON
AL
STA
ND
ARD
IZA
TIO
N D
EVEL
OPM
ENT
PRO
-G
RAM
-
2
8,13
1,52
1 1
43,3
00
-
28,
274,
821
085
N
UC
LEA
R EN
ERG
Y R
EGU
LATO
RY A
GEN
CY
2
0,47
6,40
0 3
4,08
9,61
3 2
,725
,919
-
5
7,29
1,93
2
01.
01.0
9 G
OO
D G
OV
ERN
AN
CE
IMPL
EMEN
TATI
ON
PRO
GRA
M
20,
476,
400
11,
097,
173
243
,137
-
3
1,81
6,71
0
01.
01.1
0 S
TATE
APP
ARA
TUS
AC
CO
UN
TABI
LITY
AN
D S
UPE
RVI-
SIO
N IN
CRE
ASE
PRO
GRA
M
-
495
,000
5
,000
-
5
00,0
00
01.
01.1
3 A
PPA
RATU
S RE
SOU
RCE
MA
NA
GEM
ENT
PRO
GRA
M
-
4,0
40,4
97
213
,203
-
4
,253
,700
01.
04.0
1 R
ESEA
RCH
AN
D D
EVEL
OPM
ENT
PRO
GRA
M F
OR
SCI-
ENC
E A
ND
TEC
HN
OLO
GY
-
1
,594
,000
3
1,00
0 -
1
,625
,000
01.
04.0
2 D
IFFU
SIO
N A
ND
USE
PRO
GRA
M F
OR
SCIE
NC
E A
ND
TE
CH
NO
LOG
Y
-
1,9
35,3
15
244
,685
-
2
,180
,000
01.
04.0
3 S
CIE
NC
E A
ND
TEC
HN
OLO
GY
INST
ITU
TIO
NA
L EN
-FO
RCEM
ENT
PRO
GRA
M
-
14,
927,
628
1,9
88,8
94
-
16,
916,
522
086
S
TATE
AD
MIN
ISTR
ATI
ON
AG
ENC
Y
32,
944,
348
122
,145
,845
4
0,93
0,74
0 -
1
96,0
20,9
33
01.
01.0
9 G
OO
D G
OV
ERN
AN
CE
IMPL
EMEN
TATI
ON
PRO
GRA
M
32,
944,
348
60,
611,
684
2,6
35,0
68
-
96,
191,
100
01.
01.1
0 S
TATE
APP
ARA
TUS
AC
CO
UN
TABI
LITY
AN
D S
UPE
RVI-
SIO
N IN
CRE
ASE
PRO
GRA
M
-
2,1
17,4
20
92,
880
-
2,2
10,3
00
01.
01.1
2 A
DM
INIS
TRA
TIO
N A
ND
INST
ITU
TIO
NA
L M
AN
AG
E-M
ENT
PRO
GRA
M
-
6,3
29,1
00
-
-
6,3
29,1
00
01.
01.1
3 A
PPA
RATU
S RE
SOU
RCE
MA
NA
GEM
ENT
PRO
GRA
M
-
35,
056,
133
-
-
35,
056,
133
01.
01.1
5 Q
UA
LITY
INC
REA
SE P
ROG
RAM
FO
R PU
BLIC
SER
VIC
ES
-
2,8
91,0
00
98,
000
-
2,9
89,0
00
01.
01.1
7 S
TATE
APP
ARA
TUS
MEA
NS
AN
D F
AC
ILIT
Y IN
CRE
ASE
PR
OG
RAM
-
1
,081
,248
3
7,77
8,95
2 -
3
8,86
0,20
0

273THE INDONESIANBUDGET OVERVIEW 2010
BUD
GET
SEC
TIO
NS
AN
D P
ROG
RAM
SPE
RSO
NN
EL
EXPE
ND
I-TU
RES
GO
OD
S EX
-PE
ND
ITU
RES
CAPI
TAL
EX-
PEN
DIT
URE
SSO
CIA
L A
S-SI
STA
NCE
STO
TAL
10.
05.0
1 O
FFIC
IAL
DU
TY T
RAIN
ING
PRO
GRA
M
-
14,
059,
260
325
,840
-
1
4,38
5,10
0
087
N
ATI
ON
AL
ARC
HIV
ES
26,
039,
167
55,
693,
097
22,
682,
640
-
104
,414
,904
01.
01.0
9 G
OO
D G
OV
ERN
AN
CE
IMPL
EMEN
TATI
ON
PRO
GRA
M
26,
039,
167
14,
914,
804
206
,525
-
4
1,16
0,49
6
01.
01.1
2 A
DM
INIS
TRA
TIO
N A
ND
INST
ITU
TIO
NA
L M
AN
AG
E-M
ENT
PRO
GRA
M
-
12,
738,
306
1,0
50,8
94
-
13,
789,
200
01.
01.1
3 A
PPA
RATU
S RE
SOU
RCE
MA
NA
GEM
ENT
PRO
GRA
M
-
9,8
98,5
95
278
,905
-
1
0,17
7,50
0
01.
01.1
5 Q
UA
LITY
INC
REA
SE P
ROG
RAM
FO
R PU
BLIC
SER
VIC
ES
-
18,
141,
392
9,7
10,5
16
-
27,
851,
908
01.
01.1
7 S
TATE
APP
ARA
TUS
MEA
NS
AN
D F
AC
ILIT
Y IN
CRE
ASE
PR
OG
RAM
-
-
1
1,43
5,80
0 -
1
1,43
5,80
0
088
N
ATI
ON
AL
CIV
IL S
ERV
ICE
AG
ENC
Y
157
,074
,710
1
12,5
40,0
41
168
,036
,419
-
4
37,6
51,1
70
01.
01.0
9 G
OO
D G
OV
ERN
AN
CE
IMPL
EMEN
TATI
ON
PRO
GRA
M
157
,074
,710
6
4,19
7,66
7 8
76,0
93
-
222
,148
,470
01.
01.1
0 S
TATE
APP
ARA
TUS
AC
CO
UN
TABI
LITY
AN
D S
UPE
RVI-
SIO
N IN
CRE
ASE
PRO
GRA
M
-
2,9
69,0
00
31,
000
-
3,0
00,0
00
01.
01.1
2 A
DM
INIS
TRA
TIO
N A
ND
INST
ITU
TIO
NA
L M
AN
AG
E-M
ENT
PRO
GRA
M
-
19,
355,
400
124
,277
,500
-
1
43,6
32,9
00
01.
01.1
3 A
PPA
RATU
S RE
SOU
RCE
MA
NA
GEM
ENT
PRO
GRA
M
-
13,
341,
440
619
,360
-
1
3,96
0,80
0
01.
01.1
5 Q
UA
LITY
INC
REA
SE P
ROG
RAM
FO
R PU
BLIC
SER
VIC
ES
-
12,
625,
534
389
,466
-
1
3,01
5,00
0
01.
01.1
7 S
TATE
APP
ARA
TUS
MEA
NS
AN
D F
AC
ILIT
Y IN
CRE
ASE
PR
OG
RAM
-
5
1,00
0 4
1,84
3,00
0 -
4
1,89
4,00
0
089
D
EVEL
OPM
ENT
FIN
AN
CE
CO
MPT
ROLL
ER
290
,503
,900
3
34,7
54,5
00
16,
880,
550
-
642
,138
,950
01.
01.0
9 G
OO
D G
OV
ERN
AN
CE
IMPL
EMEN
TATI
ON
PRO
GRA
M
290
,503
,900
7
2,80
4,50
0 2
21,8
50
-
363
,530
,250
01.
01.1
0 S
TATE
APP
ARA
TUS
AC
CO
UN
TABI
LITY
AN
D S
UPE
RVI-
SIO
N IN
CRE
ASE
PRO
GRA
M
-
239
,732
,700
-
-
2
39,7
32,7
00
01.
01.1
3 A
PPA
RATU
S RE
SOU
RCE
MA
NA
GEM
ENT
PRO
GRA
M
-
22,
217,
300
-
-
22,
217,
300
01.
01.1
7 S
TATE
APP
ARA
TUS
MEA
NS
AN
D F
AC
ILIT
Y IN
CRE
ASE
PR
OG
RAM
-
-
1
6,65
8,70
0 -
1
6,65
8,70
0
090
M
INIS
TRY
OF
TRA
DE
211
,732
,436
9
26,7
52,5
29
88,
701,
367
6,0
00,0
00
1,2
33,1
86,3
32
01.
01.0
9 G
OO
D G
OV
ERN
AN
CE
IMPL
EMEN
TATI
ON
PRO
GRA
M
42,
565,
128
190
,855
,814
7
,445
,890
-
2
40,8
66,8
32
01.
01.1
0 S
TATE
APP
ARA
TUS
AC
CO
UN
TABI
LITY
AN
D S
UPE
RVI-
SIO
N IN
CRE
ASE
PRO
GRA
M
5,0
18,4
82
17,
079,
458
628
,060
-
2
2,72
6,00
0

274 THE INDONESIANBUDGET OVERVIEW 2010
BUD
GET
SEC
TIO
NS
AN
D P
ROG
RAM
SPE
RSO
NN
EL
EXPE
ND
I-TU
RES
GO
OD
S EX
-PE
ND
ITU
RES
CAPI
TAL
EX-
PEN
DIT
URE
SSO
CIA
L A
S-SI
STA
NCE
STO
TAL
01.
01.1
3 A
PPA
RATU
S RE
SOU
RCE
MA
NA
GEM
ENT
PRO
GRA
M
5,6
62,1
26
37,
512,
155
4,0
52,4
19
-
47,
226,
700
01.
01.1
6 Q
UA
LITY
INC
REA
SE P
ROG
RAM
FO
R PU
BLIC
SER
VIC
ES
136
,490
1
4,51
3,32
8 1
,120
,182
-
1
5,77
0,00
0
01.
01.1
7 S
TATE
APP
ARA
TUS
MEA
NS
AN
D F
AC
ILIT
Y IN
CRE
ASE
PR
OG
RAM
-
-
3
,684
,000
-
3
,684
,000
01.
04.0
1 R
ESEA
RCH
AN
D D
EVEL
OPM
ENT
PRO
GRA
M F
OR
SCI-
ENC
E A
ND
TEC
HN
OLO
GY
7
,859
,385
3
0,71
4,60
2 2
,026
,013
-
4
0,60
0,00
0
04.
01.0
2 C
OST
OM
ER P
ROTE
CTI
ON
AN
D T
RAD
ING
SEC
URI
TY
PRO
GRA
M
6,9
82,6
47
54,
720,
577
18,
890,
000
-
80,
593,
224
04.
01.0
3 C
OO
PERA
TIO
N IN
CRE
ASE
PRO
GRA
M F
OR
INTE
RNA
-TI
ON
AL
TRA
DIN
G
14,
955,
030
64,
273,
470
235
,500
-
7
9,46
4,00
0
04.
01.0
6 E
XPO
RT D
EVEL
OPM
ENT
AN
D IN
CRE
ASE
PRO
GRA
M
99,
150,
971
328
,432
,449
1
6,74
5,38
0 -
4
44,3
28,8
00
04.
01.1
2 E
FFIC
IEN
CY
INC
REA
SE P
ROG
RAM
FO
R D
OM
ESTI
C
TRA
DIN
G
27,
063,
077
180
,423
,476
3
3,61
2,42
3 6
,000
,000
2
47,0
98,9
76
04.
90.0
3 N
ATI
ON
AL
STA
ND
ARD
IZA
TIO
N D
EVEL
OPM
ENT
PRO
-G
RAM
2
,339
,100
8
,227
,200
2
61,5
00
-
10,
827,
800
091
S
TATE
MIN
ISTR
Y F
OR
PUBL
IC H
OU
SIN
G
25,
500,
000
368
,715
,259
3
36,9
03,1
60
173
,400
,000
9
04,5
18,4
19
01.
01.0
9 G
OO
D G
OV
ERN
AN
CE
IMPL
EMEN
TATI
ON
PRO
GRA
M
25,
500,
000
65,
814,
949
793
,670
-
9
2,10
8,61
9
06.
01.0
1 H
OU
SIN
G D
EVEL
OPM
ENT
PRO
GRA
M
-
123
,693
,610
2
61,1
09,4
90
-
384
,803
,100
06.
02.0
2 H
OU
SIN
G C
UM
MU
NIT
Y E
MPO
WER
MEN
T PR
OG
RAM
-
1
79,2
06,7
00
75,
000,
000
173
,400
,000
4
27,6
06,7
00
092
S
TATE
MIN
ISTR
Y F
OR
YO
UTH
AN
D S
PORT
AFF
AIR
S 2
2,25
2,00
0 1
,282
,208
,892
2
49,3
98,5
68
-
1,5
53,8
59,4
60
01.
01.0
9 G
OO
D G
OV
ERN
AN
CE
IMPL
EMEN
TATI
ON
PRO
GRA
M
22,
252,
000
141
,207
,100
1
5,99
6,06
0 -
1
79,4
55,1
60
08.
05.0
1 FO
UN
DIN
G P
ROG
RAM
FO
R SU
PERI
OR
SPO
RTS
-
380
,427
,279
1
87,7
21
-
380
,615
,000
10.
10.0
1 Y
OU
TH P
OLI
CY
HA
RMO
NIZ
ATI
ON
AN
D D
EVEL
OP-
MEN
T PR
OG
RAM
-
2
2,50
0,00
0 -
-
2
2,50
0,00
0
10.
10.0
2 Y
OU
TH P
ART
ICIP
ATI
ON
INC
REA
SE A
ND
FO
UN
DIN
G
PRO
GRA
M
-
235
,681
,042
5
79,0
00
-
236
,260
,042
10.
10.0
3 S
PORT
MA
NA
GEM
ENT
AN
D P
OLI
CY
DEV
ELO
PMEN
T PR
OG
RAM
-
2
0,00
0,00
0 -
-
2
0,00
0,00
0
10.
10.0
4 S
PORT
SO
CIA
LIZA
TIO
N A
ND
FO
UN
DIN
G P
ROG
RAM
-
2
27,7
37,0
78
646
,626
-
2
28,3
83,7
04
10.
10.0
5 S
PORT
MEA
NS
AN
D F
AC
ILIT
Y IN
CRE
ASE
PRO
GRA
M
-
254
,656
,393
2
31,9
89,1
61
-
486
,645
,554
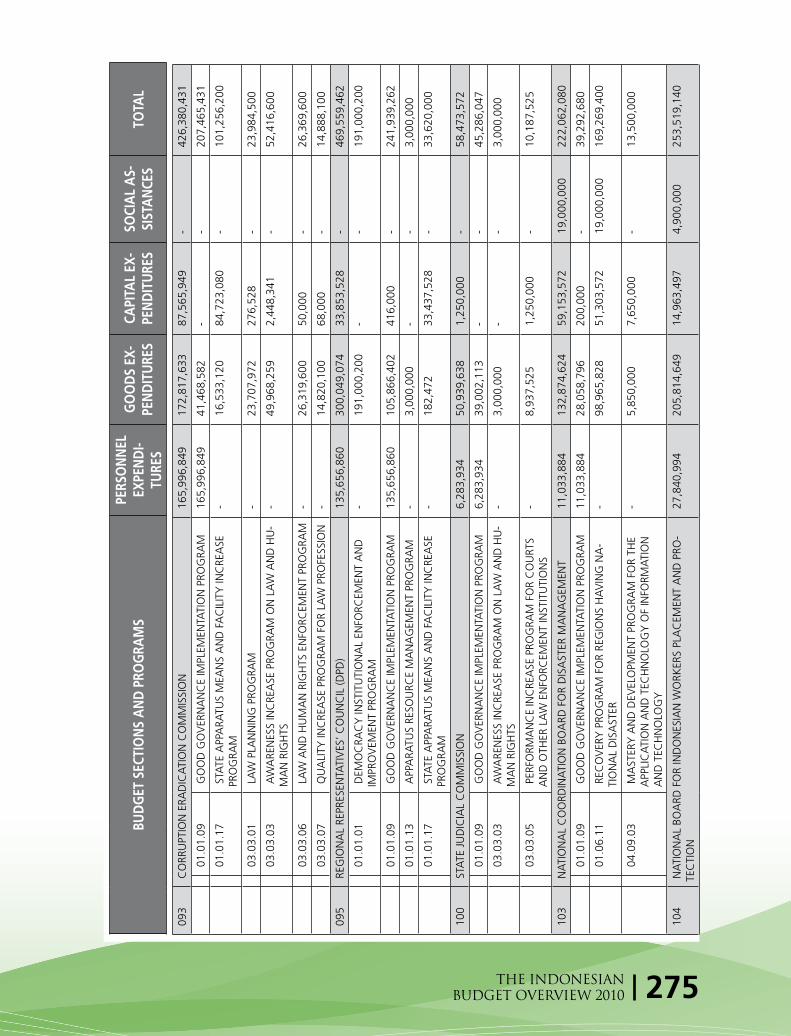
275THE INDONESIANBUDGET OVERVIEW 2010
BUD
GET
SEC
TIO
NS
AN
D P
ROG
RAM
SPE
RSO
NN
EL
EXPE
ND
I-TU
RES
GO
OD
S EX
-PE
ND
ITU
RES
CAPI
TAL
EX-
PEN
DIT
URE
SSO
CIA
L A
S-SI
STA
NCE
STO
TAL
093
C
ORR
UPT
ION
ERA
DIC
ATI
ON
CO
MM
ISSI
ON
1
65,9
96,8
49
172
,817
,633
8
7,56
5,94
9 -
4
26,3
80,4
31
01.
01.0
9 G
OO
D G
OV
ERN
AN
CE
IMPL
EMEN
TATI
ON
PRO
GRA
M
165
,996
,849
4
1,46
8,58
2 -
-
2
07,4
65,4
31
01.
01.1
7 S
TATE
APP
ARA
TUS
MEA
NS
AN
D F
AC
ILIT
Y IN
CRE
ASE
PR
OG
RAM
-
1
6,53
3,12
0 8
4,72
3,08
0 -
1
01,2
56,2
00
03.
03.0
1 L
AW
PLA
NN
ING
PRO
GRA
M
-
23,
707,
972
276
,528
-
2
3,98
4,50
0
03.
03.0
3 A
WA
REN
ESS
INC
REA
SE P
ROG
RAM
ON
LA
W A
ND
HU
-M
AN
RIG
HTS
-
4
9,96
8,25
9 2
,448
,341
-
5
2,41
6,60
0
03.
03.0
6 L
AW
AN
D H
UM
AN
RIG
HTS
EN
FORC
EMEN
T PR
OG
RAM
-
2
6,31
9,60
0 5
0,00
0 -
2
6,36
9,60
0
03.
03.0
7 Q
UA
LITY
INC
REA
SE P
ROG
RAM
FO
R LA
W P
ROFE
SSIO
N
-
14,
820,
100
68,
000
-
14,
888,
100
095
R
EGIO
NA
L RE
PRES
ENTA
TIV
ES’ C
OU
NC
IL (D
PD)
135
,656
,860
3
00,0
49,0
74
33,
853,
528
-
469
,559
,462
01.
01.0
1 D
EMO
CRA
CY
INST
ITU
TIO
NA
L EN
FORC
EMEN
T A
ND
IM
PRO
VEM
ENT
PRO
GRA
M
-
191
,000
,200
-
-
1
91,0
00,2
00
01.
01.0
9 G
OO
D G
OV
ERN
AN
CE
IMPL
EMEN
TATI
ON
PRO
GRA
M
135
,656
,860
1
05,8
66,4
02
416
,000
-
2
41,9
39,2
62
01.
01.1
3 A
PPA
RATU
S RE
SOU
RCE
MA
NA
GEM
ENT
PRO
GRA
M
-
3,0
00,0
00
-
-
3,0
00,0
00
01.
01.1
7 S
TATE
APP
ARA
TUS
MEA
NS
AN
D F
AC
ILIT
Y IN
CRE
ASE
PR
OG
RAM
-
1
82,4
72
33,
437,
528
-
33,
620,
000
100
S
TATE
JU
DIC
IAL
CO
MM
ISSI
ON
6
,283
,934
5
0,93
9,63
8 1
,250
,000
-
5
8,47
3,57
2
01.
01.0
9 G
OO
D G
OV
ERN
AN
CE
IMPL
EMEN
TATI
ON
PRO
GRA
M
6,2
83,9
34
39,
002,
113
-
-
45,
286,
047
03.
03.0
3 A
WA
REN
ESS
INC
REA
SE P
ROG
RAM
ON
LA
W A
ND
HU
-M
AN
RIG
HTS
-
3
,000
,000
-
-
3
,000
,000
03.
03.0
5 P
ERFO
RMA
NC
E IN
CRE
ASE
PRO
GRA
M F
OR
CO
URT
S A
ND
OTH
ER L
AW
EN
FORC
EMEN
T IN
STIT
UTI
ON
S
-
8,9
37,5
25
1,2
50,0
00
-
10,
187,
525
103
N
ATI
ON
AL
CO
ORD
INA
TIO
N B
OA
RD F
OR
DIS
AST
ER M
AN
AG
EMEN
T 1
1,03
3,88
4 1
32,8
74,6
24
59,
153,
572
19,
000,
000
222
,062
,080
01.
01.0
9 G
OO
D G
OV
ERN
AN
CE
IMPL
EMEN
TATI
ON
PRO
GRA
M
11,
033,
884
28,
058,
796
200
,000
-
3
9,29
2,68
0
01.
06.1
1 R
ECO
VER
Y P
ROG
RAM
FO
R RE
GIO
NS
HA
VIN
G N
A-
TIO
NA
L D
ISA
STER
-
9
8,96
5,82
8 5
1,30
3,57
2 1
9,00
0,00
0 1
69,2
69,4
00
04.
09.0
3 M
AST
ERY
AN
D D
EVEL
OPM
ENT
PRO
GRA
M F
OR
THE
APP
LIC
ATI
ON
AN
D T
ECH
NO
LOG
Y O
F IN
FORM
ATI
ON
A
ND
TEC
HN
OLO
GY
-
5,8
50,0
00
7,6
50,0
00
-
13,
500,
000
104
N
ATI
ON
AL
BOA
RD F
OR
IND
ON
ESIA
N W
ORK
ERS
PLA
CEM
ENT
AN
D P
RO-
TEC
TIO
N
27,
840,
994
205
,814
,649
1
4,96
3,49
7 4
,900
,000
2
53,5
19,1
40

276 THE INDONESIANBUDGET OVERVIEW 2010
BUD
GET
SEC
TIO
NS
AN
D P
ROG
RAM
SPE
RSO
NN
EL
EXPE
ND
I-TU
RES
GO
OD
S EX
-PE
ND
ITU
RES
CAPI
TAL
EX-
PEN
DIT
URE
SSO
CIA
L A
S-SI
STA
NCE
STO
TAL
01.
01.0
9 G
OO
D G
OV
ERN
AN
CE
IMPL
EMEN
TATI
ON
PRO
GRA
M
27,
840,
994
15,
622,
646
55,
500
-
43,
519,
140
01.
01.1
0 S
TATE
APP
ARA
TUS
AC
CO
UN
TABI
LITY
AN
D S
UPE
RVI-
SIO
N IN
CRE
ASE
PRO
GRA
M
-
3,1
53,5
60
56,
000
-
3,2
09,5
60
04.
02.0
4 J
OB
OPP
ORT
UN
ITY
DEV
ELO
PMEN
T A
ND
EX
TEN
SIO
N
PRO
GRA
M
-
187
,038
,443
1
4,85
1,99
7 4
,900
,000
2
06,7
90,4
40
105
S
IDO
ARJ
O M
UD
DIS
AST
ER M
AN
AG
EMEN
T BO
ARD
(BPL
S)
12,
444,
755
150
,342
,555
1
,045
,487
,977
7
,815
,353
1
,216
,090
,640
01.
01.0
9 G
OO
D G
OV
ERN
AN
CE
IMPL
EMEN
TATI
ON
PRO
GRA
M
12,
444,
755
4,0
16,3
85
-
-
16,
461,
140
04.
08.0
2 R
OA
DS
AN
D B
RID
GES
DEV
ELO
PMEN
T/ IN
CRE
ASE
PR
OG
RAM
-
3
,244
,993
3
45,6
13,4
07
-
348
,858
,400
05.
04.0
4 C
OA
STA
L SE
CU
RITY
AN
D F
LOO
D C
ON
TRO
L PR
O-
GRA
M
-
138
,591
,330
6
99,8
74,5
70
-
838
,465
,900
11.
08.0
1 S
OC
IAL
PRO
SPER
ITY
GU
ARA
NTE
E A
ND
ASS
ISTA
NC
E PR
OG
RAM
-
4
,489
,847
-
7
,815
,353
1
2,30
5,20
0
106
G
OV
ERN
MEN
T G
OO
DS/
SER
VIC
E PR
OC
URE
MEN
T PO
LIC
Y A
GEN
CY
1
4,23
0,30
0 8
7,32
8,29
6 8
,190
,374
4
66,3
20
110
,215
,290
01.
01.0
1 D
EMO
CRA
CY
INST
ITU
TIO
NA
L EN
FORC
EMEN
T A
ND
IM
PRO
VEM
ENT
PRO
GRA
M
-
1,4
50,0
00
-
-
1,4
50,0
00
01.
01.0
9 G
OO
D G
OV
ERN
AN
CE
IMPL
EMEN
TATI
ON
PRO
GRA
M
14,
230,
300
30,
202,
990
150
,000
-
4
4,58
3,29
0
01.
01.1
2 A
DM
INIS
TRA
TIO
N A
ND
INST
ITU
TIO
NA
L M
AN
AG
E-M
ENT
PRO
GRA
M
-
8,5
96,0
00
-
-
8,5
96,0
00
01.
01.1
3 A
PPA
RATU
S RE
SOU
RCE
MA
NA
GEM
ENT
PRO
GRA
M
-
14,
732,
306
138
,374
4
66,3
20
15,
337,
000
01.
01.1
5 Q
UA
LITY
INC
REA
SE P
ROG
RAM
FO
R LA
W P
ROFE
SSIO
N
-
32,
347,
000
1,5
80,0
00
-
33,
927,
000
01.
01.1
7 ST
ATE
APP
ARA
TUS
MEA
NS
AN
D F
AC
ILIT
Y IN
CRE
ASE
PR
OG
RAM
-
-
6
,322
,000
-
6
,322
,000
107
N
ATI
ON
AL
SEA
RCH
AN
D R
ESC
UE
AG
ENC
Y
90,
719,
000
133
,385
,996
3
41,6
06,1
04
-
565
,711
,100
01.
01.0
9 G
OO
D G
OV
ERN
AN
CE
IMPL
EMEN
TATI
ON
PRO
GRA
M
90,
719,
000
126
,589
,800
-
-
2
17,3
08,8
00
03.
02.0
1 SE
ARC
H A
ND
RES
CU
E PR
OG
RAM
-
6
,796
,196
3
41,6
06,1
04
-
348
,402
,300
108
C
OM
MIS
SIO
N F
OR
THE
SUPE
RVIS
ION
OF
BUSI
NES
S C
OM
PETI
TIO
N
32,
812,
018
45,
565,
890
3,9
35,9
92
-
82,
313,
900
04.
01.0
1 BU
SIN
ESS
CO
MPE
TITI
ON
PRO
GRA
M 3
2,81
2,01
8 4
5,56
5,89
0 3
,935
,992
-
8
2,31
3,90
0
T O
T A
L
90,
029,
992,
741
106
,652
,384
,891
82
,175
,538
,394
61
,291
,246
,363
3
40,0
38,9
45,3
80