Embed Size (px)
Citation preview
2010 Employee SurveyMay 2010

AcknowledgementsThe Berkeley Lab Survey Team consisted of the following:
Jim Krupnick, Sponsor
Vera Potapenko, Project Lead
Karen Ramorino, Project Manager
Chris Paquette, MOR Associates
Steve Wolff, MOR Associates
Brian McDonald, MOR Associates
MOR Associates, an external consulting firm, acted as project manager for this effort, analyzing the data and preparing this report. MOR Associates specializes in continuous improve-ment, strategic thinking and leadership development. MOR Associates has conducted a number of large-scale surveys for organizations in higher education, including MIT, Stanford, the University of Chicago, and others.
MOR Associates, Inc.462 Main Street, Suite 300
Watertown, MA 02472tel: 617.924.4501 fax: 617.924.8070
morassociates.com
Brian McDonald, [email protected]

Table of Contents
Introduction and Overview . . . . . . . . . . . . . . . . . . . . . . . . . . . . . . . . . . . . . . . . . . . . . . . . 1
Survey Methodology and Design . . . . . . . . . . . . . . . . . . . . . . . . . . . . . . . . . . . . . . . . . . . 4
Overview of the Results . . . . . . . . . . . . . . . . . . . . . . . . . . . . . . . . . . . . . . . . . . . . . . . . . . 9
Reading the Ratings Charts and Tables . . . . . . . . . . . . . . . . . . . . . . . . . . . . . . . . . . . . 41
Summary Charts of Agreement Ratingsfor All Questions . . . . . . . . . . . . . . . . . . . . . 45
Breakout Charts and Tables: All Divisions . . . . . . . . . . . . . . . . . . . . . . . . . . . . . . . . . . 55
Detailed Tables: All Divisions . . . . . . . . . . . . . . . . . . . . . . . . . . . . . . . . . . . . . . . . . . . . . 73
Breakout Charts and Tables: by Function . . . . . . . . . . . . . . . . . . . . . . . . . . . . . . . . . . 109
Breakout Charts and Tables: by HEERA/FLSA Status . . . . . . . . . . . . . . . . . . . . . . . . 125
Breakout Charts and Tables: by Gender . . . . . . . . . . . . . . . . . . . . . . . . . . . . . . . . . . . 141
Breakout Charts and Tables: by Race . . . . . . . . . . . . . . . . . . . . . . . . . . . . . . . . . . . . . 157
Breakout Charts and Tables: by Age . . . . . . . . . . . . . . . . . . . . . . . . . . . . . . . . . . . . . 173
Breakout Charts and Tables: by Years of Service . . . . . . . . . . . . . . . . . . . . . . . . . . . 189
Breakout Charts and Tables: by Union Code . . . . . . . . . . . . . . . . . . . . . . . . . . . . . . . 205
Appendix A: The Survey Instrument . . . . . . . . . . . . . . . . . . . . . . . . . . . . . . . . . . . . . . . .A-1


Berkeley Lab 2010 Employee Survey • Introduction and Overview | 1
MOR Associates, Inc.
Section One Introduction
and Overview


Berkeley Lab 2010 Employee Survey • Introduction | 3
MOR Associates, Inc.
Introduction
This report provides a summary of the purposes, the methodology and the results of the Berkeley Lab Employee Survey sponsored by Berkeley Lab. This effort is the part of a broader Laboratory-wide initia-tive, begun in 2009, to conduct employee surveys on a regular basis. Last year, surveys were conducted for Postdocs and Operations employees; this year’s survey was a Lab-wide survey of the Lab’s career, faculty and term communities.
The 2009 surveys were referred to as ”workplace climate” surveys that sought to inventory the likes, dislikes, and issues that formed people’s impressions of working at the Lab. This latest iteration of the survey does the same but introduces performance measures for employee engagement. Research shows engaged employ-ees are more productive, more innovative, and more committed to their work. It follows that engaged employees enjoy higher levels of purpose and meaning in their work lives. There is not one commonly accepted definition of employee engagement, but it is generally agreed that engagement involves applying a level of discretionary effort to the job.
This survey was undertaken for the following purposes, all of which helped guide the design of the survey:
• To document where employees feel positively about working at Berkeley Lab as well as where they might not.
• To discern the degree to which various aspects of working at Berkeley Lab contribute to how engaged employees can be in their work.
• To prioritize and guide workplace impovements.
The overarching goal of this effort is to make Berkeley Lab an even better place to work so that it can best fulfill its mission.
Christopher Paquette Senior Consultant MOR Associates
4 | Introduction • Berkeley Lab 2010 Employee Climate Survey
MOR Associates, Inc.
Survey Methodology
Survey Population
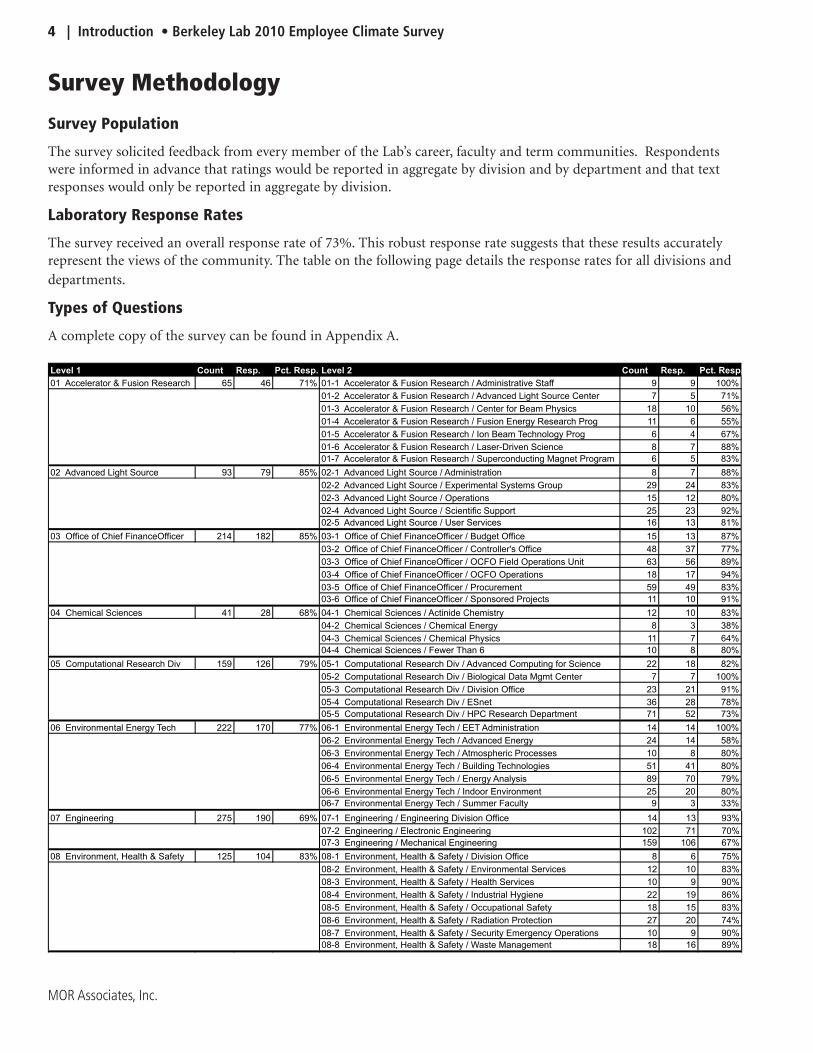
The survey solicited feedback from every member of the Lab’s career, faculty and term communities. Respondents were informed in advance that ratings would be reported in aggregate by division and by department and that text responses would only be reported in aggregate by division.
Laboratory Response Rates
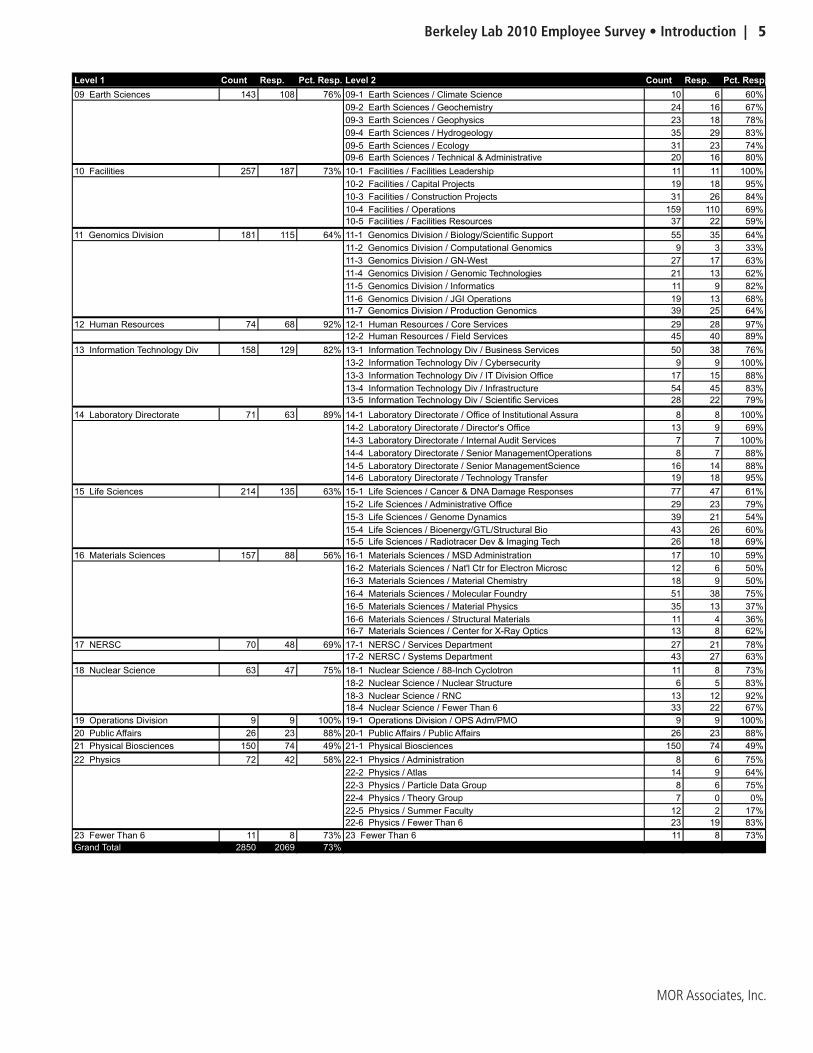
The survey received an overall response rate of 73%. This robust response rate suggests that these results accurately represent the views of the community. The table on the following page details the response rates for all divisions and departments.
Types of Questions
A complete copy of the survey can be found in Appendix A.
Level 1 Count Resp. Pct. Resp. Level 2 Count Resp. Pct. Resp.
01 Accelerator & Fusion Research 65 46 71% 01-1 Accelerator & Fusion Research / Administrative Staff 9 9 100%
01-2 Accelerator & Fusion Research / Advanced Light Source Center 7 5 71%
01-3 Accelerator & Fusion Research / Center for Beam Physics 18 10 56%
01-4 Accelerator & Fusion Research / Fusion Energy Research Prog 11 6 55%
01-5 Accelerator & Fusion Research / Ion Beam Technology Prog 6 4 67%
01-6 Accelerator & Fusion Research / Laser-Driven Science 8 7 88%
01-7 Accelerator & Fusion Research / Superconducting Magnet Program 6 5 83%
02 Advanced Light Source 93 79 85% 02-1 Advanced Light Source / Administration 8 7 88%
02-2 Advanced Light Source / Experimental Systems Group 29 24 83%
02-3 Advanced Light Source / Operations 15 12 80%
02-4 Advanced Light Source / Scientific Support 25 23 92%
02-5 Advanced Light Source / User Services 16 13 81%
03 Office of Chief FinanceOfficer 214 182 85% 03-1 Office of Chief FinanceOfficer / Budget Office 15 13 87%
03-2 Office of Chief FinanceOfficer / Controller's Office 48 37 77%
03-3 Office of Chief FinanceOfficer / OCFO Field Operations Unit 63 56 89%
03-4 Office of Chief FinanceOfficer / OCFO Operations 18 17 94%
03-5 Office of Chief FinanceOfficer / Procurement 59 49 83%
03-6 Office of Chief FinanceOfficer / Sponsored Projects 11 10 91%
04 Chemical Sciences 41 28 68% 04-1 Chemical Sciences / Actinide Chemistry 12 10 83%
04-2 Chemical Sciences / Chemical Energy 8 3 38%
04-3 Chemical Sciences / Chemical Physics 11 7 64%
04-4 Chemical Sciences / Fewer Than 6 10 8 80%
05 Computational Research Div 159 126 79% 05-1 Computational Research Div / Advanced Computing for Science 22 18 82%
05-2 Computational Research Div / Biological Data Mgmt Center 7 7 100%
05-3 Computational Research Div / Division Office 23 21 91%
05-4 Computational Research Div / ESnet 36 28 78%
05-5 Computational Research Div / HPC Research Department 71 52 73%
06 Environmental Energy Tech 222 170 77% 06-1 Environmental Energy Tech / EET Administration 14 14 100%
06-2 Environmental Energy Tech / Advanced Energy 24 14 58%
06-3 Environmental Energy Tech / Atmospheric Processes 10 8 80%
06-4 Environmental Energy Tech / Building Technologies 51 41 80%
06-5 Environmental Energy Tech / Energy Analysis 89 70 79%
06-6 Environmental Energy Tech / Indoor Environment 25 20 80%
06-7 Environmental Energy Tech / Summer Faculty 9 3 33%
07 Engineering 275 190 69% 07-1 Engineering / Engineering Division Office 14 13 93%
07-2 Engineering / Electronic Engineering 102 71 70%
07-3 Engineering / Mechanical Engineering 159 106 67%
08 Environment, Health & Safety 125 104 83% 08-1 Environment, Health & Safety / Division Office 8 6 75%
08-2 Environment, Health & Safety / Environmental Services 12 10 83%
08-3 Environment, Health & Safety / Health Services 10 9 90%
08-4 Environment, Health & Safety / Industrial Hygiene 22 19 86%
08-5 Environment, Health & Safety / Occupational Safety 18 15 83%
08-6 Environment, Health & Safety / Radiation Protection 27 20 74%
08-7 Environment, Health & Safety / Security Emergency Operations 10 9 90%
08-8 Environment, Health & Safety / Waste Management 18 16 89%
09 Earth Sciences 143 108 76% 09-1 Earth Sciences / Climate Science 10 6 60%
09-2 Earth Sciences / Geochemistry 24 16 67%
09-3 Earth Sciences / Geophysics 23 18 78%
09-4 Earth Sciences / Hydrogeology 35 29 83%
09-5 Earth Sciences / Ecology 31 23 74%
09-6 Earth Sciences / Technical & Administrative 20 16 80%
10 Facilities 257 187 73% 10-1 Facilities / Facilities Leadership 11 11 100%
10-2 Facilities / Capital Projects 19 18 95%
10-3 Facilities / Construction Projects 31 26 84%
10-4 Facilities / Operations 159 110 69%
10-5 Facilities / Facilities Resources 37 22 59%
11 Genomics Division 181 115 64% 11-1 Genomics Division / Biology/Scientific Support 55 35 64%
11-2 Genomics Division / Computational Genomics 9 3 33%
11-3 Genomics Division / GN-West 27 17 63%
11-4 Genomics Division / Genomic Technologies 21 13 62%
11-5 Genomics Division / Informatics 11 9 82%
11-6 Genomics Division / JGI Operations 19 13 68%
11-7 Genomics Division / Production Genomics 39 25 64%
12 Human Resources 74 68 92% 12-1 Human Resources / Core Services 29 28 97%
12-2 Human Resources / Field Services 45 40 89%
13 Information Technology Div 158 129 82% 13-1 Information Technology Div / Business Services 50 38 76%
13-2 Information Technology Div / Cybersecurity 9 9 100%
13-3 Information Technology Div / IT Division Office 17 15 88%
13-4 Information Technology Div / Infrastructure 54 45 83%
13-5 Information Technology Div / Scientific Services 28 22 79%
Berkeley Lab 2010 Employee Survey • Introduction | 5
MOR Associates, Inc.
07 Engineering 275 190 69% 07-1 Engineering / Engineering Division Office 14 13 93%
07-2 Engineering / Electronic Engineering 102 71 70%
07-3 Engineering / Mechanical Engineering 159 106 67%
08 Environment, Health & Safety 125 104 83% 08-1 Environment, Health & Safety / Division Office 8 6 75%
08-2 Environment, Health & Safety / Environmental Services 12 10 83%
08-3 Environment, Health & Safety / Health Services 10 9 90%
08-4 Environment, Health & Safety / Industrial Hygiene 22 19 86%
08-5 Environment, Health & Safety / Occupational Safety 18 15 83%
08-6 Environment, Health & Safety / Radiation Protection 27 20 74%
08-7 Environment, Health & Safety / Security Emergency Operations 10 9 90%
08-8 Environment, Health & Safety / Waste Management 18 16 89%
09 Earth Sciences 143 108 76% 09-1 Earth Sciences / Climate Science 10 6 60%
09-2 Earth Sciences / Geochemistry 24 16 67%
09-3 Earth Sciences / Geophysics 23 18 78%
09-4 Earth Sciences / Hydrogeology 35 29 83%
09-5 Earth Sciences / Ecology 31 23 74%
09-6 Earth Sciences / Technical & Administrative 20 16 80%
10 Facilities 257 187 73% 10-1 Facilities / Facilities Leadership 11 11 100%
10-2 Facilities / Capital Projects 19 18 95%
10-3 Facilities / Construction Projects 31 26 84%
10-4 Facilities / Operations 159 110 69%
10-5 Facilities / Facilities Resources 37 22 59%
11 Genomics Division 181 115 64% 11-1 Genomics Division / Biology/Scientific Support 55 35 64%
11-2 Genomics Division / Computational Genomics 9 3 33%
11-3 Genomics Division / GN-West 27 17 63%
11-4 Genomics Division / Genomic Technologies 21 13 62%
11-5 Genomics Division / Informatics 11 9 82%
11-6 Genomics Division / JGI Operations 19 13 68%
11-7 Genomics Division / Production Genomics 39 25 64%
12 Human Resources 74 68 92% 12-1 Human Resources / Core Services 29 28 97%
12-2 Human Resources / Field Services 45 40 89%
13 Information Technology Div 158 129 82% 13-1 Information Technology Div / Business Services 50 38 76%
13-2 Information Technology Div / Cybersecurity 9 9 100%
13-3 Information Technology Div / IT Division Office 17 15 88%
13-4 Information Technology Div / Infrastructure 54 45 83%
13-5 Information Technology Div / Scientific Services 28 22 79%
14 Laboratory Directorate 71 63 89% 14-1 Laboratory Directorate / Office of Institutional Assura 8 8 100%
14-2 Laboratory Directorate / Director's Office 13 9 69%
14-3 Laboratory Directorate / Internal Audit Services 7 7 100%
14-4 Laboratory Directorate / Senior ManagementOperations 8 7 88%
14-5 Laboratory Directorate / Senior ManagementScience 16 14 88%
14-6 Laboratory Directorate / Technology Transfer 19 18 95%
15 Life Sciences 214 135 63% 15-1 Life Sciences / Cancer & DNA Damage Responses 77 47 61%
15-2 Life Sciences / Administrative Office 29 23 79%
15-3 Life Sciences / Genome Dynamics 39 21 54%
15-4 Life Sciences / Bioenergy/GTL/Structural Bio 43 26 60%
15-5 Life Sciences / Radiotracer Dev & Imaging Tech 26 18 69%
16 Materials Sciences 157 88 56% 16-1 Materials Sciences / MSD Administration 17 10 59%
16-2 Materials Sciences / Nat'l Ctr for Electron Microsc 12 6 50%
16-3 Materials Sciences / Material Chemistry 18 9 50%
16-4 Materials Sciences / Molecular Foundry 51 38 75%
16-5 Materials Sciences / Material Physics 35 13 37%
16-6 Materials Sciences / Structural Materials 11 4 36%
16-7 Materials Sciences / Center for X-Ray Optics 13 8 62%
17 NERSC 70 48 69% 17-1 NERSC / Services Department 27 21 78%
17-2 NERSC / Systems Department 43 27 63%
18 Nuclear Science 63 47 75% 18-1 Nuclear Science / 88-Inch Cyclotron 11 8 73%
18-2 Nuclear Science / Nuclear Structure 6 5 83%
18-3 Nuclear Science / RNC 13 12 92%
18-4 Nuclear Science / Fewer Than 6 33 22 67%
19 Operations Division 9 9 100% 19-1 Operations Division / OPS Adm/PMO 9 9 100%
20 Public Affairs 26 23 88% 20-1 Public Affairs / Public Affairs 26 23 88%
21 Physical Biosciences 150 74 49% 21-1 Physical Biosciences 150 74 49%
22 Physics 72 42 58% 22-1 Physics / Administration 8 6 75%
22-2 Physics / Atlas 14 9 64%
22-3 Physics / Particle Data Group 8 6 75%
22-4 Physics / Theory Group 7 0 0%
22-5 Physics / Summer Faculty 12 2 17%
22-6 Physics / Fewer Than 6 23 19 83%
23 Fewer Than 6 11 8 73% 23 Fewer Than 6 11 8 73%
Grand Total 2850 2069 73%
As of noon, 5/26/10
Level 1 Count Resp. Pct. Resp. Level 2 Count Resp. Pct. Resp.
01 Accelerator & Fusion Research 65 46 71% 01-1 Accelerator & Fusion Research / Administrative Staff 9 9 100%
01-2 Accelerator & Fusion Research / Advanced Light Source Center 7 5 71%
01-3 Accelerator & Fusion Research / Center for Beam Physics 18 10 56%
01-4 Accelerator & Fusion Research / Fusion Energy Research Prog 11 6 55%
01-5 Accelerator & Fusion Research / Ion Beam Technology Prog 6 4 67%
01-6 Accelerator & Fusion Research / Laser-Driven Science 8 7 88%
01-7 Accelerator & Fusion Research / Superconducting Magnet Program 6 5 83%
02 Advanced Light Source 93 79 85% 02-1 Advanced Light Source / Administration 8 7 88%
02-2 Advanced Light Source / Experimental Systems Group 29 24 83%
02-3 Advanced Light Source / Operations 15 12 80%
02-4 Advanced Light Source / Scientific Support 25 23 92%
02-5 Advanced Light Source / User Services 16 13 81%
03 Office of Chief FinanceOfficer 214 182 85% 03-1 Office of Chief FinanceOfficer / Budget Office 15 13 87%
03-2 Office of Chief FinanceOfficer / Controller's Office 48 37 77%
03-3 Office of Chief FinanceOfficer / OCFO Field Operations Unit 63 56 89%
03-4 Office of Chief FinanceOfficer / OCFO Operations 18 17 94%
03-5 Office of Chief FinanceOfficer / Procurement 59 49 83%
03-6 Office of Chief FinanceOfficer / Sponsored Projects 11 10 91%
04 Chemical Sciences 41 28 68% 04-1 Chemical Sciences / Actinide Chemistry 12 10 83%
04-2 Chemical Sciences / Chemical Energy 8 3 38%
04-3 Chemical Sciences / Chemical Physics 11 7 64%
04-4 Chemical Sciences / Fewer Than 6 10 8 80%
05 Computational Research Div 159 126 79% 05-1 Computational Research Div / Advanced Computing for Science 22 18 82%
05-2 Computational Research Div / Biological Data Mgmt Center 7 7 100%
05-3 Computational Research Div / Division Office 23 21 91%
05-4 Computational Research Div / ESnet 36 28 78%
05-5 Computational Research Div / HPC Research Department 71 52 73%
06 Environmental Energy Tech 222 170 77% 06-1 Environmental Energy Tech / EET Administration 14 14 100%
06-2 Environmental Energy Tech / Advanced Energy 24 14 58%
06-3 Environmental Energy Tech / Atmospheric Processes 10 8 80%
06-4 Environmental Energy Tech / Building Technologies 51 41 80%
06-5 Environmental Energy Tech / Energy Analysis 89 70 79%
06-6 Environmental Energy Tech / Indoor Environment 25 20 80%
06-7 Environmental Energy Tech / Summer Faculty 9 3 33%
6 | Introduction • Berkeley Lab 2010 Employee Climate Survey
MOR Associates, Inc.
Survey Design
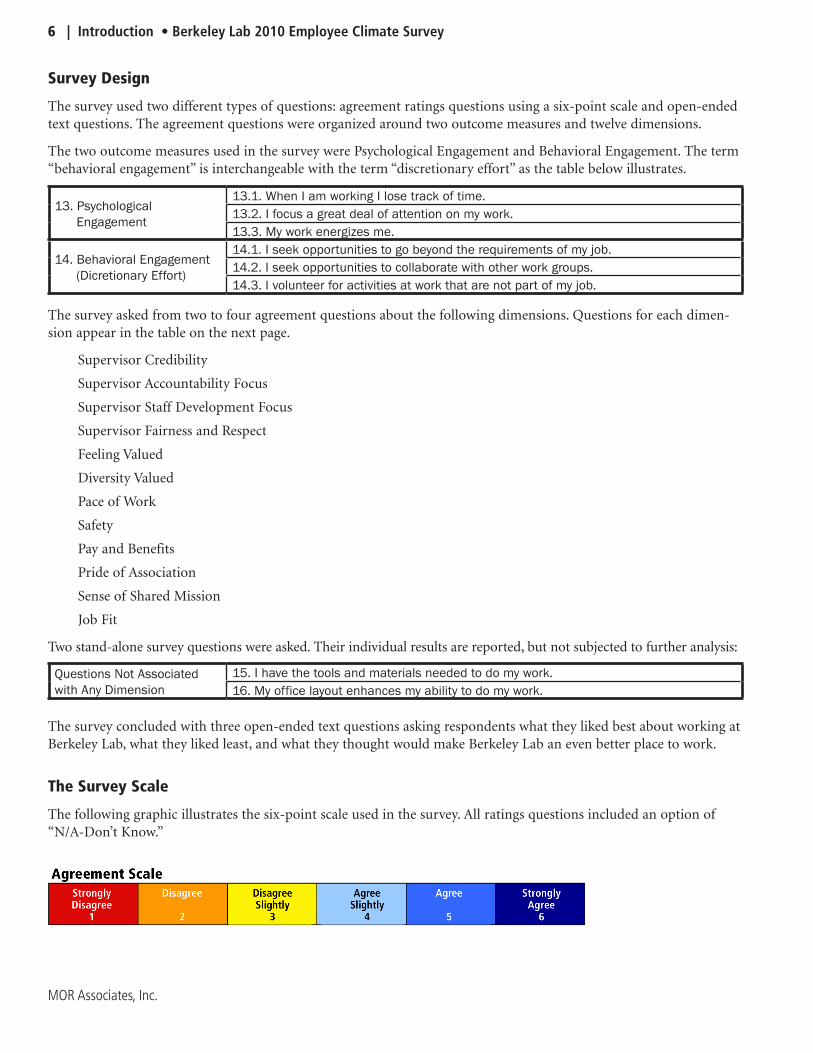
The survey used two different types of questions: agreement ratings questions using a six-point scale and open-ended text questions. The agreement questions were organized around two outcome measures and twelve dimensions.
The two outcome measures used in the survey were Psychological Engagement and Behavioral Engagement. The term “behavioral engagement” is interchangeable with the term “discretionary effort” as the table below illustrates.
The survey asked from two to four agreement questions about the following dimensions. Questions for each dimen-sion appear in the table on the next page.
Supervisor Credibility
Supervisor Accountability Focus
Supervisor Staff Development Focus
Supervisor Fairness and Respect
Feeling Valued
Diversity Valued
Pace of Work
Safety
Pay and Benefits
Pride of Association
Sense of Shared Mission
Job Fit
Two stand-alone survey questions were asked. Their individual results are reported, but not subjected to further analysis:
The survey concluded with three open-ended text questions asking respondents what they liked best about working at Berkeley Lab, what they liked least, and what they thought would make Berkeley Lab an even better place to work.
The Survey Scale
The following graphic illustrates the six-point scale used in the survey. All ratings questions included an option of “N/A-Don’t Know.”
13. Psychological Engagement
13.1. When I am working I lose track of time.13.2. I focus a great deal of attention on my work.13.3. My work energizes me.
14. Behavioral Engagement (Dicretionary Effort)
14.1. I seek opportunities to go beyond the requirements of my job.14.2. I seek opportunities to collaborate with other work groups.14.3. I volunteer for activities at work that are not part of my job.
Questions Not Associated with Any Dimension
15. I have the tools and materials needed to do my work.16. My office layout enhances my ability to do my work.
Berkeley Lab 2010 Employee Survey • Introduction | 7
MOR Associates, Inc.
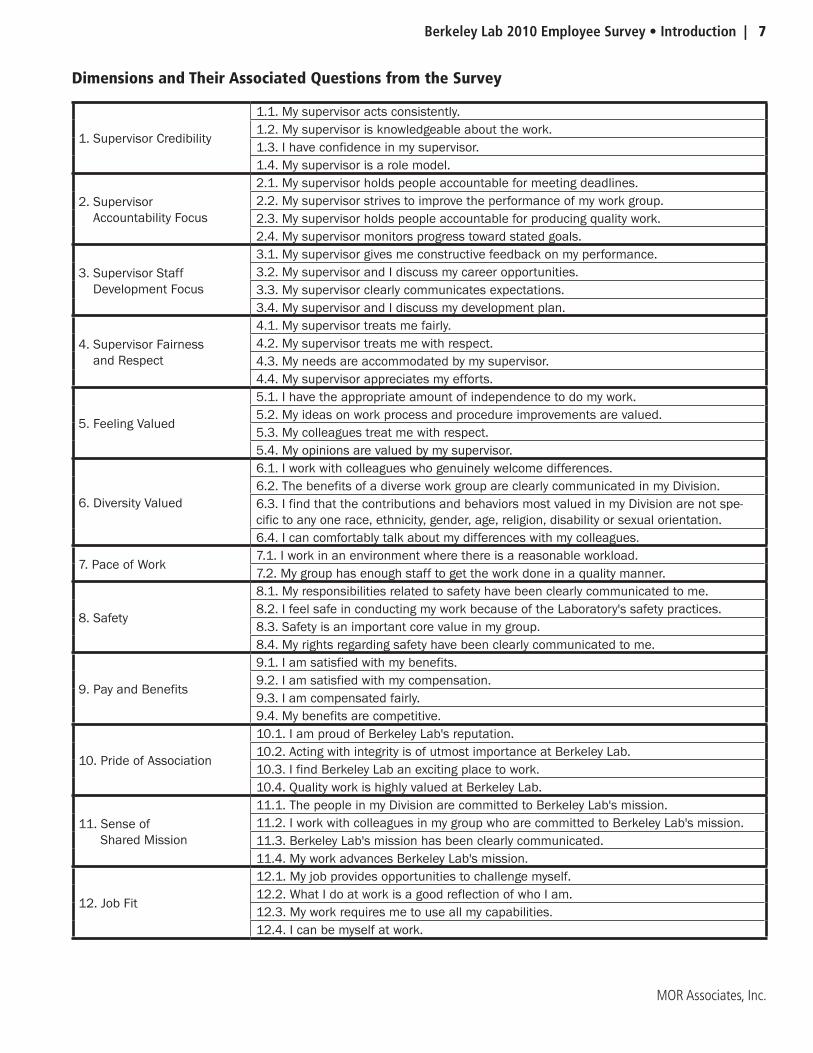
Dimensions and Their Associated Questions from the Survey
1. Supervisor Credibility
1.1. My supervisor acts consistently.1.2. My supervisor is knowledgeable about the work.1.3. I have confidence in my supervisor.1.4. My supervisor is a role model.
2. Supervisor Accountability Focus
2.1. My supervisor holds people accountable for meeting deadlines.2.2. My supervisor strives to improve the performance of my work group.2.3. My supervisor holds people accountable for producing quality work.2.4. My supervisor monitors progress toward stated goals.
3. Supervisor Staff Development Focus
3.1. My supervisor gives me constructive feedback on my performance.3.2. My supervisor and I discuss my career opportunities.3.3. My supervisor clearly communicates expectations.3.4. My supervisor and I discuss my development plan.
4. Supervisor Fairness and Respect
4.1. My supervisor treats me fairly.4.2. My supervisor treats me with respect.4.3. My needs are accommodated by my supervisor.4.4. My supervisor appreciates my efforts.
5. Feeling Valued
5.1. I have the appropriate amount of independence to do my work.5.2. My ideas on work process and procedure improvements are valued.5.3. My colleagues treat me with respect.5.4. My opinions are valued by my supervisor.
6. Diversity Valued
6.1. I work with colleagues who genuinely welcome differences.6.2. The benefits of a diverse work group are clearly communicated in my Division.6.3. I find that the contributions and behaviors most valued in my Division are not spe-cific to any one race, ethnicity, gender, age, religion, disability or sexual orientation.6.4. I can comfortably talk about my differences with my colleagues.
7. Pace of Work7.1. I work in an environment where there is a reasonable workload.7.2. My group has enough staff to get the work done in a quality manner.
8. Safety
8.1. My responsibilities related to safety have been clearly communicated to me.8.2. I feel safe in conducting my work because of the Laboratory's safety practices.8.3. Safety is an important core value in my group.8.4. My rights regarding safety have been clearly communicated to me.
9. Pay and Benefits
9.1. I am satisfied with my benefits.9.2. I am satisfied with my compensation.9.3. I am compensated fairly.9.4. My benefits are competitive.
10. Pride of Association
10.1. I am proud of Berkeley Lab's reputation.10.2. Acting with integrity is of utmost importance at Berkeley Lab.10.3. I find Berkeley Lab an exciting place to work.10.4. Quality work is highly valued at Berkeley Lab.
11. Sense of Shared Mission
11.1. The people in my Division are committed to Berkeley Lab's mission.11.2. I work with colleagues in my group who are committed to Berkeley Lab's mission.11.3. Berkeley Lab's mission has been clearly communicated.11.4. My work advances Berkeley Lab's mission.
12. Job Fit
12.1. My job provides opportunities to challenge myself.12.2. What I do at work is a good reflection of who I am.12.3. My work requires me to use all my capabilities.12.4. I can be myself at work.
8 | Introduction • Berkeley Lab 2010 Employee Climate Survey
MOR Associates, Inc.
Berkeley Lab 2010 Employee Survey • Survey Results Overview | 9
MOR Associates, Inc.
Overview of the Results
10 | Survey Results Overview • Berkeley Lab 2010 Employee Climate Survey
MOR Associates, Inc.
Executive Summary
What the Data Can Tell Us
This report contains reams of data. Much of it provides useful hard measurement of various questions and dimen-sions. If this were a customer satisfaction survey, we might easily identify the one or two items that upset people the most and leadership could then work with staff to realize improvements. Employee surveys aren’t so neat: some improvements, such as pay increases, often don’t make people happier or more engaged; the most important issues to address may be specific to smaller groups; and rather than providing definitive answers, even the best data sometime raise new questions that require further exploration. Adding to these general caveats, each place has its own culture, and the Lab is a fairly unique environment relative to the rest of the world, so what’s generally true elsewhere may not apply here. Our goal with this overview is to responsibly state what answers we think the data provide and to point out what areas may require further investigation.
A Snapshot of Berkeley Lab
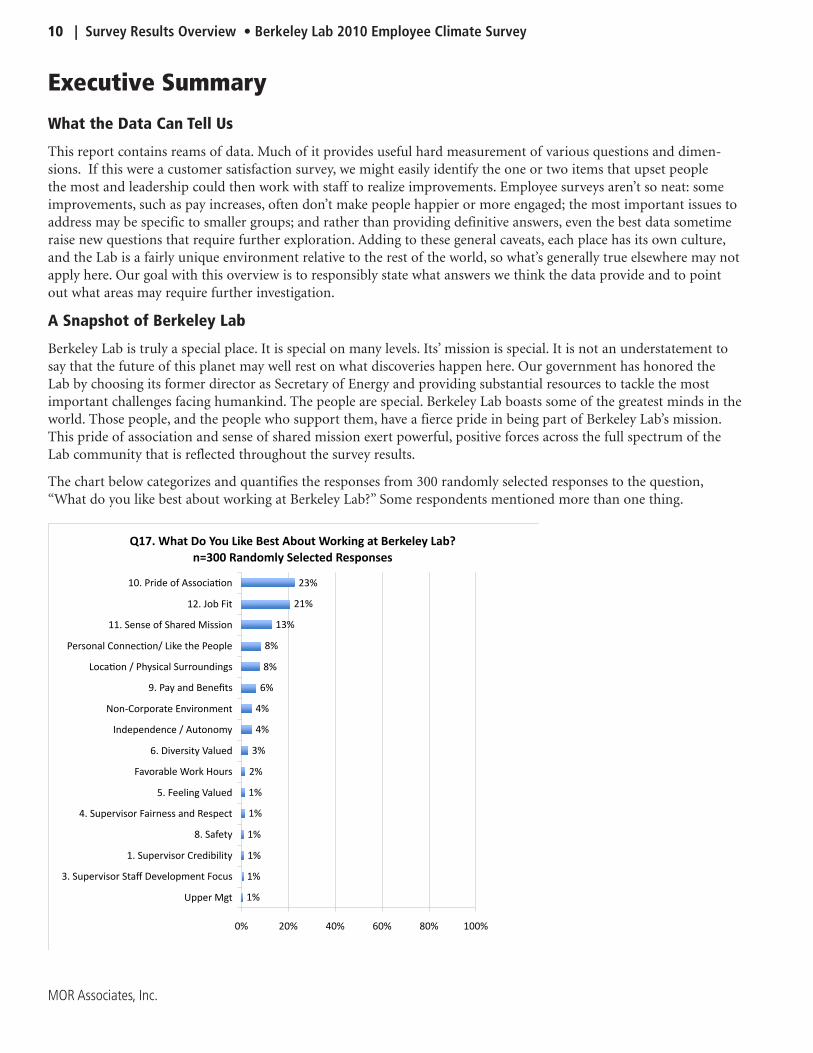
Berkeley Lab is truly a special place. It is special on many levels. Its’ mission is special. It is not an understatement to say that the future of this planet may well rest on what discoveries happen here. Our government has honored the Lab by choosing its former director as Secretary of Energy and providing substantial resources to tackle the most important challenges facing humankind. The people are special. Berkeley Lab boasts some of the greatest minds in the world. Those people, and the people who support them, have a fierce pride in being part of Berkeley Lab’s mission. This pride of association and sense of shared mission exert powerful, positive forces across the full spectrum of the Lab community that is reflected throughout the survey results.
The chart below categorizes and quantifies the responses from 300 randomly selected responses to the question, “What do you like best about working at Berkeley Lab?” Some respondents mentioned more than one thing.
Q17. What Do You Like Best About Working at Berkeley Lab?
n=300 Randomly Selected Responses
1%
1%
1%
1%
1%
1%
2%
3%
4%
4%
6%
8%
8%
13%
21%
23%
0% 20% 40% 60% 80% 100%
Upper Mgt
3. Supervisor Staff Development Focus
1. Supervisor Credibility
8. Safety
4. Supervisor Fairness and Respect
5. Feeling Valued
Favorable Work Hours
6. Diversity Valued
Independence / Autonomy
Non‐Corporate Environment
9. Pay and Benefits
[oca@on / Physical Surroundings
Personal Connec@on/ [ike the People
11. Sense of Shared Mission
12. Job Fit
10. Pride of Associa@on
Berkeley Lab 2010 Employee Survey • Survey Results Overview | 11
MOR Associates, Inc.
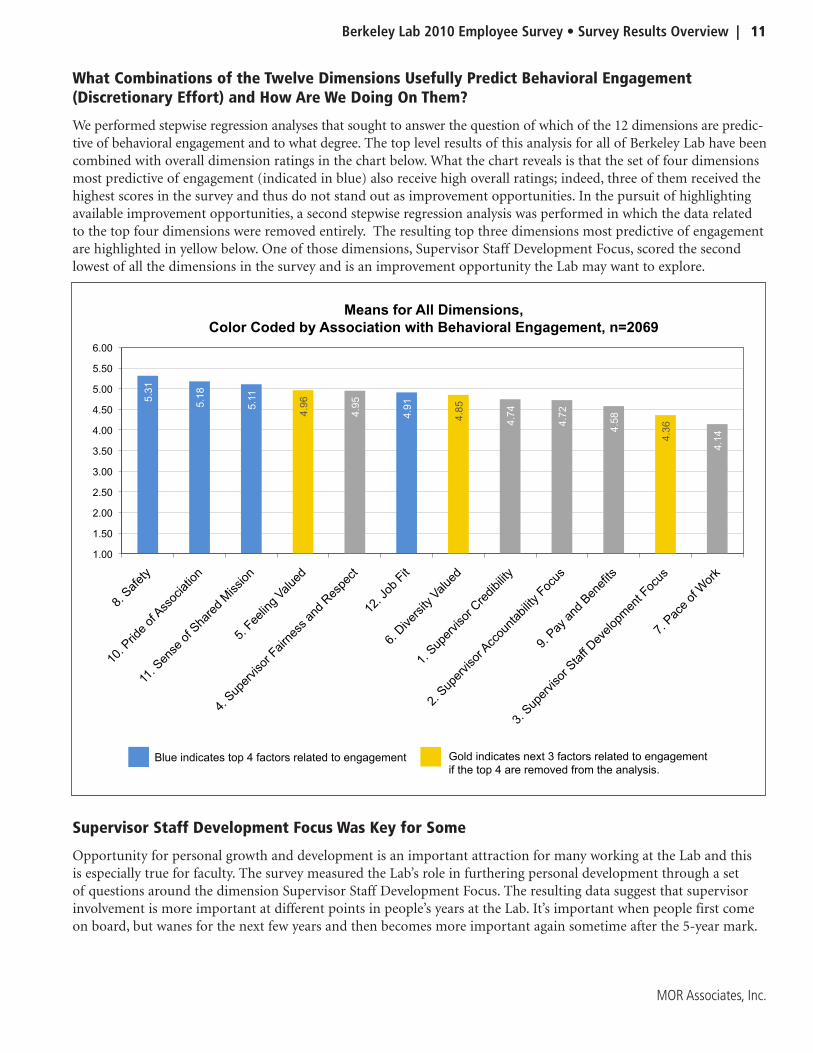
What Combinations of the Twelve Dimensions Usefully Predict Behavioral Engagement (Discretionary Effort) and How Are We Doing On Them?
We performed stepwise regression analyses that sought to answer the question of which of the 12 dimensions are predic-tive of behavioral engagement and to what degree. The top level results of this analysis for all of Berkeley Lab have been combined with overall dimension ratings in the chart below. What the chart reveals is that the set of four dimensions most predictive of engagement (indicated in blue) also receive high overall ratings; indeed, three of them received the highest scores in the survey and thus do not stand out as improvement opportunities. In the pursuit of highlighting available improvement opportunities, a second stepwise regression analysis was performed in which the data related to the top four dimensions were removed entirely. The resulting top three dimensions most predictive of engagement are highlighted in yellow below. One of those dimensions, Supervisor Staff Development Focus, scored the second lowest of all the dimensions in the survey and is an improvement opportunity the Lab may want to explore.
Supervisor Staff Development Focus Was Key for Some
Opportunity for personal growth and development is an important attraction for many working at the Lab and this is especially true for faculty. The survey measured the Lab’s role in furthering personal development through a set of questions around the dimension Supervisor Staff Development Focus. The resulting data suggest that supervisor involvement is more important at different points in people’s years at the Lab. It’s important when people first come on board, but wanes for the next few years and then becomes more important again sometime after the 5-year mark.
5.3
1
5.1
8
5.1
1
4.9
6
4.9
5
4.9
1
4.8
5
4.7
4
4.7
2
4.5
8
4.3
6
4.1
4
1.00
1.50
2.00
2.50
3.00
3.50
4.00
4.50
5.00
5.50
6.00
Means for All Dimensions,
Color Coded by Association with Behavioral Engagement, n=2069
Blue indicates top 4 factors related to engagement Gold indicates next 3 factors related to engagement
if the top 4 are removed from the analysis.
12 | Survey Results Overview • Berkeley Lab 2010 Employee Climate Survey
MOR Associates, Inc.
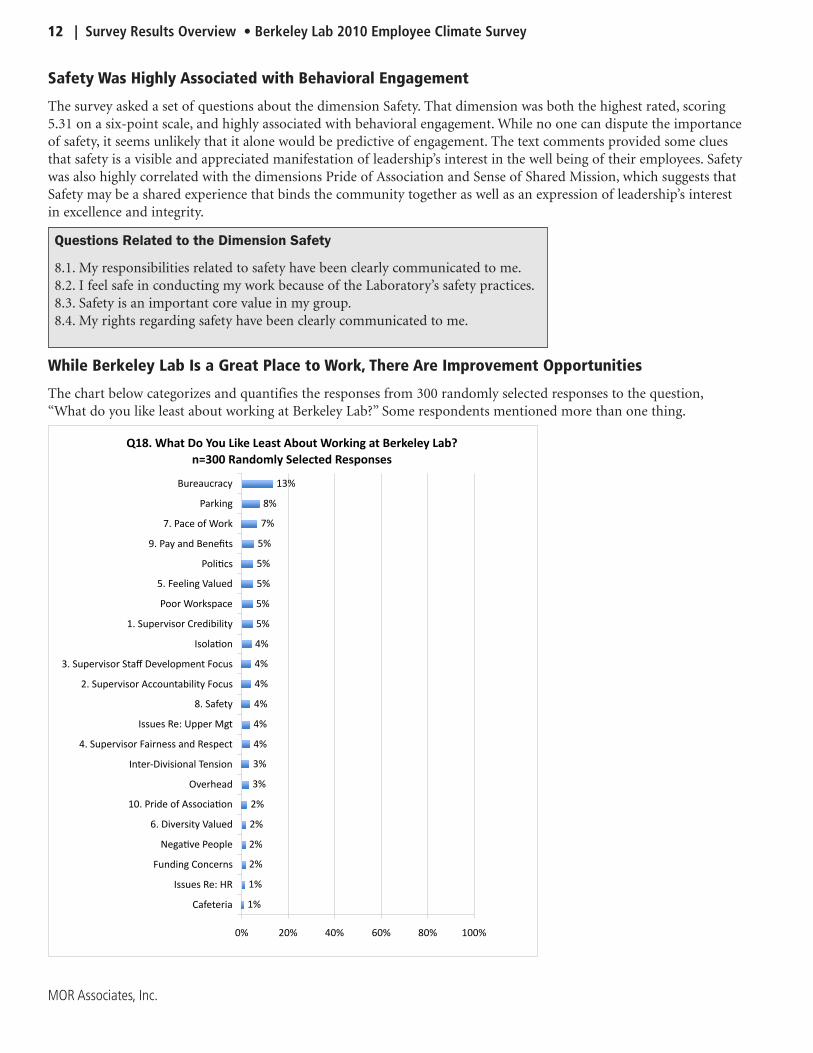
Safety Was Highly Associated with Behavioral Engagement
The survey asked a set of questions about the dimension Safety. That dimension was both the highest rated, scoring 5.31 on a six-point scale, and highly associated with behavioral engagement. While no one can dispute the importance of safety, it seems unlikely that it alone would be predictive of engagement. The text comments provided some clues that safety is a visible and appreciated manifestation of leadership’s interest in the well being of their employees. Safety was also highly correlated with the dimensions Pride of Association and Sense of Shared Mission, which suggests that Safety may be a shared experience that binds the community together as well as an expression of leadership’s interest in excellence and integrity.
Questions Related to the Dimension Safety
8.1. My responsibilities related to safety have been clearly communicated to me.8.2. I feel safe in conducting my work because of the Laboratory’s safety practices.8.3. Safety is an important core value in my group.8.4. My rights regarding safety have been clearly communicated to me.
While Berkeley Lab Is a Great Place to Work, There Are Improvement Opportunities
The chart below categorizes and quantifies the responses from 300 randomly selected responses to the question, “What do you like least about working at Berkeley Lab?” Some respondents mentioned more than one thing.
Q18. What Do You Like Least About Working at Berkeley Lab?
n=300 Randomly Selected Responses
1%
1%
2%
2%
2%
2%
3%
3%
4%
4%
4%
4%
4%
4%
5%
5%
5%
5%
5%
7%
8%
13%
0% 20% 40% 60% 80% 100%
Cafeteria
Issues Re: HR
Funding Concerns
?ega@ve People
6. Diversity Valued
10. Pride of Associa@on
Overhead
Inter‐Divisional Tension
4. Supervisor Fairness and Respect
Issues Re: Upper Mgt
8. Safety
2. Supervisor Accountability Focus
3. Supervisor Staff Development Focus
Isola@on
1. Supervisor Credibility
Poor Workspace
5. Feeling Valued
Poli@cs
9. Pay and Benefits
7. Pace of Work
Parking
Bureaucracy
Berkeley Lab 2010 Employee Survey • Survey Results Overview | 13
MOR Associates, Inc.
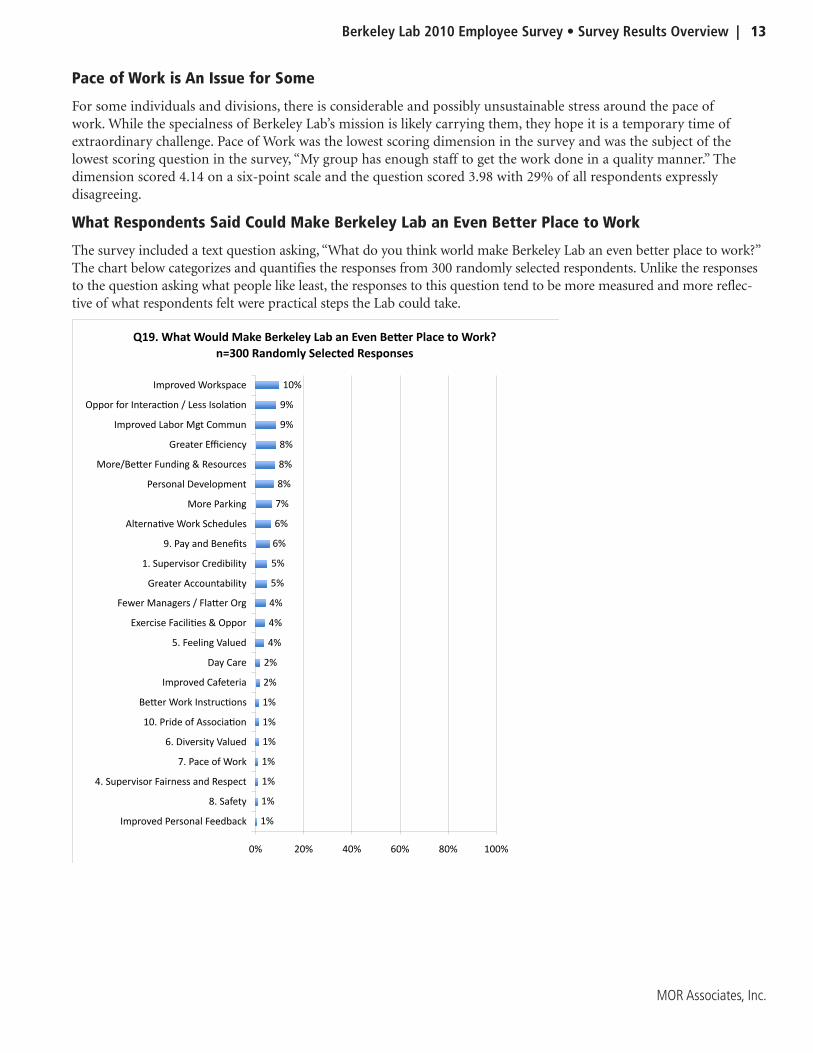
Pace of Work is An Issue for Some
For some individuals and divisions, there is considerable and possibly unsustainable stress around the pace of work. While the specialness of Berkeley Lab’s mission is likely carrying them, they hope it is a temporary time of extraordinary challenge. Pace of Work was the lowest scoring dimension in the survey and was the subject of the lowest scoring question in the survey, “My group has enough staff to get the work done in a quality manner.” The dimension scored 4.14 on a six-point scale and the question scored 3.98 with 29% of all respondents expressly disagreeing.
What Respondents Said Could Make Berkeley Lab an Even Better Place to Work
The survey included a text question asking, “What do you think world make Berkeley Lab an even better place to work?” The chart below categorizes and quantifies the responses from 300 randomly selected respondents. Unlike the responses to the question asking what people like least, the responses to this question tend to be more measured and more reflec-tive of what respondents felt were practical steps the Lab could take.
!"#$ &'at &o+ld .a/e 1e2/eley 4a5 an 78en 1e9e2 :lace to &o2/<
n=300 Randomly Selected Responses
1%
1%
1%
1%
1%
1%
1%
2%
2%
4%
4%
4%
5%
5%
6%
6%
7%
8%
8%
8%
9%
9%
10%
0% 20% 40% 60% 80% 100%
Improved Personal Feedback
8. Safety
4. Supervisor Fairness and Respect
7. Pace of Work
6. Diversity Valued
10. Pride of AssociaIon
BeKer Work InstrucIons
Improved Cafeteria
Day Care
5. Feeling Valued
EOercise FaciliIes P Qppor
FeRer Managers T FlaKer Qrg
Greater Accountability
1. Supervisor Credibility
9. Pay and Benefits
AlternaIve Work ScWedules
More Parking
Personal Development
MoreTBeKer Funding P Resources
Greater Efficiency
Improved Labor Mgt Commun
Qppor for InteracIon T Less IsolaIon
Improved Workspace
14 | Survey Results Overview • Berkeley Lab 2010 Employee Climate Survey
MOR Associates, Inc.
A Narrative Summary of the Text Comments
Not surprisingly, bureaucracy is a concern, which many saw as contributing to inefficiency and representing a waste of resources.
The quality and amount of work space was a top issue in the text comments. Another space issue was parking.
There was a notable thread in the comments expressing a wish for more opportunities to interact and/or collabo-rate with others outside of their immediate work groups. This was animated by a yearning for a sense of teamwork and belonging and/or a sense of isolation. Members of JGI, in particular, identified themselves as feeling apart from the Lab, both physically and socially. While some comments revolved around work collaboration, most were about finding more of a sense of community.
This desire for greater unity was also sometimes expressed in the comments related to improved labor/management communications. Such comments spoke to a desire for leadership to do more to communicate about the direction of the organization. Our experience is that this is a common sentiment in these types of surveys and typically appears with much greater frequency. Another thread in the comments about labor-management communications was a desire to be consulted about decisions that affect respondents work lives and/or a desire to hear more about the ratio-nale for the decisions that are made.
Various aspects of employee work life balance and quality of life appeared in the text comments, often together. They included alternate schedules, on-site exercise facilities, and cafeteria improvements. A smaller subset asked for day care.

Berkeley Lab 2010 Employee Survey • Survey Results Overview | 15
MOR Associates, Inc.
Our Analysis Suggested Areas for Further Investigation
This survey provides data, but as is often the case, it also raises questions that may require further exploration.
There are a number of dimensions that are negatively associated with behavioral engagement, i.e., the lower the ratings respondents gave, the more likely they were to be behaviorally engaged. The specific dimensions that had negative associations were:
Pay and BenefitsPace of WorkDiversityFeeling ValuedSupervisor Accountability FocusSupervisor Fairness and Respect
We can only hypothesize about why such counterintuitive results occur. One hypothesis that fits all of these instances is that negative associations represent a resentment and/or a latent source of dissatisfaction that is exacerbated by exerting greater discretionary effort. This would not be contrary to the Two Factor Theory, also known as Herzberg’s Motivation-Hygiene Theory, that describes the nature of the associations people make with various aspects of job satisfaction as viewed through two lenses: “hygiene factors” and “motivators.” The table below provides a snapshot.
Factors Hygiene Factors Motivators
Relationship to work Extrinsic Intrinsic
Relationship to overall job satisfaction
Absence leads to express dissatisfac-tion, but beyond adequacy, better doesn’t lead to express satisfaction
Better leads to greater express satisfaction, but absence doesn’t lead to express dissatisfaction
Examples Company policy Achievement
Supervision Recognition
Relationship with boss Work itself
Working conditions Responsibility
Salary Advancement
Relationships with peers Growth
As you can see, most, if not all, of the dimensions with negative associations can be classified as hygiene factors. It’s also true that, with one exception*, all of the motivators from the table above were only positively associated with behavioral engagement.
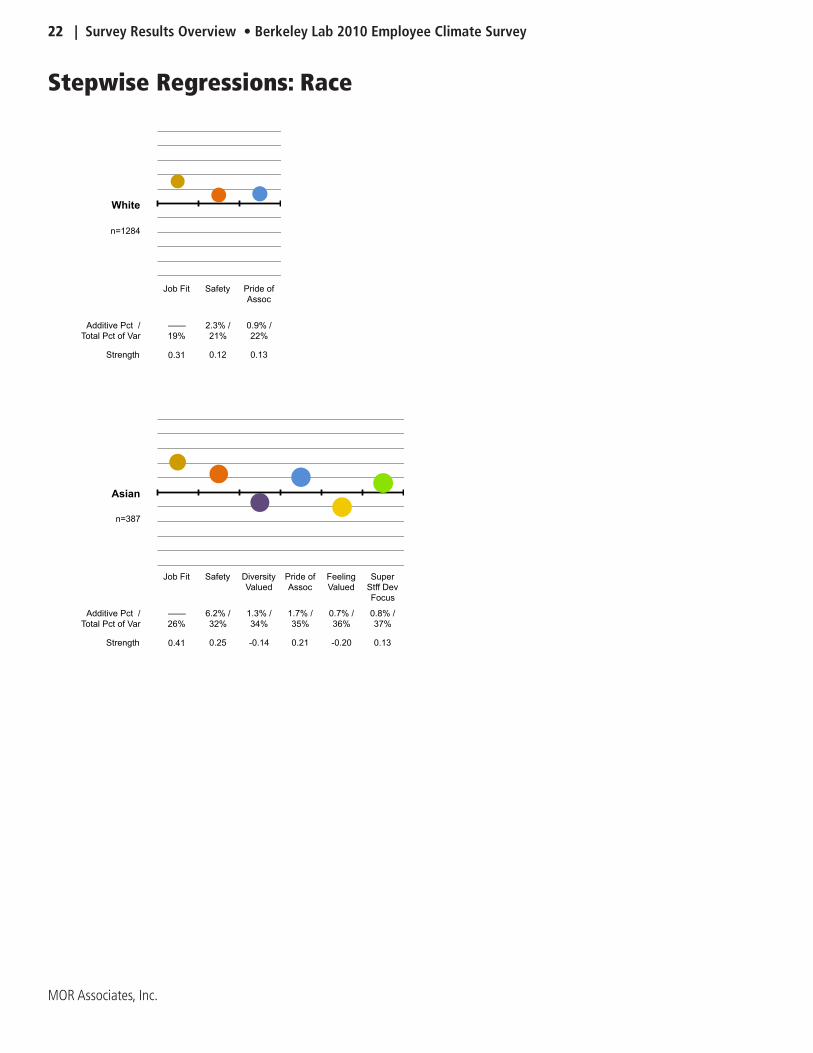
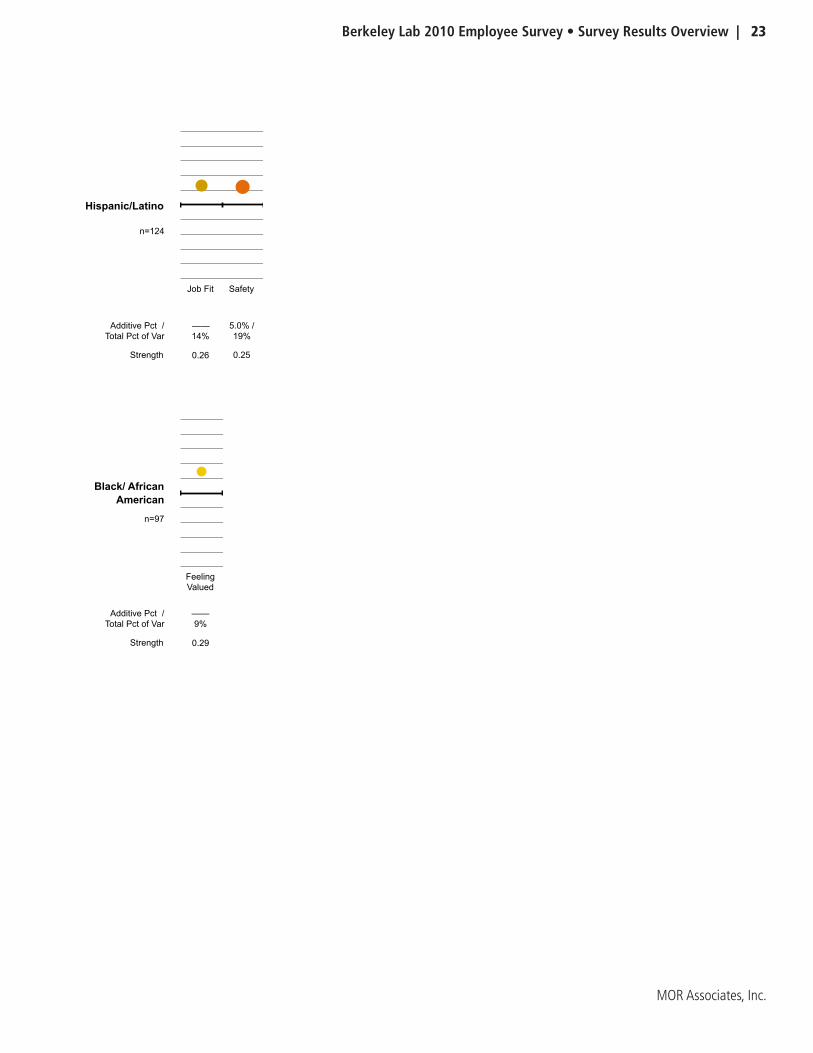
This year’s survey contained a new set of questions related to diversity. The results were mostly positive, particularly around the question of fairness, but the data suggest that there are notable differences in racial groups and divisions that are deserving of further investigation. For example, Diversity Valued was negatively associated with behavioral engagement for Asians and the dimensions that were typically predictive of behavioral engagement for other races were not predictive for Blacks/African Americans.
16 | Survey Results Overview • Berkeley Lab 2010 Employee Climate Survey
MOR Associates, Inc.
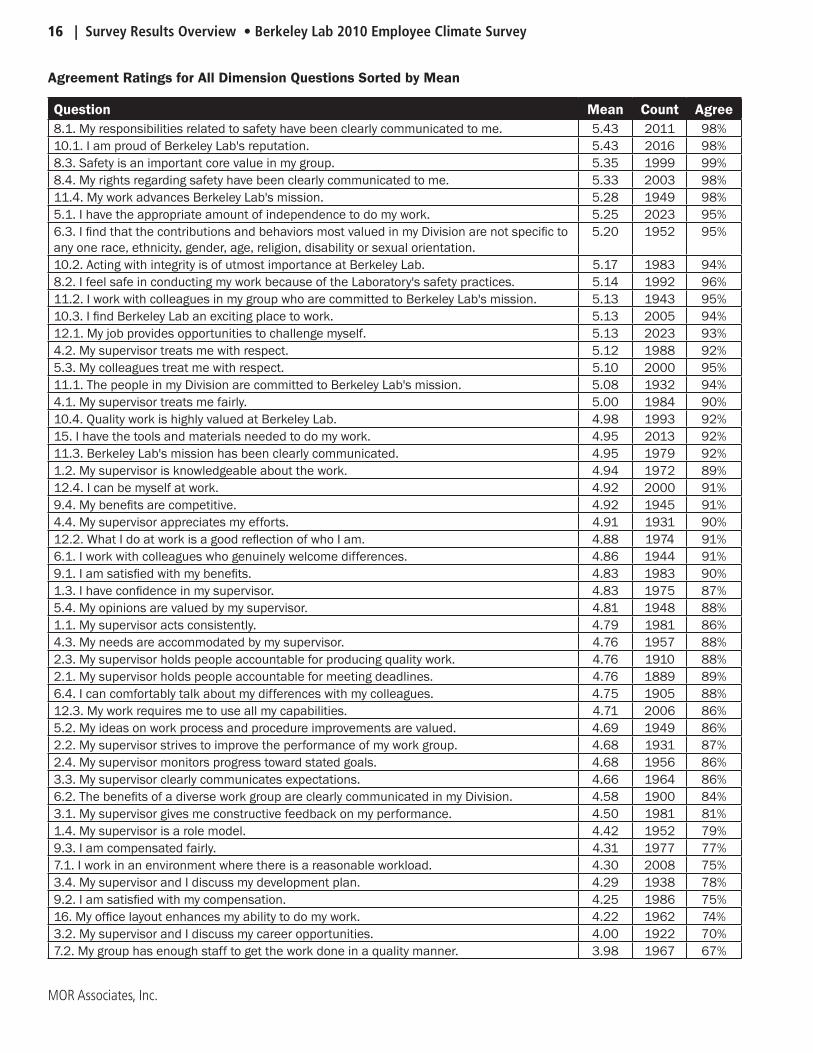
Agreement Ratings for All Dimension Questions Sorted by Mean
Question Mean Count Agree8.1. My responsibilities related to safety have been clearly communicated to me. 5.43 2011 98%10.1. I am proud of Berkeley Lab's reputation. 5.43 2016 98%8.3. Safety is an important core value in my group. 5.35 1999 99%8.4. My rights regarding safety have been clearly communicated to me. 5.33 2003 98%11.4. My work advances Berkeley Lab's mission. 5.28 1949 98%5.1. I have the appropriate amount of independence to do my work. 5.25 2023 95%6.3. I find that the contributions and behaviors most valued in my Division are not specific to any one race, ethnicity, gender, age, religion, disability or sexual orientation.
5.20 1952 95%
10.2. Acting with integrity is of utmost importance at Berkeley Lab. 5.17 1983 94%8.2. I feel safe in conducting my work because of the Laboratory's safety practices. 5.14 1992 96%11.2. I work with colleagues in my group who are committed to Berkeley Lab's mission. 5.13 1943 95%10.3. I find Berkeley Lab an exciting place to work. 5.13 2005 94%12.1. My job provides opportunities to challenge myself. 5.13 2023 93%4.2. My supervisor treats me with respect. 5.12 1988 92%5.3. My colleagues treat me with respect. 5.10 2000 95%11.1. The people in my Division are committed to Berkeley Lab's mission. 5.08 1932 94%4.1. My supervisor treats me fairly. 5.00 1984 90%10.4. Quality work is highly valued at Berkeley Lab. 4.98 1993 92%15. I have the tools and materials needed to do my work. 4.95 2013 92%11.3. Berkeley Lab's mission has been clearly communicated. 4.95 1979 92%1.2. My supervisor is knowledgeable about the work. 4.94 1972 89%12.4. I can be myself at work. 4.92 2000 91%9.4. My benefits are competitive. 4.92 1945 91%4.4. My supervisor appreciates my efforts. 4.91 1931 90%12.2. What I do at work is a good reflection of who I am. 4.88 1974 91%6.1. I work with colleagues who genuinely welcome differences. 4.86 1944 91%9.1. I am satisfied with my benefits. 4.83 1983 90%1.3. I have confidence in my supervisor. 4.83 1975 87%5.4. My opinions are valued by my supervisor. 4.81 1948 88%1.1. My supervisor acts consistently. 4.79 1981 86%4.3. My needs are accommodated by my supervisor. 4.76 1957 88%2.3. My supervisor holds people accountable for producing quality work. 4.76 1910 88%2.1. My supervisor holds people accountable for meeting deadlines. 4.76 1889 89%6.4. I can comfortably talk about my differences with my colleagues. 4.75 1905 88%12.3. My work requires me to use all my capabilities. 4.71 2006 86%5.2. My ideas on work process and procedure improvements are valued. 4.69 1949 86%2.2. My supervisor strives to improve the performance of my work group. 4.68 1931 87%2.4. My supervisor monitors progress toward stated goals. 4.68 1956 86%3.3. My supervisor clearly communicates expectations. 4.66 1964 86%6.2. The benefits of a diverse work group are clearly communicated in my Division. 4.58 1900 84%3.1. My supervisor gives me constructive feedback on my performance. 4.50 1981 81%1.4. My supervisor is a role model. 4.42 1952 79%9.3. I am compensated fairly. 4.31 1977 77%7.1. I work in an environment where there is a reasonable workload. 4.30 2008 75%3.4. My supervisor and I discuss my development plan. 4.29 1938 78%9.2. I am satisfied with my compensation. 4.25 1986 75%16. My office layout enhances my ability to do my work. 4.22 1962 74%3.2. My supervisor and I discuss my career opportunities. 4.00 1922 70%7.2. My group has enough staff to get the work done in a quality manner. 3.98 1967 67%
Berkeley Lab 2010 Employee Survey • Survey Results Overview | 17
MOR Associates, Inc.
Mean N
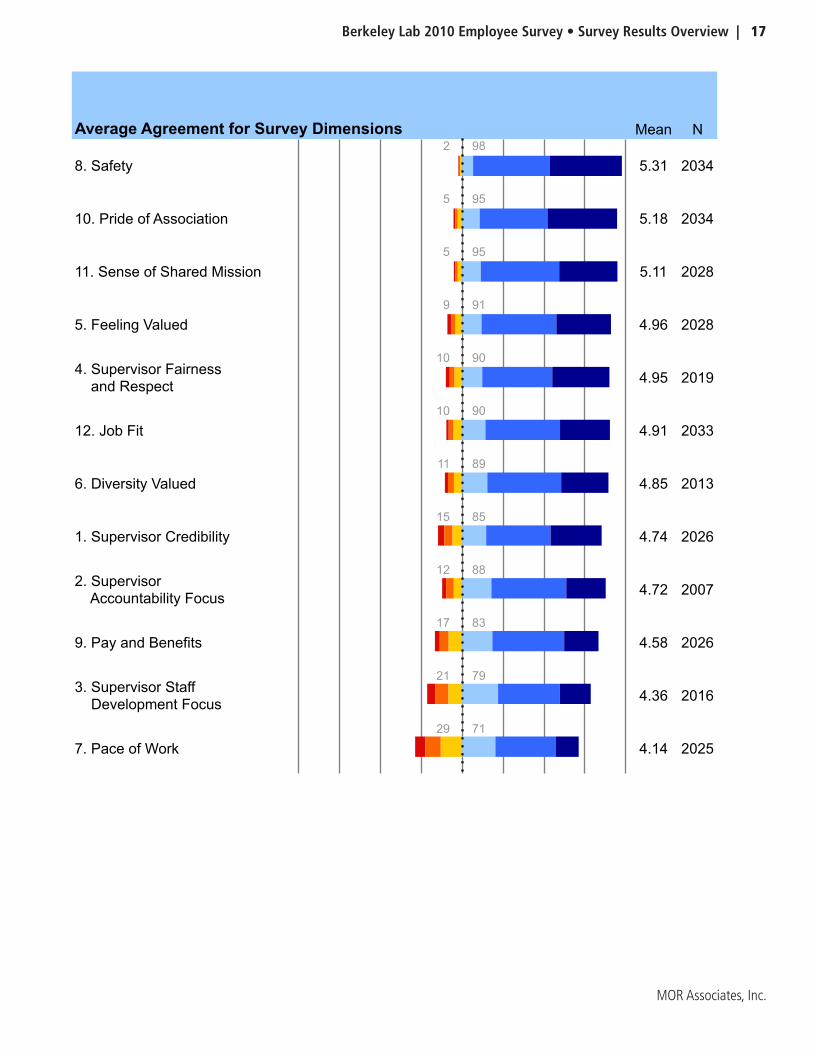
8. Safety
2 98
5.31 2034
10. Pride of Association
5 95
5.18 2034
11. Sense of Shared Mission
5 95
5.11 2028
5. Feeling Valued
9 91
4.96 2028
4. Supervisor Fairness
and Respect
10 90
4.95 2019
12. Job Fit
10 90
4.91 2033
6. Diversity Valued
11 89
4.85 2013
1. Supervisor Credibility
15 85
4.74 2026
2. Supervisor
Accountability Focus
12 88
4.72 2007
9. Pay and Benefits
17 83
4.58 2026
3. Supervisor Staff
Development Focus
21 79
4.36 2016
7. Pace of Work
29 71
4.14 2025
Average Agreement for Survey Dimensions
18 | Survey Results Overview • Berkeley Lab 2010 Employee Climate Survey
MOR Associates, Inc.
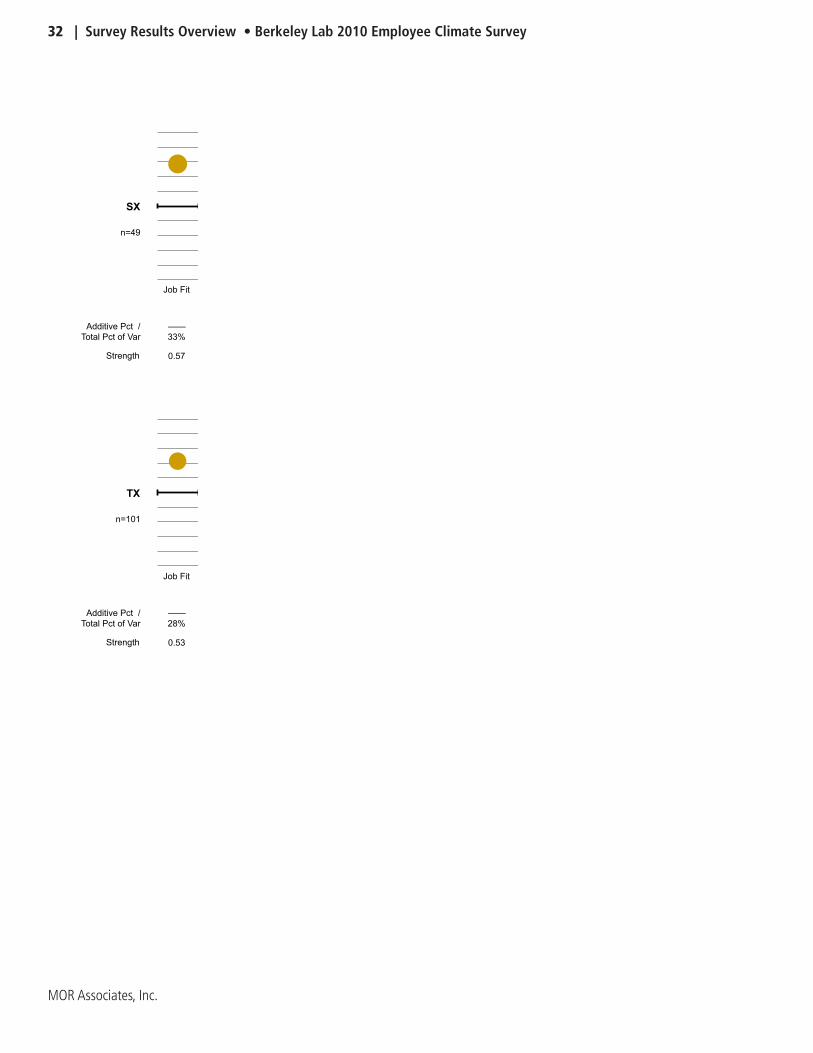
What Dimensions Are Most Predictive of Behavioral Engagement (Discretionary Effort) for Different Groups at the Lab?
As noted earlier, we performed stepwise regression analyses that sought to answer the question: which combinations of the twelve dimensions can usefully predict behavioral engagement and to what degree? The results of this analysis for various groups are presented in depth in the following pages. In many cases, the results will be intuitively correct. In other cases, the results may suggest areas for further investigation. At the most basic level, the appearance of a dimension suggests that the dimension is having a measureable effect.
Berkeley Lab 2010 Employee Survey • Survey Results Overview | 19
MOR Associates, Inc.
Job Fit
Additive Pct /
Total Pct of Var
——
33%
Strength 0.57
Job Fit
Additive Pct /
Total Pct of Var
——
28%
Strength 0.53
Job Fit Sense of
Shared
Mission
Safety Pride of
Assoc
Pay and
Benefits
Additive Pct /
Total Pct of Var
——
19%
2.7% /
22%
0.9% /
23%
0.5% /
23%
0.3% /
23%
Strength 0.29 0.10 0.11 0.11 -0.06
All
n=101
n=2070
n=49
SX
TX
Safety Super
Stff Dev
Focus
Additive Pct /
Total Pct of Var
——
32%
7.3% /
39%
Strength 0.32 0.39
Job Fit
Additive Pct /
Total Pct of Var
——
22%
Strength 0.47
Job Fit Sense of
Shared
Mission
Safety Pride of
Assoc
Pay and
Benefits
Diversity
Valued
Super
Stff Dev
Focus
Pace of
Work
Feeling
Valued
Super
Fairness
& Respct
Super
Accntblty
Focus
Super
Cred
Additive Pct /
Total Pct of Var
——
22%
Strength 0.47
PH
n=42
PB
n=74
PH
n=42
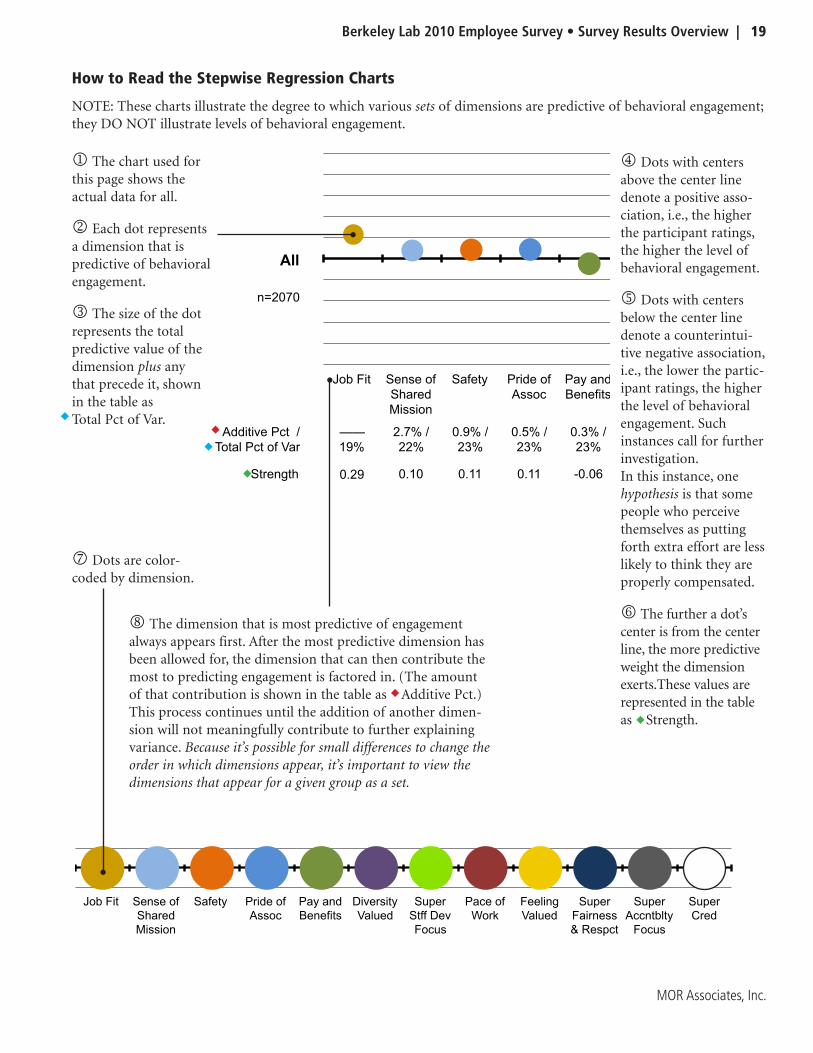
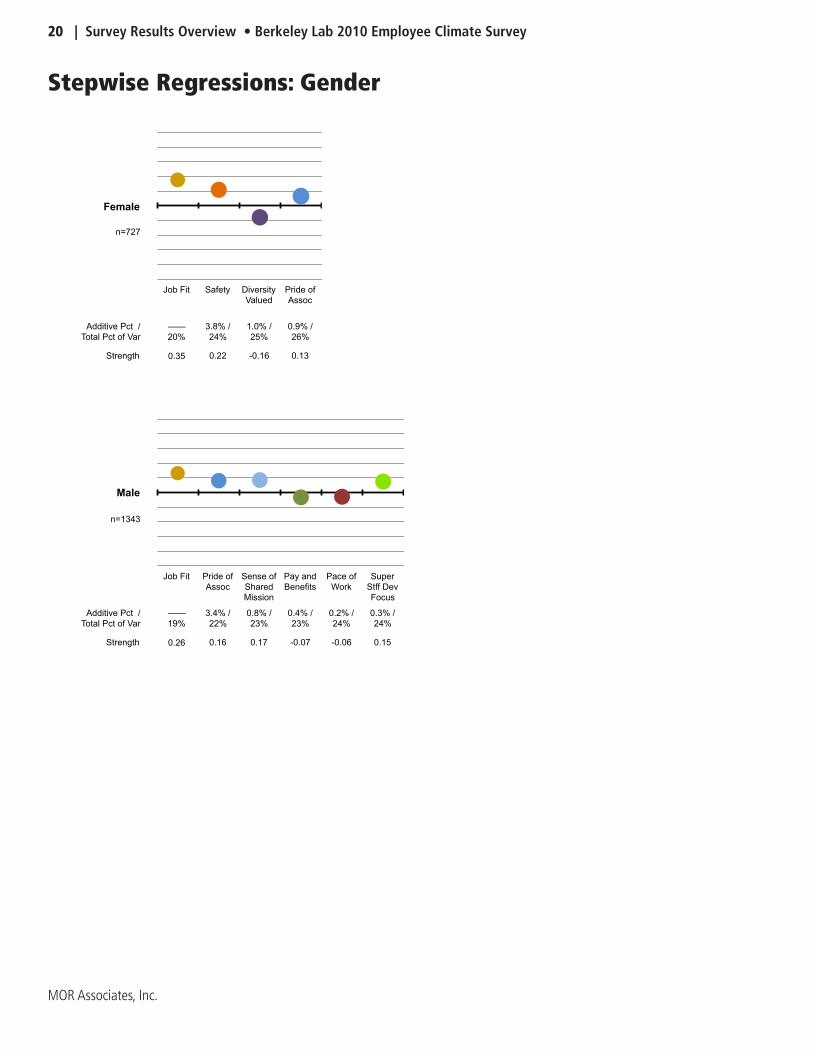
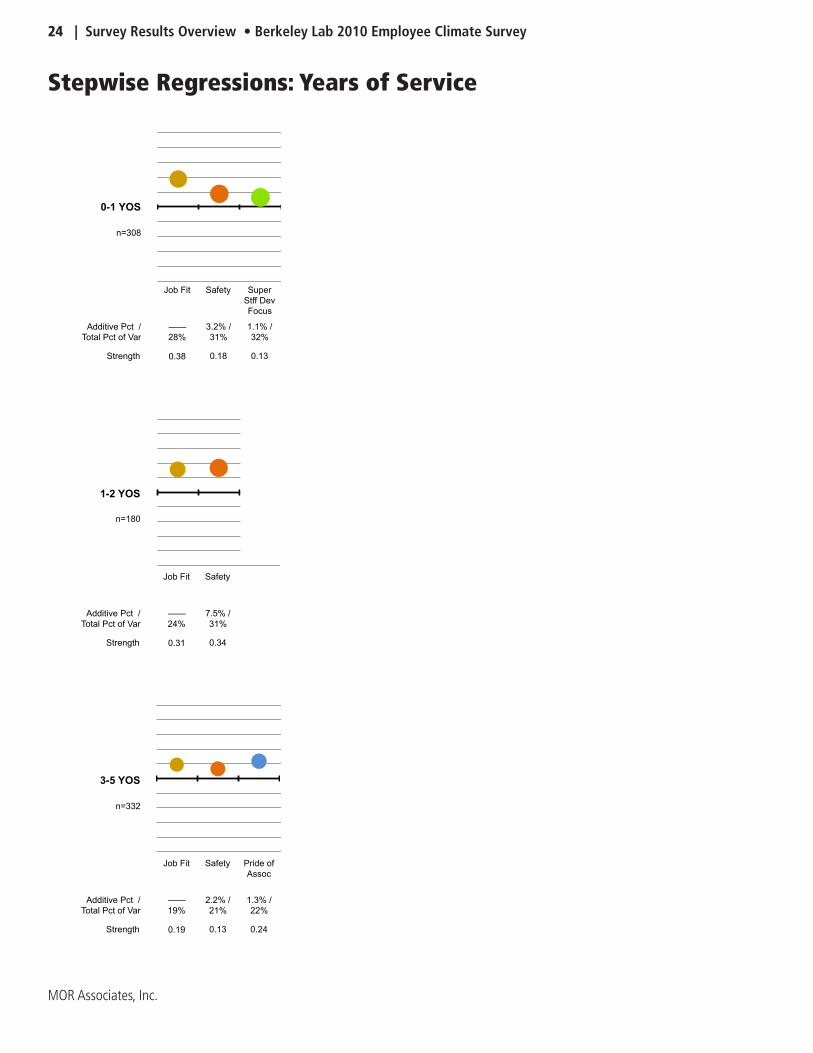
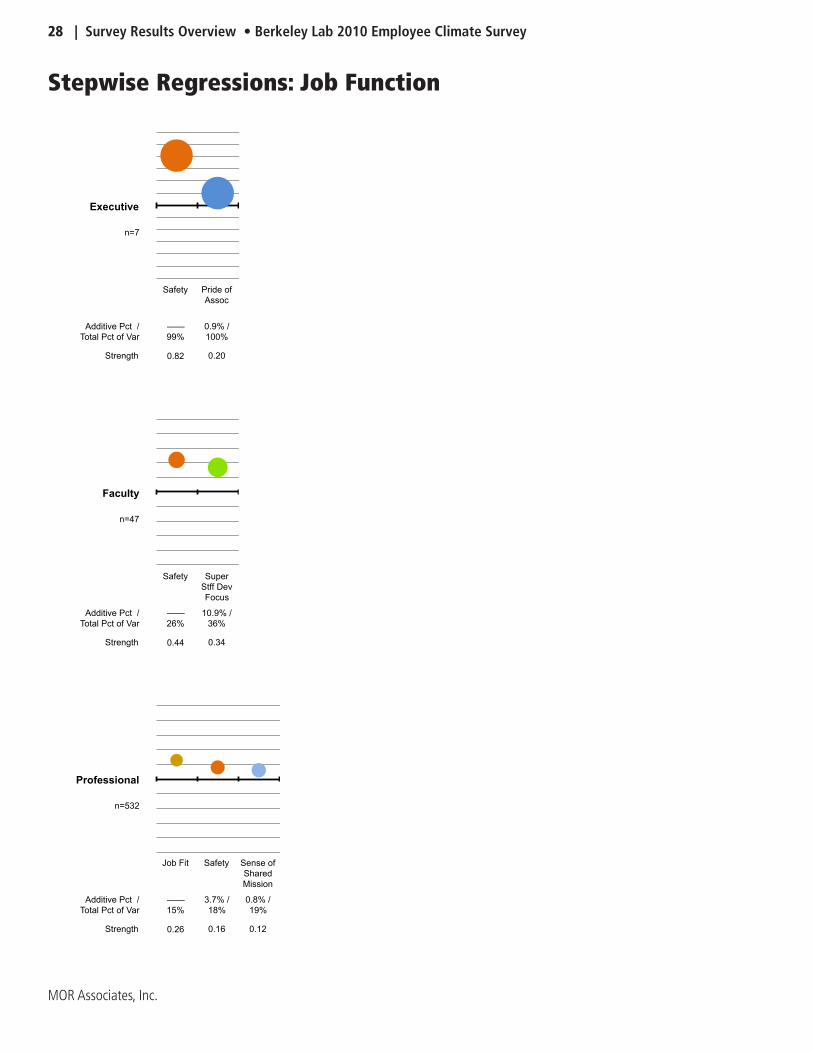
How to Read the Stepwise Regression Charts
NOTE: These charts illustrate the degree to which various sets of dimensions are predictive of behavioral engagement; they DO NOT illustrate levels of behavioral engagement.
j The chart used for this page shows the actual data for all.
k Each dot represents a dimension that is predictive of behavioral engagement.
l The size of the dot represents the total predictive value of the dimension plus any that precede it, shown in the table as Total Pct of Var.
p Dots are color-coded by dimension.
m Dots with centers above the center line denote a positive asso-ciation, i.e., the higher the participant ratings, the higher the level of behavioral engagement.
n Dots with centers below the center line denote a counterintui-tive negative association, i.e., the lower the partic-ipant ratings, the higher the level of behavioral engagement. Such instances call for further investigation. In this instance, one hypothesis is that some people who perceive themselves as putting forth extra effort are less likely to think they are properly compensated.
o The further a dot’s center is from the center line, the more predictive weight the dimension exerts.These values are represented in the table as Strength.
q The dimension that is most predictive of engagement always appears first. After the most predictive dimension has been allowed for, the dimension that can then contribute the most to predicting engagement is factored in. (The amount of that contribution is shown in the table as Additive Pct.)This process continues until the addition of another dimen-sion will not meaningfully contribute to further explaining variance. Because it’s possible for small differences to change the order in which dimensions appear, it’s important to view the dimensions that appear for a given group as a set.
20 | Survey Results Overview • Berkeley Lab 2010 Employee Climate Survey
MOR Associates, Inc.
Job Fit Safety Diversity
Valued
Pride of
Assoc
Additive Pct /
Total Pct of Var
——
20%
3.8% /
24%
1.0% /
25%
0.9% /
26%
Strength 0.35 0.22 -0.16 0.13
Job Fit Pride of
Assoc
Sense of
Shared
Mission
Pay and
Benefits
Pace of
Work
Super
Stff Dev
Focus
Additive Pct /
Total Pct of Var
——
19%
3.4% /
22%
0.8% /
23%
0.4% /
23%
0.2% /
24%
0.3% /
24%
Strength 0.26 0.16 0.17 -0.07 -0.06 0.15
Job Fit Safety Pride of
Assoc
Additive Pct /
Total Pct of Var
——
19%
2.3% /
21%
0.9% /
22%
Strength 0.31 0.12 0.13
Female
Male
White
n=727
n=1343
n=1284
Stepwise Regressions: Gender
Berkeley Lab 2010 Employee Survey • Survey Results Overview | 21
MOR Associates, Inc.
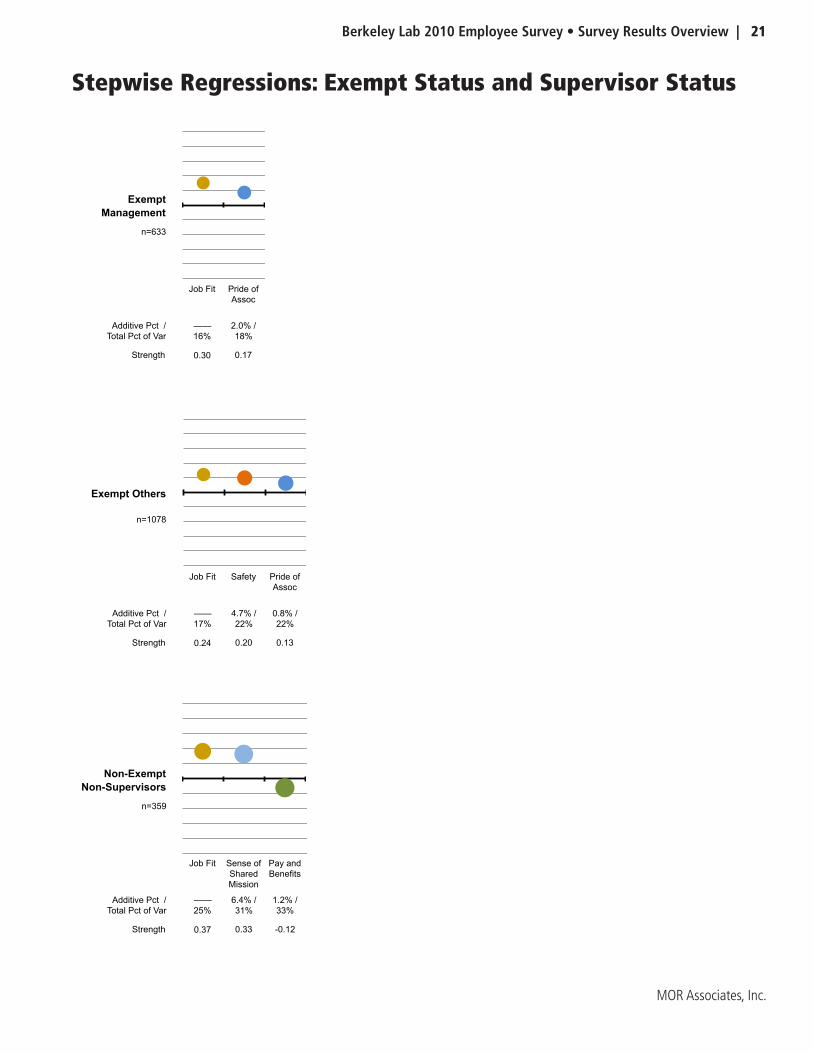
Job Fit Safety Super
Stff Dev
Focus
Pride of
Assoc
Super
Accntblty
Focus
Super
Fairness
& Respct
Feeling
Valued
Additive Pct /
Total Pct of Var
——
24%
4.0% /
28%
0.9% /
29%
2.1% /
31%
1.1% /
32%
1.2% /
34%
0.8% /
34%
Strength 0.33 0.12 0.40 0.19 -0.21 -0.43 0.19
Job Fit Safety Pride of
Assoc
Pace of
Work
Additive Pct /
Total Pct of Var
——
16%
2.7% /
18%
0.9% /
19%
0.7% /
20%
Strength 0.27 0.15 0.13 -0.09
Job Fit Pride of
Assoc
Additive Pct /
Total Pct of Var
——
16%
2.0% /
18%
Strength 0.30 0.17
Exempt
Management
11-15 YOS
16+ YOS
n=342
n=467
n=633
Job Fit Safety Pride of
Assoc
Additive Pct /
Total Pct of Var
——
17%
4.7% /
22%
0.8% /
22%
Strength 0.24 0.20 0.13
Job Fit Sense of
Shared
Mission
Pay and
Benefits
Additive Pct /
Total Pct of Var
——
25%
6.4% /
31%
1.2% /
33%
Strength 0.37 0.33 -0.12
Job Fit Sense of
Shared
Mission
Safety
Additive Pct /
Total Pct of Var
——
29%
4.2% /
33%
1.0% /
34%
Strength 0.36 0.18 0.14
Non-Exempt
Non-Supervisors
0-35 Yrs. Old
Exempt Others
n=1078
n=359
n=350
Stepwise Regressions: Exempt Status and Supervisor Status
22 | Survey Results Overview • Berkeley Lab 2010 Employee Climate Survey
MOR Associates, Inc.
Job Fit Safety Diversity
Valued
Pride of
Assoc
Additive Pct /
Total Pct of Var
——
20%
3.8% /
24%
1.0% /
25%
0.9% /
26%
Strength 0.35 0.22 -0.16 0.13
Job Fit Pride of
Assoc
Sense of
Shared
Mission
Pay and
Benefits
Pace of
Work
Super
Stff Dev
Focus
Additive Pct /
Total Pct of Var
——
19%
3.4% /
22%
0.8% /
23%
0.4% /
23%
0.2% /
24%
0.3% /
24%
Strength 0.26 0.16 0.17 -0.07 -0.06 0.15
Job Fit Safety Pride of
Assoc
Additive Pct /
Total Pct of Var
——
19%
2.3% /
21%
0.9% /
22%
Strength 0.31 0.12 0.13
Female
Male
White
n=727
n=1343
n=1284
Job Fit Safety Diversity
Valued
Pride of
Assoc
Feeling
Valued
Super
Stff Dev
Focus
Additive Pct /
Total Pct of Var
——
26%
6.2% /
32%
1.3% /
34%
1.7% /
35%
0.7% /
36%
0.8% /
37%
Strength 0.41 0.25 -0.14 0.21 -0.20 0.13
Asian
n=387
Stepwise Regressions: Race
Berkeley Lab 2010 Employee Survey • Survey Results Overview | 23
MOR Associates, Inc.
Feeling
Valued
Additive Pct /
Total Pct of Var
——
9%
Strength 0.29
Job Fit Safety
Additive Pct /
Total Pct of Var
——
14%
5.0% /
19%
Strength 0.26 0.25
Job Fit Safety Super
Stff Dev
Focus
Additive Pct /
Total Pct of Var
——
28%
3.2% /
31%
1.1% /
32%
Strength 0.38 0.18 0.13
Hispanic/Latino
0-1 YOS
Black/ African
American
n=97
n=124
n=308
24 | Survey Results Overview • Berkeley Lab 2010 Employee Climate Survey
MOR Associates, Inc.
Feeling
Valued
Additive Pct /
Total Pct of Var
——
9%
Strength 0.29
Job Fit Safety
Additive Pct /
Total Pct of Var
——
14%
5.0% /
19%
Strength 0.26 0.25
Job Fit Safety Super
Stff Dev
Focus
Additive Pct /
Total Pct of Var
——
28%
3.2% /
31%
1.1% /
32%
Strength 0.38 0.18 0.13
Hispanic/Latino
0-1 YOS
Black/ African
American
n=97
n=124
n=308
Job Fit Safety
Additive Pct /
Total Pct of Var
——
24%
7.5% /
31%
Strength 0.31 0.34
Job Fit Safety Pride of
Assoc
Additive Pct /
Total Pct of Var
——
19%
2.2% /
21%
1.3% /
22%
Strength 0.19 0.13 0.24
Job Fit Super
Stff Dev
Focus
Sense of
Shared
Mission
Pay and
Benefits
Super
Accntblty
Focus
Additive Pct /
Total Pct of Var
——
16%
2.9% /
19%
1.1% /
20%
0.9% /
21%
0.8% /
22%
Strength 0.28 0.24 0.22 -0.12 -0.17
1-2 YOS
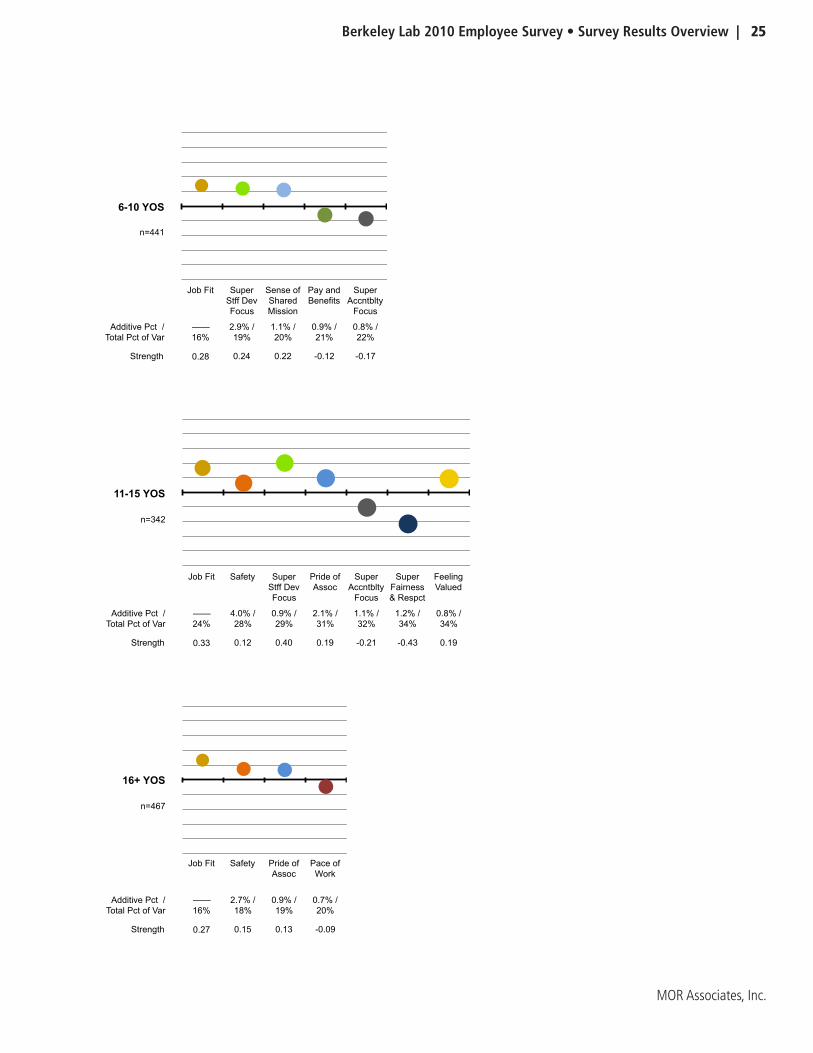
6-10 YOS
3-5 YOS
n=180
n=332
n=441
Stepwise Regressions: Years of Service
Berkeley Lab 2010 Employee Survey • Survey Results Overview | 25
MOR Associates, Inc.
Job Fit Safety
Additive Pct /
Total Pct of Var
——
24%
7.5% /
31%
Strength 0.31 0.34
Job Fit Safety Pride of
Assoc
Additive Pct /
Total Pct of Var
——
19%
2.2% /
21%
1.3% /
22%
Strength 0.19 0.13 0.24
Job Fit Super
Stff Dev
Focus
Sense of
Shared
Mission
Pay and
Benefits
Super
Accntblty
Focus
Additive Pct /
Total Pct of Var
——
16%
2.9% /
19%
1.1% /
20%
0.9% /
21%
0.8% /
22%
Strength 0.28 0.24 0.22 -0.12 -0.17
1-2 YOS
6-10 YOS
3-5 YOS
n=180
n=332
n=441
Job Fit Safety Super
Stff Dev
Focus
Pride of
Assoc
Super
Accntblty
Focus
Super
Fairness
& Respct
Feeling
Valued
Additive Pct /
Total Pct of Var
——
24%
4.0% /
28%
0.9% /
29%
2.1% /
31%
1.1% /
32%
1.2% /
34%
0.8% /
34%
Strength 0.33 0.12 0.40 0.19 -0.21 -0.43 0.19
Job Fit Safety Pride of
Assoc
Pace of
Work
Additive Pct /
Total Pct of Var
——
16%
2.7% /
18%
0.9% /
19%
0.7% /
20%
Strength 0.27 0.15 0.13 -0.09
Job Fit Pride of
Assoc
Additive Pct /
Total Pct of Var
——
16%
2.0% /
18%
Strength 0.30 0.17
Exempt
Management
11-15 YOS
16+ YOS
n=342
n=467
n=633
26 | Survey Results Overview • Berkeley Lab 2010 Employee Climate Survey
MOR Associates, Inc.
Job Fit Safety Pride of
Assoc
Additive Pct /
Total Pct of Var
——
17%
4.7% /
22%
0.8% /
22%
Strength 0.24 0.20 0.13
Job Fit Sense of
Shared
Mission
Pay and
Benefits
Additive Pct /
Total Pct of Var
——
25%
6.4% /
31%
1.2% /
33%
Strength 0.37 0.33 -0.12
Job Fit Sense of
Shared
Mission
Safety
Additive Pct /
Total Pct of Var
——
29%
4.2% /
33%
1.0% /
34%
Strength 0.36 0.18 0.14
Non-Exempt
Non-Supervisors
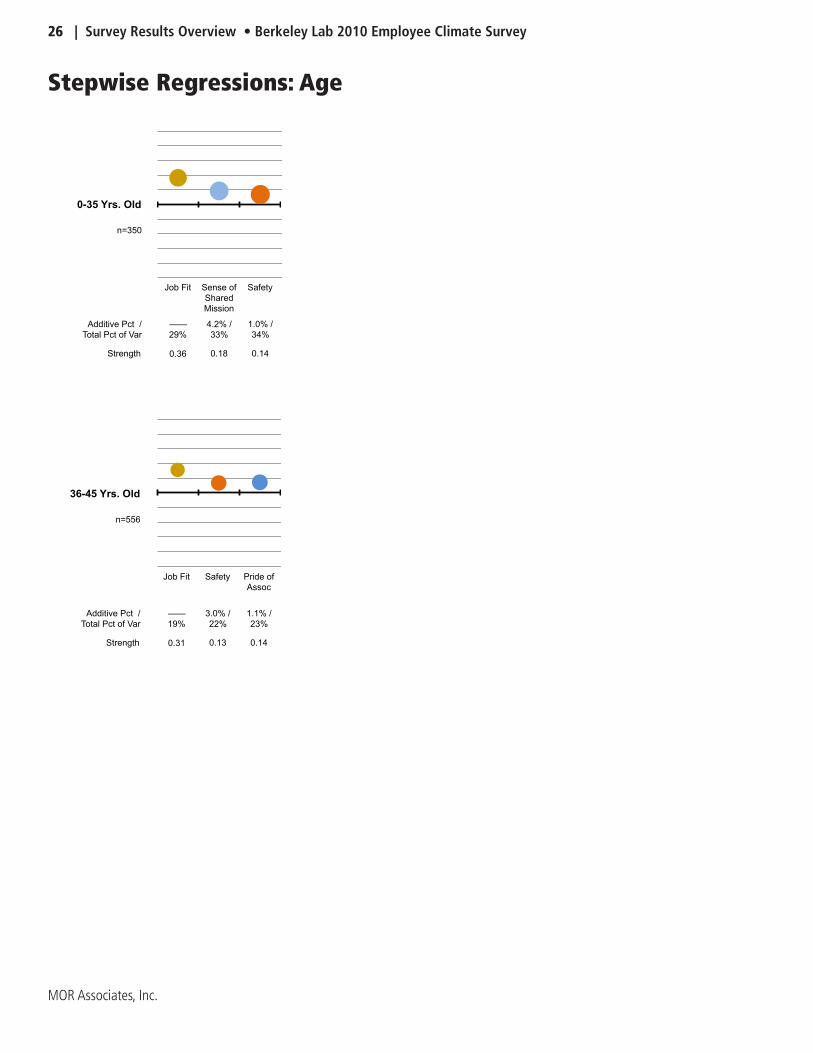
0-35 Yrs. Old
Exempt Others
n=1078
n=359
n=350
Job Fit Safety Pride of
Assoc
Additive Pct /
Total Pct of Var
——
19%
3.0% /
22%
1.1% /
23%
Strength 0.31 0.13 0.14
Job Fit Safety Pride of
Assoc
Super
Fairness
& Respct
Additive Pct /
Total Pct of Var
——
15%
3.2% /
18%
0.6% /
19%
0.6% /
19%
Strength 0.28 0.11 0.19 -0.10
Job Fit Pride of
Assoc
Additive Pct /
Total Pct of Var
——
19%
1.8% /
20%
Strength 0.34 0.16
36-45 Yrs. Old
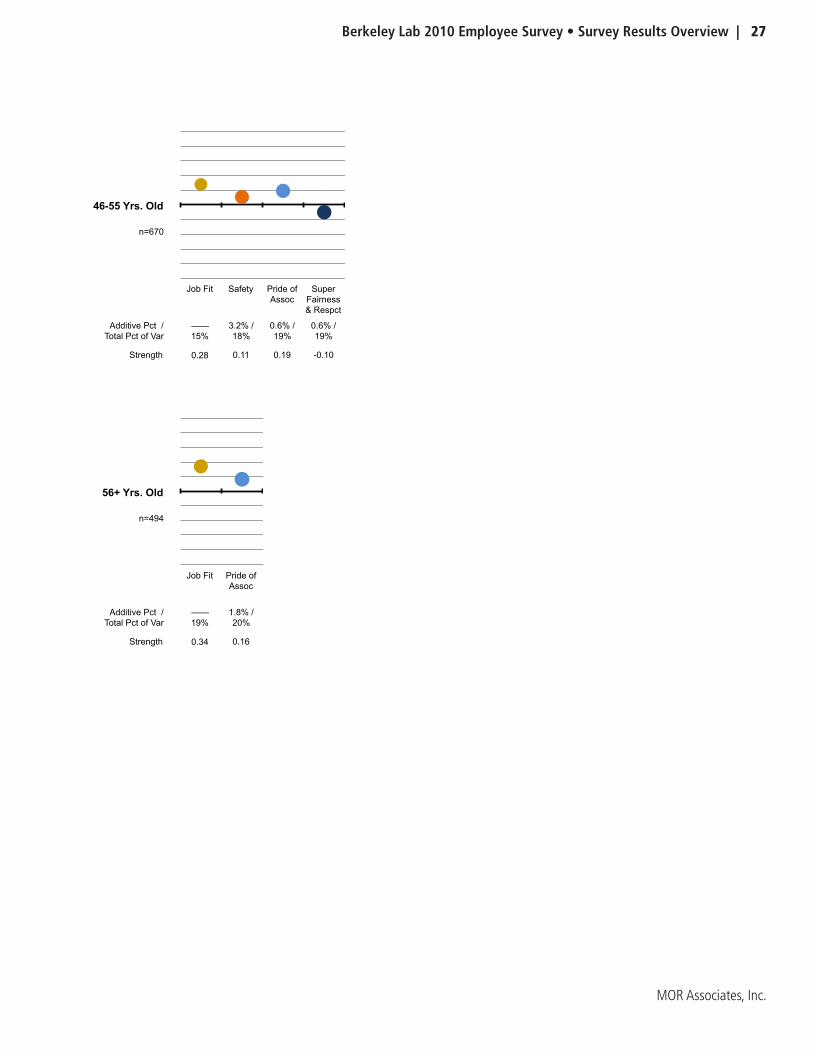
46-55 Yrs. Old
56+ Yrs. Old
n=670
n=494
n=556
Stepwise Regressions: Age
Berkeley Lab 2010 Employee Survey • Survey Results Overview | 27
MOR Associates, Inc.
Job Fit Safety Pride of
Assoc
Additive Pct /
Total Pct of Var
——
19%
3.0% /
22%
1.1% /
23%
Strength 0.31 0.13 0.14
Job Fit Safety Pride of
Assoc
Super
Fairness
& Respct
Additive Pct /
Total Pct of Var
——
15%
3.2% /
18%
0.6% /
19%
0.6% /
19%
Strength 0.28 0.11 0.19 -0.10
Job Fit Pride of
Assoc
Additive Pct /
Total Pct of Var
——
19%
1.8% /
20%
Strength 0.34 0.16
36-45 Yrs. Old
46-55 Yrs. Old
56+ Yrs. Old
n=670
n=494
n=556
28 | Survey Results Overview • Berkeley Lab 2010 Employee Climate Survey
MOR Associates, Inc.
Safety Pride of
Assoc
Additive Pct /
Total Pct of Var
——
99%
0.9% /
100%
Strength 0.82 0.20
Safety Super
Stff Dev
Focus
Additive Pct /
Total Pct of Var
——
26%
10.9% /
36%
Strength 0.44 0.34
Job Fit Safety Sense of
Shared
Mission
Additive Pct /
Total Pct of Var
——
15%
3.7% /
18%
0.8% /
19%
Strength 0.26 0.16 0.12
Professional
n=7
n=47
n=532
Executive
Faculty
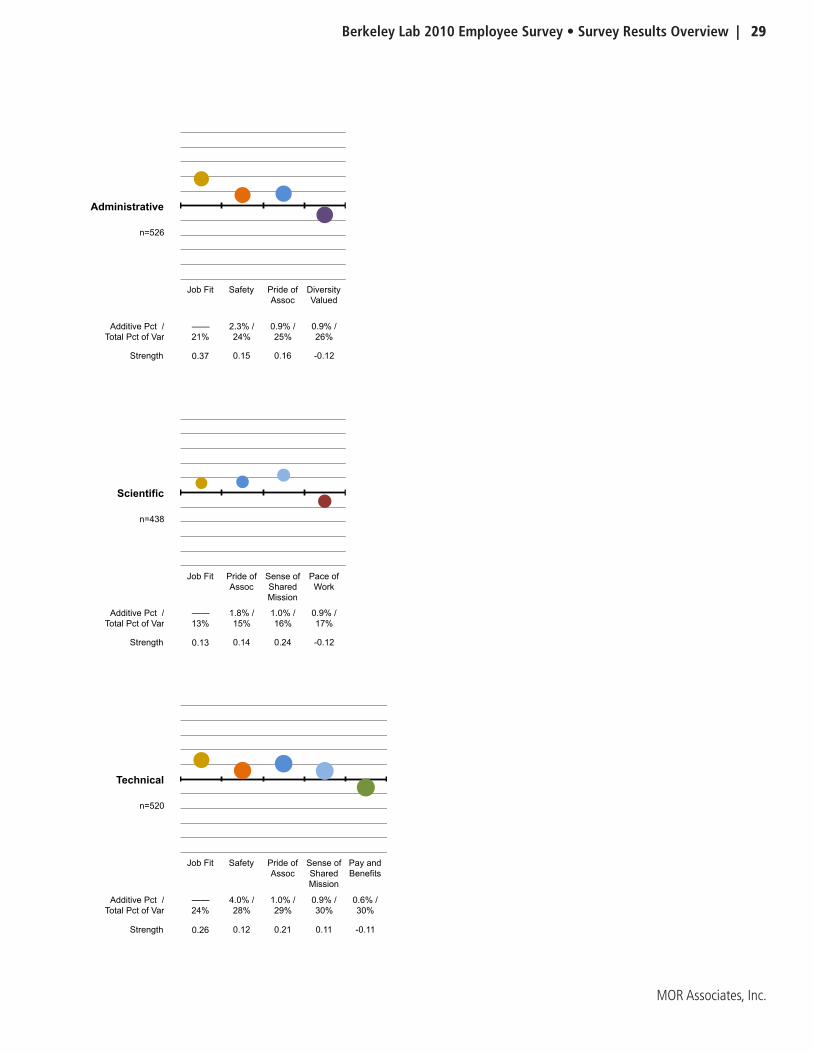
Stepwise Regressions: Job Function
Berkeley Lab 2010 Employee Survey • Survey Results Overview | 29
MOR Associates, Inc.
Job Fit Safety Pride of
Assoc
Diversity
Valued
Additive Pct /
Total Pct of Var
——
21%
2.3% /
24%
0.9% /
25%
0.9% /
26%
Strength 0.37 0.15 0.16 -0.12
Job Fit Pride of
Assoc
Sense of
Shared
Mission
Pace of
Work
Additive Pct /
Total Pct of Var
——
13%
1.8% /
15%
1.0% /
16%
0.9% /
17%
Strength 0.13 0.14 0.24 -0.12
Job Fit Safety Pride of
Assoc
Sense of
Shared
Mission
Pay and
Benefits
Additive Pct /
Total Pct of Var
——
24%
4.0% /
28%
1.0% /
29%
0.9% /
30%
0.6% /
30%
Strength 0.26 0.12 0.21 0.11 -0.11
Technical
n=526
n=438
n=520
Scientific
Administrative
30 | Survey Results Overview • Berkeley Lab 2010 Employee Climate Survey
MOR Associates, Inc.
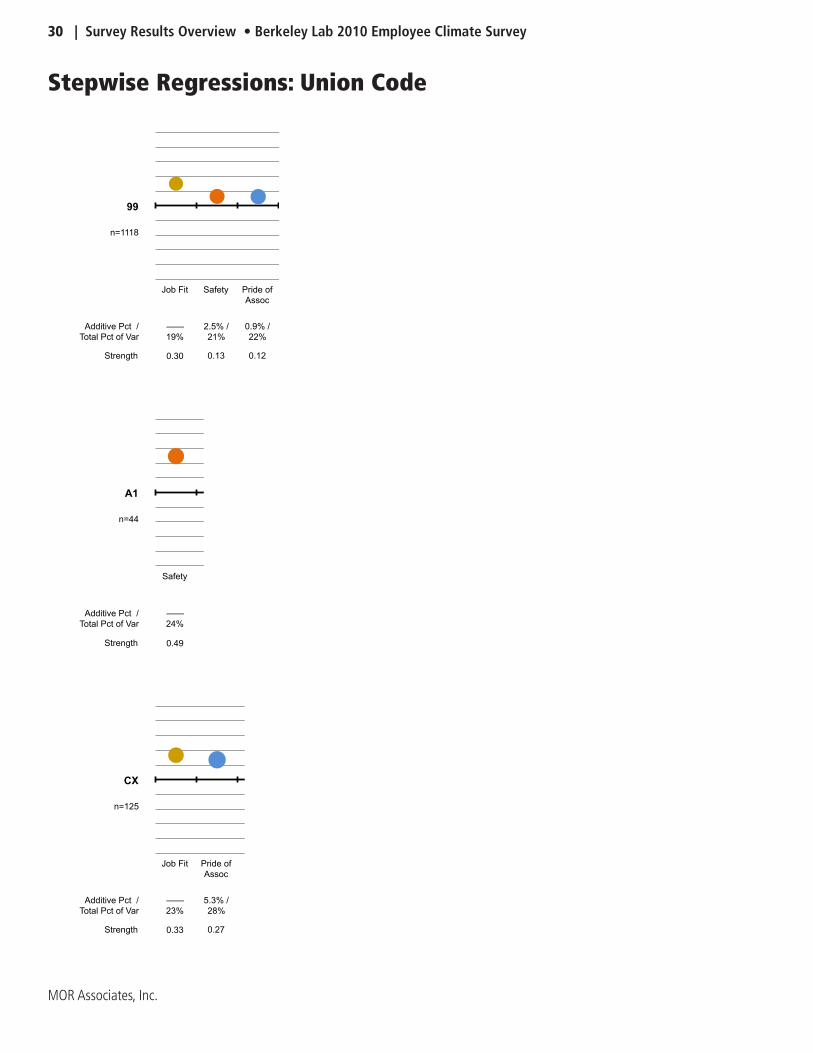
Job Fit Safety Pride of
Assoc
Additive Pct /
Total Pct of Var
——
19%
2.5% /
21%
0.9% /
22%
Strength 0.30 0.13 0.12
Safety
Additive Pct /
Total Pct of Var
——
24%
Strength 0.49
Job Fit Pride of
Assoc
Additive Pct /
Total Pct of Var
——
23%
5.3% /
28%
Strength 0.33 0.27
n=44
99
A1
n=1118
CX
n=125
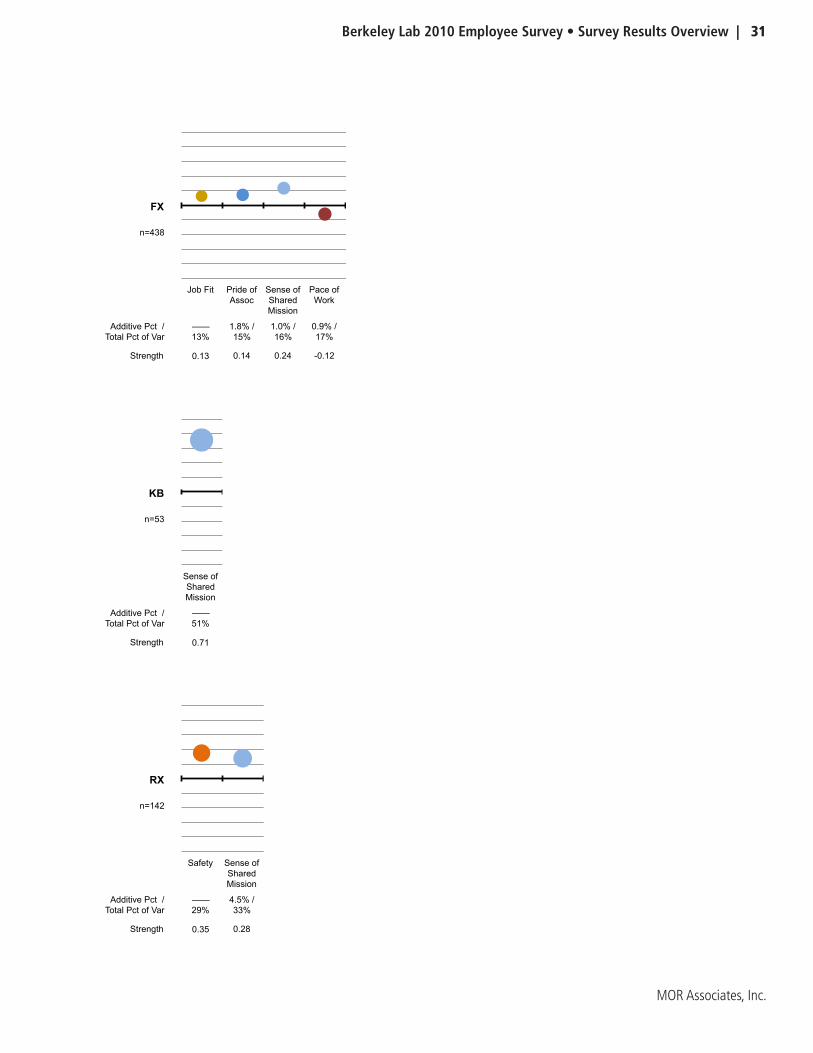
Stepwise Regressions: Union Code
Berkeley Lab 2010 Employee Survey • Survey Results Overview | 31
MOR Associates, Inc.
Job Fit Pride of
Assoc
Sense of
Shared
Mission
Pace of
Work
Additive Pct /
Total Pct of Var
——
13%
1.8% /
15%
1.0% /
16%
0.9% /
17%
Strength 0.13 0.14 0.24 -0.12
Sense of
Shared
Mission
Additive Pct /
Total Pct of Var
——
51%
Strength 0.71
Safety Sense of
Shared
Mission
Additive Pct /
Total Pct of Var
——
29%
4.5% /
33%
Strength 0.35 0.28
n=438
n=53
n=142
FX
KB
RX
32 | Survey Results Overview • Berkeley Lab 2010 Employee Climate Survey
MOR Associates, Inc.
Job Fit
Additive Pct /
Total Pct of Var
——
33%
Strength 0.57
Job Fit
Additive Pct /
Total Pct of Var
——
28%
Strength 0.53
Job Fit Sense of
Shared
Mission
Safety Pride of
Assoc
Pay and
Benefits
Additive Pct /
Total Pct of Var
——
19%
2.7% /
22%
0.9% /
23%
0.5% /
23%
0.3% /
23%
Strength 0.29 0.10 0.11 0.11 -0.06
All
n=101
n=2070
n=49
SX
TX
Berkeley Lab 2010 Employee Survey • Survey Results Overview | 33
MOR Associates, Inc.
This page is intentionally left blank.
34 | Survey Results Overview • Berkeley Lab 2010 Employee Climate Survey
MOR Associates, Inc.
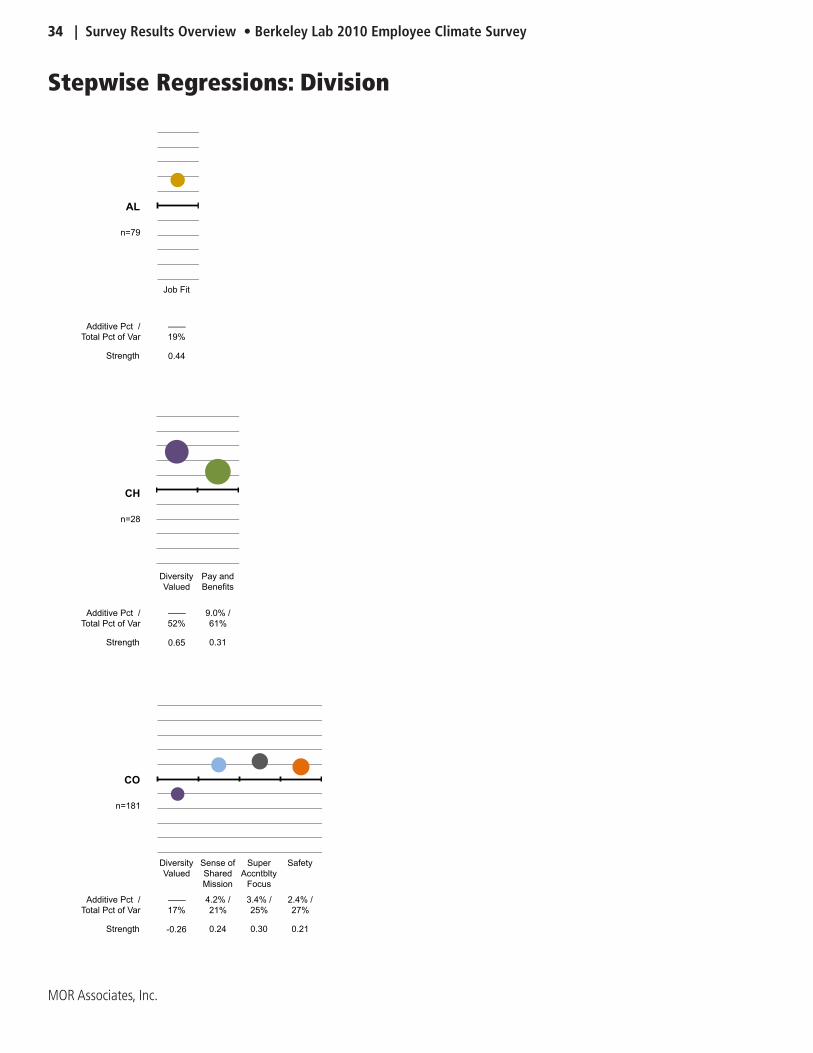
Job Fit
Additive Pct /
Total Pct of Var
——
19%
Strength 0.44
Diversity
Valued
Pay and
Benefits
Additive Pct /
Total Pct of Var
——
52%
9.0% /
61%
Strength 0.65 0.31
Diversity
Valued
Sense of
Shared
Mission
Super
Accntblty
Focus
Safety
Additive Pct /
Total Pct of Var
——
17%
4.2% /
21%
3.4% /
25%
2.4% /
27%
Strength -0.26 0.24 0.30 0.21
n=181
AL
n=79
CH
n=28
CO
Stepwise Regressions: Division
Berkeley Lab 2010 Employee Survey • Survey Results Overview | 35
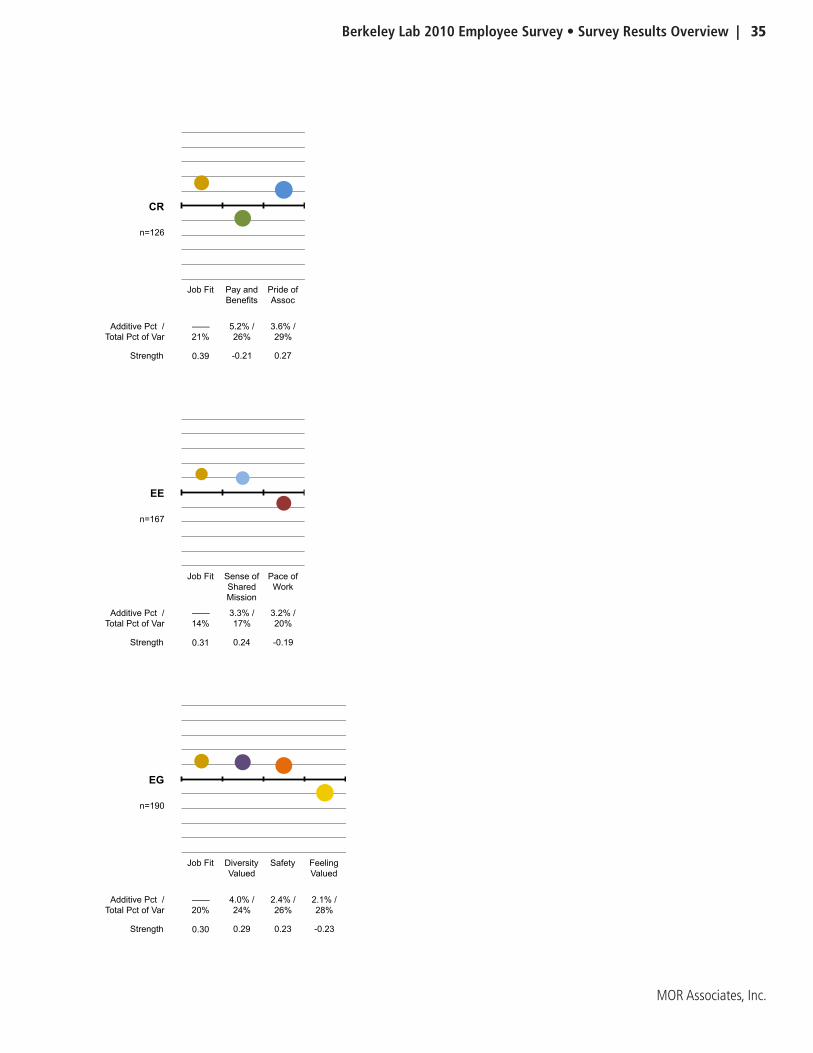
MOR Associates, Inc.
Job Fit Pay and
Benefits
Pride of
Assoc
Additive Pct /
Total Pct of Var
——
21%
5.2% /
26%
3.6% /
29%
Strength 0.39 -0.21 0.27
Job Fit Sense of
Shared
Mission
Pace of
Work
Additive Pct /
Total Pct of Var
——
14%
3.3% /
17%
3.2% /
20%
Strength 0.31 0.24 -0.19
Job Fit Diversity
Valued
Safety Feeling
Valued
Additive Pct /
Total Pct of Var
——
20%
4.0% /
24%
2.4% /
26%
2.1% /
28%
Strength 0.30 0.29 0.23 -0.23
CR
n=126
EE
n=167
EG
n=190
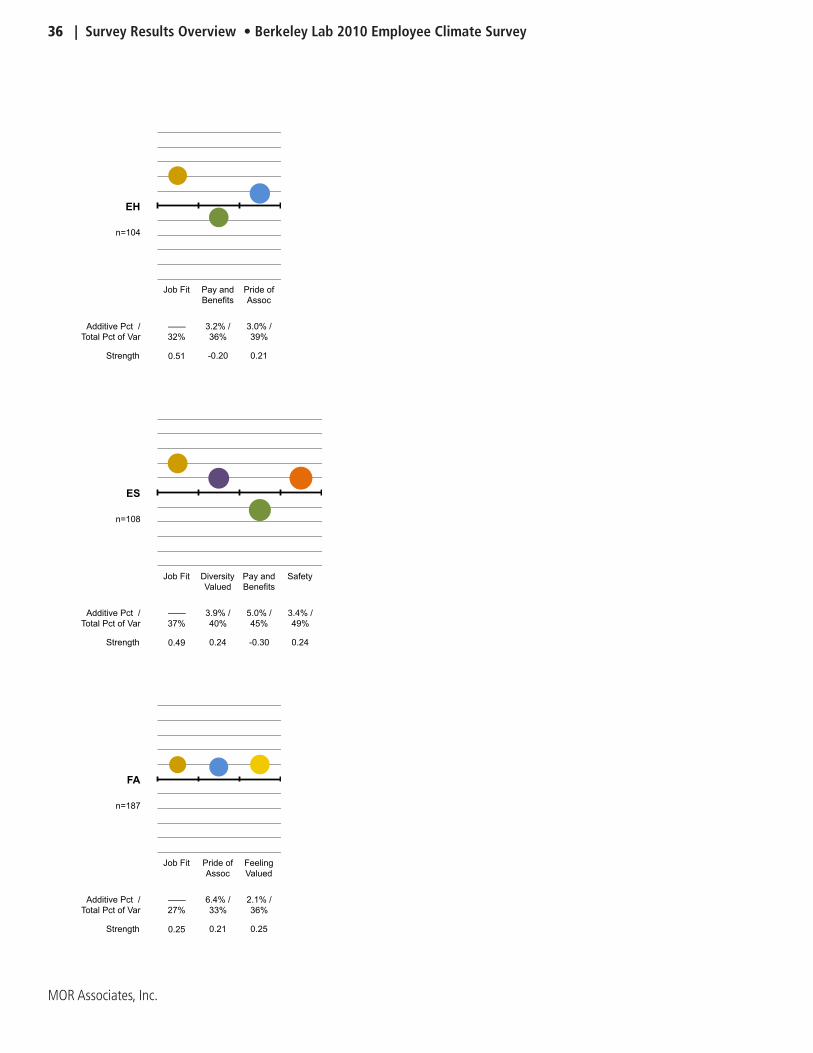
36 | Survey Results Overview • Berkeley Lab 2010 Employee Climate Survey
MOR Associates, Inc.
Job Fit Pay and
Benefits
Pride of
Assoc
Additive Pct /
Total Pct of Var
——
32%
3.2% /
36%
3.0% /
39%
Strength 0.51 -0.20 0.21
Job Fit Diversity
Valued
Pay and
Benefits
Safety
Additive Pct /
Total Pct of Var
——
37%
3.9% /
40%
5.0% /
45%
3.4% /
49%
Strength 0.49 0.24 -0.30 0.24
Job Fit Pride of
Assoc
Feeling
Valued
Additive Pct /
Total Pct of Var
——
27%
6.4% /
33%
2.1% /
36%
Strength 0.25 0.21 0.25
n=108
FA
n=187
EH
n=104
ES
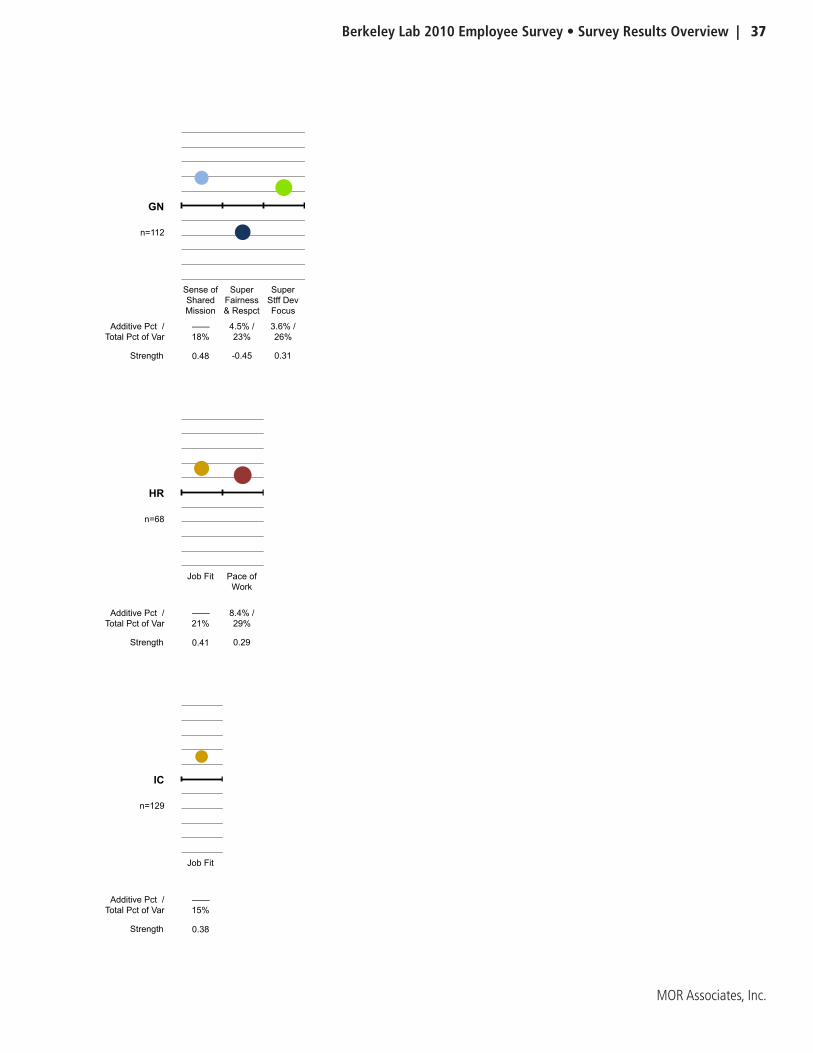
Berkeley Lab 2010 Employee Survey • Survey Results Overview | 37
MOR Associates, Inc.
Sense of
Shared
Mission
Super
Fairness
& Respct
Super
Stff Dev
Focus
Additive Pct /
Total Pct of Var
——
18%
4.5% /
23%
3.6% /
26%
Strength 0.48 -0.45 0.31
Job Fit Pace of
Work
Additive Pct /
Total Pct of Var
——
21%
8.4% /
29%
Strength 0.41 0.29
Job Fit
Additive Pct /
Total Pct of Var
——
15%
Strength 0.38
GN
n=112
HR
n=68
IC
n=129
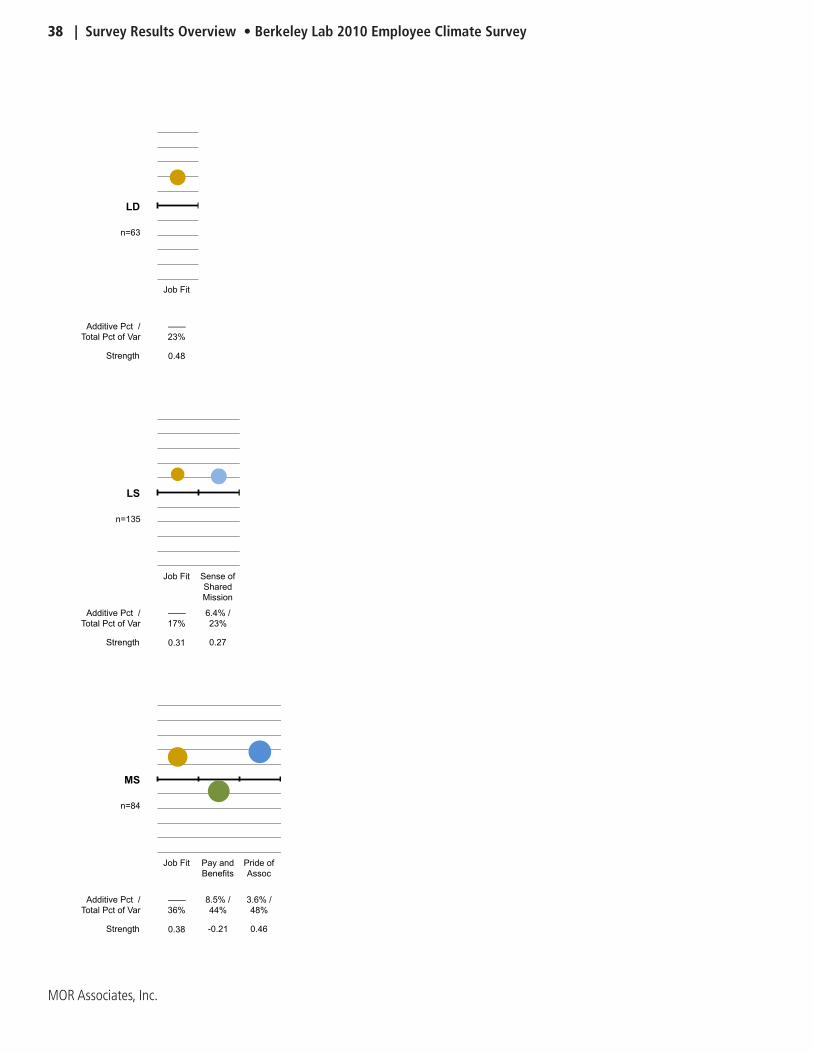
38 | Survey Results Overview • Berkeley Lab 2010 Employee Climate Survey
MOR Associates, Inc.
Job Fit
Additive Pct /
Total Pct of Var
——
23%
Strength 0.48
Job Fit Sense of
Shared
Mission
Additive Pct /
Total Pct of Var
——
17%
6.4% /
23%
Strength 0.31 0.27
Job Fit Pay and
Benefits
Pride of
Assoc
Additive Pct /
Total Pct of Var
——
36%
8.5% /
44%
3.6% /
48%
Strength 0.38 -0.21 0.46
n=63
LS
n=135
MS
n=84
LD

Berkeley Lab 2010 Employee Survey • Survey Results Overview | 39
MOR Associates, Inc.
Job Fit Super
Fairness
& Respct
Additive Pct /
Total Pct of Var
——
39%
9.7% /
49%
Strength 0.40 0.39
Diversity
Valued
Additive Pct /
Total Pct of Var
——
10%
Strength 0.31
Job Fit
Additive Pct /
Total Pct of Var
——
42%
Strength 0.65
n=23
NE
n=48
NS
n=47
PA
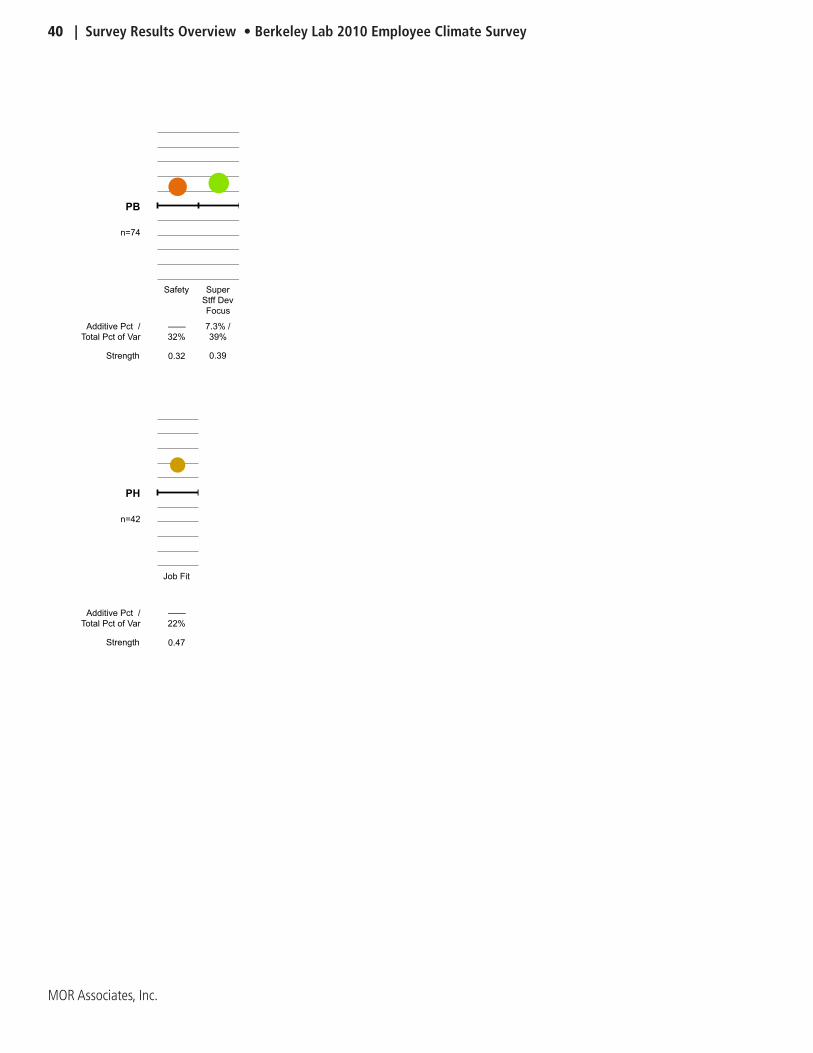
40 | Survey Results Overview • Berkeley Lab 2010 Employee Climate Survey
MOR Associates, Inc.
Safety Super
Stff Dev
Focus
Additive Pct /
Total Pct of Var
——
32%
7.3% /
39%
Strength 0.32 0.39
Job Fit
Additive Pct /
Total Pct of Var
——
22%
Strength 0.47
Job Fit Sense of
Shared
Mission
Safety Pride of
Assoc
Pay and
Benefits
Diversity
Valued
Super
Stff Dev
Focus
Pace of
Work
Feeling
Valued
Super
Fairness
& Respct
Super
Accntblty
Focus
Super
Cred
Additive Pct /
Total Pct of Var
——
22%
Strength 0.47
PH
n=42
PB
n=74
PH
n=42
Berkeley Lab 2010 Employee Survey • Reading the Charts and Tables | 41
MOR Associates, Inc.
Reading the Ratings Charts and Tables
42 | Reading the Charts and Tables • Berkeley Lab 2010 Employee Climate Survey
MOR Associates, Inc.
Mean N
10. Pride of Association Average
5 95
5.18 2034
10.1. I am proud of Berkeley
Lab's reputation.
2 98
5.43 2016
10.2. Acting with integrity is of
utmost importance at Berkeley
Lab.
6 94
5.17 1983
10.3. I find Berkeley Lab an
exciting place to work.
6 94
5.13 2005
10.4. Quality work is highly
valued at Berkeley Lab.
8 92
4.98 1993
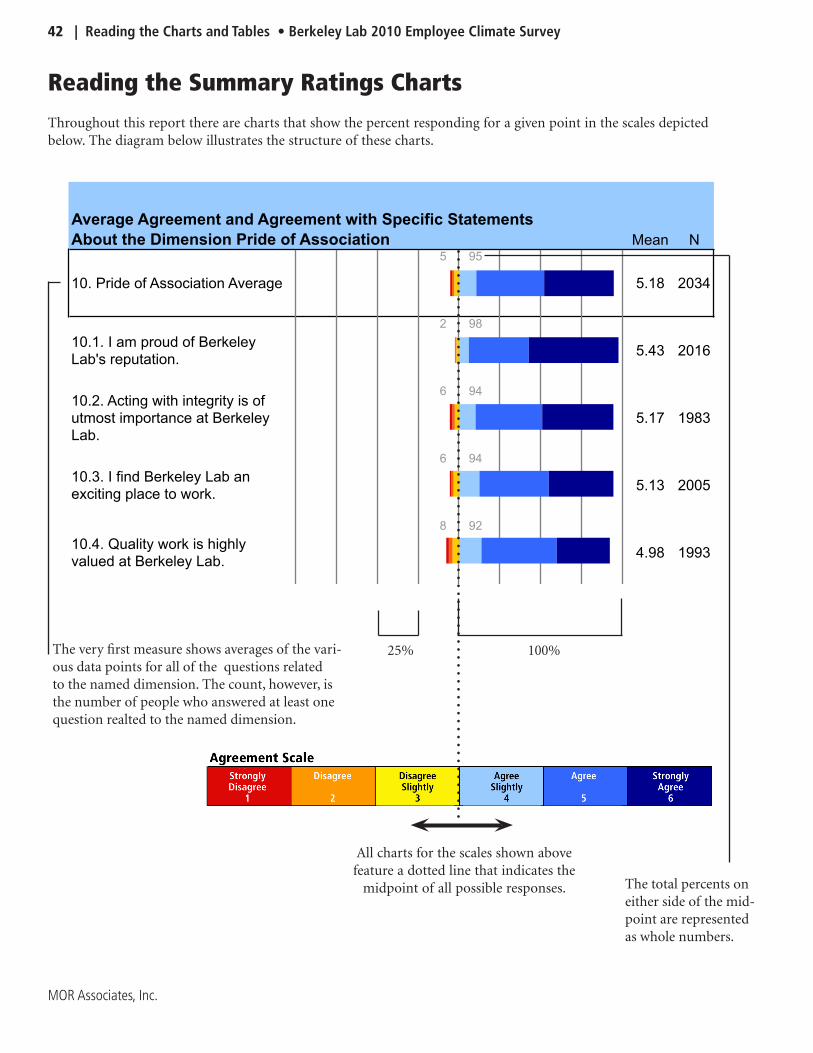
Average Agreement and Agreement with Specific Statements
About the Dimension Pride of Association
Reading the Summary Ratings Charts
Throughout this report there are charts that show the percent responding for a given point in the scales depicted below. The diagram below illustrates the structure of these charts.
All charts for the scales shown above feature a dotted line that indicates the
midpoint of all possible responses.
25% 100%
The total percents on either side of the mid-point are represented as whole numbers.
The very first measure shows averages of the vari-ous data points for all of the questions related to the named dimension. The count, however, is the number of people who answered at least one question realted to the named dimension.
Berkeley Lab 2010 Employee Survey • Reading the Charts and Tables | 43
MOR Associates, Inc.
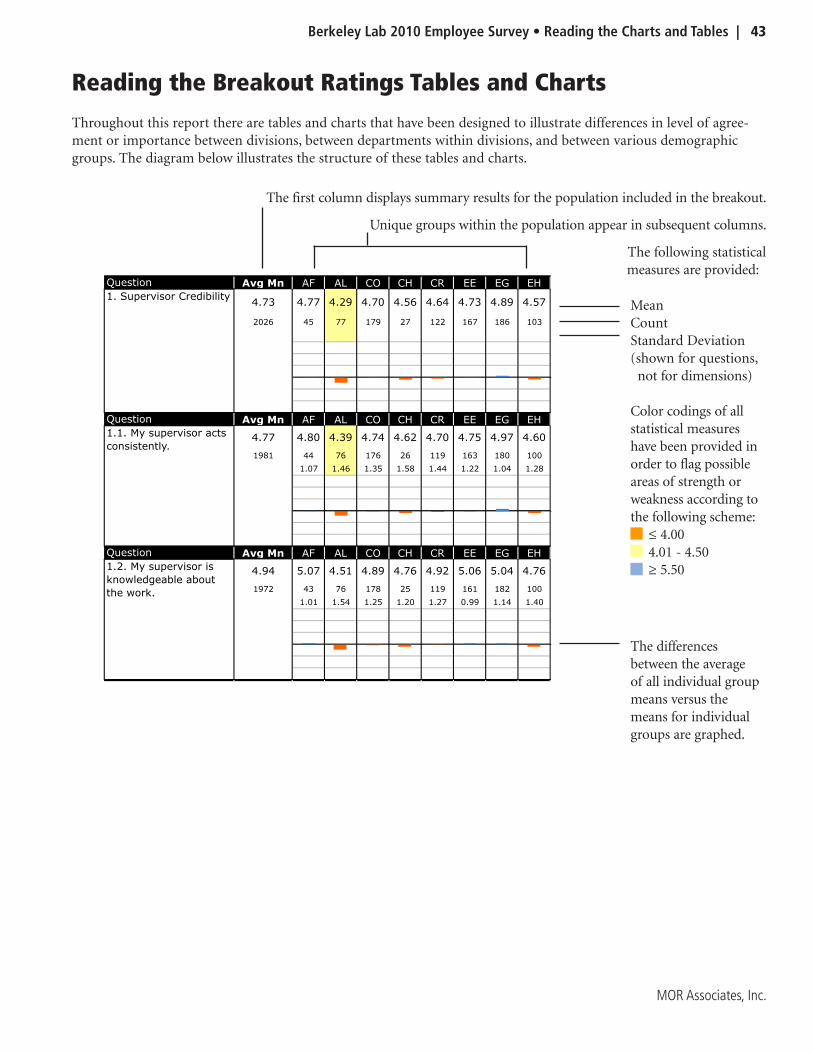
The first column displays summary results for the population included in the breakout.
Unique groups within the population appear in subsequent columns.
The following statistical measures are provided: l
MeanCountStandard Deviation(shown for questions, not for dimensions)
Color codings of all statistical measures have been provided in order to flag possible areas of strength or weakness according to the following scheme:
≤ 4.00 4.01 - 4.50≥ 5.50
The differences between the average of all individual group means versus the means for individual groups are graphed.
Reading the Breakout Ratings Tables and Charts
Throughout this report there are tables and charts that have been designed to illustrate differences in level of agree-ment or importance between divisions, between departments within divisions, and between various demographic groups. The diagram below illustrates the structure of these tables and charts.
Question Avg Mn AF AL CO CH CR EE EG EH ES FA GN HR IC LD LS MS NE NS OD PA PB PH <6
4.73 4.77 4.29 4.70 4.56 4.64 4.73 4.89 4.57 4.96 4.64 4.82 4.76 4.72 5.05 4.93 4.93 4.48 4.64 5.18 4.44 4.89 4.75 4.38
2026 45 77 179 27 122 167 186 103 105 182 111 67 126 63 133 81 47 47 8 23 72 40 15
Question Avg Mn AF AL CO CH CR EE EG EH ES FA GN HR IC LD LS MS NE NS OD PA PB PH <6
4.77 4.80 4.39 4.74 4.62 4.70 4.75 4.97 4.60 5.04 4.77 4.77 4.82 4.72 5.11 4.91 5.00 4.55 4.70 5.00 4.71 4.90 4.73 4.40
1981 44 76 176 26 119 163 180 100 103 178 109 66 123 63 132 78 47 46 8 21 68 40 15
1.07 1.46 1.35 1.58 1.44 1.22 1.04 1.28 1.11 1.19 1.20 1.05 1.30 1.02 1.24 1.06 1.28 1.24 1.41 1.23 1.34 0.99 1.72
Question Avg Mn AF AL CO CH CR EE EG EH ES FA GN HR IC LD LS MS NE NS OD PA PB PH <6
4.94 5.07 4.51 4.89 4.76 4.92 5.06 5.04 4.76 5.09 4.68 5.07 4.86 5.03 5.05 5.22 4.87 4.83 4.89 5.29 4.85 5.07 4.95 4.80
1972 43 76 178 25 119 161 182 100 103 176 108 64 123 63 130 78 46 46 7 20 69 40 15
1.01 1.54 1.25 1.20 1.27 0.99 1.14 1.40 0.93 1.26 1.15 1.05 1.15 0.85 1.02 1.22 1.23 1.08 0.49 1.18 1.17 1.08 1.26
Question Avg Mn AF AL CO CH CR EE EG EH ES FA GN HR IC LD LS MS NE NS OD PA PB PH <6
4.82 4.86 4.39 4.80 4.88 4.73 4.78 4.96 4.67 5.10 4.78 4.90 4.88 4.70 5.23 4.95 5.06 4.53 4.68 5.43 4.26 4.87 4.88 4.47
1975 43 76 173 25 120 161 180 103 101 180 108 65 125 62 132 78 45 44 7 23 69 40 15
1.21 1.55 1.35 1.01 1.48 1.23 1.17 1.40 1.12 1.23 1.15 1.07 1.33 1.01 1.19 1.10 1.38 1.46 0.79 1.57 1.51 1.14 1.46
Question Avg Mn AF AL CO CH CR EE EG EH ES FA GN HR IC LD LS MS NE NS OD PA PB PH <6
4.39 4.35 3.86 4.35 4.00 4.22 4.33 4.58 4.26 4.63 4.34 4.53 4.49 4.42 4.83 4.66 4.77 4.00 4.31 5.00 3.95 4.70 4.45 3.87
1952 43 74 174 27 119 161 181 102 96 176 105 61 122 63 129 77 45 45 8 22 67 40 15
1.27 1.67 1.49 1.41 1.69 1.43 1.26 1.52 1.32 1.41 1.37 1.32 1.45 1.35 1.30 1.37 1.65 1.47 0.76 1.46 1.51 1.24 1.68
1. Supervisor Credibility
1.1. My supervisor acts
consistently.
1.2. My supervisor is
knowledgeable about
the work.
1.3. I have confidence
in my supervisor.
1.4. My supervisor is a
role model.
44 | Reading the Charts and Tables • Berkeley Lab 2010 Employee Climate Survey
MOR Associates, Inc.
Berkeley Lab 2010 Employee Survey • Summary Charts for Agreement Ratings | 45
MOR Associates, Inc.
Summary Charts of Agreement Ratings
for All Questions
46 | Summary Charts for Agreement Ratings • Berkeley Lab 2010 Employee Climate Survey
MOR Associates, Inc.
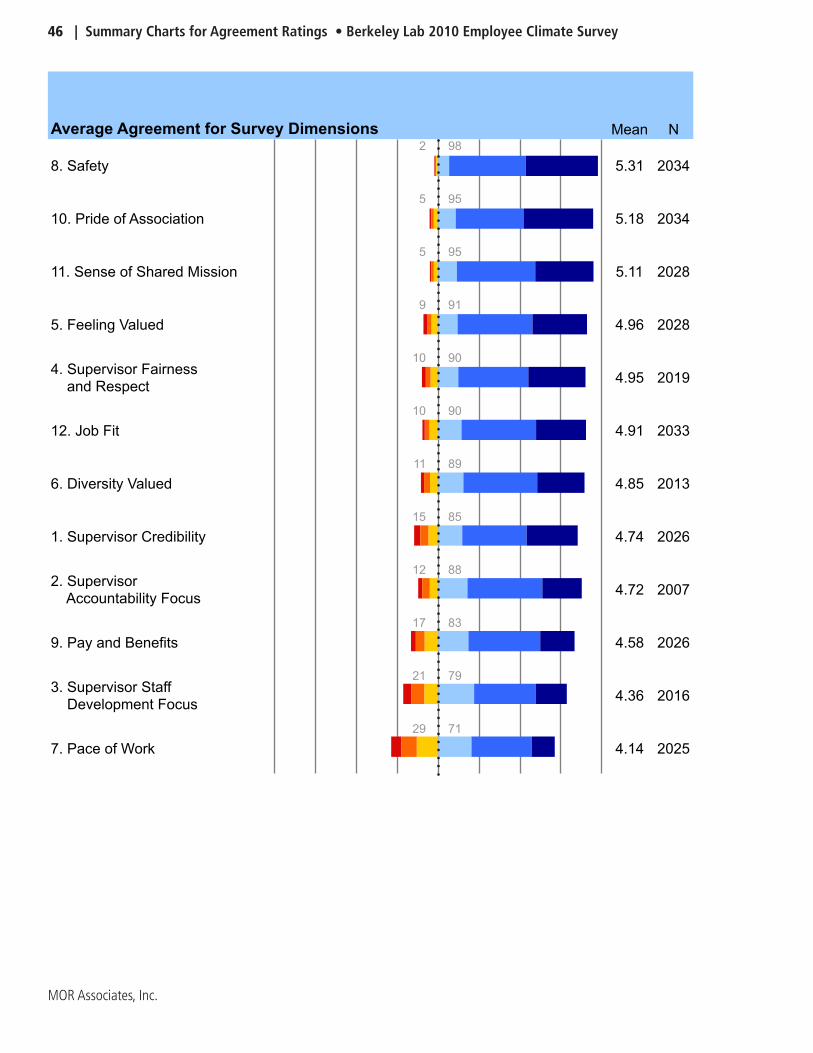
Mean N
8. Safety
2 98
5.31 2034
10. Pride of Association
5 95
5.18 2034
11. Sense of Shared Mission
5 95
5.11 2028
5. Feeling Valued
9 91
4.96 2028
4. Supervisor Fairness
and Respect
10 90
4.95 2019
12. Job Fit
10 90
4.91 2033
6. Diversity Valued
11 89
4.85 2013
1. Supervisor Credibility
15 85
4.74 2026
2. Supervisor
Accountability Focus
12 88
4.72 2007
9. Pay and Benefits
17 83
4.58 2026
3. Supervisor Staff
Development Focus
21 79
4.36 2016
7. Pace of Work
29 71
4.14 2025
Average Agreement for Survey Dimensions
Berkeley Lab 2010 Employee Survey • Summary Charts for Agreement Ratings | 47
MOR Associates, Inc.
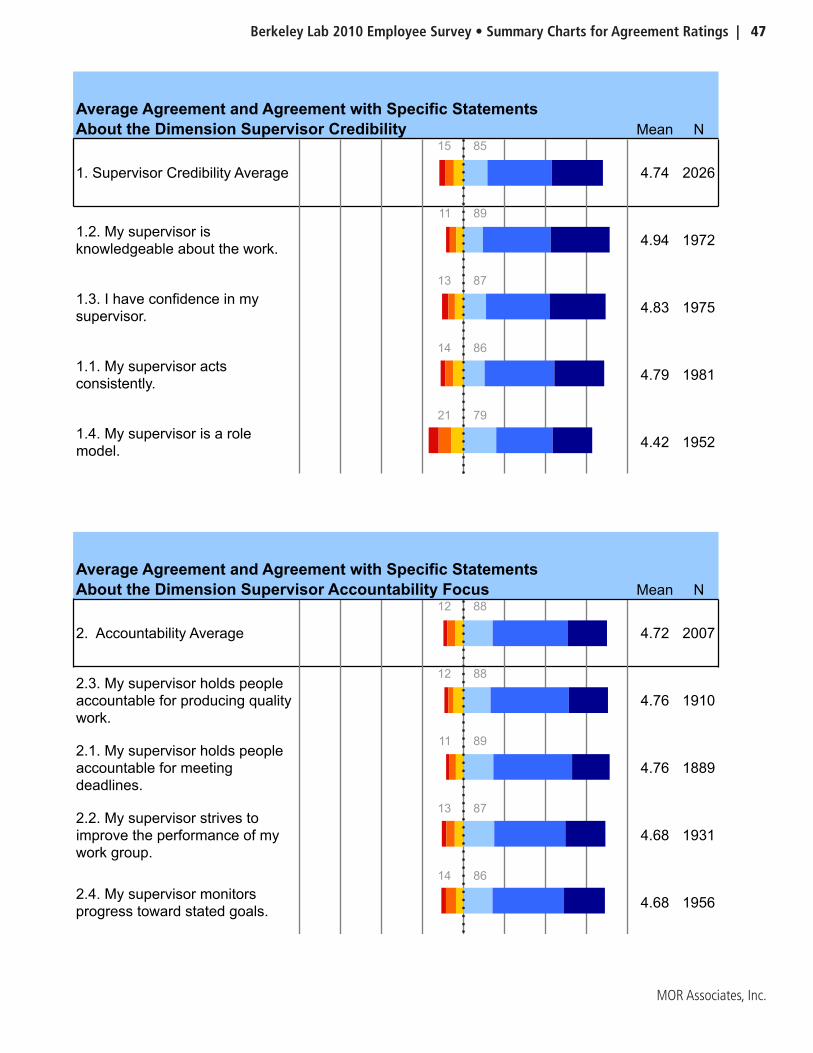
Mean N
1. Supervisor Credibility Average
15 85
4.74 2026
1.2. My supervisor is
knowledgeable about the work.
11 89
4.94 1972
1.3. I have confidence in my
supervisor.
13 87
4.83 1975
1.1. My supervisor acts
consistently.
14 86
4.79 1981
1.4. My supervisor is a role
model.
21 79
4.42 1952
Average Agreement and Agreement with Specific Statements
About the Dimension Supervisor Credibility
Mean N
2. Accountability Average
12 88
4.72 2007
2.3. My supervisor holds people
accountable for producing quality
work.
12 88
4.76 1910
2.1. My supervisor holds people
accountable for meeting
deadlines.
11 89
4.76 1889
2.2. My supervisor strives to
improve the performance of my
work group.
13 87
4.68 1931
2.4. My supervisor monitors
progress toward stated goals.
14 86
4.68 1956
Average Agreement and Agreement with Specific Statements
About the Dimension Supervisor Accountability Focus
48 | Summary Charts for Agreement Ratings • Berkeley Lab 2010 Employee Climate Survey
MOR Associates, Inc.
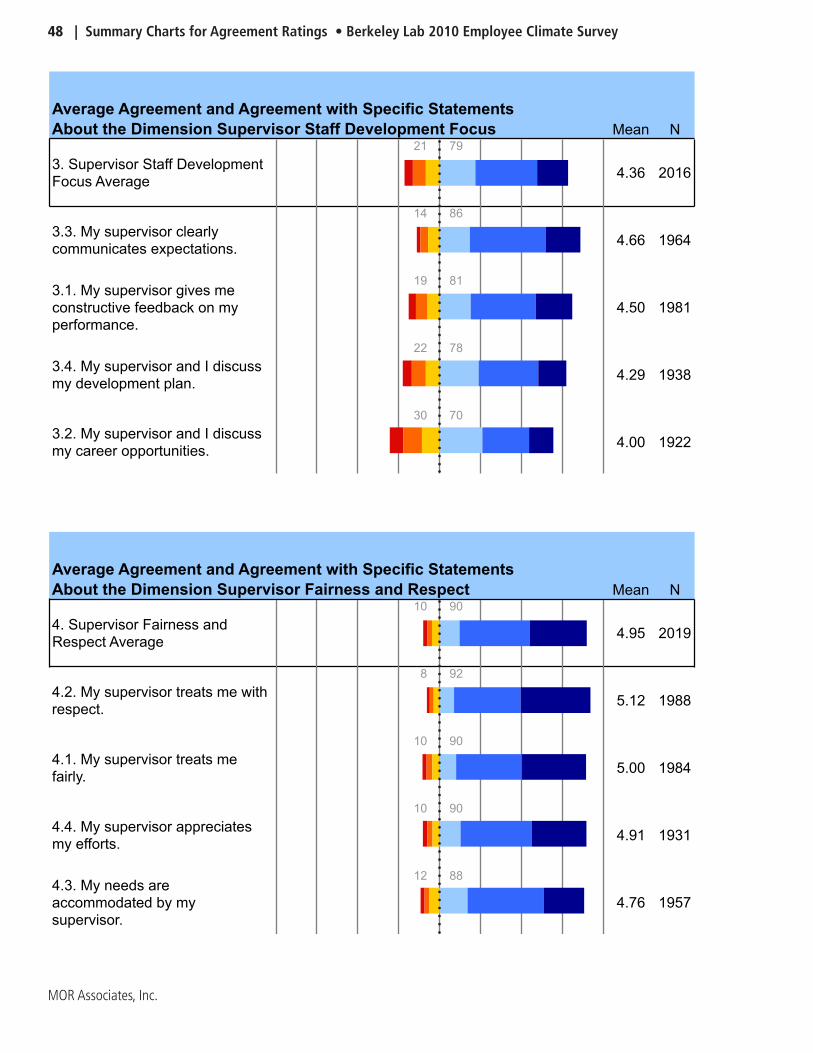
Mean N
3. Supervisor Staff Development
Focus Average
21 79
4.36 2016
3.3. My supervisor clearly
communicates expectations.
14 86
4.66 1964
3.1. My supervisor gives me
constructive feedback on my
performance.
19 81
4.50 1981
3.4. My supervisor and I discuss
my development plan.
22 78
4.29 1938
3.2. My supervisor and I discuss
my career opportunities.
30 70
4.00 1922
Average Agreement and Agreement with Specific Statements
About the Dimension Supervisor Staff Development Focus
Mean N
4. Supervisor Fairness and
Respect Average
10 90
4.95 2019
4.2. My supervisor treats me with
respect.
8 92
5.12 1988
4.1. My supervisor treats me
fairly.
10 90
5.00 1984
4.4. My supervisor appreciates
my efforts.
10 90
4.91 1931
4.3. My needs are
accommodated by my
supervisor.
12 88
4.76 1957
Average Agreement and Agreement with Specific Statements
About the Dimension Supervisor Fairness and Respect
Berkeley Lab 2010 Employee Survey • Summary Charts for Agreement Ratings | 49
MOR Associates, Inc.
Mean N
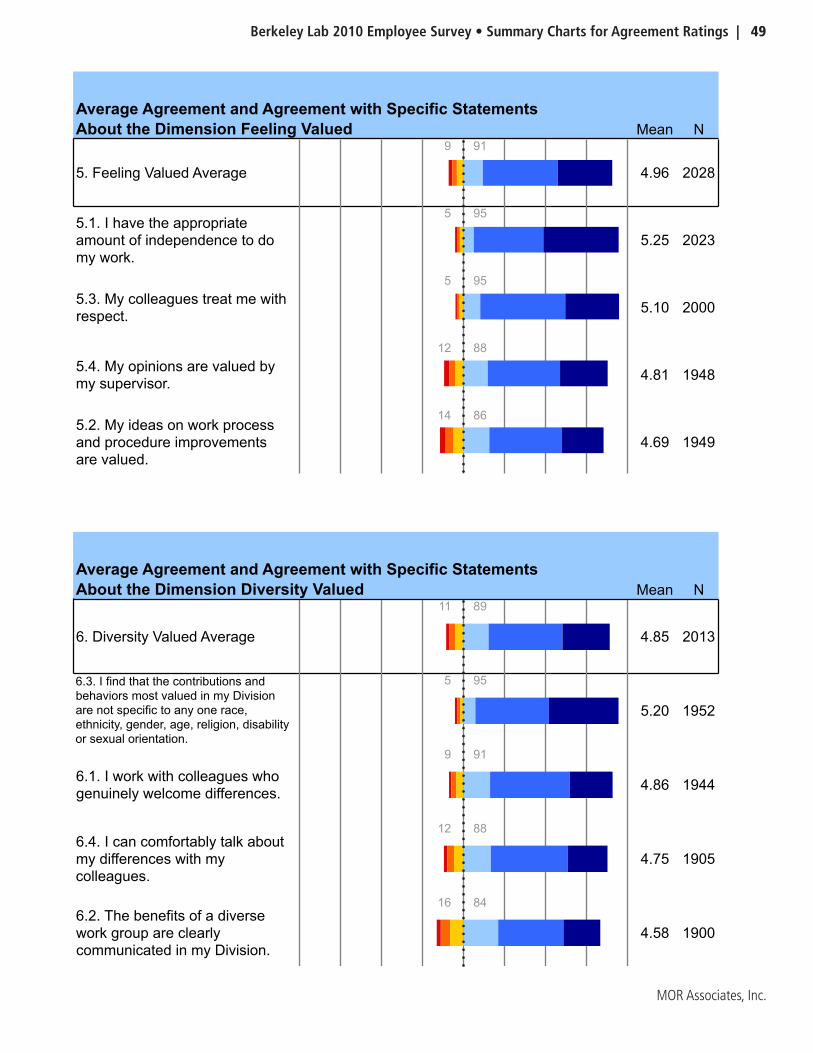
5. Feeling Valued Average
9 91
4.96 2028
5.1. I have the appropriate
amount of independence to do
my work.
5 95
5.25 2023
5.3. My colleagues treat me with
respect.
5 95
5.10 2000
5.4. My opinions are valued by
my supervisor.
12 88
4.81 1948
5.2. My ideas on work process
and procedure improvements
are valued.
14 86
4.69 1949
Average Agreement and Agreement with Specific Statements
About the Dimension Feeling Valued
Mean N
6. Diversity Valued Average
11 89
4.85 2013
6.3. I find that the contributions and
behaviors most valued in my Division
are not specific to any one race,
ethnicity, gender, age, religion, disability
or sexual orientation.
5 95
5.20 1952
6.1. I work with colleagues who
genuinely welcome differences.
9 91
4.86 1944
6.4. I can comfortably talk about
my differences with my
colleagues.
12 88
4.75 1905
6.2. The benefits of a diverse
work group are clearly
communicated in my Division.
16 84
4.58 1900
Average Agreement and Agreement with Specific Statements
About the Dimension Diversity Valued

50 | Summary Charts for Agreement Ratings • Berkeley Lab 2010 Employee Climate Survey
MOR Associates, Inc.
Mean N
7. Pace of Work Average
29 71
4.14 2025
7.1. I work in an environment
where there is a reasonable
workload.
25 75
4.30 2008
7.2. My group has enough staff
to get the work done in a quality
manner.
33 67
3.98 1967
Average Agreement and Agreement with Specific Statements
About the Dimension Pace of Work
Mean N
8. Safety Average
2 98
5.31 2034
8.1. My responsibilities related to
safety have been clearly
communicated to me.
2 98
5.43 2011
8.3. Safety is an important core
value in my group.
1 99
5.35 1999
8.4. My rights regarding safety
have been clearly communicated
to me.
2 98
5.33 2003
8.2. I feel safe in conducting my
work because of the Laboratory's
safety practices.
4 96
5.14 1992
Average Agreement and Agreement with Specific Statements
About the Dimension Safety
Berkeley Lab 2010 Employee Survey • Summary Charts for Agreement Ratings | 51
MOR Associates, Inc.
Mean N
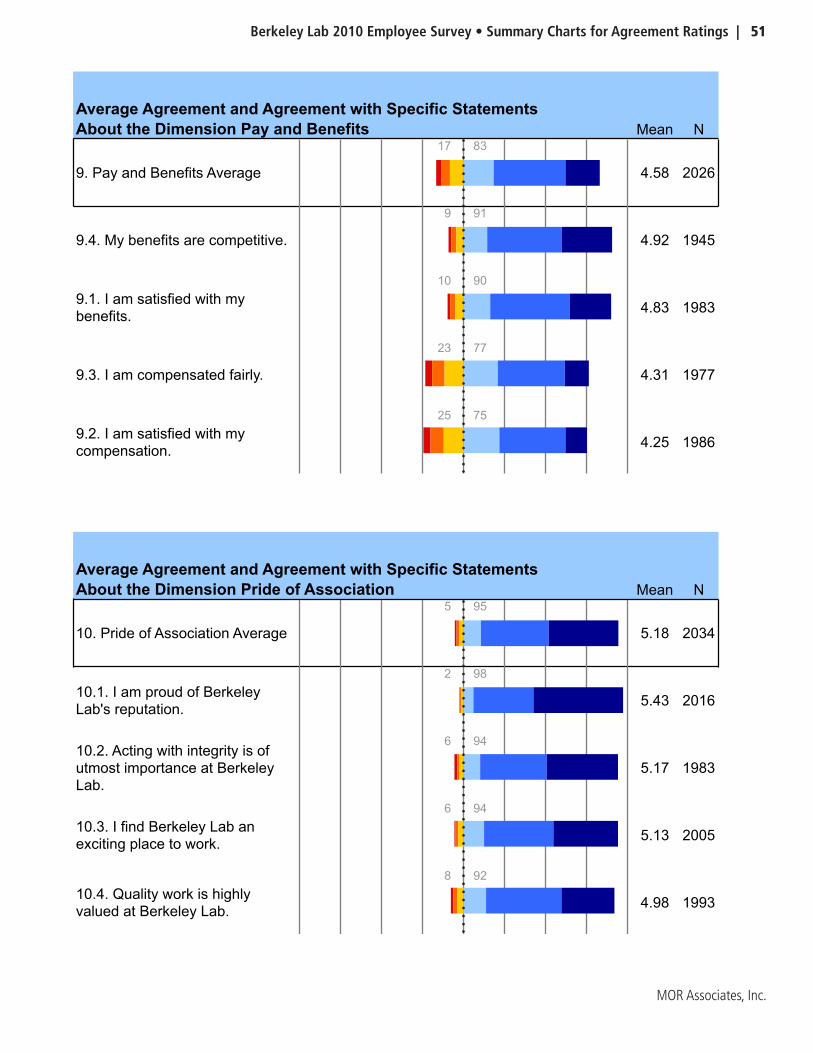
9. Pay and Benefits Average
17 83
4.58 2026
9.4. My benefits are competitive.
9 91
4.92 1945
9.1. I am satisfied with my
benefits.
10 90
4.83 1983
9.3. I am compensated fairly.
23 77
4.31 1977
9.2. I am satisfied with my
compensation.
25 75
4.25 1986
Average Agreement and Agreement with Specific Statements
About the Dimension Pay and Benefits
Mean N
10. Pride of Association Average
5 95
5.18 2034
10.1. I am proud of Berkeley
Lab's reputation.
2 98
5.43 2016
10.2. Acting with integrity is of
utmost importance at Berkeley
Lab.
6 94
5.17 1983
10.3. I find Berkeley Lab an
exciting place to work.
6 94
5.13 2005
10.4. Quality work is highly
valued at Berkeley Lab.
8 92
4.98 1993
Average Agreement and Agreement with Specific Statements
About the Dimension Pride of Association
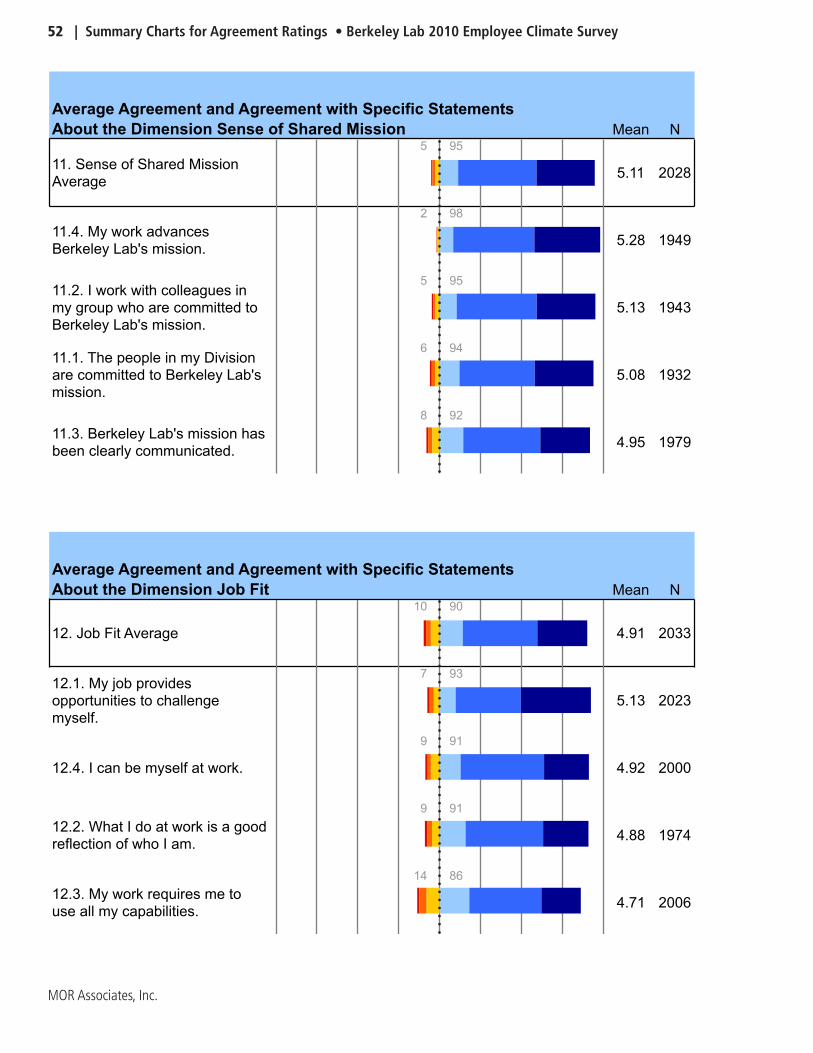
52 | Summary Charts for Agreement Ratings • Berkeley Lab 2010 Employee Climate Survey
MOR Associates, Inc.
Mean N
11. Sense of Shared Mission
Average
5 95
5.11 2028
11.4. My work advances
Berkeley Lab's mission.
2 98
5.28 1949
11.2. I work with colleagues in
my group who are committed to
Berkeley Lab's mission.
5 95
5.13 1943
11.1. The people in my Division
are committed to Berkeley Lab's
mission.
6 94
5.08 1932
11.3. Berkeley Lab's mission has
been clearly communicated.
8 92
4.95 1979
Average Agreement and Agreement with Specific Statements
About the Dimension Sense of Shared Mission
Mean N
12. Job Fit Average
10 90
4.91 2033
12.1. My job provides
opportunities to challenge
myself.
7 93
5.13 2023
12.4. I can be myself at work.
9 91
4.92 2000
12.2. What I do at work is a good
reflection of who I am.
9 91
4.88 1974
12.3. My work requires me to
use all my capabilities.
14 86
4.71 2006
Average Agreement and Agreement with Specific Statements
About the Dimension Job Fit
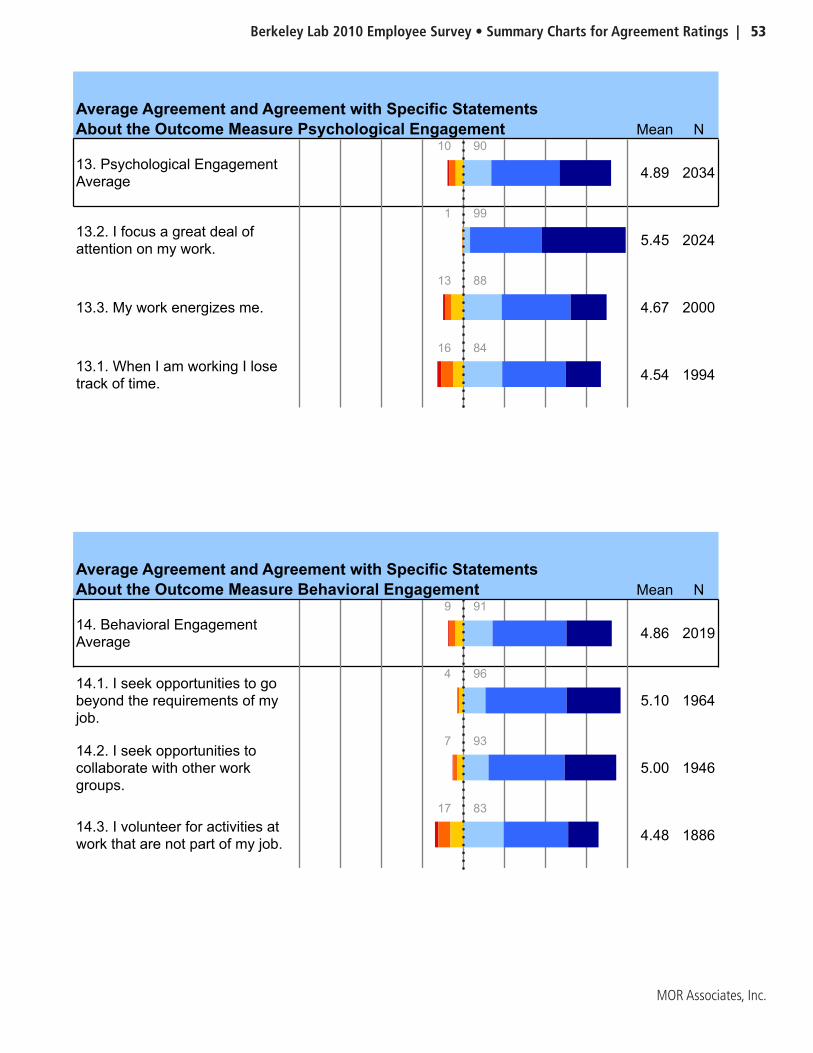
Berkeley Lab 2010 Employee Survey • Summary Charts for Agreement Ratings | 53
MOR Associates, Inc.
Mean N
13. Psychological Engagement
Average
10 90
4.89 2034
13.2. I focus a great deal of
attention on my work.
1 99
5.45 2024
13.3. My work energizes me.
13 88
4.67 2000
13.1. When I am working I lose
track of time.
16 84
4.54 1994
Average Agreement and Agreement with Specific Statements
About the Outcome Measure Psychological Engagement
Mean N
14. Behavioral Engagement
Average
9 91
4.86 2019
14.1. I seek opportunities to go
beyond the requirements of my
job.
4 96
5.10 1964
14.2. I seek opportunities to
collaborate with other work
groups.
7 93
5.00 1946
14.3. I volunteer for activities at
work that are not part of my job.
17 83
4.48 1886
Average Agreement and Agreement with Specific Statements
About the Outcome Measure Behavioral Engagement
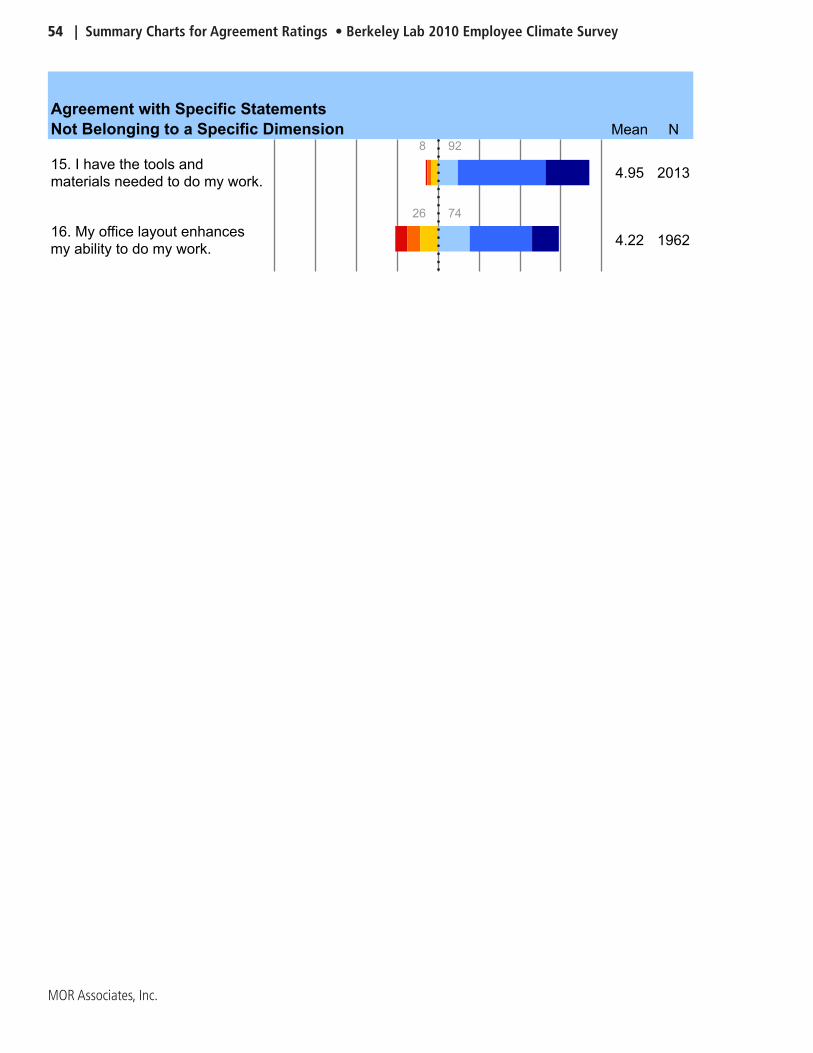
54 | Summary Charts for Agreement Ratings • Berkeley Lab 2010 Employee Climate Survey
MOR Associates, Inc.
Mean N
15. I have the tools and
materials needed to do my work.
8 92
4.95 2013
16. My office layout enhances
my ability to do my work.
26 74
4.22 1962
Agreement with Specific Statements
Not Belonging to a Specific Dimension

Berkeley Lab 2010 Employee Survey • Breakouts: All Divisions | 55
MOR Associates, Inc.
Breakout Charts and Tables:
All Divisions

56 | Breakouts: All Divisions • Berkeley Lab 2010 Employee Climate Survey
MOR Associates, Inc.
Division Key
This page is intended to serve as a guide for reading the abbreviations of the division charts on the following pages.
AF Accelerator & Fusion Research
AL Advanced Light Source
CO Office of Chief Financial Officer
CH Chemical Sciences
CR Computational Research Div
EE Environmental Energy Tech
EG Engineering
EH Environment, Health & Safety
ES Earth Sciences
FA Facilities
GN Genomics Division
HR Human Resources
IC Information Technology Div
LD Laboratory Directorate
LS Life Sciences
MS Materials Sciences
NE NERSC
NS Nuclear Science
OD Operations Division
PA Public Affairs
PB Physical Biosciences
PH Physics
<6 Fewer Than 6
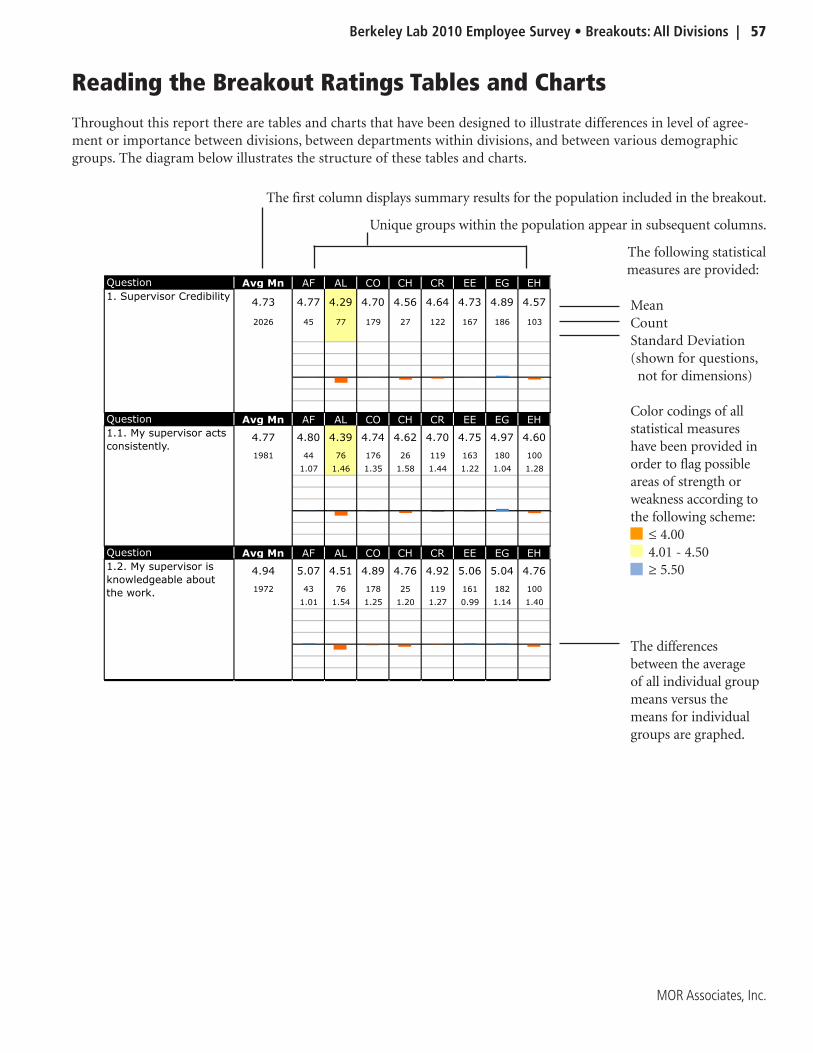
Berkeley Lab 2010 Employee Survey • Breakouts: All Divisions | 57
MOR Associates, Inc.
The first column displays summary results for the population included in the breakout.
Unique groups within the population appear in subsequent columns.
The following statistical measures are provided: l
MeanCountStandard Deviation(shown for questions, not for dimensions)
Color codings of all statistical measures have been provided in order to flag possible areas of strength or weakness according to the following scheme:
≤ 4.00 4.01 - 4.50≥ 5.50
The differences between the average of all individual group means versus the means for individual groups are graphed.
Reading the Breakout Ratings Tables and Charts
Throughout this report there are tables and charts that have been designed to illustrate differences in level of agree-ment or importance between divisions, between departments within divisions, and between various demographic groups. The diagram below illustrates the structure of these tables and charts.
Question Avg Mn AF AL CO CH CR EE EG EH ES FA GN HR IC LD LS MS NE NS OD PA PB PH <6
4.73 4.77 4.29 4.70 4.56 4.64 4.73 4.89 4.57 4.96 4.64 4.82 4.76 4.72 5.05 4.93 4.93 4.48 4.64 5.18 4.44 4.89 4.75 4.38
2026 45 77 179 27 122 167 186 103 105 182 111 67 126 63 133 81 47 47 8 23 72 40 15
Question Avg Mn AF AL CO CH CR EE EG EH ES FA GN HR IC LD LS MS NE NS OD PA PB PH <6
4.77 4.80 4.39 4.74 4.62 4.70 4.75 4.97 4.60 5.04 4.77 4.77 4.82 4.72 5.11 4.91 5.00 4.55 4.70 5.00 4.71 4.90 4.73 4.40
1981 44 76 176 26 119 163 180 100 103 178 109 66 123 63 132 78 47 46 8 21 68 40 15
1.07 1.46 1.35 1.58 1.44 1.22 1.04 1.28 1.11 1.19 1.20 1.05 1.30 1.02 1.24 1.06 1.28 1.24 1.41 1.23 1.34 0.99 1.72
Question Avg Mn AF AL CO CH CR EE EG EH ES FA GN HR IC LD LS MS NE NS OD PA PB PH <6
4.94 5.07 4.51 4.89 4.76 4.92 5.06 5.04 4.76 5.09 4.68 5.07 4.86 5.03 5.05 5.22 4.87 4.83 4.89 5.29 4.85 5.07 4.95 4.80
1972 43 76 178 25 119 161 182 100 103 176 108 64 123 63 130 78 46 46 7 20 69 40 15
1.01 1.54 1.25 1.20 1.27 0.99 1.14 1.40 0.93 1.26 1.15 1.05 1.15 0.85 1.02 1.22 1.23 1.08 0.49 1.18 1.17 1.08 1.26
Question Avg Mn AF AL CO CH CR EE EG EH ES FA GN HR IC LD LS MS NE NS OD PA PB PH <6
4.82 4.86 4.39 4.80 4.88 4.73 4.78 4.96 4.67 5.10 4.78 4.90 4.88 4.70 5.23 4.95 5.06 4.53 4.68 5.43 4.26 4.87 4.88 4.47
1975 43 76 173 25 120 161 180 103 101 180 108 65 125 62 132 78 45 44 7 23 69 40 15
1.21 1.55 1.35 1.01 1.48 1.23 1.17 1.40 1.12 1.23 1.15 1.07 1.33 1.01 1.19 1.10 1.38 1.46 0.79 1.57 1.51 1.14 1.46
Question Avg Mn AF AL CO CH CR EE EG EH ES FA GN HR IC LD LS MS NE NS OD PA PB PH <6
4.39 4.35 3.86 4.35 4.00 4.22 4.33 4.58 4.26 4.63 4.34 4.53 4.49 4.42 4.83 4.66 4.77 4.00 4.31 5.00 3.95 4.70 4.45 3.87
1952 43 74 174 27 119 161 181 102 96 176 105 61 122 63 129 77 45 45 8 22 67 40 15
1.27 1.67 1.49 1.41 1.69 1.43 1.26 1.52 1.32 1.41 1.37 1.32 1.45 1.35 1.30 1.37 1.65 1.47 0.76 1.46 1.51 1.24 1.68
1. Supervisor Credibility
1.1. My supervisor acts
consistently.
1.2. My supervisor is
knowledgeable about
the work.
1.3. I have confidence
in my supervisor.
1.4. My supervisor is a
role model.
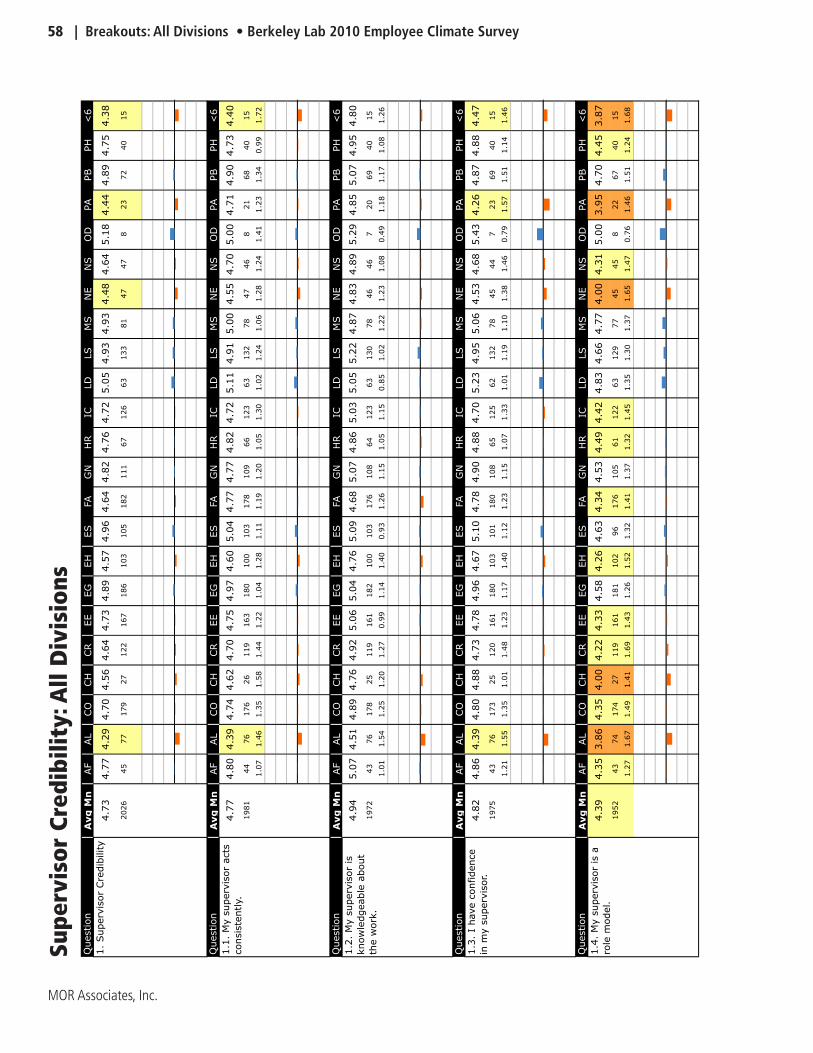
58 | Breakouts: All Divisions • Berkeley Lab 2010 Employee Climate Survey
MOR Associates, Inc.
Question
Avg
Mn
AF
AL
CO
CH
CR
EE
EG
EH
ES
FA
GN
HR
ICLD
LS
MS
NE
NS
OD
PA
PB
PH
<6
4.7
34.7
74.2
94.7
04.5
64.6
44.7
34.8
94.5
74.9
64.6
44.8
24.7
64.7
25.0
54.9
34.9
34.4
84.6
45.1
84.4
44.8
94.7
54.3
8
2026
45
77
179
27
122
167
186
103
105
182
111
67
126
63
133
81
47
47
823
72
40
15
Question
Avg
Mn
AF
AL
CO
CH
CR
EE
EG
EH
ES
FA
GN
HR
ICLD
LS
MS
NE
NS
OD
PA
PB
PH
<6
4.7
74.8
04.3
94.7
44.6
24.7
04.7
54.9
74.6
05.0
44.7
74.7
74.8
24.7
25.1
14.9
15.0
04.5
54.7
05.0
04.7
14.9
04.7
34.4
0
1981
44
76
176
26
119
163
180
100
103
178
109
66
123
63
132
78
47
46
821
68
40
15
1.0
71.4
61.3
51.5
81.4
41.2
21.0
41.2
81.1
11.1
91.2
01.0
51.3
01.0
21.2
41.0
61.2
81.2
41.4
11.2
31.3
40.9
91.7
2
Question
Avg
Mn
AF
AL
CO
CH
CR
EE
EG
EH
ES
FA
GN
HR
ICLD
LS
MS
NE
NS
OD
PA
PB
PH
<6
4.9
45.0
74.5
14.8
94.7
64.9
25.0
65.0
44.7
65.0
94.6
85.0
74.8
65.0
35.0
55.2
24.8
74.8
34.8
95.2
94.8
55.0
74.9
54.8
0
1972
43
76
178
25
119
161
182
100
103
176
108
64
123
63
130
78
46
46
720
69
40
15
1.0
11.5
41.2
51.2
01.2
70.9
91.1
41.4
00.9
31.2
61.1
51.0
51.1
50.8
51.0
21.2
21.2
31.0
80.4
91.1
81.1
71.0
81.2
6
Question
Avg
Mn
AF
AL
CO
CH
CR
EE
EG
EH
ES
FA
GN
HR
ICLD
LS
MS
NE
NS
OD
PA
PB
PH
<6
4.8
24.8
64.3
94.8
04.8
84.7
34.7
84.9
64.6
75.1
04.7
84.9
04.8
84.7
05.2
34.9
55.0
64.5
34.6
85.4
34.2
64.8
74.8
84.4
7
1975
43
76
173
25
120
161
180
103
101
180
108
65
125
62
132
78
45
44
723
69
40
15
1.2
11.5
51.3
51.0
11.4
81.2
31.1
71.4
01.1
21.2
31.1
51.0
71.3
31.0
11.1
91.1
01.3
81.4
60.7
91.5
71.5
11.1
41.4
6
Question
Avg
Mn
AF
AL
CO
CH
CR
EE
EG
EH
ES
FA
GN
HR
ICLD
LS
MS
NE
NS
OD
PA
PB
PH
<6
4.3
94.3
53.8
64.3
54.0
04.2
24.3
34.5
84.2
64.6
34.3
44.5
34.4
94.4
24.8
34.6
64.7
74.0
04.3
15.0
03.9
54.7
04.4
53.8
7
1952
43
74
174
27
119
161
181
102
96
176
105
61
122
63
129
77
45
45
822
67
40
15
1.2
71.6
71.4
91.4
11.6
91.4
31.2
61.5
21.3
21.4
11.3
71.3
21.4
51.3
51.3
01.3
71.6
51.4
70.7
61.4
61.5
11.2
41.6
8
1.
Superv
isor
Cre
dib
ility
1.1
. M
y s
uperv
isor
acts
consis
tently.
1.2
. M
y s
uperv
isor
is
know
ledgeable
about
the w
ork
.
1.3
. I
have c
onfidence
in m
y s
uperv
isor.
1.4
. M
y s
uperv
isor
is a
role
model.
Supe
rvis
or C
redi
bilit
y: A
ll D
ivis
ions
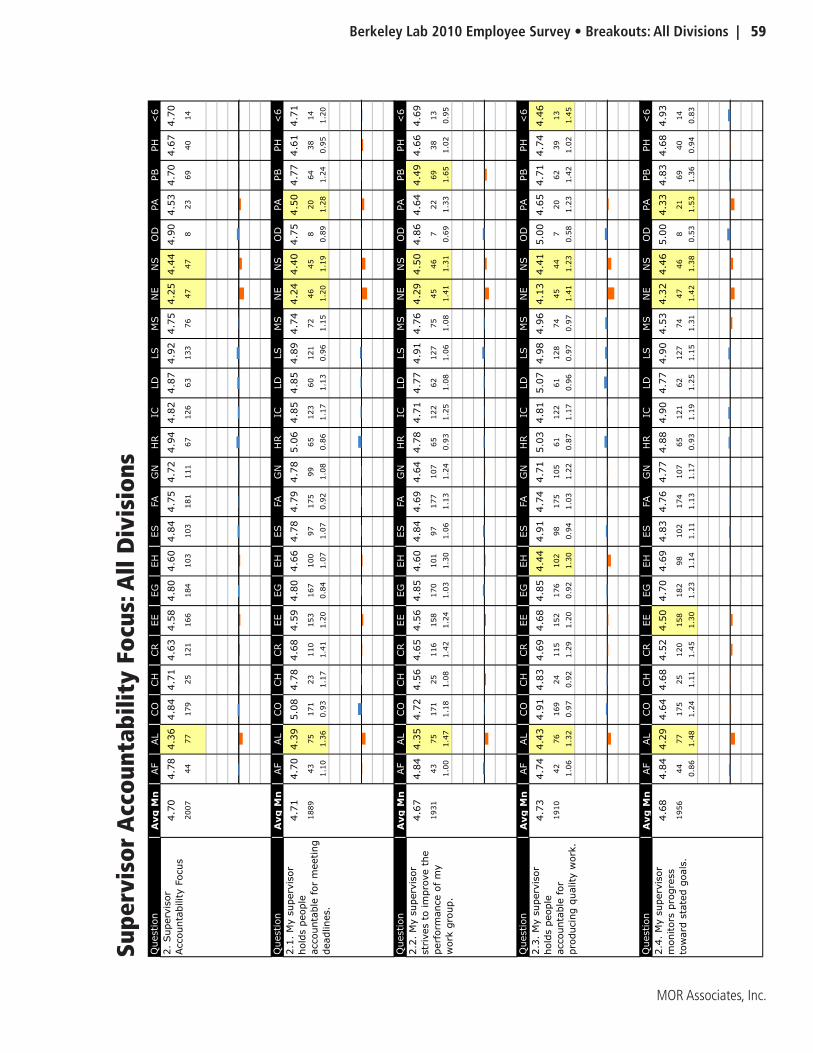
Berkeley Lab 2010 Employee Survey • Breakouts: All Divisions | 59
MOR Associates, Inc.
Question
Avg
Mn
AF
AL
CO
CH
CR
EE
EG
EH
ES
FA
GN
HR
ICLD
LS
MS
NE
NS
OD
PA
PB
PH
<6
4.7
04.7
84.3
64.8
44.7
14.6
34.5
84.8
04.6
04.8
44.7
54.7
24.9
44.8
24.8
74.9
24.7
54.2
54.4
44.9
04.5
34.7
04.6
74.7
0
2007
44
77
179
25
121
166
184
103
103
181
111
67
126
63
133
76
47
47
823
69
40
14
Question
Avg
Mn
AF
AL
CO
CH
CR
EE
EG
EH
ES
FA
GN
HR
ICLD
LS
MS
NE
NS
OD
PA
PB
PH
<6
4.7
14.7
04.3
95.0
84.7
84.6
84.5
94.8
04.6
64.7
84.7
94.7
85.0
64.8
54.8
54.8
94.7
44.2
44.4
04.7
54.5
04.7
74.6
14.7
1
1889
43
75
171
23
110
153
167
100
97
175
99
65
123
60
121
72
46
45
820
64
38
14
1.1
01.3
60.9
31.1
71.4
11.2
00.8
41.0
71.0
70.9
21.0
80.8
61.1
71.1
30.9
61.1
51.2
01.1
90.8
91.2
81.2
40.9
51.2
0
Question
Avg
Mn
AF
AL
CO
CH
CR
EE
EG
EH
ES
FA
GN
HR
ICLD
LS
MS
NE
NS
OD
PA
PB
PH
<6
4.6
74.8
44.3
54.7
24.5
64.6
54.5
64.8
54.6
04.8
44.6
94.6
44.7
84.7
14.7
74.9
14.7
64.2
94.5
04.8
64.6
44.4
94.6
64.6
9
1931
43
75
171
25
116
158
170
101
97
177
107
65
122
62
127
75
45
46
722
69
38
13
1.0
01.4
71.1
81.0
81.4
21.2
41.0
31.3
01.0
61.1
31.2
40.9
31.2
51.0
81.0
61.0
81.4
11.3
10.6
91.3
31.6
51.0
20.9
5
Question
Avg
Mn
AF
AL
CO
CH
CR
EE
EG
EH
ES
FA
GN
HR
ICLD
LS
MS
NE
NS
OD
PA
PB
PH
<6
4.7
34.7
44.4
34.9
14.8
34.6
94.6
84.8
54.4
44.9
14.7
44.7
15.0
34.8
15.0
74.9
84.9
64.1
34.4
15.0
04.6
54.7
14.7
44.4
6
1910
42
76
169
24
115
152
176
102
98
175
105
61
122
61
128
74
45
44
720
62
39
13
1.0
61.3
20.9
70.9
21.2
91.2
00.9
21.3
00.9
41.0
31.2
20.8
71.1
70.9
60.9
70.9
71.4
11.2
30.5
81.2
31.4
21.0
21.4
5
Question
Avg
Mn
AF
AL
CO
CH
CR
EE
EG
EH
ES
FA
GN
HR
ICLD
LS
MS
NE
NS
OD
PA
PB
PH
<6
4.6
84.8
44.2
94.6
44.6
84.5
24.5
04.7
04.6
94.8
34.7
64.7
74.8
84.9
04.7
74.9
04.5
34.3
24.4
65.0
04.3
34.8
34.6
84.9
3
1956
44
77
175
25
120
158
182
98
102
174
107
65
121
62
127
74
47
46
821
69
40
14
0.8
61.4
81.2
41.1
11.4
51.3
01.2
31.1
41.1
11.1
31.1
70.9
31.1
91.2
51.1
51.3
11.4
21.3
80.5
31.5
31.3
60.9
40.8
3
2.
Superv
isor
Accounta
bility F
ocus
2.1
. M
y s
uperv
isor
hold
s p
eople
accounta
ble
for
meeting
deadlines.
2.2
. M
y s
uperv
isor
str
ives t
o im
pro
ve t
he
perf
orm
ance o
f m
y
work
gro
up.
2.3
. M
y s
uperv
isor
hold
s p
eople
accounta
ble
for
pro
ducin
g q
uality
work
.
2.4
. M
y s
uperv
isor
monitors
pro
gre
ss
tow
ard
sta
ted g
oals
.
Supe
rvis
or A
ccou
ntab
ility
Foc
us: A
ll D
ivis
ions
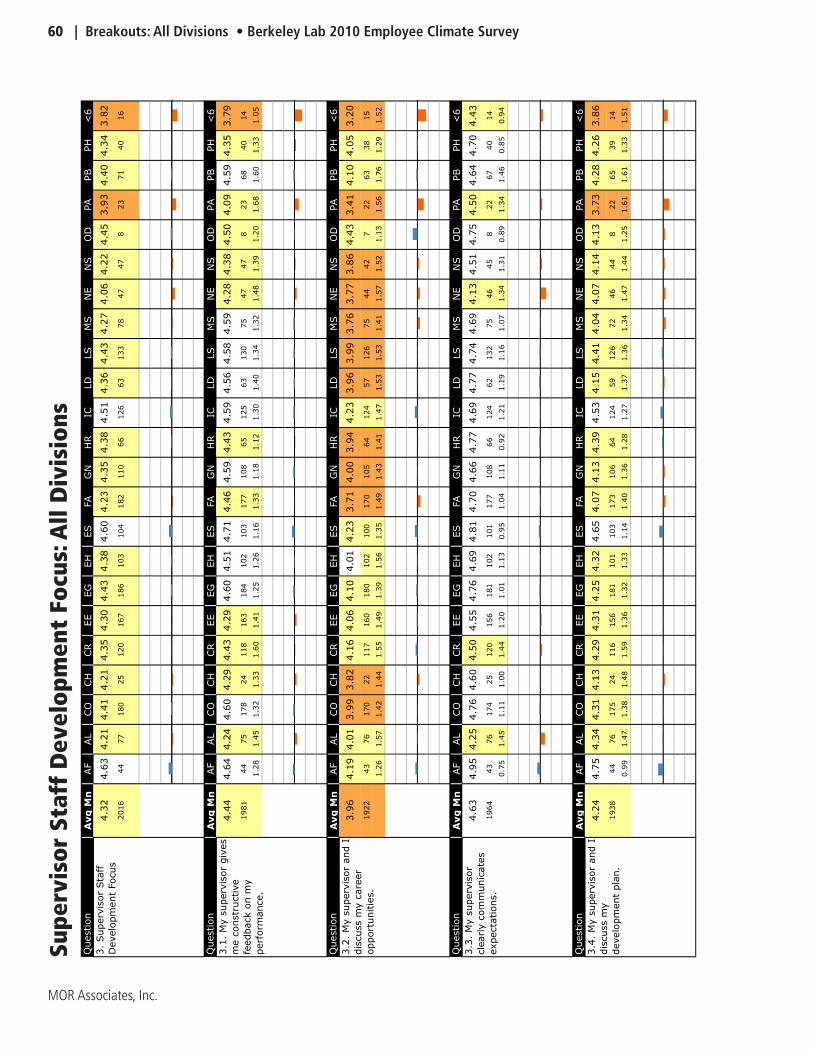
60 | Breakouts: All Divisions • Berkeley Lab 2010 Employee Climate Survey
MOR Associates, Inc.
Question
Avg
Mn
AF
AL
CO
CH
CR
EE
EG
EH
ES
FA
GN
HR
ICLD
LS
MS
NE
NS
OD
PA
PB
PH
<6
4.3
24.6
34.2
14.4
14.2
14.3
54.3
04.4
34.3
84.6
04.2
34.3
54.3
84.5
14.3
64.4
34.2
74.0
64.2
24.4
53.9
34.4
04.3
43.8
2
2016
44
77
180
25
120
167
186
103
104
182
110
66
126
63
133
78
47
47
823
71
40
16
Question
Avg
Mn
AF
AL
CO
CH
CR
EE
EG
EH
ES
FA
GN
HR
ICLD
LS
MS
NE
NS
OD
PA
PB
PH
<6
4.4
44.6
44.2
44.6
04.2
94.4
34.2
94.6
04.5
14.7
14.4
64.5
94.4
34.5
94.5
64.5
84.5
94.2
84.3
84.5
04.0
94.5
94.3
53.7
9
1981
44
75
178
24
118
163
184
102
103
177
108
65
125
63
130
75
47
47
823
68
40
14
1.2
81.4
51.3
21.3
31.6
01.4
11.2
51.2
61.1
61.3
31.1
81.1
21.3
01.4
01.3
41.3
21.4
81.3
91.2
01.6
81.6
01.3
31.0
5
Question
Avg
Mn
AF
AL
CO
CH
CR
EE
EG
EH
ES
FA
GN
HR
ICLD
LS
MS
NE
NS
OD
PA
PB
PH
<6
3.9
64.1
94.0
13.9
93.8
24.1
64.0
64.1
04.0
14.2
33.7
14.0
03.9
44.2
33.9
63.9
93.7
63.7
73.8
64.4
33.4
14.1
04.0
53.2
0
1922
43
76
170
22
117
160
180
102
100
170
105
64
124
57
126
75
44
42
722
63
38
15
1.2
61.5
71.4
21.4
41.5
51.4
91.3
91.5
61.3
51.4
91.4
31.4
11.4
71.5
31.5
31.4
11.5
71.5
21.1
31.5
61.7
61.2
91.5
2
Question
Avg
Mn
AF
AL
CO
CH
CR
EE
EG
EH
ES
FA
GN
HR
ICLD
LS
MS
NE
NS
OD
PA
PB
PH
<6
4.6
34.9
54.2
54.7
64.6
04.5
04.5
54.7
64.6
94.8
14.7
04.6
64.7
74.6
94.7
74.7
44.6
94.1
34.5
14.7
54.5
04.6
44.7
04.4
3
1964
43
76
174
25
120
156
181
102
101
177
108
66
124
62
132
75
46
45
822
67
40
14
0.7
51.4
51.1
11.0
01.4
41.2
01.0
11.1
30.9
51.0
41.1
10.9
21.2
11.1
91.1
61.0
71.3
41.3
10.8
91.3
41.4
60.8
50.9
4
Question
Avg
Mn
AF
AL
CO
CH
CR
EE
EG
EH
ES
FA
GN
HR
ICLD
LS
MS
NE
NS
OD
PA
PB
PH
<6
4.2
44.7
54.3
44.3
14.1
34.2
94.3
14.2
54.3
24.6
54.0
74.1
34.3
94.5
34.1
54.4
14.0
44.0
74.1
44.1
33.7
34.2
84.2
63.8
6
1938
44
76
175
24
116
156
181
101
103
173
106
64
124
59
126
72
46
44
822
65
39
14
0.9
91.4
71.3
81.4
81.5
91.3
61.3
21.3
31.1
41.4
01.3
61.2
81.2
71.3
71.3
61.3
41.4
71.4
41.2
51.6
11.6
11.3
31.5
1
3.
Superv
isor
Sta
ff
Develo
pm
ent
Focus
3.1
. M
y s
uperv
isor
giv
es
me c
onstr
uctive
feedback o
n m
y
perf
orm
ance.
3.2
. M
y s
uperv
isor
and I
dis
cuss m
y c
are
er
opport
unitie
s.
3.3
. M
y s
uperv
isor
cle
arly c
om
munic
ate
s
expecta
tions.
3.4
. M
y s
uperv
isor
and I
dis
cuss m
y
develo
pm
ent
pla
n.
Supe
rvis
or S
taff
Dev
elop
men
t Fo
cus:
All
Div
isio
ns
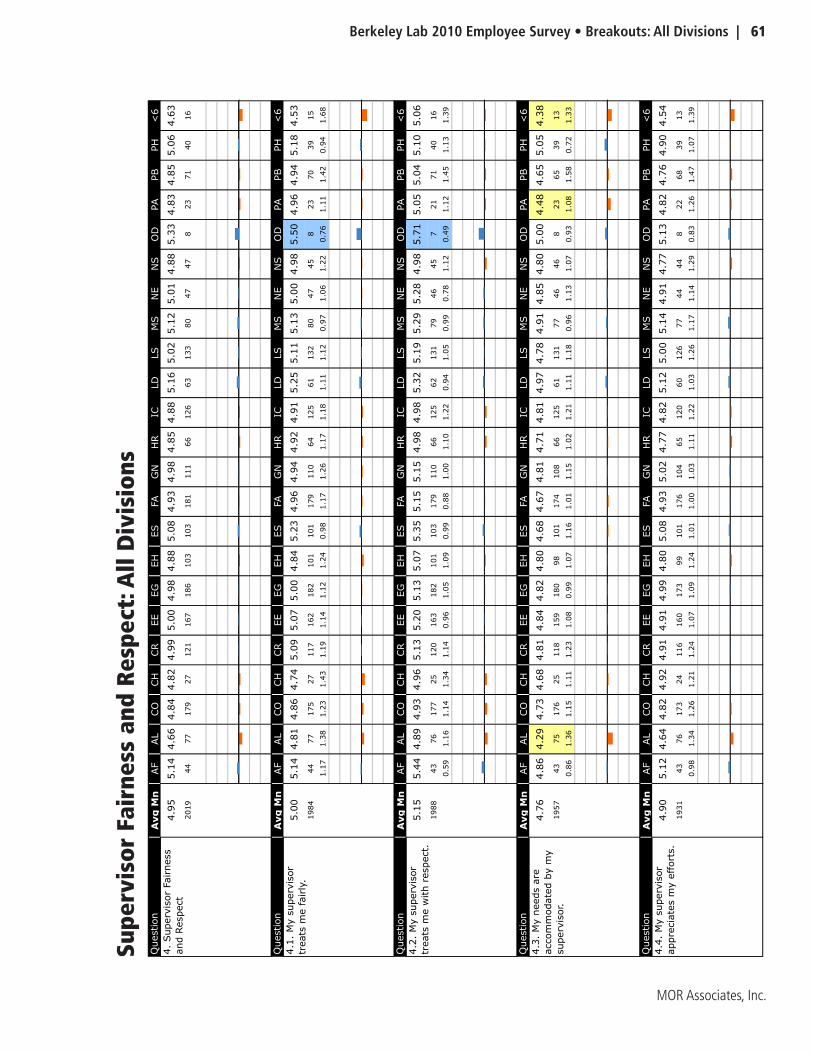
Berkeley Lab 2010 Employee Survey • Breakouts: All Divisions | 61
MOR Associates, Inc.
Question
Avg
Mn
AF
AL
CO
CH
CR
EE
EG
EH
ES
FA
GN
HR
ICLD
LS
MS
NE
NS
OD
PA
PB
PH
<6
4.9
55.1
44.6
64.8
44.8
24.9
95.0
04.9
84.8
85.0
84.9
34.9
84.8
54.8
85.1
65.0
25.1
25.0
14.8
85.3
34.8
34.8
55.0
64.6
3
2019
44
77
179
27
121
167
186
103
103
181
111
66
126
63
133
80
47
47
823
71
40
16
Question
Avg
Mn
AF
AL
CO
CH
CR
EE
EG
EH
ES
FA
GN
HR
ICLD
LS
MS
NE
NS
OD
PA
PB
PH
<6
5.0
05.1
44.8
14.8
64.7
45.0
95.0
75.0
04.8
45.2
34.9
64.9
44.9
24.9
15.2
55.1
15.1
35.0
04.9
85.5
04.9
64.9
45.1
84.5
3
1984
44
77
175
27
117
162
182
101
101
179
110
64
125
61
132
80
47
45
823
70
39
15
1.1
71.3
81.2
31.4
31.1
91.1
41.1
21.2
40.9
81.1
71.2
61.1
71.1
81.1
11.1
20.9
71.0
61.2
20.7
61.1
11.4
20.9
41.6
8
Question
Avg
Mn
AF
AL
CO
CH
CR
EE
EG
EH
ES
FA
GN
HR
ICLD
LS
MS
NE
NS
OD
PA
PB
PH
<6
5.1
55.4
44.8
94.9
34.9
65.1
35.2
05.1
35.0
75.3
55.1
55.1
54.9
84.9
85.3
25.1
95.2
95.2
84.9
85.7
15.0
55.0
45.1
05.0
6
1988
43
76
177
25
120
163
182
101
103
179
110
66
125
62
131
79
46
45
721
71
40
16
0.5
91.1
61.1
41.3
41.1
40.9
61.0
51.0
90.9
90.8
81.0
01.1
01.2
20.9
41.0
50.9
90.7
81.1
20.4
91.1
21.4
51.1
31.3
9
Question
Avg
Mn
AF
AL
CO
CH
CR
EE
EG
EH
ES
FA
GN
HR
ICLD
LS
MS
NE
NS
OD
PA
PB
PH
<6
4.7
64.8
64.2
94.7
34.6
84.8
14.8
44.8
24.8
04.6
84.6
74.8
14.7
14.8
14.9
74.7
84.9
14.8
54.8
05.0
04.4
84.6
55.0
54.3
8
1957
43
75
176
25
118
159
180
98
101
174
108
66
125
61
131
77
46
46
823
65
39
13
0.8
61.3
61.1
51.1
11.2
31.0
80.9
91.0
71.1
61.0
11.1
51.0
21.2
11.1
11.1
80.9
61.1
31.0
70.9
31.0
81.5
80.7
21.3
3
Question
Avg
Mn
AF
AL
CO
CH
CR
EE
EG
EH
ES
FA
GN
HR
ICLD
LS
MS
NE
NS
OD
PA
PB
PH
<6
4.9
05.1
24.6
44.8
24.9
24.9
14.9
14.9
94.8
05.0
84.9
35.0
24.7
74.8
25.1
25.0
05.1
44.9
14.7
75.1
34.8
24.7
64.9
04.5
4
1931
43
76
173
24
116
160
173
99
101
176
104
65
120
60
126
77
44
44
822
68
39
13
0.9
81.3
41.2
61.2
11.2
41.0
71.0
91.2
41.0
11.0
01.0
31.1
11.2
21.0
31.2
61.1
71.1
41.2
90.8
31.2
61.4
71.0
71.3
9
4.
Superv
isor
Fairness
and R
espect
4.1
. M
y s
uperv
isor
treats
me f
airly
.
4.2
. M
y s
uperv
isor
treats
me w
ith r
espect.
4.3
. M
y n
eeds a
re
accom
modate
d b
y m
y
superv
isor.
4.4
. M
y s
uperv
isor
appre
cia
tes m
y e
ffort
s.
Supe
rvis
or F
airn
ess
and
Res
pect
: All
Div
isio
ns
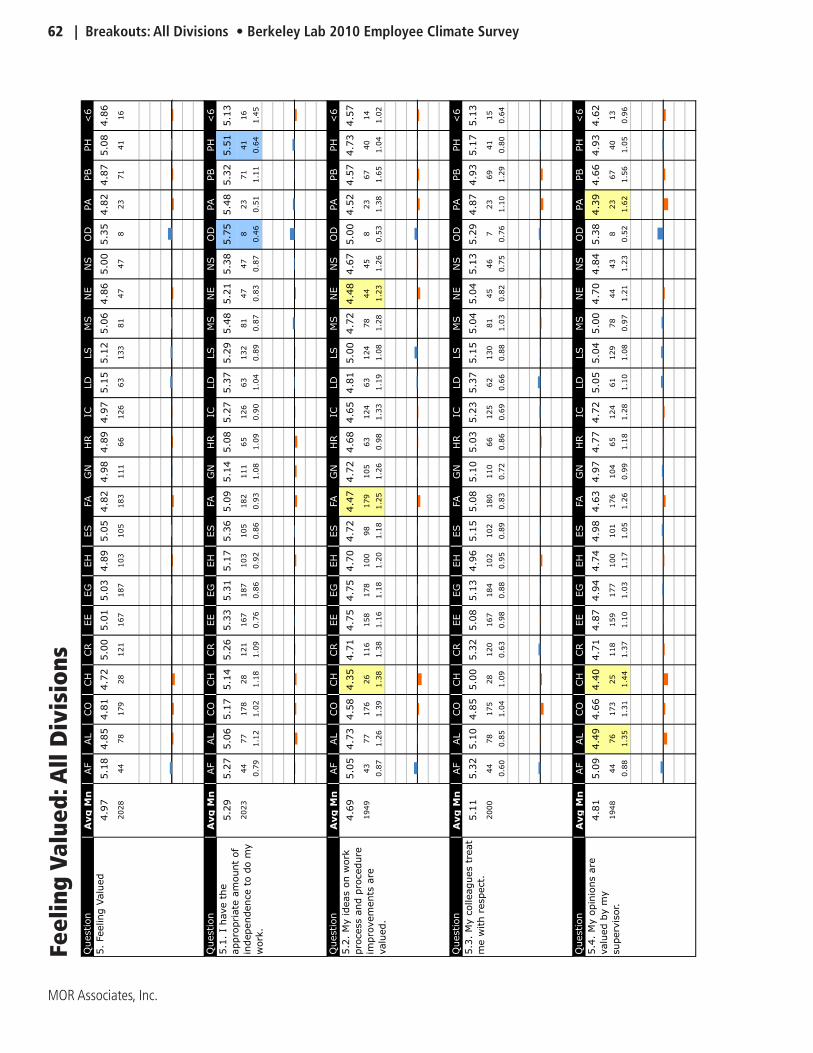
62 | Breakouts: All Divisions • Berkeley Lab 2010 Employee Climate Survey
MOR Associates, Inc.
Question
Avg
Mn
AF
AL
CO
CH
CR
EE
EG
EH
ES
FA
GN
HR
ICLD
LS
MS
NE
NS
OD
PA
PB
PH
<6
4.9
75.1
84.8
54.8
14.7
25.0
05.0
15.0
34.8
95.0
54.8
24.9
84.8
94.9
75.1
55.1
25.0
64.8
65.0
05.3
54.8
24.8
75.0
84.8
6
2028
44
78
179
28
121
167
187
103
105
183
111
66
126
63
133
81
47
47
823
71
41
16
Question
Avg
Mn
AF
AL
CO
CH
CR
EE
EG
EH
ES
FA
GN
HR
ICLD
LS
MS
NE
NS
OD
PA
PB
PH
<6
5.2
95.2
75.0
65.1
75.1
45.2
65.3
35.3
15.1
75.3
65.0
95.1
45.0
85.2
75.3
75.2
95.4
85.2
15.3
85.7
55.4
85.3
25.5
15.1
3
2023
44
77
178
28
121
167
187
103
105
182
111
65
126
63
132
81
47
47
823
71
41
16
0.7
91.1
21.0
21.1
81.0
90.7
60.8
60.9
20.8
60.9
31.0
81.0
90.9
01.0
40.8
90.8
70.8
30.8
70.4
60.5
11.1
10.6
41.4
5
Question
Avg
Mn
AF
AL
CO
CH
CR
EE
EG
EH
ES
FA
GN
HR
ICLD
LS
MS
NE
NS
OD
PA
PB
PH
<6
4.6
95.0
54.7
34.5
84.3
54.7
14.7
54.7
54.7
04.7
24.4
74.7
24.6
84.6
54.8
15.0
04.7
24.4
84.6
75.0
04.5
24.5
74.7
34.5
7
1949
43
77
176
26
116
158
178
100
98
179
105
63
124
63
124
78
44
45
823
67
40
14
0.8
71.2
61.3
91.3
81.3
81.1
61.1
81.2
01.1
81.2
51.2
60.9
81.3
31.1
91.0
81.2
81.2
31.2
60.5
31.3
81.6
51.0
41.0
2
Question
Avg
Mn
AF
AL
CO
CH
CR
EE
EG
EH
ES
FA
GN
HR
ICLD
LS
MS
NE
NS
OD
PA
PB
PH
<6
5.1
15.3
25.1
04.8
55.0
05.3
25.0
85.1
34.9
65.1
55.0
85.1
05.0
35.2
35.3
75.1
55.0
45.0
45.1
35.2
94.8
74.9
35.1
75.1
3
2000
44
78
175
28
120
167
184
102
102
180
110
66
125
62
130
81
45
46
723
69
41
15
0.6
00.8
51.0
41.0
90.6
30.9
80.8
80.9
50.8
90.8
30.7
20.8
60.6
90.6
60.8
81.0
30.8
20.7
50.7
61.1
01.2
90.8
00.6
4
Question
Avg
Mn
AF
AL
CO
CH
CR
EE
EG
EH
ES
FA
GN
HR
ICLD
LS
MS
NE
NS
OD
PA
PB
PH
<6
4.8
15.0
94.4
94.6
64.4
04.7
14.8
74.9
44.7
44.9
84.6
34.9
74.7
74.7
25.0
55.0
45.0
04.7
04.8
45.3
84.3
94.6
64.9
34.6
2
1948
44
76
173
25
118
159
177
100
101
176
104
65
124
61
129
78
44
43
823
67
40
13
0.8
81.3
51.3
11.4
41.3
71.1
01.0
31.1
71.0
51.2
60.9
91.1
81.2
81.1
01.0
80.9
71.2
11.2
30.5
21.6
21.5
61.0
50.9
6
5.
Feeling V
alu
ed
5.1
. I
have t
he
appro
priate
am
ount
of
independence t
o d
o m
y
work
.
5.2
. M
y ideas o
n w
ork
pro
cess a
nd p
rocedure
impro
vem
ents
are
valu
ed.
5.3
. M
y c
olleagues t
reat
me w
ith r
espect.
5.4
. M
y o
pin
ions a
re
valu
ed b
y m
y
superv
isor.
Feel
ing
Valu
ed: A
ll D
ivis
ions
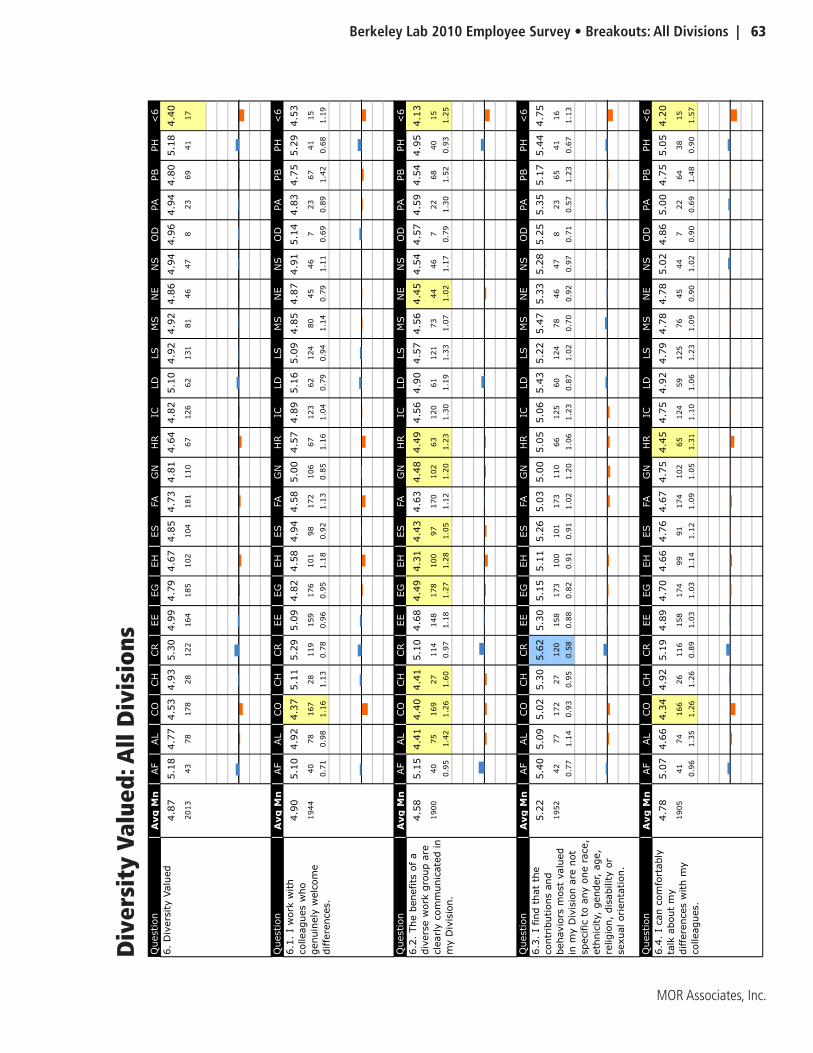
Berkeley Lab 2010 Employee Survey • Breakouts: All Divisions | 63
MOR Associates, Inc.
Question
Avg
Mn
AF
AL
CO
CH
CR
EE
EG
EH
ES
FA
GN
HR
ICLD
LS
MS
NE
NS
OD
PA
PB
PH
<6
4.8
75.1
84.7
74.5
34.9
35.3
04.9
94.7
94.6
74.8
54.7
34.8
14.6
44.8
25.1
04.9
24.9
24.8
64.9
44.9
64.9
44.8
05.1
84.4
0
2013
43
78
178
28
122
164
185
102
104
181
110
67
126
62
131
81
46
47
823
69
41
17
Question
Avg
Mn
AF
AL
CO
CH
CR
EE
EG
EH
ES
FA
GN
HR
ICLD
LS
MS
NE
NS
OD
PA
PB
PH
<6
4.9
05.1
04.9
24.3
75.1
15.2
95.0
94.8
24.5
84.9
44.5
85.0
04.5
74.8
95.1
65.0
94.8
54.8
74.9
15.1
44.8
34.7
55.2
94.5
3
1944
40
78
167
28
119
159
176
101
98
172
106
67
123
62
124
80
45
46
723
67
41
15
0.7
10.9
81.1
61.1
30.7
80.9
60.9
51.1
80.9
21.1
30.8
51.1
61.0
40.7
90.9
41.1
40.7
91.1
10.6
90.8
91.4
20.6
81.1
9
Question
Avg
Mn
AF
AL
CO
CH
CR
EE
EG
EH
ES
FA
GN
HR
ICLD
LS
MS
NE
NS
OD
PA
PB
PH
<6
4.5
85.1
54.4
14.4
04.4
15.1
04.6
84.4
94.3
14.4
34.6
34.4
84.4
94.5
64.9
04.5
74.5
64.4
54.5
44.5
74.5
94.5
44.9
54.1
3
1900
40
75
169
27
114
148
178
100
97
170
102
63
120
61
121
73
44
46
722
68
40
15
0.9
51.4
21.2
61.6
00.9
71.1
81.2
71.2
81.0
51.1
21.2
01.2
31.3
01.1
91.3
31.0
71.0
21.1
70.7
91.3
01.5
20.9
31.2
5
Question
Avg
Mn
AF
AL
CO
CH
CR
EE
EG
EH
ES
FA
GN
HR
ICLD
LS
MS
NE
NS
OD
PA
PB
PH
<6
5.2
25.4
05.0
95.0
25.3
05.6
25.3
05.1
55.1
15.2
65.0
35.0
05.0
55.0
65.4
35.2
25.4
75.3
35.2
85.2
55.3
55.1
75.4
44.7
5
1952
42
77
172
27
120
158
173
100
101
173
110
66
125
60
124
78
46
47
823
65
41
16
0.7
71.1
40.9
30.9
50.5
80.8
80.8
20.9
10.9
11.0
21.2
01.0
61.2
30.8
71.0
20.7
00.9
20.9
70.7
10.5
71.2
30.6
71.1
3
Question
Avg
Mn
AF
AL
CO
CH
CR
EE
EG
EH
ES
FA
GN
HR
ICLD
LS
MS
NE
NS
OD
PA
PB
PH
<6
4.7
85.0
74.6
64.3
44.9
25.1
94.8
94.7
04.6
64.7
64.6
74.7
54.4
54.7
54.9
24.7
94.7
84.7
85.0
24.8
65.0
04.7
55.0
54.2
0
1905
41
74
166
26
116
158
174
99
91
174
102
65
124
59
125
76
45
44
722
64
38
15
0.9
61.3
51.2
61.2
60.8
91.0
31.0
31.1
41.1
21.0
91.0
51.3
11.1
01.0
61.2
31.0
90.9
01.0
20.9
00.6
91.4
80.9
01.5
7
6.
Div
ers
ity V
alu
ed
6.1
. I
work
with
colleagues w
ho
genuin
ely
welc
om
e
diffe
rences.
6.2
. The b
enefits
of
a
div
ers
e w
ork
gro
up a
re
cle
arly c
om
munic
ate
d in
my D
ivis
ion.
6.3
. I
find t
hat
the
contr
ibutions a
nd
behavio
rs m
ost
valu
ed
in m
y D
ivis
ion a
re n
ot
specific
to a
ny o
ne r
ace,
eth
nic
ity,
gender, a
ge,
religio
n,
dis
ability o
r
sexual orienta
tion.
6.4
. I
can c
om
fort
ably
talk
about
my
diffe
rences w
ith m
y
colleagues.
Div
ersi
ty V
alue
d: A
ll D
ivis
ions
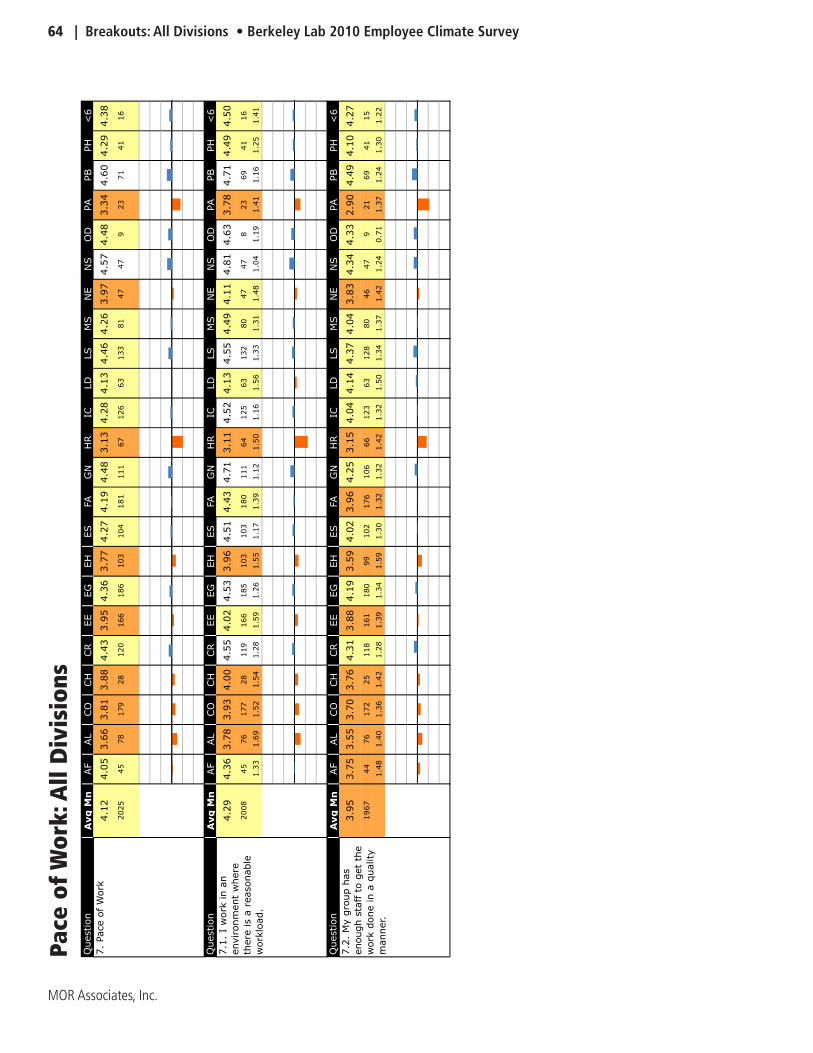
64 | Breakouts: All Divisions • Berkeley Lab 2010 Employee Climate Survey
MOR Associates, Inc.
Question
Avg
Mn
AF
AL
CO
CH
CR
EE
EG
EH
ES
FA
GN
HR
ICLD
LS
MS
NE
NS
OD
PA
PB
PH
<6
4.1
24.0
53.6
63.8
13.8
84.4
33.9
54.3
63.7
74.2
74.1
94.4
83.1
34.2
84.1
34.4
64.2
63.9
74.5
74.4
83.3
44.6
04.2
94.3
8
2025
45
78
179
28
120
166
186
103
104
181
111
67
126
63
133
81
47
47
923
71
41
16
Question
Avg
Mn
AF
AL
CO
CH
CR
EE
EG
EH
ES
FA
GN
HR
ICLD
LS
MS
NE
NS
OD
PA
PB
PH
<6
4.2
94.3
63.7
83.9
34.0
04.5
54.0
24.5
33.9
64.5
14.4
34.7
13.1
14.5
24.1
34.5
54.4
94.1
14.8
14.6
33.7
84.7
14.4
94.5
0
2008
45
76
177
28
119
166
185
103
103
180
111
64
125
63
132
80
47
47
823
69
41
16
1.3
31.6
91.5
21.5
41.2
81.5
91.2
61.5
51.1
71.3
91.1
21.5
01.1
61.5
61.3
31.3
11.4
81.0
41.1
91.4
11.1
61.2
51.4
1
Question
Avg
Mn
AF
AL
CO
CH
CR
EE
EG
EH
ES
FA
GN
HR
ICLD
LS
MS
NE
NS
OD
PA
PB
PH
<6
3.9
53.7
53.5
53.7
03.7
64.3
13.8
84.1
93.5
94.0
23.9
64.2
53.1
54.0
44.1
44.3
74.0
43.8
34.3
44.3
32.9
04.4
94.1
04.2
7
1967
44
76
172
25
118
161
180
99
102
176
106
66
123
63
128
80
46
47
921
69
41
15
1.4
81.4
01.3
61.4
21.2
81.3
91.3
41.5
91.3
01.3
21.3
21.4
21.3
21.5
01.3
41.3
71.4
21.2
40.7
11.3
71.2
41.3
01.2
2
7.
Pace o
f W
ork
7.1
. I
work
in a
n
environm
ent
where
there
is a
reasonable
work
load.
7.2
. M
y g
roup h
as
enough s
taff
to g
et
the
work
done in a
quality
manner.
Pace
of
Wor
k: A
ll D
ivis
ions

Berkeley Lab 2010 Employee Survey • Breakouts: All Divisions | 65
MOR Associates, Inc.
Question
Avg
Mn
AF
AL
CO
CH
CR
EE
EG
EH
ES
FA
GN
HR
ICLD
LS
MS
NE
NS
OD
PA
PB
PH
<6
5.3
15.3
45.1
35.3
15.2
55.4
95.1
85.2
45.3
45.3
95.3
55.3
45.2
65.3
65.4
55.2
65.3
75.2
35.2
95.4
75.3
15.3
95.3
15.0
4
2034
44
78
179
28
123
167
187
103
104
184
111
67
126
63
133
81
47
47
823
73
41
17
Question
Avg
Mn
AF
AL
CO
CH
CR
EE
EG
EH
ES
FA
GN
HR
ICLD
LS
MS
NE
NS
OD
PA
PB
PH
<6
5.4
25.4
35.1
95.4
55.4
35.6
15.4
05.2
95.3
55.5
65.3
95.4
95.4
35.5
75.5
15.4
15.5
25.3
75.3
05.3
85.5
75.5
05.4
95.1
2
2011
44
77
178
28
123
164
185
102
104
184
109
65
123
63
129
79
46
47
823
72
41
17
0.5
50.8
00.7
40.6
90.5
50.8
60.7
20.7
00.6
50.7
80.7
20.5
60.6
30.5
60.6
20.6
40.6
10.7
80.7
40.5
90.6
30.5
11.2
2
Question
Avg
Mn
AF
AL
CO
CH
CR
EE
EG
EH
ES
FA
GN
HR
ICLD
LS
MS
NE
NS
OD
PA
PB
PH
<6
5.1
55.1
14.9
65.1
84.9
65.3
55.1
05.0
45.1
55.1
65.1
15.2
15.1
85.1
75.3
95.0
45.1
35.2
55.1
75.5
05.1
35.2
15.1
04.7
6
1992
44
77
177
26
118
162
186
103
103
179
109
66
123
62
131
80
44
46
623
70
40
17
0.7
50.9
20.8
10.7
20.8
20.9
70.9
60.8
70.8
00.9
40.8
10.6
10.8
50.6
61.0
30.8
50.5
30.8
80.5
50.8
10.8
80.7
81.3
5
Question
Avg
Mn
AF
AL
CO
CH
CR
EE
EG
EH
ES
FA
GN
HR
ICLD
LS
MS
NE
NS
OD
PA
PB
PH
<6
5.3
65.4
75.2
15.3
25.3
75.4
35.0
75.3
95.5
15.4
75.5
45.3
25.1
45.3
05.4
85.3
35.4
75.0
75.3
35.7
15.2
25.4
75.1
85.4
1
1999
43
78
177
27
120
162
185
102
103
181
109
66
125
61
132
81
45
46
723
70
39
17
0.5
90.9
20.7
00.6
90.6
40.7
90.7
10.6
60.5
90.5
30.6
40.6
80.8
50.5
70.7
30.6
10.7
50.7
00.4
90.7
40.7
40.6
00.7
1
Question
Avg
Mn
AF
AL
CO
CH
CR
EE
EG
EH
ES
FA
GN
HR
ICLD
LS
MS
NE
NS
OD
PA
PB
PH
<6
5.3
15.3
65.1
75.2
95.2
25.5
75.1
65.2
45.3
75.3
95.3
75.3
65.3
05.4
05.4
25.2
75.3
85.2
25.3
75.2
95.3
25.3
95.4
64.8
8
2003
44
78
176
27
121
164
186
103
104
180
108
67
124
62
131
80
45
46
722
70
41
17
0.5
30.7
80.7
50.6
40.5
50.9
30.7
70.6
60.7
60.6
90.6
50.6
00.7
90.7
80.8
60.6
60.7
00.6
80.4
90.7
20.7
90.5
51.1
7
8.2
. I
feel safe
in
conducting m
y w
ork
because o
f th
e
Labora
tory
's s
afe
ty
pra
ctices.
8.3
. Safe
ty is a
n
import
ant
core
valu
e in
my g
roup.
8.4
. M
y r
ights
regard
ing
safe
ty h
ave b
een c
learly
com
munic
ate
d t
o m
e.
8.
Safe
ty
8.1
. M
y r
esponsib
ilitie
s
rela
ted t
o s
afe
ty h
ave
been c
learly
com
munic
ate
d t
o m
e.
Safe
ty: A
ll D
ivis
ions
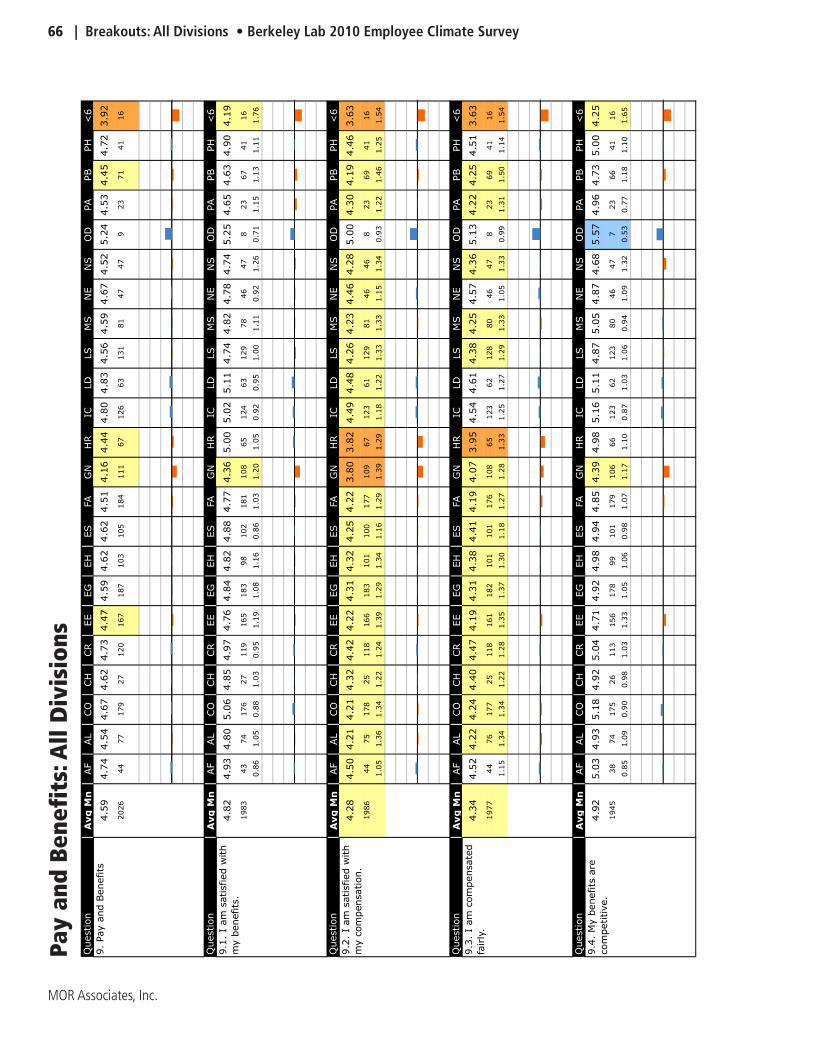
66 | Breakouts: All Divisions • Berkeley Lab 2010 Employee Climate Survey
MOR Associates, Inc.
Question
Avg
Mn
AF
AL
CO
CH
CR
EE
EG
EH
ES
FA
GN
HR
ICLD
LS
MS
NE
NS
OD
PA
PB
PH
<6
4.5
94.7
44.5
44.6
74.6
24.7
34.4
74.5
94.6
24.6
24.5
14.1
64.4
44.8
04.8
34.5
64.5
94.6
74.5
25.2
44.5
34.4
54.7
23.9
2
2026
44
77
179
27
120
167
187
103
105
184
111
67
126
63
131
81
47
47
923
71
41
16
Question
Avg
Mn
AF
AL
CO
CH
CR
EE
EG
EH
ES
FA
GN
HR
ICLD
LS
MS
NE
NS
OD
PA
PB
PH
<6
4.8
24.9
34.8
05.0
64.8
54.9
74.7
64.8
44.8
24.8
84.7
74.3
65.0
05.0
25.1
14.7
44.8
24.7
84.7
45.2
54.6
54.6
34.9
04.1
9
1983
43
74
176
27
119
165
183
98
102
181
108
65
124
63
129
78
46
47
823
67
41
16
0.8
61.0
50.8
81.0
30.9
51.1
91.0
81.1
60.8
61.0
31.2
01.0
50.9
20.9
51.0
01.1
10.9
21.2
60.7
11.1
51.1
31.1
11.7
6
Question
Avg
Mn
AF
AL
CO
CH
CR
EE
EG
EH
ES
FA
GN
HR
ICLD
LS
MS
NE
NS
OD
PA
PB
PH
<6
4.2
84.5
04.2
14.2
14.3
24.4
24.2
24.3
14.3
24.2
54.2
23.8
03.8
24.4
94.4
84.2
64.2
34.4
64.2
85.0
04.3
04.1
94.4
63.6
3
1986
44
75
178
25
118
166
183
101
100
177
109
67
123
61
129
81
46
46
823
69
41
16
1.0
51.3
61.3
41.2
21.2
41.3
91.2
91.3
41.1
61.2
91.3
91.2
91.1
81.2
21.3
31.3
31.1
51.3
40.9
31.2
21.4
61.2
51.5
4
Question
Avg
Mn
AF
AL
CO
CH
CR
EE
EG
EH
ES
FA
GN
HR
ICLD
LS
MS
NE
NS
OD
PA
PB
PH
<6
4.3
44.5
24.2
24.2
44.4
04.4
74.1
94.3
14.3
84.4
14.1
94.0
73.9
54.5
44.6
14.3
84.2
54.5
74.3
65.1
34.2
24.2
54.5
13.6
3
1977
44
76
177
25
118
161
182
101
101
176
108
65
123
62
128
80
46
47
823
69
41
16
1.1
51.3
41.3
41.2
21.2
81.3
51.3
71.3
01.1
81.2
71.2
81.3
31.2
51.2
71.2
91.3
31.0
51.3
30.9
91.3
11.5
01.1
41.5
4
Question
Avg
Mn
AF
AL
CO
CH
CR
EE
EG
EH
ES
FA
GN
HR
ICLD
LS
MS
NE
NS
OD
PA
PB
PH
<6
4.9
25.0
34.9
35.1
84.9
25.0
44.7
14.9
24.9
84.9
44.8
54.3
94.9
85.1
65.1
14.8
75.0
54.8
74.6
85.5
74.9
64.7
35.0
04.2
5
1945
38
74
175
26
113
156
178
99
101
179
106
66
123
62
123
80
46
47
723
66
41
16
0.8
51.0
90.9
00.9
81.0
31.3
31.0
51.0
60.9
81.0
71.1
71.1
00.8
71.0
31.0
60.9
41.0
91.3
20.5
30.7
71.1
81.1
01.6
5
9.4
. M
y b
enefits
are
com
petitive.
9.
Pay a
nd B
enefits
9.1
. I
am
satisfied w
ith
my b
enefits
.
9.2
. I
am
satisfied w
ith
my c
om
pensation.
9.3
. I
am
com
pensate
d
fairly
.
Pay
and
Bene
fits
: All
Div
isio
ns
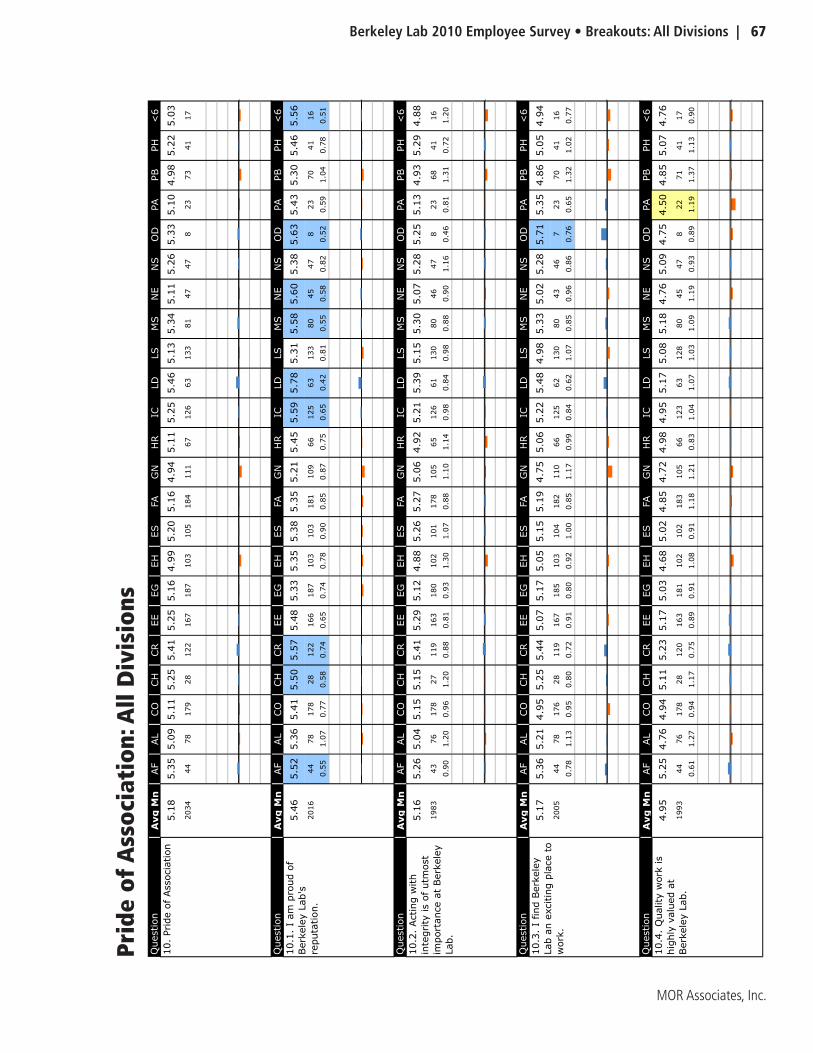
Berkeley Lab 2010 Employee Survey • Breakouts: All Divisions | 67
MOR Associates, Inc.
Question
Avg
Mn
AF
AL
CO
CH
CR
EE
EG
EH
ES
FA
GN
HR
ICLD
LS
MS
NE
NS
OD
PA
PB
PH
<6
5.1
85.3
55.0
95.1
15.2
55.4
15.2
55.1
64.9
95.2
05.1
64.9
45.1
15.2
55.4
65.1
35.3
45.1
15.2
65.3
35.1
04.9
85.2
25.0
3
2034
44
78
179
28
122
167
187
103
105
184
111
67
126
63
133
81
47
47
823
73
41
17
Question
Avg
Mn
AF
AL
CO
CH
CR
EE
EG
EH
ES
FA
GN
HR
ICLD
LS
MS
NE
NS
OD
PA
PB
PH
<6
5.4
65.5
25.3
65.4
15.5
05.5
75.4
85.3
35.3
55.3
85.3
55.2
15.4
55.5
95.7
85.3
15.5
85.6
05.3
85.6
35.4
35.3
05.4
65.5
6
2016
44
78
178
28
122
166
187
103
103
181
109
66
125
63
133
80
45
47
823
70
41
16
0.5
51.0
70.7
70.5
80.7
40.6
50.7
40.7
80.9
00.8
50.8
70.7
50.6
50.4
20.8
10.5
50.5
80.8
20.5
20.5
91.0
40.7
80.5
1
Question
Avg
Mn
AF
AL
CO
CH
CR
EE
EG
EH
ES
FA
GN
HR
ICLD
LS
MS
NE
NS
OD
PA
PB
PH
<6
5.1
65.2
65.0
45.1
55.1
55.4
15.2
95.1
24.8
85.2
65.2
75.0
64.9
25.2
15.3
95.1
55.3
05.0
75.2
85.2
55.1
34.9
35.2
94.8
8
1983
43
76
178
27
119
163
180
102
101
178
105
65
126
61
130
80
46
47
823
68
41
16
0.9
01.2
00.9
61.2
00.8
80.8
10.9
31.3
01.0
70.8
81.1
01.1
40.9
80.8
40.9
80.8
80.9
01.1
60.4
60.8
11.3
10.7
21.2
0
Question
Avg
Mn
AF
AL
CO
CH
CR
EE
EG
EH
ES
FA
GN
HR
ICLD
LS
MS
NE
NS
OD
PA
PB
PH
<6
5.1
75.3
65.2
14.9
55.2
55.4
45.0
75.1
75.0
55.1
55.1
94.7
55.0
65.2
25.4
84.9
85.3
35.0
25.2
85.7
15.3
54.8
65.0
54.9
4
2005
44
78
176
28
119
167
185
103
104
182
110
66
125
62
130
80
43
46
723
70
41
16
0.7
81.1
30.9
50.8
00.7
20.9
10.8
00.9
21.0
00.8
51.1
70.9
90.8
40.6
21.0
70.8
50.9
60.8
60.7
60.6
51.3
21.0
20.7
7
Question
Avg
Mn
AF
AL
CO
CH
CR
EE
EG
EH
ES
FA
GN
HR
ICLD
LS
MS
NE
NS
OD
PA
PB
PH
<6
4.9
55.2
54.7
64.9
45.1
15.2
35.1
75.0
34.6
85.0
24.8
54.7
24.9
84.9
55.1
75.0
85.1
84.7
65.0
94.7
54.5
04.8
55.0
74.7
6
1993
44
76
178
28
120
163
181
102
102
183
105
66
123
63
128
80
45
47
822
71
41
17
0.6
11.2
70.9
41.1
70.7
50.8
90.9
11.0
80.9
11.1
81.2
10.8
31.0
41.0
71.0
31.0
91.1
90.9
30.8
91.1
91.3
71.1
30.9
0
10.2
. Acting w
ith
inte
grity
is o
f utm
ost
import
ance a
t Berk
ele
y
Lab.
10.3
. I
find B
erk
ele
y
Lab a
n e
xcitin
g p
lace t
o
work
.
10.4
. Q
uality
work
is
hig
hly
valu
ed a
t
Berk
ele
y L
ab.
10.
Pride o
f Associa
tion
10.1
. I
am
pro
ud o
f
Berk
ele
y L
ab's
reputa
tion.
Prid
e of
Ass
ocia
tion
: All
Div
isio
ns
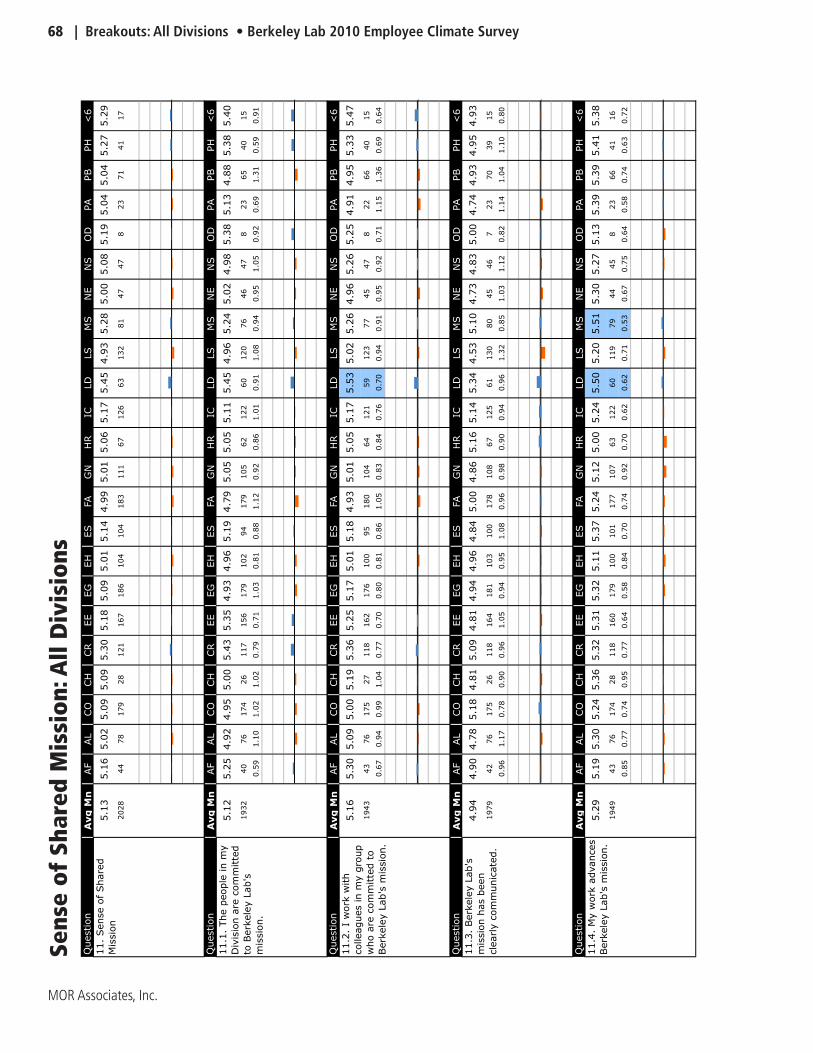
68 | Breakouts: All Divisions • Berkeley Lab 2010 Employee Climate Survey
MOR Associates, Inc.
Question
Avg
Mn
AF
AL
CO
CH
CR
EE
EG
EH
ES
FA
GN
HR
ICLD
LS
MS
NE
NS
OD
PA
PB
PH
<6
5.1
35.1
65.0
25.0
95.0
95.3
05.1
85.0
95.0
15.1
44.9
95.0
15.0
65.1
75.4
54.9
35.2
85.0
05.0
85.1
95.0
45.0
45.2
75.2
9
2028
44
78
179
28
121
167
186
104
104
183
111
67
126
63
132
81
47
47
823
71
41
17
Question
Avg
Mn
AF
AL
CO
CH
CR
EE
EG
EH
ES
FA
GN
HR
ICLD
LS
MS
NE
NS
OD
PA
PB
PH
<6
5.1
25.2
54.9
24.9
55.0
05.4
35.3
54.9
34.9
65.1
94.7
95.0
55.0
55.1
15.4
54.9
65.2
45.0
24.9
85.3
85.1
34.8
85.3
85.4
0
1932
40
76
174
26
117
156
179
102
94
179
105
62
122
60
120
76
46
47
823
65
40
15
0.5
91.1
01.0
21.0
20.7
90.7
11.0
30.8
10.8
81.1
20.9
20.8
61.0
10.9
11.0
80.9
40.9
51.0
50.9
20.6
91.3
10.5
90.9
1
Question
Avg
Mn
AF
AL
CO
CH
CR
EE
EG
EH
ES
FA
GN
HR
ICLD
LS
MS
NE
NS
OD
PA
PB
PH
<6
5.1
65.3
05.0
95.0
05.1
95.3
65.2
55.1
75.0
15.1
84.9
35.0
15.0
55.1
75.5
35.0
25.2
64.9
65.2
65.2
54.9
14.9
55.3
35.4
7
1943
43
76
175
27
118
162
176
100
95
180
104
64
121
59
123
77
45
47
822
66
40
15
0.6
70.9
40.9
91.0
40.7
70.7
00.8
00.8
10.8
61.0
50.8
30.8
40.7
60.7
00.9
40.9
10.9
50.9
20.7
11.1
51.3
60.6
90.6
4
Question
Avg
Mn
AF
AL
CO
CH
CR
EE
EG
EH
ES
FA
GN
HR
ICLD
LS
MS
NE
NS
OD
PA
PB
PH
<6
4.9
44.9
04.7
85.1
84.8
15.0
94.8
14.9
44.9
64.8
45.0
04.8
65.1
65.1
45.3
44.5
35.1
04.7
34.8
35.0
04.7
44.9
34.9
54.9
3
1979
42
76
175
26
118
164
181
103
100
178
108
67
125
61
130
80
45
46
723
70
39
15
0.9
61.1
70.7
80.9
00.9
61.0
50.9
40.9
51.0
80.9
60.9
80.9
00.9
40.9
61.3
20.8
51.0
31.1
20.8
21.1
41.0
41.1
00.8
0
Question
Avg
Mn
AF
AL
CO
CH
CR
EE
EG
EH
ES
FA
GN
HR
ICLD
LS
MS
NE
NS
OD
PA
PB
PH
<6
5.2
95.1
95.3
05.2
45.3
65.3
25.3
15.3
25.1
15.3
75.2
45.1
25.0
05.2
45.5
05.2
05.5
15.3
05.2
75.1
35.3
95.3
95.4
15.3
8
1949
43
76
174
28
118
160
179
100
101
177
107
63
122
60
119
79
44
45
823
66
41
16
0.8
50.7
70.7
40.9
50.7
70.6
40.5
80.8
40.7
00.7
40.9
20.7
00.6
20.6
20.7
10.5
30.6
70.7
50.6
40.5
80.7
40.6
30.7
2
11.2
. I
work
with
colleagues in m
y g
roup
who a
re c
om
mitte
d t
o
Berk
ele
y L
ab's
mis
sio
n.
11.3
. Berk
ele
y L
ab's
mis
sio
n h
as b
een
cle
arly c
om
munic
ate
d.
11.4
. M
y w
ork
advances
Berk
ele
y L
ab's
mis
sio
n.
11.
Sense o
f Share
d
Mis
sio
n
11.1
. The p
eople
in m
y
Div
isio
n a
re c
om
mitte
d
to B
erk
ele
y L
ab's
mis
sio
n.
Sens
e of
Sha
red
Mis
sion
: All
Div
isio
ns
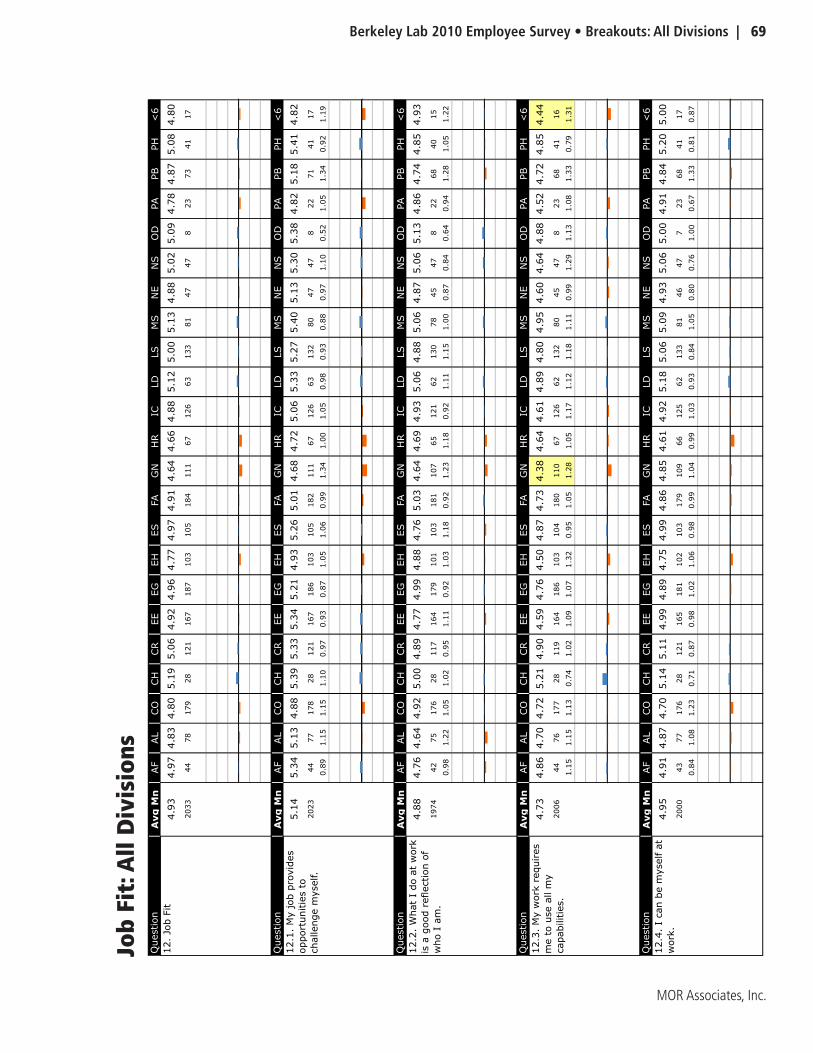
Berkeley Lab 2010 Employee Survey • Breakouts: All Divisions | 69
MOR Associates, Inc.
Question
Avg
Mn
AF
AL
CO
CH
CR
EE
EG
EH
ES
FA
GN
HR
ICLD
LS
MS
NE
NS
OD
PA
PB
PH
<6
4.9
34.9
74.8
34.8
05.1
95.0
64.9
24.9
64.7
74.9
74.9
14.6
44.6
64.8
85.1
25.0
05.1
34.8
85.0
25.0
94.7
84.8
75.0
84.8
0
2033
44
78
179
28
121
167
187
103
105
184
111
67
126
63
133
81
47
47
823
73
41
17
Question
Avg
Mn
AF
AL
CO
CH
CR
EE
EG
EH
ES
FA
GN
HR
ICLD
LS
MS
NE
NS
OD
PA
PB
PH
<6
5.1
45.3
45.1
34.8
85.3
95.3
35.3
45.2
14.9
35.2
65.0
14.6
84.7
25.0
65.3
35.2
75.4
05.1
35.3
05.3
84.8
25.1
85.4
14.8
2
2023
44
77
178
28
121
167
186
103
105
182
111
67
126
63
132
80
47
47
822
71
41
17
0.8
91.1
51.1
51.1
00.9
70.9
30.8
71.0
51.0
60.9
91.3
41.0
01.0
50.9
80.9
30.8
80.9
71.1
00.5
21.0
51.3
40.9
21.1
9
Question
Avg
Mn
AF
AL
CO
CH
CR
EE
EG
EH
ES
FA
GN
HR
ICLD
LS
MS
NE
NS
OD
PA
PB
PH
<6
4.8
84.7
64.6
44.9
25.0
04.8
94.7
74.9
94.8
84.7
65.0
34.6
44.6
94.9
35.0
64.8
85.0
64.8
75.0
65.1
34.8
64.7
44.8
54.9
3
1974
42
75
176
28
117
164
179
101
103
181
107
65
121
62
130
78
45
47
822
68
40
15
0.9
81.2
21.0
51.0
20.9
51.1
10.9
21.0
31.1
80.9
21.2
31.1
80.9
21.1
11.1
51.0
00.8
70.8
40.6
40.9
41.2
81.0
51.2
2
Question
Avg
Mn
AF
AL
CO
CH
CR
EE
EG
EH
ES
FA
GN
HR
ICLD
LS
MS
NE
NS
OD
PA
PB
PH
<6
4.7
34.8
64.7
04.7
25.2
14.9
04.5
94.7
64.5
04.8
74.7
34.3
84.6
44.6
14.8
94.8
04.9
54.6
04.6
44.8
84.5
24.7
24.8
54.4
4
2006
44
76
177
28
119
164
186
103
104
180
110
67
126
62
132
80
45
47
823
68
41
16
1.1
51.1
51.1
30.7
41.0
21.0
91.0
71.3
20.9
51.0
51.2
81.0
51.1
71.1
21.1
81.1
10.9
91.2
91.1
31.0
81.3
30.7
91.3
1
Question
Avg
Mn
AF
AL
CO
CH
CR
EE
EG
EH
ES
FA
GN
HR
ICLD
LS
MS
NE
NS
OD
PA
PB
PH
<6
4.9
54.9
14.8
74.7
05.1
45.1
14.9
94.8
94.7
54.9
94.8
64.8
54.6
14.9
25.1
85.0
65.0
94.9
35.0
65.0
04.9
14.8
45.2
05.0
0
2000
43
77
176
28
121
165
181
102
103
179
109
66
125
62
133
81
46
47
723
68
41
17
0.8
41.0
81.2
30.7
10.8
70.9
81.0
21.0
60.9
80.9
91.0
40.9
91.0
30.9
30.8
41.0
50.8
00.7
61.0
00.6
71.3
30.8
10.8
7
12.2
. W
hat
I do a
t w
ork
is a
good r
eflection o
f
who I
am
.
12.3
. M
y w
ork
requires
me t
o u
se a
ll m
y
capabilitie
s.
12.4
. I
can b
e m
yself a
t
work
.
12.
Job F
it
12.1
. M
y job p
rovid
es
opport
unitie
s t
o
challenge m
yself.
Job
Fit:
All
Div
isio
ns
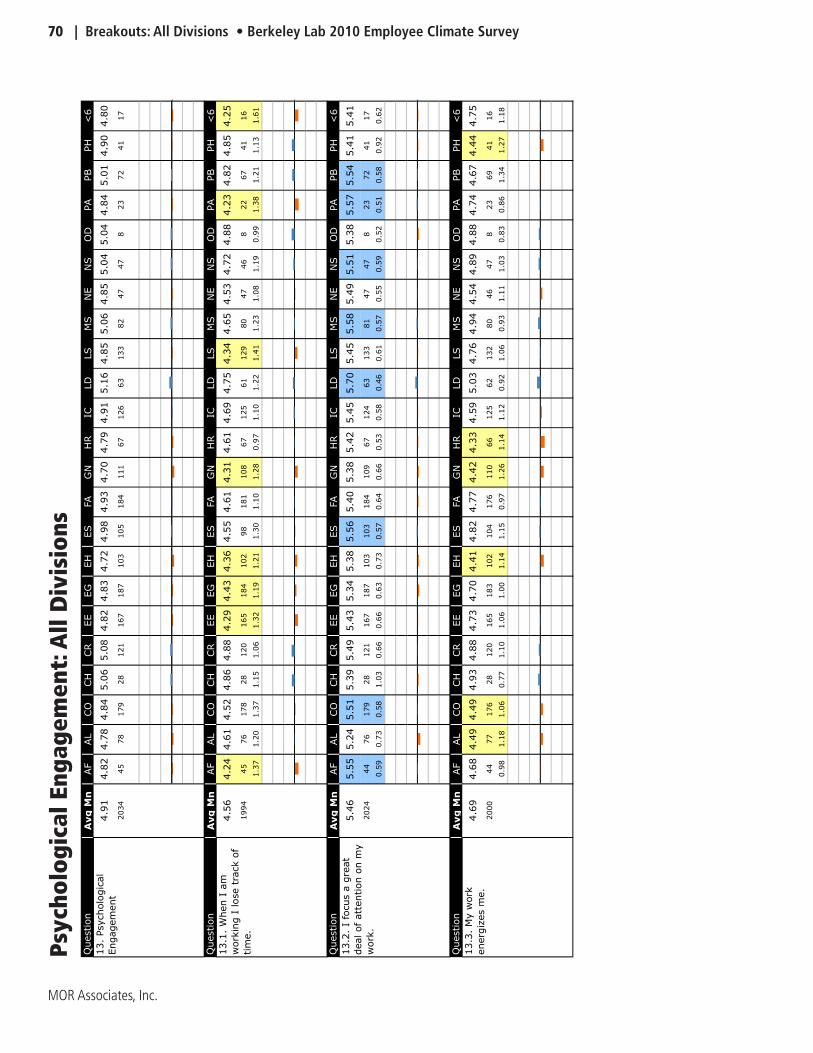
70 | Breakouts: All Divisions • Berkeley Lab 2010 Employee Climate Survey
MOR Associates, Inc.
Question
Avg
Mn
AF
AL
CO
CH
CR
EE
EG
EH
ES
FA
GN
HR
ICLD
LS
MS
NE
NS
OD
PA
PB
PH
<6
4.9
14.8
24.7
84.8
45.0
65.0
84.8
24.8
34.7
24.9
84.9
34.7
04.7
94.9
15.1
64.8
55.0
64.8
55.0
45.0
44.8
45.0
14.9
04.8
0
2034
45
78
179
28
121
167
187
103
105
184
111
67
126
63
133
82
47
47
823
72
41
17
Question
Avg
Mn
AF
AL
CO
CH
CR
EE
EG
EH
ES
FA
GN
HR
ICLD
LS
MS
NE
NS
OD
PA
PB
PH
<6
4.5
64.2
44.6
14.5
24.8
64.8
84.2
94.4
34.3
64.5
54.6
14.3
14.6
14.6
94.7
54.3
44.6
54.5
34.7
24.8
84.2
34.8
24.8
54.2
5
1994
45
76
178
28
120
165
184
102
98
181
108
67
125
61
129
80
47
46
822
67
41
16
1.3
71.2
01.3
71.1
51.0
61.3
21.1
91.2
11.3
01.1
01.2
80.9
71.1
01.2
21.4
11.2
31.0
81.1
90.9
91.3
81.2
11.1
31.6
1
Question
Avg
Mn
AF
AL
CO
CH
CR
EE
EG
EH
ES
FA
GN
HR
ICLD
LS
MS
NE
NS
OD
PA
PB
PH
<6
5.4
65.5
55.2
45.5
15.3
95.4
95.4
35.3
45.3
85.5
65.4
05.3
85.4
25.4
55.7
05.4
55.5
85.4
95.5
15.3
85.5
75.5
45.4
15.4
1
2024
44
76
179
28
121
167
187
103
103
184
109
67
124
63
133
81
47
47
823
72
41
17
0.5
90.7
30.5
81.0
30.6
60.6
60.6
30.7
30.5
70.6
40.6
60.5
30.5
80.4
60.6
10.5
70.5
50.5
90.5
20.5
10.5
80.9
20.6
2
Question
Avg
Mn
AF
AL
CO
CH
CR
EE
EG
EH
ES
FA
GN
HR
ICLD
LS
MS
NE
NS
OD
PA
PB
PH
<6
4.6
94.6
84.4
94.4
94.9
34.8
84.7
34.7
04.4
14.8
24.7
74.4
24.3
34.5
95.0
34.7
64.9
44.5
44.8
94.8
84.7
44.6
74.4
44.7
5
2000
44
77
176
28
120
165
183
102
104
176
110
66
125
62
132
80
46
47
823
69
41
16
0.9
81.1
81.0
60.7
71.1
01.0
61.0
01.1
41.1
50.9
71.2
61.1
41.1
20.9
21.0
60.9
31.1
11.0
30.8
30.8
61.3
41.2
71.1
8
13.
Psycholo
gic
al
Engagem
ent
13.1
. W
hen I
am
work
ing I
lose t
rack o
f
tim
e.
13.2
. I
focus a
gre
at
deal of
att
ention o
n m
y
work
.
13.3
. M
y w
ork
energ
izes m
e.
Psyc
holo
gica
l Eng
agem
ent:
All
Div
isio
ns
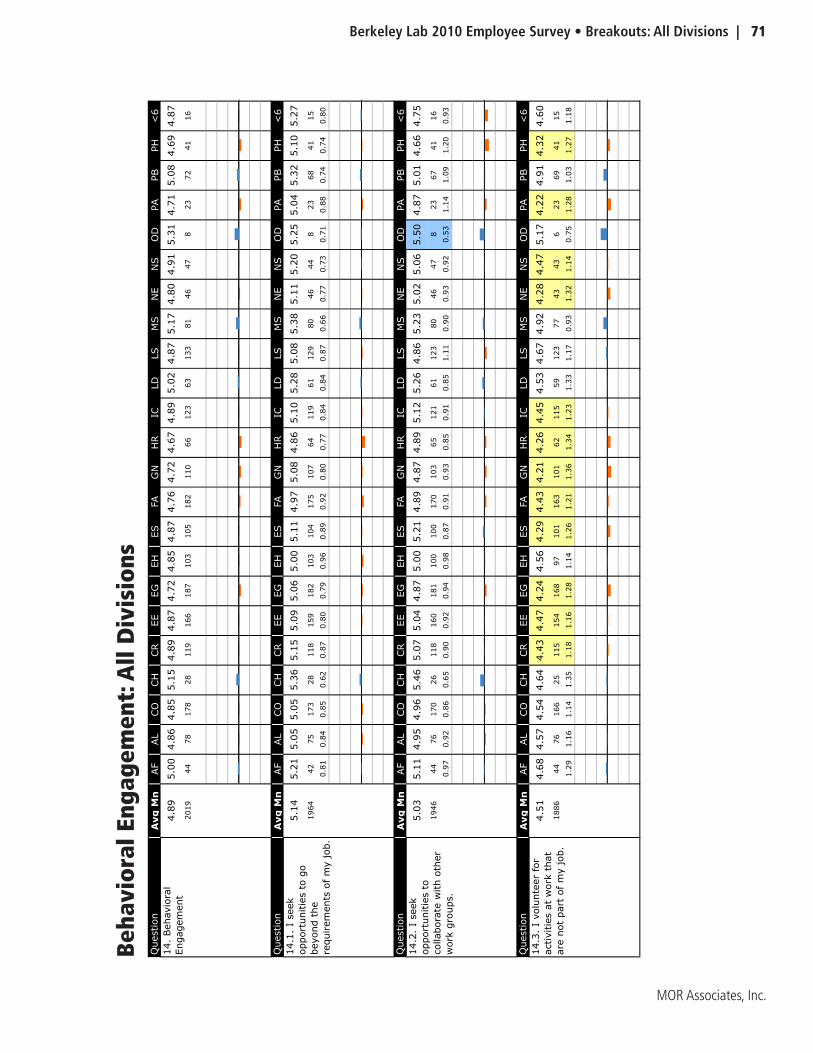
Berkeley Lab 2010 Employee Survey • Breakouts: All Divisions | 71
MOR Associates, Inc.
Question
Avg
Mn
AF
AL
CO
CH
CR
EE
EG
EH
ES
FA
GN
HR
ICLD
LS
MS
NE
NS
OD
PA
PB
PH
<6
4.8
95.0
04.8
64.8
55.1
54.8
94.8
74.7
24.8
54.8
74.7
64.7
24.6
74.8
95.0
24.8
75.1
74.8
04.9
15.3
14.7
15.0
84.6
94.8
7
2019
44
78
178
28
119
166
187
103
105
182
110
66
123
63
133
81
46
47
823
72
41
16
Question
Avg
Mn
AF
AL
CO
CH
CR
EE
EG
EH
ES
FA
GN
HR
ICLD
LS
MS
NE
NS
OD
PA
PB
PH
<6
5.1
45.2
15.0
55.0
55.3
65.1
55.0
95.0
65.0
05.1
14.9
75.0
84.8
65.1
05.2
85.0
85.3
85.1
15.2
05.2
55.0
45.3
25.1
05.2
7
1964
42
75
173
28
118
159
182
103
104
175
107
64
119
61
129
80
46
44
823
68
41
15
0.8
10.8
40.8
50.6
20.8
70.8
00.7
90.9
60.8
90.9
20.8
00.7
70.8
40.8
40.8
70.6
60.7
70.7
30.7
10.8
80.7
40.7
40.8
0
Question
Avg
Mn
AF
AL
CO
CH
CR
EE
EG
EH
ES
FA
GN
HR
ICLD
LS
MS
NE
NS
OD
PA
PB
PH
<6
5.0
35.1
14.9
54.9
65.4
65.0
75.0
44.8
75.0
05.2
14.8
94.8
74.8
95.1
25.2
64.8
65.2
35.0
25.0
65.5
04.8
75.0
14.6
64.7
5
1946
44
76
170
26
118
160
181
100
100
170
103
65
121
61
123
80
46
47
823
67
41
16
0.9
70.9
20.8
60.6
50.9
00.9
20.9
40.9
80.8
70.9
10.9
30.8
50.9
10.8
51.1
10.9
00.9
30.9
20.5
31.1
41.0
91.2
00.9
3
Question
Avg
Mn
AF
AL
CO
CH
CR
EE
EG
EH
ES
FA
GN
HR
ICLD
LS
MS
NE
NS
OD
PA
PB
PH
<6
4.5
14.6
84.5
74.5
44.6
44.4
34.4
74.2
44.5
64.2
94.4
34.2
14.2
64.4
54.5
34.6
74.9
24.2
84.4
75.1
74.2
24.9
14.3
24.6
0
1886
44
76
166
25
115
154
168
97
101
163
101
62
115
59
123
77
43
43
623
69
41
15
1.2
91.1
61.1
41.3
51.1
81.1
61.2
81.1
41.2
61.2
11.3
61.3
41.2
31.3
31.1
70.9
31.3
21.1
40.7
51.2
81.0
31.2
71.1
8
14.3
. I
volu
nte
er
for
activitie
s a
t w
ork
that
are
not
part
of
my job.
14.
Behavio
ral
Engagem
ent
14.1
. I
seek
opport
unitie
s t
o g
o
beyond t
he
requirem
ents
of
my job.
14.2
. I
seek
opport
unitie
s t
o
collabora
te w
ith o
ther
work
gro
ups.
Beha
vior
al E
ngag
emen
t: A
ll D
ivis
ions
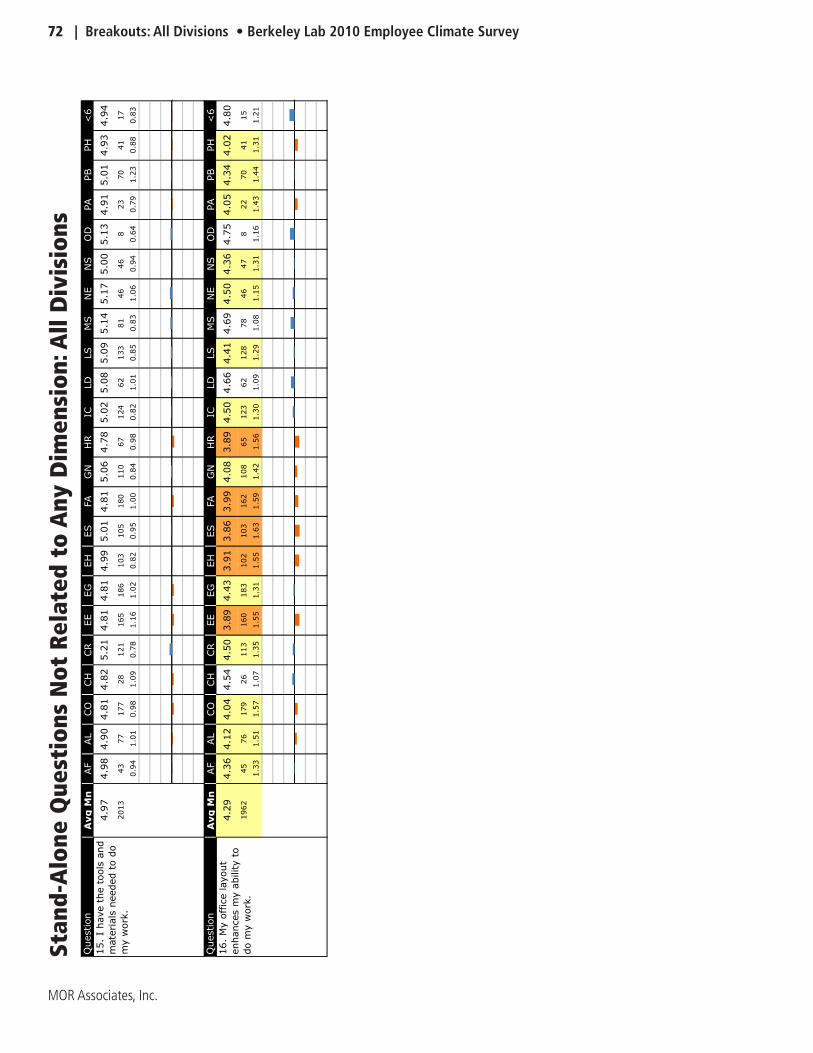
72 | Breakouts: All Divisions • Berkeley Lab 2010 Employee Climate Survey
MOR Associates, Inc.
Question
Avg
Mn
AF
AL
CO
CH
CR
EE
EG
EH
ES
FA
GN
HR
ICLD
LS
MS
NE
NS
OD
PA
PB
PH
<6
4.9
74.9
84.9
04.8
14.8
25.2
14.8
14.8
14.9
95.0
14.8
15.0
64.7
85.0
25.0
85.0
95.1
45.1
75.0
05.1
34.9
15.0
14.9
34.9
4
2013
43
77
177
28
121
165
186
103
105
180
110
67
124
62
133
81
46
46
823
70
41
17
0.9
41.0
10.9
81.0
90.7
81.1
61.0
20.8
20.9
51.0
00.8
40.9
80.8
21.0
10.8
50.8
31.0
60.9
40.6
40.7
91.2
30.8
80.8
3
Question
Avg
Mn
AF
AL
CO
CH
CR
EE
EG
EH
ES
FA
GN
HR
ICLD
LS
MS
NE
NS
OD
PA
PB
PH
<6
4.2
94.3
64.1
24.0
44.5
44.5
03.8
94.4
33.9
13.8
63.9
94.0
83.8
94.5
04.6
64.4
14.6
94.5
04.3
64.7
54.0
54.3
44.0
24.8
0
1962
45
76
179
26
113
160
183
102
103
162
108
65
123
62
128
78
46
47
822
70
41
15
1.3
31.5
11.5
71.0
71.3
51.5
51.3
11.5
51.6
31.5
91.4
21.5
61.3
01.0
91.2
91.0
81.1
51.3
11.1
61.4
31.4
41.3
11.2
1
15.
I have t
he t
ools
and
mate
rials
needed t
o d
o
my w
ork
.
16.
My o
ffic
e layout
enhances m
y a
bility t
o
do m
y w
ork
.
Stan
d-A
lone
Que
stio
ns N
ot R
elat
ed t
o A
ny D
imen
sion
: All
Div
isio
ns
Berkeley Lab 2010 Employee Survey • Detailed Tables: All Divisions | 73
MOR Associates, Inc.
Detailed Tables: All Divisions

74 | Detailed Tables: All Divisions • Berkeley Lab 2010 Employee Climate Survey
MOR Associates, Inc.
1 Supervisor Credibility
Mean SD D SD SA A SA Count
All 4.74 4% 5% 6% 15% 39% 31% 2026
Accelerator & Fusion Research 4.77 2% 4% 6% 17% 44% 27% 45
Advanced Light Source 4.29 10% 8% 6% 17% 37% 22% 77
Office of Chief Finance Officer 4.70 4% 6% 7% 14% 37% 33% 179
Chemical Sciences 4.56 4% 7% 9% 16% 39% 25% 27
Computational Research Div 4.64 6% 8% 6% 13% 32% 36% 122
Environmental Energy Tech 4.73 3% 4% 7% 17% 40% 29% 167
Engineering 4.89 3% 4% 3% 11% 48% 30% 186
Environment, Health & Safety 4.57 5% 8% 5% 18% 36% 28% 103
Earth Sciences 4.96 2% 3% 4% 16% 36% 38% 105
Facilities 4.64 4% 5% 8% 17% 41% 26% 182
Genomics Division 4.82 3% 4% 7% 13% 40% 33% 111
Human Resources 4.76 2% 3% 7% 16% 47% 25% 67
Information Technology Div 4.72 5% 4% 6% 16% 40% 30% 126
Laboratory Directorate 5.05 1% 4% 5% 8% 43% 39% 63
Life Sciences 4.93 2% 4% 5% 12% 38% 38% 133
Materials Sciences 4.93 3% 4% 4% 15% 38% 37% 81
NERSC 4.48 7% 4% 8% 22% 32% 26% 47
Nuclear Science 4.64 4% 6% 6% 18% 37% 29% 47
Operations Division 5.18 0% 0% 6% 13% 38% 43% 8
Public Affairs 4.44 3% 10% 9% 16% 37% 23% 23
Physical Biosciences 4.89 6% 3% 5% 9% 36% 41% 72
Physics 4.75 1% 6% 5% 17% 48% 24% 40
Fewer Than 6 4.38 2% 18% 8% 15% 25% 32% 15
1.1 My supervisor acts consistently.
Mean SD D SD SA A SA Count Std. Dev.
All 4.79 3% 5% 6% 13% 43% 30% 1981 1.24
Accelerator & Fusion Research 4.80 2% 0% 11% 11% 52% 23% 44 1.07
Advanced Light Source 4.39 7% 8% 8% 17% 38% 22% 76 1.46
Office of Chief Finance Officer 4.74 4% 7% 3% 17% 36% 34% 176 1.35
Chemical Sciences 4.62 8% 8% 4% 12% 35% 35% 26 1.58
Computational Research Div 4.70 4% 8% 8% 13% 31% 37% 119 1.44
Environmental Energy Tech 4.75 3% 4% 7% 12% 47% 26% 163 1.22
Engineering 4.97 1% 4% 4% 8% 53% 29% 180 1.04
Environment, Health & Safety 4.60 3% 7% 6% 19% 41% 24% 100 1.28
Earth Sciences 5.04 1% 4% 5% 12% 38% 41% 103 1.11
Facilities 4.77 3% 2% 11% 11% 46% 28% 178 1.19
Genomics Division 4.77 2% 5% 9% 12% 44% 28% 109 1.20
Human Resources 4.82 2% 3% 6% 14% 53% 23% 66 1.05
Information Technology Div 4.72 5% 4% 5% 15% 44% 28% 123 1.30
Laboratory Directorate 5.11 0% 3% 8% 3% 46% 40% 63 1.02
Life Sciences 4.91 2% 6% 3% 13% 39% 37% 132 1.24
Materials Sciences 5.00 3% 1% 3% 14% 46% 33% 78 1.06
NERSC 4.55 4% 2% 13% 19% 38% 23% 47 1.28
Nuclear Science 4.70 2% 7% 4% 22% 37% 28% 46 1.24
Operations Division 5.00 0% 0% 25% 13% 0% 63% 8 1.41
Public Affairs 4.71 0% 10% 5% 19% 38% 29% 21 1.23
Physical Biosciences 4.90 6% 1% 6% 9% 40% 38% 68 1.34
Physics 4.73 0% 5% 8% 13% 60% 15% 40 0.99
Fewer Than 6 4.40 0% 27% 7% 7% 20% 40% 15 1.72
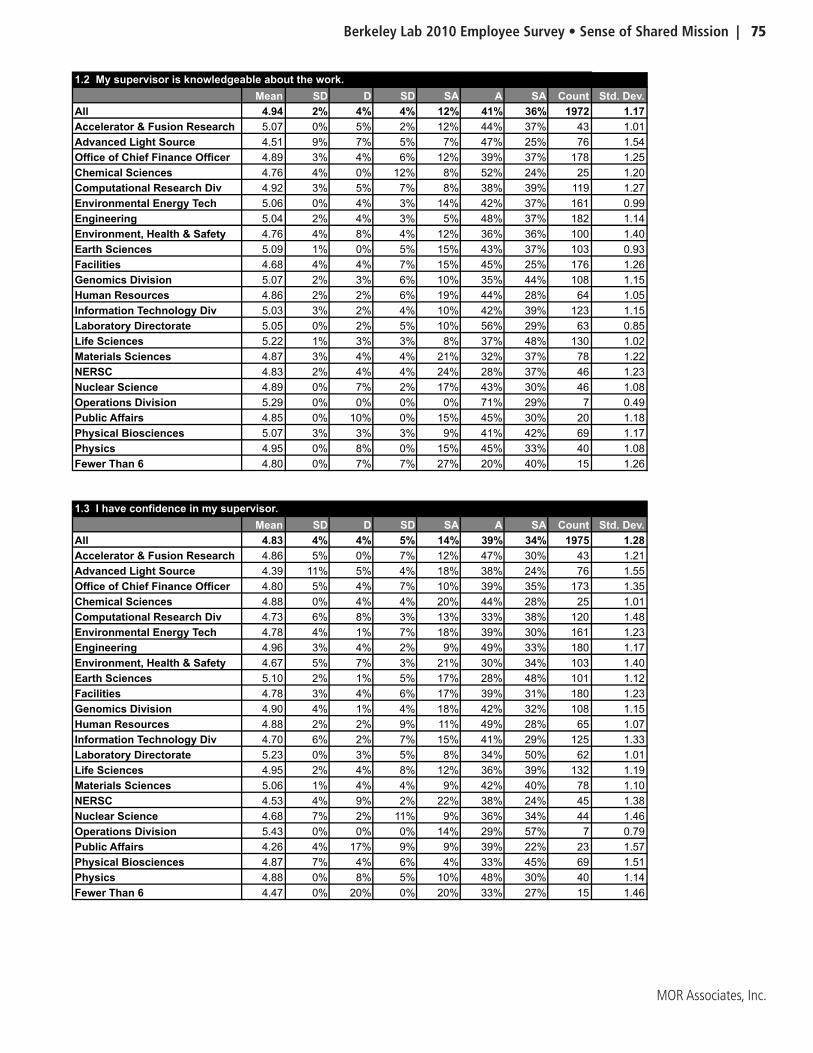
Berkeley Lab 2010 Employee Survey • Sense of Shared Mission | 75
MOR Associates, Inc.
1.2 My supervisor is knowledgeable about the work.
Mean SD D SD SA A SA Count Std. Dev.
All 4.94 2% 4% 4% 12% 41% 36% 1972 1.17
Accelerator & Fusion Research 5.07 0% 5% 2% 12% 44% 37% 43 1.01
Advanced Light Source 4.51 9% 7% 5% 7% 47% 25% 76 1.54
Office of Chief Finance Officer 4.89 3% 4% 6% 12% 39% 37% 178 1.25
Chemical Sciences 4.76 4% 0% 12% 8% 52% 24% 25 1.20
Computational Research Div 4.92 3% 5% 7% 8% 38% 39% 119 1.27
Environmental Energy Tech 5.06 0% 4% 3% 14% 42% 37% 161 0.99
Engineering 5.04 2% 4% 3% 5% 48% 37% 182 1.14
Environment, Health & Safety 4.76 4% 8% 4% 12% 36% 36% 100 1.40
Earth Sciences 5.09 1% 0% 5% 15% 43% 37% 103 0.93
Facilities 4.68 4% 4% 7% 15% 45% 25% 176 1.26
Genomics Division 5.07 2% 3% 6% 10% 35% 44% 108 1.15
Human Resources 4.86 2% 2% 6% 19% 44% 28% 64 1.05
Information Technology Div 5.03 3% 2% 4% 10% 42% 39% 123 1.15
Laboratory Directorate 5.05 0% 2% 5% 10% 56% 29% 63 0.85
Life Sciences 5.22 1% 3% 3% 8% 37% 48% 130 1.02
Materials Sciences 4.87 3% 4% 4% 21% 32% 37% 78 1.22
NERSC 4.83 2% 4% 4% 24% 28% 37% 46 1.23
Nuclear Science 4.89 0% 7% 2% 17% 43% 30% 46 1.08
Operations Division 5.29 0% 0% 0% 0% 71% 29% 7 0.49
Public Affairs 4.85 0% 10% 0% 15% 45% 30% 20 1.18
Physical Biosciences 5.07 3% 3% 3% 9% 41% 42% 69 1.17
Physics 4.95 0% 8% 0% 15% 45% 33% 40 1.08
Fewer Than 6 4.80 0% 7% 7% 27% 20% 40% 15 1.26
1.3 I have confidence in my supervisor.
Mean SD D SD SA A SA Count Std. Dev.
All 4.83 4% 4% 5% 14% 39% 34% 1975 1.28
Accelerator & Fusion Research 4.86 5% 0% 7% 12% 47% 30% 43 1.21
Advanced Light Source 4.39 11% 5% 4% 18% 38% 24% 76 1.55
Office of Chief Finance Officer 4.80 5% 4% 7% 10% 39% 35% 173 1.35
Chemical Sciences 4.88 0% 4% 4% 20% 44% 28% 25 1.01
Computational Research Div 4.73 6% 8% 3% 13% 33% 38% 120 1.48
Environmental Energy Tech 4.78 4% 1% 7% 18% 39% 30% 161 1.23
Engineering 4.96 3% 4% 2% 9% 49% 33% 180 1.17
Environment, Health & Safety 4.67 5% 7% 3% 21% 30% 34% 103 1.40
Earth Sciences 5.10 2% 1% 5% 17% 28% 48% 101 1.12
Facilities 4.78 3% 4% 6% 17% 39% 31% 180 1.23
Genomics Division 4.90 4% 1% 4% 18% 42% 32% 108 1.15
Human Resources 4.88 2% 2% 9% 11% 49% 28% 65 1.07
Information Technology Div 4.70 6% 2% 7% 15% 41% 29% 125 1.33
Laboratory Directorate 5.23 0% 3% 5% 8% 34% 50% 62 1.01
Life Sciences 4.95 2% 4% 8% 12% 36% 39% 132 1.19
Materials Sciences 5.06 1% 4% 4% 9% 42% 40% 78 1.10
NERSC 4.53 4% 9% 2% 22% 38% 24% 45 1.38
Nuclear Science 4.68 7% 2% 11% 9% 36% 34% 44 1.46
Operations Division 5.43 0% 0% 0% 14% 29% 57% 7 0.79
Public Affairs 4.26 4% 17% 9% 9% 39% 22% 23 1.57
Physical Biosciences 4.87 7% 4% 6% 4% 33% 45% 69 1.51
Physics 4.88 0% 8% 5% 10% 48% 30% 40 1.14
Fewer Than 6 4.47 0% 20% 0% 20% 33% 27% 15 1.46
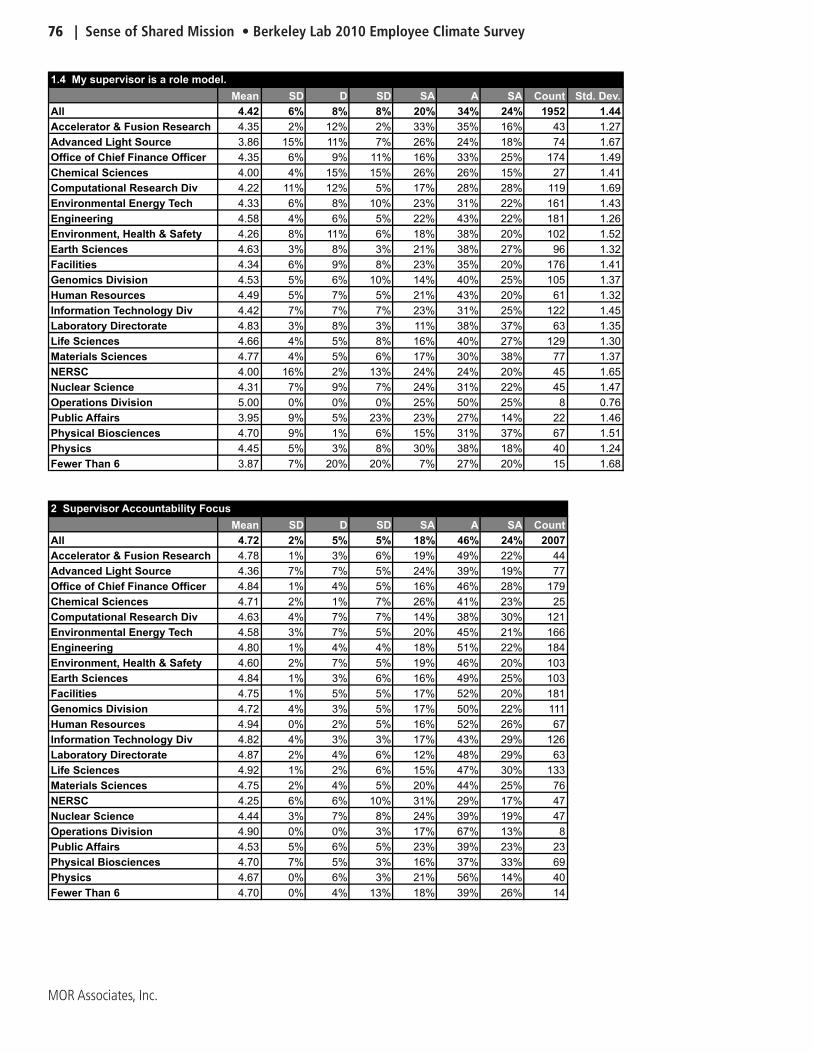
76 | Sense of Shared Mission • Berkeley Lab 2010 Employee Climate Survey
MOR Associates, Inc.
1.4 My supervisor is a role model.
Mean SD D SD SA A SA Count Std. Dev.
All 4.42 6% 8% 8% 20% 34% 24% 1952 1.44
Accelerator & Fusion Research 4.35 2% 12% 2% 33% 35% 16% 43 1.27
Advanced Light Source 3.86 15% 11% 7% 26% 24% 18% 74 1.67
Office of Chief Finance Officer 4.35 6% 9% 11% 16% 33% 25% 174 1.49
Chemical Sciences 4.00 4% 15% 15% 26% 26% 15% 27 1.41
Computational Research Div 4.22 11% 12% 5% 17% 28% 28% 119 1.69
Environmental Energy Tech 4.33 6% 8% 10% 23% 31% 22% 161 1.43
Engineering 4.58 4% 6% 5% 22% 43% 22% 181 1.26
Environment, Health & Safety 4.26 8% 11% 6% 18% 38% 20% 102 1.52
Earth Sciences 4.63 3% 8% 3% 21% 38% 27% 96 1.32
Facilities 4.34 6% 9% 8% 23% 35% 20% 176 1.41
Genomics Division 4.53 5% 6% 10% 14% 40% 25% 105 1.37
Human Resources 4.49 5% 7% 5% 21% 43% 20% 61 1.32
Information Technology Div 4.42 7% 7% 7% 23% 31% 25% 122 1.45
Laboratory Directorate 4.83 3% 8% 3% 11% 38% 37% 63 1.35
Life Sciences 4.66 4% 5% 8% 16% 40% 27% 129 1.30
Materials Sciences 4.77 4% 5% 6% 17% 30% 38% 77 1.37
NERSC 4.00 16% 2% 13% 24% 24% 20% 45 1.65
Nuclear Science 4.31 7% 9% 7% 24% 31% 22% 45 1.47
Operations Division 5.00 0% 0% 0% 25% 50% 25% 8 0.76
Public Affairs 3.95 9% 5% 23% 23% 27% 14% 22 1.46
Physical Biosciences 4.70 9% 1% 6% 15% 31% 37% 67 1.51
Physics 4.45 5% 3% 8% 30% 38% 18% 40 1.24
Fewer Than 6 3.87 7% 20% 20% 7% 27% 20% 15 1.68
2 Supervisor Accountability Focus
Mean SD D SD SA A SA Count
All 4.72 2% 5% 5% 18% 46% 24% 2007
Accelerator & Fusion Research 4.78 1% 3% 6% 19% 49% 22% 44
Advanced Light Source 4.36 7% 7% 5% 24% 39% 19% 77
Office of Chief Finance Officer 4.84 1% 4% 5% 16% 46% 28% 179
Chemical Sciences 4.71 2% 1% 7% 26% 41% 23% 25
Computational Research Div 4.63 4% 7% 7% 14% 38% 30% 121
Environmental Energy Tech 4.58 3% 7% 5% 20% 45% 21% 166
Engineering 4.80 1% 4% 4% 18% 51% 22% 184
Environment, Health & Safety 4.60 2% 7% 5% 19% 46% 20% 103
Earth Sciences 4.84 1% 3% 6% 16% 49% 25% 103
Facilities 4.75 1% 5% 5% 17% 52% 20% 181
Genomics Division 4.72 4% 3% 5% 17% 50% 22% 111
Human Resources 4.94 0% 2% 5% 16% 52% 26% 67
Information Technology Div 4.82 4% 3% 3% 17% 43% 29% 126
Laboratory Directorate 4.87 2% 4% 6% 12% 48% 29% 63
Life Sciences 4.92 1% 2% 6% 15% 47% 30% 133
Materials Sciences 4.75 2% 4% 5% 20% 44% 25% 76
NERSC 4.25 6% 6% 10% 31% 29% 17% 47
Nuclear Science 4.44 3% 7% 8% 24% 39% 19% 47
Operations Division 4.90 0% 0% 3% 17% 67% 13% 8
Public Affairs 4.53 5% 6% 5% 23% 39% 23% 23
Physical Biosciences 4.70 7% 5% 3% 16% 37% 33% 69
Physics 4.67 0% 6% 3% 21% 56% 14% 40
Fewer Than 6 4.70 0% 4% 13% 18% 39% 26% 14
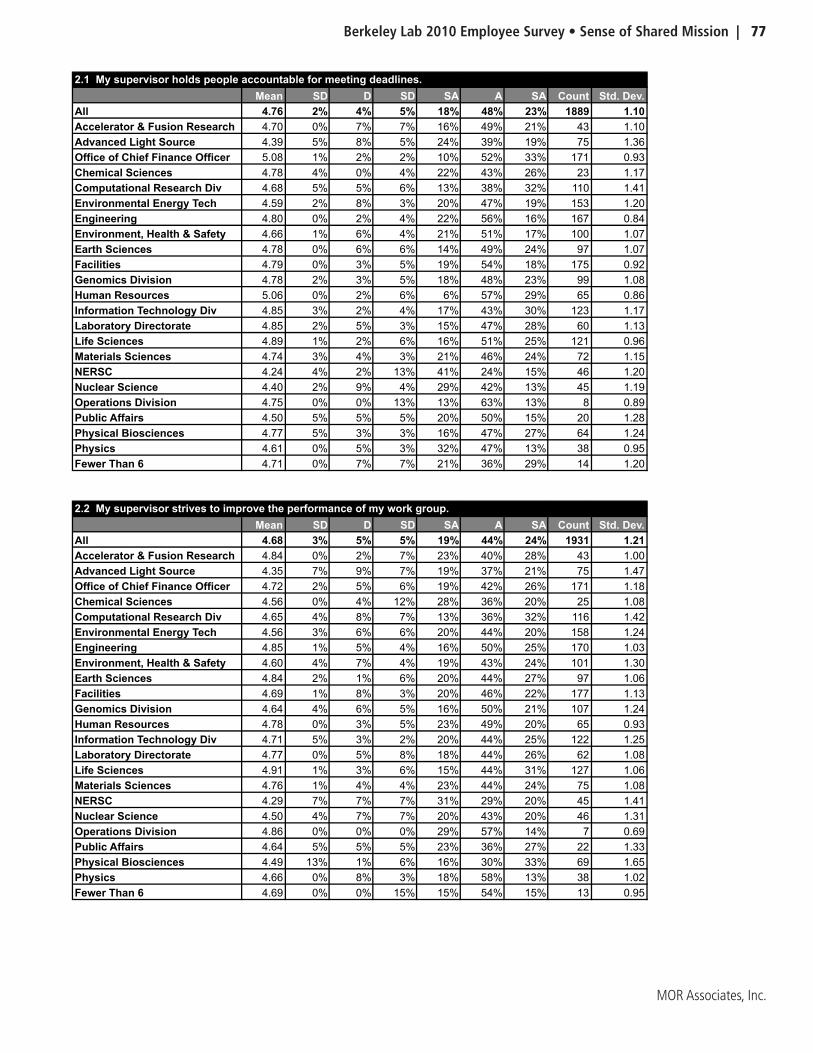
Berkeley Lab 2010 Employee Survey • Sense of Shared Mission | 77
MOR Associates, Inc.
2.1 My supervisor holds people accountable for meeting deadlines.
Mean SD D SD SA A SA Count Std. Dev.
All 4.76 2% 4% 5% 18% 48% 23% 1889 1.10
Accelerator & Fusion Research 4.70 0% 7% 7% 16% 49% 21% 43 1.10
Advanced Light Source 4.39 5% 8% 5% 24% 39% 19% 75 1.36
Office of Chief Finance Officer 5.08 1% 2% 2% 10% 52% 33% 171 0.93
Chemical Sciences 4.78 4% 0% 4% 22% 43% 26% 23 1.17
Computational Research Div 4.68 5% 5% 6% 13% 38% 32% 110 1.41
Environmental Energy Tech 4.59 2% 8% 3% 20% 47% 19% 153 1.20
Engineering 4.80 0% 2% 4% 22% 56% 16% 167 0.84
Environment, Health & Safety 4.66 1% 6% 4% 21% 51% 17% 100 1.07
Earth Sciences 4.78 0% 6% 6% 14% 49% 24% 97 1.07
Facilities 4.79 0% 3% 5% 19% 54% 18% 175 0.92
Genomics Division 4.78 2% 3% 5% 18% 48% 23% 99 1.08
Human Resources 5.06 0% 2% 6% 6% 57% 29% 65 0.86
Information Technology Div 4.85 3% 2% 4% 17% 43% 30% 123 1.17
Laboratory Directorate 4.85 2% 5% 3% 15% 47% 28% 60 1.13
Life Sciences 4.89 1% 2% 6% 16% 51% 25% 121 0.96
Materials Sciences 4.74 3% 4% 3% 21% 46% 24% 72 1.15
NERSC 4.24 4% 2% 13% 41% 24% 15% 46 1.20
Nuclear Science 4.40 2% 9% 4% 29% 42% 13% 45 1.19
Operations Division 4.75 0% 0% 13% 13% 63% 13% 8 0.89
Public Affairs 4.50 5% 5% 5% 20% 50% 15% 20 1.28
Physical Biosciences 4.77 5% 3% 3% 16% 47% 27% 64 1.24
Physics 4.61 0% 5% 3% 32% 47% 13% 38 0.95
Fewer Than 6 4.71 0% 7% 7% 21% 36% 29% 14 1.20
2.2 My supervisor strives to improve the performance of my work group.
Mean SD D SD SA A SA Count Std. Dev.
All 4.68 3% 5% 5% 19% 44% 24% 1931 1.21
Accelerator & Fusion Research 4.84 0% 2% 7% 23% 40% 28% 43 1.00
Advanced Light Source 4.35 7% 9% 7% 19% 37% 21% 75 1.47
Office of Chief Finance Officer 4.72 2% 5% 6% 19% 42% 26% 171 1.18
Chemical Sciences 4.56 0% 4% 12% 28% 36% 20% 25 1.08
Computational Research Div 4.65 4% 8% 7% 13% 36% 32% 116 1.42
Environmental Energy Tech 4.56 3% 6% 6% 20% 44% 20% 158 1.24
Engineering 4.85 1% 5% 4% 16% 50% 25% 170 1.03
Environment, Health & Safety 4.60 4% 7% 4% 19% 43% 24% 101 1.30
Earth Sciences 4.84 2% 1% 6% 20% 44% 27% 97 1.06
Facilities 4.69 1% 8% 3% 20% 46% 22% 177 1.13
Genomics Division 4.64 4% 6% 5% 16% 50% 21% 107 1.24
Human Resources 4.78 0% 3% 5% 23% 49% 20% 65 0.93
Information Technology Div 4.71 5% 3% 2% 20% 44% 25% 122 1.25
Laboratory Directorate 4.77 0% 5% 8% 18% 44% 26% 62 1.08
Life Sciences 4.91 1% 3% 6% 15% 44% 31% 127 1.06
Materials Sciences 4.76 1% 4% 4% 23% 44% 24% 75 1.08
NERSC 4.29 7% 7% 7% 31% 29% 20% 45 1.41
Nuclear Science 4.50 4% 7% 7% 20% 43% 20% 46 1.31
Operations Division 4.86 0% 0% 0% 29% 57% 14% 7 0.69
Public Affairs 4.64 5% 5% 5% 23% 36% 27% 22 1.33
Physical Biosciences 4.49 13% 1% 6% 16% 30% 33% 69 1.65
Physics 4.66 0% 8% 3% 18% 58% 13% 38 1.02
Fewer Than 6 4.69 0% 0% 15% 15% 54% 15% 13 0.95

78 | Sense of Shared Mission • Berkeley Lab 2010 Employee Climate Survey
MOR Associates, Inc.
2.3 My supervisor holds people accountable for producing quality work.
Mean SD D SD SA A SA Count Std. Dev.
All 4.76 2% 3% 6% 17% 48% 24% 1910 1.12
Accelerator & Fusion Research 4.74 2% 2% 5% 19% 52% 19% 42 1.06
Advanced Light Source 4.43 7% 4% 5% 25% 42% 17% 76 1.32
Office of Chief Finance Officer 4.91 1% 2% 5% 16% 49% 27% 169 0.97
Chemical Sciences 4.83 0% 0% 8% 25% 42% 25% 24 0.92
Computational Research Div 4.69 3% 4% 10% 13% 42% 28% 115 1.29
Environmental Energy Tech 4.68 3% 7% 4% 16% 49% 22% 152 1.20
Engineering 4.85 1% 2% 4% 19% 53% 21% 176 0.92
Environment, Health & Safety 4.44 4% 9% 6% 18% 48% 16% 102 1.30
Earth Sciences 4.91 1% 1% 5% 17% 50% 26% 98 0.94
Facilities 4.74 2% 2% 9% 13% 57% 18% 175 1.03
Genomics Division 4.71 6% 1% 5% 15% 51% 22% 105 1.22
Human Resources 5.03 0% 2% 3% 16% 48% 31% 61 0.87
Information Technology Div 4.81 3% 2% 4% 20% 41% 30% 122 1.17
Laboratory Directorate 5.07 2% 0% 7% 7% 52% 33% 61 0.96
Life Sciences 4.98 1% 2% 5% 12% 52% 29% 128 0.97
Materials Sciences 4.96 1% 0% 7% 15% 47% 30% 74 0.97
NERSC 4.13 9% 2% 16% 29% 29% 16% 45 1.41
Nuclear Science 4.41 2% 5% 14% 30% 30% 20% 44 1.23
Operations Division 5.00 0% 0% 0% 14% 71% 14% 7 0.58
Public Affairs 4.65 0% 10% 5% 20% 40% 25% 20 1.23
Physical Biosciences 4.71 5% 6% 5% 16% 32% 35% 62 1.42
Physics 4.74 0% 8% 3% 13% 62% 15% 39 1.02
Fewer Than 6 4.46 0% 8% 31% 0% 31% 31% 13 1.45
2.4 My supervisor monitors progress toward stated goals.
Mean SD D SD SA A SA Count Std. Dev.
All 4.68 3% 6% 5% 18% 44% 25% 1956 1.23
Accelerator & Fusion Research 4.84 0% 2% 5% 18% 57% 18% 44 0.86
Advanced Light Source 4.29 9% 8% 1% 27% 36% 18% 77 1.48
Office of Chief Finance Officer 4.64 1% 9% 7% 18% 40% 26% 175 1.24
Chemical Sciences 4.68 4% 0% 4% 28% 44% 20% 25 1.11
Computational Research Div 4.52 4% 12% 4% 16% 37% 28% 120 1.45
Environmental Energy Tech 4.50 4% 7% 6% 24% 38% 22% 158 1.30
Engineering 4.70 2% 8% 5% 14% 46% 25% 182 1.23
Environment, Health & Safety 4.69 0% 8% 5% 20% 42% 24% 98 1.14
Earth Sciences 4.83 2% 4% 5% 13% 51% 25% 102 1.11
Facilities 4.76 2% 5% 4% 16% 51% 22% 174 1.13
Genomics Division 4.77 4% 3% 4% 17% 49% 24% 107 1.17
Human Resources 4.88 0% 3% 5% 17% 52% 23% 65 0.93
Information Technology Div 4.90 3% 3% 3% 12% 45% 32% 121 1.19
Laboratory Directorate 4.77 3% 5% 6% 10% 48% 27% 62 1.25
Life Sciences 4.90 2% 2% 6% 17% 39% 34% 127 1.15
Materials Sciences 4.53 4% 7% 5% 22% 41% 22% 74 1.31
NERSC 4.32 4% 13% 4% 23% 36% 19% 47 1.42
Nuclear Science 4.46 4% 9% 7% 20% 39% 22% 46 1.38
Operations Division 5.00 0% 0% 0% 13% 75% 13% 8 0.53
Public Affairs 4.33 10% 5% 5% 29% 29% 24% 21 1.53
Physical Biosciences 4.83 4% 7% 0% 14% 38% 36% 69 1.36
Physics 4.68 0% 5% 5% 20% 58% 13% 40 0.94
Fewer Than 6 4.93 0% 0% 0% 36% 36% 29% 14 0.83

Berkeley Lab 2010 Employee Survey • Sense of Shared Mission | 79
MOR Associates, Inc.
3 Supervisor Staff Development Focus
Mean SD D SD SA A SA Count
All 4.36 5% 8% 8% 22% 38% 19% 2016
Accelerator & Fusion Research 4.63 2% 5% 5% 21% 49% 18% 44
Advanced Light Source 4.21 8% 10% 5% 24% 35% 18% 77
Office of Chief Finance Officer 4.41 5% 7% 10% 18% 42% 19% 180
Chemical Sciences 4.21 4% 9% 14% 23% 35% 15% 25
Computational Research Div 4.35 9% 7% 7% 18% 34% 25% 120
Environmental Energy Tech 4.30 6% 8% 8% 24% 37% 17% 167
Engineering 4.43 4% 8% 6% 25% 40% 17% 186
Environment, Health & Safety 4.38 3% 10% 11% 17% 39% 19% 103
Earth Sciences 4.60 2% 5% 8% 21% 43% 21% 104
Facilities 4.23 6% 9% 10% 24% 37% 15% 182
Genomics Division 4.35 4% 6% 11% 25% 36% 18% 110
Human Resources 4.38 2% 6% 13% 26% 35% 18% 66
Information Technology Div 4.51 5% 4% 7% 20% 41% 21% 126
Laboratory Directorate 4.36 4% 13% 7% 18% 39% 20% 63
Life Sciences 4.43 5% 8% 8% 21% 35% 23% 133
Materials Sciences 4.27 5% 8% 8% 29% 33% 17% 78
NERSC 4.06 6% 12% 13% 27% 23% 19% 47
Nuclear Science 4.22 7% 8% 10% 23% 36% 17% 47
Operations Division 4.45 0% 10% 6% 22% 52% 9% 8
Public Affairs 3.93 9% 16% 10% 19% 30% 16% 23
Physical Biosciences 4.40 10% 8% 5% 15% 34% 28% 71
Physics 4.34 3% 8% 8% 25% 44% 12% 40
Fewer Than 6 3.82 0% 24% 18% 18% 33% 7% 16
3.1 My supervisor gives me constructive feedback on my performance.
Mean SD D SD SA A SA Count Std. Dev.
All 4.50 4% 7% 7% 19% 40% 22% 1981 1.34
Accelerator & Fusion Research 4.64 5% 7% 2% 11% 57% 18% 44 1.28
Advanced Light Source 4.24 8% 9% 3% 27% 37% 16% 75 1.45
Office of Chief Finance Officer 4.60 3% 7% 8% 12% 45% 24% 178 1.32
Chemical Sciences 4.29 4% 8% 8% 29% 33% 17% 24 1.33
Computational Research Div 4.43 11% 4% 7% 16% 32% 30% 118 1.60
Environmental Energy Tech 4.29 5% 10% 9% 24% 32% 20% 163 1.41
Engineering 4.60 3% 6% 5% 20% 43% 22% 184 1.25
Environment, Health & Safety 4.51 3% 5% 13% 19% 39% 22% 102 1.26
Earth Sciences 4.71 3% 4% 5% 18% 48% 22% 103 1.16
Facilities 4.46 5% 6% 8% 19% 42% 19% 177 1.33
Genomics Division 4.59 2% 5% 10% 21% 40% 22% 108 1.18
Human Resources 4.43 2% 5% 12% 26% 42% 14% 65 1.12
Information Technology Div 4.59 6% 3% 5% 22% 41% 23% 125 1.30
Laboratory Directorate 4.56 2% 14% 5% 13% 40% 27% 63 1.40
Life Sciences 4.58 2% 9% 8% 15% 38% 27% 130 1.34
Materials Sciences 4.59 4% 8% 3% 19% 44% 23% 75 1.32
NERSC 4.28 6% 9% 9% 30% 21% 26% 47 1.48
Nuclear Science 4.38 4% 11% 6% 19% 40% 19% 47 1.39
Operations Division 4.50 0% 13% 0% 25% 50% 13% 8 1.20
Public Affairs 4.09 13% 9% 4% 26% 26% 22% 23 1.68
Physical Biosciences 4.59 9% 7% 4% 9% 37% 34% 68 1.60
Physics 4.35 0% 15% 13% 13% 43% 18% 40 1.33
Fewer Than 6 3.79 0% 14% 21% 36% 29% 0% 14 1.05

80 | Sense of Shared Mission • Berkeley Lab 2010 Employee Climate Survey
MOR Associates, Inc.
3.2 My supervisor and I discuss my career opportunities.
Mean SD D SD SA A SA Count Std. Dev.
All 4.00 8% 11% 11% 26% 29% 15% 1922 1.48
Accelerator & Fusion Research 4.19 5% 5% 14% 35% 28% 14% 43 1.26
Advanced Light Source 4.01 9% 13% 8% 25% 26% 18% 76 1.57
Office of Chief Finance Officer 3.99 8% 9% 17% 22% 33% 12% 170 1.42
Chemical Sciences 3.82 5% 14% 27% 18% 23% 14% 22 1.44
Computational Research Div 4.16 9% 13% 4% 21% 34% 19% 117 1.55
Environmental Energy Tech 4.06 9% 11% 6% 26% 35% 13% 160 1.49
Engineering 4.10 7% 11% 7% 32% 31% 13% 180 1.39
Environment, Health & Safety 4.01 8% 15% 12% 17% 32% 17% 102 1.56
Earth Sciences 4.23 4% 7% 17% 26% 26% 20% 100 1.35
Facilities 3.71 11% 13% 12% 31% 23% 10% 170 1.49
Genomics Division 4.00 6% 13% 11% 30% 25% 15% 105 1.43
Human Resources 3.94 5% 14% 16% 30% 20% 16% 64 1.41
Information Technology Div 4.23 8% 7% 9% 24% 32% 19% 124 1.47
Laboratory Directorate 3.96 7% 18% 9% 19% 33% 14% 57 1.53
Life Sciences 3.99 10% 10% 7% 31% 25% 17% 126 1.53
Materials Sciences 3.76 11% 9% 12% 39% 20% 9% 75 1.41
NERSC 3.77 7% 18% 18% 25% 11% 20% 44 1.57
Nuclear Science 3.86 12% 7% 17% 24% 29% 12% 42 1.52
Operations Division 4.43 0% 14% 0% 14% 71% 0% 7 1.13
Public Affairs 3.41 9% 27% 18% 14% 23% 9% 22 1.56
Physical Biosciences 4.10 16% 8% 3% 22% 25% 25% 63 1.76
Physics 4.05 8% 5% 11% 32% 39% 5% 38 1.29
Fewer Than 6 3.20 0% 53% 13% 0% 27% 7% 15 1.52
3.3 My supervisor clearly communicates expectations.
Mean SD D SD SA A SA Count Std. Dev.
All 4.66 2% 5% 7% 19% 46% 21% 1964 1.16
Accelerator & Fusion Research 4.95 0% 2% 0% 16% 63% 19% 43 0.75
Advanced Light Source 4.25 8% 9% 4% 24% 39% 16% 76 1.45
Office of Chief Finance Officer 4.76 1% 5% 6% 18% 45% 25% 174 1.11
Chemical Sciences 4.60 0% 4% 8% 28% 44% 16% 25 1.00
Computational Research Div 4.50 6% 7% 9% 14% 38% 26% 120 1.44
Environmental Energy Tech 4.55 3% 6% 7% 19% 47% 18% 156 1.20
Engineering 4.76 1% 4% 5% 19% 51% 20% 181 1.01
Environment, Health & Safety 4.69 1% 5% 10% 16% 46% 23% 102 1.13
Earth Sciences 4.81 1% 2% 4% 22% 50% 21% 101 0.95
Facilities 4.70 1% 3% 8% 21% 46% 20% 177 1.04
Genomics Division 4.66 4% 0% 8% 22% 46% 19% 108 1.11
Human Resources 4.77 0% 2% 9% 20% 50% 20% 66 0.92
Information Technology Div 4.69 3% 5% 5% 17% 48% 23% 124 1.21
Laboratory Directorate 4.77 2% 6% 5% 15% 45% 27% 62 1.19
Life Sciences 4.74 2% 5% 9% 13% 47% 25% 132 1.16
Materials Sciences 4.69 0% 5% 7% 24% 41% 23% 75 1.07
NERSC 4.13 4% 11% 11% 28% 33% 13% 46 1.34
Nuclear Science 4.51 4% 4% 11% 16% 44% 20% 45 1.31
Operations Division 4.75 0% 0% 13% 13% 63% 13% 8 0.89
Public Affairs 4.50 0% 14% 9% 14% 41% 23% 22 1.34
Physical Biosciences 4.64 6% 7% 6% 7% 43% 30% 67 1.46
Physics 4.70 0% 3% 5% 25% 55% 13% 40 0.85
Fewer Than 6 4.43 0% 0% 21% 21% 50% 7% 14 0.94
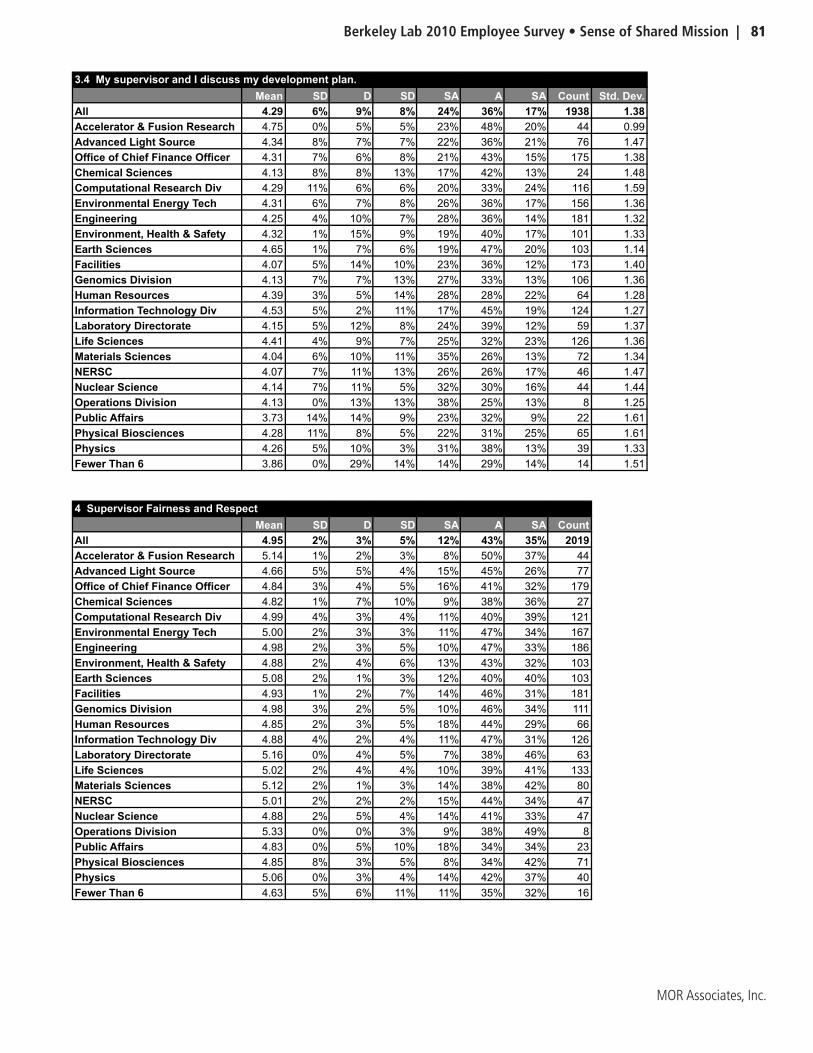
Berkeley Lab 2010 Employee Survey • Sense of Shared Mission | 81
MOR Associates, Inc.
3.4 My supervisor and I discuss my development plan.
Mean SD D SD SA A SA Count Std. Dev.
All 4.29 6% 9% 8% 24% 36% 17% 1938 1.38
Accelerator & Fusion Research 4.75 0% 5% 5% 23% 48% 20% 44 0.99
Advanced Light Source 4.34 8% 7% 7% 22% 36% 21% 76 1.47
Office of Chief Finance Officer 4.31 7% 6% 8% 21% 43% 15% 175 1.38
Chemical Sciences 4.13 8% 8% 13% 17% 42% 13% 24 1.48
Computational Research Div 4.29 11% 6% 6% 20% 33% 24% 116 1.59
Environmental Energy Tech 4.31 6% 7% 8% 26% 36% 17% 156 1.36
Engineering 4.25 4% 10% 7% 28% 36% 14% 181 1.32
Environment, Health & Safety 4.32 1% 15% 9% 19% 40% 17% 101 1.33
Earth Sciences 4.65 1% 7% 6% 19% 47% 20% 103 1.14
Facilities 4.07 5% 14% 10% 23% 36% 12% 173 1.40
Genomics Division 4.13 7% 7% 13% 27% 33% 13% 106 1.36
Human Resources 4.39 3% 5% 14% 28% 28% 22% 64 1.28
Information Technology Div 4.53 5% 2% 11% 17% 45% 19% 124 1.27
Laboratory Directorate 4.15 5% 12% 8% 24% 39% 12% 59 1.37
Life Sciences 4.41 4% 9% 7% 25% 32% 23% 126 1.36
Materials Sciences 4.04 6% 10% 11% 35% 26% 13% 72 1.34
NERSC 4.07 7% 11% 13% 26% 26% 17% 46 1.47
Nuclear Science 4.14 7% 11% 5% 32% 30% 16% 44 1.44
Operations Division 4.13 0% 13% 13% 38% 25% 13% 8 1.25
Public Affairs 3.73 14% 14% 9% 23% 32% 9% 22 1.61
Physical Biosciences 4.28 11% 8% 5% 22% 31% 25% 65 1.61
Physics 4.26 5% 10% 3% 31% 38% 13% 39 1.33
Fewer Than 6 3.86 0% 29% 14% 14% 29% 14% 14 1.51
4 Supervisor Fairness and Respect
Mean SD D SD SA A SA Count
All 4.95 2% 3% 5% 12% 43% 35% 2019
Accelerator & Fusion Research 5.14 1% 2% 3% 8% 50% 37% 44
Advanced Light Source 4.66 5% 5% 4% 15% 45% 26% 77
Office of Chief Finance Officer 4.84 3% 4% 5% 16% 41% 32% 179
Chemical Sciences 4.82 1% 7% 10% 9% 38% 36% 27
Computational Research Div 4.99 4% 3% 4% 11% 40% 39% 121
Environmental Energy Tech 5.00 2% 3% 3% 11% 47% 34% 167
Engineering 4.98 2% 3% 5% 10% 47% 33% 186
Environment, Health & Safety 4.88 2% 4% 6% 13% 43% 32% 103
Earth Sciences 5.08 2% 1% 3% 12% 40% 40% 103
Facilities 4.93 1% 2% 7% 14% 46% 31% 181
Genomics Division 4.98 3% 2% 5% 10% 46% 34% 111
Human Resources 4.85 2% 3% 5% 18% 44% 29% 66
Information Technology Div 4.88 4% 2% 4% 11% 47% 31% 126
Laboratory Directorate 5.16 0% 4% 5% 7% 38% 46% 63
Life Sciences 5.02 2% 4% 4% 10% 39% 41% 133
Materials Sciences 5.12 2% 1% 3% 14% 38% 42% 80
NERSC 5.01 2% 2% 2% 15% 44% 34% 47
Nuclear Science 4.88 2% 5% 4% 14% 41% 33% 47
Operations Division 5.33 0% 0% 3% 9% 38% 49% 8
Public Affairs 4.83 0% 5% 10% 18% 34% 34% 23
Physical Biosciences 4.85 8% 3% 5% 8% 34% 42% 71
Physics 5.06 0% 3% 4% 14% 42% 37% 40
Fewer Than 6 4.63 5% 6% 11% 11% 35% 32% 16

82 | Sense of Shared Mission • Berkeley Lab 2010 Employee Climate Survey
MOR Associates, Inc.
4.1 My supervisor treats me fairly.
Mean SD D SD SA A SA Count Std. Dev.
All 5.00 3% 3% 4% 10% 40% 39% 1984 1.18
Accelerator & Fusion Research 5.14 2% 5% 2% 5% 41% 45% 44 1.17
Advanced Light Source 4.81 5% 5% 4% 10% 40% 35% 77 1.38
Office of Chief Finance Officer 4.86 2% 5% 6% 15% 36% 36% 175 1.23
Chemical Sciences 4.74 4% 7% 7% 11% 33% 37% 27 1.43
Computational Research Div 5.09 3% 2% 4% 9% 37% 45% 117 1.19
Environmental Energy Tech 5.07 2% 4% 4% 6% 43% 41% 162 1.14
Engineering 5.00 2% 3% 6% 8% 45% 36% 182 1.12
Environment, Health & Safety 4.84 2% 5% 8% 12% 39% 35% 101 1.24
Earth Sciences 5.23 2% 0% 3% 10% 39% 47% 101 0.98
Facilities 4.96 3% 3% 4% 11% 44% 35% 179 1.17
Genomics Division 4.94 5% 2% 5% 9% 42% 37% 110 1.26
Human Resources 4.92 3% 2% 5% 17% 38% 36% 64 1.17
Information Technology Div 4.91 3% 3% 5% 9% 48% 32% 125 1.18
Laboratory Directorate 5.25 0% 7% 2% 7% 31% 54% 61 1.11
Life Sciences 5.11 2% 4% 4% 8% 39% 44% 132 1.12
Materials Sciences 5.13 1% 1% 3% 14% 41% 40% 80 0.97
NERSC 5.00 0% 4% 4% 17% 36% 38% 47 1.06
Nuclear Science 4.98 2% 7% 2% 4% 49% 36% 45 1.22
Operations Division 5.50 0% 0% 0% 13% 25% 63% 8 0.76
Public Affairs 4.96 0% 4% 4% 22% 30% 39% 23 1.11
Physical Biosciences 4.94 6% 4% 4% 7% 33% 46% 70 1.42
Physics 5.18 0% 3% 3% 13% 38% 44% 39 0.94
Fewer Than 6 4.53 13% 0% 7% 13% 33% 33% 15 1.68
4.2 My supervisor treats me with respect.
Mean SD D SD SA A SA Count Std. Dev.
All 5.12 2% 2% 4% 9% 41% 43% 1988 1.07
Accelerator & Fusion Research 5.44 0% 0% 0% 5% 47% 49% 43 0.59
Advanced Light Source 4.89 3% 4% 4% 11% 49% 30% 76 1.16
Office of Chief Finance Officer 4.93 1% 5% 5% 13% 41% 35% 177 1.14
Chemical Sciences 4.96 0% 8% 12% 4% 28% 48% 25 1.34
Computational Research Div 5.13 3% 1% 4% 8% 38% 46% 120 1.14
Environmental Energy Tech 5.20 1% 2% 2% 7% 45% 42% 163 0.96
Engineering 5.13 2% 1% 4% 9% 43% 41% 182 1.05
Environment, Health & Safety 5.07 1% 5% 2% 10% 43% 40% 101 1.09
Earth Sciences 5.35 2% 1% 3% 3% 37% 54% 103 0.99
Facilities 5.15 0% 1% 4% 12% 42% 40% 179 0.88
Genomics Division 5.15 2% 1% 4% 8% 45% 41% 110 1.00
Human Resources 4.98 2% 3% 5% 14% 41% 36% 66 1.10
Information Technology Div 4.98 5% 2% 3% 8% 46% 37% 125 1.22
Laboratory Directorate 5.32 0% 2% 6% 3% 35% 53% 62 0.94
Life Sciences 5.19 1% 5% 2% 7% 40% 46% 131 1.05
Materials Sciences 5.29 1% 1% 4% 6% 35% 52% 79 0.99
NERSC 5.28 0% 2% 0% 7% 50% 41% 46 0.78
Nuclear Science 4.98 2% 2% 4% 13% 42% 36% 45 1.12
Operations Division 5.71 0% 0% 0% 0% 29% 71% 7 0.49
Public Affairs 5.05 0% 5% 5% 14% 33% 43% 21 1.12
Physical Biosciences 5.04 7% 1% 4% 10% 23% 55% 71 1.45
Physics 5.10 0% 5% 5% 13% 30% 48% 40 1.13
Fewer Than 6 5.06 6% 0% 6% 6% 31% 50% 16 1.39

Berkeley Lab 2010 Employee Survey • Sense of Shared Mission | 83
MOR Associates, Inc.
4.3 My needs are accommodated by my supervisor.
Mean SD D SD SA A SA Count Std. Dev.
All 4.76 2% 3% 6% 17% 47% 25% 1957 1.13
Accelerator & Fusion Research 4.86 0% 0% 9% 16% 53% 21% 43 0.86
Advanced Light Source 4.29 8% 5% 7% 20% 49% 11% 75 1.36
Office of Chief Finance Officer 4.73 3% 3% 6% 20% 43% 25% 176 1.15
Chemical Sciences 4.68 0% 4% 12% 20% 40% 24% 25 1.11
Computational Research Div 4.81 3% 4% 5% 12% 46% 30% 118 1.23
Environmental Energy Tech 4.84 3% 3% 3% 14% 55% 23% 159 1.08
Engineering 4.82 0% 4% 7% 16% 51% 23% 180 0.99
Environment, Health & Safety 4.80 1% 3% 8% 16% 46% 26% 98 1.07
Earth Sciences 4.68 3% 3% 6% 22% 44% 23% 101 1.16
Facilities 4.67 1% 3% 9% 20% 50% 17% 174 1.01
Genomics Division 4.81 3% 3% 6% 13% 49% 26% 108 1.15
Human Resources 4.71 2% 3% 3% 27% 45% 20% 66 1.02
Information Technology Div 4.81 5% 2% 4% 14% 48% 27% 125 1.21
Laboratory Directorate 4.97 2% 3% 7% 7% 49% 33% 61 1.11
Life Sciences 4.78 2% 3% 8% 18% 39% 30% 131 1.18
Materials Sciences 4.91 1% 0% 4% 26% 39% 30% 77 0.96
NERSC 4.85 4% 0% 2% 22% 43% 28% 46 1.13
Nuclear Science 4.80 0% 4% 7% 22% 39% 28% 46 1.07
Operations Division 5.00 0% 0% 13% 0% 63% 25% 8 0.93
Public Affairs 4.48 0% 4% 17% 17% 48% 13% 23 1.08
Physical Biosciences 4.65 9% 5% 6% 8% 37% 35% 65 1.58
Physics 5.05 0% 0% 3% 15% 56% 26% 39 0.72
Fewer Than 6 4.38 0% 8% 23% 15% 31% 23% 13 1.33
4.4 My supervisor appreciates my efforts.
Mean SD D SD SA A SA Count Std. Dev.
All 4.91 3% 3% 4% 13% 44% 33% 1931 1.16
Accelerator & Fusion Research 5.12 2% 2% 0% 5% 58% 33% 43 0.98
Advanced Light Source 4.64 5% 7% 0% 21% 41% 26% 76 1.34
Office of Chief Finance Officer 4.82 4% 4% 3% 15% 42% 32% 173 1.26
Chemical Sciences 4.92 0% 8% 8% 0% 50% 33% 24 1.21
Computational Research Div 4.91 4% 3% 1% 15% 41% 35% 116 1.24
Environmental Energy Tech 4.91 2% 3% 3% 18% 44% 31% 160 1.07
Engineering 4.99 2% 2% 5% 9% 48% 34% 173 1.09
Environment, Health & Safety 4.80 4% 3% 5% 14% 44% 29% 99 1.24
Earth Sciences 5.08 2% 1% 2% 15% 43% 38% 101 1.01
Facilities 4.93 1% 1% 9% 14% 45% 30% 176 1.00
Genomics Division 5.02 2% 1% 6% 10% 48% 34% 104 1.03
Human Resources 4.77 2% 5% 6% 14% 51% 23% 65 1.11
Information Technology Div 4.82 4% 3% 6% 11% 48% 28% 120 1.22
Laboratory Directorate 5.12 0% 3% 5% 12% 37% 43% 60 1.03
Life Sciences 5.00 2% 6% 3% 8% 37% 43% 126 1.26
Materials Sciences 5.14 4% 1% 1% 10% 36% 47% 77 1.17
NERSC 4.91 5% 0% 2% 16% 48% 30% 44 1.14
Nuclear Science 4.77 2% 7% 5% 18% 34% 34% 44 1.29
Operations Division 5.13 0% 0% 0% 25% 38% 38% 8 0.83
Public Affairs 4.82 0% 5% 14% 18% 23% 41% 22 1.26
Physical Biosciences 4.76 9% 1% 6% 6% 44% 34% 68 1.47
Physics 4.90 0% 5% 5% 15% 44% 31% 39 1.07
Fewer Than 6 4.54 0% 15% 8% 8% 46% 23% 13 1.39
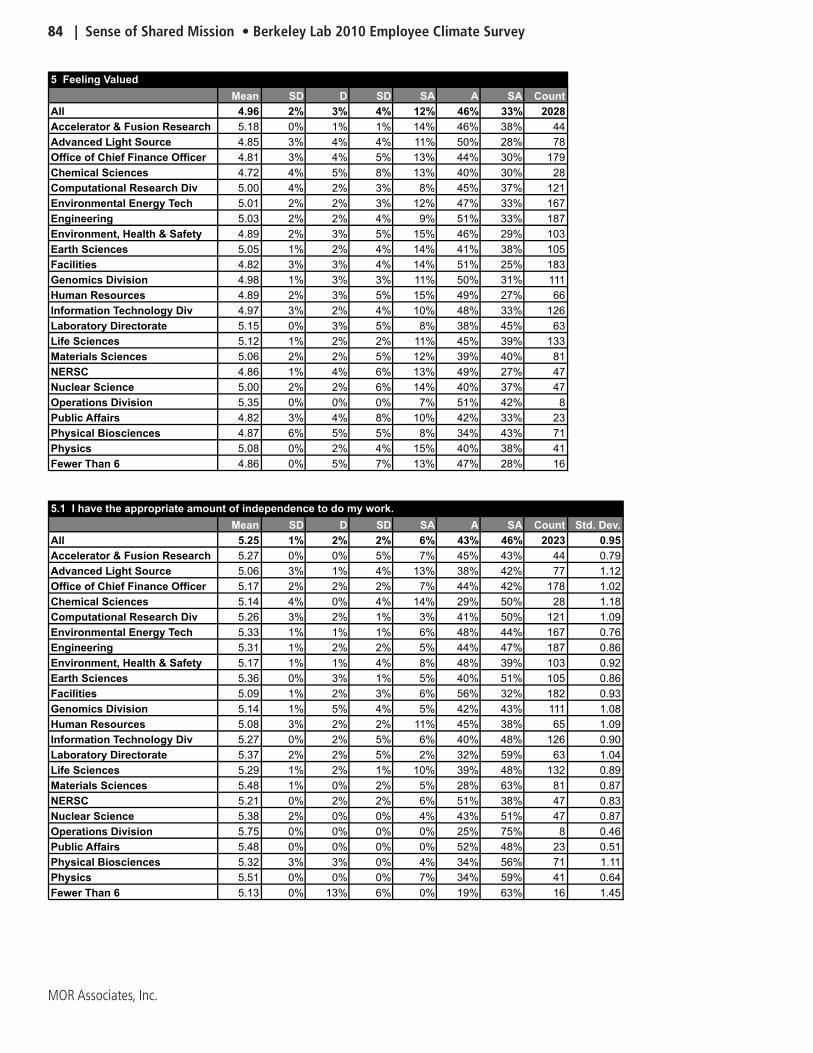
84 | Sense of Shared Mission • Berkeley Lab 2010 Employee Climate Survey
MOR Associates, Inc.
5 Feeling Valued
Mean SD D SD SA A SA Count
All 4.96 2% 3% 4% 12% 46% 33% 2028
Accelerator & Fusion Research 5.18 0% 1% 1% 14% 46% 38% 44
Advanced Light Source 4.85 3% 4% 4% 11% 50% 28% 78
Office of Chief Finance Officer 4.81 3% 4% 5% 13% 44% 30% 179
Chemical Sciences 4.72 4% 5% 8% 13% 40% 30% 28
Computational Research Div 5.00 4% 2% 3% 8% 45% 37% 121
Environmental Energy Tech 5.01 2% 2% 3% 12% 47% 33% 167
Engineering 5.03 2% 2% 4% 9% 51% 33% 187
Environment, Health & Safety 4.89 2% 3% 5% 15% 46% 29% 103
Earth Sciences 5.05 1% 2% 4% 14% 41% 38% 105
Facilities 4.82 3% 3% 4% 14% 51% 25% 183
Genomics Division 4.98 1% 3% 3% 11% 50% 31% 111
Human Resources 4.89 2% 3% 5% 15% 49% 27% 66
Information Technology Div 4.97 3% 2% 4% 10% 48% 33% 126
Laboratory Directorate 5.15 0% 3% 5% 8% 38% 45% 63
Life Sciences 5.12 1% 2% 2% 11% 45% 39% 133
Materials Sciences 5.06 2% 2% 5% 12% 39% 40% 81
NERSC 4.86 1% 4% 6% 13% 49% 27% 47
Nuclear Science 5.00 2% 2% 6% 14% 40% 37% 47
Operations Division 5.35 0% 0% 0% 7% 51% 42% 8
Public Affairs 4.82 3% 4% 8% 10% 42% 33% 23
Physical Biosciences 4.87 6% 5% 5% 8% 34% 43% 71
Physics 5.08 0% 2% 4% 15% 40% 38% 41
Fewer Than 6 4.86 0% 5% 7% 13% 47% 28% 16
5.1 I have the appropriate amount of independence to do my work.
Mean SD D SD SA A SA Count Std. Dev.
All 5.25 1% 2% 2% 6% 43% 46% 2023 0.95
Accelerator & Fusion Research 5.27 0% 0% 5% 7% 45% 43% 44 0.79
Advanced Light Source 5.06 3% 1% 4% 13% 38% 42% 77 1.12
Office of Chief Finance Officer 5.17 2% 2% 2% 7% 44% 42% 178 1.02
Chemical Sciences 5.14 4% 0% 4% 14% 29% 50% 28 1.18
Computational Research Div 5.26 3% 2% 1% 3% 41% 50% 121 1.09
Environmental Energy Tech 5.33 1% 1% 1% 6% 48% 44% 167 0.76
Engineering 5.31 1% 2% 2% 5% 44% 47% 187 0.86
Environment, Health & Safety 5.17 1% 1% 4% 8% 48% 39% 103 0.92
Earth Sciences 5.36 0% 3% 1% 5% 40% 51% 105 0.86
Facilities 5.09 1% 2% 3% 6% 56% 32% 182 0.93
Genomics Division 5.14 1% 5% 4% 5% 42% 43% 111 1.08
Human Resources 5.08 3% 2% 2% 11% 45% 38% 65 1.09
Information Technology Div 5.27 0% 2% 5% 6% 40% 48% 126 0.90
Laboratory Directorate 5.37 2% 2% 5% 2% 32% 59% 63 1.04
Life Sciences 5.29 1% 2% 1% 10% 39% 48% 132 0.89
Materials Sciences 5.48 1% 0% 2% 5% 28% 63% 81 0.87
NERSC 5.21 0% 2% 2% 6% 51% 38% 47 0.83
Nuclear Science 5.38 2% 0% 0% 4% 43% 51% 47 0.87
Operations Division 5.75 0% 0% 0% 0% 25% 75% 8 0.46
Public Affairs 5.48 0% 0% 0% 0% 52% 48% 23 0.51
Physical Biosciences 5.32 3% 3% 0% 4% 34% 56% 71 1.11
Physics 5.51 0% 0% 0% 7% 34% 59% 41 0.64
Fewer Than 6 5.13 0% 13% 6% 0% 19% 63% 16 1.45

Berkeley Lab 2010 Employee Survey • Sense of Shared Mission | 85
MOR Associates, Inc.
5.2 My ideas on work process and procedure improvements are valued.
Mean SD D SD SA A SA Count Std. Dev.
All 4.69 3% 5% 6% 16% 44% 25% 1949 1.25
Accelerator & Fusion Research 5.05 0% 2% 0% 21% 44% 33% 43 0.87
Advanced Light Source 4.73 3% 9% 3% 8% 55% 23% 77 1.26
Office of Chief Finance Officer 4.58 6% 5% 7% 16% 39% 27% 176 1.39
Chemical Sciences 4.35 4% 8% 15% 15% 38% 19% 26 1.38
Computational Research Div 4.71 7% 3% 5% 13% 43% 29% 116 1.38
Environmental Energy Tech 4.75 3% 3% 4% 20% 45% 25% 158 1.16
Engineering 4.75 3% 4% 6% 13% 49% 24% 178 1.18
Environment, Health & Safety 4.70 3% 4% 5% 22% 40% 26% 100 1.20
Earth Sciences 4.72 1% 6% 6% 21% 37% 29% 98 1.18
Facilities 4.47 4% 6% 7% 18% 50% 15% 179 1.25
Genomics Division 4.72 3% 8% 3% 13% 48% 26% 105 1.26
Human Resources 4.68 0% 3% 8% 25% 44% 19% 63 0.98
Information Technology Div 4.65 6% 2% 6% 13% 48% 23% 124 1.33
Laboratory Directorate 4.81 0% 8% 8% 10% 44% 30% 63 1.19
Life Sciences 5.00 2% 3% 4% 10% 46% 35% 124 1.08
Materials Sciences 4.72 4% 4% 8% 14% 42% 28% 78 1.28
NERSC 4.48 2% 7% 11% 16% 48% 16% 44 1.23
Nuclear Science 4.67 2% 4% 11% 18% 36% 29% 45 1.26
Operations Division 5.00 0% 0% 0% 13% 75% 13% 8 0.53
Public Affairs 4.52 4% 4% 13% 17% 35% 26% 23 1.38
Physical Biosciences 4.57 9% 7% 7% 9% 28% 39% 67 1.65
Physics 4.73 0% 5% 5% 25% 43% 23% 40 1.04
Fewer Than 6 4.57 0% 7% 7% 14% 64% 7% 14 1.02
5.3 My colleagues treat me with respect.
Mean SD D SD SA A SA Count Std. Dev.
All 5.10 1% 1% 3% 10% 52% 33% 2000 0.89
Accelerator & Fusion Research 5.32 0% 0% 0% 7% 55% 39% 44 0.60
Advanced Light Source 5.10 1% 0% 4% 6% 59% 29% 78 0.85
Office of Chief Finance Officer 4.85 2% 3% 4% 13% 55% 23% 175 1.04
Chemical Sciences 5.00 4% 0% 4% 11% 50% 32% 28 1.09
Computational Research Div 5.32 0% 0% 2% 4% 55% 39% 120 0.63
Environmental Energy Tech 5.08 2% 1% 3% 10% 49% 35% 167 0.98
Engineering 5.13 2% 1% 3% 5% 58% 32% 184 0.88
Environment, Health & Safety 4.96 1% 2% 5% 11% 55% 26% 102 0.95
Earth Sciences 5.15 1% 0% 2% 18% 39% 40% 102 0.89
Facilities 5.08 0% 1% 4% 11% 53% 31% 180 0.83
Genomics Division 5.10 0% 1% 1% 13% 58% 27% 110 0.72
Human Resources 5.03 2% 0% 3% 11% 59% 26% 66 0.86
Information Technology Div 5.23 0% 1% 1% 7% 57% 34% 125 0.69
Laboratory Directorate 5.37 0% 0% 0% 10% 44% 47% 62 0.66
Life Sciences 5.15 1% 2% 2% 11% 49% 36% 130 0.88
Materials Sciences 5.04 1% 1% 6% 12% 42% 37% 81 1.03
NERSC 5.04 0% 2% 2% 11% 58% 27% 45 0.82
Nuclear Science 5.13 0% 0% 2% 15% 50% 33% 46 0.75
Operations Division 5.29 0% 0% 0% 14% 43% 43% 7 0.76
Public Affairs 4.87 0% 9% 0% 13% 52% 26% 23 1.10
Physical Biosciences 4.93 3% 6% 4% 9% 39% 39% 69 1.29
Physics 5.17 0% 0% 2% 17% 41% 39% 41 0.80
Fewer Than 6 5.13 0% 0% 0% 13% 60% 27% 15 0.64

86 | Sense of Shared Mission • Berkeley Lab 2010 Employee Climate Survey
MOR Associates, Inc.
5.4 My opinions are valued by my supervisor.
Mean SD D SD SA A SA Count Std. Dev.
All 4.81 3% 4% 5% 15% 44% 29% 1948 1.20
Accelerator & Fusion Research 5.09 0% 2% 0% 20% 41% 36% 44 0.88
Advanced Light Source 4.49 7% 5% 5% 16% 50% 17% 76 1.35
Office of Chief Finance Officer 4.66 4% 5% 6% 17% 39% 28% 173 1.31
Chemical Sciences 4.40 4% 12% 8% 12% 44% 20% 25 1.44
Computational Research Div 4.71 6% 3% 6% 14% 41% 31% 118 1.37
Environmental Energy Tech 4.87 1% 5% 4% 13% 48% 28% 159 1.10
Engineering 4.94 2% 3% 4% 11% 53% 28% 177 1.03
Environment, Health & Safety 4.74 2% 5% 5% 19% 43% 26% 100 1.17
Earth Sciences 4.98 2% 1% 6% 12% 47% 33% 101 1.05
Facilities 4.63 5% 4% 3% 22% 44% 22% 176 1.26
Genomics Division 4.97 2% 1% 4% 13% 51% 29% 104 0.99
Human Resources 4.77 2% 6% 6% 12% 48% 26% 65 1.18
Information Technology Div 4.72 5% 3% 6% 15% 45% 27% 124 1.28
Laboratory Directorate 5.05 0% 3% 8% 13% 31% 44% 61 1.10
Life Sciences 5.04 2% 2% 2% 12% 45% 36% 129 1.08
Materials Sciences 5.00 1% 1% 3% 18% 45% 32% 78 0.97
NERSC 4.70 2% 5% 7% 20% 39% 27% 44 1.21
Nuclear Science 4.84 2% 2% 9% 19% 30% 37% 43 1.23
Operations Division 5.38 0% 0% 0% 0% 63% 38% 8 0.52
Public Affairs 4.39 9% 4% 17% 9% 30% 30% 23 1.62
Physical Biosciences 4.66 9% 3% 9% 9% 33% 37% 67 1.56
Physics 4.93 0% 3% 10% 13% 43% 33% 40 1.05
Fewer Than 6 4.62 0% 0% 15% 23% 46% 15% 13 0.96
6 Diversity Valued
Mean SD D SD SA A SA Count
All 4.85 2% 4% 5% 15% 45% 29% 2013
Accelerator & Fusion Research 5.18 1% 2% 1% 10% 50% 37% 43
Advanced Light Source 4.77 4% 5% 4% 14% 45% 29% 78
Office of Chief Finance Officer 4.53 3% 6% 6% 21% 47% 17% 178
Chemical Sciences 4.93 4% 3% 6% 15% 31% 43% 28
Computational Research Div 5.30 0% 1% 2% 8% 41% 47% 122
Environmental Energy Tech 4.99 1% 3% 6% 12% 44% 35% 164
Engineering 4.79 2% 3% 5% 18% 48% 23% 185
Environment, Health & Safety 4.67 1% 6% 9% 15% 47% 22% 102
Earth Sciences 4.85 1% 2% 4% 24% 39% 29% 104
Facilities 4.73 2% 4% 6% 17% 50% 21% 181
Genomics Division 4.81 2% 3% 6% 16% 47% 26% 110
Human Resources 4.64 3% 6% 6% 19% 45% 22% 67
Information Technology Div 4.82 4% 3% 4% 14% 48% 27% 126
Laboratory Directorate 5.10 2% 1% 3% 10% 45% 38% 62
Life Sciences 4.92 2% 4% 3% 11% 46% 33% 131
Materials Sciences 4.92 1% 3% 5% 16% 43% 31% 81
NERSC 4.86 1% 2% 6% 18% 50% 24% 46
Nuclear Science 4.94 1% 4% 5% 16% 38% 35% 47
Operations Division 4.96 0% 0% 0% 32% 41% 27% 8
Public Affairs 4.94 0% 2% 6% 16% 49% 28% 23
Physical Biosciences 4.80 6% 4% 8% 7% 36% 39% 69
Physics 5.18 0% 1% 2% 13% 46% 39% 41
Fewer Than 6 4.40 3% 7% 12% 21% 39% 18% 17

Berkeley Lab 2010 Employee Survey • Sense of Shared Mission | 87
MOR Associates, Inc.
6.1 I work with colleagues who genuinely welcome differences.
Mean SD D SD SA A SA Count Std. Dev.
All 4.86 1% 3% 4% 16% 49% 26% 1944 1.04
Accelerator & Fusion Research 5.10 0% 0% 0% 20% 50% 30% 40 0.71
Advanced Light Source 4.92 1% 4% 1% 12% 59% 23% 78 0.98
Office of Chief Finance Officer 4.37 3% 7% 8% 25% 48% 10% 167 1.16
Chemical Sciences 5.11 4% 0% 4% 11% 39% 43% 28 1.13
Computational Research Div 5.29 0% 1% 3% 5% 48% 43% 119 0.78
Environmental Energy Tech 5.09 1% 3% 4% 9% 49% 35% 159 0.96
Engineering 4.82 1% 2% 3% 20% 53% 20% 176 0.95
Environment, Health & Safety 4.58 2% 5% 11% 16% 48% 19% 101 1.18
Earth Sciences 4.94 0% 2% 2% 27% 39% 31% 98 0.92
Facilities 4.58 2% 5% 8% 22% 45% 18% 172 1.13
Genomics Division 5.00 0% 1% 5% 16% 50% 28% 106 0.85
Human Resources 4.57 3% 6% 3% 22% 51% 15% 67 1.16
Information Technology Div 4.89 2% 2% 1% 18% 50% 26% 123 1.04
Laboratory Directorate 5.16 0% 0% 5% 10% 50% 35% 62 0.79
Life Sciences 5.09 2% 2% 2% 9% 54% 32% 124 0.94
Materials Sciences 4.85 3% 5% 0% 18% 48% 28% 80 1.14
NERSC 4.87 0% 2% 0% 24% 56% 18% 45 0.79
Nuclear Science 4.91 0% 7% 4% 13% 43% 33% 46 1.11
Operations Division 5.14 0% 0% 0% 14% 57% 29% 7 0.69
Public Affairs 4.83 0% 0% 9% 22% 48% 22% 23 0.89
Physical Biosciences 4.75 6% 3% 10% 6% 40% 34% 67 1.42
Physics 5.29 0% 0% 0% 12% 46% 41% 41 0.68
Fewer Than 6 4.53 0% 7% 13% 20% 40% 20% 15 1.19
6.2 The benefits of a diverse work group are clearly communicated in my Division.
Mean SD D SD SA A SA Count Std. Dev.
All 4.58 2% 6% 8% 21% 40% 23% 1900 1.22
Accelerator & Fusion Research 5.15 0% 5% 0% 8% 50% 38% 40 0.95
Advanced Light Source 4.41 4% 9% 11% 17% 35% 24% 75 1.42
Office of Chief Finance Officer 4.40 4% 8% 6% 27% 40% 16% 169 1.26
Chemical Sciences 4.41 7% 7% 11% 19% 22% 33% 27 1.60
Computational Research Div 5.10 1% 2% 4% 12% 44% 38% 114 0.97
Environmental Energy Tech 4.68 1% 5% 10% 18% 39% 26% 148 1.18
Engineering 4.49 3% 7% 10% 21% 39% 21% 178 1.27
Environment, Health & Safety 4.31 3% 9% 12% 20% 42% 14% 100 1.28
Earth Sciences 4.43 2% 1% 12% 35% 35% 14% 97 1.05
Facilities 4.63 1% 6% 5% 21% 47% 19% 170 1.12
Genomics Division 4.48 3% 5% 9% 25% 40% 18% 102 1.20
Human Resources 4.49 3% 3% 13% 24% 37% 21% 63 1.23
Information Technology Div 4.56 4% 5% 8% 18% 42% 23% 120 1.30
Laboratory Directorate 4.90 3% 3% 3% 13% 44% 33% 61 1.19
Life Sciences 4.57 3% 9% 4% 18% 41% 24% 121 1.33
Materials Sciences 4.56 0% 4% 12% 26% 38% 19% 73 1.07
NERSC 4.45 0% 5% 14% 25% 45% 11% 44 1.02
Nuclear Science 4.54 2% 4% 7% 33% 33% 22% 46 1.17
Operations Division 4.57 0% 0% 0% 57% 29% 14% 7 0.79
Public Affairs 4.59 0% 9% 14% 14% 36% 27% 22 1.30
Physical Biosciences 4.54 6% 7% 10% 13% 29% 34% 68 1.52
Physics 4.95 0% 3% 3% 23% 43% 30% 40 0.93
Fewer Than 6 4.13 0% 13% 13% 33% 27% 13% 15 1.25

88 | Sense of Shared Mission • Berkeley Lab 2010 Employee Climate Survey
MOR Associates, Inc.
Mean SD D SD SA A SA Count Std. Dev.
All 5.20 2% 2% 2% 7% 45% 43% 1952 0.97
Accelerator & Fusion Research 5.40 0% 2% 0% 2% 45% 50% 42 0.77
Advanced Light Source 5.09 3% 4% 0% 10% 42% 42% 77 1.14
Office of Chief Finance Officer 5.02 1% 3% 1% 11% 57% 27% 172 0.93
Chemical Sciences 5.30 0% 0% 7% 11% 26% 56% 27 0.95
Computational Research Div 5.62 0% 0% 0% 5% 28% 67% 120 0.58
Environmental Energy Tech 5.30 1% 1% 4% 4% 42% 48% 158 0.88
Engineering 5.15 1% 1% 2% 11% 51% 35% 173 0.82
Environment, Health & Safety 5.11 0% 3% 3% 9% 50% 35% 100 0.91
Earth Sciences 5.26 1% 1% 2% 10% 40% 47% 101 0.91
Facilities 5.03 2% 2% 3% 8% 53% 32% 173 1.02
Genomics Division 5.00 3% 4% 5% 5% 45% 38% 110 1.20
Human Resources 5.05 3% 2% 0% 14% 47% 35% 66 1.06
Information Technology Div 5.06 5% 2% 2% 5% 46% 41% 125 1.23
Laboratory Directorate 5.43 2% 0% 2% 3% 37% 57% 60 0.87
Life Sciences 5.22 2% 2% 0% 5% 47% 44% 124 1.02
Materials Sciences 5.47 0% 1% 0% 4% 40% 55% 78 0.70
NERSC 5.33 2% 0% 2% 2% 46% 48% 46 0.92
Nuclear Science 5.28 0% 4% 0% 11% 34% 51% 47 0.97
Operations Division 5.25 0% 0% 0% 13% 50% 38% 8 0.71
Public Affairs 5.35 0% 0% 0% 4% 57% 39% 23 0.57
Physical Biosciences 5.17 5% 2% 3% 3% 38% 49% 65 1.23
Physics 5.44 0% 0% 2% 2% 44% 51% 41 0.67
Fewer Than 6 4.75 0% 6% 6% 19% 44% 25% 16 1.13
6.4 I can comfortably talk about my differences with my colleagues.
Mean SD D SD SA A SA Count Std. Dev.
All 4.75 2% 4% 6% 17% 47% 24% 1905 1.13
Accelerator & Fusion Research 5.07 2% 0% 2% 10% 54% 32% 41 0.96
Advanced Light Source 4.66 7% 3% 4% 16% 45% 26% 74 1.35
Office of Chief Finance Officer 4.34 4% 8% 8% 23% 43% 13% 166 1.26
Chemical Sciences 4.92 4% 4% 0% 19% 35% 38% 26 1.26
Computational Research Div 5.19 0% 3% 2% 11% 43% 41% 116 0.89
Environmental Energy Tech 4.89 0% 4% 7% 15% 46% 29% 158 1.03
Engineering 4.70 2% 3% 6% 21% 51% 18% 174 1.03
Environment, Health & Safety 4.66 0% 7% 10% 14% 47% 21% 99 1.14
Earth Sciences 4.76 2% 4% 1% 25% 42% 25% 91 1.12
Facilities 4.67 2% 3% 6% 18% 53% 17% 174 1.09
Genomics Division 4.75 1% 4% 7% 16% 52% 21% 102 1.05
Human Resources 4.45 2% 12% 8% 15% 45% 18% 65 1.31
Information Technology Div 4.75 3% 2% 4% 17% 53% 20% 124 1.10
Laboratory Directorate 4.92 3% 0% 3% 15% 51% 27% 59 1.06
Life Sciences 4.79 2% 5% 7% 14% 41% 31% 125 1.23
Materials Sciences 4.78 3% 1% 7% 18% 47% 24% 76 1.09
NERSC 4.78 0% 2% 7% 20% 53% 18% 45 0.90
Nuclear Science 5.02 0% 2% 9% 9% 43% 36% 44 1.02
Operations Division 4.86 0% 0% 0% 43% 29% 29% 7 0.90
Public Affairs 5.00 0% 0% 0% 23% 55% 23% 22 0.69
Physical Biosciences 4.75 6% 5% 9% 5% 38% 38% 64 1.48
Physics 5.05 0% 3% 3% 13% 50% 32% 38 0.90
Fewer Than 6 4.20 13% 0% 13% 13% 47% 13% 15 1.57
6.3 I find that the contributions and behaviors most valued in my Division are not specific to any one race,
ethnicity, gender, age, religion, disability or sexual orientation.

Berkeley Lab 2010 Employee Survey • Sense of Shared Mission | 89
MOR Associates, Inc.
7 Pace of Work
Mean SD D SD SA A SA Count
All 4.14 6% 9% 13% 20% 37% 14% 2025
Accelerator & Fusion Research 4.05 7% 10% 14% 25% 30% 15% 45
Advanced Light Source 3.66 12% 14% 16% 20% 26% 11% 78
Office of Chief Finance Officer 3.81 9% 14% 13% 23% 34% 7% 179
Chemical Sciences 3.88 9% 10% 19% 17% 35% 9% 28
Computational Research Div 4.43 5% 5% 10% 19% 44% 16% 120
Environmental Energy Tech 3.95 9% 12% 13% 19% 35% 12% 166
Engineering 4.36 4% 8% 10% 18% 44% 15% 186
Environment, Health & Safety 3.77 10% 17% 13% 15% 33% 11% 103
Earth Sciences 4.27 3% 6% 18% 24% 33% 16% 104
Facilities 4.19 6% 8% 10% 23% 39% 13% 181
Genomics Division 4.48 2% 7% 11% 18% 43% 18% 111
Human Resources 3.13 18% 17% 24% 23% 13% 5% 67
Information Technology Div 4.28 3% 6% 16% 22% 38% 15% 126
Laboratory Directorate 4.13 7% 12% 13% 15% 35% 18% 63
Life Sciences 4.46 5% 5% 10% 21% 36% 22% 133
Materials Sciences 4.26 4% 8% 16% 18% 37% 17% 81
NERSC 3.97 9% 10% 13% 26% 31% 12% 47
Nuclear Science 4.57 2% 5% 9% 18% 49% 17% 47
Operations Division 4.48 0% 6% 6% 28% 53% 6% 9
Public Affairs 3.34 12% 18% 25% 21% 18% 7% 23
Physical Biosciences 4.60 2% 4% 14% 15% 43% 22% 71
Physics 4.29 4% 9% 10% 24% 40% 13% 41
Fewer Than 6 4.38 3% 6% 16% 13% 45% 16% 16
7.1 I work in an environment where there is a reasonable workload.
Mean SD D SD SA A SA Count Std. Dev.
All 4.30 6% 9% 10% 17% 41% 17% 2008 1.41
Accelerator & Fusion Research 4.36 2% 11% 11% 18% 40% 18% 45 1.33
Advanced Light Source 3.78 14% 14% 9% 17% 30% 14% 76 1.69
Office of Chief Finance Officer 3.93 8% 15% 11% 18% 37% 11% 177 1.52
Chemical Sciences 4.00 11% 7% 18% 11% 43% 11% 28 1.54
Computational Research Div 4.55 4% 6% 6% 19% 45% 20% 119 1.28
Environmental Energy Tech 4.02 10% 13% 11% 13% 36% 16% 166 1.59
Engineering 4.53 4% 6% 9% 14% 51% 17% 185 1.26
Environment, Health & Safety 3.96 7% 18% 12% 12% 38% 14% 103 1.55
Earth Sciences 4.51 1% 4% 17% 21% 36% 21% 103 1.17
Facilities 4.43 6% 8% 6% 18% 43% 19% 180 1.39
Genomics Division 4.71 2% 4% 10% 12% 52% 21% 111 1.12
Human Resources 3.11 17% 19% 28% 16% 13% 8% 64 1.50
Information Technology Div 4.52 2% 5% 10% 21% 46% 16% 125 1.16
Laboratory Directorate 4.13 10% 10% 11% 16% 37% 17% 63 1.56
Life Sciences 4.55 5% 5% 7% 20% 40% 23% 132 1.33
Materials Sciences 4.49 4% 6% 10% 19% 40% 21% 80 1.31
NERSC 4.11 9% 9% 11% 23% 34% 15% 47 1.48
Nuclear Science 4.81 2% 2% 4% 17% 53% 21% 47 1.04
Operations Division 4.63 0% 13% 0% 13% 63% 13% 8 1.19
Public Affairs 3.78 4% 17% 22% 17% 30% 9% 23 1.41
Physical Biosciences 4.71 3% 1% 10% 17% 43% 25% 69 1.16
Physics 4.49 2% 7% 10% 17% 46% 17% 41 1.25
Fewer Than 6 4.50 6% 6% 6% 13% 50% 19% 16 1.41
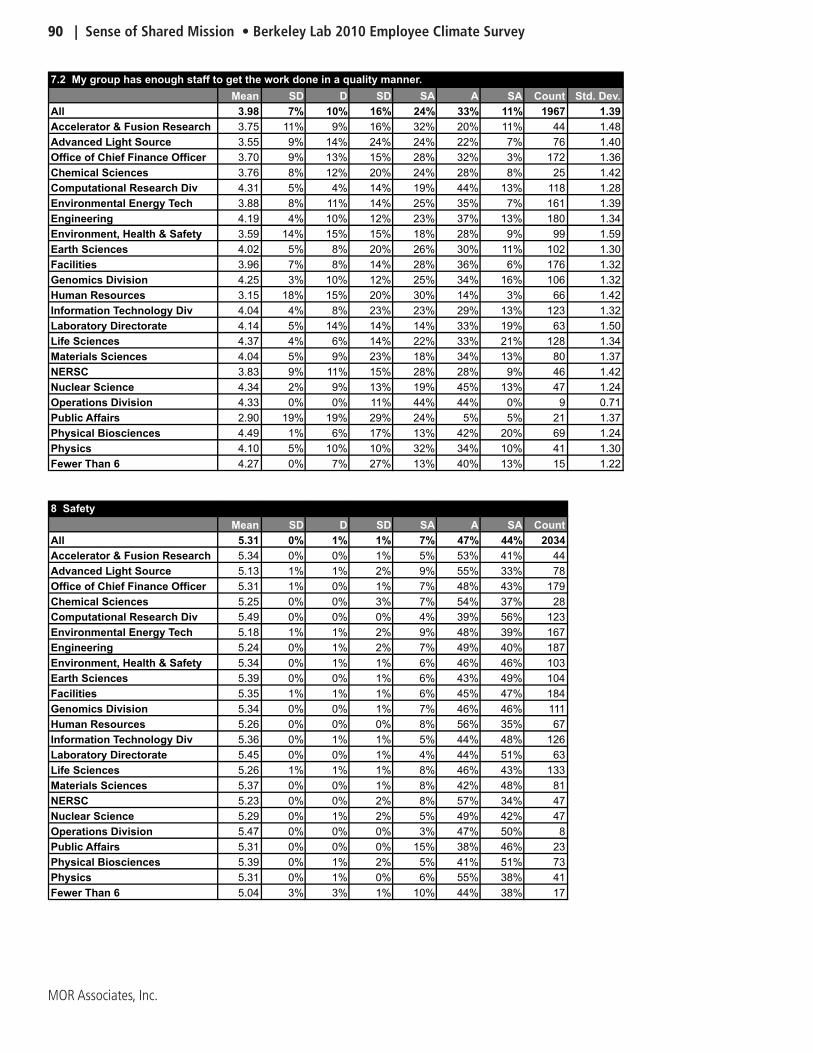
90 | Sense of Shared Mission • Berkeley Lab 2010 Employee Climate Survey
MOR Associates, Inc.
7.2 My group has enough staff to get the work done in a quality manner.
Mean SD D SD SA A SA Count Std. Dev.
All 3.98 7% 10% 16% 24% 33% 11% 1967 1.39
Accelerator & Fusion Research 3.75 11% 9% 16% 32% 20% 11% 44 1.48
Advanced Light Source 3.55 9% 14% 24% 24% 22% 7% 76 1.40
Office of Chief Finance Officer 3.70 9% 13% 15% 28% 32% 3% 172 1.36
Chemical Sciences 3.76 8% 12% 20% 24% 28% 8% 25 1.42
Computational Research Div 4.31 5% 4% 14% 19% 44% 13% 118 1.28
Environmental Energy Tech 3.88 8% 11% 14% 25% 35% 7% 161 1.39
Engineering 4.19 4% 10% 12% 23% 37% 13% 180 1.34
Environment, Health & Safety 3.59 14% 15% 15% 18% 28% 9% 99 1.59
Earth Sciences 4.02 5% 8% 20% 26% 30% 11% 102 1.30
Facilities 3.96 7% 8% 14% 28% 36% 6% 176 1.32
Genomics Division 4.25 3% 10% 12% 25% 34% 16% 106 1.32
Human Resources 3.15 18% 15% 20% 30% 14% 3% 66 1.42
Information Technology Div 4.04 4% 8% 23% 23% 29% 13% 123 1.32
Laboratory Directorate 4.14 5% 14% 14% 14% 33% 19% 63 1.50
Life Sciences 4.37 4% 6% 14% 22% 33% 21% 128 1.34
Materials Sciences 4.04 5% 9% 23% 18% 34% 13% 80 1.37
NERSC 3.83 9% 11% 15% 28% 28% 9% 46 1.42
Nuclear Science 4.34 2% 9% 13% 19% 45% 13% 47 1.24
Operations Division 4.33 0% 0% 11% 44% 44% 0% 9 0.71
Public Affairs 2.90 19% 19% 29% 24% 5% 5% 21 1.37
Physical Biosciences 4.49 1% 6% 17% 13% 42% 20% 69 1.24
Physics 4.10 5% 10% 10% 32% 34% 10% 41 1.30
Fewer Than 6 4.27 0% 7% 27% 13% 40% 13% 15 1.22
8 Safety
Mean SD D SD SA A SA Count
All 5.31 0% 1% 1% 7% 47% 44% 2034
Accelerator & Fusion Research 5.34 0% 0% 1% 5% 53% 41% 44
Advanced Light Source 5.13 1% 1% 2% 9% 55% 33% 78
Office of Chief Finance Officer 5.31 1% 0% 1% 7% 48% 43% 179
Chemical Sciences 5.25 0% 0% 3% 7% 54% 37% 28
Computational Research Div 5.49 0% 0% 0% 4% 39% 56% 123
Environmental Energy Tech 5.18 1% 1% 2% 9% 48% 39% 167
Engineering 5.24 0% 1% 2% 7% 49% 40% 187
Environment, Health & Safety 5.34 0% 1% 1% 6% 46% 46% 103
Earth Sciences 5.39 0% 0% 1% 6% 43% 49% 104
Facilities 5.35 1% 1% 1% 6% 45% 47% 184
Genomics Division 5.34 0% 0% 1% 7% 46% 46% 111
Human Resources 5.26 0% 0% 0% 8% 56% 35% 67
Information Technology Div 5.36 0% 1% 1% 5% 44% 48% 126
Laboratory Directorate 5.45 0% 0% 1% 4% 44% 51% 63
Life Sciences 5.26 1% 1% 1% 8% 46% 43% 133
Materials Sciences 5.37 0% 0% 1% 8% 42% 48% 81
NERSC 5.23 0% 0% 2% 8% 57% 34% 47
Nuclear Science 5.29 0% 1% 2% 5% 49% 42% 47
Operations Division 5.47 0% 0% 0% 3% 47% 50% 8
Public Affairs 5.31 0% 0% 0% 15% 38% 46% 23
Physical Biosciences 5.39 0% 1% 2% 5% 41% 51% 73
Physics 5.31 0% 1% 0% 6% 55% 38% 41
Fewer Than 6 5.04 3% 3% 1% 10% 44% 38% 17
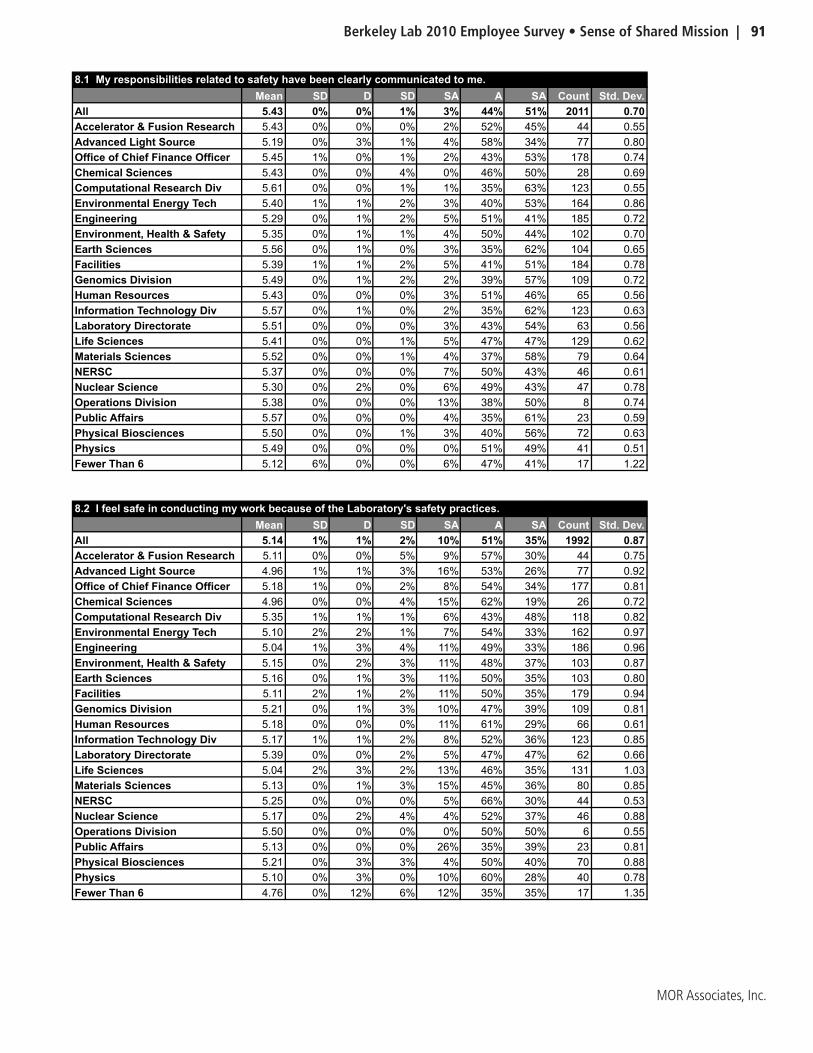
Berkeley Lab 2010 Employee Survey • Sense of Shared Mission | 91
MOR Associates, Inc.
8.1 My responsibilities related to safety have been clearly communicated to me.
Mean SD D SD SA A SA Count Std. Dev.
All 5.43 0% 0% 1% 3% 44% 51% 2011 0.70
Accelerator & Fusion Research 5.43 0% 0% 0% 2% 52% 45% 44 0.55
Advanced Light Source 5.19 0% 3% 1% 4% 58% 34% 77 0.80
Office of Chief Finance Officer 5.45 1% 0% 1% 2% 43% 53% 178 0.74
Chemical Sciences 5.43 0% 0% 4% 0% 46% 50% 28 0.69
Computational Research Div 5.61 0% 0% 1% 1% 35% 63% 123 0.55
Environmental Energy Tech 5.40 1% 1% 2% 3% 40% 53% 164 0.86
Engineering 5.29 0% 1% 2% 5% 51% 41% 185 0.72
Environment, Health & Safety 5.35 0% 1% 1% 4% 50% 44% 102 0.70
Earth Sciences 5.56 0% 1% 0% 3% 35% 62% 104 0.65
Facilities 5.39 1% 1% 2% 5% 41% 51% 184 0.78
Genomics Division 5.49 0% 1% 2% 2% 39% 57% 109 0.72
Human Resources 5.43 0% 0% 0% 3% 51% 46% 65 0.56
Information Technology Div 5.57 0% 1% 0% 2% 35% 62% 123 0.63
Laboratory Directorate 5.51 0% 0% 0% 3% 43% 54% 63 0.56
Life Sciences 5.41 0% 0% 1% 5% 47% 47% 129 0.62
Materials Sciences 5.52 0% 0% 1% 4% 37% 58% 79 0.64
NERSC 5.37 0% 0% 0% 7% 50% 43% 46 0.61
Nuclear Science 5.30 0% 2% 0% 6% 49% 43% 47 0.78
Operations Division 5.38 0% 0% 0% 13% 38% 50% 8 0.74
Public Affairs 5.57 0% 0% 0% 4% 35% 61% 23 0.59
Physical Biosciences 5.50 0% 0% 1% 3% 40% 56% 72 0.63
Physics 5.49 0% 0% 0% 0% 51% 49% 41 0.51
Fewer Than 6 5.12 6% 0% 0% 6% 47% 41% 17 1.22
8.2 I feel safe in conducting my work because of the Laboratory's safety practices.
Mean SD D SD SA A SA Count Std. Dev.
All 5.14 1% 1% 2% 10% 51% 35% 1992 0.87
Accelerator & Fusion Research 5.11 0% 0% 5% 9% 57% 30% 44 0.75
Advanced Light Source 4.96 1% 1% 3% 16% 53% 26% 77 0.92
Office of Chief Finance Officer 5.18 1% 0% 2% 8% 54% 34% 177 0.81
Chemical Sciences 4.96 0% 0% 4% 15% 62% 19% 26 0.72
Computational Research Div 5.35 1% 1% 1% 6% 43% 48% 118 0.82
Environmental Energy Tech 5.10 2% 2% 1% 7% 54% 33% 162 0.97
Engineering 5.04 1% 3% 4% 11% 49% 33% 186 0.96
Environment, Health & Safety 5.15 0% 2% 3% 11% 48% 37% 103 0.87
Earth Sciences 5.16 0% 1% 3% 11% 50% 35% 103 0.80
Facilities 5.11 2% 1% 2% 11% 50% 35% 179 0.94
Genomics Division 5.21 0% 1% 3% 10% 47% 39% 109 0.81
Human Resources 5.18 0% 0% 0% 11% 61% 29% 66 0.61
Information Technology Div 5.17 1% 1% 2% 8% 52% 36% 123 0.85
Laboratory Directorate 5.39 0% 0% 2% 5% 47% 47% 62 0.66
Life Sciences 5.04 2% 3% 2% 13% 46% 35% 131 1.03
Materials Sciences 5.13 0% 1% 3% 15% 45% 36% 80 0.85
NERSC 5.25 0% 0% 0% 5% 66% 30% 44 0.53
Nuclear Science 5.17 0% 2% 4% 4% 52% 37% 46 0.88
Operations Division 5.50 0% 0% 0% 0% 50% 50% 6 0.55
Public Affairs 5.13 0% 0% 0% 26% 35% 39% 23 0.81
Physical Biosciences 5.21 0% 3% 3% 4% 50% 40% 70 0.88
Physics 5.10 0% 3% 0% 10% 60% 28% 40 0.78
Fewer Than 6 4.76 0% 12% 6% 12% 35% 35% 17 1.35
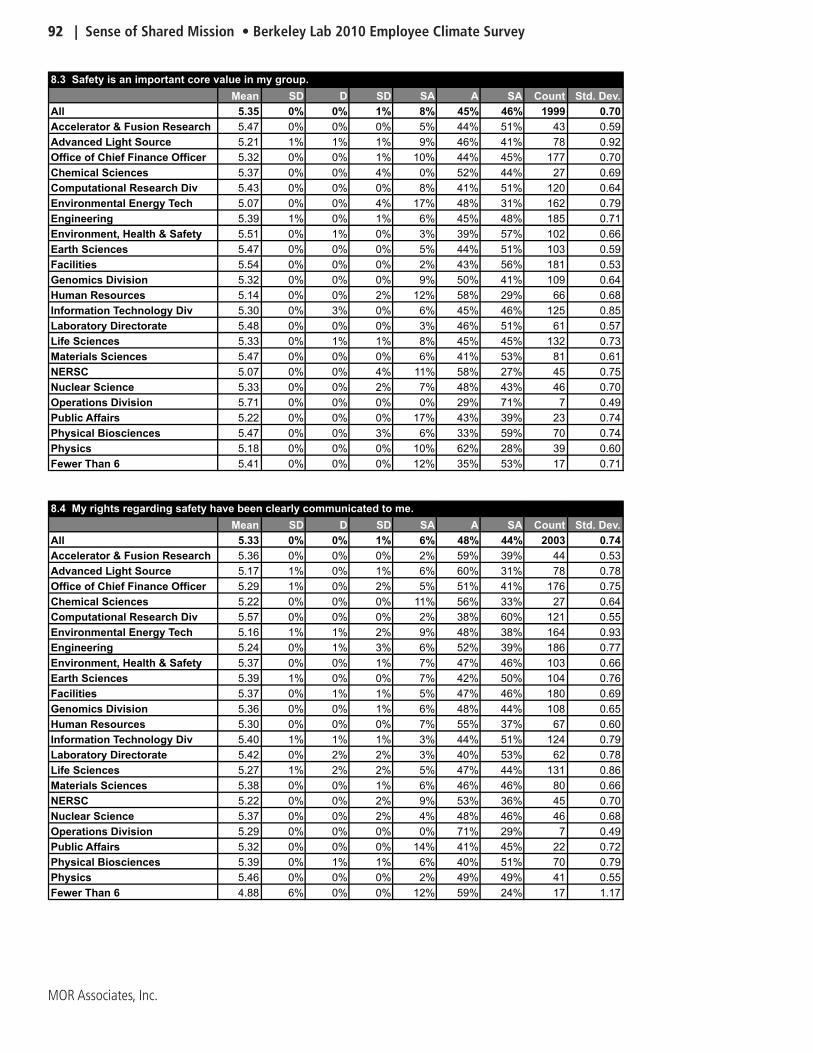
92 | Sense of Shared Mission • Berkeley Lab 2010 Employee Climate Survey
MOR Associates, Inc.
8.3 Safety is an important core value in my group.
Mean SD D SD SA A SA Count Std. Dev.
All 5.35 0% 0% 1% 8% 45% 46% 1999 0.70
Accelerator & Fusion Research 5.47 0% 0% 0% 5% 44% 51% 43 0.59
Advanced Light Source 5.21 1% 1% 1% 9% 46% 41% 78 0.92
Office of Chief Finance Officer 5.32 0% 0% 1% 10% 44% 45% 177 0.70
Chemical Sciences 5.37 0% 0% 4% 0% 52% 44% 27 0.69
Computational Research Div 5.43 0% 0% 0% 8% 41% 51% 120 0.64
Environmental Energy Tech 5.07 0% 0% 4% 17% 48% 31% 162 0.79
Engineering 5.39 1% 0% 1% 6% 45% 48% 185 0.71
Environment, Health & Safety 5.51 0% 1% 0% 3% 39% 57% 102 0.66
Earth Sciences 5.47 0% 0% 0% 5% 44% 51% 103 0.59
Facilities 5.54 0% 0% 0% 2% 43% 56% 181 0.53
Genomics Division 5.32 0% 0% 0% 9% 50% 41% 109 0.64
Human Resources 5.14 0% 0% 2% 12% 58% 29% 66 0.68
Information Technology Div 5.30 0% 3% 0% 6% 45% 46% 125 0.85
Laboratory Directorate 5.48 0% 0% 0% 3% 46% 51% 61 0.57
Life Sciences 5.33 0% 1% 1% 8% 45% 45% 132 0.73
Materials Sciences 5.47 0% 0% 0% 6% 41% 53% 81 0.61
NERSC 5.07 0% 0% 4% 11% 58% 27% 45 0.75
Nuclear Science 5.33 0% 0% 2% 7% 48% 43% 46 0.70
Operations Division 5.71 0% 0% 0% 0% 29% 71% 7 0.49
Public Affairs 5.22 0% 0% 0% 17% 43% 39% 23 0.74
Physical Biosciences 5.47 0% 0% 3% 6% 33% 59% 70 0.74
Physics 5.18 0% 0% 0% 10% 62% 28% 39 0.60
Fewer Than 6 5.41 0% 0% 0% 12% 35% 53% 17 0.71
8.4 My rights regarding safety have been clearly communicated to me.
Mean SD D SD SA A SA Count Std. Dev.
All 5.33 0% 0% 1% 6% 48% 44% 2003 0.74
Accelerator & Fusion Research 5.36 0% 0% 0% 2% 59% 39% 44 0.53
Advanced Light Source 5.17 1% 0% 1% 6% 60% 31% 78 0.78
Office of Chief Finance Officer 5.29 1% 0% 2% 5% 51% 41% 176 0.75
Chemical Sciences 5.22 0% 0% 0% 11% 56% 33% 27 0.64
Computational Research Div 5.57 0% 0% 0% 2% 38% 60% 121 0.55
Environmental Energy Tech 5.16 1% 1% 2% 9% 48% 38% 164 0.93
Engineering 5.24 0% 1% 3% 6% 52% 39% 186 0.77
Environment, Health & Safety 5.37 0% 0% 1% 7% 47% 46% 103 0.66
Earth Sciences 5.39 1% 0% 0% 7% 42% 50% 104 0.76
Facilities 5.37 0% 1% 1% 5% 47% 46% 180 0.69
Genomics Division 5.36 0% 0% 1% 6% 48% 44% 108 0.65
Human Resources 5.30 0% 0% 0% 7% 55% 37% 67 0.60
Information Technology Div 5.40 1% 1% 1% 3% 44% 51% 124 0.79
Laboratory Directorate 5.42 0% 2% 2% 3% 40% 53% 62 0.78
Life Sciences 5.27 1% 2% 2% 5% 47% 44% 131 0.86
Materials Sciences 5.38 0% 0% 1% 6% 46% 46% 80 0.66
NERSC 5.22 0% 0% 2% 9% 53% 36% 45 0.70
Nuclear Science 5.37 0% 0% 2% 4% 48% 46% 46 0.68
Operations Division 5.29 0% 0% 0% 0% 71% 29% 7 0.49
Public Affairs 5.32 0% 0% 0% 14% 41% 45% 22 0.72
Physical Biosciences 5.39 0% 1% 1% 6% 40% 51% 70 0.79
Physics 5.46 0% 0% 0% 2% 49% 49% 41 0.55
Fewer Than 6 4.88 6% 0% 0% 12% 59% 24% 17 1.17

Berkeley Lab 2010 Employee Survey • Sense of Shared Mission | 93
MOR Associates, Inc.
9 Pay and Benefits
Mean SD D SD SA A SA Count
All 4.58 3% 5% 8% 18% 44% 21% 2026
Accelerator & Fusion Research 4.74 0% 5% 9% 10% 58% 17% 44
Advanced Light Source 4.54 4% 5% 8% 19% 44% 20% 77
Office of Chief Finance Officer 4.67 3% 4% 7% 19% 42% 25% 179
Chemical Sciences 4.62 0% 8% 8% 19% 46% 20% 27
Computational Research Div 4.73 3% 4% 6% 17% 46% 24% 120
Environmental Energy Tech 4.47 6% 5% 9% 17% 44% 19% 167
Engineering 4.59 2% 8% 5% 18% 46% 21% 187
Environment, Health & Safety 4.62 3% 6% 7% 19% 40% 25% 103
Earth Sciences 4.62 1% 4% 11% 18% 47% 18% 105
Facilities 4.51 3% 4% 10% 20% 45% 17% 184
Genomics Division 4.16 3% 11% 11% 27% 37% 11% 111
Human Resources 4.44 3% 7% 12% 19% 38% 21% 67
Information Technology Div 4.80 1% 3% 7% 19% 41% 28% 126
Laboratory Directorate 4.83 1% 5% 5% 18% 39% 31% 63
Life Sciences 4.56 3% 4% 10% 18% 45% 19% 131
Materials Sciences 4.59 2% 6% 11% 16% 41% 23% 81
NERSC 4.67 0% 5% 11% 14% 51% 18% 47
Nuclear Science 4.52 3% 9% 7% 13% 48% 20% 47
Operations Division 5.24 0% 0% 6% 3% 51% 39% 9
Public Affairs 4.53 2% 4% 10% 23% 43% 17% 23
Physical Biosciences 4.45 6% 5% 6% 22% 43% 19% 71
Physics 4.72 2% 5% 5% 13% 52% 21% 41
Fewer Than 6 3.92 14% 6% 16% 16% 34% 14% 16
9.1 I am satisfied with my benefits.
Mean SD D SD SA A SA Count Std. Dev.
All 4.83 2% 3% 5% 16% 49% 25% 1983 1.06
Accelerator & Fusion Research 4.93 0% 2% 5% 12% 60% 21% 43 0.86
Advanced Light Source 4.80 3% 1% 4% 19% 51% 22% 74 1.05
Office of Chief Finance Officer 5.06 1% 1% 3% 13% 51% 31% 176 0.88
Chemical Sciences 4.85 0% 4% 7% 15% 48% 26% 27 1.03
Computational Research Div 4.97 1% 2% 4% 15% 49% 29% 119 0.95
Environmental Energy Tech 4.76 4% 2% 7% 12% 51% 24% 165 1.19
Engineering 4.84 2% 4% 4% 15% 50% 25% 183 1.08
Environment, Health & Safety 4.82 2% 4% 4% 20% 39% 31% 98 1.16
Earth Sciences 4.88 0% 2% 5% 17% 56% 21% 102 0.86
Facilities 4.77 2% 2% 7% 18% 51% 21% 181 1.03
Genomics Division 4.36 2% 9% 6% 30% 39% 14% 108 1.20
Human Resources 5.00 0% 3% 9% 8% 45% 35% 65 1.05
Information Technology Div 5.02 1% 1% 4% 16% 46% 32% 124 0.92
Laboratory Directorate 5.11 0% 3% 3% 11% 44% 38% 63 0.95
Life Sciences 4.74 1% 3% 6% 22% 48% 20% 129 1.00
Materials Sciences 4.82 1% 5% 4% 17% 46% 27% 78 1.11
NERSC 4.78 0% 4% 4% 15% 61% 15% 46 0.92
Nuclear Science 4.74 2% 6% 9% 9% 47% 28% 47 1.26
Operations Division 5.25 0% 0% 0% 13% 50% 38% 8 0.71
Public Affairs 4.65 0% 9% 4% 22% 43% 22% 23 1.15
Physical Biosciences 4.63 3% 3% 6% 22% 48% 18% 67 1.13
Physics 4.90 2% 5% 0% 12% 54% 27% 41 1.11
Fewer Than 6 4.19 19% 0% 6% 13% 44% 19% 16 1.76
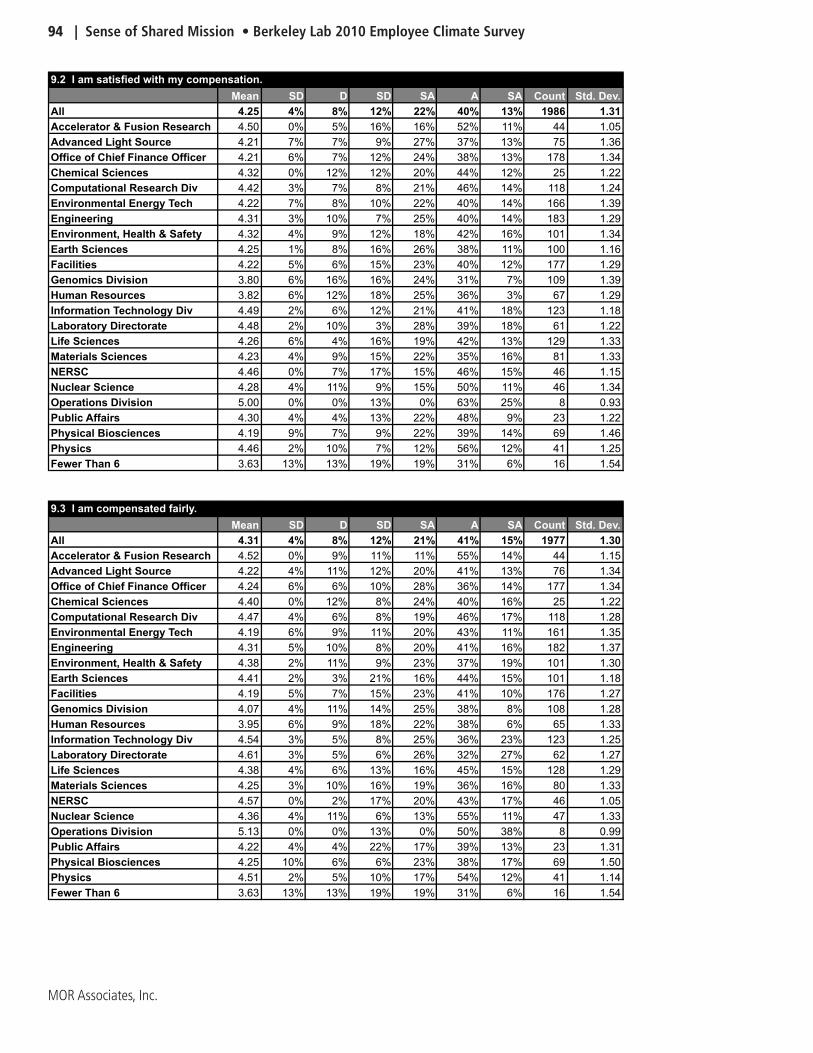
94 | Sense of Shared Mission • Berkeley Lab 2010 Employee Climate Survey
MOR Associates, Inc.
9.2 I am satisfied with my compensation.
Mean SD D SD SA A SA Count Std. Dev.
All 4.25 4% 8% 12% 22% 40% 13% 1986 1.31
Accelerator & Fusion Research 4.50 0% 5% 16% 16% 52% 11% 44 1.05
Advanced Light Source 4.21 7% 7% 9% 27% 37% 13% 75 1.36
Office of Chief Finance Officer 4.21 6% 7% 12% 24% 38% 13% 178 1.34
Chemical Sciences 4.32 0% 12% 12% 20% 44% 12% 25 1.22
Computational Research Div 4.42 3% 7% 8% 21% 46% 14% 118 1.24
Environmental Energy Tech 4.22 7% 8% 10% 22% 40% 14% 166 1.39
Engineering 4.31 3% 10% 7% 25% 40% 14% 183 1.29
Environment, Health & Safety 4.32 4% 9% 12% 18% 42% 16% 101 1.34
Earth Sciences 4.25 1% 8% 16% 26% 38% 11% 100 1.16
Facilities 4.22 5% 6% 15% 23% 40% 12% 177 1.29
Genomics Division 3.80 6% 16% 16% 24% 31% 7% 109 1.39
Human Resources 3.82 6% 12% 18% 25% 36% 3% 67 1.29
Information Technology Div 4.49 2% 6% 12% 21% 41% 18% 123 1.18
Laboratory Directorate 4.48 2% 10% 3% 28% 39% 18% 61 1.22
Life Sciences 4.26 6% 4% 16% 19% 42% 13% 129 1.33
Materials Sciences 4.23 4% 9% 15% 22% 35% 16% 81 1.33
NERSC 4.46 0% 7% 17% 15% 46% 15% 46 1.15
Nuclear Science 4.28 4% 11% 9% 15% 50% 11% 46 1.34
Operations Division 5.00 0% 0% 13% 0% 63% 25% 8 0.93
Public Affairs 4.30 4% 4% 13% 22% 48% 9% 23 1.22
Physical Biosciences 4.19 9% 7% 9% 22% 39% 14% 69 1.46
Physics 4.46 2% 10% 7% 12% 56% 12% 41 1.25
Fewer Than 6 3.63 13% 13% 19% 19% 31% 6% 16 1.54
9.3 I am compensated fairly.
Mean SD D SD SA A SA Count Std. Dev.
All 4.31 4% 8% 12% 21% 41% 15% 1977 1.30
Accelerator & Fusion Research 4.52 0% 9% 11% 11% 55% 14% 44 1.15
Advanced Light Source 4.22 4% 11% 12% 20% 41% 13% 76 1.34
Office of Chief Finance Officer 4.24 6% 6% 10% 28% 36% 14% 177 1.34
Chemical Sciences 4.40 0% 12% 8% 24% 40% 16% 25 1.22
Computational Research Div 4.47 4% 6% 8% 19% 46% 17% 118 1.28
Environmental Energy Tech 4.19 6% 9% 11% 20% 43% 11% 161 1.35
Engineering 4.31 5% 10% 8% 20% 41% 16% 182 1.37
Environment, Health & Safety 4.38 2% 11% 9% 23% 37% 19% 101 1.30
Earth Sciences 4.41 2% 3% 21% 16% 44% 15% 101 1.18
Facilities 4.19 5% 7% 15% 23% 41% 10% 176 1.27
Genomics Division 4.07 4% 11% 14% 25% 38% 8% 108 1.28
Human Resources 3.95 6% 9% 18% 22% 38% 6% 65 1.33
Information Technology Div 4.54 3% 5% 8% 25% 36% 23% 123 1.25
Laboratory Directorate 4.61 3% 5% 6% 26% 32% 27% 62 1.27
Life Sciences 4.38 4% 6% 13% 16% 45% 15% 128 1.29
Materials Sciences 4.25 3% 10% 16% 19% 36% 16% 80 1.33
NERSC 4.57 0% 2% 17% 20% 43% 17% 46 1.05
Nuclear Science 4.36 4% 11% 6% 13% 55% 11% 47 1.33
Operations Division 5.13 0% 0% 13% 0% 50% 38% 8 0.99
Public Affairs 4.22 4% 4% 22% 17% 39% 13% 23 1.31
Physical Biosciences 4.25 10% 6% 6% 23% 38% 17% 69 1.50
Physics 4.51 2% 5% 10% 17% 54% 12% 41 1.14
Fewer Than 6 3.63 13% 13% 19% 19% 31% 6% 16 1.54
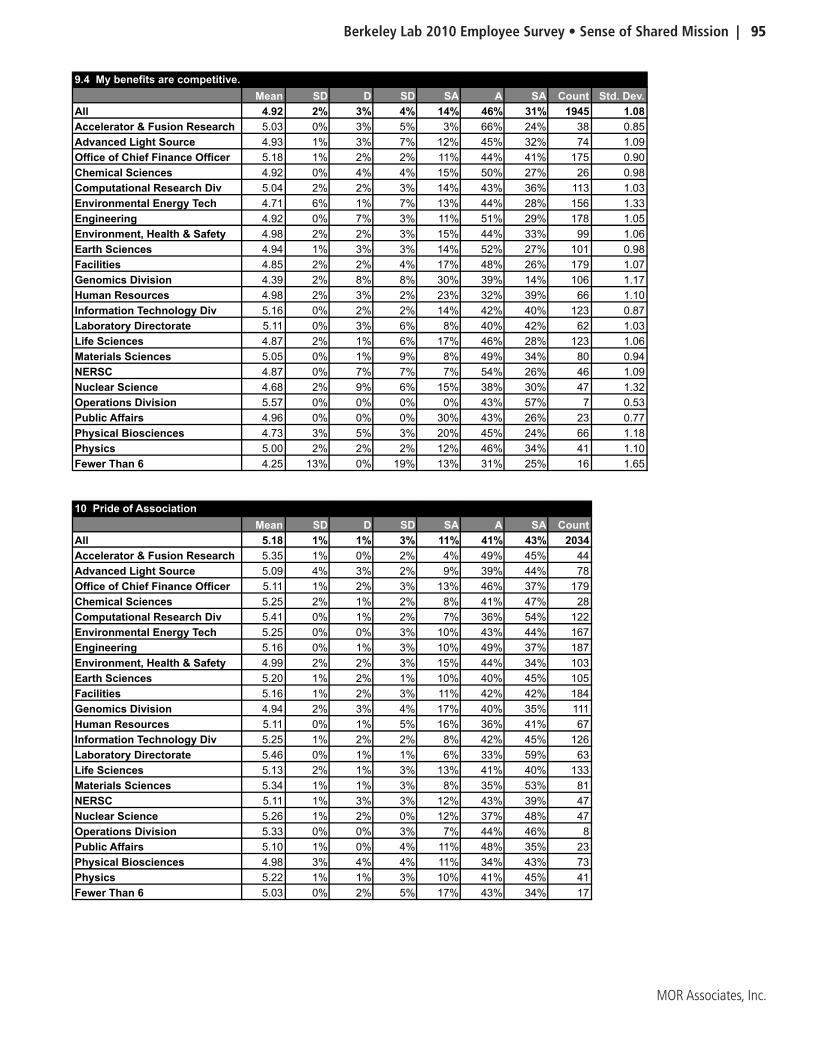
Berkeley Lab 2010 Employee Survey • Sense of Shared Mission | 95
MOR Associates, Inc.
9.4 My benefits are competitive.
Mean SD D SD SA A SA Count Std. Dev.
All 4.92 2% 3% 4% 14% 46% 31% 1945 1.08
Accelerator & Fusion Research 5.03 0% 3% 5% 3% 66% 24% 38 0.85
Advanced Light Source 4.93 1% 3% 7% 12% 45% 32% 74 1.09
Office of Chief Finance Officer 5.18 1% 2% 2% 11% 44% 41% 175 0.90
Chemical Sciences 4.92 0% 4% 4% 15% 50% 27% 26 0.98
Computational Research Div 5.04 2% 2% 3% 14% 43% 36% 113 1.03
Environmental Energy Tech 4.71 6% 1% 7% 13% 44% 28% 156 1.33
Engineering 4.92 0% 7% 3% 11% 51% 29% 178 1.05
Environment, Health & Safety 4.98 2% 2% 3% 15% 44% 33% 99 1.06
Earth Sciences 4.94 1% 3% 3% 14% 52% 27% 101 0.98
Facilities 4.85 2% 2% 4% 17% 48% 26% 179 1.07
Genomics Division 4.39 2% 8% 8% 30% 39% 14% 106 1.17
Human Resources 4.98 2% 3% 2% 23% 32% 39% 66 1.10
Information Technology Div 5.16 0% 2% 2% 14% 42% 40% 123 0.87
Laboratory Directorate 5.11 0% 3% 6% 8% 40% 42% 62 1.03
Life Sciences 4.87 2% 1% 6% 17% 46% 28% 123 1.06
Materials Sciences 5.05 0% 1% 9% 8% 49% 34% 80 0.94
NERSC 4.87 0% 7% 7% 7% 54% 26% 46 1.09
Nuclear Science 4.68 2% 9% 6% 15% 38% 30% 47 1.32
Operations Division 5.57 0% 0% 0% 0% 43% 57% 7 0.53
Public Affairs 4.96 0% 0% 0% 30% 43% 26% 23 0.77
Physical Biosciences 4.73 3% 5% 3% 20% 45% 24% 66 1.18
Physics 5.00 2% 2% 2% 12% 46% 34% 41 1.10
Fewer Than 6 4.25 13% 0% 19% 13% 31% 25% 16 1.65
10 Pride of Association
Mean SD D SD SA A SA Count
All 5.18 1% 1% 3% 11% 41% 43% 2034
Accelerator & Fusion Research 5.35 1% 0% 2% 4% 49% 45% 44
Advanced Light Source 5.09 4% 3% 2% 9% 39% 44% 78
Office of Chief Finance Officer 5.11 1% 2% 3% 13% 46% 37% 179
Chemical Sciences 5.25 2% 1% 2% 8% 41% 47% 28
Computational Research Div 5.41 0% 1% 2% 7% 36% 54% 122
Environmental Energy Tech 5.25 0% 0% 3% 10% 43% 44% 167
Engineering 5.16 0% 1% 3% 10% 49% 37% 187
Environment, Health & Safety 4.99 2% 2% 3% 15% 44% 34% 103
Earth Sciences 5.20 1% 2% 1% 10% 40% 45% 105
Facilities 5.16 1% 2% 3% 11% 42% 42% 184
Genomics Division 4.94 2% 3% 4% 17% 40% 35% 111
Human Resources 5.11 0% 1% 5% 16% 36% 41% 67
Information Technology Div 5.25 1% 2% 2% 8% 42% 45% 126
Laboratory Directorate 5.46 0% 1% 1% 6% 33% 59% 63
Life Sciences 5.13 2% 1% 3% 13% 41% 40% 133
Materials Sciences 5.34 1% 1% 3% 8% 35% 53% 81
NERSC 5.11 1% 3% 3% 12% 43% 39% 47
Nuclear Science 5.26 1% 2% 0% 12% 37% 48% 47
Operations Division 5.33 0% 0% 3% 7% 44% 46% 8
Public Affairs 5.10 1% 0% 4% 11% 48% 35% 23
Physical Biosciences 4.98 3% 4% 4% 11% 34% 43% 73
Physics 5.22 1% 1% 3% 10% 41% 45% 41
Fewer Than 6 5.03 0% 2% 5% 17% 43% 34% 17

96 | Sense of Shared Mission • Berkeley Lab 2010 Employee Climate Survey
MOR Associates, Inc.
10.1 I am proud of Berkeley Lab's reputation.
Mean SD D SD SA A SA Count Std. Dev.
All 5.43 0% 1% 1% 6% 37% 55% 2016 0.77
Accelerator & Fusion Research 5.52 0% 0% 0% 2% 43% 55% 44 0.55
Advanced Light Source 5.36 3% 1% 3% 4% 31% 59% 78 1.07
Office of Chief Finance Officer 5.41 0% 1% 2% 7% 35% 54% 178 0.77
Chemical Sciences 5.50 0% 0% 0% 4% 43% 54% 28 0.58
Computational Research Div 5.57 0% 1% 2% 2% 28% 66% 122 0.74
Environmental Energy Tech 5.48 0% 0% 1% 7% 37% 56% 166 0.65
Engineering 5.33 0% 1% 3% 4% 48% 44% 187 0.74
Environment, Health & Safety 5.35 0% 1% 2% 7% 42% 49% 103 0.78
Earth Sciences 5.38 1% 2% 0% 7% 36% 54% 103 0.90
Facilities 5.35 1% 1% 1% 9% 37% 51% 181 0.85
Genomics Division 5.21 1% 0% 3% 12% 42% 42% 109 0.87
Human Resources 5.45 0% 0% 3% 6% 33% 58% 66 0.75
Information Technology Div 5.59 0% 1% 1% 2% 32% 65% 125 0.65
Laboratory Directorate 5.78 0% 0% 0% 0% 22% 78% 63 0.42
Life Sciences 5.31 1% 0% 2% 10% 41% 47% 133 0.81
Materials Sciences 5.58 0% 0% 0% 3% 38% 60% 80 0.55
NERSC 5.60 0% 0% 0% 4% 31% 64% 45 0.58
Nuclear Science 5.38 0% 2% 0% 9% 36% 53% 47 0.82
Operations Division 5.63 0% 0% 0% 0% 38% 63% 8 0.52
Public Affairs 5.43 0% 0% 0% 4% 48% 48% 23 0.59
Physical Biosciences 5.30 1% 3% 0% 11% 29% 56% 70 1.04
Physics 5.46 0% 0% 2% 10% 27% 61% 41 0.78
Fewer Than 6 5.56 0% 0% 0% 0% 44% 56% 16 0.51
10.2 Acting with integrity is of utmost importance at Berkeley Lab.
Mean SD D SD SA A SA Count Std. Dev.
All 5.17 2% 1% 2% 10% 41% 44% 1983 1.00
Accelerator & Fusion Research 5.26 2% 0% 0% 7% 49% 42% 43 0.90
Advanced Light Source 5.04 4% 3% 3% 7% 45% 39% 76 1.20
Office of Chief Finance Officer 5.15 2% 2% 1% 10% 48% 38% 178 0.96
Chemical Sciences 5.15 4% 4% 0% 4% 44% 44% 27 1.20
Computational Research Div 5.41 1% 1% 2% 8% 31% 58% 119 0.88
Environmental Energy Tech 5.29 1% 0% 2% 9% 43% 45% 163 0.81
Engineering 5.12 1% 1% 4% 12% 46% 37% 180 0.93
Environment, Health & Safety 4.88 6% 2% 1% 17% 38% 36% 102 1.30
Earth Sciences 5.26 3% 1% 1% 9% 35% 51% 101 1.07
Facilities 5.27 1% 1% 3% 6% 43% 46% 178 0.88
Genomics Division 5.06 3% 2% 2% 11% 44% 38% 105 1.10
Human Resources 4.92 0% 5% 6% 22% 28% 40% 65 1.14
Information Technology Div 5.21 2% 1% 3% 10% 39% 46% 126 0.98
Laboratory Directorate 5.39 0% 2% 2% 8% 33% 56% 61 0.84
Life Sciences 5.15 2% 0% 2% 12% 43% 41% 130 0.98
Materials Sciences 5.30 0% 0% 6% 9% 34% 51% 80 0.88
NERSC 5.07 0% 4% 0% 11% 54% 30% 46 0.90
Nuclear Science 5.28 2% 4% 0% 9% 28% 57% 47 1.16
Operations Division 5.25 0% 0% 0% 0% 75% 25% 8 0.46
Public Affairs 5.13 0% 0% 4% 13% 48% 35% 23 0.81
Physical Biosciences 4.93 4% 3% 4% 13% 34% 41% 68 1.31
Physics 5.29 0% 0% 0% 15% 41% 44% 41 0.72
Fewer Than 6 4.88 0% 6% 6% 19% 31% 38% 16 1.20

Berkeley Lab 2010 Employee Survey • Sense of Shared Mission | 97
MOR Associates, Inc.
10.3 I find Berkeley Lab an exciting place to work.
Mean SD D SD SA A SA Count Std. Dev.
All 5.13 1% 2% 3% 13% 42% 40% 2005 0.94
Accelerator & Fusion Research 5.36 0% 0% 5% 5% 41% 50% 44 0.78
Advanced Light Source 5.21 4% 1% 0% 9% 37% 49% 78 1.13
Office of Chief Finance Officer 4.95 1% 2% 3% 18% 47% 29% 176 0.95
Chemical Sciences 5.25 0% 0% 4% 11% 43% 43% 28 0.80
Computational Research Div 5.44 0% 0% 2% 8% 34% 55% 119 0.72
Environmental Energy Tech 5.07 1% 1% 5% 12% 48% 34% 167 0.91
Engineering 5.17 0% 1% 2% 14% 46% 37% 185 0.80
Environment, Health & Safety 5.05 0% 2% 5% 14% 46% 34% 103 0.92
Earth Sciences 5.15 1% 4% 1% 8% 46% 40% 104 1.00
Facilities 5.19 1% 1% 2% 10% 48% 38% 182 0.85
Genomics Division 4.75 2% 5% 5% 24% 36% 29% 110 1.17
Human Resources 5.06 2% 0% 5% 17% 39% 38% 66 0.99
Information Technology Div 5.22 0% 2% 2% 12% 42% 42% 125 0.84
Laboratory Directorate 5.48 0% 0% 0% 6% 39% 55% 62 0.62
Life Sciences 4.98 2% 2% 6% 15% 39% 36% 130 1.07
Materials Sciences 5.33 0% 1% 3% 10% 35% 51% 80 0.85
NERSC 5.02 0% 0% 9% 16% 37% 37% 43 0.96
Nuclear Science 5.28 0% 2% 0% 13% 37% 48% 46 0.86
Operations Division 5.71 0% 0% 0% 14% 0% 86% 7 0.76
Public Affairs 5.35 0% 0% 0% 9% 48% 43% 23 0.65
Physical Biosciences 4.86 1% 9% 7% 7% 37% 39% 70 1.32
Physics 5.05 2% 0% 5% 10% 49% 34% 41 1.02
Fewer Than 6 4.94 0% 0% 0% 31% 44% 25% 16 0.77
10.4 Quality work is highly valued at Berkeley Lab.
Mean SD D SD SA A SA Count Std. Dev.
All 4.98 2% 2% 4% 14% 46% 32% 1993 1.04
Accelerator & Fusion Research 5.25 0% 0% 2% 2% 64% 32% 44 0.61
Advanced Light Source 4.76 4% 5% 3% 16% 43% 29% 76 1.27
Office of Chief Finance Officer 4.94 1% 2% 3% 16% 52% 26% 178 0.94
Chemical Sciences 5.11 4% 0% 4% 14% 32% 46% 28 1.17
Computational Research Div 5.23 0% 1% 2% 9% 51% 38% 120 0.75
Environmental Energy Tech 5.17 1% 1% 4% 12% 44% 40% 163 0.89
Engineering 5.03 1% 3% 3% 9% 56% 29% 181 0.91
Environment, Health & Safety 4.68 2% 4% 5% 22% 49% 19% 102 1.08
Earth Sciences 5.02 0% 2% 4% 17% 45% 32% 102 0.91
Facilities 4.85 2% 4% 5% 18% 38% 33% 183 1.18
Genomics Division 4.72 2% 5% 8% 20% 36% 30% 105 1.21
Human Resources 4.98 0% 0% 5% 21% 45% 29% 66 0.83
Information Technology Div 4.95 2% 3% 4% 8% 55% 28% 123 1.04
Laboratory Directorate 5.17 2% 3% 2% 10% 38% 46% 63 1.07
Life Sciences 5.08 2% 1% 2% 14% 42% 38% 128 1.03
Materials Sciences 5.18 3% 1% 3% 11% 35% 48% 80 1.09
NERSC 4.76 2% 7% 2% 16% 49% 24% 45 1.19
Nuclear Science 5.09 2% 0% 0% 17% 47% 34% 47 0.93
Operations Division 4.75 0% 0% 13% 13% 63% 13% 8 0.89
Public Affairs 4.50 5% 0% 14% 18% 50% 14% 22 1.19
Physical Biosciences 4.85 6% 3% 6% 11% 37% 38% 71 1.37
Physics 5.07 2% 2% 5% 5% 46% 39% 41 1.13
Fewer Than 6 4.76 0% 0% 12% 18% 53% 18% 17 0.90
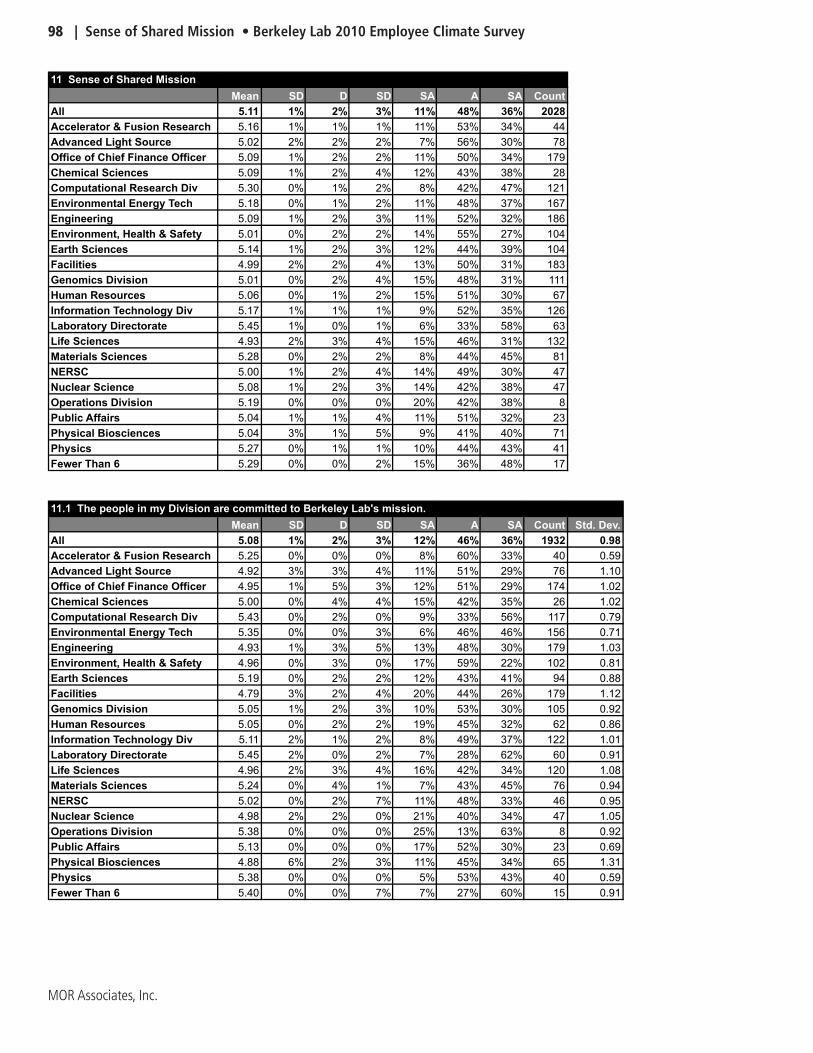
98 | Sense of Shared Mission • Berkeley Lab 2010 Employee Climate Survey
MOR Associates, Inc.
11 Sense of Shared Mission
Mean SD D SD SA A SA Count
All 5.11 1% 2% 3% 11% 48% 36% 2028
Accelerator & Fusion Research 5.16 1% 1% 1% 11% 53% 34% 44
Advanced Light Source 5.02 2% 2% 2% 7% 56% 30% 78
Office of Chief Finance Officer 5.09 1% 2% 2% 11% 50% 34% 179
Chemical Sciences 5.09 1% 2% 4% 12% 43% 38% 28
Computational Research Div 5.30 0% 1% 2% 8% 42% 47% 121
Environmental Energy Tech 5.18 0% 1% 2% 11% 48% 37% 167
Engineering 5.09 1% 2% 3% 11% 52% 32% 186
Environment, Health & Safety 5.01 0% 2% 2% 14% 55% 27% 104
Earth Sciences 5.14 1% 2% 3% 12% 44% 39% 104
Facilities 4.99 2% 2% 4% 13% 50% 31% 183
Genomics Division 5.01 0% 2% 4% 15% 48% 31% 111
Human Resources 5.06 0% 1% 2% 15% 51% 30% 67
Information Technology Div 5.17 1% 1% 1% 9% 52% 35% 126
Laboratory Directorate 5.45 1% 0% 1% 6% 33% 58% 63
Life Sciences 4.93 2% 3% 4% 15% 46% 31% 132
Materials Sciences 5.28 0% 2% 2% 8% 44% 45% 81
NERSC 5.00 1% 2% 4% 14% 49% 30% 47
Nuclear Science 5.08 1% 2% 3% 14% 42% 38% 47
Operations Division 5.19 0% 0% 0% 20% 42% 38% 8
Public Affairs 5.04 1% 1% 4% 11% 51% 32% 23
Physical Biosciences 5.04 3% 1% 5% 9% 41% 40% 71
Physics 5.27 0% 1% 1% 10% 44% 43% 41
Fewer Than 6 5.29 0% 0% 2% 15% 36% 48% 17
11.1 The people in my Division are committed to Berkeley Lab's mission.
Mean SD D SD SA A SA Count Std. Dev.
All 5.08 1% 2% 3% 12% 46% 36% 1932 0.98
Accelerator & Fusion Research 5.25 0% 0% 0% 8% 60% 33% 40 0.59
Advanced Light Source 4.92 3% 3% 4% 11% 51% 29% 76 1.10
Office of Chief Finance Officer 4.95 1% 5% 3% 12% 51% 29% 174 1.02
Chemical Sciences 5.00 0% 4% 4% 15% 42% 35% 26 1.02
Computational Research Div 5.43 0% 2% 0% 9% 33% 56% 117 0.79
Environmental Energy Tech 5.35 0% 0% 3% 6% 46% 46% 156 0.71
Engineering 4.93 1% 3% 5% 13% 48% 30% 179 1.03
Environment, Health & Safety 4.96 0% 3% 0% 17% 59% 22% 102 0.81
Earth Sciences 5.19 0% 2% 2% 12% 43% 41% 94 0.88
Facilities 4.79 3% 2% 4% 20% 44% 26% 179 1.12
Genomics Division 5.05 1% 2% 3% 10% 53% 30% 105 0.92
Human Resources 5.05 0% 2% 2% 19% 45% 32% 62 0.86
Information Technology Div 5.11 2% 1% 2% 8% 49% 37% 122 1.01
Laboratory Directorate 5.45 2% 0% 2% 7% 28% 62% 60 0.91
Life Sciences 4.96 2% 3% 4% 16% 42% 34% 120 1.08
Materials Sciences 5.24 0% 4% 1% 7% 43% 45% 76 0.94
NERSC 5.02 0% 2% 7% 11% 48% 33% 46 0.95
Nuclear Science 4.98 2% 2% 0% 21% 40% 34% 47 1.05
Operations Division 5.38 0% 0% 0% 25% 13% 63% 8 0.92
Public Affairs 5.13 0% 0% 0% 17% 52% 30% 23 0.69
Physical Biosciences 4.88 6% 2% 3% 11% 45% 34% 65 1.31
Physics 5.38 0% 0% 0% 5% 53% 43% 40 0.59
Fewer Than 6 5.40 0% 0% 7% 7% 27% 60% 15 0.91
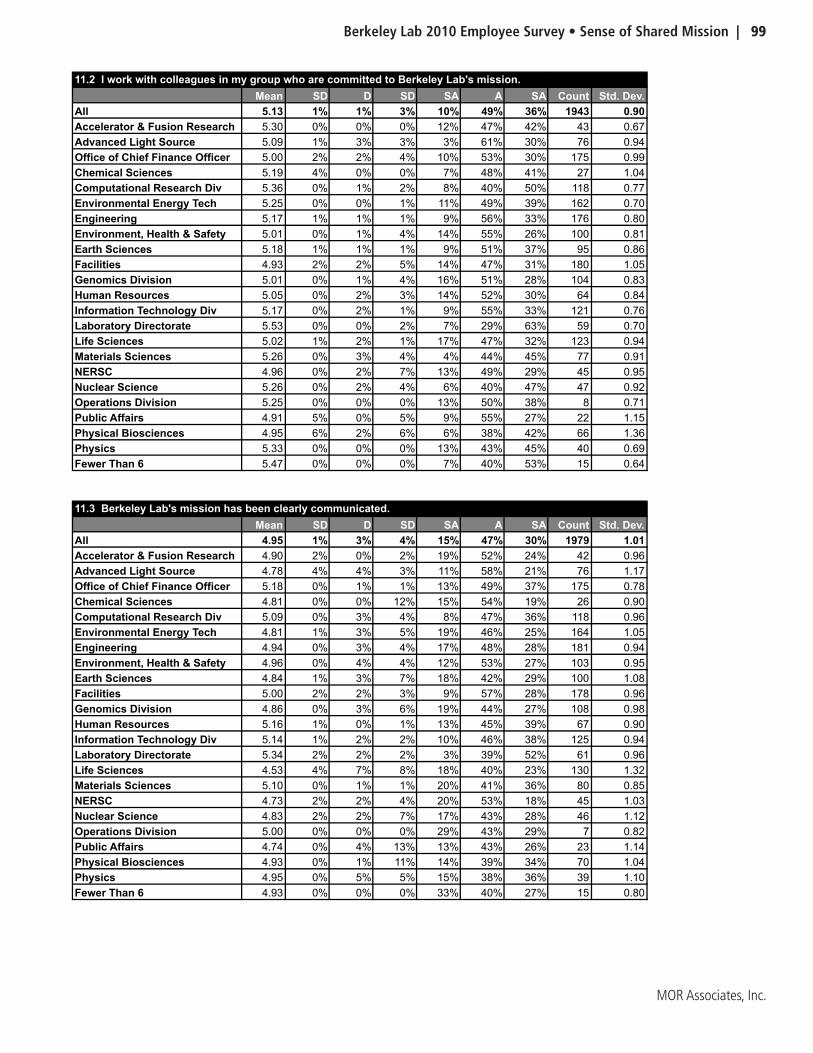
Berkeley Lab 2010 Employee Survey • Sense of Shared Mission | 99
MOR Associates, Inc.
11.2 I work with colleagues in my group who are committed to Berkeley Lab's mission.
Mean SD D SD SA A SA Count Std. Dev.
All 5.13 1% 1% 3% 10% 49% 36% 1943 0.90
Accelerator & Fusion Research 5.30 0% 0% 0% 12% 47% 42% 43 0.67
Advanced Light Source 5.09 1% 3% 3% 3% 61% 30% 76 0.94
Office of Chief Finance Officer 5.00 2% 2% 4% 10% 53% 30% 175 0.99
Chemical Sciences 5.19 4% 0% 0% 7% 48% 41% 27 1.04
Computational Research Div 5.36 0% 1% 2% 8% 40% 50% 118 0.77
Environmental Energy Tech 5.25 0% 0% 1% 11% 49% 39% 162 0.70
Engineering 5.17 1% 1% 1% 9% 56% 33% 176 0.80
Environment, Health & Safety 5.01 0% 1% 4% 14% 55% 26% 100 0.81
Earth Sciences 5.18 1% 1% 1% 9% 51% 37% 95 0.86
Facilities 4.93 2% 2% 5% 14% 47% 31% 180 1.05
Genomics Division 5.01 0% 1% 4% 16% 51% 28% 104 0.83
Human Resources 5.05 0% 2% 3% 14% 52% 30% 64 0.84
Information Technology Div 5.17 0% 2% 1% 9% 55% 33% 121 0.76
Laboratory Directorate 5.53 0% 0% 2% 7% 29% 63% 59 0.70
Life Sciences 5.02 1% 2% 1% 17% 47% 32% 123 0.94
Materials Sciences 5.26 0% 3% 4% 4% 44% 45% 77 0.91
NERSC 4.96 0% 2% 7% 13% 49% 29% 45 0.95
Nuclear Science 5.26 0% 2% 4% 6% 40% 47% 47 0.92
Operations Division 5.25 0% 0% 0% 13% 50% 38% 8 0.71
Public Affairs 4.91 5% 0% 5% 9% 55% 27% 22 1.15
Physical Biosciences 4.95 6% 2% 6% 6% 38% 42% 66 1.36
Physics 5.33 0% 0% 0% 13% 43% 45% 40 0.69
Fewer Than 6 5.47 0% 0% 0% 7% 40% 53% 15 0.64
11.3 Berkeley Lab's mission has been clearly communicated.
Mean SD D SD SA A SA Count Std. Dev.
All 4.95 1% 3% 4% 15% 47% 30% 1979 1.01
Accelerator & Fusion Research 4.90 2% 0% 2% 19% 52% 24% 42 0.96
Advanced Light Source 4.78 4% 4% 3% 11% 58% 21% 76 1.17
Office of Chief Finance Officer 5.18 0% 1% 1% 13% 49% 37% 175 0.78
Chemical Sciences 4.81 0% 0% 12% 15% 54% 19% 26 0.90
Computational Research Div 5.09 0% 3% 4% 8% 47% 36% 118 0.96
Environmental Energy Tech 4.81 1% 3% 5% 19% 46% 25% 164 1.05
Engineering 4.94 0% 3% 4% 17% 48% 28% 181 0.94
Environment, Health & Safety 4.96 0% 4% 4% 12% 53% 27% 103 0.95
Earth Sciences 4.84 1% 3% 7% 18% 42% 29% 100 1.08
Facilities 5.00 2% 2% 3% 9% 57% 28% 178 0.96
Genomics Division 4.86 0% 3% 6% 19% 44% 27% 108 0.98
Human Resources 5.16 1% 0% 1% 13% 45% 39% 67 0.90
Information Technology Div 5.14 1% 2% 2% 10% 46% 38% 125 0.94
Laboratory Directorate 5.34 2% 2% 2% 3% 39% 52% 61 0.96
Life Sciences 4.53 4% 7% 8% 18% 40% 23% 130 1.32
Materials Sciences 5.10 0% 1% 1% 20% 41% 36% 80 0.85
NERSC 4.73 2% 2% 4% 20% 53% 18% 45 1.03
Nuclear Science 4.83 2% 2% 7% 17% 43% 28% 46 1.12
Operations Division 5.00 0% 0% 0% 29% 43% 29% 7 0.82
Public Affairs 4.74 0% 4% 13% 13% 43% 26% 23 1.14
Physical Biosciences 4.93 0% 1% 11% 14% 39% 34% 70 1.04
Physics 4.95 0% 5% 5% 15% 38% 36% 39 1.10
Fewer Than 6 4.93 0% 0% 0% 33% 40% 27% 15 0.80
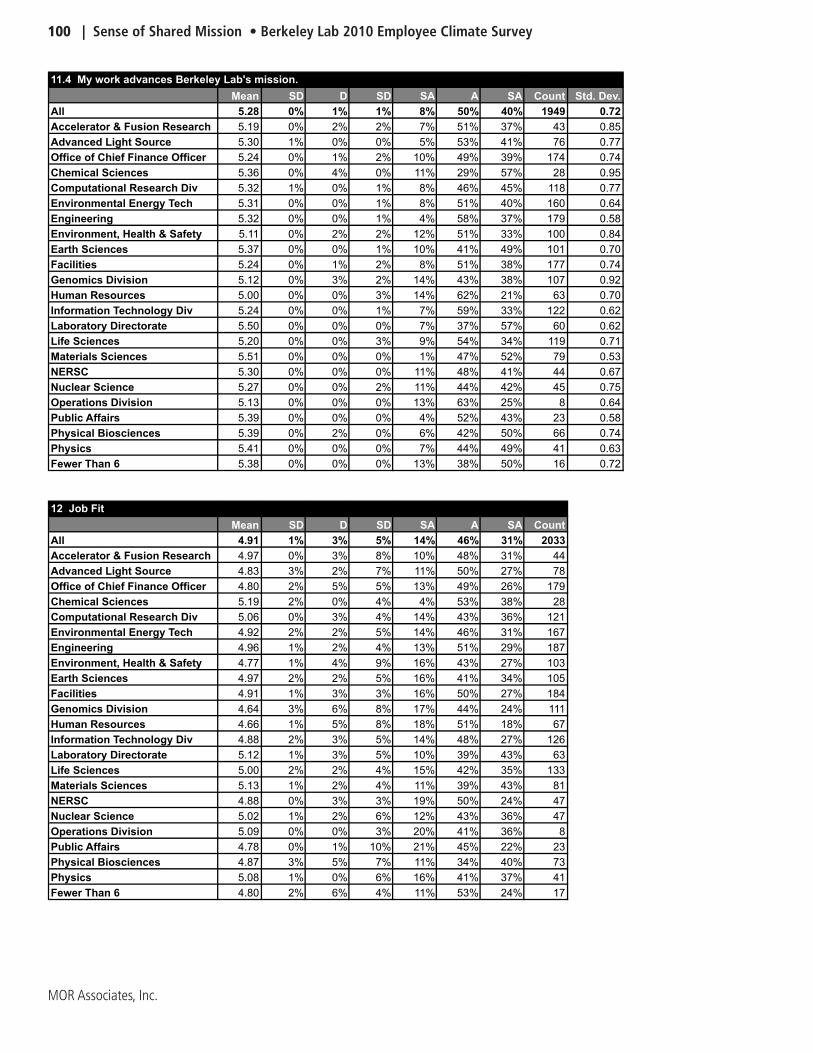
100 | Sense of Shared Mission • Berkeley Lab 2010 Employee Climate Survey
MOR Associates, Inc.
11.4 My work advances Berkeley Lab's mission.
Mean SD D SD SA A SA Count Std. Dev.
All 5.28 0% 1% 1% 8% 50% 40% 1949 0.72
Accelerator & Fusion Research 5.19 0% 2% 2% 7% 51% 37% 43 0.85
Advanced Light Source 5.30 1% 0% 0% 5% 53% 41% 76 0.77
Office of Chief Finance Officer 5.24 0% 1% 2% 10% 49% 39% 174 0.74
Chemical Sciences 5.36 0% 4% 0% 11% 29% 57% 28 0.95
Computational Research Div 5.32 1% 0% 1% 8% 46% 45% 118 0.77
Environmental Energy Tech 5.31 0% 0% 1% 8% 51% 40% 160 0.64
Engineering 5.32 0% 0% 1% 4% 58% 37% 179 0.58
Environment, Health & Safety 5.11 0% 2% 2% 12% 51% 33% 100 0.84
Earth Sciences 5.37 0% 0% 1% 10% 41% 49% 101 0.70
Facilities 5.24 0% 1% 2% 8% 51% 38% 177 0.74
Genomics Division 5.12 0% 3% 2% 14% 43% 38% 107 0.92
Human Resources 5.00 0% 0% 3% 14% 62% 21% 63 0.70
Information Technology Div 5.24 0% 0% 1% 7% 59% 33% 122 0.62
Laboratory Directorate 5.50 0% 0% 0% 7% 37% 57% 60 0.62
Life Sciences 5.20 0% 0% 3% 9% 54% 34% 119 0.71
Materials Sciences 5.51 0% 0% 0% 1% 47% 52% 79 0.53
NERSC 5.30 0% 0% 0% 11% 48% 41% 44 0.67
Nuclear Science 5.27 0% 0% 2% 11% 44% 42% 45 0.75
Operations Division 5.13 0% 0% 0% 13% 63% 25% 8 0.64
Public Affairs 5.39 0% 0% 0% 4% 52% 43% 23 0.58
Physical Biosciences 5.39 0% 2% 0% 6% 42% 50% 66 0.74
Physics 5.41 0% 0% 0% 7% 44% 49% 41 0.63
Fewer Than 6 5.38 0% 0% 0% 13% 38% 50% 16 0.72
12 Job Fit
Mean SD D SD SA A SA Count
All 4.91 1% 3% 5% 14% 46% 31% 2033
Accelerator & Fusion Research 4.97 0% 3% 8% 10% 48% 31% 44
Advanced Light Source 4.83 3% 2% 7% 11% 50% 27% 78
Office of Chief Finance Officer 4.80 2% 5% 5% 13% 49% 26% 179
Chemical Sciences 5.19 2% 0% 4% 4% 53% 38% 28
Computational Research Div 5.06 0% 3% 4% 14% 43% 36% 121
Environmental Energy Tech 4.92 2% 2% 5% 14% 46% 31% 167
Engineering 4.96 1% 2% 4% 13% 51% 29% 187
Environment, Health & Safety 4.77 1% 4% 9% 16% 43% 27% 103
Earth Sciences 4.97 2% 2% 5% 16% 41% 34% 105
Facilities 4.91 1% 3% 3% 16% 50% 27% 184
Genomics Division 4.64 3% 6% 8% 17% 44% 24% 111
Human Resources 4.66 1% 5% 8% 18% 51% 18% 67
Information Technology Div 4.88 2% 3% 5% 14% 48% 27% 126
Laboratory Directorate 5.12 1% 3% 5% 10% 39% 43% 63
Life Sciences 5.00 2% 2% 4% 15% 42% 35% 133
Materials Sciences 5.13 1% 2% 4% 11% 39% 43% 81
NERSC 4.88 0% 3% 3% 19% 50% 24% 47
Nuclear Science 5.02 1% 2% 6% 12% 43% 36% 47
Operations Division 5.09 0% 0% 3% 20% 41% 36% 8
Public Affairs 4.78 0% 1% 10% 21% 45% 22% 23
Physical Biosciences 4.87 3% 5% 7% 11% 34% 40% 73
Physics 5.08 1% 0% 6% 16% 41% 37% 41
Fewer Than 6 4.80 2% 6% 4% 11% 53% 24% 17

Berkeley Lab 2010 Employee Survey • Sense of Shared Mission | 101
MOR Associates, Inc.
12.1 My job provides opportunities to challenge myself.
Mean SD D SD SA A SA Count Std. Dev.
All 5.13 1% 3% 4% 10% 40% 43% 2023 1.05
Accelerator & Fusion Research 5.34 0% 2% 5% 0% 43% 50% 44 0.89
Advanced Light Source 5.13 4% 1% 1% 9% 40% 44% 77 1.15
Office of Chief Finance Officer 4.88 1% 6% 4% 11% 46% 31% 178 1.15
Chemical Sciences 5.39 4% 0% 4% 0% 32% 61% 28 1.10
Computational Research Div 5.33 2% 1% 2% 7% 35% 54% 121 0.97
Environmental Energy Tech 5.34 1% 1% 2% 7% 36% 53% 167 0.93
Engineering 5.21 1% 2% 2% 8% 47% 40% 186 0.87
Environment, Health & Safety 4.93 1% 3% 5% 17% 43% 32% 103 1.05
Earth Sciences 5.26 2% 1% 5% 7% 33% 52% 105 1.06
Facilities 5.01 1% 3% 2% 14% 47% 32% 182 0.99
Genomics Division 4.68 5% 4% 6% 15% 41% 28% 111 1.34
Human Resources 4.72 0% 3% 10% 18% 49% 19% 67 1.00
Information Technology Div 5.06 2% 3% 2% 10% 46% 37% 126 1.05
Laboratory Directorate 5.33 0% 3% 5% 3% 33% 56% 63 0.98
Life Sciences 5.27 1% 1% 3% 12% 33% 50% 132 0.93
Materials Sciences 5.40 1% 0% 3% 6% 34% 56% 80 0.88
NERSC 5.13 0% 4% 0% 15% 40% 40% 47 0.97
Nuclear Science 5.30 0% 6% 2% 4% 30% 57% 47 1.10
Operations Division 5.38 0% 0% 0% 0% 63% 38% 8 0.52
Public Affairs 4.82 0% 5% 5% 23% 41% 27% 22 1.05
Physical Biosciences 5.18 4% 4% 3% 6% 24% 59% 71 1.34
Physics 5.41 0% 0% 7% 7% 22% 63% 41 0.92
Fewer Than 6 4.82 0% 6% 12% 6% 47% 29% 17 1.19
12.2 What I do at work is a good reflection of who I am.
Mean SD D SD SA A SA Count Std. Dev.
All 4.88 2% 3% 5% 16% 47% 28% 1974 1.05
Accelerator & Fusion Research 4.76 0% 2% 10% 19% 48% 21% 42 0.98
Advanced Light Source 4.64 4% 4% 5% 17% 49% 20% 75 1.22
Office of Chief Finance Officer 4.92 1% 4% 4% 12% 51% 28% 176 1.05
Chemical Sciences 5.00 4% 0% 4% 4% 64% 25% 28 1.02
Computational Research Div 4.89 0% 3% 3% 23% 44% 27% 117 0.95
Environmental Energy Tech 4.77 1% 5% 7% 14% 49% 24% 164 1.11
Engineering 4.99 1% 1% 3% 15% 52% 28% 179 0.92
Environment, Health & Safety 4.88 2% 1% 5% 19% 46% 28% 101 1.03
Earth Sciences 4.76 3% 4% 3% 22% 41% 27% 103 1.18
Facilities 5.03 1% 3% 2% 13% 51% 30% 181 0.92
Genomics Division 4.64 3% 7% 5% 19% 45% 22% 107 1.23
Human Resources 4.69 3% 3% 8% 17% 46% 23% 65 1.18
Information Technology Div 4.93 1% 1% 5% 17% 50% 26% 121 0.92
Laboratory Directorate 5.06 2% 3% 5% 8% 42% 40% 62 1.11
Life Sciences 4.88 3% 1% 7% 16% 41% 32% 130 1.15
Materials Sciences 5.06 0% 4% 4% 12% 44% 37% 78 1.00
NERSC 4.87 0% 2% 4% 18% 56% 20% 45 0.87
Nuclear Science 5.06 0% 0% 6% 13% 49% 32% 47 0.84
Operations Division 5.13 0% 0% 0% 13% 63% 25% 8 0.64
Public Affairs 4.86 0% 0% 5% 36% 27% 32% 22 0.94
Physical Biosciences 4.74 4% 3% 6% 18% 40% 29% 68 1.28
Physics 4.85 3% 0% 8% 15% 50% 25% 40 1.05
Fewer Than 6 4.93 7% 0% 0% 7% 60% 27% 15 1.22
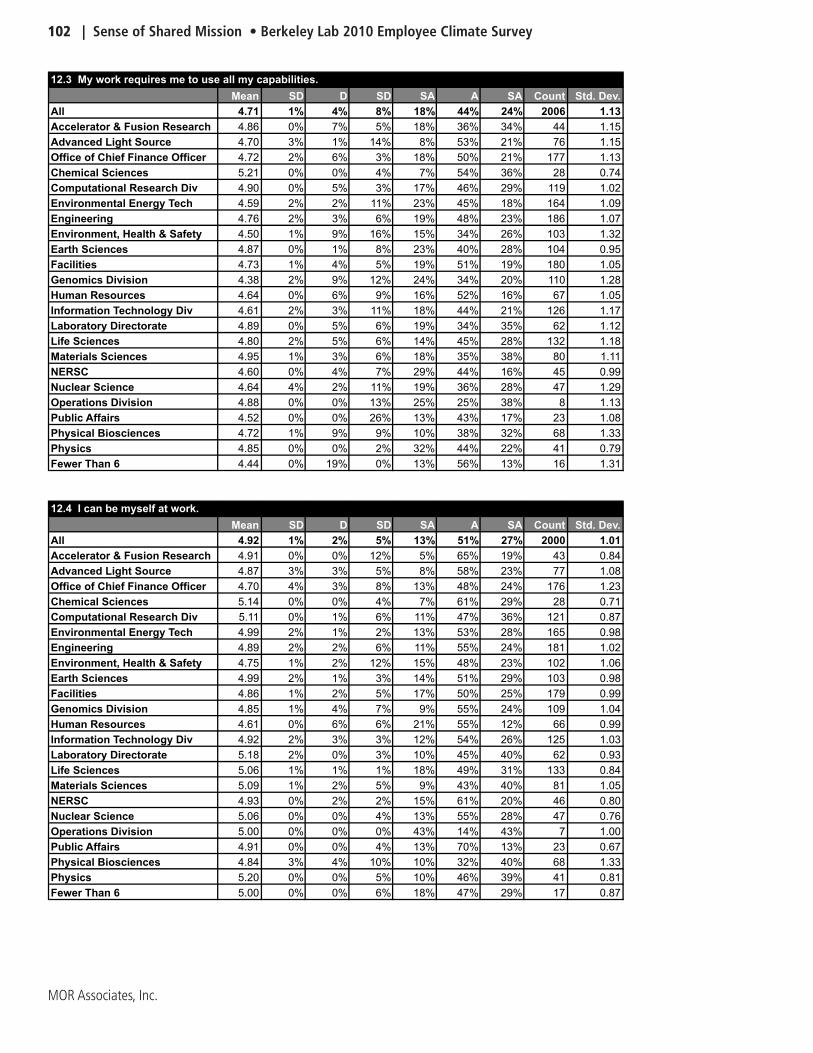
102 | Sense of Shared Mission • Berkeley Lab 2010 Employee Climate Survey
MOR Associates, Inc.
12.3 My work requires me to use all my capabilities.
Mean SD D SD SA A SA Count Std. Dev.
All 4.71 1% 4% 8% 18% 44% 24% 2006 1.13
Accelerator & Fusion Research 4.86 0% 7% 5% 18% 36% 34% 44 1.15
Advanced Light Source 4.70 3% 1% 14% 8% 53% 21% 76 1.15
Office of Chief Finance Officer 4.72 2% 6% 3% 18% 50% 21% 177 1.13
Chemical Sciences 5.21 0% 0% 4% 7% 54% 36% 28 0.74
Computational Research Div 4.90 0% 5% 3% 17% 46% 29% 119 1.02
Environmental Energy Tech 4.59 2% 2% 11% 23% 45% 18% 164 1.09
Engineering 4.76 2% 3% 6% 19% 48% 23% 186 1.07
Environment, Health & Safety 4.50 1% 9% 16% 15% 34% 26% 103 1.32
Earth Sciences 4.87 0% 1% 8% 23% 40% 28% 104 0.95
Facilities 4.73 1% 4% 5% 19% 51% 19% 180 1.05
Genomics Division 4.38 2% 9% 12% 24% 34% 20% 110 1.28
Human Resources 4.64 0% 6% 9% 16% 52% 16% 67 1.05
Information Technology Div 4.61 2% 3% 11% 18% 44% 21% 126 1.17
Laboratory Directorate 4.89 0% 5% 6% 19% 34% 35% 62 1.12
Life Sciences 4.80 2% 5% 6% 14% 45% 28% 132 1.18
Materials Sciences 4.95 1% 3% 6% 18% 35% 38% 80 1.11
NERSC 4.60 0% 4% 7% 29% 44% 16% 45 0.99
Nuclear Science 4.64 4% 2% 11% 19% 36% 28% 47 1.29
Operations Division 4.88 0% 0% 13% 25% 25% 38% 8 1.13
Public Affairs 4.52 0% 0% 26% 13% 43% 17% 23 1.08
Physical Biosciences 4.72 1% 9% 9% 10% 38% 32% 68 1.33
Physics 4.85 0% 0% 2% 32% 44% 22% 41 0.79
Fewer Than 6 4.44 0% 19% 0% 13% 56% 13% 16 1.31
12.4 I can be myself at work.
Mean SD D SD SA A SA Count Std. Dev.
All 4.92 1% 2% 5% 13% 51% 27% 2000 1.01
Accelerator & Fusion Research 4.91 0% 0% 12% 5% 65% 19% 43 0.84
Advanced Light Source 4.87 3% 3% 5% 8% 58% 23% 77 1.08
Office of Chief Finance Officer 4.70 4% 3% 8% 13% 48% 24% 176 1.23
Chemical Sciences 5.14 0% 0% 4% 7% 61% 29% 28 0.71
Computational Research Div 5.11 0% 1% 6% 11% 47% 36% 121 0.87
Environmental Energy Tech 4.99 2% 1% 2% 13% 53% 28% 165 0.98
Engineering 4.89 2% 2% 6% 11% 55% 24% 181 1.02
Environment, Health & Safety 4.75 1% 2% 12% 15% 48% 23% 102 1.06
Earth Sciences 4.99 2% 1% 3% 14% 51% 29% 103 0.98
Facilities 4.86 1% 2% 5% 17% 50% 25% 179 0.99
Genomics Division 4.85 1% 4% 7% 9% 55% 24% 109 1.04
Human Resources 4.61 0% 6% 6% 21% 55% 12% 66 0.99
Information Technology Div 4.92 2% 3% 3% 12% 54% 26% 125 1.03
Laboratory Directorate 5.18 2% 0% 3% 10% 45% 40% 62 0.93
Life Sciences 5.06 1% 1% 1% 18% 49% 31% 133 0.84
Materials Sciences 5.09 1% 2% 5% 9% 43% 40% 81 1.05
NERSC 4.93 0% 2% 2% 15% 61% 20% 46 0.80
Nuclear Science 5.06 0% 0% 4% 13% 55% 28% 47 0.76
Operations Division 5.00 0% 0% 0% 43% 14% 43% 7 1.00
Public Affairs 4.91 0% 0% 4% 13% 70% 13% 23 0.67
Physical Biosciences 4.84 3% 4% 10% 10% 32% 40% 68 1.33
Physics 5.20 0% 0% 5% 10% 46% 39% 41 0.81
Fewer Than 6 5.00 0% 0% 6% 18% 47% 29% 17 0.87
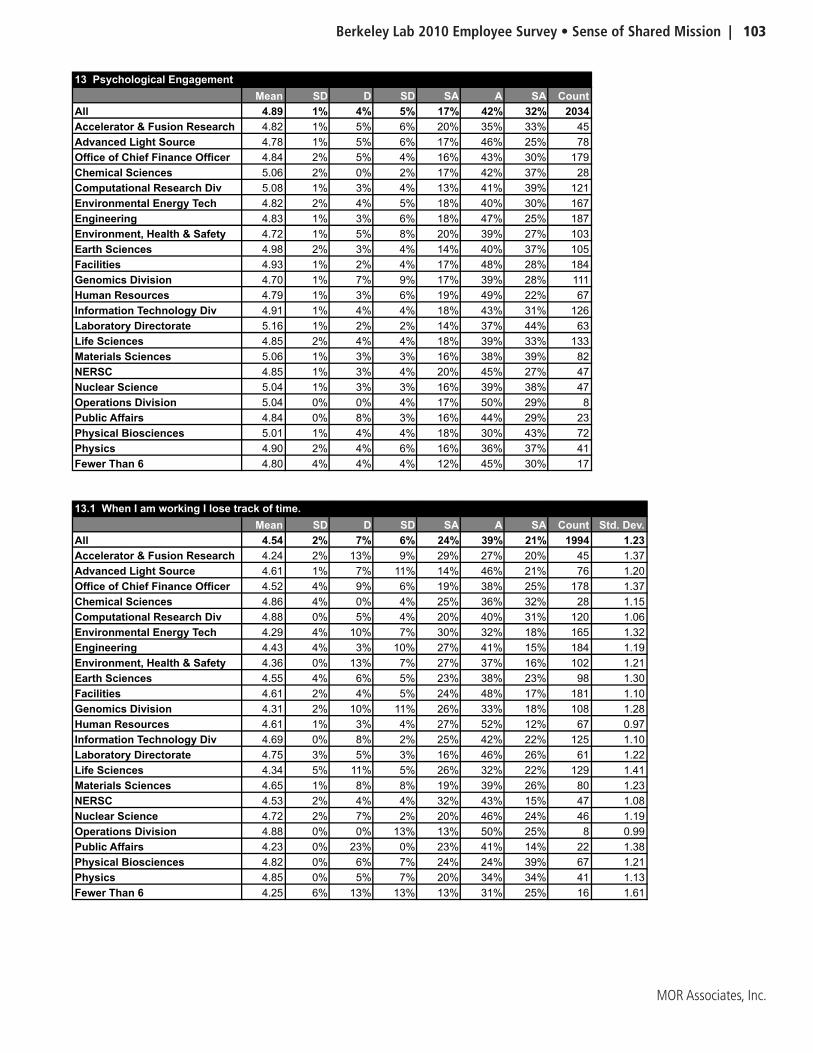
Berkeley Lab 2010 Employee Survey • Sense of Shared Mission | 103
MOR Associates, Inc.
13 Psychological Engagement
Mean SD D SD SA A SA Count
All 4.89 1% 4% 5% 17% 42% 32% 2034
Accelerator & Fusion Research 4.82 1% 5% 6% 20% 35% 33% 45
Advanced Light Source 4.78 1% 5% 6% 17% 46% 25% 78
Office of Chief Finance Officer 4.84 2% 5% 4% 16% 43% 30% 179
Chemical Sciences 5.06 2% 0% 2% 17% 42% 37% 28
Computational Research Div 5.08 1% 3% 4% 13% 41% 39% 121
Environmental Energy Tech 4.82 2% 4% 5% 18% 40% 30% 167
Engineering 4.83 1% 3% 6% 18% 47% 25% 187
Environment, Health & Safety 4.72 1% 5% 8% 20% 39% 27% 103
Earth Sciences 4.98 2% 3% 4% 14% 40% 37% 105
Facilities 4.93 1% 2% 4% 17% 48% 28% 184
Genomics Division 4.70 1% 7% 9% 17% 39% 28% 111
Human Resources 4.79 1% 3% 6% 19% 49% 22% 67
Information Technology Div 4.91 1% 4% 4% 18% 43% 31% 126
Laboratory Directorate 5.16 1% 2% 2% 14% 37% 44% 63
Life Sciences 4.85 2% 4% 4% 18% 39% 33% 133
Materials Sciences 5.06 1% 3% 3% 16% 38% 39% 82
NERSC 4.85 1% 3% 4% 20% 45% 27% 47
Nuclear Science 5.04 1% 3% 3% 16% 39% 38% 47
Operations Division 5.04 0% 0% 4% 17% 50% 29% 8
Public Affairs 4.84 0% 8% 3% 16% 44% 29% 23
Physical Biosciences 5.01 1% 4% 4% 18% 30% 43% 72
Physics 4.90 2% 4% 6% 16% 36% 37% 41
Fewer Than 6 4.80 4% 4% 4% 12% 45% 30% 17
13.1 When I am working I lose track of time.
Mean SD D SD SA A SA Count Std. Dev.
All 4.54 2% 7% 6% 24% 39% 21% 1994 1.23
Accelerator & Fusion Research 4.24 2% 13% 9% 29% 27% 20% 45 1.37
Advanced Light Source 4.61 1% 7% 11% 14% 46% 21% 76 1.20
Office of Chief Finance Officer 4.52 4% 9% 6% 19% 38% 25% 178 1.37
Chemical Sciences 4.86 4% 0% 4% 25% 36% 32% 28 1.15
Computational Research Div 4.88 0% 5% 4% 20% 40% 31% 120 1.06
Environmental Energy Tech 4.29 4% 10% 7% 30% 32% 18% 165 1.32
Engineering 4.43 4% 3% 10% 27% 41% 15% 184 1.19
Environment, Health & Safety 4.36 0% 13% 7% 27% 37% 16% 102 1.21
Earth Sciences 4.55 4% 6% 5% 23% 38% 23% 98 1.30
Facilities 4.61 2% 4% 5% 24% 48% 17% 181 1.10
Genomics Division 4.31 2% 10% 11% 26% 33% 18% 108 1.28
Human Resources 4.61 1% 3% 4% 27% 52% 12% 67 0.97
Information Technology Div 4.69 0% 8% 2% 25% 42% 22% 125 1.10
Laboratory Directorate 4.75 3% 5% 3% 16% 46% 26% 61 1.22
Life Sciences 4.34 5% 11% 5% 26% 32% 22% 129 1.41
Materials Sciences 4.65 1% 8% 8% 19% 39% 26% 80 1.23
NERSC 4.53 2% 4% 4% 32% 43% 15% 47 1.08
Nuclear Science 4.72 2% 7% 2% 20% 46% 24% 46 1.19
Operations Division 4.88 0% 0% 13% 13% 50% 25% 8 0.99
Public Affairs 4.23 0% 23% 0% 23% 41% 14% 22 1.38
Physical Biosciences 4.82 0% 6% 7% 24% 24% 39% 67 1.21
Physics 4.85 0% 5% 7% 20% 34% 34% 41 1.13
Fewer Than 6 4.25 6% 13% 13% 13% 31% 25% 16 1.61

104 | Sense of Shared Mission • Berkeley Lab 2010 Employee Climate Survey
MOR Associates, Inc.
13.2 I focus a great deal of attention on my work.
Mean SD D SD SA A SA Count Std. Dev.
All 5.45 0% 0% 1% 4% 44% 51% 2024 0.64
Accelerator & Fusion Research 5.55 0% 0% 0% 5% 36% 59% 44 0.59
Advanced Light Source 5.24 0% 1% 0% 9% 53% 37% 76 0.73
Office of Chief Finance Officer 5.51 0% 1% 0% 1% 44% 54% 179 0.58
Chemical Sciences 5.39 4% 0% 0% 4% 36% 57% 28 1.03
Computational Research Div 5.49 0% 1% 1% 2% 42% 55% 121 0.66
Environmental Energy Tech 5.43 0% 0% 1% 6% 41% 51% 167 0.66
Engineering 5.34 0% 0% 1% 5% 52% 42% 187 0.63
Environment, Health & Safety 5.38 0% 1% 1% 6% 44% 49% 103 0.73
Earth Sciences 5.56 0% 0% 0% 4% 36% 60% 103 0.57
Facilities 5.40 0% 0% 1% 5% 47% 47% 184 0.64
Genomics Division 5.38 0% 0% 2% 5% 48% 46% 109 0.66
Human Resources 5.42 0% 0% 0% 1% 55% 43% 67 0.53
Information Technology Div 5.45 0% 0% 0% 4% 47% 49% 124 0.58
Laboratory Directorate 5.70 0% 0% 0% 0% 30% 70% 63 0.46
Life Sciences 5.45 0% 0% 1% 4% 45% 50% 133 0.61
Materials Sciences 5.58 0% 0% 0% 4% 35% 62% 81 0.57
NERSC 5.49 0% 0% 0% 2% 47% 51% 47 0.55
Nuclear Science 5.51 0% 0% 0% 4% 40% 55% 47 0.59
Operations Division 5.38 0% 0% 0% 0% 63% 38% 8 0.52
Public Affairs 5.57 0% 0% 0% 0% 43% 57% 23 0.51
Physical Biosciences 5.54 0% 0% 0% 4% 38% 58% 72 0.58
Physics 5.41 2% 0% 0% 5% 37% 56% 41 0.92
Fewer Than 6 5.41 0% 0% 0% 6% 47% 47% 17 0.62
13.3 My work energizes me.
Mean SD D SD SA A SA Count Std. Dev.
All 4.67 1% 4% 7% 23% 42% 22% 2000 1.09
Accelerator & Fusion Research 4.68 0% 2% 9% 27% 41% 20% 44 0.98
Advanced Light Source 4.49 1% 8% 6% 27% 39% 18% 77 1.18
Office of Chief Finance Officer 4.49 1% 6% 6% 28% 46% 13% 176 1.06
Chemical Sciences 4.93 0% 0% 4% 21% 54% 21% 28 0.77
Computational Research Div 4.88 2% 3% 6% 18% 42% 31% 120 1.10
Environmental Energy Tech 4.73 1% 3% 8% 19% 47% 22% 165 1.06
Engineering 4.70 0% 5% 6% 21% 49% 19% 183 1.00
Environment, Health & Safety 4.41 2% 2% 18% 26% 35% 17% 102 1.14
Earth Sciences 4.82 2% 4% 7% 13% 46% 28% 104 1.15
Facilities 4.77 1% 2% 6% 23% 48% 20% 176 0.97
Genomics Division 4.42 0% 11% 13% 21% 35% 21% 110 1.26
Human Resources 4.33 2% 6% 14% 27% 39% 12% 66 1.14
Information Technology Div 4.59 2% 4% 9% 25% 41% 20% 125 1.12
Laboratory Directorate 5.03 0% 2% 2% 26% 34% 37% 62 0.92
Life Sciences 4.76 2% 2% 7% 26% 39% 26% 132 1.06
Materials Sciences 4.94 1% 0% 3% 26% 40% 30% 80 0.93
NERSC 4.54 2% 4% 7% 26% 46% 15% 46 1.11
Nuclear Science 4.89 0% 2% 6% 26% 32% 34% 47 1.03
Operations Division 4.88 0% 0% 0% 38% 38% 25% 8 0.83
Public Affairs 4.74 0% 0% 9% 26% 48% 17% 23 0.86
Physical Biosciences 4.67 3% 7% 4% 25% 28% 33% 69 1.34
Physics 4.44 2% 7% 10% 24% 37% 20% 41 1.27
Fewer Than 6 4.75 6% 0% 0% 19% 56% 19% 16 1.18

Berkeley Lab 2010 Employee Survey • Sense of Shared Mission | 105
MOR Associates, Inc.
14 Behavioral Engagement
Mean SD D SD SA A SA Count
All 4.86 1% 4% 5% 18% 45% 28% 2019
Accelerator & Fusion Research 5.00 2% 2% 5% 13% 43% 35% 44
Advanced Light Source 4.86 0% 4% 6% 18% 45% 27% 78
Office of Chief Finance Officer 4.85 1% 3% 4% 20% 48% 24% 178
Chemical Sciences 5.15 1% 3% 1% 9% 45% 40% 28
Computational Research Div 4.89 1% 3% 6% 17% 44% 30% 119
Environmental Energy Tech 4.87 1% 3% 4% 19% 47% 27% 166
Engineering 4.72 1% 5% 5% 21% 46% 22% 187
Environment, Health & Safety 4.85 1% 4% 4% 19% 45% 27% 103
Earth Sciences 4.87 1% 4% 6% 16% 43% 30% 105
Facilities 4.76 1% 4% 6% 20% 47% 23% 182
Genomics Division 4.72 1% 5% 8% 15% 47% 23% 110
Human Resources 4.67 1% 5% 8% 16% 53% 17% 66
Information Technology Div 4.89 1% 3% 5% 17% 43% 30% 123
Laboratory Directorate 5.02 1% 4% 3% 11% 44% 37% 63
Life Sciences 4.87 1% 4% 4% 18% 43% 29% 133
Materials Sciences 5.17 0% 0% 3% 15% 41% 40% 81
NERSC 4.80 1% 5% 5% 22% 41% 28% 46
Nuclear Science 4.91 1% 2% 1% 23% 45% 28% 47
Operations Division 5.31 0% 0% 0% 10% 50% 40% 8
Public Affairs 4.71 0% 9% 3% 23% 39% 26% 23
Physical Biosciences 5.08 0% 3% 3% 14% 41% 39% 72
Physics 4.69 2% 3% 10% 19% 43% 24% 41
Fewer Than 6 4.87 0% 2% 9% 17% 43% 28% 16
14.1 I seek opportunities to go beyond the requirements of my job.
Mean SD D SD SA A SA Count Std. Dev.
All 5.10 0% 1% 3% 13% 50% 33% 1964 0.83
Accelerator & Fusion Research 5.21 0% 0% 5% 10% 45% 40% 42 0.81
Advanced Light Source 5.05 0% 0% 5% 16% 47% 32% 75 0.84
Office of Chief Finance Officer 5.05 1% 1% 2% 16% 51% 30% 173 0.85
Chemical Sciences 5.36 0% 0% 0% 7% 50% 43% 28 0.62
Computational Research Div 5.15 0% 3% 3% 8% 50% 36% 118 0.87
Environmental Energy Tech 5.09 0% 1% 2% 14% 51% 31% 159 0.80
Engineering 5.06 0% 1% 3% 15% 52% 29% 182 0.79
Environment, Health & Safety 5.00 1% 2% 5% 10% 53% 29% 103 0.96
Earth Sciences 5.11 1% 1% 2% 13% 48% 35% 104 0.89
Facilities 4.97 0% 3% 3% 16% 49% 29% 175 0.92
Genomics Division 5.08 0% 1% 4% 11% 54% 30% 107 0.80
Human Resources 4.86 0% 0% 8% 14% 63% 16% 64 0.77
Information Technology Div 5.10 1% 0% 1% 19% 45% 34% 119 0.84
Laboratory Directorate 5.28 0% 2% 2% 10% 41% 46% 61 0.84
Life Sciences 5.08 1% 1% 3% 12% 51% 32% 129 0.87
Materials Sciences 5.38 0% 0% 0% 10% 43% 48% 80 0.66
NERSC 5.11 0% 0% 2% 17% 48% 33% 46 0.77
Nuclear Science 5.20 0% 0% 0% 18% 43% 39% 44 0.73
Operations Division 5.25 0% 0% 0% 13% 50% 38% 8 0.71
Public Affairs 5.04 0% 4% 0% 9% 61% 26% 23 0.88
Physical Biosciences 5.32 0% 0% 1% 12% 40% 47% 68 0.74
Physics 5.10 0% 0% 2% 15% 54% 29% 41 0.74
Fewer Than 6 5.27 0% 0% 7% 0% 53% 40% 15 0.80

106 | Sense of Shared Mission • Berkeley Lab 2010 Employee Climate Survey
MOR Associates, Inc.
14.2 I seek opportunities to collaborate with other work groups.
Mean SD D SD SA A SA Count Std. Dev.
All 5.00 0% 2% 4% 15% 47% 32% 1946 0.94
Accelerator & Fusion Research 5.11 0% 2% 7% 7% 45% 39% 44 0.97
Advanced Light Source 4.95 0% 1% 7% 17% 46% 29% 76 0.92
Office of Chief Finance Officer 4.96 0% 2% 4% 18% 51% 26% 170 0.86
Chemical Sciences 5.46 0% 0% 0% 8% 38% 54% 26 0.65
Computational Research Div 5.07 0% 2% 5% 12% 47% 34% 118 0.90
Environmental Energy Tech 5.04 0% 4% 1% 16% 48% 33% 160 0.92
Engineering 4.87 1% 2% 4% 19% 50% 24% 181 0.94
Environment, Health & Safety 5.00 1% 2% 3% 17% 44% 33% 100 0.98
Earth Sciences 5.21 0% 1% 4% 11% 41% 43% 100 0.87
Facilities 4.89 1% 2% 3% 19% 52% 23% 170 0.91
Genomics Division 4.87 0% 3% 6% 15% 54% 22% 103 0.93
Human Resources 4.89 0% 2% 6% 14% 58% 20% 65 0.85
Information Technology Div 5.12 0% 2% 4% 13% 43% 38% 121 0.91
Laboratory Directorate 5.26 0% 3% 0% 7% 48% 43% 61 0.85
Life Sciences 4.86 0% 6% 6% 18% 38% 33% 123 1.11
Materials Sciences 5.23 0% 1% 4% 13% 36% 46% 80 0.90
NERSC 5.02 0% 2% 2% 22% 39% 35% 46 0.93
Nuclear Science 5.06 2% 0% 0% 17% 49% 32% 47 0.92
Operations Division 5.50 0% 0% 0% 0% 50% 50% 8 0.53
Public Affairs 4.87 0% 9% 0% 17% 43% 30% 23 1.14
Physical Biosciences 5.01 0% 6% 3% 13% 39% 39% 67 1.09
Physics 4.66 2% 2% 12% 17% 41% 24% 41 1.20
Fewer Than 6 4.75 0% 0% 13% 19% 50% 19% 16 0.93
14.3 I volunteer for activities at work that are not part of my job.
Mean SD D SD SA A SA Count Std. Dev.
All 4.48 2% 7% 8% 25% 39% 19% 1886 1.21
Accelerator & Fusion Research 4.68 5% 5% 2% 23% 39% 27% 44 1.29
Advanced Light Source 4.57 0% 9% 7% 22% 42% 20% 76 1.16
Office of Chief Finance Officer 4.54 2% 5% 6% 27% 43% 17% 166 1.14
Chemical Sciences 4.64 4% 8% 4% 12% 48% 24% 25 1.35
Computational Research Div 4.43 2% 6% 10% 30% 34% 18% 115 1.18
Environmental Energy Tech 4.47 3% 5% 9% 26% 42% 16% 154 1.16
Engineering 4.24 3% 11% 8% 28% 37% 13% 168 1.28
Environment, Health & Safety 4.56 1% 7% 4% 30% 38% 20% 97 1.14
Earth Sciences 4.29 3% 9% 11% 24% 41% 13% 101 1.26
Facilities 4.43 2% 7% 10% 24% 39% 17% 163 1.21
Genomics Division 4.21 3% 11% 16% 20% 34% 17% 101 1.36
Human Resources 4.26 2% 15% 10% 21% 37% 16% 62 1.34
Information Technology Div 4.45 2% 8% 11% 19% 43% 17% 115 1.23
Laboratory Directorate 4.53 3% 8% 7% 17% 42% 22% 59 1.33
Life Sciences 4.67 2% 5% 4% 24% 41% 24% 123 1.17
Materials Sciences 4.92 1% 0% 4% 22% 45% 27% 77 0.93
NERSC 4.28 2% 12% 9% 26% 35% 16% 43 1.32
Nuclear Science 4.47 2% 7% 2% 33% 42% 14% 43 1.14
Operations Division 5.17 0% 0% 0% 17% 50% 33% 6 0.75
Public Affairs 4.22 0% 13% 9% 43% 13% 22% 23 1.28
Physical Biosciences 4.91 0% 4% 4% 17% 43% 30% 69 1.03
Physics 4.32 2% 7% 15% 24% 34% 17% 41 1.27
Fewer Than 6 4.60 0% 7% 7% 33% 27% 27% 15 1.18

Berkeley Lab 2010 Employee Survey • Sense of Shared Mission | 107
MOR Associates, Inc.
15 I have the tools and materials needed to do my work.
Mean SD D SD SA A SA Count Std. Dev.
All 4.95 1% 2% 4% 12% 54% 27% 2013 0.96
Accelerator & Fusion Research 4.98 0% 2% 5% 16% 47% 30% 43 0.94
Advanced Light Source 4.90 3% 1% 1% 18% 52% 25% 77 1.01
Office of Chief Finance Officer 4.81 2% 1% 7% 15% 56% 20% 177 0.98
Chemical Sciences 4.82 4% 0% 7% 11% 57% 21% 28 1.09
Computational Research Div 5.21 0% 2% 0% 12% 48% 38% 121 0.78
Environmental Energy Tech 4.81 2% 5% 5% 10% 53% 25% 165 1.16
Engineering 4.81 1% 4% 4% 15% 55% 21% 186 1.02
Environment, Health & Safety 4.99 0% 2% 5% 8% 63% 22% 103 0.82
Earth Sciences 5.01 1% 3% 2% 11% 54% 29% 105 0.95
Facilities 4.81 1% 3% 6% 16% 53% 21% 180 1.00
Genomics Division 5.06 0% 3% 3% 7% 60% 27% 110 0.84
Human Resources 4.78 1% 1% 7% 15% 57% 18% 67 0.98
Information Technology Div 5.02 0% 1% 4% 15% 52% 28% 124 0.82
Laboratory Directorate 5.08 2% 2% 5% 6% 50% 35% 62 1.01
Life Sciences 5.09 1% 1% 4% 8% 56% 30% 133 0.85
Materials Sciences 5.14 0% 1% 2% 14% 47% 36% 81 0.83
NERSC 5.17 0% 4% 7% 2% 41% 46% 46 1.06
Nuclear Science 5.00 0% 2% 7% 11% 50% 30% 46 0.94
Operations Division 5.13 0% 0% 0% 13% 63% 25% 8 0.64
Public Affairs 4.91 0% 0% 9% 9% 65% 17% 23 0.79
Physical Biosciences 5.01 3% 4% 4% 7% 40% 41% 70 1.23
Physics 4.93 0% 2% 5% 12% 59% 22% 41 0.88
Fewer Than 6 4.94 0% 0% 12% 0% 71% 18% 17 0.83
16 My office layout enhances my ability to do my work.
Mean SD D SD SA A SA Count Std. Dev.
All 4.22 7% 8% 11% 19% 38% 16% 1962 1.44
Accelerator & Fusion Research 4.36 4% 7% 13% 16% 44% 16% 45 1.33
Advanced Light Source 4.12 11% 5% 12% 24% 32% 17% 76 1.51
Office of Chief Finance Officer 4.04 11% 9% 11% 17% 37% 15% 179 1.57
Chemical Sciences 4.54 0% 8% 8% 19% 54% 12% 26 1.07
Computational Research Div 4.50 4% 8% 8% 21% 35% 25% 113 1.35
Environmental Energy Tech 3.89 12% 11% 10% 21% 34% 11% 160 1.55
Engineering 4.43 5% 8% 7% 15% 52% 14% 183 1.31
Environment, Health & Safety 3.91 12% 9% 15% 19% 33% 13% 102 1.55
Earth Sciences 3.86 16% 6% 16% 17% 33% 14% 103 1.63
Facilities 3.99 11% 13% 7% 19% 36% 14% 162 1.59
Genomics Division 4.08 7% 9% 12% 22% 37% 12% 108 1.42
Human Resources 3.89 11% 12% 12% 18% 34% 12% 65 1.56
Information Technology Div 4.50 3% 7% 10% 16% 43% 20% 123 1.30
Laboratory Directorate 4.66 2% 2% 11% 21% 44% 21% 62 1.09
Life Sciences 4.41 3% 7% 13% 17% 41% 18% 128 1.29
Materials Sciences 4.69 0% 4% 12% 21% 40% 24% 78 1.08
NERSC 4.50 2% 4% 7% 35% 33% 20% 46 1.15
Nuclear Science 4.36 6% 4% 6% 28% 40% 15% 47 1.31
Operations Division 4.75 0% 0% 25% 0% 50% 25% 8 1.16
Public Affairs 4.05 5% 9% 23% 23% 23% 18% 22 1.43
Physical Biosciences 4.34 4% 7% 19% 16% 29% 26% 70 1.44
Physics 4.02 7% 2% 22% 27% 32% 10% 41 1.31
Fewer Than 6 4.80 0% 7% 7% 20% 33% 33% 15 1.21
108 | Sense of Shared Mission • Berkeley Lab 2010 Employee Climate Survey
MOR Associates, Inc.

Berkeley Lab 2010 Employee Survey • Breakouts: Function | 109
MOR Associates, Inc.
Breakout Charts and Tables:
by Function
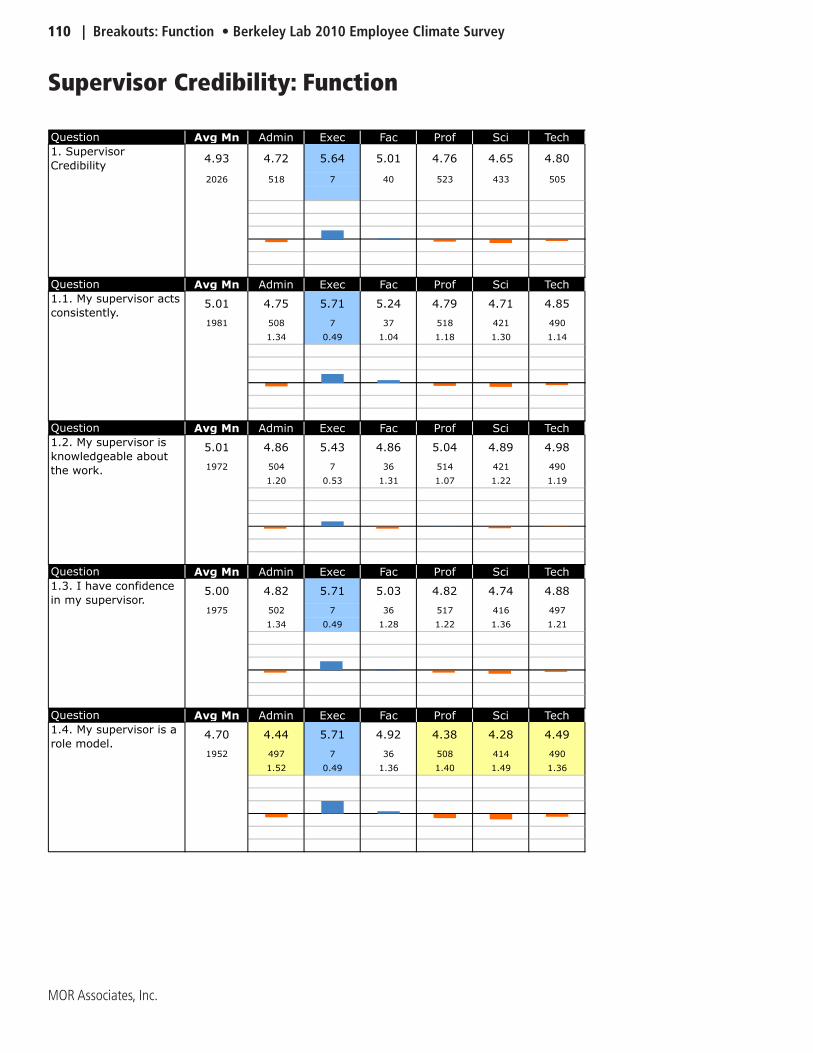
110 | Breakouts: Function • Berkeley Lab 2010 Employee Climate Survey
MOR Associates, Inc.
Supervisor Credibility: Function
Question Avg Mn Admin Exec Fac Prof Sci Tech
4.93 4.72 5.64 5.01 4.76 4.65 4.80
2026 518 7 40 523 433 505
Question Avg Mn Admin Exec Fac Prof Sci Tech
5.01 4.75 5.71 5.24 4.79 4.71 4.85
1981 508 7 37 518 421 490
1.34 0.49 1.04 1.18 1.30 1.14
Question Avg Mn Admin Exec Fac Prof Sci Tech
5.01 4.86 5.43 4.86 5.04 4.89 4.98
1972 504 7 36 514 421 490
1.20 0.53 1.31 1.07 1.22 1.19
Question Avg Mn Admin Exec Fac Prof Sci Tech
5.00 4.82 5.71 5.03 4.82 4.74 4.88
1975 502 7 36 517 416 497
1.34 0.49 1.28 1.22 1.36 1.21
Question Avg Mn Admin Exec Fac Prof Sci Tech
4.70 4.44 5.71 4.92 4.38 4.28 4.49
1952 497 7 36 508 414 490
1.52 0.49 1.36 1.40 1.49 1.36
1. Supervisor
Credibility
1.1. My supervisor acts
consistently.
1.2. My supervisor is
knowledgeable about
the work.
1.3. I have confidence
in my supervisor.
1.4. My supervisor is a
role model.
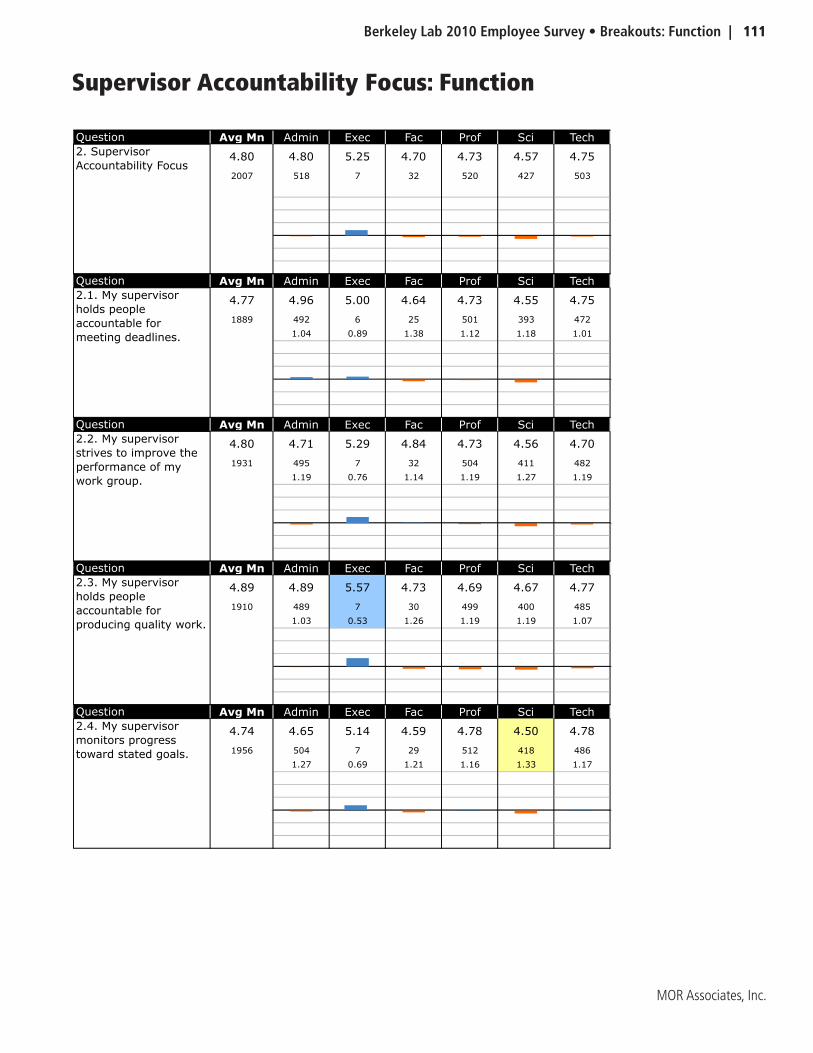
Berkeley Lab 2010 Employee Survey • Breakouts: Function | 111
MOR Associates, Inc.
Supervisor Accountability Focus: Function
Question Avg Mn Admin Exec Fac Prof Sci Tech
4.80 4.80 5.25 4.70 4.73 4.57 4.75
2007 518 7 32 520 427 503
Question Avg Mn Admin Exec Fac Prof Sci Tech
4.77 4.96 5.00 4.64 4.73 4.55 4.75
1889 492 6 25 501 393 472
1.04 0.89 1.38 1.12 1.18 1.01
Question Avg Mn Admin Exec Fac Prof Sci Tech
4.80 4.71 5.29 4.84 4.73 4.56 4.70
1931 495 7 32 504 411 482
1.19 0.76 1.14 1.19 1.27 1.19
Question Avg Mn Admin Exec Fac Prof Sci Tech
4.89 4.89 5.57 4.73 4.69 4.67 4.77
1910 489 7 30 499 400 485
1.03 0.53 1.26 1.19 1.19 1.07
Question Avg Mn Admin Exec Fac Prof Sci Tech
4.74 4.65 5.14 4.59 4.78 4.50 4.78
1956 504 7 29 512 418 486
1.27 0.69 1.21 1.16 1.33 1.17
2. Supervisor
Accountability Focus
2.1. My supervisor
holds people
accountable for
meeting deadlines.
2.2. My supervisor
strives to improve the
performance of my
work group.
2.3. My supervisor
holds people
accountable for
producing quality work.
2.4. My supervisor
monitors progress
toward stated goals.
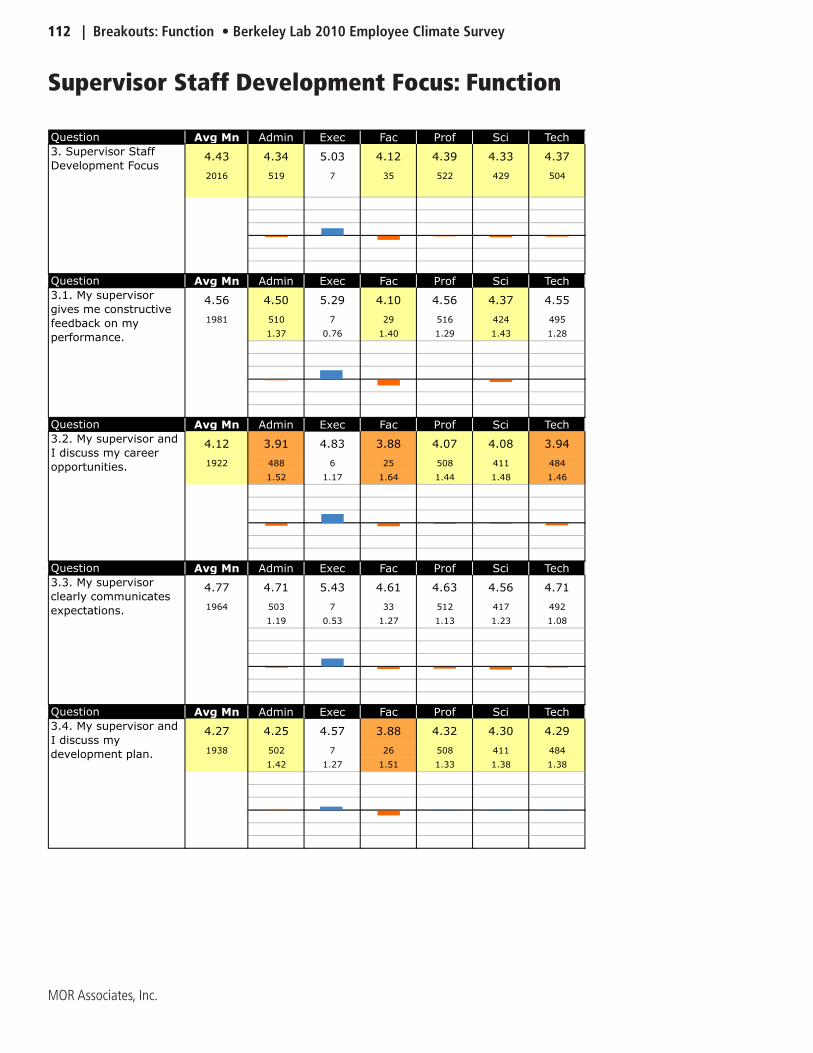
112 | Breakouts: Function • Berkeley Lab 2010 Employee Climate Survey
MOR Associates, Inc.
Supervisor Staff Development Focus: Function
Question Avg Mn Admin Exec Fac Prof Sci Tech
4.43 4.34 5.03 4.12 4.39 4.33 4.37
2016 519 7 35 522 429 504
Question Avg Mn Admin Exec Fac Prof Sci Tech
4.56 4.50 5.29 4.10 4.56 4.37 4.55
1981 510 7 29 516 424 495
1.37 0.76 1.40 1.29 1.43 1.28
Question Avg Mn Admin Exec Fac Prof Sci Tech
4.12 3.91 4.83 3.88 4.07 4.08 3.94
1922 488 6 25 508 411 484
1.52 1.17 1.64 1.44 1.48 1.46
Question Avg Mn Admin Exec Fac Prof Sci Tech
4.77 4.71 5.43 4.61 4.63 4.56 4.71
1964 503 7 33 512 417 492
1.19 0.53 1.27 1.13 1.23 1.08
Question Avg Mn Admin Exec Fac Prof Sci Tech
4.27 4.25 4.57 3.88 4.32 4.30 4.29
1938 502 7 26 508 411 484
1.42 1.27 1.51 1.33 1.38 1.38
3. Supervisor Staff
Development Focus
3.1. My supervisor
gives me constructive
feedback on my
performance.
3.2. My supervisor and
I discuss my career
opportunities.
3.3. My supervisor
clearly communicates
expectations.
3.4. My supervisor and
I discuss my
development plan.
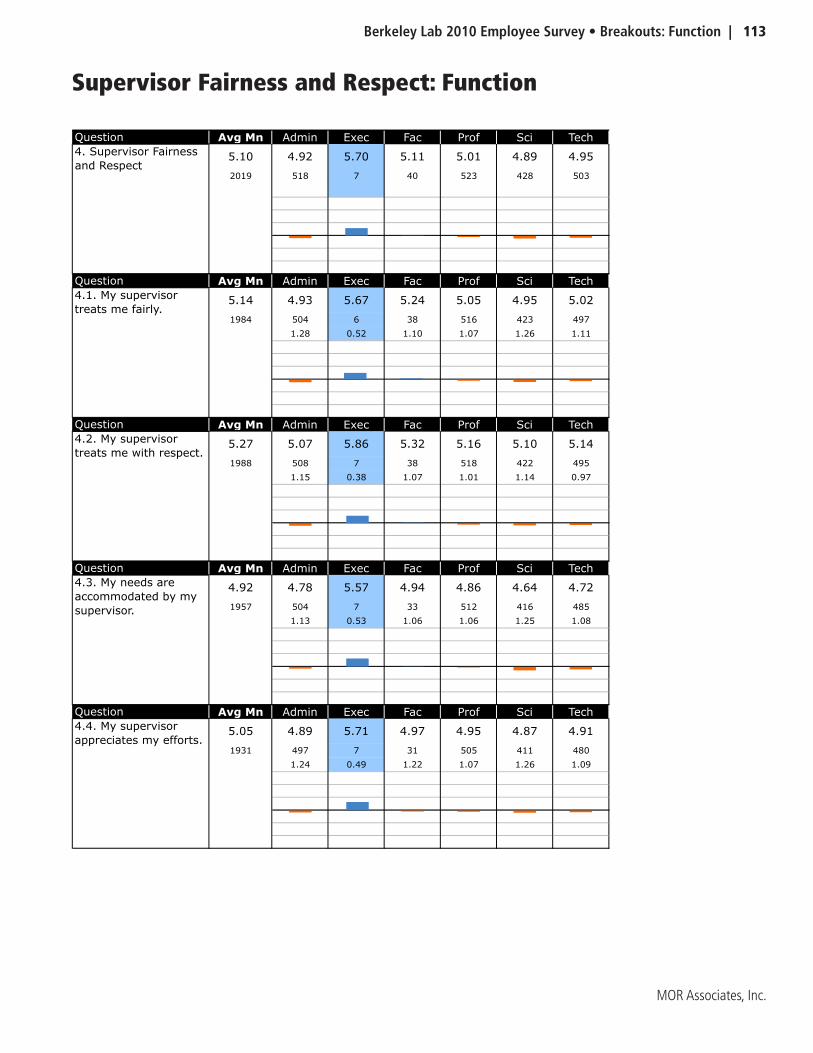
Berkeley Lab 2010 Employee Survey • Breakouts: Function | 113
MOR Associates, Inc.
Supervisor Fairness and Respect: Function
Question Avg Mn Admin Exec Fac Prof Sci Tech
5.10 4.92 5.70 5.11 5.01 4.89 4.95
2019 518 7 40 523 428 503
Question Avg Mn Admin Exec Fac Prof Sci Tech
5.14 4.93 5.67 5.24 5.05 4.95 5.02
1984 504 6 38 516 423 497
1.28 0.52 1.10 1.07 1.26 1.11
Question Avg Mn Admin Exec Fac Prof Sci Tech
5.27 5.07 5.86 5.32 5.16 5.10 5.14
1988 508 7 38 518 422 495
1.15 0.38 1.07 1.01 1.14 0.97
Question Avg Mn Admin Exec Fac Prof Sci Tech
4.92 4.78 5.57 4.94 4.86 4.64 4.72
1957 504 7 33 512 416 485
1.13 0.53 1.06 1.06 1.25 1.08
Question Avg Mn Admin Exec Fac Prof Sci Tech
5.05 4.89 5.71 4.97 4.95 4.87 4.91
1931 497 7 31 505 411 480
1.24 0.49 1.22 1.07 1.26 1.09
4. Supervisor Fairness
and Respect
4.1. My supervisor
treats me fairly.
4.2. My supervisor
treats me with respect.
4.3. My needs are
accommodated by my
supervisor.
4.4. My supervisor
appreciates my efforts.
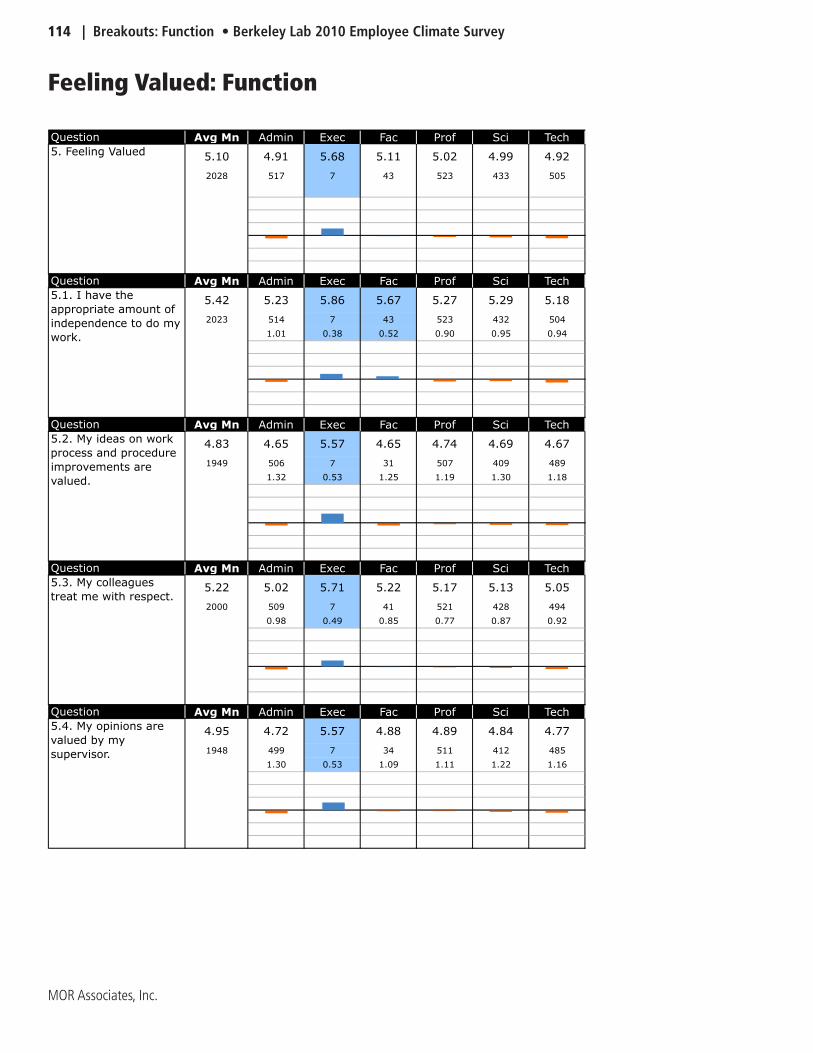
114 | Breakouts: Function • Berkeley Lab 2010 Employee Climate Survey
MOR Associates, Inc.
Feeling Valued: Function
Question Avg Mn Admin Exec Fac Prof Sci Tech
5.10 4.91 5.68 5.11 5.02 4.99 4.92
2028 517 7 43 523 433 505
Question Avg Mn Admin Exec Fac Prof Sci Tech
5.42 5.23 5.86 5.67 5.27 5.29 5.18
2023 514 7 43 523 432 504
1.01 0.38 0.52 0.90 0.95 0.94
Question Avg Mn Admin Exec Fac Prof Sci Tech
4.83 4.65 5.57 4.65 4.74 4.69 4.67
1949 506 7 31 507 409 489
1.32 0.53 1.25 1.19 1.30 1.18
Question Avg Mn Admin Exec Fac Prof Sci Tech
5.22 5.02 5.71 5.22 5.17 5.13 5.05
2000 509 7 41 521 428 494
0.98 0.49 0.85 0.77 0.87 0.92
Question Avg Mn Admin Exec Fac Prof Sci Tech
4.95 4.72 5.57 4.88 4.89 4.84 4.77
1948 499 7 34 511 412 485
1.30 0.53 1.09 1.11 1.22 1.16
5. Feeling Valued
5.1. I have the
appropriate amount of
independence to do my
work.
5.2. My ideas on work
process and procedure
improvements are
valued.
5.3. My colleagues
treat me with respect.
5.4. My opinions are
valued by my
supervisor.

Berkeley Lab 2010 Employee Survey • Breakouts: Function | 115
MOR Associates, Inc.
Diversity Valued: Function
Question Avg Mn Admin Exec Fac Prof Sci Tech
5.00 4.73 5.48 5.13 4.91 4.98 4.76
2013 517 7 42 520 428 499
Question Avg Mn Admin Exec Fac Prof Sci Tech
5.01 4.69 5.43 5.22 4.96 5.00 4.78
1944 496 7 41 508 415 477
1.11 0.53 0.85 0.96 0.97 1.09
Question Avg Mn Admin Exec Fac Prof Sci Tech
4.74 4.53 5.29 4.87 4.60 4.67 4.50
1900 487 7 38 496 411 461
1.28 0.49 1.09 1.20 1.17 1.25
Question Avg Mn Admin Exec Fac Prof Sci Tech
5.32 5.13 5.71 5.43 5.25 5.32 5.10
1952 503 7 40 509 416 477
1.01 0.49 0.90 0.97 0.95 0.93
Question Avg Mn Admin Exec Fac Prof Sci Tech
4.92 4.57 5.50 5.03 4.85 4.93 4.67
1905 494 6 40 495 396 474
1.24 0.55 1.17 1.00 1.04 1.19
6. Diversity Valued
6.1. I work with
colleagues who
genuinely welcome
differences.
6.2. The benefits of a
diverse work group are
clearly communicated
in my Division.
6.3. I find that the
contributions and
behaviors most valued
in my Division are not
specific to any one
race, ethnicity, gender,
age, religion, disability
or sexual orientation.
6.4. I can comfortably
talk about my
differences with my
colleagues.
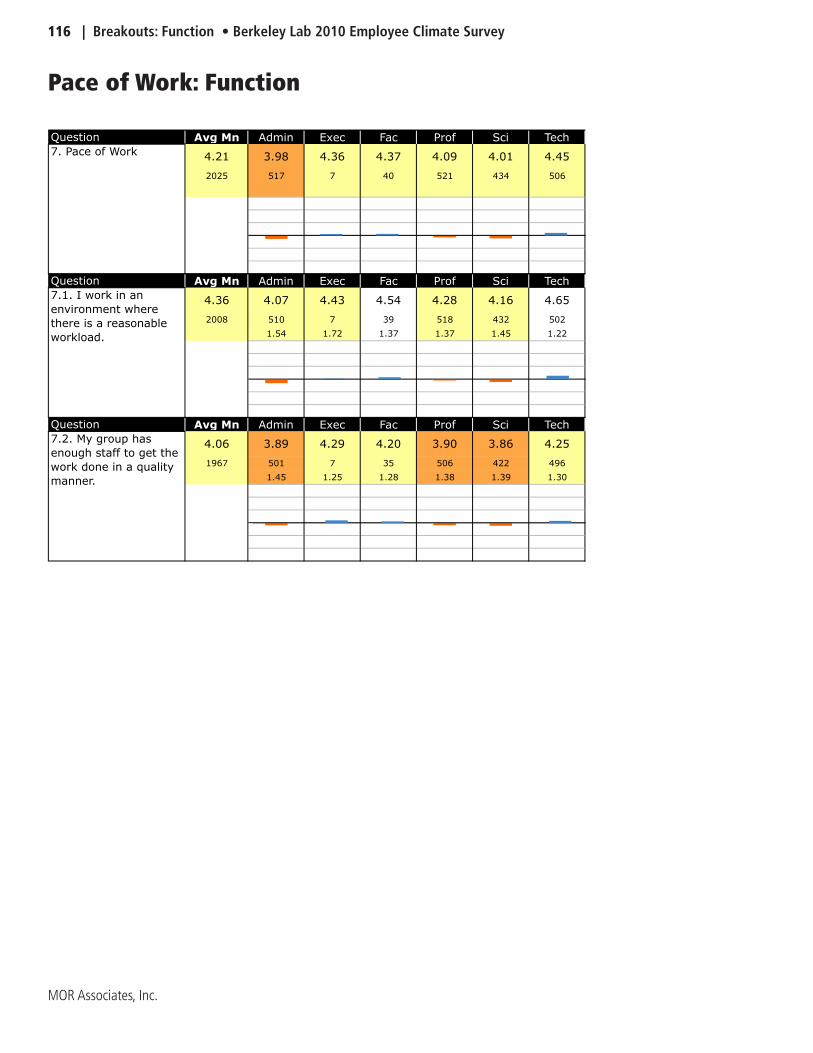
116 | Breakouts: Function • Berkeley Lab 2010 Employee Climate Survey
MOR Associates, Inc.
Pace of Work: Function
Question Avg Mn Admin Exec Fac Prof Sci Tech
4.21 3.98 4.36 4.37 4.09 4.01 4.45
2025 517 7 40 521 434 506
Question Avg Mn Admin Exec Fac Prof Sci Tech
4.36 4.07 4.43 4.54 4.28 4.16 4.65
2008 510 7 39 518 432 502
1.54 1.72 1.37 1.37 1.45 1.22
Question Avg Mn Admin Exec Fac Prof Sci Tech
4.06 3.89 4.29 4.20 3.90 3.86 4.25
1967 501 7 35 506 422 496
1.45 1.25 1.28 1.38 1.39 1.30
7. Pace of Work
7.1. I work in an
environment where
there is a reasonable
workload.
7.2. My group has
enough staff to get the
work done in a quality
manner.
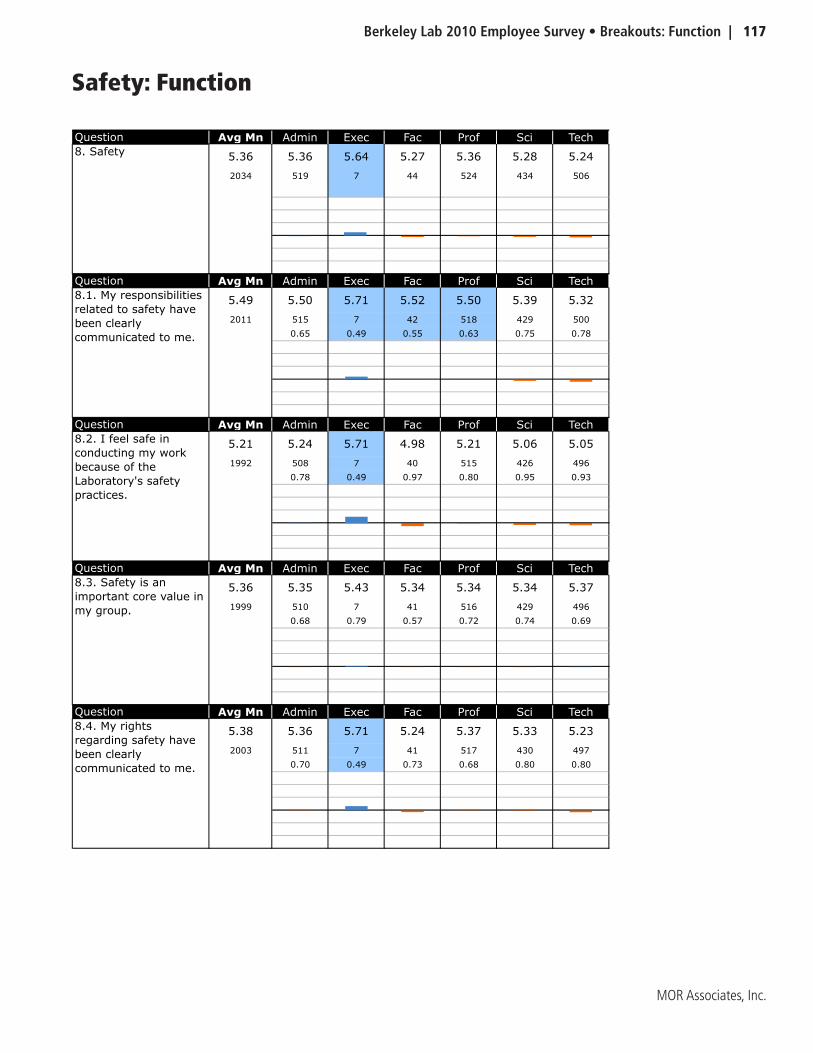
Berkeley Lab 2010 Employee Survey • Breakouts: Function | 117
MOR Associates, Inc.
Safety: Function
Question Avg Mn Admin Exec Fac Prof Sci Tech
5.36 5.36 5.64 5.27 5.36 5.28 5.24
2034 519 7 44 524 434 506
Question Avg Mn Admin Exec Fac Prof Sci Tech
5.49 5.50 5.71 5.52 5.50 5.39 5.32
2011 515 7 42 518 429 500
0.65 0.49 0.55 0.63 0.75 0.78
Question Avg Mn Admin Exec Fac Prof Sci Tech
5.21 5.24 5.71 4.98 5.21 5.06 5.05
1992 508 7 40 515 426 496
0.78 0.49 0.97 0.80 0.95 0.93
Question Avg Mn Admin Exec Fac Prof Sci Tech
5.36 5.35 5.43 5.34 5.34 5.34 5.37
1999 510 7 41 516 429 496
0.68 0.79 0.57 0.72 0.74 0.69
Question Avg Mn Admin Exec Fac Prof Sci Tech
5.38 5.36 5.71 5.24 5.37 5.33 5.23
2003 511 7 41 517 430 497
0.70 0.49 0.73 0.68 0.80 0.80
8.2. I feel safe in
conducting my work
because of the
Laboratory's safety
practices.
8.3. Safety is an
important core value in
my group.
8.4. My rights
regarding safety have
been clearly
communicated to me.
8. Safety
8.1. My responsibilities
related to safety have
been clearly
communicated to me.
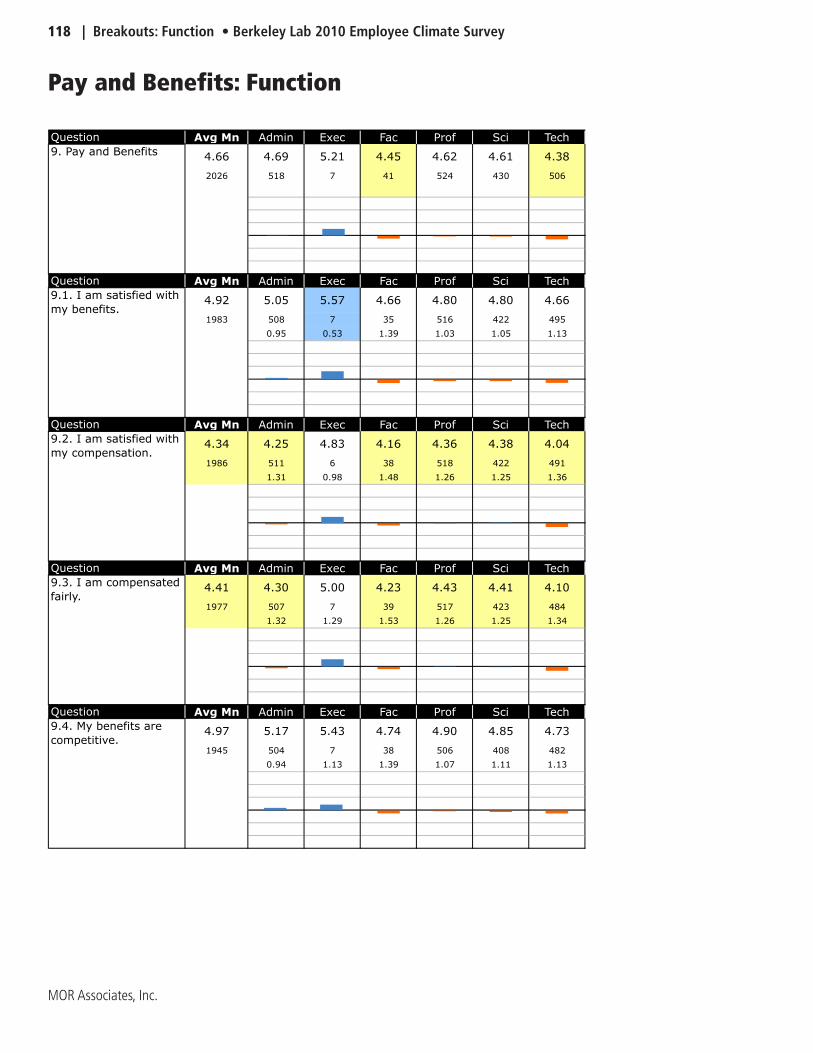
118 | Breakouts: Function • Berkeley Lab 2010 Employee Climate Survey
MOR Associates, Inc.
Pay and Benefits: Function
Question Avg Mn Admin Exec Fac Prof Sci Tech
4.66 4.69 5.21 4.45 4.62 4.61 4.38
2026 518 7 41 524 430 506
Question Avg Mn Admin Exec Fac Prof Sci Tech
4.92 5.05 5.57 4.66 4.80 4.80 4.66
1983 508 7 35 516 422 495
0.95 0.53 1.39 1.03 1.05 1.13
Question Avg Mn Admin Exec Fac Prof Sci Tech
4.34 4.25 4.83 4.16 4.36 4.38 4.04
1986 511 6 38 518 422 491
1.31 0.98 1.48 1.26 1.25 1.36
Question Avg Mn Admin Exec Fac Prof Sci Tech
4.41 4.30 5.00 4.23 4.43 4.41 4.10
1977 507 7 39 517 423 484
1.32 1.29 1.53 1.26 1.25 1.34
Question Avg Mn Admin Exec Fac Prof Sci Tech
4.97 5.17 5.43 4.74 4.90 4.85 4.73
1945 504 7 38 506 408 482
0.94 1.13 1.39 1.07 1.11 1.13
9.4. My benefits are
competitive.
9. Pay and Benefits
9.1. I am satisfied with
my benefits.
9.2. I am satisfied with
my compensation.
9.3. I am compensated
fairly.
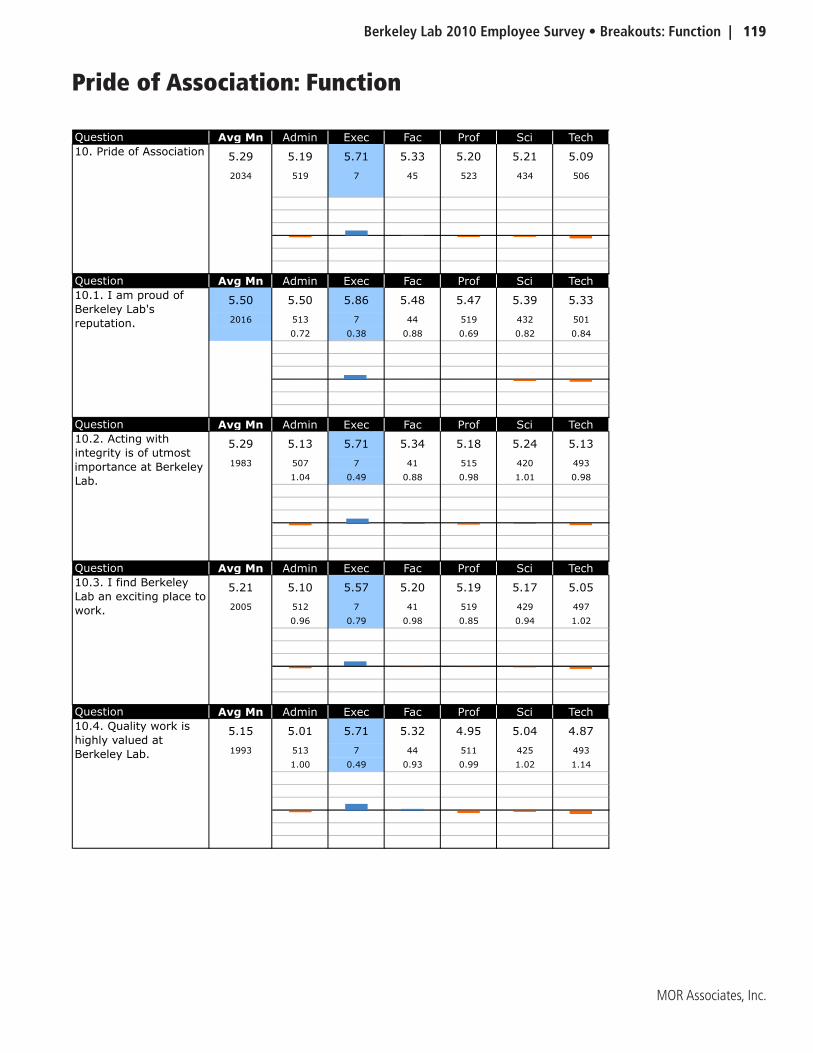
Berkeley Lab 2010 Employee Survey • Breakouts: Function | 119
MOR Associates, Inc.
Pride of Association: Function
Question Avg Mn Admin Exec Fac Prof Sci Tech
5.29 5.19 5.71 5.33 5.20 5.21 5.09
2034 519 7 45 523 434 506
Question Avg Mn Admin Exec Fac Prof Sci Tech
5.50 5.50 5.86 5.48 5.47 5.39 5.33
2016 513 7 44 519 432 501
0.72 0.38 0.88 0.69 0.82 0.84
Question Avg Mn Admin Exec Fac Prof Sci Tech
5.29 5.13 5.71 5.34 5.18 5.24 5.13
1983 507 7 41 515 420 493
1.04 0.49 0.88 0.98 1.01 0.98
Question Avg Mn Admin Exec Fac Prof Sci Tech
5.21 5.10 5.57 5.20 5.19 5.17 5.05
2005 512 7 41 519 429 497
0.96 0.79 0.98 0.85 0.94 1.02
Question Avg Mn Admin Exec Fac Prof Sci Tech
5.15 5.01 5.71 5.32 4.95 5.04 4.87
1993 513 7 44 511 425 493
1.00 0.49 0.93 0.99 1.02 1.14
10.2. Acting with
integrity is of utmost
importance at Berkeley
Lab.
10.3. I find Berkeley
Lab an exciting place to
work.
10.4. Quality work is
highly valued at
Berkeley Lab.
10. Pride of Association
10.1. I am proud of
Berkeley Lab's
reputation.
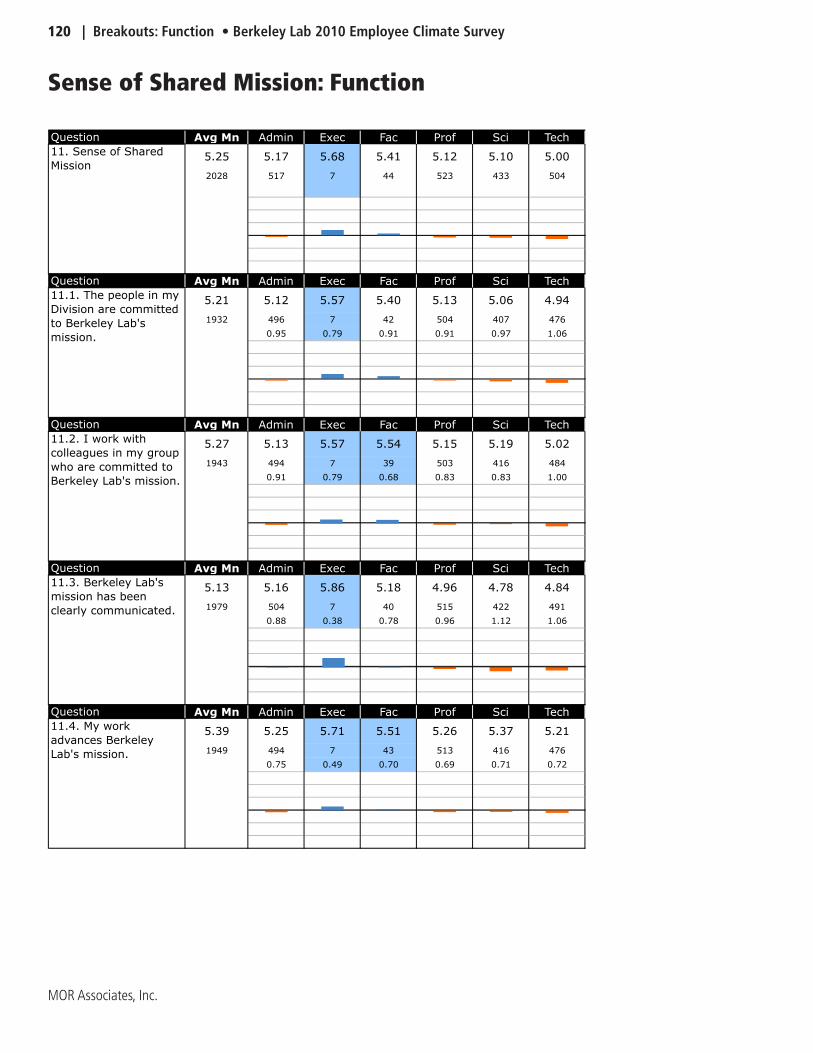
120 | Breakouts: Function • Berkeley Lab 2010 Employee Climate Survey
MOR Associates, Inc.
Sense of Shared Mission: Function
Question Avg Mn Admin Exec Fac Prof Sci Tech
5.25 5.17 5.68 5.41 5.12 5.10 5.00
2028 517 7 44 523 433 504
Question Avg Mn Admin Exec Fac Prof Sci Tech
5.21 5.12 5.57 5.40 5.13 5.06 4.94
1932 496 7 42 504 407 476
0.95 0.79 0.91 0.91 0.97 1.06
Question Avg Mn Admin Exec Fac Prof Sci Tech
5.27 5.13 5.57 5.54 5.15 5.19 5.02
1943 494 7 39 503 416 484
0.91 0.79 0.68 0.83 0.83 1.00
Question Avg Mn Admin Exec Fac Prof Sci Tech
5.13 5.16 5.86 5.18 4.96 4.78 4.84
1979 504 7 40 515 422 491
0.88 0.38 0.78 0.96 1.12 1.06
Question Avg Mn Admin Exec Fac Prof Sci Tech
5.39 5.25 5.71 5.51 5.26 5.37 5.21
1949 494 7 43 513 416 476
0.75 0.49 0.70 0.69 0.71 0.72
11.2. I work with
colleagues in my group
who are committed to
Berkeley Lab's mission.
11.3. Berkeley Lab's
mission has been
clearly communicated.
11.4. My work
advances Berkeley
Lab's mission.
11. Sense of Shared
Mission
11.1. The people in my
Division are committed
to Berkeley Lab's
mission.
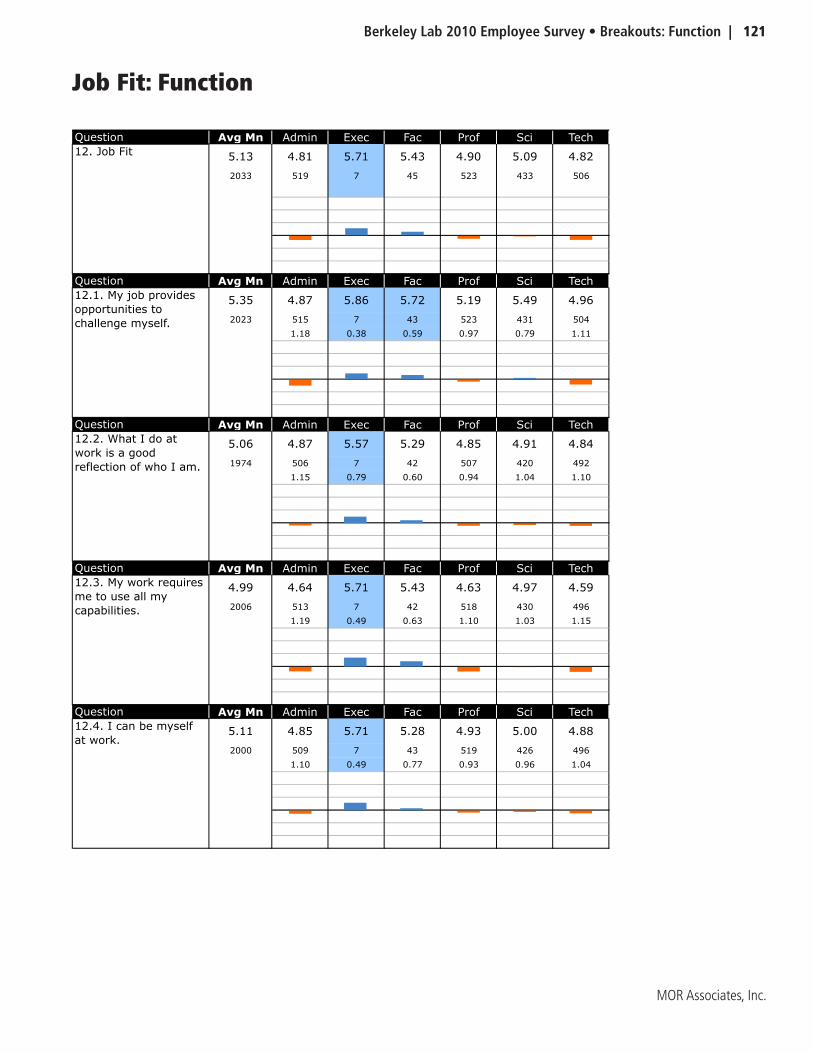
Berkeley Lab 2010 Employee Survey • Breakouts: Function | 121
MOR Associates, Inc.
Job Fit: Function
Question Avg Mn Admin Exec Fac Prof Sci Tech
5.13 4.81 5.71 5.43 4.90 5.09 4.82
2033 519 7 45 523 433 506
Question Avg Mn Admin Exec Fac Prof Sci Tech
5.35 4.87 5.86 5.72 5.19 5.49 4.96
2023 515 7 43 523 431 504
1.18 0.38 0.59 0.97 0.79 1.11
Question Avg Mn Admin Exec Fac Prof Sci Tech
5.06 4.87 5.57 5.29 4.85 4.91 4.84
1974 506 7 42 507 420 492
1.15 0.79 0.60 0.94 1.04 1.10
Question Avg Mn Admin Exec Fac Prof Sci Tech
4.99 4.64 5.71 5.43 4.63 4.97 4.59
2006 513 7 42 518 430 496
1.19 0.49 0.63 1.10 1.03 1.15
Question Avg Mn Admin Exec Fac Prof Sci Tech
5.11 4.85 5.71 5.28 4.93 5.00 4.88
2000 509 7 43 519 426 496
1.10 0.49 0.77 0.93 0.96 1.04
12.2. What I do at
work is a good
reflection of who I am.
12.3. My work requires
me to use all my
capabilities.
12.4. I can be myself
at work.
12. Job Fit
12.1. My job provides
opportunities to
challenge myself.
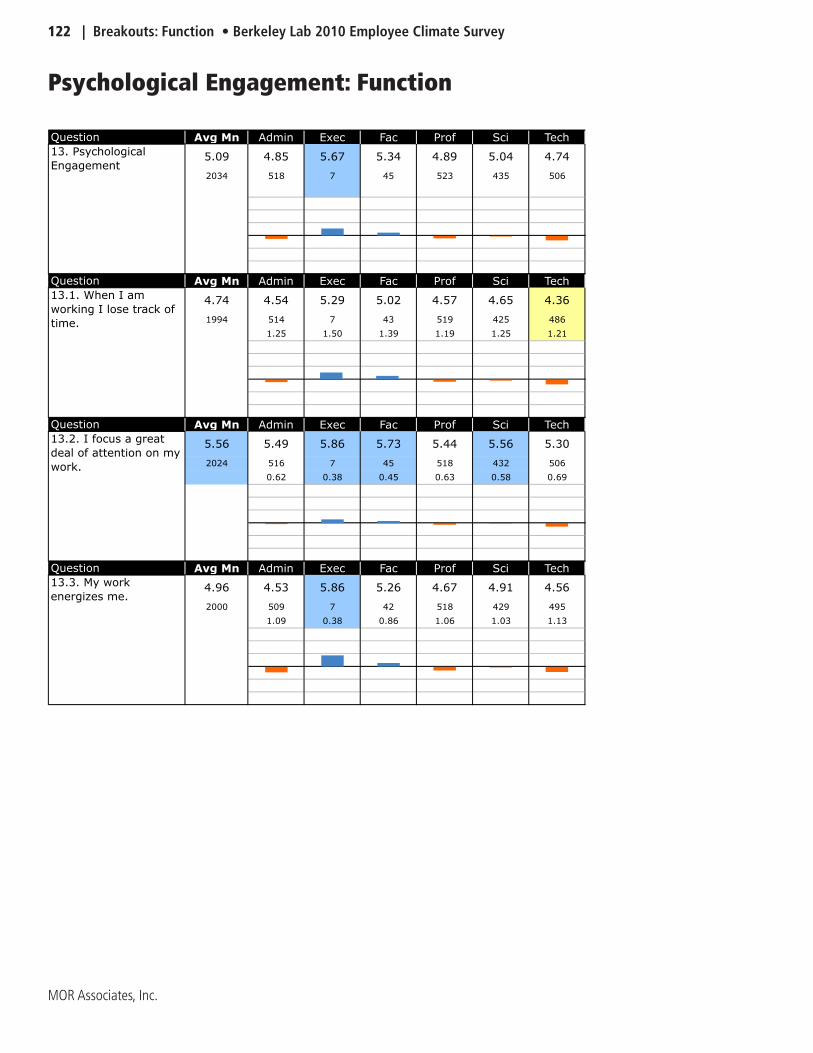
122 | Breakouts: Function • Berkeley Lab 2010 Employee Climate Survey
MOR Associates, Inc.
Psychological Engagement: Function
Question Avg Mn Admin Exec Fac Prof Sci Tech
5.09 4.85 5.67 5.34 4.89 5.04 4.74
2034 518 7 45 523 435 506
Question Avg Mn Admin Exec Fac Prof Sci Tech
4.74 4.54 5.29 5.02 4.57 4.65 4.36
1994 514 7 43 519 425 486
1.25 1.50 1.39 1.19 1.25 1.21
Question Avg Mn Admin Exec Fac Prof Sci Tech
5.56 5.49 5.86 5.73 5.44 5.56 5.30
2024 516 7 45 518 432 506
0.62 0.38 0.45 0.63 0.58 0.69
Question Avg Mn Admin Exec Fac Prof Sci Tech
4.96 4.53 5.86 5.26 4.67 4.91 4.56
2000 509 7 42 518 429 495
1.09 0.38 0.86 1.06 1.03 1.13
13. Psychological
Engagement
13.1. When I am
working I lose track of
time.
13.2. I focus a great
deal of attention on my
work.
13.3. My work
energizes me.
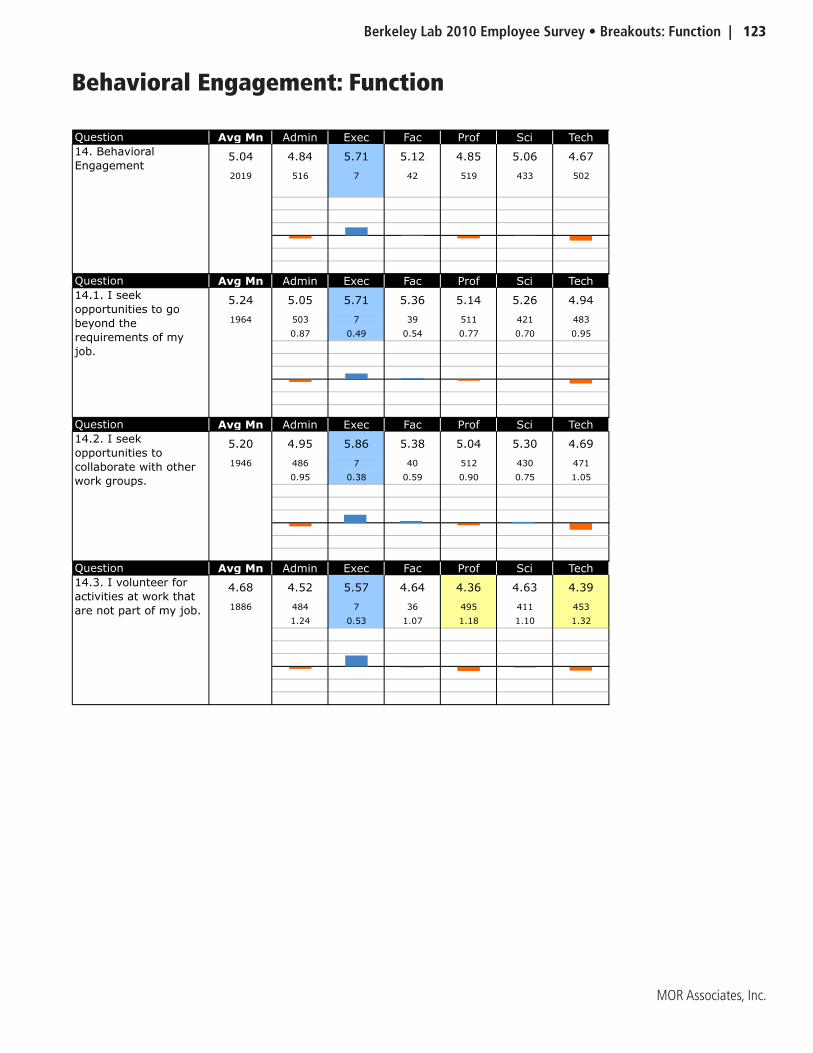
Berkeley Lab 2010 Employee Survey • Breakouts: Function | 123
MOR Associates, Inc.
Behavioral Engagement: Function
Question Avg Mn Admin Exec Fac Prof Sci Tech
5.04 4.84 5.71 5.12 4.85 5.06 4.67
2019 516 7 42 519 433 502
Question Avg Mn Admin Exec Fac Prof Sci Tech
5.24 5.05 5.71 5.36 5.14 5.26 4.94
1964 503 7 39 511 421 483
0.87 0.49 0.54 0.77 0.70 0.95
Question Avg Mn Admin Exec Fac Prof Sci Tech
5.20 4.95 5.86 5.38 5.04 5.30 4.69
1946 486 7 40 512 430 471
0.95 0.38 0.59 0.90 0.75 1.05
Question Avg Mn Admin Exec Fac Prof Sci Tech
4.68 4.52 5.57 4.64 4.36 4.63 4.39
1886 484 7 36 495 411 453
1.24 0.53 1.07 1.18 1.10 1.32
14.3. I volunteer for
activities at work that
are not part of my job.
14. Behavioral
Engagement
14.1. I seek
opportunities to go
beyond the
requirements of my
job.
14.2. I seek
opportunities to
collaborate with other
work groups.
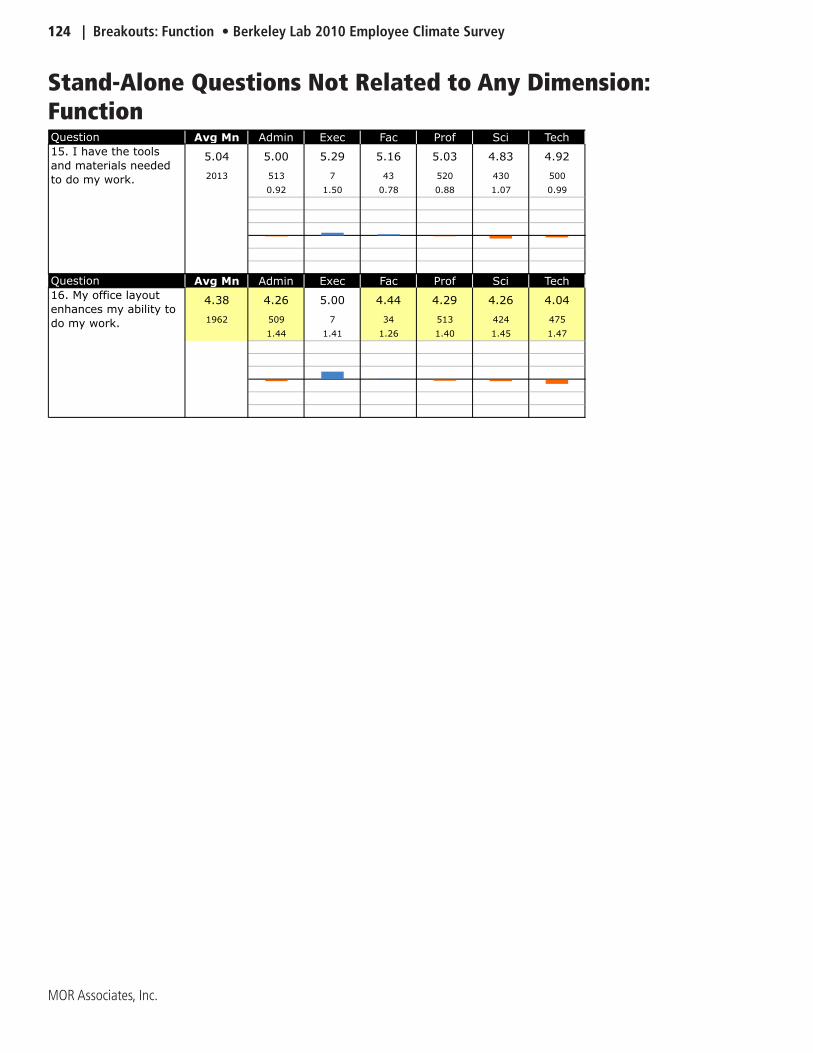
124 | Breakouts: Function • Berkeley Lab 2010 Employee Climate Survey
MOR Associates, Inc.
Stand-Alone Questions Not Related to Any Dimension: FunctionQuestion Avg Mn Admin Exec Fac Prof Sci Tech
5.04 5.00 5.29 5.16 5.03 4.83 4.92
2013 513 7 43 520 430 500
0.92 1.50 0.78 0.88 1.07 0.99
Question Avg Mn Admin Exec Fac Prof Sci Tech
4.38 4.26 5.00 4.44 4.29 4.26 4.04
1962 509 7 34 513 424 475
1.44 1.41 1.26 1.40 1.45 1.47
15. I have the tools
and materials needed
to do my work.
16. My office layout
enhances my ability to
do my work.
Berkeley Lab 2010 Employee Survey • Breakouts: HEERA/FLSA Status | 125
MOR Associates, Inc.
Breakout Charts and Tables:
by HEERA/FLSA Status
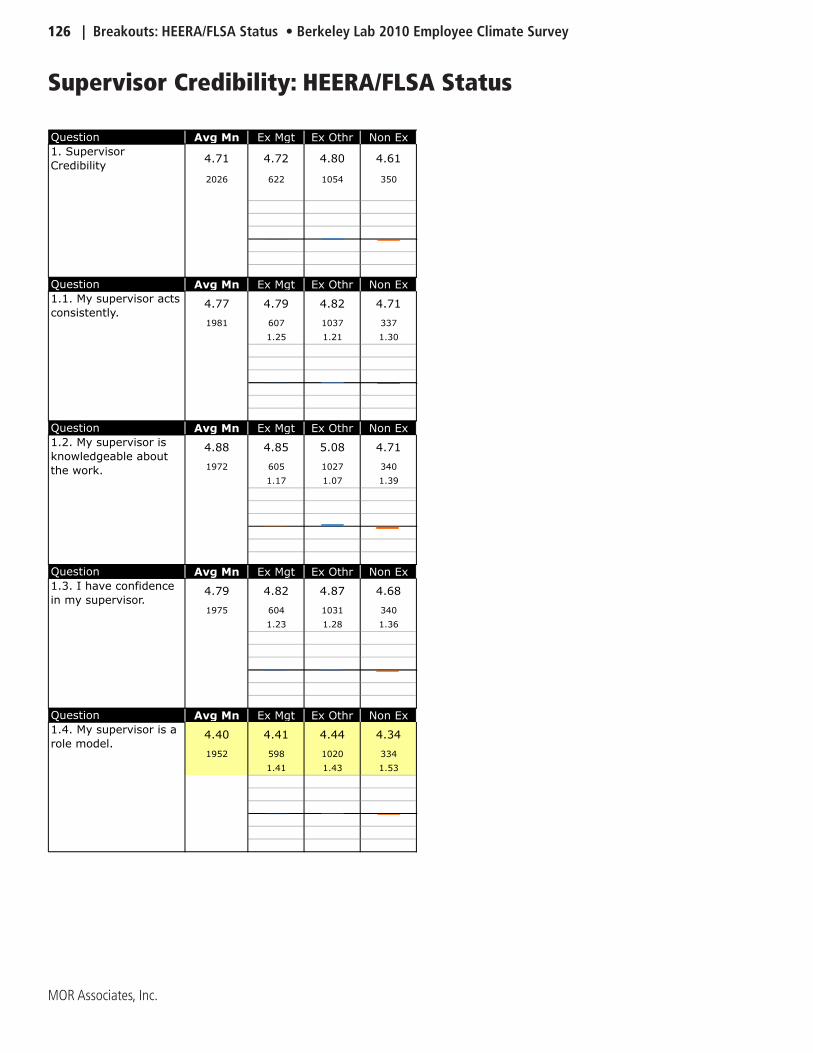
126 | Breakouts: HEERA/FLSA Status • Berkeley Lab 2010 Employee Climate Survey
MOR Associates, Inc.
Supervisor Credibility: HEERA/FLSA Status
Question Avg Mn Ex Mgt Ex Othr Non Ex
4.71 4.72 4.80 4.61
2026 622 1054 350
Question Avg Mn Ex Mgt Ex Othr Non Ex
4.77 4.79 4.82 4.71
1981 607 1037 337
1.25 1.21 1.30
Question Avg Mn Ex Mgt Ex Othr Non Ex
4.88 4.85 5.08 4.71
1972 605 1027 340
1.17 1.07 1.39
Question Avg Mn Ex Mgt Ex Othr Non Ex
4.79 4.82 4.87 4.68
1975 604 1031 340
1.23 1.28 1.36
Question Avg Mn Ex Mgt Ex Othr Non Ex
4.40 4.41 4.44 4.34
1952 598 1020 334
1.41 1.43 1.53
1. Supervisor
Credibility
1.1. My supervisor acts
consistently.
1.2. My supervisor is
knowledgeable about
the work.
1.3. I have confidence
in my supervisor.
1.4. My supervisor is a
role model.
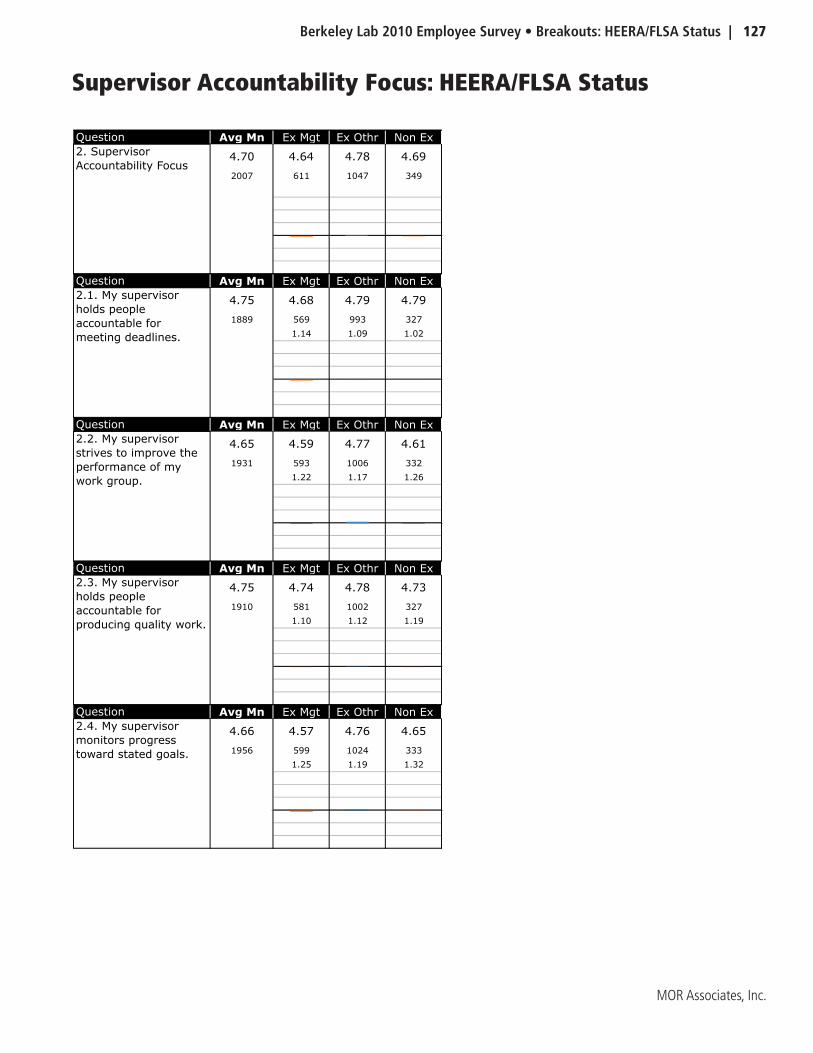
Berkeley Lab 2010 Employee Survey • Breakouts: HEERA/FLSA Status | 127
MOR Associates, Inc.
Supervisor Accountability Focus: HEERA/FLSA Status
Question Avg Mn Ex Mgt Ex Othr Non Ex
4.70 4.64 4.78 4.69
2007 611 1047 349
Question Avg Mn Ex Mgt Ex Othr Non Ex
4.75 4.68 4.79 4.79
1889 569 993 327
1.14 1.09 1.02
Question Avg Mn Ex Mgt Ex Othr Non Ex
4.65 4.59 4.77 4.61
1931 593 1006 332
1.22 1.17 1.26
Question Avg Mn Ex Mgt Ex Othr Non Ex
4.75 4.74 4.78 4.73
1910 581 1002 327
1.10 1.12 1.19
Question Avg Mn Ex Mgt Ex Othr Non Ex
4.66 4.57 4.76 4.65
1956 599 1024 333
1.25 1.19 1.32
2. Supervisor
Accountability Focus
2.1. My supervisor
holds people
accountable for
meeting deadlines.
2.2. My supervisor
strives to improve the
performance of my
work group.
2.3. My supervisor
holds people
accountable for
producing quality work.
2.4. My supervisor
monitors progress
toward stated goals.
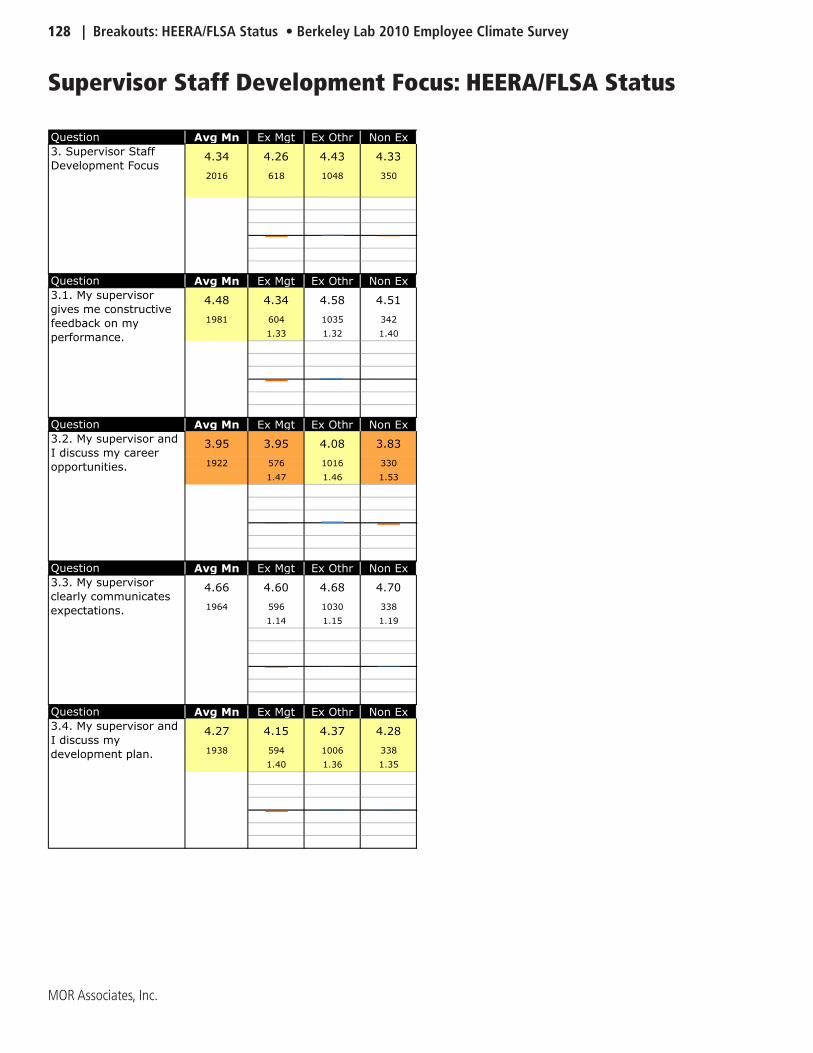
128 | Breakouts: HEERA/FLSA Status • Berkeley Lab 2010 Employee Climate Survey
MOR Associates, Inc.
Supervisor Staff Development Focus: HEERA/FLSA Status
Question Avg Mn Ex Mgt Ex Othr Non Ex
4.34 4.26 4.43 4.33
2016 618 1048 350
Question Avg Mn Ex Mgt Ex Othr Non Ex
4.48 4.34 4.58 4.51
1981 604 1035 342
1.33 1.32 1.40
Question Avg Mn Ex Mgt Ex Othr Non Ex
3.95 3.95 4.08 3.83
1922 576 1016 330
1.47 1.46 1.53
Question Avg Mn Ex Mgt Ex Othr Non Ex
4.66 4.60 4.68 4.70
1964 596 1030 338
1.14 1.15 1.19
Question Avg Mn Ex Mgt Ex Othr Non Ex
4.27 4.15 4.37 4.28
1938 594 1006 338
1.40 1.36 1.35
3. Supervisor Staff
Development Focus
3.1. My supervisor
gives me constructive
feedback on my
performance.
3.2. My supervisor and
I discuss my career
opportunities.
3.3. My supervisor
clearly communicates
expectations.
3.4. My supervisor and
I discuss my
development plan.
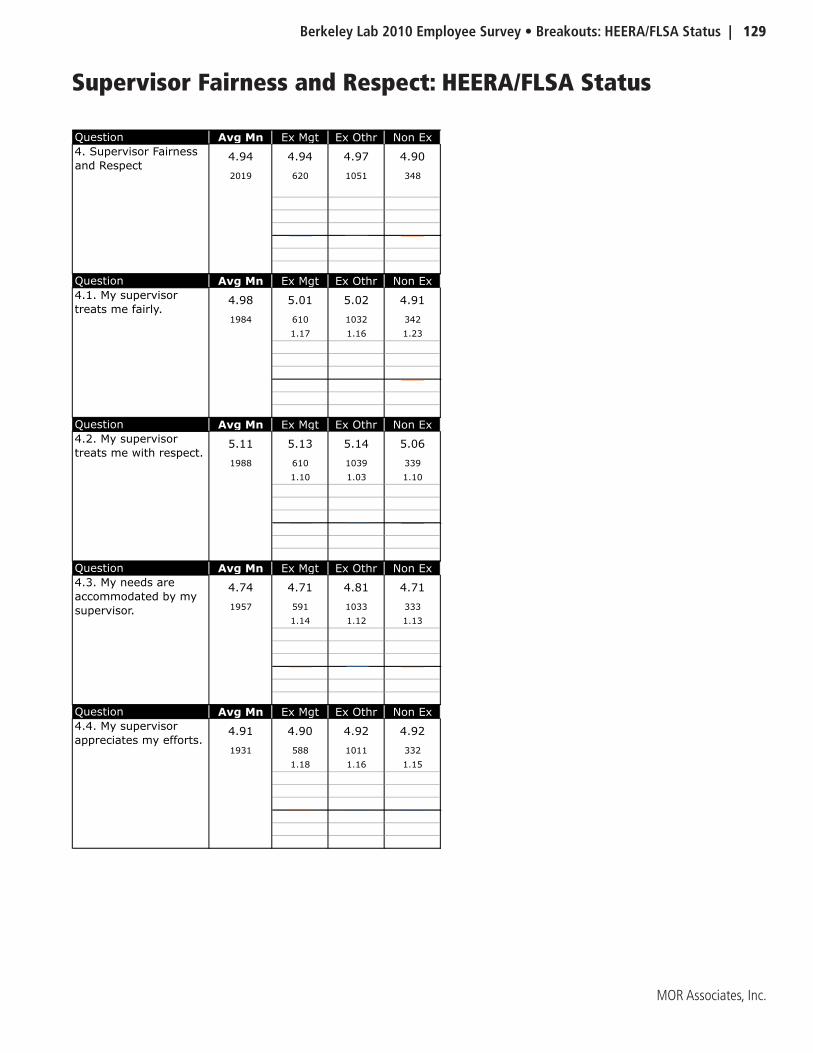
Berkeley Lab 2010 Employee Survey • Breakouts: HEERA/FLSA Status | 129
MOR Associates, Inc.
Supervisor Fairness and Respect: HEERA/FLSA Status
Question Avg Mn Ex Mgt Ex Othr Non Ex
4.94 4.94 4.97 4.90
2019 620 1051 348
Question Avg Mn Ex Mgt Ex Othr Non Ex
4.98 5.01 5.02 4.91
1984 610 1032 342
1.17 1.16 1.23
Question Avg Mn Ex Mgt Ex Othr Non Ex
5.11 5.13 5.14 5.06
1988 610 1039 339
1.10 1.03 1.10
Question Avg Mn Ex Mgt Ex Othr Non Ex
4.74 4.71 4.81 4.71
1957 591 1033 333
1.14 1.12 1.13
Question Avg Mn Ex Mgt Ex Othr Non Ex
4.91 4.90 4.92 4.92
1931 588 1011 332
1.18 1.16 1.15
4. Supervisor Fairness
and Respect
4.1. My supervisor
treats me fairly.
4.2. My supervisor
treats me with respect.
4.3. My needs are
accommodated by my
supervisor.
4.4. My supervisor
appreciates my efforts.
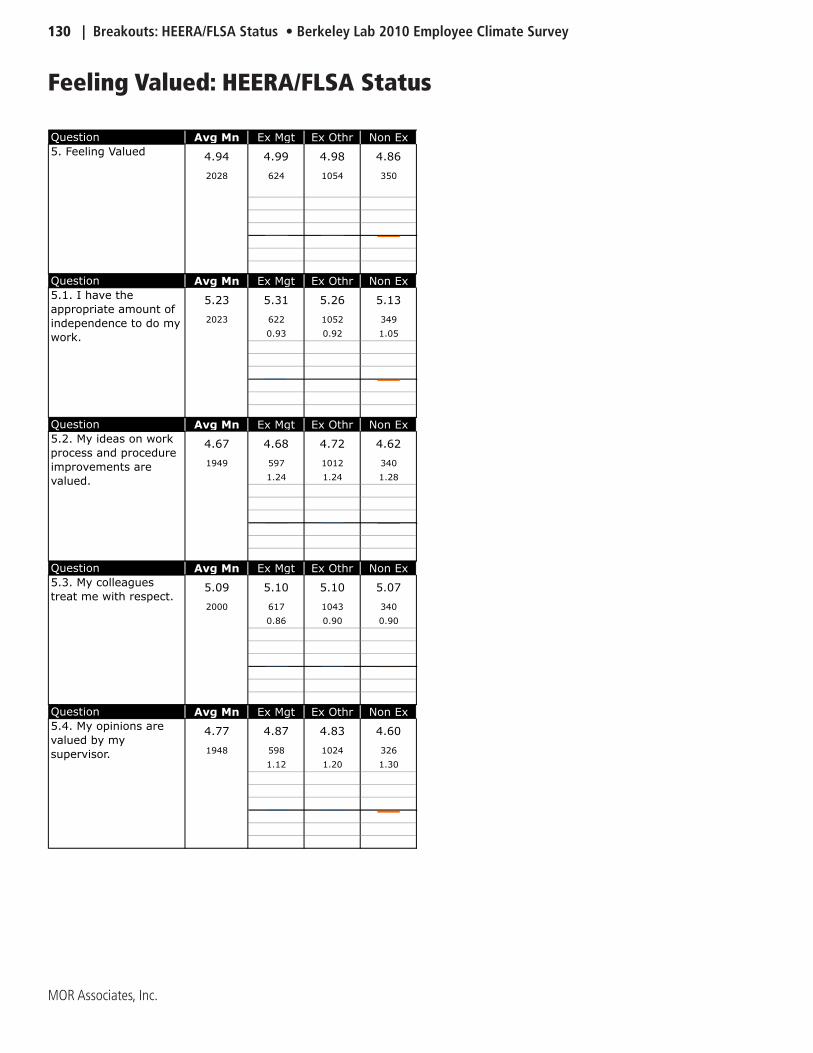
130 | Breakouts: HEERA/FLSA Status • Berkeley Lab 2010 Employee Climate Survey
MOR Associates, Inc.
Feeling Valued: HEERA/FLSA Status
Question Avg Mn Ex Mgt Ex Othr Non Ex
4.94 4.99 4.98 4.86
2028 624 1054 350
Question Avg Mn Ex Mgt Ex Othr Non Ex
5.23 5.31 5.26 5.13
2023 622 1052 349
0.93 0.92 1.05
Question Avg Mn Ex Mgt Ex Othr Non Ex
4.67 4.68 4.72 4.62
1949 597 1012 340
1.24 1.24 1.28
Question Avg Mn Ex Mgt Ex Othr Non Ex
5.09 5.10 5.10 5.07
2000 617 1043 340
0.86 0.90 0.90
Question Avg Mn Ex Mgt Ex Othr Non Ex
4.77 4.87 4.83 4.60
1948 598 1024 326
1.12 1.20 1.30
5. Feeling Valued
5.1. I have the
appropriate amount of
independence to do my
work.
5.2. My ideas on work
process and procedure
improvements are
valued.
5.3. My colleagues
treat me with respect.
5.4. My opinions are
valued by my
supervisor.
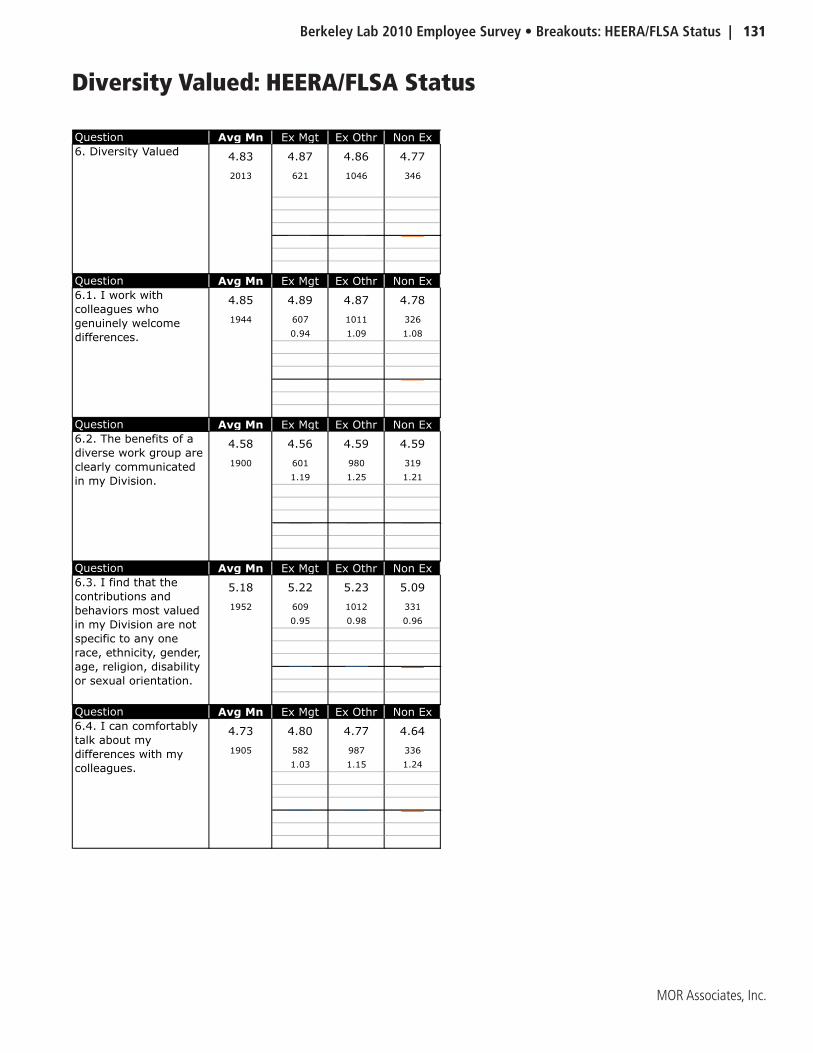
Berkeley Lab 2010 Employee Survey • Breakouts: HEERA/FLSA Status | 131
MOR Associates, Inc.
Diversity Valued: HEERA/FLSA Status
Question Avg Mn Ex Mgt Ex Othr Non Ex
4.83 4.87 4.86 4.77
2013 621 1046 346
Question Avg Mn Ex Mgt Ex Othr Non Ex
4.85 4.89 4.87 4.78
1944 607 1011 326
0.94 1.09 1.08
Question Avg Mn Ex Mgt Ex Othr Non Ex
4.58 4.56 4.59 4.59
1900 601 980 319
1.19 1.25 1.21
Question Avg Mn Ex Mgt Ex Othr Non Ex
5.18 5.22 5.23 5.09
1952 609 1012 331
0.95 0.98 0.96
Question Avg Mn Ex Mgt Ex Othr Non Ex
4.73 4.80 4.77 4.64
1905 582 987 336
1.03 1.15 1.24
6. Diversity Valued
6.1. I work with
colleagues who
genuinely welcome
differences.
6.2. The benefits of a
diverse work group are
clearly communicated
in my Division.
6.3. I find that the
contributions and
behaviors most valued
in my Division are not
specific to any one
race, ethnicity, gender,
age, religion, disability
or sexual orientation.
6.4. I can comfortably
talk about my
differences with my
colleagues.
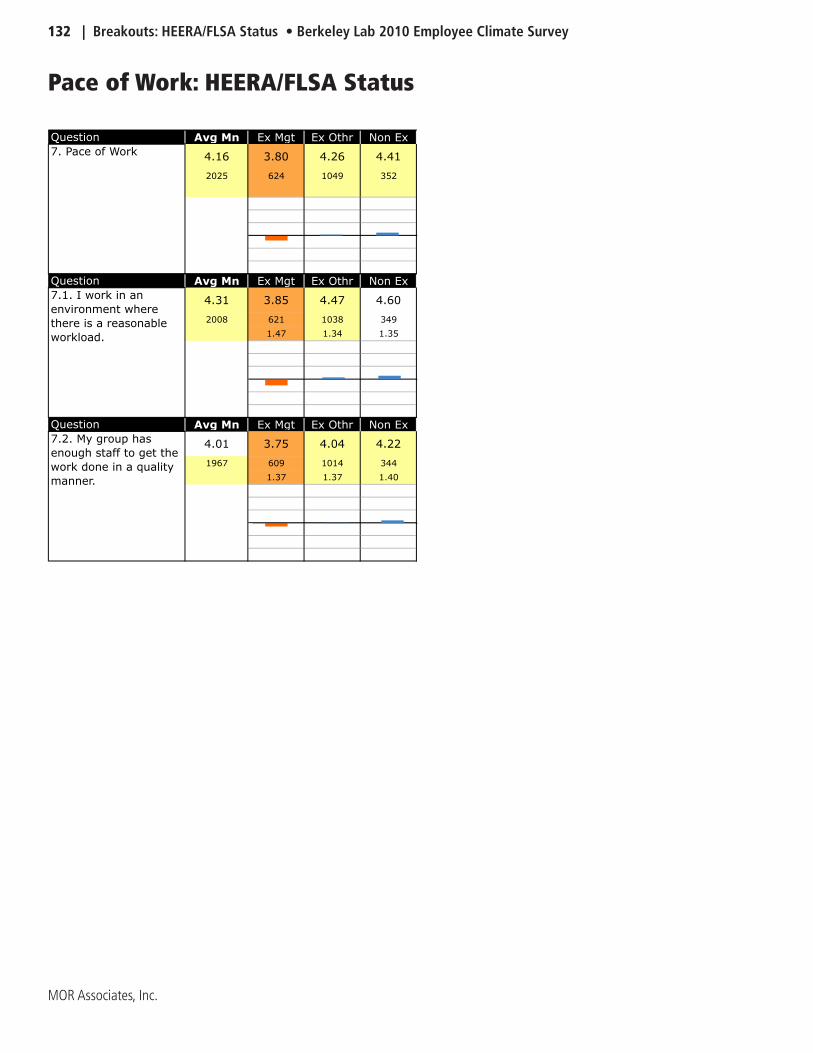
132 | Breakouts: HEERA/FLSA Status • Berkeley Lab 2010 Employee Climate Survey
MOR Associates, Inc.
Pace of Work: HEERA/FLSA Status
Question Avg Mn Ex Mgt Ex Othr Non Ex
4.16 3.80 4.26 4.41
2025 624 1049 352
Question Avg Mn Ex Mgt Ex Othr Non Ex
4.31 3.85 4.47 4.60
2008 621 1038 349
1.47 1.34 1.35
Question Avg Mn Ex Mgt Ex Othr Non Ex
4.01 3.75 4.04 4.22
1967 609 1014 344
1.37 1.37 1.40
7. Pace of Work
7.1. I work in an
environment where
there is a reasonable
workload.
7.2. My group has
enough staff to get the
work done in a quality
manner.
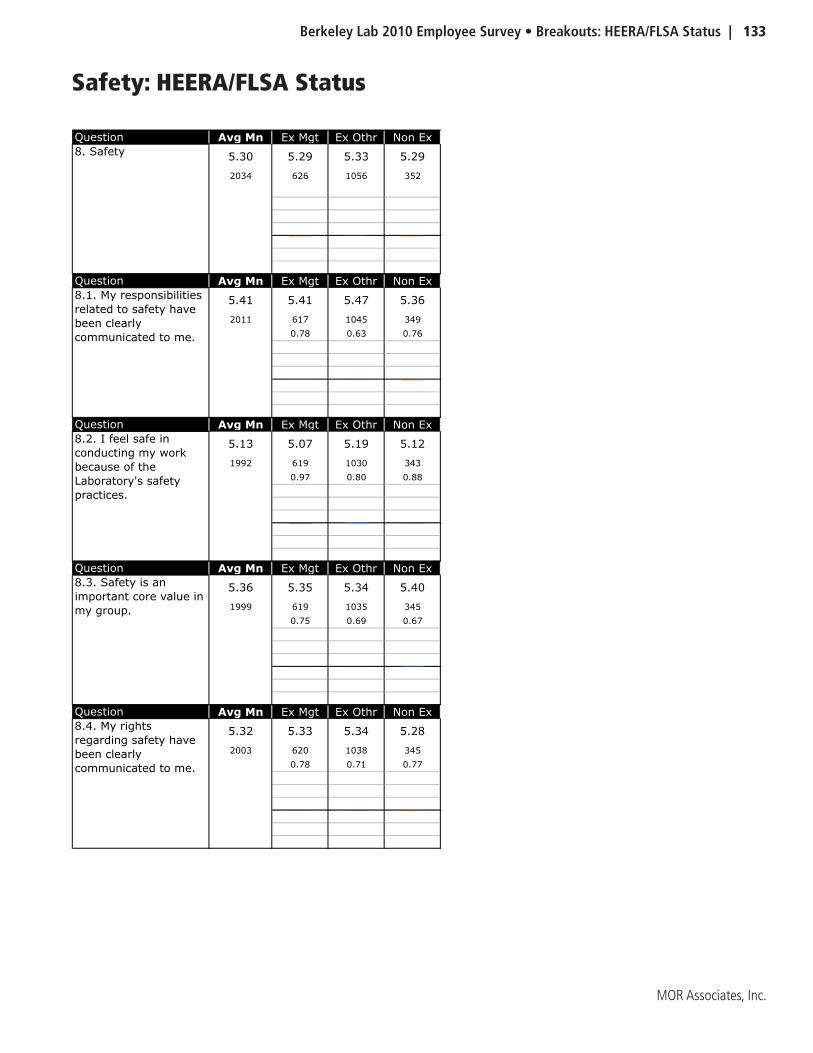
Berkeley Lab 2010 Employee Survey • Breakouts: HEERA/FLSA Status | 133
MOR Associates, Inc.
Safety: HEERA/FLSA Status
Question Avg Mn Ex Mgt Ex Othr Non Ex
5.30 5.29 5.33 5.29
2034 626 1056 352
Question Avg Mn Ex Mgt Ex Othr Non Ex
5.41 5.41 5.47 5.36
2011 617 1045 349
0.78 0.63 0.76
Question Avg Mn Ex Mgt Ex Othr Non Ex
5.13 5.07 5.19 5.12
1992 619 1030 343
0.97 0.80 0.88
Question Avg Mn Ex Mgt Ex Othr Non Ex
5.36 5.35 5.34 5.40
1999 619 1035 345
0.75 0.69 0.67
Question Avg Mn Ex Mgt Ex Othr Non Ex
5.32 5.33 5.34 5.28
2003 620 1038 345
0.78 0.71 0.77
8.2. I feel safe in
conducting my work
because of the
Laboratory's safety
practices.
8.3. Safety is an
important core value in
my group.
8.4. My rights
regarding safety have
been clearly
communicated to me.
8. Safety
8.1. My responsibilities
related to safety have
been clearly
communicated to me.
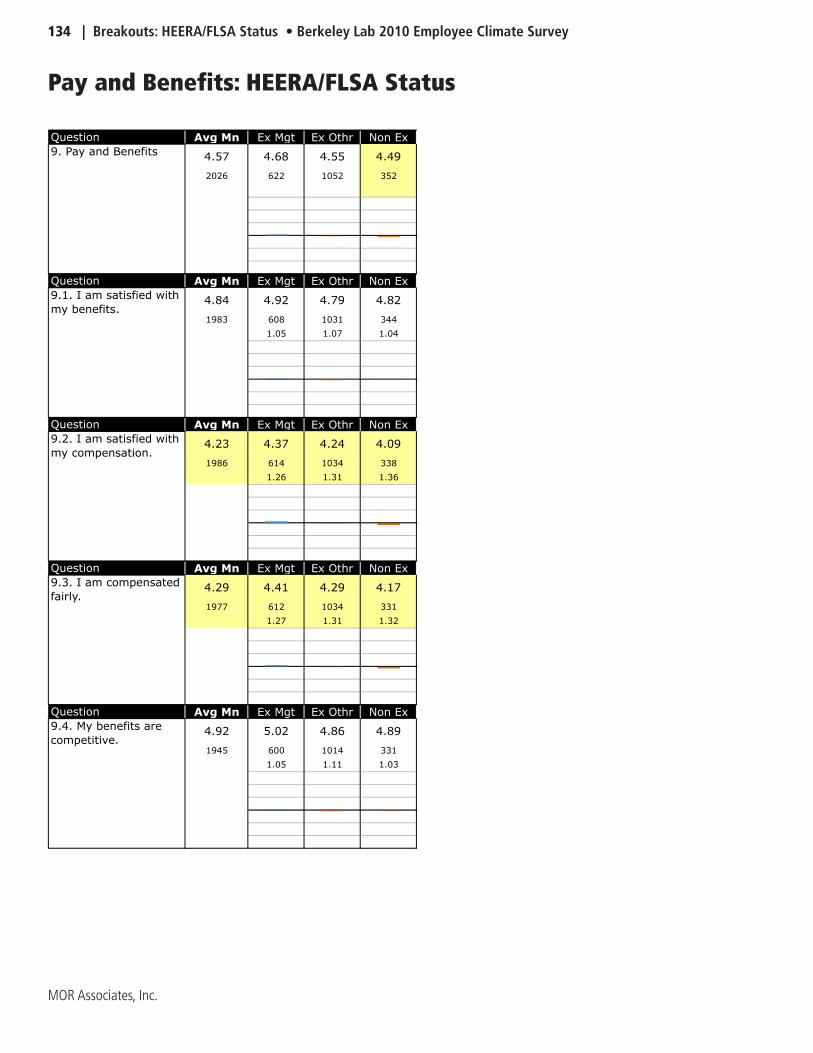
134 | Breakouts: HEERA/FLSA Status • Berkeley Lab 2010 Employee Climate Survey
MOR Associates, Inc.
Pay and Benefits: HEERA/FLSA Status
Question Avg Mn Ex Mgt Ex Othr Non Ex
4.57 4.68 4.55 4.49
2026 622 1052 352
Question Avg Mn Ex Mgt Ex Othr Non Ex
4.84 4.92 4.79 4.82
1983 608 1031 344
1.05 1.07 1.04
Question Avg Mn Ex Mgt Ex Othr Non Ex
4.23 4.37 4.24 4.09
1986 614 1034 338
1.26 1.31 1.36
Question Avg Mn Ex Mgt Ex Othr Non Ex
4.29 4.41 4.29 4.17
1977 612 1034 331
1.27 1.31 1.32
Question Avg Mn Ex Mgt Ex Othr Non Ex
4.92 5.02 4.86 4.89
1945 600 1014 331
1.05 1.11 1.03
9.4. My benefits are
competitive.
9. Pay and Benefits
9.1. I am satisfied with
my benefits.
9.2. I am satisfied with
my compensation.
9.3. I am compensated
fairly.
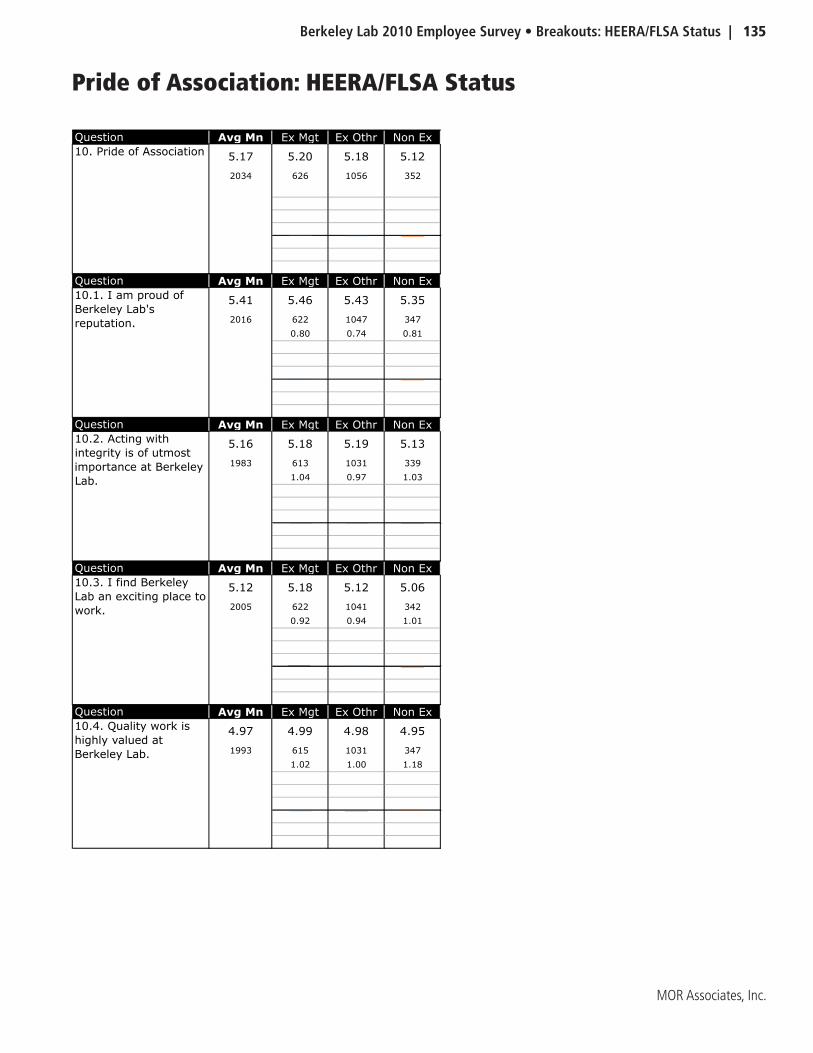
Berkeley Lab 2010 Employee Survey • Breakouts: HEERA/FLSA Status | 135
MOR Associates, Inc.
Pride of Association: HEERA/FLSA Status
Question Avg Mn Ex Mgt Ex Othr Non Ex
5.17 5.20 5.18 5.12
2034 626 1056 352
Question Avg Mn Ex Mgt Ex Othr Non Ex
5.41 5.46 5.43 5.35
2016 622 1047 347
0.80 0.74 0.81
Question Avg Mn Ex Mgt Ex Othr Non Ex
5.16 5.18 5.19 5.13
1983 613 1031 339
1.04 0.97 1.03
Question Avg Mn Ex Mgt Ex Othr Non Ex
5.12 5.18 5.12 5.06
2005 622 1041 342
0.92 0.94 1.01
Question Avg Mn Ex Mgt Ex Othr Non Ex
4.97 4.99 4.98 4.95
1993 615 1031 347
1.02 1.00 1.18
10.2. Acting with
integrity is of utmost
importance at Berkeley
Lab.
10.3. I find Berkeley
Lab an exciting place to
work.
10.4. Quality work is
highly valued at
Berkeley Lab.
10. Pride of Association
10.1. I am proud of
Berkeley Lab's
reputation.
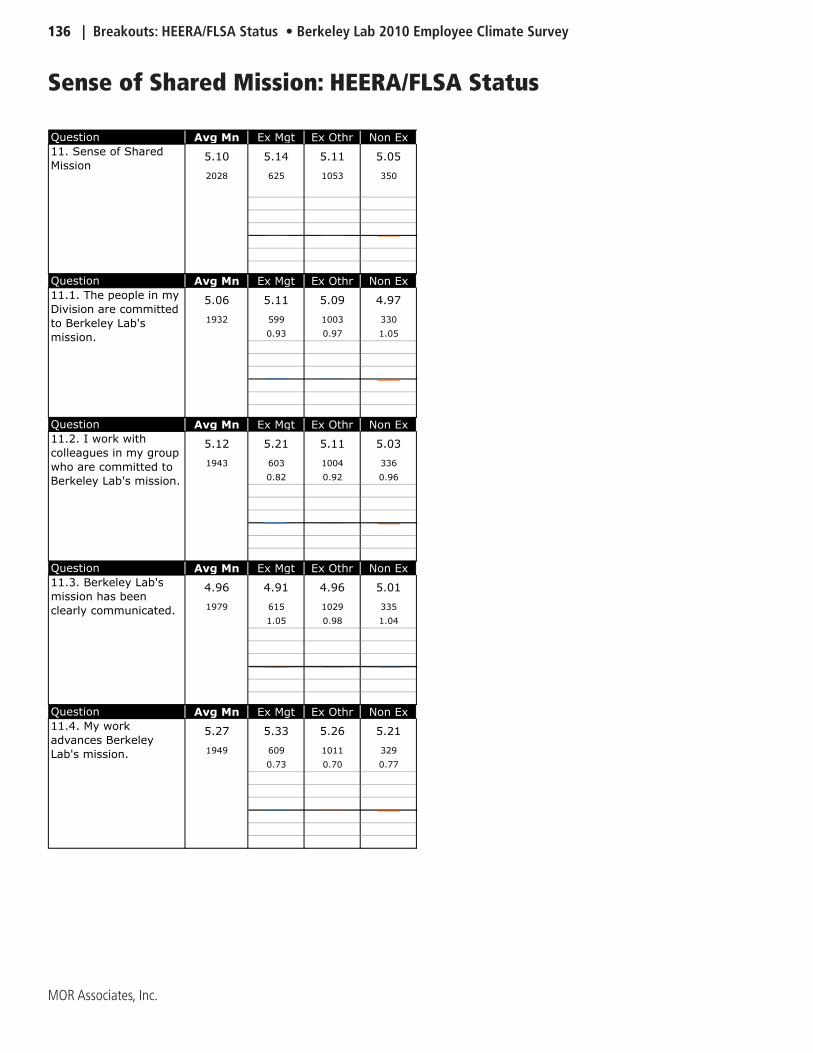
136 | Breakouts: HEERA/FLSA Status • Berkeley Lab 2010 Employee Climate Survey
MOR Associates, Inc.
Sense of Shared Mission: HEERA/FLSA Status
Question Avg Mn Ex Mgt Ex Othr Non Ex
5.10 5.14 5.11 5.05
2028 625 1053 350
Question Avg Mn Ex Mgt Ex Othr Non Ex
5.06 5.11 5.09 4.97
1932 599 1003 330
0.93 0.97 1.05
Question Avg Mn Ex Mgt Ex Othr Non Ex
5.12 5.21 5.11 5.03
1943 603 1004 336
0.82 0.92 0.96
Question Avg Mn Ex Mgt Ex Othr Non Ex
4.96 4.91 4.96 5.01
1979 615 1029 335
1.05 0.98 1.04
Question Avg Mn Ex Mgt Ex Othr Non Ex
5.27 5.33 5.26 5.21
1949 609 1011 329
0.73 0.70 0.77
11.2. I work with
colleagues in my group
who are committed to
Berkeley Lab's mission.
11.3. Berkeley Lab's
mission has been
clearly communicated.
11.4. My work
advances Berkeley
Lab's mission.
11. Sense of Shared
Mission
11.1. The people in my
Division are committed
to Berkeley Lab's
mission.
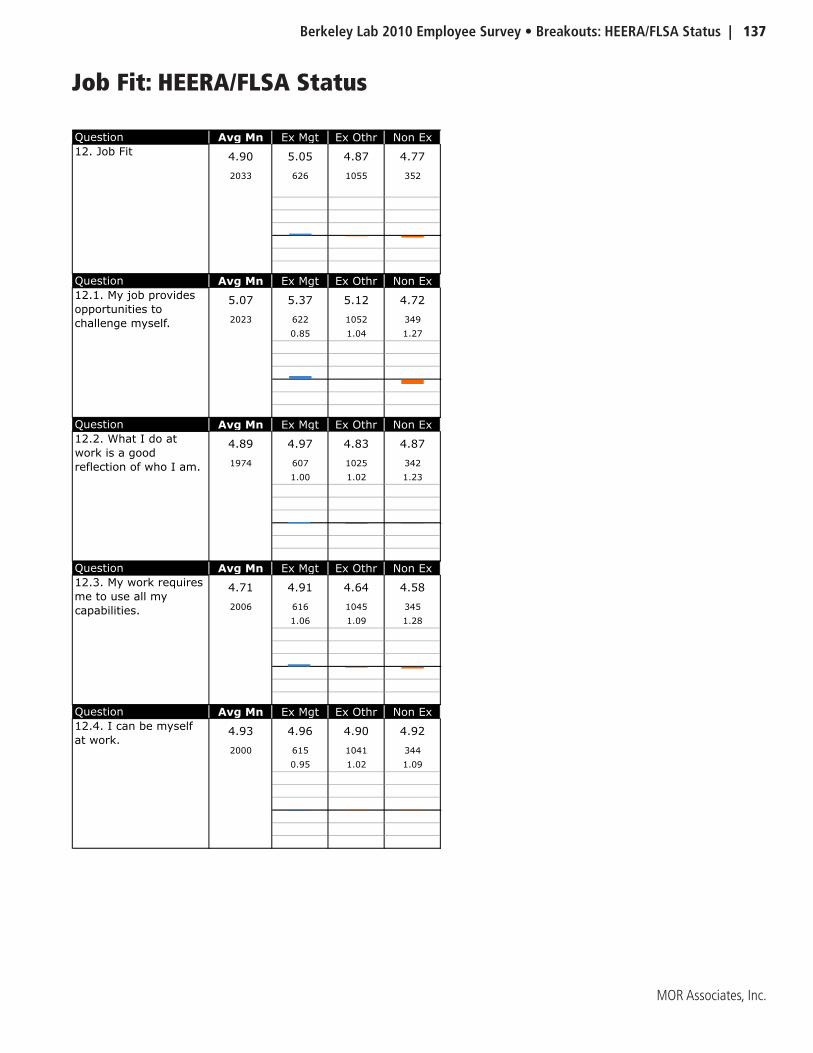
Berkeley Lab 2010 Employee Survey • Breakouts: HEERA/FLSA Status | 137
MOR Associates, Inc.
Job Fit: HEERA/FLSA Status
Question Avg Mn Ex Mgt Ex Othr Non Ex
4.90 5.05 4.87 4.77
2033 626 1055 352
Question Avg Mn Ex Mgt Ex Othr Non Ex
5.07 5.37 5.12 4.72
2023 622 1052 349
0.85 1.04 1.27
Question Avg Mn Ex Mgt Ex Othr Non Ex
4.89 4.97 4.83 4.87
1974 607 1025 342
1.00 1.02 1.23
Question Avg Mn Ex Mgt Ex Othr Non Ex
4.71 4.91 4.64 4.58
2006 616 1045 345
1.06 1.09 1.28
Question Avg Mn Ex Mgt Ex Othr Non Ex
4.93 4.96 4.90 4.92
2000 615 1041 344
0.95 1.02 1.09
12.2. What I do at
work is a good
reflection of who I am.
12.3. My work requires
me to use all my
capabilities.
12.4. I can be myself
at work.
12. Job Fit
12.1. My job provides
opportunities to
challenge myself.
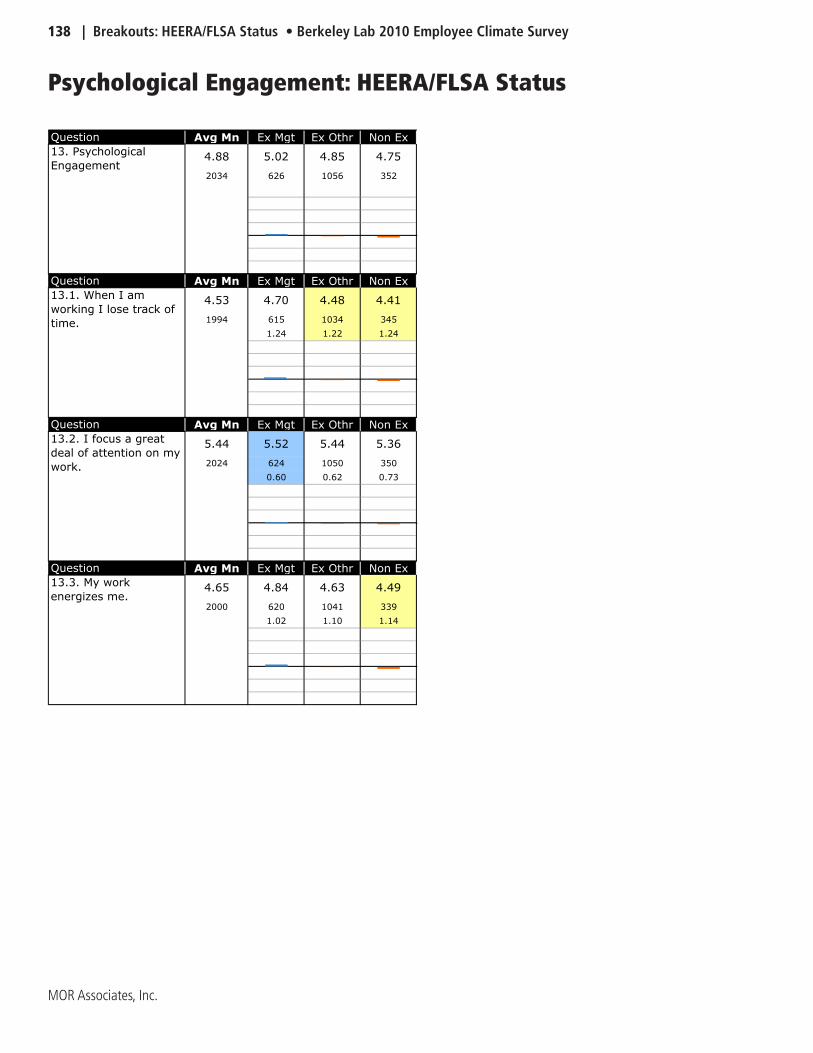
138 | Breakouts: HEERA/FLSA Status • Berkeley Lab 2010 Employee Climate Survey
MOR Associates, Inc.
Psychological Engagement: HEERA/FLSA Status
Question Avg Mn Ex Mgt Ex Othr Non Ex
4.88 5.02 4.85 4.75
2034 626 1056 352
Question Avg Mn Ex Mgt Ex Othr Non Ex
4.53 4.70 4.48 4.41
1994 615 1034 345
1.24 1.22 1.24
Question Avg Mn Ex Mgt Ex Othr Non Ex
5.44 5.52 5.44 5.36
2024 624 1050 350
0.60 0.62 0.73
Question Avg Mn Ex Mgt Ex Othr Non Ex
4.65 4.84 4.63 4.49
2000 620 1041 339
1.02 1.10 1.14
13. Psychological
Engagement
13.1. When I am
working I lose track of
time.
13.2. I focus a great
deal of attention on my
work.
13.3. My work
energizes me.
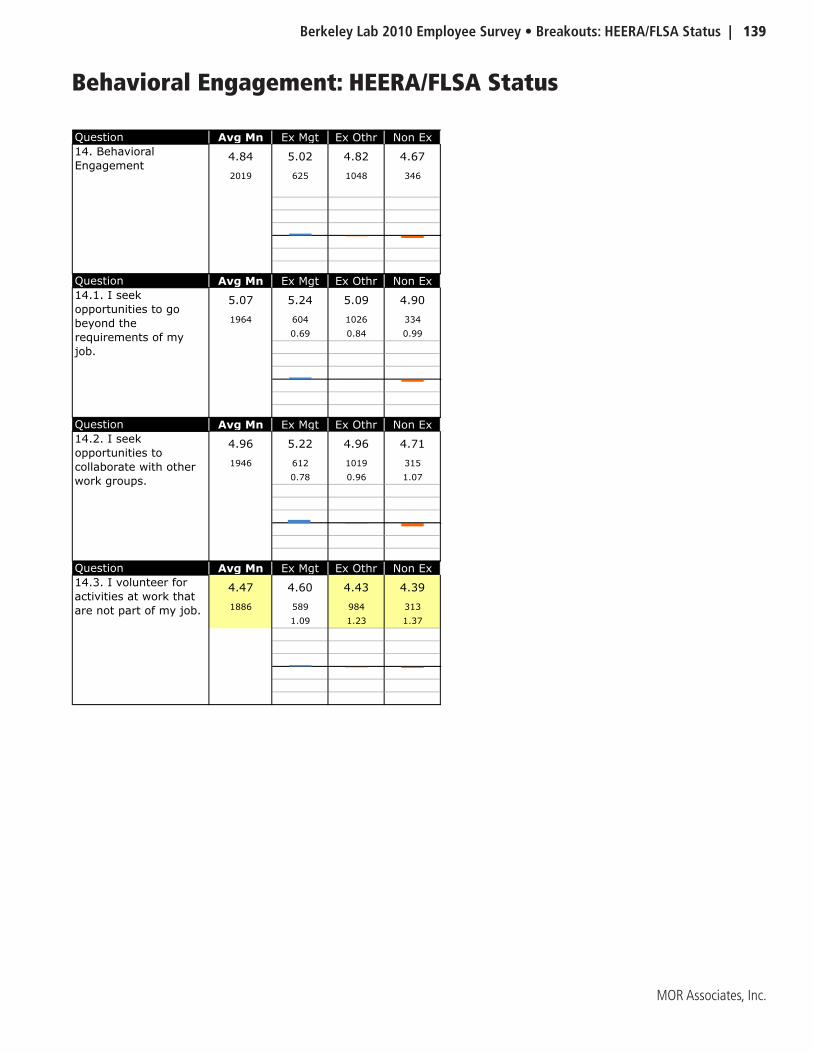
Berkeley Lab 2010 Employee Survey • Breakouts: HEERA/FLSA Status | 139
MOR Associates, Inc.
Behavioral Engagement: HEERA/FLSA Status
Question Avg Mn Ex Mgt Ex Othr Non Ex
4.84 5.02 4.82 4.67
2019 625 1048 346
Question Avg Mn Ex Mgt Ex Othr Non Ex
5.07 5.24 5.09 4.90
1964 604 1026 334
0.69 0.84 0.99
Question Avg Mn Ex Mgt Ex Othr Non Ex
4.96 5.22 4.96 4.71
1946 612 1019 315
0.78 0.96 1.07
Question Avg Mn Ex Mgt Ex Othr Non Ex
4.47 4.60 4.43 4.39
1886 589 984 313
1.09 1.23 1.37
14.3. I volunteer for
activities at work that
are not part of my job.
14. Behavioral
Engagement
14.1. I seek
opportunities to go
beyond the
requirements of my
job.
14.2. I seek
opportunities to
collaborate with other
work groups.
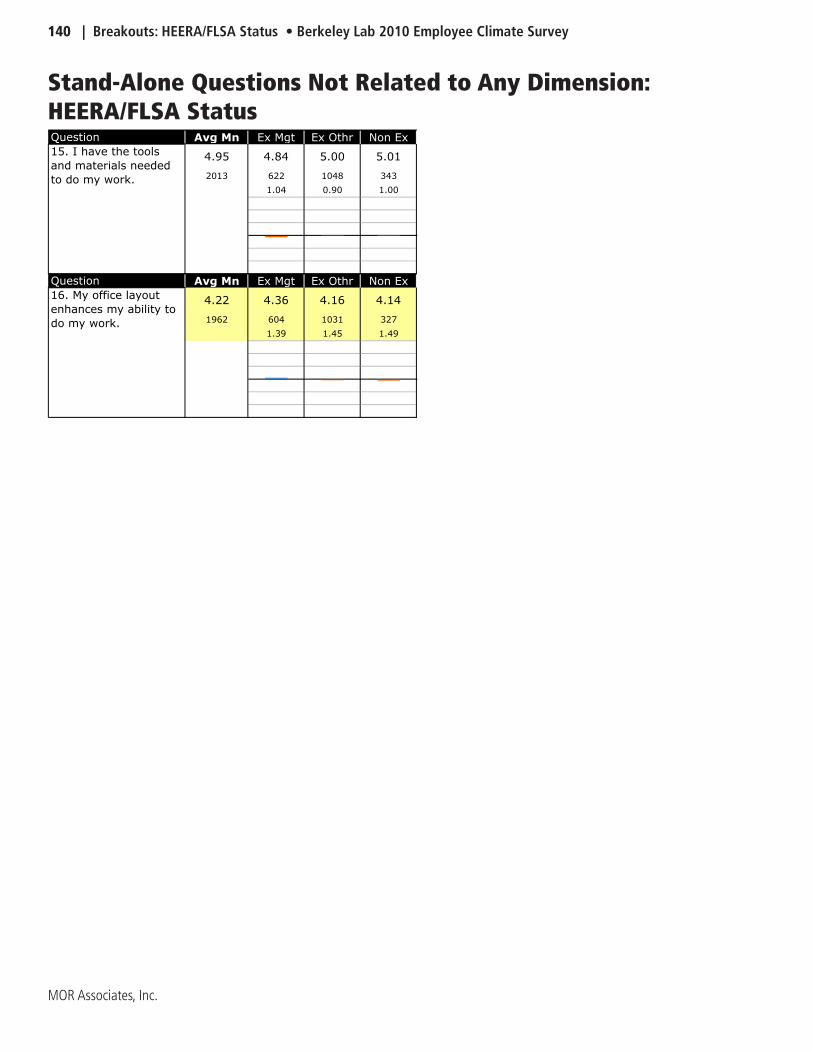
140 | Breakouts: HEERA/FLSA Status • Berkeley Lab 2010 Employee Climate Survey
MOR Associates, Inc.
Stand-Alone Questions Not Related to Any Dimension: HEERA/FLSA StatusQuestion Avg Mn Ex Mgt Ex Othr Non Ex
4.95 4.84 5.00 5.01
2013 622 1048 343
1.04 0.90 1.00
Question Avg Mn Ex Mgt Ex Othr Non Ex
4.22 4.36 4.16 4.14
1962 604 1031 327
1.39 1.45 1.49
15. I have the tools
and materials needed
to do my work.
16. My office layout
enhances my ability to
do my work.

Berkeley Lab 2010 Employee Survey • Breakouts: Gender | 141
MOR Associates, Inc.
Breakout Charts and Tables: by Gender
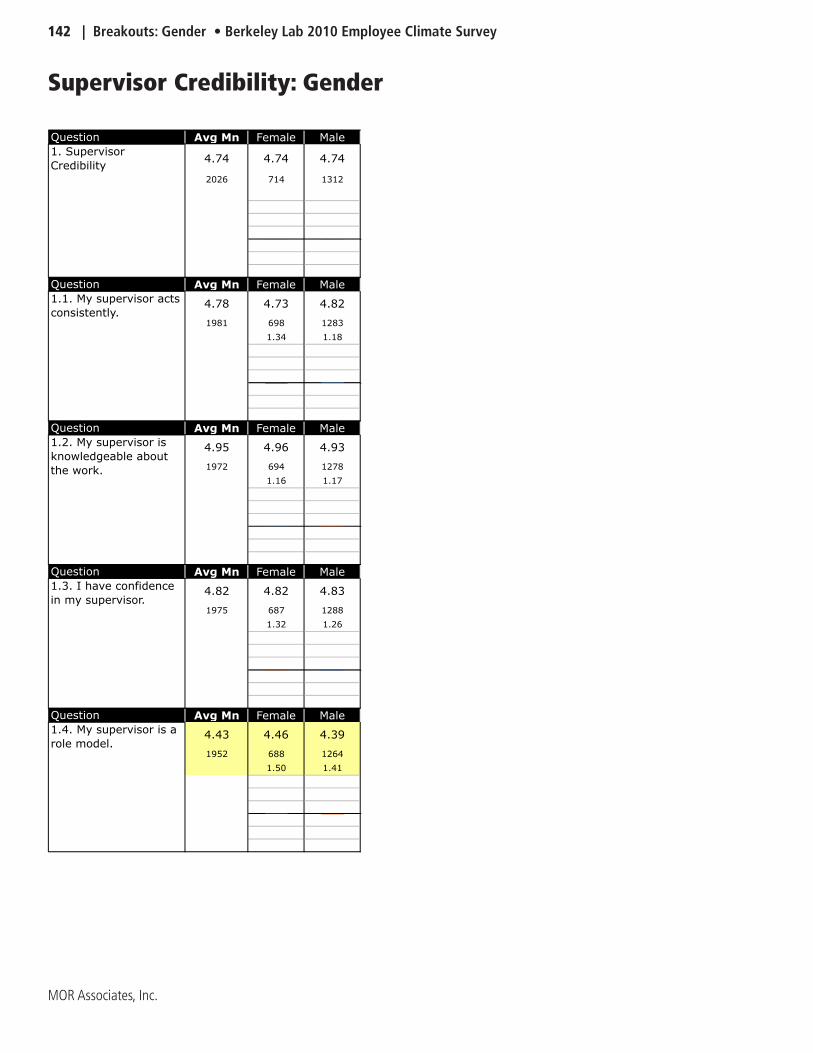
142 | Breakouts: Gender • Berkeley Lab 2010 Employee Climate Survey
MOR Associates, Inc.
Supervisor Credibility: Gender
Question Avg Mn Female Male
4.74 4.74 4.74
2026 714 1312
Question Avg Mn Female Male
4.78 4.73 4.82
1981 698 1283
1.34 1.18
Question Avg Mn Female Male
4.95 4.96 4.93
1972 694 1278
1.16 1.17
Question Avg Mn Female Male
4.82 4.82 4.83
1975 687 1288
1.32 1.26
Question Avg Mn Female Male
4.43 4.46 4.39
1952 688 1264
1.50 1.41
1. Supervisor
Credibility
1.1. My supervisor acts
consistently.
1.2. My supervisor is
knowledgeable about
the work.
1.3. I have confidence
in my supervisor.
1.4. My supervisor is a
role model.
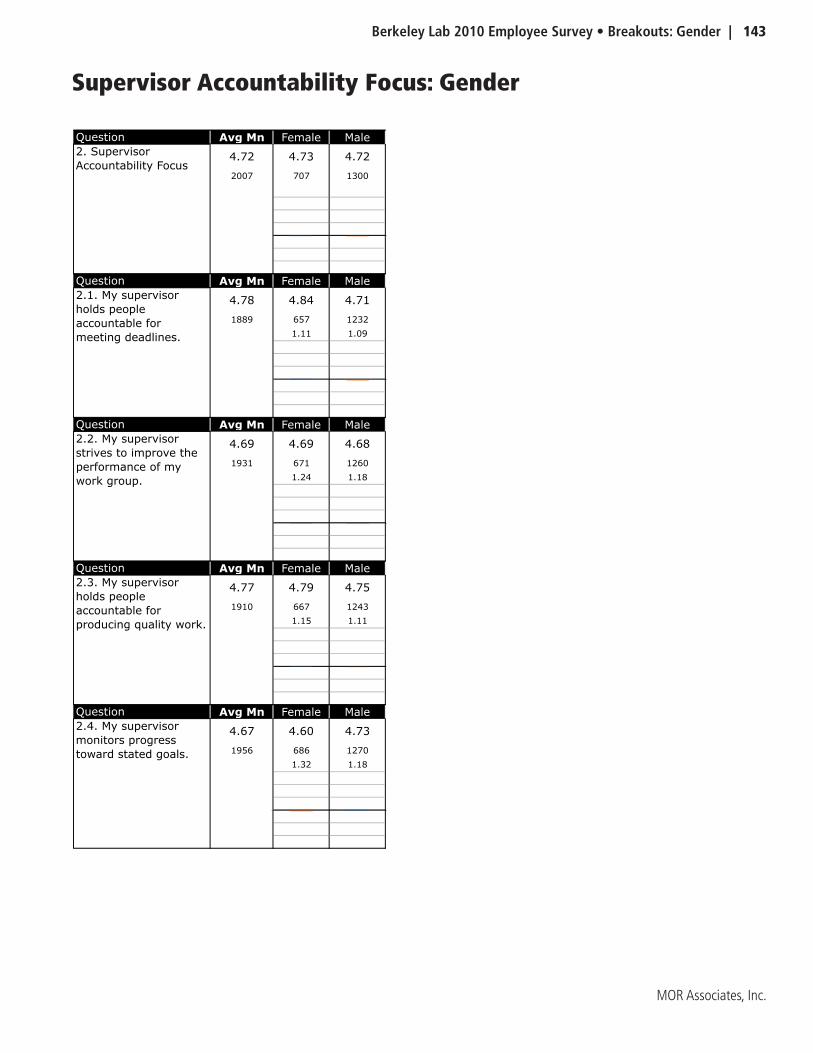
Berkeley Lab 2010 Employee Survey • Breakouts: Gender | 143
MOR Associates, Inc.
Supervisor Accountability Focus: Gender
Question Avg Mn Female Male
4.72 4.73 4.72
2007 707 1300
Question Avg Mn Female Male
4.78 4.84 4.71
1889 657 1232
1.11 1.09
Question Avg Mn Female Male
4.69 4.69 4.68
1931 671 1260
1.24 1.18
Question Avg Mn Female Male
4.77 4.79 4.75
1910 667 1243
1.15 1.11
Question Avg Mn Female Male
4.67 4.60 4.73
1956 686 1270
1.32 1.18
2. Supervisor
Accountability Focus
2.1. My supervisor
holds people
accountable for
meeting deadlines.
2.2. My supervisor
strives to improve the
performance of my
work group.
2.3. My supervisor
holds people
accountable for
producing quality work.
2.4. My supervisor
monitors progress
toward stated goals.
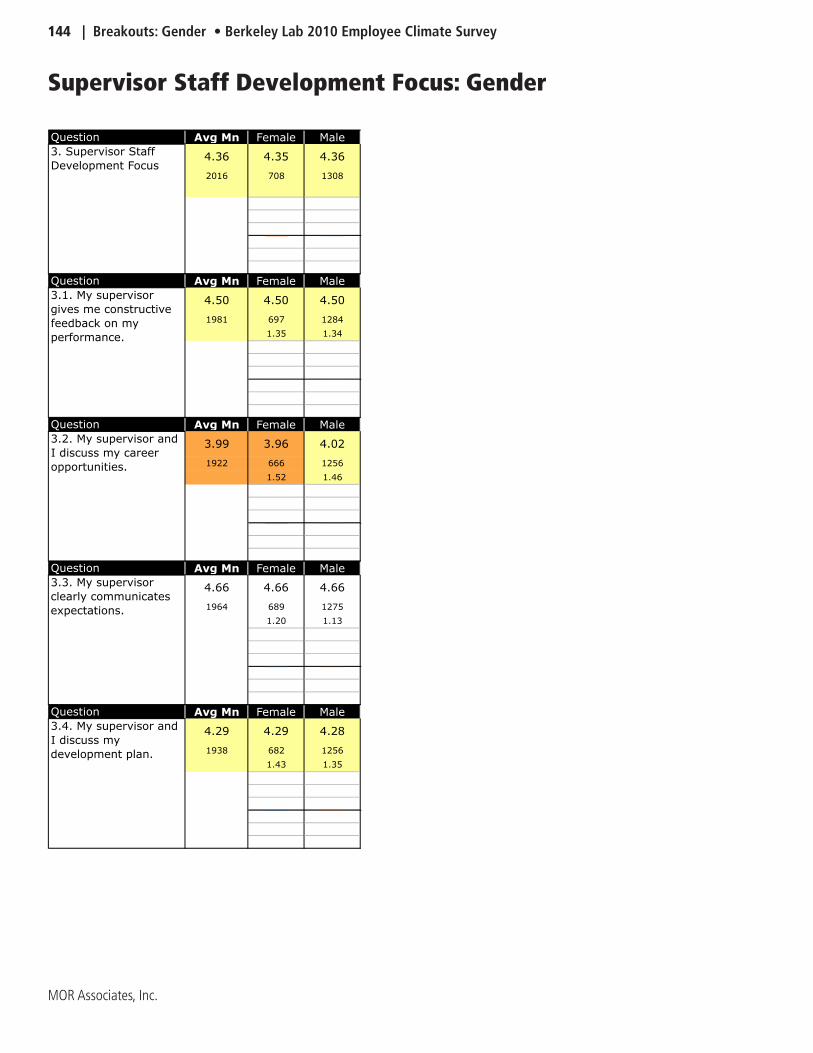
144 | Breakouts: Gender • Berkeley Lab 2010 Employee Climate Survey
MOR Associates, Inc.
Supervisor Staff Development Focus: Gender
Question Avg Mn Female Male
4.36 4.35 4.36
2016 708 1308
Question Avg Mn Female Male
4.50 4.50 4.50
1981 697 1284
1.35 1.34
Question Avg Mn Female Male
3.99 3.96 4.02
1922 666 1256
1.52 1.46
Question Avg Mn Female Male
4.66 4.66 4.66
1964 689 1275
1.20 1.13
Question Avg Mn Female Male
4.29 4.29 4.28
1938 682 1256
1.43 1.35
3. Supervisor Staff
Development Focus
3.1. My supervisor
gives me constructive
feedback on my
performance.
3.2. My supervisor and
I discuss my career
opportunities.
3.3. My supervisor
clearly communicates
expectations.
3.4. My supervisor and
I discuss my
development plan.
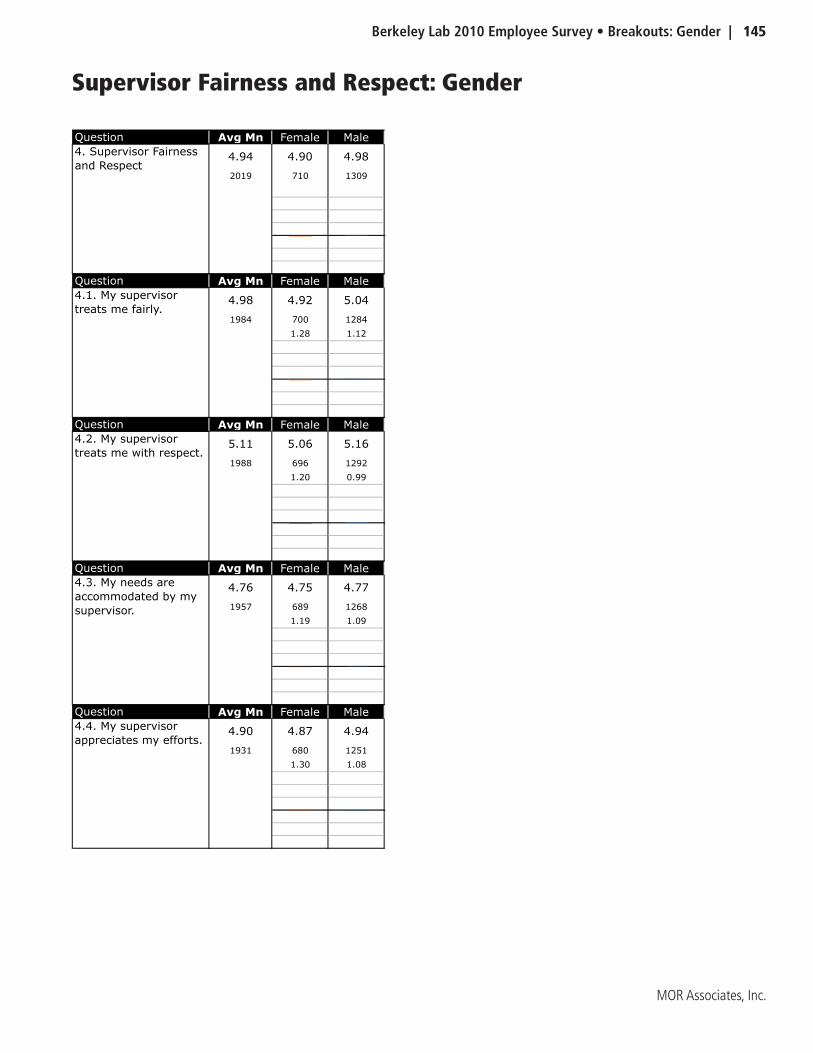
Berkeley Lab 2010 Employee Survey • Breakouts: Gender | 145
MOR Associates, Inc.
Supervisor Fairness and Respect: Gender
Question Avg Mn Female Male
4.94 4.90 4.98
2019 710 1309
Question Avg Mn Female Male
4.98 4.92 5.04
1984 700 1284
1.28 1.12
Question Avg Mn Female Male
5.11 5.06 5.16
1988 696 1292
1.20 0.99
Question Avg Mn Female Male
4.76 4.75 4.77
1957 689 1268
1.19 1.09
Question Avg Mn Female Male
4.90 4.87 4.94
1931 680 1251
1.30 1.08
4. Supervisor Fairness
and Respect
4.1. My supervisor
treats me fairly.
4.2. My supervisor
treats me with respect.
4.3. My needs are
accommodated by my
supervisor.
4.4. My supervisor
appreciates my efforts.
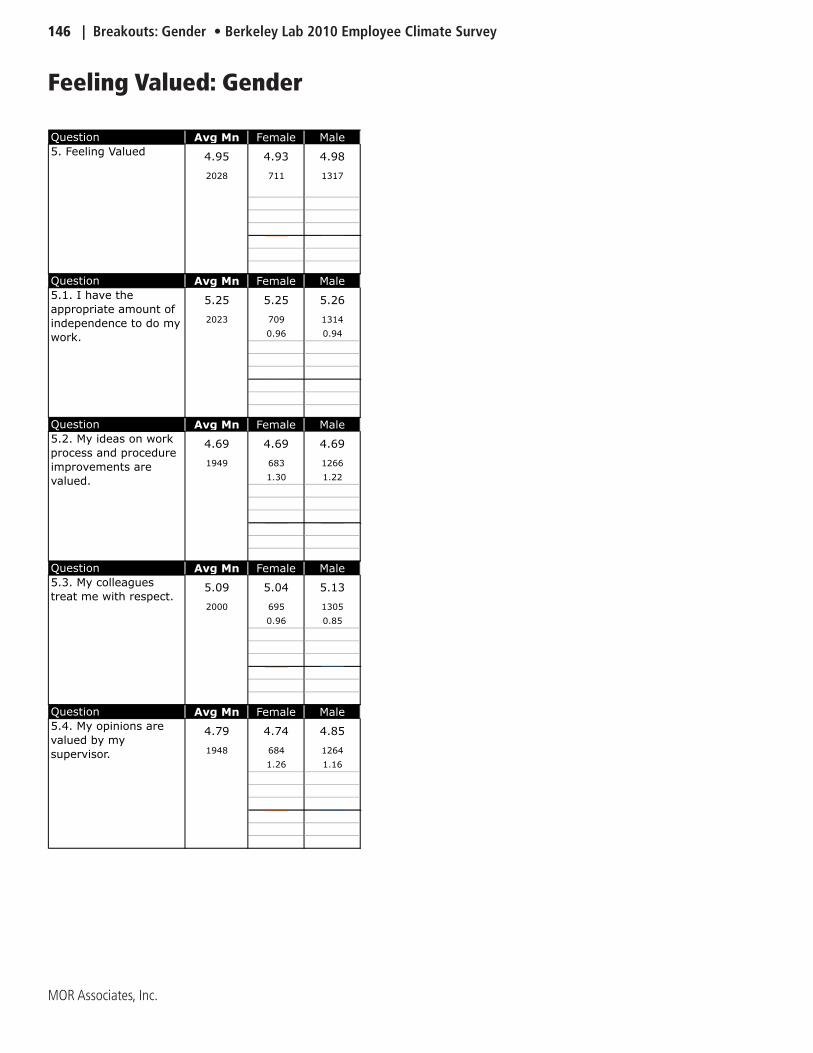
146 | Breakouts: Gender • Berkeley Lab 2010 Employee Climate Survey
MOR Associates, Inc.
Feeling Valued: Gender
Question Avg Mn Female Male
4.95 4.93 4.98
2028 711 1317
Question Avg Mn Female Male
5.25 5.25 5.26
2023 709 1314
0.96 0.94
Question Avg Mn Female Male
4.69 4.69 4.69
1949 683 1266
1.30 1.22
Question Avg Mn Female Male
5.09 5.04 5.13
2000 695 1305
0.96 0.85
Question Avg Mn Female Male
4.79 4.74 4.85
1948 684 1264
1.26 1.16
5. Feeling Valued
5.1. I have the
appropriate amount of
independence to do my
work.
5.2. My ideas on work
process and procedure
improvements are
valued.
5.3. My colleagues
treat me with respect.
5.4. My opinions are
valued by my
supervisor.
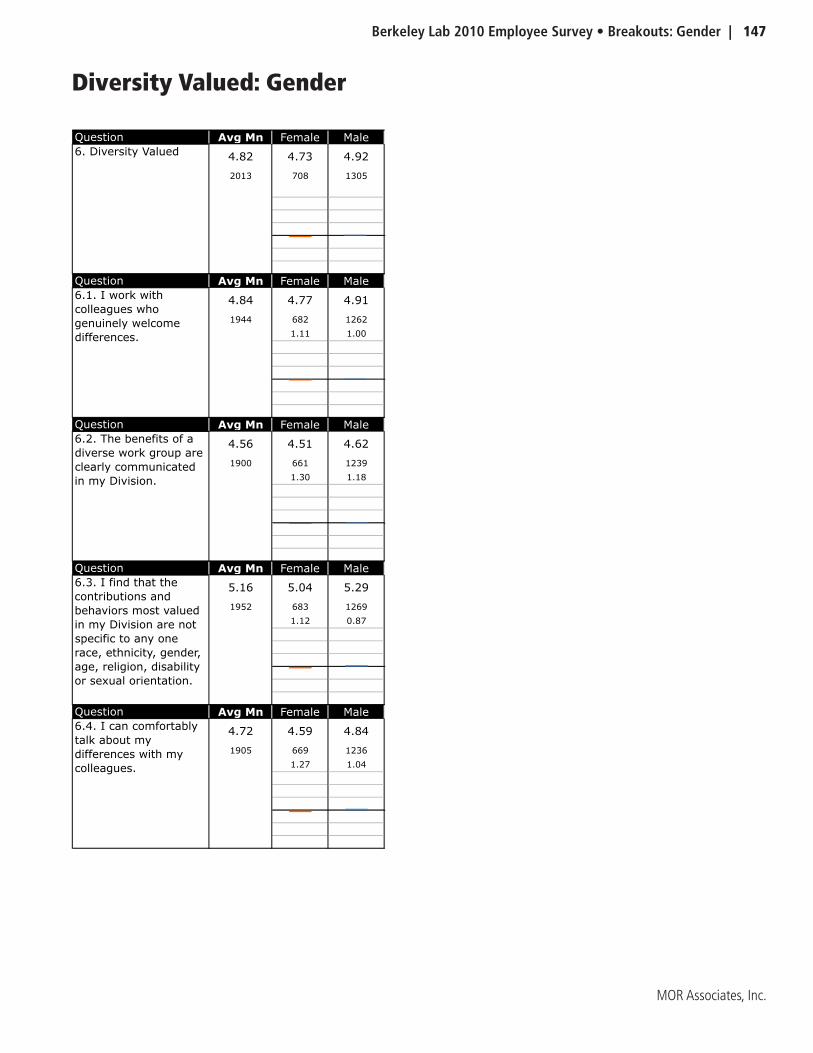
Berkeley Lab 2010 Employee Survey • Breakouts: Gender | 147
MOR Associates, Inc.
Diversity Valued: Gender
Question Avg Mn Female Male
4.82 4.73 4.92
2013 708 1305
Question Avg Mn Female Male
4.84 4.77 4.91
1944 682 1262
1.11 1.00
Question Avg Mn Female Male
4.56 4.51 4.62
1900 661 1239
1.30 1.18
Question Avg Mn Female Male
5.16 5.04 5.29
1952 683 1269
1.12 0.87
Question Avg Mn Female Male
4.72 4.59 4.84
1905 669 1236
1.27 1.04
6. Diversity Valued
6.1. I work with
colleagues who
genuinely welcome
differences.
6.2. The benefits of a
diverse work group are
clearly communicated
in my Division.
6.3. I find that the
contributions and
behaviors most valued
in my Division are not
specific to any one
race, ethnicity, gender,
age, religion, disability
or sexual orientation.
6.4. I can comfortably
talk about my
differences with my
colleagues.
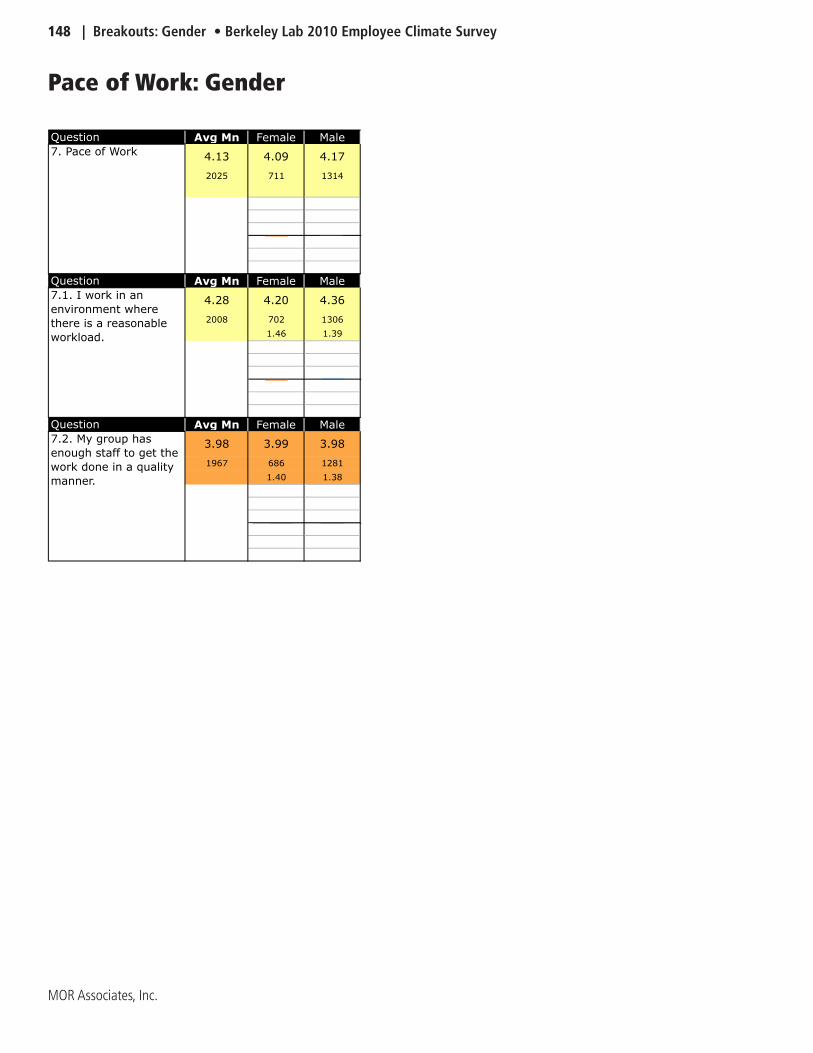
148 | Breakouts: Gender • Berkeley Lab 2010 Employee Climate Survey
MOR Associates, Inc.
Pace of Work: Gender
Question Avg Mn Female Male
4.13 4.09 4.17
2025 711 1314
Question Avg Mn Female Male
4.28 4.20 4.36
2008 702 1306
1.46 1.39
Question Avg Mn Female Male
3.98 3.99 3.98
1967 686 1281
1.40 1.38
7. Pace of Work
7.1. I work in an
environment where
there is a reasonable
workload.
7.2. My group has
enough staff to get the
work done in a quality
manner.
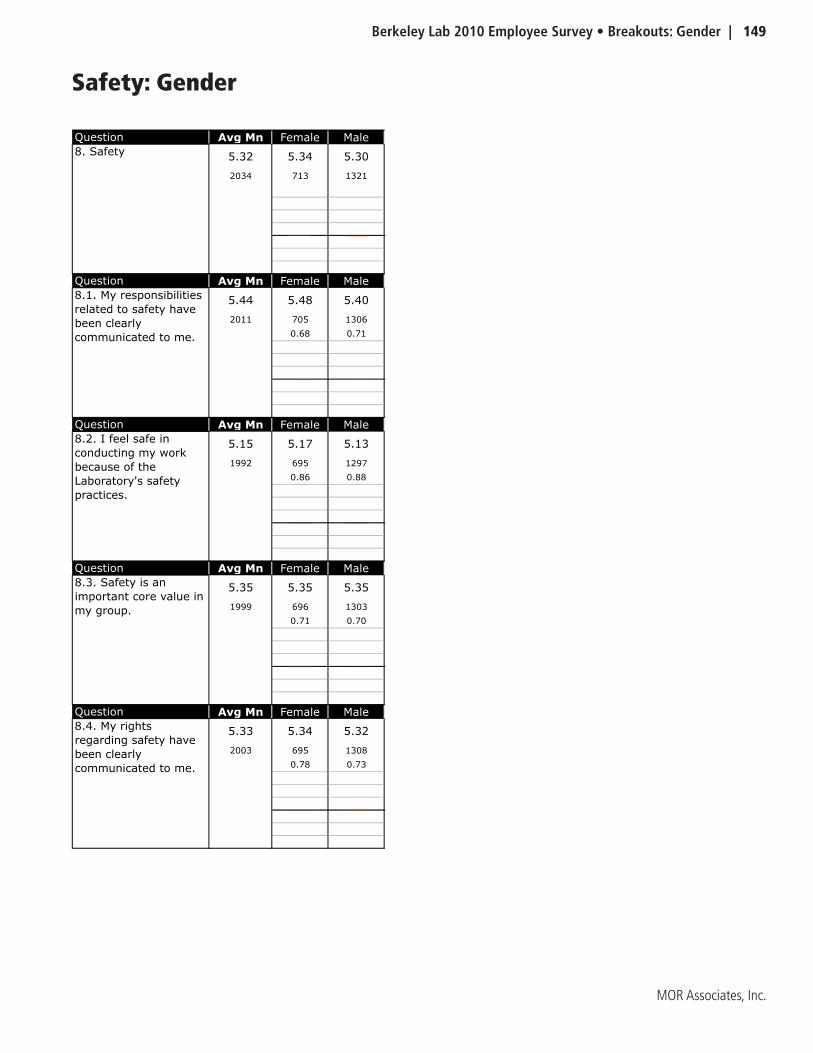
Berkeley Lab 2010 Employee Survey • Breakouts: Gender | 149
MOR Associates, Inc.
Safety: Gender
Question Avg Mn Female Male
5.32 5.34 5.30
2034 713 1321
Question Avg Mn Female Male
5.44 5.48 5.40
2011 705 1306
0.68 0.71
Question Avg Mn Female Male
5.15 5.17 5.13
1992 695 1297
0.86 0.88
Question Avg Mn Female Male
5.35 5.35 5.35
1999 696 1303
0.71 0.70
Question Avg Mn Female Male
5.33 5.34 5.32
2003 695 1308
0.78 0.73
8. Safety
8.1. My responsibilities
related to safety have
been clearly
communicated to me.
8.2. I feel safe in
conducting my work
because of the
Laboratory's safety
practices.
8.3. Safety is an
important core value in
my group.
8.4. My rights
regarding safety have
been clearly
communicated to me.
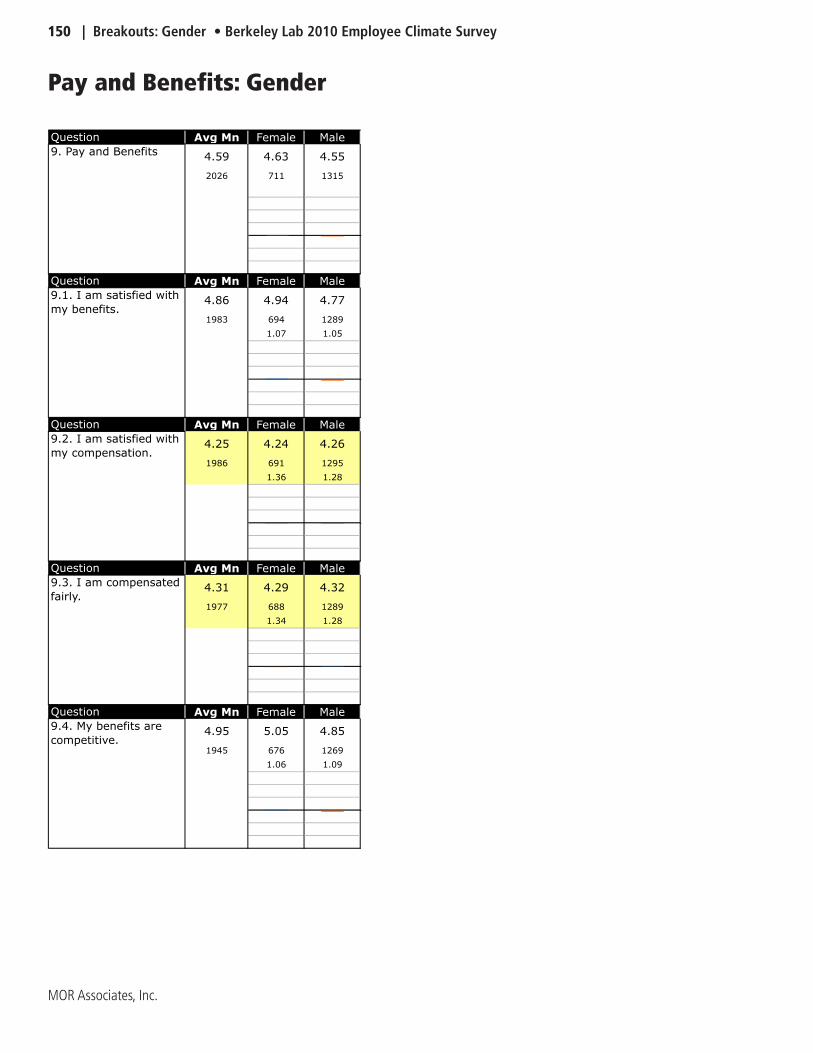
150 | Breakouts: Gender • Berkeley Lab 2010 Employee Climate Survey
MOR Associates, Inc.
Pay and Benefits: Gender
Question Avg Mn Female Male
4.59 4.63 4.55
2026 711 1315
Question Avg Mn Female Male
4.86 4.94 4.77
1983 694 1289
1.07 1.05
Question Avg Mn Female Male
4.25 4.24 4.26
1986 691 1295
1.36 1.28
Question Avg Mn Female Male
4.31 4.29 4.32
1977 688 1289
1.34 1.28
Question Avg Mn Female Male
4.95 5.05 4.85
1945 676 1269
1.06 1.09
9.4. My benefits are
competitive.
9. Pay and Benefits
9.1. I am satisfied with
my benefits.
9.2. I am satisfied with
my compensation.
9.3. I am compensated
fairly.
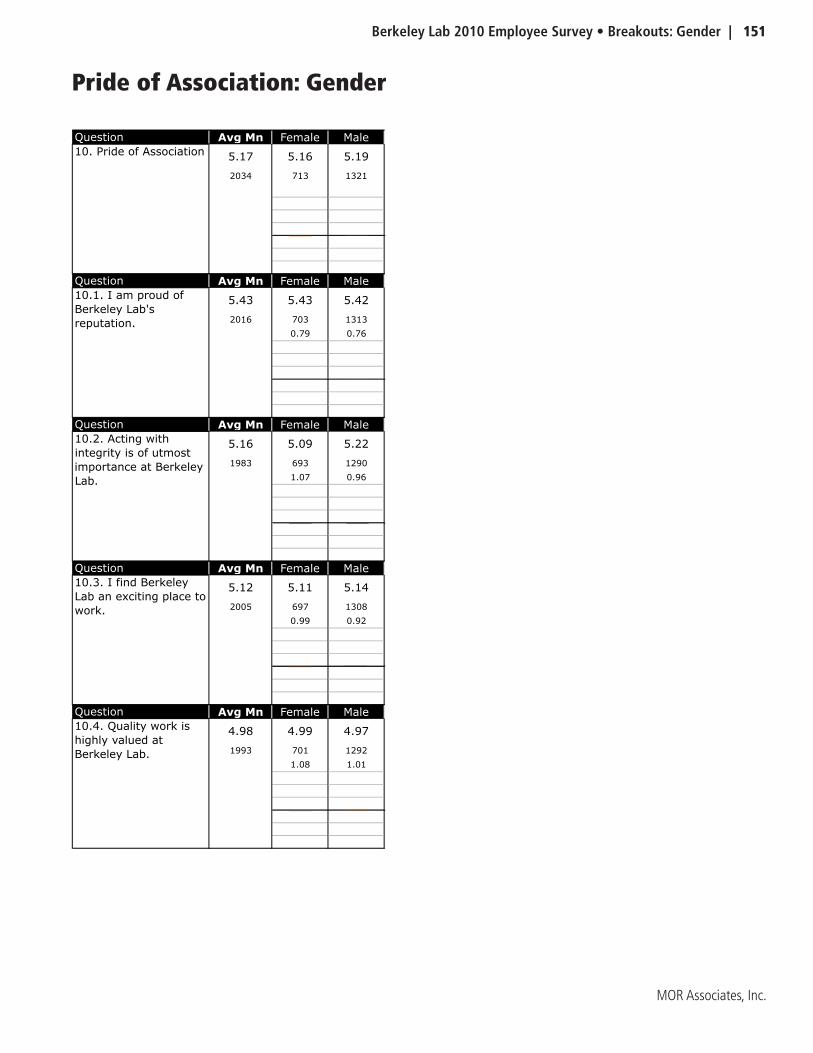
Berkeley Lab 2010 Employee Survey • Breakouts: Gender | 151
MOR Associates, Inc.
Pride of Association: Gender
Question Avg Mn Female Male
5.17 5.16 5.19
2034 713 1321
Question Avg Mn Female Male
5.43 5.43 5.42
2016 703 1313
0.79 0.76
Question Avg Mn Female Male
5.16 5.09 5.22
1983 693 1290
1.07 0.96
Question Avg Mn Female Male
5.12 5.11 5.14
2005 697 1308
0.99 0.92
Question Avg Mn Female Male
4.98 4.99 4.97
1993 701 1292
1.08 1.01
10. Pride of Association
10.1. I am proud of
Berkeley Lab's
reputation.
10.2. Acting with
integrity is of utmost
importance at Berkeley
Lab.
10.3. I find Berkeley
Lab an exciting place to
work.
10.4. Quality work is
highly valued at
Berkeley Lab.
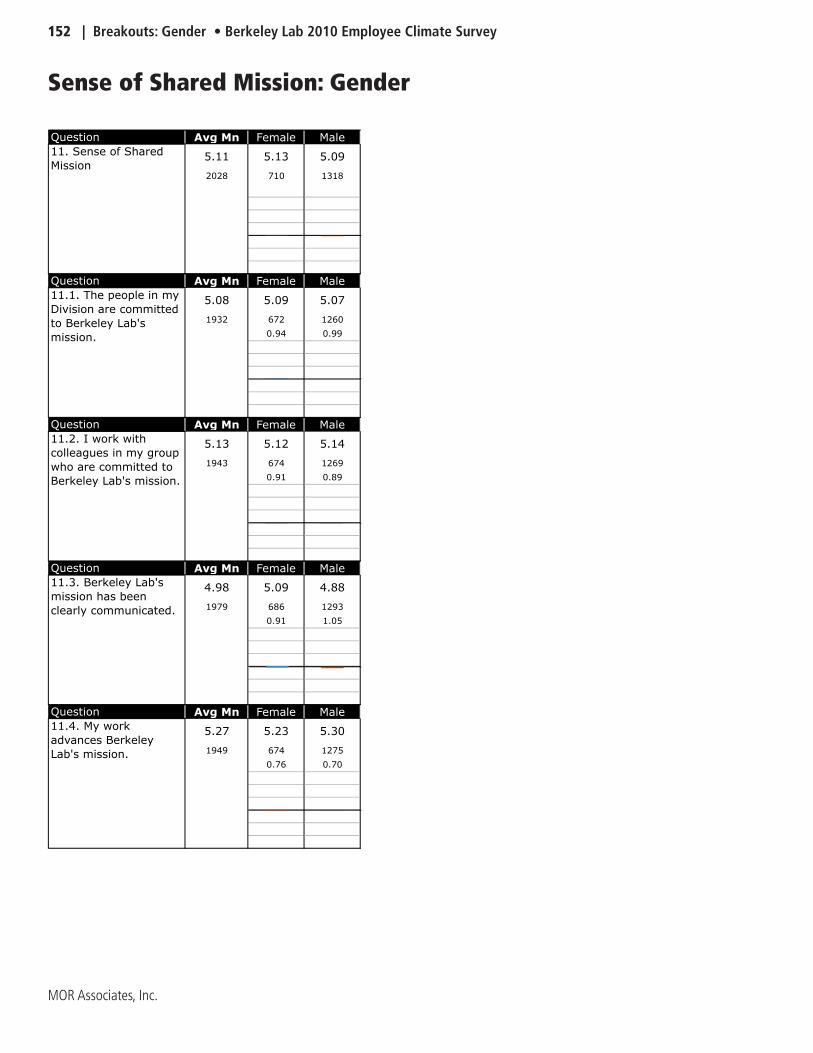
152 | Breakouts: Gender • Berkeley Lab 2010 Employee Climate Survey
MOR Associates, Inc.
Sense of Shared Mission: Gender
Question Avg Mn Female Male
5.11 5.13 5.09
2028 710 1318
Question Avg Mn Female Male
5.08 5.09 5.07
1932 672 1260
0.94 0.99
Question Avg Mn Female Male
5.13 5.12 5.14
1943 674 1269
0.91 0.89
Question Avg Mn Female Male
4.98 5.09 4.88
1979 686 1293
0.91 1.05
Question Avg Mn Female Male
5.27 5.23 5.30
1949 674 1275
0.76 0.70
11. Sense of Shared
Mission
11.1. The people in my
Division are committed
to Berkeley Lab's
mission.
11.2. I work with
colleagues in my group
who are committed to
Berkeley Lab's mission.
11.3. Berkeley Lab's
mission has been
clearly communicated.
11.4. My work
advances Berkeley
Lab's mission.
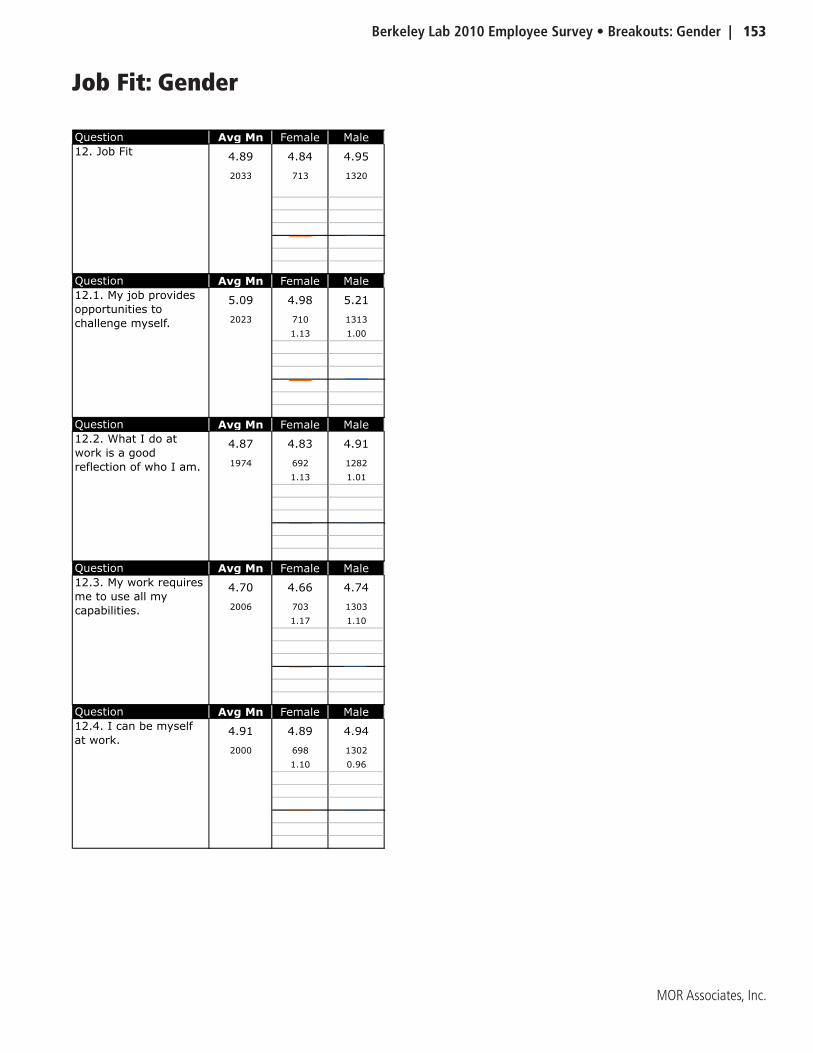
Berkeley Lab 2010 Employee Survey • Breakouts: Gender | 153
MOR Associates, Inc.
Job Fit: Gender
Question Avg Mn Female Male
4.89 4.84 4.95
2033 713 1320
Question Avg Mn Female Male
5.09 4.98 5.21
2023 710 1313
1.13 1.00
Question Avg Mn Female Male
4.87 4.83 4.91
1974 692 1282
1.13 1.01
Question Avg Mn Female Male
4.70 4.66 4.74
2006 703 1303
1.17 1.10
Question Avg Mn Female Male
4.91 4.89 4.94
2000 698 1302
1.10 0.96
12. Job Fit
12.1. My job provides
opportunities to
challenge myself.
12.2. What I do at
work is a good
reflection of who I am.
12.3. My work requires
me to use all my
capabilities.
12.4. I can be myself
at work.
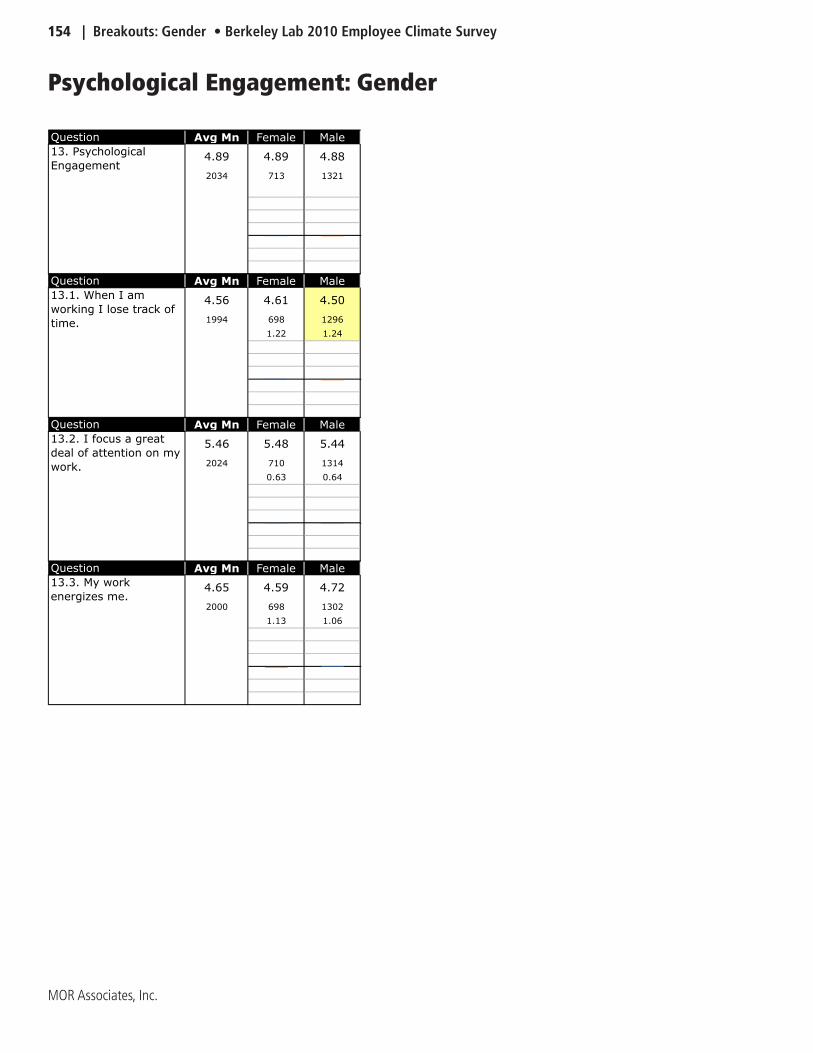
154 | Breakouts: Gender • Berkeley Lab 2010 Employee Climate Survey
MOR Associates, Inc.
Psychological Engagement: Gender
Question Avg Mn Female Male
4.89 4.89 4.88
2034 713 1321
Question Avg Mn Female Male
4.56 4.61 4.50
1994 698 1296
1.22 1.24
Question Avg Mn Female Male
5.46 5.48 5.44
2024 710 1314
0.63 0.64
Question Avg Mn Female Male
4.65 4.59 4.72
2000 698 1302
1.13 1.06
13.2. I focus a great
deal of attention on my
work.
13.3. My work
energizes me.
13. Psychological
Engagement
13.1. When I am
working I lose track of
time.
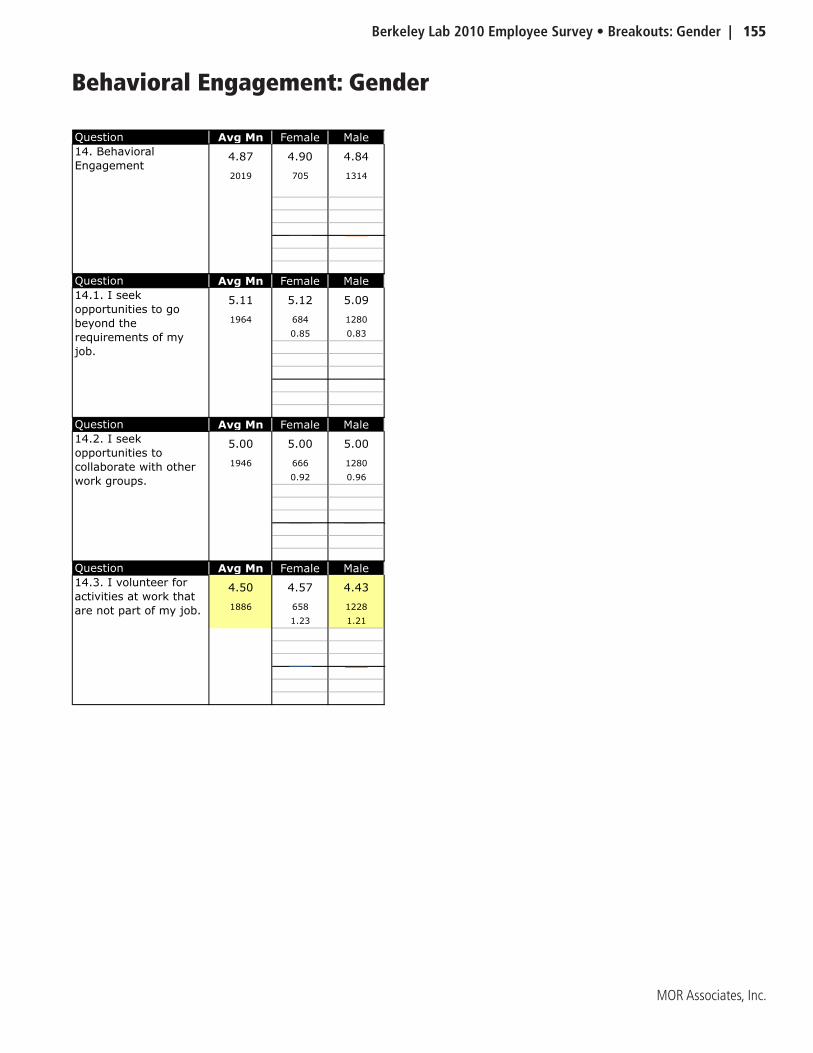
Berkeley Lab 2010 Employee Survey • Breakouts: Gender | 155
MOR Associates, Inc.
Behavioral Engagement: Gender
Question Avg Mn Female Male
4.87 4.90 4.84
2019 705 1314
Question Avg Mn Female Male
5.11 5.12 5.09
1964 684 1280
0.85 0.83
Question Avg Mn Female Male
5.00 5.00 5.00
1946 666 1280
0.92 0.96
Question Avg Mn Female Male
4.50 4.57 4.43
1886 658 1228
1.23 1.21
14. Behavioral
Engagement
14.1. I seek
opportunities to go
beyond the
requirements of my
job.
14.2. I seek
opportunities to
collaborate with other
work groups.
14.3. I volunteer for
activities at work that
are not part of my job.
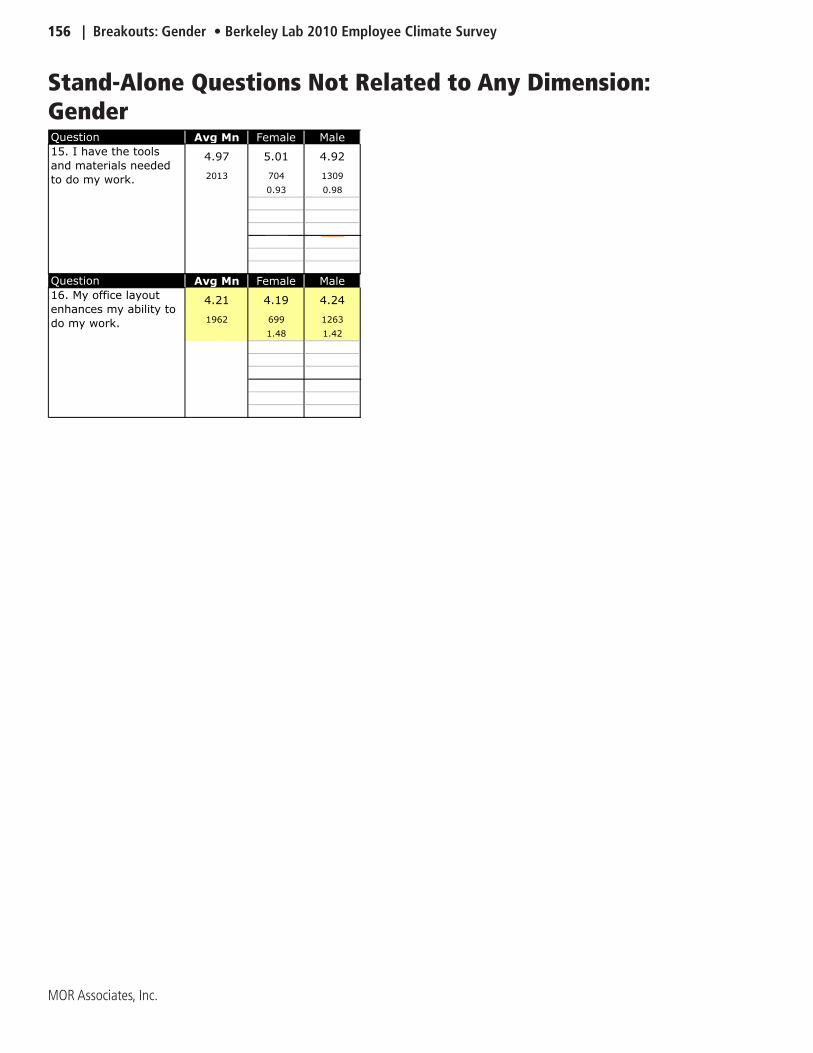
156 | Breakouts: Gender • Berkeley Lab 2010 Employee Climate Survey
MOR Associates, Inc.
Stand-Alone Questions Not Related to Any Dimension: GenderQuestion Avg Mn Female Male
4.97 5.01 4.92
2013 704 1309
0.93 0.98
Question Avg Mn Female Male
4.21 4.19 4.24
1962 699 1263
1.48 1.42
15. I have the tools
and materials needed
to do my work.
16. My office layout
enhances my ability to
do my work.
Berkeley Lab 2010 Employee Survey • Breakouts: Race | 157
MOR Associates, Inc.
Breakout Charts and Tables:
by Race
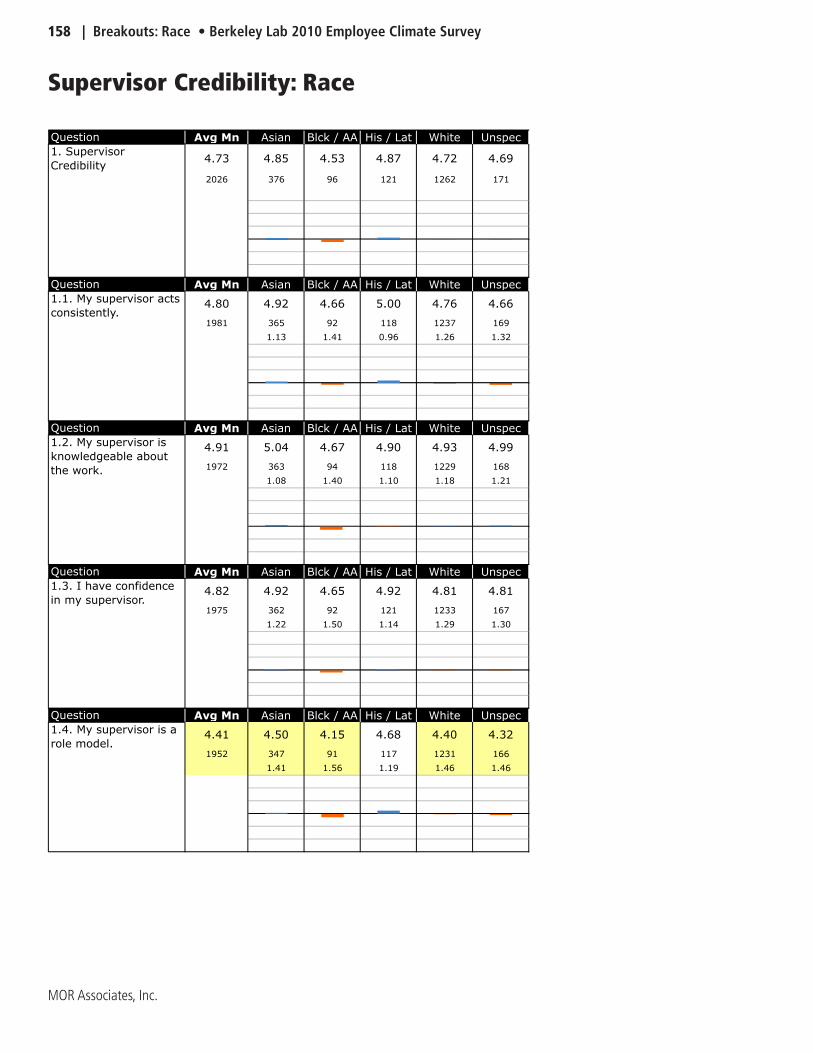
158 | Breakouts: Race • Berkeley Lab 2010 Employee Climate Survey
MOR Associates, Inc.
Supervisor Credibility: Race
Question Avg Mn Asian Blck / AA His / Lat White Unspec
4.73 4.85 4.53 4.87 4.72 4.69
2026 376 96 121 1262 171
Question Avg Mn Asian Blck / AA His / Lat White Unspec
4.80 4.92 4.66 5.00 4.76 4.66
1981 365 92 118 1237 169
1.13 1.41 0.96 1.26 1.32
Question Avg Mn Asian Blck / AA His / Lat White Unspec
4.91 5.04 4.67 4.90 4.93 4.99
1972 363 94 118 1229 168
1.08 1.40 1.10 1.18 1.21
Question Avg Mn Asian Blck / AA His / Lat White Unspec
4.82 4.92 4.65 4.92 4.81 4.81
1975 362 92 121 1233 167
1.22 1.50 1.14 1.29 1.30
Question Avg Mn Asian Blck / AA His / Lat White Unspec
4.41 4.50 4.15 4.68 4.40 4.32
1952 347 91 117 1231 166
1.41 1.56 1.19 1.46 1.46
1. Supervisor
Credibility
1.1. My supervisor acts
consistently.
1.2. My supervisor is
knowledgeable about
the work.
1.3. I have confidence
in my supervisor.
1.4. My supervisor is a
role model.
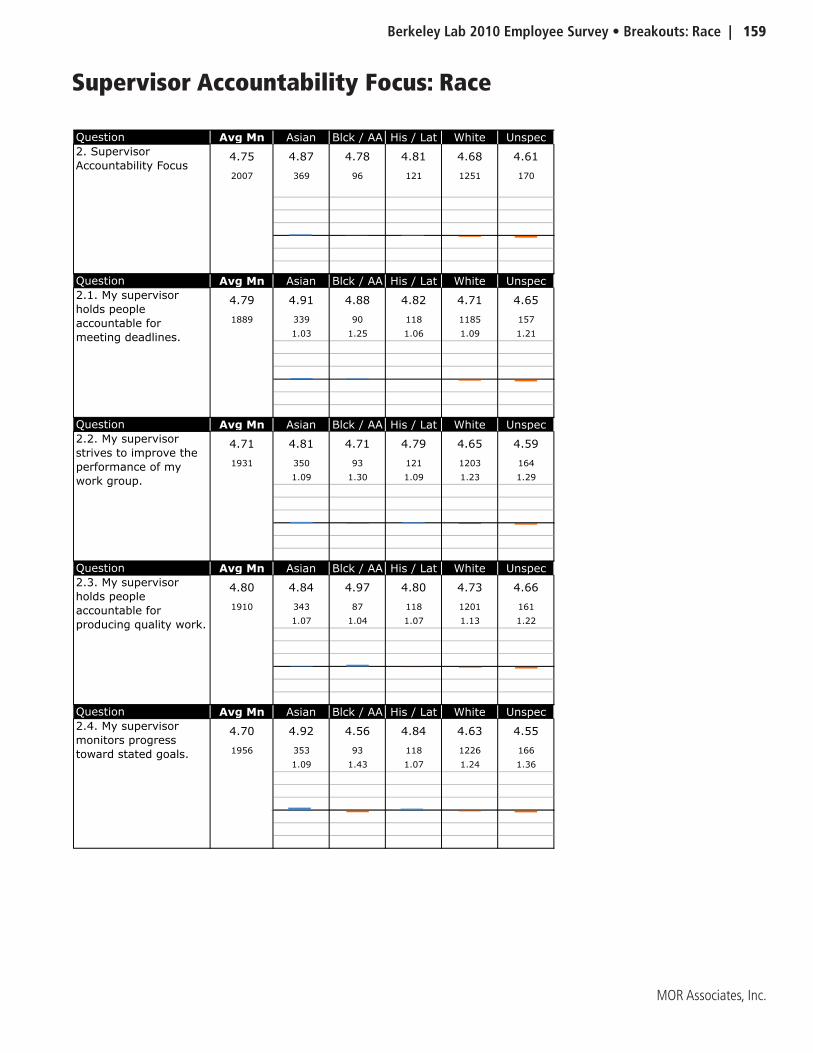
Berkeley Lab 2010 Employee Survey • Breakouts: Race | 159
MOR Associates, Inc.
Supervisor Accountability Focus: Race
Question Avg Mn Asian Blck / AA His / Lat White Unspec
4.75 4.87 4.78 4.81 4.68 4.61
2007 369 96 121 1251 170
Question Avg Mn Asian Blck / AA His / Lat White Unspec
4.79 4.91 4.88 4.82 4.71 4.65
1889 339 90 118 1185 157
1.03 1.25 1.06 1.09 1.21
Question Avg Mn Asian Blck / AA His / Lat White Unspec
4.71 4.81 4.71 4.79 4.65 4.59
1931 350 93 121 1203 164
1.09 1.30 1.09 1.23 1.29
Question Avg Mn Asian Blck / AA His / Lat White Unspec
4.80 4.84 4.97 4.80 4.73 4.66
1910 343 87 118 1201 161
1.07 1.04 1.07 1.13 1.22
Question Avg Mn Asian Blck / AA His / Lat White Unspec
4.70 4.92 4.56 4.84 4.63 4.55
1956 353 93 118 1226 166
1.09 1.43 1.07 1.24 1.36
2. Supervisor
Accountability Focus
2.1. My supervisor
holds people
accountable for
meeting deadlines.
2.2. My supervisor
strives to improve the
performance of my
work group.
2.3. My supervisor
holds people
accountable for
producing quality work.
2.4. My supervisor
monitors progress
toward stated goals.

160 | Breakouts: Race • Berkeley Lab 2010 Employee Climate Survey
MOR Associates, Inc.
Supervisor Staff Development Focus: Race
Question Avg Mn Asian Blck / AA His / Lat White Unspec
4.37 4.54 4.30 4.43 4.32 4.25
2016 374 96 122 1253 171
Question Avg Mn Asian Blck / AA His / Lat White Unspec
4.52 4.71 4.46 4.62 4.45 4.35
1981 364 94 119 1236 168
1.19 1.41 1.24 1.37 1.43
Question Avg Mn Asian Blck / AA His / Lat White Unspec
3.95 4.18 3.82 3.90 3.99 3.87
1922 349 90 117 1205 161
1.41 1.51 1.33 1.49 1.60
Question Avg Mn Asian Blck / AA His / Lat White Unspec
4.69 4.79 4.71 4.79 4.62 4.55
1964 357 91 121 1232 163
1.08 1.19 1.01 1.18 1.21
Question Avg Mn Asian Blck / AA His / Lat White Unspec
4.32 4.47 4.22 4.40 4.23 4.25
1938 353 94 119 1212 160
1.31 1.40 1.15 1.40 1.42
3. Supervisor Staff
Development Focus
3.1. My supervisor
gives me constructive
feedback on my
performance.
3.2. My supervisor and
I discuss my career
opportunities.
3.3. My supervisor
clearly communicates
expectations.
3.4. My supervisor and
I discuss my
development plan.
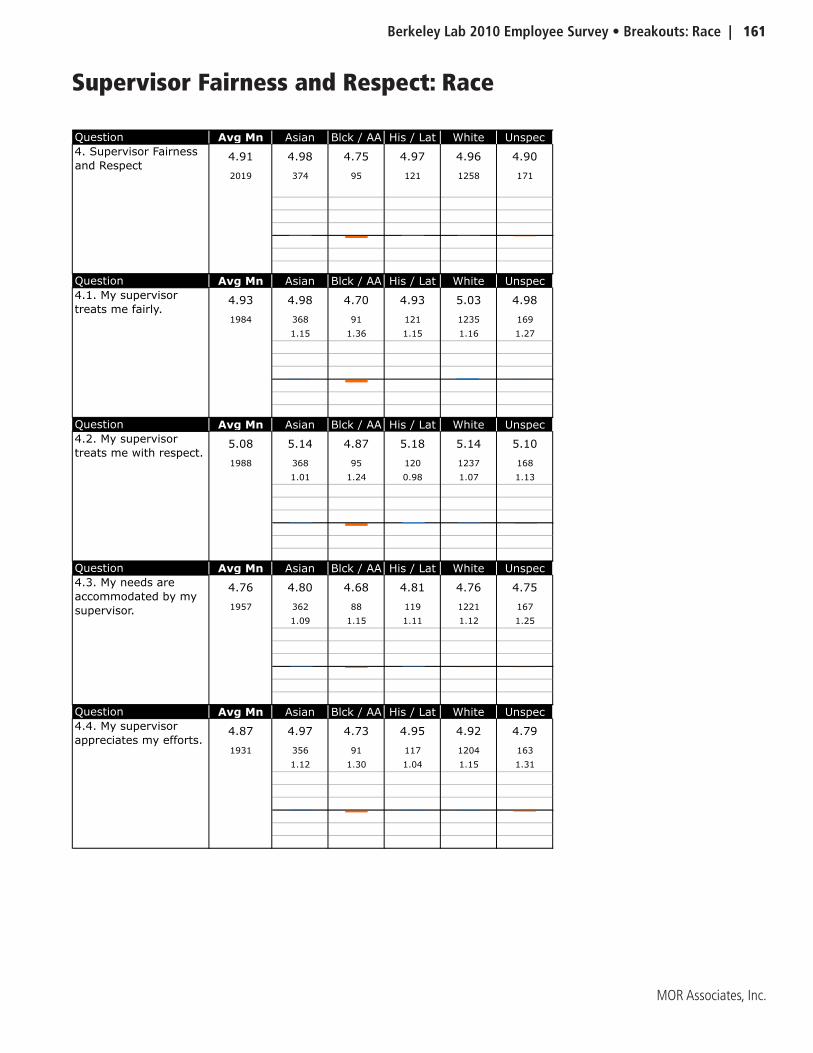
Berkeley Lab 2010 Employee Survey • Breakouts: Race | 161
MOR Associates, Inc.
Supervisor Fairness and Respect: Race
Question Avg Mn Asian Blck / AA His / Lat White Unspec
4.91 4.98 4.75 4.97 4.96 4.90
2019 374 95 121 1258 171
Question Avg Mn Asian Blck / AA His / Lat White Unspec
4.93 4.98 4.70 4.93 5.03 4.98
1984 368 91 121 1235 169
1.15 1.36 1.15 1.16 1.27
Question Avg Mn Asian Blck / AA His / Lat White Unspec
5.08 5.14 4.87 5.18 5.14 5.10
1988 368 95 120 1237 168
1.01 1.24 0.98 1.07 1.13
Question Avg Mn Asian Blck / AA His / Lat White Unspec
4.76 4.80 4.68 4.81 4.76 4.75
1957 362 88 119 1221 167
1.09 1.15 1.11 1.12 1.25
Question Avg Mn Asian Blck / AA His / Lat White Unspec
4.87 4.97 4.73 4.95 4.92 4.79
1931 356 91 117 1204 163
1.12 1.30 1.04 1.15 1.31
4. Supervisor Fairness
and Respect
4.1. My supervisor
treats me fairly.
4.2. My supervisor
treats me with respect.
4.3. My needs are
accommodated by my
supervisor.
4.4. My supervisor
appreciates my efforts.
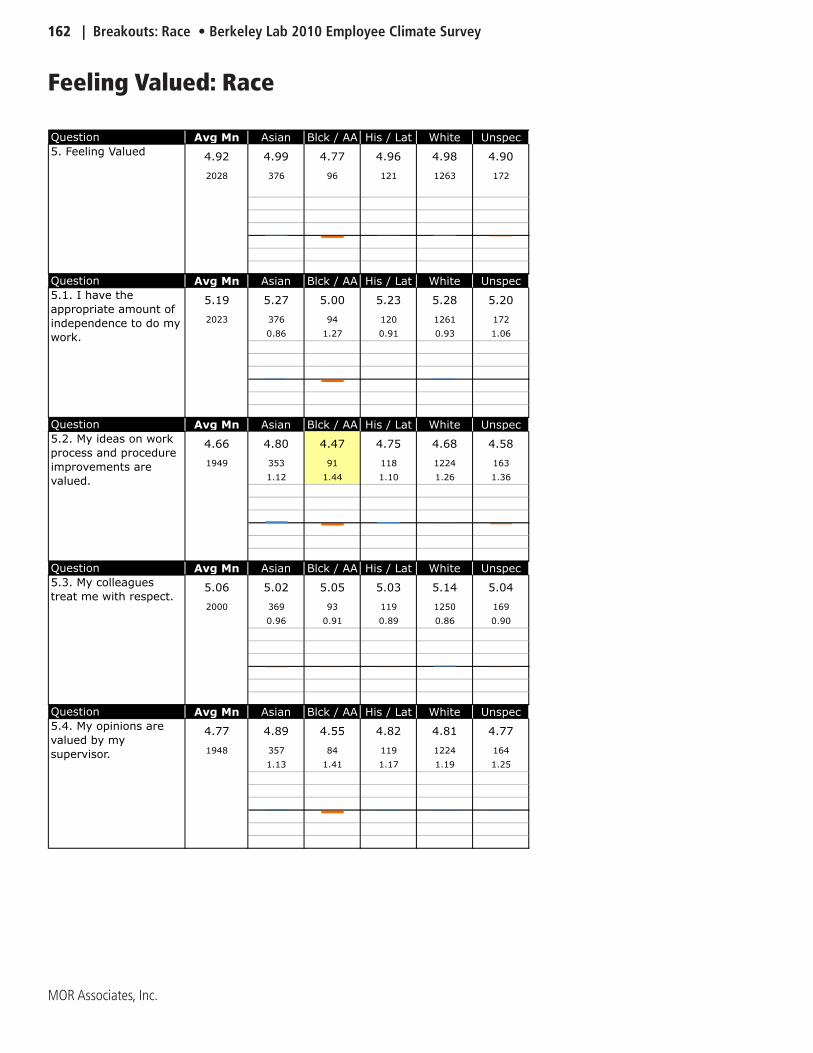
162 | Breakouts: Race • Berkeley Lab 2010 Employee Climate Survey
MOR Associates, Inc.
Feeling Valued: Race
Question Avg Mn Asian Blck / AA His / Lat White Unspec
4.92 4.99 4.77 4.96 4.98 4.90
2028 376 96 121 1263 172
Question Avg Mn Asian Blck / AA His / Lat White Unspec
5.19 5.27 5.00 5.23 5.28 5.20
2023 376 94 120 1261 172
0.86 1.27 0.91 0.93 1.06
Question Avg Mn Asian Blck / AA His / Lat White Unspec
4.66 4.80 4.47 4.75 4.68 4.58
1949 353 91 118 1224 163
1.12 1.44 1.10 1.26 1.36
Question Avg Mn Asian Blck / AA His / Lat White Unspec
5.06 5.02 5.05 5.03 5.14 5.04
2000 369 93 119 1250 169
0.96 0.91 0.89 0.86 0.90
Question Avg Mn Asian Blck / AA His / Lat White Unspec
4.77 4.89 4.55 4.82 4.81 4.77
1948 357 84 119 1224 164
1.13 1.41 1.17 1.19 1.25
5. Feeling Valued
5.1. I have the
appropriate amount of
independence to do my
work.
5.2. My ideas on work
process and procedure
improvements are
valued.
5.3. My colleagues
treat me with respect.
5.4. My opinions are
valued by my
supervisor.
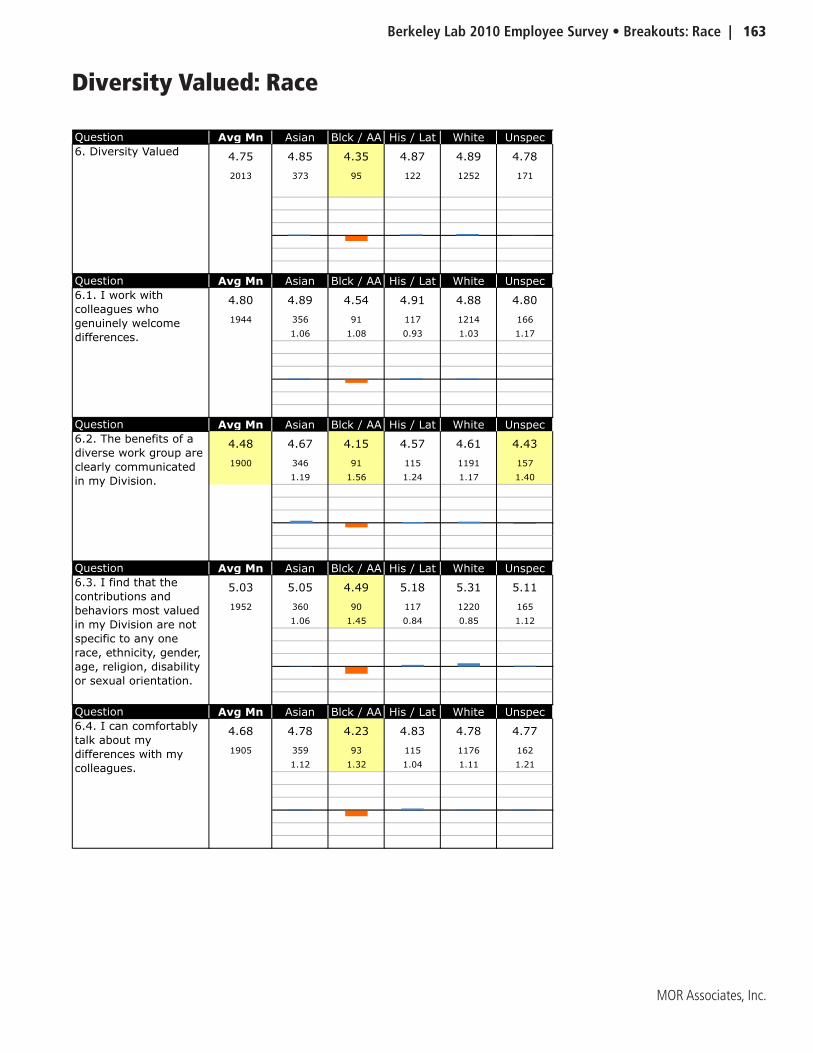
Berkeley Lab 2010 Employee Survey • Breakouts: Race | 163
MOR Associates, Inc.
Diversity Valued: Race
Question Avg Mn Asian Blck / AA His / Lat White Unspec
4.75 4.85 4.35 4.87 4.89 4.78
2013 373 95 122 1252 171
Question Avg Mn Asian Blck / AA His / Lat White Unspec
4.80 4.89 4.54 4.91 4.88 4.80
1944 356 91 117 1214 166
1.06 1.08 0.93 1.03 1.17
Question Avg Mn Asian Blck / AA His / Lat White Unspec
4.48 4.67 4.15 4.57 4.61 4.43
1900 346 91 115 1191 157
1.19 1.56 1.24 1.17 1.40
Question Avg Mn Asian Blck / AA His / Lat White Unspec
5.03 5.05 4.49 5.18 5.31 5.11
1952 360 90 117 1220 165
1.06 1.45 0.84 0.85 1.12
Question Avg Mn Asian Blck / AA His / Lat White Unspec
4.68 4.78 4.23 4.83 4.78 4.77
1905 359 93 115 1176 162
1.12 1.32 1.04 1.11 1.21
6. Diversity Valued
6.1. I work with
colleagues who
genuinely welcome
differences.
6.2. The benefits of a
diverse work group are
clearly communicated
in my Division.
6.3. I find that the
contributions and
behaviors most valued
in my Division are not
specific to any one
race, ethnicity, gender,
age, religion, disability
or sexual orientation.
6.4. I can comfortably
talk about my
differences with my
colleagues.
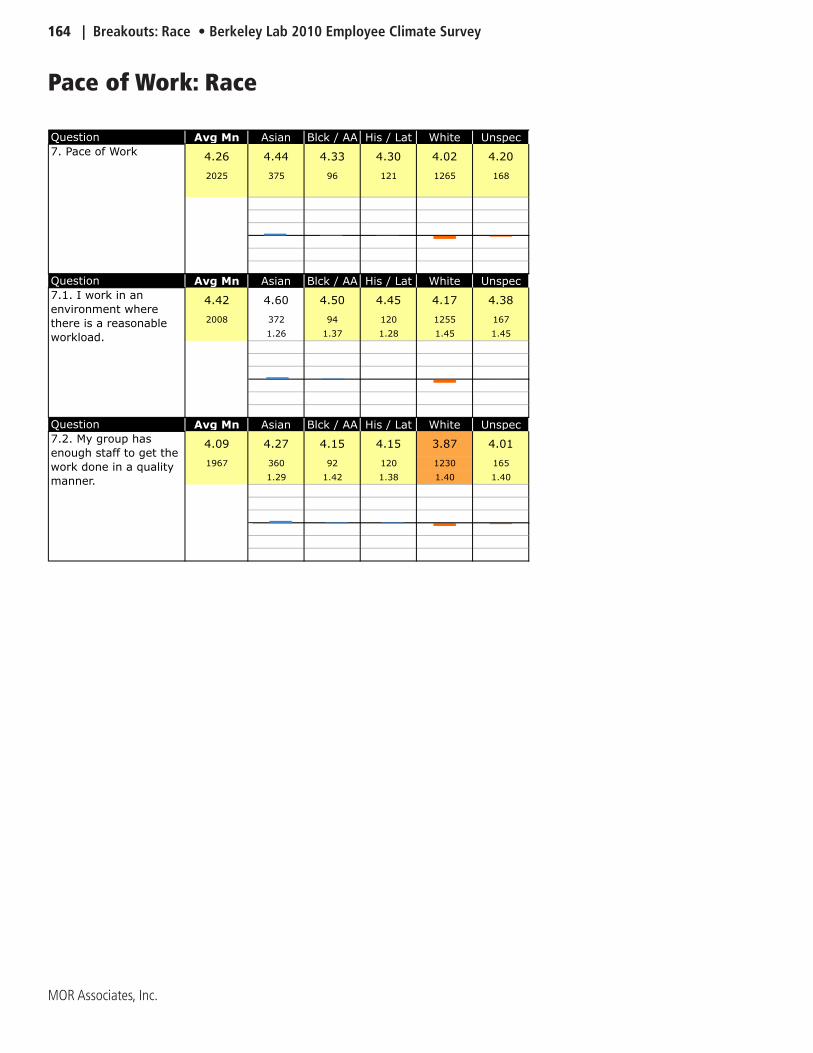
164 | Breakouts: Race • Berkeley Lab 2010 Employee Climate Survey
MOR Associates, Inc.
Pace of Work: Race
Question Avg Mn Asian Blck / AA His / Lat White Unspec
4.26 4.44 4.33 4.30 4.02 4.20
2025 375 96 121 1265 168
Question Avg Mn Asian Blck / AA His / Lat White Unspec
4.42 4.60 4.50 4.45 4.17 4.38
2008 372 94 120 1255 167
1.26 1.37 1.28 1.45 1.45
Question Avg Mn Asian Blck / AA His / Lat White Unspec
4.09 4.27 4.15 4.15 3.87 4.01
1967 360 92 120 1230 165
1.29 1.42 1.38 1.40 1.40
7. Pace of Work
7.1. I work in an
environment where
there is a reasonable
workload.
7.2. My group has
enough staff to get the
work done in a quality
manner.
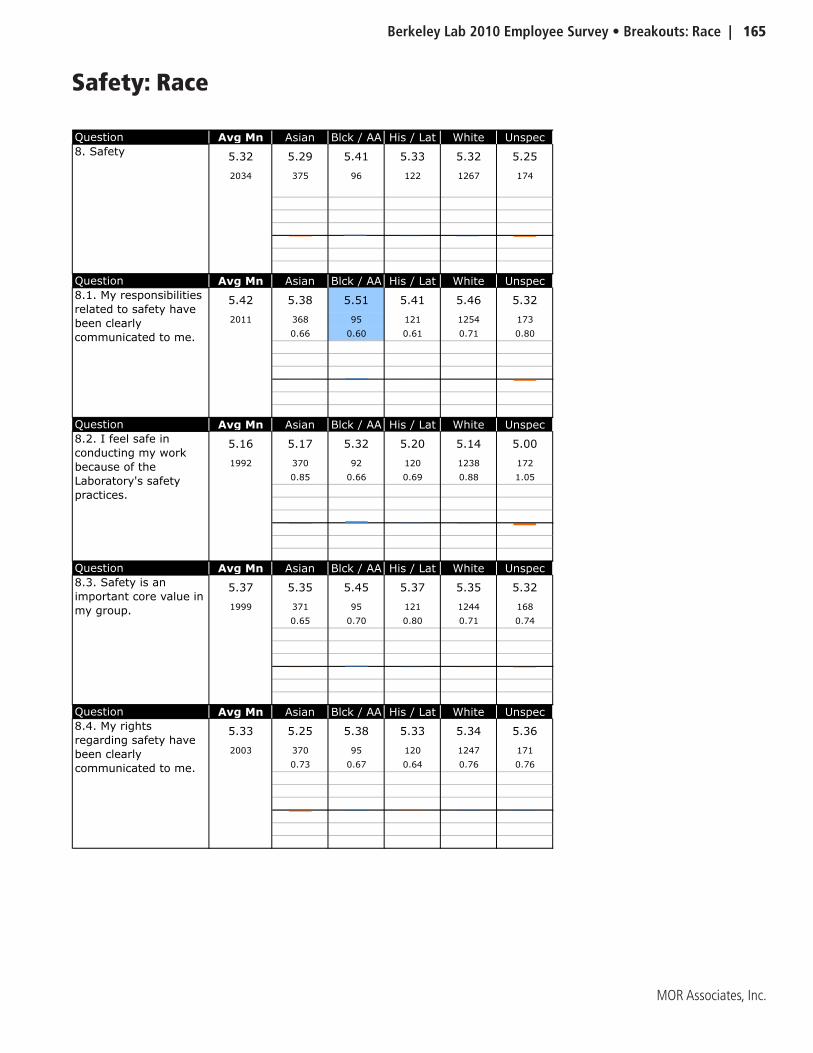
Berkeley Lab 2010 Employee Survey • Breakouts: Race | 165
MOR Associates, Inc.
Safety: Race
Question Avg Mn Asian Blck / AA His / Lat White Unspec
5.32 5.29 5.41 5.33 5.32 5.25
2034 375 96 122 1267 174
Question Avg Mn Asian Blck / AA His / Lat White Unspec
5.42 5.38 5.51 5.41 5.46 5.32
2011 368 95 121 1254 173
0.66 0.60 0.61 0.71 0.80
Question Avg Mn Asian Blck / AA His / Lat White Unspec
5.16 5.17 5.32 5.20 5.14 5.00
1992 370 92 120 1238 172
0.85 0.66 0.69 0.88 1.05
Question Avg Mn Asian Blck / AA His / Lat White Unspec
5.37 5.35 5.45 5.37 5.35 5.32
1999 371 95 121 1244 168
0.65 0.70 0.80 0.71 0.74
Question Avg Mn Asian Blck / AA His / Lat White Unspec
5.33 5.25 5.38 5.33 5.34 5.36
2003 370 95 120 1247 171
0.73 0.67 0.64 0.76 0.76
8. Safety
8.1. My responsibilities
related to safety have
been clearly
communicated to me.
8.2. I feel safe in
conducting my work
because of the
Laboratory's safety
practices.
8.3. Safety is an
important core value in
my group.
8.4. My rights
regarding safety have
been clearly
communicated to me.
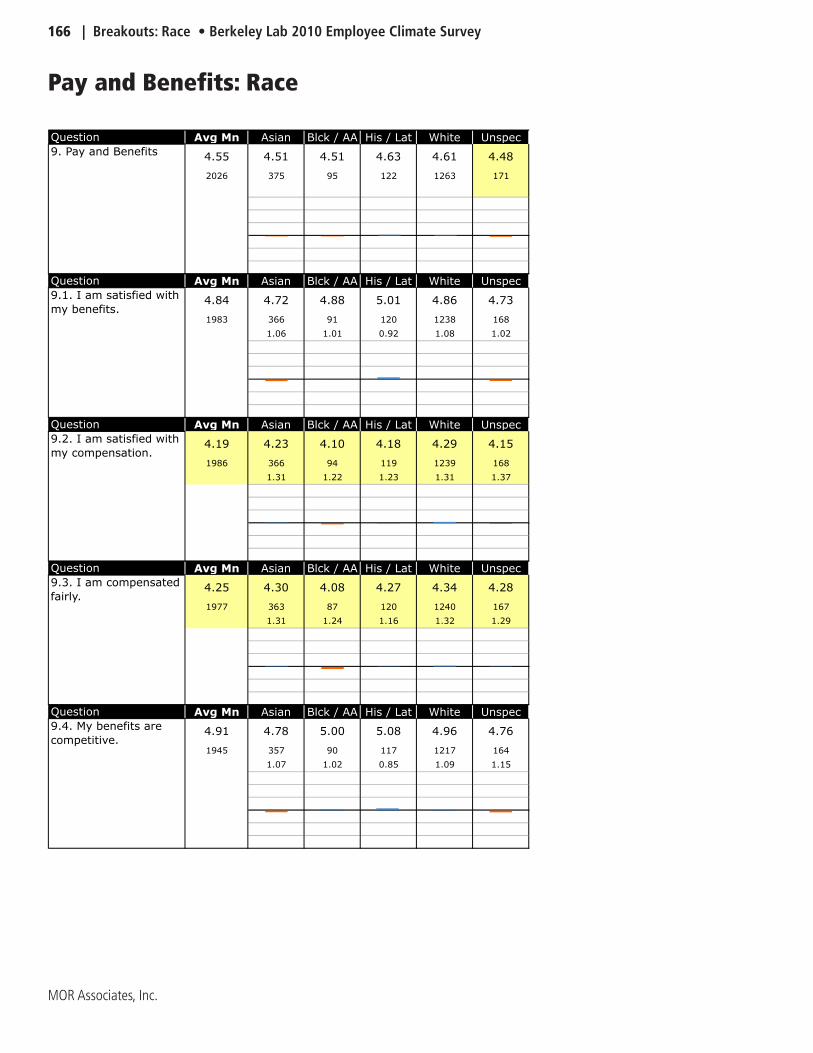
166 | Breakouts: Race • Berkeley Lab 2010 Employee Climate Survey
MOR Associates, Inc.
Pay and Benefits: Race
Question Avg Mn Asian Blck / AA His / Lat White Unspec
4.55 4.51 4.51 4.63 4.61 4.48
2026 375 95 122 1263 171
Question Avg Mn Asian Blck / AA His / Lat White Unspec
4.84 4.72 4.88 5.01 4.86 4.73
1983 366 91 120 1238 168
1.06 1.01 0.92 1.08 1.02
Question Avg Mn Asian Blck / AA His / Lat White Unspec
4.19 4.23 4.10 4.18 4.29 4.15
1986 366 94 119 1239 168
1.31 1.22 1.23 1.31 1.37
Question Avg Mn Asian Blck / AA His / Lat White Unspec
4.25 4.30 4.08 4.27 4.34 4.28
1977 363 87 120 1240 167
1.31 1.24 1.16 1.32 1.29
Question Avg Mn Asian Blck / AA His / Lat White Unspec
4.91 4.78 5.00 5.08 4.96 4.76
1945 357 90 117 1217 164
1.07 1.02 0.85 1.09 1.15
9.4. My benefits are
competitive.
9. Pay and Benefits
9.1. I am satisfied with
my benefits.
9.2. I am satisfied with
my compensation.
9.3. I am compensated
fairly.
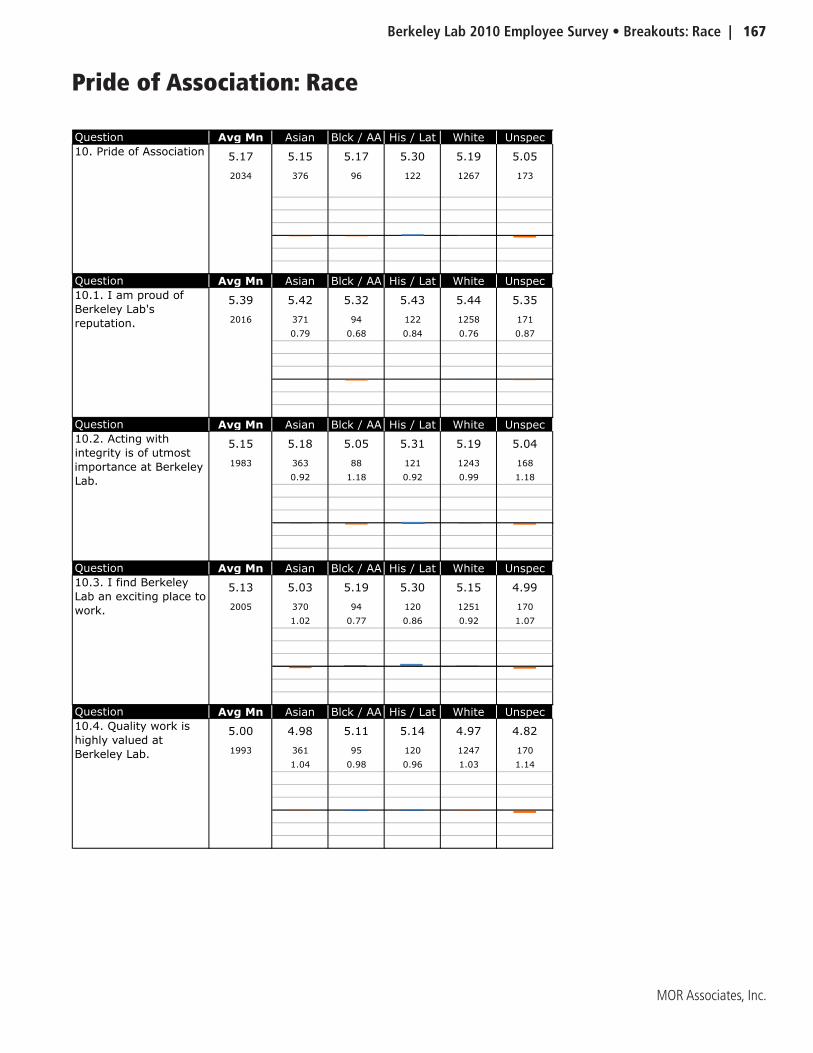
Berkeley Lab 2010 Employee Survey • Breakouts: Race | 167
MOR Associates, Inc.
Pride of Association: Race
Question Avg Mn Asian Blck / AA His / Lat White Unspec
5.17 5.15 5.17 5.30 5.19 5.05
2034 376 96 122 1267 173
Question Avg Mn Asian Blck / AA His / Lat White Unspec
5.39 5.42 5.32 5.43 5.44 5.35
2016 371 94 122 1258 171
0.79 0.68 0.84 0.76 0.87
Question Avg Mn Asian Blck / AA His / Lat White Unspec
5.15 5.18 5.05 5.31 5.19 5.04
1983 363 88 121 1243 168
0.92 1.18 0.92 0.99 1.18
Question Avg Mn Asian Blck / AA His / Lat White Unspec
5.13 5.03 5.19 5.30 5.15 4.99
2005 370 94 120 1251 170
1.02 0.77 0.86 0.92 1.07
Question Avg Mn Asian Blck / AA His / Lat White Unspec
5.00 4.98 5.11 5.14 4.97 4.82
1993 361 95 120 1247 170
1.04 0.98 0.96 1.03 1.14
10. Pride of Association
10.1. I am proud of
Berkeley Lab's
reputation.
10.2. Acting with
integrity is of utmost
importance at Berkeley
Lab.
10.3. I find Berkeley
Lab an exciting place to
work.
10.4. Quality work is
highly valued at
Berkeley Lab.
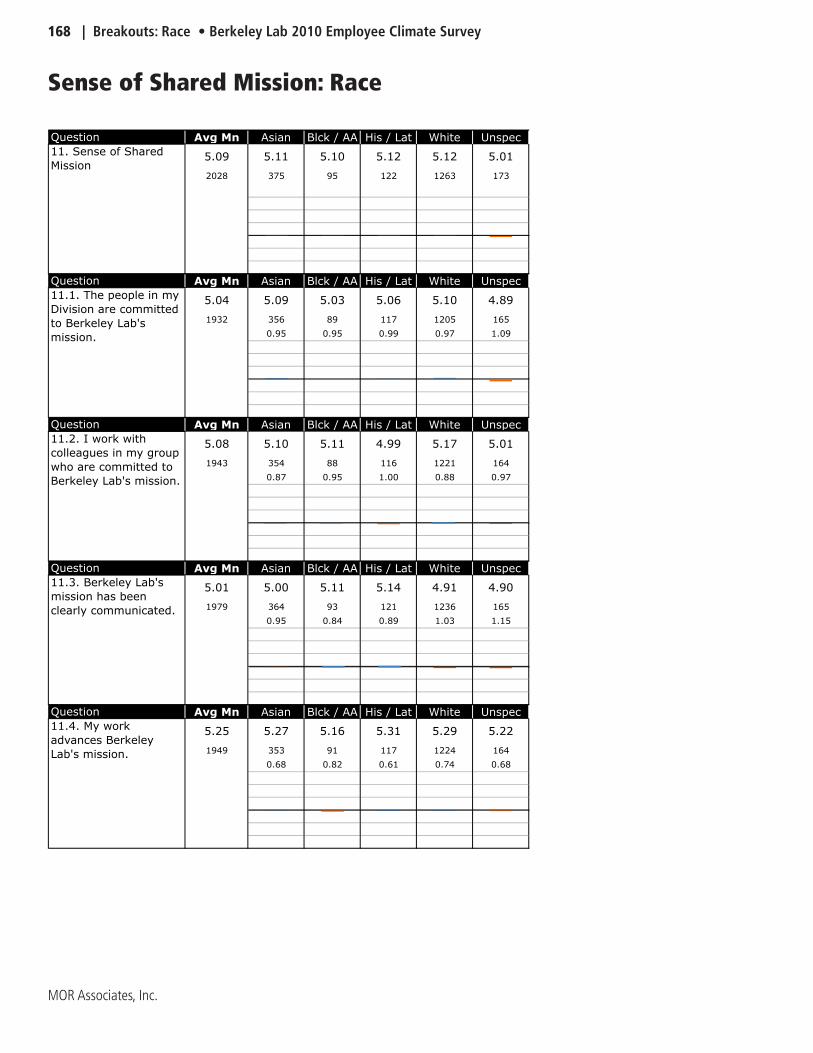
168 | Breakouts: Race • Berkeley Lab 2010 Employee Climate Survey
MOR Associates, Inc.
Sense of Shared Mission: Race
Question Avg Mn Asian Blck / AA His / Lat White Unspec
5.09 5.11 5.10 5.12 5.12 5.01
2028 375 95 122 1263 173
Question Avg Mn Asian Blck / AA His / Lat White Unspec
5.04 5.09 5.03 5.06 5.10 4.89
1932 356 89 117 1205 165
0.95 0.95 0.99 0.97 1.09
Question Avg Mn Asian Blck / AA His / Lat White Unspec
5.08 5.10 5.11 4.99 5.17 5.01
1943 354 88 116 1221 164
0.87 0.95 1.00 0.88 0.97
Question Avg Mn Asian Blck / AA His / Lat White Unspec
5.01 5.00 5.11 5.14 4.91 4.90
1979 364 93 121 1236 165
0.95 0.84 0.89 1.03 1.15
Question Avg Mn Asian Blck / AA His / Lat White Unspec
5.25 5.27 5.16 5.31 5.29 5.22
1949 353 91 117 1224 164
0.68 0.82 0.61 0.74 0.68
11. Sense of Shared
Mission
11.1. The people in my
Division are committed
to Berkeley Lab's
mission.
11.2. I work with
colleagues in my group
who are committed to
Berkeley Lab's mission.
11.3. Berkeley Lab's
mission has been
clearly communicated.
11.4. My work
advances Berkeley
Lab's mission.
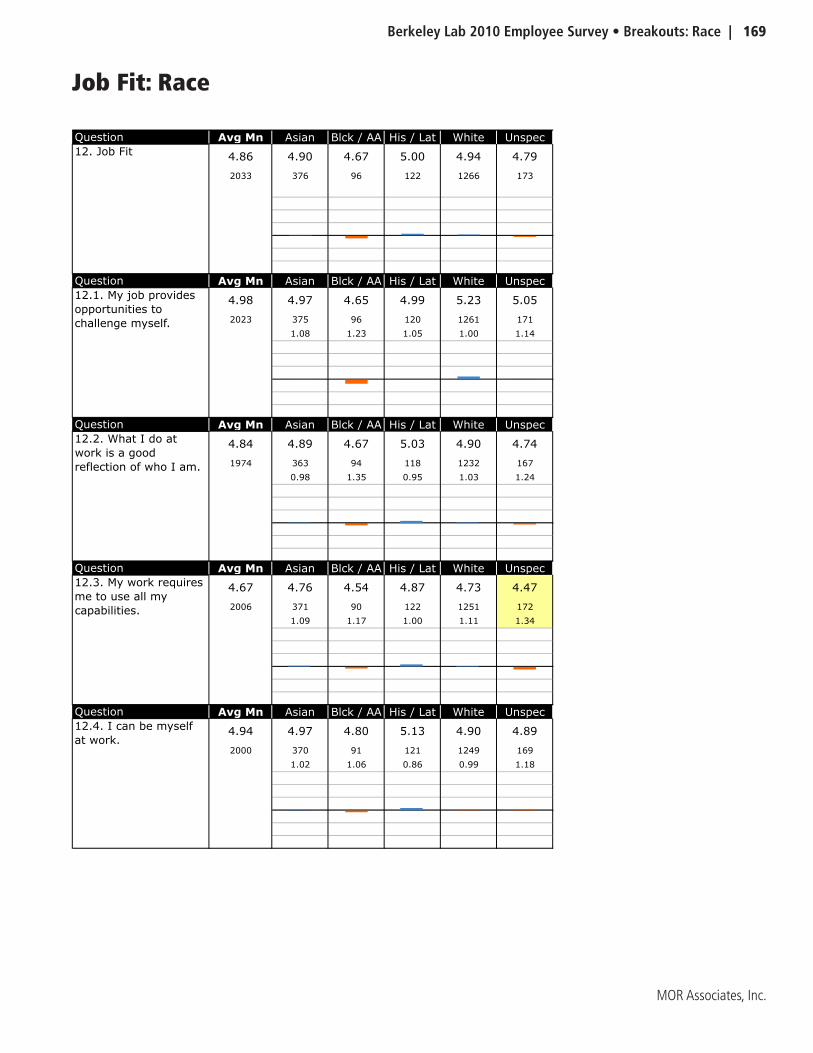
Berkeley Lab 2010 Employee Survey • Breakouts: Race | 169
MOR Associates, Inc.
Job Fit: Race
Question Avg Mn Asian Blck / AA His / Lat White Unspec
4.86 4.90 4.67 5.00 4.94 4.79
2033 376 96 122 1266 173
Question Avg Mn Asian Blck / AA His / Lat White Unspec
4.98 4.97 4.65 4.99 5.23 5.05
2023 375 96 120 1261 171
1.08 1.23 1.05 1.00 1.14
Question Avg Mn Asian Blck / AA His / Lat White Unspec
4.84 4.89 4.67 5.03 4.90 4.74
1974 363 94 118 1232 167
0.98 1.35 0.95 1.03 1.24
Question Avg Mn Asian Blck / AA His / Lat White Unspec
4.67 4.76 4.54 4.87 4.73 4.47
2006 371 90 122 1251 172
1.09 1.17 1.00 1.11 1.34
Question Avg Mn Asian Blck / AA His / Lat White Unspec
4.94 4.97 4.80 5.13 4.90 4.89
2000 370 91 121 1249 169
1.02 1.06 0.86 0.99 1.18
12. Job Fit
12.1. My job provides
opportunities to
challenge myself.
12.2. What I do at
work is a good
reflection of who I am.
12.3. My work requires
me to use all my
capabilities.
12.4. I can be myself
at work.
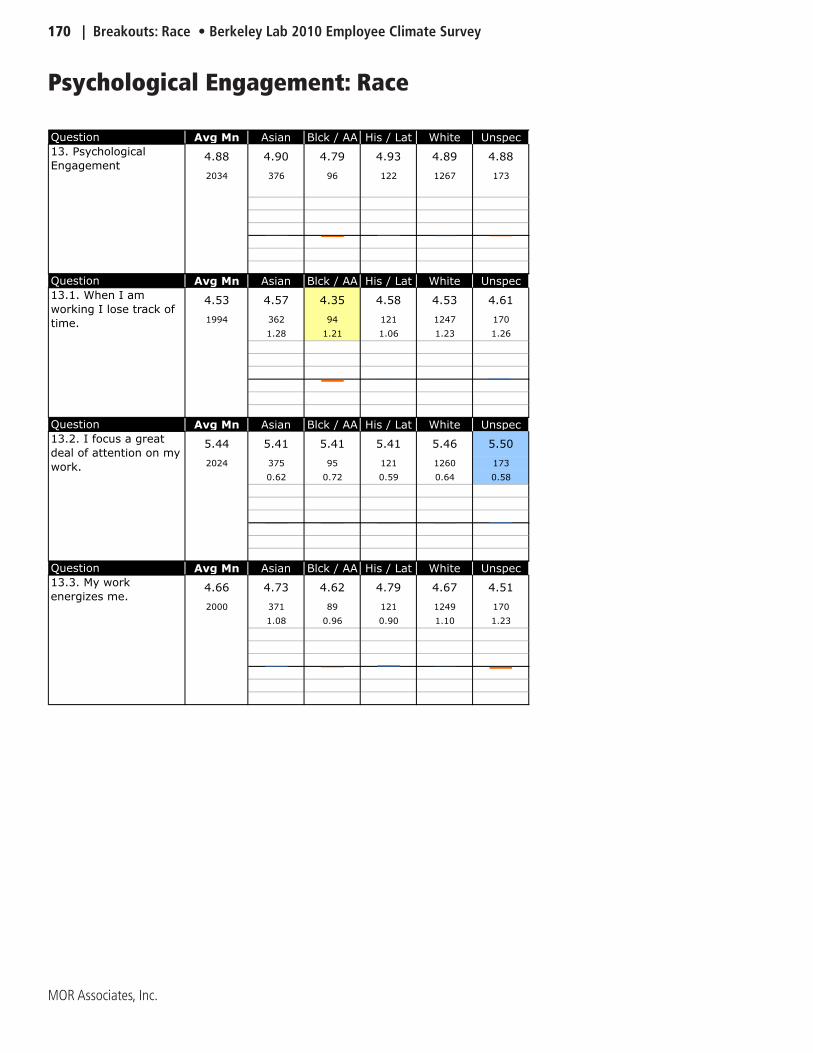
170 | Breakouts: Race • Berkeley Lab 2010 Employee Climate Survey
MOR Associates, Inc.
Psychological Engagement: Race
Question Avg Mn Asian Blck / AA His / Lat White Unspec
4.88 4.90 4.79 4.93 4.89 4.88
2034 376 96 122 1267 173
Question Avg Mn Asian Blck / AA His / Lat White Unspec
4.53 4.57 4.35 4.58 4.53 4.61
1994 362 94 121 1247 170
1.28 1.21 1.06 1.23 1.26
Question Avg Mn Asian Blck / AA His / Lat White Unspec
5.44 5.41 5.41 5.41 5.46 5.50
2024 375 95 121 1260 173
0.62 0.72 0.59 0.64 0.58
Question Avg Mn Asian Blck / AA His / Lat White Unspec
4.66 4.73 4.62 4.79 4.67 4.51
2000 371 89 121 1249 170
1.08 0.96 0.90 1.10 1.23
13.2. I focus a great
deal of attention on my
work.
13.3. My work
energizes me.
13. Psychological
Engagement
13.1. When I am
working I lose track of
time.
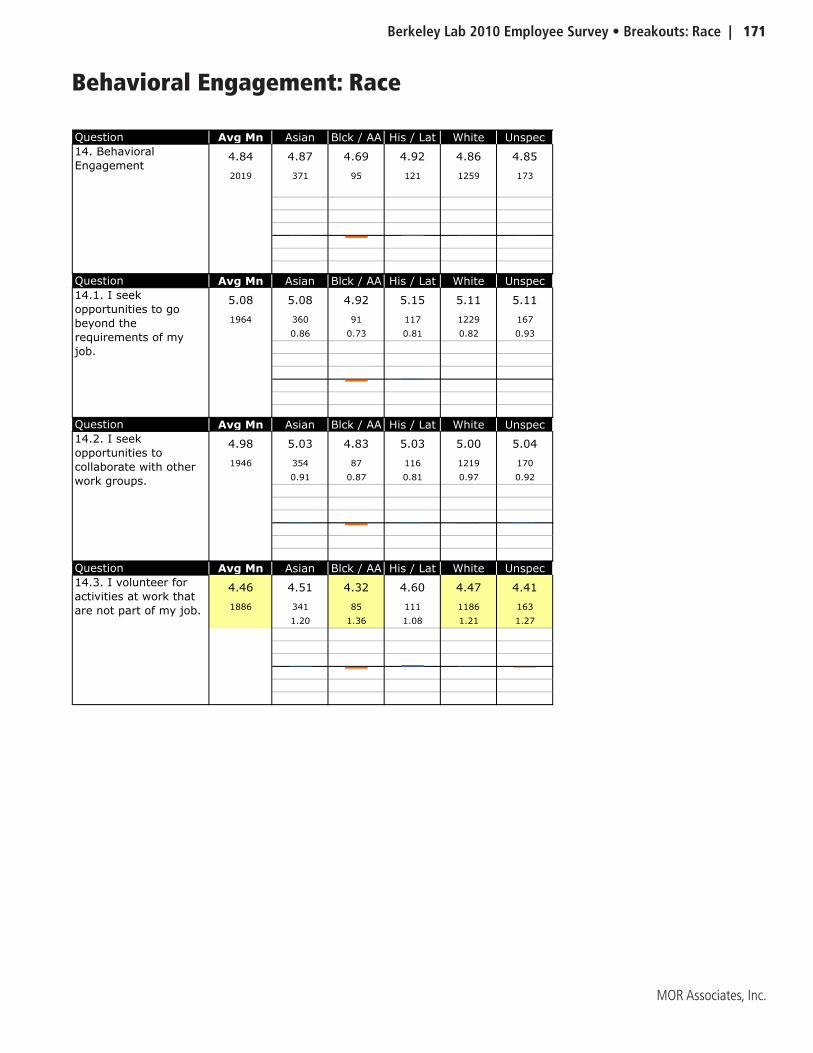
Berkeley Lab 2010 Employee Survey • Breakouts: Race | 171
MOR Associates, Inc.
Behavioral Engagement: Race
Question Avg Mn Asian Blck / AA His / Lat White Unspec
4.84 4.87 4.69 4.92 4.86 4.85
2019 371 95 121 1259 173
Question Avg Mn Asian Blck / AA His / Lat White Unspec
5.08 5.08 4.92 5.15 5.11 5.11
1964 360 91 117 1229 167
0.86 0.73 0.81 0.82 0.93
Question Avg Mn Asian Blck / AA His / Lat White Unspec
4.98 5.03 4.83 5.03 5.00 5.04
1946 354 87 116 1219 170
0.91 0.87 0.81 0.97 0.92
Question Avg Mn Asian Blck / AA His / Lat White Unspec
4.46 4.51 4.32 4.60 4.47 4.41
1886 341 85 111 1186 163
1.20 1.36 1.08 1.21 1.27
14. Behavioral
Engagement
14.1. I seek
opportunities to go
beyond the
requirements of my
job.
14.2. I seek
opportunities to
collaborate with other
work groups.
14.3. I volunteer for
activities at work that
are not part of my job.
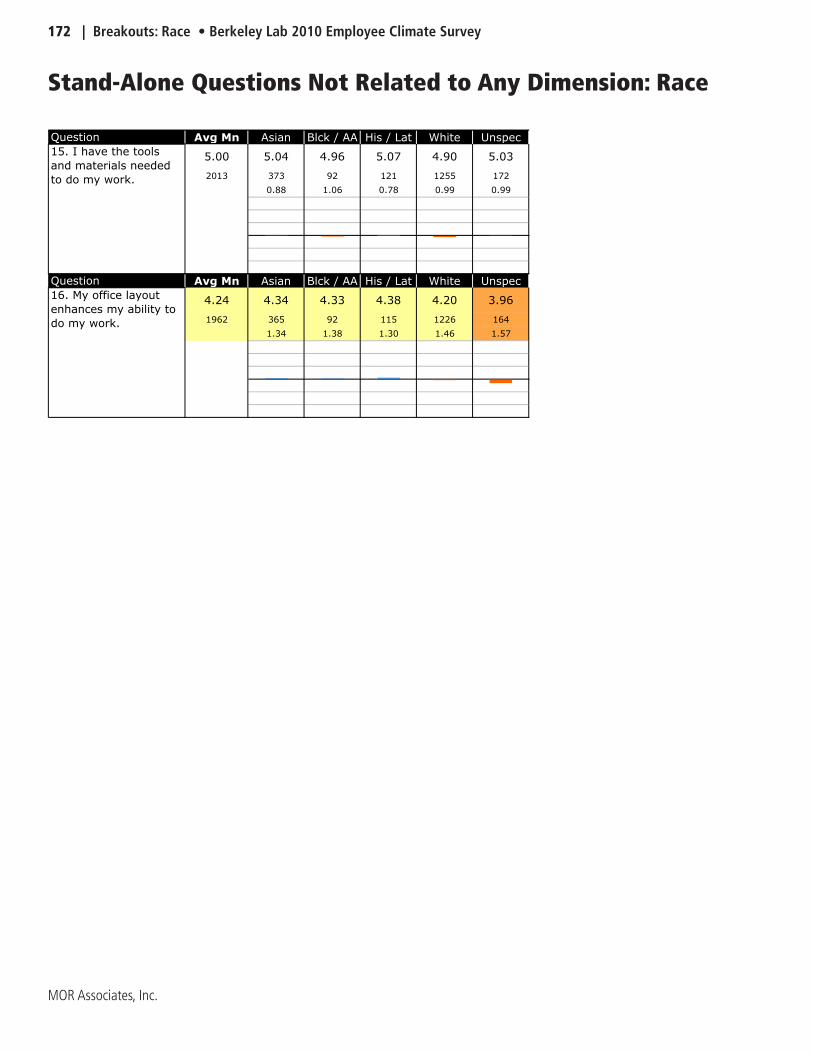
172 | Breakouts: Race • Berkeley Lab 2010 Employee Climate Survey
MOR Associates, Inc.
Stand-Alone Questions Not Related to Any Dimension: Race
Question Avg Mn Asian Blck / AA His / Lat White Unspec
5.00 5.04 4.96 5.07 4.90 5.03
2013 373 92 121 1255 172
0.88 1.06 0.78 0.99 0.99
Question Avg Mn Asian Blck / AA His / Lat White Unspec
4.24 4.34 4.33 4.38 4.20 3.96
1962 365 92 115 1226 164
1.34 1.38 1.30 1.46 1.57
15. I have the tools
and materials needed
to do my work.
16. My office layout
enhances my ability to
do my work.

Berkeley Lab 2010 Employee Survey • Breakouts: Age | 173
MOR Associates, Inc.
Breakout Charts and Tables:
by Age
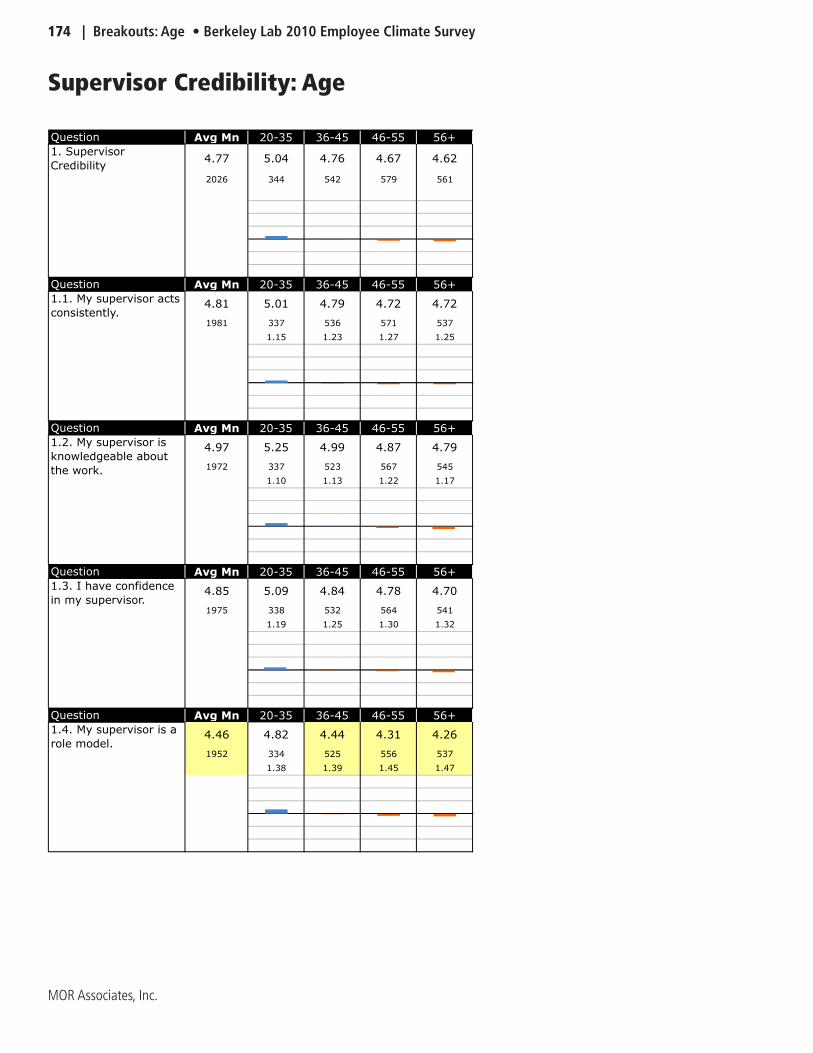
174 | Breakouts: Age • Berkeley Lab 2010 Employee Climate Survey
MOR Associates, Inc.
Supervisor Credibility: Age
Question Avg Mn 20-35 36-45 46-55 56+
4.77 5.04 4.76 4.67 4.62
2026 344 542 579 561
Question Avg Mn 20-35 36-45 46-55 56+
4.81 5.01 4.79 4.72 4.72
1981 337 536 571 537
1.15 1.23 1.27 1.25
Question Avg Mn 20-35 36-45 46-55 56+
4.97 5.25 4.99 4.87 4.79
1972 337 523 567 545
1.10 1.13 1.22 1.17
Question Avg Mn 20-35 36-45 46-55 56+
4.85 5.09 4.84 4.78 4.70
1975 338 532 564 541
1.19 1.25 1.30 1.32
Question Avg Mn 20-35 36-45 46-55 56+
4.46 4.82 4.44 4.31 4.26
1952 334 525 556 537
1.38 1.39 1.45 1.47
1. Supervisor
Credibility
1.1. My supervisor acts
consistently.
1.2. My supervisor is
knowledgeable about
the work.
1.3. I have confidence
in my supervisor.
1.4. My supervisor is a
role model.
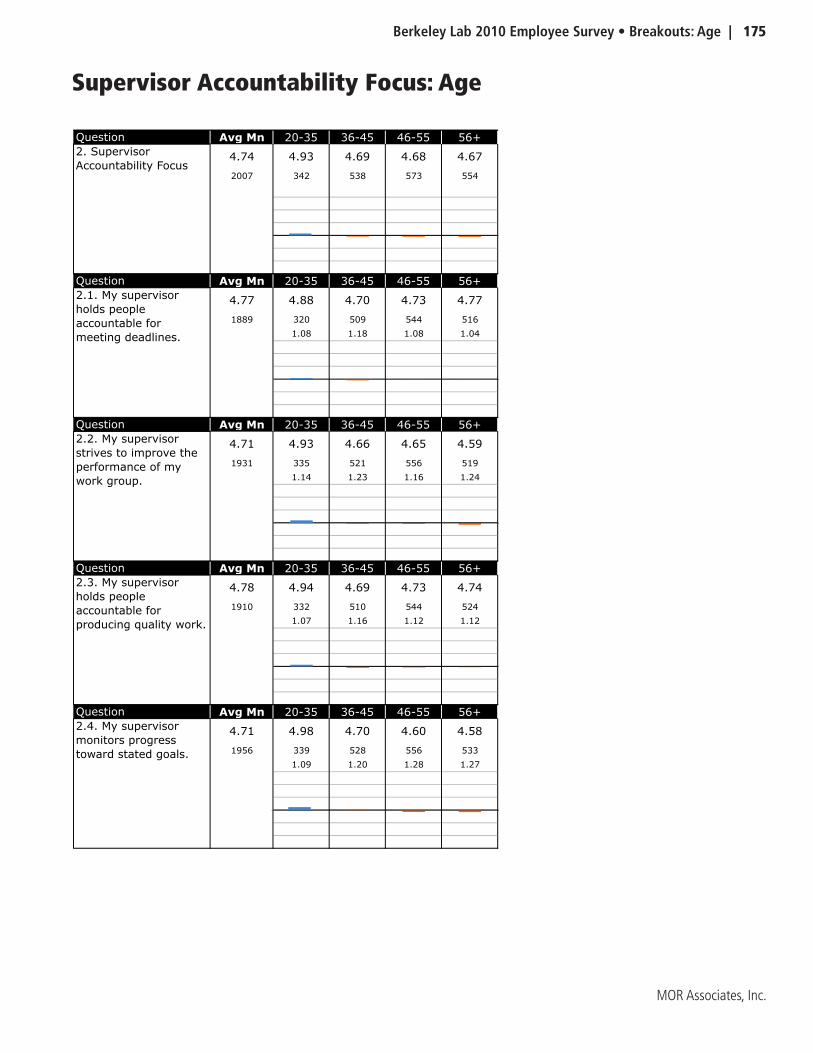
Berkeley Lab 2010 Employee Survey • Breakouts: Age | 175
MOR Associates, Inc.
Supervisor Accountability Focus: Age
Question Avg Mn 20-35 36-45 46-55 56+
4.74 4.93 4.69 4.68 4.67
2007 342 538 573 554
Question Avg Mn 20-35 36-45 46-55 56+
4.77 4.88 4.70 4.73 4.77
1889 320 509 544 516
1.08 1.18 1.08 1.04
Question Avg Mn 20-35 36-45 46-55 56+
4.71 4.93 4.66 4.65 4.59
1931 335 521 556 519
1.14 1.23 1.16 1.24
Question Avg Mn 20-35 36-45 46-55 56+
4.78 4.94 4.69 4.73 4.74
1910 332 510 544 524
1.07 1.16 1.12 1.12
Question Avg Mn 20-35 36-45 46-55 56+
4.71 4.98 4.70 4.60 4.58
1956 339 528 556 533
1.09 1.20 1.28 1.27
2. Supervisor
Accountability Focus
2.1. My supervisor
holds people
accountable for
meeting deadlines.
2.2. My supervisor
strives to improve the
performance of my
work group.
2.3. My supervisor
holds people
accountable for
producing quality work.
2.4. My supervisor
monitors progress
toward stated goals.
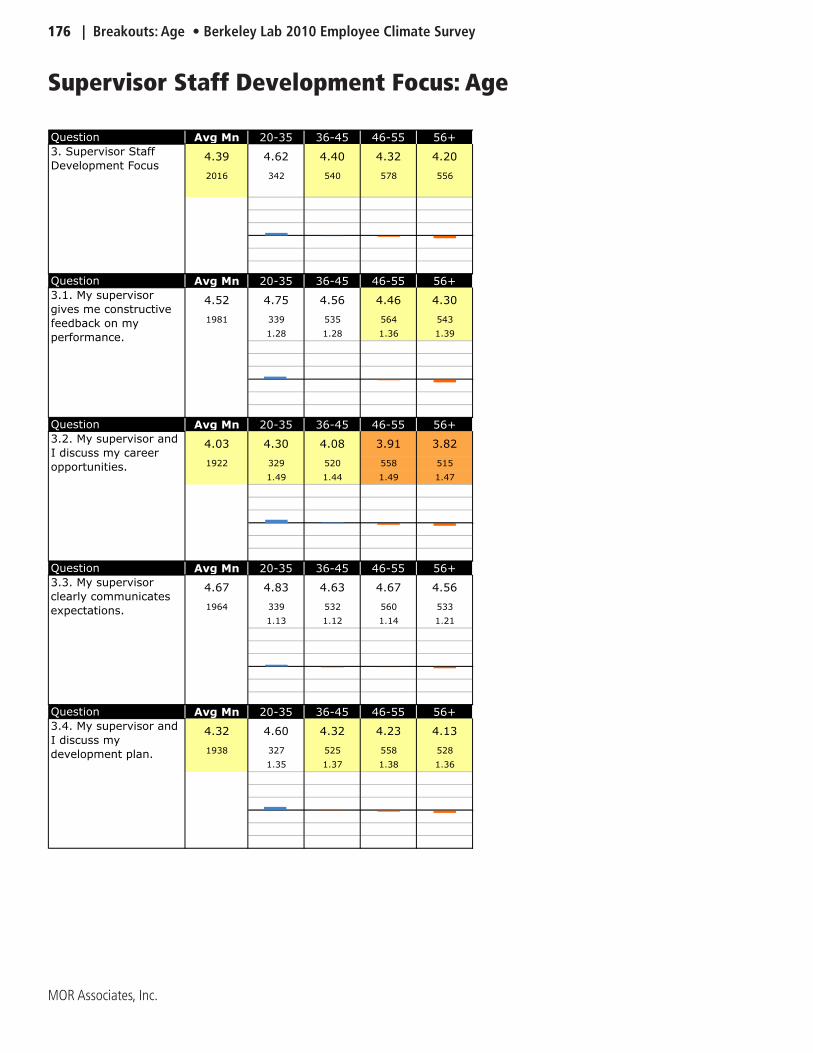
176 | Breakouts: Age • Berkeley Lab 2010 Employee Climate Survey
MOR Associates, Inc.
Supervisor Staff Development Focus: Age
Question Avg Mn 20-35 36-45 46-55 56+
4.39 4.62 4.40 4.32 4.20
2016 342 540 578 556
Question Avg Mn 20-35 36-45 46-55 56+
4.52 4.75 4.56 4.46 4.30
1981 339 535 564 543
1.28 1.28 1.36 1.39
Question Avg Mn 20-35 36-45 46-55 56+
4.03 4.30 4.08 3.91 3.82
1922 329 520 558 515
1.49 1.44 1.49 1.47
Question Avg Mn 20-35 36-45 46-55 56+
4.67 4.83 4.63 4.67 4.56
1964 339 532 560 533
1.13 1.12 1.14 1.21
Question Avg Mn 20-35 36-45 46-55 56+
4.32 4.60 4.32 4.23 4.13
1938 327 525 558 528
1.35 1.37 1.38 1.36
3. Supervisor Staff
Development Focus
3.1. My supervisor
gives me constructive
feedback on my
performance.
3.2. My supervisor and
I discuss my career
opportunities.
3.3. My supervisor
clearly communicates
expectations.
3.4. My supervisor and
I discuss my
development plan.
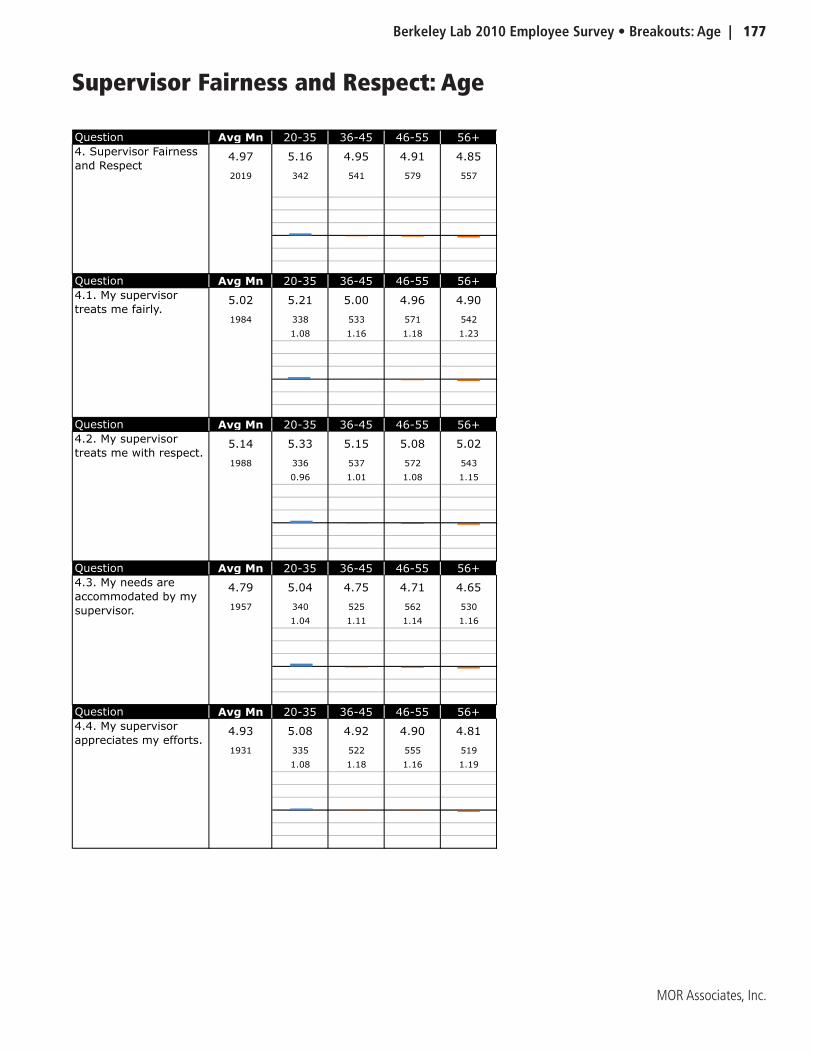
Berkeley Lab 2010 Employee Survey • Breakouts: Age | 177
MOR Associates, Inc.
Supervisor Fairness and Respect: Age
Question Avg Mn 20-35 36-45 46-55 56+
4.97 5.16 4.95 4.91 4.85
2019 342 541 579 557
Question Avg Mn 20-35 36-45 46-55 56+
5.02 5.21 5.00 4.96 4.90
1984 338 533 571 542
1.08 1.16 1.18 1.23
Question Avg Mn 20-35 36-45 46-55 56+
5.14 5.33 5.15 5.08 5.02
1988 336 537 572 543
0.96 1.01 1.08 1.15
Question Avg Mn 20-35 36-45 46-55 56+
4.79 5.04 4.75 4.71 4.65
1957 340 525 562 530
1.04 1.11 1.14 1.16
Question Avg Mn 20-35 36-45 46-55 56+
4.93 5.08 4.92 4.90 4.81
1931 335 522 555 519
1.08 1.18 1.16 1.19
4. Supervisor Fairness
and Respect
4.1. My supervisor
treats me fairly.
4.2. My supervisor
treats me with respect.
4.3. My needs are
accommodated by my
supervisor.
4.4. My supervisor
appreciates my efforts.

178 | Breakouts: Age • Berkeley Lab 2010 Employee Climate Survey
MOR Associates, Inc.
Feeling Valued: Age
Question Avg Mn 20-35 36-45 46-55 56+
4.98 5.13 4.95 4.94 4.89
2028 342 541 582 563
Question Avg Mn 20-35 36-45 46-55 56+
5.26 5.34 5.24 5.22 5.26
2023 342 539 580 562
0.92 0.99 0.95 0.92
Question Avg Mn 20-35 36-45 46-55 56+
4.71 4.92 4.68 4.66 4.59
1949 332 518 561 538
1.15 1.28 1.24 1.27
Question Avg Mn 20-35 36-45 46-55 56+
5.11 5.20 5.07 5.11 5.05
2000 337 537 571 555
0.90 0.90 0.86 0.89
Question Avg Mn 20-35 36-45 46-55 56+
4.83 5.07 4.81 4.78 4.67
1948 336 526 557 529
1.03 1.17 1.19 1.30
5. Feeling Valued
5.1. I have the
appropriate amount of
independence to do my
work.
5.2. My ideas on work
process and procedure
improvements are
valued.
5.3. My colleagues
treat me with respect.
5.4. My opinions are
valued by my
supervisor.
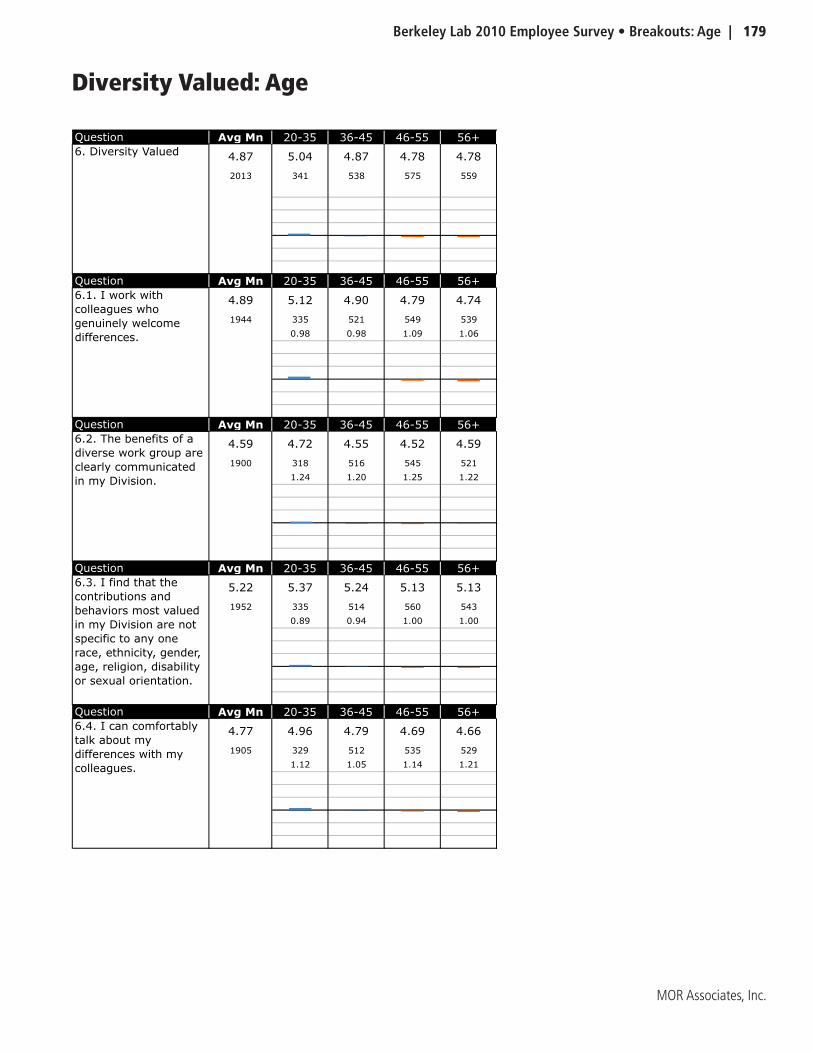
Berkeley Lab 2010 Employee Survey • Breakouts: Age | 179
MOR Associates, Inc.
Diversity Valued: Age
Question Avg Mn 20-35 36-45 46-55 56+
4.87 5.04 4.87 4.78 4.78
2013 341 538 575 559
Question Avg Mn 20-35 36-45 46-55 56+
4.89 5.12 4.90 4.79 4.74
1944 335 521 549 539
0.98 0.98 1.09 1.06
Question Avg Mn 20-35 36-45 46-55 56+
4.59 4.72 4.55 4.52 4.59
1900 318 516 545 521
1.24 1.20 1.25 1.22
Question Avg Mn 20-35 36-45 46-55 56+
5.22 5.37 5.24 5.13 5.13
1952 335 514 560 543
0.89 0.94 1.00 1.00
Question Avg Mn 20-35 36-45 46-55 56+
4.77 4.96 4.79 4.69 4.66
1905 329 512 535 529
1.12 1.05 1.14 1.21
6. Diversity Valued
6.1. I work with
colleagues who
genuinely welcome
differences.
6.2. The benefits of a
diverse work group are
clearly communicated
in my Division.
6.3. I find that the
contributions and
behaviors most valued
in my Division are not
specific to any one
race, ethnicity, gender,
age, religion, disability
or sexual orientation.
6.4. I can comfortably
talk about my
differences with my
colleagues.
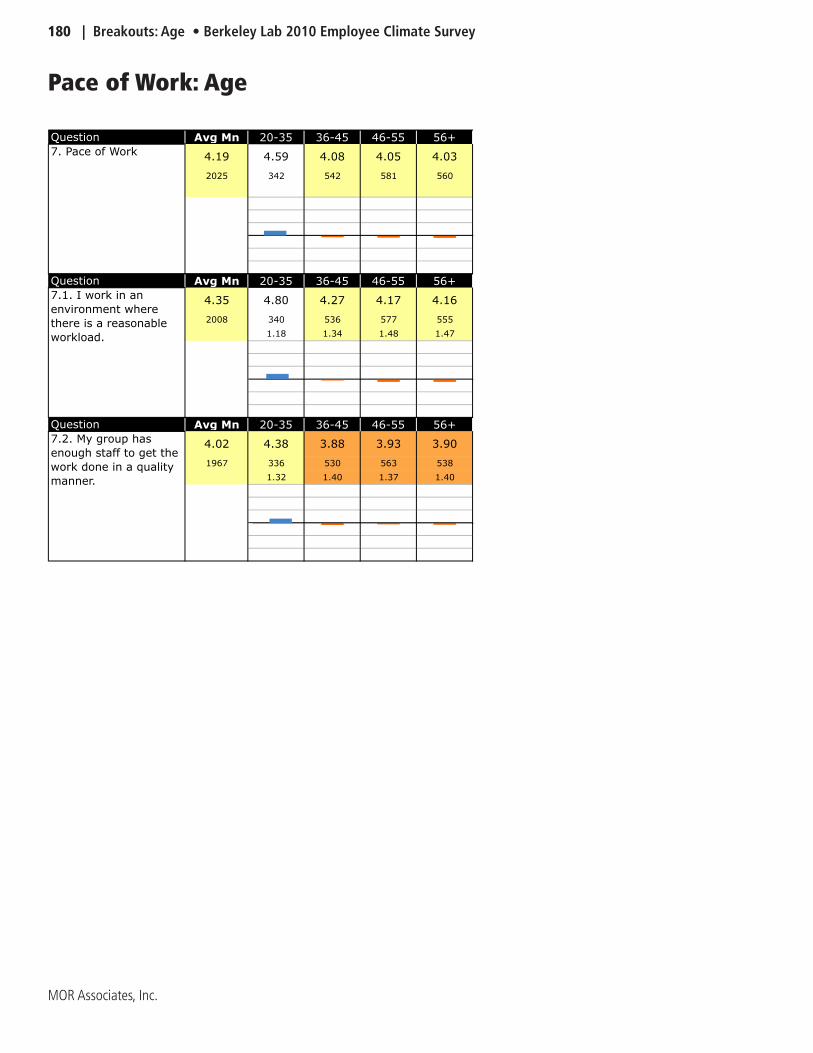
180 | Breakouts: Age • Berkeley Lab 2010 Employee Climate Survey
MOR Associates, Inc.
Pace of Work: Age
Question Avg Mn 20-35 36-45 46-55 56+
4.19 4.59 4.08 4.05 4.03
2025 342 542 581 560
Question Avg Mn 20-35 36-45 46-55 56+
4.35 4.80 4.27 4.17 4.16
2008 340 536 577 555
1.18 1.34 1.48 1.47
Question Avg Mn 20-35 36-45 46-55 56+
4.02 4.38 3.88 3.93 3.90
1967 336 530 563 538
1.32 1.40 1.37 1.40
7. Pace of Work
7.1. I work in an
environment where
there is a reasonable
workload.
7.2. My group has
enough staff to get the
work done in a quality
manner.
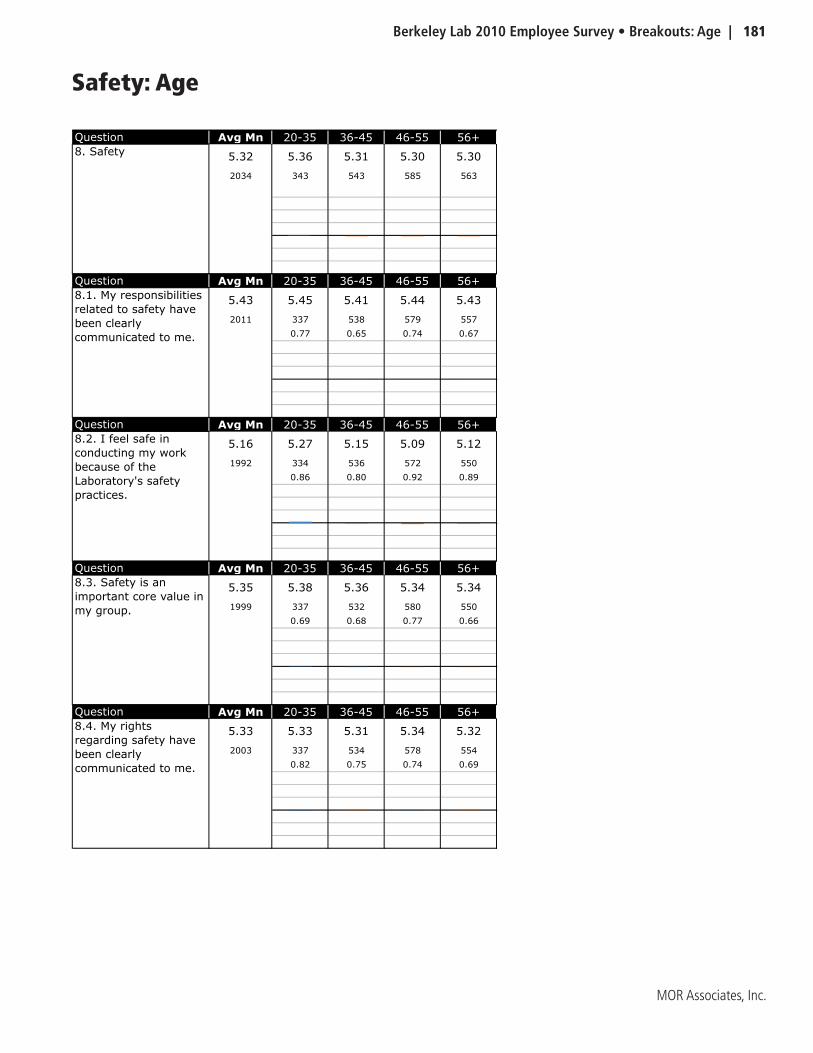
Berkeley Lab 2010 Employee Survey • Breakouts: Age | 181
MOR Associates, Inc.
Safety: Age
Question Avg Mn 20-35 36-45 46-55 56+
5.32 5.36 5.31 5.30 5.30
2034 343 543 585 563
Question Avg Mn 20-35 36-45 46-55 56+
5.43 5.45 5.41 5.44 5.43
2011 337 538 579 557
0.77 0.65 0.74 0.67
Question Avg Mn 20-35 36-45 46-55 56+
5.16 5.27 5.15 5.09 5.12
1992 334 536 572 550
0.86 0.80 0.92 0.89
Question Avg Mn 20-35 36-45 46-55 56+
5.35 5.38 5.36 5.34 5.34
1999 337 532 580 550
0.69 0.68 0.77 0.66
Question Avg Mn 20-35 36-45 46-55 56+
5.33 5.33 5.31 5.34 5.32
2003 337 534 578 554
0.82 0.75 0.74 0.69
8.2. I feel safe in
conducting my work
because of the
Laboratory's safety
practices.
8.3. Safety is an
important core value in
my group.
8.4. My rights
regarding safety have
been clearly
communicated to me.
8. Safety
8.1. My responsibilities
related to safety have
been clearly
communicated to me.
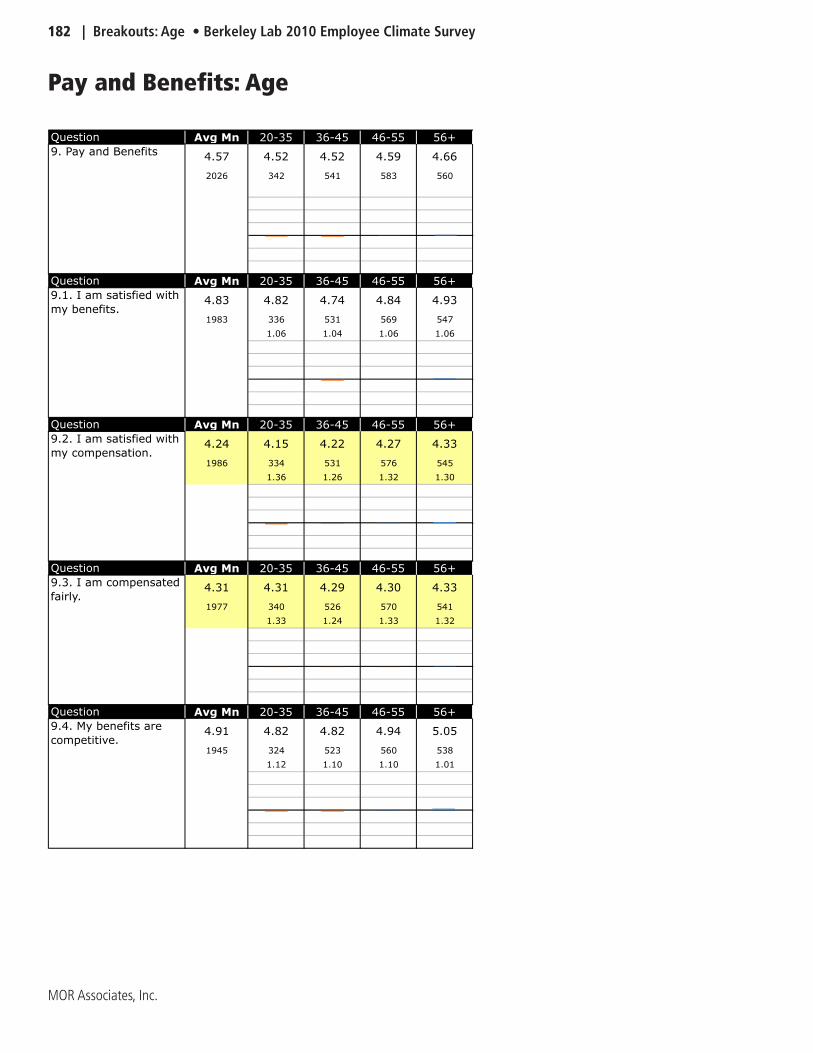
182 | Breakouts: Age • Berkeley Lab 2010 Employee Climate Survey
MOR Associates, Inc.
Pay and Benefits: Age
Question Avg Mn 20-35 36-45 46-55 56+
4.57 4.52 4.52 4.59 4.66
2026 342 541 583 560
Question Avg Mn 20-35 36-45 46-55 56+
4.83 4.82 4.74 4.84 4.93
1983 336 531 569 547
1.06 1.04 1.06 1.06
Question Avg Mn 20-35 36-45 46-55 56+
4.24 4.15 4.22 4.27 4.33
1986 334 531 576 545
1.36 1.26 1.32 1.30
Question Avg Mn 20-35 36-45 46-55 56+
4.31 4.31 4.29 4.30 4.33
1977 340 526 570 541
1.33 1.24 1.33 1.32
Question Avg Mn 20-35 36-45 46-55 56+
4.91 4.82 4.82 4.94 5.05
1945 324 523 560 538
1.12 1.10 1.10 1.01
9.4. My benefits are
competitive.
9. Pay and Benefits
9.1. I am satisfied with
my benefits.
9.2. I am satisfied with
my compensation.
9.3. I am compensated
fairly.
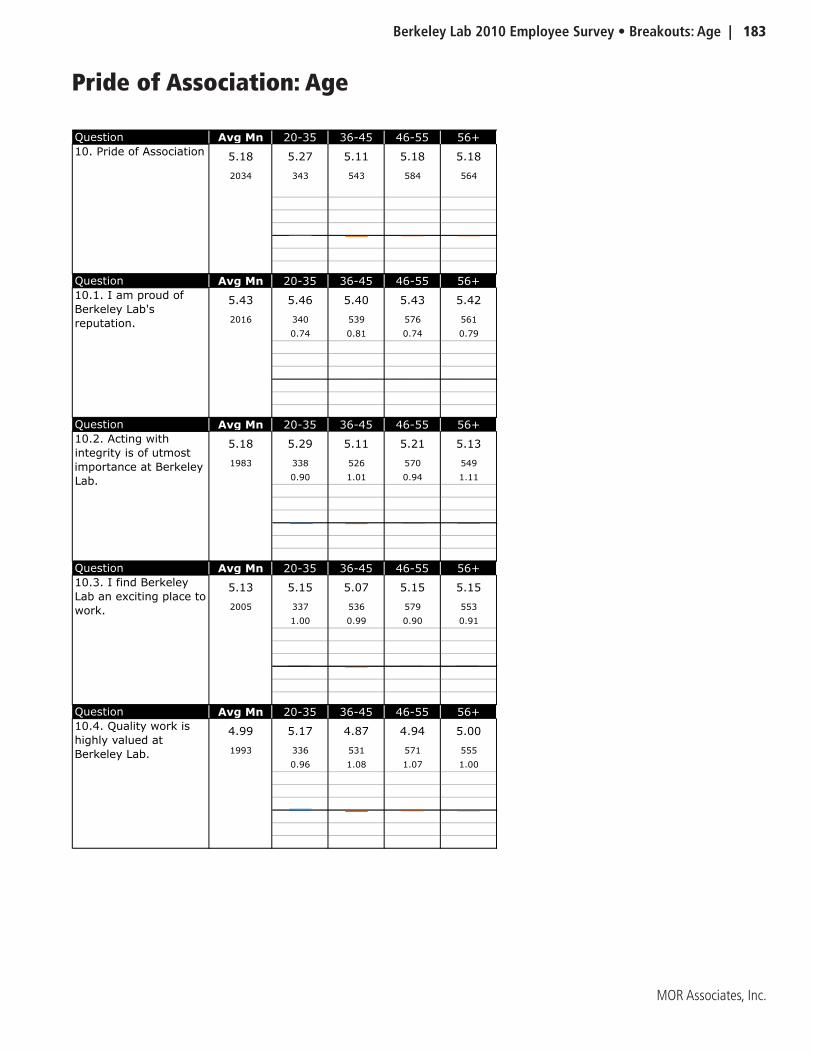
Berkeley Lab 2010 Employee Survey • Breakouts: Age | 183
MOR Associates, Inc.
Pride of Association: Age
Question Avg Mn 20-35 36-45 46-55 56+
5.18 5.27 5.11 5.18 5.18
2034 343 543 584 564
Question Avg Mn 20-35 36-45 46-55 56+
5.43 5.46 5.40 5.43 5.42
2016 340 539 576 561
0.74 0.81 0.74 0.79
Question Avg Mn 20-35 36-45 46-55 56+
5.18 5.29 5.11 5.21 5.13
1983 338 526 570 549
0.90 1.01 0.94 1.11
Question Avg Mn 20-35 36-45 46-55 56+
5.13 5.15 5.07 5.15 5.15
2005 337 536 579 553
1.00 0.99 0.90 0.91
Question Avg Mn 20-35 36-45 46-55 56+
4.99 5.17 4.87 4.94 5.00
1993 336 531 571 555
0.96 1.08 1.07 1.00
10.2. Acting with
integrity is of utmost
importance at Berkeley
Lab.
10.3. I find Berkeley
Lab an exciting place to
work.
10.4. Quality work is
highly valued at
Berkeley Lab.
10. Pride of Association
10.1. I am proud of
Berkeley Lab's
reputation.

184 | Breakouts: Age • Berkeley Lab 2010 Employee Climate Survey
MOR Associates, Inc.
Sense of Shared Mission: Age
Question Avg Mn 20-35 36-45 46-55 56+
5.11 5.18 5.05 5.11 5.12
2028 342 541 581 564
Question Avg Mn 20-35 36-45 46-55 56+
5.09 5.18 5.03 5.05 5.09
1932 325 515 551 541
0.95 1.00 0.96 0.98
Question Avg Mn 20-35 36-45 46-55 56+
5.14 5.23 5.11 5.09 5.13
1943 329 515 555 544
0.89 0.90 0.93 0.87
Question Avg Mn 20-35 36-45 46-55 56+
4.96 5.02 4.85 4.97 4.99
1979 337 527 570 545
1.01 1.02 1.01 1.00
Question Avg Mn 20-35 36-45 46-55 56+
5.27 5.27 5.21 5.34 5.27
1949 325 526 560 538
0.72 0.76 0.73 0.66
11.2. I work with
colleagues in my group
who are committed to
Berkeley Lab's mission.
11.3. Berkeley Lab's
mission has been
clearly communicated.
11.4. My work
advances Berkeley
Lab's mission.
11. Sense of Shared
Mission
11.1. The people in my
Division are committed
to Berkeley Lab's
mission.
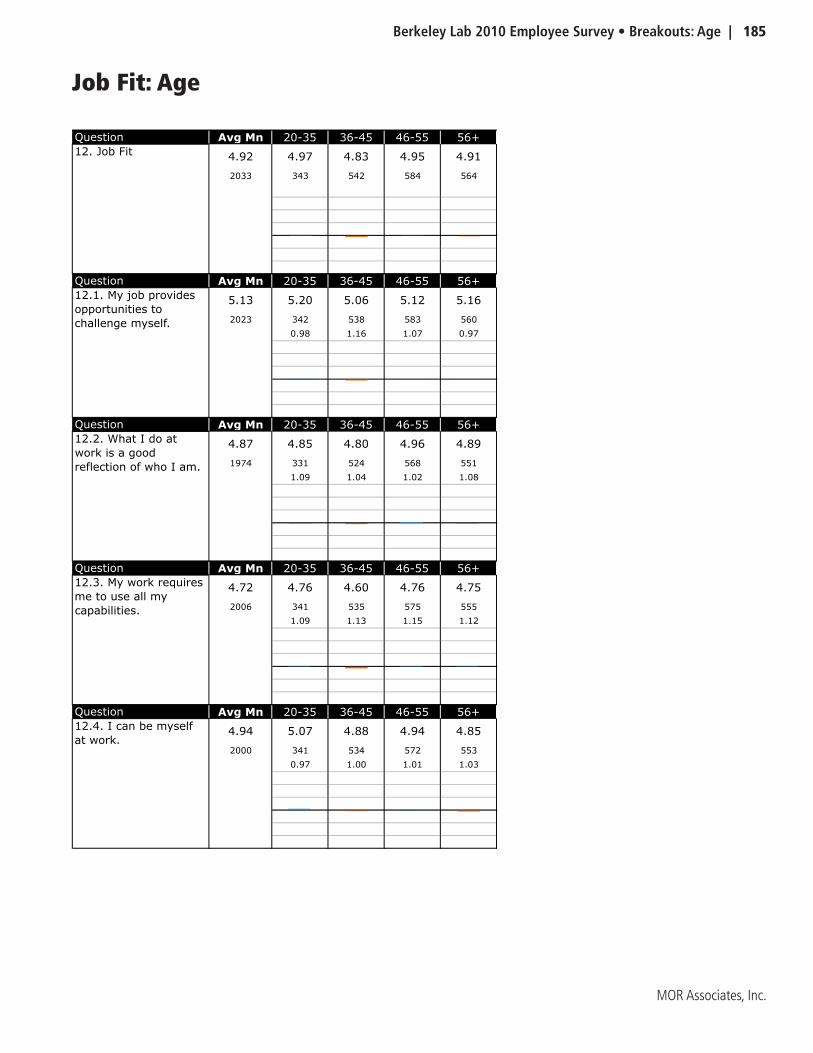
Berkeley Lab 2010 Employee Survey • Breakouts: Age | 185
MOR Associates, Inc.
Job Fit: Age
Question Avg Mn 20-35 36-45 46-55 56+
4.92 4.97 4.83 4.95 4.91
2033 343 542 584 564
Question Avg Mn 20-35 36-45 46-55 56+
5.13 5.20 5.06 5.12 5.16
2023 342 538 583 560
0.98 1.16 1.07 0.97
Question Avg Mn 20-35 36-45 46-55 56+
4.87 4.85 4.80 4.96 4.89
1974 331 524 568 551
1.09 1.04 1.02 1.08
Question Avg Mn 20-35 36-45 46-55 56+
4.72 4.76 4.60 4.76 4.75
2006 341 535 575 555
1.09 1.13 1.15 1.12
Question Avg Mn 20-35 36-45 46-55 56+
4.94 5.07 4.88 4.94 4.85
2000 341 534 572 553
0.97 1.00 1.01 1.03
12.2. What I do at
work is a good
reflection of who I am.
12.3. My work requires
me to use all my
capabilities.
12.4. I can be myself
at work.
12. Job Fit
12.1. My job provides
opportunities to
challenge myself.
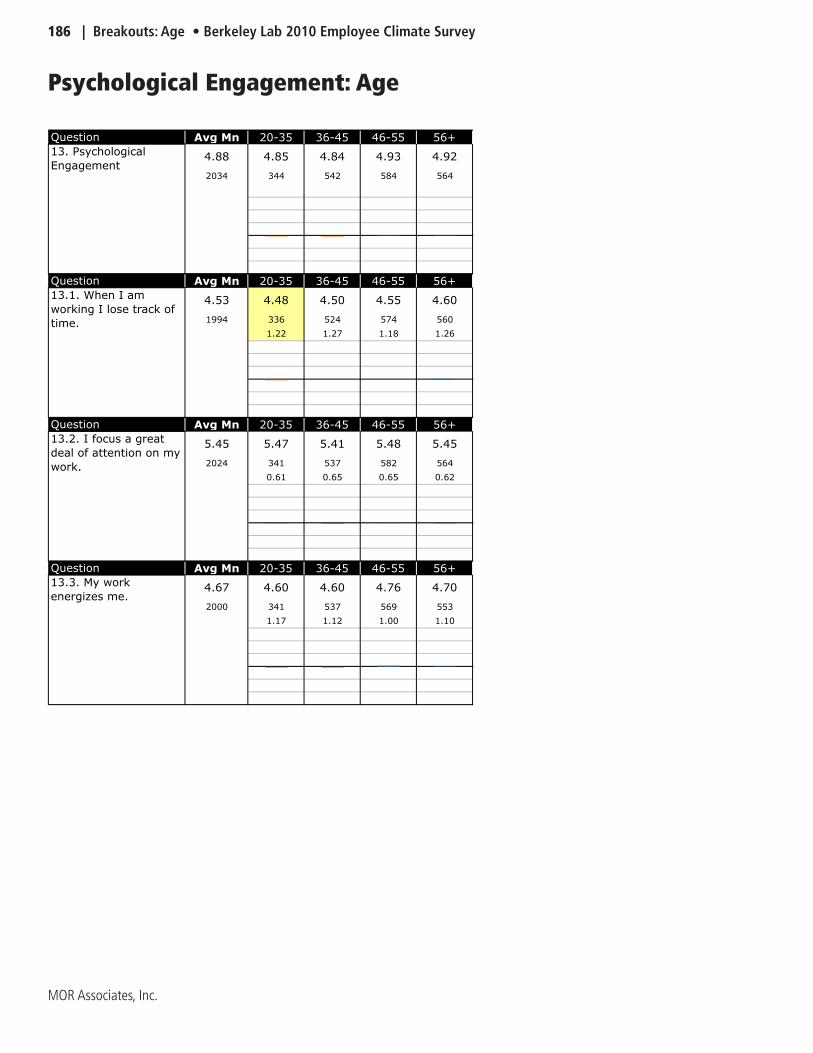
186 | Breakouts: Age • Berkeley Lab 2010 Employee Climate Survey
MOR Associates, Inc.
Psychological Engagement: Age
Question Avg Mn 20-35 36-45 46-55 56+
4.88 4.85 4.84 4.93 4.92
2034 344 542 584 564
Question Avg Mn 20-35 36-45 46-55 56+
4.53 4.48 4.50 4.55 4.60
1994 336 524 574 560
1.22 1.27 1.18 1.26
Question Avg Mn 20-35 36-45 46-55 56+
5.45 5.47 5.41 5.48 5.45
2024 341 537 582 564
0.61 0.65 0.65 0.62
Question Avg Mn 20-35 36-45 46-55 56+
4.67 4.60 4.60 4.76 4.70
2000 341 537 569 553
1.17 1.12 1.00 1.10
13. Psychological
Engagement
13.1. When I am
working I lose track of
time.
13.2. I focus a great
deal of attention on my
work.
13.3. My work
energizes me.
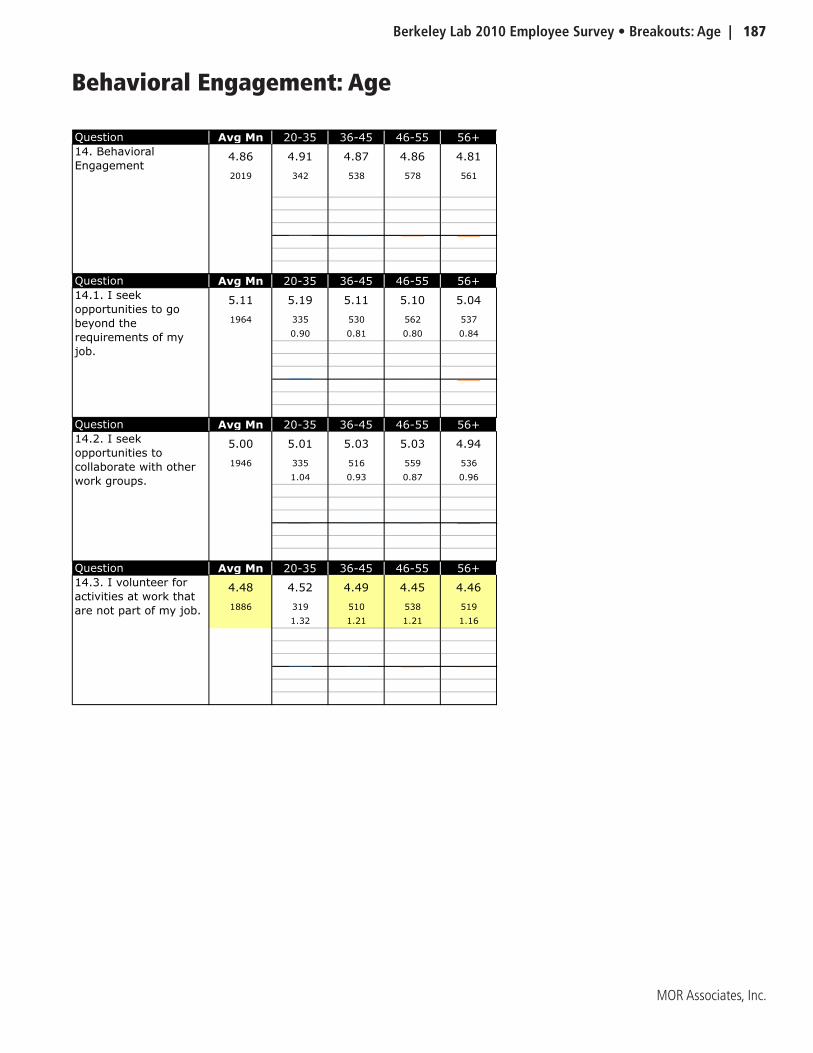
Berkeley Lab 2010 Employee Survey • Breakouts: Age | 187
MOR Associates, Inc.
Behavioral Engagement: Age
Question Avg Mn 20-35 36-45 46-55 56+
4.86 4.91 4.87 4.86 4.81
2019 342 538 578 561
Question Avg Mn 20-35 36-45 46-55 56+
5.11 5.19 5.11 5.10 5.04
1964 335 530 562 537
0.90 0.81 0.80 0.84
Question Avg Mn 20-35 36-45 46-55 56+
5.00 5.01 5.03 5.03 4.94
1946 335 516 559 536
1.04 0.93 0.87 0.96
Question Avg Mn 20-35 36-45 46-55 56+
4.48 4.52 4.49 4.45 4.46
1886 319 510 538 519
1.32 1.21 1.21 1.16
14.3. I volunteer for
activities at work that
are not part of my job.
14. Behavioral
Engagement
14.1. I seek
opportunities to go
beyond the
requirements of my
job.
14.2. I seek
opportunities to
collaborate with other
work groups.
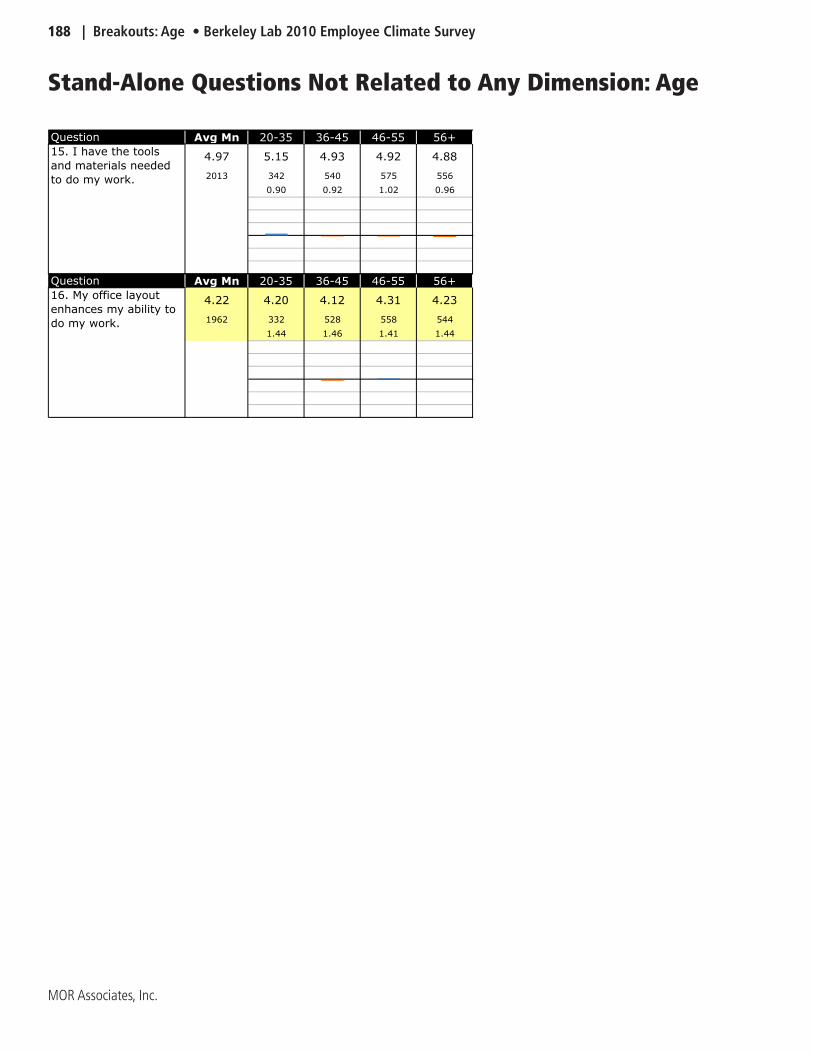
188 | Breakouts: Age • Berkeley Lab 2010 Employee Climate Survey
MOR Associates, Inc.
Stand-Alone Questions Not Related to Any Dimension: Age
Question Avg Mn 20-35 36-45 46-55 56+
4.97 5.15 4.93 4.92 4.88
2013 342 540 575 556
0.90 0.92 1.02 0.96
Question Avg Mn 20-35 36-45 46-55 56+
4.22 4.20 4.12 4.31 4.23
1962 332 528 558 544
1.44 1.46 1.41 1.44
15. I have the tools
and materials needed
to do my work.
16. My office layout
enhances my ability to
do my work.
Berkeley Lab 2010 Employee Survey • Breakouts: Years of Service | 189
MOR Associates, Inc.
Breakout Charts and Tables:
by Years of Service
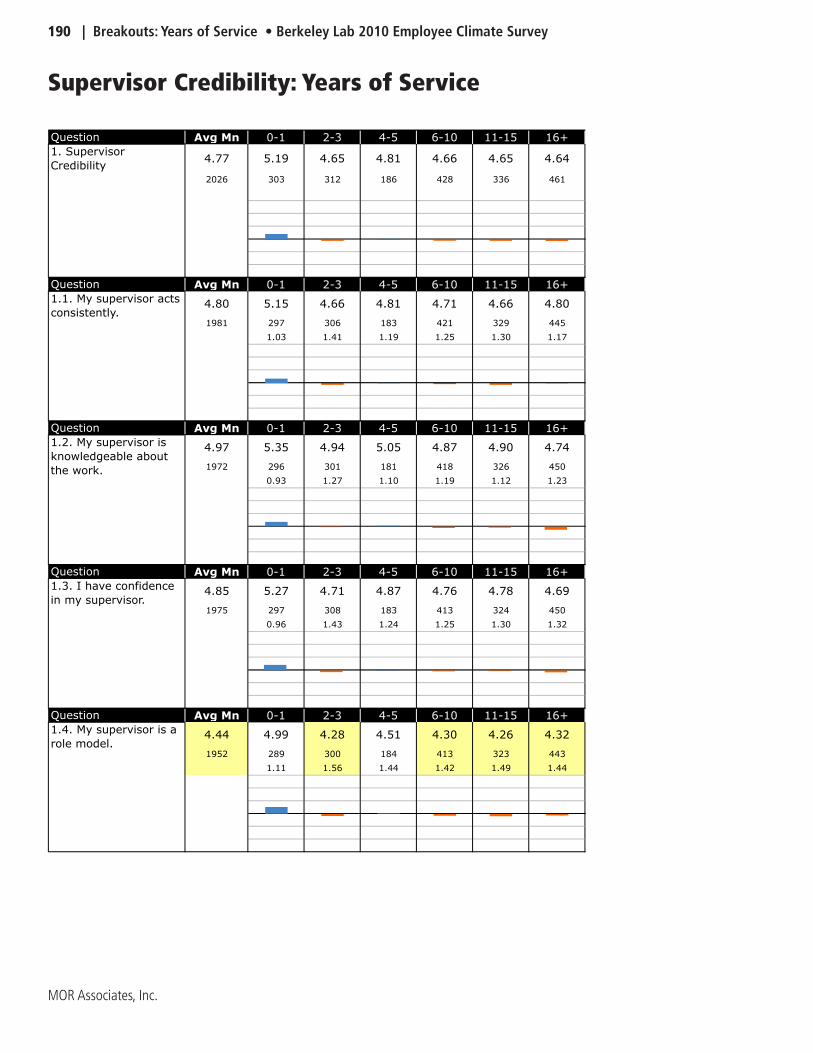
190 | Breakouts: Years of Service • Berkeley Lab 2010 Employee Climate Survey
MOR Associates, Inc.
Supervisor Credibility: Years of Service
Question Avg Mn 0-1 2-3 4-5 6-10 11-15 16+
4.77 5.19 4.65 4.81 4.66 4.65 4.64
2026 303 312 186 428 336 461
Question Avg Mn 0-1 2-3 4-5 6-10 11-15 16+
4.80 5.15 4.66 4.81 4.71 4.66 4.80
1981 297 306 183 421 329 445
1.03 1.41 1.19 1.25 1.30 1.17
Question Avg Mn 0-1 2-3 4-5 6-10 11-15 16+
4.97 5.35 4.94 5.05 4.87 4.90 4.74
1972 296 301 181 418 326 450
0.93 1.27 1.10 1.19 1.12 1.23
Question Avg Mn 0-1 2-3 4-5 6-10 11-15 16+
4.85 5.27 4.71 4.87 4.76 4.78 4.69
1975 297 308 183 413 324 450
0.96 1.43 1.24 1.25 1.30 1.32
Question Avg Mn 0-1 2-3 4-5 6-10 11-15 16+
4.44 4.99 4.28 4.51 4.30 4.26 4.32
1952 289 300 184 413 323 443
1.11 1.56 1.44 1.42 1.49 1.44
1. Supervisor
Credibility
1.1. My supervisor acts
consistently.
1.2. My supervisor is
knowledgeable about
the work.
1.3. I have confidence
in my supervisor.
1.4. My supervisor is a
role model.

Berkeley Lab 2010 Employee Survey • Breakouts: Years of Service | 191
MOR Associates, Inc.
Supervisor Accountability Focus: Years of Service
Question Avg Mn 0-1 2-3 4-5 6-10 11-15 16+
4.74 5.06 4.65 4.84 4.65 4.64 4.62
2007 301 309 185 424 332 456
Question Avg Mn 0-1 2-3 4-5 6-10 11-15 16+
4.78 4.98 4.65 4.97 4.72 4.67 4.69
1889 280 297 177 403 309 423
0.94 1.22 0.99 1.15 1.07 1.09
Question Avg Mn 0-1 2-3 4-5 6-10 11-15 16+
4.70 5.06 4.62 4.71 4.61 4.59 4.60
1931 292 300 181 407 321 430
0.98 1.33 1.19 1.23 1.20 1.20
Question Avg Mn 0-1 2-3 4-5 6-10 11-15 16+
4.78 5.05 4.68 4.90 4.68 4.71 4.69
1910 283 297 181 400 313 436
0.98 1.25 1.08 1.14 1.06 1.14
Question Avg Mn 0-1 2-3 4-5 6-10 11-15 16+
4.72 5.15 4.64 4.80 4.60 4.60 4.51
1956 287 302 185 410 329 443
0.94 1.30 1.07 1.26 1.23 1.31
2. Supervisor
Accountability Focus
2.1. My supervisor
holds people
accountable for
meeting deadlines.
2.2. My supervisor
strives to improve the
performance of my
work group.
2.3. My supervisor
holds people
accountable for
producing quality work.
2.4. My supervisor
monitors progress
toward stated goals.
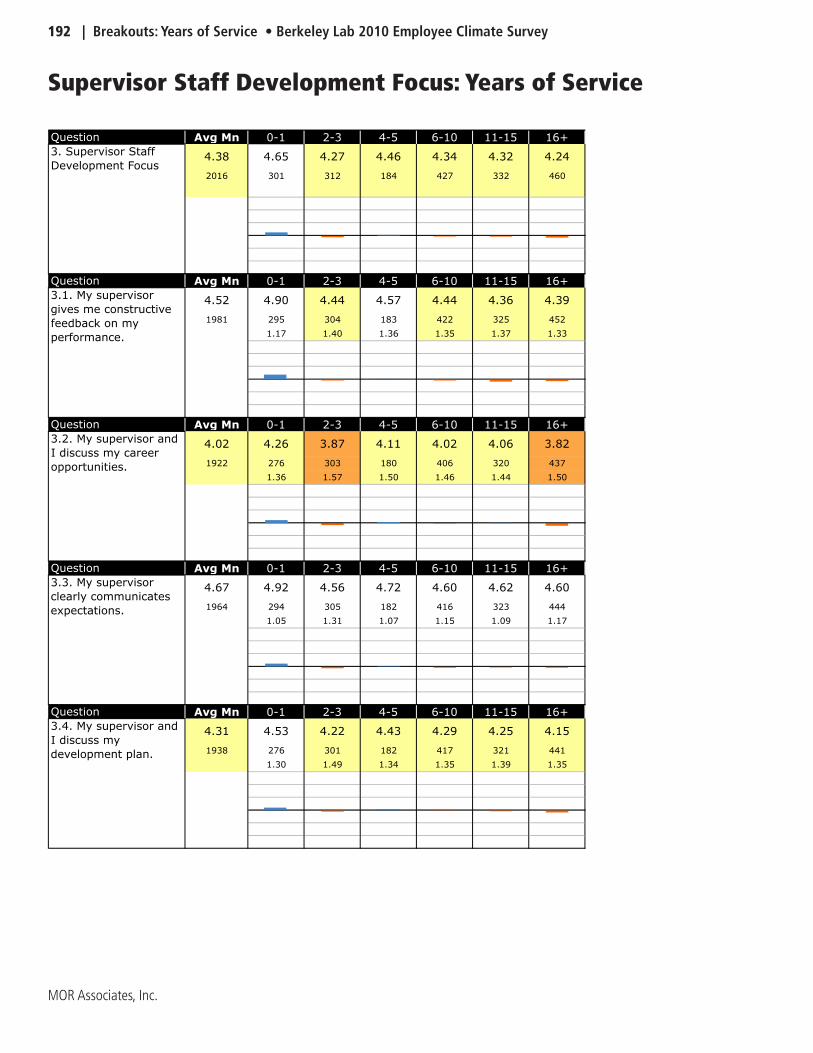
192 | Breakouts: Years of Service • Berkeley Lab 2010 Employee Climate Survey
MOR Associates, Inc.
Supervisor Staff Development Focus: Years of Service
Question Avg Mn 0-1 2-3 4-5 6-10 11-15 16+
4.38 4.65 4.27 4.46 4.34 4.32 4.24
2016 301 312 184 427 332 460
Question Avg Mn 0-1 2-3 4-5 6-10 11-15 16+
4.52 4.90 4.44 4.57 4.44 4.36 4.39
1981 295 304 183 422 325 452
1.17 1.40 1.36 1.35 1.37 1.33
Question Avg Mn 0-1 2-3 4-5 6-10 11-15 16+
4.02 4.26 3.87 4.11 4.02 4.06 3.82
1922 276 303 180 406 320 437
1.36 1.57 1.50 1.46 1.44 1.50
Question Avg Mn 0-1 2-3 4-5 6-10 11-15 16+
4.67 4.92 4.56 4.72 4.60 4.62 4.60
1964 294 305 182 416 323 444
1.05 1.31 1.07 1.15 1.09 1.17
Question Avg Mn 0-1 2-3 4-5 6-10 11-15 16+
4.31 4.53 4.22 4.43 4.29 4.25 4.15
1938 276 301 182 417 321 441
1.30 1.49 1.34 1.35 1.39 1.35
3. Supervisor Staff
Development Focus
3.1. My supervisor
gives me constructive
feedback on my
performance.
3.2. My supervisor and
I discuss my career
opportunities.
3.3. My supervisor
clearly communicates
expectations.
3.4. My supervisor and
I discuss my
development plan.
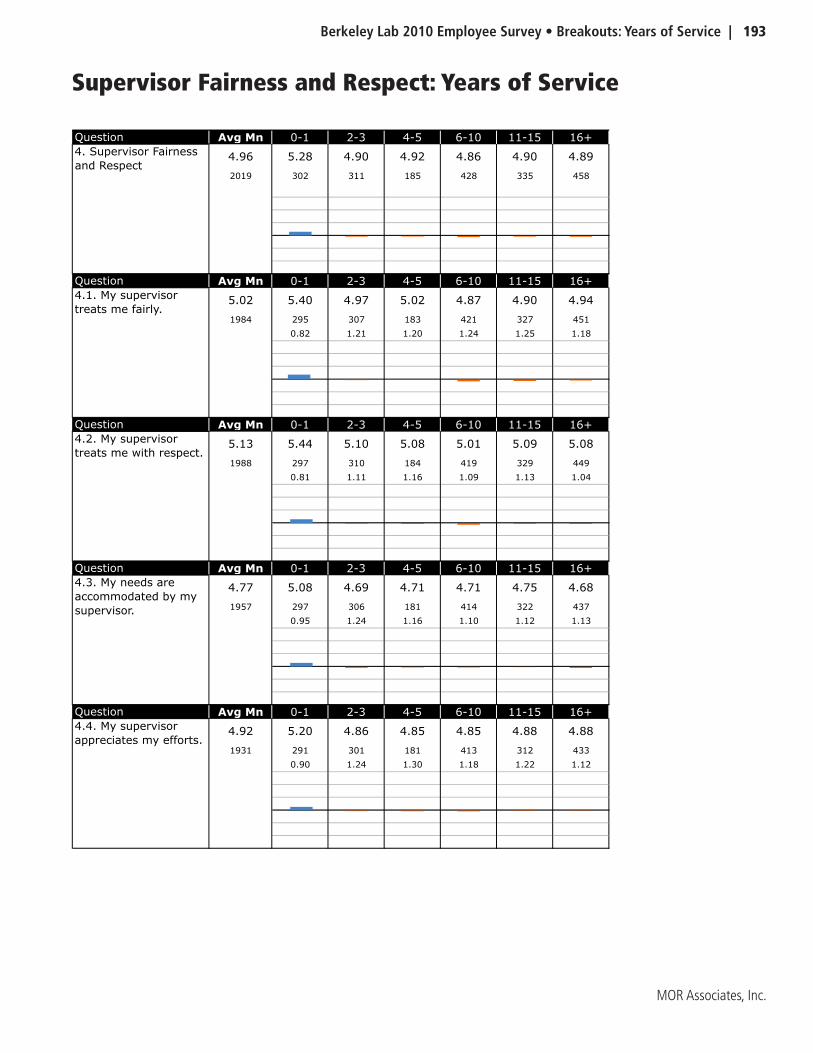
Berkeley Lab 2010 Employee Survey • Breakouts: Years of Service | 193
MOR Associates, Inc.
Supervisor Fairness and Respect: Years of Service
Question Avg Mn 0-1 2-3 4-5 6-10 11-15 16+
4.96 5.28 4.90 4.92 4.86 4.90 4.89
2019 302 311 185 428 335 458
Question Avg Mn 0-1 2-3 4-5 6-10 11-15 16+
5.02 5.40 4.97 5.02 4.87 4.90 4.94
1984 295 307 183 421 327 451
0.82 1.21 1.20 1.24 1.25 1.18
Question Avg Mn 0-1 2-3 4-5 6-10 11-15 16+
5.13 5.44 5.10 5.08 5.01 5.09 5.08
1988 297 310 184 419 329 449
0.81 1.11 1.16 1.09 1.13 1.04
Question Avg Mn 0-1 2-3 4-5 6-10 11-15 16+
4.77 5.08 4.69 4.71 4.71 4.75 4.68
1957 297 306 181 414 322 437
0.95 1.24 1.16 1.10 1.12 1.13
Question Avg Mn 0-1 2-3 4-5 6-10 11-15 16+
4.92 5.20 4.86 4.85 4.85 4.88 4.88
1931 291 301 181 413 312 433
0.90 1.24 1.30 1.18 1.22 1.12
4. Supervisor Fairness
and Respect
4.1. My supervisor
treats me fairly.
4.2. My supervisor
treats me with respect.
4.3. My needs are
accommodated by my
supervisor.
4.4. My supervisor
appreciates my efforts.
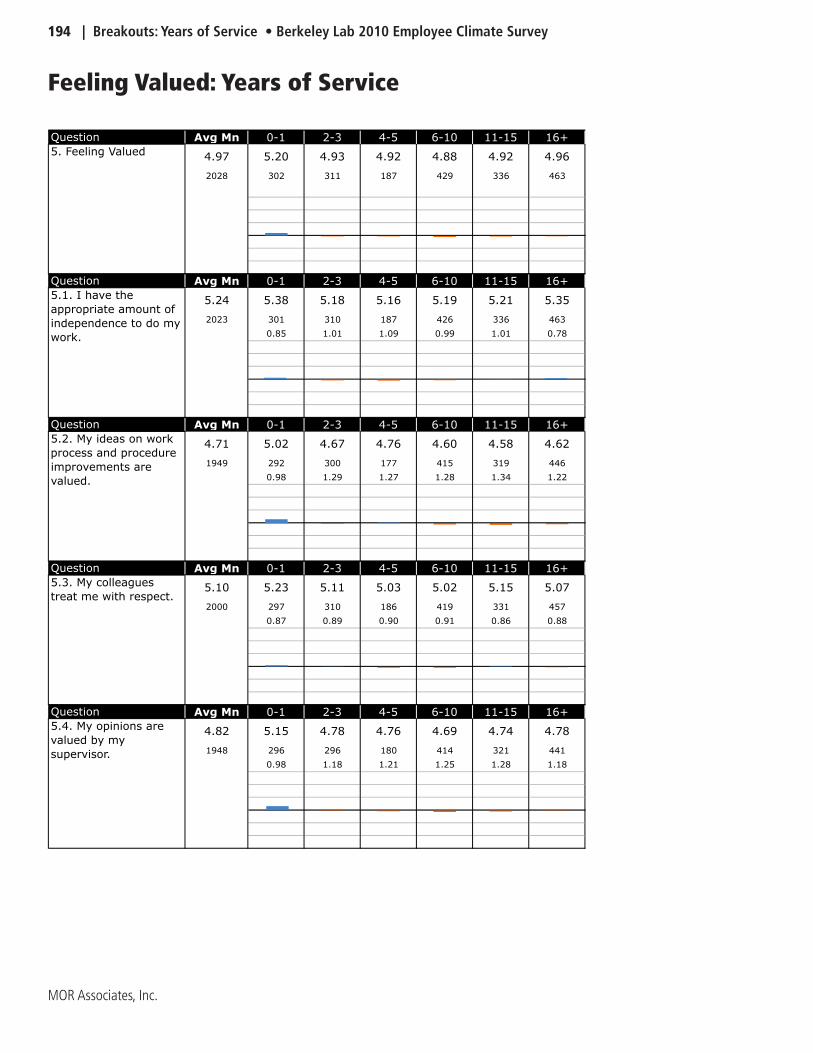
194 | Breakouts: Years of Service • Berkeley Lab 2010 Employee Climate Survey
MOR Associates, Inc.
Feeling Valued: Years of Service
Question Avg Mn 0-1 2-3 4-5 6-10 11-15 16+
4.97 5.20 4.93 4.92 4.88 4.92 4.96
2028 302 311 187 429 336 463
Question Avg Mn 0-1 2-3 4-5 6-10 11-15 16+
5.24 5.38 5.18 5.16 5.19 5.21 5.35
2023 301 310 187 426 336 463
0.85 1.01 1.09 0.99 1.01 0.78
Question Avg Mn 0-1 2-3 4-5 6-10 11-15 16+
4.71 5.02 4.67 4.76 4.60 4.58 4.62
1949 292 300 177 415 319 446
0.98 1.29 1.27 1.28 1.34 1.22
Question Avg Mn 0-1 2-3 4-5 6-10 11-15 16+
5.10 5.23 5.11 5.03 5.02 5.15 5.07
2000 297 310 186 419 331 457
0.87 0.89 0.90 0.91 0.86 0.88
Question Avg Mn 0-1 2-3 4-5 6-10 11-15 16+
4.82 5.15 4.78 4.76 4.69 4.74 4.78
1948 296 296 180 414 321 441
0.98 1.18 1.21 1.25 1.28 1.18
5. Feeling Valued
5.1. I have the
appropriate amount of
independence to do my
work.
5.2. My ideas on work
process and procedure
improvements are
valued.
5.3. My colleagues
treat me with respect.
5.4. My opinions are
valued by my
supervisor.
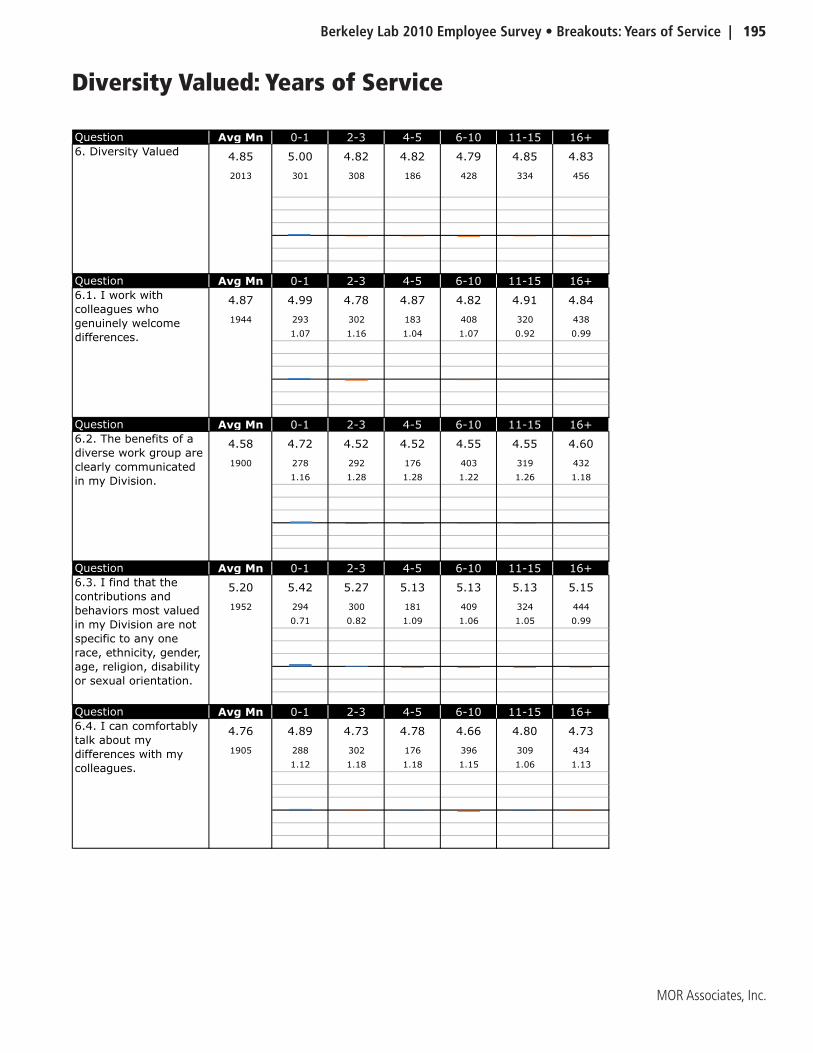
Berkeley Lab 2010 Employee Survey • Breakouts: Years of Service | 195
MOR Associates, Inc.
Diversity Valued: Years of Service
Question Avg Mn 0-1 2-3 4-5 6-10 11-15 16+
4.85 5.00 4.82 4.82 4.79 4.85 4.83
2013 301 308 186 428 334 456
Question Avg Mn 0-1 2-3 4-5 6-10 11-15 16+
4.87 4.99 4.78 4.87 4.82 4.91 4.84
1944 293 302 183 408 320 438
1.07 1.16 1.04 1.07 0.92 0.99
Question Avg Mn 0-1 2-3 4-5 6-10 11-15 16+
4.58 4.72 4.52 4.52 4.55 4.55 4.60
1900 278 292 176 403 319 432
1.16 1.28 1.28 1.22 1.26 1.18
Question Avg Mn 0-1 2-3 4-5 6-10 11-15 16+
5.20 5.42 5.27 5.13 5.13 5.13 5.15
1952 294 300 181 409 324 444
0.71 0.82 1.09 1.06 1.05 0.99
Question Avg Mn 0-1 2-3 4-5 6-10 11-15 16+
4.76 4.89 4.73 4.78 4.66 4.80 4.73
1905 288 302 176 396 309 434
1.12 1.18 1.18 1.15 1.06 1.13
6. Diversity Valued
6.1. I work with
colleagues who
genuinely welcome
differences.
6.2. The benefits of a
diverse work group are
clearly communicated
in my Division.
6.3. I find that the
contributions and
behaviors most valued
in my Division are not
specific to any one
race, ethnicity, gender,
age, religion, disability
or sexual orientation.
6.4. I can comfortably
talk about my
differences with my
colleagues.
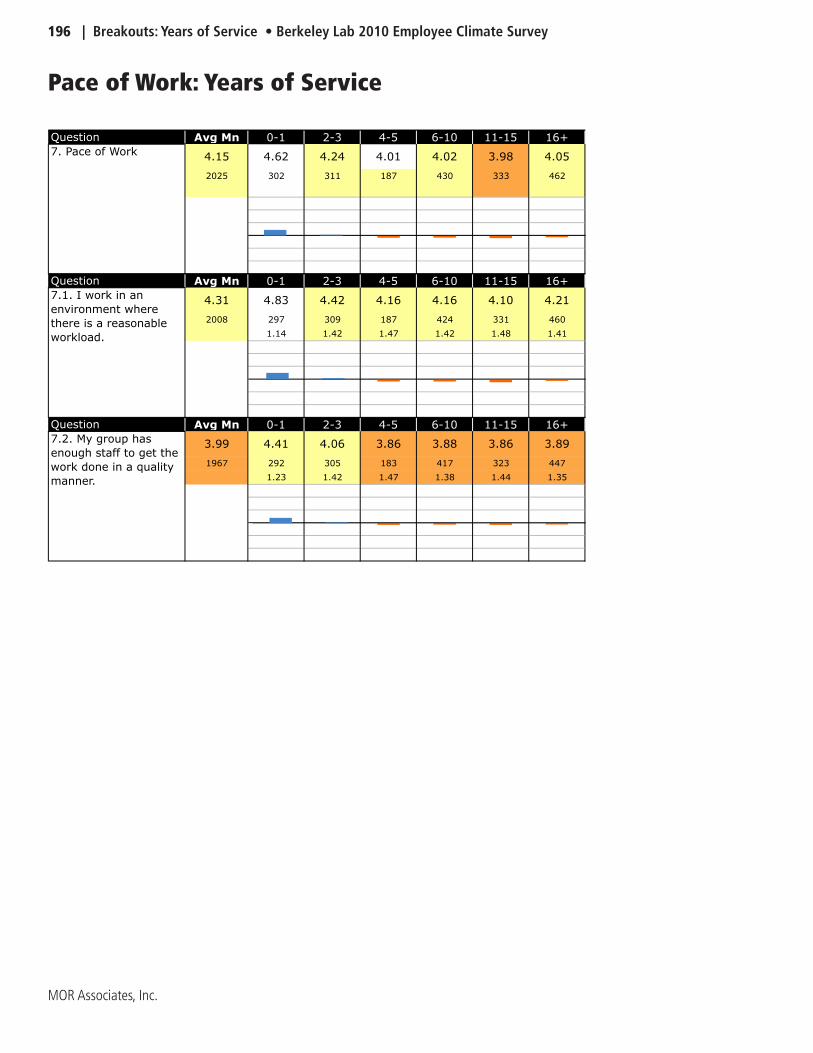
196 | Breakouts: Years of Service • Berkeley Lab 2010 Employee Climate Survey
MOR Associates, Inc.
Pace of Work: Years of Service
Question Avg Mn 0-1 2-3 4-5 6-10 11-15 16+
4.15 4.62 4.24 4.01 4.02 3.98 4.05
2025 302 311 187 430 333 462
Question Avg Mn 0-1 2-3 4-5 6-10 11-15 16+
4.31 4.83 4.42 4.16 4.16 4.10 4.21
2008 297 309 187 424 331 460
1.14 1.42 1.47 1.42 1.48 1.41
Question Avg Mn 0-1 2-3 4-5 6-10 11-15 16+
3.99 4.41 4.06 3.86 3.88 3.86 3.89
1967 292 305 183 417 323 447
1.23 1.42 1.47 1.38 1.44 1.35
7. Pace of Work
7.1. I work in an
environment where
there is a reasonable
workload.
7.2. My group has
enough staff to get the
work done in a quality
manner.
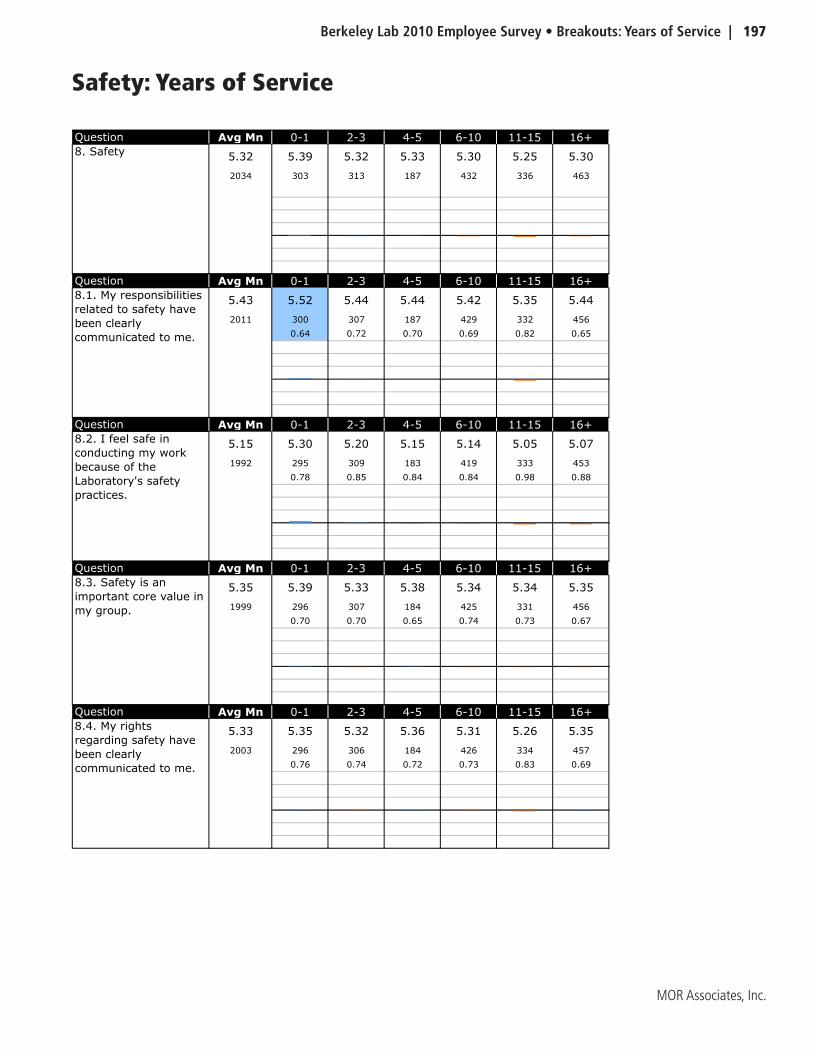
Berkeley Lab 2010 Employee Survey • Breakouts: Years of Service | 197
MOR Associates, Inc.
Safety: Years of Service
Question Avg Mn 0-1 2-3 4-5 6-10 11-15 16+
5.32 5.39 5.32 5.33 5.30 5.25 5.30
2034 303 313 187 432 336 463
Question Avg Mn 0-1 2-3 4-5 6-10 11-15 16+
5.43 5.52 5.44 5.44 5.42 5.35 5.44
2011 300 307 187 429 332 456
0.64 0.72 0.70 0.69 0.82 0.65
Question Avg Mn 0-1 2-3 4-5 6-10 11-15 16+
5.15 5.30 5.20 5.15 5.14 5.05 5.07
1992 295 309 183 419 333 453
0.78 0.85 0.84 0.84 0.98 0.88
Question Avg Mn 0-1 2-3 4-5 6-10 11-15 16+
5.35 5.39 5.33 5.38 5.34 5.34 5.35
1999 296 307 184 425 331 456
0.70 0.70 0.65 0.74 0.73 0.67
Question Avg Mn 0-1 2-3 4-5 6-10 11-15 16+
5.33 5.35 5.32 5.36 5.31 5.26 5.35
2003 296 306 184 426 334 457
0.76 0.74 0.72 0.73 0.83 0.69
8.2. I feel safe in
conducting my work
because of the
Laboratory's safety
practices.
8.3. Safety is an
important core value in
my group.
8.4. My rights
regarding safety have
been clearly
communicated to me.
8. Safety
8.1. My responsibilities
related to safety have
been clearly
communicated to me.
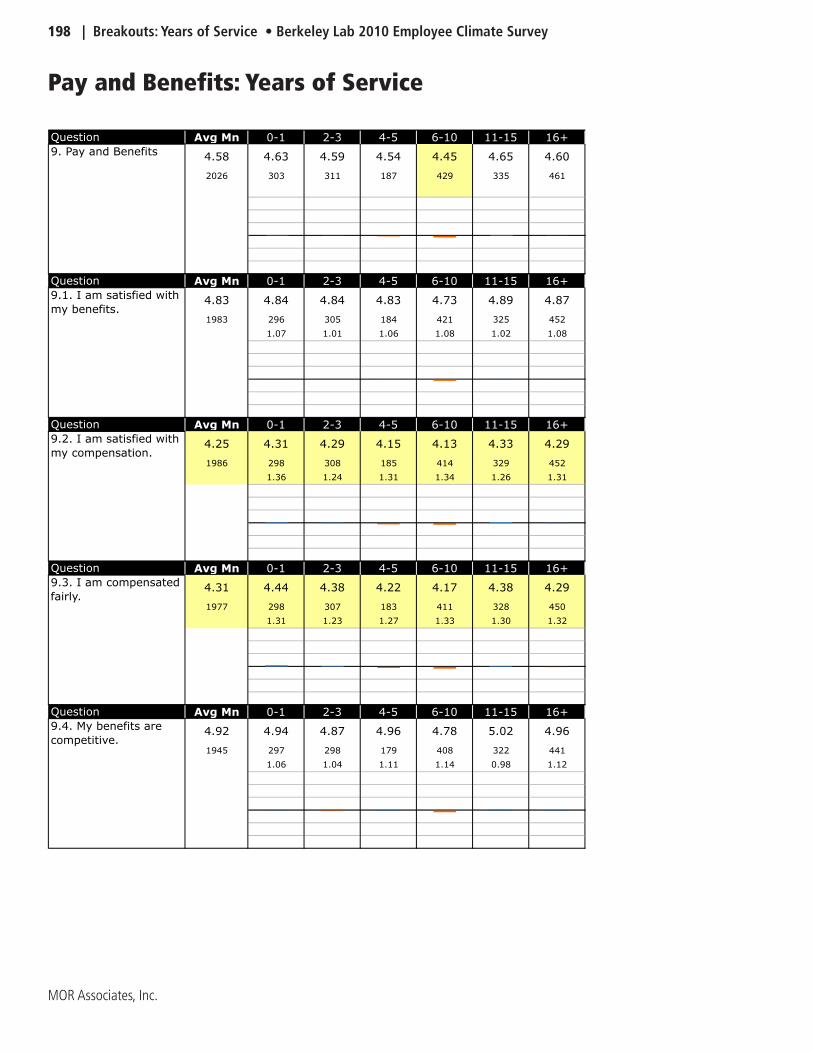
198 | Breakouts: Years of Service • Berkeley Lab 2010 Employee Climate Survey
MOR Associates, Inc.
Pay and Benefits: Years of Service
Question Avg Mn 0-1 2-3 4-5 6-10 11-15 16+
4.58 4.63 4.59 4.54 4.45 4.65 4.60
2026 303 311 187 429 335 461
Question Avg Mn 0-1 2-3 4-5 6-10 11-15 16+
4.83 4.84 4.84 4.83 4.73 4.89 4.87
1983 296 305 184 421 325 452
1.07 1.01 1.06 1.08 1.02 1.08
Question Avg Mn 0-1 2-3 4-5 6-10 11-15 16+
4.25 4.31 4.29 4.15 4.13 4.33 4.29
1986 298 308 185 414 329 452
1.36 1.24 1.31 1.34 1.26 1.31
Question Avg Mn 0-1 2-3 4-5 6-10 11-15 16+
4.31 4.44 4.38 4.22 4.17 4.38 4.29
1977 298 307 183 411 328 450
1.31 1.23 1.27 1.33 1.30 1.32
Question Avg Mn 0-1 2-3 4-5 6-10 11-15 16+
4.92 4.94 4.87 4.96 4.78 5.02 4.96
1945 297 298 179 408 322 441
1.06 1.04 1.11 1.14 0.98 1.12
9.4. My benefits are
competitive.
9. Pay and Benefits
9.1. I am satisfied with
my benefits.
9.2. I am satisfied with
my compensation.
9.3. I am compensated
fairly.
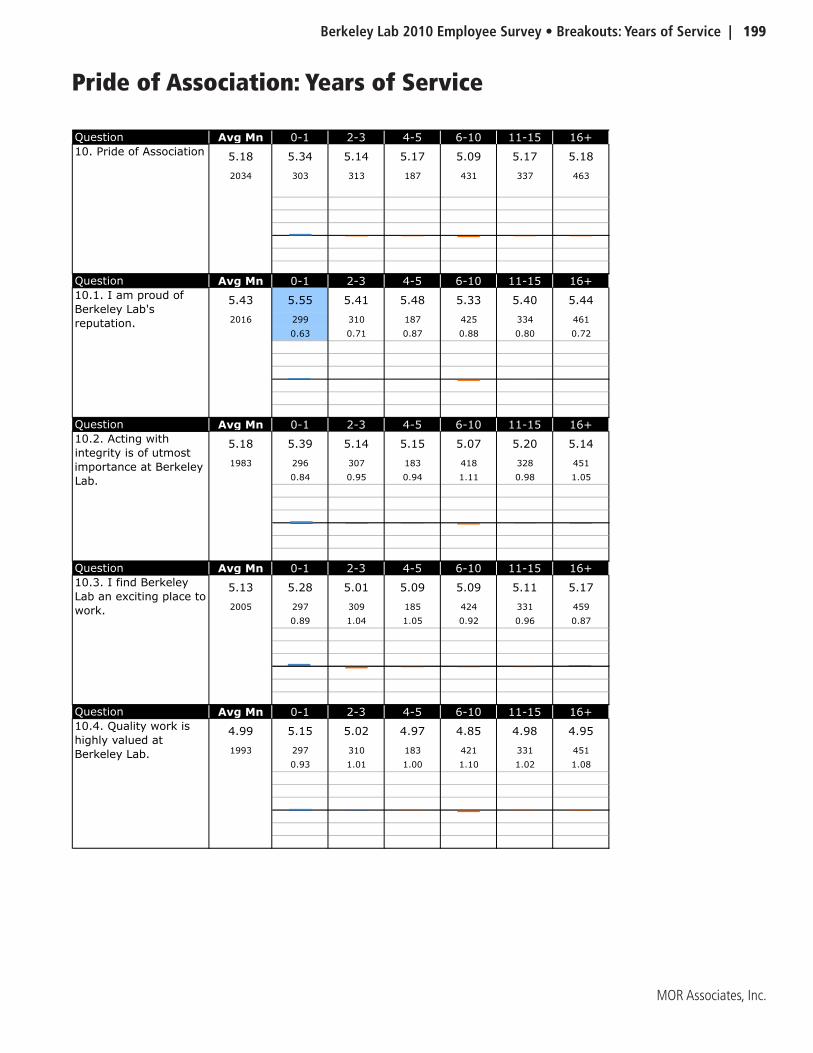
Berkeley Lab 2010 Employee Survey • Breakouts: Years of Service | 199
MOR Associates, Inc.
Pride of Association: Years of Service
Question Avg Mn 0-1 2-3 4-5 6-10 11-15 16+
5.18 5.34 5.14 5.17 5.09 5.17 5.18
2034 303 313 187 431 337 463
Question Avg Mn 0-1 2-3 4-5 6-10 11-15 16+
5.43 5.55 5.41 5.48 5.33 5.40 5.44
2016 299 310 187 425 334 461
0.63 0.71 0.87 0.88 0.80 0.72
Question Avg Mn 0-1 2-3 4-5 6-10 11-15 16+
5.18 5.39 5.14 5.15 5.07 5.20 5.14
1983 296 307 183 418 328 451
0.84 0.95 0.94 1.11 0.98 1.05
Question Avg Mn 0-1 2-3 4-5 6-10 11-15 16+
5.13 5.28 5.01 5.09 5.09 5.11 5.17
2005 297 309 185 424 331 459
0.89 1.04 1.05 0.92 0.96 0.87
Question Avg Mn 0-1 2-3 4-5 6-10 11-15 16+
4.99 5.15 5.02 4.97 4.85 4.98 4.95
1993 297 310 183 421 331 451
0.93 1.01 1.00 1.10 1.02 1.08
10.2. Acting with
integrity is of utmost
importance at Berkeley
Lab.
10.3. I find Berkeley
Lab an exciting place to
work.
10.4. Quality work is
highly valued at
Berkeley Lab.
10. Pride of Association
10.1. I am proud of
Berkeley Lab's
reputation.
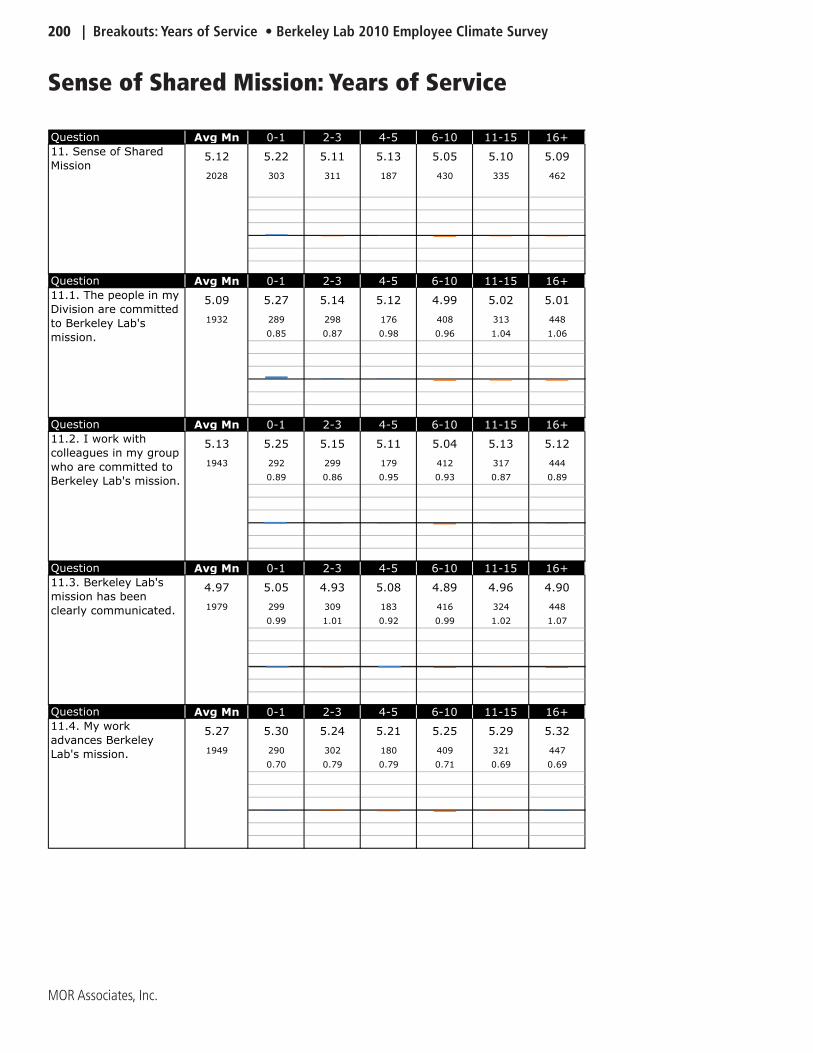
200 | Breakouts: Years of Service • Berkeley Lab 2010 Employee Climate Survey
MOR Associates, Inc.
Sense of Shared Mission: Years of Service
Question Avg Mn 0-1 2-3 4-5 6-10 11-15 16+
5.12 5.22 5.11 5.13 5.05 5.10 5.09
2028 303 311 187 430 335 462
Question Avg Mn 0-1 2-3 4-5 6-10 11-15 16+
5.09 5.27 5.14 5.12 4.99 5.02 5.01
1932 289 298 176 408 313 448
0.85 0.87 0.98 0.96 1.04 1.06
Question Avg Mn 0-1 2-3 4-5 6-10 11-15 16+
5.13 5.25 5.15 5.11 5.04 5.13 5.12
1943 292 299 179 412 317 444
0.89 0.86 0.95 0.93 0.87 0.89
Question Avg Mn 0-1 2-3 4-5 6-10 11-15 16+
4.97 5.05 4.93 5.08 4.89 4.96 4.90
1979 299 309 183 416 324 448
0.99 1.01 0.92 0.99 1.02 1.07
Question Avg Mn 0-1 2-3 4-5 6-10 11-15 16+
5.27 5.30 5.24 5.21 5.25 5.29 5.32
1949 290 302 180 409 321 447
0.70 0.79 0.79 0.71 0.69 0.69
11.2. I work with
colleagues in my group
who are committed to
Berkeley Lab's mission.
11.3. Berkeley Lab's
mission has been
clearly communicated.
11.4. My work
advances Berkeley
Lab's mission.
11. Sense of Shared
Mission
11.1. The people in my
Division are committed
to Berkeley Lab's
mission.
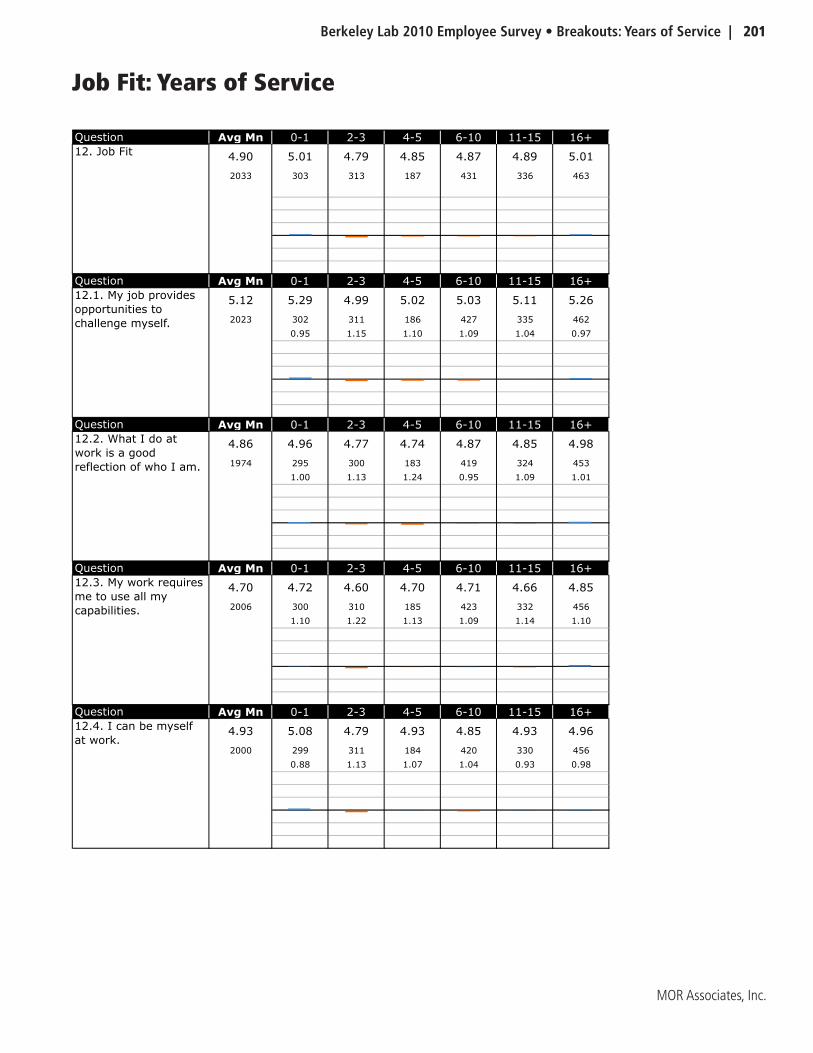
Berkeley Lab 2010 Employee Survey • Breakouts: Years of Service | 201
MOR Associates, Inc.
Job Fit: Years of Service
Question Avg Mn 0-1 2-3 4-5 6-10 11-15 16+
4.90 5.01 4.79 4.85 4.87 4.89 5.01
2033 303 313 187 431 336 463
Question Avg Mn 0-1 2-3 4-5 6-10 11-15 16+
5.12 5.29 4.99 5.02 5.03 5.11 5.26
2023 302 311 186 427 335 462
0.95 1.15 1.10 1.09 1.04 0.97
Question Avg Mn 0-1 2-3 4-5 6-10 11-15 16+
4.86 4.96 4.77 4.74 4.87 4.85 4.98
1974 295 300 183 419 324 453
1.00 1.13 1.24 0.95 1.09 1.01
Question Avg Mn 0-1 2-3 4-5 6-10 11-15 16+
4.70 4.72 4.60 4.70 4.71 4.66 4.85
2006 300 310 185 423 332 456
1.10 1.22 1.13 1.09 1.14 1.10
Question Avg Mn 0-1 2-3 4-5 6-10 11-15 16+
4.93 5.08 4.79 4.93 4.85 4.93 4.96
2000 299 311 184 420 330 456
0.88 1.13 1.07 1.04 0.93 0.98
12.2. What I do at
work is a good
reflection of who I am.
12.3. My work requires
me to use all my
capabilities.
12.4. I can be myself
at work.
12. Job Fit
12.1. My job provides
opportunities to
challenge myself.
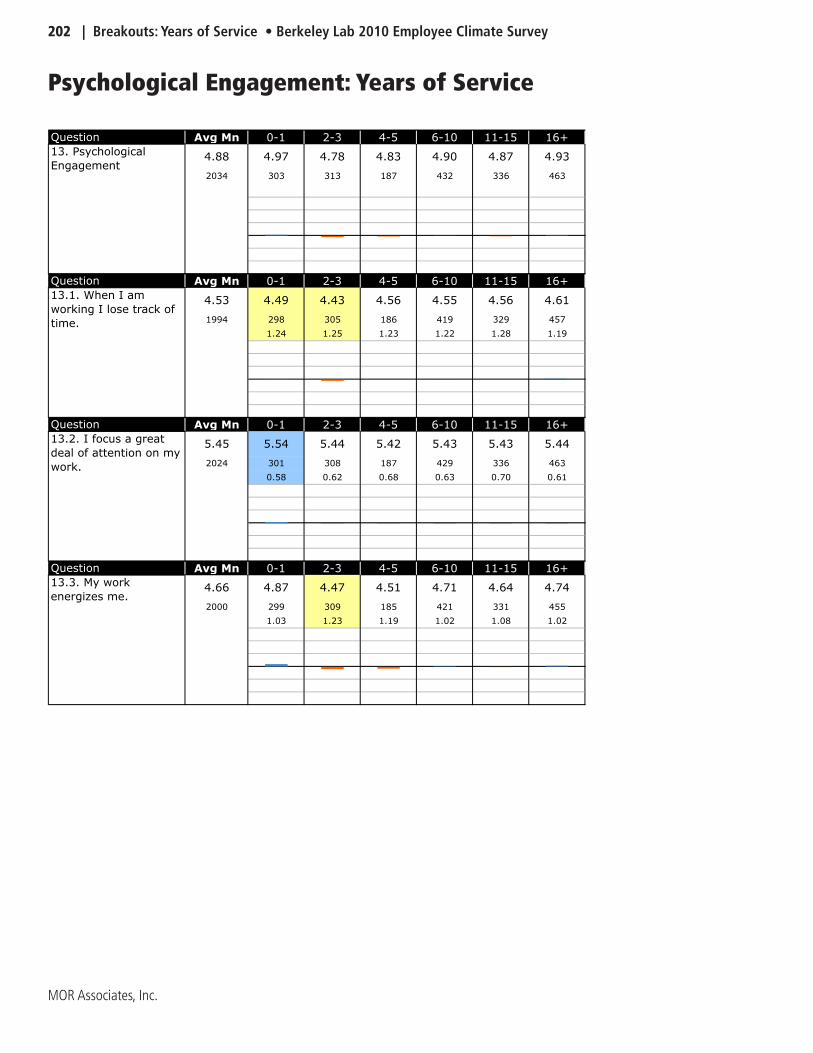
202 | Breakouts: Years of Service • Berkeley Lab 2010 Employee Climate Survey
MOR Associates, Inc.
Psychological Engagement: Years of Service
Question Avg Mn 0-1 2-3 4-5 6-10 11-15 16+
4.88 4.97 4.78 4.83 4.90 4.87 4.93
2034 303 313 187 432 336 463
Question Avg Mn 0-1 2-3 4-5 6-10 11-15 16+
4.53 4.49 4.43 4.56 4.55 4.56 4.61
1994 298 305 186 419 329 457
1.24 1.25 1.23 1.22 1.28 1.19
Question Avg Mn 0-1 2-3 4-5 6-10 11-15 16+
5.45 5.54 5.44 5.42 5.43 5.43 5.44
2024 301 308 187 429 336 463
0.58 0.62 0.68 0.63 0.70 0.61
Question Avg Mn 0-1 2-3 4-5 6-10 11-15 16+
4.66 4.87 4.47 4.51 4.71 4.64 4.74
2000 299 309 185 421 331 455
1.03 1.23 1.19 1.02 1.08 1.02
13. Psychological
Engagement
13.1. When I am
working I lose track of
time.
13.2. I focus a great
deal of attention on my
work.
13.3. My work
energizes me.
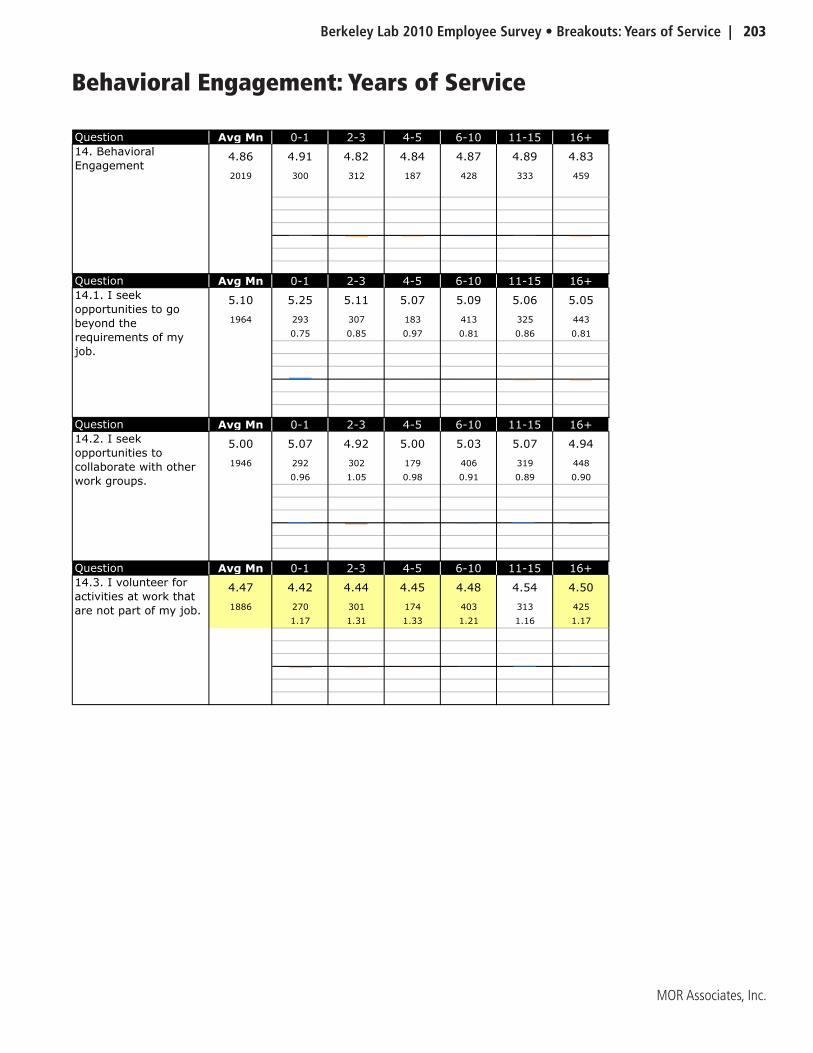
Berkeley Lab 2010 Employee Survey • Breakouts: Years of Service | 203
MOR Associates, Inc.
Behavioral Engagement: Years of Service
Question Avg Mn 0-1 2-3 4-5 6-10 11-15 16+
4.86 4.91 4.82 4.84 4.87 4.89 4.83
2019 300 312 187 428 333 459
Question Avg Mn 0-1 2-3 4-5 6-10 11-15 16+
5.10 5.25 5.11 5.07 5.09 5.06 5.05
1964 293 307 183 413 325 443
0.75 0.85 0.97 0.81 0.86 0.81
Question Avg Mn 0-1 2-3 4-5 6-10 11-15 16+
5.00 5.07 4.92 5.00 5.03 5.07 4.94
1946 292 302 179 406 319 448
0.96 1.05 0.98 0.91 0.89 0.90
Question Avg Mn 0-1 2-3 4-5 6-10 11-15 16+
4.47 4.42 4.44 4.45 4.48 4.54 4.50
1886 270 301 174 403 313 425
1.17 1.31 1.33 1.21 1.16 1.17
14.3. I volunteer for
activities at work that
are not part of my job.
14. Behavioral
Engagement
14.1. I seek
opportunities to go
beyond the
requirements of my
job.
14.2. I seek
opportunities to
collaborate with other
work groups.
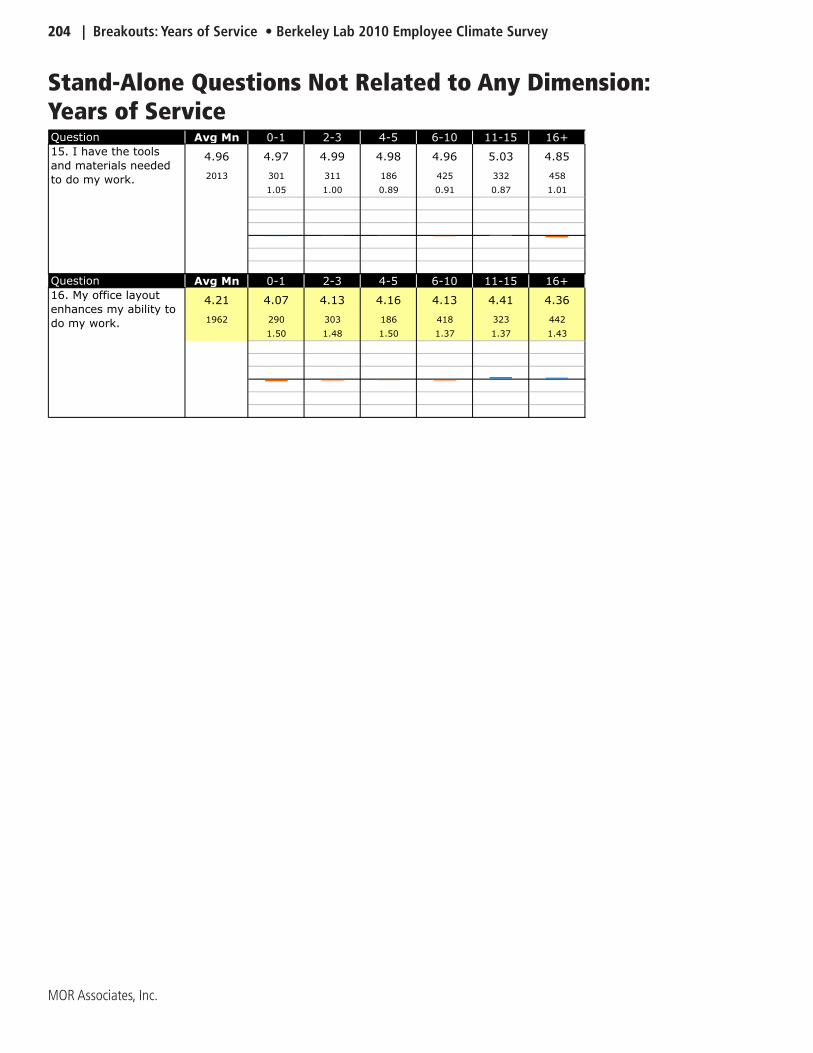
204 | Breakouts: Years of Service • Berkeley Lab 2010 Employee Climate Survey
MOR Associates, Inc.
Stand-Alone Questions Not Related to Any Dimension: Years of ServiceQuestion Avg Mn 0-1 2-3 4-5 6-10 11-15 16+
4.96 4.97 4.99 4.98 4.96 5.03 4.85
2013 301 311 186 425 332 458
1.05 1.00 0.89 0.91 0.87 1.01
Question Avg Mn 0-1 2-3 4-5 6-10 11-15 16+
4.21 4.07 4.13 4.16 4.13 4.41 4.36
1962 290 303 186 418 323 442
1.50 1.48 1.50 1.37 1.37 1.43
15. I have the tools
and materials needed
to do my work.
16. My office layout
enhances my ability to
do my work.
Berkeley Lab 2010 Employee Survey • Breakouts: Union Code | 205
MOR Associates, Inc.
Breakout Charts and Tables:
by Union Code
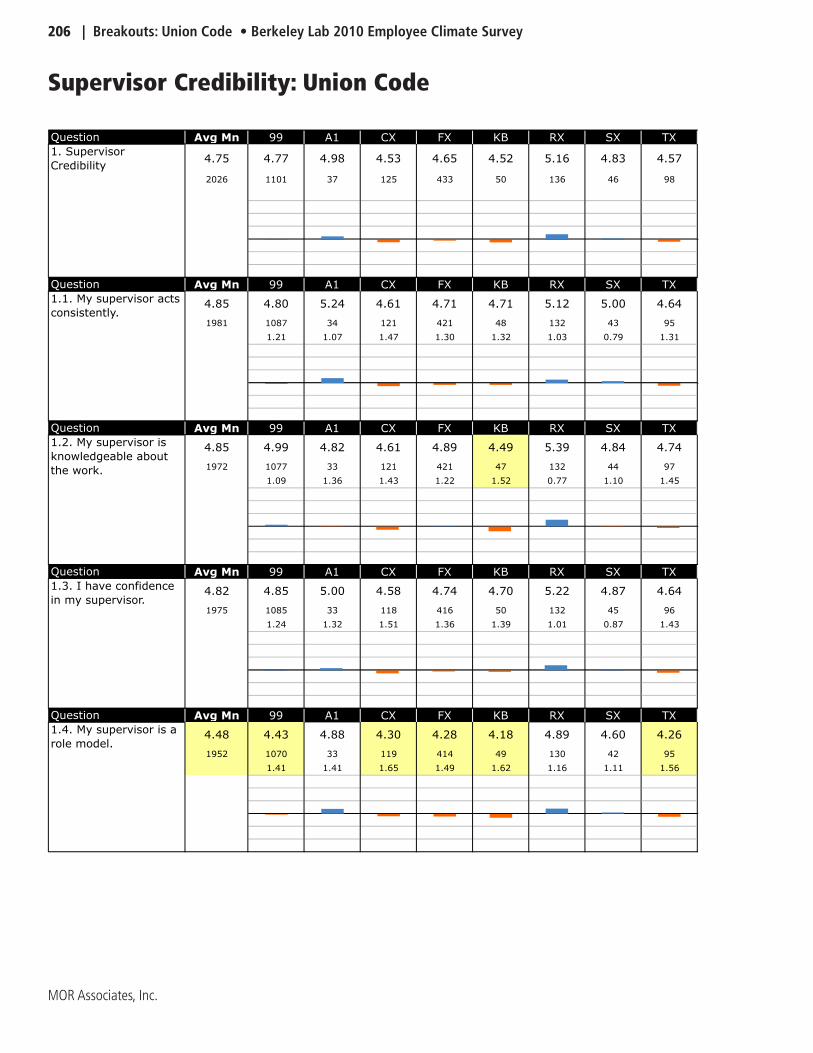
206 | Breakouts: Union Code • Berkeley Lab 2010 Employee Climate Survey
MOR Associates, Inc.
Supervisor Credibility: Union Code
Question Avg Mn 99 A1 CX FX KB RX SX TX
4.75 4.77 4.98 4.53 4.65 4.52 5.16 4.83 4.57
2026 1101 37 125 433 50 136 46 98
Question Avg Mn 99 A1 CX FX KB RX SX TX
4.85 4.80 5.24 4.61 4.71 4.71 5.12 5.00 4.64
1981 1087 34 121 421 48 132 43 95
1.21 1.07 1.47 1.30 1.32 1.03 0.79 1.31
Question Avg Mn 99 A1 CX FX KB RX SX TX
4.85 4.99 4.82 4.61 4.89 4.49 5.39 4.84 4.74
1972 1077 33 121 421 47 132 44 97
1.09 1.36 1.43 1.22 1.52 0.77 1.10 1.45
Question Avg Mn 99 A1 CX FX KB RX SX TX
4.82 4.85 5.00 4.58 4.74 4.70 5.22 4.87 4.64
1975 1085 33 118 416 50 132 45 96
1.24 1.32 1.51 1.36 1.39 1.01 0.87 1.43
Question Avg Mn 99 A1 CX FX KB RX SX TX
4.48 4.43 4.88 4.30 4.28 4.18 4.89 4.60 4.26
1952 1070 33 119 414 49 130 42 95
1.41 1.41 1.65 1.49 1.62 1.16 1.11 1.56
1. Supervisor
Credibility
1.1. My supervisor acts
consistently.
1.2. My supervisor is
knowledgeable about
the work.
1.3. I have confidence
in my supervisor.
1.4. My supervisor is a
role model.
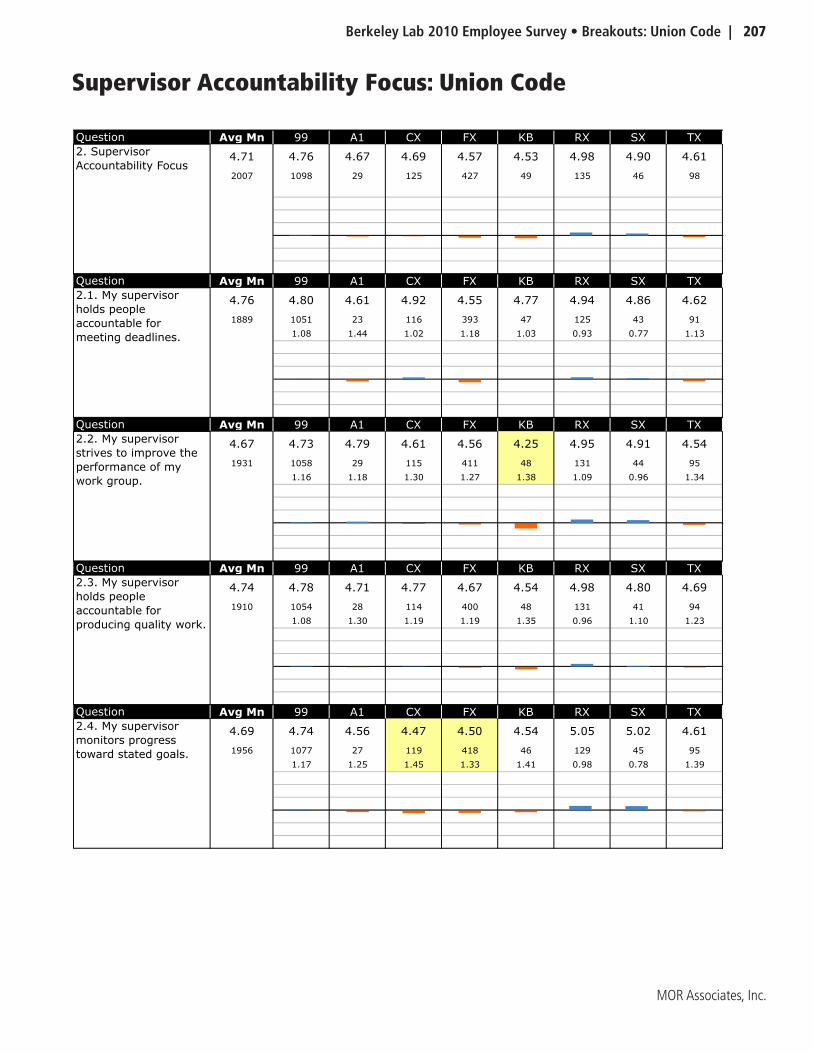
Berkeley Lab 2010 Employee Survey • Breakouts: Union Code | 207
MOR Associates, Inc.
Supervisor Accountability Focus: Union Code
Question Avg Mn 99 A1 CX FX KB RX SX TX
4.71 4.76 4.67 4.69 4.57 4.53 4.98 4.90 4.61
2007 1098 29 125 427 49 135 46 98
Question Avg Mn 99 A1 CX FX KB RX SX TX
4.76 4.80 4.61 4.92 4.55 4.77 4.94 4.86 4.62
1889 1051 23 116 393 47 125 43 91
1.08 1.44 1.02 1.18 1.03 0.93 0.77 1.13
Question Avg Mn 99 A1 CX FX KB RX SX TX
4.67 4.73 4.79 4.61 4.56 4.25 4.95 4.91 4.54
1931 1058 29 115 411 48 131 44 95
1.16 1.18 1.30 1.27 1.38 1.09 0.96 1.34
Question Avg Mn 99 A1 CX FX KB RX SX TX
4.74 4.78 4.71 4.77 4.67 4.54 4.98 4.80 4.69
1910 1054 28 114 400 48 131 41 94
1.08 1.30 1.19 1.19 1.35 0.96 1.10 1.23
Question Avg Mn 99 A1 CX FX KB RX SX TX
4.69 4.74 4.56 4.47 4.50 4.54 5.05 5.02 4.61
1956 1077 27 119 418 46 129 45 95
1.17 1.25 1.45 1.33 1.41 0.98 0.78 1.39
2. Supervisor
Accountability Focus
2.1. My supervisor
holds people
accountable for
meeting deadlines.
2.2. My supervisor
strives to improve the
performance of my
work group.
2.3. My supervisor
holds people
accountable for
producing quality work.
2.4. My supervisor
monitors progress
toward stated goals.
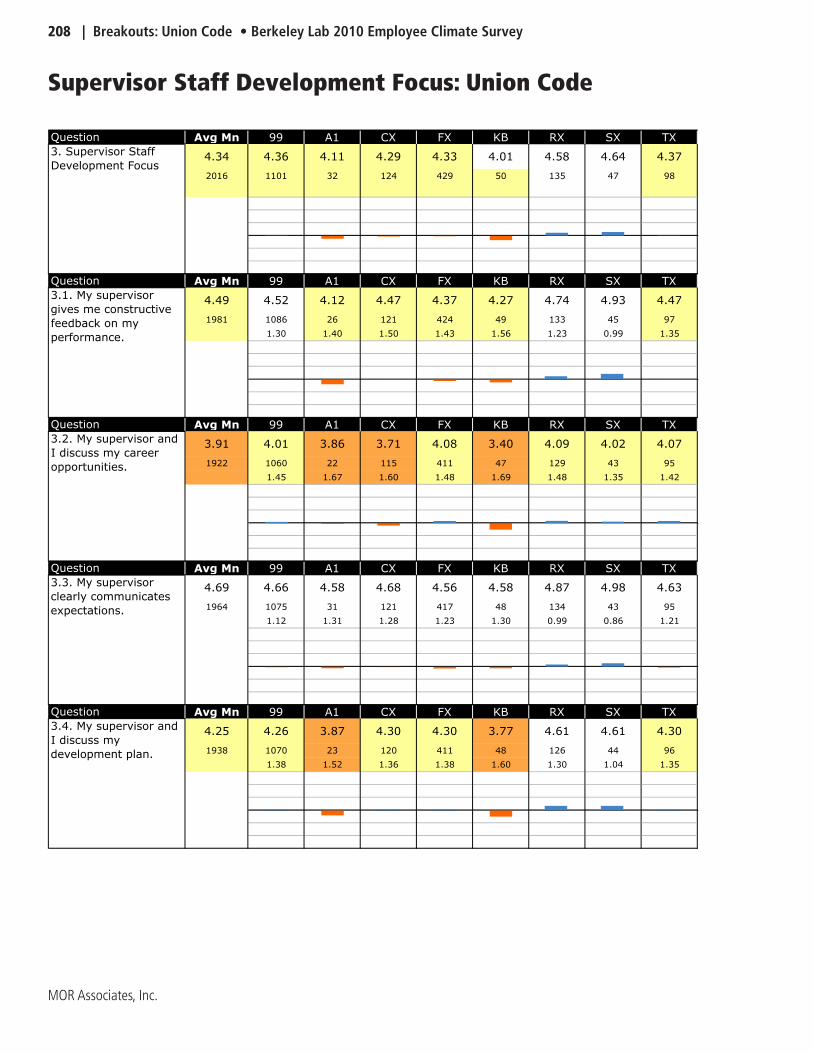
208 | Breakouts: Union Code • Berkeley Lab 2010 Employee Climate Survey
MOR Associates, Inc.
Supervisor Staff Development Focus: Union Code
Question Avg Mn 99 A1 CX FX KB RX SX TX
4.34 4.36 4.11 4.29 4.33 4.01 4.58 4.64 4.37
2016 1101 32 124 429 50 135 47 98
Question Avg Mn 99 A1 CX FX KB RX SX TX
4.49 4.52 4.12 4.47 4.37 4.27 4.74 4.93 4.47
1981 1086 26 121 424 49 133 45 97
1.30 1.40 1.50 1.43 1.56 1.23 0.99 1.35
Question Avg Mn 99 A1 CX FX KB RX SX TX
3.91 4.01 3.86 3.71 4.08 3.40 4.09 4.02 4.07
1922 1060 22 115 411 47 129 43 95
1.45 1.67 1.60 1.48 1.69 1.48 1.35 1.42
Question Avg Mn 99 A1 CX FX KB RX SX TX
4.69 4.66 4.58 4.68 4.56 4.58 4.87 4.98 4.63
1964 1075 31 121 417 48 134 43 95
1.12 1.31 1.28 1.23 1.30 0.99 0.86 1.21
Question Avg Mn 99 A1 CX FX KB RX SX TX
4.25 4.26 3.87 4.30 4.30 3.77 4.61 4.61 4.30
1938 1070 23 120 411 48 126 44 96
1.38 1.52 1.36 1.38 1.60 1.30 1.04 1.35
3. Supervisor Staff
Development Focus
3.1. My supervisor
gives me constructive
feedback on my
performance.
3.2. My supervisor and
I discuss my career
opportunities.
3.3. My supervisor
clearly communicates
expectations.
3.4. My supervisor and
I discuss my
development plan.
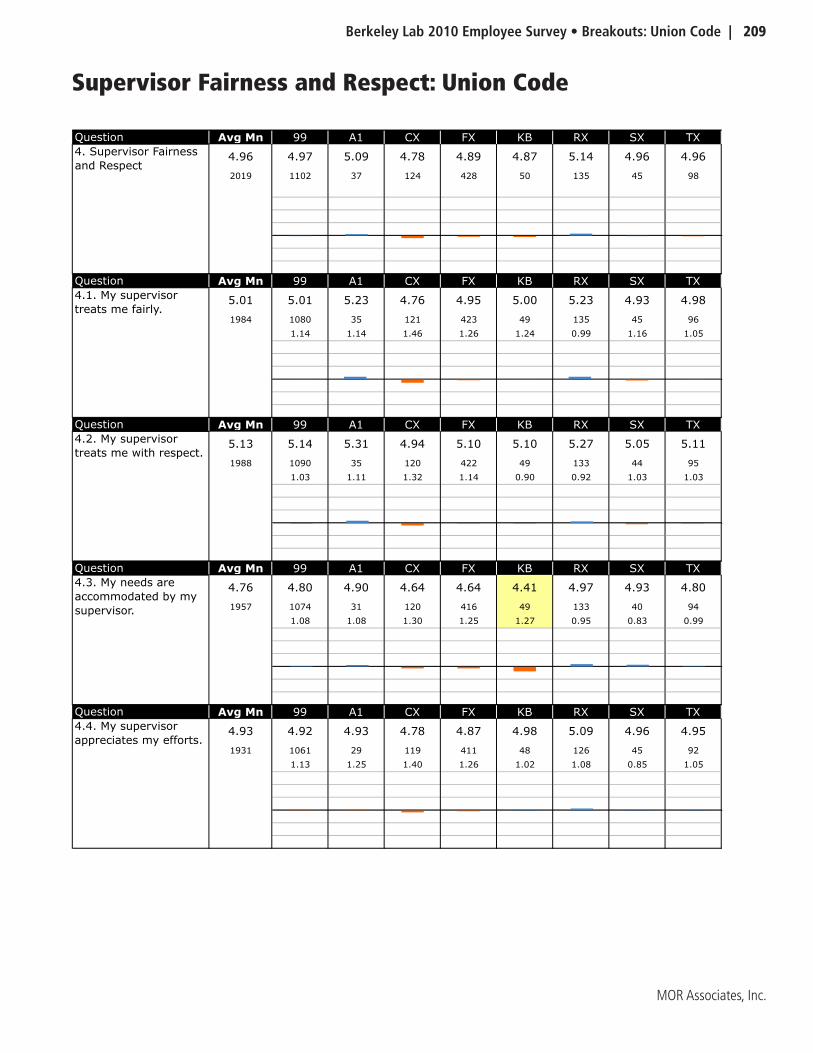
Berkeley Lab 2010 Employee Survey • Breakouts: Union Code | 209
MOR Associates, Inc.
Supervisor Fairness and Respect: Union Code
Question Avg Mn 99 A1 CX FX KB RX SX TX
4.96 4.97 5.09 4.78 4.89 4.87 5.14 4.96 4.96
2019 1102 37 124 428 50 135 45 98
Question Avg Mn 99 A1 CX FX KB RX SX TX
5.01 5.01 5.23 4.76 4.95 5.00 5.23 4.93 4.98
1984 1080 35 121 423 49 135 45 96
1.14 1.14 1.46 1.26 1.24 0.99 1.16 1.05
Question Avg Mn 99 A1 CX FX KB RX SX TX
5.13 5.14 5.31 4.94 5.10 5.10 5.27 5.05 5.11
1988 1090 35 120 422 49 133 44 95
1.03 1.11 1.32 1.14 0.90 0.92 1.03 1.03
Question Avg Mn 99 A1 CX FX KB RX SX TX
4.76 4.80 4.90 4.64 4.64 4.41 4.97 4.93 4.80
1957 1074 31 120 416 49 133 40 94
1.08 1.08 1.30 1.25 1.27 0.95 0.83 0.99
Question Avg Mn 99 A1 CX FX KB RX SX TX
4.93 4.92 4.93 4.78 4.87 4.98 5.09 4.96 4.95
1931 1061 29 119 411 48 126 45 92
1.13 1.25 1.40 1.26 1.02 1.08 0.85 1.05
4. Supervisor Fairness
and Respect
4.1. My supervisor
treats me fairly.
4.2. My supervisor
treats me with respect.
4.3. My needs are
accommodated by my
supervisor.
4.4. My supervisor
appreciates my efforts.
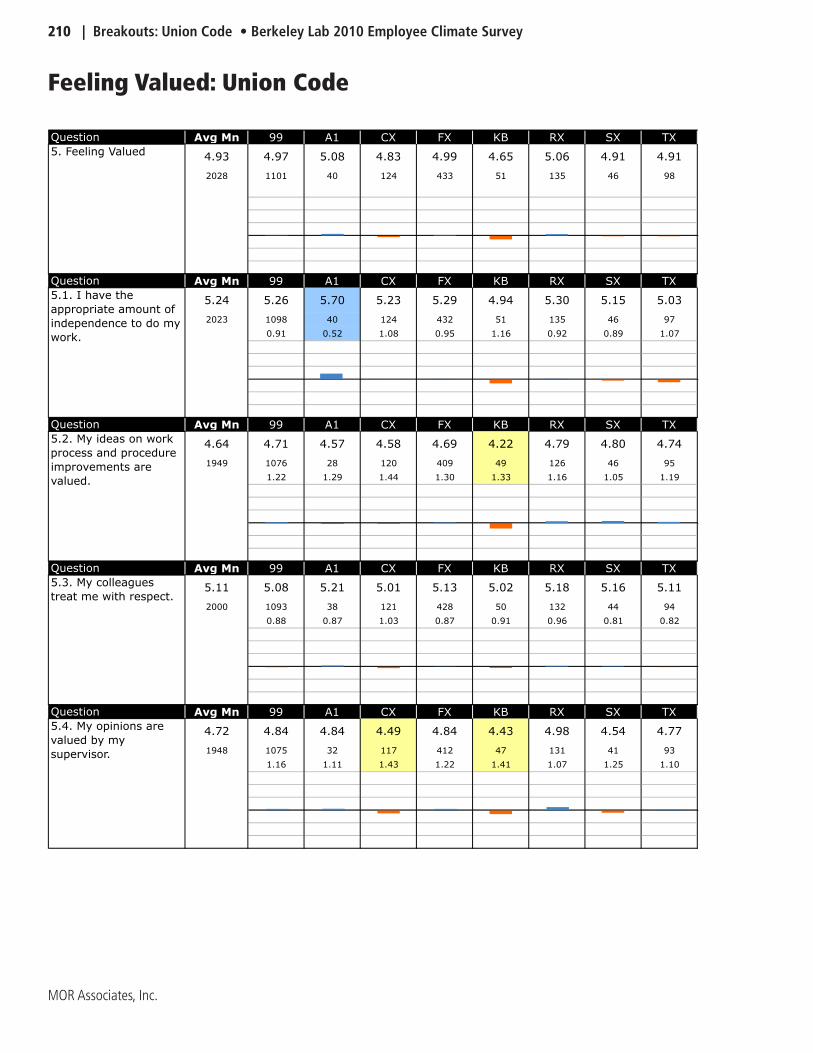
210 | Breakouts: Union Code • Berkeley Lab 2010 Employee Climate Survey
MOR Associates, Inc.
Feeling Valued: Union Code
Question Avg Mn 99 A1 CX FX KB RX SX TX
4.93 4.97 5.08 4.83 4.99 4.65 5.06 4.91 4.91
2028 1101 40 124 433 51 135 46 98
Question Avg Mn 99 A1 CX FX KB RX SX TX
5.24 5.26 5.70 5.23 5.29 4.94 5.30 5.15 5.03
2023 1098 40 124 432 51 135 46 97
0.91 0.52 1.08 0.95 1.16 0.92 0.89 1.07
Question Avg Mn 99 A1 CX FX KB RX SX TX
4.64 4.71 4.57 4.58 4.69 4.22 4.79 4.80 4.74
1949 1076 28 120 409 49 126 46 95
1.22 1.29 1.44 1.30 1.33 1.16 1.05 1.19
Question Avg Mn 99 A1 CX FX KB RX SX TX
5.11 5.08 5.21 5.01 5.13 5.02 5.18 5.16 5.11
2000 1093 38 121 428 50 132 44 94
0.88 0.87 1.03 0.87 0.91 0.96 0.81 0.82
Question Avg Mn 99 A1 CX FX KB RX SX TX
4.72 4.84 4.84 4.49 4.84 4.43 4.98 4.54 4.77
1948 1075 32 117 412 47 131 41 93
1.16 1.11 1.43 1.22 1.41 1.07 1.25 1.10
5. Feeling Valued
5.1. I have the
appropriate amount of
independence to do my
work.
5.2. My ideas on work
process and procedure
improvements are
valued.
5.3. My colleagues
treat me with respect.
5.4. My opinions are
valued by my
supervisor.
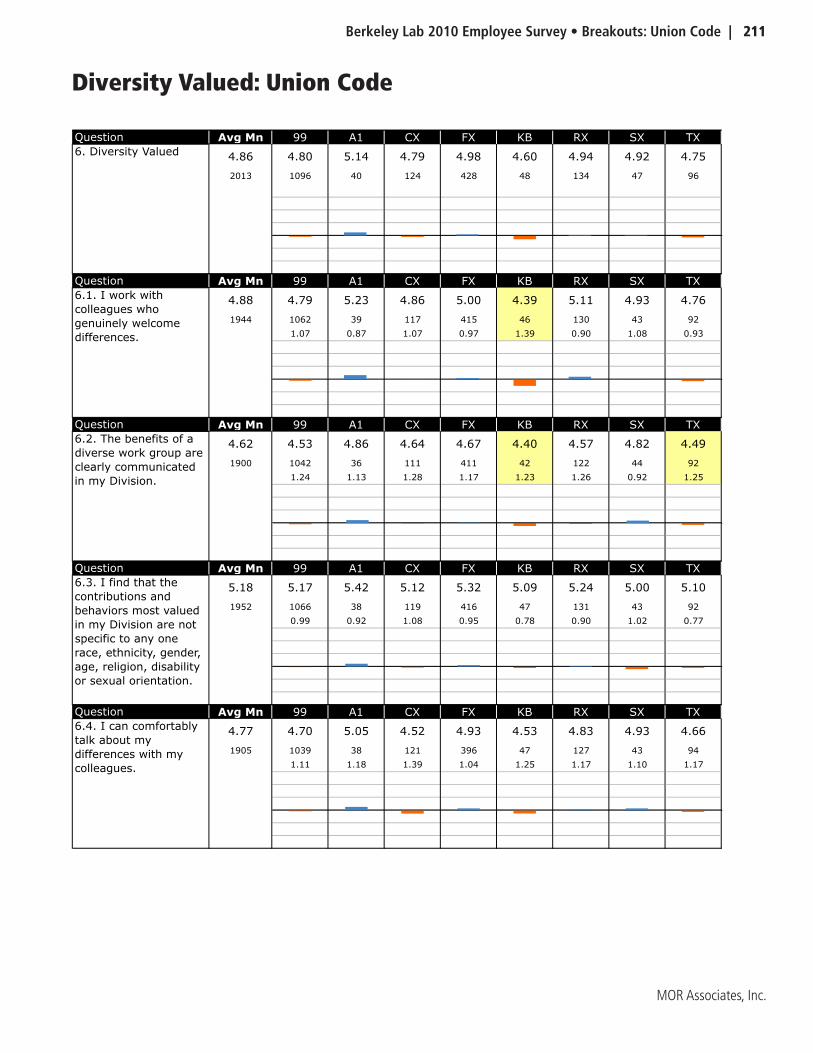
Berkeley Lab 2010 Employee Survey • Breakouts: Union Code | 211
MOR Associates, Inc.
Diversity Valued: Union Code
Question Avg Mn 99 A1 CX FX KB RX SX TX
4.86 4.80 5.14 4.79 4.98 4.60 4.94 4.92 4.75
2013 1096 40 124 428 48 134 47 96
Question Avg Mn 99 A1 CX FX KB RX SX TX
4.88 4.79 5.23 4.86 5.00 4.39 5.11 4.93 4.76
1944 1062 39 117 415 46 130 43 92
1.07 0.87 1.07 0.97 1.39 0.90 1.08 0.93
Question Avg Mn 99 A1 CX FX KB RX SX TX
4.62 4.53 4.86 4.64 4.67 4.40 4.57 4.82 4.49
1900 1042 36 111 411 42 122 44 92
1.24 1.13 1.28 1.17 1.23 1.26 0.92 1.25
Question Avg Mn 99 A1 CX FX KB RX SX TX
5.18 5.17 5.42 5.12 5.32 5.09 5.24 5.00 5.10
1952 1066 38 119 416 47 131 43 92
0.99 0.92 1.08 0.95 0.78 0.90 1.02 0.77
Question Avg Mn 99 A1 CX FX KB RX SX TX
4.77 4.70 5.05 4.52 4.93 4.53 4.83 4.93 4.66
1905 1039 38 121 396 47 127 43 94
1.11 1.18 1.39 1.04 1.25 1.17 1.10 1.17
6. Diversity Valued
6.1. I work with
colleagues who
genuinely welcome
differences.
6.2. The benefits of a
diverse work group are
clearly communicated
in my Division.
6.3. I find that the
contributions and
behaviors most valued
in my Division are not
specific to any one
race, ethnicity, gender,
age, religion, disability
or sexual orientation.
6.4. I can comfortably
talk about my
differences with my
colleagues.
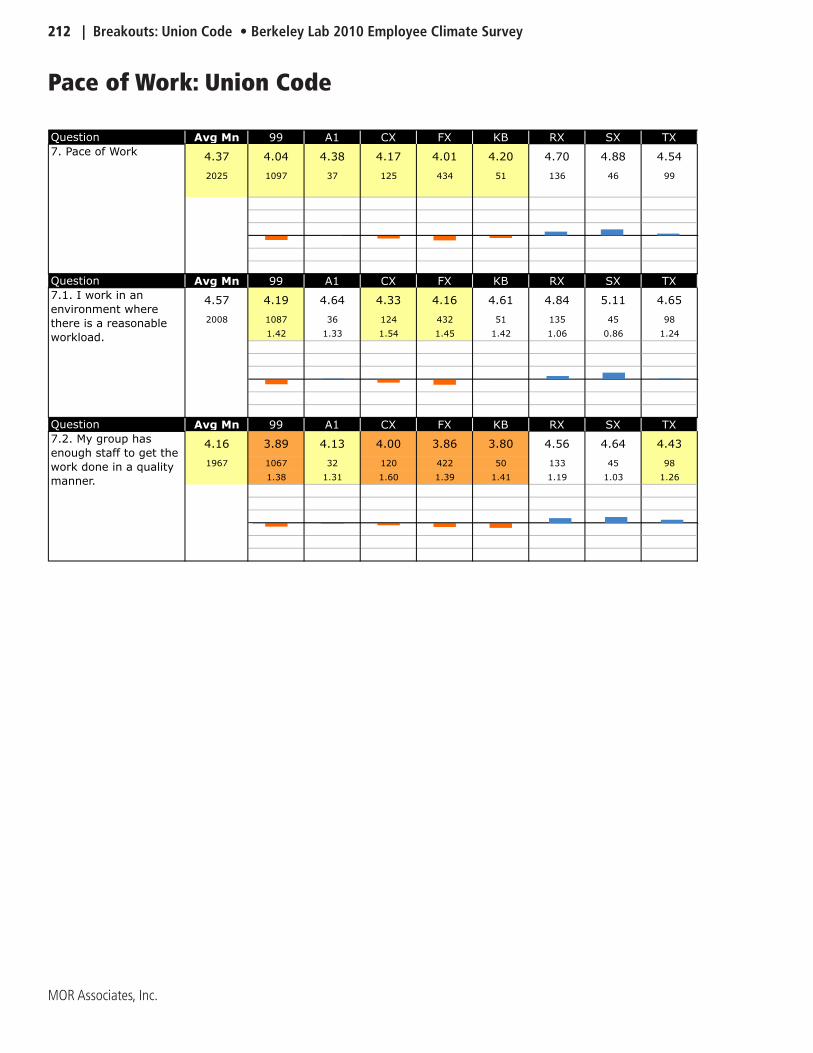
212 | Breakouts: Union Code • Berkeley Lab 2010 Employee Climate Survey
MOR Associates, Inc.
Pace of Work: Union Code
Question Avg Mn 99 A1 CX FX KB RX SX TX
4.37 4.04 4.38 4.17 4.01 4.20 4.70 4.88 4.54
2025 1097 37 125 434 51 136 46 99
Question Avg Mn 99 A1 CX FX KB RX SX TX
4.57 4.19 4.64 4.33 4.16 4.61 4.84 5.11 4.65
2008 1087 36 124 432 51 135 45 98
1.42 1.33 1.54 1.45 1.42 1.06 0.86 1.24
Question Avg Mn 99 A1 CX FX KB RX SX TX
4.16 3.89 4.13 4.00 3.86 3.80 4.56 4.64 4.43
1967 1067 32 120 422 50 133 45 98
1.38 1.31 1.60 1.39 1.41 1.19 1.03 1.26
7. Pace of Work
7.1. I work in an
environment where
there is a reasonable
workload.
7.2. My group has
enough staff to get the
work done in a quality
manner.
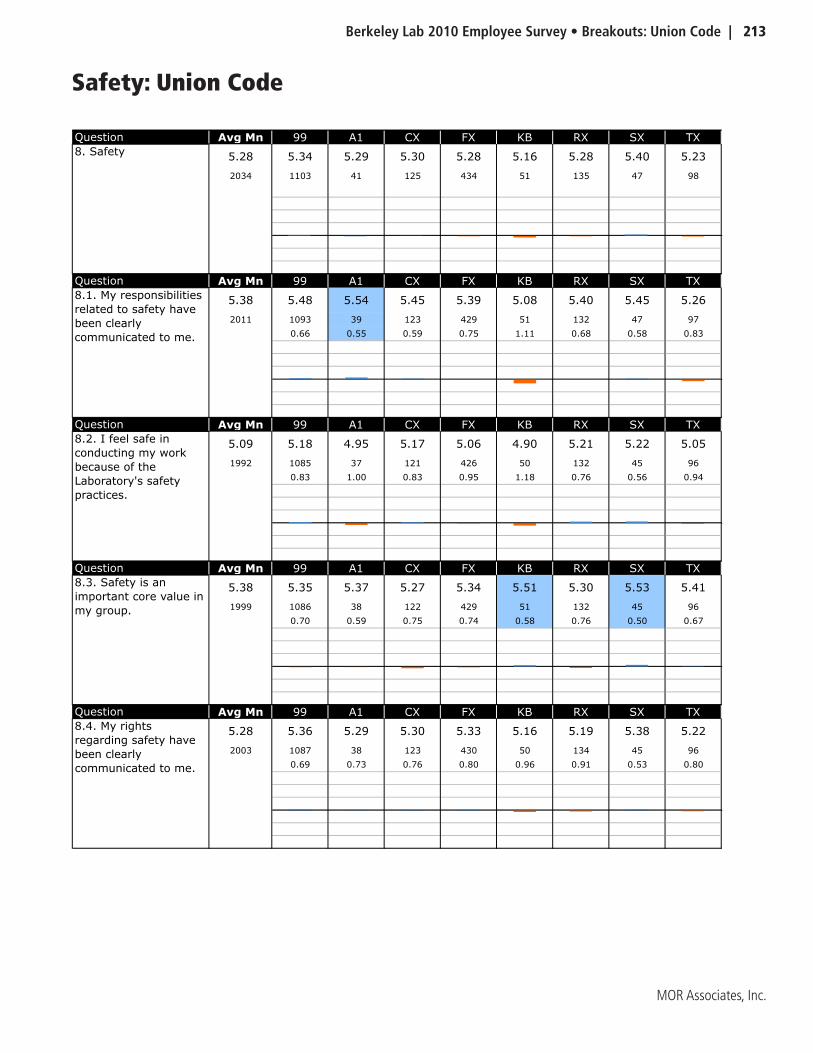
Berkeley Lab 2010 Employee Survey • Breakouts: Union Code | 213
MOR Associates, Inc.
Safety: Union Code
Question Avg Mn 99 A1 CX FX KB RX SX TX
5.28 5.34 5.29 5.30 5.28 5.16 5.28 5.40 5.23
2034 1103 41 125 434 51 135 47 98
Question Avg Mn 99 A1 CX FX KB RX SX TX
5.38 5.48 5.54 5.45 5.39 5.08 5.40 5.45 5.26
2011 1093 39 123 429 51 132 47 97
0.66 0.55 0.59 0.75 1.11 0.68 0.58 0.83
Question Avg Mn 99 A1 CX FX KB RX SX TX
5.09 5.18 4.95 5.17 5.06 4.90 5.21 5.22 5.05
1992 1085 37 121 426 50 132 45 96
0.83 1.00 0.83 0.95 1.18 0.76 0.56 0.94
Question Avg Mn 99 A1 CX FX KB RX SX TX
5.38 5.35 5.37 5.27 5.34 5.51 5.30 5.53 5.41
1999 1086 38 122 429 51 132 45 96
0.70 0.59 0.75 0.74 0.58 0.76 0.50 0.67
Question Avg Mn 99 A1 CX FX KB RX SX TX
5.28 5.36 5.29 5.30 5.33 5.16 5.19 5.38 5.22
2003 1087 38 123 430 50 134 45 96
0.69 0.73 0.76 0.80 0.96 0.91 0.53 0.80
8.2. I feel safe in
conducting my work
because of the
Laboratory's safety
practices.
8.3. Safety is an
important core value in
my group.
8.4. My rights
regarding safety have
been clearly
communicated to me.
8. Safety
8.1. My responsibilities
related to safety have
been clearly
communicated to me.
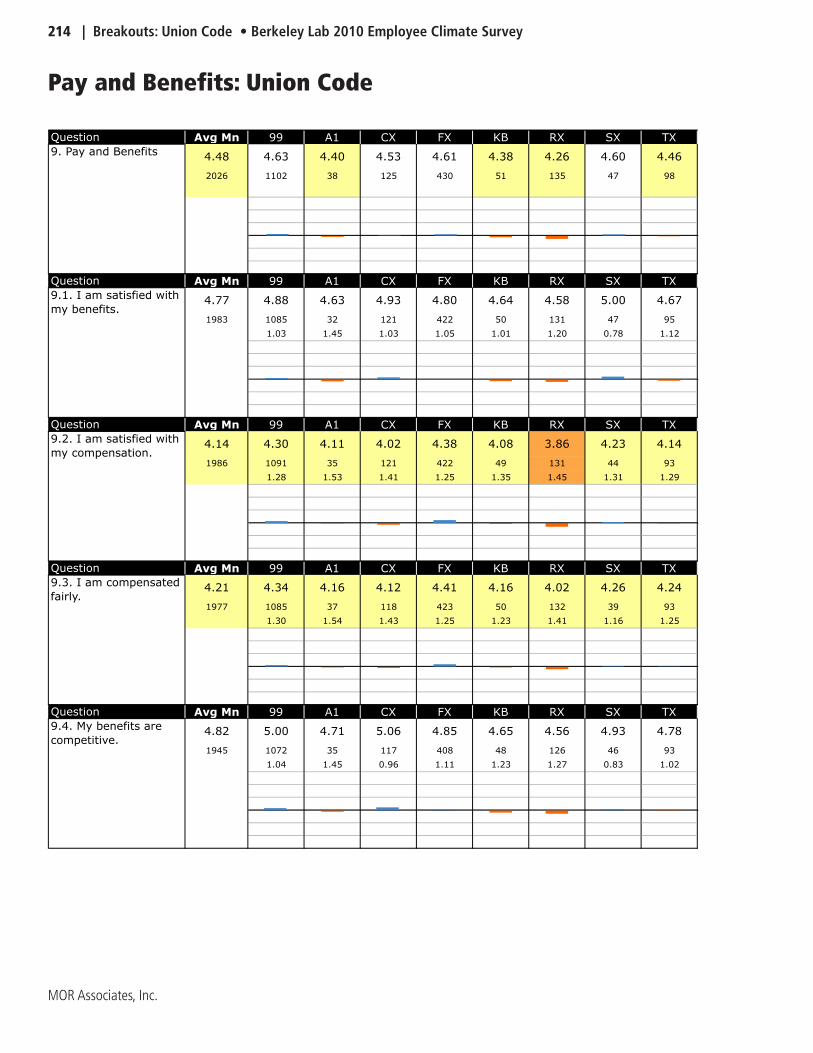
214 | Breakouts: Union Code • Berkeley Lab 2010 Employee Climate Survey
MOR Associates, Inc.
Pay and Benefits: Union Code
Question Avg Mn 99 A1 CX FX KB RX SX TX
4.48 4.63 4.40 4.53 4.61 4.38 4.26 4.60 4.46
2026 1102 38 125 430 51 135 47 98
Question Avg Mn 99 A1 CX FX KB RX SX TX
4.77 4.88 4.63 4.93 4.80 4.64 4.58 5.00 4.67
1983 1085 32 121 422 50 131 47 95
1.03 1.45 1.03 1.05 1.01 1.20 0.78 1.12
Question Avg Mn 99 A1 CX FX KB RX SX TX
4.14 4.30 4.11 4.02 4.38 4.08 3.86 4.23 4.14
1986 1091 35 121 422 49 131 44 93
1.28 1.53 1.41 1.25 1.35 1.45 1.31 1.29
Question Avg Mn 99 A1 CX FX KB RX SX TX
4.21 4.34 4.16 4.12 4.41 4.16 4.02 4.26 4.24
1977 1085 37 118 423 50 132 39 93
1.30 1.54 1.43 1.25 1.23 1.41 1.16 1.25
Question Avg Mn 99 A1 CX FX KB RX SX TX
4.82 5.00 4.71 5.06 4.85 4.65 4.56 4.93 4.78
1945 1072 35 117 408 48 126 46 93
1.04 1.45 0.96 1.11 1.23 1.27 0.83 1.02
9.4. My benefits are
competitive.
9. Pay and Benefits
9.1. I am satisfied with
my benefits.
9.2. I am satisfied with
my compensation.
9.3. I am compensated
fairly.
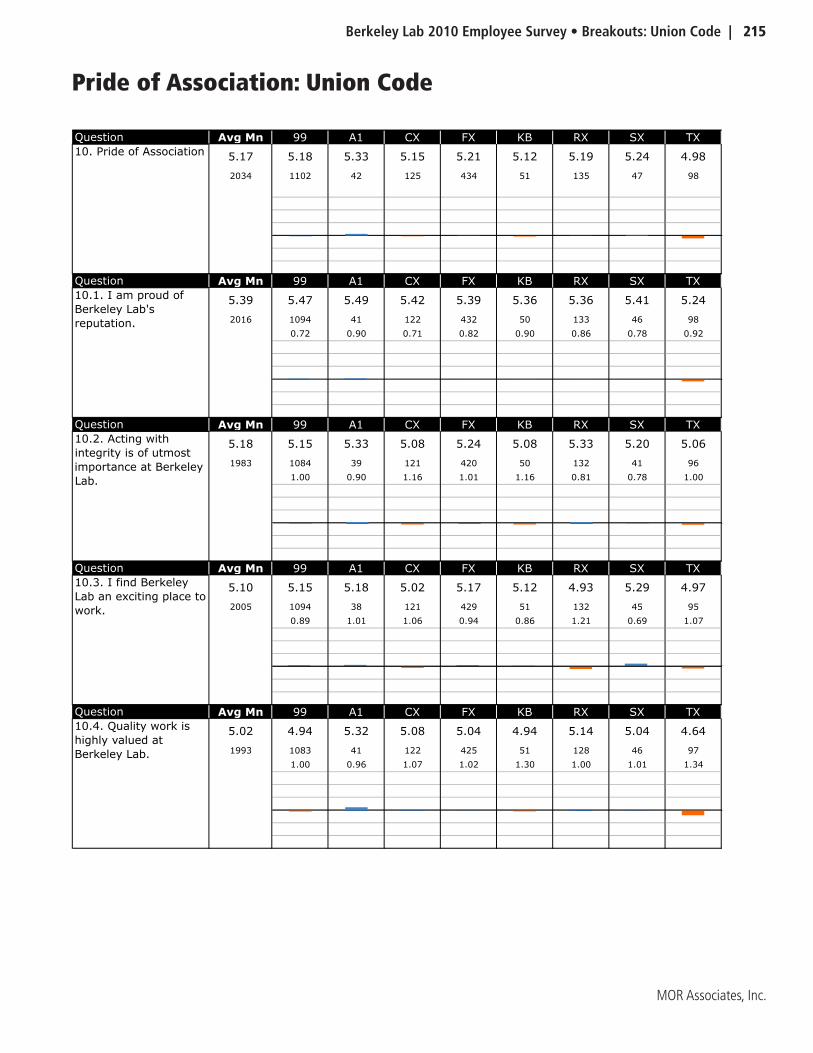
Berkeley Lab 2010 Employee Survey • Breakouts: Union Code | 215
MOR Associates, Inc.
Pride of Association: Union Code
Question Avg Mn 99 A1 CX FX KB RX SX TX
5.17 5.18 5.33 5.15 5.21 5.12 5.19 5.24 4.98
2034 1102 42 125 434 51 135 47 98
Question Avg Mn 99 A1 CX FX KB RX SX TX
5.39 5.47 5.49 5.42 5.39 5.36 5.36 5.41 5.24
2016 1094 41 122 432 50 133 46 98
0.72 0.90 0.71 0.82 0.90 0.86 0.78 0.92
Question Avg Mn 99 A1 CX FX KB RX SX TX
5.18 5.15 5.33 5.08 5.24 5.08 5.33 5.20 5.06
1983 1084 39 121 420 50 132 41 96
1.00 0.90 1.16 1.01 1.16 0.81 0.78 1.00
Question Avg Mn 99 A1 CX FX KB RX SX TX
5.10 5.15 5.18 5.02 5.17 5.12 4.93 5.29 4.97
2005 1094 38 121 429 51 132 45 95
0.89 1.01 1.06 0.94 0.86 1.21 0.69 1.07
Question Avg Mn 99 A1 CX FX KB RX SX TX
5.02 4.94 5.32 5.08 5.04 4.94 5.14 5.04 4.64
1993 1083 41 122 425 51 128 46 97
1.00 0.96 1.07 1.02 1.30 1.00 1.01 1.34
10.2. Acting with
integrity is of utmost
importance at Berkeley
Lab.
10.3. I find Berkeley
Lab an exciting place to
work.
10.4. Quality work is
highly valued at
Berkeley Lab.
10. Pride of Association
10.1. I am proud of
Berkeley Lab's
reputation.
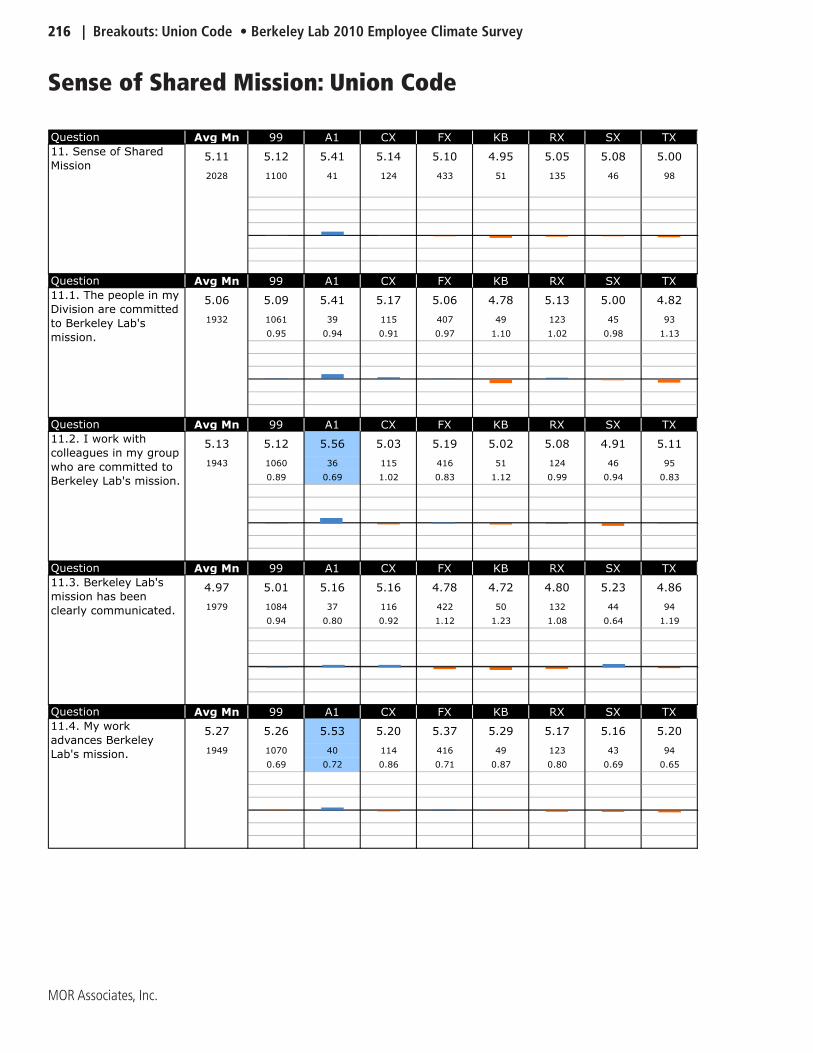
216 | Breakouts: Union Code • Berkeley Lab 2010 Employee Climate Survey
MOR Associates, Inc.
Sense of Shared Mission: Union Code
Question Avg Mn 99 A1 CX FX KB RX SX TX
5.11 5.12 5.41 5.14 5.10 4.95 5.05 5.08 5.00
2028 1100 41 124 433 51 135 46 98
Question Avg Mn 99 A1 CX FX KB RX SX TX
5.06 5.09 5.41 5.17 5.06 4.78 5.13 5.00 4.82
1932 1061 39 115 407 49 123 45 93
0.95 0.94 0.91 0.97 1.10 1.02 0.98 1.13
Question Avg Mn 99 A1 CX FX KB RX SX TX
5.13 5.12 5.56 5.03 5.19 5.02 5.08 4.91 5.11
1943 1060 36 115 416 51 124 46 95
0.89 0.69 1.02 0.83 1.12 0.99 0.94 0.83
Question Avg Mn 99 A1 CX FX KB RX SX TX
4.97 5.01 5.16 5.16 4.78 4.72 4.80 5.23 4.86
1979 1084 37 116 422 50 132 44 94
0.94 0.80 0.92 1.12 1.23 1.08 0.64 1.19
Question Avg Mn 99 A1 CX FX KB RX SX TX
5.27 5.26 5.53 5.20 5.37 5.29 5.17 5.16 5.20
1949 1070 40 114 416 49 123 43 94
0.69 0.72 0.86 0.71 0.87 0.80 0.69 0.65
11.2. I work with
colleagues in my group
who are committed to
Berkeley Lab's mission.
11.3. Berkeley Lab's
mission has been
clearly communicated.
11.4. My work
advances Berkeley
Lab's mission.
11. Sense of Shared
Mission
11.1. The people in my
Division are committed
to Berkeley Lab's
mission.
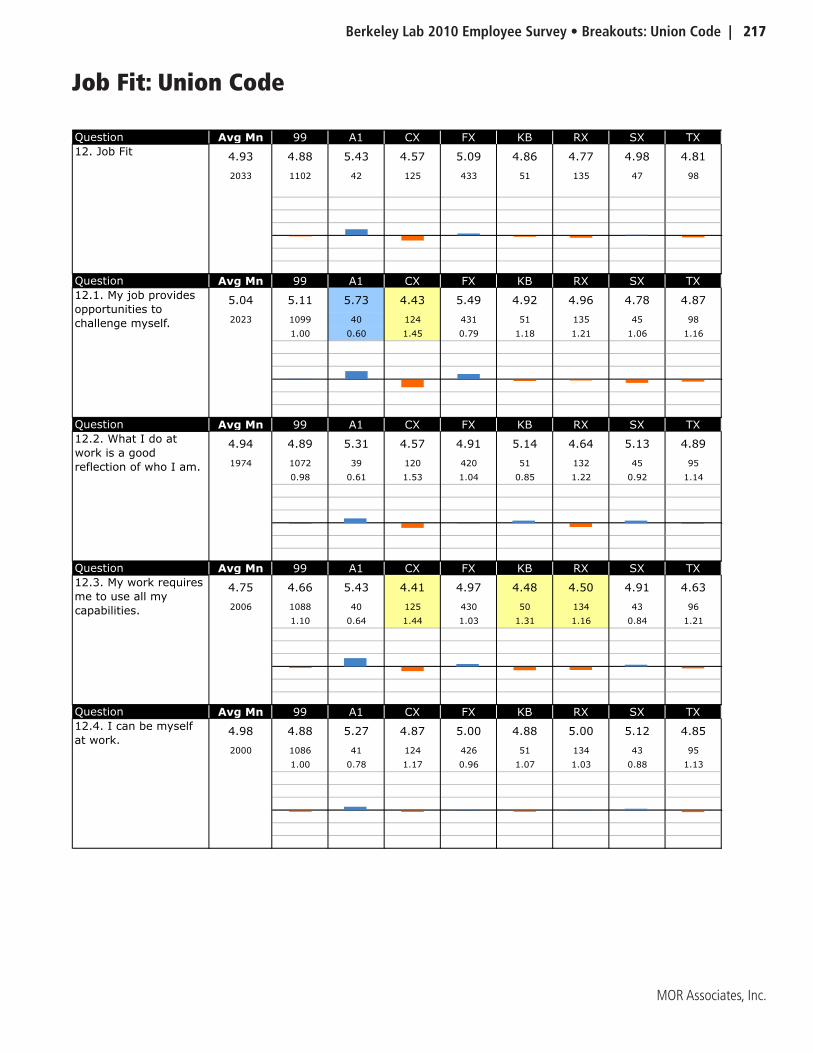
Berkeley Lab 2010 Employee Survey • Breakouts: Union Code | 217
MOR Associates, Inc.
Job Fit: Union Code
Question Avg Mn 99 A1 CX FX KB RX SX TX
4.93 4.88 5.43 4.57 5.09 4.86 4.77 4.98 4.81
2033 1102 42 125 433 51 135 47 98
Question Avg Mn 99 A1 CX FX KB RX SX TX
5.04 5.11 5.73 4.43 5.49 4.92 4.96 4.78 4.87
2023 1099 40 124 431 51 135 45 98
1.00 0.60 1.45 0.79 1.18 1.21 1.06 1.16
Question Avg Mn 99 A1 CX FX KB RX SX TX
4.94 4.89 5.31 4.57 4.91 5.14 4.64 5.13 4.89
1974 1072 39 120 420 51 132 45 95
0.98 0.61 1.53 1.04 0.85 1.22 0.92 1.14
Question Avg Mn 99 A1 CX FX KB RX SX TX
4.75 4.66 5.43 4.41 4.97 4.48 4.50 4.91 4.63
2006 1088 40 125 430 50 134 43 96
1.10 0.64 1.44 1.03 1.31 1.16 0.84 1.21
Question Avg Mn 99 A1 CX FX KB RX SX TX
4.98 4.88 5.27 4.87 5.00 4.88 5.00 5.12 4.85
2000 1086 41 124 426 51 134 43 95
1.00 0.78 1.17 0.96 1.07 1.03 0.88 1.13
12.2. What I do at
work is a good
reflection of who I am.
12.3. My work requires
me to use all my
capabilities.
12.4. I can be myself
at work.
12. Job Fit
12.1. My job provides
opportunities to
challenge myself.
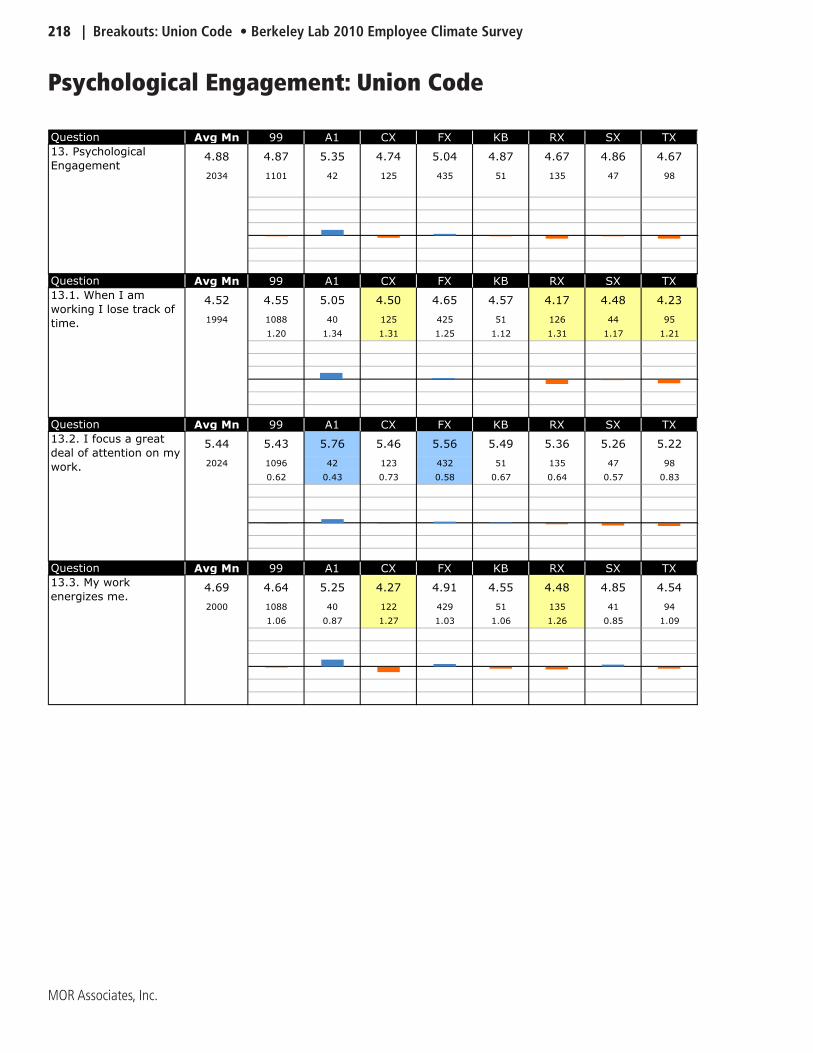
218 | Breakouts: Union Code • Berkeley Lab 2010 Employee Climate Survey
MOR Associates, Inc.
Psychological Engagement: Union Code
Question Avg Mn 99 A1 CX FX KB RX SX TX
4.88 4.87 5.35 4.74 5.04 4.87 4.67 4.86 4.67
2034 1101 42 125 435 51 135 47 98
Question Avg Mn 99 A1 CX FX KB RX SX TX
4.52 4.55 5.05 4.50 4.65 4.57 4.17 4.48 4.23
1994 1088 40 125 425 51 126 44 95
1.20 1.34 1.31 1.25 1.12 1.31 1.17 1.21
Question Avg Mn 99 A1 CX FX KB RX SX TX
5.44 5.43 5.76 5.46 5.56 5.49 5.36 5.26 5.22
2024 1096 42 123 432 51 135 47 98
0.62 0.43 0.73 0.58 0.67 0.64 0.57 0.83
Question Avg Mn 99 A1 CX FX KB RX SX TX
4.69 4.64 5.25 4.27 4.91 4.55 4.48 4.85 4.54
2000 1088 40 122 429 51 135 41 94
1.06 0.87 1.27 1.03 1.06 1.26 0.85 1.09
13. Psychological
Engagement
13.1. When I am
working I lose track of
time.
13.2. I focus a great
deal of attention on my
work.
13.3. My work
energizes me.
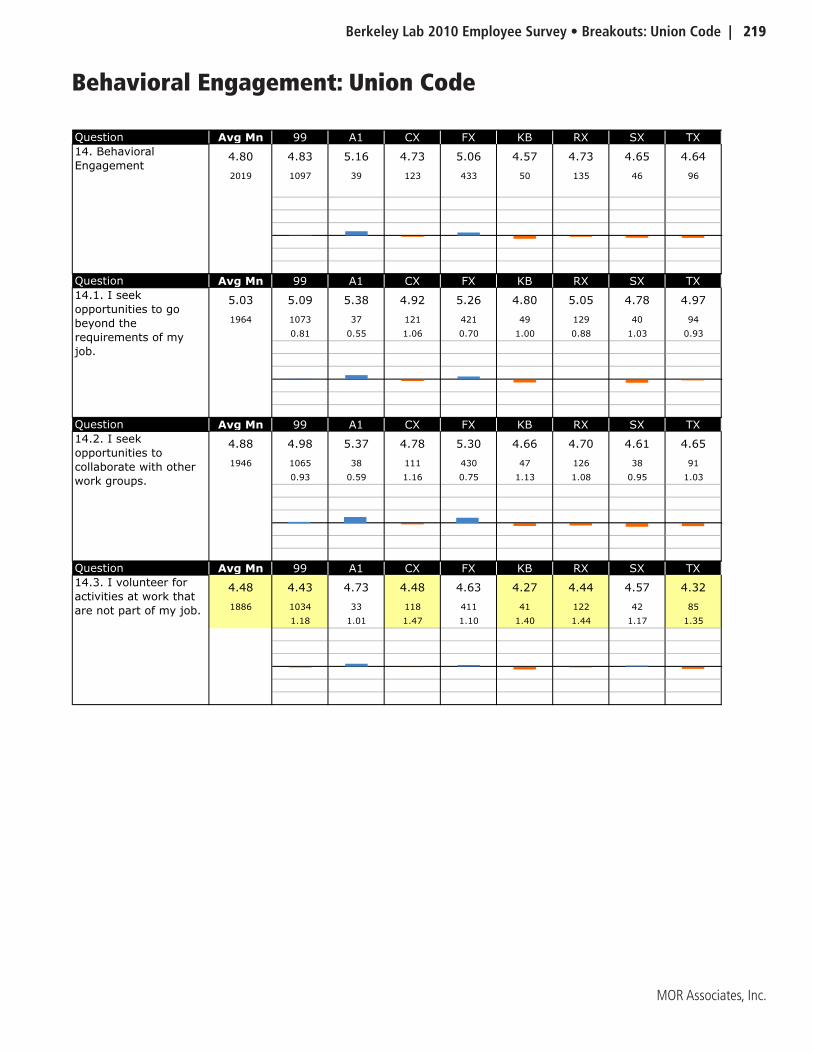
Berkeley Lab 2010 Employee Survey • Breakouts: Union Code | 219
MOR Associates, Inc.
Behavioral Engagement: Union Code
Question Avg Mn 99 A1 CX FX KB RX SX TX
4.80 4.83 5.16 4.73 5.06 4.57 4.73 4.65 4.64
2019 1097 39 123 433 50 135 46 96
Question Avg Mn 99 A1 CX FX KB RX SX TX
5.03 5.09 5.38 4.92 5.26 4.80 5.05 4.78 4.97
1964 1073 37 121 421 49 129 40 94
0.81 0.55 1.06 0.70 1.00 0.88 1.03 0.93
Question Avg Mn 99 A1 CX FX KB RX SX TX
4.88 4.98 5.37 4.78 5.30 4.66 4.70 4.61 4.65
1946 1065 38 111 430 47 126 38 91
0.93 0.59 1.16 0.75 1.13 1.08 0.95 1.03
Question Avg Mn 99 A1 CX FX KB RX SX TX
4.48 4.43 4.73 4.48 4.63 4.27 4.44 4.57 4.32
1886 1034 33 118 411 41 122 42 85
1.18 1.01 1.47 1.10 1.40 1.44 1.17 1.35
14.3. I volunteer for
activities at work that
are not part of my job.
14. Behavioral
Engagement
14.1. I seek
opportunities to go
beyond the
requirements of my
job.
14.2. I seek
opportunities to
collaborate with other
work groups.
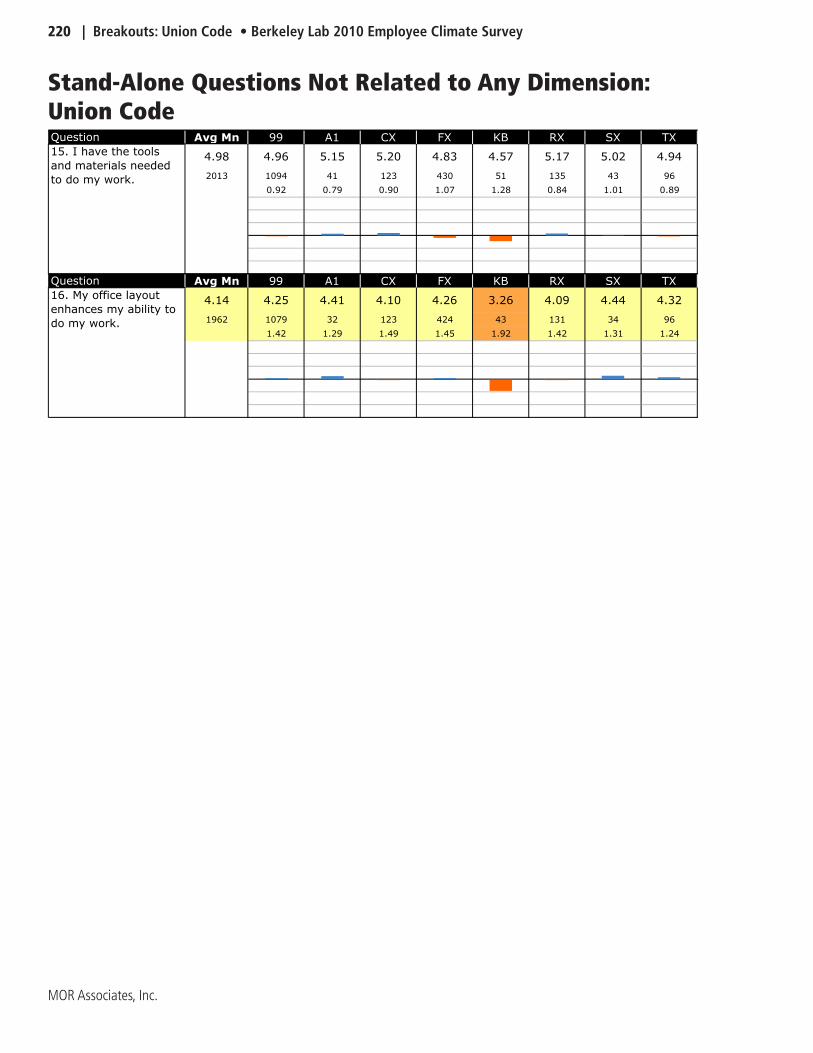
220 | Breakouts: Union Code • Berkeley Lab 2010 Employee Climate Survey
MOR Associates, Inc.
Stand-Alone Questions Not Related to Any Dimension: Union CodeQuestion Avg Mn 99 A1 CX FX KB RX SX TX
4.98 4.96 5.15 5.20 4.83 4.57 5.17 5.02 4.94
2013 1094 41 123 430 51 135 43 96
0.92 0.79 0.90 1.07 1.28 0.84 1.01 0.89
Question Avg Mn 99 A1 CX FX KB RX SX TX
4.14 4.25 4.41 4.10 4.26 3.26 4.09 4.44 4.32
1962 1079 32 123 424 43 131 34 96
1.42 1.29 1.49 1.45 1.92 1.42 1.31 1.24
15. I have the tools
and materials needed
to do my work.
16. My office layout
enhances my ability to
do my work.
Berkeley Lab 2010 Employee Survey • Appendix A: The Survey Instrument | A-1
MOR Associates, Inc.
Appendix A: The Survey Instrument
A-2 | Appendix A: The Survey Instrument • Berkeley Lab 2010 Employee Climate Survey
MOR Associates, Inc.
Please read each statement in the survey and consider the extent to which you agreewith each statement. Then choose the response which best describes your impression.
If you encounter a question that you don't have an answer for, please select "N/A - Don'tKnow."
Please read each statement in the survey and consider the extent to which you agreewith each statement. Then choose the response which best describes your impression.
If you encounter a question that you don't have an answer for, please select "N/A - Don'tKnow."
For the purpose of this survey, supervisor is defined as yourprimary immediate supervisor who regularly monitors your job performance.
We need to be sure the survey instrument is functioning properly. Can you see the "Next" button below?(ANSWER REQUIRED)
Yes
For the purpose of this survey, supervisor is defined as yourprimary immediate supervisor who regularly monitors your job performance.
We need to be sure the survey instrument is functioning properly. Can you see the "Next" button below?(ANSWER REQUIRED)
Yes
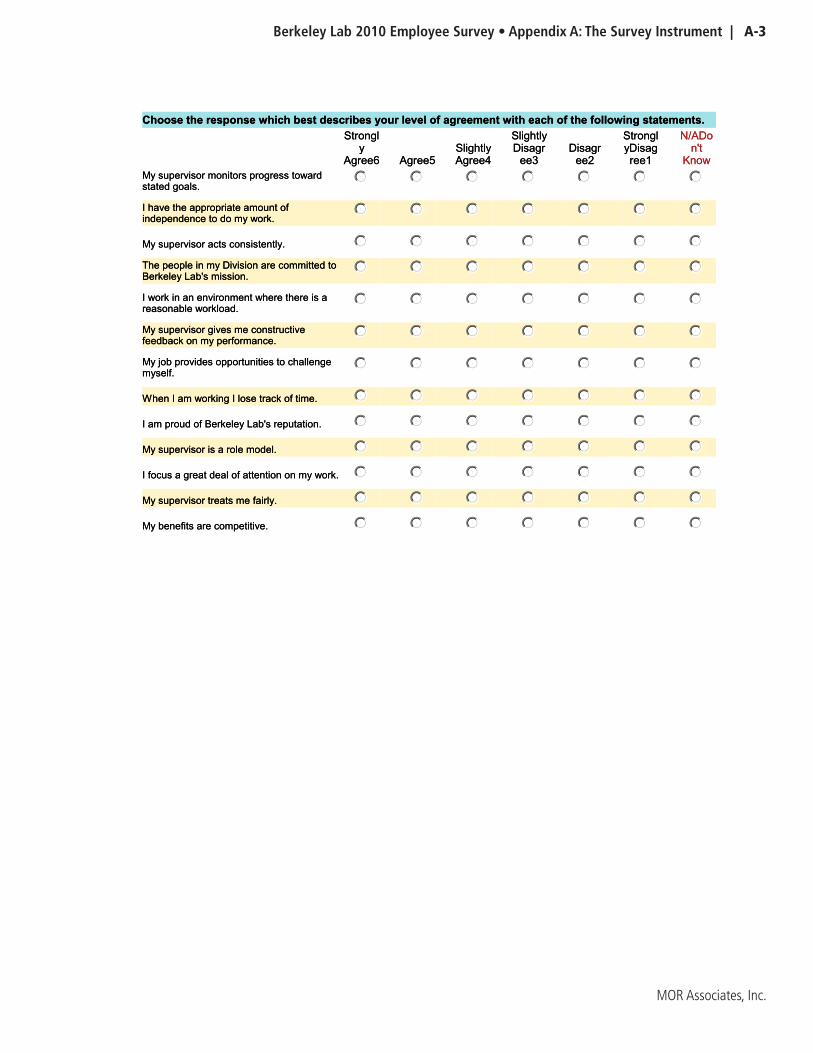
Berkeley Lab 2010 Employee Survey • Appendix A: The Survey Instrument | A-3
MOR Associates, Inc.
Choose the response which best describes your level of agreement with each of the following statements.
My supervisor monitors progress towardstated goals.
Strongly
Agree6
Agree5
SlightlyAgree4
SlightlyDisagr
ee3
Disagree2
StronglyDisagree1
N/ADon't
Know
I have the appropriate amount ofindependence to do my work.
My supervisor acts consistently.
The people in my Division are committed toBerkeley Lab's mission.
I work in an environment where there is areasonable workload.
My supervisor gives me constructivefeedback on my performance.
My job provides opportunities to challengemyself.
When I am working I lose track of time.
I am proud of Berkeley Lab's reputation.
My supervisor is a role model.
I focus a great deal of attention on my work.
My supervisor treats me fairly.
My benefits are competitive.

A-4 | Appendix A: The Survey Instrument • Berkeley Lab 2010 Employee Climate Survey
MOR Associates, Inc.
Choose the response which best describes your level of agreement with each of the following statements.
Quality work is highly valued at BerkeleyLab.
Strongly
Agree6
Agree5
SlightlyAgree4
SlightlyDisagr
ee3
Disagree2
StronglyDisagree1
N/ADon't
Know
My responsibilities related to safety havebeen clearly communicated to me.
My supervisor holds people accountable formeeting deadlines.
My supervisor and I discuss mydevelopment plan.
My ideas on work process and procedureimprovements are valued.
My supervisor is knowledgeable about thework.
I work with colleagues in my group who arecommitted to Berkeley Lab's mission.
My group has enough staff to get the workdone in a quality manner.
I am satisfied with my benefits.
What I do at work is a good reflection of whoI am.
My office layout enhances my ability to domy work.
My supervisor appreciates my efforts.
My work advances Berkeley Lab's mission.
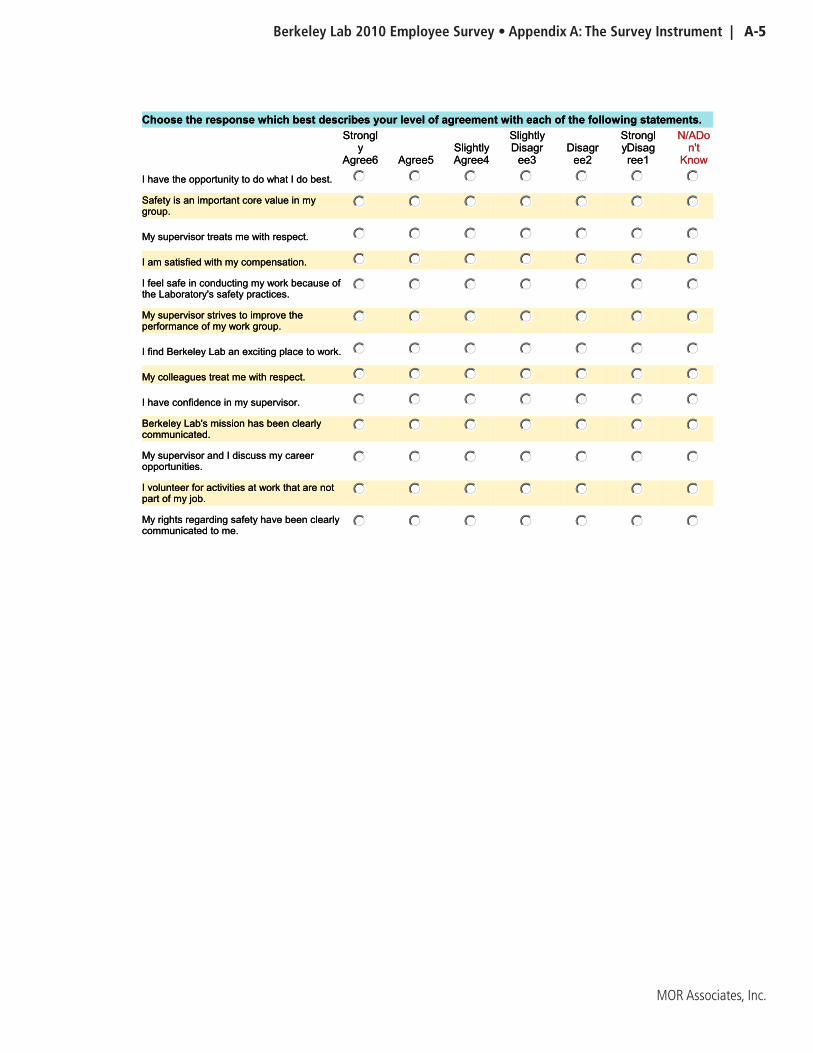
Berkeley Lab 2010 Employee Survey • Appendix A: The Survey Instrument | A-5
MOR Associates, Inc.
Choose the response which best describes your level of agreement with each of the following statements.
I have the opportunity to do what I do best.
Strongly
Agree6
Agree5
SlightlyAgree4
SlightlyDisagr
ee3
Disagree2
StronglyDisagree1
N/ADon't
Know
Safety is an important core value in mygroup.
My supervisor treats me with respect.
I am satisfied with my compensation.
I feel safe in conducting my work because ofthe Laboratory's safety practices.
My supervisor strives to improve theperformance of my work group.
I find Berkeley Lab an exciting place to work.
My colleagues treat me with respect.
I have confidence in my supervisor.
Berkeley Lab's mission has been clearlycommunicated.
My supervisor and I discuss my careeropportunities.
I volunteer for activities at work that are notpart of my job.
My rights regarding safety have been clearlycommunicated to me.
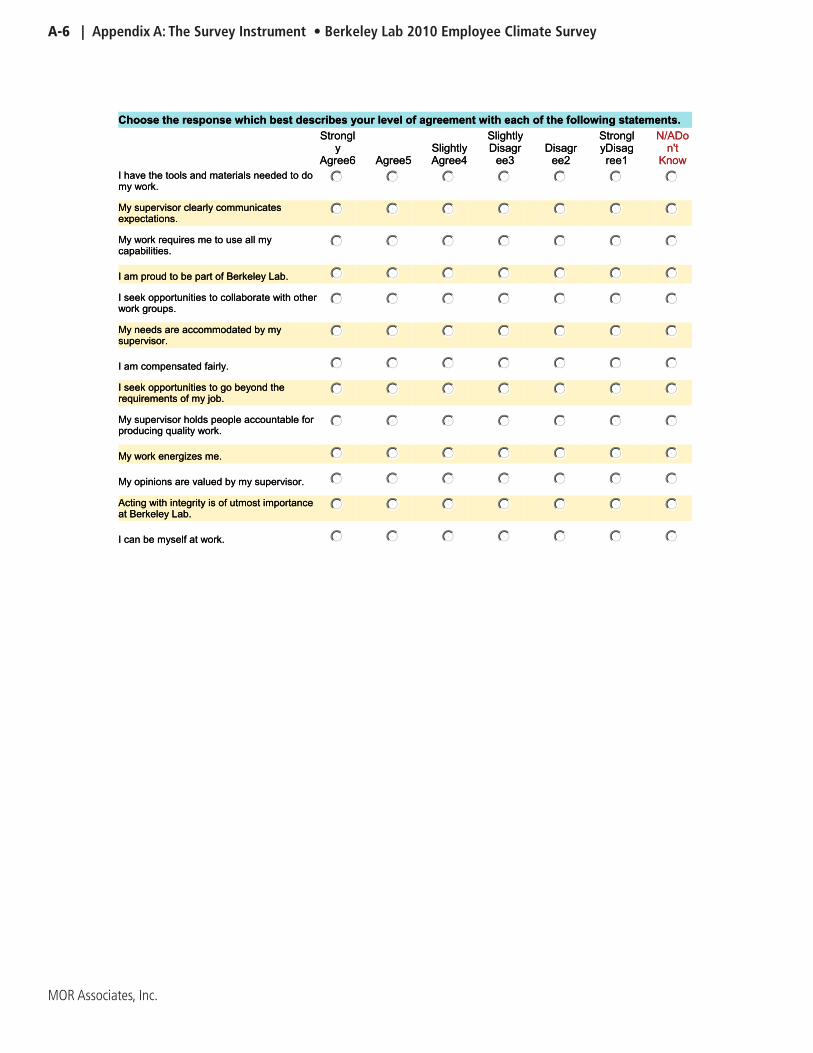
A-6 | Appendix A: The Survey Instrument • Berkeley Lab 2010 Employee Climate Survey
MOR Associates, Inc.
Choose the response which best describes your level of agreement with each of the following statements.
I have the tools and materials needed to domy work.
Strongly
Agree6
Agree5
SlightlyAgree4
SlightlyDisagr
ee3
Disagree2
StronglyDisagree1
N/ADon't
Know
My supervisor clearly communicatesexpectations.
My work requires me to use all mycapabilities.
I am proud to be part of Berkeley Lab.
I seek opportunities to collaborate with otherwork groups.
My needs are accommodated by mysupervisor.
I am compensated fairly.
I seek opportunities to go beyond therequirements of my job.
My supervisor holds people accountable forproducing quality work.
My work energizes me.
My opinions are valued by my supervisor.
Acting with integrity is of utmost importanceat Berkeley Lab.
I can be myself at work.
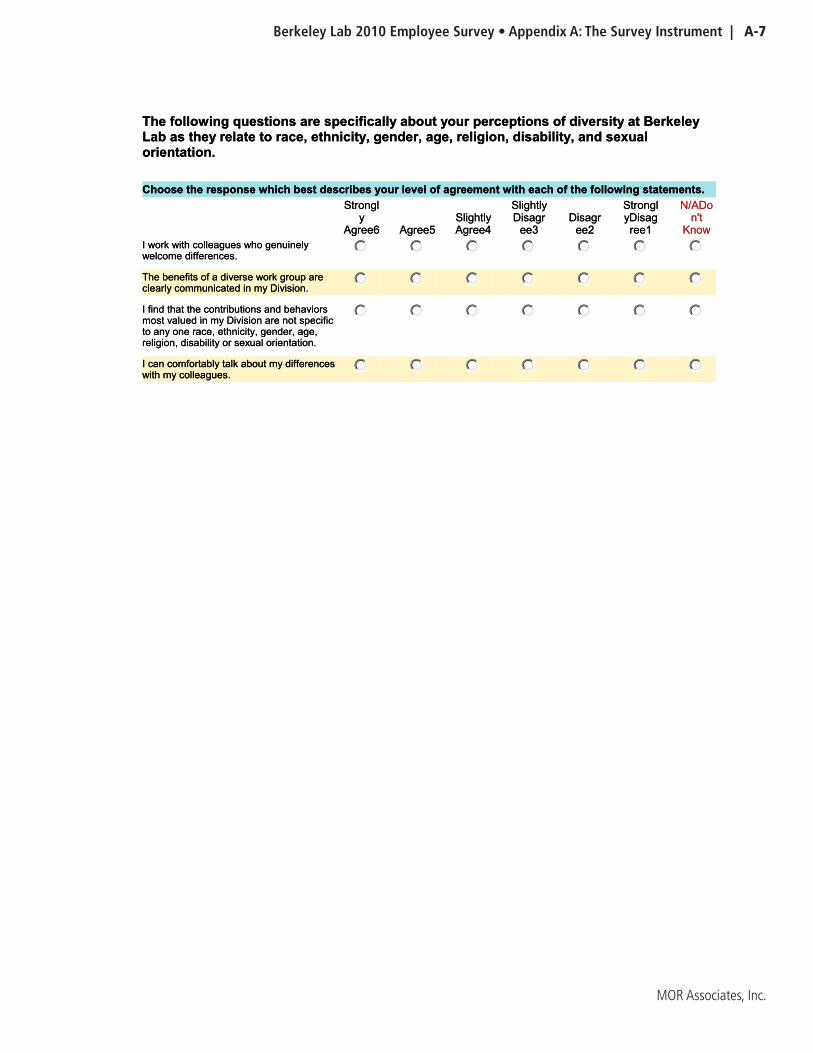
Berkeley Lab 2010 Employee Survey • Appendix A: The Survey Instrument | A-7
MOR Associates, Inc.
The following questions are specifically about your perceptions of diversity at BerkeleyLab as they relate to race, ethnicity, gender, age, religion, disability, and sexualorientation.
Choose the response which best describes your level of agreement with each of the following statements.
I work with colleagues who genuinelywelcome differences.
Strongly
Agree6
Agree5
SlightlyAgree4
SlightlyDisagr
ee3
Disagree2
StronglyDisagree1
N/ADon't
Know
The benefits of a diverse work group areclearly communicated in my Division.
I find that the contributions and behaviorsmost valued in my Division are not specificto any one race, ethnicity, gender, age,religion, disability or sexual orientation.
I can comfortably talk about my differenceswith my colleagues.
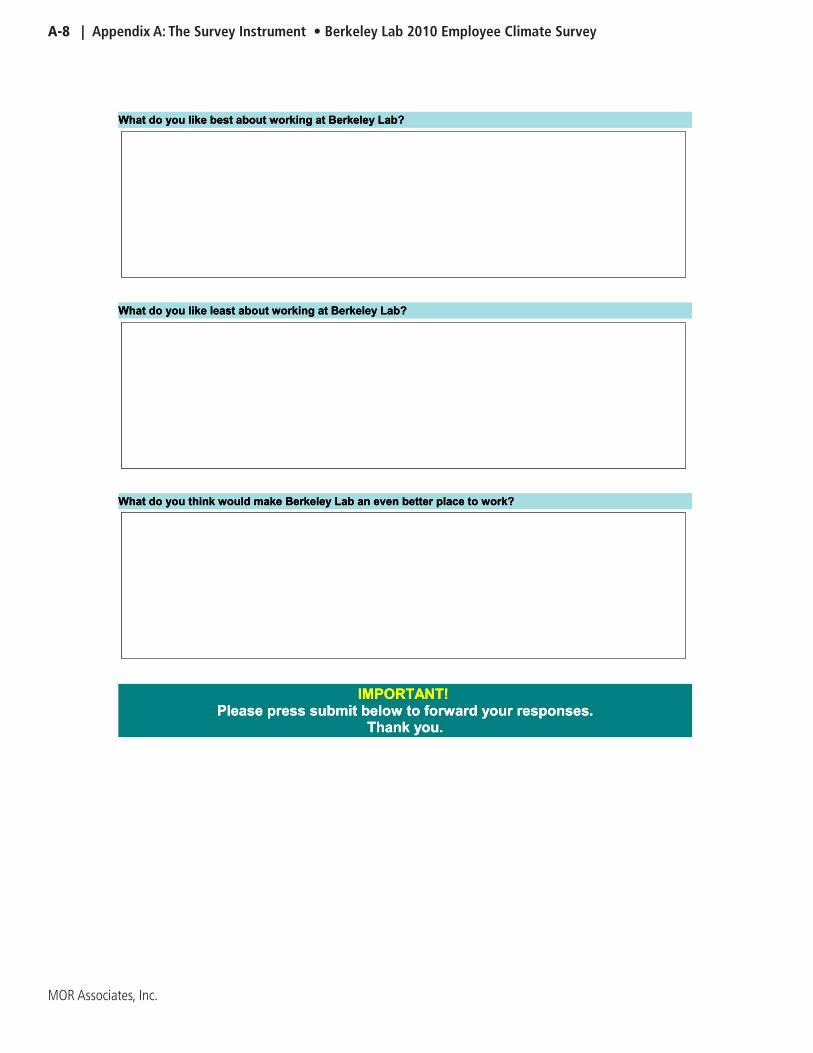
A-8 | Appendix A: The Survey Instrument • Berkeley Lab 2010 Employee Climate Survey
MOR Associates, Inc.
What do you like best about working at Berkeley Lab?
What do you like least about working at Berkeley Lab?
What do you think would make Berkeley Lab an even better place to work?
IMPORTANT!Please press submit below to forward your responses.
Thank you.
What do you like best about working at Berkeley Lab?
What do you like least about working at Berkeley Lab?
What do you think would make Berkeley Lab an even better place to work?
IMPORTANT!Please press submit below to forward your responses.
Thank you.