Embed Size (px)
Citation preview
patient characteristics
3
William Carlos Williams
“The Library”
For there is a wind or a ghost of windin all books echoing the lifethere, a high wind that fills the tubes of the ear until we think we hear a wind,actual.

3patient characteristics
88 | cardiovascular comorbidity in diabetic & non-diabetic patients with hypertension
90 | adherence to prescription drug therapy at or near initiation ACE-Is/ARBs || beta blockers || calcium channel blockers || diuretics || lipid lowering agents || anti-diabetic drugs
92 | EPO use & anemia at initiation mean hemoglobin || EPO use || geographic variations in mean hemoglobin & in pre-ESRD EPO use
94 | biochemical characteristics BUN || serum creatinine || BUN/serum creatinine ratio
96 | predictors of eGFR eGFR at initiation || body mass index || eGFR, by diabetic status & cardiac comorbidity, & by number of comorbidities
98 | summary
Figure 3.13 Patients who receive EPO
prior to initiation are likely to have
higher mean hemoglobins than
those not on the therapy. Figure 3.16
Since 1999, blacks have experienced
the largest increase in mean hemo-
globin at initiation—approximately
0.5 g/dl. Figure 3.21 Native Americans
had the largest decrease in BUN
levels between 1995 and 2005, at
12.3 mg/dl, and in 2005 also had the
lowest BUNs at initiation, at 79.6
mg/dl; the highest levels occurred
in Asians and whites, at 85.2 and
83.9 mg/dl, respectively. Figure 3.29 In
2005, estimated glomerular filtration
rates rose slightly compared to those
in 2004, but the upward trend of
these rates since 1995 appears to be
leveling.
contents
highlights
ecause patients with chronic kidney disease are more likely to die than to reach end-stage renal disease, incident ESRD patients—who have survived CKD—are unique. And it should not be surprising that they
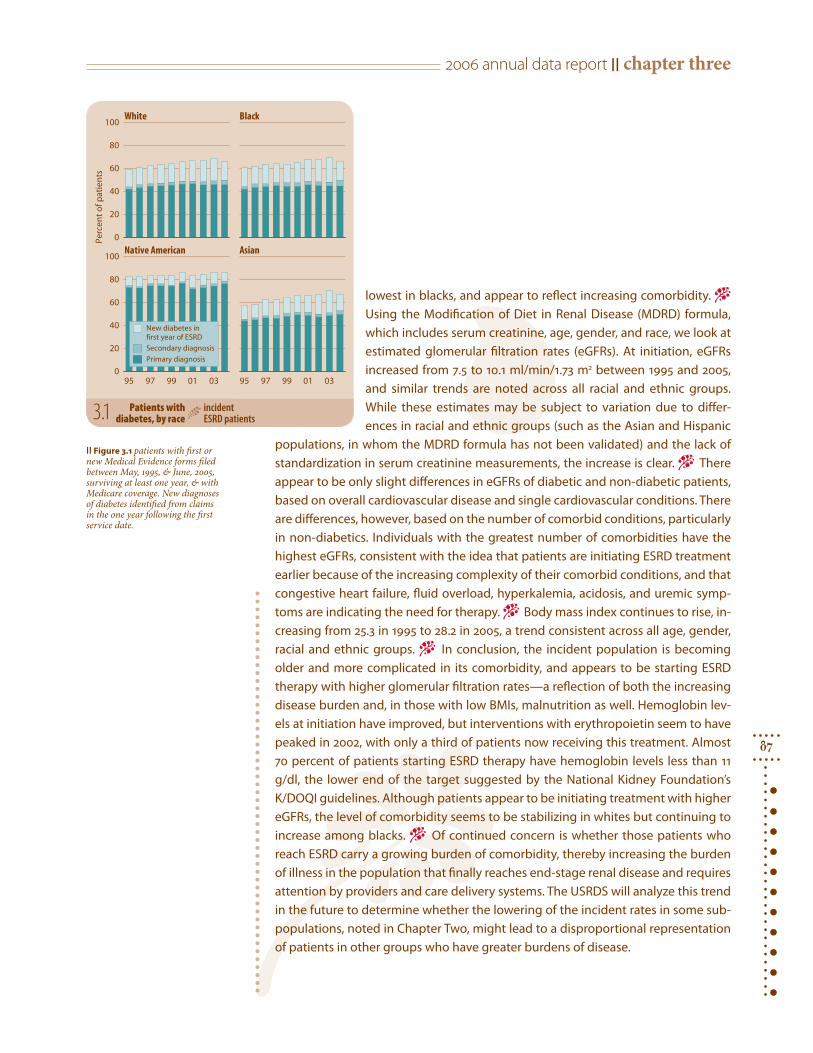
are affected by an increasing level of comorbidity. − Since diabetes is the leading cause of ESRD, we assessed the total burden of the disease at the initiation of ESRD therapy. As either a primary or secondary cause of ESRD, the occurrence of diabe-tes in new patients has grown, in whites, from 43.9 percent in 1995 to 49.8 percent in 2004, and in Asians from 45.6 to 52.9 percent. Over the same period the total dia-betes burden assessed in those who survive the first year of ESRD treatment has in-creased from 59 to 66 percent in whites, 60.6 to 66.3 percent in blacks, 82.4 to 86.1 percent in Native Americans, and 57.4 to 66.9 percent in Asians. Increases in comor-bidity at initiation had appeared to stabilize after 1996, but overall CVD comorbidity masks increases in CHF, ISHD, and PVD, most notably in the black population. − We look here also at the prescription drug therapy used to treat some of these diseases. Since medication adherence is an indicator of consistency of treatment, we report on the Medication Possession Ratio, a measure of gaps in the refilling of prescrip-tions. Among patients receiving ACE-Is or ARBs, almost one-third have missed a pre-scription in a six-month period, a number which reaches 45 percent for those with at least 12 months of treatment. This pattern is similar for those treated with beta blockers, calcium channel blockers, or diuretics. With these medications shown in clinical trials to influence outcomes, adherence to treatment is an area of concern for the ESRD population. − Over the last decade there has been a slow but steady increase in the mean hemoglobin level at initiation of ESRD treatment, from 9.2 to 10.3 g/dl between May, 1995, and May, 2005; the percent of patients receiving eryth-ropoietin treatment prior to initiation has grown as well, but has remained at 33 percent for the last four years. As noted in previous ADRs, African-American patients entering treatment have lower hemoglobins, but it appears that the disparity be-tween whites and blacks is narrowing. Interestingly, patients who enter ESRD with secondary glomerulonephritis have hemoglobin levels almost 0.5–1.0 g/dl lower than those with ESRD due to primary glomerular diseases, and their EPO use before initiation is lower. These data suggest that pre-ESRD anemia management needs to improve, using National Kidney Foundation guidelines. − Lower hemoglobin levels at initiation are, not surprisingly, associated with high BUNs and creatinines, or the most advanced stage of kidney failure, and with greater comorbidity, linked to earlier initiation of ESRD therapy and greater severity of disease. − Lower BUN and creatinine levels at initiation suggest that patients are starting dialysis earlier in their course of progression to ESRD. BUN/creatinine ratios increase with age, are
B
2006 annual data report || chapter three
87
lowest in blacks, and appear to reflect increasing comorbidity. − Using the Modification of Diet in Renal Disease (MDRD) formula, which includes serum creatinine, age, gender, and race, we look at estimated glomerular filtration rates (eGFRs). At initiation, eGFRs increased from 7.5 to 10.1 ml/min/1.73 m2 between 1995 and 2005, and similar trends are noted across all racial and ethnic groups. While these estimates may be subject to variation due to differ-ences in racial and ethnic groups (such as the Asian and Hispanic
populations, in whom the MDRD formula has not been validated) and the lack of standardization in serum creatinine measurements, the increase is clear. − There appear to be only slight differences in eGFRs of diabetic and non-diabetic patients, based on overall cardiovascular disease and single cardiovascular conditions. There are differences, however, based on the number of comorbid conditions, particularly in non-diabetics. Individuals with the greatest number of comorbidities have the highest eGFRs, consistent with the idea that patients are initiating ESRD treatment earlier because of the increasing complexity of their comorbid conditions, and that congestive heart failure, fluid overload, hyperkalemia, acidosis, and uremic symp-toms are indicating the need for therapy. − Body mass index continues to rise, in-creasing from 25.3 in 1995 to 28.2 in 2005, a trend consistent across all age, gender, racial and ethnic groups. − In conclusion, the incident population is becoming older and more complicated in its comorbidity, and appears to be starting ESRD therapy with higher glomerular filtration rates—a reflection of both the increasing disease burden and, in those with low BMIs, malnutrition as well. Hemoglobin lev-els at initiation have improved, but interventions with erythropoietin seem to have peaked in 2002, with only a third of patients now receiving this treatment. Almost 70 percent of patients starting ESRD therapy have hemoglobin levels less than 11 g/dl, the lower end of the target suggested by the National Kidney Foundation’s K/DOQI guidelines. Although patients appear to be initiating treatment with higher eGFRs, the level of comorbidity seems to be stabilizing in whites but continuing to increase among blacks. − Of continued concern is whether those patients who reach ESRD carry a growing burden of comorbidity, thereby increasing the burden of illness in the population that finally reaches end-stage renal disease and requires attention by providers and care delivery systems. The USRDS will analyze this trend in the future to determine whether the lowering of the incident rates in some sub-populations, noted in Chapter Two, might lead to a disproportional representation of patients in other groups who have greater burdens of disease.
95 97 99 01 03 95 97 99 01 03 0
20
40
60
80
100
stneita
p fo t
necr eP 0
20
40
60
80
100White
Native American
Black
Asian
Primary diagnosis
Secondary diagnosis
New diabetes in first year of ESRD
|| Figure 3.1 patients with first or new Medical Evidence forms filed between May, 1995, & June, 2005, surviving at least one year, & with Medicare coverage. New diagnoses of diabetes identified from claims in the one year following the first service date.
3.1 Patients with diabetes, by race incident
ESRD patients

3patient characteristics
88
cardiovascular comorbidity
0
20
40
60
80
100
0
10
20
30
40
50
0
10
20
30
All CVD: all patients
CHF
ISHD
PVD
84 88 92 96 000
5
10
15
20
25
dezilatips
oh s t
n eitap f
o tn ec reP
84 88 92 96 00 84 88 92 96 00Year of initiation
White Black
65-7475+
20-4445-64
84 88 92 96 00
dezilatips
oh st
neitap f o t
necr eP 0
20
40
60
80
Year of initiation84 88 92 96 00 84 88 92 96 00
All White Black
ISHD PVD
All cardiovascular disease CHF
rior to 1995, comorbid conditions were not included on the Medical Evidence form, making it diffi-
cult to assess long-term comorbidity. As an alternative, we again use inpatient hospital-ization claims to assess comorbidity, look-ing here at the presence of cardiovascular disease since 1984 in diabetic and non-dia-betic patients with hypertension.
Among incident diabetic patients with hypertension, the proportion hospitalized with any cardiovascular disease in the first year of therapy increased from 41.0 percent in 1984 to 60.3 percent in 2003; most of this growth, however, occurred during the 1980s and early 1990s, and since 1997 the rate has remained stable at 59–60 percent (Figure 3.2). A similar pattern is seen among non-diabetic patients with hypertension (Figure 3.4). The proportion hospitalized with car-diovascular disease rose from 40 percent in 1984 to 55 percent in 2003, with rates remain-ing at 54–55 percent since 1997.
The proportion of incident patients hospitalized with congestive heart failure has also increased—from 18 percent in 1984 to 36.4 percent in 2003 among dia-betic patients with hypertension, and from 18 percent to 32 percent among those with hypertension only. Rates of ischemic heart disease, in contrast, have remained rela-tively steady, varying between 10 and 15 percent in diabetic patients, and 10 and 14 percent in non-diabetics. And since 1995, peripheral vascular disease has been found in 14–15 percent of hospitalized patients with diabetes and hypertension, and 9–11 percent of those with hypertension only.
Cardiovascular comorbidity differs by race. In 2003, for example, among hospi-talized diabetic patients with hyperten-sion, 62.2 percent of whites had some form of cardiovascular disease, compared to 57.4 percent of blacks. Among hospitalized non-diabetic patients with hypertension, the numbers were 58.1 and 51.1, respectively.
The presense of cardiovascular dis-ease also varies by age (Figures 3.3 and 3.5). Regardless of diabetic status or race, patients age 65 and older are most likely to be hos-pitalized with the disease, and patients age 20–44 the least. These younger patients, however, have seen a greater increase in car-diovascular disease than their older coun-
3.3 Cardiovascular comorbidity in incident pts who survive one year after ESRD initiation: DM pts with HTN, by age & race
incident Medicare pts surviving one year + 90 days after initiation
P3.2 Cardiovascular comorbidity in incident patients who survive
one year after ESRD initiation: DM patients with HTN, by raceincident Medicare pts surviving 1 yr + 90 days after initiation
terparts; among those with diabetes and hypertension, the percent hospitalized with
any cardiovascular disease increased from 29.3 in 1984 to 44.2 in 2003. −

2006 annual data report || chapter three
89
0
20
40
60
80
100
0
10
20
30
40
50
0
10
20
30
All CVD: all patients
CHF
ISHD
PVD
84 88 92 96 000
5
10
15
20
25
dezilatips
oh st
n eit ap f
o tnecreP
84 88 92 96 00 84 88 92 96 00Year of initiation
White Black
65-7475+
20-4445-64
dezilatips
oh st
neitap f
o tn ecr eP 0
20
40
60
80
Year of initiation
All White Black
ISHD PVD
All cardiovascular disease CHF
84 88 92 96 00 84 88 92 96 00 84 88 92 96 00
3.5 Cardiovascular comorbidity in incident pts who survive one year after ESRD initiation: NDM pts with HTN, by age & race
incident Medicare pts surviving one year + 90 days after initiation
3.4 Cardiovascular comorbidity in incident patients who survive 1 year after ESRD initiation: NDM patients with HTN, by race
incident Medicare pts surviving 1 yr + 90 days after initiation
|| Figures 3.2–5 incident Medicare patients surviv-ing one year + 90 days after initiation, with Medicare Parts A & B as primary payor. Hospitalization data, 1984–1990, from REBUS inpatient hospitalization diagnosis codes; 1991–2004 data from ESRD inpa-tient database.
3patient characteristics
90
adherence to prescription drug therapy at or near initiation
Months
6 12 18 24 12+ mo.
)%(
RPM
20
36
52
68
84
<6565+
Months
6 12 18 24 12+ mo.
)%( RP
M
20
36
52
68
84
<6565+
20
36
52
68
84
Months
6 12 18 24 12+ mo.
)%( RP
M
20
36
52
68
84
Dihydropyridine
Non-dihydropyridine
<65 65+
)%(
RPM
20
36
52
68
84
Months
6 12 18 24 12+ mo.20
36
52
68
84
Loop diuretic
Thiazide-like diuretic
<6565+
3.6 Adherence to drug therapy: ACE-Is/ARBs, by age
incident ESRD patients, 2000–2004 combined 3.7
3.8 Adherence to drug therapy: calcium channel blockers, by age
incident ESRD patients, 2000–2004 combined 3.9 Adherence to drug
therapy: diuretics, by ageincident ESRD patients, 2000–2004 combined
Adherence to drug therapy: beta blockers, by age
incident ESRD patients, 2000–2004 combined
2006 annual data report || chapter three
91
)%(
RPM
20
36
52
68
84
Months
6 12 18 24 12+ mo.20
36
52
68
84
Statins
Non-statins
<6565+
)%( RP
M
20
36
52
68
84
Months
6 12 18 24 12+ mo.20
36
52
68
84Secretagogues
Thiazolidinediones
<6565+
3.10 Adherence to drug therapy: lipid lowering agents, by age
incident ESRD patients, 2000–2004 combined
3.11 Adherence to drug therapy: oral anti-diabetic drugs, by age
incident ESRD patients, 2000–2004 combined
he improvement of medication adherence, or compli-ance, has assumed a prominent role in various initia-tives promoting quality care in the general population.
As noted in our Chapter One spread on prescription drug ther-apy, to assess adherence there must be evidence that a medication was obtained and taken. Pharmacy prescription and refill records, obtained through acquisition of claims data, can provide informa-tion on patterns of drug prescribing and use.
New end-stage renal disease patients have complex comorbidi-ties that result in the prescribing of multiple medications. They are a vulnerable population, prone to cardiovascular and infectious com-plications and death. Numerous studies in the general population have assessed the relationship of medication adherence to various outcome measures, but none have done so for new ESRD patients. Medications are often the most cost-effective interventions that can be used to prevent, treat, or manage a medical condition.
As in Chapters One and Five, we here evaluate pharmacy pre-scription claims data from the Medstat MarketScan Research Database, which contains data on EGHP patients. We use a widely adopted adherence measure called the medication possession ratio (MPR), described by Sikka et al. as “the sum of the days’ supply of medication divided by the number of days between the first fill and the last refill plus the days’ supply of the last refill.” The MPR is usu-ally less than 1.0 if a patient does not refill a prescription.
We calculate the MPR using set followup periods of 6, 12, 18, and 24 months to show the effect of this time across different med-ication classes. We also evaluate a followup period of at least 12 months (dots on graphs), allowing followup for as long as a patient is covered by insurance.
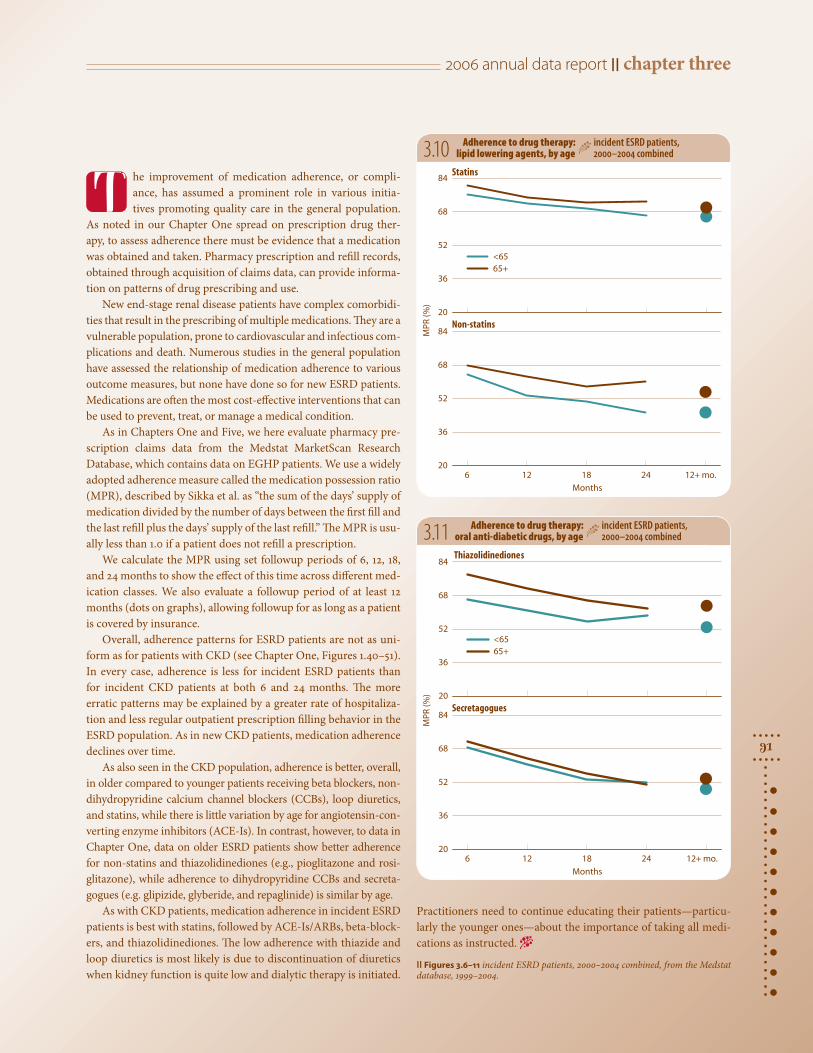
Overall, adherence patterns for ESRD patients are not as uni-form as for patients with CKD (see Chapter One, Figures 1.40–51). In every case, adherence is less for incident ESRD patients than for incident CKD patients at both 6 and 24 months. The more erratic patterns may be explained by a greater rate of hospitaliza-tion and less regular outpatient prescription filling behavior in the ESRD population. As in new CKD patients, medication adherence declines over time.
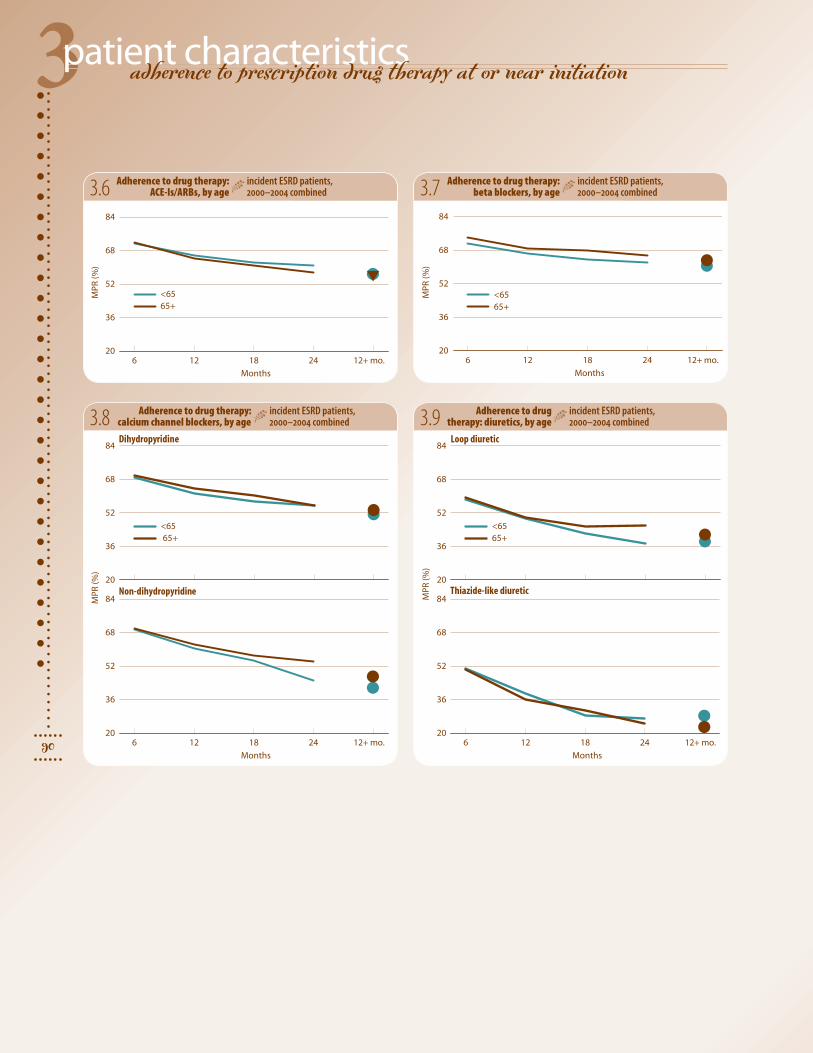
As also seen in the CKD population, adherence is better, overall, in older compared to younger patients receiving beta blockers, non-dihydropyridine calcium channel blockers (CCBs), loop diuretics, and statins, while there is little variation by age for angiotensin-con-verting enzyme inhibitors (ACE-Is). In contrast, however, to data in Chapter One, data on older ESRD patients show better adherence for non-statins and thiazolidinediones (e.g., pioglitazone and rosi-glitazone), while adherence to dihydropyridine CCBs and secreta-gogues (e.g. glipizide, glyberide, and repaglinide) is similar by age.
As with CKD patients, medication adherence in incident ESRD patients is best with statins, followed by ACE-Is/ARBs, beta-block-ers, and thiazolidinediones. The low adherence with thiazide and loop diuretics is most likely is due to discontinuation of diuretics when kidney function is quite low and dialytic therapy is initiated.
T
Practitioners need to continue educating their patients—particu-larly the younger ones—about the importance of taking all medi-cations as instructed. −
|| Figures 3.6–11 incident ESRD patients, 2000–2004 combined, from the Medstat database, 1999–2004.
3patient characteristics
92
EPO use & anemia at initiation
9-<10
<9
10-<11
12+
96 97 98 99 00 01 02 03 04 05
)ld/
g( ni
bo l
go
meH
9
10
11
12
Hemodialysis
Peritoneal dialysis
Transplant
All
96 97 98 99 00 01 02 03 04 05
)ld/
g( ni
bol
go
meH
9.0
9.4
9.8
10.2
10.6
OPE g
niviecer tnecreP
20
24
28
32
36
Hgb:with EPO
Hgb: without EPO
Hgb: Overall
% receiving EPO
96 97 98 99 00 01 02 03 04 05
stneita
p fo t
nec reP
0
20
40
60
80
100
11-<12
)ld/
g( ni
bol
go
meH
8.4
8.8
9.2
9.6
10.0
10.4
1999
2004
Mean hemoglobin: Male Female
OP E g
niviecer stne it a
p fo t
necre P 0
10
20
30
40
50EPO use
)ld/
g( ni
bol
go
meH
8.4
8.8
9.2
9.6
10.0
10.4
1999
2004
Mean hemoglobin: Male Female
All Black AsianWhite N Am Hispanic
All Black AsianWhite N Am Hispanic
All 20-44 65-740-19 45-64 75+
All 20-44 65-740-19 45-64 75+
OPE g
niviec e r stne ita
p fo t
necr eP 0
10
20
30
40
50EPO use
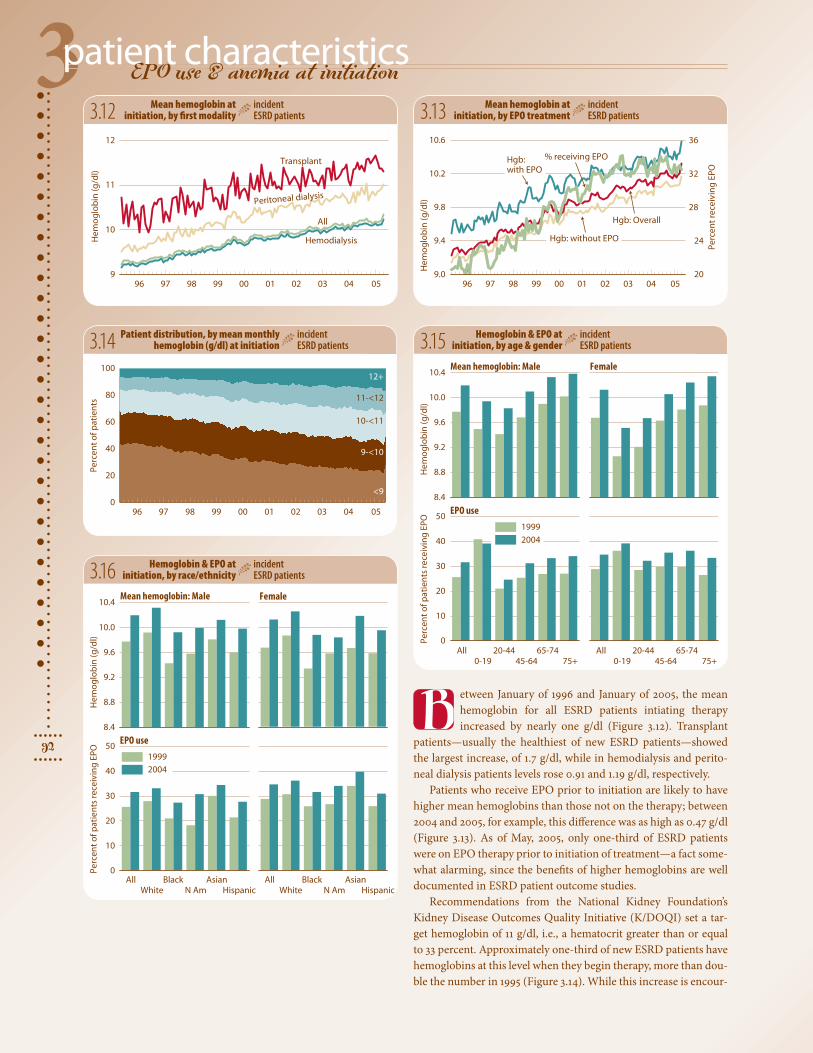
etween January of 1996 and January of 2005, the mean hemoglobin for all ESRD patients intiating therapy increased by nearly one g/dl (Figure 3.12). Transplant
patients—usually the healthiest of new ESRD patients—showed the largest increase, of 1.7 g/dl, while in hemodialysis and perito-neal dialysis patients levels rose 0.91 and 1.19 g/dl, respectively.
Patients who receive EPO prior to initiation are likely to have higher mean hemoglobins than those not on the therapy; between 2004 and 2005, for example, this difference was as high as 0.47 g/dl (Figure 3.13). As of May, 2005, only one-third of ESRD patients were on EPO therapy prior to initiation of treatment—a fact some-what alarming, since the benefits of higher hemoglobins are well documented in ESRD patient outcome studies.
Recommendations from the National Kidney Foundation’s Kidney Disease Outcomes Quality Initiative (K/DOQI) set a tar-get hemoglobin of 11 g/dl, i.e., a hematocrit greater than or equal to 33 percent. Approximately one-third of new ESRD patients have hemoglobins at this level when they begin therapy, more than dou-ble the number in 1995 (Figure 3.14). While this increase is encour-
3.12 3.13
3.15
3.16
3.14
Mean hemoglobin at initiation, by EPO treatment
incident ESRD patients
Hemoglobin & EPO at initiation, by age & gender
incident ESRD patients
Hemoglobin & EPO at initiation, by race/ethnicity
incident ESRD patients
Patient distribution, by mean monthly hemoglobin (g/dl) at initiation
incident ESRD patients
Mean hemoglobin at initiation, by first modality
incident ESRD patients
B

2006 annual data report || chapter three
93
1998–1999: All patients
95 97 99 01 03 058.8
9.0
9.2
9.4
9.6
9.8
10.0
10.2
Primary glomerulonephritisSecondary glomerulonephritisCancer
Mean hemoglobin Percent receiving EPO
95 97 99 01 03 05
stneita
p fo tnecre
P
0
10
20
30
40
)ld/
g( ni
bol
go
meH
9.98 + (10.14)9.82 to <9.989.72 to <9.829.55 to <9.72below 9.55 (9.36)
10.48 + (10.63)10.31 to <10.4810.16 to <10.31
9.98 to <10.16below 9.98 (9.81)
35.8 + (41.8)30.6 to <35.826.6 to <30.622.1 to <26.6below 22.1 (17.0)
35.8 + (43.3)30.6 to <35.826.6 to <30.622.1 to <26.6below 22.1 (18.6)
3.19
3.17 3.18
aging, nearly 50 percent of new ESRD patients still begin therapy with a hemo-globin below 10 g/dl.
Between 1999 and 2004, hemoglobin levels at initiation increased 0.42 and 0.45 g/dl overall in males and females, respec-tively, and they remain slightly higher in older patients of each gender (Figure 3.15). EPO use has grown by about 6 percent, but use in male children has decreased by nearly 2 percent.
Since 1999, blacks have experienced the largest increase in mean hemoglobin levels at initiation—approximately 0.5 g/dl (Fig-ure 3.16). It is important to note, however, that mean hemoglobins in this population tend to be the lowest compared to all other racial and ethnic groups, and that in 2004, blacks and Hispanics were the least likely to receive EPO therapy prior to initiation.
Mean hemoglobins at initiation are high-est in the Upper Midwest, the Rocky Moun-tains, and locales along the Pacific Coast (Figure 3.17). In 2003–2004, hemoglobins in patients residing in these areas averaged
0.82 g/dl higher at initiation compared to those in patients living in areas represented by the bottom quintile. In many cases, the percent of patients receiving EPO prior to initiation is highest in these same areas (Fig-ure 3.18). More than 43 percent of patients residing in areas represented by the upper quintile were given EPO prior to beginning ESRD therapy.
When comparing patients who initiate ESRD therapy with either primary or sec-
Mean hemoglobin & EPO use at initiation, by primary diagnosis
incident ESRD patients
Geographic variations in the percent of patients receiving EPO before initiation, by HSA
incident ESRD patients
Geographic variations in mean hemoglobin (g/dl) at initiation, by HSA
incident ESRD patients
1998–1999
2003–2004
1998–1999
2003–2004
ondary glomerulonephritis or cancer, those with primary glomerulonephritis have the highest mean hemoglobins, at 10.2 g/dl in 2005, and are the most likely to receive EPO prior to initiation (Figure 3.19). −
|| Figures 3.12–19 incident ESRD patients with a first service date between May, 1995, & June, 2005; data from Medical Evidence form. Maps by HSA; exclude patients residing in Puerto Rico & the Territories.
3patient characteristics
94
biochemical characteristics
95 96 97 98 99 00 01 02 03 04 0575
80
85
90
95
1000-1920-4445-6465-7475+All
)ld/
gm(
NU
B
All0-19
20-4445-64
65-7475+
All0-19
20-4445-64
65-7475+
All0-19
20-4445-64
65-7475+
All0-19
20-4445-64
65-7475+
All0-19
20-4445-64
65-7475+
All0-19
20-4445-64
65-7475+
All0-19
20-4445-64
65-7475+
All0-19
20-4445-64
65-7475+
All0-19
20-4445-64
65-7475+
All0-19
20-4445-64
65-7475+
)ld/
gm(
NU
B
70
80
90
1001999
2004
White Native AmericanBlack Asian Hispanic
95 96 97 98 99 00 01 02 03 04 05
)ld/
gm( e
ninitaerc
mu reS
4
6
8
10
120-1920-4445-64
65-7475+All
)ld/
gm( e
ninitae rc
mu re S
4
6
8
10
121999
2004
White Native AmericanBlack Asian Hispanic
95 96 97 98 99 00 01 02 03 04 05)l
d/g
m( N
UB
75
80
85
90
95
100
Asian Hispanic All
White Black N Am
95 96 97 98 99 00 01 02 03 04 05
)ld/
gm( e
ninitaer c
mure S
4
6
8
10
12Asian Hispanic All
White Black N Am
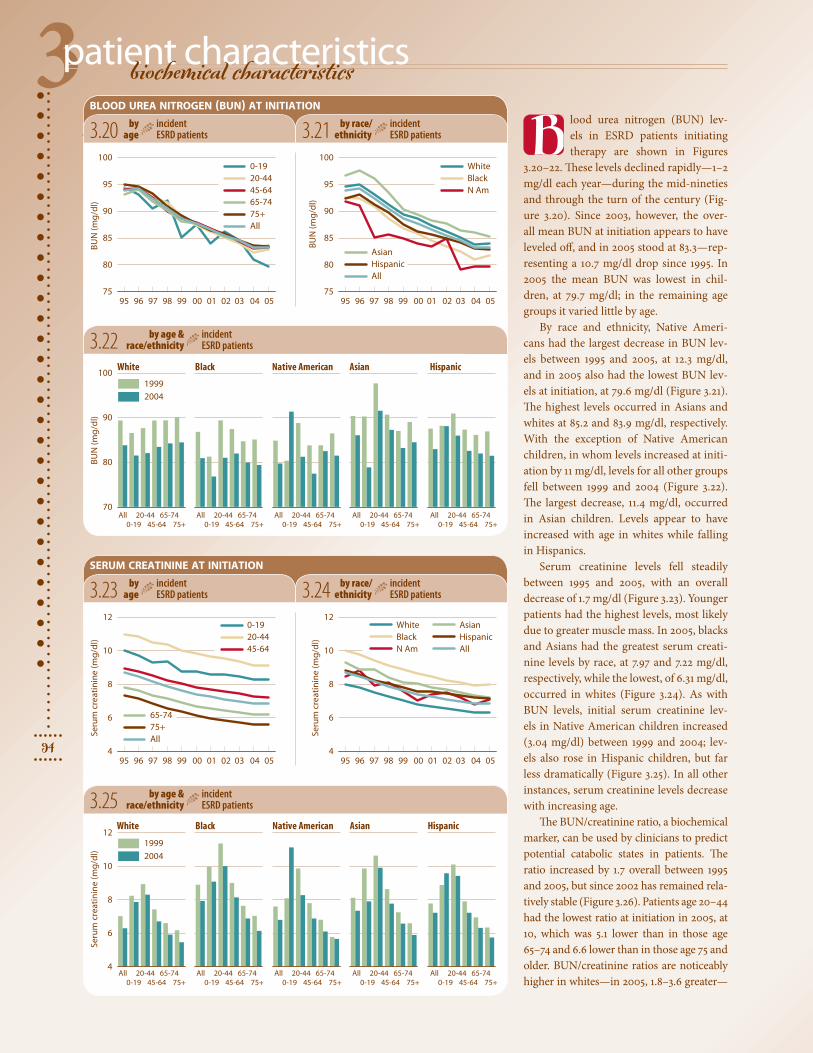
lood urea nitrogen (BUN) lev-els in ESRD patients initiating therapy are shown in Figures
3.20–22. These levels declined rapidly—1–2 mg/dl each year—during the mid-nineties and through the turn of the century (Fig-ure 3.20). Since 2003, however, the over-all mean BUN at initiation appears to have leveled off, and in 2005 stood at 83.3—rep-resenting a 10.7 mg/dl drop since 1995. In 2005 the mean BUN was lowest in chil-dren, at 79.7 mg/dl; in the remaining age groups it varied little by age.
By race and ethnicity, Native Ameri-cans had the largest decrease in BUN lev-els between 1995 and 2005, at 12.3 mg/dl, and in 2005 also had the lowest BUN lev-els at initiation, at 79.6 mg/dl (Figure 3.21). The highest levels occurred in Asians and whites at 85.2 and 83.9 mg/dl, respectively. With the exception of Native American children, in whom levels increased at initi-ation by 11 mg/dl, levels for all other groups fell between 1999 and 2004 (Figure 3.22). The largest decrease, 11.4 mg/dl, occurred in Asian children. Levels appear to have increased with age in whites while falling in Hispanics.
Serum creatinine levels fell steadily between 1995 and 2005, with an overall decrease of 1.7 mg/dl (Figure 3.23). Younger patients had the highest levels, most likely due to greater muscle mass. In 2005, blacks and Asians had the greatest serum creati-nine levels by race, at 7.97 and 7.22 mg/dl, respectively, while the lowest, of 6.31 mg/dl, occurred in whites (Figure 3.24). As with BUN levels, initial serum creatinine lev-els in Native American children increased (3.04 mg/dl) between 1999 and 2004; lev-els also rose in Hispanic children, but far less dramatically (Figure 3.25). In all other instances, serum creatinine levels decrease with increasing age.
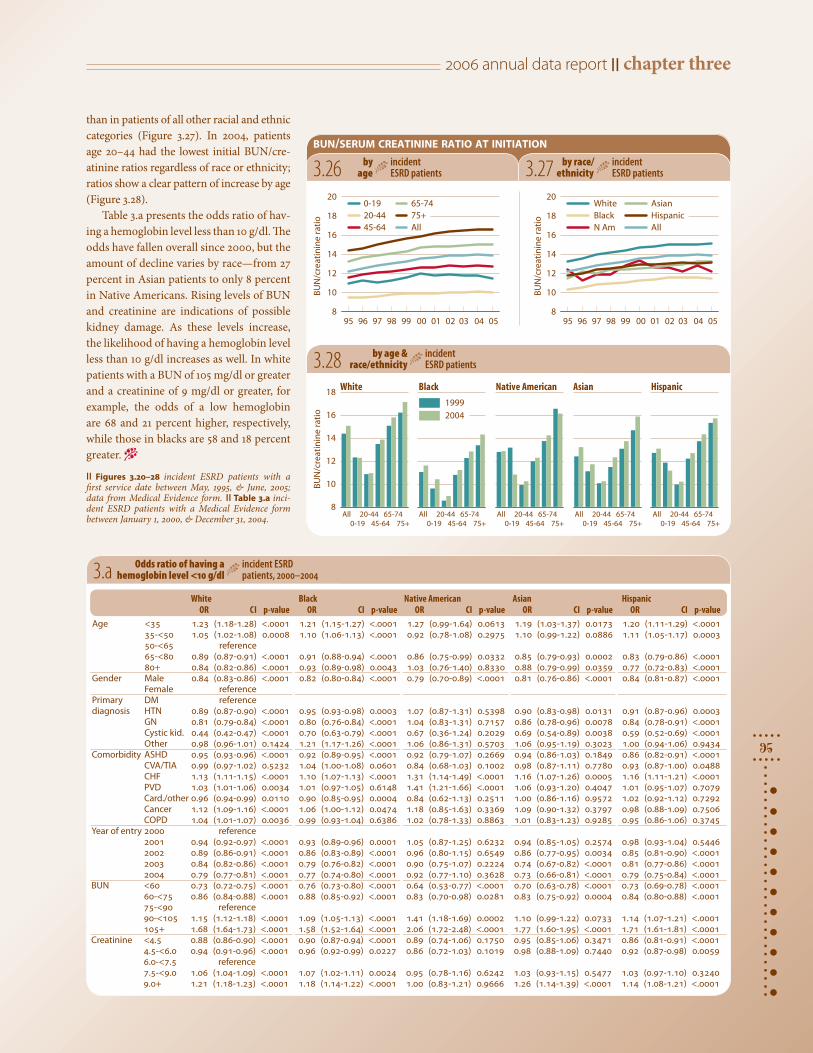
The BUN/creatinine ratio, a biochemical marker, can be used by clinicians to predict potential catabolic states in patients. The ratio increased by 1.7 overall between 1995 and 2005, but since 2002 has remained rela-tively stable (Figure 3.26). Patients age 20–44 had the lowest ratio at initiation in 2005, at 10, which was 5.1 lower than in those age 65–74 and 6.6 lower than in those age 75 and older. BUN/creatinine ratios are noticeably higher in whites—in 2005, 1.8–3.6 greater—
by age
incident ESRD patients3.20
blood urea nitrogen (bun) at initiation
serum creatinine at initiation
3.21
3.22
3.23 3.24
3.25 by age & race/ethnicity
incident ESRD patients
by race/ethnicity
incident ESRD patients
by age
incident ESRD patients
by age & race/ethnicity
incident ESRD patients
by race/ethnicity
incident ESRD patients B
2006 annual data report || chapter three
95
All0-19
20-4445-64
65-7475+
All0-19
20-4445-64
65-7475+
All0-19
20-4445-64
65-7475+
All0-19
20-4445-64
65-7475+
All0-19
20-4445-64
65-7475+
95 96 97 98 99 00 01 02 03 04 05oitar e
ninit aerc/
NU
B8
10
12
14
16
18
200-1920-4445-64
65-7475+All
oitar eni
nita erc/N
UB
8
10
12
14
16
181999
2004
White Native AmericanBlack Asian Hispanic
95 96 97 98 99 00 01 02 03 04 05
oitar eni
nitaerc/N
UB
8
10
12
14
16
18
20White Black N Am
Asian Hispanic All
bun/serum creatinine ratio at initiation
3.a
3.26 3.27
3.28
by race/ethnicity
incident ESRD patients
by age
incident ESRD patients
by age & race/ethnicity
incident ESRD patients
Odds ratio of having a hemoglobin level <10 g/dl
incident ESRD patients, 2000–2004
than in patients of all other racial and ethnic categories (Figure 3.27). In 2004, patients age 20–44 had the lowest initial BUN/cre-atinine ratios regardless of race or ethnicity; ratios show a clear pattern of increase by age (Figure 3.28).
Table 3.a presents the odds ratio of hav-ing a hemoglobin level less than 10 g/dl. The odds have fallen overall since 2000, but the amount of decline varies by race—from 27 percent in Asian patients to only 8 percent in Native Americans. Rising levels of BUN and creatinine are indications of possible kidney damage. As these levels increase, the likelihood of having a hemoglobin level less than 10 g/dl increases as well. In white patients with a BUN of 105 mg/dl or greater and a creatinine of 9 mg/dl or greater, for example, the odds of a low hemoglobin are 68 and 21 percent higher, respectively, while those in blacks are 58 and 18 percent greater. −
|| Figures 3.20–28 incident ESRD patients with a first service date between May, 1995, & June, 2005; data from Medical Evidence form. || Table 3.a inci-dent ESRD patients with a Medical Evidence form between January 1, 2000, & December 31, 2004.
White Black NativeAmerican Asian Hispanic OR CI p-value OR CI p-value OR CI p-value OR CI p-value OR CI p-valueAge <35 1.23 (1.18-1.28) <.0001 1.21 (1.15-1.27) <.0001 1.27 (0.99-1.64) 0.0613 1.19 (1.03-1.37) 0.0173 1.20 (1.11-1.29) <.0001 35-<50 1.05 (1.02-1.08) 0.0008 1.10 (1.06-1.13) <.0001 0.92 (0.78-1.08) 0.2975 1.10 (0.99-1.22) 0.0886 1.11 (1.05-1.17) 0.0003 50-<65 reference 65-<80 0.89 (0.87-0.91) <.0001 0.91 (0.88-0.94) <.0001 0.86 (0.75-0.99) 0.0332 0.85 (0.79-0.93) 0.0002 0.83 (0.79-0.86) <.0001 80+ 0.84 (0.82-0.86) <.0001 0.93 (0.89-0.98) 0.0043 1.03 (0.76-1.40) 0.8330 0.88 (0.79-0.99) 0.0359 0.77 (0.72-0.83) <.0001Gender Male 0.84 (0.83-0.86) <.0001 0.82 (0.80-0.84) <.0001 0.79 (0.70-0.89) <.0001 0.81 (0.76-0.86) <.0001 0.84 (0.81-0.87) <.0001 Female reference Primary DM reference diagnosis HTN 0.89 (0.87-0.90) <.0001 0.95 (0.93-0.98) 0.0003 1.07 (0.87-1.31) 0.5398 0.90 (0.83-0.98) 0.0131 0.91 (0.87-0.96) 0.0003 GN 0.81 (0.79-0.84) <.0001 0.80 (0.76-0.84) <.0001 1.04 (0.83-1.31) 0.7157 0.86 (0.78-0.96) 0.0078 0.84 (0.78-0.91) <.0001 Cystic kid. 0.44 (0.42-0.47) <.0001 0.70 (0.63-0.79) <.0001 0.67 (0.36-1.24) 0.2029 0.69 (0.54-0.89) 0.0038 0.59 (0.52-0.69) <.0001 Other 0.98 (0.96-1.01) 0.1424 1.21 (1.17-1.26) <.0001 1.06 (0.86-1.31) 0.5703 1.06 (0.95-1.19) 0.3023 1.00 (0.94-1.06) 0.9434Comorbidity ASHD 0.95 (0.93-0.96) <.0001 0.92 (0.89-0.95) <.0001 0.92 (0.79-1.07) 0.2669 0.94 (0.86-1.03) 0.1849 0.86 (0.82-0.91) <.0001 CVA/TIA 0.99 (0.97-1.02) 0.5232 1.04 (1.00-1.08) 0.0601 0.84 (0.68-1.03) 0.1002 0.98 (0.87-1.11) 0.7780 0.93 (0.87-1.00) 0.0488 CHF 1.13 (1.11-1.15) <.0001 1.10 (1.07-1.13) <.0001 1.31 (1.14-1.49) <.0001 1.16 (1.07-1.26) 0.0005 1.16 (1.11-1.21) <.0001 PVD 1.03 (1.01-1.06) 0.0034 1.01 (0.97-1.05) 0.6148 1.41 (1.21-1.66) <.0001 1.06 (0.93-1.20) 0.4047 1.01 (0.95-1.07) 0.7079 Card./other 0.96 (0.94-0.99) 0.0110 0.90 (0.85-0.95) 0.0004 0.84 (0.62-1.13) 0.2511 1.00 (0.86-1.16) 0.9572 1.02 (0.92-1.12) 0.7292 Cancer 1.12 (1.09-1.16) <.0001 1.06 (1.00-1.12) 0.0474 1.18 (0.85-1.63) 0.3369 1.09 (0.90-1.32) 0.3797 0.98 (0.88-1.09) 0.7506 COPD 1.04 (1.01-1.07) 0.0036 0.99 (0.93-1.04) 0.6386 1.02 (0.78-1.33) 0.8863 1.01 (0.83-1.23) 0.9285 0.95 (0.86-1.06) 0.3745Year of entry 2000 reference 2001 0.94 (0.92-0.97) <.0001 0.93 (0.89-0.96) 0.0001 1.05 (0.87-1.25) 0.6232 0.94 (0.85-1.05) 0.2574 0.98 (0.93-1.04) 0.5446 2002 0.89 (0.86-0.91) <.0001 0.86 (0.83-0.89) <.0001 0.96 (0.80-1.15) 0.6549 0.86 (0.77-0.95) 0.0034 0.85 (0.81-0.90) <.0001 2003 0.84 (0.82-0.86) <.0001 0.79 (0.76-0.82) <.0001 0.90 (0.75-1.07) 0.2224 0.74 (0.67-0.82) <.0001 0.81 (0.77-0.86) <.0001 2004 0.79 (0.77-0.81) <.0001 0.77 (0.74-0.80) <.0001 0.92 (0.77-1.10) 0.3628 0.73 (0.66-0.81) <.0001 0.79 (0.75-0.84) <.0001BUN <60 0.73 (0.72-0.75) <.0001 0.76 (0.73-0.80) <.0001 0.64 (0.53-0.77) <.0001 0.70 (0.63-0.78) <.0001 0.73 (0.69-0.78) <.0001 60-<75 0.86 (0.84-0.88) <.0001 0.88 (0.85-0.92) <.0001 0.83 (0.70-0.98) 0.0281 0.83 (0.75-0.92) 0.0004 0.84 (0.80-0.88) <.0001 75-<90 reference 90-<105 1.15 (1.12-1.18) <.0001 1.09 (1.05-1.13) <.0001 1.41 (1.18-1.69) 0.0002 1.10 (0.99-1.22) 0.0733 1.14 (1.07-1.21) <.0001 105+ 1.68 (1.64-1.73) <.0001 1.58 (1.52-1.64) <.0001 2.06 (1.72-2.48) <.0001 1.77 (1.60-1.95) <.0001 1.71 (1.61-1.81) <.0001Creatinine <4.5 0.88 (0.86-0.90) <.0001 0.90 (0.87-0.94) <.0001 0.89 (0.74-1.06) 0.1750 0.95 (0.85-1.06) 0.3471 0.86 (0.81-0.91) <.0001 4.5-<6.0 0.94 (0.91-0.96) <.0001 0.96 (0.92-0.99) 0.0227 0.86 (0.72-1.03) 0.1019 0.98 (0.88-1.09) 0.7440 0.92 (0.87-0.98) 0.0059 6.0-<7.5 reference 7.5-<9.0 1.06 (1.04-1.09) <.0001 1.07 (1.02-1.11) 0.0024 0.95 (0.78-1.16) 0.6242 1.03 (0.93-1.15) 0.5477 1.03 (0.97-1.10) 0.3240 9.0+ 1.21 (1.18-1.23) <.0001 1.18 (1.14-1.22) <.0001 1.00 (0.83-1.21) 0.9666 1.26 (1.14-1.39) <.0001 1.14 (1.08-1.21) <.0001
3patient characteristics
96
predictors of eGFR
Black Asian
All0-19
20-4445-64
65-7475+
All0-19
20-4445-64
65-7475+
All0-19
20-4445-64
65-7475+
All0-19
20-4445-64
65-7475+
All0-19
20-4445-64
65-7475+
All0-19
20-4445-64
65-7475+
All0-19
20-4445-64
65-7475+
All0-19
20-4445-64
65-7475+
All0-19
20-4445-64
65-7475+
All0-19
20-4445-64
65-7475+
95 96 97 98 99 00 01 02 03 04 05
m2 )
37.1/ni
m /lm( RF
G em
2 ) 3 7.1/
nim /l
m( RFG e
m2 )
3 7.1/ni
m /lm( RF
G e
6
7
8
9
10
11
12
65-7475+All
0-1920-4445-64
4
6
8
10
121999
2004
Native AmericanWhite Hispanic
Black AsianNative AmericanWhite Hispanic
95 96 97 98 99 00 01 02 03 04 05
m2 )
/gk( I
MBm
2 )/
gk( IMB
m2 )
/gk( I
MB
20
22
24
26
28
300-1920-4445-64
65-7475+All
18
20
22
24
26
28
301999
2004
95 96 97 98 99 00 01 02 03 04 056
7
8
9
10
11White Black N Am
Asian Hispanic All
95 96 97 98 99 00 01 02 03 04 0520
22
24
26
28
30
Asian Hispanic All
White Black N Am
3.29
body mass index (bmi) at initiation
3.30
by age & race/ethnicity
incident ESRD patients3.31
3.32 3.33
3.34
estimated glomerular filtration rate (egfr) at initiation
by age & race/ethnicity
incident ESRD patients
by race/ethnicity
incident ESRD patients
by age
incident ESRD patients
by race/ethnicity
incident ESRD patients
by age
incident ESRD patients

2006 annual data report || chapter three
97
95 97 99 01 03 05
m 37.1/ni
m /lm(
RFG e
2 )
6
7
8
9
10
11
12
All CV disease CHF ISHDPVD
95 97 99 01 03 05 95 97 99 01 03 05
m 37.1/ni
m/lm(
RFGe
2 )
6
7
8
9
10
11
12
Zero 1234-6
Diabetic Non-diabeticDiabetic Non-diabetic
95 97 99 01 03 05
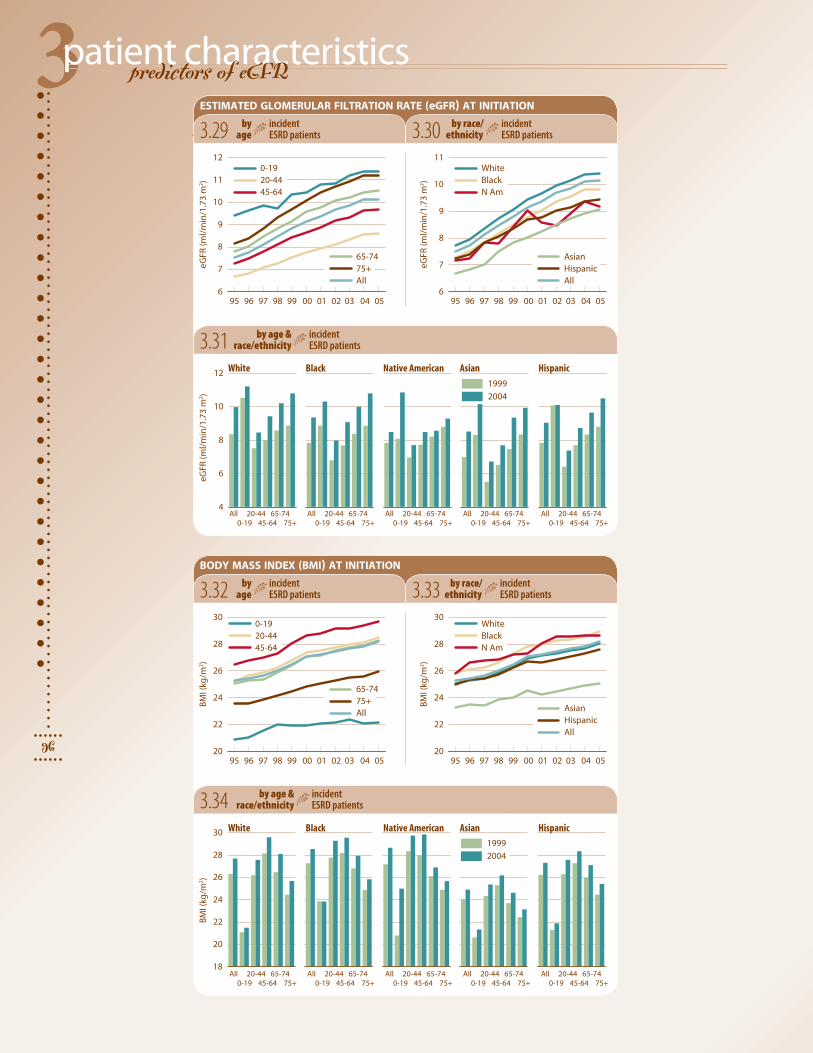
stimated glomerular filtration rates (eGFRs) at initiation are shown in Figures 3.29–31. Rates increased slightly in 2005, but the upward trends evident since 1995 appear to
be leveling off (Figure 3.29). Evidence of this phenomenon can be seen by comparing the increase in eGFR between 1995 and 2005 to that which occured between 1995 and 2002. Between 1995 and 2005, an increase of 2.3 ml/min/1.73 m2 is evident for all patients, while an increase of 2.17 ml/min/1.73 m2 occurred between 1995 and 2002, indicating that 94 pecent of the increase noted between 1995 and 2005 occurred prior to 2003.
Children and those age 75 and older have the highest rates at ini-tiation, at 11.4 and 11.2 ml/min/1.73 m2, respectively, and, beginning with patients age 20–44, rates increase with age regardless of race or ethnic background. Patients age 65–74 and 75 and older show the highest increases in rates since 1995—2.4 and 2.8 ml/min/1.73 m2, respectively. By race and ethnicity, eGFRs in 2005 are highest in whites, at 10.39, and lowest in Asians, at 9.07. And regardless of race or ethnicity, rates are highest in children.
Body mass index (BMI) at initiation is depicted in Figures 3.32–34. Since 1995, BMIs have increased 2.4 kg/m2 for all patients. The largest growth between 1995 and 2005 was 2.7–2.8 kg/m2,
3.35 3.36
found in patients age 20–74. In 2005, the BMI for all patients ini-tiating therapy stood at 28.2 kg/m2. Blacks and Native Americans have the highest BMIs at initiation, at 28.95 and 28.6 kg/m2, respec-tively, a factor that may be related to high rates of diabetes in each of these populations. BMI appears to decrease with age, regardless of racial or ethnic background.
Estimated glomerular filtration rates at initiation do not appear to be influenced by cardiac comorbidity in either diabetic or non-diabetic patients (Figure 3.35). Diabetic status does, however, appear to have an influence on eGFR in that non-diabetics tend to have rates that are 0.25–0.51 ml/min/1.73 m2 lower than their dia-betic counterparts, depending on the type of cardiac comorbidity being measured.
The number of comorbidities appears to have a major influ-ence on eGFR, particularly in non-diabetics. Compared to levels in patients with one listed comorbidity, eGFRs are approximately 2.7 ml/min/1.73 m2 (31 percent) higher in patients with 4–6 comor-bidities, suggesting that sicker patients are now tending to begin ESRD therapy at an earlier point in the course of their disease. −
|| Figures 3.29–36 incident ESRD patients with a first service date between May, 1995, & June, 2005; data from Medical Evidence form. Estimated GFR for ages 0–18 from Schwartz et al., & for ages 19 & above from Levey et al.
Estimated GFR, by diabetic status & number of comorbidities
incident ESRD patients
Estimated GFR, by diabetic status & cardiac comorbidity
incident ESRD patients
E

3patient characteristicschapter summary
98
Figure number 3.17 3.17 3.18 3.18 98–99 03–04 98–99 03–04Overall value for all pts 29.0 30.4 26.2 33.0 Total patients 156,494 179,597 156,494 179,597 Overall value for pts mapped 29.0 30.4 26.7 33.5Missing HSA/state: pts dropped 11,885 19,727 11,885 19,727
Figure 3.20 Blood urea nitro-gen (BUN) levels declined rapidly during the mid-1990s and through the turn
of the century. Since 2003, however, the mean BUN at initiation for all patients appears to have leveled off, and in 2005 stood at 83.3—represent-ing a 10.7 mg/dl drop since 1995. Figure 3.21 Native Americans had the largest decrease in BUN lev-els between 1995 and 2005, at 12.3 mg/dl, and in 2005 also had the lowest BUNs at initiation, at 79.6 mg/dl; the highest levels occurred in Asians and whites, at 85.2 and 83.9 mg/dl, respectively. Fig-ure 3.23 Serum creatinine levels at initiation fell steadily between 1995 and 2005, with an overall decrease of 1.7 mg/dl. Figure 3.21 In 2005, blacks and Asians had the highest serum creatinine levels, at 7.97 and 7.22 mg/dl, respectively, while the low-est level, 6.84 mg/dl occurred in whites. Figure 3.26 Between 1995 and 2005, the BUN/creatinine ratio increased by 1.7 in all patients, but since 2002 it has remained relatively stable.
Figure 3.29 In 2005, esti-mated glomerular filtration rates (eGFRs) rose slightly compared to those in 2004,
but the upward trend of these rates since 1995 appears to be leveling. Figure 3.30 Estimated glo-merular filtration rates are highest in whites, at 10.39, and lowest in Asians, at 9.07 ml/min/1.73 m2. Figure 3.32 Since 1995, the mean BMI at initiation has increased by 2.4 kg/m2 for all patients. Figure 3.33 Blacks and Native Americans have the highest BMIs at initiation, at 29.0 and 28.6 kg/m2, respec-tively, a factor which may be related to high rates of diabetes in each of these populations. Figure 3.35 Diabetic status appears to have an influence on eGFR, with eGFRs in non-diabetics 0.25–0.51 ml/min/1.73 m2 lower than their diabetic counter-parts, depending on the type of cardiac comorbid-ity being measured.
Figures 3.2–3 Among inci-dent diabetic patients with hypertension, the propor-tion hospitalized with any
cardiovascular disease in the year after initiation increased from 41.0 percent in 1984 to 60.3 per-cent in 2003; rates have been steady at 59–60 per-cent since 1997. Among non-diabetic patients with hypertension, the proportion rose from 40 percent in 1984 to 55 percent in 2003, with rates remaining at 54–55 percent since 1997.
Figures 3.6–11 As seen with the CKD population, adher-ence to medication regimens in the incident ESRD popu-lation is better among those age 65 and older than among
those younger than 65. Overall adherence patterns are not as uniform for ESRD as for CKD patients.
Figure 3.12 Between Janu-ary, 1996, and January, 2005, the mean hemoglobin for all patients initiating therapy increased by nearly one g/dl.
Figure 3.13 Patients who receive EPO prior to ini-tiation are likely to have higher mean hemoglobins than those not on the therapy. Figure 3.14 Approxi-mately one-third of new ESRD patients have hemo-globins meeting or exceeding the K/DOQI target when they begin ESRD therapy, more than double the number in 1995. Figure 3.15 Between 1999 and 2004, hemoglobin levels at initiation increased by 0.42 and 0.45 g/dl in males and females, respec-tively, and are slightly higher in older patients of each gender. Figure 3.16 Since 1999, blacks have experienced the largest increase in mean hemoglo-bin at initiation—approximately 0.5 g/dl. Figure 3.19 When comparing patients who initiate ESRD therapy with either primary or secondary glomeru-lonephritis or cancer, those with primary glomer-ulonephritis had the highest mean hemoglobins, 10.2 g/dl, in 2005.
cardiovascular comorbidity
EPO use & anemia at initiation
adherence to drug therapy at
or near initiation
predictors of eGFR
biochemical characteristics
maps: national means & patient populations