Embed Size (px)
Citation preview

8/4/2019 2006 Global Ag Blumenthal
http://slidepdf.com/reader/full/2006-global-ag-blumenthal 1/12
Limitations of Policies in“Creating Competitiveness”
Gary Blumenthal
World Perspectives, Inc.
The ne us between markets andpolicies…
rarely leads to a straightforwardstory of successful“competitiveness” in agriculture.

8/4/2019 2006 Global Ag Blumenthal
http://slidepdf.com/reader/full/2006-global-ag-blumenthal 2/12
Policy and Market Fundamentals
I. Farm Policy
II. Uruguay Round/Doha
III. Midwest AgriFood SystemFundamentals
I. False Premise of the Farm Bill
8/4/2019 2006 Global Ag Blumenthal
http://slidepdf.com/reader/full/2006-global-ag-blumenthal 3/12
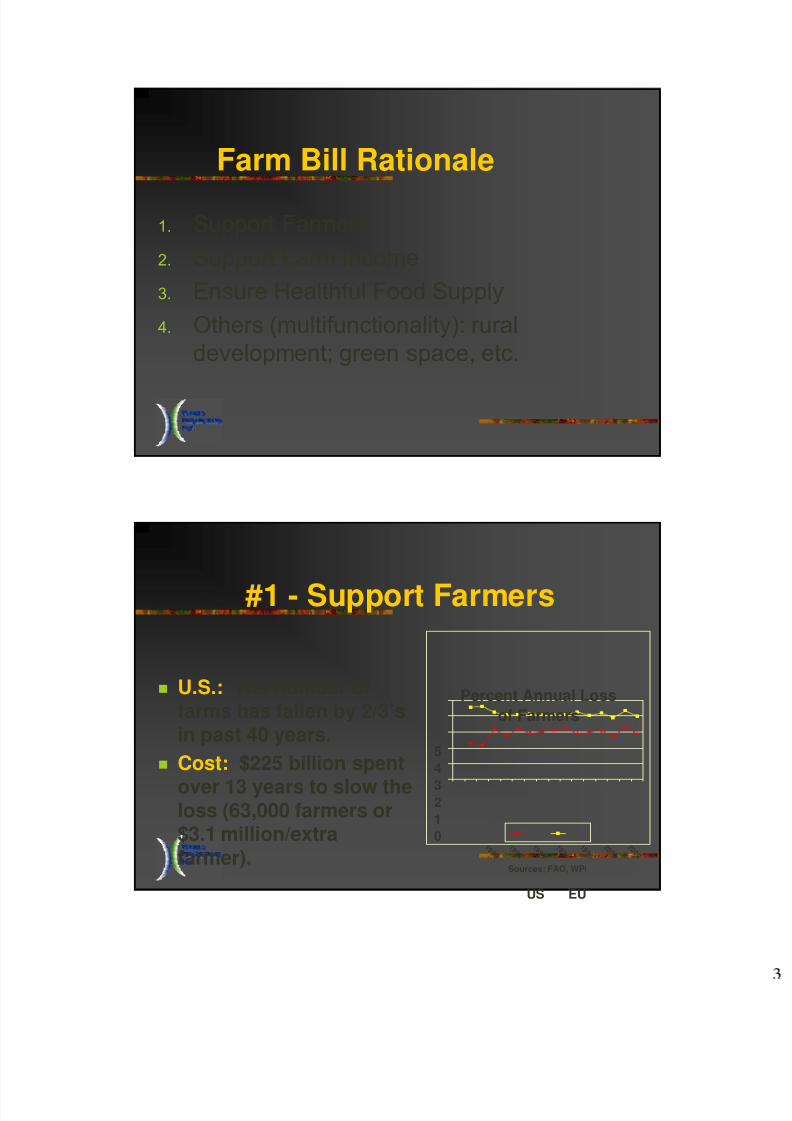
Farm Bill Rationale
1. Support Farmers
2. Support Farm Income
3. Ensure Healthful Food Supply
4. Others (multifunctionality): ruraldevelopment; green space, etc.
#1 - Support Farmers
U.S.: The number offarms has fallen by 2/3’sin past 40 years.
Cost: $225 billion spent
over 13 years to slow theloss (63,000 farmers or$3.1 million/extrafarmer).
Percent Annual Loss
of Farmers
0
1
23
4
5
1 9 9 0
1 9 9 2
1 9 9 4
1 9 9 6
1 9 9 8
2 0 0 0
2 0 0 2
Sources; FAO, WPI
US EU

8/4/2019 2006 Global Ag Blumenthal
http://slidepdf.com/reader/full/2006-global-ag-blumenthal 4/12
Efficiency Sheds Labor
102
104
106
108
110
112
114
M i l l i o
n s
1995 1997 1999 2001
Source: FAO
Latin American Farmers
012
345
M u l t i p l e o f A r e a
E x p a n s i o n
W h e a t
S o y b e a n s
G e n e r a l
Source: WPI
Survey of US Farmer
Expansion Ambition
2. Support Farm Income
Income higher under decoupling due to benefit of volatility; less harmful to competitiveness.
Gross Cash Receipts - 8 Commodities
46000
5100056000
61000
2 0 0 1
2 0 0 3
2 0 0 5
2 0 0 7
Sources: WPI, AgriLogic
$
M
i l l i o
n s
High Loan Rate
Current Policy
Baseline
All AMTA
Payment Type Influences Land Value
1000
1100
1200
1300
1400
1500
1600
1700
2002 2003 2004 2005 2006 2007 2008
Source: AgriLogic, WPI
$ / A c r e Inflation Only
Direct Payment
High Mkt Loan

8/4/2019 2006 Global Ag Blumenthal
http://slidepdf.com/reader/full/2006-global-ag-blumenthal 5/12
3. Ensure Healthful Food Supply
Obesity: #1 health issue
U.S.: F&V production isflat; imports up 50% infour years;
4. Other Farm Policy Goals
Rural - Development
Green Space Stewardship
Reduced commercial crop production…= reduced competitiveness

8/4/2019 2006 Global Ag Blumenthal
http://slidepdf.com/reader/full/2006-global-ag-blumenthal 6/12
Program Effectiveness versus Budget
OMB’s Program Assessment Rating Tool (PART)
Program PART Ranking
Bioenergy (ethanol) Adequate
CCC Marketing Loans Moderately Effective
CCC Export Guarantees Moderately Effective
Counter Cyclical Payments Adequate
Conservation Assistance Results Not DemonstratedCrop Insurance Results Not Demonstrated
Direct Crop Payments Adequate
Food Aid Moderately Effective
II. Trade Rounds
Helpful but Not the Sole Panacea

8/4/2019 2006 Global Ag Blumenthal
http://slidepdf.com/reader/full/2006-global-ag-blumenthal 7/12

8/4/2019 2006 Global Ag Blumenthal
http://slidepdf.com/reader/full/2006-global-ag-blumenthal 8/12
Constraints on Competitiveness
Rules-Based Trade:
Reduced government policies
≈ increased competition.
Trade is driven foremost by capacity
III. Competitive Advantages

8/4/2019 2006 Global Ag Blumenthal
http://slidepdf.com/reader/full/2006-global-ag-blumenthal 9/12
1. Capital/Resource Base
2. Technology
3. Management Capacity
Fundamental Midwest CompetitiveAdvantages
Capital/Resources
• $11 Trillion GDP;$38,000 per capita
• Water
• Land
4
1.7
1
0
1
2
3
4
Sources: UN, WPI
Fresh Water Per Capita
Nor th America Eurpope Asia
0.4 0.85
8.810.56
20.4
0
5
10
15
20
25
Sources: FAO, WPI
Arable Hectares Per Agricultural Person
Africa Asia Europe S. America NAFTA

8/4/2019 2006 Global Ag Blumenthal
http://slidepdf.com/reader/full/2006-global-ag-blumenthal 10/12
Technology Development and Utilization
Rabobank Study: Labor + Machinery -- U.S. is 25-45% less expensive thanBrazil and Argentinarespectively; technologieseclipse labor.
GIS, GPS, remotesensing, auto-steering
Biotechnology
53.8
17.5
7.7
0
10
20
30
40
50
60
MMT
GM Crop Expansion
Soybean
Corn
Wheat
Management Capacity
More highly educated farmers
Entrepreneurship
Readily transferable skills Culture
8/4/2019 2006 Global Ag Blumenthal
http://slidepdf.com/reader/full/2006-global-ag-blumenthal 11/12

8/4/2019 2006 Global Ag Blumenthal
http://slidepdf.com/reader/full/2006-global-ag-blumenthal 12/12
U.S. Farmer Attitudes
Government subsidies have actually stifled incentives for entrepreneurship among grain farmers by relieving financial pressure for them to adapt.
Those who prosper in this future agriculture must be willing to challenge their traditional comfort zone…
Create competitive advantages rather than protect old ones…[but this] will be much more difficult if
policymakers continue to emphasize income subsidies instead of strategic investments.
0
5
10
15
20
Liberalize Protect
Major U.S. Farm
OrganizationLiberalize by 2019?
Food Processing
“Agriculture” Sector
Production >20%
Growth: Labor,Packaging, Marketing
52,000 graduatesneeded (2005-2010),
49,300 projected. Food processing and
machinery the most prominentMidwest industry.
Once the most advanced inthe world.
•Attraction of capital.
•Risk/Reward
•Attention to regulatory
burden.
•U.S. fiscal management.


![D. S. Nº 043-2006-AG[1]](https://img.dokumen.tips/doc/110x75/5571f85c49795991698d4080/d-s-nao-043-2006-ag1.jpg)