Embed Size (px)
Citation preview

2 0 0 6 A N N U A L R E P O R T
Experience the Difference.
Delivering the Boating Dream.
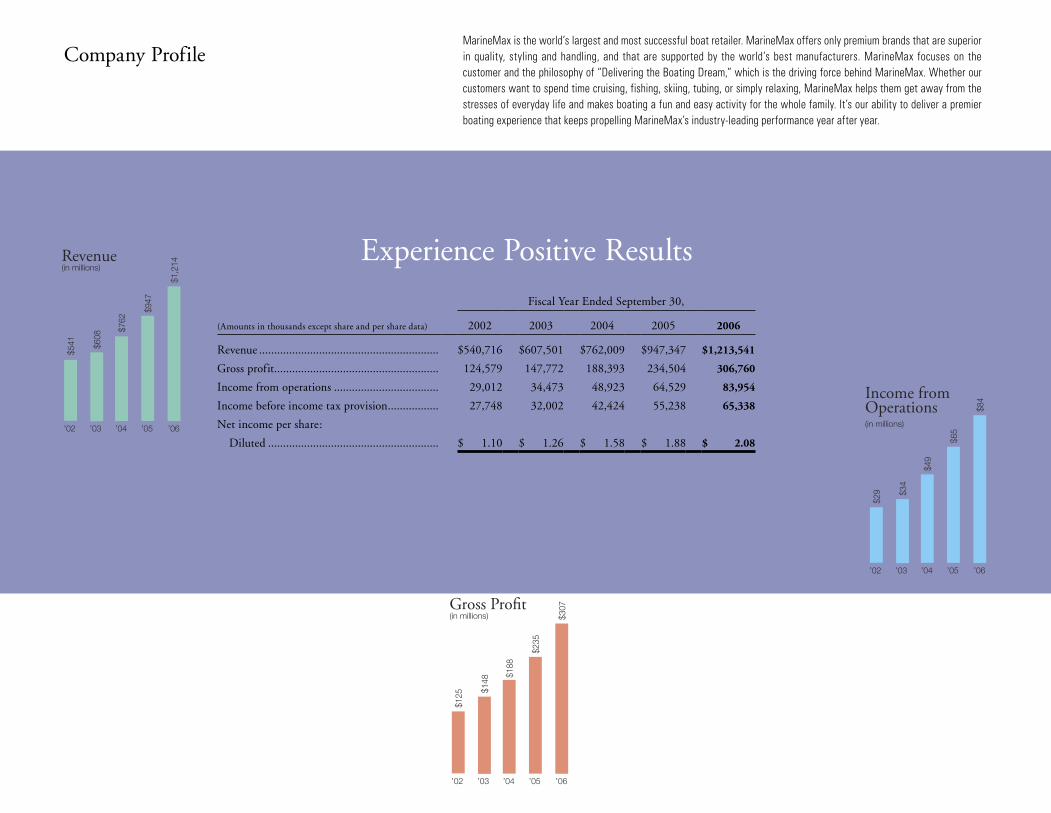
MarineMax is the world’s largest and most successful boat retailer. MarineMax offers only premium brands that are superior in quality, styling and handling, and that are supported by the world’s best manufacturers. MarineMax focuses on the customer and the philosophy of “Delivering the Boating Dream,” which is the driving force behind MarineMax. Whether our customers want to spend time cruising, fishing, skiing, tubing, or simply relaxing, MarineMax helps them get away from the stresses of everyday life and makes boating a fun and easy activity for the whole family. It’s our ability to deliver a premier boating experience that keeps propelling MarineMax’s industry-leading performance year after year.
Revenue(in millions)
$541 $6
08
$762
$947
Gross Profit(in millions)
Income from Operations(in millions)
0
300
600
900
1200
1500
0
50
100
150
200
250
300
350
$1,2
14
’02 ’03 ’04 ’05 ’06
$125 $1
48
$188
$235
$307
’02 ’03 ’04 ’05 ’06
$29 $3
4
$49
$65
$84
’02 ’03 ’04 ’05 ’06
0
20
40
60
80
100 Experience Positive Results
Company Profile
Revenue(in millions)
$541 $6
08
$762
$947
Gross Profit(in millions)
Income from Operations(in millions)
0
300
600
900
1200
1500
0
50
100
150
200
250
300
350
$1,2
14
’02 ’03 ’04 ’05 ’06
$125 $1
48
$188
$235
$307
’02 ’03 ’04 ’05 ’06
$29 $3
4
$49
$65
$84
’02 ’03 ’04 ’05 ’06
0
20
40
60
80
100
Revenue(in millions)
$541 $6
08
$762
$947
Gross Profit(in millions)
Income from Operations(in millions)
0
300
600
900
1200
1500
0
50
100
150
200
250
300
350
$1,2
14
’02 ’03 ’04 ’05 ’06
$125 $1
48
$188
$235
$307
’02 ’03 ’04 ’05 ’06
$29 $3
4
$49
$65
$84
’02 ’03 ’04 ’05 ’06
0
20
40
60
80
100
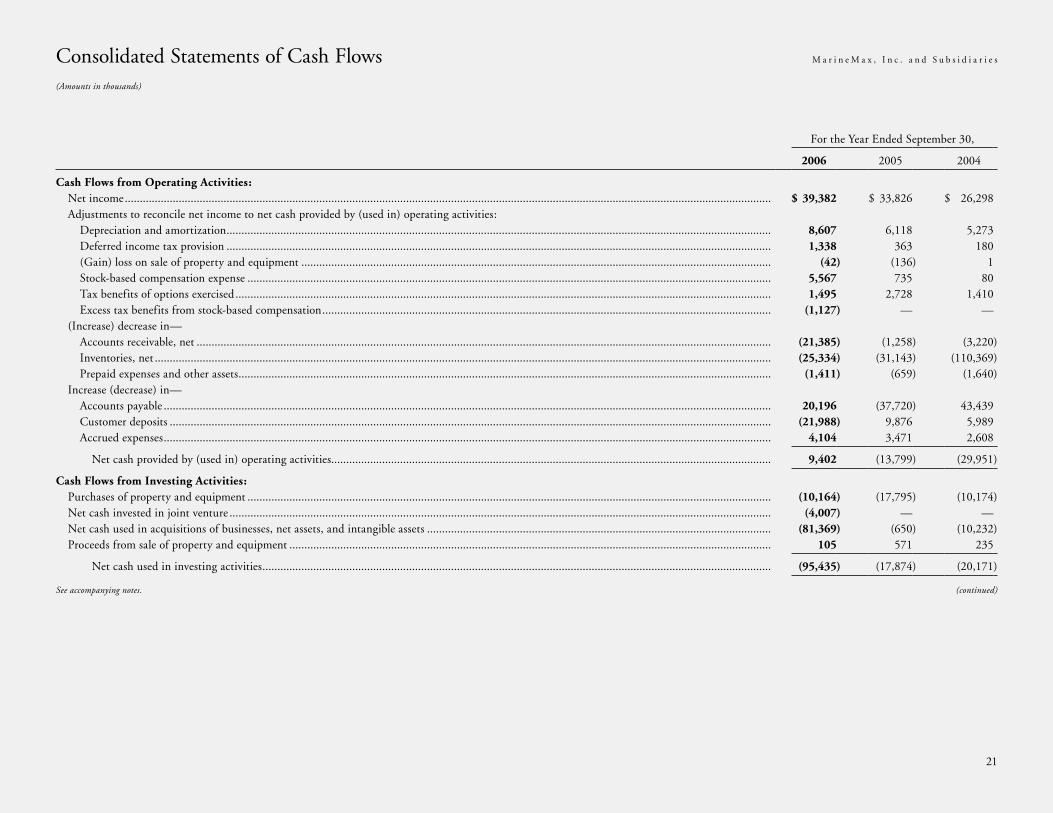
Fiscal Year Ended September 30,
(Amounts in thousands except share and per share data) 2002 2003 2004 2005 2006
Revenue ............................................................ $540,716 $607,501 $762,009 $947,347 $ 1,213,541
Gross profit ....................................................... 124,579 147,772 188,393 234,504 306,760
Income from operations ................................... 29,012 34,473 48,923 64,529 83,954
Income before income tax provision ................. 27,748 32,002 42,424 55,238 65,338
Net income per share:
Diluted ......................................................... $ 1.10 $ 1.26 $ 1.58 $ 1.88 $ 2.08

You’ll notice the difference the moment you walk in the door. MarineMax features the best brands in boating. Our professional sales consultants are here to listen, answer your questions and help you find the boat of your dreams. To ensure you have made the right choice, our team can set up a convenient, no-hassle sea trial. Take your dream boat out for a spin.
Our Difference
Our MarineMax professionals make sure you are confident in the operation of your new boat. Whenever possible, our deliveries take place on the water where you will be assisted by our certified captains. We encourage the whole family to be present for the delivery so they can also receive some hands-on experience in operating the new boat. We want your entire crew to be safe and comfortable from day one.
Our Delivery
Easy shopping, comfortable financing, and a stellar delivery experience are only some of the things that you can expect from MarineMax. But we don’t stop there. As a member of the MarineMax family, you will also be able to join us for our renowned Getaways! events. On these organized trips, you’ll be able to enjoy socializing with other boaters and folks like you who have discovered the pleasure and serenity of life off land.
Your Positive Experience
Our new boats are backed by excellent manufacturer provided warranties. Extended service plans are also available for the utmost in protection. If you are looking for a certain part or accessory, we carry a large inventory. We even let you request parts or service appointments via our website, anytime you want. Beyond our convenient service hours, many of our locations also offer a Mobile Service team that can make a dock call right to your boat.
Our Commitment
1

2
“We will continue to invest in our brand. As the world’s largest boating
retailer, we will position ourselves as the place for boating in boaters’ and
potential boaters’ minds. Our brand is the experience our customers
receive when they purchase a boat or accessories, take delivery, attend our
Getaways! and classes, or see us for service. Every interaction is an oppor-
tunity for our team members to build the relationship and our brand.”
William H. McGill, Jr.
3
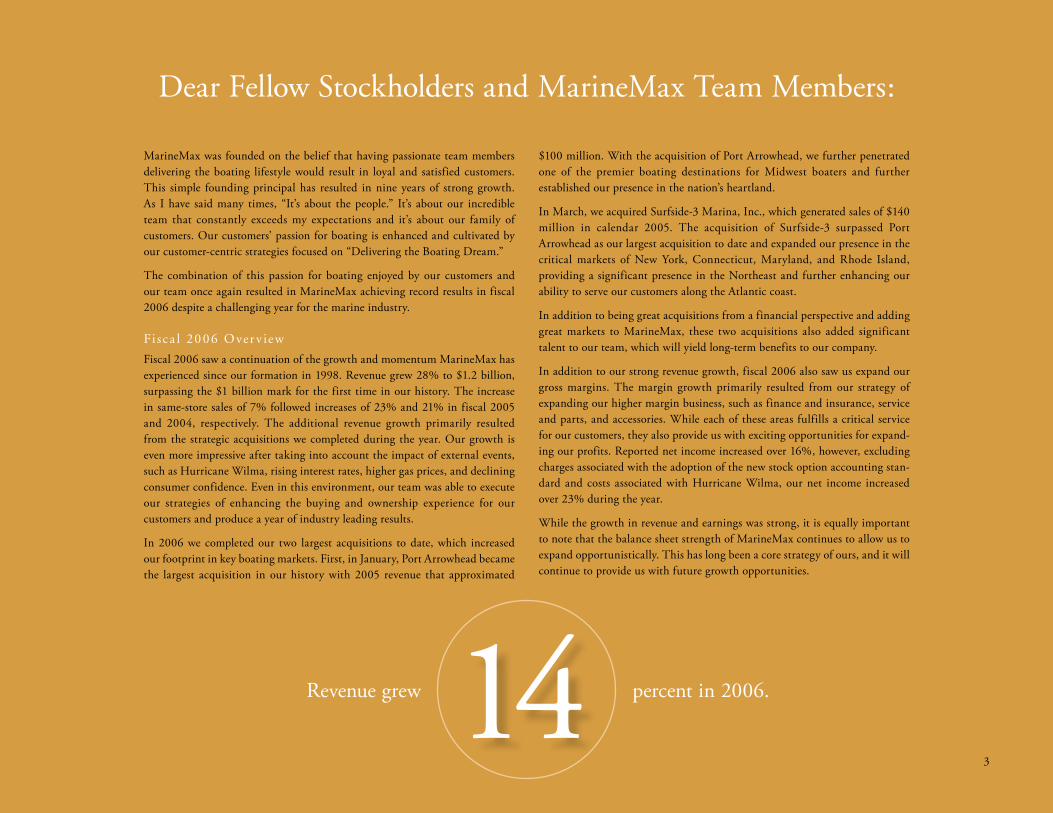
MarineMax was founded on the belief that having passionate team members delivering the boating lifestyle would result in loyal and satisfied customers. This simple founding principal has resulted in nine years of strong growth. As I have said many times, “It’s about the people.” It’s about our incredible team that constantly exceeds my expectations and it’s about our family of customers. Our customers’ passion for boating is enhanced and cultivated by our customer-centric strategies focused on “Delivering the Boating Dream.”
The combination of this passion for boating enjoyed by our customers and our team once again resulted in MarineMax achieving record results in fiscal 2006 despite a challenging year for the marine industry.
Fi sc a l 20 06 Over v iew
Fiscal 2006 saw a continuation of the growth and momentum MarineMax has experienced since our formation in 1998. Revenue grew 28% to $1.2 billion, surpassing the $1 billion mark for the first time in our history. The increase in same-store sales of 7% followed increases of 23% and 21% in fiscal 2005 and 2004, respectively. The additional revenue growth primarily resulted from the strategic acquisitions we completed during the year. Our growth is even more impressive after taking into account the impact of external events, such as Hurricane Wilma, rising interest rates, higher gas prices, and declining consumer confidence. Even in this environment, our team was able to execute our strategies of enhancing the buying and ownership experience for our customers and produce a year of industry leading results.
In 2006 we completed our two largest acquisitions to date, which increased our footprint in key boating markets. First, in January, Port Arrowhead became the largest acquisition in our history with 2005 revenue that approximated
$100 million. With the acquisition of Port Arrowhead, we further penetrated one of the premier boating destinations for Midwest boaters and further established our presence in the nation’s heartland.
In March, we acquired Surfside-3 Marina, Inc., which generated sales of $140 million in calendar 2005. The acquisition of Surfside-3 surpassed Port Arrowhead as our largest acquisition to date and expanded our presence in the critical markets of New York, Connecticut, Maryland, and Rhode Island, providing a significant presence in the Northeast and further enhancing our ability to serve our customers along the Atlantic coast.
In addition to being great acquisitions from a financial perspective and adding great markets to MarineMax, these two acquisitions also added significant talent to our team, which will yield long-term benefits to our company.
In addition to our strong revenue growth, fiscal 2006 also saw us expand our gross margins. The margin growth primarily resulted from our strategy of expanding our higher margin business, such as finance and insurance, service and parts, and accessories. While each of these areas fulfills a critical service for our customers, they also provide us with exciting opportunities for expand-ing our profits. Reported net income increased over 16%, however, excluding charges associated with the adoption of the new stock option accounting stan-dard and costs associated with Hurricane Wilma, our net income increased over 23% during the year.
While the growth in revenue and earnings was strong, it is equally important to note that the balance sheet strength of MarineMax continues to allow us to expand opportunistically. This has long been a core strategy of ours, and it will continue to provide us with future growth opportunities.
percent in 2006.Revenue grew 14
Dear Fellow Stockholders and MarineMax Team Members:
Our St rateg ie s
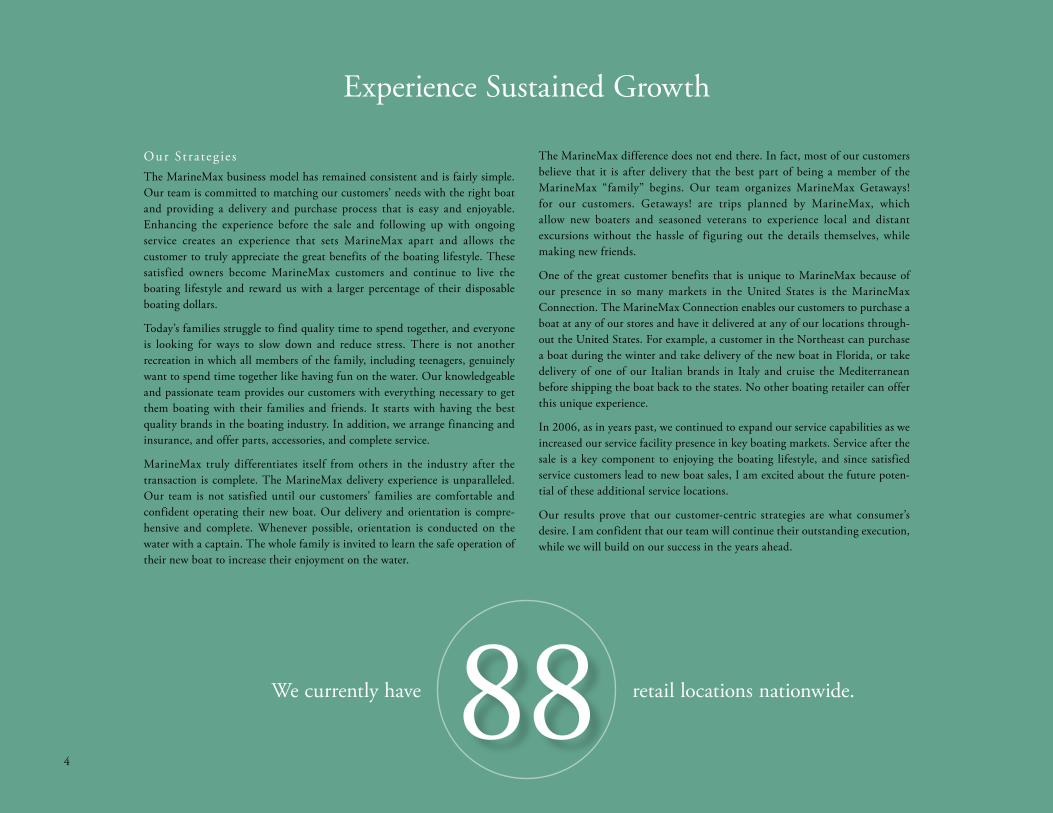
The MarineMax business model has remained consistent and is fairly simple. Our team is committed to matching our customers’ needs with the right boat and providing a delivery and purchase process that is easy and enjoyable. Enhancing the experience before the sale and following up with ongoing service creates an experience that sets MarineMax apart and allows the customer to truly appreciate the great benefits of the boating lifestyle. These satisfied owners become MarineMax customers and continue to live the boating lifestyle and reward us with a larger percentage of their disposable boating dollars.
Today’s families struggle to find quality time to spend together, and everyone is looking for ways to slow down and reduce stress. There is not another recreation in which all members of the family, including teenagers, genuinely want to spend time together like having fun on the water. Our knowledgeable and passionate team provides our customers with everything necessary to get them boating with their families and friends. It starts with having the best quality brands in the boating industry. In addition, we arrange financing and insurance, and offer parts, accessories, and complete service.
MarineMax truly differentiates itself from others in the industry after the transaction is complete. The MarineMax delivery experience is unparalleled. Our team is not satisfied until our customers’ families are comfortable and confident operating their new boat. Our delivery and orientation is compre-hensive and complete. Whenever possible, orientation is conducted on the water with a captain. The whole family is invited to learn the safe operation of their new boat to increase their enjoyment on the water.
The MarineMax difference does not end there. In fact, most of our customers believe that it is after delivery that the best part of being a member of the MarineMax “family” begins. Our team organizes MarineMax Getaways! for our customers. Getaways! are trips planned by MarineMax, which allow new boaters and seasoned veterans to experience local and distant excursions without the hassle of figuring out the details themselves, while making new friends.
One of the great customer benefits that is unique to MarineMax because of our presence in so many markets in the United States is the MarineMax Connection. The MarineMax Connection enables our customers to purchase a boat at any of our stores and have it delivered at any of our locations through-out the United States. For example, a customer in the Northeast can purchase a boat during the winter and take delivery of the new boat in Florida, or take delivery of one of our Italian brands in Italy and cruise the Mediterranean before shipping the boat back to the states. No other boating retailer can offer this unique experience.
In 2006, as in years past, we continued to expand our service capabilities as we increased our service facility presence in key boating markets. Service after the sale is a key component to enjoying the boating lifestyle, and since satisfied service customers lead to new boat sales, I am excited about the future poten-tial of these additional service locations.
Our results prove that our customer-centric strategies are what consumer’s desire. I am confident that our team will continue their outstanding execution, while we will build on our success in the years ahead.
4
retail locations nationwide.We currently have
Experience Sustained Growth
88
5
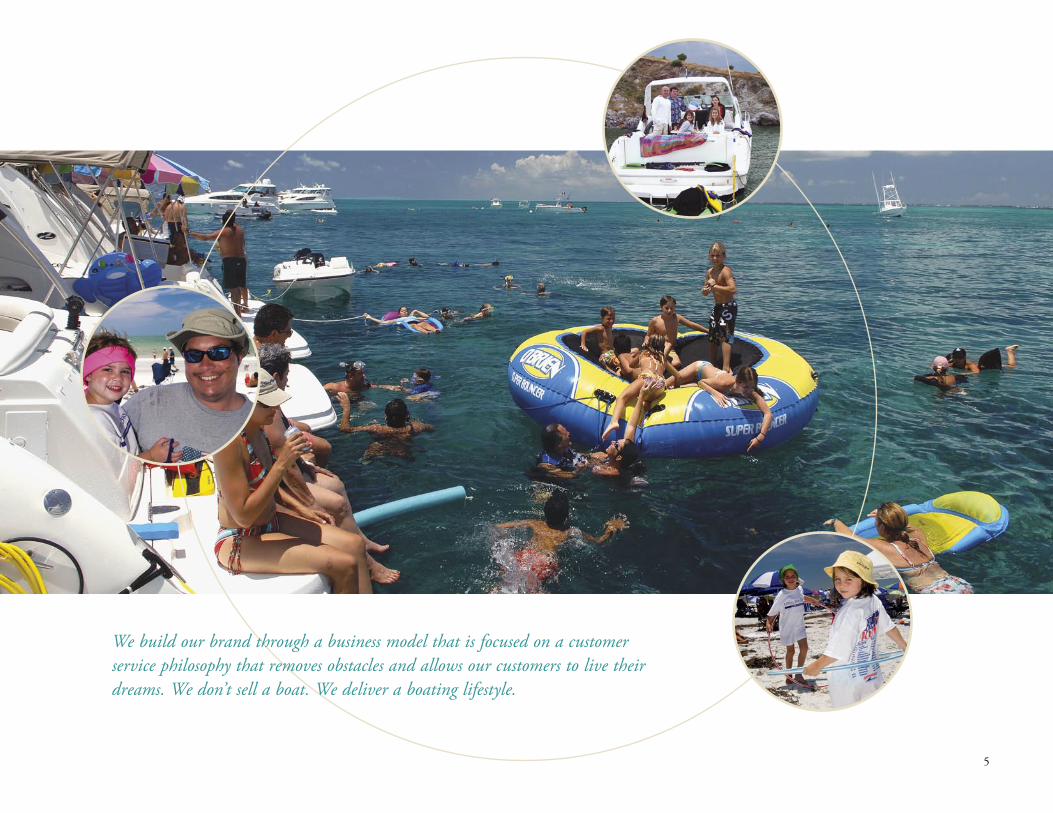
We build our brand through a business model that is focused on a customer service philosophy that removes obstacles and allows our customers to live their dreams. We don’t sell a boat. We deliver a boating lifestyle.

MarineMax-sponsored excursions allow our customers to meet new people in new boating destinations while we handle all the details. Our educational classes include Women on Water™, Kids in Boating and other related topics that enhance the boating lifestyle by improving our customers’ skills and confidence. MarineMax is unsurpassed in “delivering the boating dream.”
6
7
Our Ma nu fac tu r ing Pa r tner s
Our strategic partners build the best brands in the world. Brands such as Sea Ray, Boston Whaler, Meridian, Hatteras, Cabo, Ferretti, Riva, Pershing, Apreamare, Mochi Craft, Bertram, Azimut, Princecraft, Baja, and Grady White ensure that our customers have access to the highest level of quality and support found anywhere. These brands allow us to meet the needs of all types of boaters. Whether water skiing, wakeboarding, fishing in freshwater or salt-water, cruising for weeks, or enjoying a day away from work, MarineMax has the best brand for almost every customer. These manufacturers don’t just build great boats—they also partner with us to deliver the boating lifestyle with their support.
Boating Industry magazine launched a ranking of the Top 100 dealers in North America last year. It has become the most prestigious award that a boating retailer can receive. Last year we were ranked number one in the inaugural ranking. I am very proud that in this year’s competition we were again ranked number one and further recognized as being in a class by ourselves. This award is based on customer service, business operations, marketing, and professionalism. Our customers are the most important judges, and they have voted us the best with their loyalty, which has resulted in our strong financial performance and growing market share.
L ook ing A head
In fiscal 2007, we will continue to follow our core strategies that have yielded strong and market leading results. While we expect the year to present external
challenges, we will focus our efforts on increasing same-store sales to drive our internal growth and pursue accretive acquisitions when they make sense both strategically and culturally. As the only consolidator in the industry, we are in a unique position to take advantage of opportunities when they become avail-able. We also continue to in invest in our brand and our team, the driving force that helps produce industry leading results year after year.
In conclusion, as we head into 2007, I reflect back over the past nine years. We have grown our annual sales to over $1.2 billion, while continuing to invest and position MarineMax for long-term sustainable growth with one of the strongest balance sheets in the industry. While we expect our results on a quarterly basis will always be volatile due to the large average ticket price of our products and the cyclicality associated with the industry, we believe that, over time, our brand, our people, and our strategies will result in a company that will be much larger, more diverse and financially stronger than today. Again, thank you to our stockholders, customers, business partners, and team members for your continued passion for boating, support and belief in our great company.
Sincerely,
William H. McGill, Jr.Chairman of the Board, President and Chief Executive Officer
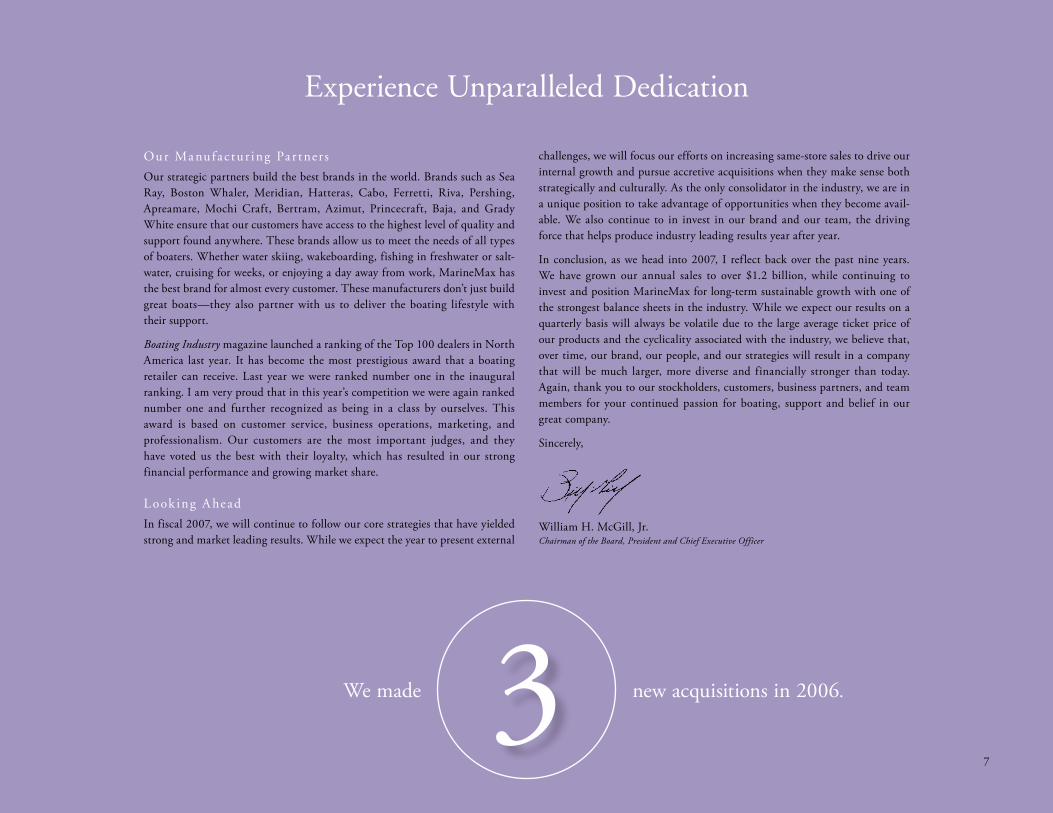
3 new acquisitions in 2006.We made
Experience Unparalleled Dedication

8
Our strategies are simple and focus on enhancing our customers’ boating lifestyles. MarineMax provides a solution that improves the boating experience for our custom-ers in today’s hectic world. The MarineMax boating solution ensures that boating is the answer for stress relief and family recreation. No other activity or lifestyle brings all members of the family together for fun and relaxation.
9
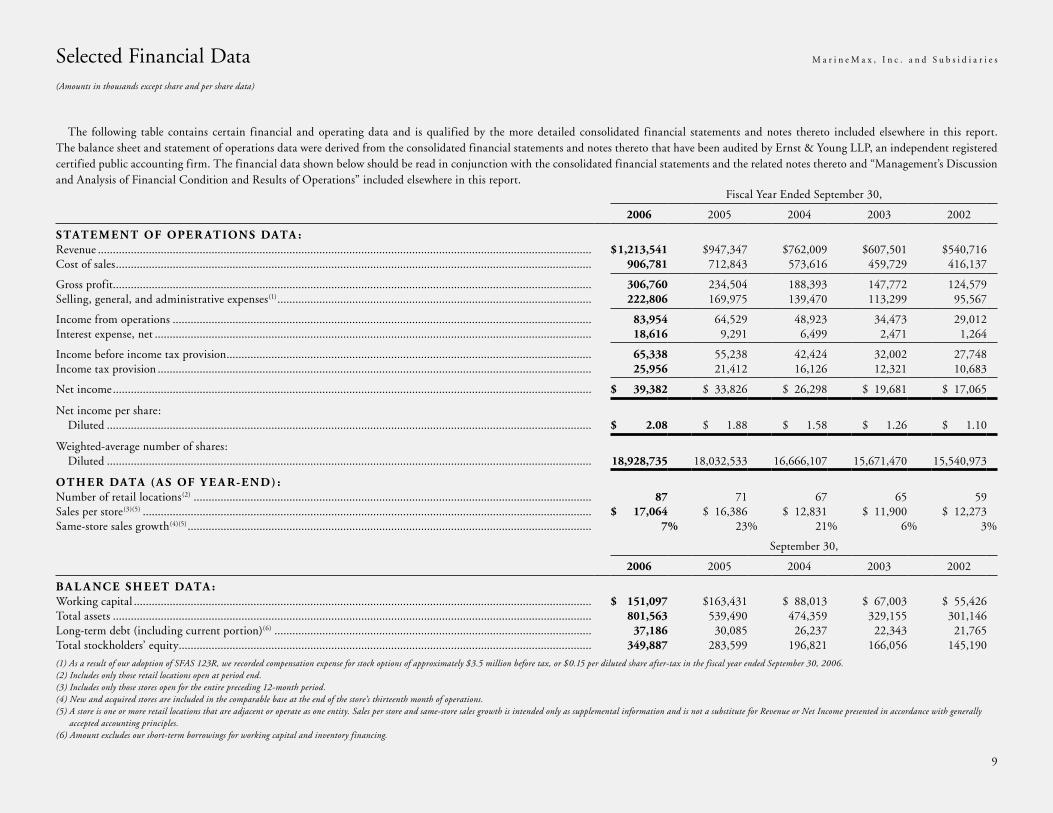
Selected Financial Data M a r i n e M a x , I n c . a n d S u b s i d i a r i e s
(Amounts in thousands except share and per share data)
The following table contains certain financial and operating data and is qualified by the more detailed consolidated financial statements and notes thereto included elsewhere in this report. The balance sheet and statement of operations data were derived from the consolidated financial statements and notes thereto that have been audited by Ernst & Young LLP, an independent registered certified public accounting firm. The financial data shown below should be read in conjunction with the consolidated financial statements and the related notes thereto and “Management’s Discussion and Analysis of Financial Condition and Results of Operations” included elsewhere in this report.
Fiscal Year Ended September 30,
2006 2005 2004 2003 2002
STAT E M EN T OF OPER AT IONS DATA :Revenue ..................................................................................................................................................................... $ 1,213,541 $947,347 $762,009 $607,501 $540,716Cost of sales ............................................................................................................................................................... 906,781 712,843 573,616 459,729 416,137
Gross profit ................................................................................................................................................................ 306,760 234,504 188,393 147,772 124,579Selling, general, and administrative expenses(1) ......................................................................................................... 222,806 169,975 139,470 113,299 95,567
Income from operations ............................................................................................................................................ 83,954 64,529 48,923 34,473 29,012Interest expense, net .................................................................................................................................................. 18,616 9,291 6,499 2,471 1,264
Income before income tax provision .......................................................................................................................... 65,338 55,238 42,424 32,002 27,748Income tax provision ................................................................................................................................................. 25,956 21,412 16,126 12,321 10,683
Net income ................................................................................................................................................................ $ 39,382 $ 33,826 $ 26,298 $ 19,681 $ 17,065
Net income per share: Diluted .................................................................................................................................................................. $ 2.08 $ 1.88 $ 1.58 $ 1.26 $ 1.10
Weighted-average number of shares: Diluted .................................................................................................................................................................. 18,928,735 18,032,533 16,666,107 15,671,470 15,540,973
OT HER DATA (A S OF Y E A R-END) :Number of retail locations(2) ..................................................................................................................................... 87 71 67 65 59Sales per store(3)(5) ...................................................................................................................................................... $ 17,064 $ 16,386 $ 12,831 $ 11,900 $ 12,273Same-store sales growth(4)(5) ....................................................................................................................................... 7% 23% 21% 6% 3%
September 30,
2006 2005 2004 2003 2002
BA L A NCE SHE ET DATA :Working capital ......................................................................................................................................................... $ 151,097 $163,431 $ 88,013 $ 67,003 $ 55,426Total assets ................................................................................................................................................................ 801,563 539,490 474,359 329,155 301,146Long-term debt (including current portion)(6) .......................................................................................................... 37,186 30,085 26,237 22,343 21,765Total stockholders’ equity .......................................................................................................................................... 349,887 283,599 196,821 166,056 145,190
(1) As a result of our adoption of SFAS 123R, we recorded compensation expense for stock options of approximately $3.5 million before tax, or $0.15 per diluted share after-tax in the fiscal year ended September 30, 2006.(2) Includes only those retail locations open at period end.(3) Includes only those stores open for the entire preceding 12-month period.(4) New and acquired stores are included in the comparable base at the end of the store’s thirteenth month of operations.(5) A store is one or more retail locations that are adjacent or operate as one entity. Sales per store and same-store sales growth is intended only as supplemental information and is not a substitute for Revenue or Net Income presented in accordance with generally
accepted accounting principles.(6) Amount excludes our short-term borrowings for working capital and inventory financing.
10
We are the largest recreational boat retailer in the United States with fiscal 2006 revenue exceeding $1.2 billion. Through our current 88 retail locations in 22 states, we sell new and used recreational boats and related marine products, including engines, trailers, parts, and acces-sories. We also arrange related boat financing, insurance, and extended warranty contracts; provide boat repair and maintenance services; and offer yacht and boat brokerage services, and where available, offer slip and storage accommodations.
MarineMax was incorporated in January 1998. We commenced operations with the acquisition of five independent recreational boat dealers on March 1, 1998. Since the initial acquisitions in March 1998, we have significantly expanded our operations through the acquisition of 20 recre-ational boat dealers, two boat brokerage operations, and two full-service yacht repair facilities. As a part of our acquisition strategy, we frequently engage in discussions with various recreational boat dealers regarding their potential acquisition by us. Potential acquisition discussions fre-quently take place over a long period of time and involve difficult business integration and other issues, including in some cases, management succession and related matters. As a result of these and other factors, a number of potential acquisitions that from time to time appear likely to occur do not result in binding legal agreements and are not consummated. The following are the acqui-sitions we have completed during the fiscal years ending September 30, 2006 and 2004. No significant acquisitions were completed during the fiscal year ending September 30, 2005.
During the fiscal year ended September 30, 2006, we completed the acquisition of two recre-ational boat dealers. During March 2006, we acquired substantially all of the assets and assumed certain liabilities of Surfside-3 Marina, Inc. (Surfside), a privately held boat dealership with eight locations in New York and Connecticut, for approximately $24.8 million in cash and 665,024 shares of common stock, plus $24.0 million in working capital adjustments including acquisition costs. The shares were valued at $33.71 per share, which was the average closing market price of our common stock for the five-day period beginning two days prior to and end-ing two days subsequent to the acquisition date. Based on the provisions of the asset purchase agreement, 100,000 shares of common stock are currently held in escrow, subject to the satisfac-tion of working capital adjustment and other provisions in the acquisition documents. We and Surfside are in current discussions to resolve such matters. The acquisition expands our ability to serve consumers in the Northeast boating community and allows us to capitalize on Surfside’s market position and leverage our inventory management and inventory financing resources over the acquired locations. Based on our preliminary valuation, the purchase price, including acqui-sition costs, is anticipated to result in the recognition of approximately $37.0 million in tax deductible goodwill and approximately $14.7 million in tax deductible indefinite-lived intangible assets (dealer agreements). We are in the process of finalizing the purchase price allo-cation and determining the fair value of acquired intangible assets; accordingly, certain purchase price allocations are subject to change. Surfside has been included in our consolidated financial statements since the date of acquisition.
During January 2006, we acquired substantially all of the assets, including certain real estate, and assumed certain liabilities of the Port Arrowhead Group (Port Arrowhead), a privately held boat dealership with locations in Missouri and Oklahoma, for approximately $27.5 million in cash, plus $5.0 million in working capital adjustments including acquisition costs. Port Arrowhead operates six retail locations, including a large marina with more than 300 slips. The acquisition expands our ability to serve consumers in the Midwest boating community, including neighboring boating destinations in Illinois, Kansas, and Arkansas. The acquisition also allows us to capitalize on Port Arrowhead’s market position and leverage our inventory management and inventory financing resources over the acquired locations. Based on our preliminary valuation, the purchase price, including acquisition costs, is anticipated to result in the recognition of approximately $6.1 million in tax deductible goodwill and approximately $2.0 million in tax deductible indefinite-lived intangible assets (dealer agreements). We are in the process of finalizing the purchase price allocation and determining the fair value of acquired intangible assets; accordingly, certain purchase price allocations are subject to change. Port Arrowhead has been included in our consolidated financial statements since the date of acquisition.
During the fiscal year ended September 30, 2004, we completed the acquisition of three rec-reational boat dealers. During June 2004, we acquired substantially all of the assets, including real estate, and assumed certain liabilities of Imperial Marine (Imperial), a privately held boat dealership with locations in Baltimore and the northern Chesapeake area of Maryland, for approximately $9.3 million in cash, including acquisition costs. Imperial operates a highway location and a marina on the Gunpowder River. The acquisition expands our ability to serve consumers in the Mid-Atlantic United States boating community. Additionally, the acquisition allows us to capitalize on Imperial’s market position and leverage our inventory management and inventory financing resources over the acquired locations. The acquisition resulted in the recognition of approximately $1.1 million in tax deductible goodwill, including acquisition costs, and approximately $580,000 in tax deductible indefinite-lived intangible assets (dealer agreements). Imperial has been included in our consolidated financial statements since the date of acquisition.
During June 2004, we purchased inventory and certain equipment and assumed certain lia-bilities from the previous Jacksonville, Florida-based Sea Ray dealer (Jacksonville) for the sport boat and sport cruiser product lines for approximately $900,000 in cash, including acquisition costs. The purchase enhanced our ability to serve customers in the northeast Florida boating community by adding the sport boat and sport cruiser product lines to our existing Sea Ray product offerings. The acquisition resulted in the recognition of approximately $240,000 in tax deductible goodwill, including acquisition costs, and approximately $450,000 in tax deductible indefinite-lived intangible assets (dealer agreements). Jacksonville has been included in our consolidated financial statements since the date of acquisition.
Management’s Discussion and Analysis of Financial Condition, M a r i n e M a x , I n c . a n d S u b s i d i a r i e s
and Results of Operations

11
During October 2003, we acquired substantially all of the assets and assumed certain liabilities of Emarine International, Inc. and Steven Myers, Inc. (Emarine), a privately held boat dealership located in Fort Lauderdale, Florida, for approximately $305,000 in cash. The acquisi-tion resulted in the recognition of approximately $300,000 in tax deductible goodwill, including acquisition costs. The acquisition provides us with an established retail location to sell the newly offered Ferretti Group products in the southeast Florida boating community. The assets pur-chase agreement contained an earn out provision based on the future profits of the location, assuming certain conditions and provisions were met. In August 2004, the earn out provisions were modified withdrawing the requirements for any future earn out payments. Emarine has been included in our consolidated financial statements since the date of acquisition.
Application of Critical Accounting Policies
We have identified the policies below as critical to our business operations and the understanding of our results of operations. The impact and risks related to these policies on our business operations is discussed throughout Management’s Discussion and Analysis of Financial Condition and Results of Operations when such policies affect our reported and expected financial results.
In the ordinary course of business, we make a number of estimates and assumptions relating to the reporting of results of operations and financial condition in the preparation of our finan-cial statements in conformity with accounting principles generally accepted in the United States. We base our estimates on historical experience and on various other assumptions that we believe are reasonable under the circumstances. The results form the basis for making judgments about the carrying values of assets and liabilities that are not readily apparent from other sources. Actual results could differ significantly from those estimates under different assumptions and conditions. We believe that the following discussion addresses our most critical accounting poli-cies, which are those that are most important to the portrayal of our financial condition and results of operations and require our most difficult, subjective, and complex judgments, often as a result of the need to make estimates about the effect of matters that are inherently uncertain.
Revenue Recognition
We recognize revenue from boat, motor, and trailer sales, and parts and service operations at the time the boat, motor, trailer, or part is delivered to or accepted by the customer or service is completed. We recognize commissions earned from a brokerage sale at the time the related bro-kerage transaction closes. We recognize revenue from slip and storage services on a straight-line basis over the term of the slip or storage agreement. We recognize commissions earned by us for placing notes with financial institutions in connection with customer boat financing when the related boat sales are recognized. We also recognize marketing fees earned on credit life, accident and disability, and hull insurance products sold by third-party insurance companies at the later
of customer acceptance of the insurance product as evidenced by contract execution, or when the related boat sale is recognized. We also recognize commissions earned on extended warranty service contracts sold on behalf of third-party insurance companies at the later of customer acceptance of the service contract terms as evidenced by contract execution, or recognition of the related boat sale.
Certain finance and extended warranty commissions and marketing fees on insurance prod-ucts may be charged back if a customer terminates or defaults on the underlying contract within a specified period of time. Based upon our experience of terminations and defaults, we maintain a chargeback allowance that was not material to our financial statements taken as a whole as of September 30, 2006 or 2005. Should results differ materially from our historical experiences, we would need to modify our estimate of future chargebacks, which could have a material adverse effect on our operating margins.
Vendor Consideration Received
We account for consideration received from our vendors in accordance with Emerging Issues Task Force Issue No. 02-16, “Accounting by a Customer (Including a Reseller) for Certain Consideration Received from a Vendor” (EITF 02-16). EITF 02-16 requires us to classify inter-est assistance received from manufacturers as a reduction of inventory cost and related cost of sales. Pursuant to EITF 02-16, amounts received by us under our co-op assistance programs from our manufacturers, are netted against related advertising expenses.
Inventories
Inventory costs consist of the amount paid to acquire the inventory, net of vendor consider-ation and purchase discounts, the cost of equipment added, reconditioning costs, and transpor-tation costs relating to acquiring inventory for sale. New and used boat, motor, and trailer inventories are stated at the lower of cost, determined on a specific-identification basis, or mar-ket. Parts and accessories are stated at the lower of cost, determined on the first-in, first-out basis, or market. If the carrying amount of our inventory exceeds its fair value, we reduce the carrying amount to ref lect fair value. We utilize our historical experience and current sales trends as the basis for our lower of cost or market analysis. If events occur and market conditions change, causing the fair value to fall below carrying value, further reductions may be required.
Valuation of Goodwill and Other Intangible Assets
We account for goodwill and identifiable intangible assets in accordance with Statement of Financial Accounting Standards No. 141, “Business Combinations” (SFAS 141), and Statement of Financial Accounting Standards No. 142, “Goodwill and other Intangible Assets” (SFAS 142). SFAS 141 requires that all business combinations initiated after June 30, 2001 be accounted for using the purchase method of accounting and identifiable intangible assets acquired in a
12
Management’s Discussion and Analysis of Financial Condition, M a r i n e M a x , I n c . a n d S u b s i d i a r i e s
and Results of Operations (continued)
business combination be recognized as assets and reported separately from goodwill. We have determined that our most significant acquired identifiable intangible assets are dealer agree-ments, which are indefinite-lived intangible assets. SFAS 142 requires that goodwill and indefi-nite-lived intangible assets no longer be amortized, but instead tested for impairment at least annually and whenever events or changes in circumstances indicate that the carrying value may not be recoverable. If the carrying amount of goodwill or an identifiable intangible asset exceeds its fair value, we would recognize an impairment loss. We measure any potential impairment based on various business valuation methodologies, including a projected discounted cash flow method. We completed our last annual impairment test during the fourth quarter of fiscal 2006, based on financial information as of the third quarter of fiscal 2006, which resulted in no impairment of goodwill or identifiable intangible assets. To date, we have not recognized any impairment of goodwill or identifiable intangible assets in the application of SFAS 142. We will continue to test goodwill and identifiable intangible assets for impairment at least annually and whenever events or changes in circumstances indicate that the carrying value may not be recov-erable. Prior to the adoption of SFAS 142, all purchase price in excess of the net tangible assets was recorded as goodwill and no identifiable intangible assets were recognized. Net goodwill and identifiable intangible assets amounted to $94.1 million and $22.1 million, respectively, at September 30, 2006.
The most significant estimates used in our goodwill valuation model include estimates of the future growth in our cash f lows and future working capital needs to support our projected growth. Should circumstances change causing these assumptions to differ materially than expected, our goodwill may become impaired, resulting in a material adverse effect on our operating margins.
For a more comprehensive list of our accounting policies, including those which involve varying degrees of judgment, see Note 3—“Significant Accounting Policies” of Notes to Consolidated Financial Statements.
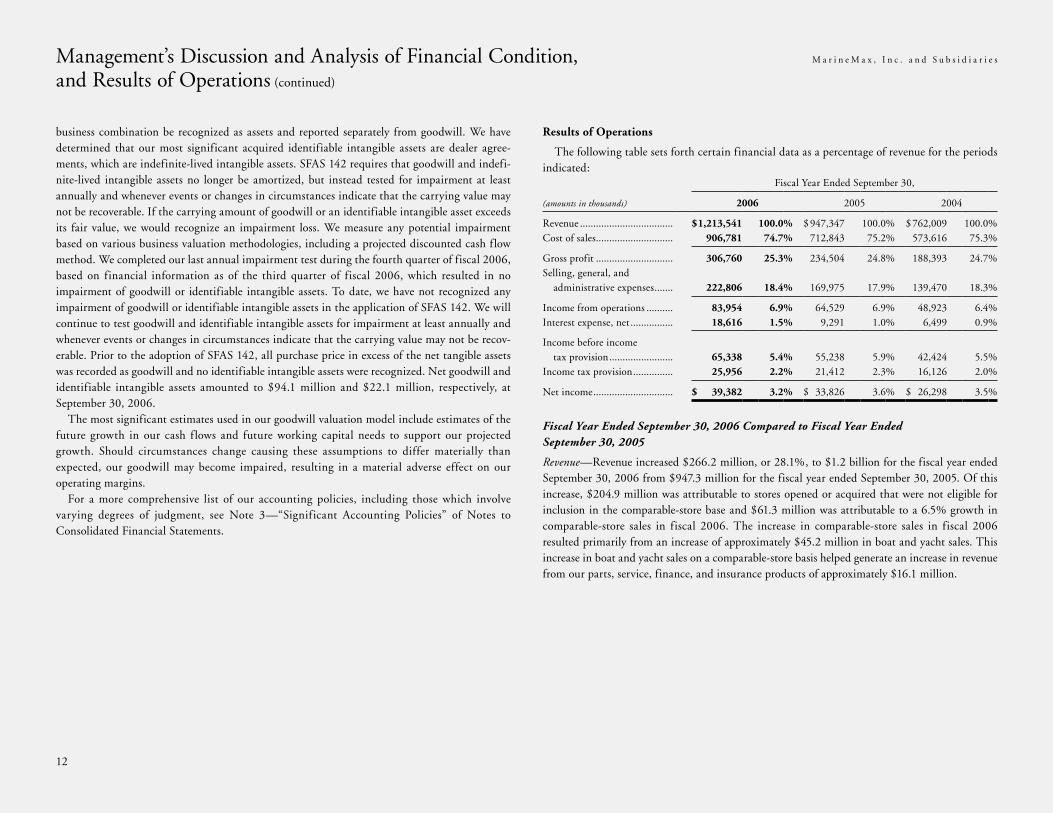
Results of Operations
The following table sets forth certain financial data as a percentage of revenue for the periods indicated:
Fiscal Year Ended September 30,
(amounts in thousands) 2006 2005 2004
Revenue ................................... $ 1,213,541 100.0% $ 947,347 100.0% $ 762,009 100.0%Cost of sales ............................. 906,781 74.7% 712,843 75.2% 573,616 75.3%
Gross profit ............................. 306,760 25.3% 234,504 24.8% 188,393 24.7%Selling, general, and administrative expenses ....... 222,806 18.4% 169,975 17.9% 139,470 18.3%
Income from operations .......... 83,954 6.9% 64,529 6.9% 48,923 6.4%Interest expense, net ................ 18,616 1.5% 9,291 1.0% 6,499 0.9%
Income before income tax provision ........................ 65,338 5.4% 55,238 5.9% 42,424 5.5%Income tax provision ............... 25,956 2.2% 21,412 2.3% 16,126 2.0%
Net income .............................. $ 39,382 3.2% $ 33,826 3.6% $ 26,298 3.5%
Fiscal Year Ended September 30, 2006 Compared to Fiscal Year Ended September 30, 2005
Revenue—Revenue increased $266.2 million, or 28.1%, to $1.2 billion for the fiscal year ended September 30, 2006 from $947.3 million for the fiscal year ended September 30, 2005. Of this increase, $204.9 million was attributable to stores opened or acquired that were not eligible for inclusion in the comparable-store base and $61.3 million was attributable to a 6.5% growth in comparable-store sales in fiscal 2006. The increase in comparable-store sales in fiscal 2006 resulted primarily from an increase of approximately $45.2 million in boat and yacht sales. This increase in boat and yacht sales on a comparable-store basis helped generate an increase in revenue from our parts, service, finance, and insurance products of approximately $16.1 million.
13
Gross Profit—Gross profit increased $72.3 million, or 30.8%, to $306.8 million for the fiscal year ended September 30, 2006 from $234.5 million for the fiscal year ended September 30, 2005. Gross profit as a percentage of revenue increased to 25.3% in fiscal 2006 from 24.8% in fiscal 2005. This increase was primarily attributable to an increase in service, finance, insurance, parts, and brokerage revenue, which generally yield higher gross margins than boat sales, and an increase in manufacturer programs in place for the year ended September 30, 2006. The increase in gross profit was partially offset by a decrease in gross margins on boat sales, coupled with an increase in yacht sales, which generally yield lower gross margins than boat sales.
Selling, General, and Administrative Expenses—Selling, general, and administrative expenses increased $52.8 million, or 31.1%, to $222.8 million for the fiscal year ended September 30, 2006 from $170.0 million for the fiscal year ended September 30, 2005. Selling, general, and administrative expenses as a percentage of revenue increased approximately 50 basis points to 18.4% for the year ended September 30, 2006 from 17.9% for the year ended September 30, 2005. In fiscal 2006, the increase as a percentage of revenue was attributable to approximately $3.5 million of stock option compensation expense resulting from the adoption of SFAS 123R and approximately $1.2 million of hurricane related expenses to move and repair inventory (net of related insurance reimbursements) and uninsured losses to our locations. Additionally, our selling, general and administrative expenses as a percentage of revenue increased due to increased marketing and commission expenses associated with achieving our level of comparable-store sales growth, increased facilities, and other costs associated with new and acquired stores.
Interest Expense—Interest expense increased $9.3 million, or 100.4%, to $18.6 million for the fiscal year ended September 30, 2006 from $9.3 million for the fiscal year ended September 30, 2005. Interest expense as a percentage of revenue increased to 1.5% for fiscal 2006 from 1.0% for fiscal 2005. The increase was primarily a result of increased borrowings associated with our revolving credit facility and mortgages, which accounted for an increase in interest expense of approximately $5.7 million and a less favorable interest rate environment, which accounted for an increase of approximately $3.6 million in interest expense.
Income Tax Provision—Income taxes increased $4.5 million, or 21.2%, to $26.0 million for the fiscal year ended September 30, 2006 from $21.4 million for the fiscal year ended September 30, 2005 as a result of increased earnings. Our effective tax rate increased to 39.7% for the f iscal year ended September 30, 2006 from 38.8% for the f iscal year ended September 30, 2005 as a result of the adoption of SFAS 123R.
Fiscal Year Ended September 30, 2005 Compared to Fiscal Year Ended September 30, 2004
Revenue—Revenue increased $185.3 million, or 24.3%, to $947.3 million for the fiscal year ended September 30, 2005 from $762.0 million for the fiscal year ended September 30, 2004. Of this increase, $11.9 million was attributable to stores opened or acquired that were not eligi-ble for inclusion in the comparable-store base and $173.4 million was attributable to a 22.8% growth in comparable-store sales in fiscal 2005. The increase in comparable-store sales in fiscal 2005 resulted primarily from an increase of approximately $160.2 million in boat and yacht sales. This increase in boat and yacht sales on a comparable-store basis helped generate an increase in revenue from our parts, service, finance, and insurance products of approximately $13.2 million.
Gross Profit—Gross profit increased $46.1 million, or 24.5%, to $234.5 million for the fiscal year ended September 30, 2005 from $188.4 million for the fiscal year ended September 30, 2004. Gross profit as a percentage of revenue increased to 24.8% in fiscal 2005 from 24.7% in fiscal 2004. This increase was primarily attributable to an increase in gross margins on boat sales and improvements in service, finance, insurance, parts, and brokerage revenues, which generally yield higher gross margins than boat sales. The increase in gross profit was partially offset by an increase in yacht sales, which generally yield lower gross margins than boat sales.
Selling, General, and Administrative Expenses—Selling, general, and administrative expenses increased $30.5 million, or 21.9%, to $170.0 million for the fiscal year ended September 30, 2005 from $139.5 million for the fiscal year ended September 30, 2004. Selling, general, and administrative expenses as a percentage of revenue decreased approximately 35 basis points to 17.9% for the year ended September 30, 2005 from 18.3% for the year ended September 30, 2004. The decrease as a percentage of revenue was attributable to an approximate 60 basis point decrease in our comparable-stores selling, general, and administrative expenses. This decrease incurred by our comparable-store locations resulted from the leveraging of our operating expense structure, which resulted in decreases in personnel costs and fixed expenses as a percentage of revenue. These decreases were partially offset by an approximate $4.4 million increase in mar-keting expenses associated with achieving our level of comparable-store sales growth, the addi-tion and expansion of various product lines, increases in inventory maintenance costs related to supporting our increase in comparable-store sales and the addition and expansion of various product lines, and an increase in our accrued litigation expense related to a single lawsuit award that we are currently appealing. Additionally, the reduction of the comparable-store expenses was partially offset by an increase in expenses associated with stores opened or acquired that were not eligible for inclusion in the comparable-store base. These opened or acquired stores generally operate at a higher expense structure than our other locations.
14
Interest Expense—Interest expense increased $2.8 million, or 43.0%, to $9.3 million for the fiscal year ended September 30, 2005 from $6.5 million for the fiscal year ended September 30, 2004. Interest expense as a percentage of revenue increased to 1.0% for fiscal 2005 from 0.9% for fiscal 2004. The increase was primarily a result of a less favorable interest rate environment, which accounted for approximately $2.2 million of the increase, coupled with an increase in the average borrowings associated with our revolving credit facility and mortgages, which accounted for approximately $600,000.
Income Tax Provision—Income taxes increased $5.3 million, or 32.8%, to $21.4 million for the fiscal year ended September 30, 2005 from $16.1 million for the fiscal year ended September 30, 2004 as a result of increased earnings. Our effective tax rate increased to 38.8% for the fiscal year ended September 30, 2005 from 38.0% for the fiscal year ended September 30, 2004 as a result of a review of our effective tax rate calculation for the jurisdictions in which we currently operate.
Quarterly Data and Seasonality
Our business, as well as the entire recreational boating industry, is highly seasonal, with sea-sonality varying in different geographic markets. With the exception of Florida, we generally realize significantly lower sales and higher levels of inventories, and related short-term
borrowings, in the quarterly periods ending December 31 and March 31. The onset of the public boat and recreation shows in January stimulates boat sales and allows us to reduce our inventory levels and related short-term borrowings throughout the remainder of the fiscal year. Our busi-ness could become substantially more seasonal as we acquire dealers that operate in colder regions of the United States.
Our business is also subject to weather patterns, which may adversely affect our results of operations. For example, drought conditions (or merely reduced rainfall levels) or excessive rain, may close area boating locations or render boating dangerous or inconvenient, thereby curtailing customer demand for our products. In addition, unseasonably cool weather and prolonged winter conditions may lead to a shorter selling season in certain locations. Hurricanes and other storms could result in disruptions of our operations or damage to our boat inventories and facilities, as was the case during fiscal 2006 and 2005 when Florida and other markets were affected by numerous hurricanes. Although our geographic diversity is likely to reduce the overall impact to us of adverse weather conditions in any one market area, these conditions will continue to represent potential, material adverse risks to us and our future financial performance.
The following table sets forth certain unaudited quarterly financial data for each of our last eight quarters. The information has been derived from unaudited financial statements that we believe reflect all adjustments, consisting only of normal recurring adjustments, necessary for the fair presentation of such quarterly financial information.
Management’s Discussion and Analysis of Financial Condition, M a r i n e M a x , I n c . a n d S u b s i d i a r i e s
and Results of Operations (continued)
The operating results for any quarter are not necessarily indicative of the results to be expected for any future period.
(amounts in thousands except share and per share data)
September 30, 2006
June 30, 2006
March 31, 2006
December 31, 2005
September 30, 2005
June 30, 2005
March 31, 2005
December 31, 2004
Revenue .......................................................................................................................... $323,622 $421,348 $287,387 $181,184 $228,634 $306,141 $228,384 $184,188Cost of sales .................................................................................................................... 230,044 321,089 218,812 136,836 163,936 235,475 173,368 140,064
Gross profit .................................................................................................................... 93,578 100,259 68,575 44,348 64,698 70,666 55,016 44,124Selling, general, and administrative expenses ................................................................ 67,017 65,229 50,088 40,472 46,011 45,903 40,921 37,140
Income from operations ................................................................................................. 26,561 35,030 18,487 3,876 18,687 24,763 14,095 6,984Interest expense .............................................................................................................. 5,661 5,900 4,294 2,761 1,936 2,267 2,704 2,384
Income before income tax provision .............................................................................. 20,900 29,130 14,193 1,115 16,751 22,496 11,391 4,600Income tax provision ...................................................................................................... 8,293 11,607 5,605 451 6,595 8,661 4,385 1,771
Net income ..................................................................................................................... $ 12,607 $ 17,523 $ 8,588 $ 664 $ 10,156 $ 13,835 $ 7,006 $ 2,829
Net income per share: Diluted ....................................................................................................................... $ 0.66 $ 0.90 $ 0.46 $ 0.04 $ 0.54 $ 0.74 $ 0.39 $ 0.17
Weighted-average number of shares: Diluted ....................................................................................................................... 19,009,231 19,426,294 18,751,417 18,525,849 18,703,958 18,633,251 17,834,520 16,959,020
15
Liquidity and Capital Resources
Our cash needs are primarily for working capital to support operations, including new and used boat and related parts inventories, off-season liquidity, and growth through acquisitions and new store openings. We regularly monitor the aging of our inventories and current market trends to evaluate our current and future inventory needs. We also use this evaluation in con-junction with our review of our current and expected operating performance and expected growth to determine the adequacy of our financing needs. These cash needs have historically been financed with cash generated from operations and borrowings under our line of credit facility. We currently depend upon dividends and other payments from our consolidated operating subsidiaries, and our line of credit facility to fund our current operations and meet our cash needs. Currently, no agreements exist that restrict this f low of funds from our operating subsidiaries.
For the fiscal year ended September 30, 2006, cash provided by operating activities approxi-mated $9.3 million. For the fiscal years ended September 30, 2005 and 2004, cash used in operating activities was approximately $13.8 million and $30.0 million, respectively. For the fis-cal year ended September 30, 2006, cash provided by operating activities was due primarily to net income, adjusted for non-cash depreciation, amortization, and stock-based compensation charges, and increases in accounts payable and accrued expenses, partially offset by an increase in accounts receivable due to increased revenues, an increase in inventories to ensure appropriate inventory levels, and a decrease in customer deposits. For the fiscal year ended September 30, 2005, cash used in operating activities was due primarily to a decrease in accounts payable due to the timing of certain payments to our manufacturers and an increase in inventories due to the continued expansion of existing product lines and to ensure appropriate inventory levels, par-tially offset by net income and an increase in customer deposits. For the fiscal year ended September 30, 2004, cash used in operating activities was due primarily to an increase in inven-tories due to the addition of new product lines, the continued expansion of existing product lines, and to ensure appropriate inventory levels, partially offset by net income, an increase in accounts payable due to the timing of certain payments to our manufacturers, and an increase in customer deposits.
For the fiscal years ended September 30, 2006, 2005, and 2004, cash used in investing activ-ities was approximately $95.4 million, $17.9 million, and $20.2 million, respectively. For the fiscal years ended September 30, 2006 and 2004, cash used in investing activities was primarily used in business acquisitions and to purchase property and equipment associated with opening new retail facilities or improving and relocating existing retail facilities. For the fiscal year ended September 30, 2005, cash used in investing activities was primarily used to purchase property and equipment associated with opening new retail facilities or improving and relocating existing retail facilities.
For the fiscal years ended September 30, 2006, 2005, and 2004, cash provided by financing activities was approximately $83.9 million, $43.9 million, and $54.7 million, respectively. For the fiscal year ended September 30, 2006, cash provided by financing activities was primarily attributable to proceeds from net borrowings on short-term borrowings as a result of increased inventory levels and borrowings on long-term debt on equipment and real estate acquired, and proceeds from common shares issued upon the exercise of stock options and under the employee stock purchase plan, partially offset by purchases of treasury stock and repayments of long-term debt. For the fiscal year ended September 30, 2005, cash provided by financing activities was primarily attributable to proceeds from common shares issued through the February 2005 pub-lic offering, upon the exercise of stock options, and stock purchases under our employee stock purchase plan, partially offset by net repayments on short-term borrowings as a result of using the proceeds from the issuance of common shares through the February 2005 public offering and repayments of long-term debt. For the fiscal year ended September 30, 2004, cash provided by financing activities was primarily attributable to proceeds from net borrowings on short-term borrowings as a result of increased inventory levels and borrowings on long-term debt on equip-ment and real estate acquired, and proceeds from common shares issued upon the exercise of stock options and under the employee stock purchase plan, partially offset by repayments of long-term debt.
As of September 30, 2006, our indebtedness totaled approximately $358.7 million, of which approximately $37.2 million was associated with our real estate holdings and $321.5 million was associated with financing our inventory and working capital needs.
During June 2006, we entered into a second amended and restated credit and security agree-ment with eight financial institutions. The credit facility provides us a line of credit with asset-based borrowing availability of up to $500 million for working capital and inventory financing, with the amount of permissible borrowings determined pursuant to a borrowing base formula. The credit facility also permits approved-vendor floorplan borrowings of up to $20 million. The credit facility accrues interest at LIBOR plus 150 to 260 basis points, with the interest rate based upon the ratio of our net outstanding borrowings to our tangible net worth. The credit facility is secured by our inventory, accounts receivable, equipment, furniture, and fixtures. The credit facility requires us to satisfy certain covenants, including maintaining a leverage ratio tied to our tangible net worth. The other terms and conditions of the new credit facility are generally simi-lar to the previous credit facility. The credit facility matures in May 2011, with two one-year renewal options remaining. As of September 30, 2006, we were in compliance with all of the credit facility covenants.
16
Prior to the June 2006 second amended and restated credit and security agreement, our credit facility was amended during March 2006 and February 2006. The March 2006 amendment temporarily increased our asset-based borrowing availability up to $415 million through July 31, 2006. The February 2006 amendment increased our asset-based borrowing availability up to $385 million, and extended the maturity of the credit facility to March 1, 2009, with two one-year renewal options. Prior to the February 2006 amendment, our credit facility provided us with asset-based borrowing availability of up to $340 million, permitted up to $20 million in approved-vendor floorplan borrowings, accrued interest at a rate of LIBOR plus 150 to 260 basis points, and was scheduled to mature in March 2008, with two one-year renewal options remain-ing. The other terms and conditions of the credit facility were generally similar to the new credit facility.
During the fiscal years ended September 30, 2006, 2005, and 2004, we completed the acqui-sition of five marine retail operations. We acquired the net assets, related property, and buildings and assumed or retired certain liabilities, including the outstanding floorplan obligations related to new boat inventories, for approximately $62.8 million in cash, including acquisition costs and 665,024 shares of common stock valued at $33.71 per share.
Except as specified in this “Management’s Discussion and Analysis of Financial Condition, and Results of Operations” and in our consolidated financial statements, we have no material commitments for capital for the next 12 months. We believe that our existing capital resources will be sufficient to finance our operations for at least the next 12 months, except for possible significant acquisitions.
Contractual Commitments and Commercial Commitments
The following table sets forth a summary of our material contractual obligations and commercial commitments as of September 30, 2006:
Year Ending September 30,(amounts in thousands)
Line of Credit
Long-Term Debt
OperatingLeases Total
2007......................................................................... $321,500 $ 4,532 $10,362 $336,3942008......................................................................... — 4,626 8,300 12,9262009......................................................................... — 4,720 4,603 9,3232010......................................................................... — 4,826 3,532 8,3582011......................................................................... — 4,185 2,426 6,611Thereafter ................................................................ — 14,297 542 14,839
Total ........................................................................ $321,500 $37,186 $29,765 $388,451
Management’s Discussion and Analysis of Financial Condition, M a r i n e M a x , I n c . a n d S u b s i d i a r i e s
and Results of Operations (continued)
17
Consolidated Balance Sheets M a r i n e M a x , I n c . a n d S u b s i d i a r i e s
(Amounts in thousands except share and per share data)
September 30, 2006
September 30, 2005
A SSETSCurrent Assets: Cash and cash equivalents $ 25,113 $ 27,271 Accounts receivable, net .............................................................................................................................................................................................................. 57,589 26,235 Inventories, net ............................................................................................................................................................................................................................ 462,847 317,705 Prepaid expenses and other current assets ................................................................................................................................................................................... 8,445 6,934 Deferred tax assets ....................................................................................................................................................................................................................... 4,486 4,956
Total current assets .............................................................................................................................................................................................................. 558,480 383,101Property and equipment, net ........................................................................................................................................................................................................... 122,215 99,994Goodwill and other intangible assets, net ....................................................................................................................................................................................... 116,195 56,184Other long-term assets ..................................................................................................................................................................................................................... 4,673 211
Total assets .......................................................................................................................................................................................................................... $801,563 $539,490
LI A BILIT I E S A ND STOCK HOLDER S’ EQU IT YCurrent Liabilities: Accounts payable ......................................................................................................................................................................................................................... $ 37,398 $ 18,146 Customer deposits ....................................................................................................................................................................................................................... 17,170 25,793 Accrued expenses ......................................................................................................................................................................................................................... 26,783 21,096 Short-term borrowings ................................................................................................................................................................................................................ 321,500 150,000 Current maturities of long-term debt .......................................................................................................................................................................................... 4,532 4,635
Total current liabilities ........................................................................................................................................................................................................ 407,383 219,670Deferred tax liabilities ..................................................................................................................................................................................................................... 11,639 10,771Long-term debt, net of current maturities ....................................................................................................................................................................................... 32,654 25,450
Total liabilities ..................................................................................................................................................................................................................... 451,676 255,891Commitments And ContingenciesStockholders’ Equity: Preferred stock, $.001 par value, 1,000,000 shares authorized, none issued or outstanding at September 30, 2006 and 2005 ................................................. — — Common stock, $.001 par value; 24,000,000 shares authorized, 18,529,524 and 17,678,087 shares issued and outstanding at
September 30, 2006 and 2005, respectively ............................................................................................................................................................................ 19 18 Additional paid-in capital ............................................................................................................................................................................................................ 156,618 125,672 Retained earnings ........................................................................................................................................................................................................................ 200,306 160,924 Deferred stock compensation ...................................................................................................................................................................................................... — (2,397) Accumulated other comprehensive income ................................................................................................................................................................................. 507 — Treasury stock, at cost, 336,300 and 30,000 shares held at September 30, 2006 and 2005, respectively .................................................................................. (7,563) (618)
Total stockholders’ equity .................................................................................................................................................................................................... 349,887 283,599
Total liabilities and stockholders’ equity ............................................................................................................................................................................. $801,563 $539,490
See accompanying notes.
18
Consolidated Statements of Operations M a r i n e M a x , I n c . a n d S u b s i d i a r i e s
(Amounts in thousands except share and per share data)
For the Year Ended September 30,
2006 2005 2004
Revenue ....................................................................................................................................................................................................................... $ 1,213,541 $947,347 $762,009Cost of sales ................................................................................................................................................................................................................. 906,781 712,843 573,616
Gross profit .............................................................................................................................................................................................................. 306,760 234,504 188,393Selling, general, and administrative expenses .............................................................................................................................................................. 222,806 169,975 139,470
Income from operations .......................................................................................................................................................................................... 83,954 64,529 48,923Interest expense ........................................................................................................................................................................................................... 18,616 9,291 6,499
Income before income tax provision ............................................................................................................................................................................ 65,338 55,238 42,424Income tax provision ................................................................................................................................................................................................... 25,956 21,412 16,126
Net income .................................................................................................................................................................................................................. $ 39,382 $ 33,826 $ 26,298
Basic net income per common share ........................................................................................................................................................................... $ 2.18 $ 2.01 $ 1.69
Diluted net income per common share ....................................................................................................................................................................... $ 2.08 $ 1.88 $ 1.58
Weighted-average number of common shares used in computing net income per common share: Basic ........................................................................................................................................................................................................................ 18,028,562 16,815,445 15,585,314
Diluted .................................................................................................................................................................................................................... 18,928,735 18,032,533 16,666,107
See accompanying notes.
19
Consolidated Statements of Comprehensive Income M a r i n e M a x , I n c . a n d S u b s i d i a r i e s
(Amounts in thousands)
For the Year Ended September 30,
2006 2005 2004
Net income .................................................................................................................................................................................................................................. $39,382 $33,826 $26,298Other comprehensive income: Change in fair market value of interest rate swap, net of tax of $34 ....................................................................................................................................... 54 — — Change in fair market value of foreign currency hedges, net of tax of $284 .......................................................................................................................... 453 — —
Comprehensive income ............................................................................................................................................................................................................... $39,889 $33,826 $26,298
See accompanying notes.
20
Consolidated Statements of Stockholders’ Equity M a r i n e M a x , I n c . a n d S u b s i d i a r i e s
(Amounts in thousands except share data)
Additional Paid-in Capital
Retained Earnings
Deferred Stock
Compensation
Accumulated Other
Comprehensive Income
Treasury Stock
Total Stockholders’
Equity
Common Stock
Shares Amount
BALANCE, September 30, 2003 ............................................................... 15,401,686 $15 $ 65,235 $100,806 $ — $ — $ — $166,056
Net income ................................................................................................. — — — 26,298 — — — 26,298Purchase of treasury stock .......................................................................... (32,000) — — — — — (678) (678)Issuance of treasury stock ........................................................................... 2,000 — — (6) — — 60 54Shares issued under employee stock purchase plan .................................... 64,429 — 636 — — — — 636Shares issued upon exercise of stock options .............................................. 271,338 1 2,964 — — — — 2,965Stock-based compensation .......................................................................... 3,559 — 80 — — — — 80Tax benefits of options exercised ................................................................ — — 1,410 — — — — 1,410
BALANCE, September 30, 2004 .............................................................. 15,711,012 16 70,325 127,098 — — (618) 196,821
Net income ................................................................................................. — — — 33,826 — — — 33,826Shares issued under employee stock purchase plan .................................... 51,727 — 1,018 — — — — 1,018Shares issued upon exercise of stock options .............................................. 379,567 — 4,268 — — — — 4,268Shares issued through public offering ........................................................ 1,429,000 2 44,201 — — — — 44,203Stock-based compensation .......................................................................... 106,781 — 3,132 — (3,027) — — 105Amortization of deferred stock compensation ............................................ — — — — 630 — — 630Tax benefits of options exercised ................................................................ — — 2,728 — — — — 2,728
BALANCE, September 30, 2005 ............................................................... 17,678,087 18 125,672 160,924 (2,397) — (618) 283,599
Net income ................................................................................................. — — — 39,382 — — — 39,382Purchase of treasury stock .......................................................................... (306,300) — — — — — (6,945) (6,945)Reclassification resulting from adoption of SFAS 123R ............................ — — (2,397) — 2,397 — — —Shares issued under employee stock purchase plan .................................... 59,197 — 1,283 — — — — 1,283Shares issued upon exercise of stock options .............................................. 253,353 — 2,581 — — — — 2,581Stock-based compensation .......................................................................... 180,163 — 5,567 — — — — 5,567Shares issued upon business acquisition ..................................................... 665,024 1 22,417 — — — — 22,418Tax benefits of options exercised ................................................................ — — 1,495 — — — — 1,495Change in fair market value of derivative instruments, net of tax ............. — — — — — 507 — 507
BALANCE, September 30, 2006 ............................................................ 18,529,524 $19 $156,618 $200,306 $ — $507 $(7,563) $349,887
See accompanying notes.
21
Consolidated Statements of Cash Flows M a r i n e M a x , I n c . a n d S u b s i d i a r i e s
(Amounts in thousands)
For the Year Ended September 30,
2006 2005 2004
Cash Flows from Operating Activities: Net income ........................................................................................................................................................................................................................ $ 39,382 $ 33,826 $ 26,298 Adjustments to reconcile net income to net cash provided by (used in) operating activities: Depreciation and amortization ...................................................................................................................................................................................... 8,607 6,118 5,273 Deferred income tax provision ...................................................................................................................................................................................... 1,338 363 180 (Gain) loss on sale of property and equipment ............................................................................................................................................................. (42) (136) 1 Stock-based compensation expense ............................................................................................................................................................................... 5,567 735 80 Tax benefits of options exercised ................................................................................................................................................................................... 1,495 2,728 1,410 Excess tax benefits from stock-based compensation ...................................................................................................................................................... (1,127) — — (Increase) decrease in— Accounts receivable, net ................................................................................................................................................................................................ (21,385) (1,258) (3,220) Inventories, net .............................................................................................................................................................................................................. (25,334) (31,143) (110,369) Prepaid expenses and other assets .................................................................................................................................................................................. (1,411) (659) (1,640) Increase (decrease) in— Accounts payable ........................................................................................................................................................................................................... 20,196 (37,720) 43,439 Customer deposits ......................................................................................................................................................................................................... (21,988) 9,876 5,989 Accrued expenses ........................................................................................................................................................................................................... 4,104 3,471 2,608
Net cash provided by (used in) operating activities ................................................................................................................................................... 9,402 (13,799) (29,951)
Cash Flows from Investing Activities: Purchases of property and equipment ............................................................................................................................................................................... (10,164) (17,795) (10,174) Net cash invested in joint venture ..................................................................................................................................................................................... (4,007) — — Net cash used in acquisitions of businesses, net assets, and intangible assets ................................................................................................................... (81,369) (650) (10,232) Proceeds from sale of property and equipment ................................................................................................................................................................. 105 571 235
Net cash used in investing activities .......................................................................................................................................................................... (95,435) (17,874) (20,171)
See accompanying notes. (continued)
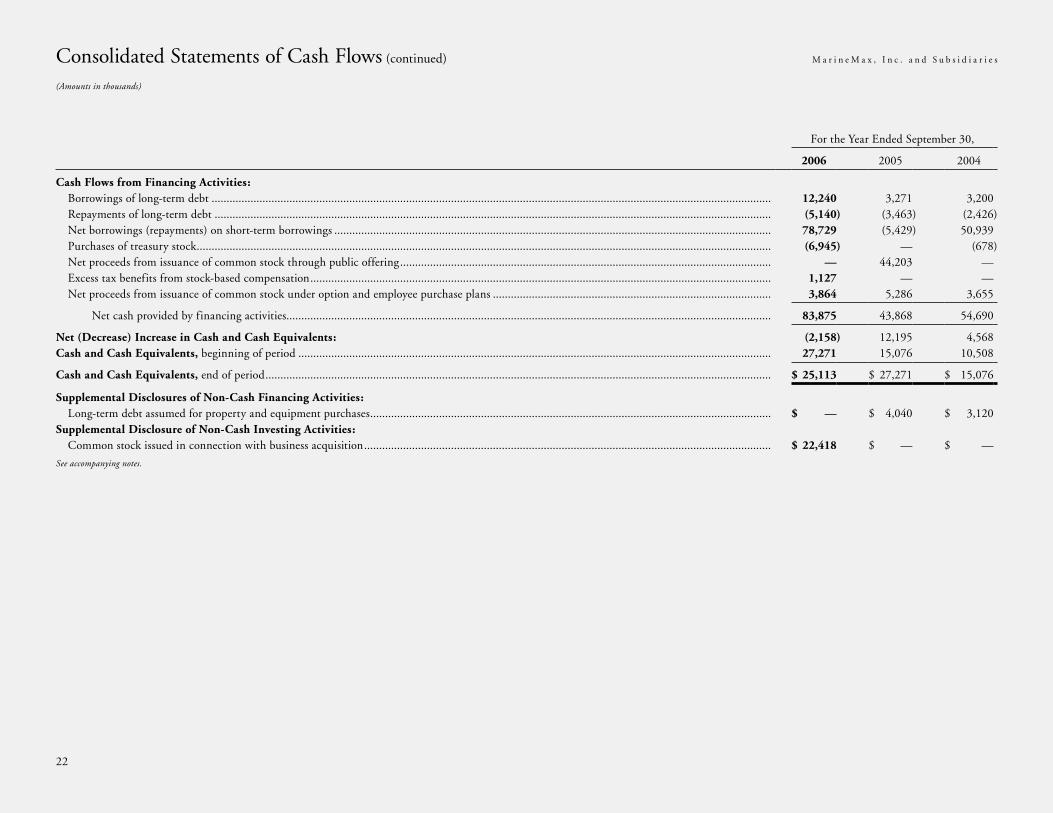
22
Consolidated Statements of Cash Flows (continued) M a r i n e M a x , I n c . a n d S u b s i d i a r i e s
(Amounts in thousands)
For the Year Ended September 30,
2006 2005 2004
Cash Flows from Financing Activities: Borrowings of long-term debt ........................................................................................................................................................................................... 12,240 3,271 3,200 Repayments of long-term debt .......................................................................................................................................................................................... (5,140) (3,463) (2,426) Net borrowings (repayments) on short-term borrowings .................................................................................................................................................. 78,729 (5,429) 50,939 Purchases of treasury stock ................................................................................................................................................................................................ (6,945) — (678) Net proceeds from issuance of common stock through public offering ............................................................................................................................ — 44,203 — Excess tax benefits from stock-based compensation .......................................................................................................................................................... 1,127 — — Net proceeds from issuance of common stock under option and employee purchase plans ............................................................................................. 3,864 5,286 3,655
Net cash provided by financing activities .................................................................................................................................................................. 83,875 43,868 54,690
Net (Decrease) Increase in Cash and Cash Equivalents: (2,158) 12,195 4,568Cash and Cash Equivalents, beginning of period .............................................................................................................................................................. 27,271 15,076 10,508
Cash and Cash Equivalents, end of period ......................................................................................................................................................................... $ 25,113 $ 27,271 $ 15,076
Supplemental Disclosures of Non-Cash Financing Activities: Long-term debt assumed for property and equipment purchases ...................................................................................................................................... $ — $ 4,040 $ 3,120Supplemental Disclosure of Non-Cash Investing Activities: Common stock issued in connection with business acquisition ........................................................................................................................................ $ 22,418 $ — $ —
See accompanying notes.
23
Notes to Consolidated Financial Statements M a r i n e M a x , I n c . a n d S u b s i d i a r i e s
1. COMPANY BACKGROUND AND BASIS OF PRESENTATION:
We were incorporated in Delaware in January 1998 and are the largest recreational boat retailer in the United States. We engage primarily in the retail sale, brokerage, and service of new and used boats, motors, trailers, marine parts, and accessories and offer slip and storage accom-modations in certain locations. In addition, we arrange related boat financing, insurance, and extended service contracts. As of September 30, 2006, we operated through 87 retail locations in 22 states, consisting of Alabama, Arizona, California, Colorado, Connecticut, Delaware, Florida, Georgia, Maryland, Minnesota, Missouri, Nevada, New Jersey, New York, North Carolina, Ohio, Oklahoma, Rhode Island, South Carolina, Tennessee, Texas, and Utah.
We are the nation’s largest retailer of Sea Ray, Boston Whaler, Meridian, and Hatteras Yachts, all of which are manufactured by Brunswick Corporation (Brunswick), the world’s largest man-ufacturer of marine products. Sales of new Brunswick boats accounted for approximately 59%, 60%, and 60% of our revenue in fiscal 2006, 2005, and 2004, respectively. We believe we rep-resented approximately 13%, 10%, and 10% of all Brunswick marine product sales during fiscal 2006, 2005, and 2004, respectively.
We have dealership agreements with Sea Ray, Boston Whaler, Meridian, Hatteras Yachts, Mercury Marine, and Baja Marine Corporation, all subsidiaries or divisions of Brunswick. We also have dealer agreements with Ferretti Group, Bertram and Azimut. These agreements allow us to purchase, stock, sell, and service these manufacturers’ boats and products. These agreements also allow us to use these manufacturers’ names, trade symbols, and intellectual properties in our operations.
Each of our operating dealership subsidiaries that carry the Sea Ray product line is party to a multi-year dealer agreement with Brunswick covering Sea Ray products and is the exclusive dealer of Sea Ray boats in its geographic markets. Our subsidiary, MarineMax Motor Yachts, LLC, is a party to a dealer agreement with Hatteras Yachts. The agreement gives us the right to sell Hatteras Yachts throughout the state of Florida (excluding the Florida Panhandle) and the state of Texas, as well as the U.S. distribution rights for Hatteras products over 82 feet. Our subsidiary, MarineMax International, LLC, is a party to a dealer agreement with Ferretti Group and Bertram Yachts. The agreement appoints us as the exclusive dealer for Ferretti Yachts, Pershing, Riva, Apreamare, and Mochi Craft mega-yachts, yachts and other recreational boats for the United States, Canada, and the Bahamas. The agreement also appoints us as the exclusive dealer for Bertram in the United States (excluding the Florida peninsula and certain portions of New England), Canada, and the Bahamas.
Upon the completion of the Surfside-3 acquisition, we became the exclusive dealer for Azimut-Benetti Group’s product lines Azimut and Atlantis. The Azimut dealer agreement provides a geographic territory to promote the product line and to network with the appropriate clientele through various independent locations designated for Azimut retail sales.
As is typical in the industry, we deal with manufacturers, other than the Sea Ray division of Brunswick, under renewable annual dealer agreements, each of which gives us the right to sell various makes and models of boats within a given geographic region. Any change or termination of these agreements for any reason, including changes in competitive, regulatory, or marketing practices, including rebate or incentive programs, could adversely affect our results of operations. Although there are a limited number of manufacturers of the type of boats and products that we sell, we believe that adequate alternative sources would be available to replace any manufacturer other than Brunswick as a product source. These alternative sources may not be available at the time of any interruption, and alternative products may not be available at comparable terms, which could affect operating results adversely. Additionally, a change in suppliers could cause a loss of revenue, which would affect operating results adversely.
The consolidated financial statements include our accounts and the accounts of our subsidiar-ies, all of which are wholly owned. All significant intercompany transactions and accounts have been eliminated.
2. ACQUISITIONS:
We commenced operations with the acquisition of five independent recreational boat dealers on March 1, 1998. Since the initial acquisitions, we have acquired 20 recreational boat dealers, two boat brokerage operations, and two full-service yacht repair facilities. As a part of our acqui-sition strategy, we frequently engage in discussions with various recreational boat dealers regard-ing their potential acquisition by us. Potential acquisition discussions frequently take place over a long period of time and involve difficult business integration and other issues, including, in some cases, management succession and related matters. As a result of these and other factors, a number of potential acquisitions that from time to time appear likely to occur do not result in binding legal agreements and are not consummated. The following describes the acquisitions we completed during the fiscal years ended September 30, 2006 and 2004. No significant acquisi-tions were completed during the fiscal year ended September 30, 2005.
During January 2006, we acquired substantially all of the assets, including certain real estate, and assumed certain liabilities of the Port Arrowhead Group (Port Arrowhead), a privately held boat dealership with locations in Missouri and Oklahoma, for approximately $27.5 million in cash, including acquisition costs, plus working capital adjustments. Port Arrowhead operates six retail locations, including a large marina with more than 300 slips. The acquisition expands our ability to serve consumers in the Midwest boating community, including neighboring boating destinations in Illinois, Kansas, and Arkansas. The acquisition also allows us to capitalize on Port Arrowhead’s market position and leverage our inventory management and inventory financ-ing resources over the acquired locations. Based on our preliminary valuation, the purchase price, including acquisition costs, is anticipated to result in the recognition of approximately $6.1 million in tax deductible goodwill and approximately $2.0 million in tax deductible
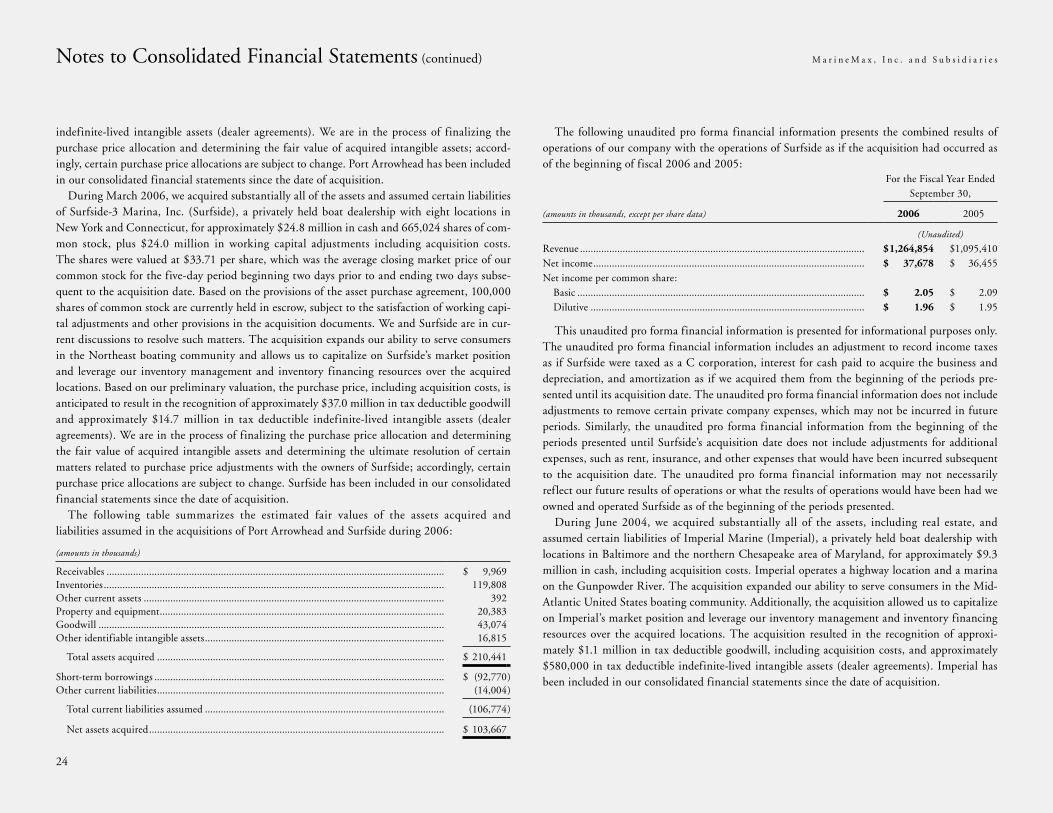
24
Notes to Consolidated Financial Statements (continued) M a r i n e M a x , I n c . a n d S u b s i d i a r i e s
indefinite-lived intangible assets (dealer agreements). We are in the process of finalizing the purchase price allocation and determining the fair value of acquired intangible assets; accord-ingly, certain purchase price allocations are subject to change. Port Arrowhead has been included in our consolidated financial statements since the date of acquisition.
During March 2006, we acquired substantially all of the assets and assumed certain liabilities of Surfside-3 Marina, Inc. (Surfside), a privately held boat dealership with eight locations in New York and Connecticut, for approximately $24.8 million in cash and 665,024 shares of com-mon stock, plus $24.0 million in working capital adjustments including acquisition costs. The shares were valued at $33.71 per share, which was the average closing market price of our common stock for the five-day period beginning two days prior to and ending two days subse-quent to the acquisition date. Based on the provisions of the asset purchase agreement, 100,000 shares of common stock are currently held in escrow, subject to the satisfaction of working capi-tal adjustments and other provisions in the acquisition documents. We and Surfside are in cur-rent discussions to resolve such matters. The acquisition expands our ability to serve consumers in the Northeast boating community and allows us to capitalize on Surfside’s market position and leverage our inventory management and inventory financing resources over the acquired locations. Based on our preliminary valuation, the purchase price, including acquisition costs, is anticipated to result in the recognition of approximately $37.0 million in tax deductible goodwill and approximately $14.7 million in tax deductible indefinite-lived intangible assets (dealer agreements). We are in the process of finalizing the purchase price allocation and determining the fair value of acquired intangible assets and determining the ultimate resolution of certain matters related to purchase price adjustments with the owners of Surfside; accordingly, certain purchase price allocations are subject to change. Surfside has been included in our consolidated financial statements since the date of acquisition.
The following table summarizes the estimated fair values of the assets acquired and liabilities assumed in the acquisitions of Port Arrowhead and Surfside during 2006:
(amounts in thousands)
Receivables ............................................................................................................................... $ 9,969Inventories ................................................................................................................................ 119,808Other current assets ................................................................................................................. 392Property and equipment ........................................................................................................... 20,383Goodwill .................................................................................................................................. 43,074Other identifiable intangible assets .......................................................................................... 16,815
Total assets acquired ............................................................................................................ $ 210,441
Short-term borrowings ............................................................................................................. $ (92,770)Other current liabilities ............................................................................................................ (14,004)
Total current liabilities assumed .......................................................................................... (106,774)
Net assets acquired ............................................................................................................... $ 103,667
The following unaudited pro forma financial information presents the combined results of operations of our company with the operations of Surfside as if the acquisition had occurred as of the beginning of fiscal 2006 and 2005:
For the Fiscal Year Ended September 30,
(amounts in thousands, except per share data) 2006 2005
(Unaudited)
Revenue ........................................................................................................... $ 1,264,854 $ 1,095,410Net income ...................................................................................................... $ 37,678 $ 36,455Net income per common share: Basic ............................................................................................................ $ 2.05 $ 2.09 Dilutive ....................................................................................................... $ 1.96 $ 1.95
This unaudited pro forma financial information is presented for informational purposes only. The unaudited pro forma financial information includes an adjustment to record income taxes as if Surfside were taxed as a C corporation, interest for cash paid to acquire the business and depreciation, and amortization as if we acquired them from the beginning of the periods pre-sented until its acquisition date. The unaudited pro forma financial information does not include adjustments to remove certain private company expenses, which may not be incurred in future periods. Similarly, the unaudited pro forma financial information from the beginning of the periods presented until Surfside’s acquisition date does not include adjustments for additional expenses, such as rent, insurance, and other expenses that would have been incurred subsequent to the acquisition date. The unaudited pro forma financial information may not necessarily reflect our future results of operations or what the results of operations would have been had we owned and operated Surfside as of the beginning of the periods presented.
During June 2004, we acquired substantially all of the assets, including real estate, and assumed certain liabilities of Imperial Marine (Imperial), a privately held boat dealership with locations in Baltimore and the northern Chesapeake area of Maryland, for approximately $9.3 million in cash, including acquisition costs. Imperial operates a highway location and a marina on the Gunpowder River. The acquisition expanded our ability to serve consumers in the Mid-Atlantic United States boating community. Additionally, the acquisition allowed us to capitalize on Imperial’s market position and leverage our inventory management and inventory financing resources over the acquired locations. The acquisition resulted in the recognition of approxi-mately $1.1 million in tax deductible goodwill, including acquisition costs, and approximately $580,000 in tax deductible indefinite-lived intangible assets (dealer agreements). Imperial has been included in our consolidated financial statements since the date of acquisition.
25
During June 2004, we purchased inventory, certain equipment and assumed certain liabilities from the previous Jacksonville, Florida-based Sea Ray dealer (Jacksonville) for the sport boat and sport cruiser product lines for approximately $900,000 in cash, including acquisition costs. The purchase enhanced our ability to serve customers in the northeast Florida boating commu-nity by adding the sport boat and sport cruiser product lines to our existing Sea Ray product offerings. The acquisition resulted in the recognition of approximately $240,000 in tax deduct-ible goodwill, including acquisition costs, and approximately $450,000 in tax deductible indefi-nite-lived intangible assets (dealer agreements). Jacksonville has been included in our consolidated financial statements since the date of acquisition.
During October 2003, we acquired substantially all of the assets and assumed certain liabili-ties of Emarine International, Inc. and Steven Myers, Inc. (Emarine), a privately held boat deal-ership located in Fort Lauderdale, Florida, for approximately $305,000 in cash. The acquisition resulted in the recognition of approximately $300,000 in tax deductible goodwill, including acquisition costs. The acquisition provided us with an established retail location to sell the newly offered Ferretti Group products in the southeast Florida boating community. The asset purchase agreement contained an earn out provision based on the future profits of the location, assuming certain conditions and provisions were met. In August 2004, the earn out provisions were modi-fied withdrawing the requirements for any future earn out payments. Emarine has been included in our consolidated financial statements since the date of acquisition.
Pro forma results of operations have not been presented with respect to any of the fiscal 2004 acquisitions, as the effects of those acquisitions were not significant on either an individual or an aggregate basis.
3. SIGNIFICANT ACCOUNTING POLICIES:
Statements of Cash Flows
For purposes of the consolidated statements of cash flows, we consider all highly liquid invest-ments with an original maturity of three months or less to be cash equivalents.
We made interest payments of approximately $17.2 million, $9.0 million, and $6.5 million for the fiscal years ended September 30, 2006, 2005, and 2004, respectively, including interest on debt to finance our real estate holdings and new boat inventory. We made income tax payments of approximately $8.9 million, $15.3 million, and $16.2 million for the fiscal years ended September 30, 2006, 2005, and 2004, respectively.
Vendor Consideration Received
We account for consideration received from our vendors in accordance with Emerging Issues Task Force Issue No. 02-16, “Accounting by a Customer (Including a Reseller) for Certain Consideration Received from a Vendor” (EITF 02-16). EITF 02-16 most significantly requires us to classify interest assistance received from manufacturers as a reduction of inventory cost and related cost of sales as opposed to netting the assistance against our interest expense incurred with our lenders. Pursuant to EITF 02-16, amounts received by us under our co-op assistance programs from our manufacturers, are netted against related advertising expenses.
Inventories
Inventory costs consist of the amount paid to acquire the inventory, net of vendor consideration and purchase discounts, the cost of equipment added, reconditioning costs, and transportation costs relating to acquiring inventory for sale. New and used boat, motor, and trailer inventories are stated at the lower of cost, determined on a specific-identification basis, or market. Parts and accessories are stated at the lower of cost, determined on the first-in, first-out basis, or market. Based on the agings of the inventories and our consideration of current market trends, we maintain a lower of cost or market valuation allowance, which was not material to the consolidated financial statements taken as a whole as of September 30, 2006 or 2005.
Property and Equipment
We record property and equipment at cost, net of accumulated depreciation, and depreciate over their estimated useful lives using the straight-line method. We capitalize and amortize leasehold improvements over the lesser of the life of the lease or the estimated useful life of the asset. Useful lives for purposes of computing depreciation are as follows:
Years
Buildings and improvements ............................................................................................................. 5-40Machinery and equipment ................................................................................................................ 3-10Furniture and fixtures ....................................................................................................................... 5-10Vehicles ............................................................................................................................................. 3-5
We remove the cost of property and equipment sold or retired and the related accumulated depreciation from the accounts at the time of disposition, and include any resulting gain or loss in the consolidated statements of operations. We charge maintenance, repairs, and minor replace-ments to operations as incurred; we capitalize and amortize major replacements and improvements over their useful lives.
26
Valuation of Goodwill and Other Intangible Assets
We account for goodwill and identifiable intangible assets in accordance with Statement of Financial Accounting Standards No. 141, “Business Combinations” (SFAS 141), and Statement of Financial Accounting Standards No. 142, “Goodwill and Other Intangible Assets” (SFAS 142). SFAS 141 requires that all business combinations initiated after June 30, 2001 be accounted for using the purchase method of accounting and identifiable intangible assets acquired in a business combination be recognized as assets and reported separately from goodwill. We have determined that our most significant acquired identifiable intangible assets are the dealer agree-ments, which are indefinite-lived intangible assets. SFAS 142 requires that goodwill and indefinite-lived intangible assets no longer be amortized, but instead tested for impairment at least annually and whenever events or changes in circumstances indicate that the carrying value may not be recoverable. If the carrying amount of goodwill or an identifiable intangible asset exceeds its fair value, we would recognize an impairment loss. We measure any potential impair-ment based on various business valuation methodologies, including a projected discounted cash f low method. We completed the annual impairment test during the fourth quarter of fiscal 2006, based on financial information as of the third quarter of fiscal 2006, which resulted in no impairment of goodwill or identifiable intangible assets. To date, we have not recognized any impairment of goodwill or identifiable intangible assets in the application of SFAS 142.
There was no goodwill amortization expense for the fiscal years ended September 30, 2006, 2005, and 2004. Accumulated amortization of goodwill was approximately $2.6 million at September 30, 2006 and 2005.
Impairment of Long-Lived Assets
Statement of Financial Accounting Standards No. 144, “Accounting for Impairment or Disposal of Long-Lived Assets” (SFAS 144), requires that long-lived assets, such as property and equipment and purchased intangibles subject to amortization, be reviewed for impairment when-ever events or changes in circumstances indicate that the carrying amount of an asset may not be recoverable. Recoverability of the asset is measured by comparison of its carrying amount to undiscounted future net cash flows the asset is expected to generate. If such assets are considered to be impaired, the impairment to be recognized is measured as the amount by which the carry-ing amount of the asset exceeds its fair market value. Estimates of expected future cash flows represent management’s best estimate based on currently available information and reasonable and supportable assumptions. Any impairment recognized in accordance with SFAS 144 is per-manent and may not be restored. To date, we have not recognized any impairment of long-lived assets in connection with SFAS 144.
Customer Deposits
Customer deposits primarily include amounts received from customers toward the purchase of boats. We recognize these deposits as revenue upon delivery or acceptance of the related boats to customers.
Insurance
We retain varying levels of risk relating to the insurance policies we maintain, most signifi-cantly workers’ compensation insurance and employee medical benefits. We are responsible for the claims and losses incurred under these programs, limited by per occurrence deductibles and paid claims or losses up to pre-determined maximum exposure limits. Any losses above the pre-determined exposure limits are paid by our third-party insurance carriers. We estimate our lia-bility for incurred but not reported losses using our historical loss experience, our judgment, and industry information.
Derivative Instruments
We account for derivative instruments in accordance with Statement of Financial Accounting Standards No. 133, “Accounting for Derivative Instruments and Certain Hedging Activities” (SFAS 133), as amended by Statement of Financial Accounting Standards No. 138, “Accounting for Certain Derivative Instruments and Certain Hedging Activity, an Amendment of SFAS 133” (SFAS 138) and Statement of Financial Accounting Standards No. 149, “Amendment of Statement 133 on Derivative Instruments and Hedging Activities” (SFAS 149), (collectively SFAS 133). Under these standards, all derivative instruments are recorded on the balance sheet at their respective fair values.
We utilize certain derivative instruments, from time to time, including interest rate swaps and forward contracts to manage variability in cash flows associated with interest rates and fore-casted purchases of boats and yachts from certain of our foreign suppliers in Euro dollars.
The accounting for changes in the fair value (i.e., gains or losses) of a derivative instrument depends on whether it has been designated and qualifies as part of a hedging relationship based on its effectiveness in hedging against the exposure and further, on the type of hedging relation-ship. For those derivative instruments that are designated and qualify as hedging instruments, we designate the hedging instrument, based upon the exposure being hedged, as a fair value hedge or a cash flow hedge.
Our forward contracts and interest rate swap are designated and accounted for as cash flow hedges (i.e., hedging the exposure to variability in expected future cash flows that is attributable to a particular risk). SFAS No. 133 provides that the effective portion of the gain or loss on a derivative instrument designated and qualifying as a cash flow hedging instrument be reported as a component of other comprehensive income and be reclassified into earnings in the same line
Notes to Consolidated Financial Statements (continued) M a r i n e M a x , I n c . a n d S u b s i d i a r i e s
27
item in the income statement as the hedged item in the same period or periods during which the transaction affects earnings. The ineffective portion of the gain or loss on these derivative instruments, if any, is recognized in other income/expense in current earnings during the period of change.
For derivative instruments not designated as hedging instruments, the gain or loss is recog-nized in other income/expense in current earnings during the period of change. When a cash flow hedge is terminated, if the forecasted hedged transaction is still probable of occurrence, amounts previously recorded in other comprehensive income remain in other comprehensive income and are recognized in earnings in the period in which the hedged transaction affects earnings.
Additional information with regard to accounting policies associated with derivative instruments is contained in Note 9, “Derivative Instruments and Hedging Activity.”
Revenue Recognition
We recognize revenue from boat, motor, and trailer sales and parts and service operations at the time the boat, motor, trailer, or part is delivered to or accepted by the customer or service is completed. We recognize commissions earned from a brokerage sale at the time the related bro-kerage transaction closes. We recognize revenue from slip and storage services on a straight-line basis over the term of the slip or storage agreement. We recognize commissions earned by us for placing notes with financial institutions in connection with customer boat financing when we recognize the related boat sales. We also recognize marketing fees earned on credit life, accident and disability, and hull insurance products sold by third-party insurance companies at the later of customer acceptance of the insurance product as evidenced by contract execution or when we recognize the related boat sale. Pursuant to negotiated agreements with financial and insurance institutions, we are charged back for a portion of these fees should the customer terminate or default on the related finance or insurance contract before it is outstanding for a stipulated minimal period of time. The chargeback allowance, which was not material to the consolidated financial statements taken as a whole as of September 30, 2006 or 2005, is based on our experience with repayments or defaults on the related finance or insurance contracts.
We also recognize commissions earned on extended warranty service contracts sold on behalf of third-party insurance companies at the later of customer acceptance of the service contract terms as evidenced by contract execution, or recognition of the related boat sale. We are charged back for a portion of these commissions should the customer terminate or default on the service contract prior to its scheduled maturity. The chargeback allowance, which was not material to the consolidated financial statements taken as a whole as of September 30, 2006 or 2005, is based upon our experience with repayments or defaults on the service contracts.
Stock-Based Compensation
Prior to October 1, 2005 we accounted for our share-based compensation plans under the recognition and measurement provisions of Accounting Principles Board Opinion No. 25, “Accounting for Stock Issued to Employees” (APB 25) and related interpretations and disclosure requirements established by Statement of Financial Accounting Standards No. 123, “Accounting for Stock-Based Compensation” (SFAS 123), as amended by Statement of Financial Accounting Standards No. 148, “Accounting for Stock-Based Compensation—Transition and Disclosure” (SFAS 148). Under APB 25, because the grant price was equal to or greater than the fair value no compensation expense was recorded in earnings for our stock options and awards granted under our employee stock purchase plan (ESPP). The pro forma effects on net income and earnings per share for stock options and ESPP awards were disclosed in a footnote to the financial statements. Compensation expense was recorded in earnings for non-vested common stock awards (restricted stock awards) and Board of Director fees.
Effective October 1, 2005, we adopted the provisions of Statement of Financial Accounting Standards No. 123R, “Share-Based Payment” (SFAS 123R) for our share-based compensation plans. We adopted SFAS 123R using the modified prospective transition method. Under this transition method, compensation cost recognized in fiscal 2006 includes (a) the compensation cost for all share-based awards granted prior to, but not yet vested as of October 1, 2005, based on the grant-date fair value estimated in accordance with the original provisions of SFAS 123 and (b) the compensation cost for all share-based awards granted subsequent to September 30, 2005, based on the grant-date fair value estimated in accordance with the provisions of SFAS 123R. Results for prior periods have not been restated. As a result of our adoption of SFAS 123R, we recorded compensation expense for stock options of approximately $3.5 million before tax, or $0.15 per diluted share after-tax in the fiscal year ended September 30, 2006.
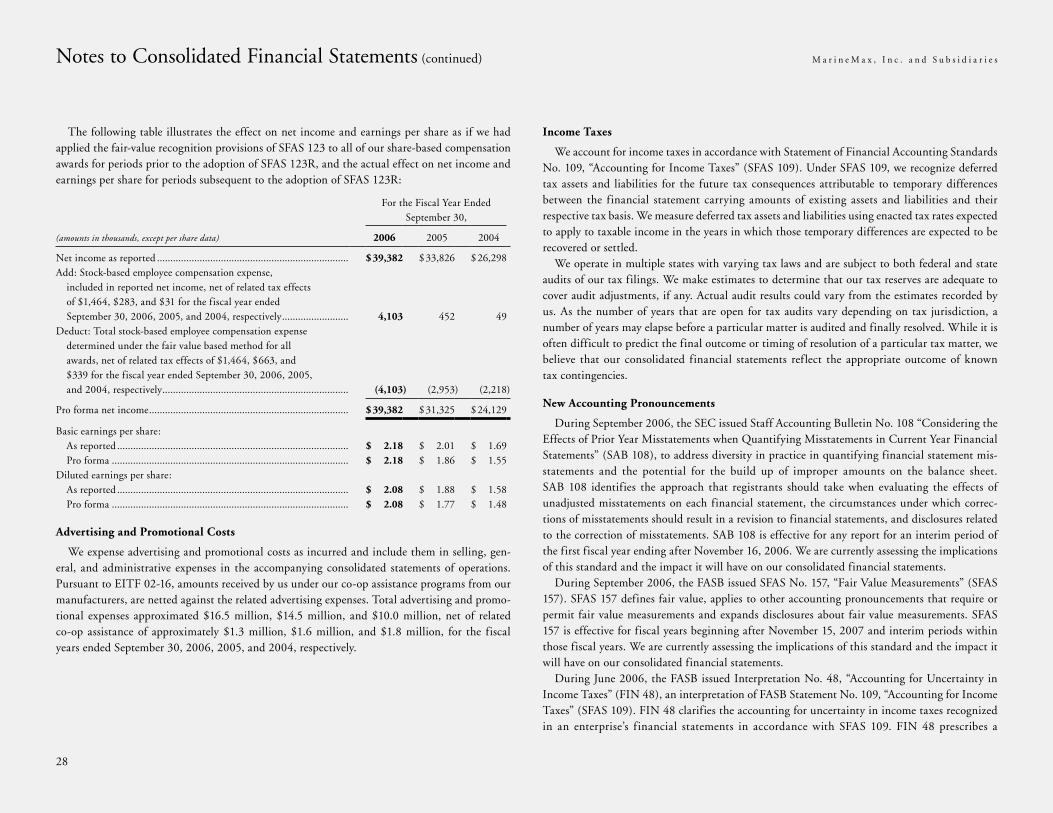
28
Notes to Consolidated Financial Statements (continued) M a r i n e M a x , I n c . a n d S u b s i d i a r i e s
The following table illustrates the effect on net income and earnings per share as if we had applied the fair-value recognition provisions of SFAS 123 to all of our share-based compensation awards for periods prior to the adoption of SFAS 123R, and the actual effect on net income and earnings per share for periods subsequent to the adoption of SFAS 123R:
For the Fiscal Year Ended September 30,
(amounts in thousands, except per share data) 2006 2005 2004
Net income as reported ........................................................................ $ 39,382 $ 33,826 $ 26,298Add: Stock-based employee compensation expense, included in reported net income, net of related tax effects
of $1,464, $283, and $31 for the fiscal year ended September 30, 2006, 2005, and 2004, respectively ......................... 4,103 452 49
Deduct: Total stock-based employee compensation expense determined under the fair value based method for all
awards, net of related tax effects of $1,464, $663, and $339 for the fiscal year ended September 30, 2006, 2005, and 2004, respectively ...................................................................... (4,103) (2,953) (2,218)
Pro forma net income ........................................................................... $ 39,382 $ 31,325 $ 24,129
Basic earnings per share: As reported ....................................................................................... $ 2.18 $ 2.01 $ 1.69 Pro forma ......................................................................................... $ 2.18 $ 1.86 $ 1.55Diluted earnings per share: As reported ....................................................................................... $ 2.08 $ 1.88 $ 1.58 Pro forma ......................................................................................... $ 2.08 $ 1.77 $ 1.48
Advertising and Promotional Costs
We expense advertising and promotional costs as incurred and include them in selling, gen-eral, and administrative expenses in the accompanying consolidated statements of operations. Pursuant to EITF 02-16, amounts received by us under our co-op assistance programs from our manufacturers, are netted against the related advertising expenses. Total advertising and promo-tional expenses approximated $16.5 million, $14.5 million, and $10.0 million, net of related co-op assistance of approximately $1.3 million, $1.6 million, and $1.8 million, for the fiscal years ended September 30, 2006, 2005, and 2004, respectively.
Income Taxes
We account for income taxes in accordance with Statement of Financial Accounting Standards No. 109, “Accounting for Income Taxes” (SFAS 109). Under SFAS 109, we recognize deferred tax assets and liabilities for the future tax consequences attributable to temporary differences between the financial statement carrying amounts of existing assets and liabilities and their respective tax basis. We measure deferred tax assets and liabilities using enacted tax rates expected to apply to taxable income in the years in which those temporary differences are expected to be recovered or settled.
We operate in multiple states with varying tax laws and are subject to both federal and state audits of our tax filings. We make estimates to determine that our tax reserves are adequate to cover audit adjustments, if any. Actual audit results could vary from the estimates recorded by us. As the number of years that are open for tax audits vary depending on tax jurisdiction, a number of years may elapse before a particular matter is audited and finally resolved. While it is often difficult to predict the final outcome or timing of resolution of a particular tax matter, we believe that our consolidated financial statements reflect the appropriate outcome of known tax contingencies.
New Accounting Pronouncements
During September 2006, the SEC issued Staff Accounting Bulletin No. 108 “Considering the Effects of Prior Year Misstatements when Quantifying Misstatements in Current Year Financial Statements” (SAB 108), to address diversity in practice in quantifying financial statement mis-statements and the potential for the build up of improper amounts on the balance sheet. SAB 108 identifies the approach that registrants should take when evaluating the effects of unadjusted misstatements on each financial statement, the circumstances under which correc-tions of misstatements should result in a revision to financial statements, and disclosures related to the correction of misstatements. SAB 108 is effective for any report for an interim period of the first fiscal year ending after November 16, 2006. We are currently assessing the implications of this standard and the impact it will have on our consolidated financial statements.
During September 2006, the FASB issued SFAS No. 157, “Fair Value Measurements” (SFAS 157). SFAS 157 defines fair value, applies to other accounting pronouncements that require or permit fair value measurements and expands disclosures about fair value measurements. SFAS 157 is effective for fiscal years beginning after November 15, 2007 and interim periods within those fiscal years. We are currently assessing the implications of this standard and the impact it will have on our consolidated financial statements.
During June 2006, the FASB issued Interpretation No. 48, “Accounting for Uncertainty in Income Taxes” (FIN 48), an interpretation of FASB Statement No. 109, “Accounting for Income Taxes” (SFAS 109). FIN 48 clarifies the accounting for uncertainty in income taxes recognized in an enterprise’s financial statements in accordance with SFAS 109. FIN 48 prescribes a
29
recognition threshold and measurement attribute for the financial statement recognition and measurement of a tax position taken or expected to be taken in a tax return. FIN 48 also pro-vides guidance on derecognition, classification, interest and penalties, accounting in interim periods, disclosure, and transition. FIN 48 is effective for fiscal years beginning after December 15, 2006. FIN 48 is effective for the first quarter of our 2008 fiscal year, and we are currently assessing the implications of this standard and the impact it will have on our consolidated financial statements.
During June 2006, the Emerging Issues Task Force (EITF) of the Financial Accounting Standards Board (FASB) reached a consensus on Issue No. 06-3, “How Taxes Collected from Customers and Remitted to Governmental Authorities Should Be Presented in the Income Statement (That Is, Gross versus Net Presentation)” (EITF 06-3). The consensus determined that the scope of EITF 06-3 includes any tax assessed by a governmental authority that is imposed concurrently on a specific revenue-producing transaction between a seller and a cus-tomer, and may include, but is not limited to, sales, use, value added, and some excise taxes. EITF 06-3 also determined that the presentation of taxes on either a gross basis or a net basis within the scope of EITF 06-3 is an accounting policy decision that should be disclosed pursu-ant to APB Opinion No. 22, “Disclosure of Accounting Policies” (APB 22). EITF 06-3 does not require a company to reevaluate its existing policies related to taxes assessed by a governmental authority that are directly imposed on a revenue-producing transaction between a seller and a customer. EITF 06-3 is effective for interim and annual financial statements beginning after December 15, 2006, with early adoption permitted. We will adopt EITF 06-3 in the first quar-ter of fiscal year 2007 and do not expect the implementation of this standard to have a material impact on our consolidated financial statements as taxes collected from customers and remitted to governmental authorities are presented net in our consolidated statements of operations.
During May 2005, the FASB issued Statement of Financial Accounting Standard No. 154, “Accounting Changes and Error Corrections” (SFAS 154) which replaces Accounting Principles Board Opinion No. 20, “Accounting Changes” (APB 20) and SFAS No. 3, “Reporting Accounting Changes in Interim Financial Statements—An Amendment of APB Opinion No. 28” (SFAS 3). SFAS 154 provides guidance on the accounting for and reporting of account-ing changes and error corrections. SFAS 154 is effective for accounting changes and correction of errors made in fiscal years beginning after December 15, 2005. SFAS 154 is effective for the first quarter of our fiscal year 2007 and we are currently assessing the implications of this standard and the impact it will have on our consolidated financial statements.
During March 2005, the Financial Accounting Standards Board (FASB) issued Interpretation No. 47, “Accounting for Conditional Asset Retirement Obligations—an Interpretation of FASB Statement No. 143” (FIN 47), which clarifies the timing of liability recognition for legal
obligations associated with an asset retirement when the timing and (or) method of settling obligations are conditional on a future event that may or may not be within the control of the entity. FIN 47 is effective no later than the end of fiscal years ending after December 15, 2005. The adoption of FIN 47 did not have an effect on our consolidated financial statements.
Concentrations of Credit Risk
Financial instruments, which potentially subject us to concentrations of credit risk, consist principally of cash and cash equivalents and accounts receivable. Concentrations of credit risk with respect to our cash and cash equivalents are limited primarily to amounts held with finan-cial institutions. Concentrations of credit risk arising from our receivables are limited primarily to amounts due from manufacturers and financial institutions.
Fair Value of Financial Instruments
The carrying amount of our financial instruments approximates fair value due either to length to maturity or existence of interest rates that approximate prevailing market rates unless other-wise disclosed in these consolidated financial statements.
Use of Estimates and Assumptions
The preparation of consolidated financial statements in conformity with accounting princi-ples generally accepted in the United States requires us to make estimates and assumptions that affect the reported amounts of assets and liabilities and disclosure of contingent assets and liabil-ities at the date of the consolidated financial statements and the reported amounts of revenue and expenses during the reporting periods. Significant estimates made by us in the accompany-ing consolidated financial statements relate to valuation allowances, valuation of goodwill and intangible assets, valuation of long-lived assets, and valuation of accruals. Actual results could differ from those estimates.
4. ACCOUNTS RECEIVABLE:
Trade receivables consist primarily of receivables from financial institutions, which provide funding for customer boat financing, and amounts due from financial institutions earned from arranging financing with our customers. We normally collect these receivables within 30 days of the sale. Trade receivables also include amounts due from customers on the sale of boats, parts, service, and storage. Amounts due from manufacturers represent receivables for various manu-facturer programs and parts and service work performed pursuant to the manufacturers’ warran-ties. At September 30, 2006, other receivables consists primarily of amounts we believe are due related to certain unresolved matters associated to the terms and conditions of the asset purchase
30
Notes to Consolidated Financial Statements (continued) M a r i n e M a x , I n c . a n d S u b s i d i a r i e s
agreement with Surfside (see Note 2. Acquisitions). We do not believe the ultimate resolution of these matters will have a material adverse effect on our consolidated financial condition, results of operations or cash flows.
The allowance for uncollectible receivables, which was not material to the consolidated finan-cial statements taken as a whole as of September 30, 2006 or 2005, was based on our consider-ation of customer payment practices, past transaction history with customers, and economic conditions. We review the allowance for uncollectible receivables when an event or other change in circumstances results in a change in the estimate of the ultimate collectibility of a specific account.
The accounts receivable balances consisted of the following at September 30,
(amounts in thousands) 2006 2005
Trade receivables ....................................................................................................... $22,125 $14,570Amounts due from manufacturers ............................................................................ 26,087 10,374Other receivables ....................................................................................................... 9,377 1,291
$57,589 $26,235
5. INVENTORIES:
Inventories, net consisted of the following at September 30,
(amounts in thousands) 2006 2005
New boats, motors, and trailers ............................................................................. $382,077 $265,954Used boats, motors, and trailers ............................................................................. 69,729 43,193Parts, accessories, and other ................................................................................... 11,041 8,558
$462,847 $317,705
6. PROPERTY AND EQUIPMENT:
Property and equipment consisted of the following at September 30,
(amounts in thousands) 2006 2005
Land .................................................................................................................... $ 43,142 $ 33,223Buildings and improvements ............................................................................... 71,991 58,082Machinery and equipment .................................................................................. 32,311 27,524Furniture and fixtures ......................................................................................... 7,099 6,311Vehicles ............................................................................................................... 6,205 5,513
160,748 130,653Less—Accumulated depreciation ........................................................................ (38,533) (30,659)
$ 122,215 $ 99,994
Depreciation expense totaled approximately $8.3 million, $5.9 million, and $5.3 million for the fiscal years ended September 30, 2006, 2005, and 2004, respectively.
7. GOODWILL AND OTHER INTANGIBLE ASSETS:
The changes in the carrying amounts of net goodwill and identifiable intangible assets for the fiscal years ended September 30, were as follows:
(amounts in thousands) Goodwill
Identifiable Intangible
Assets Total
Balance, September 30, 2004 ..................................................... $ 50,322 $ 5,540 $ 55,862 Changes during the period ...................................................... 199 123 322
Balance, September 30, 2005 ...................................................... 50,521 5,663 56,184 Changes during the period ...................................................... 43,546 16,464 60,011
Balance, September 30, 2006 ................................................... $94,068 $22,127 $116,195
31
8. OTHER LONG-TERM ASSETS:
During February 2006, we became party to a joint venture with Brunswick that acquired certain real estate and assets of Great American Marina for an aggregate purchase price of approximately $11.0 million, of which we contributed approximately $4.0 million and Brunswick contributed approximately $7.0 million. The terms of the agreement specify that we operate and maintain the service business, and Brunswick operates and maintains the marina business. Simultaneously with the closing, the acquired entity became Gulfport Marina, LLC (Gulfport). We account for our investment in Gulfport in accordance with Accounting Principles Board Opinion No. 18, “The Equity Method of Accounting for Investments in Common Stock.” Accordingly, we adjust the carrying amount of our investment in Gulfport to recognize our share of earnings or losses.
9. DERIVATIVE INSTRUMENTS AND HEDGING ACTIVITY:
We have entered into foreign currency cash flow hedges to reduce the variability of cash flows associated with forecasted purchases of boats and yachts from certain of our foreign suppliers in Euro dollars. These cash flow hedges are designed to offset changes in expected cash flows due to fluctuations in the Euro dollar from the time the contracts are entered into until actual deliv-ery of the inventory and corresponding payments are made. At September 30, 2006, there were outstanding contracts, which had a combined notional amount of approximately $10.4 million and mature at various times through December 2006. These contracts are designated as cash flow hedges since they are expected to be highly effective in offsetting changes in the cash flows attributable to forecasted purchases of yachts and boats from certain of our foreign suppliers in Euro dollars. Because the critical terms of the forward contracts and the forecasted transactions coincide (i.e., the currency, notional amount, and timing), changes in cash flows attributable to the risks being hedged are expected to be completely offset by the forward contract. However, if we become aware of a forecasted purchase that will not occur as planned and there are no exten-uating circumstances, we will write-off the related amount in other comprehensive income in current earnings. Outstanding contracts at September 30, 2006 had unrealized gains of approximately $571,000, which were recorded in other current assets on the consolidated bal-ance sheet and qualify as highly effective for reporting purposes. Effectiveness of yacht and boat forward contracts is determined by comparing the change in the fair value of the forward contract to the change in the expected cash to be paid for the hedged item. During the year ended September 30, 2006, the ineffective portion of the hedging instruments was not signifi-cant. For closed contracts related to inventory on hand at September 30, 2006, we recorded approximately $92,000 of unrealized gains as a contra inventory on the consolidated balance sheet. These unrealized gains will be recognized as a reduction to the cost of sales when the related boat is sold. At September 30, 2006, the net unrealized gains related to open and
closed contracts recorded in accumulated other comprehensive income were approximately $453,000, net of tax. All of the existing gains are expected to be reclassified into earnings within the next 12 months as the related boats are sold. We had no significant foreign currency cash flow hedges outstanding at September 30, 2005.
We have entered into an interest rate swap agreement with a notional amount of $4.0 million, that matures in June 2015, and is designated as a cash f low hedge to convert a portion of the floating rate debt to a fixed rate of 5.67%. Since all of the critical terms of the swap exactly match those of the hedged debt, no ineffectiveness has been identified in the hedging relationship. Consequently, all changes in fair value are recorded as a component of other com-prehensive income. We periodically determine the effectiveness of the swap by determining that the critical terms still match, determining that the future interest payments are still probable of occurrence, and evaluating the likelihood of the counterparty’s compliance with the terms of the swap. At September 30, 2006, the swap agreement had a fair value of approximately $88,000, which was recorded in other long-term assets on the consolidated balance sheet. We had no significant interest rate swap agreements outstanding at September 30, 2005.
10. SHORT-TERM BORROWINGS:
During June 2006, we entered into a second amended and restated credit and security agreement with eight financial institutions. The credit facility provides us a line of credit with asset-based borrowing availability of up to $500 million for working capital and inventory financing, with the amount of permissible borrowings determined pursuant to a borrowing base formula. The credit facility also permits approved-vendor f loorplan borrowings of up to $20 million. The credit facility accrues interest at the London Interbank Offered Rate (LIBOR) plus 150 to 260 basis points, with the interest rate based upon the ratio of our net outstanding borrowings to our tangible net worth. The credit facility is secured by our inventory, accounts receivable, equipment, furniture, and fixtures. The credit facility requires us to satisfy certain covenants, including maintaining a leverage ratio tied to our tangible net worth. The other terms and conditions of the new credit facility are generally similar to the previous credit facility. The credit facility matures in May 2011, with two one-year renewal options remaining. At September 30, 2006, we were in compliance with all of the credit facility covenants.
Prior to the June 2006 second amended and restated credit and security agreement, our credit facility was amended during March 2006 and February 2006. The March 2006 amendment temporarily increased our asset-based borrowing availability up to $415 million through July 31, 2006. The February 2006 amendment increased our asset-based borrowing availability up to $385 million, and extended the maturity of the credit facility to March 1, 2009, with two one-year renewal options.
32
Notes to Consolidated Financial Statements (continued) M a r i n e M a x , I n c . a n d S u b s i d i a r i e s
Prior to the February 2006 amendment, our credit facility provided us with asset-based borrowing availability of up to $340 million, permitted up to $20 million in approved-vendor floorplan borrowings, accrued interest at a rate of LIBOR plus 150 to 260 basis points, and was scheduled to mature in March 2008, with two one-year renewal options remaining. The other terms and conditions of the credit facility were generally similar to the new credit facility.
Short-term borrowings as of September 30, 2006 and 2005 were $321.5 million and $150.0 million, respectively. The additional available borrowings under the credit facility at September 30, 2006 and 2005 were $130.0 million and $180.0 million, respectively. At September 30, 2006 and 2005, the interest rate on the outstanding short-term borrowings was 6.8% and 5.2%, respectively.
As is common in our industry, we receive interest assistance directly from boat manufacturers, including Brunswick. The interest assistance programs vary by manufacturer and generally include periods of free financing or reduced interest rate programs. The interest assistance may be paid directly to us or our lender depending on the arrangements the manufacturer has estab-lished. We classify interest assistance received from manufacturers as a reduction of inventory cost and related cost of sales as opposed to netting the assistance against our interest expense incurred with our lenders.
11. LONG-TERM DEBT:
Long-term debt consisted of the following at September 30,
(amounts in thousands) 2006 2005
Various mortgage notes payable to financial institutions, due in monthly installments ranging from $16,924 to $37,500, bearing interest at
rates ranging from 6.82% to 7.18%, maturing September 2012 through July 2014, collateralized by machinery and equipment ....................... $ 9,669 $ 12,593
Various mortgage notes payable to financial institutions, due in monthly installments ranging from $22,605 to $102,000, bearing interest at
rates ranging from 5.67% to 7.75%, maturing September 2010 through June 2016, collateralized by machinery and equipment .................................... 27,517 17,492
37,186 30,085Less—Current maturities ...................................................................................... (4532) (4,635)
$32,654 $25,450
The aggregate maturities of long-term debt were as follows at September 30,
(amounts in thousands) 2006
2007 .............................................................................................................................................. $ 4,5322008 .............................................................................................................................................. 4,6252009 .............................................................................................................................................. 4,7202010 ............................................................................................................................................... 4,8262011 ............................................................................................................................................... 4,185Thereafter ...................................................................................................................................... 14,298
Total .......................................................................................................................................... $37,186
12. INCOME TAXES:
The components of our provision for income taxes consisted of the following for the fiscal years ended September 30,
(amounts in thousands) 2006 2005 2004
Current provision: Federal ............................................................................................... $22,091 $18,871 $14,310 State ................................................................................................... 2,845 2,178 1,636
Total current provision .......................................................................... 24,936 21,049 15,946
Deferred provision: Federal ............................................................................................... 927 330 164 State ................................................................................................... 93 33 16
Total deferred provision ........................................................................ 1,020 363 180
Total income tax provision .................................................................... $25,956 $21,412 $16,126
Below is a reconciliation of the statutory federal income tax rate to our effective tax rate for the fiscal years ended September 30,
2006 2005 2004
Federal tax provision ...................................................................................... 35.0% 35.0% 35.0%State tax provision, net of federal benefit ....................................................... 3.6% 3.6% 2.8%Other .............................................................................................................. 1.1% 0.2% 0.2%
Effective tax rate ........................................................................................ 39.7% 38.8% 38.0%
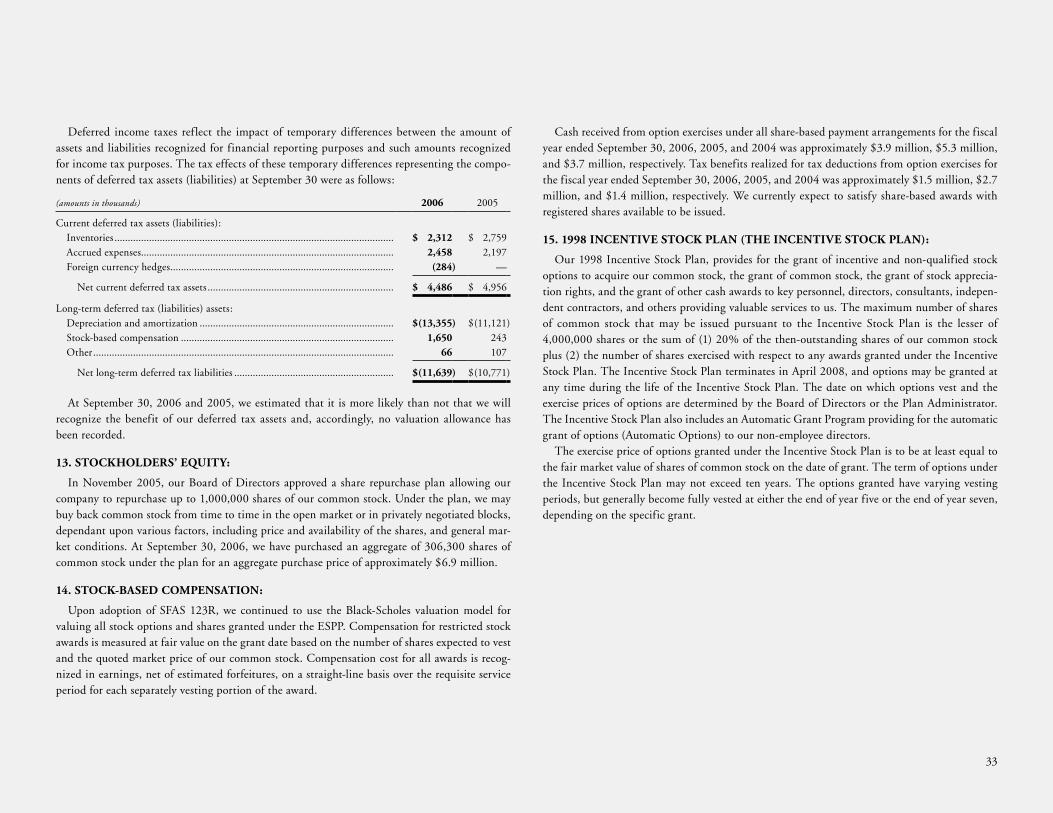
33
Deferred income taxes reflect the impact of temporary differences between the amount of assets and liabilities recognized for financial reporting purposes and such amounts recognized for income tax purposes. The tax effects of these temporary differences representing the compo-nents of deferred tax assets (liabilities) at September 30 were as follows:
(amounts in thousands) 2006 2005
Current deferred tax assets (liabilities): Inventories ......................................................................................................... $ 2,312 $ 2,759 Accrued expenses ............................................................................................... 2,458 2,197 Foreign currency hedges .................................................................................... (284) —
Net current deferred tax assets ...................................................................... $ 4,486 $ 4,956
Long-term deferred tax (liabilities) assets: Depreciation and amortization ......................................................................... $ (13,355) $ (11,121) Stock-based compensation ................................................................................ 1,650 243 Other ................................................................................................................. 66 107
Net long-term deferred tax liabilities ............................................................ $ (11,639) $ (10,771)
At September 30, 2006 and 2005, we estimated that it is more likely than not that we will recognize the benefit of our deferred tax assets and, accordingly, no valuation allowance has been recorded.
13. STOCKHOLDERS’ EQUITY:
In November 2005, our Board of Directors approved a share repurchase plan allowing our company to repurchase up to 1,000,000 shares of our common stock. Under the plan, we may buy back common stock from time to time in the open market or in privately negotiated blocks, dependant upon various factors, including price and availability of the shares, and general mar-ket conditions. At September 30, 2006, we have purchased an aggregate of 306,300 shares of common stock under the plan for an aggregate purchase price of approximately $6.9 million.
14. STOCK-BASED COMPENSATION:
Upon adoption of SFAS 123R, we continued to use the Black-Scholes valuation model for valuing all stock options and shares granted under the ESPP. Compensation for restricted stock awards is measured at fair value on the grant date based on the number of shares expected to vest and the quoted market price of our common stock. Compensation cost for all awards is recog-nized in earnings, net of estimated forfeitures, on a straight-line basis over the requisite service period for each separately vesting portion of the award.
Cash received from option exercises under all share-based payment arrangements for the fiscal year ended September 30, 2006, 2005, and 2004 was approximately $3.9 million, $5.3 million, and $3.7 million, respectively. Tax benefits realized for tax deductions from option exercises for the fiscal year ended September 30, 2006, 2005, and 2004 was approximately $1.5 million, $2.7 million, and $1.4 million, respectively. We currently expect to satisfy share-based awards with registered shares available to be issued.
15. 1998 INCENTIVE STOCK PLAN (THE INCENTIVE STOCK PLAN):
Our 1998 Incentive Stock Plan, provides for the grant of incentive and non-qualified stock options to acquire our common stock, the grant of common stock, the grant of stock apprecia-tion rights, and the grant of other cash awards to key personnel, directors, consultants, indepen-dent contractors, and others providing valuable services to us. The maximum number of shares of common stock that may be issued pursuant to the Incentive Stock Plan is the lesser of 4,000,000 shares or the sum of (1) 20% of the then-outstanding shares of our common stock plus (2) the number of shares exercised with respect to any awards granted under the Incentive Stock Plan. The Incentive Stock Plan terminates in April 2008, and options may be granted at any time during the life of the Incentive Stock Plan. The date on which options vest and the exercise prices of options are determined by the Board of Directors or the Plan Administrator. The Incentive Stock Plan also includes an Automatic Grant Program providing for the automatic grant of options (Automatic Options) to our non-employee directors.
The exercise price of options granted under the Incentive Stock Plan is to be at least equal to the fair market value of shares of common stock on the date of grant. The term of options under the Incentive Stock Plan may not exceed ten years. The options granted have varying vesting periods, but generally become fully vested at either the end of year five or the end of year seven, depending on the specific grant.
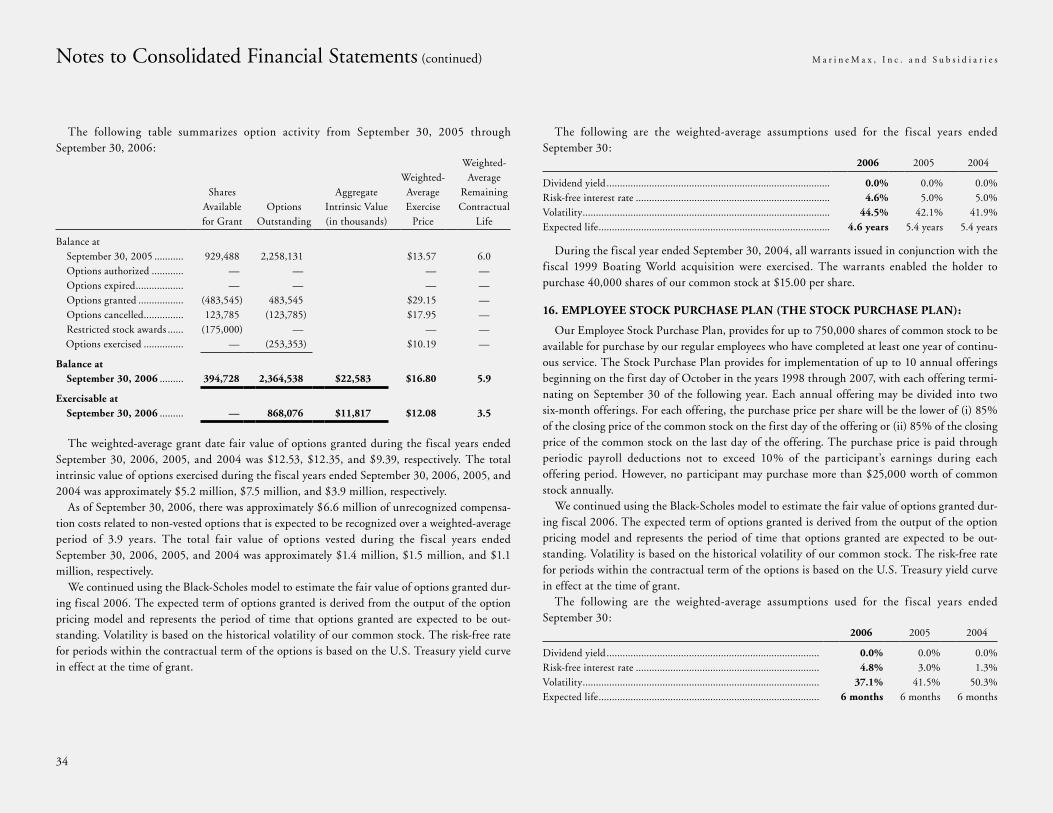
34
The following table summarizes option activity from September 30, 2005 through September 30, 2006:
Shares Available for Grant
Options Outstanding
Aggregate Intrinsic Value (in thousands)
Weighted- Average Exercise
Price
Weighted- Average
Remaining Contractual
Life
Balance at September 30, 2005 ........... 929,488 2,258,131 $13.57 6.0 Options authorized ............ — — — — Options expired .................. — — — — Options granted ................. (483,545) 483,545 $29.15 — Options cancelled ............... 123,785 (123,785) $17.95 — Restricted stock awards ...... (175,000) — — — Options exercised ............... — (253,353) $10.19 —
Balance at September 30, 2006 ......... 394,728 2,364,538 $22,583 $16.80 5.9
Exercisable at September 30, 2006 ......... — 868,076 $11,817 $12.08 3.5
The weighted-average grant date fair value of options granted during the fiscal years ended September 30, 2006, 2005, and 2004 was $12.53, $12.35, and $9.39, respectively. The total intrinsic value of options exercised during the fiscal years ended September 30, 2006, 2005, and 2004 was approximately $5.2 million, $7.5 million, and $3.9 million, respectively.
As of September 30, 2006, there was approximately $6.6 million of unrecognized compensa-tion costs related to non-vested options that is expected to be recognized over a weighted-average period of 3.9 years. The total fair value of options vested during the fiscal years ended September 30, 2006, 2005, and 2004 was approximately $1.4 million, $1.5 million, and $1.1 million, respectively.
We continued using the Black-Scholes model to estimate the fair value of options granted dur-ing fiscal 2006. The expected term of options granted is derived from the output of the option pricing model and represents the period of time that options granted are expected to be out-standing. Volatility is based on the historical volatility of our common stock. The risk-free rate for periods within the contractual term of the options is based on the U.S. Treasury yield curve in effect at the time of grant.
The following are the weighted-average assumptions used for the fiscal years ended September 30:
2006 2005 2004
Dividend yield .................................................................................... 0.0% 0.0% 0.0%Risk-free interest rate ......................................................................... 4.6% 5.0% 5.0%Volatility ............................................................................................. 44.5% 42.1% 41.9%Expected life ....................................................................................... 4.6 years 5.4 years 5.4 years
During the fiscal year ended September 30, 2004, all warrants issued in conjunction with the fiscal 1999 Boating World acquisition were exercised. The warrants enabled the holder to purchase 40,000 shares of our common stock at $15.00 per share.
16. EMPLOYEE STOCK PURCHASE PLAN (THE STOCK PURCHASE PLAN):
Our Employee Stock Purchase Plan, provides for up to 750,000 shares of common stock to be available for purchase by our regular employees who have completed at least one year of continu-ous service. The Stock Purchase Plan provides for implementation of up to 10 annual offerings beginning on the first day of October in the years 1998 through 2007, with each offering termi-nating on September 30 of the following year. Each annual offering may be divided into two six-month offerings. For each offering, the purchase price per share will be the lower of (i) 85% of the closing price of the common stock on the first day of the offering or (ii) 85% of the closing price of the common stock on the last day of the offering. The purchase price is paid through periodic payroll deductions not to exceed 10% of the participant’s earnings during each offering period. However, no participant may purchase more than $25,000 worth of common stock annually.
We continued using the Black-Scholes model to estimate the fair value of options granted dur-ing fiscal 2006. The expected term of options granted is derived from the output of the option pricing model and represents the period of time that options granted are expected to be out-standing. Volatility is based on the historical volatility of our common stock. The risk-free rate for periods within the contractual term of the options is based on the U.S. Treasury yield curve in effect at the time of grant.
The following are the weighted-average assumptions used for the fiscal years ended September 30:
2006 2005 2004
Dividend yield ................................................................................ 0.0% 0.0% 0.0%Risk-free interest rate ..................................................................... 4.8% 3.0% 1.3%Volatility ......................................................................................... 37.1% 41.5% 50.3%Expected life ................................................................................... 6 months 6 months 6 months
Notes to Consolidated Financial Statements (continued) M a r i n e M a x , I n c . a n d S u b s i d i a r i e s
35
As of September 30, 2006, we had issued 446,684 of the 750,000 shares of common stock reserved for issuance under our 1998 employee stock purchase plan.
17. RESTRICTED STOCK AWARDS:
During the first quarter of fiscal 2006 and 2005, we granted non-vested (restricted) stock awards to certain key employees pursuant to the 1998 Incentive Stock Plan. The restricted stock awards have varying vesting periods, but generally become fully vested at either the end of year four or the end of year five, depending on the specific award.
We accounted for the restricted stock awards granted in fiscal 2005 using the measurement and recognition provisions of APB 25. Accordingly, we measured compensation cost at the grant date using the intrinsic value method and will recognize compensation cost in earnings over the requisite service period. We accounted for the restricted stock awards granted subsequent to September 30, 2005 using the measurement and recognition provisions of SFAS 123R. Accordingly, the fair value of the restricted stock awards is measured on the grant date and recognized in earnings over the requisite service period for each separately vesting portion of the award.
The following table summarizes restricted stock activity from September 30, 2005 through September 30, 2006:
Shares
Weighted-Average Grant Date Fair Value
Non-vested balance at September 30, 2005 ............................................ 103,000 $29.39Changes during the period: Shares granted ..................................................................................... 175,000 $27.47 Shares vested ....................................................................................... — — Shares forfeited .................................................................................... — —
Non-vested balance at September 30, 2006 ........................................ 278,000 $28.18
As of September 30, 2006, we had approximately $5.3 million of total unrecognized compen-sation cost related to restricted stock awards granted under the Plan. We expect to recognize that cost over a weighted-average period of 3.5 years. Pursuant to SFAS 123R, the approximate $2.4 million of deferred stock compensation recorded as a reduction to stockholders’ equity as of September 30, 2005 is no longer reported as a separate component of stockholders’ equity and is instead recorded in additional paid-in capital.
18. NET INCOME PER SHARE:
The following is a reconciliation of the shares used in the denominator for calculating basic and diluted earnings per share for the fiscal years ended September 30,
2006 2005 2004
Weighted-average common shares outstanding used in calculating basic net income per share ................... 18,028,562 16,815,445 15,585,314Effect of dilutive options ......................................................... 900,173 1,217,088 1,080,793
Weighted-average common and common equivalent shares used in calculating diluted net income per share ................ 18,928,735 18,032,533 16,666,107
Options to purchase 699,500, 53,000, and 17,460 shares of common stock were outstanding at September 30, 2006, 2005, and 2004, respectively, but were not included in the computation of diluted earnings per share because the options’ exercise prices were greater than the average market price of our common stock, and therefore, their effect would be anti-dilutive.
19. COMMITMENTS AND CONTINGENCIES:
Lease Commitments
We lease certain land, buildings, machinery, equipment, and vehicles related to our dealerships under non-cancelable third-party operating leases. Rental expense, including month-to-month rentals, were approximately $10.9 million, $9.4 million, and $8.9 million for the fiscal years ended September 30, 2006, 2005, and 2004, respectively. Rental expense to related parties under both cancelable and non-cancelable operating leases approximated $385,000 for each of the fiscal years ended September 30, 2006, 2005, and 2004.
The rental payments to related parties, under both cancelable and non-cancelable operating leases during fiscal 2006, 2005, and 2004, represent rental payments for buildings to an entity partially owned by an officer of our company. We believe the terms of the transaction are consistent with those that we would obtain from third parties.
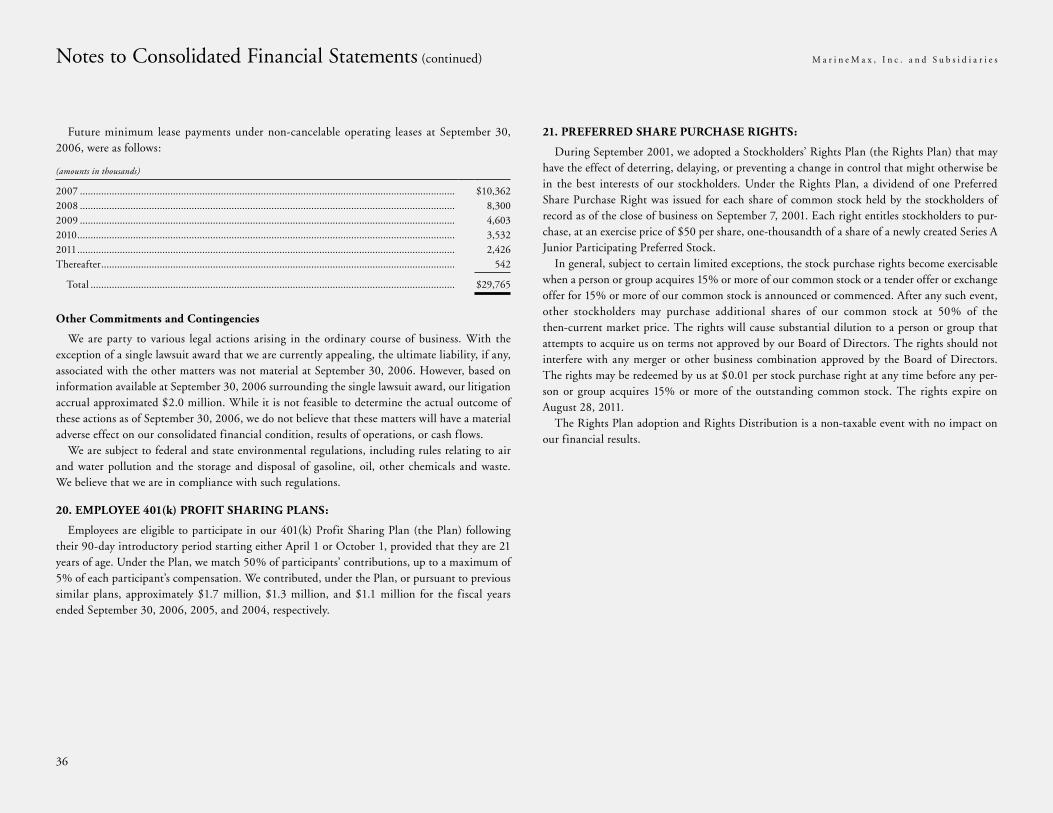
36
Future minimum lease payments under non-cancelable operating leases at September 30, 2006, were as follows:
(amounts in thousands)
2007 ............................................................................................................................................. $10,3622008 ............................................................................................................................................. 8,3002009 ............................................................................................................................................. 4,6032010 .............................................................................................................................................. 3,5322011 .............................................................................................................................................. 2,426Thereafter ..................................................................................................................................... 542
Total ......................................................................................................................................... $29,765
Other Commitments and Contingencies
We are party to various legal actions arising in the ordinary course of business. With the exception of a single lawsuit award that we are currently appealing, the ultimate liability, if any, associated with the other matters was not material at September 30, 2006. However, based on information available at September 30, 2006 surrounding the single lawsuit award, our litigation accrual approximated $2.0 million. While it is not feasible to determine the actual outcome of these actions as of September 30, 2006, we do not believe that these matters will have a material adverse effect on our consolidated financial condition, results of operations, or cash flows.
We are subject to federal and state environmental regulations, including rules relating to air and water pollution and the storage and disposal of gasoline, oil, other chemicals and waste. We believe that we are in compliance with such regulations.
20. EMPLOYEE 401(k) PROFIT SHARING PLANS:
Employees are eligible to participate in our 401(k) Profit Sharing Plan (the Plan) following their 90-day introductory period starting either April 1 or October 1, provided that they are 21 years of age. Under the Plan, we match 50% of participants’ contributions, up to a maximum of 5% of each participant’s compensation. We contributed, under the Plan, or pursuant to previous similar plans, approximately $1.7 million, $1.3 million, and $1.1 million for the fiscal years ended September 30, 2006, 2005, and 2004, respectively.
21. PREFERRED SHARE PURCHASE RIGHTS:
During September 2001, we adopted a Stockholders’ Rights Plan (the Rights Plan) that may have the effect of deterring, delaying, or preventing a change in control that might otherwise be in the best interests of our stockholders. Under the Rights Plan, a dividend of one Preferred Share Purchase Right was issued for each share of common stock held by the stockholders of record as of the close of business on September 7, 2001. Each right entitles stockholders to pur-chase, at an exercise price of $50 per share, one-thousandth of a share of a newly created Series A Junior Participating Preferred Stock.
In general, subject to certain limited exceptions, the stock purchase rights become exercisable when a person or group acquires 15% or more of our common stock or a tender offer or exchange offer for 15% or more of our common stock is announced or commenced. After any such event, other stockholders may purchase additional shares of our common stock at 50% of the then-current market price. The rights will cause substantial dilution to a person or group that attempts to acquire us on terms not approved by our Board of Directors. The rights should not interfere with any merger or other business combination approved by the Board of Directors. The rights may be redeemed by us at $0.01 per stock purchase right at any time before any per-son or group acquires 15% or more of the outstanding common stock. The rights expire on August 28, 2011.
The Rights Plan adoption and Rights Distribution is a non-taxable event with no impact on our financial results.
Notes to Consolidated Financial Statements (continued) M a r i n e M a x , I n c . a n d S u b s i d i a r i e s
37
The Board of Directors and Shareholders ofMarineMax, Inc.
We have audited the accompanying consolidated balance sheets of MarineMax, Inc. and subsidiaries as of September 30, 2006 and 2005, and the related consolidated statements of operations, comprehensive income, stockholders’ equity, and cash flows for each of the three years in the period ended September 30, 2006. These financial statements are the responsibility of the Company’s management. Our responsibility is to express an opinion on these financial statements based on our audits.
We conducted our audits in accordance with the standards of the Public Company Accounting Oversight Board (United States). Those standards require that we plan and perform the audit to obtain reasonable assurance about whether the financial statements are free of material misstate-ment. An audit includes examining, on a test basis, evidence supporting the amounts and disclo-sures in the financial statements. An audit also includes assessing the accounting principles used and significant estimates made by management, as well as evaluating the overall financial state-ment presentation. We believe that our audits provide a reasonable basis for our opinion.
In our opinion, the financial statements referred to above present fairly, in all material respects, the consolidated financial position of MarineMax, Inc. and subsidiaries at September 30, 2006 and 2005, and the consolidated results of their operations and their cash flows for each of the three years in the period ended September 30, 2006 in conformity with U.S. generally accepted accounting principles.
We also have audited, in accordance with the standards of the Public Company Accounting Oversight Board (United States), the effectiveness of MarineMax, Inc.’s internal control over f inancial reporting as of September 30, 2006, based on criteria established in Internal Control-Integrated Framework issued by the Committee of Sponsoring Organizations of the Treadway Commission and our report dated December 14, 2006 expressed an unqualified opinion thereon.
As discussed in Note 3 to the consolidated financial statements, as of October 1, 2005, the Company adopted the provisions of Statement of Financial Accounting Standards No. 123R, “Share-Based Payment.”
Ernst & Young LLP
Certified Public AccountantsTampa, FloridaDecember 14, 2006
Report of Independent Registered Public Accounting Firm
38
During January 2006, we acquired substantially all of the assets, including certain real estate, and assumed certain liabilities of Port Arrowhead. During March 2006, we acquired substan-tially all of the assets and assumed certain liabilities of Surfside. As permitted by Securities and Exchange Commission guidance, the scope of our Section 404 evaluation for the fiscal year ended September 30, 2006 does not include the internal controls over financial reporting of the acquired operations of Port Arrowhead or Surfside. Port Arrowhead and Surfside are included in our consolidated financial statements from the date of acquisition. Port Arrowhead and Surfside represented approximately $201.8 million and $16.7 million of total assets and net assets, respectively, as of September 30, 2006 and approximately $192.3 million and $900,000 of rev-enues and net income, respectively, for the year then ended. From the acquisition date to September 30, 2006, the processes and systems of the acquired operations were discrete and did not signif icantly impact internal controls over f inancial reporting for our other consolidated subsidiaries. Management is responsible for establishing and maintaining adequate
internal control over financial reporting, as such term is defined in Rule 13a-15(f ) of the Securities Exchange Act of 1934. Under the supervision and with the participation of the Company’s management, including its principal executive officer and principal financial officer, the Company conducted an evaluation of the effectiveness of the Company’s internal control over financial reporting as of September 30, 2006 as required by the Securities Exchange Act of 1934 Rule 13a-15(c). In making this assessment, the Company used the criteria set forth by the Committee of Sponsoring Organizations of the Treadway Commission (COSO) in Internal Control-Integrated Framework. Based on its evaluation, management concluded that its internal control over financial reporting was effective as of September 30, 2006.
Management’s assessment of the effectiveness of the Company’s internal control over financial reporting as of September 30, 2006 has been audited by Ernst & Young LLP, an independent registered public accounting firm, as stated in their report which appears on next page.
Management’s Report on Internal Control Over Financial Reporting M a r i n e M a x , I n c . a n d S u b s i d i a r i e s
39
The Board of Directors and Shareholders ofMarineMax, Inc.
We have audited management’s assessment, included in the accompanying Management’s Report on Internal Control over Financial Reporting, that MarineMax, Inc. maintained effec-tive internal control over financial reporting as of September 30, 2006, based on criteria estab-lished in Internal Control-Integrated Framework issued by the Committee of Sponsoring Organizations of the Treadway Commission (the COSO criteria). MarineMax, Inc.’s manage-ment is responsible for maintaining effective internal control over financial reporting and for its assessment of the effectiveness of internal control over financial reporting. Our responsibility is to express an opinion on management’s assessment and an opinion on the effectiveness of the company’s internal control over financial reporting based on our audit.
We conducted our audit in accordance with the standards of the Public Company Accounting Oversight Board (United States). Those standards require that we plan and perform the audit to obtain reasonable assurance about whether effective internal control over financial reporting was maintained in all material respects. Our audit included obtaining an understanding of internal control over financial reporting, evaluating management’s assessment, testing and evaluating the design and operating effectiveness of internal control, and performing such other procedures as we considered necessary in the circumstances. We believe that our audit provides a reasonable basis for our opinion.
A company’s internal control over financial reporting is a process designed to provide reason-able assurance regarding the reliability of financial reporting and the preparation of financial statements for external purposes in accordance with generally accepted accounting principles. A company’s internal control over financial reporting includes those policies and procedures that (1) pertain to the maintenance of records that, in reasonable detail, accurately and fairly reflect the transactions and dispositions of the assets of the company; (2) provide reasonable assurance that transactions are recorded as necessary to permit preparation of financial statements in accordance with generally accepted accounting principles, and that receipts and expenditures of the company are being made only in accordance with authorizations of management and direc-tors of the company; and (3) provide reasonable assurance regarding prevention or timely detec-tion of unauthorized acquisition, use, or disposition of the company’s assets that could have a material effect on the financial statements.
Because of its inherent limitations, internal control over financial reporting may not prevent or detect misstatements. Also, projections of any evaluation of effectiveness to future periods are subject to the risk that controls may become inadequate because of changes in conditions, or that the degree of compliance with the policies or procedures may deteriorate.
As indicated in the accompanying Management’s Report on Internal Control over Financial Reporting, management’s assessment of and conclusion on the effectiveness of internal control over financial reporting did not include the internal controls of the Port Arrowhead Group or Surfside-3 Marina, Inc., which are included in the 2006 consolidated financial statements of MarineMax, Inc. and constituted approximately $201.8 million and $16.7 million of total assets and net assets, respectively, as of September 30, 2006 and approximately $192.3 million and $900,000 of revenues and net income, respectively, for the year then ended. Our audit of internal control over financial reporting of MarineMax, Inc. also did not include an evaluation of the internal control over financial reporting of the Port Arrowhead Group and Surfside-3 Marina, Inc.
In our opinion, management’s assessment that MarineMax, Inc. maintained effective internal control over financial reporting as of September 30, 2006, is fairly stated, in all material respects, based on the COSO criteria.
Also, in our opinion, MarineMax, Inc. maintained, in all material respects, effective internal control over financial reporting as of September 30, 2006, based on the COSO criteria.
We also have audited, in accordance with the standards of the Public Company Accounting Oversight Board (United States), the consolidated balance sheets of MarineMax, Inc. as of September 30, 2006 and 2005, and the related consolidated statements of operations, compre-hensive income, stockholders’ equity, and cash flows for each of the three years in the period ended September 30, 2006 of MarineMax, Inc. and our report dated December 14, 2006 expressed an unqualified opinion thereon.
Ernst & Young LLP Certified Public AccountantsTampa, FloridaDecember 14, 2006
Report of Independent Registered Public Accounting Firm
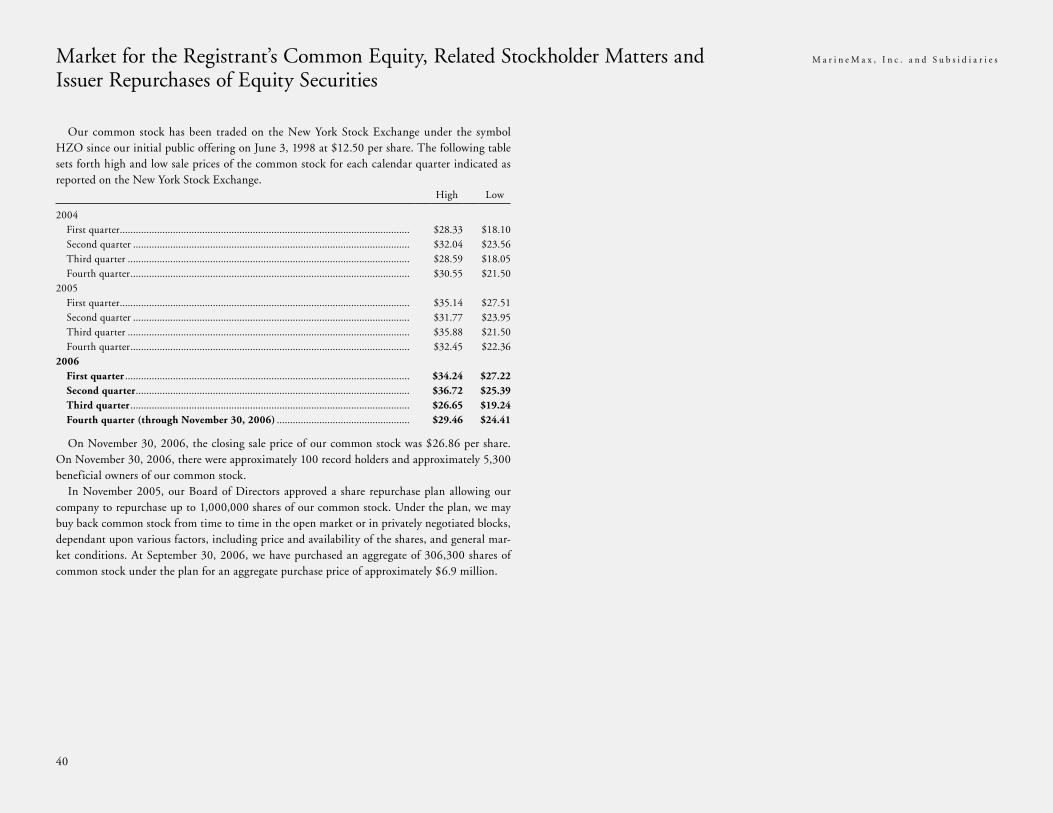
40
Market for the Registrant’s Common Equity, Related Stockholder Matters and M a r i n e M a x , I n c . a n d S u b s i d i a r i e s
Issuer Repurchases of Equity Securities
Our common stock has been traded on the New York Stock Exchange under the symbol HZO since our initial public offering on June 3, 1998 at $12.50 per share. The following table sets forth high and low sale prices of the common stock for each calendar quarter indicated as reported on the New York Stock Exchange.
High Low
2004 First quarter ............................................................................................................. $28.33 $18.10 Second quarter ........................................................................................................ $32.04 $23.56 Third quarter .......................................................................................................... $28.59 $18.05 Fourth quarter ......................................................................................................... $30.55 $21.502005 First quarter ............................................................................................................. $35.14 $27.51 Second quarter ........................................................................................................ $31.77 $23.95 Third quarter .......................................................................................................... $35.88 $21.50 Fourth quarter ......................................................................................................... $32.45 $22.36 2006 First quarter ........................................................................................................... $34.24 $27.22 Second quarter ....................................................................................................... $36.72 $25.39 Third quarter ......................................................................................................... $26.65 $19.24 Fourth quarter (through November 30, 2006) .................................................. $29.46 $24.41
On November 30, 2006, the closing sale price of our common stock was $26.86 per share. On November 30, 2006, there were approximately 100 record holders and approximately 5,300 beneficial owners of our common stock.
In November 2005, our Board of Directors approved a share repurchase plan allowing our company to repurchase up to 1,000,000 shares of our common stock. Under the plan, we may buy back common stock from time to time in the open market or in privately negotiated blocks, dependant upon various factors, including price and availability of the shares, and general mar-ket conditions. At September 30, 2006, we have purchased an aggregate of 306,300 shares of common stock under the plan for an aggregate purchase price of approximately $6.9 million.
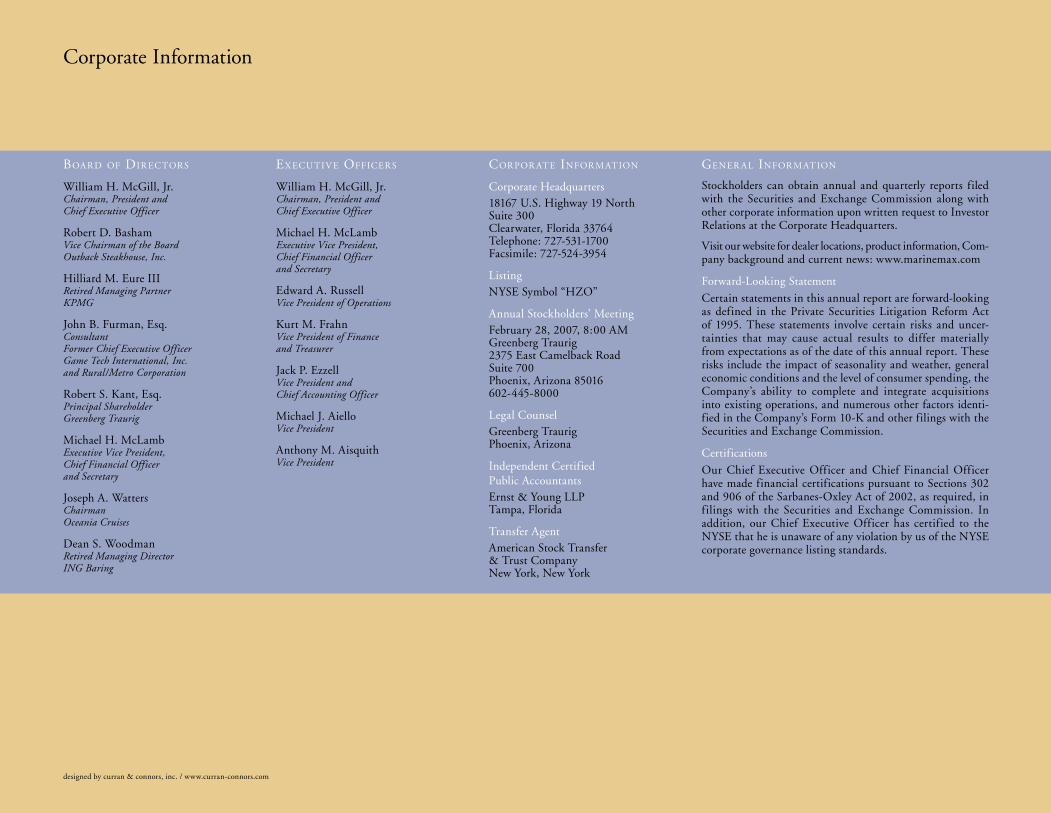
BOA R D OF DIR ECTOR S
William H. McGill, Jr.Chairman, President and Chief Executive Officer
Robert D. BashamVice Chairman of the Board Outback Steakhouse, Inc.
Hilliard M. Eure IIIRetired Managing Partner KPMG
John B. Furman, Esq.Consultant Former Chief Executive Officer Game Tech International, Inc. and Rural/Metro Corporation
Robert S. Kant, Esq.Principal Shareholder Greenberg Traurig
Michael H. McLambExecutive Vice President, Chief Financial Officer and Secretary
Joseph A. WattersChairman Oceania Cruises
Dean S. WoodmanRetired Managing Director ING Baring
EX ECUTIV E OFFICER S
William H. McGill, Jr.Chairman, President and Chief Executive Officer
Michael H. McLambExecutive Vice President, Chief Financial Officer and Secretary
Edward A. RussellVice President of Operations
Kurt M. FrahnVice President of Finance and Treasurer
Jack P. EzzellVice President and Chief Accounting Officer
Michael J. AielloVice President
Anthony M. AisquithVice President
COR POR ATE INFOR M ATION
Corporate Headquarters18167 U.S. Highway 19 North Suite 300 Clearwater, Florida 33764 Telephone: 727-531-1700 Facsimile: 727-524-3954
ListingNYSE Symbol “HZO”
Annual Stockholders’ MeetingFebruary 28, 2007, 8:00 AM Greenberg Traurig2375 East Camelback RoadSuite 700Phoenix, Arizona 85016602-445-8000
Legal CounselGreenberg Traurig Phoenix, Arizona
Independent Certified Public AccountantsErnst & Young LLP Tampa, Florida
Transfer AgentAmerican Stock Transfer & Trust Company New York, New York
GENER A L INFOR M ATION
Stockholders can obtain annual and quarterly reports filed with the Securities and Exchange Commission along with other corporate information upon written request to Investor Relations at the Corporate Headquarters.
Visit our website for dealer locations, product information, Com-pany background and current news: www.marinemax.com
Forward-Looking Statement
Certain statements in this annual report are forward-looking as defined in the Private Securities Litigation Reform Act of 1995. These statements involve certain risks and uncer-tainties that may cause actual results to differ materially from expectations as of the date of this annual report. These risks include the impact of seasonality and weather, general economic conditions and the level of consumer spending, the Company’s ability to complete and integrate acquisitions into existing operations, and numerous other factors identi-fied in the Company’s Form 10-K and other filings with the Securities and Exchange Commission.
Certifications
Our Chief Executive Officer and Chief Financial Officer have made financial certifications pursuant to Sections 302 and 906 of the Sarbanes-Oxley Act of 2002, as required, in filings with the Securities and Exchange Commission. In addition, our Chief Executive Officer has certified to the NYSE that he is unaware of any violation by us of the NYSE corporate governance listing standards.
designed by curran & connors, inc. / www.curran-connors.com
Corporate Information
Alabama • Arizona • California • Colorado • Connecticut • Delaware • Florida • Georgia • Maryland • Minnesota • Missouri
Nevada • New Jersey • New York • North Carolina • Oklahoma • Ohio • Rhode Island • South Carolina • Tennessee • Texas • Utah
L O C A T I O N S
18167 U.S. Highway 19 North, Suite 300
Clearwater, Florida 33764
727-531-1700
www.marinemax.com


