Embed Size (px)
Citation preview

2 0 0 1 A N N U A L R E P O R T

C O R P O R A T E P R O F I L E
Giga-tronics provides instruments, systems, subsystems and
components for inclusion in, and for the maintenance of, a wide range of
communications equipment and facilities. We serve a broad market spanning
commercial, military and industry users.
Instrument Division supplies RF and microwave frequency synthesizers
and power measurement instruments in bench top, rack mount and VXIbus
configurations for use in cellular, PCS, radar, electronic warfare, satellite and
telecommunications systems test applications.
Microsource is a vertically integrated designer and manufacturer of
leading-edge microwave circuits, components, and sub-systems. It’s product
line includes a broad range of YIG based signal sources and peripheral devices
such as oscillators, filters, multipliers, band reject and band pass filters,
and broad band signal synthesizers.
ASCOR designs and manufactures ATE instrumentation and
switching equipment in the VXI and PXI formats for terrestrial and satellite
related communications, commercial aircraft, military flight systems and
automatic test systems.
DYMATIX designs and manufactures automation and test equipment
for the semiconductor and memory media industries. Key products include,
automatic die sorting systems, automatic tape and reel equipment, robotic
wafer/disk handling and inspection equipment, and wafer test probers.

1
F I N A N C I A L H I G H L I G H T S
(In thousands except per share data and ratio)
March 31, 2001 March 25, 2000 March 27, 1999
New orders $ 57,830 $ 64,013 $ 36,786
Net sales 54,159 47,577 37,636
Operating income 3,024 1,495 (3,759)
Pre-tax earnings 3, 461 1,633 (3,006)
Net earnings 1,901 1,139 (1,858)
Backlog 39,964 34,128 17,692
Earnings per share - basic 0.42 0.26 (.43)
Earnings per share - diluted 0.40 0.24 (.43)
Current ratio 4.06 3.17 3.32
Working capital 22,924 21,066 18,021
Shareholders’ equity 28,475 26, 149 24,710
Total assets 37,318 37,526 33,259
Equity per share 6.27 5.90 5.66

2
T O O U R S H A R E H O L D E R S
Performance for the fiscal year ended March 31, 2001
showed substantial improvement over the prior year.
Sales of $54,159,000 were up 14% while earnings of
$1,901,000 were up 67%.
Earnings of $.40 per fully diluted share compared with
$.24 per fully diluted share a year ago.
Backlog of approximately $40,000,000 (about $32,700,000
shippable in 12 months) was up 17% from the $34,100,000
($23,900,000 shippable within 12 months) of a year earlier.
Manufacturing margins increased 21% to $19,056,000
compared to $15,810,000 for the prior year.
Giga-tronics financial condition continued strong with no
debt, $3,469,000 in cash and liquid investments and a back-up unused
$7,000,000 line of credit. Current ratio was 4.06 up from 3.17 a year
earlier.
Shareholders equity increased to $28,475,000 or 6.27 per share
from $26,149,000 or 5.90 per share last year. Tangible book value was
6.18 per share up from 5.75 a share a year ago.

3
In November 2000, we established a research and develop-
ment facility in England. This was done because of the availability of
power measurement engineers in the United Kingdom at a time when
that kind of technical talent was virtually unavailable in California.
This is currently a very small facility, but has thus far well served
our original purpose.
R & D expenses for FY 2001 were $5,087,000 or 9.4% of
sales, up from $4,180,000 or 8.8% of sales for the prior year.
There were several significant management changes shortly
after year end and in the early months of FY 2002.
Claudio Mariotta became President and General Manager
of the Instrument Division as of April 1st replacing Jim Koehn who
retired at year end. Mr. Mariotta had been with the organization for
3 years as Vice President Engineering and Vice President Operations.
He has had more than 30 years of technology based business experi-
ence with such companies as SSE Telecom and the Farinon
Division of Harris Corporation.
4
On April 16, 2001, William Wilson became President
and General Manager of Microsource Division replacing Robert Smith
who retired at that time. Bill had been and continues as a Director of
Giga-tronics Inc. He brings many years of very applicable experience
to this challenging job having served as CEO of Microwave
Technology, Inc., President of Amplica, Inc., Business Director
of Hybrid Microcircuits at Rockwell/Collins Radio and on
Technical Staff at Sandia Laboratories.
On June 4, John Regazzi joined Giga-tronics Instrument
Division as VP for Engineering. Mr. Regazzi comes to us from
Hewlett Packard/Agilent where he spent 24 years in senior technical
management and product planning positions.
On July 1, 2001, Carlos Blanco was named National Sales and
Marketing Manager of the Instrument Division. He had previously
served as International Manager for Europe, South America, and
Mexico. Prior to joining Giga-tronics in November 1999, Mr. Blanco
was Director of Latin American Sales for IFR Systems Inc. and
Marconi Instruments Inc.
On June 25, Scott Weiss joined Microsource Division as VP
of Sales and Marketing. Mr. Weiss has served in sales and marketing
positions at companies such as TrueTime, Inc. and Internet
Commerce.

5
Because we believe it is important to understand the breadth
and depth of the market we serve, we have reproduced on the following
two pages the spectrum analysis and market outline that appeared in
last years annual report. Giga-tronics serves many segments of this
broad market with equipment essential to the manufacture, calibration,
maintenance and operation of these communications systems.
Through the fourth quarter of FY 2001 and the first
quarter of FY 2002, this market has softened substantially due in
part to the general economic slowdown and in part to an imbalance
in the build-out of many of the large wireless communication systems.
We will undoubtedly feel the effects of this through the first part of
this year. Fortunately, we now have experienced senior managers
aggressively addressing this challenge.
Sincerely,
George H. Bruns, Jr.Chairman and Chief Executive Officer

F R E Q U E N C Y S P E C T R U M
6
FIXED & MOBILE SERVICES 10 KHZ - 500MARITIME COMM & NAV 10 KHZ - 3000BROADCAST, AM TO TVRO 500 KHZ - 4000AERO COMM & NAV 40 KHZ - 3700CB 27PAGING 30 - 50LOW BAND LAND MOBILE 30 - 50CT1 40 - 50Wireless Local Loop 66 - 88, 132 - 520SCA PAGING 90 - 108HIGH BAND LAND MOBILE 150 - 170PAGING 150 - 175
TETRA, Wireless Local Loop 380 - 512UHF LAND MOBILE 450 - 500IMTS PAGING 450 - 500UHF TV 500 - 800CELLULAR 800 - 900CELLULAR TRUNKING SMR 800 - 950Wireless Local Loop 800ISM 800 - 1000PCN spread spectrum 900CT2 1000 1GHz
Narrowband GPS 930 - 931GPS 970 - 1210, 1220 - 1400, 1420 - 1540Wireless Local Loop 1500GPS 1550 - 1580, 1590 - 1640, 1650 - 1680LEO 1600DECT, Wireless Local Loop 1800PCS 1850 - 1990Wireless Local Loop 1900PCS 2130 - 2150, 2180 - 2200ISM 2200 - 2700Wireless Local Loop 2300 - 2310PCS, Big LEO sat/mobile downlink 2400 - 2500Bluetooth 2400Wireless Local Loop 2400 2.5 GHz
TV RELAY AND MMDS-IFTS 1700 - 2700MMDS 2500 - 2700Wireless Local Loop 2700MILITARY 2700 - 2900RADAR, AERO. COMM & NAV 2700 - 3000MARITIME COMM & NAV 2900 - 3000Wireless Local Loop 3500AERO. COMM & NAV 3600 - 3700TVRO 3950 - 4000Fixed Satellite, Mobile, space to earth 4660 - 4685 5 GHz
Big LEO, forward link 5000 - 5150Private Land Mobile 5150 - 5650WLL, unlicensed high speed data, ISM, Govt 5150 - 5350, 5725 - 5825Big LEO 5925 - 6425Big LEO, return link 6425 - 7125 8 GHz
Govt, space research, satellite 7075 - 8500RADAR 9000 - 10500
Mobile Satellite 11.7 - 12.2 GHzDBS 12.2 - 12.7RADAR 13.4 - 14 GHzFixed - Satellite, earth to space 14 - 15.7 GHzRADAR 15 - 17.7 GHz 20 GHz
Fixed - Mobile, Video 21.4 - 22.5 GHzLMDS 27.5 - 28.35 GHzLMDS 29.1 - 29.25 GHzBig LEO 29 .75 - 30 GHzMicrowave point to point 38 GHz 40 GHz
European LMDS 41 - 42 GHzISM 61 GHzVehicle Radar 77 GHzAir to Air secure communications 94 GHz 110 GHz
CB Citizens Band
EMC Electro-magnetic Compatibility
TETRA Trans Euro. Trunked Radio
GSM Global Sytem/Mobile Comm.
UHF Ultra High Frequency
IMTS Improved Mobile Telephone Service
ISM Industrial Scientific & Medical Band
PCN Public Communications Network
GPS Global Positioning System
DECT Digital European Cordless Telephone
PCS Personal Comm. System
WLL Wireless Local Loop
MMDS Multi-channel, Multi-point
TVRO TV Receive Only
LEO Low Earth Orbit
LMDS Local Multi-point Distribution Service
CDMA Code Division Multiple Access
TDMA Time Division Multiple Access
LAN Local Area Network
WAN Wide Area Network
DBS Direct Broadcast Service
Distribution Service

7
The allocation of frequency spectrum on the preceding page, ranging from
10 kilohertz to 110 gigahertz, indicates the real breadth of the wireless communications
market and the wide range of specific applications of this technology.
We tend to think of wireless communication principally in terms of voice and
data transmission. Certainly this is a large and growing segment of this market and
includes such sub-segments as cellular, internet, point to point, point to multipoint,
LMDS, back-haul, fixed and mobile services, satellite up and down links, GPS, LAN,
WAN and others.
At the same time, however, the civilian aviation and the commercial aviation
segments of this market use wireless communication not only in voice and data trans-
mission, but in the application of radar to the very vital function of air traffic control.
Commercial aircraft in flight use storm warning radar to detect and avoid storm cells
for reasons of both safety and passenger comfort. Forward looking radar provides ter-
rain warning in mountainous country. Ground control radar is used to direct and con-
trol aircraft traffic on runways and taxiways of very large airports where visual surveil-
lance is difficult. There are potential applications for in-flight close proximity warning.
The military uses radar in a wide range of navigation, missile identification and
weapons control applications. Ground forces are now equipped with very sophisticated
wireless communications and wireless weapons control systems. With the current
emphasis by the armed services on COTS (commercial off-the-shelf ) procurement there
is little difference between commercial and military procurement.
Then there is the "every-day" private user market including Global Positioning
Systems, the home use walk around telephone, CB (citizen band) users, ham radio,
even the remote control door locks on your car.
All of the foregoing segments of this very large and diverse market utilize the
same fundamental technologies and have very similar needs for instruments and test
systems that calibrate and maintain the various elements of these communications
systems. Therefore, they are all extremely important markets to Giga-tronics.
B R E A D T H O F M A R K E T S
Tektronix
PEI Electronic
Amkor
Spectrian Loral
Denso
Agilent
Management Technologies
RCAF (Canadian Airforce)
Boeing
Qualcomm
Phillips
BEI
Sanders
Motorola
Lockheed Martin
Alcatel
Grumman
Conexant
Korean Army
Canadian Military
Mitsubishi
Lucent
Seoul University
Dallas Semiconductor
8
ShinEtsu
Hughes
Raytheon
Northrop Grumman
Harris Aerospace
Nokia
Rohde & Schwarz
BAE Systems
U.S. Navy
U.S. Army
Marine Corps
US Air Force
Ericsson
Siemens
Kyocera
Teradyne
Delphi
Nortel
French Navy
Australian Military
St. Judes Hospital
Unisys
Spectrian
MEMC
U S E R S O F G I G A - T R O N I C S P R O D U C T S

I N S T R U M E N T S
4650 Norris Canyon RoadSan Ramon, CA 94583-1320(925)-328-4650(925)-328-4700 (FAX)e-mail: [email protected]
Microwave Signal Generators, RF Signal Generators, Peak Power Meters, Universal
Power Meters, VXI Signal Generators and VXI Universal Power Meters.
Claudio Mariotta is the President and General Manager of this Division,
having previously served as Vice President of Operations and as Vice President of
Engineering. Before coming to Giga-tronics he had served as Executive Vice President
of SSE Telecom and as Vice President of
Engineering at the Microwave Division
of Harris Corporation.
Claudio S. MariottaPresident, Giga-tronics Instrument Division

M I C R O S O U R C E
1269 Corporate Center ParkwaySanta Rosa, CA 95407-5412(707)-527-7010(707)-527-7176 (FAX)www.microsource-inc.com
YIG Oscillators, YIG based microwave and millimeter wave products, free running
and phase locked oscillators in narrow and wide band configurations, band pass and
band reject filters, narrow and wide band frequency synthesizers and highly integrated
front-end modules for applications in test & measurement, wireless communications
and defense electronics.
Bill Wilson is the President and General Manager of Microsource.
He is also a Director of Giga-tronics Incorporated. His prior experience
includes Chairman and CEO of Microwave Technology, Inc.,
President of Amplica Inc./COMSAT, Business Director
Hybrid Microcircuits of Rockwell International/Collins
Radio and on technical staff of Sandia Laboratories
and Rome Air Development Center.
William E. WilsonPresident, Microsource, Inc.
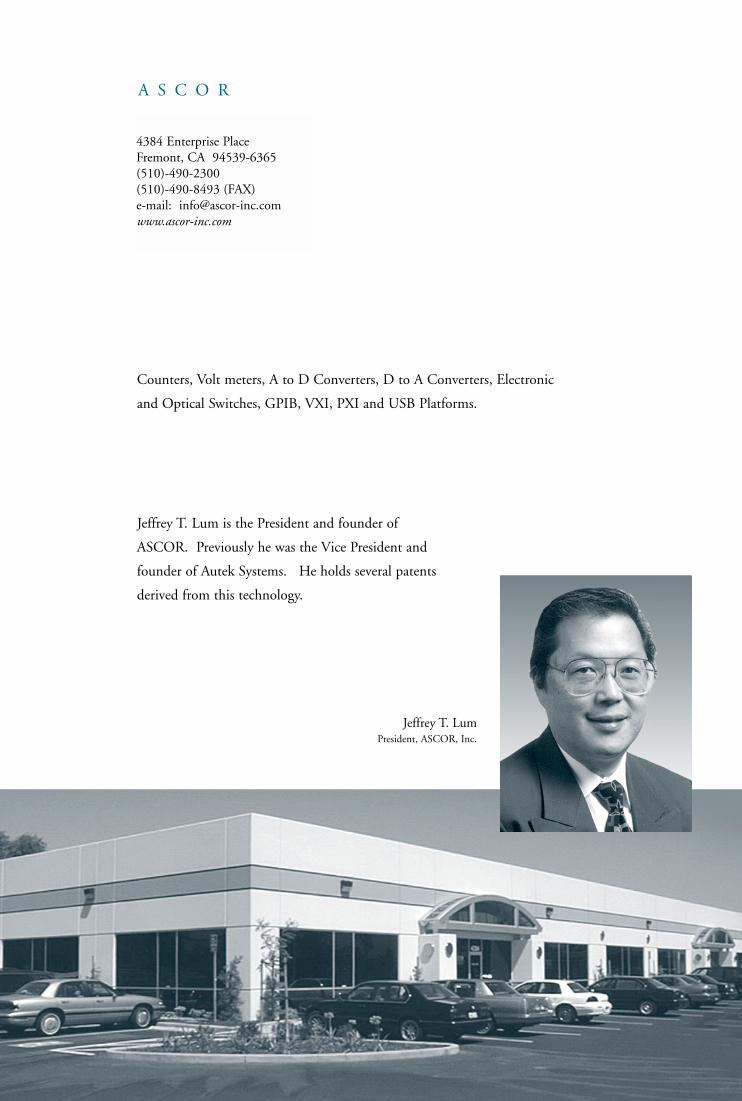
A S C O R
4384 Enterprise PlaceFremont, CA 94539-6365(510)-490-2300(510)-490-8493 (FAX)e-mail: [email protected]
Counters, Volt meters, A to D Converters, D to A Converters, Electronic
and Optical Switches, GPIB, VXI, PXI and USB Platforms.
Jeffrey T. Lum is the President and founder of
ASCOR. Previously he was the Vice President and
founder of Autek Systems. He holds several patents
derived from this technology.
Jeffrey T. LumPresident, ASCOR, Inc.
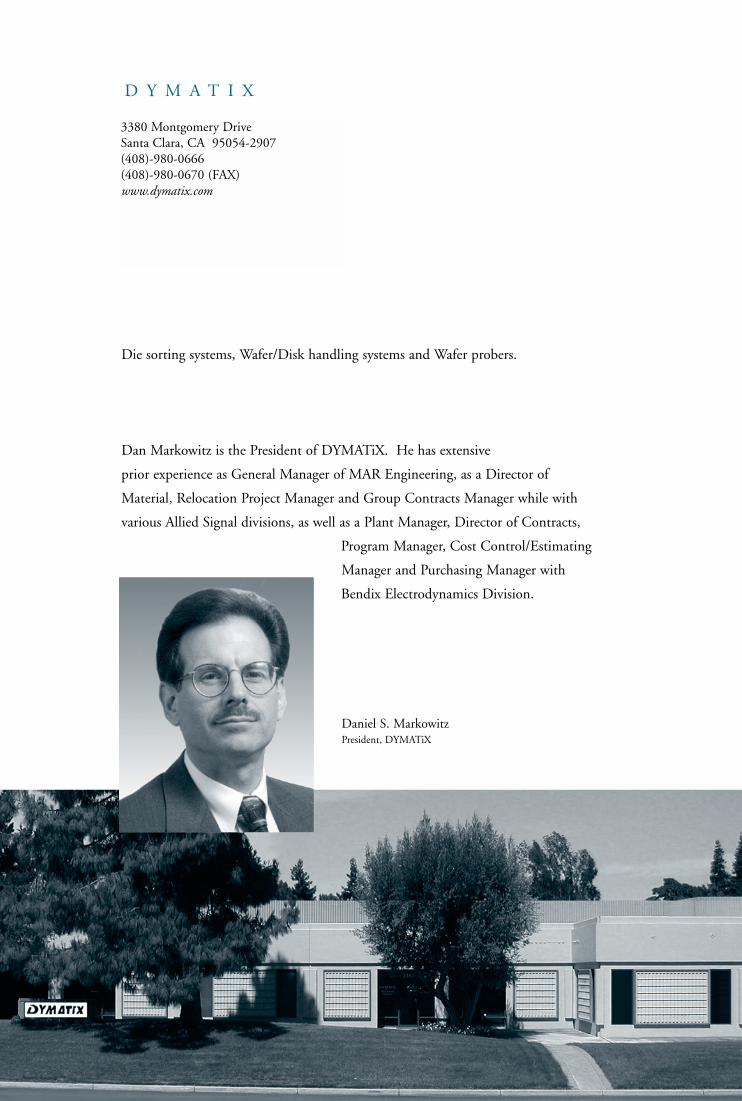
D Y M A T I X
3380 Montgomery DriveSanta Clara, CA 95054-2907(408)-980-0666(408)-980-0670 (FAX)www.dymatix.com
Die sorting systems, Wafer/Disk handling systems and Wafer probers.
Dan Markowitz is the President of DYMATiX. He has extensive
prior experience as General Manager of MAR Engineering, as a Director of
Material, Relocation Project Manager and Group Contracts Manager while with
various Allied Signal divisions, as well as a Plant Manager, Director of Contracts,
Program Manager, Cost Control/Estimating
Manager and Purchasing Manager with
Bendix Electrodynamics Division.
Daniel S. MarkowitzPresident, DYMATiX

F I N A N C I A L R E P O R T
“Giga-tronics continues to maintain a strongfinancial position with a current ratio of over 4and almost $23 million in working capital.”
Mark H. Cosmez, IIVice President, FinanceChief Financial Officer & Secretary
13
14
15 MANAGEMENT’S DISCUSSION AND ANALYSIS
17 CONSOLIDATED BALANCE SHEETS
18 CONSOLIDATED STATEMENTS OF OPERATIONS
19 CONSOLIDATED STATEMENTS OF SHAREHOLDERS’ EQUITY
20 CONSOLIDATED STATEMENTS OF CASH FLOWS
21 NOTES TO CONSOLIDATED FINANCIAL STATEMENTS
29 INDEPENDENT AUDITOR’S REPORT
30 SELECTED FINANCIAL DATA
32 CORPORATE INFORMATION
F I N A N C I A L R E P O R T

15
M A N A G E M E N T ’ S D I S C U S S I O N A N D A N A L Y S I S
During the fourth quarter of fiscal 2001, the Company adopted SAB 101, Revenue Recognition in Financial Statements.The Company recorded a net cumulative effect adjustment related to this change in accounting of $520,000, effective March 26, 2000. The adoption of SAB 101 resulted in the deferral of $2,165,000 in sales as of the beginning of the 2001 fiscal year, and subsequentrecognition of the deferred sales during the year.
New orders received in 2001 were $57,830,000, a decrease of 10% from $64,013,000 in 2000. This decrease was attribut-able primarily to the non recurrence of a three year contract for about $14,100,000 recorded at the end of fiscal 2000. At year end2001, the Company’s backlog of unfilled orders was $39,964,000, compared to $34,128,000 at the end of 2000. As of year end 2001,there were approximately $7,245,000 unfilled orders that were scheduled for shipment beyond a year and as of year end 2000 therewere $10,201,000 unfilled orders scheduled for shipment beyond a year. Primarily, the increase in backlog is attributable to strongorder levels at Microsource and at the Giga-tronics Instruments division.
Net sales for 2001 were $54,159,000, a 14% increase from $47,577,000 in 2000. Sales for the fiscal year 2001, without theSAB 101 adjustment, would have been $51,994,000, or over a 9% increase in revenue as compared to the $47,577,000 of the prioryear. In fiscal 2001, Microsource decreased revenues 12% or $1,861,000, while Giga-tronics Instruments increased 35% or$6,485,000, in sales and ASCOR improved 12% or $798,000, in sales. DYMATIX (formerly the Semiconductor Equipment Group)improved 16% or $1,160,000. DYMATIX sales for the fiscal year 2001, without the SAB 101 adjustment, would have declined over 14%or $1,005,000.
Cost of sales increased 11% in 2001 to $35,103,000 from $31,767,000 in 2000. Cost of sales for the fiscal year 2001, without the SAB 101 adjustment, would have been $33,681,000, or over a 6% increase in cost of sales as compared to the prior year.The increase in fiscal 2001 is attributable to increased shipments of products during the fiscal year coupled with higher costs for labor and material for the products shipped.
Operating expenses increased 12% in 2001 over 2000. Product development costs increased $907,000 in fiscal 2001 to$5,087,000. This was principally due to increased development of new products at the Instruments division and at Microsource.Selling, general and administrative expenses increased $1,058,000 to $10,713,000 in 2001 due to higher commissions on higher revenues coupled with higher personnel and promotional expenses at the Instruments division. Amortization of intangibles decreased$248,000 to $232,000 principally, as a result of reduced amortization of patents and licenses.
Other income increased in fiscal 2001 primarily due to increased sublease rent from the facilities leased in Santa Rosa. Net interest income in 2001 increased from 2000 due to higher average cash available for investment. The average cash improvementresulted principally from higher cash levels in the middle of the year. The provision for income taxes in 2001 was $1,040,000, or 30%,of the pre-tax earnings.
Giga-tronics recorded net earnings before cumulative effect of accounting change of $2,421,000, or $0.51 per diluted share,in 2001 versus $1,139,000, or $0.24 per diluted share, in 2000. The improvement in 2001 earnings was due to the Company’s highersales levels in 2001 as compared to 2000. The Company recorded $520,000 for the cumulative effect of accounting change as a resultof the implementation of SAB 101. As a result, Giga-tronics recorded net earnings of $1,901,000, or $0.40 per diluted share, in 2001versus $1,139,000, or $0.24 per diluted share, in 2000.
R e s u l t s o f O p e r a t i o n s f o r F i s c a l 2 0 0 0 a s c o m p a r e d t o 1 9 9 9
New orders received in 2000 were $64,013,000, an increase of 74% from $36,786,000 in 1999. At year end 2000, theCompany’s backlog of unfilled orders was $34,128,000, compared to $17,692,000 at the end of 1999. As of year end 2000, there wereapproximately $10,201,000 unfilled orders that were scheduled for shipment beyond a year and as of year end 1999 there were nounfilled orders scheduled for shipment beyond a year. Primarily, the increase in backlog is attributable to strong order levels atMicrosource and at the Giga-tronics Instruments division.
Net sales for 2000 were $47,577,000, a 26% increase from $37,636,000 in 1999. Every segment of the business improvedrevenue during the fiscal year. In fiscal 2000, Microsource increased revenues 68% or $6,085,000, DYMATIX (formerly theSemiconductor Equipment Group) improved 43% or $2,180,000, in revenue, while Giga-tronics Instruments increased 8% or$1,455,000, in sales and ASCOR improved 3% or $221,000, in sales.
Cost of sales increased 22% in 2000 to $31,767,000 from $26,102,000 in 1999. The increase in fiscal 2000 is attributable toincreased shipments of products during the fiscal year coupled with higher costs for labor and material for the products shipped.
Operating expenses declined 6% in 2000 over 1999. Product development costs declined $1,133,000 in fiscal 2000 to$4,180,000 as the development of new products returned to previous levels. Selling, general and administrative expenses increased$237,000 to $9,655,000 in 2000 due to higher commissions on higher revenues. Amortization of intangibles decreased $82,000 to$480,000 as a result of reduced amortization of patents and licenses.
Other income decreased in fiscal 2000 primarily due to the fiscal 1999 gain from the sale of a surplus building followingfacilities consolidation at DYMATIX for which there was no corresponding sale in fiscal 2000. Net interest income in 2000 decreased51% from 1999 due to lower average cash available for investment. The average cash decline resulted principally from low cash levelat the beginning of the year. The provision for income taxes in 2000 was $494,000, or 30%, of the pre-tax earnings.
Giga-tronics recorded net earnings of $1,139,000, or $0.24 per diluted share, in 2000 versus a loss of $1,858,000, or $0.43 perdiluted share, in 1999. The improvement in 2000 earnings was due to the Company’s higher sales levels in 2000 as compared to 1999.
R e s u l t s o f O p e r a t i o n s f o r F i s c a l 2 0 0 1 a s C o m p a r e d t o 2 0 0 0
16
M A N A G E M E N T ’ S D I S C U S S I O N A N D A N A L Y S I S
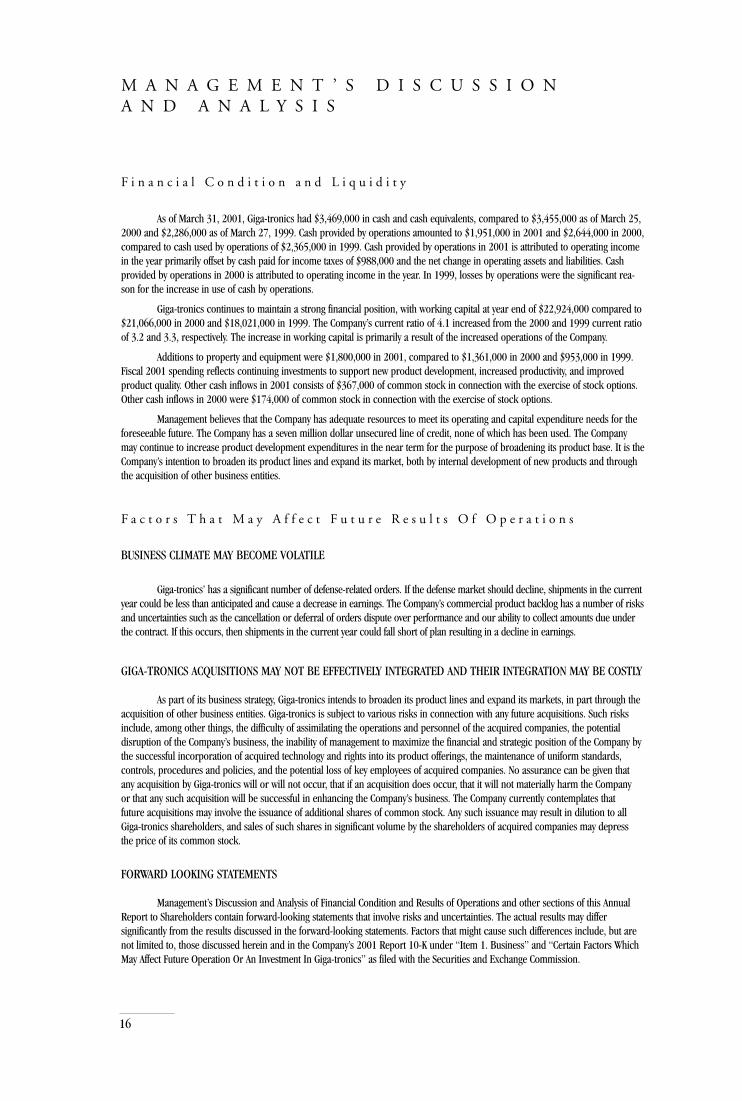
F i n a n c i a l C o n d i t i o n a n d L i q u i d i t y
As of March 31, 2001, Giga-tronics had $3,469,000 in cash and cash equivalents, compared to $3,455,000 as of March 25,2000 and $2,286,000 as of March 27, 1999. Cash provided by operations amounted to $1,951,000 in 2001 and $2,644,000 in 2000,compared to cash used by operations of $2,365,000 in 1999. Cash provided by operations in 2001 is attributed to operating incomein the year primarily offset by cash paid for income taxes of $988,000 and the net change in operating assets and liabilities. Cash provided by operations in 2000 is attributed to operating income in the year. In 1999, losses by operations were the significant rea-son for the increase in use of cash by operations.
Giga-tronics continues to maintain a strong financial position, with working capital at year end of $22,924,000 compared to$21,066,000 in 2000 and $18,021,000 in 1999. The Company’s current ratio of 4.1 increased from the 2000 and 1999 current ratioof 3.2 and 3.3, respectively. The increase in working capital is primarily a result of the increased operations of the Company.
Additions to property and equipment were $1,800,000 in 2001, compared to $1,361,000 in 2000 and $953,000 in 1999.Fiscal 2001 spending reflects continuing investments to support new product development, increased productivity, and improvedproduct quality. Other cash inflows in 2001 consists of $367,000 of common stock in connection with the exercise of stock options.Other cash inflows in 2000 were $174,000 of common stock in connection with the exercise of stock options.
Management believes that the Company has adequate resources to meet its operating and capital expenditure needs for theforeseeable future. The Company has a seven million dollar unsecured line of credit, none of which has been used. The Companymay continue to increase product development expenditures in the near term for the purpose of broadening its product base. It is theCompany’s intention to broaden its product lines and expand its market, both by internal development of new products and throughthe acquisition of other business entities.
F a c t o r s T h a t M a y A f f e c t F u t u r e R e s u l t s O f O p e r a t i o n s
BUSINESS CLIMATE MAY BECOME VOLATILE
Giga-tronics’ has a significant number of defense-related orders. If the defense market should decline, shipments in the currentyear could be less than anticipated and cause a decrease in earnings. The Company’s commercial product backlog has a number of risksand uncertainties such as the cancellation or deferral of orders dispute over performance and our ability to collect amounts due underthe contract. If this occurs, then shipments in the current year could fall short of plan resulting in a decline in earnings.
GIGA-TRONICS ACQUISITIONS MAY NOT BE EFFECTIVELY INTEGRATED AND THEIR INTEGRATION MAY BE COSTLY
As part of its business strategy, Giga-tronics intends to broaden its product lines and expand its markets, in part through theacquisition of other business entities. Giga-tronics is subject to various risks in connection with any future acquisitions. Such risksinclude, among other things, the difficulty of assimilating the operations and personnel of the acquired companies, the potential disruption of the Company’s business, the inability of management to maximize the financial and strategic position of the Company bythe successful incorporation of acquired technology and rights into its product offerings, the maintenance of uniform standards, controls, procedures and policies, and the potential loss of key employees of acquired companies. No assurance can be given thatany acquisition by Giga-tronics will or will not occur, that if an acquisition does occur, that it will not materially harm the Company or that any such acquisition will be successful in enhancing the Company’s business. The Company currently contemplates that future acquisitions may involve the issuance of additional shares of common stock. Any such issuance may result in dilution to allGiga-tronics shareholders, and sales of such shares in significant volume by the shareholders of acquired companies may depress the price of its common stock.
FORWARD LOOKING STATEMENTS
Management’s Discussion and Analysis of Financial Condition and Results of Operations and other sections of this AnnualReport to Shareholders contain forward-looking statements that involve risks and uncertainties. The actual results may differ significantly from the results discussed in the forward-looking statements. Factors that might cause such differences include, but arenot limited to, those discussed herein and in the Company’s 2001 Report 10-K under “Item 1. Business” and “Certain Factors WhichMay Affect Future Operation Or An Investment In Giga-tronics” as filed with the Securities and Exchange Commission.

17
C O N S O L I D A T E D B A L A N C E S H E E T S
(In thousands except share data) March 31, 2001 March 25, 2000
AssetsCurrent assets
Cash and cash equivalents $ 3,469 $ 3,455Trade accounts receivable, net of allowance 7,767 9,194
of $262 and $254 respectivelyInventories, net 15,185 14,113Prepaid expenses 424 444Deferred income taxes 3,560 3,570
Total current assets 30,405 30,776
Property and equipmentLeasehold improvements 398 382Machinery and equipment 16,123 14,673Office furniture and fixtures 1,142 1,023
Property and equipment, gross cost 17,663 16,078Less accumulated depreciation and amortization 12,357 10,678
Property and equipment, net 5,306 5,400Patents and licenses 36 112Goodwill, net 339 564Other assets 1,232 674
Total assets $ 37,318 $ 37,526
Liabilities and shareholders’ equityCurrent liabilities
Accounts payable $ 3,347 $ 4,065Accrued commissions 435 625Accrued payroll and benefits 1,687 1,638Accrued warranty 732 553Customer advances 690 1,536Obligation under capital lease 167 118Other current liabilities 423 1,175
Total current liabilities 7,481 9,710Obligations under capital lease, net of current portion 115 127Deferred income taxes 796 1,011Deferred rent 451 529
Total liabilities 8,843 11,377Shareholders’ equityPreferred stock of no par value
Authorized 1,000,000 shares; no shares outstandingat March 31, 2001 and March 25, 2000 — —
Common stock of no par value;Authorized 40,000,000 shares; 4,542,694 shares atMarch 31, 2001 and 4,431,008 shares at March 25, 2000 issued and outstanding 12,346 11,921
Retained earnings 16,129 14,228
Total shareholders’ equity 28,475 26,149
Total liabilities and shareholders’ equity $ 37,318 $ 37,526
See Accompanying Notes to Consolidated Financial Statements

18
CONSOLIDATED STATEMENTS OF OPERATIONS
Years ended(In thousands except per share data) March 31, 2001 March 25, 2000 March 27, 1999
Net sales $ 54,159 $ 47,577 $ 37,636Cost of sales 35,103 31,767 26,102
Gross profit 19,056 15,810 11,534
Product development 5,087 4,180 5,313Selling, general and administrative 10,713 9,655 9,418Amortization of intangibles 232 480 562
Operating expenses 16,032 14,315 15,293
Operating income (loss) 3,024 1,495 (3,759 )
Other income (expense) 232 79 632Interest income, net 205 59 121Earnings (loss) before provision (benefit) for income taxes and cumulative effect of accounting change 3,461 1,633 (3,006)Provision (benefit) for income taxes 1,040 494 (1,148)Earnings (loss) before cumulative effect of accounting change 2,421 1,139 (1,858)Cumulative effect of accounting change 520 — —
Net earnings (loss) $ 1,901 $ 1,139 $ (1,858)
Basic earnings (loss) per share:
Before cumulative effect of accounting change $ 0.54 $ 0.26 $ (0.43)
Cumulative effect of accounting change (0.12) — —
Basic earnings (loss) per share $ 0.42 $ 0.26 $ (0.43)
Diluted earnings (loss) per share:
Before cumulative effect of accounting change $ 0.51 $ 0.24 $ (0.43)
Cumulative effect of accounting change (0.11) — —
Diluted earnings (loss) per share $ 0.40 $ 0.24 $ (0.43)
Weighted average basic common shares outstanding 4,474 4,379 4,338
Weighted average diluted common shares outstanding 4,803 4,693 4,338
Pro forma amounts assuming accounting change is applied retroactively: (Unaudited)
Net income (loss) $ 2,421 $ 623 $ (1,404)
Net income (loss) per share – Basic $ 0.54 $ 0.14 $ (0.32)
Net income (loss) per share – Diluted $ 0.51 $ 0.13 $ (0.32)
See Accompanying Notes to Consolidated Financial Statements

19
CONSOLIDATED STATEMENTS OF SHAREHOLDERS’ EQUITY
Balance at March 28, 1998 4,326,299 $ 11,532 $ — $ (18) $ 14,947 $ 26,461Comprehensive Income
Net loss — — (1,858) — (1,858) (1,858)Unrealized gain on investments,
net of income tax benefit of $10 — — 18 18 — 18
Comprehensive loss — — (1,840) — — —Stock issuance under stock
option plans 35,603 89 — — — 89
Balance at March 27, 1999 4,361,902 $ 11,621 $ — $ — $ 13,089 $ 24,710Comprehensive Income – net
Net earnings — — 1,139 — 1,139 1,139
Stock issuance under stockOption plans 69,106 174 — — — 174
Tax benefit associated with exerciseof stock options — 126 — — — 126
Balance at March 25, 2000 4,431,008 $ 11,921 $ — $ — $ 14,228 $ 26,149Comprehensive Income – net
Net earnings — — 1,901 — 1,901 1,901Stock issuance under stock
option plans 111,686 367 — — — 367Tax benefit associated with exercise
of stock options — 58 — — — 58
Balance at March 31, 2001 4,542,694 $ 12,346 $ — $ — $ 16,129 $ 28,475
See Accompanying Notes to Consolidated Financial Statements
(In thousands except share data)Common Stock
Shares AmountComprehensiveIncome (Loss)
OtherComprehensiveIncome (Loss)
RetainedEarnings Total
20
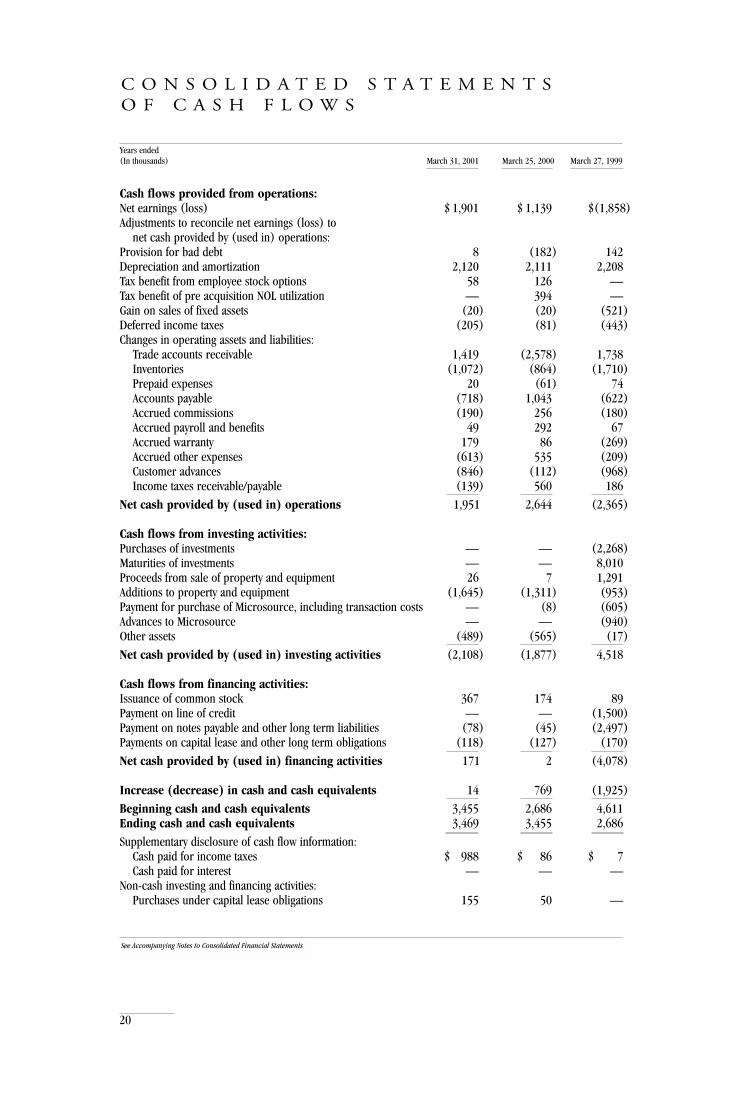
C O N S O L I D A T E D S T A T E M E N T SO F C A S H F L O W S
Years ended(In thousands) March 31, 2001 March 25, 2000 March 27, 1999
Cash flows provided from operations:Net earnings (loss) $ 1,901 $ 1,139 $(1,858)Adjustments to reconcile net earnings (loss) to
net cash provided by (used in) operations:Provision for bad debt 8 (182) 142Depreciation and amortization 2,120 2,111 2,208Tax benefit from employee stock options 58 126 —Tax benefit of pre acquisition NOL utilization — 394 —Gain on sales of fixed assets (20) (20) (521)Deferred income taxes (205) (81) (443)Changes in operating assets and liabilities:
Trade accounts receivable 1,419 (2,578) 1,738Inventories (1,072) (864) (1,710)Prepaid expenses 20 (61) 74Accounts payable (718) 1,043 (622)Accrued commissions (190) 256 (180)Accrued payroll and benefits 49 292 67Accrued warranty 179 86 (269)Accrued other expenses (613) 535 (209)Customer advances (846) (112) (968)Income taxes receivable/payable (139) 560 186
Net cash provided by (used in) operations 1,951 2,644 (2,365)
Cash flows from investing activities:Purchases of investments — — (2,268)Maturities of investments — — 8,010Proceeds from sale of property and equipment 26 7 1,291Additions to property and equipment (1,645) (1,311) (953)Payment for purchase of Microsource, including transaction costs — (8) (605)Advances to Microsource — — (940)Other assets (489) (565) (17)
Net cash provided by (used in) investing activities (2,108) (1,877) 4,518
Cash flows from financing activities:Issuance of common stock 367 174 89Payment on line of credit — — (1,500)Payment on notes payable and other long term liabilities (78) (45) (2,497)Payments on capital lease and other long term obligations (118) (127) (170)
Net cash provided by (used in) financing activities 171 2 (4,078)
Increase (decrease) in cash and cash equivalents 14 769 (1,925)
Beginning cash and cash equivalents 3,455 2,686 4,611Ending cash and cash equivalents 3,469 3,455 2,686
Supplementary disclosure of cash flow information:Cash paid for income taxes $ 988 $ 86 $ 7Cash paid for interest — — —
Non-cash investing and financing activities:Purchases under capital lease obligations 155 50 —
See Accompanying Notes to Consolidated Financial Statements

21
N O T E S T O C O N S O L I D A T E DF I N A N C I A L S T A T E M E N T S
1 Business Combinations
On May 18, 1998, Giga-tronics Incorporated acquired Microsource, Inc. (Microsource) of Santa Rosa, California. Microsource develops andmanufactures a broad line of YIG (Yttrium, Iron, Garnet) tuned oscillators, filters, and microwave synthesizers. The acquisition was accounted forusing the purchase method of accounting, and accordingly, the results of operations of Microsource have been included in the Company’sconsolidated financial statements from May 18, 1998. The purchase price consisted of $1,500,000 plus contingent payments based upon future netincome of Microsource during the two fiscal years after the effective time of the merger.
The purchase price was subsequently adjusted to give effect to the contingent payment of $8,000, net paid to Microsource shareholders based onthe subsidiary’s fiscal year 2000 operating results. In addition, the purchase price allocation was adjusted to give effect in fiscal year 2000 to therecognition of deferred tax assets of $394,000 for which no value was assigned at the date of the acquisition.
2 Summary of Significant Accounting Policies
The Company The accompanying consolidated financial statements include the accounts of Giga-tronics and its wholly owned subsidiaries.Giga-tronics and its subsidiary companies design, manufacture and market a broad line of test and measurement equipment used in thedevelopment, test, and maintenance of wireless communications products and systems, flight navigational equipment, electronic defense systems,and automatic testing systems. The Company also manufactures and markets a line of test, measurement, and handling equipment used in themanufacturing of semiconductor devices. The Company’s products are sold worldwide to customers in the test and measurement andsemiconductor industries. The Company has a United Kingdom (UK) research & development facility for the Instruments division. Otherwise theCompany has no other foreign-based operations or material amounts of identifiable assets in foreign countries. Its gross margins on foreign anddomestic sales are similar, and all non-U.S. sales are made in U.S. dollars.
Principles of Consolidation The consolidated financial statements include the accounts of Giga-tronics and its wholly-owned subsidiaries. Allsignificant intercompany balances and transactions have been eliminated in consolidation.
Use of Estimates The preparation of financial statements in conformity with accounting principles generally accepted in the United States ofAmerica requires management to make estimates and assumptions that effect the reported amounts of assets and liabilities and the disclosure ofcontingent assets and liabilities at the date of the financial statements and the reported amounts of revenues and expenses during the reportingperiod. Actual results could differ from those estimates.
Fiscal Year The Company’s financial reporting year consists of either a 52 week or 53 week period ending on the last Saturday of the month ofMarch. Fiscal year 2001 contained 53 weeks while fiscal years 2000 and 1999 each contained 52 weeks.
Reclassifications Certain reclassifications, none of which affected net income (loss), have been made to prior year balances in order toconform to the current year presentation.
Revenue Recognition Revenues are recognized when there is evidence of an arrangement, delivery has occurred, the price is fixed anddeterminable, and collectibility is reasonably assured. Revenue to customers is recorded when products are shipped and the risk of loss haspassed. Upon shipment, the Company also provides for the estimated cost that may be incurred for product warranties. Revenue related toproducts shipped subject to customers’ evaluation is recognized upon final acceptance.
During the fourth quarter of fiscal 2001, the Company adopted Staff Accounting Bulletin (SAB) 101, Revenue Recognition in FinancialStatements, effective March 26, 2000. Prior to the adoption of SAB 101, the Company recognized revenue on sales with final customer acceptanceupon delivery and provided for the estimated costs of installation obligations at the time the revenue was recognized. The Company recorded acumulative effect adjustment related to this change in accounting of $520,000, net of income taxes. The adoption of SAB 101 resulted in thedeferral of $2,165,000 in sales as of the beginning of the 2001 fiscal year, and subsequent recognition of the deferred sales during the year.
Pro forma effect of SAB 101 assuming accounting change is applied retroactively is as follows:
Years ended(In thousands except per share data) March 31, 2001 March 25, 2000 March 27, 1999(Unaudited)
Net Sales $ 54,159 $ 45,412 $ 39,120Cost of Sales 35,103 30,345 26,938
Gross Profit 19,056 15,067 12,182Operating Expense 16,032 14,315 15,293
Operating Income (loss) 3,024 752 (3,111)Interest and other income 437 138 753
Earnings (loss) before taxes 3,461 890 (2,358)Provision (benefit) for income taxes 1,040 267 (954)
Net income (loss) $ 2,421 $ 623 $ (1,404)
Net income (loss) per share – Basic $ 0.54 $ 0.14 $ (0.32)
Net income (loss) per share – Diluted $ 0.51 $ 0.13 $ (0.32)
22
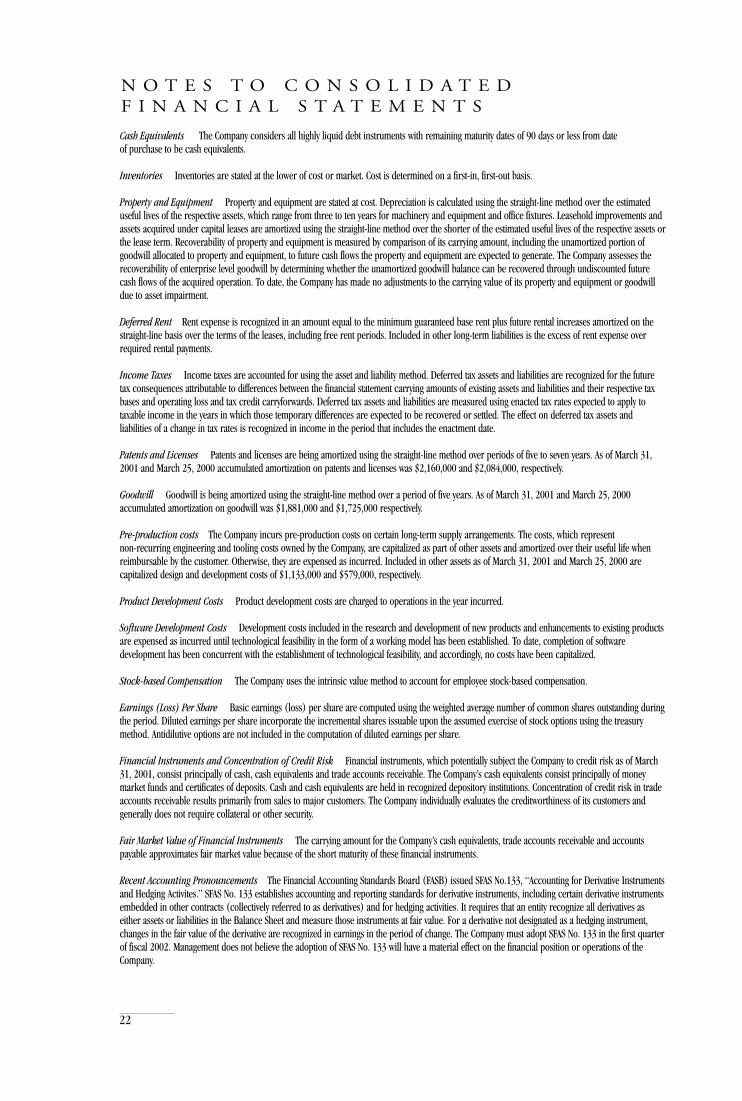
N O T E S T O C O N S O L I D A T E DF I N A N C I A L S T A T E M E N T S
Cash Equivalents The Company considers all highly liquid debt instruments with remaining maturity dates of 90 days or less from date of purchase to be cash equivalents.
Inventories Inventories are stated at the lower of cost or market. Cost is determined on a first-in, first-out basis.
Property and Equipment Property and equipment are stated at cost. Depreciation is calculated using the straight-line method over the estimateduseful lives of the respective assets, which range from three to ten years for machinery and equipment and office fixtures. Leasehold improvements andassets acquired under capital leases are amortized using the straight-line method over the shorter of the estimated useful lives of the respective assets orthe lease term. Recoverability of property and equipment is measured by comparison of its carrying amount, including the unamortized portion ofgoodwill allocated to property and equipment, to future cash flows the property and equipment are expected to generate. The Company assesses therecoverability of enterprise level goodwill by determining whether the unamortized goodwill balance can be recovered through undiscounted futurecash flows of the acquired operation. To date, the Company has made no adjustments to the carrying value of its property and equipment or goodwilldue to asset impairment.
Deferred Rent Rent expense is recognized in an amount equal to the minimum guaranteed base rent plus future rental increases amortized on thestraight-line basis over the terms of the leases, including free rent periods. Included in other long-term liabilities is the excess of rent expense overrequired rental payments.
Income Taxes Income taxes are accounted for using the asset and liability method. Deferred tax assets and liabilities are recognized for the futuretax consequences attributable to differences between the financial statement carrying amounts of existing assets and liabilities and their respective taxbases and operating loss and tax credit carryforwards. Deferred tax assets and liabilities are measured using enacted tax rates expected to apply totaxable income in the years in which those temporary differences are expected to be recovered or settled. The effect on deferred tax assets andliabilities of a change in tax rates is recognized in income in the period that includes the enactment date.
Patents and Licenses Patents and licenses are being amortized using the straight-line method over periods of five to seven years. As of March 31,2001 and March 25, 2000 accumulated amortization on patents and licenses was $2,160,000 and $2,084,000, respectively.
Goodwill Goodwill is being amortized using the straight-line method over a period of five years. As of March 31, 2001 and March 25, 2000accumulated amortization on goodwill was $1,881,000 and $1,725,000 respectively.
Pre-production costs The Company incurs pre-production costs on certain long-term supply arrangements. The costs, which represent non-recurring engineering and tooling costs owned by the Company, are capitalized as part of other assets and amortized over their useful life whenreimbursable by the customer. Otherwise, they are expensed as incurred. Included in other assets as of March 31, 2001 and March 25, 2000 arecapitalized design and development costs of $1,133,000 and $579,000, respectively.
Product Development Costs Product development costs are charged to operations in the year incurred.
Software Development Costs Development costs included in the research and development of new products and enhancements to existing productsare expensed as incurred until technological feasibility in the form of a working model has been established. To date, completion of softwaredevelopment has been concurrent with the establishment of technological feasibility, and accordingly, no costs have been capitalized.
Stock-based Compensation The Company uses the intrinsic value method to account for employee stock-based compensation.
Earnings (Loss) Per Share Basic earnings (loss) per share are computed using the weighted average number of common shares outstanding duringthe period. Diluted earnings per share incorporate the incremental shares issuable upon the assumed exercise of stock options using the treasurymethod. Antidilutive options are not included in the computation of diluted earnings per share.
Financial Instruments and Concentration of Credit Risk Financial instruments, which potentially subject the Company to credit risk as of March31, 2001, consist principally of cash, cash equivalents and trade accounts receivable. The Company’s cash equivalents consist principally of moneymarket funds and certificates of deposits. Cash and cash equivalents are held in recognized depository institutions. Concentration of credit risk in tradeaccounts receivable results primarily from sales to major customers. The Company individually evaluates the creditworthiness of its customers andgenerally does not require collateral or other security.
Fair Market Value of Financial Instruments The carrying amount for the Company’s cash equivalents, trade accounts receivable and accountspayable approximates fair market value because of the short maturity of these financial instruments.
Recent Accounting Pronouncements The Financial Accounting Standards Board (FASB) issued SFAS No.133, “Accounting for Derivative Instrumentsand Hedging Activites.” SFAS No. 133 establishes accounting and reporting standards for derivative instruments, including certain derivative instrumentsembedded in other contracts (collectively referred to as derivatives) and for hedging activities. It requires that an entity recognize all derivatives aseither assets or liabilities in the Balance Sheet and measure those instruments at fair value. For a derivative not designated as a hedging instrument,changes in the fair value of the derivative are recognized in earnings in the period of change. The Company must adopt SFAS No. 133 in the first quarterof fiscal 2002. Management does not believe the adoption of SFAS No. 133 will have a material effect on the financial position or operations of theCompany.

23
N O T E S T O C O N S O L I D A T E DF I N A N C I A L S T A T E M E N T S
4 Inventories
Years ended March 31, 2001 March 25, 2000(In thousands)
Raw materials $ 8,432 $ 8,095Work-in-progress 4,833 5,167Finished goods 1,020 294Loaned inventory 900 557
$ 15,185 $ 14,113
5 Selling Expenses
Selling expenses consist primarily of commissions paid to various marketing agencies. Commission expense totaled $2,579,000, $2,360,000,and $2,051,000 in fiscal 2001, 2000, and 1999, respectively. Advertising costs which are expensed as incurred totaled $579,000, $511,000, and$558,000 for fiscal 2001, 2000, and 1999, respectively.
6 Significant Customers and Industry Segment Information
The Company has five reportable segments: Giga-tronics Instruments division, ASCOR, Microsource, DYMATIX, and Corporate. Giga-tronicsInstrument division produces a broad line of test and measurement equipment used in the development, test and maintenance of wirelesscommunications products and systems, flight navigational equipment, electronic defense systems and automatic testing systems. ASCOR designs,manufactures, and markets a line of switching devices that link together many specific purpose instruments that comprise automatic test systems.Microsource develops and manufactures a broad line of YIG (Yttrium, Iron, Garnet) tuned oscillators, filters and microwave synthesizers, whichare used in a wide variety of microwave instruments or devices. DYMATIX, which includes Viking Semiconductor Equipment, Inc. and Ultracision,Inc., manufactures and markets optical inspection equipment used to test semiconductor devices and automation equipment for the test andinspection of silicon wafers. Corporate handles the financing needs of each segment and lends funds to each segment as required.
The accounting policies for the segments are the same as those described in the “Summary of Significant Accounting Policies.” The Companyevaluates the performance of its segments and allocates resources to them based on earnings before income taxes (pre-tax income (loss)).Segment net sales includes sales to external customers. Segment pre-tax loss includes an allocation for corporate expenses, amortization ofgoodwill, and interest expense from borrowings from Corporate. Corporate expenses are allocated to the reportable segments based principallyon full time equivalent headcount. Interest expense is charged at prime which is currently 9% for cash required by each segment. Goodwillassociated with acquisitions are recorded as assets of the individual segments. Assets include accounts receivable, inventories, equipment, cash,deferred income taxes, prepaid expenses, goodwill and other long-term assets. The Company accounts for inter-segment sales and transfers atterms that allow a reasonable profit to the seller. During the periods reported there were no significant inter-segment sales or transfers.
The Company’s reportable operating segments are strategic business units that offer different products and services. They are managedseparately because each business utilizes different technology and requires different marketing strategies. All of the businesses except for Giga-tronics Instruments were acquired. The Company’s chief operating decision maker is considered to be the Company’s Chief Executive Officer(“CEO”). The CEO reviews financial information presented on a consolidated basis accompanied by disaggregated information about revenuesand pre-tax income by operating segment. The tables below present information for the fiscal years ended in 2001, 2000 and 1999:
3 Cash and Cash Equivalents
Cash and cash equivalents consisted of the following at March 31, 2001 and March 25, 2000:
March 31, 2001 Cash and Cash Equivalents(In thousands) Amortized Fair
Cost Value
Cash $ 3,469 $ 3,469Total $ 3,469 $ 3,469
March 25, 2000 Cash and Cash Equivalents(In thousands) Amortized Fair
Cost Value
Cash $ 1,067 $ 1,067Money market funds 1,933 1,933Other marketable securities 455 455
Total $ 3,455 $ 3,455

24
N O T E S T O C O N S O L I D A T E DF I N A N C I A L S T A T E M E N T S
March 31, 2001 (In thousands): Giga-tronics Instruments ASCOR Microsource DYMATIX Corporate Total
Revenue $ 25,001 $ 7,503 $ 13,208 $ 8,447 $ — $ 54,159Interest income 25 93 6 3 109 236Interest expense (196) (4) (744) (354) 1,267 (31)Depreciation and amortization 604 148 1,270 98 — 2,120Pre-tax income 1,193 1,436 (985) 434 1,383 3,461Assets 15,518 4,172 11,937 5,236 455 37,318
March 25, 2000 (In thousands): Giga-tronics Instruments ASCOR Microsource DYMATIX Corporate Total
Revenue $ 18,516 $ 6,705 $ 15,069 $ 7,287 $ — $ 47,577Interest income — 34 1 — 70 105Interest expense (25) (15) (634) (329) 957 (46)Depreciation and amortization 699 153 1,164 95 — 2,111Pre-tax income 361 53 132 168 919 1,633Assets 13,546 5,299 11,874 5,396 1,411 37,526
March 27, 1999 (In thousands): Giga-tronics Instruments ASCOR Microsource DYMATIX Corporate Total
Revenue $ 17,061 $ 6,484 $ 8,984 $ 5,107 $ — $ 37,636Interest income 35 10 — 2 120 167Interest expense — 31 455 287 (727) 46Depreciation and amortization 924 152 1,004 128 — 2,208Pre-tax income (loss) (805) 546 (777) (2,791) 821 (3,006)Assets 10,130 4,426 11,495 5,763 1,445 33,259
The Company’s Giga-tronics Instruments, ASCOR, and Microsource segments sell to agencies of the U.S. Government and U.S. defense-related customers. Infiscal 2001, 2000, and 1999 U.S. Government and U.S. defense-related customers accounted for 11%, 16%, and 24%, of sales, respectively. In addition during2001, a Japanese distributor of the Company, Midoriya, accounted for 10% of the Company’s consolidated sales and 11% of accounts receivable as of year end.
Export sales accounted for 41%, 30%, and 20% of the Company’s sales in fiscal 2001, 2000, and 1999, respectively. Export sales by geographical area areshown below:
Years ended (In thousands) March 31, 2001 March 25, 2000 March 27, 1999
Americas $ 4,256 $ 1,989 $ 445Europe 6,831 6,448 3,446Asia 9,512 4,981 3,371Rest of world 1,473 1,050 403
$ 22,072 $ 14,468 $ 7,665
7 Earnings (loss) per Share
Shares used in per share computations for the years ended March 31, 2001, March 25, 2000, and March 27, 1999 are as follows:
Years ended (In thousands except per share data) March 31, 2001 March 25, 2000 March 27, 1999
Net earnings (loss) $ 1,901 $ 1,139 $ (1,858)Weighted average:Common shares outstanding 4,474 4,379 4,338Common share equivalents 329 314 —
Common shares assuming dilution 4,803 4,693 4,338
Net earnings per share of common stock $ 0.42 $ 0.26 $ (0.43)Net earnings per share of common stock
assuming dilution $ 0.40 $ 0.24 $ (0.43)
Stock options not included in computation 57 24 537
The number of stock options not included in the computation of diluted earnings per share (EPS) for the period ended March 27, 1999 is a result of theCompany’s loss from continuing operations and therefore the options are antidilutive. The number of stock options not included in the computation ofdiluted EPS for the periods ending March 31, 2001 and March 25, 2000 reflects stock options where the exercise prices were greater than the averagemarket price of the common shares and are therefore antidilutive.

25
N O T E S T O C O N S O L I D A T E DF I N A N C I A L S T A T E M E N T S
8 Income Taxes
Following are the components of the provision (benefit) for income taxes:
Years ended March 31, 2001 March 25, 2000 March 27, 1999(In thousands)
Current:Federal $ 1,063 $ 46 $ (720)State 66 7 4
1,129 53 (716)Deferred:
Federal 58 (180) (205)State (263) 100 (227)
(205) (80) (432)Charge in lieu of taxes attributable to employer stock option plans 58 127 —Goodwill, for initial recognition of acquired tax benefits that previously were included in the valuation reserve 58 394 —
Provision (benefit) for income taxes $ 1,040 $ 494 $ (1,148)
The tax effects of temporary differences that give rise to significant portions of the deferred tax assets and liabilities are as follows:
Years ended March 31, 2001 March 25, 2000(In thousands)
Current tax assets, net $ 3,560 $ 3,570Noncurrent tax asset (liabilities), net (796) (1,011)
Net deferred taxes $ 2,764 $ 2,559
Future state tax effect (182) (188)Allowance for doubtful accounts 112 196Fixed asset depreciation (855) (1,116)Inventory reserves and additional costs capitalized 2,529 2,747Deferred revenue — 19Accrued vacation 284 268Accrued warranty 314 237Other accrued liabilities 212 330Net operating loss carryforward 6,056 6,452Income tax credits 786 501Valuation allowances (6,492) (6,887)
$ 2,764 $ 2,559
Years ended March 31, 2001 March 25, 2000 March 27, 1999(In thousands except percentages)
Statutory federal income tax (benefit) $ 1,176 34.0% $ 555 34.0% $(1,022) 34.0%Beginning of year change in deferred
Tax asset valuation allowance — — (55) (3.4) — —State income tax, net of federal benefit 200 5.8 57 3.5 (146) 4.9Nontax deductible expenses 6 0.2 6 0.4 14 (0.4)Tax credits (297) (8.6) (98) (6.0) (58) 1.9Goodwill and patent amortization 60 1.7 88 5.4 84 (2.8)Interest income exempt from federal tax (58) (1.7) (51) (3.1) (19) .6Other (47) (1.4) (8) (.5) (1) —
Effective income tax (benefit) $ 1,040 30.0% $ 494 30.3% $(1,148) 38.2%
26
N O T E S T O C O N S O L I D A T E DF I N A N C I A L S T A T E M E N T S
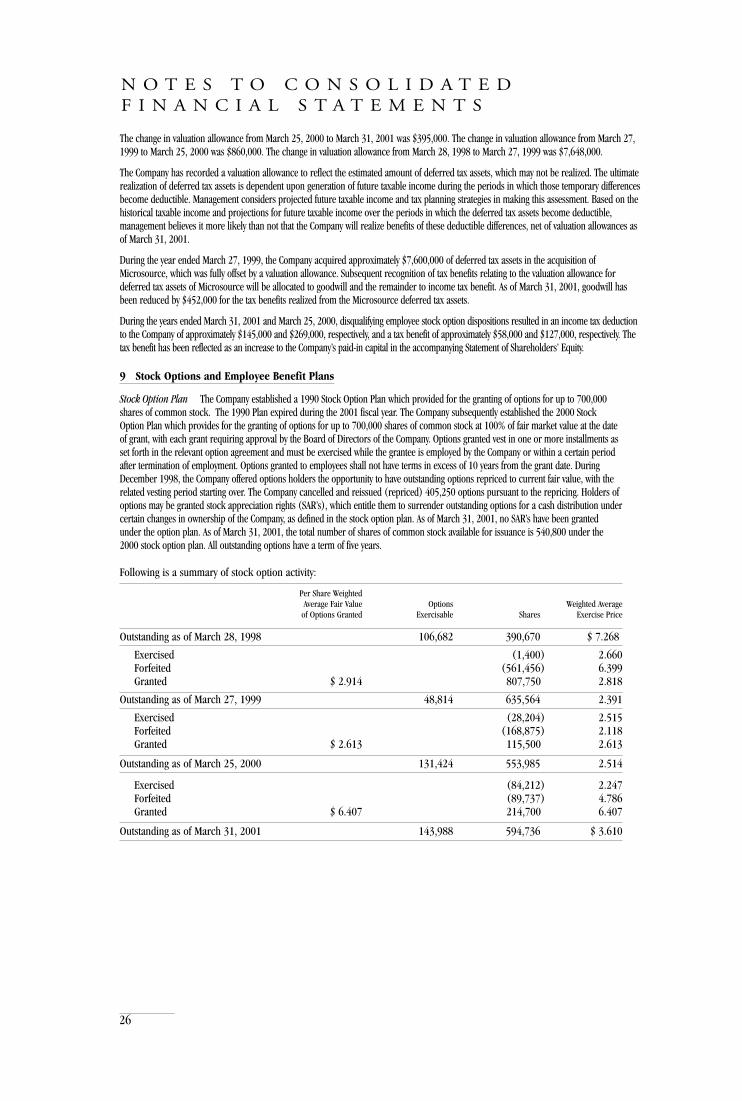
Following is a summary of stock option activity:
Per Share WeightedAverage Fair Value Options Weighted Average
of Options Granted Exercisable Shares Exercise Price
Outstanding as of March 28, 1998 106,682 390,670 $ 7.268
Exercised (1,400) 2.660Forfeited (561,456) 6.399Granted $ 2.914 807,750 2.818
Outstanding as of March 27, 1999 48,814 635,564 2.391
Exercised (28,204) 2.515Forfeited (168,875) 2.118Granted $ 2.613 115,500 2.613
Outstanding as of March 25, 2000 131,424 553,985 2.514
Exercised (84,212) 2.247Forfeited (89,737) 4.786Granted $ 6.407 214,700 6.407
Outstanding as of March 31, 2001 143,988 594,736 $ 3.610
9 Stock Options and Employee Benefit Plans
Stock Option Plan The Company established a 1990 Stock Option Plan which provided for the granting of options for up to 700,000shares of common stock. The 1990 Plan expired during the 2001 fiscal year. The Company subsequently established the 2000 StockOption Plan which provides for the granting of options for up to 700,000 shares of common stock at 100% of fair market value at the dateof grant, with each grant requiring approval by the Board of Directors of the Company. Options granted vest in one or more installments asset forth in the relevant option agreement and must be exercised while the grantee is employed by the Company or within a certain periodafter termination of employment. Options granted to employees shall not have terms in excess of 10 years from the grant date. DuringDecember 1998, the Company offered options holders the opportunity to have outstanding options repriced to current fair value, with therelated vesting period starting over. The Company cancelled and reissued (repriced) 405,250 options pursuant to the repricing. Holders ofoptions may be granted stock appreciation rights (SAR’s), which entitle them to surrender outstanding options for a cash distribution undercertain changes in ownership of the Company, as defined in the stock option plan. As of March 31, 2001, no SAR’s have been grantedunder the option plan. As of March 31, 2001, the total number of shares of common stock available for issuance is 540,800 under the2000 stock option plan. All outstanding options have a term of five years.
The change in valuation allowance from March 25, 2000 to March 31, 2001 was $395,000. The change in valuation allowance from March 27,1999 to March 25, 2000 was $860,000. The change in valuation allowance from March 28, 1998 to March 27, 1999 was $7,648,000.
The Company has recorded a valuation allowance to reflect the estimated amount of deferred tax assets, which may not be realized. The ultimaterealization of deferred tax assets is dependent upon generation of future taxable income during the periods in which those temporary differencesbecome deductible. Management considers projected future taxable income and tax planning strategies in making this assessment. Based on thehistorical taxable income and projections for future taxable income over the periods in which the deferred tax assets become deductible,management believes it more likely than not that the Company will realize benefits of these deductible differences, net of valuation allowances asof March 31, 2001.
During the year ended March 27, 1999, the Company acquired approximately $7,600,000 of deferred tax assets in the acquisition ofMicrosource, which was fully offset by a valuation allowance. Subsequent recognition of tax benefits relating to the valuation allowance fordeferred tax assets of Microsource will be allocated to goodwill and the remainder to income tax benefit. As of March 31, 2001, goodwill hasbeen reduced by $452,000 for the tax benefits realized from the Microsource deferred tax assets.
During the years ended March 31, 2001 and March 25, 2000, disqualifying employee stock option dispositions resulted in an income tax deductionto the Company of approximately $145,000 and $269,000, respectively, and a tax benefit of approximately $58,000 and $127,000, respectively. Thetax benefit has been reflected as an increase to the Company’s paid-in capital in the accompanying Statement of Shareholders’ Equity.

27
N O T E S T O C O N S O L I D A T E DF I N A N C I A L S T A T E M E N T S
For purposes of computing pro-forma (unaudited) consolidated net earnings (loss), the fair value of each option grant and EmployeeStock Purchase Plan purchase right is estimated on the date of grant using the Black Scholes option pricing model. The assumptions usedto value the option grants and purchase rights are stated below:
Years ended March 31, 2001 March 25, 2000 March 27, 1999
Expected life of options 4 years 4 years 4 yearsExpected life of purchase rights 6 mos 6 mos 6 mosVolatility 60% 60% 60%Risk-free interest rate 4.64 to 6.30 5.08 to 5.97 4.53 to 5.66Dividend yield Zero Zero Zero
Options Outstanding and Exercisable as of March 25, 2001, by Price Range
Number Weighted Average Weighted Number WeightedRange of of Options Remaining Average of Options AverageExercise Prices Outstanding Contractual Life Exercise Price Exercisable Exercise Price
$2.09 286,536 2.69 $ 2.094 113,238 $ 2.094From $2.12 to $5.09 182,200 3.77 3.658 30,750 2.895From $6.13 to $8.88 126,000 4.54 6.990 — —
From $2.09 to $8.88 594,736 3.41 $ 3.610 143,988 $ 2.26
Employee Stock Purchase Plan Under the Company’s Employee Stock Purchase Plan (the Purchase Plan), employees meeting specificemployment qualifications are eligible to participate and can purchase shares semi-annually through payroll deductions at the lower of85% of the fair market value of the stock at the commencement or end of the offering period. The Purchase Plan permits eligibleemployees to purchase common stock through payroll deductions for up to 10% of qualified compensation. As of March 31, 2001, 18,260shares remain available for issuance under the Purchase Plan. The weighted average fair value of the purchase rights granted in fiscal 2001was $6.471.
401(k) Plan The Company has established 401(k) plans which cover substantially all employees. Participants may make voluntarycontributions to the plan up to 20% of their defined compensation. The Company is required to match a percentage of the participants’contributions in accordance with the plan. Participants vest ratably in Company contributions over a four-year period. Companycontributions to the plans for fiscal 2001, 2000, and 1999 were approximately $208,000, $151,000, and $153,000, respectively.
In accordance with SFAS No. 123, “Accounting for Stock-Based Compensation”, the Company is required to disclose the effects on netearnings and earnings per share as if it had elected to use the fair value method to account for employee stock-based compensation plans.Had the Company recorded a charge for the fair value of options granted consistent with SFAS No. 123, net earnings (loss) and net earnings(loss) per share would have been changed to the pro-forma (unaudited) amounts shown below:
Years ended March 31, 2001 March 25, 2000 March 27, 1999(In thousands except per share data)
Net earnings (loss)As reported $ 1,901 $ 1,139 $ (1,858)Pro-forma 1,537 872 (2,234)
Net earnings (loss) per share – basicAs reported 0.42 0.26 (0.43)Pro-forma 0.34 0.20 (0.52)
Net earnings (loss) per share – dilutedAs reported 0.40 0.24 (0.43)Pro-forma $ 0.32 $ 0.19 $ (0.52)
28
N O T E S T O C O N S O L I D A T E DF I N A N C I A L S T A T E M E N T S
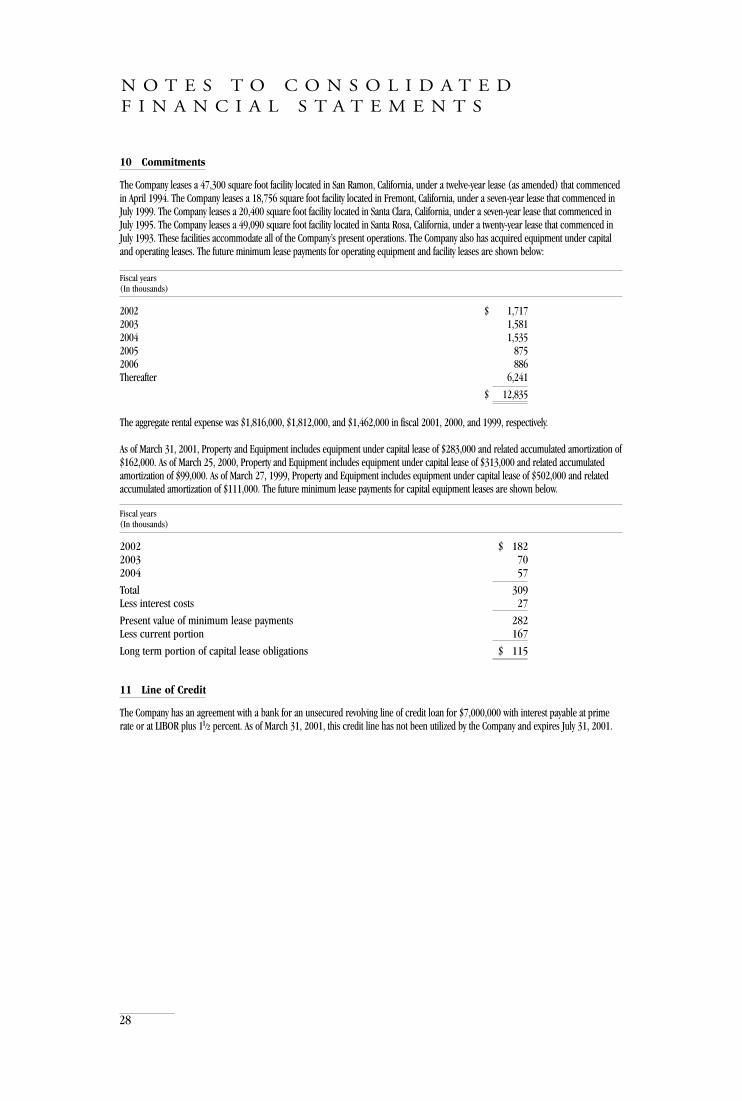
10 Commitments
The Company leases a 47,300 square foot facility located in San Ramon, California, under a twelve-year lease (as amended) that commencedin April 1994. The Company leases a 18,756 square foot facility located in Fremont, California, under a seven-year lease that commenced inJuly 1999. The Company leases a 20,400 square foot facility located in Santa Clara, California, under a seven-year lease that commenced inJuly 1995. The Company leases a 49,090 square foot facility located in Santa Rosa, California, under a twenty-year lease that commenced inJuly 1993. These facilities accommodate all of the Company’s present operations. The Company also has acquired equipment under capitaland operating leases. The future minimum lease payments for operating equipment and facility leases are shown below:
Fiscal years(In thousands)
2002 $ 1,7172003 1,5812004 1,5352005 8752006 886Thereafter 6,241
$ 12,835
The aggregate rental expense was $1,816,000, $1,812,000, and $1,462,000 in fiscal 2001, 2000, and 1999, respectively.
As of March 31, 2001, Property and Equipment includes equipment under capital lease of $283,000 and related accumulated amortization of$162,000. As of March 25, 2000, Property and Equipment includes equipment under capital lease of $313,000 and related accumulatedamortization of $99,000. As of March 27, 1999, Property and Equipment includes equipment under capital lease of $502,000 and relatedaccumulated amortization of $111,000. The future minimum lease payments for capital equipment leases are shown below.
Fiscal years(In thousands)
2002 $ 1822003 702004 57
Total 309Less interest costs 27
Present value of minimum lease payments 282Less current portion 167
Long term portion of capital lease obligations $ 115
11 Line of Credit
The Company has an agreement with a bank for an unsecured revolving line of credit loan for $7,000,000 with interest payable at primerate or at LIBOR plus 11/2 percent. As of March 31, 2001, this credit line has not been utilized by the Company and expires July 31, 2001.

29
I N D E P E N D E N T A U D I T O R S ’ R E P O R T
The Board of Directors and ShareholdersGiga-tronics Incorporated:
We have audited the accompanying consolidated balance sheets of Giga-tronics Incorporated and subsidiaries as of March 31, 2001 and March 25, 2000, and the related consolidated statements of operations, shareholders’ equity and cash flows for years ended March 31, 2001, March 25, 2000, and March 27, 1999. These consolidated financial statements are the responsibility of the Company’s management. Our responsibility is to express an opinion on these consolidated financial statements based on our audits.
We conducted our audits in accordance with auditing standards generally accepted in the United States ofAmerica. Those standards require that we plan and perform the audit to obtain reasonable assurance aboutwhether the financial statements are free of material misstatement. An audit includes examining, on a testbasis, evidence supporting the amounts and disclosures in the financial statements. An audit also includesassessing the accounting principles used and significant estimates made by management, as well as evaluating the overall financial statement presentation. We believe that our audits provide a reasonable basis for our opinion.
In our opinion, the consolidated financial statements referred to above present fairly, in all material respects,the financial position of Giga-tronics Incorporated and subsidiaries as of March 31, 2001 and March 25,2000, and the results of their operations and their cash flows for the years ended March 31, 2001, March25, 2000, and March 27, 1999, in conformity with accounting principles generally accepted in the UnitedStates of America.
As discussed in Note 2 to the consolidated financial statements, effective March 26, 2000, the Companychanged its method of accounting for certain equipment sales.
KPMG LLPMountain View, CaliforniaMay 4, 2001
30
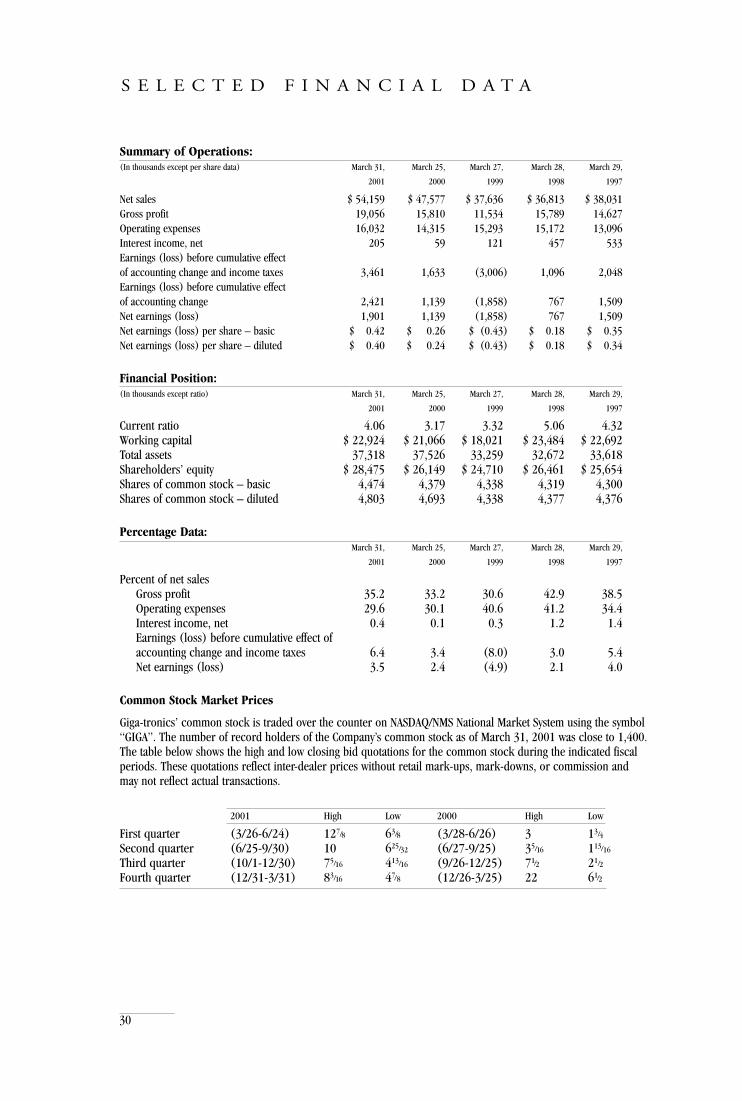
Summary of Operations:(In thousands except per share data) March 31, March 25, March 27, March 28, March 29,
2001 2000 1999 1998 1997
Net sales $ 54,159 $ 47,577 $ 37,636 $ 36,813 $ 38,031Gross profit 19,056 15,810 11,534 15,789 14,627Operating expenses 16,032 14,315 15,293 15,172 13,096Interest income, net 205 59 121 457 533Earnings (loss) before cumulative effectof accounting change and income taxes 3,461 1,633 (3,006) 1,096 2,048Earnings (loss) before cumulative effectof accounting change 2,421 1,139 (1,858) 767 1,509Net earnings (loss) 1,901 1,139 (1,858) 767 1,509Net earnings (loss) per share – basic $ 0.42 $ 0.26 $ (0.43) $ 0.18 $ 0.35Net earnings (loss) per share – diluted $ 0.40 $ 0.24 $ (0.43) $ 0.18 $ 0.34
Financial Position:(In thousands except ratio) March 31, March 25, March 27, March 28, March 29,
2001 2000 1999 1998 1997
Current ratio 4.06 3.17 3.32 5.06 4.32Working capital $ 22,924 $ 21,066 $ 18,021 $ 23,484 $ 22,692Total assets 37,318 37,526 33,259 32,672 33,618Shareholders’ equity $ 28,475 $ 26,149 $ 24,710 $ 26,461 $ 25,654Shares of common stock – basic 4,474 4,379 4,338 4,319 4,300Shares of common stock – diluted 4,803 4,693 4,338 4,377 4,376
Percentage Data:March 31, March 25, March 27, March 28, March 29,
2001 2000 1999 1998 1997
Percent of net salesGross profit 35.2 33.2 30.6 42.9 38.5Operating expenses 29.6 30.1 40.6 41.2 34.4Interest income, net 0.4 0.1 0.3 1.2 1.4Earnings (loss) before cumulative effect of accounting change and income taxes 6.4 3.4 (8.0) 3.0 5.4Net earnings (loss) 3.5 2.4 (4.9) 2.1 4.0
Common Stock Market Prices
Giga-tronics’ common stock is traded over the counter on NASDAQ/NMS National Market System using the symbol“GIGA”. The number of record holders of the Company’s common stock as of March 31, 2001 was close to 1,400.The table below shows the high and low closing bid quotations for the common stock during the indicated fiscal periods. These quotations reflect inter-dealer prices without retail mark-ups, mark-downs, or commission and may not reflect actual transactions.
2001 High Low 2000 High Low
First quarter (3/26-6/24) 127/8 63/8 (3/28-6/26) 3 13/4
Second quarter (6/25-9/30) 10 625/32 (6/27-9/25) 35/16 113/16
Third quarter (10/1-12/30) 75/16 413/16 (9/26-12/25) 71/2 21/2
Fourth quarter (12/31-3/31) 83/16 47/8 (12/26-3/25) 22 61/2
S E L E C T E D F I N A N C I A L D A T A
31
S E L E C T E D F I N A N C I A L D A T A
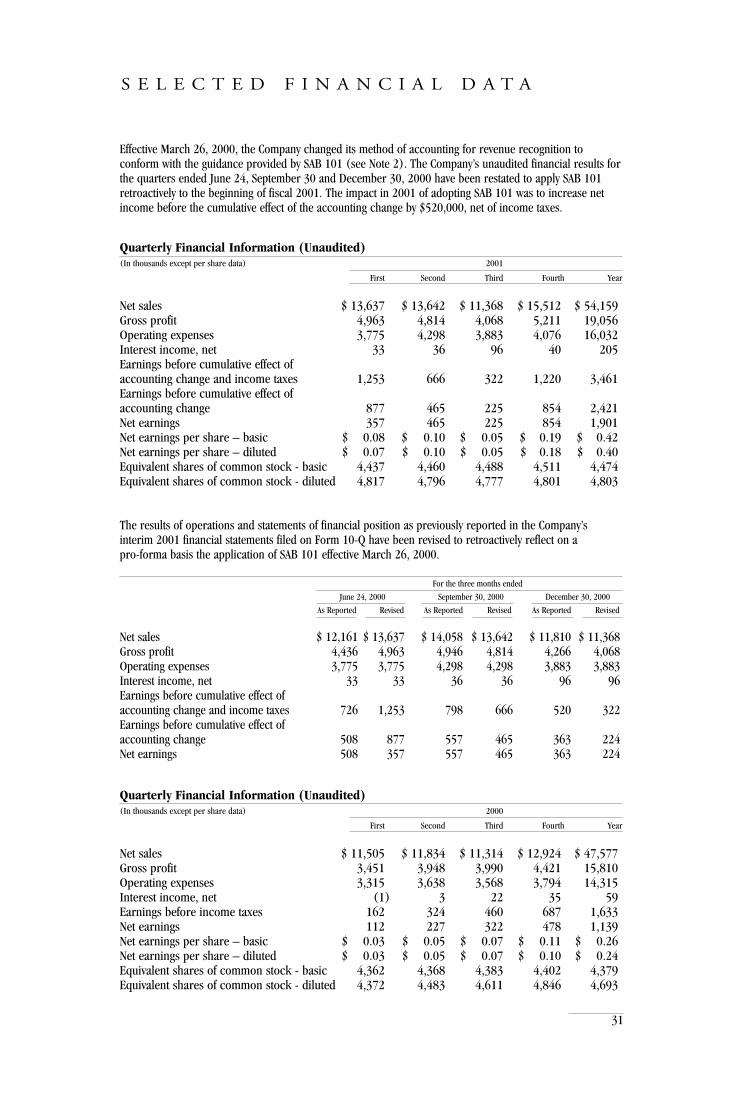
Effective March 26, 2000, the Company changed its method of accounting for revenue recognition to conform with the guidance provided by SAB 101 (see Note 2). The Company’s unaudited financial results forthe quarters ended June 24, September 30 and December 30, 2000 have been restated to apply SAB 101retroactively to the beginning of fiscal 2001. The impact in 2001 of adopting SAB 101 was to increase netincome before the cumulative effect of the accounting change by $520,000, net of income taxes.
Quarterly Financial Information (Unaudited)(In thousands except per share data) 2001
First Second Third Fourth Year
Net sales $ 13,637 $ 13,642 $ 11,368 $ 15,512 $ 54,159Gross profit 4,963 4,814 4,068 5,211 19,056Operating expenses 3,775 4,298 3,883 4,076 16,032Interest income, net 33 36 96 40 205Earnings before cumulative effect of accounting change and income taxes 1,253 666 322 1,220 3,461Earnings before cumulative effect of accounting change 877 465 225 854 2,421Net earnings 357 465 225 854 1,901Net earnings per share – basic $ 0.08 $ 0.10 $ 0.05 $ 0.19 $ 0.42Net earnings per share – diluted $ 0.07 $ 0.10 $ 0.05 $ 0.18 $ 0.40Equivalent shares of common stock - basic 4,437 4,460 4,488 4,511 4,474Equivalent shares of common stock - diluted 4,817 4,796 4,777 4,801 4,803
The results of operations and statements of financial position as previously reported in the Company’s interim 2001 financial statements filed on Form 10-Q have been revised to retroactively reflect on a pro-forma basis the application of SAB 101 effective March 26, 2000.
For the three months ended
June 24, 2000 September 30, 2000 December 30, 2000
As Reported Revised As Reported Revised As Reported Revised
Net sales $ 12,161 $ 13,637 $ 14,058 $ 13,642 $ 11,810 $ 11,368Gross profit 4,436 4,963 4,946 4,814 4,266 4,068Operating expenses 3,775 3,775 4,298 4,298 3,883 3,883Interest income, net 33 33 36 36 96 96Earnings before cumulative effect of accounting change and income taxes 726 1,253 798 666 520 322Earnings before cumulative effect of accounting change 508 877 557 465 363 224Net earnings 508 357 557 465 363 224
Quarterly Financial Information (Unaudited)(In thousands except per share data) 2000
First Second Third Fourth Year
Net sales $ 11,505 $ 11,834 $ 11,314 $ 12,924 $ 47,577Gross profit 3,451 3,948 3,990 4,421 15,810Operating expenses 3,315 3,638 3,568 3,794 14,315Interest income, net (1) 3 22 35 59Earnings before income taxes 162 324 460 687 1,633Net earnings 112 227 322 478 1,139Net earnings per share – basic $ 0.03 $ 0.05 $ 0.07 $ 0.11 $ 0.26Net earnings per share – diluted $ 0.03 $ 0.05 $ 0.07 $ 0.10 $ 0.24Equivalent shares of common stock - basic 4,362 4,368 4,383 4,402 4,379Equivalent shares of common stock - diluted 4,372 4,483 4,611 4,846 4,693

32
C O R P O R A T E I N F O R M A T I O N
D I R E C T O R S
George H. Bruns, Jr.Chairman andChief Executive Officer
James A. Cole 1,2
General Partner, Windward VenturesGeneral Partner, Spectra Enterprises
Robert C. Wilson 1,2
ChairmanWilson & Chambers
William E. Wilson 1,2
PresidentMicrosource, Inc.
1Member, Compensation Committee
2Member, Audit Committee
E X E C U T I V E O F F I C E R S
George H. Bruns, Jr.Chairman and
Chief Executive Officer
Mark H. Cosmez IIVice President, Finance/
Chief Financial Officer & Secretary
Claudio S. MariottaPresident, Giga-tronics Instrument Division
Jeffrey T. LumPresident, ASCOR, Inc.
Daniel S. MarkowitzPresident, DYMATIX (Ultracision, Inc. and Viking Semiconductor Equipment, Inc.)
William E. WilsonPresident, Microsource, Inc.
H E A D Q U A R T E R S
Giga-tronics IncorporatedGeorge H. Bruns, Jr.Chairman and Chief Executive Officer4650 Norris Canyon RoadSan Ramon, CA 94583(925) 328-4650(925) 328-4700 (FAX)
www.gigatronics.com
S U B S I D I A R I E S
ASCOR, Inc.4384 Enterprise PlaceFremont, CA 94539(510) 490-2300(510) 490-8493 (FAX)
www.ascor-inc.com
Microsource, Inc.1269 Corporate Center ParkwaySanta Rosa, CA 95407(707) 527-7010(707) 527-7176 (FAX)
www.microsource-inc.com
DYMATIX(Ultracision, Inc. and Viking Semiconductor Equipment. Inc.)3380 Montgomery DriveSanta Clara, CA 95054(408) 980-0666(408) 980-0670 (FAX)
www.dymatix.com

L E G A L C O U N S E L
McCutchen, Doyle, Brown & Enerson, LLPThree Embarcadero Center18th FloorSan Francisco, CA 94111www.mccutchen.com
T R A N S F E R A G E N T
Mellon Shareholder Services LLC253 Montgomery Street, 23rd FloorSan Francisco, CA 94104www.melloninvestor.com
I N D E P E N D E N T A U D I T O R S
KPMG LLP500 East Middlefield RoadMountain View, CA 94043www.kpmg.com
A N N U A L M E E T I N G
The Company’s Annual Meeting of Shareholderswill be held at 9:30 a.m. on August 30, 2001 atGiga-tronics’ offices located at 4650 Norris CanyonRoad, San Ramon, CA 94583.
F O R M 1 0 - K
A copy of the Company’s Annual Report on Form 10-K for 2001, filed with the Securities and Exchange Commission, may be obtained by shareholders without charge by a written request to:
Company Secretary4650 Norris Canyon RoadSan Ramon, CA 94583
C O R P O R A T E I N F O R M A T I O N

Giga-tronics Incorporated4650 Norris Canyon RoadSan Ramon, CA 94583
(925) 328-4650(925) 328-4700 (FAX)www.gigatronics.com