Embed Size (px)
Citation preview

S:\EOG2001Bulletin 1
2000-2001 End-of-Grade Multiple-Choice Test Results October 16, 2001
Authors: Chuck Dulaney and Glenda Burch
Districtwide Results WCPSS EOG multiple-choice results for 2000-2001 showed increases at all grade levels in both proficiency and average scale score in reading. In math, results show increases in proficiency at all grade levels. Math scale score ranges were recalculated by NCDPI for 2001 and comparisons to previous years are not valid.
• More than 90% of students scored at or above grade level in reading in grades 5 and 8 and in math in grades 4 and 5.
• More than 85% of students scored at or above grade level in reading in grades 3, 4, 5, 7, and 8 and in math in grades 4-8.
• No grade level showed a decrease.
Achievement Over Time The percentage of students meeting or exceeding grade level standards in reading and math in all grade levels are the highest WCPSS students have ever achieved (see figures 1-4). Average reading scale scores also reached new highs in all grade levels (see figures 5 and 6).
Disaggregated Results Gains in reading were shown by almost all race and gender groups at all grade levels. At grade 7, slight decreases were seen for female, Asian, Hispanic, and multiracial groups. The largest gains were made by previously lower-performing groups. (See figures 7-12 on pages 5 and 6). For example, the percentage of Black students in grade 4 meeting or exceeding grade level standards in reading rose from 57.4% in 2000 to 65.3% in 2001. The percentage of Black students in grade 5 meeting or exceeding grade level
Background Wake County Public School System (WCPSS) students took the North Carolina End-of-Grade (EOG) multiple-choice tests during the months of May and June. Traditional calendar schools tested the week of May 22-26 and year-round schools tested the week of June 19-23. The EOG tests have several components including: computer skills, open-ended tests, multiple-choice tests, and the writing assessment. All EOG tests are designed to measure student achievement of the knowledge and skills of the North Carolina Standard Course of Study for students in grades three through eight. The multiple-choice tests are required in reading and math and are optional in social studies and science. During the May/June 2001 administration, WCPSS students took the reading and math multiple-choice tests. The EOG tests are a vital part of the North Carolina Annual Testing Program. They are the basis for the accountability program referred to as “ABCs”—Accountability, Basics, and Control. The goal of the ABCs is to hold individual schools accountable for student achievement in the basic subjects of reading and math. Under this program, test scores will be the basis for rewards or corrective action for individual schools.
E&R Report No. 01.37

S:\EOG2001Bulletin 2
standards rose from 68.9% in 2000 to 76.8% in 2001. The percentage of Hispanic students at or above grade level in reading rose from 65.4% in 2000 to 74.5% in grade 3, and from 66.7% to 79.9% in grade 8. Students received free or reduced lunch showed improvements in reading at all grade levels, ranging from a 1.5 percentage point increase at grade 7 to an 8.9 percentage point increase at grade 5. Math gains were greater than reading gains in 2001. Eighth-grade Hispanic students showed an 11.6 point gain in the percentage of students at or above grade level from 2000 to 2001. Black students showed gains ranging from 2.3 percentage points at grade 8 to 8.2 percentage points at grade 3. Grade 7 showed a very small drop in percent at grade level for students not receiving free lunch (-.3), Asian students (-.9), Hispanic students (-1.2) and multiracial students (-6.0).
Achievement Level Scores
The achievement level score attempts to categorize student achievement according to four broad levels, defined by the North Carolina Department of Public Instruction (NCDPI) as follows: Achievement Levels Level I: Students performing at this level do not have sufficient mastery of knowledge and skills in this subject area to be successful at the next grade level. Level II: Students performing at this level demonstrate inconsistent mastery of knowledge and skills in this subject area, and are minimally prepared to be successful at the next grade level.
Level III: Students performing at this level consistently demonstrate mastery of grade level subject matter and skills and are well prepared for the next grade level. Level IV: Students performing at this level consistently perform in a superior manner clearly beyond that required to be proficient at grade level work.
One important way of examining test scores is to follow the progress of a cohort of students over time. The shaded and unshaded boxes in the tables below show the scores of cohorts of students. For example, one cohort of students was in 3rd grade in 1996 and completed 8th grade in 2001. Over time the percentage of students in that cohort who were in levels III and IV and therefore considered to be “at or above grade level” in reading increased from 76.3% to 90.6%.
Figure 1 WCPSS Reading Achievement Levels Over Time
Percentage of Students at Levels III and IV
Grade 1995 1996 1997 1998 1999 2000 2001 3 74.4 76.3 75.3 79.3 80.4 83.1 85.3 4 75.2 79.9 78.7 80.3 80.8 81.6 85.9 5 79.6 77.7 80.3 84.3 84.8 87.7 90.8 6 76.8 78.8 77.8 78.8 80.7 77.9 80.7 7 80.2 78.1 78.6 80.5 84.9 84.4 85.1 8 84.0 82.8 83.3 86.4 87.1 88.7 90.6

S:\EOG2001Bulletin 3
Figure 2 WCPSS Mathematics Achievement Levels Over Time
Percentage of Students at Levels III and IV
Grade 1995 1996 1997 1998 1999 2000 2001 3 73.5 76.9 76.8 75.4 77.1 80.0 84.0 4 78.0 79.6 83.3 84.1 88.1 89.2 92.7 5 77.2 78.3 80.2 84.0 87.0 88.9 92.1 6 80.1 80.7 79.7 82.7 84.8 85.3 88.1 7 81.0 80.2 81.0 83.7 87.3 86.8 87.6 8 83.2 80.6 79.0 83.2 83.8 85.7 86.9
Math achievement for the cohort of students that was in 3rd grade in 1996 and completed 8th grade in 2001 also shows the pattern of improvement over time. The percentage of students in that cohort who were in levels III and IV and therefore considered to be “at or above grade level” in math increased from 76.9% to 86.9%. Changes Within Grade Levels Over Time By comparing scores for a grade level to scores achieved in previous years, we see some indication of instructional changes over time, although it must be noted that different groups of students are in each grade level each year. The following graphs show changes within each grade level over the past seven years.
Figure 3 Percent of WCPSS Students in Levels III and IV in Reading
����������������������������
��������������������������������
���������������������������������������������
��������������������������������
������������������������������������
��������������������������������������������������
��������������������������������
���������������������������������������������
��������������������������������
������������������������������������
����������������������������������������
����������������������������������������
������������������������������������
���������������������������������������������
����������������������������������������
������������������������������������
���������������������������������������������
��������������������������������������������
����������������������������������������
���������������������������������������������
��������������������������������������������
��������������������������������
����������������������������������������
�������������������������������������������������������
85.3 85.9
90.8
80.7
85.1
90.6
50556065707580859095
3 4 5 6 7 8
Grade Level
Perc
ent a
t Lev
el II
I or
IV
�������� 1995�������� 1996
1997����19981999
����20002001
As shown in Figure 3, grades 3, 4, 5, and 8 have shown steady improvement over the past five years, while gains in grade 6 and 7 have been less even. The percentage of students scoring at or above grade level in reading in grades 6 and 7 has not shown significant increases during the past three years.

S:\EOG2001Bulletin 4
Figure 4 Percent of WCPSS Students in Levels III and IV in Mathematics
����������������������������
���������������������������������������������
��������������������������������
���������������������������������������������
������������������������������������
��������������������������������������������������
����������������������������������������
������������������������������������
���������������������������������������������
������������������������������������
���������������������������������������������
������������������������������������
����������������������������������������
����������������������������������������
��������������������������������������������������
����������������������������������������
��������������������������������������������������
����������������������������������������
���������������������������������������������
������������������������������������������������
�������������������������������������������������������
��������������������������������������������
�������������������������������������������������������
��������������������������������������������
84.0
92.7 92.188.1 87.6 86.9
50556065707580859095
3 4 5 6 7 8
Grade Level
Perc
ent a
t Lev
el II
I or
IV����
1995�������� 1996
1997����
19981999����
���� 20002001
In mathematics, steady increases in the percentage of students on grade level can be seen in grades 3, 4, 5, 6, and 8. The percentage of students on grade level in grade seven for the past three years has not increased. Scale Scores The EOG scale score was developed by staff at the Thurstone Psychometric Laboratory at UNC-Chapel Hill. Scale scores cover the entire span from grade 3 through grade 10, and are designed to show growth over time. The scales were originally designed to begin near 100 and end near 200 with a mean of approximately 150 (anchored at the fifth grade). Mean (average) scale scores for cohorts are expected to increase as students move through grade levels and are an important way to track group changes from year to year. A new math scale was developed by NCDPI and used for reporting results on new math tests implemented in 2000-2001. The new scale range goes from approximately 211 to 310. As shown in Figures 5 & 6, average reading scores in 2001 were the highest they have ever been at all grade levels. Because the range used for calculating math scores changed in 2001, comparisons to previous years are not valid.
Figure 5 WCPSS Reading Scale Score Means Over Time
Grade 1995 1996 1997 1998 1999 2000 2001 3 146.7 147.0 146.9 148.2 148.7 149.6 150.2 4 150.8 151.7 151.6 152.4 152.3 152.9 154.1 5 155.4 155.0 155.9 157.2 157.1 158.4 159.0 6 157.3 158.4 158.6 158.5 159.4 158.9 159.8 7 161.1 160.8 161.0 161.7 162.4 162.4 162.7 8 163.2 162.9 163.6 164.4 164.7 165.0 165.8

S:\EOG2001Bulletin 5
Figure 6 WCPSS Math Scale Score Means Over Time
Grade 1995 1996 1997 1998 1999 2000 *2001 3 143.8 144.7 145.3 144.9 145.3 146.8 253.7 4 151.4 151.4 152.6 154.0 155.0 155.9 259.1 5 158.1 158.2 159.5 160.1 161.9 163.0 263.8 6 164.4 164.9 165.1 166.1 167.1 167.8 266.1 7 171.1 170.7 171.8 172.5 173.7 174.2 270.5 8 176.1 175.5 175.4 177.4 177.5 178.4 273.7
* Note: Math scale score ranges were recalculated by NCDPI in 2001. Comparisons to previous years are not valid.
Disaggregated Results
WCPSS disaggregates results for different groups of students. The most common groupings are race and gender, and the following tables (Figures 7-12) show three years of results for the major demographic student groups. Disaggregated test results by school are included in the annual volume of School Profiles.
Figure 7
2001 End-of-Grade Reading Results For WCPSS (Percentage Of Students Who Scored At Level III And Level IV)
Category Gd. 3 Gd. 4 Gd. 5 Gd. 6 Gd. 7 Gd. 8
Total System 85.3 85.9 90.8 80.7 85.1 90.6
Not F/R 91.8 92.4 95.1 88.6 91.0 95.0
F/R Lunch 64.7 62.9 73.9 51.4 58.5 68.6
Male 83.5 84.5 89.8 78.7 83.7 88.9
Female 87.1 87.3 91.8 82.8 86.5 92.3
White 93.8 94.7 96.7 91.3 93.9 96.4
Black 65.9 65.3 76.9 9
56.7 64.2 76.1
Asian 94.5 94.2 95.6 94.2 91.6 94.7
Hispanic 74.5 71.7 76.2 59.1 68.8 79.9
Multiracial 85.6 88.1 93.3 85.7 86.7 94.4

S:\EOG2001Bulletin 6
Figure 8
2000 End-of-Grade Reading Results For WCPSS
(Percentage Of Students Who Scored At Level III And Level IV) Category Gd. 3 Gd. 4 Gd. 5 Gd. 6 Gd. 7 Gd. 8
All Students 83.1 81.6 87.7 77.9 84.4 88.7 Not F/R 90.9 89.2 93.8 85.7 91.0 93.2
F/R Lunch 57.5 54.7 65.0 46.8 57.0 66.6
Male 80.7 79.0 86.1 74.7 81.9 86.4 Female 85.7 84.5 89.4 81.2 87.0 91.3 White 92.6 91.1 95.0 88.6 93.5 95.1 Black 60.4 57.5 68.8 52.8 61.8 73.2 Asian 93.0 92.8 95.3 84.5 92.9 92.9
Hispanic 65.4 68.2 73.4 56.9 70.6 66.7
Multiracial 84.3 81.2 91.8 78.2 87.7 85.9
Figure 9
1999 End-of-Grade Reading Results For WCPSS
(Percentage Of Students Who Scored At Level III And Level IV) Category Gd. 3 Gd. 4 Gd. 5 Gd. 6 Gd. 7 Gd. 8
All Students 80.4 80.8 84.8 80.7 84.9 87.1 Not F/R 88.6 88.7 91.3 88.8 90.8 92.2
F/R Lunch 53.8 53.3 60.1 51.6 60.1 61.5
Male 78.2 79.0 83.6 78.7 83.0 85.4 Female 82.8 82.8 86.2 83.0 87.0 88.9 White 89.5 89.8 93.0 90.4 93.1 94.5 Black 57.7 56.5 63.8 57.1 64.5 66.3 Asian 89.5 89.6 93.1 93.3 89.4 92.2
Hispanic 62.9 65.9 70.1 67.5 65.3 75.4
Multiracial 84.5 90.0 75.7 87.3 81.6 82.9

S:\EOG2001Bulletin 7
Figure 10
2001 End-Of-Grade Mathematics Results For WCPSS
(Percentage Of Students Who Scored At Level III And Level IV) Category Gd. 3 Gd. 4 Gd. 5 Gd. 6 Gd. 7 Gd. 8
Total System 84.0 92.7 92.1 88.1 87.6 86.9
Not F/R 91.0 96.5 95.7 93.9 92.5 91.7
F/R Lunch 61.9 79.2 77.7 66.6 65.7 63.1
Male 83.5 92.6 91.2 87.8 87.0 85.9
Female 84.5 92.7 92.9 88.5 88.3 87.9
White 94.4 98.0 97.4 95.8 95.2 94.3
Black 60.0 79.1 78.4 70.8 69.5 67.8
Asian 93.9 99.0 98.0 96.9 95.1 95.5
Hispanic 75.3 87.4 85.6 74.5 73.2 77.1
Multiracial 81.3 93.2 94.8 88.4 87.8 86.1
Figure 11
2000 End-Of-Grade Mathematics Results For WCPSS
(Percentage Of Students Who Scored At Level III And Level IV) Category Gd. 3 Gd. 4 Gd. 5 Gd. 6 Gd. 7 Gd. 8
Total System 80.0 89.2 88.9 85.4 86.8 85.8 Not F/R 88.4 94.6 94.0 91.6 92.8 90.6 F/R Lunch 52.1 70.3 69.9 60.6 61.8 61.8 Male 79.8 88.9 88.2 83.7 86.1 84.2 Female 80.2 89.6 89.6 87.1 87.6 87.4 White 91.4 95.7 95.4 93.7 94.8 93.6 Black 51.8 72.2 71.8 65.0 66.8 65.5 Asian 94.8 97.1 96.9 95.6 96.0 93.8 Hispanic 65.9 83.7 78.5 70.7 74.4 65.5 Multiracial 75.2 87.6 88.2 85.2 93.8 79.7

S:\EOG2001Bulletin 8
Figure 12
1999 End-Of-Grade Mathematics Results For WCPSS (Percentage Of Students Who Scored At Level III And Level IV)
Category Gd. 3 Gd. 4 Gd. 5 Gd. 6 Gd. 7 Gd. 8
Total System 77.1 88.1 87.0 84.8 87.4 83.9 Not F/R 86.3 94.1 92.9 91.8 92.6 89.6 F/R Lunch 47.5 67.2 64.3 59.4 64.7 54.8 Male 76.6 88.4 86.7 83.8 86.5 83.2 Female 77.7 87.9 87.2 85.9 88.2 84.6 White 87.7 95.3 94.6 93.5 94.4 93.1 Black 49.7 68.8 66.8 63.6 68.6 57.2 Asian 94.0 95.6 95.7 95.4 95.6 95.0 Hispanic 63.1 78.8 75.9 73.2 74.4 70.4 Multiracial 74.4 90.0 82.1 88.9 87.8 82.5
As shown in the preceding tables and illustrated below, significant gaps persist over time when achievement is disaggregated by race and gender, although the gap sometimes narrows as cohorts progress through the system. Figures 13 and 14 show reading and math performance for Black and White students across four years and the gap appears to have narrowed more in 2001 than in previous years.
Figure 13 Reading Percent At/Above Grade Level by Race
The 2000-2001 8th-grade Cohort over Time
93 9496
62
57
62
76
90
40
50
60
70
80
90
100
Grade 5 - 1998 Grade 6 - 1999 Grade 7 - 2000 Grade 8 - 2001
Perc
ent A
t/Abo
ve G
rade
Lev
el
White
Black
S:\EOG2001Bulletin 9
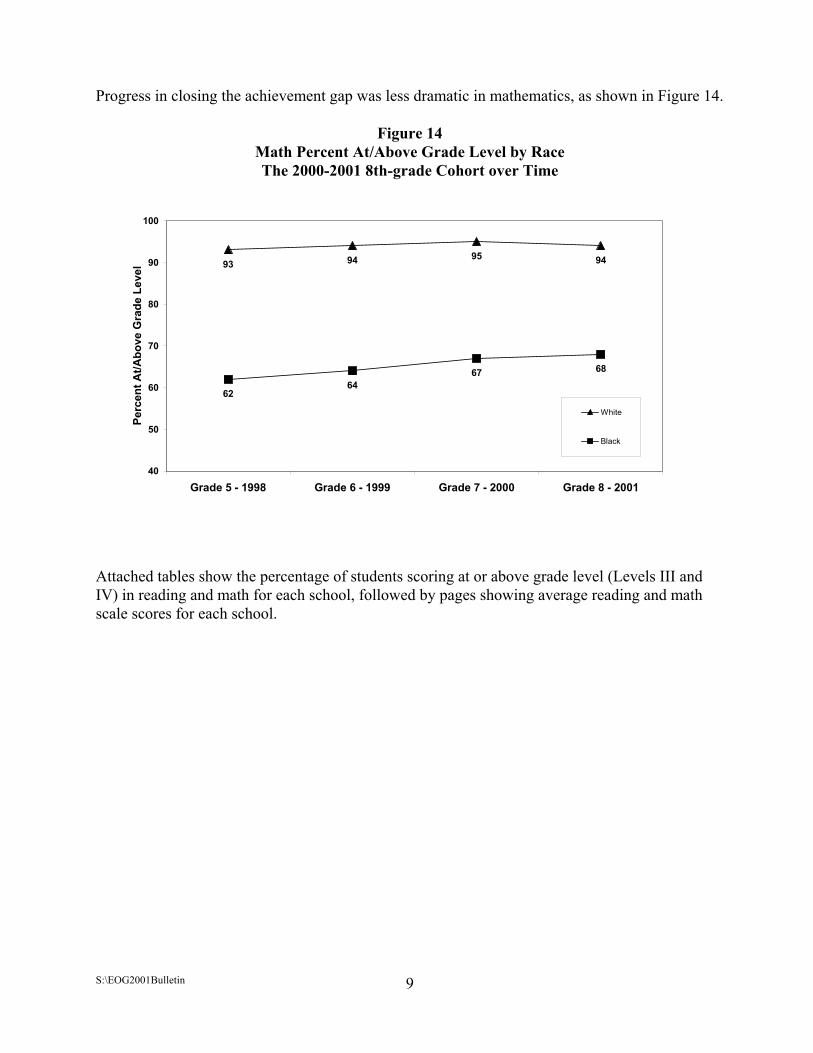
Progress in closing the achievement gap was less dramatic in mathematics, as shown in Figure 14.
Figure 14 Math Percent At/Above Grade Level by Race The 2000-2001 8th-grade Cohort over Time
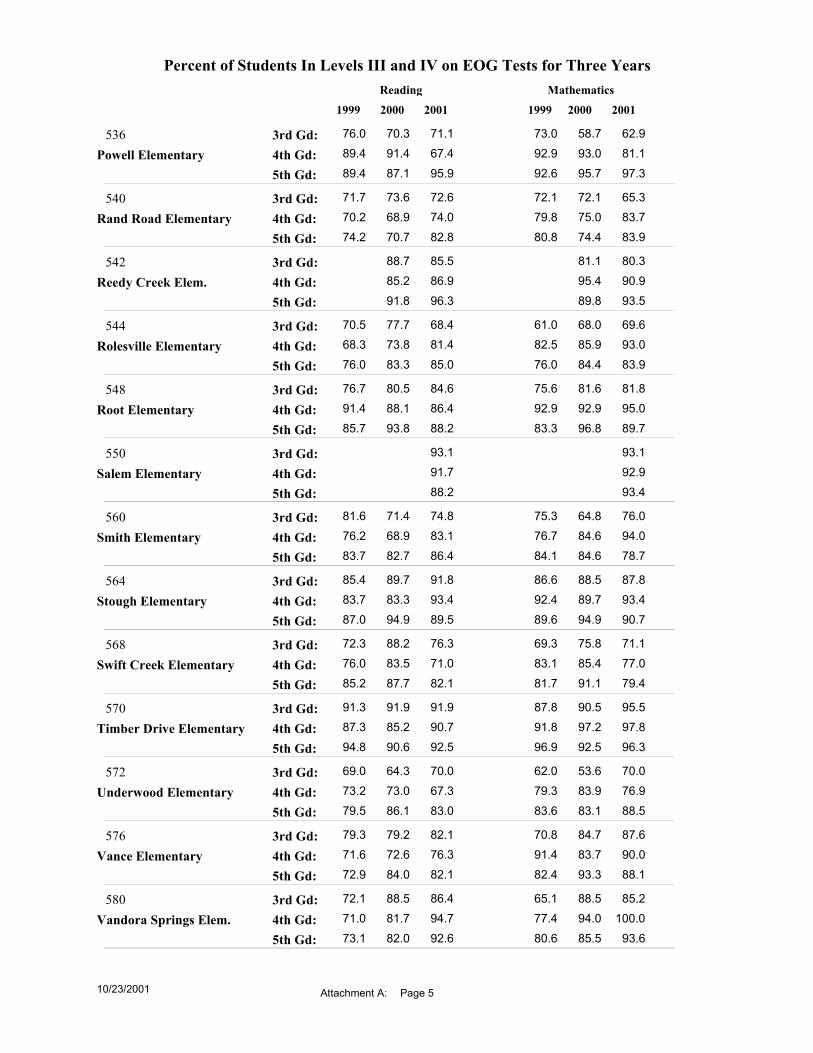
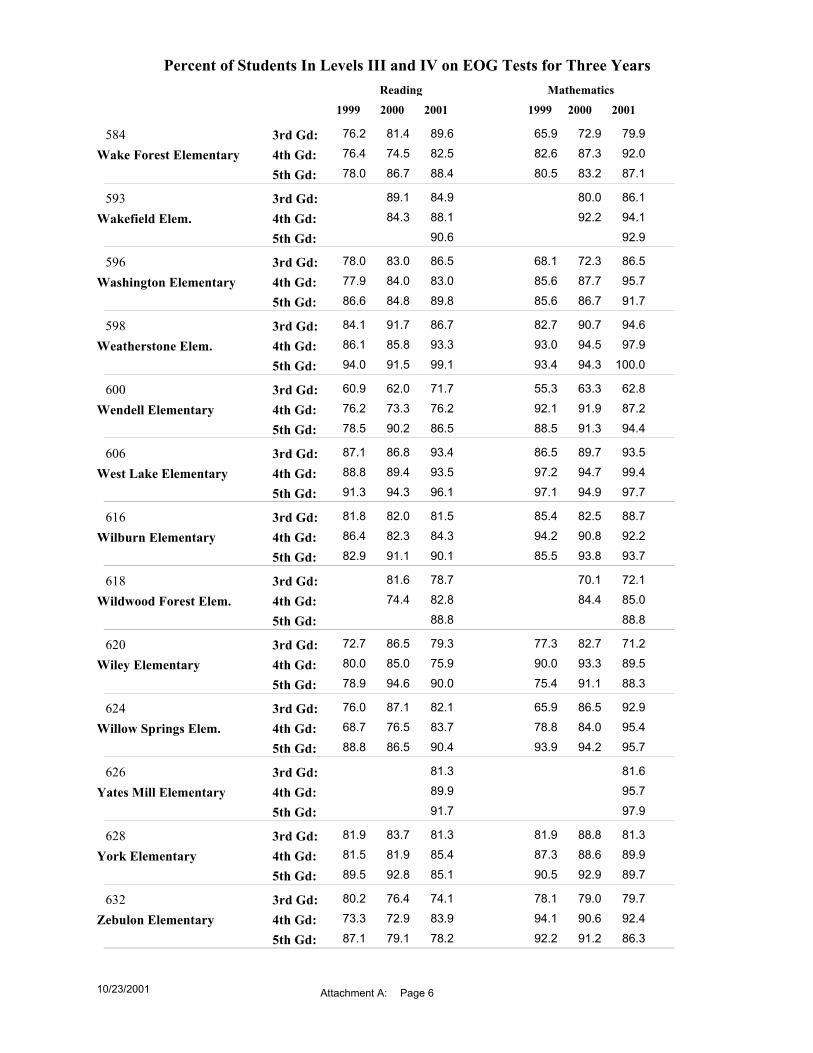
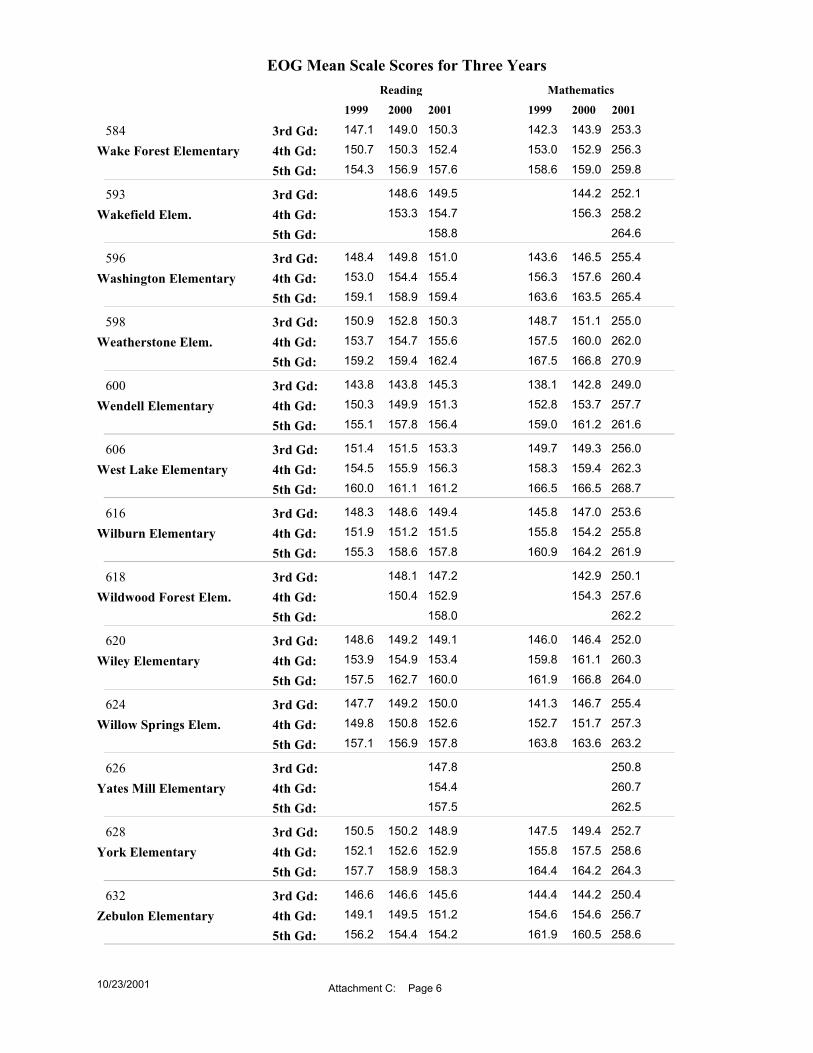
Attached tables show the percentage of students scoring at or above grade level (Levels III and IV) in reading and math for each school, followed by pages showing average reading and math scale scores for each school.
9395 94
6264
67 68
94
40
50
60
70
80
90
100
Grade 5 - 1998 Grade 6 - 1999 Grade 7 - 2000 Grade 8 - 2001
Perc
ent A
t/Abo
ve G
rade
Lev
el
White
Black

Percent of Students In Levels III and IV on EOG Tests for Three YearsReading Mathematics
20001999 2001200019992001
Adams Elementary304 87.886.33rd Gd:
4th Gd:5th Gd:
89.586.794.590.1
89.993.193.2
88.878.793.490.895.989.2
89.996.094.5
Apex Elementary308 88.589.73rd Gd:
4th Gd:5th Gd:
92.888.588.894.1
91.593.997.8
87.984.895.394.392.095.9
93.996.996.8
Aversboro Elementary320 79.579.53rd Gd:
4th Gd:5th Gd:
60.584.083.173.5
78.966.774.4
72.274.779.588.270.578.3
70.487.778.2
Baileywick Elementary326 90.485.63rd Gd:
4th Gd:5th Gd:
84.680.294.781.3
89.084.293.9
84.675.389.490.191.582.3
89.093.792.9
Baucom Elementary328 95.991.93rd Gd:
4th Gd:5th Gd:
90.990.192.593.1
94.192.698.6
90.787.695.794.395.991.7
90.495.999.3
Brassfield Elementary334 88.380.83rd Gd:
4th Gd:5th Gd:
87.287.490.189.4
93.894.798.7
90.377.796.887.491.492.7
98.496.198.7
Brentwood Elementary336 73.964.33rd Gd:
4th Gd:5th Gd:
62.880.377.576.3
70.670.779.5
70.263.593.083.891.585.7
63.577.396.4
Briarcliff Elementary340 91.078.73rd Gd:
4th Gd:5th Gd:
78.983.889.885.5
91.391.296.3
91.080.984.483.890.884.6
85.994.595.1
Brooks Elementary344 65.472.43rd Gd:
4th Gd:5th Gd:
62.171.977.588.0
77.376.891.2
69.269.768.276.479.886.7
69.788.491.2
Bugg Elementary352 85.583.33rd Gd:
4th Gd:5th Gd:
82.579.082.179.4
89.989.789.0
80.383.383.885.278.665.1
82.698.585.4
Carver Elementary362 75.562.03rd Gd:
4th Gd:5th Gd:
64.665.977.065.6
80.978.682.4
72.862.083.971.880.078.7
75.996.692.6
Cary Elementary364 71.580.83rd Gd:
4th Gd:5th Gd:
75.765.079.580.9
76.573.384.5
65.978.381.879.687.684.3
75.982.690.6
Combs Elementary376 83.388.53rd Gd:
4th Gd:5th Gd:
98.676.090.487.9
89.293.396.3
86.386.2100.093.3
91.8100.0
89.2100.0
95.0
10/23/2001 Page 1Attachment A:

Percent of Students In Levels III and IV on EOG Tests for Three YearsReading Mathematics
20001999 2001200019992001
Conn Elementary380 58.574.13rd Gd:
4th Gd:5th Gd:
78.978.978.373.5
73.564.685.9
58.572.978.985.785.577.1
72.384.890.2
Creech Road Elementary384 51.168.03rd Gd:
4th Gd:5th Gd:
57.365.171.774.0
84.282.285.2
41.557.377.680.075.081.3
75.090.576.5
Davis Drive Elementary390 98.394.23rd Gd:
4th Gd:5th Gd:
97.696.098.295.9
96.597.798.8
97.194.898.899.4
100.097.7
97.0100.0
98.8
Dillard Dr. Elementary393 81.83rd Gd:
4th Gd:5th Gd:
84.187.6
88.188.789.1
76.992.187.6
89.094.990.1
Douglas Elementary396 77.079.43rd Gd:
4th Gd:5th Gd:
86.283.886.281.0
79.486.788.7
55.469.691.280.983.375.9
76.288.087.3
Durant Road Elementary398 88.686.43rd Gd:
4th Gd:5th Gd:
94.091.297.690.8
93.192.297.6
83.787.098.296.596.598.3
96.995.298.8
Farmington Woods Elementa414 78.874.33rd Gd:
4th Gd:5th Gd:
79.778.083.382.5
84.485.488.5
72.073.785.883.779.087.2
85.692.391.2
Fox Road Elementary415 82.778.93rd Gd:
4th Gd:5th Gd:
82.475.488.687.8
89.786.291.9
70.376.284.985.285.993.2
79.594.391.1
Fuller Elementary416 79.772.53rd Gd:
4th Gd:5th Gd:
73.574.775.075.3
82.488.485.1
72.567.977.481.373.867.4
76.587.073.8
Fuquay-Varina Elementary420 74.864.93rd Gd:
4th Gd:5th Gd:
63.570.177.982.0
78.783.983.7
73.356.575.981.085.083.2
83.794.785.1
Green Hope Elementary439 3rd Gd:
4th Gd:5th Gd:
94.399.098.3
97.199.0
100.0
Green Elementary440 91.487.93rd Gd:
4th Gd:5th Gd:
83.684.791.582.8
90.091.690.1
87.683.093.894.693.188.2
94.296.295.4
Hilburn Drive Elementary442 88.484.33rd Gd:
4th Gd:5th Gd:
76.788.8
90.984.692.0
82.682.084.488.8
90.990.694.3
10/23/2001 Page 2Attachment A:

Percent of Students In Levels III and IV on EOG Tests for Three YearsReading Mathematics
20001999 2001200019992001
Hodge Road Elementary446 66.764.13rd Gd:
4th Gd:5th Gd:
66.068.277.869.2
77.275.785.6
62.264.882.088.377.170.1
72.085.284.0
Holly Springs Elementary447 76.281.13rd Gd:
4th Gd:5th Gd:
83.373.985.076.7
82.885.490.2
78.577.992.486.394.085.4
83.093.592.2
Hunter Elementary448 89.379.43rd Gd:
4th Gd:5th Gd:
82.190.592.482.8
82.981.693.3
85.176.285.488.891.680.5
85.690.390.8
Jeffreys Grove Elementary452 86.580.23rd Gd:
4th Gd:5th Gd:
85.780.485.484.5
83.788.587.9
85.673.690.185.384.577.3
80.696.290.1
Jones Dairy Elementary454 90.382.83rd Gd:
4th Gd:5th Gd:
85.189.394.386.3
88.792.391.0
89.785.292.697.395.388.8
87.994.995.9
Joyner Elementary456 78.778.53rd Gd:
4th Gd:5th Gd:
74.576.089.192.9
82.682.486.4
73.776.383.390.087.389.5
78.285.187.5
Kingswood Elementary460 96.489.23rd Gd:
4th Gd:5th Gd:
92.488.698.594.7
93.292.698.1
100.093.298.597.1
100.098.2
95.5100.0100.0
Knightdale Elementary464 63.476.73rd Gd:
4th Gd:5th Gd:
78.660.673.772.9
79.173.087.4
57.161.279.777.865.776.9
70.486.588.2
Lacy Elementary468 80.680.43rd Gd:
4th Gd:5th Gd:
85.777.887.188.3
79.181.194.0
72.576.787.986.985.190.2
91.988.498.8
Leesville Road Elementary469 77.63rd Gd:
4th Gd:5th Gd:
90.782.091.587.2
94.792.599.0
77.697.388.891.589.6
91.597.096.9
Lead Mine Elementary470 89.283.13rd Gd:
4th Gd:5th Gd:
84.383.589.185.7
83.886.491.4
87.877.789.887.091.483.9
82.190.095.1
Lincoln Heights Elementary476 72.970.53rd Gd:
4th Gd:5th Gd:
69.076.681.785.9
80.392.985.1
75.957.574.575.675.389.2
82.793.088.8
Lockhart Elementary480 75.565.13rd Gd:
4th Gd:5th Gd:
79.868.486.980.4
87.689.695.3
77.860.689.468.483.576.5
81.797.089.7
10/23/2001 Page 3Attachment A:

Percent of Students In Levels III and IV on EOG Tests for Three YearsReading Mathematics
20001999 2001200019992001
Lynn Road Elementary488 76.379.63rd Gd:
4th Gd:5th Gd:
78.479.879.883.5
84.884.984.8
75.878.589.788.578.082.8
73.990.988.2
Middle Creek Elementary494 3rd Gd:
4th Gd:5th Gd:
79.578.182.8
72.689.089.1
Millbrook Elementary496 73.576.03rd Gd:
4th Gd:5th Gd:
79.780.081.781.8
81.874.791.4
68.774.787.085.789.282.3
71.381.388.9
Morrisville Elementary504 97.598.23rd Gd:
4th Gd:5th Gd:
95.793.697.996.3
96.896.199.4
95.699.497.697.196.596.3
96.198.7
100.0
North Ridge Elementary516 92.380.23rd Gd:
4th Gd:5th Gd:
83.383.193.284.0
91.594.195.7
87.977.992.394.092.188.7
91.596.493.6
Northwoods Elementary520 84.991.13rd Gd:
4th Gd:5th Gd:
89.982.786.684.9
91.992.993.6
83.887.094.487.289.885.7
92.892.993.6
Oak Grove Elementary522 96.596.53rd Gd:
4th Gd:5th Gd:
92.995.097.595.7
95.194.696.9
95.994.795.298.298.598.8
96.398.297.6
Olive Chapel Elementary523 95.284.73rd Gd:
4th Gd:5th Gd:
85.087.491.488.6
90.796.991.9
91.091.093.293.391.490.4
93.597.794.6
Olds @ Cardinal Gibbons524 85.180.43rd Gd:
4th Gd:5th Gd:
75.085.792.287.7
81.884.082.9
93.673.992.598.296.191.2
78.896.095.1
Partnership Elementary525 91.43rd Gd:
4th Gd:5th Gd:
90.083.3
91.4 90.094.4
Penny Road Elemenary530 82.279.33rd Gd:
4th Gd:5th Gd:
83.776.588.389.4
89.177.897.7
82.277.591.383.289.289.4
83.791.996.6
Pleasant Union Elementary531 83.989.03rd Gd:
4th Gd:5th Gd:
90.195.796.493.4
91.391.195.2
79.893.695.097.993.796.7
95.295.594.4
Poe Elementary532 86.373.63rd Gd:
4th Gd:5th Gd:
71.7100.0100.0
83.378.792.1
75.564.282.6100.0
100.0
80.380.994.7
10/23/2001 Page 4Attachment A:
Percent of Students In Levels III and IV on EOG Tests for Three YearsReading Mathematics
20001999 2001200019992001
Powell Elementary536 70.376.03rd Gd:
4th Gd:5th Gd:
91.489.487.189.4
71.167.495.9
58.773.093.092.995.792.6
62.981.197.3
Rand Road Elementary540 73.671.73rd Gd:
4th Gd:5th Gd:
68.970.270.774.2
72.674.082.8
72.172.175.079.874.480.8
65.383.783.9
Reedy Creek Elem.542 88.73rd Gd:
4th Gd:5th Gd:
85.291.8
85.586.996.3
81.195.489.8
80.390.993.5
Rolesville Elementary544 77.770.53rd Gd:
4th Gd:5th Gd:
73.868.383.376.0
68.481.485.0
68.061.085.982.584.476.0
69.693.083.9
Root Elementary548 80.576.73rd Gd:
4th Gd:5th Gd:
88.191.493.885.7
84.686.488.2
81.675.692.992.996.883.3
81.895.089.7
Salem Elementary550 3rd Gd:
4th Gd:5th Gd:
93.191.788.2
93.192.993.4
Smith Elementary560 71.481.63rd Gd:
4th Gd:5th Gd:
68.976.282.783.7
74.883.186.4
64.875.384.676.784.684.1
76.094.078.7
Stough Elementary564 89.785.43rd Gd:
4th Gd:5th Gd:
83.383.794.987.0
91.893.489.5
88.586.689.792.494.989.6
87.893.490.7
Swift Creek Elementary568 88.272.33rd Gd:
4th Gd:5th Gd:
83.576.087.785.2
76.371.082.1
75.869.385.483.191.181.7
71.177.079.4
Timber Drive Elementary570 91.991.33rd Gd:
4th Gd:5th Gd:
85.287.390.694.8
91.990.792.5
90.587.897.291.892.596.9
95.597.896.3
Underwood Elementary572 64.369.03rd Gd:
4th Gd:5th Gd:
73.073.286.179.5
70.067.383.0
53.662.083.979.383.183.6
70.076.988.5
Vance Elementary576 79.279.33rd Gd:
4th Gd:5th Gd:
72.671.684.072.9
82.176.382.1
84.770.883.791.493.382.4
87.690.088.1
Vandora Springs Elem.580 88.572.13rd Gd:
4th Gd:5th Gd:
81.771.082.073.1
86.494.792.6
88.565.194.077.485.580.6
85.2100.0
93.6
10/23/2001 Page 5Attachment A:
Percent of Students In Levels III and IV on EOG Tests for Three YearsReading Mathematics
20001999 2001200019992001
Wake Forest Elementary584 81.476.23rd Gd:
4th Gd:5th Gd:
74.576.486.778.0
89.682.588.4
72.965.987.382.683.280.5
79.992.087.1
Wakefield Elem.593 89.13rd Gd:
4th Gd:5th Gd:
84.384.988.190.6
80.092.2
86.194.192.9
Washington Elementary596 83.078.03rd Gd:
4th Gd:5th Gd:
84.077.984.886.6
86.583.089.8
72.368.187.785.686.785.6
86.595.791.7
Weatherstone Elem.598 91.784.13rd Gd:
4th Gd:5th Gd:
85.886.191.594.0
86.793.399.1
90.782.794.593.094.393.4
94.697.9
100.0
Wendell Elementary600 62.060.93rd Gd:
4th Gd:5th Gd:
73.376.290.278.5
71.776.286.5
63.355.391.992.191.388.5
62.887.294.4
West Lake Elementary606 86.887.13rd Gd:
4th Gd:5th Gd:
89.488.894.391.3
93.493.596.1
89.786.594.797.294.997.1
93.599.497.7
Wilburn Elementary616 82.081.83rd Gd:
4th Gd:5th Gd:
82.386.491.182.9
81.584.390.1
82.585.490.894.293.885.5
88.792.293.7
Wildwood Forest Elem.618 81.63rd Gd:
4th Gd:5th Gd:
74.478.782.888.8
70.184.4
72.185.088.8
Wiley Elementary620 86.572.73rd Gd:
4th Gd:5th Gd:
85.080.094.678.9
79.375.990.0
82.777.393.390.091.175.4
71.289.588.3
Willow Springs Elem.624 87.176.03rd Gd:
4th Gd:5th Gd:
76.568.786.588.8
82.183.790.4
86.565.984.078.894.293.9
92.995.495.7
Yates Mill Elementary626 3rd Gd:
4th Gd:5th Gd:
81.389.991.7
81.695.797.9
York Elementary628 83.781.93rd Gd:
4th Gd:5th Gd:
81.981.592.889.5
81.385.485.1
88.881.988.687.392.990.5
81.389.989.7
Zebulon Elementary632 76.480.23rd Gd:
4th Gd:5th Gd:
72.973.379.187.1
74.183.978.2
79.078.190.694.191.292.2
79.792.486.3
10/23/2001 Page 6Attachment A:

Percent of Students In Levels III and IV on EOG Tests for Three YearsReading Mathematics
20001999 2001 20001999 2001
Apex Middle312 84.885.2 88.46th Gd:
7th Gd:8th Gd:
88.685.4 92.988.688.2 92.7
91.289.4 92.791.885.7 93.990.287.4 92.7
Carnage Middle356 72.576.1 73.66th Gd:
7th Gd:8th Gd:
76.678.7 75.584.781.8 85.4
80.382.3 81.684.181.5 76.079.779.5 83.7
Carroll Middle360 72.778.9 72.26th Gd:
7th Gd:8th Gd:
87.989.0 85.091.389.9 90.8
85.881.6 83.292.890.6 81.788.386.7 88.4
Centennial Middle370 83.16th Gd:
7th Gd:8th Gd:
75.988.9
87.178.680.8
Daniels Middle388 73.279.7 83.46th Gd:
7th Gd:8th Gd:
84.079.4 84.587.187.9 91.2
82.984.3 88.982.880.3 83.285.483.9 84.8
Davis Drive Middle391 90.191.0 90.86th Gd:
7th Gd:8th Gd:
91.589.8 92.493.294.4 95.0
92.190.1 95.493.692.5 95.192.790.8 93.5
Dillard Middle394 80.1 79.46th Gd:
7th Gd:8th Gd:
89.0 86.395.2
87.5 87.392.4 88.0
92.6
Durant Road Middle399 83.789.7 89.36th Gd:
7th Gd:8th Gd:
91.589.8 91.095.692.4 97.4
91.393.7 95.893.991.9 93.290.989.7 93.6
East Cary Middle400 77.479.8 79.36th Gd:
7th Gd:8th Gd:
83.793.4 85.993.294.2 89.2
87.085.7 88.086.592.6 88.491.092.8 90.8
East Garner Middle404 58.668.1 69.26th Gd:
7th Gd:8th Gd:
73.279.7 71.788.380.4 91.2
73.771.1 79.077.576.5 80.380.976.3 78.9
East Millbrook Middle408 68.779.4 77.06th Gd:
7th Gd:8th Gd:
81.279.6 77.183.379.9 86.2
73.076.4 81.978.579.3 83.476.567.2 74.9
East Wake Middle410 65.768.9 68.36th Gd:
7th Gd:8th Gd:
72.984.4 72.580.677.4 82.3
77.076.3 77.376.684.0 80.377.872.9 76.7
10/23/2001 Page 1Attachment B:

Percent of Students In Levels III and IV on EOG Tests for Three YearsReading Mathematics
20001999 2001 20001999 2001
Fuquay-Varina Middle424 75.570.8 70.76th Gd:
7th Gd:8th Gd:
79.579.9 85.583.779.4 87.6
82.582.4 85.281.180.2 84.978.177.0 81.4
Leesville Road Middle471 81.983.6 86.86th Gd:
7th Gd:8th Gd:
88.292.4 93.194.092.1 93.4
86.687.6 92.492.092.5 90.792.087.8 92.8
Ligon Middle472 85.387.3 87.76th Gd:
7th Gd:8th Gd:
92.082.9 90.587.586.1 95.8
89.789.1 92.690.988.1 95.582.581.0 92.8
Lufkin Rd. Middle484 93.5 92.06th Gd:
7th Gd:8th Gd:
96.094.3 96.7
98.4
Martin Middle492 81.883.0 82.26th Gd:
7th Gd:8th Gd:
83.587.3 88.589.090.9 90.0
89.089.6 89.686.790.5 90.086.987.4 86.4
North Garner Middle512 63.459.9 63.06th Gd:
7th Gd:8th Gd:
67.274.3 68.680.980.4 79.2
73.967.8 72.877.284.4 84.680.577.4 69.3
Wake Forest-Rolesville Mid.592 72.980.4 71.26th Gd:
7th Gd:8th Gd:
87.183.6 79.990.781.2 91.6
84.480.5 83.285.083.8 81.686.580.1 85.5
Wakefield Middle594 81.8 86.96th Gd:
7th Gd:8th Gd:
86.292.4 93.2
87.5
West Cary Middle604 79.788.3 83.96th Gd:
7th Gd:8th Gd:
91.289.0 89.990.988.8 93.5
90.090.9 90.790.792.2 90.590.684.6 94.4
West Lake Middle607 89.890.3 92.26th Gd:
7th Gd:8th Gd:
91.892.8 96.095.096.3 96.8
94.694.7 94.994.794.2 95.893.796.1 95.0
West Millbrook Middle608 77.576.1 88.76th Gd:
7th Gd:8th Gd:
85.078.2 86.785.291.2 92.4
84.175.4 92.785.385.1 93.383.689.4 90.4
Zebulon Middle636 67.568.4 68.96th Gd:
7th Gd:8th Gd:
77.775.6 75.286.077.6 83.5
73.277.0 84.084.190.1 79.379.273.3 84.3
10/23/2001 Page 2Attachment B:

EOG Mean Scale Scores for Three YearsReading Mathematics
20001999 2001 20001999 2001
Adams Elementary304 151.8149.73rd Gd:
4th Gd:5th Gd:
154.8154.0160.3158.0
152.9157.3160.3
149.7146.2159.2157.9166.2163.3
256.5263.8266.4
Apex Elementary308 153.0151.13rd Gd:
4th Gd:5th Gd:
156.5154.7160.9160.8
152.7157.0161.6
148.6147.7158.6157.0165.3166.1
256.6262.8267.6
Aversboro Elementary320 147.9145.83rd Gd:
4th Gd:5th Gd:
147.4151.5155.3153.4
148.2148.7153.6
143.9144.0150.7152.5156.2155.4
250.6254.7255.7
Baileywick Elementary326 151.6149.23rd Gd:
4th Gd:5th Gd:
152.9151.8160.0156.5
150.9154.7160.6
149.5144.7155.6153.6163.5161.3
255.1259.9265.8
Baucom Elementary328 153.9152.73rd Gd:
4th Gd:5th Gd:
156.4155.4161.2159.3
153.6156.9162.1
149.2149.2160.0158.0167.1164.5
255.6261.5268.3
Brassfield Elementary334 152.0148.83rd Gd:
4th Gd:5th Gd:
155.3154.4159.7158.6
155.4158.6163.0
151.3145.9160.9156.8165.1164.5
258.9265.7270.4
Brentwood Elementary336 145.0144.13rd Gd:
4th Gd:5th Gd:
147.2151.3155.4153.9
144.5147.9154.5
142.8141.4152.0153.9161.7157.4
249.6252.4260.4
Briarcliff Elementary340 152.5149.63rd Gd:
4th Gd:5th Gd:
152.2151.8159.0157.2
151.2156.1161.8
149.5146.6154.8152.4164.2160.7
253.6260.7265.2
Brooks Elementary344 144.5146.53rd Gd:
4th Gd:5th Gd:
148.0149.8156.5159.0
147.9150.9158.2
141.2142.2147.8150.6159.8162.6
250.0255.0261.6
Bugg Elementary352 150.7151.23rd Gd:
4th Gd:5th Gd:
152.6150.6156.4154.9
150.5155.9158.5
146.7146.6154.2151.7158.2153.9
252.4259.4261.1
Carver Elementary362 146.0142.13rd Gd:
4th Gd:5th Gd:
148.5148.7154.8152.2
147.1151.8155.2
142.9140.1153.0150.1161.1155.2
250.3257.6261.7
Cary Elementary364 146.9147.33rd Gd:
4th Gd:5th Gd:
151.3148.8156.0157.2
148.3151.2156.8
143.5144.5153.8151.4161.3163.5
251.4256.2261.2
Combs Elementary376 150.2151.13rd Gd:
4th Gd:5th Gd:
157.2151.4158.8158.3
152.9155.7160.9
149.2149.1161.2154.4165.2165.7
256.0263.3266.5
10/23/2001 Page 1Attachment C:

EOG Mean Scale Scores for Three YearsReading Mathematics
20001999 2001 20001999 2001
Conn Elementary380 144.5146.93rd Gd:
4th Gd:5th Gd:
152.2151.1155.4154.4
147.2149.4158.1
140.4143.3154.8152.8160.9159.9
250.7255.8262.4
Creech Road Elementary384 141.1143.83rd Gd:
4th Gd:5th Gd:
146.4146.7152.3153.5
146.2149.6154.5
136.2140.3149.8150.1154.6156.9
249.7255.3256.8
Davis Drive Elementary390 154.8153.93rd Gd:
4th Gd:5th Gd:
158.0156.9162.2160.9
154.7158.8163.2
155.2152.4162.1161.5168.4165.5
257.7265.1268.0
Dillard Dr. Elementary393 149.73rd Gd:
4th Gd:5th Gd:
154.8158.9
151.2155.0158.9
145.9159.4164.6
255.6259.3262.1
Douglas Elementary396 149.2147.53rd Gd:
4th Gd:5th Gd:
154.1151.9157.8155.6
148.3155.0159.4
142.8141.8155.6154.2160.7159.2
251.1257.9262.8
Durant Road Elementary398 150.9150.53rd Gd:
4th Gd:5th Gd:
155.3155.2161.3159.0
153.7155.4160.8
148.4147.3159.2159.0167.5166.0
257.0260.3268.1
Farmington Woods Elementa414 148.8148.13rd Gd:
4th Gd:5th Gd:
153.1151.6157.9157.3
151.3154.6159.3
144.6145.4154.4153.1160.2161.7
255.5260.0265.2
Fox Road Elementary415 148.7148.53rd Gd:
4th Gd:5th Gd:
151.8151.0157.4156.6
149.0152.3157.4
143.5143.7153.6152.6159.9161.2
252.0257.3261.0
Fuller Elementary416 148.6147.13rd Gd:
4th Gd:5th Gd:
151.6151.3156.6154.7
150.3154.7158.8
143.7141.5152.8152.2158.3156.7
252.1257.7260.3
Fuquay-Varina Elementary420 146.1144.33rd Gd:
4th Gd:5th Gd:
148.4149.2155.5155.6
147.7152.8156.1
143.2139.3151.2151.9161.2159.4
252.2258.4259.2
Green Hope Elementary439 3rd Gd:
4th Gd:5th Gd:
154.3159.6163.8
257.9265.7273.7
Green Elementary440 151.7150.63rd Gd:
4th Gd:5th Gd:
154.1152.6159.6156.6
152.4155.5159.4
149.0147.4157.4156.4166.1162.2
256.3261.5266.4
Hilburn Drive Elementary442 150.1149.73rd Gd:
4th Gd:5th Gd:
151.4158.4
151.4153.4160.6
147.3145.5152.4163.5
255.4258.9266.9
10/23/2001 Page 2Attachment C:

EOG Mean Scale Scores for Three YearsReading Mathematics
20001999 2001 20001999 2001
Hodge Road Elementary446 144.2143.53rd Gd:
4th Gd:5th Gd:
147.0147.3154.2152.2
147.3148.8154.5
139.9140.5149.9153.0157.4154.6
249.6253.2258.5
Holly Springs Elementary447 147.8148.83rd Gd:
4th Gd:5th Gd:
152.1151.3156.6154.6
148.8152.2157.8
145.5144.4155.9152.9162.3159.9
252.6258.1262.4
Hunter Elementary448 152.6149.93rd Gd:
4th Gd:5th Gd:
155.2157.5162.1158.1
150.9155.4161.5
149.4147.2157.6158.4166.1162.2
254.9260.0267.6
Jeffreys Grove Elementary452 151.7149.53rd Gd:
4th Gd:5th Gd:
155.4153.2158.7156.6
150.2155.7158.7
149.7145.4159.2156.7163.7160.5
254.3260.4264.2
Jones Dairy Elementary454 152.1150.73rd Gd:
4th Gd:5th Gd:
154.2153.6160.5159.3
150.7156.3159.3
149.0146.8156.5156.3164.8162.5
254.5260.2264.0
Joyner Elementary456 147.1147.63rd Gd:
4th Gd:5th Gd:
151.5151.7158.7159.7
149.4152.1157.0
144.7145.9152.9155.8162.8164.2
251.9255.9261.4
Kingswood Elementary460 154.5151.93rd Gd:
4th Gd:5th Gd:
155.8155.5162.2160.9
153.6157.2162.1
154.0150.3162.5160.9172.6171.4
256.4264.4273.1
Knightdale Elementary464 143.9145.43rd Gd:
4th Gd:5th Gd:
150.0146.1153.1153.0
146.1149.4156.1
138.3140.1150.4147.4154.0155.7
249.5253.6257.1
Lacy Elementary468 149.9149.73rd Gd:
4th Gd:5th Gd:
155.8153.0160.4159.2
150.4154.4161.8
146.4146.3157.8154.8162.5163.4
256.2259.3267.9
Leesville Road Elementary469 148.73rd Gd:
4th Gd:5th Gd:
155.0152.8160.4157.3
153.1157.4161.6
146.5158.6155.6167.0163.2
257.1262.3267.4
Lead Mine Elementary470 151.6149.23rd Gd:
4th Gd:5th Gd:
153.0152.9158.9157.1
150.2154.8160.3
149.4145.5155.6155.8163.5161.2
252.9259.6265.7
Lincoln Heights Elementary476 146.9145.43rd Gd:
4th Gd:5th Gd:
148.9149.6156.3156.5
148.2155.1157.0
145.0139.0151.2149.4158.2160.7
252.5257.7259.8
Lockhart Elementary480 147.6144.13rd Gd:
4th Gd:5th Gd:
151.3146.9156.6155.4
149.4154.3158.1
144.9140.0154.1146.5157.9158.4
251.4258.6261.1
10/23/2001 Page 3Attachment C:

EOG Mean Scale Scores for Three YearsReading Mathematics
20001999 2001 20001999 2001
Lynn Road Elementary488 148.6148.63rd Gd:
4th Gd:5th Gd:
151.9151.9156.3155.5
148.8153.2156.3
145.7146.3156.3154.9159.7159.9
251.6257.1260.9
Middle Creek Elementary494 3rd Gd:
4th Gd:5th Gd:
149.3150.9155.4
252.3255.8261.6
Millbrook Elementary496 146.0148.13rd Gd:
4th Gd:5th Gd:
151.6151.3157.1155.9
147.1150.5157.0
142.4144.1151.3151.4162.3157.8
249.7252.5259.6
Morrisville Elementary504 155.0154.63rd Gd:
4th Gd:5th Gd:
158.4156.5162.3160.4
154.8158.3163.1
154.3152.8162.0159.9168.0166.9
258.5263.8269.3
North Ridge Elementary516 152.5149.33rd Gd:
4th Gd:5th Gd:
152.5152.3158.6156.5
151.9156.1159.2
149.7144.6156.3155.1162.4160.6
254.0259.3262.7
Northwoods Elementary520 150.9150.83rd Gd:
4th Gd:5th Gd:
156.0153.5158.6158.3
152.0155.2160.7
148.4148.3161.1155.6164.0162.7
255.1259.3266.2
Oak Grove Elementary522 154.3153.43rd Gd:
4th Gd:5th Gd:
157.6157.5162.7161.2
154.4157.6163.2
152.7151.4160.4160.8169.3168.1
257.3264.2271.4
Olive Chapel Elementary523 152.3151.43rd Gd:
4th Gd:5th Gd:
154.4153.8159.6157.6
152.7157.2160.4
151.3150.4156.5155.8163.6161.8
256.7262.3264.7
Olds @ Cardinal Gibbons524 149.9148.13rd Gd:
4th Gd:5th Gd:
151.3156.2159.5158.8
147.8153.7157.7
149.8142.7157.5159.8165.1161.8
250.3260.6261.9
Partnership Elementary525 151.53rd Gd:
4th Gd:5th Gd:
152.6154.6
149.2 255.4259.5
Penny Road Elemenary530 149.9148.23rd Gd:
4th Gd:5th Gd:
153.1151.3160.3158.3
150.7151.3162.2
148.0145.5155.8153.7166.7165.1
254.2257.0267.9
Pleasant Union Elementary531 150.7151.73rd Gd:
4th Gd:5th Gd:
155.9156.8161.1159.5
152.5156.2160.2
147.6149.5156.6158.3162.5162.3
255.5260.1261.8
Poe Elementary532 149.9145.83rd Gd:
4th Gd:5th Gd:
150.4156.8166.0
150.7153.1157.5
146.3140.5152.3155.8167.4
253.4256.3260.6
10/23/2001 Page 4Attachment C:

EOG Mean Scale Scores for Three YearsReading Mathematics
20001999 2001 20001999 2001
Powell Elementary536 145.1147.03rd Gd:
4th Gd:5th Gd:
153.9153.4158.0157.9
146.8150.1159.0
141.1143.8156.8156.6164.9164.5
250.1253.7265.2
Rand Road Elementary540 146.1145.53rd Gd:
4th Gd:5th Gd:
148.4148.5153.6153.5
145.5150.2155.0
144.0143.2148.5151.2156.7158.4
249.5254.8258.4
Reedy Creek Elem.542 150.23rd Gd:
4th Gd:5th Gd:
153.1159.1
149.6152.9159.3
146.0156.4163.2
252.5258.1262.6
Rolesville Elementary544 146.5143.83rd Gd:
4th Gd:5th Gd:
149.3148.9155.6154.0
146.4150.2156.8
142.1139.6151.6151.1158.8156.0
250.1254.5258.5
Root Elementary548 148.7148.83rd Gd:
4th Gd:5th Gd:
156.4156.5160.7157.9
150.8155.4161.2
148.6145.7161.0158.7168.1162.2
254.2263.1267.0
Salem Elementary550 3rd Gd:
4th Gd:5th Gd:
154.1156.6158.6
257.2261.1263.4
Smith Elementary560 145.5147.03rd Gd:
4th Gd:5th Gd:
149.2149.7155.9155.3
145.8151.4155.2
142.2144.3152.9151.5157.5159.8
250.2256.4256.3
Stough Elementary564 151.4150.53rd Gd:
4th Gd:5th Gd:
153.4153.1159.3157.6
152.7155.5158.6
150.3148.9155.7156.6163.8163.1
256.5260.1262.6
Swift Creek Elementary568 149.0147.43rd Gd:
4th Gd:5th Gd:
153.3151.8158.7157.0
149.0150.6158.1
146.0142.9156.5154.0161.7159.7
252.7255.0260.4
Timber Drive Elementary570 152.4152.13rd Gd:
4th Gd:5th Gd:
154.2153.5158.6158.4
153.1155.8159.2
150.1149.7157.7156.1162.9165.1
257.3261.6264.6
Underwood Elementary572 143.6146.93rd Gd:
4th Gd:5th Gd:
151.3152.2159.0156.2
146.4149.6158.2
137.5141.8153.0152.3163.1163.4
250.7253.8264.6
Vance Elementary576 148.2147.23rd Gd:
4th Gd:5th Gd:
149.6150.7156.6152.9
148.0151.4156.3
145.9143.0154.1155.8161.8157.9
252.2257.5260.8
Vandora Springs Elem.580 149.3145.63rd Gd:
4th Gd:5th Gd:
151.0148.6155.5153.1
149.6154.7157.7
148.2142.0155.2152.2159.8159.3
254.0260.4261.1
10/23/2001 Page 5Attachment C:
EOG Mean Scale Scores for Three YearsReading Mathematics
20001999 2001 20001999 2001
Wake Forest Elementary584 149.0147.13rd Gd:
4th Gd:5th Gd:
150.3150.7156.9154.3
150.3152.4157.6
143.9142.3152.9153.0159.0158.6
253.3256.3259.8
Wakefield Elem.593 148.63rd Gd:
4th Gd:5th Gd:
153.3149.5154.7158.8
144.2156.3
252.1258.2264.6
Washington Elementary596 149.8148.43rd Gd:
4th Gd:5th Gd:
154.4153.0158.9159.1
151.0155.4159.4
146.5143.6157.6156.3163.5163.6
255.4260.4265.4
Weatherstone Elem.598 152.8150.93rd Gd:
4th Gd:5th Gd:
154.7153.7159.4159.2
150.3155.6162.4
151.1148.7160.0157.5166.8167.5
255.0262.0270.9
Wendell Elementary600 143.8143.83rd Gd:
4th Gd:5th Gd:
149.9150.3157.8155.1
145.3151.3156.4
142.8138.1153.7152.8161.2159.0
249.0257.7261.6
West Lake Elementary606 151.5151.43rd Gd:
4th Gd:5th Gd:
155.9154.5161.1160.0
153.3156.3161.2
149.3149.7159.4158.3166.5166.5
256.0262.3268.7
Wilburn Elementary616 148.6148.33rd Gd:
4th Gd:5th Gd:
151.2151.9158.6155.3
149.4151.5157.8
147.0145.8154.2155.8164.2160.9
253.6255.8261.9
Wildwood Forest Elem.618 148.13rd Gd:
4th Gd:5th Gd:
150.4147.2152.9158.0
142.9154.3
250.1257.6262.2
Wiley Elementary620 149.2148.63rd Gd:
4th Gd:5th Gd:
154.9153.9162.7157.5
149.1153.4160.0
146.4146.0161.1159.8166.8161.9
252.0260.3264.0
Willow Springs Elem.624 149.2147.73rd Gd:
4th Gd:5th Gd:
150.8149.8156.9157.1
150.0152.6157.8
146.7141.3151.7152.7163.6163.8
255.4257.3263.2
Yates Mill Elementary626 3rd Gd:
4th Gd:5th Gd:
147.8154.4157.5
250.8260.7262.5
York Elementary628 150.2150.53rd Gd:
4th Gd:5th Gd:
152.6152.1158.9157.7
148.9152.9158.3
149.4147.5157.5155.8164.2164.4
252.7258.6264.3
Zebulon Elementary632 146.6146.63rd Gd:
4th Gd:5th Gd:
149.5149.1154.4156.2
145.6151.2154.2
144.2144.4154.6154.6160.5161.9
250.4256.7258.6
10/23/2001 Page 6Attachment C:

EOG Mean Scale Scores for Three YearsReading Mathematics
20001999 2001 20001999 2001
Apex Middle312 160.9159.86th Gd:
7th Gd:8th Gd:
163.4162.5165.3164.9
161.7165.9166.9
170.3168.2175.4173.4180.0177.8
268.1273.9275.4
Carnage Middle356 158.3158.86th Gd:
7th Gd:8th Gd:
161.4161.6164.2164.1
158.0160.8165.0
166.3166.6174.0172.6176.8176.7
264.0268.4274.0
Carroll Middle360 157.0158.56th Gd:
7th Gd:8th Gd:
162.8163.0165.7164.9
157.7161.2164.9
166.6165.0173.7173.9178.9177.8
263.4266.9271.1
Centennial Middle370 6th Gd:
7th Gd:8th Gd:
160.8160.2163.0
265.1266.6269.3
Daniels Middle388 158.0159.56th Gd:
7th Gd:8th Gd:
162.8161.5164.3165.3
161.0162.0166.4
165.9167.6173.9173.1177.4177.6
266.7268.8273.7
Davis Drive Middle391 162.4161.96th Gd:
7th Gd:8th Gd:
164.2163.8166.5167.5
163.1164.6167.3
170.7169.3177.3175.7182.0180.6
270.0273.7277.0
Dillard Middle394 159.26th Gd:
7th Gd:8th Gd:
163.9160.0162.6168.2
169.7179.0
268.5271.0277.5
Durant Road Middle399 160.0161.16th Gd:
7th Gd:8th Gd:
164.3163.8166.6165.9
162.0164.0167.5
168.5169.3176.0174.8179.8179.7
268.9272.2275.6
East Cary Middle400 159.1159.86th Gd:
7th Gd:8th Gd:
162.7164.7166.6166.9
159.3163.0165.4
168.9168.1175.9177.2181.3181.8
266.1271.9274.5
East Garner Middle404 153.1155.36th Gd:
7th Gd:8th Gd:
158.7159.7162.9161.6
155.4158.9164.6
160.2161.0167.7167.4173.4171.9
259.8264.7269.0
East Millbrook Middle408 155.8158.06th Gd:
7th Gd:8th Gd:
160.5160.5163.3161.7
157.4160.4163.3
162.6162.1169.4169.2173.0169.9
262.8266.7267.6
East Wake Middle410 155.6155.36th Gd:
7th Gd:8th Gd:
158.9160.6162.3161.5
155.6159.2161.1
163.9162.3167.7170.9173.8171.8
260.0265.4267.1
Fuquay-Varina Middle424 157.9156.56th Gd:
7th Gd:8th Gd:
161.1160.5162.7162.3
156.7162.3163.7
166.4164.9170.2170.4174.6173.7
264.5267.6270.2
Leesville Road Middle471 159.8159.86th Gd:
7th Gd:8th Gd:
163.3164.9168.0166.6
160.6164.5167.6
168.8167.2176.9176.6182.7179.0
266.8273.6277.5
10/23/2001 Page 1Attachment D:

EOG Mean Scale Scores for Three YearsReading Mathematics
20001999 2001 20001999 2001
Ligon Middle472 163.4163.46th Gd:
7th Gd:8th Gd:
166.3163.7166.3165.7
164.2166.5169.3
174.6173.1180.3177.0180.9180.1
273.4278.2280.2
Lufkin Rd. Middle484 163.16th Gd:
7th Gd:8th Gd:
163.6165.8
171.9 269.5276.3
Martin Middle492 160.9161.66th Gd:
7th Gd:8th Gd:
163.1164.1166.6166.9
161.5164.1167.0
172.4171.6177.4176.8181.4181.9
269.0274.6275.9
North Garner Middle512 153.8154.26th Gd:
7th Gd:8th Gd:
157.4158.8161.7161.7
154.3157.9161.3
162.5159.1169.5171.2174.8173.9
259.9267.1267.3
Wake Forest-Rolesville Mid.592 157.1158.66th Gd:
7th Gd:8th Gd:
162.4161.7164.7162.5
156.5160.6164.9
165.5164.0172.1171.6177.9174.8
261.9266.2272.3
Wakefield Middle594 6th Gd:
7th Gd:8th Gd:
161.7163.3
268.1271.8
West Cary Middle604 159.4161.16th Gd:
7th Gd:8th Gd:
163.5163.5166.2165.2
160.8164.0166.9
170.5170.0174.5174.8179.8176.8
267.4272.0274.9
West Lake Middle607 162.4161.96th Gd:
7th Gd:8th Gd:
164.9165.0167.6167.5
162.9165.1168.2
171.8171.6178.4177.4183.3183.7
269.8272.9277.7
West Millbrook Middle608 159.9159.16th Gd:
7th Gd:8th Gd:
163.1161.3163.6166.1
161.5163.7167.1
166.4165.1174.2171.9176.3179.6
266.7271.7274.6
Zebulon Middle636 154.9155.96th Gd:
7th Gd:8th Gd:
159.5159.2161.8160.7
155.9160.0163.1
161.3162.3171.5171.6174.2172.7
262.0265.4270.7
10/23/2001 Page 2Attachment D: