Embed Size (px)
Citation preview
6
2.0 Shrimp Aquaculture
2.1 Aquaculture - Definition
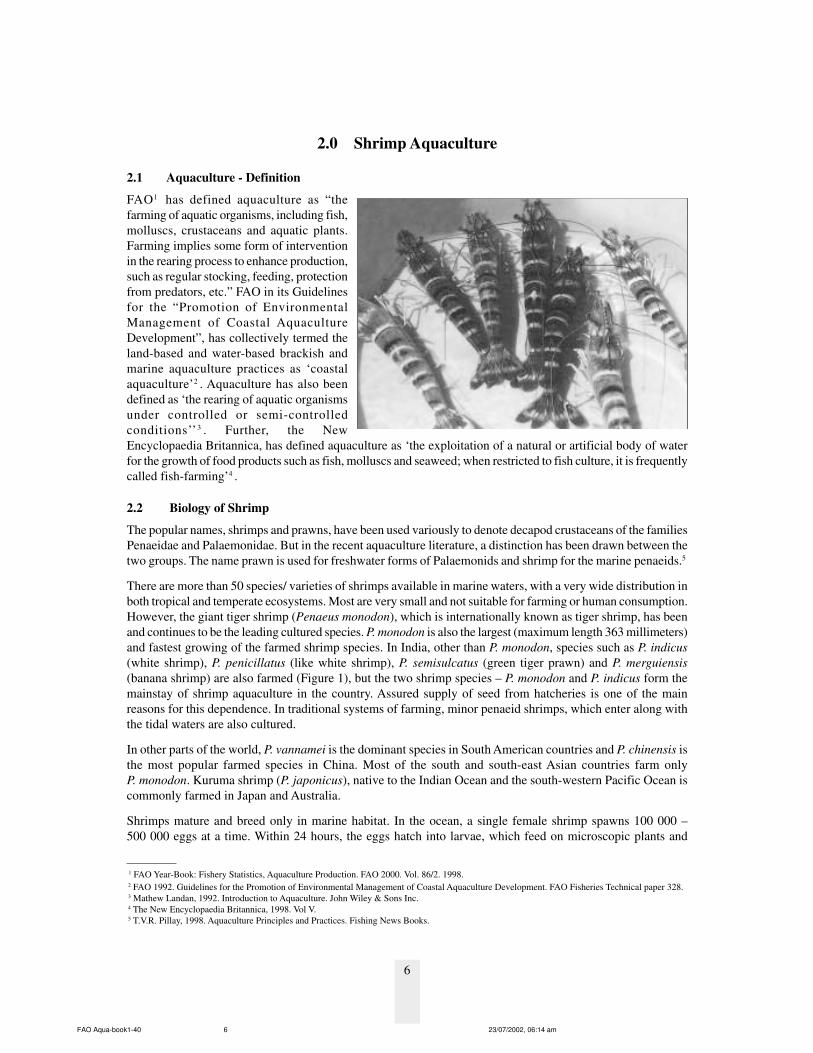
FAO1 has defined aquaculture as “thefarming of aquatic organisms, including fish,molluscs, crustaceans and aquatic plants.Farming implies some form of interventionin the rearing process to enhance production,such as regular stocking, feeding, protectionfrom predators, etc.” FAO in its Guidelinesfor the “Promotion of EnvironmentalManagement of Coastal AquacultureDevelopment”, has collectively termed theland-based and water-based brackish andmarine aquaculture practices as ‘coastalaquaculture’2 . Aquaculture has also beendefined as ‘the rearing of aquatic organismsunder controlled or semi-controlledconditions’’3 . Further, the NewEncyclopaedia Britannica, has defined aquaculture as ‘the exploitation of a natural or artificial body of waterfor the growth of food products such as fish, molluscs and seaweed; when restricted to fish culture, it is frequentlycalled fish-farming’4 .
2.2 Biology of Shrimp
The popular names, shrimps and prawns, have been used variously to denote decapod crustaceans of the familiesPenaeidae and Palaemonidae. But in the recent aquaculture literature, a distinction has been drawn between thetwo groups. The name prawn is used for freshwater forms of Palaemonids and shrimp for the marine penaeids.5
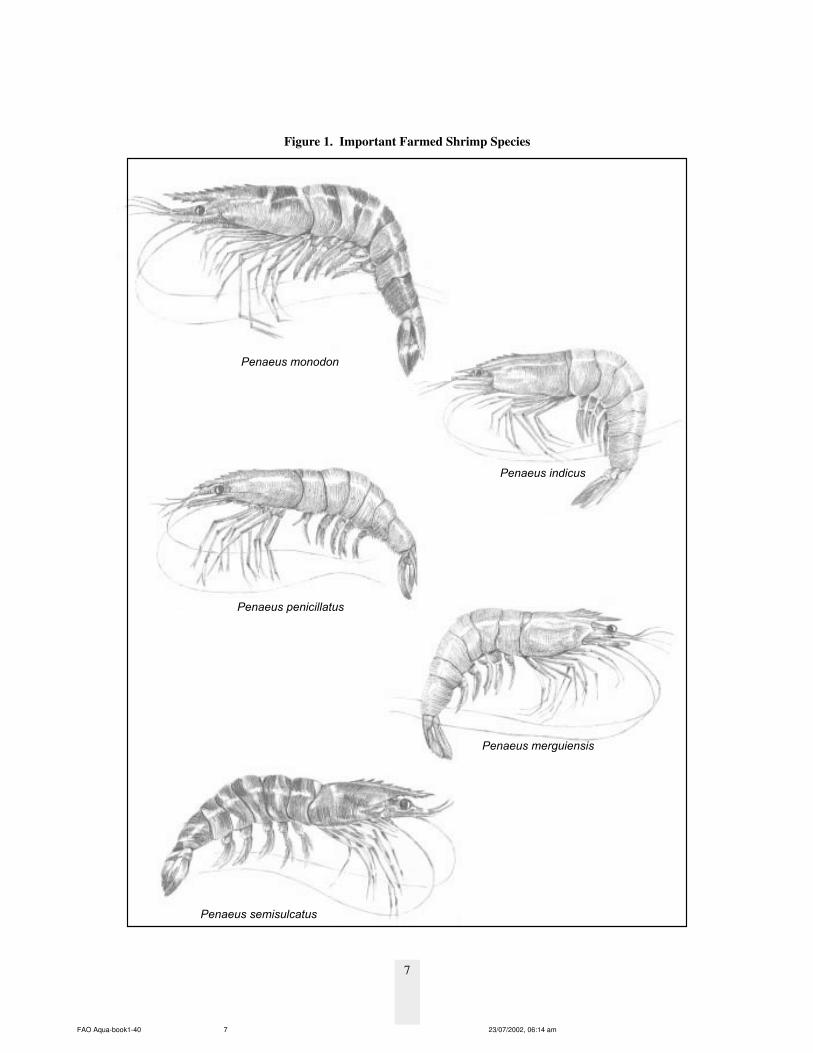
There are more than 50 species/ varieties of shrimps available in marine waters, with a very wide distribution inboth tropical and temperate ecosystems. Most are very small and not suitable for farming or human consumption.However, the giant tiger shrimp (Penaeus monodon), which is internationally known as tiger shrimp, has beenand continues to be the leading cultured species. P. monodon is also the largest (maximum length 363 millimeters)and fastest growing of the farmed shrimp species. In India, other than P. monodon, species such as P. indicus(white shrimp), P. penicillatus (like white shrimp), P. semisulcatus (green tiger prawn) and P. merguiensis(banana shrimp) are also farmed (Figure 1), but the two shrimp species – P. monodon and P. indicus form themainstay of shrimp aquaculture in the country. Assured supply of seed from hatcheries is one of the mainreasons for this dependence. In traditional systems of farming, minor penaeid shrimps, which enter along withthe tidal waters are also cultured.
In other parts of the world, P. vannamei is the dominant species in South American countries and P. chinensis isthe most popular farmed species in China. Most of the south and south-east Asian countries farm onlyP. monodon. Kuruma shrimp (P. japonicus), native to the Indian Ocean and the south-western Pacific Ocean iscommonly farmed in Japan and Australia.
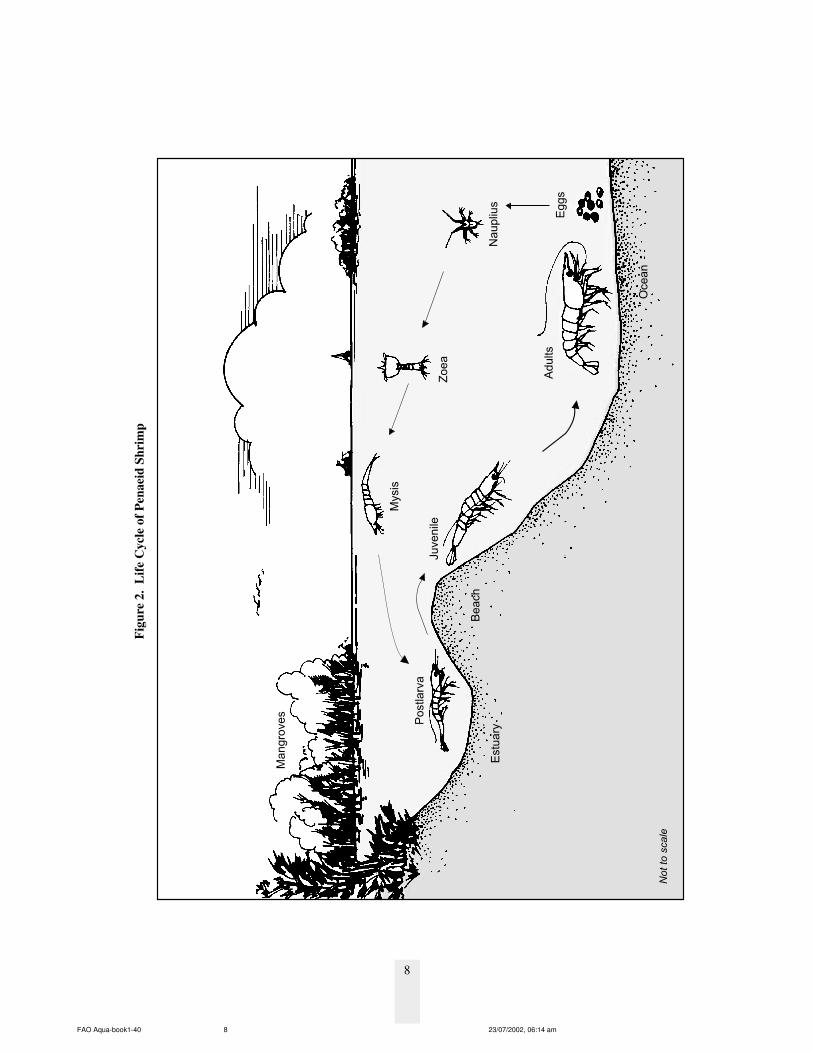
Shrimps mature and breed only in marine habitat. In the ocean, a single female shrimp spawns 100 000 –500 000 eggs at a time. Within 24 hours, the eggs hatch into larvae, which feed on microscopic plants and
1 FAO Year-Book: Fishery Statistics, Aquaculture Production. FAO 2000. Vol. 86/2. 1998.2 FAO 1992. Guidelines for the Promotion of Environmental Management of Coastal Aquaculture Development. FAO Fisheries Technical paper 328.3 Mathew Landan, 1992. Introduction to Aquaculture. John Wiley & Sons Inc.4 The New Encyclopaedia Britannica, 1998. Vol V.5 T.V.R. Pillay, 1998. Aquaculture Principles and Practices. Fishing News Books.
FAO Aqua-book1-40 23/07/2002, 06:14 am6
7
Figure 1. Important Farmed Shrimp Species
Penaeus monodon
Penaeus indicus
Penaeus merguiensis
Penaeus semisulcatus
Penaeus penicillatus
FAO Aqua-book1-40 23/07/2002, 06:14 am7
8
Figu
re 2
. L
ife C
ycle
of P
enae
id S
hrim
p
Ocean
Eggs
Mangroves
Postlarva
Beach
Adults
Zoea
Nauplius
Mysis
Juvenile
No
t to
sca
le
Estuary
FAO Aqua-book1-40 23/07/2002, 06:14 am8
9
animals present in the water known as plankton. After passing through three stages and various sub-stages, in aperiod of about 12 days (Figure 2), the larvae develop into young shrimp known as postlarvae. These postlarvaetolerate wide range of salinity from slightly greater than freshwater (1 –2 ppt)* to full-strength ocean water(35-40 ppt). Postlarvae migrate to low-saline, nutrient-rich estuaries and backwaters where they grow frompostlarvae to larger juveniles/ sub-adults. This phase of the life-cycle of the shrimps is used for farming. Thejuveniles then return to the sea to mature and breed, thus completing the lifecycle.
2.3 Farming Practices
In shrimp farming parlance, farmers refer to postlarvae as “PLs” and as each day passes, the stages are numberedPL-1, PL-2, and so on. When their gills become branched (PL- 13 to PL- 17) the postlarvae can be moved to thefarm for raising to table- size. From hatching, it takes about 25 days to produce a PL-15.
Shrimps are generally cultured in land based ponds/ impoundments. To achieve this, the ponds are initiallyprepared by drying and tilling (to remove the pests and predators and metabolize the organic matter) and thenliming (to correct the pH and to keep the bottom free from microorganisms). Inorganic fertilizers such as ureaand super phosphate are then applied to develop the natural food organisms known as plankton (floating) andbenthos (bottom living). The plankton in aquaculture ponds create turbidity and the water usually appears greenor greenish-brown. This colour is maintained all through the culture period. After these preparations, shrimppostlarvae are stocked at varying densities (numbers per square meter) depending on the level of production.Pelleted diets with about 40% of protein is used as supplementary feed. The feed is provided in three differentsizes depending on the size of the shrimp - starter, grower and finisher. The feed quantity to be given is monitoredusing feed trays and it is adjusted according to the level of growth. Water quality is continuously monitored andthe optimum levels of important parameters such as dissolved oxygen, pH and salinity are regulated by resortingto periodical exchange of water. The rate of exchange depends on the number of shrimp stocked, and the qualityof pond water. Some farmers resort to aeration of the ponds using mechanical/ electrical aerators. After continuousmonitoring of the stock, they are generally harvested when they reach marketable size of 30 – 35 g. It normallytakes about 4-5 months to achieve this size in tropical conditions. An average production of 500 kg – 1500 kgis expected per crop by adopting scientific farming practice in low input systems.
In traditional shrimp farming systems, the migrating postlarval stages are trapped in the brackishwaterimpoundments along with all other organisms present in the estuarine water and allowed to grow. With theintroduction of scientific shrimp farming with selective stocking, the requirements for seed has increased andthe controlled production of shrimp seed in sea water- based hatcheries is practiced all over the world.
Tiger shrimp and white shrimp require clean water for optimum growth and good health. Shrimps are primarilybottom dwellers and are easily stressed when exposed to poor pond conditions such as low pH, high organicmatter concentration, and soft sediment containing reduced microbial metabolites. When shrimps are stressedthey are susceptible to many diseases, especially to viral diseases. The primary objective during culture is toprovide a good quality environment in ponds to prevent stress, minimize the risk of diseases, and to enhancesurvival rate and production.
Commercial shrimp farming, the production of marine shrimp in impoundments, ponds and tanks, started in theearly 1970s, and today, over fifty countries export farmed shrimp. In Ecuador, the leading producer in thewestern hemisphere, export revenues range from US $400 to US $800 million a year. In Thailand, the leader inthe eastern hemisphere, they have passed the billion dollar mark. In addition, Indonesia, India, China, Malaysia,Taiwan, Bangladesh and Sri Lanka all produce huge amounts of farmed shrimp. The Philippines, Vietnam andMyanmar have shrimp farms, and there are shrimp farms throughout Central and South America. The shrimpimporting nations-the United States, Western Europe and Japan-specialize in high-tech “intensive” shrimpfarming, but productions are not of higher magnitude.
***
* ppt – parts per thousand (gram / litre)
FAO Aqua-book1-40 23/07/2002, 06:14 am9
10
3.0 Shrimp Aquaculture - Global and Indian Scenario
3.1 Introduction
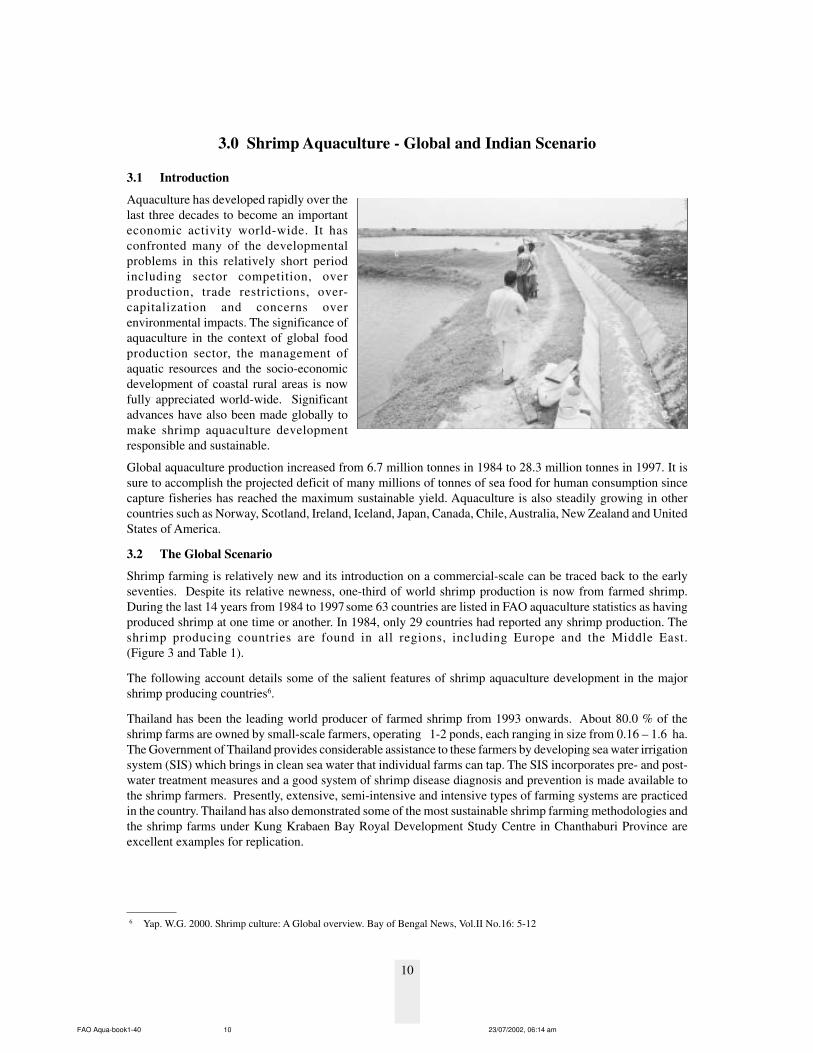
Aquaculture has developed rapidly over thelast three decades to become an importanteconomic activity world-wide. It hasconfronted many of the developmentalproblems in this relatively short periodincluding sector competition, overproduction, trade restrictions, over-capitalization and concerns overenvironmental impacts. The significance ofaquaculture in the context of global foodproduction sector, the management ofaquatic resources and the socio-economicdevelopment of coastal rural areas is nowfully appreciated world-wide. Significantadvances have also been made globally tomake shrimp aquaculture developmentresponsible and sustainable.
Global aquaculture production increased from 6.7 million tonnes in 1984 to 28.3 million tonnes in 1997. It issure to accomplish the projected deficit of many millions of tonnes of sea food for human consumption sincecapture fisheries has reached the maximum sustainable yield. Aquaculture is also steadily growing in othercountries such as Norway, Scotland, Ireland, Iceland, Japan, Canada, Chile, Australia, New Zealand and UnitedStates of America.
3.2 The Global Scenario
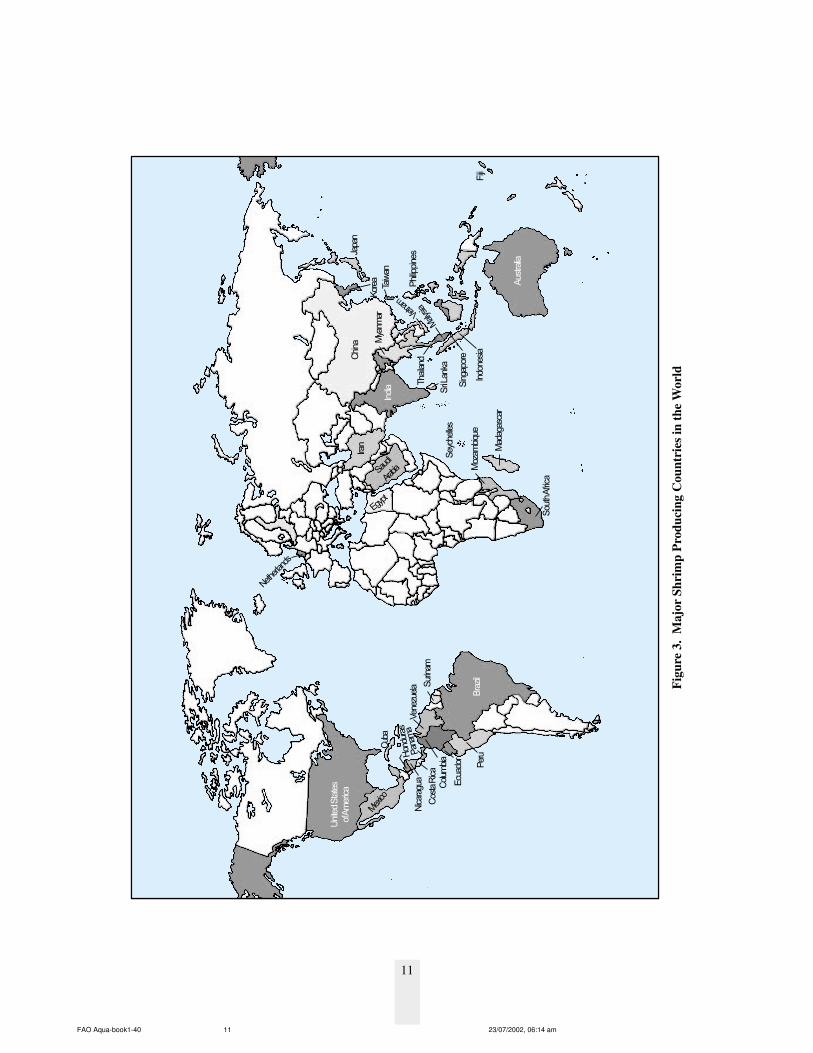
Shrimp farming is relatively new and its introduction on a commercial-scale can be traced back to the earlyseventies. Despite its relative newness, one-third of world shrimp production is now from farmed shrimp.During the last 14 years from 1984 to 1997some 63 countries are listed in FAO aquaculture statistics as havingproduced shrimp at one time or another. In 1984, only 29 countries had reported any shrimp production. Theshrimp producing countries are found in all regions, including Europe and the Middle East.(Figure 3 and Table 1).
The following account details some of the salient features of shrimp aquaculture development in the majorshrimp producing countries6.
Thailand has been the leading world producer of farmed shrimp from 1993 onwards. About 80.0 % of theshrimp farms are owned by small-scale farmers, operating 1-2 ponds, each ranging in size from 0.16 – 1.6 ha.The Government of Thailand provides considerable assistance to these farmers by developing sea water irrigationsystem (SIS) which brings in clean sea water that individual farms can tap. The SIS incorporates pre- and post-water treatment measures and a good system of shrimp disease diagnosis and prevention is made available tothe shrimp farmers. Presently, extensive, semi-intensive and intensive types of farming systems are practicedin the country. Thailand has also demonstrated some of the most sustainable shrimp farming methodologies andthe shrimp farms under Kung Krabaen Bay Royal Development Study Centre in Chanthaburi Province areexcellent examples for replication.
6 Yap. W.G. 2000. Shrimp culture: A Global overview. Bay of Bengal News, Vol.II No.16: 5-12
FAO Aqua-book1-40 23/07/2002, 06:14 am10
11
Figu
re 3
. M
ajor
Shr
imp
Prod
ucin
g C
ount
ries
in th
e W
orld
United States
of America
Mexico
Cuba
Nicaragua
Costa Rica
Honduras
Panam
aVenezuela Surinam
Colum
bia
Ecuador Peru
Brazil
South Africa
Mozam
bique
Madagascar
Seychelles
Egypt
Saudi
Arabia
Iran
Netherlands
India
Myanm
ar Vietnam
Sri Lanka
Thailand
Malysia
Singapore
Indonesia
Taiwan
Korea PhilippinesJapan
Fiji
Australia
China
FAO Aqua-book1-40 23/07/2002, 06:14 am11
12
Indonesia is the second largest shrimp producing country after Thailand. In the province of Lampung which islocated in southern Sumatra, one of the world’s largest shrimp farm under the control and management of onecompany can be found. Here the P.T. Dipasena Citra Darmaja has established 18 000 individual plastic-linedculture ponds covering some 4 500 ha in a 16 000 ha site. It has also obtained the rights to further develop atleast 50 000 ha of land. Most of the ponds measure 2 500 m2 gross area, with a few measuring half a hectare.As provided for under Indonesian law, any aquaculture development over 30 ha in Java and 50 ha in islandsoutside Java has to be developed under the Tambak Inti Rakyat (TIR) or nucleus-estate concept. Indonesia stillhas large undeveloped land in the outer islands, particularly in Sumatra and therefore has the potential tobecome the world’s largest farmed shrimp producer, if the farming practices are done in a sustainable andresponsible manner.
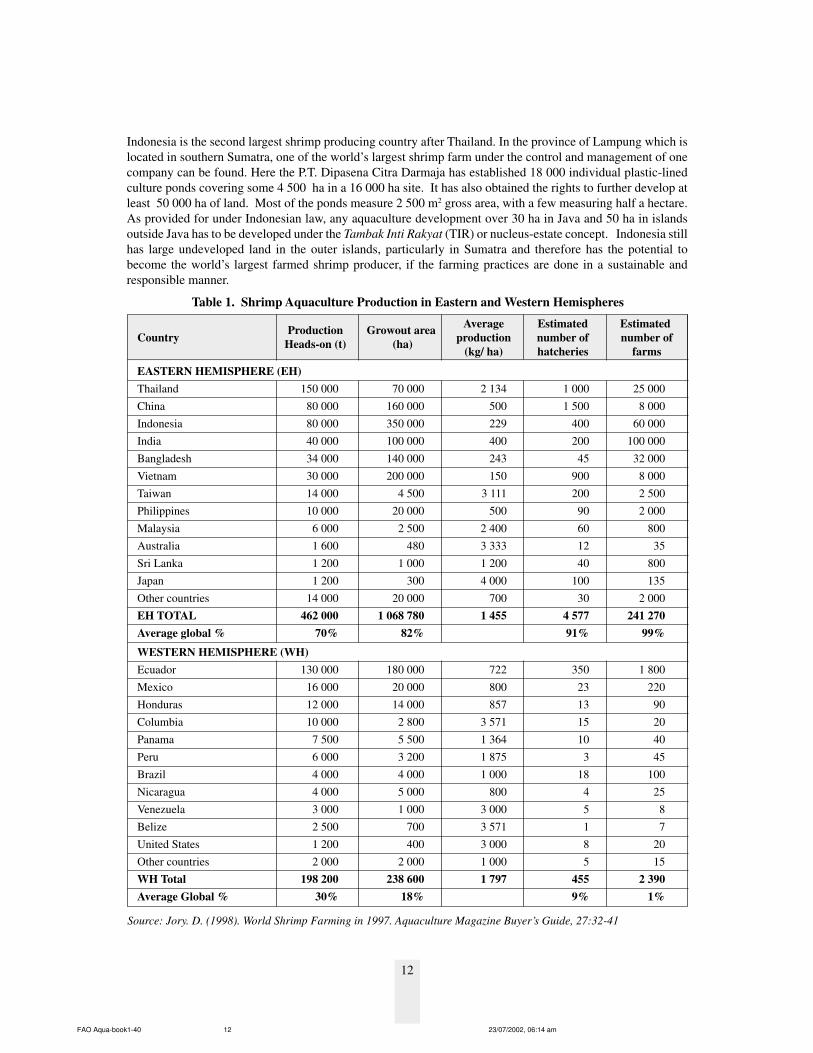
Table 1. Shrimp Aquaculture Production in Eastern and Western Hemispheres
Production Growout area Average Estimated EstimatedCountry Heads-on (t) (ha) production number of number of
(kg/ ha) hatcheries farms
EASTERN HEMISPHERE (EH)Thailand 150 000 70 000 2 134 1 000 25 000China 80 000 160 000 500 1 500 8 000Indonesia 80 000 350 000 229 400 60 000India 40 000 100 000 400 200 100 000Bangladesh 34 000 140 000 243 45 32 000Vietnam 30 000 200 000 150 900 8 000Taiwan 14 000 4 500 3 111 200 2 500Philippines 10 000 20 000 500 90 2 000Malaysia 6 000 2 500 2 400 60 800Australia 1 600 480 3 333 12 35Sri Lanka 1 200 1 000 1 200 40 800Japan 1 200 300 4 000 100 135Other countries 14 000 20 000 700 30 2 000EH TOTAL 462 000 1 068 780 1 455 4 577 241 270Average global % 70% 82% 91% 99%
WESTERN HEMISPHERE (WH)Ecuador 130 000 180 000 722 350 1 800Mexico 16 000 20 000 800 23 220Honduras 12 000 14 000 857 13 90Columbia 10 000 2 800 3 571 15 20Panama 7 500 5 500 1 364 10 40Peru 6 000 3 200 1 875 3 45Brazil 4 000 4 000 1 000 18 100Nicaragua 4 000 5 000 800 4 25Venezuela 3 000 1 000 3 000 5 8Belize 2 500 700 3 571 1 7United States 1 200 400 3 000 8 20Other countries 2 000 2 000 1 000 5 15WH Total 198 200 238 600 1 797 455 2 390Average Global % 30% 18% 9% 1%
Source: Jory. D. (1998). World Shrimp Farming in 1997. Aquaculture Magazine Buyer’s Guide, 27:32-41
FAO Aqua-book1-40 23/07/2002, 06:14 am12
13
China, originally started with freshwater aquaculture but has now moved to coastal salt water aquaculture in abig way. The Chinese government took a macro-approach to development. Without the shrimp farms thecoastal flat lands were useless for anything else. The meteoric rise in the Chinese shrimp farming was madepossible by a massive development programme along the Bohai Bay coastline in the north east all the waydown to Fujian in the south. Every year, thousands of hectares were developed by the Chinese governmentwhen it came to the realisation that shrimp farming was the best way of productive utilisation of vast tracts ofarid saline-alkaline coastal flat lands, providing employment and earning foreign exchange. In 1993, Chinafound that overstocking and lack of provision for treating wastewater discharge resulted in decline in production.However, mitigation measures were soon adopted and presently extensive, semi-intensive and intensive farmingmethods are practiced for shrimp farming.
Unlike other South-East Asian countries, Philippines lacks the abundance of resources suitable for shrimpaquaculture. At its peak in 1993, Philippines produced 95 816 metric tonnes of all species, but mostly of thegiant tiger shrimp. The total production in 1997 fell largely due to shrimp disease. However, shrimp growers inNegros Occidental which used to be the centre of intensive shrimp farming are slowly trying out lower densities,using pro-biotics, pond bio-remediation techniques and even mixed culture with fish species such as tilapia.The South-East Asian Fisheries Development Centre (SEAFDEC), an inter-governmental organization withheadquarters in Bangkok is providing technical back-up to shrimp farmers in the Philippines for makingfarming practices more sustainable.
Vietnamese shrimp production has steadily increased to a ten-fold growth over 12 years. The farms are extensiveand semi-intensive types.
Bangladesh is slowly increasing its production year by year and it already produces more than the Philippines.The culture systems used are extensive, semi-intensive and intensive.
The Middle East, is also striving to become a shrimp producing region. Many of the countries in the regionincluding UAE, Kuwait and Yemen have initiated moves to venture into shrimp farming. So far, large-scaledevelopments have taken place only in two countries, Saudi Arabia along the Red Sea and Islamic Republic ofIran along the Persian Gulf. Iran is moving very fast after culture trials under a UNDP/FAO Project showed thatit is possible to breed and grow local species found in the Persian Gulf which has an average salinity of 38 ppt.Initially two species were being farmed– P. semisulcatus and P. indicus. However, due to slow growth of theformer when farmers shifted to a locally milled feed, all the farms are now stocked with P. indicus. In the year2000, shrimp farming expanded even faster than it did in 1999. Over 12 000 ha of new farms are beingdesigned and built in the coastal areas. Presently, the harvest average 1.8 metric tonnes per hectare and almostthe entire crop is exported to Europe.
Ecuador, the only country outside Asia, stands fourth position in production. As early as 1984 it was alreadyproducing more than any of the major shrimp producing countries in Asia. The production touched a peak ofabout 130 000 metric tonnes in 1997. Extensive, and semi-intensive methods of culture are practiced in Ecuador.Practically all the Latin American countries from Mexico to Peru produce shrimp. However, except for Mexico,Honduras and Columbia which in 1997 produced 16 000, 12 000 and 10 000 metric tonnes respectively, all therest produced less than 10 000 metric tonnes.
3.3 Development of Shrimp Aquaculture in IndiaIndia, by virtue of its 8 118 km long coastline, 2.02 million sq. km of Exclusive Economic Zone (EEZ) andextensive geographical stretch with varied terrain and climate, supports a wide diversity of inland and coastalwetland habitats. It has been estimated that there is 3.9 million ha of estuaries and 3.5 million ha of brackishwaterareas in the country7. Out of this, 1.2 million ha of coastal area has been identified as suitable for brackishwateraquaculture and through the use of sustainable practices this resource can yield optimum quantities of shrimpand other commercially valuable fin and shell fish species.
7 WWF. 1992. India’s Wetlands, Mangroves and Coral Reefs. Prepared by World Wild Fund For Nature, India for the Ministry ofEnvironment and Forests.
FAO Aqua-book1-40 23/07/2002, 06:14 am13
14
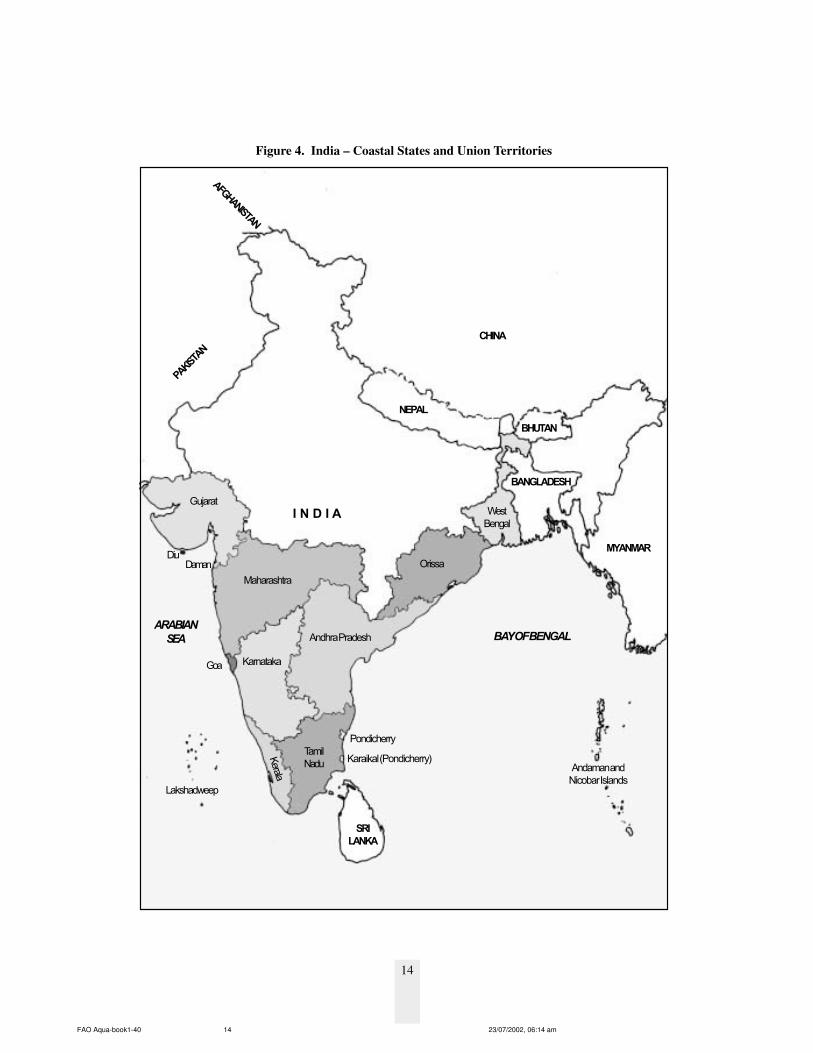
Figure 4. India – Coastal States and Union Territories
I N D I A
BANGLADESH
MYANMAR
Gujarat
Maharashtra
Orissa
West
Bengal
CHINA
DamanDiu
NEPAL
BHUTAN
AFGHANISTAN
PAKISTAN
ARABIAN
SEA BAY OF BENGAL
Lakshadweep
Kerala
Goa Karnataka
Andhra Pradesh
Tamil
Nadu
Pondicherry
Andaman and
Nicobar Islands
Karaikal (Pondicherry)
SRI
LANKA
FAO Aqua-book1-40 23/07/2002, 06:14 am14
15
The shrimp farming areas are mainly located in the coastal states of Andhra Pradesh, West Bengal, Kerala,Orissa, Tamil Nadu, Karnataka, Maharashtra, Gujarat and Goa (Figure 4). The major markets for Indian shrimpare Japan, Western Europe and USA. Today, India stands amongst the major shrimp producing countries havinga growth rate of about 300.0 % over the last decade.
In India, shrimp farming has been traditionally practiced in the coastal states of West Bengal and Kerala. Thetraditional trap and culture system was characterized with low production levels of mixed species of fin andshell fishes. The importance of introducing scientific farming techniques to increase production and productivityfrom the traditional system was felt and the Indian Council of Agricultural Research (ICAR) implemented anAll India Coordinated Research Project on Brackishwater Fish Farming (1973- 1984) to develop and testvarious farming technologies under different agro-climatic conditions of the country. The main centre of theproject was located in West Bengal and the other centres were located in Orissa, Andhra Pradesh, Tamil Nadu,Kerala and Goa for demonstrating the technologies to the small-scale farmers.
Simultaneously, the shrimp hatchery technology was also introduced into the country and two commercialhatcheries were established in the late eighties with the initiative from the MPEDA. With the establishment ofmore hatcheries in the private sector, the country witnessed a faster development of shrimp farming between1990 – 1994. The culture practice was also gradually intensified and varied levels of intensification were noticeddepending on the investment capabilities of the farmer/ entrepreneur. Stocking densities of 2 to 30 nos/ m2 wereused under different systems by the farmers.
Like any other agriculture/ animal husbandry practice, shrimp culture was also affected by health and diseaseproblems. Initially, some of the bacterial diseases were noticed which were more or less localized and themortality levels were not very high. Later in 1995, viral diseases such as monodon baculo virus and white spotvirus disease affected the farmed shrimp and there was a slump in shrimp farming. Reasons such as heavystocking densities and poor farm management practices were attributed to the shrimp diseases out break in thecountry. Following the verdict of this Court and the establishment of Aquaculture Authority with powers toissue licenses and guidelines, the shrimp culture sector is gradually going through a regulated regime and isslowly returning to its normal production level.
3.4 Development of Allied Activities
3.4.1 Shrimp Hatcheries
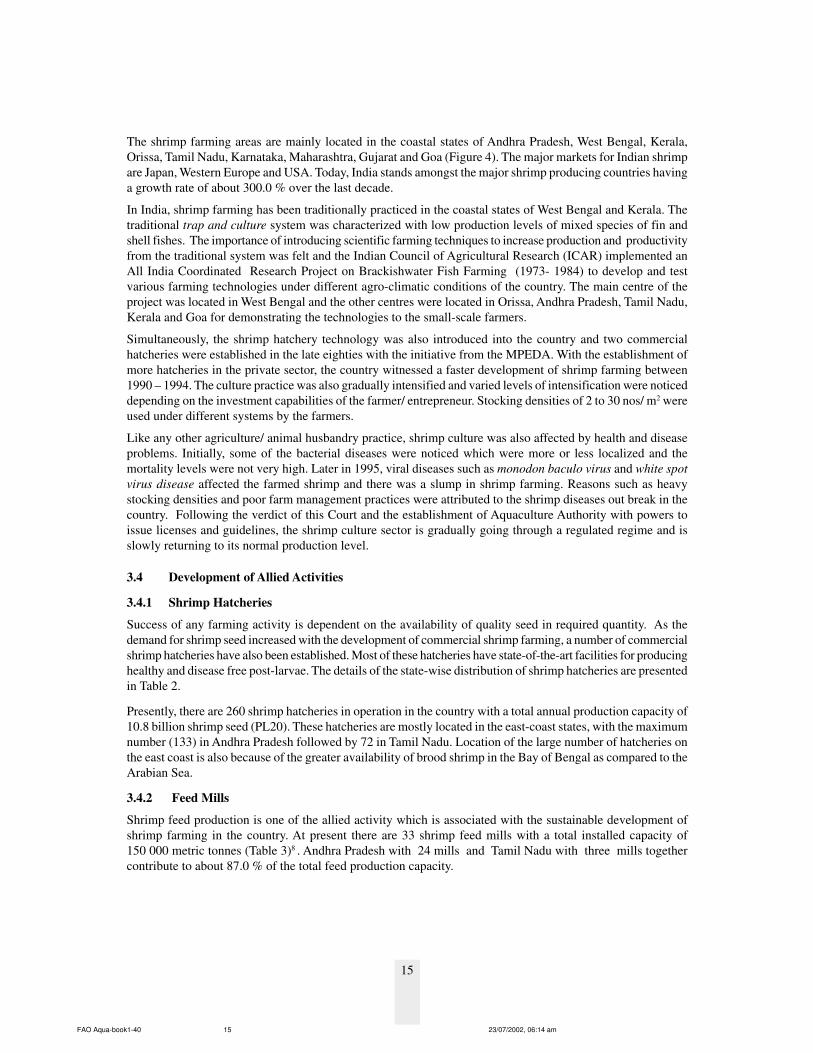
Success of any farming activity is dependent on the availability of quality seed in required quantity. As thedemand for shrimp seed increased with the development of commercial shrimp farming, a number of commercialshrimp hatcheries have also been established. Most of these hatcheries have state-of-the-art facilities for producinghealthy and disease free post-larvae. The details of the state-wise distribution of shrimp hatcheries are presentedin Table 2.
Presently, there are 260 shrimp hatcheries in operation in the country with a total annual production capacity of10.8 billion shrimp seed (PL20). These hatcheries are mostly located in the east-coast states, with the maximumnumber (133) in Andhra Pradesh followed by 72 in Tamil Nadu. Location of the large number of hatcheries onthe east coast is also because of the greater availability of brood shrimp in the Bay of Bengal as compared to theArabian Sea.
3.4.2 Feed Mills
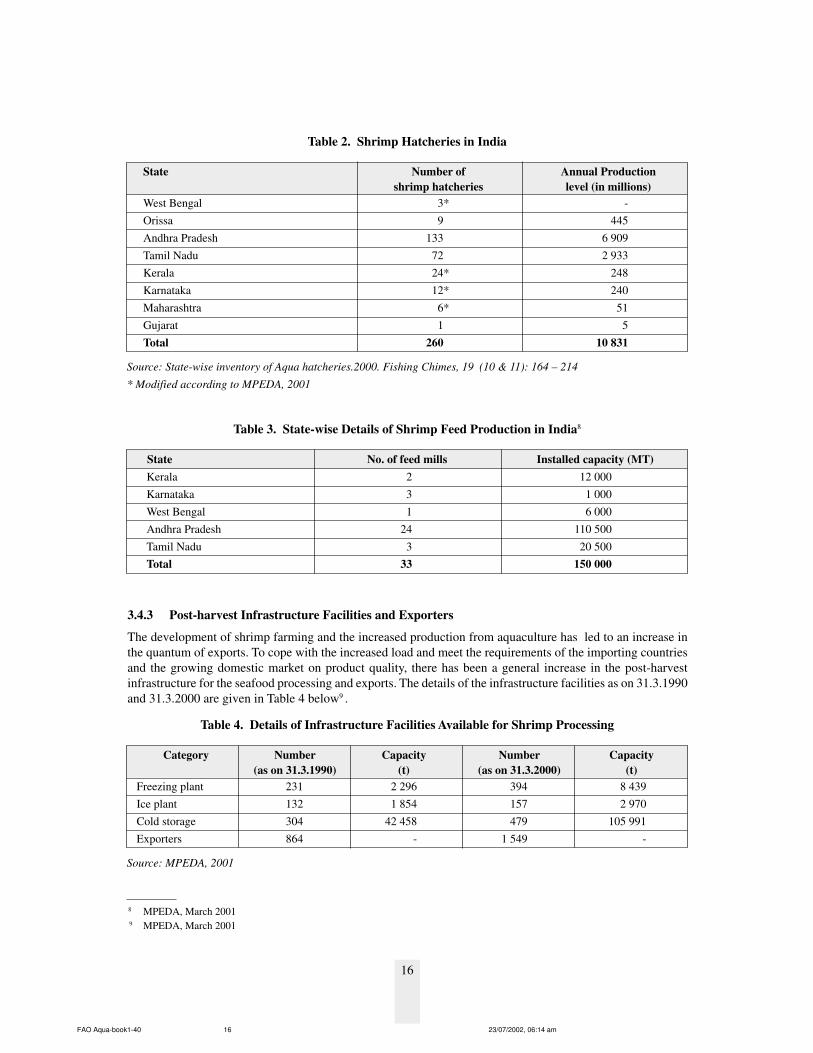
Shrimp feed production is one of the allied activity which is associated with the sustainable development ofshrimp farming in the country. At present there are 33 shrimp feed mills with a total installed capacity of150 000 metric tonnes (Table 3)8 . Andhra Pradesh with 24 mills and Tamil Nadu with three mills togethercontribute to about 87.0 % of the total feed production capacity.
FAO Aqua-book1-40 23/07/2002, 06:14 am15
16
8 MPEDA, March 20019 MPEDA, March 2001
State Number of Annual Productionshrimp hatcheries level (in millions)
West Bengal 3* -Orissa 9 445Andhra Pradesh 133 6 909Tamil Nadu 72 2 933Kerala 24* 248Karnataka 12* 240Maharashtra 6* 51Gujarat 1 5Total 260 10 831
Source: State-wise inventory of Aqua hatcheries.2000. Fishing Chimes, 19 (10 & 11): 164 – 214
* Modified according to MPEDA, 2001
Table 2. Shrimp Hatcheries in India
State No. of feed mills Installed capacity (MT)Kerala 2 12 000Karnataka 3 1 000West Bengal 1 6 000Andhra Pradesh 24 110 500Tamil Nadu 3 20 500Total 33 150 000
Table 3. State-wise Details of Shrimp Feed Production in India8
3.4.3 Post-harvest Infrastructure Facilities and Exporters
The development of shrimp farming and the increased production from aquaculture has led to an increase inthe quantum of exports. To cope with the increased load and meet the requirements of the importing countriesand the growing domestic market on product quality, there has been a general increase in the post-harvestinfrastructure for the seafood processing and exports. The details of the infrastructure facilities as on 31.3.1990and 31.3.2000 are given in Table 4 below9 .
Category Number Capacity Number Capacity(as on 31.3.1990) (t) (as on 31.3.2000) (t)
Freezing plant 231 2 296 394 8 439Ice plant 132 1 854 157 2 970Cold storage 304 42 458 479 105 991Exporters 864 - 1 549 -
Source: MPEDA, 2001
Table 4. Details of Infrastructure Facilities Available for Shrimp Processing
FAO Aqua-book1-40 23/07/2002, 06:14 am16
17
3.5 Status of Shrimp Aquaculture in the Coastal States and Union Territories
Starting in a small way in the late 1980s, commercial shrimp aquaculture became a significant activity in theearly 1990s in selected pockets along the country’s vast coastline. The states with the highest concentration ofshrimp culture farms are Andhra Pradesh, Tamil Nadu and Orissa. Some of the west-coast states like Maharashtraand Goa also developed commercial shrimp farms, but the overall area is much less as compared to the states onthe east coast. The area and production under traditional systems was stagnant for decades as there was no effortmade for optimisation of the production through adoption of scientific methodologies.
Commercial shrimp farming developed on account of the government’s policy to promote shrimp culture inview of its potential to utilise the vast saline tracts along the coastline, provide employment opportunities tocoastal rural population and to earn valuable foreign exchange. After the liberalization of Indian economy in1991, development of shrimp culture gained greater momentum. Individual entrepreneurs were also encouragedto take up shrimp farming with both financial and technical support.
The opposition to shrimp culture has stemmed from both socio-economic and environmental issues. The socio-economic issues include land alienation, displacement of coastal communities from open access to public landsused by them for fish and net drying, grazing, etc. The environmental issues include salinisation of groundwaterand productive agricultural lands, contamination of ground and surface waters with organic wastes of shrimpfarming, destruction of mangroves, loss of mud-flats which result in changes in conditions mitigating/ controllingfloods.
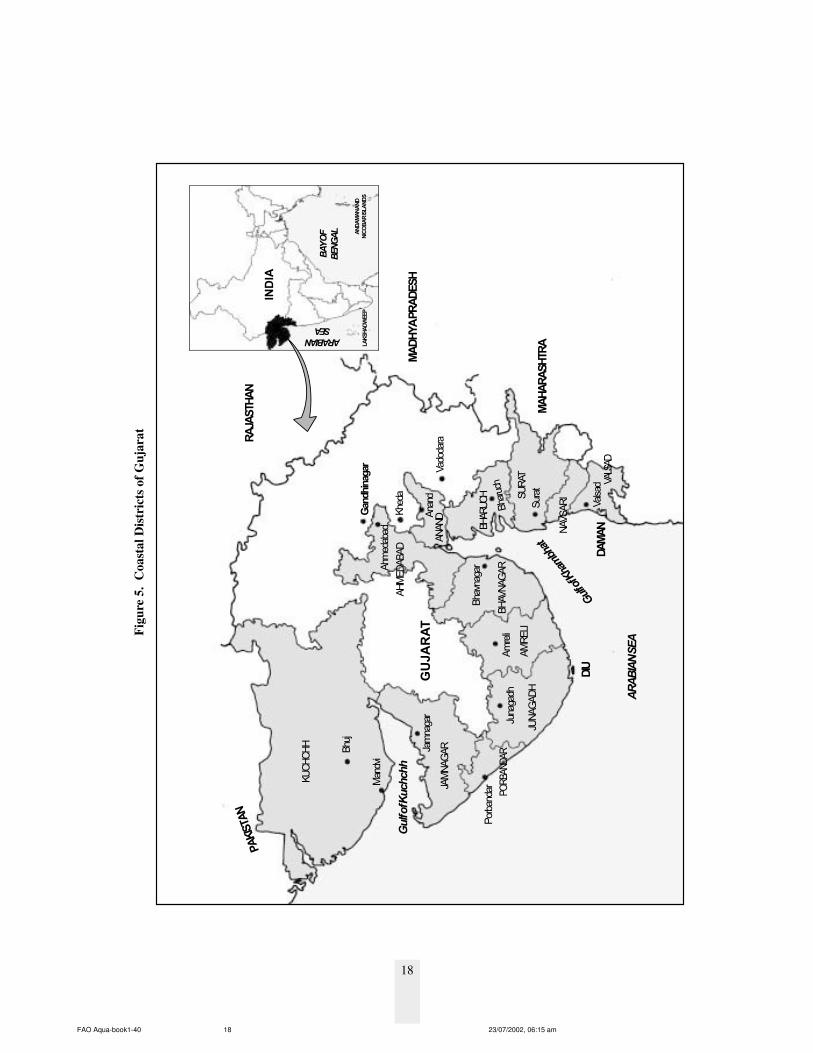
3.5.1 Gujarat
Gujarat is the northern-most maritime state on the west coast of India with a long coastline of 1 600 km and saltmarshes, sand-belts and gravel patches mark the coastal topography (Figure 5). The southern coast of the Gulfof Kutch is characterised by innumerable coral reefs, tidal mud flats and coral islands. The Rann of Kutch is avast expanse of tidal mud flats flaked with saline efflorescence.
The Gujarat coast, including the two Gulfs, is blessed with physical features congenial to the development offisheries and aquaculture. The area of the continental shelf of Gujarat is estimated at 184 000 sq. km and it isabout 34.0 % of the total shelf area of India. The maximum width of the continental shelf is 191 miles due westoff Umbergoan (Valsad district) and minimum width is 58 miles between Madhavpur and Miyani (Porbandardistrict). It is estimated that out of 2.02 million sq km of the EEZ available to the country, the west coastaccounts for 860 000 sq. km. The EEZ off Gujarat coast is estimated at 214 060 sq. km.
Gujarat with 376 000 ha of potential brackishwater land, occupies the second place among the maritime statesnext to West Bengal. However, only 997 ha have been developed for farming till 1997-1998. Out of the developedarea, only 316 ha were in operation during 1998 – 1999 (Figure 6). The low rate of development in the state isdue to the delay in developing lease policy and allotment of land to the different sectors by the state government.
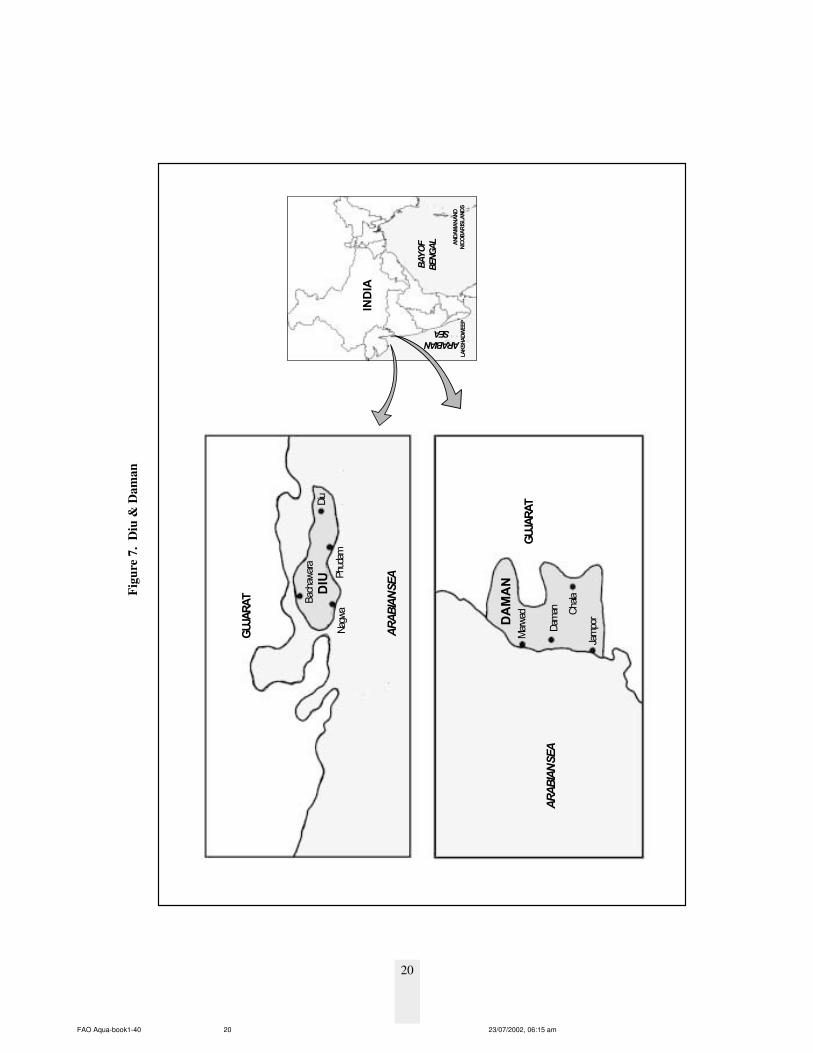
3.5.2 Daman and Diu
The Union Territory of Daman & Diu is situated on the west coast of India (Figure 7). Daman is bordered byMaharashtra in the south and Gujarat in the north and east. Diu is the southern-most point of the KathiawarPeninsula, Gujarat. Daman & Diu have a coastline of 27 km. Shrimp farming has not been taken up in thisUnion Territory due to lack of suitable areas along the small coastline.
FAO Aqua-book1-40 23/07/2002, 06:14 am17
18
GUJARAT
INDIA
Bhuj
MAHARASHTRA
RAJASTHAN
PAKISTAN
KUCHCHH Jamnagar
Bhavnagar
Gandhinagar
Kheda
Ahm
edabad
AHMEDABAD
Anand
ANAND
Vadodara
Bharuch
BHARUCH
VALSAD
Figu
re 5
. C
oast
al D
istr
icts
of G
ujar
at
ARABIAN
SEA
LAKSHADWEEP
BAY O
F
BEN
GA
L ANDAMAN AND
NICOBAR ISLANDS
AR
AB
IAN
SEA
DAMAN
DIU
Junagadh
JUNAGADH
Amreli
AMRELI
BHAVNAGAR
SuratSURAT
NAV
SARI
Valsad
Gulf o
f Kuchchh
Mandvi
JAMNAGAR
Porbandar PORBANDAR
MADHYA PRADESH
Gulf of K
ham
bhat
FAO Aqua-book1-40 23/07/2002, 06:15 am18
19
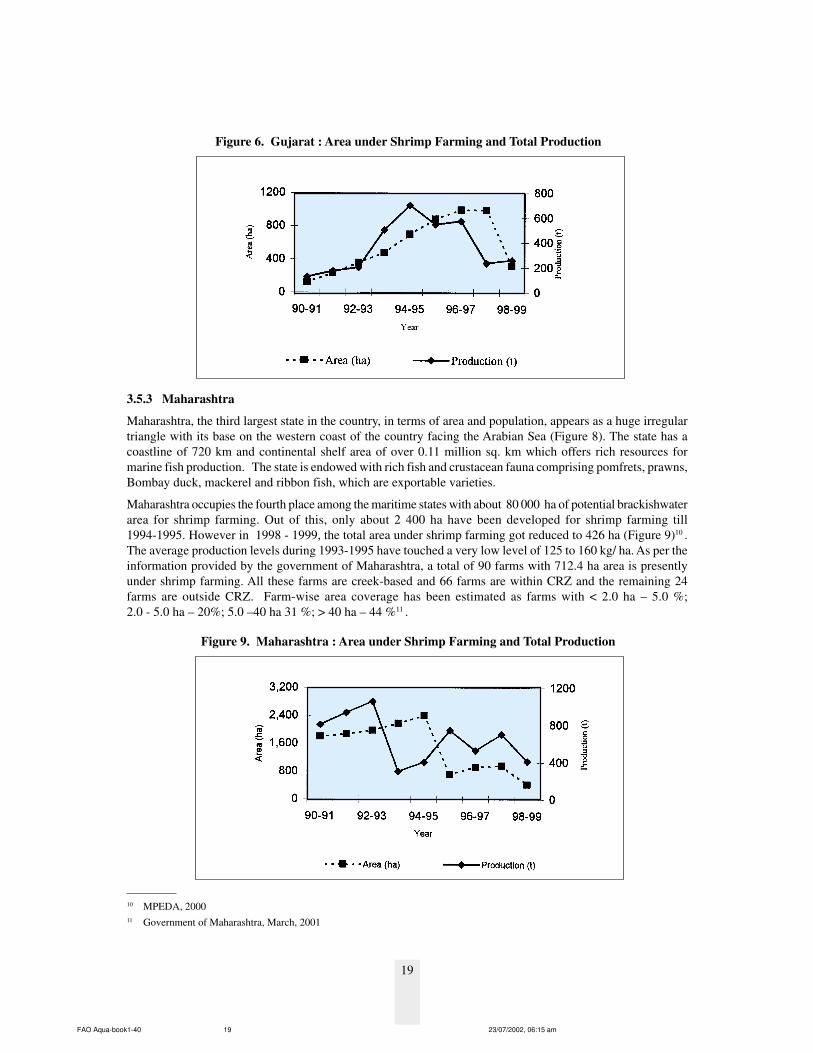
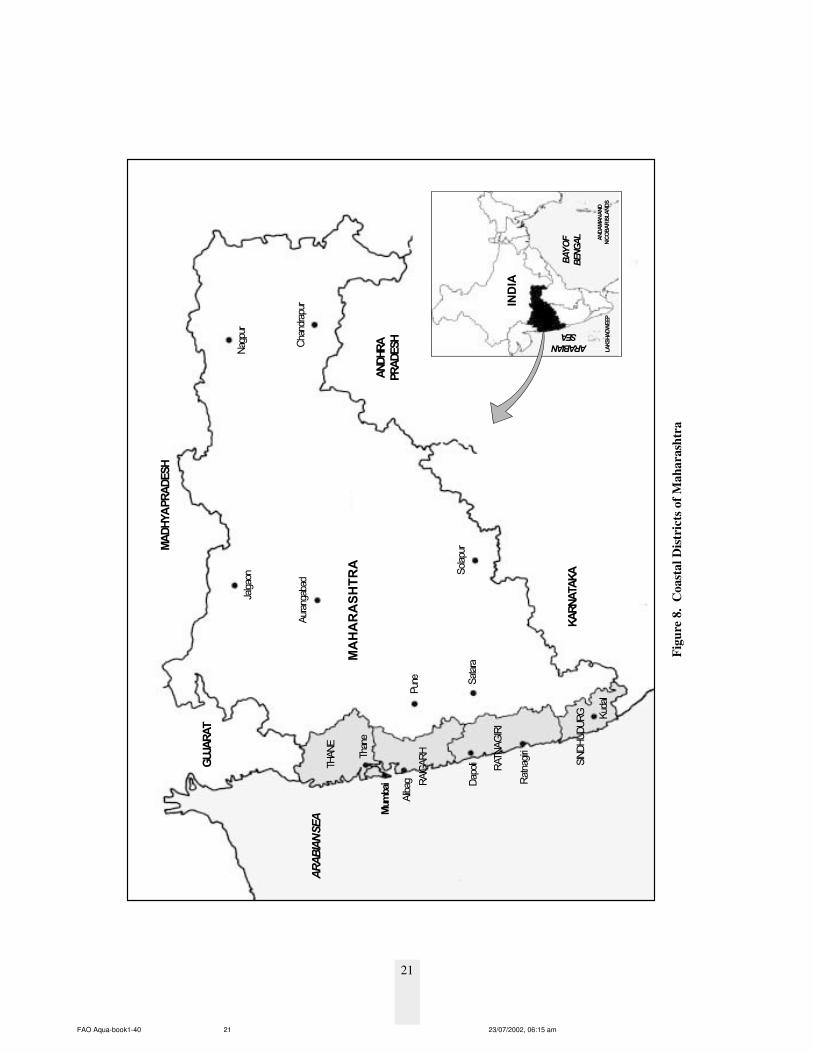
3.5.3 Maharashtra
Maharashtra, the third largest state in the country, in terms of area and population, appears as a huge irregulartriangle with its base on the western coast of the country facing the Arabian Sea (Figure 8). The state has acoastline of 720 km and continental shelf area of over 0.11 million sq. km which offers rich resources formarine fish production. The state is endowed with rich fish and crustacean fauna comprising pomfrets, prawns,Bombay duck, mackerel and ribbon fish, which are exportable varieties.
Maharashtra occupies the fourth place among the maritime states with about 80 000 ha of potential brackishwaterarea for shrimp farming. Out of this, only about 2 400 ha have been developed for shrimp farming till1994-1995. However in 1998 - 1999, the total area under shrimp farming got reduced to 426 ha (Figure 9)10 .The average production levels during 1993-1995 have touched a very low level of 125 to 160 kg/ ha. As per theinformation provided by the government of Maharashtra, a total of 90 farms with 712.4 ha area is presentlyunder shrimp farming. All these farms are creek-based and 66 farms are within CRZ and the remaining 24farms are outside CRZ. Farm-wise area coverage has been estimated as farms with < 2.0 ha – 5.0 %;2.0 - 5.0 ha – 20%; 5.0 –40 ha 31 %; > 40 ha – 44 %11 .
10 MPEDA, 200011 Government of Maharashtra, March, 2001
Figure 9. Maharashtra : Area under Shrimp Farming and Total Production
Figure 6. Gujarat : Area under Shrimp Farming and Total Production
FAO Aqua-book1-40 23/07/2002, 06:15 am19
20
INDIA
AR
AB
IAN
SEA
GUJARAT
Figu
re 7
. D
iu &
Dam
an
DIU
GUJARAT
Nagwa
Bachawara
Phudam
Diu
DAMAN
AR
AB
IAN
SEA
Marwad
Dam
an Chala
Jampor
BAY O
F
BEN
GA
L
ARABIAN
SEA
LAKSHADWEEP
ANDAMAN AND
NICOBAR ISLANDS
FAO Aqua-book1-40 23/07/2002, 06:15 am20
21
INDIA
MAHARASHTRA
Aurangabad
Jalgaon
Pune
Satara
KARNATAKA
ANDHRA
PRADESH
MADHYA PRADESH
GUJARAT
Solapur
Chandrapur
Nagpur
Thane
THANE
RATNAGIRI
Figu
re 8
. C
oast
al D
istr
icts
of M
ahar
asht
ra
BAY O
F
BEN
GA
L
ARABIAN
SEA
LAKSHADWEEP
ANDAMAN AND
NICOBAR ISLANDS
AR
AB
IAN
SEA
Mumbai RAIGARH
Dapoli
Ratnagiri
Alibag
SINDHUDURG Kudal
FAO Aqua-book1-40 23/07/2002, 06:15 am21
22
3.5.4 Goa
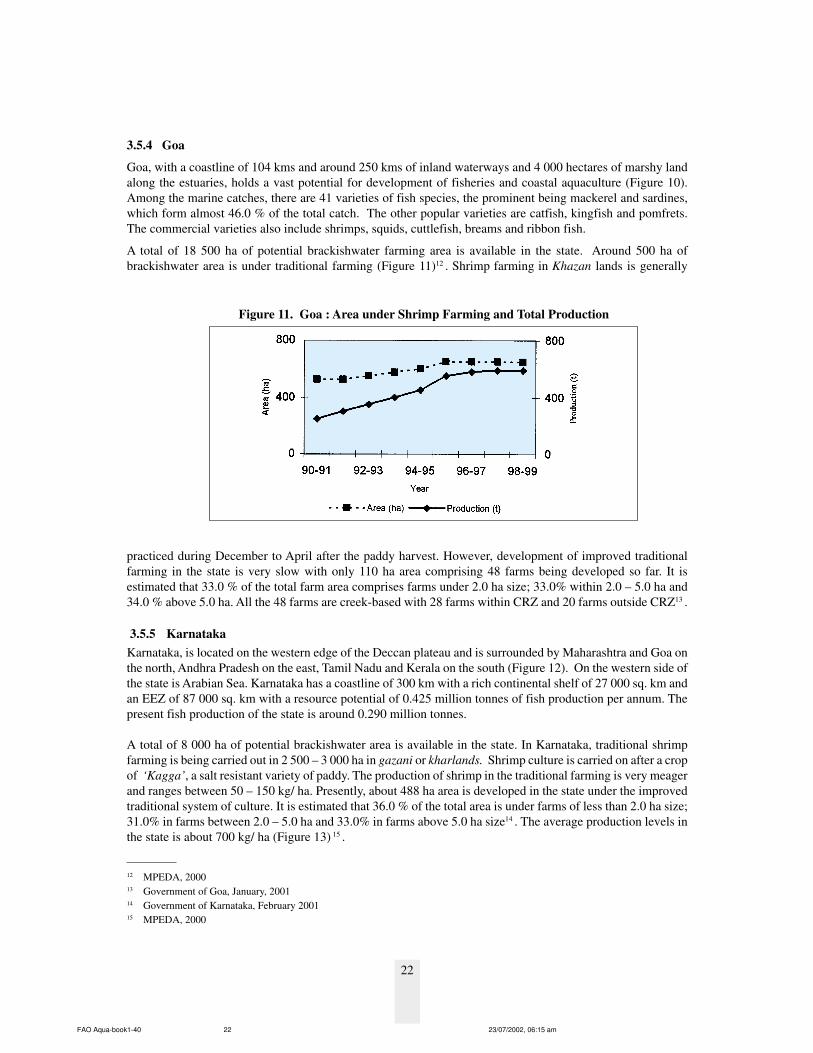
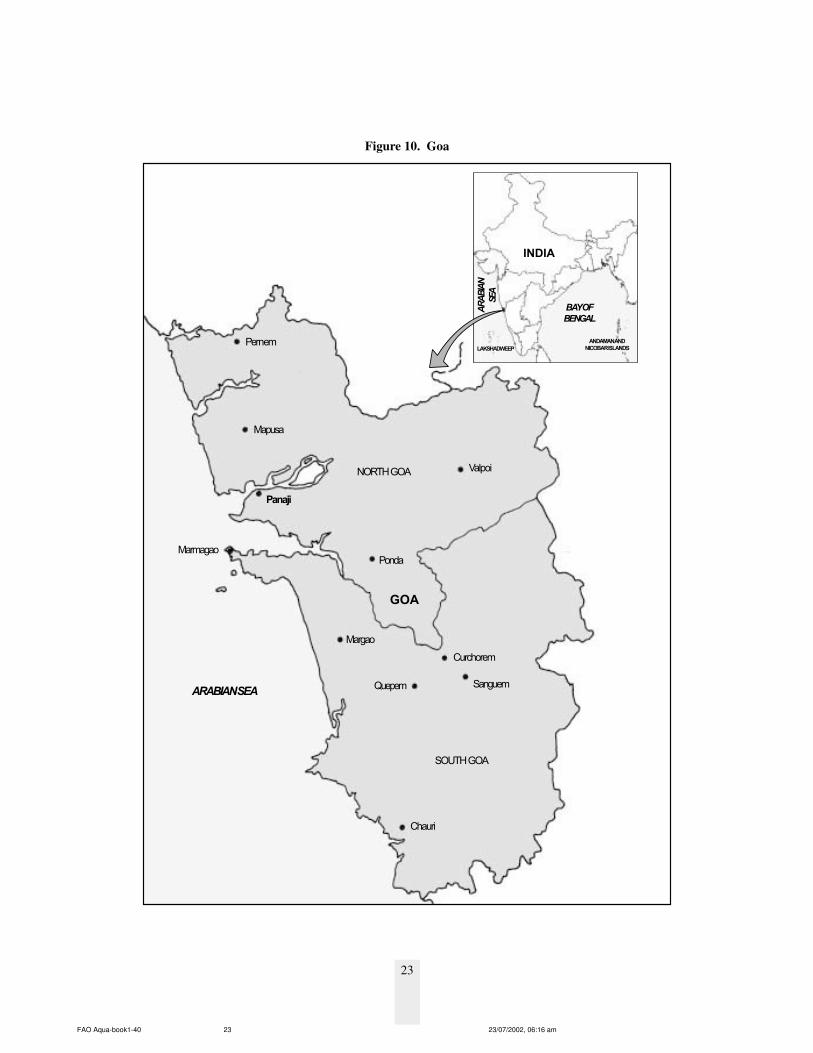
Goa, with a coastline of 104 kms and around 250 kms of inland waterways and 4 000 hectares of marshy landalong the estuaries, holds a vast potential for development of fisheries and coastal aquaculture (Figure 10).Among the marine catches, there are 41 varieties of fish species, the prominent being mackerel and sardines,which form almost 46.0 % of the total catch. The other popular varieties are catfish, kingfish and pomfrets.The commercial varieties also include shrimps, squids, cuttlefish, breams and ribbon fish.
A total of 18 500 ha of potential brackishwater farming area is available in the state. Around 500 ha ofbrackishwater area is under traditional farming (Figure 11)12 . Shrimp farming in Khazan lands is generally
practiced during December to April after the paddy harvest. However, development of improved traditionalfarming in the state is very slow with only 110 ha area comprising 48 farms being developed so far. It isestimated that 33.0 % of the total farm area comprises farms under 2.0 ha size; 33.0% within 2.0 – 5.0 ha and34.0 % above 5.0 ha. All the 48 farms are creek-based with 28 farms within CRZ and 20 farms outside CRZ13 .
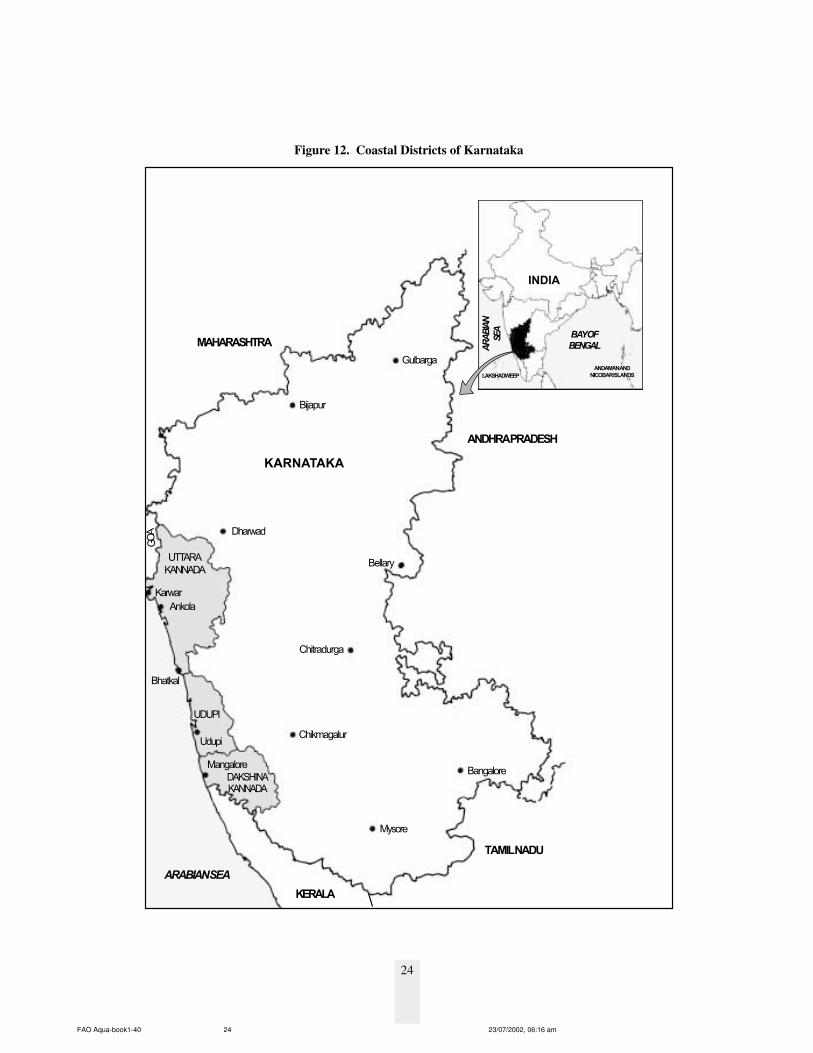
3.5.5 KarnatakaKarnataka, is located on the western edge of the Deccan plateau and is surrounded by Maharashtra and Goa onthe north, Andhra Pradesh on the east, Tamil Nadu and Kerala on the south (Figure 12). On the western side ofthe state is Arabian Sea. Karnataka has a coastline of 300 km with a rich continental shelf of 27 000 sq. km andan EEZ of 87 000 sq. km with a resource potential of 0.425 million tonnes of fish production per annum. Thepresent fish production of the state is around 0.290 million tonnes.
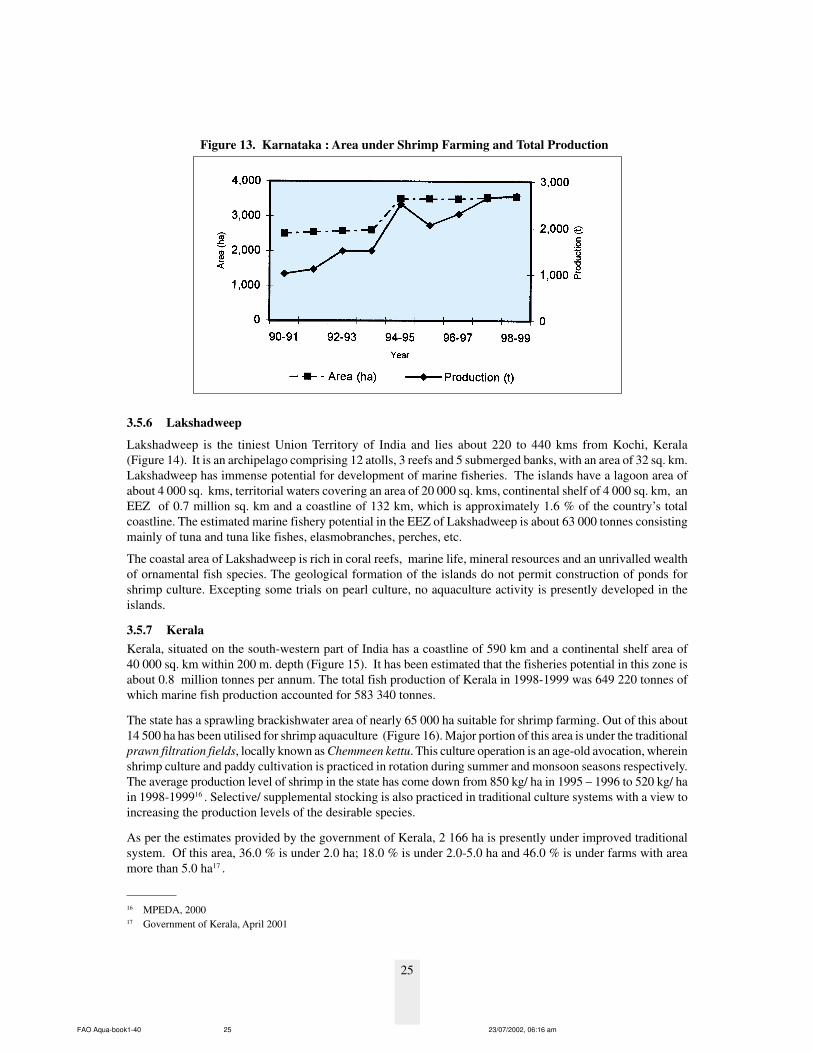
A total of 8 000 ha of potential brackishwater area is available in the state. In Karnataka, traditional shrimpfarming is being carried out in 2 500 – 3 000 ha in gazani or kharlands. Shrimp culture is carried on after a cropof ‘Kagga’, a salt resistant variety of paddy. The production of shrimp in the traditional farming is very meagerand ranges between 50 – 150 kg/ ha. Presently, about 488 ha area is developed in the state under the improvedtraditional system of culture. It is estimated that 36.0 % of the total area is under farms of less than 2.0 ha size;31.0% in farms between 2.0 – 5.0 ha and 33.0% in farms above 5.0 ha size14 . The average production levels inthe state is about 700 kg/ ha (Figure 13) 15 .
12 MPEDA, 200013 Government of Goa, January, 200114 Government of Karnataka, February 200115 MPEDA, 2000
Figure 11. Goa : Area under Shrimp Farming and Total Production
FAO Aqua-book1-40 23/07/2002, 06:15 am22
23
Figure 10. Goa
GOA
Pernem
Valpoi
Ponda
Margao
Curchorem
SanguemQuepem
Chauri
SOUTH GOA
NORTH GOA
ARABIAN SEA
Mapusa
Panaji
Marmagao
BAY OF
BENGAL
AR
AB
IAN
SEA
LAKSHADWEEP
ANDAMAN AND
NICOBAR ISLANDS
INDIA
FAO Aqua-book1-40 23/07/2002, 06:16 am23
24
Figure 12. Coastal Districts of Karnataka
KARNATAKA
TAMIL NADU
Gulbarga
ANDHRA PRADESH
MAHARASHTRA
Bijapur
Dharwad
Bellary
Chitradurga
Chikmagalur
Bangalore
Mysore
GOA
UTTARA
KANNADA
Mangalore
DAKSHINAKANNADA
ARABIAN SEA
Karwar
Ankola
Bhatkal
Udupi
UDUPI
KERALA
INDIA
BAY OF
BENGAL
LAKSHADWEEP
ANDAMAN AND
NICOBAR ISLANDS
AR
AB
IAN
SEA
FAO Aqua-book1-40 23/07/2002, 06:16 am24
25
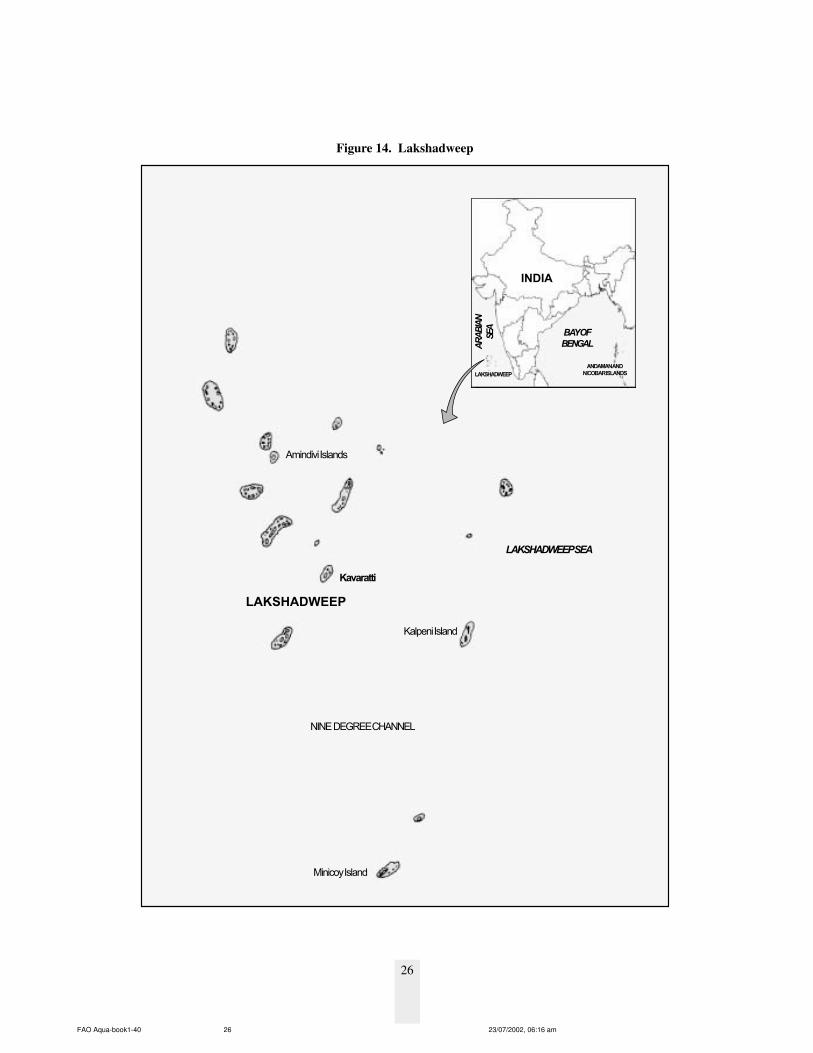
3.5.6 Lakshadweep
Lakshadweep is the tiniest Union Territory of India and lies about 220 to 440 kms from Kochi, Kerala(Figure 14). It is an archipelago comprising 12 atolls, 3 reefs and 5 submerged banks, with an area of 32 sq. km.Lakshadweep has immense potential for development of marine fisheries. The islands have a lagoon area ofabout 4 000 sq. kms, territorial waters covering an area of 20 000 sq. kms, continental shelf of 4 000 sq. km, anEEZ of 0.7 million sq. km and a coastline of 132 km, which is approximately 1.6 % of the country’s totalcoastline. The estimated marine fishery potential in the EEZ of Lakshadweep is about 63 000 tonnes consistingmainly of tuna and tuna like fishes, elasmobranches, perches, etc.
The coastal area of Lakshadweep is rich in coral reefs, marine life, mineral resources and an unrivalled wealthof ornamental fish species. The geological formation of the islands do not permit construction of ponds forshrimp culture. Excepting some trials on pearl culture, no aquaculture activity is presently developed in theislands.
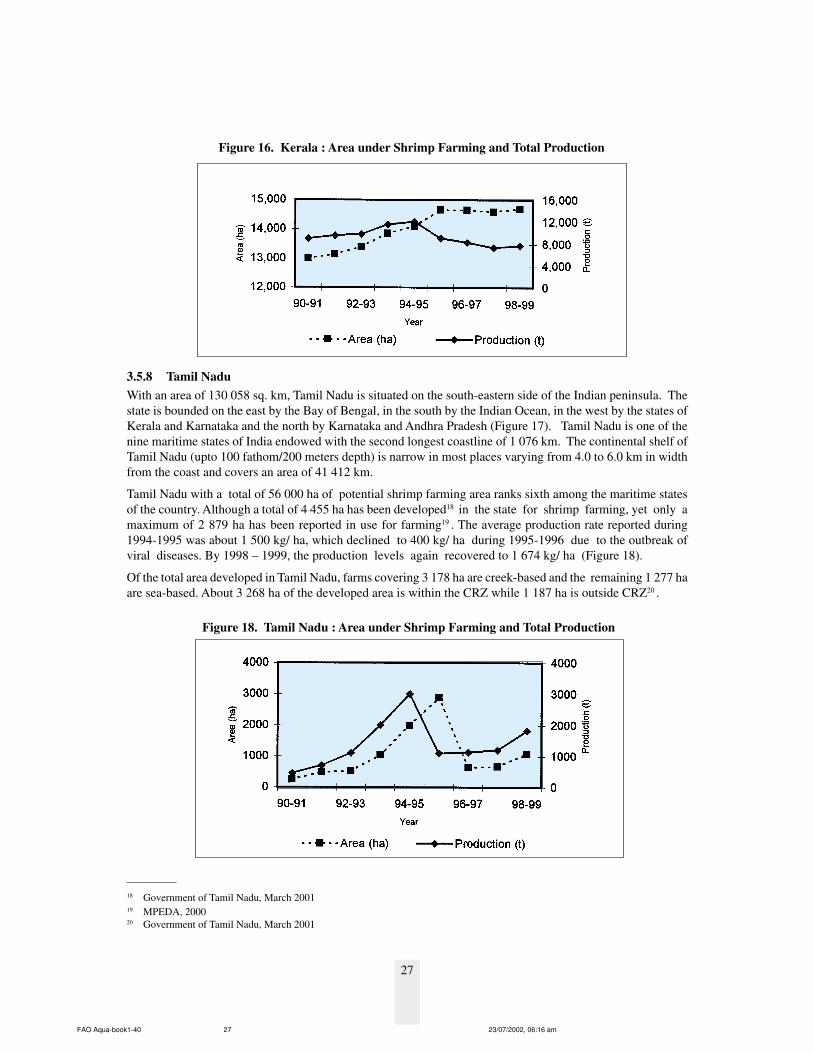
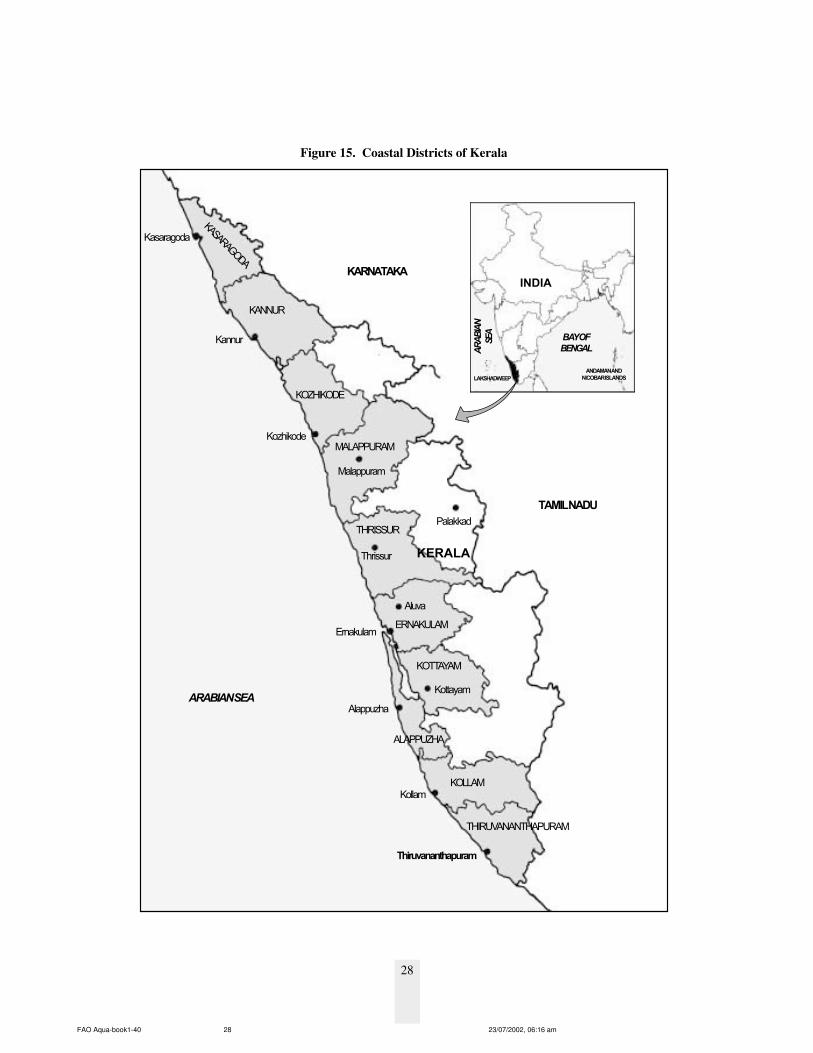
3.5.7 KeralaKerala, situated on the south-western part of India has a coastline of 590 km and a continental shelf area of40 000 sq. km within 200 m. depth (Figure 15). It has been estimated that the fisheries potential in this zone isabout 0.8 million tonnes per annum. The total fish production of Kerala in 1998-1999 was 649 220 tonnes ofwhich marine fish production accounted for 583 340 tonnes.
The state has a sprawling brackishwater area of nearly 65 000 ha suitable for shrimp farming. Out of this about14 500 ha has been utilised for shrimp aquaculture (Figure 16). Major portion of this area is under the traditionalprawn filtration fields, locally known as Chemmeen kettu. This culture operation is an age-old avocation, whereinshrimp culture and paddy cultivation is practiced in rotation during summer and monsoon seasons respectively.The average production level of shrimp in the state has come down from 850 kg/ ha in 1995 – 1996 to 520 kg/ hain 1998-199916 . Selective/ supplemental stocking is also practiced in traditional culture systems with a view toincreasing the production levels of the desirable species.
As per the estimates provided by the government of Kerala, 2 166 ha is presently under improved traditionalsystem. Of this area, 36.0 % is under 2.0 ha; 18.0 % is under 2.0-5.0 ha and 46.0 % is under farms with areamore than 5.0 ha17 .
16 MPEDA, 200017 Government of Kerala, April 2001
Figure 13. Karnataka : Area under Shrimp Farming and Total Production
FAO Aqua-book1-40 23/07/2002, 06:16 am25
26
Figure 14. Lakshadweep
LAKSHADWEEP
Amindivi Islands
Minicoy Island
NINE DEGREE CHANNEL
LAKSHADWEEP SEA
Kalpeni Island
Kavaratti
BAY OF
BENGAL
ANDAMAN AND
NICOBAR ISLANDS
INDIA
AR
AB
IAN
SEA
LAKSHADWEEP
FAO Aqua-book1-40 23/07/2002, 06:16 am26
27
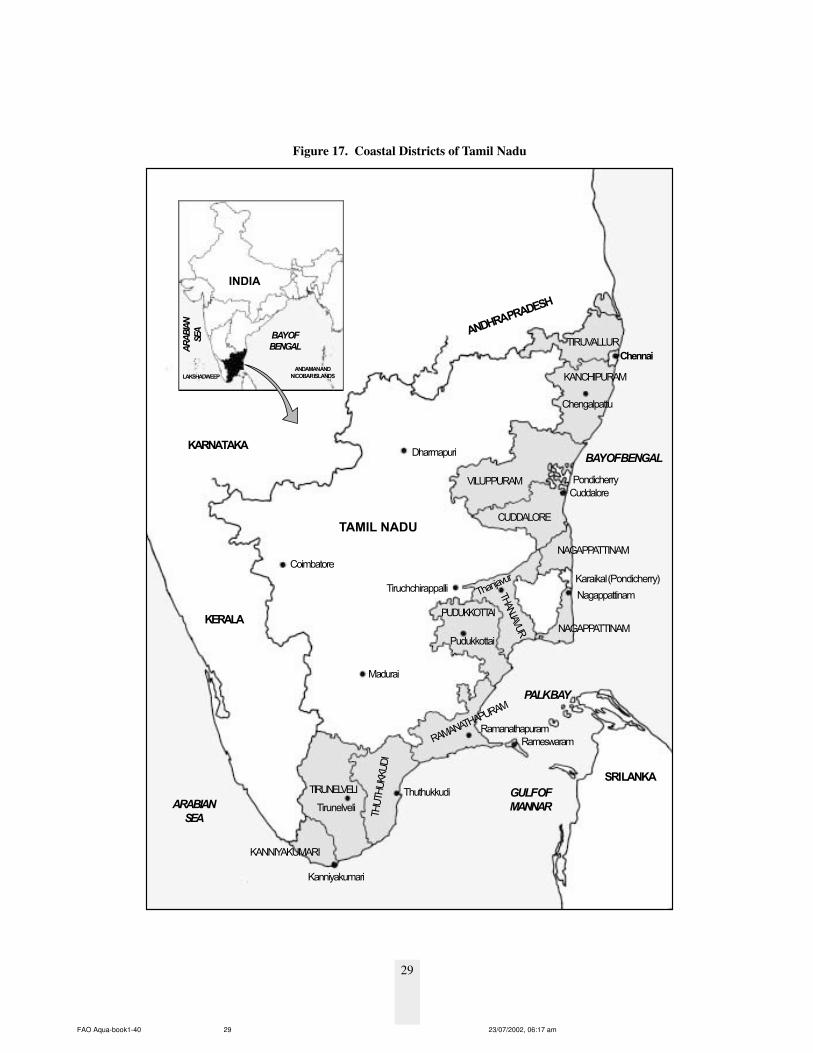
3.5.8 Tamil NaduWith an area of 130 058 sq. km, Tamil Nadu is situated on the south-eastern side of the Indian peninsula. Thestate is bounded on the east by the Bay of Bengal, in the south by the Indian Ocean, in the west by the states ofKerala and Karnataka and the north by Karnataka and Andhra Pradesh (Figure 17). Tamil Nadu is one of thenine maritime states of India endowed with the second longest coastline of 1 076 km. The continental shelf ofTamil Nadu (upto 100 fathom/200 meters depth) is narrow in most places varying from 4.0 to 6.0 km in widthfrom the coast and covers an area of 41 412 km.
Tamil Nadu with a total of 56 000 ha of potential shrimp farming area ranks sixth among the maritime statesof the country. Although a total of 4 455 ha has been developed18 in the state for shrimp farming, yet only amaximum of 2 879 ha has been reported in use for farming19 . The average production rate reported during1994-1995 was about 1 500 kg/ ha, which declined to 400 kg/ ha during 1995-1996 due to the outbreak ofviral diseases. By 1998 – 1999, the production levels again recovered to 1 674 kg/ ha (Figure 18).
Of the total area developed in Tamil Nadu, farms covering 3 178 ha are creek-based and the remaining 1 277 haare sea-based. About 3 268 ha of the developed area is within the CRZ while 1 187 ha is outside CRZ20 .
18 Government of Tamil Nadu, March 200119 MPEDA, 200020 Government of Tamil Nadu, March 2001
Figure 16. Kerala : Area under Shrimp Farming and Total Production
Figure 18. Tamil Nadu : Area under Shrimp Farming and Total Production
FAO Aqua-book1-40 23/07/2002, 06:16 am27
28
Figure 15. Coastal Districts of Kerala
KERALA
Kasaragoda
KASARAGODA
Palakkad
ERNAKULAM
KOTTAYAM
Kottayam
ALAPPUZHA
KOLLAM
THIRUVANANTHAPURAM
TAMIL NADU
BAY OF
BENGAL
ANDAMAN AND
NICOBAR ISLANDS
INDIA
AR
AB
IAN
SEA
LAKSHADWEEP
KARNATAKA
Thrissur
Kannur
KANNUR
Kozhikode
KOZHIKODE
Malappuram
MALAPPURAM
THRISSUR
Aluva
Ernakulam
Alappuzha
Kollam
ARABIAN SEA
Thiruvananthapuram
FAO Aqua-book1-40 23/07/2002, 06:16 am28
29
Figure 17. Coastal Districts of Tamil Nadu
TAMIL NADU
Coimbatore
KARNATAKA
Tiruchchirappalli
Madurai
THUTHUKKUDI
RamanathapuramRA
MANAT
HAPU
RAM
Pudukkottai
PUDUKKOTTAI
Thanjav
ur
CUDDALORE
VILUPPURAM
ANDHRA PRADESH
BAY OF BENGAL
Rameswaram
PALK BAY
THAN
JAVUR
Nagappattinam
Karaikal (Pondicherry)
NAGAPPATTINAM
Cuddalore
Pondicherry
Chengalpattu
Chennai
KANCHIPURAM
TIRUVALLUR
SRI LANKA
NAGAPPATTINAMKERALA
Kanniyakumari
Thuthukkudi GULF OF
MANNAR
TIRUNELVELI
Tirunelveli
KANNIYAKUMARI
Dharmapuri
ARABIAN
SEA
INDIA
BAY OF
BENGAL
ANDAMAN AND
NICOBAR ISLANDS
AR
AB
IAN
SEA
LAKSHADWEEP
FAO Aqua-book1-40 23/07/2002, 06:17 am29
30
3.5.9 Pondicherry
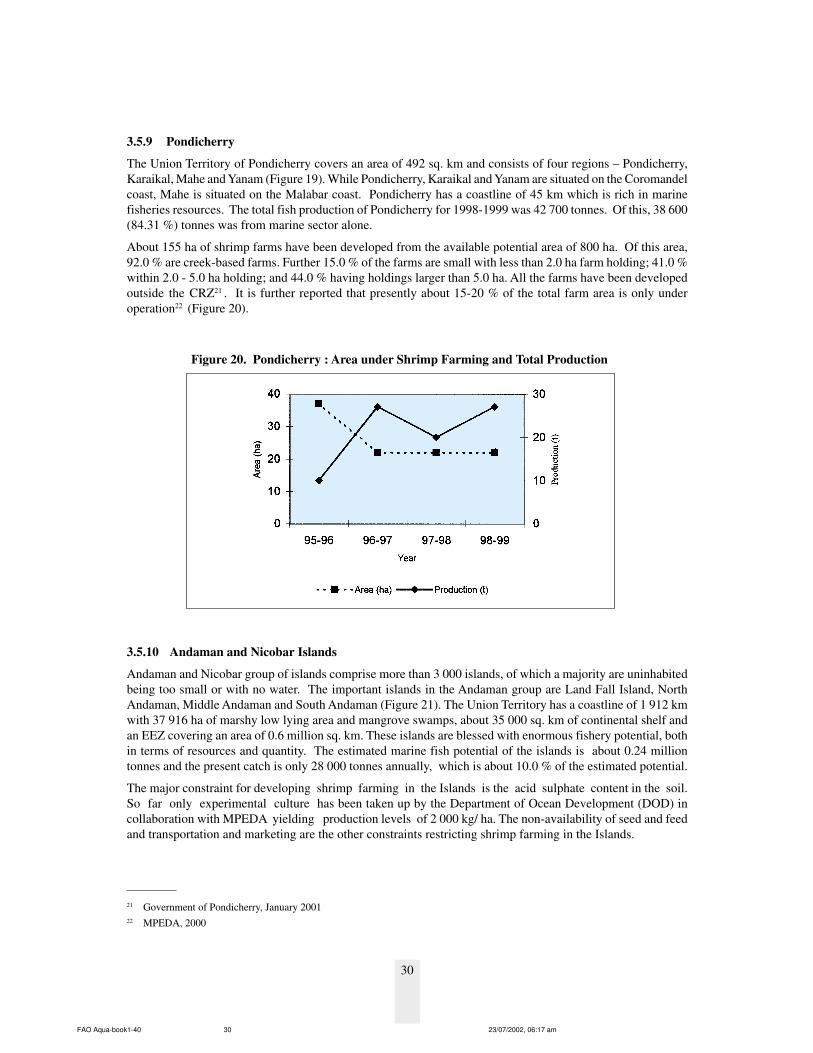
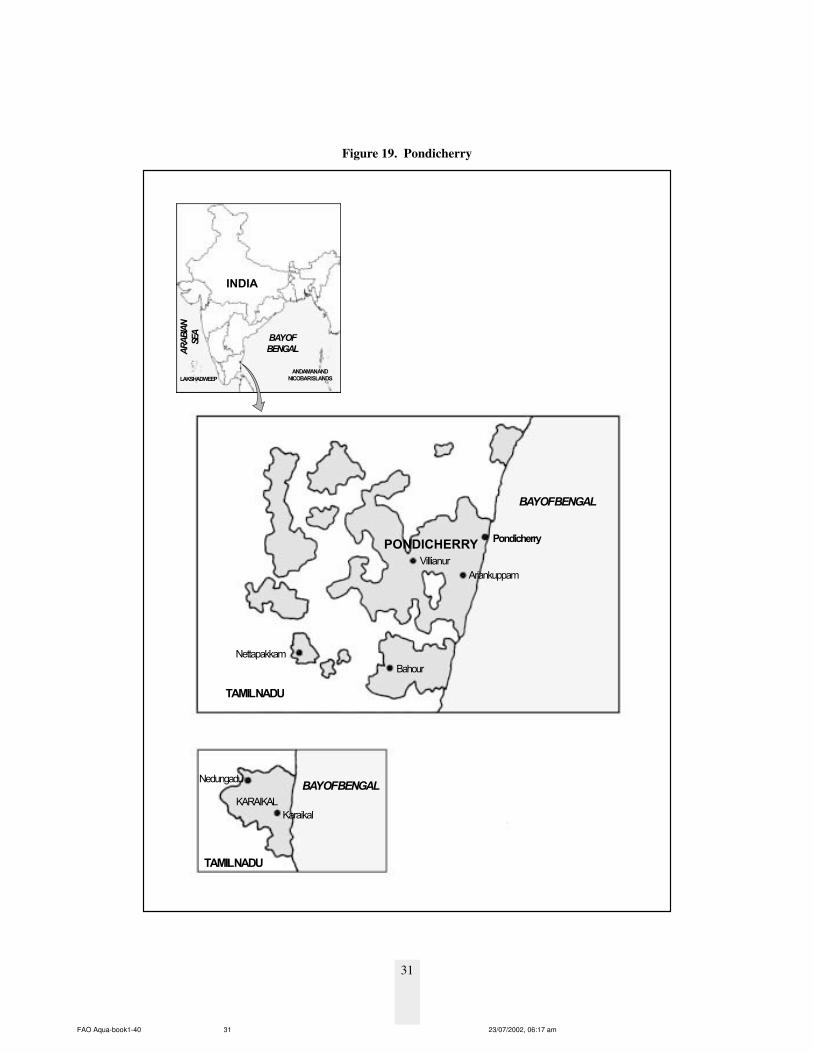
The Union Territory of Pondicherry covers an area of 492 sq. km and consists of four regions – Pondicherry,Karaikal, Mahe and Yanam (Figure 19). While Pondicherry, Karaikal and Yanam are situated on the Coromandelcoast, Mahe is situated on the Malabar coast. Pondicherry has a coastline of 45 km which is rich in marinefisheries resources. The total fish production of Pondicherry for 1998-1999 was 42 700 tonnes. Of this, 38 600(84.31 %) tonnes was from marine sector alone.
About 155 ha of shrimp farms have been developed from the available potential area of 800 ha. Of this area,92.0 % are creek-based farms. Further 15.0 % of the farms are small with less than 2.0 ha farm holding; 41.0 %within 2.0 - 5.0 ha holding; and 44.0 % having holdings larger than 5.0 ha. All the farms have been developedoutside the CRZ21 . It is further reported that presently about 15-20 % of the total farm area is only underoperation22 (Figure 20).
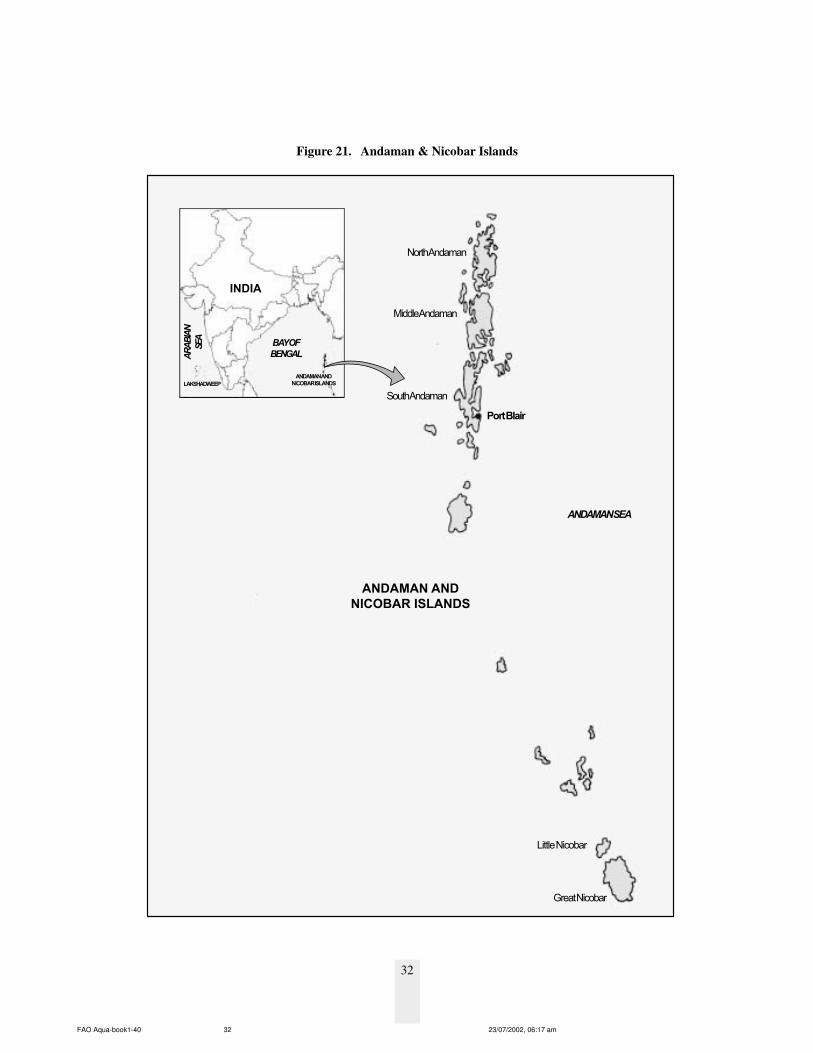
3.5.10 Andaman and Nicobar Islands
Andaman and Nicobar group of islands comprise more than 3 000 islands, of which a majority are uninhabitedbeing too small or with no water. The important islands in the Andaman group are Land Fall Island, NorthAndaman, Middle Andaman and South Andaman (Figure 21). The Union Territory has a coastline of 1 912 kmwith 37 916 ha of marshy low lying area and mangrove swamps, about 35 000 sq. km of continental shelf andan EEZ covering an area of 0.6 million sq. km. These islands are blessed with enormous fishery potential, bothin terms of resources and quantity. The estimated marine fish potential of the islands is about 0.24 milliontonnes and the present catch is only 28 000 tonnes annually, which is about 10.0 % of the estimated potential.
The major constraint for developing shrimp farming in the Islands is the acid sulphate content in the soil.So far only experimental culture has been taken up by the Department of Ocean Development (DOD) incollaboration with MPEDA yielding production levels of 2 000 kg/ ha. The non-availability of seed and feedand transportation and marketing are the other constraints restricting shrimp farming in the Islands.
21 Government of Pondicherry, January 200122 MPEDA, 2000
Figure 20. Pondicherry : Area under Shrimp Farming and Total Production
FAO Aqua-book1-40 23/07/2002, 06:17 am30
31
Figure 19. Pondicherry
PONDICHERRY
TAMIL NADU
Villianur
Nettapakkam
Bahour
TAMIL NADU
BAY OF BENGAL
KARAIKAL
Karaikal
Nedungadu
BAY OF BENGAL
Pondicherry
Ariankuppam
INDIA
BAY OF
BENGAL
LAKSHADWEEP
ANDAMAN AND
NICOBAR ISLANDS
AR
AB
IAN
SEA
FAO Aqua-book1-40 23/07/2002, 06:17 am31
32
Figure 21. Andaman & Nicobar Islands
North Andaman
ANDAMAN AND
NICOBAR ISLANDS
ANDAMAN SEA
Middle Andaman
South Andaman
Port Blair
Little Nicobar
Great Nicobar
INDIA
BAY OF
BENGAL
ANDAMAN AND
NICOBAR ISLANDSLAKSHADWEEP
AR
AB
IAN
SEA
FAO Aqua-book1-40 23/07/2002, 06:17 am32
33
3.5.11 Andhra Pradesh
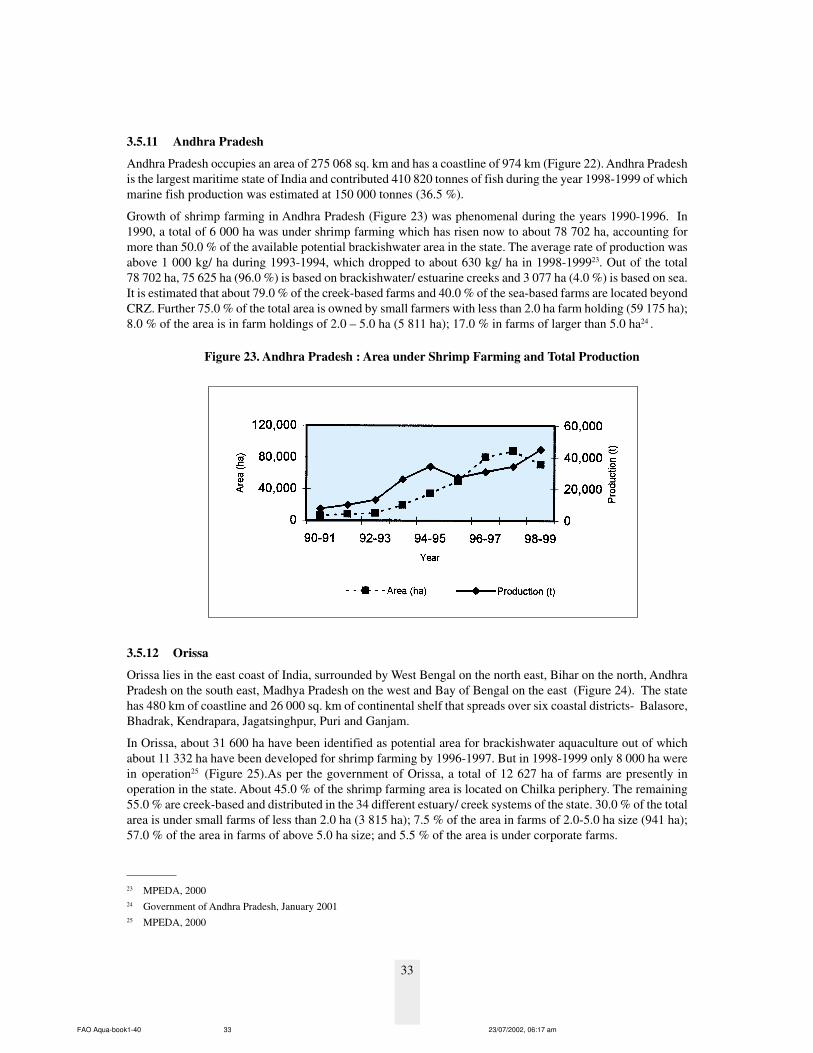
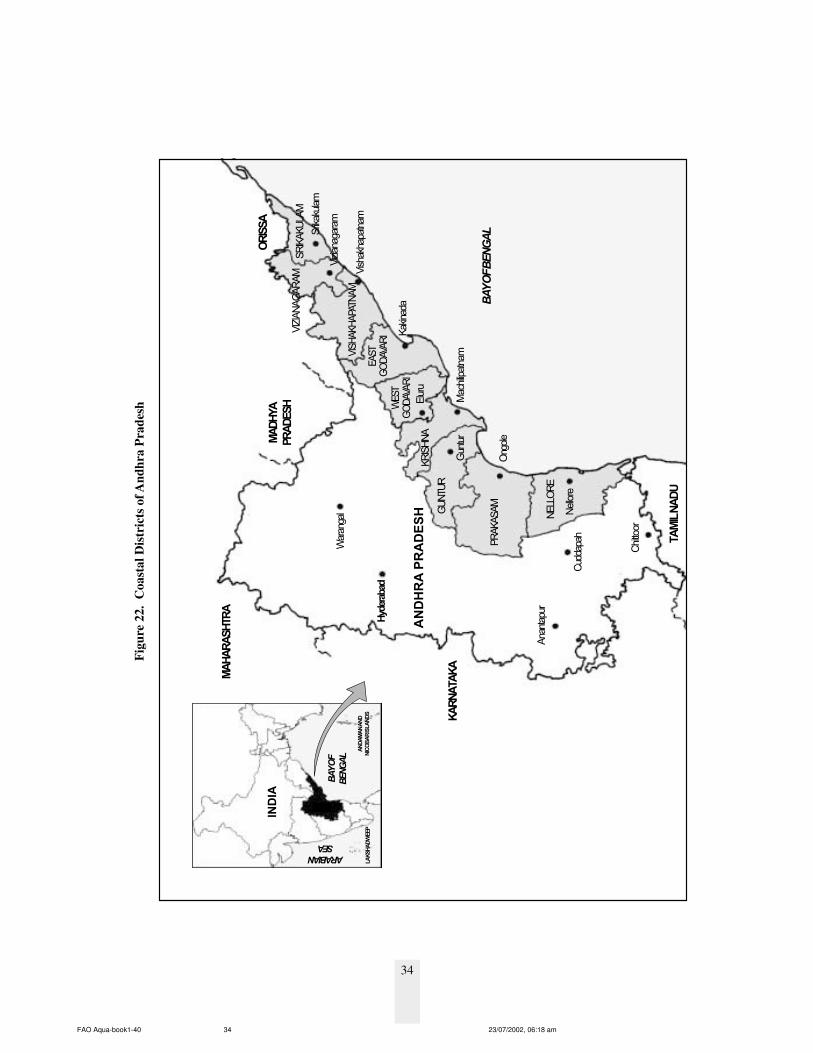
Andhra Pradesh occupies an area of 275 068 sq. km and has a coastline of 974 km (Figure 22). Andhra Pradeshis the largest maritime state of India and contributed 410 820 tonnes of fish during the year 1998-1999 of whichmarine fish production was estimated at 150 000 tonnes (36.5 %).
Growth of shrimp farming in Andhra Pradesh (Figure 23) was phenomenal during the years 1990-1996. In1990, a total of 6 000 ha was under shrimp farming which has risen now to about 78 702 ha, accounting formore than 50.0 % of the available potential brackishwater area in the state. The average rate of production wasabove 1 000 kg/ ha during 1993-1994, which dropped to about 630 kg/ ha in 1998-199923. Out of the total78 702 ha, 75 625 ha (96.0 %) is based on brackishwater/ estuarine creeks and 3 077 ha (4.0 %) is based on sea.It is estimated that about 79.0 % of the creek-based farms and 40.0 % of the sea-based farms are located beyondCRZ. Further 75.0 % of the total area is owned by small farmers with less than 2.0 ha farm holding (59 175 ha);8.0 % of the area is in farm holdings of 2.0 – 5.0 ha (5 811 ha); 17.0 % in farms of larger than 5.0 ha24 .
3.5.12 Orissa
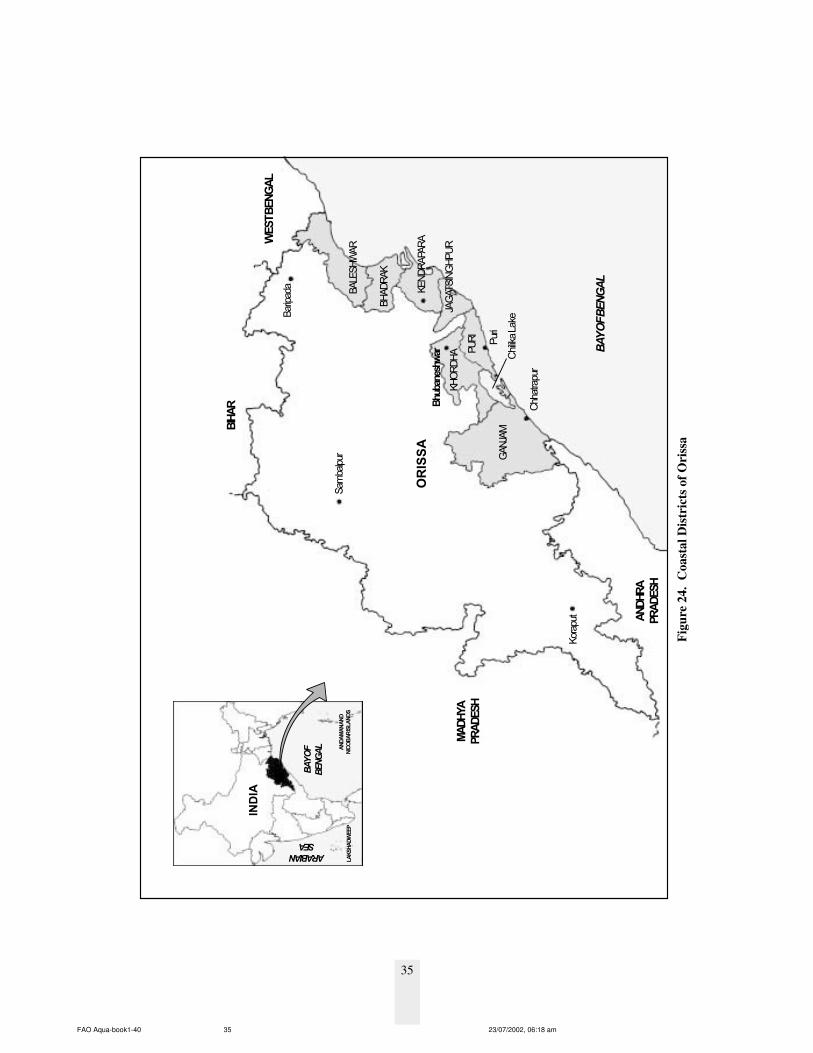
Orissa lies in the east coast of India, surrounded by West Bengal on the north east, Bihar on the north, AndhraPradesh on the south east, Madhya Pradesh on the west and Bay of Bengal on the east (Figure 24). The statehas 480 km of coastline and 26 000 sq. km of continental shelf that spreads over six coastal districts- Balasore,Bhadrak, Kendrapara, Jagatsinghpur, Puri and Ganjam.
In Orissa, about 31 600 ha have been identified as potential area for brackishwater aquaculture out of whichabout 11 332 ha have been developed for shrimp farming by 1996-1997. But in 1998-1999 only 8 000 ha werein operation25 (Figure 25).As per the government of Orissa, a total of 12 627 ha of farms are presently inoperation in the state. About 45.0 % of the shrimp farming area is located on Chilka periphery. The remaining55.0 % are creek-based and distributed in the 34 different estuary/ creek systems of the state. 30.0 % of the totalarea is under small farms of less than 2.0 ha (3 815 ha); 7.5 % of the area in farms of 2.0-5.0 ha size (941 ha);57.0 % of the area in farms of above 5.0 ha size; and 5.5 % of the area is under corporate farms.
23 MPEDA, 200024 Government of Andhra Pradesh, January 200125 MPEDA, 2000
Figure 23. Andhra Pradesh : Area under Shrimp Farming and Total Production
FAO Aqua-book1-40 23/07/2002, 06:17 am33
34
Figu
re 2
2. C
oast
al D
istr
icts
of A
ndhr
a Pr
ades
h
INDIA
ARABIAN
SEA
ANDAMAN AND
NICOBAR ISLANDS
ANDHRA PRADESH
TAMIL NADU
BAY O
F B
EN
GA
L
KARNATAKA
MAHARASHTRA
Warangal
Hyderabad
MADHYA
PRADESH
Cuddapah
Anantapur
Chittoor
Nellore
NELLORE
Ongole
PRAKASAM
Guntur
GUNTU
R
Machilipatnam
KRISHNA
Eluru
WEST
GODAVARI
EAST
GODAVARIV
IZIANAGARAM
VISHAKHAPATN
AM
Vishakhapatnam
Vizianagaram
Srikakulam
SRIKAKULAM
ORISSA
Kakinada
BAY O
F
BEN
GA
L
LAKSHADWEEP
FAO Aqua-book1-40 23/07/2002, 06:18 am34
35
ARABIAN
SEA
LAKSHADWEEP
Figu
re 2
4. C
oast
al D
istr
icts
of O
riss
a
Sam
balpur
ORISSA
MADHYA
PRADESH
ANDHRA
PRADESH
Koraput
BIHAR
Baripada
KHORDHA
Bhubaneshwar
WEST BENGAL
INDIA
BAY O
F
BEN
GA
L ANDAMAN AND
NICOBAR ISLANDS
BAY O
F B
EN
GA
L
GANJAM
Chhatrapur
PURI
BHADRAK
BALESHWAR
KENDRAPARA
JAGATSINGHPUR
Puri
Chilika Lake
FAO Aqua-book1-40 23/07/2002, 06:18 am35
36
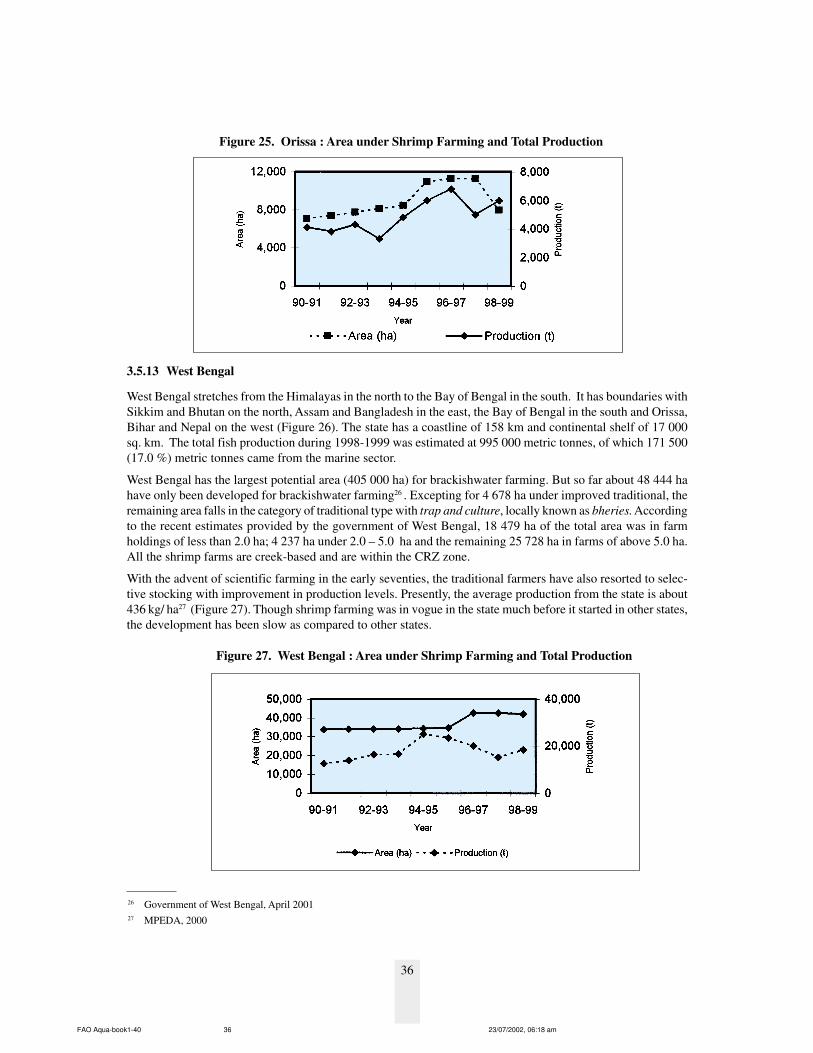
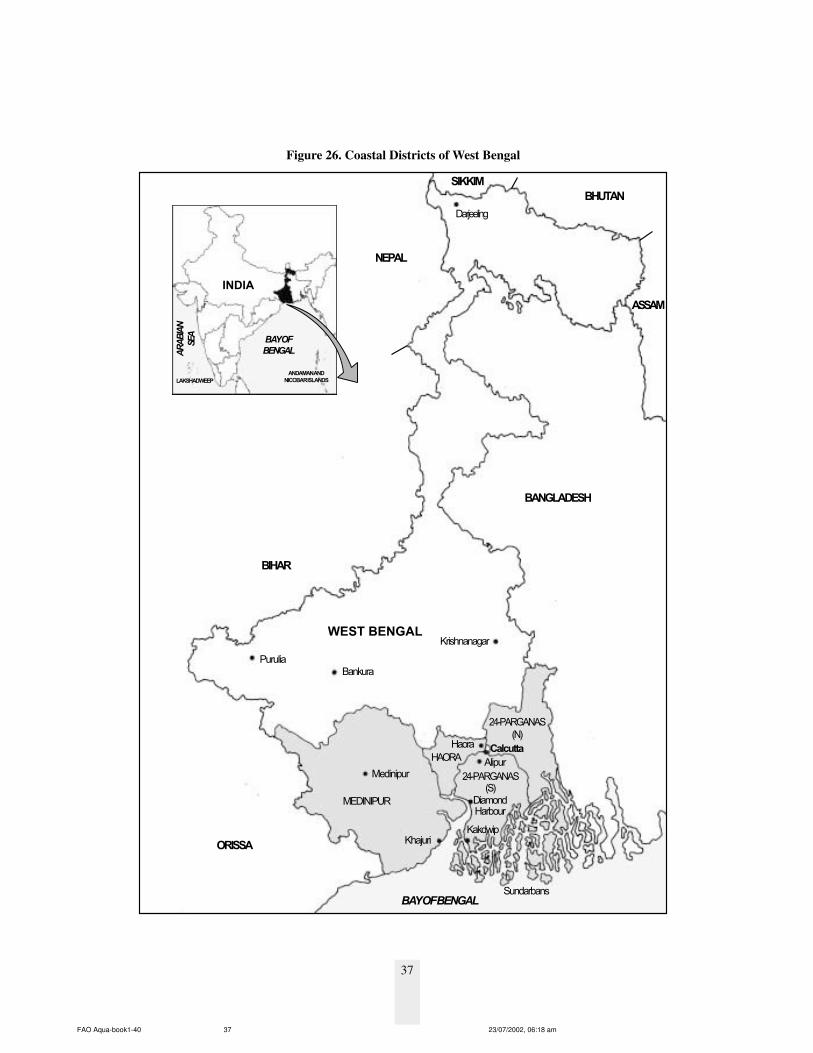
3.5.13 West Bengal
West Bengal stretches from the Himalayas in the north to the Bay of Bengal in the south. It has boundaries withSikkim and Bhutan on the north, Assam and Bangladesh in the east, the Bay of Bengal in the south and Orissa,Bihar and Nepal on the west (Figure 26). The state has a coastline of 158 km and continental shelf of 17 000sq. km. The total fish production during 1998-1999 was estimated at 995 000 metric tonnes, of which 171 500(17.0 %) metric tonnes came from the marine sector.
West Bengal has the largest potential area (405 000 ha) for brackishwater farming. But so far about 48 444 hahave only been developed for brackishwater farming26 . Excepting for 4 678 ha under improved traditional, theremaining area falls in the category of traditional type with trap and culture, locally known as bheries. Accordingto the recent estimates provided by the government of West Bengal, 18 479 ha of the total area was in farmholdings of less than 2.0 ha; 4 237 ha under 2.0 – 5.0 ha and the remaining 25 728 ha in farms of above 5.0 ha.All the shrimp farms are creek-based and are within the CRZ zone.
With the advent of scientific farming in the early seventies, the traditional farmers have also resorted to selec-tive stocking with improvement in production levels. Presently, the average production from the state is about436 kg/ ha27 (Figure 27). Though shrimp farming was in vogue in the state much before it started in other states,the development has been slow as compared to other states.
26 Government of West Bengal, April 200127 MPEDA, 2000
Figure 25. Orissa : Area under Shrimp Farming and Total Production
Figure 27. West Bengal : Area under Shrimp Farming and Total Production
FAO Aqua-book1-40 23/07/2002, 06:18 am36
37
Figure 26. Coastal Districts of West Bengal
BankuraPurulia
WEST BENGAL
BIHAR
INDIA
MEDINIPUR
ORISSA
BAY OF
BENGAL
ANDAMAN AND
NICOBAR ISLANDS
AR
AB
IAN
SEA
LAKSHADWEEP
Darjeeling
Krishnanagar
BANGLADESH
MedinipurAlipur
CalcuttaHaora
HAORA
24-PARGANAS
(N)
24-PARGANAS(S)
ASSAM
KhajuriKakdwip
DiamondHarbour
SundarbansBAY OF BENGAL
NEPAL
SIKKIM
BHUTAN
FAO Aqua-book1-40 23/07/2002, 06:18 am37
38
< 2.0 ha 2.0-5.0 ha 5.0-10 ha > 10 ha Total State No. of No. of No. of No. of No. of
Farmers., %** Farmers %** Farmers %** Farmers %** FarmersGujarat 22 15.60 103 73.05 10 7.09 6 4.26 141Maharashtra 74 54.00 36 26.00 13 10.00 13 10.00 136Karnataka 393 61.69 94 14.76 48 7.54 102 16.01 637Goa 41 24.55 19 11.36 97* 58.08 10 5.99 167Kerala 1 297 50.00 699 27.00 234 9.00 362 14.00 2 592Tamil Nadu 352 42.00 349 41.00 107 13.00 36 4.00 844Andhra Pradesh 69 738 96.19 2 190 3.02 336 0.46 238 0.33 72 502Orissa 7 580 97.88 100 1.29 51 0.66 13 0.17 7 744West Bengal* 4 327 55.00 1 778* 29.00 1 077* 13.00 646* 8.00 7 828Total 83 824 90.57 5 368 5.80 1 973 2.13 1 426 1.54 92 591
Source: MPEDA, 1998-99; **Percentage of total farmers in the state
Note: 90% of the farmers own farms of less than 2 ha size. In the states of West Bengal, Karnataka, Kerala and Goa, the traditional farms contribute to the higher percentage of larger water bodies.
Table 5. Distribution of Shrimp Farms Based on the Area Holdings by Individual Farmers/Entrepreneurs in the Coastal States of India
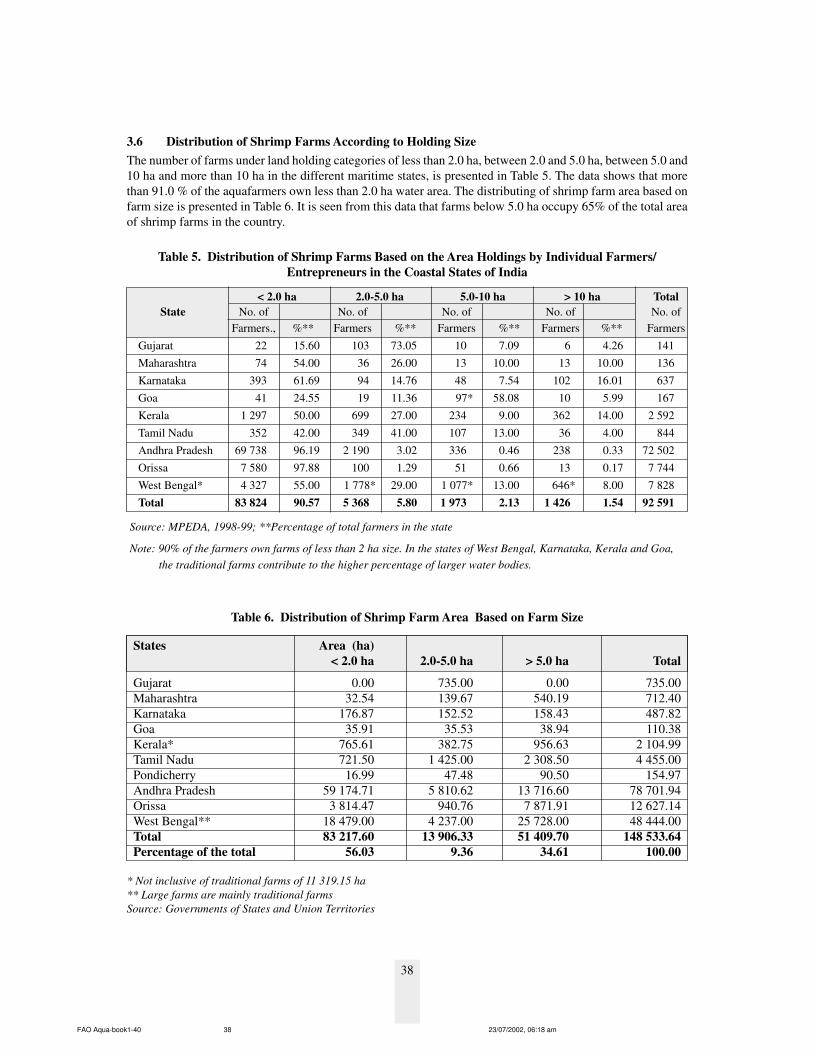
3.6 Distribution of Shrimp Farms According to Holding SizeThe number of farms under land holding categories of less than 2.0 ha, between 2.0 and 5.0 ha, between 5.0 and10 ha and more than 10 ha in the different maritime states, is presented in Table 5. The data shows that morethan 91.0 % of the aquafarmers own less than 2.0 ha water area. The distributing of shrimp farm area based onfarm size is presented in Table 6. It is seen from this data that farms below 5.0 ha occupy 65% of the total areaof shrimp farms in the country.
States Area (ha)< 2.0 ha 2.0-5.0 ha > 5.0 ha Total
Gujarat 0.00 735.00 0.00 735.00Maharashtra 32.54 139.67 540.19 712.40Karnataka 176.87 152.52 158.43 487.82Goa 35.91 35.53 38.94 110.38Kerala* 765.61 382.75 956.63 2 104.99Tamil Nadu 721.50 1 425.00 2 308.50 4 455.00Pondicherry 16.99 47.48 90.50 154.97Andhra Pradesh 59 174.71 5 810.62 13 716.60 78 701.94Orissa 3 814.47 940.76 7 871.91 12 627.14West Bengal** 18 479.00 4 237.00 25 728.00 48 444.00Total 83 217.60 13 906.33 51 409.70 148 533.64Percentage of the total 56.03 9.36 34.61 100.00
Table 6. Distribution of Shrimp Farm Area Based on Farm Size
* Not inclusive of traditional farms of 11 319.15 ha** Large farms are mainly traditional farmsSource: Governments of States and Union Territories
FAO Aqua-book1-40 23/07/2002, 06:18 am38
39
Production (million t) ExportYear Quantity Value
Marine Inland Total (million t) % (Rs. Inmillions)
1950-51 0.53 0.22 0.75 0.02 2.7 20
1960-61 0.88 0.28 1.16 0.02 1.7 40
1970-71 1.09 0.67 1.76 0.04 2.3 350
1980-81 1.55 0.89 2.44 0.08 3.3 2 350
1990-91 2.30 1.54 3.84 0.14 3.6 8 930
1996-97 2.97 2.38 5.35 0.30 5.6 41 210
1997-98 2.95 2.44 5.39 0.38 7.1 46 970
1998-99 2.70 2.56 5.26 0.30 5.7* 46 270
(Source: GOI, 2000)
Note: * Balance 94.3% is utilized for domestic consumption
Table 7. Fish Production and Exports
Only 10 corporate sector companies from the 500 leading corporate companies in India28 are involved inaquaculture. These 10 corporate companies have taken up 1 898 ha of land, of which only 758 ha has beendeveloped into shrimp farms. This constitutes just 0.54 % of the total water spread area of 140 936 ha developedfor shrimp culture in the country. Compared to 92 591 farmers involved in shrimp farming, the companiesconstitute barely 0.03 % of the total farms.
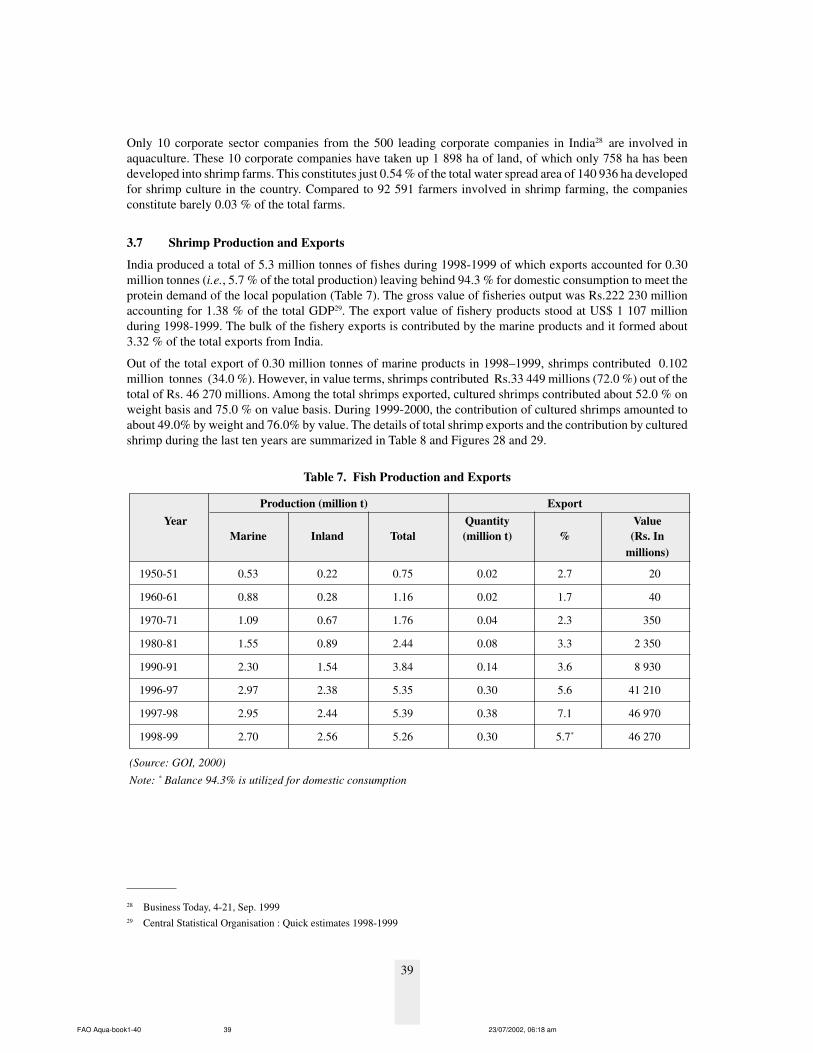
3.7 Shrimp Production and Exports
India produced a total of 5.3 million tonnes of fishes during 1998-1999 of which exports accounted for 0.30million tonnes (i.e., 5.7 % of the total production) leaving behind 94.3 % for domestic consumption to meet theprotein demand of the local population (Table 7). The gross value of fisheries output was Rs.222 230 millionaccounting for 1.38 % of the total GDP29. The export value of fishery products stood at US$ 1 107 millionduring 1998-1999. The bulk of the fishery exports is contributed by the marine products and it formed about3.32 % of the total exports from India.
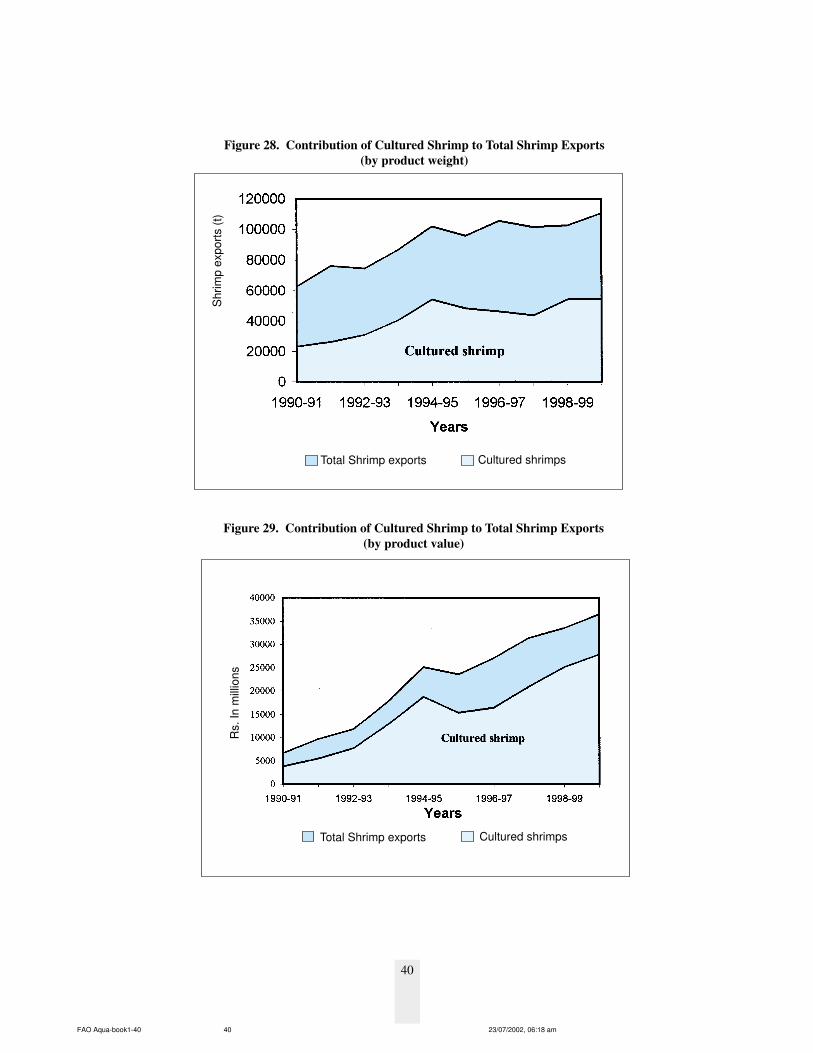
Out of the total export of 0.30 million tonnes of marine products in 1998–1999, shrimps contributed 0.102million tonnes (34.0 %). However, in value terms, shrimps contributed Rs.33 449 millions (72.0 %) out of thetotal of Rs. 46 270 millions. Among the total shrimps exported, cultured shrimps contributed about 52.0 % onweight basis and 75.0 % on value basis. During 1999-2000, the contribution of cultured shrimps amounted toabout 49.0% by weight and 76.0% by value. The details of total shrimp exports and the contribution by culturedshrimp during the last ten years are summarized in Table 8 and Figures 28 and 29.
28 Business Today, 4-21, Sep. 199929 Central Statistical Organisation : Quick estimates 1998-1999
FAO Aqua-book1-40 23/07/2002, 06:18 am39
40
Figure 28. Contribution of Cultured Shrimp to Total Shrimp Exports(by product weight)
Figure 29. Contribution of Cultured Shrimp to Total Shrimp Exports(by product value)
Total Shrimp exports Cultured shrimps
Total Shrimp exports Cultured shrimps
Rs.
In m
illio
nsS
hrim
p ex
ports
(t)
FAO Aqua-book1-40 23/07/2002, 06:18 am40