Embed Size (px)
Citation preview

1
Simulation in AODV and DSR

2
Outline
Review DSR and AODV
Simulation Environment
Simulation Graph
Simulation Result
Conclusion

3
DSR Route Discovery
A
B
C
D
E G
F H
[A,G,ID,A]
[A,G,ID,AB] [A,G,ID,ABE]
[A,G,ID,AC]
Node E drop the packet because it has forward the same ID packet
Source A forward data to destination G

4
DSR Route Reply
A
B
C
D
E G
F H
[A,B,E]
[A,B,E] [A,B,E]
[A,B,E]
Node A stores the route from A to G in its route cache
5
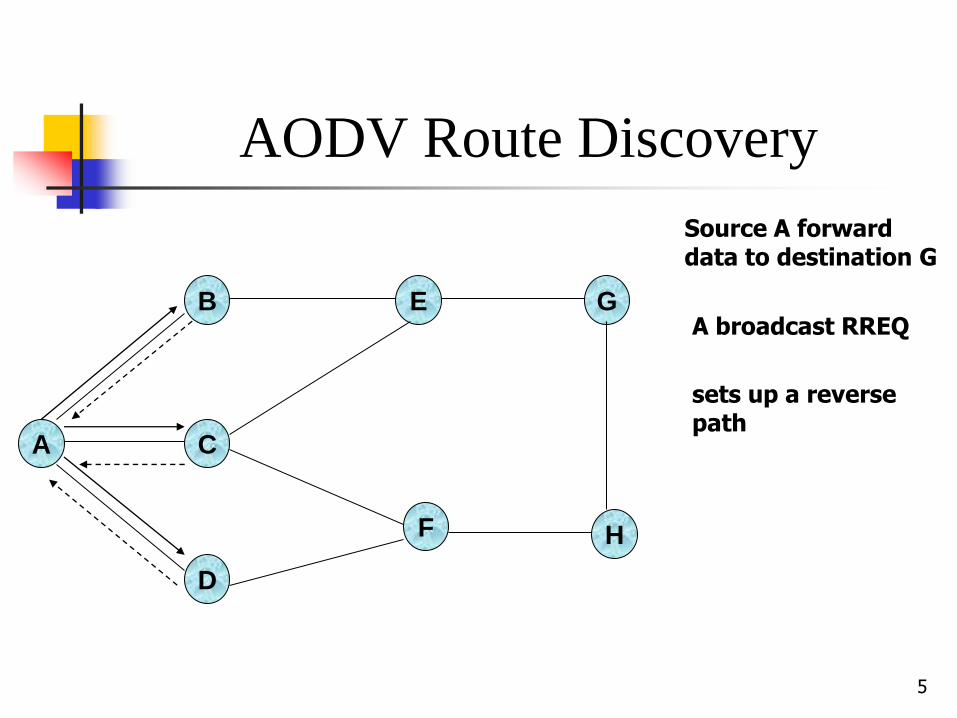
AODV Route Discovery
A
B
C
D
E G
F H
Source A forward data to destination G
A broadcast RREQ
sets up a reverse path

6
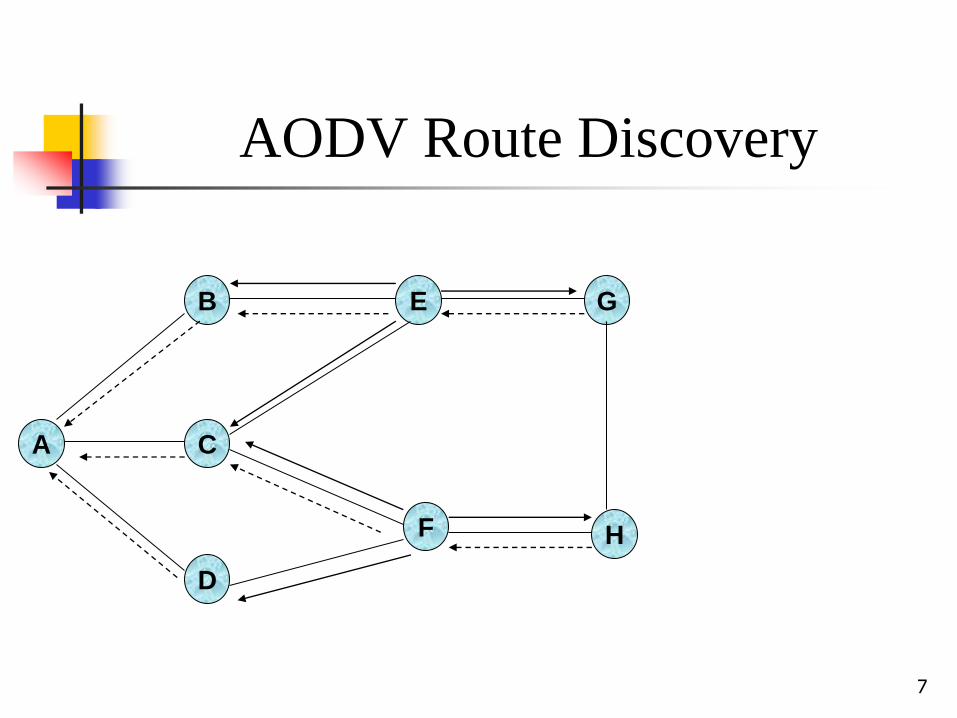
AODV Route Discovery
A
B
C
D
E G
F H
7
AODV Route Discovery
A
B
C
D
E G
F H

8
AODV Route RREP
A
B
C
D
E G
F H
<source_addr , broadcast_id>

9
DSR vs AODV
Difference
Cache and Table
DSR forward greater packets than AODV
AODV periodically forward Hello Message to
neighbors , DSR not.

10
Simulation Environment
Software NS2
Version:2.1b9a
OS Linux-Red hat 7.3
CPU P3 900
Memory 128MB

11
Simulation Environment
Simulation Range
1500*300 meters
Number of node in the range
Random creating 50 nodes
Number of source node in the range
Random 20 sources
Random 40 sources

12
Simulation Environment
Node radio range
250 meters
Traffic source
CBR (Content Bit-Rate)
Node radio bandwidth
2Mb/sec

13
Simulation Environment
Packet Length
512 byte
Node Buffer
100
Node speed
0~20 meter/sec

14
Simulation Environment
Random create 50 nodes in 1500*300 meters
Random select 20(40) nodes to deliver packets
Each node starts its journey from a random location to a random location with a randomly chosen speed 0~20 m/s

15
Simulation Environment
Each node move in 50 seconds, then move again after pause 20(40 or 60 or 80) seconds
Total Run Time: 300 seconds

16
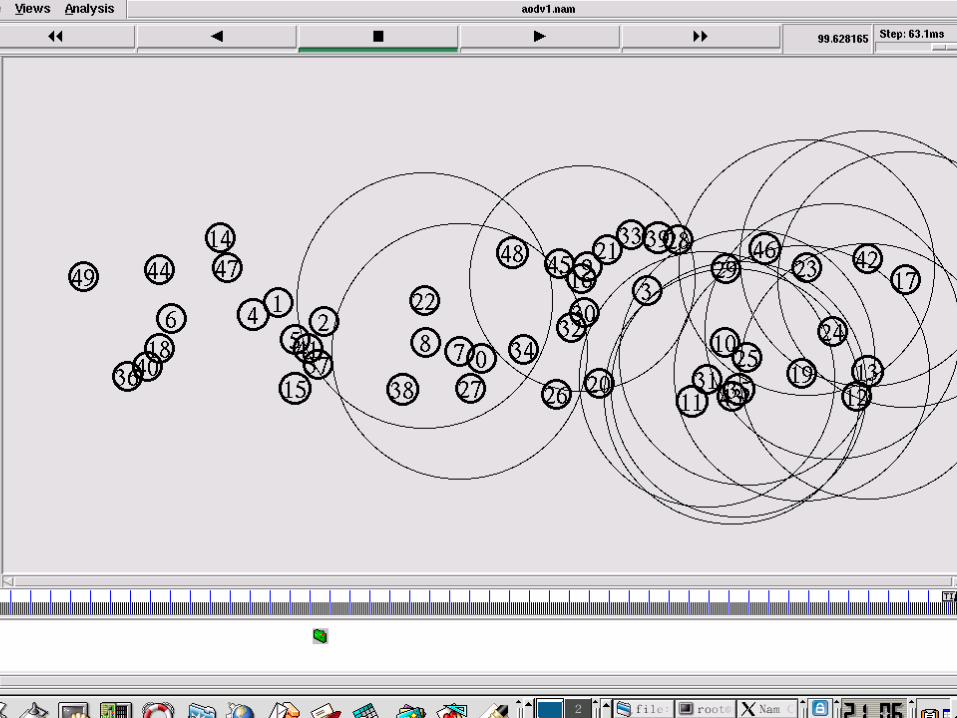
Simulation of AODV

17
Simulation of AODV
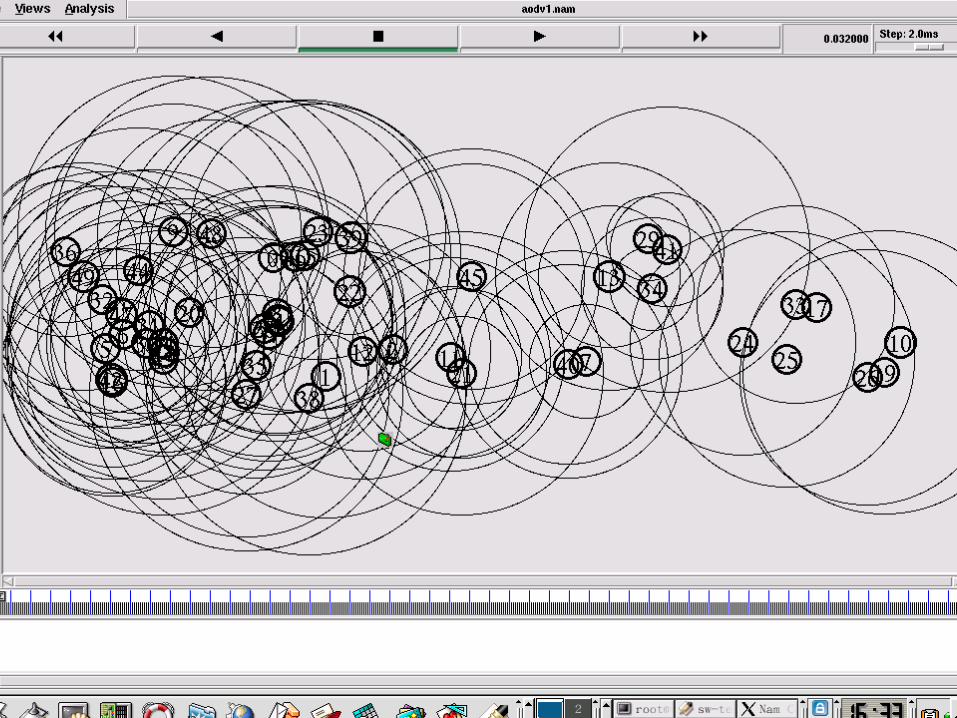
18
Simulation of AODV

19
20

21
Performance Matrics
Throughput
The ratio of the data packets delivered to the
destinations to those generated by the CBR
sources.
received packets / sent packets

22
Throughput(20sources)
20 sources
0
0.2
0.4
0.6
0.8
1
20 40 60 80
Pause Time (sec)
Thro
ughp
ut
AODV
DSR

23
Throughput(40sources)
40 sources
0
0.2
0.4
0.6
0.8
1
1.2
20 40 60 80
Pause Time (sec)
Thro
ughp
ut
AODV
DSR

24
Performance Matrics
Average Delay
For each packet with id of trace level (AGT)
and type (CBR), calculate the send(s) time(s)
and the receive(r) time(t) and average it

25
Average Delay (20 sources)
20 sources
0
0.005
0.01
0.015
0.02
0.025
0.03
20 40 60 80
Pause Time (sec)
Ave
rage
Del
ay (s
ec)
AODV
DSR

26
Average Delay (40 sources)
40 sources
0
0.005
0.01
0.015
0.02
0.025
0.03
20 40 60 80
Pause Time (sec)
Aver
age D
elay
(sec)
AODV
DSR

27
Performance Matrics
Normalized Routing Overhead
Normalized routing load = (routing packets sent)
/ receives

28
Normalized Routing Overhead (20 sources)
20 sources
0
0.1
0.2
0.3
0.4
0.5
20 40 60 80
Pause Time (sec)
Rout
ing
Over
head
AODV
DSR

29
Normalized Routing Overhead (40 sources)
40 sources
0
0.1
0.2
0.3
0.4
0.5
0.6
20 40 60 80
Pause Time (sec)
Rout
ing
Over
head
AODV
DSR

30
Source Code
31
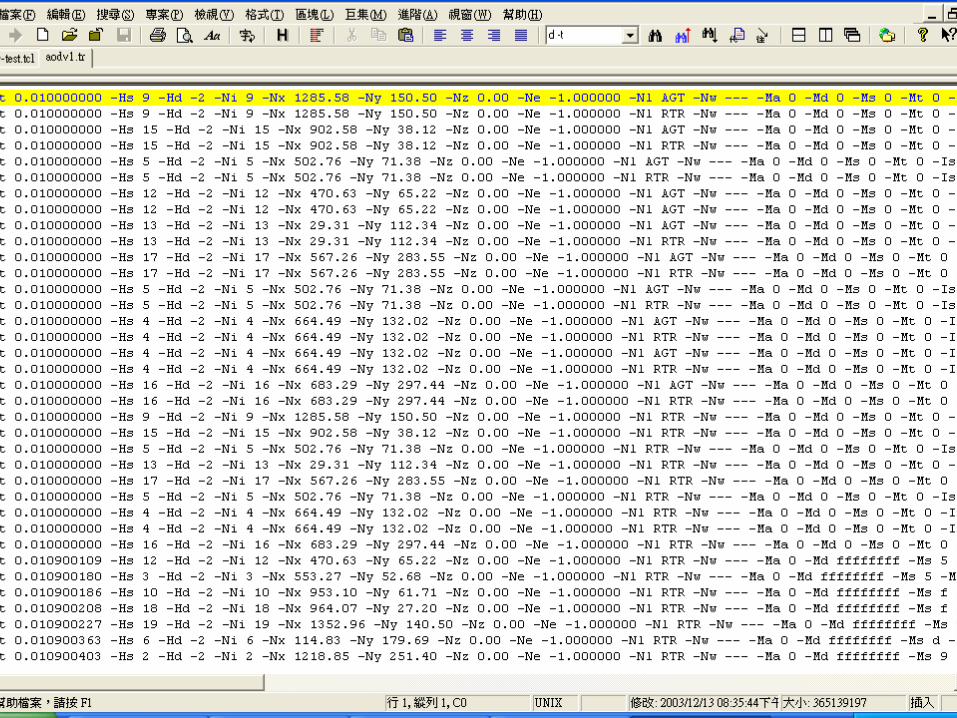
Trace File

32
33
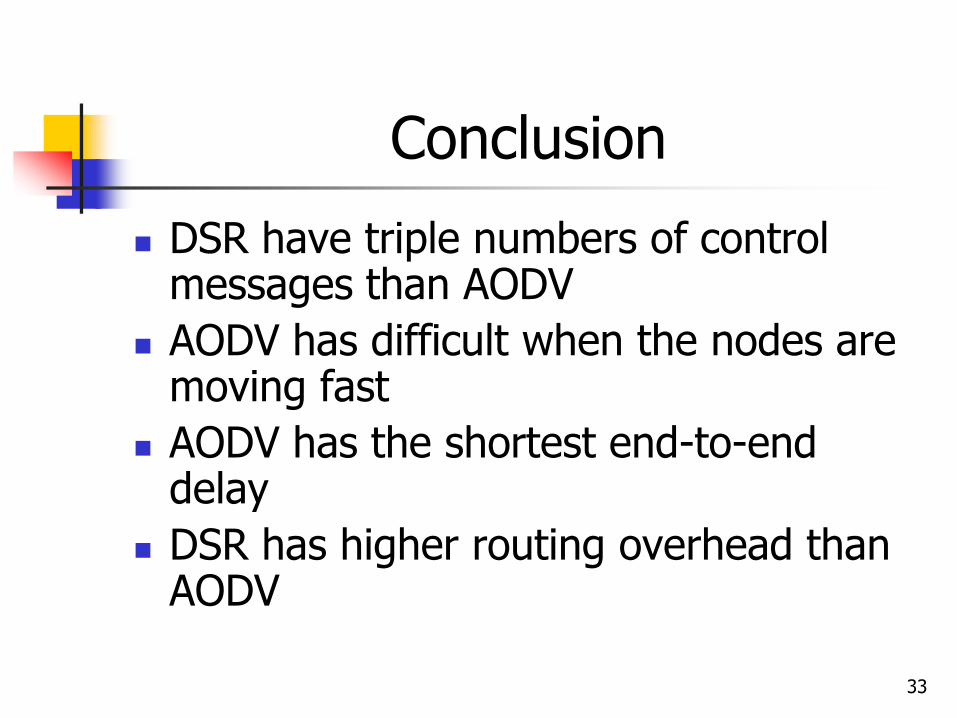
Conclusion
DSR have triple numbers of control messages than AODV
AODV has difficult when the nodes are moving fast
AODV has the shortest end-to-end delay
DSR has higher routing overhead than AODV