Embed Size (px)
Citation preview
2. Observed Concentrations of Nitrogen, Cadmium, Lead, Mercury and Lindane at HELCOM Stations in 2005
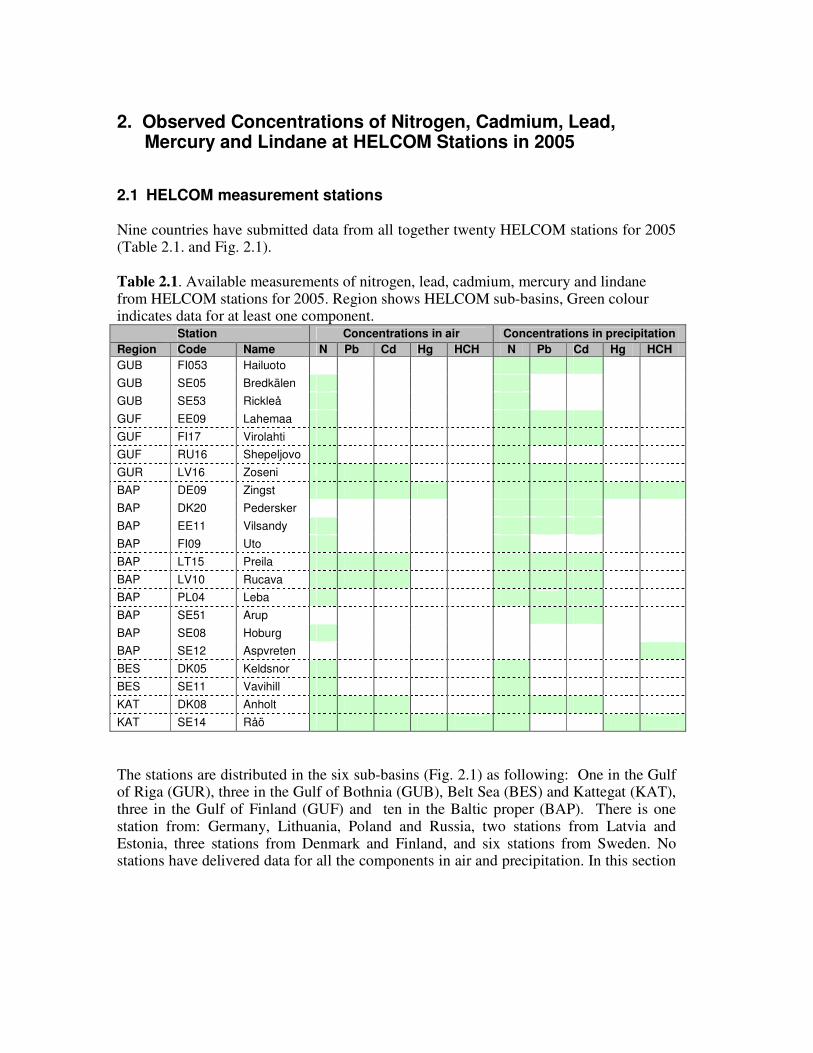
2.1 HELCOM measurement stations Nine countries have submitted data from all together twenty HELCOM stations for 2005 (Table 2.1. and Fig. 2.1). Table 2.1. Available measurements of nitrogen, lead, cadmium, mercury and lindane from HELCOM stations for 2005. Region shows HELCOM sub-basins, Green colour indicates data for at least one component.
Station Concentrations in air Concentrations in precipitation
Region Code Name N Pb Cd Hg HCH N Pb Cd Hg HCH
GUB FI053 Hailuoto GUB SE05 Bredkälen GUB SE53 Rickleå GUF EE09 Lahemaa GUF FI17 Virolahti GUF RU16 Shepeljovo GUR LV16 Zoseni BAP DE09 Zingst BAP DK20 Pedersker BAP EE11 Vilsandy BAP FI09 Uto BAP LT15 Preila BAP LV10 Rucava BAP PL04 Leba BAP SE51 Arup BAP SE08 Hoburg BAP SE12 Aspvreten BES DK05 Keldsnor BES SE11 Vavihill KAT DK08 Anholt KAT SE14 Råö
The stations are distributed in the six sub-basins (Fig. 2.1) as following: One in the Gulf of Riga (GUR), three in the Gulf of Bothnia (GUB), Belt Sea (BES) and Kattegat (KAT), three in the Gulf of Finland (GUF) and ten in the Baltic proper (BAP). There is one station from: Germany, Lithuania, Poland and Russia, two stations from Latvia and Estonia, three stations from Denmark and Finland, and six stations from Sweden. No stations have delivered data for all the components in air and precipitation. In this section
EMEP Centres Joint Report for HELCOM
4
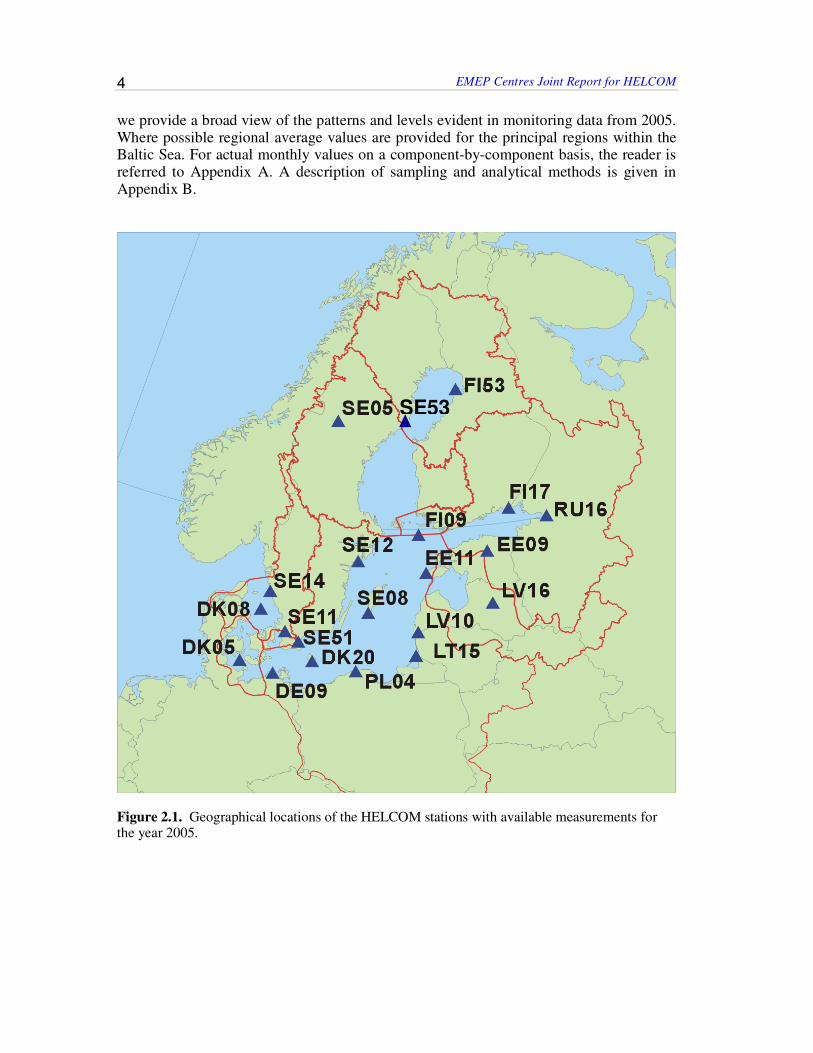
we provide a broad view of the patterns and levels evident in monitoring data from 2005. Where possible regional average values are provided for the principal regions within the Baltic Sea. For actual monthly values on a component-by-component basis, the reader is referred to Appendix A. A description of sampling and analytical methods is given in Appendix B.
Figure 2.1. Geographical locations of the HELCOM stations with available measurements for the year 2005.
SE53
Observed Pollutant Concentrations in 2005
5
2.2 Nitrogen concentrations in air Altogether 15 stations have delivered data for one or more nitrogen species in air: 10 for respectively total reduced nitrogen (NH3+NH4
+), 12 for total nitrate (HNO3+NO3-), and
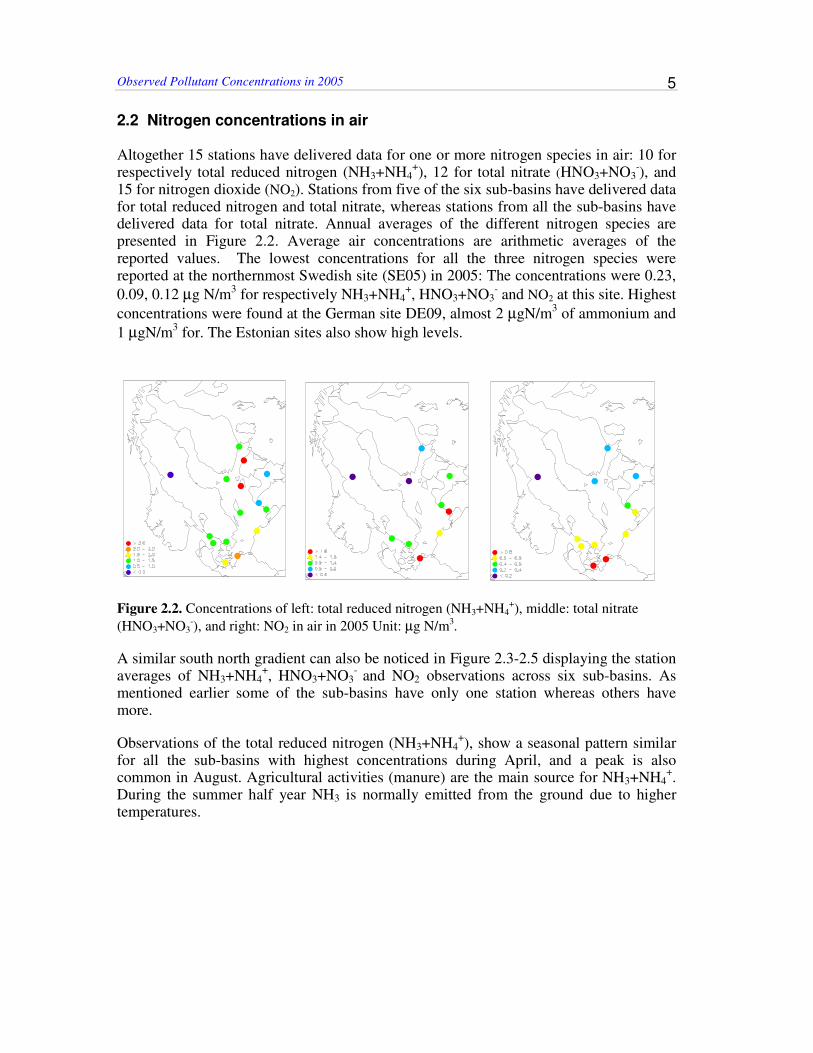
15 for nitrogen dioxide (NO2). Stations from five of the six sub-basins have delivered data for total reduced nitrogen and total nitrate, whereas stations from all the sub-basins have delivered data for total nitrate. Annual averages of the different nitrogen species are presented in Figure 2.2. Average air concentrations are arithmetic averages of the reported values. The lowest concentrations for all the three nitrogen species were reported at the northernmost Swedish site (SE05) in 2005: The concentrations were 0.23,
0.09, 0.12 µg N/m3 for respectively NH3+NH4+, HNO3+NO3
- and NO2 at this site. Highest
concentrations were found at the German site DE09, almost 2 µgN/m3 of ammonium and
1 µgN/m3 for. The Estonian sites also show high levels.
Figure 2.2. Concentrations of left: total reduced nitrogen (NH3+NH4
+), middle: total nitrate
(HNO3+NO3-), and right: NO2 in air in 2005 Unit: µg N/m3.
A similar south north gradient can also be noticed in Figure 2.3-2.5 displaying the station averages of NH3+NH4
+, HNO3+NO3
- and NO2 observations across six sub-basins. As
mentioned earlier some of the sub-basins have only one station whereas others have more.
Observations of the total reduced nitrogen (NH3+NH4+), show a seasonal pattern similar
for all the sub-basins with highest concentrations during April, and a peak is also common in August. Agricultural activities (manure) are the main source for NH3+NH4
+. During the summer half year NH3 is normally emitted from the ground due to higher temperatures.

EMEP Centres Joint Report for HELCOM
6
Figure 2.3. Monthly total reduced nitrogen (NH3+NH4) concentrations in the air in 2005 averaged for the sub-basins.
Figure 2.4. Monthly total oxidized nitrate (HNO3+NO3
-) concentrations in the air in 2005
Observed Pollutant Concentrations in 2005
7
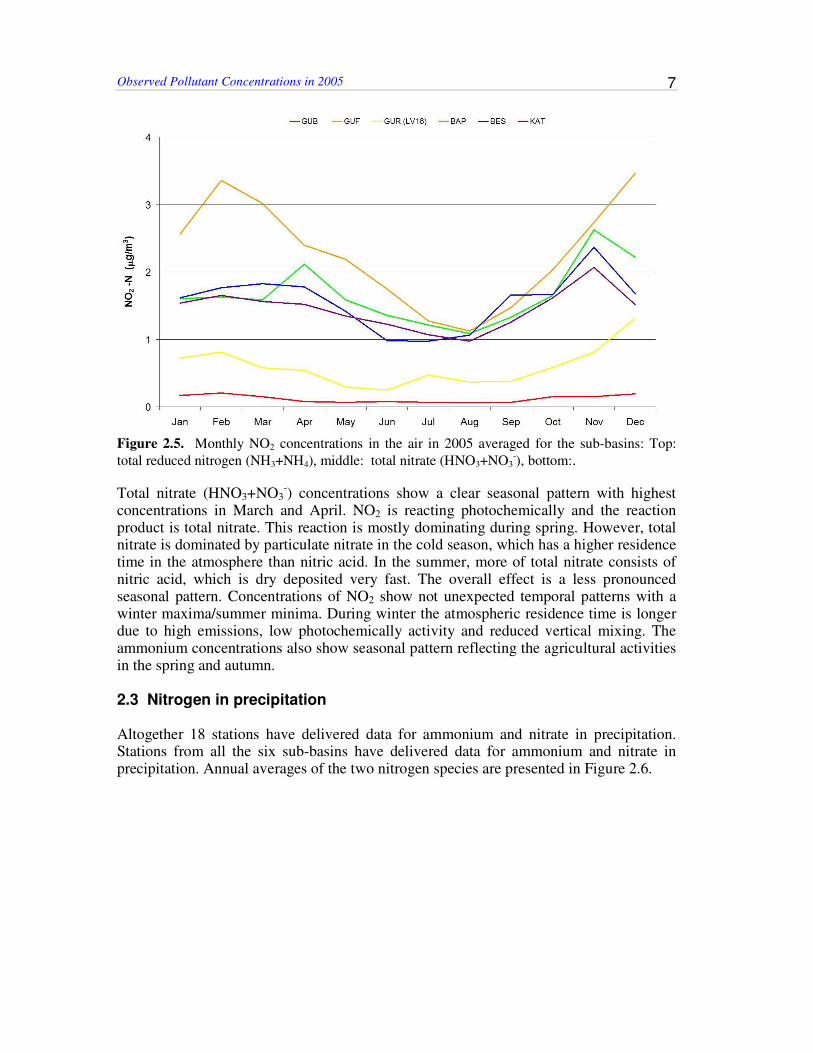
Figure 2.5. Monthly NO2 concentrations in the air in 2005 averaged for the sub-basins: Top:
total reduced nitrogen (NH3+NH4), middle: total nitrate (HNO3+NO3-), bottom:.
Total nitrate (HNO3+NO3-) concentrations show a clear seasonal pattern with highest
concentrations in March and April. NO2 is reacting photochemically and the reaction product is total nitrate. This reaction is mostly dominating during spring. However, total nitrate is dominated by particulate nitrate in the cold season, which has a higher residence time in the atmosphere than nitric acid. In the summer, more of total nitrate consists of nitric acid, which is dry deposited very fast. The overall effect is a less pronounced seasonal pattern. Concentrations of NO2 show not unexpected temporal patterns with a winter maxima/summer minima. During winter the atmospheric residence time is longer due to high emissions, low photochemically activity and reduced vertical mixing. The ammonium concentrations also show seasonal pattern reflecting the agricultural activities in the spring and autumn. 2.3 Nitrogen in precipitation Altogether 18 stations have delivered data for ammonium and nitrate in precipitation. Stations from all the six sub-basins have delivered data for ammonium and nitrate in precipitation. Annual averages of the two nitrogen species are presented in Figure 2.6.
EMEP Centres Joint Report for HELCOM
8
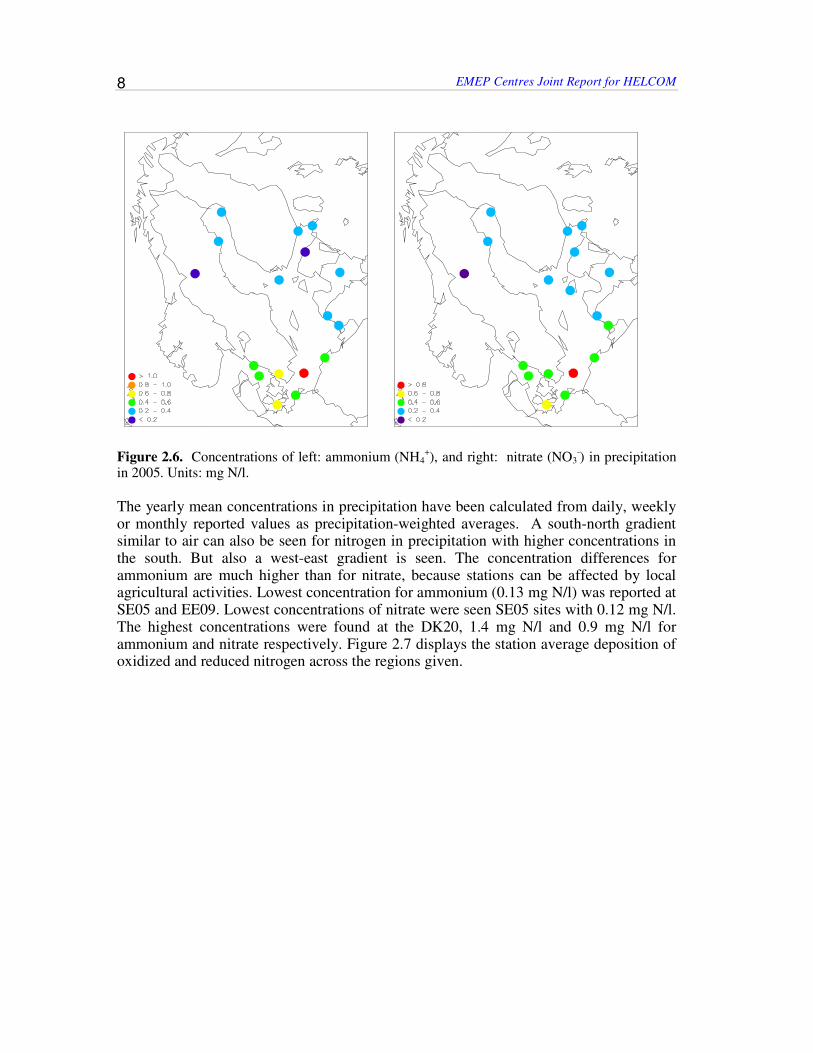
Figure 2.6. Concentrations of left: ammonium (NH4
+), and right: nitrate (NO3
-) in precipitation
in 2005. Units: mg N/l.
The yearly mean concentrations in precipitation have been calculated from daily, weekly or monthly reported values as precipitation-weighted averages. A south-north gradient similar to air can also be seen for nitrogen in precipitation with higher concentrations in the south. But also a west-east gradient is seen. The concentration differences for ammonium are much higher than for nitrate, because stations can be affected by local agricultural activities. Lowest concentration for ammonium (0.13 mg N/l) was reported at SE05 and EE09. Lowest concentrations of nitrate were seen SE05 sites with 0.12 mg N/l. The highest concentrations were found at the DK20, 1.4 mg N/l and 0.9 mg N/l for ammonium and nitrate respectively. Figure 2.7 displays the station average deposition of oxidized and reduced nitrogen across the regions given.

Observed Pollutant Concentrations in 2005
9
Figure 2.7. Monthly nitrogen depositions in 2005 averaged for the sub-basins: Top: reduced nitrogen (NH4
+), and bottom: nitrate (NO3
-).
It is to be observed that seasonal patterns are not as strong as for airborne components. This is due to the presence of the precipitation effect. Airborne nitrogen species will be
EMEP Centres Joint Report for HELCOM
10
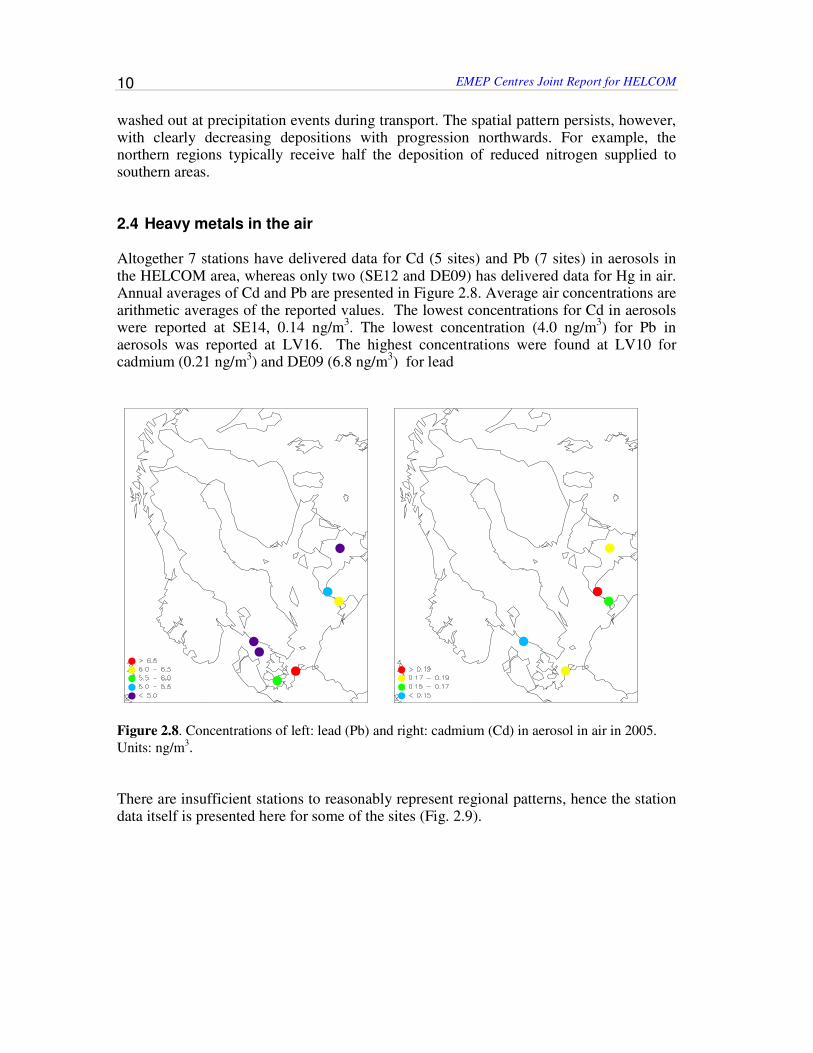
washed out at precipitation events during transport. The spatial pattern persists, however, with clearly decreasing depositions with progression northwards. For example, the northern regions typically receive half the deposition of reduced nitrogen supplied to southern areas. 2.4 Heavy metals in the air Altogether 7 stations have delivered data for Cd (5 sites) and Pb (7 sites) in aerosols in the HELCOM area, whereas only two (SE12 and DE09) has delivered data for Hg in air. Annual averages of Cd and Pb are presented in Figure 2.8. Average air concentrations are arithmetic averages of the reported values. The lowest concentrations for Cd in aerosols were reported at SE14, 0.14 ng/m
3. The lowest concentration (4.0 ng/m
3) for Pb in
aerosols was reported at LV16. The highest concentrations were found at LV10 for cadmium (0.21 ng/m
3) and DE09 (6.8 ng/m
3) for lead
Figure 2.8. Concentrations of left: lead (Pb) and right: cadmium (Cd) in aerosol in air in 2005.
Units: ng/m3.
There are insufficient stations to reasonably represent regional patterns, hence the station data itself is presented here for some of the sites (Fig. 2.9).
Observed Pollutant Concentrations in 2005
11
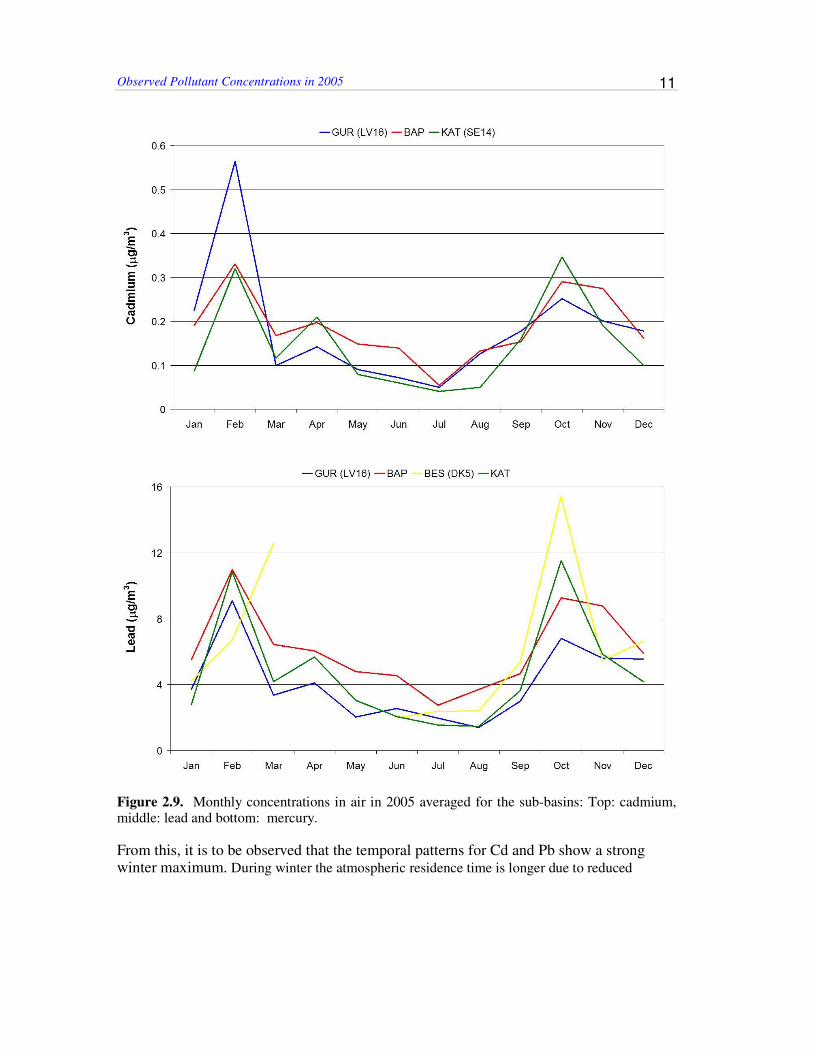
Figure 2.9. Monthly concentrations in air in 2005 averaged for the sub-basins: Top: cadmium, middle: lead and bottom: mercury.
From this, it is to be observed that the temporal patterns for Cd and Pb show a strong winter maximum. During winter the atmospheric residence time is longer due to reduced
EMEP Centres Joint Report for HELCOM
12
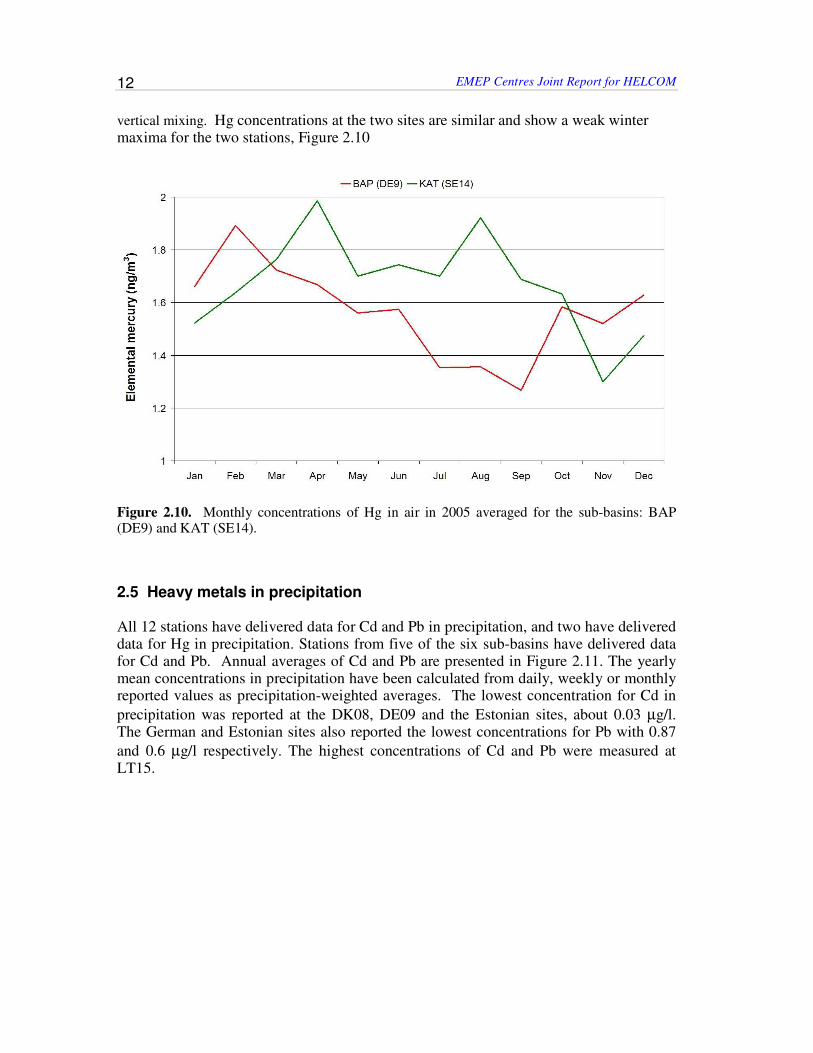
vertical mixing. Hg concentrations at the two sites are similar and show a weak winter maxima for the two stations, Figure 2.10
Figure 2.10. Monthly concentrations of Hg in air in 2005 averaged for the sub-basins: BAP (DE9) and KAT (SE14).
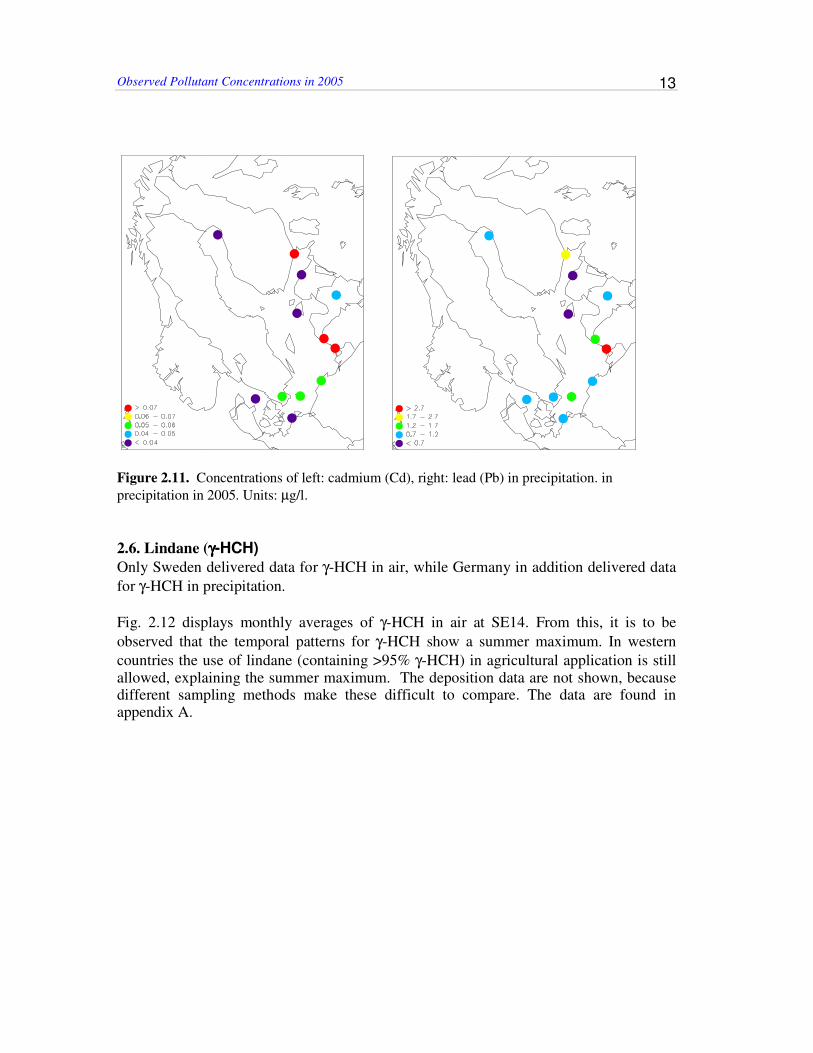
2.5 Heavy metals in precipitation All 12 stations have delivered data for Cd and Pb in precipitation, and two have delivered data for Hg in precipitation. Stations from five of the six sub-basins have delivered data for Cd and Pb. Annual averages of Cd and Pb are presented in Figure 2.11. The yearly mean concentrations in precipitation have been calculated from daily, weekly or monthly reported values as precipitation-weighted averages. The lowest concentration for Cd in
precipitation was reported at the DK08, DE09 and the Estonian sites, about 0.03 µg/l. The German and Estonian sites also reported the lowest concentrations for Pb with 0.87
and 0.6 µg/l respectively. The highest concentrations of Cd and Pb were measured at LT15.
Observed Pollutant Concentrations in 2005
13
Figure 2.11. Concentrations of left: cadmium (Cd), right: lead (Pb) in precipitation. in
precipitation in 2005. Units: µg/l.
2.6. Lindane (γγγγ-HCH)
Only Sweden delivered data for γ-HCH in air, while Germany in addition delivered data
for γ-HCH in precipitation.
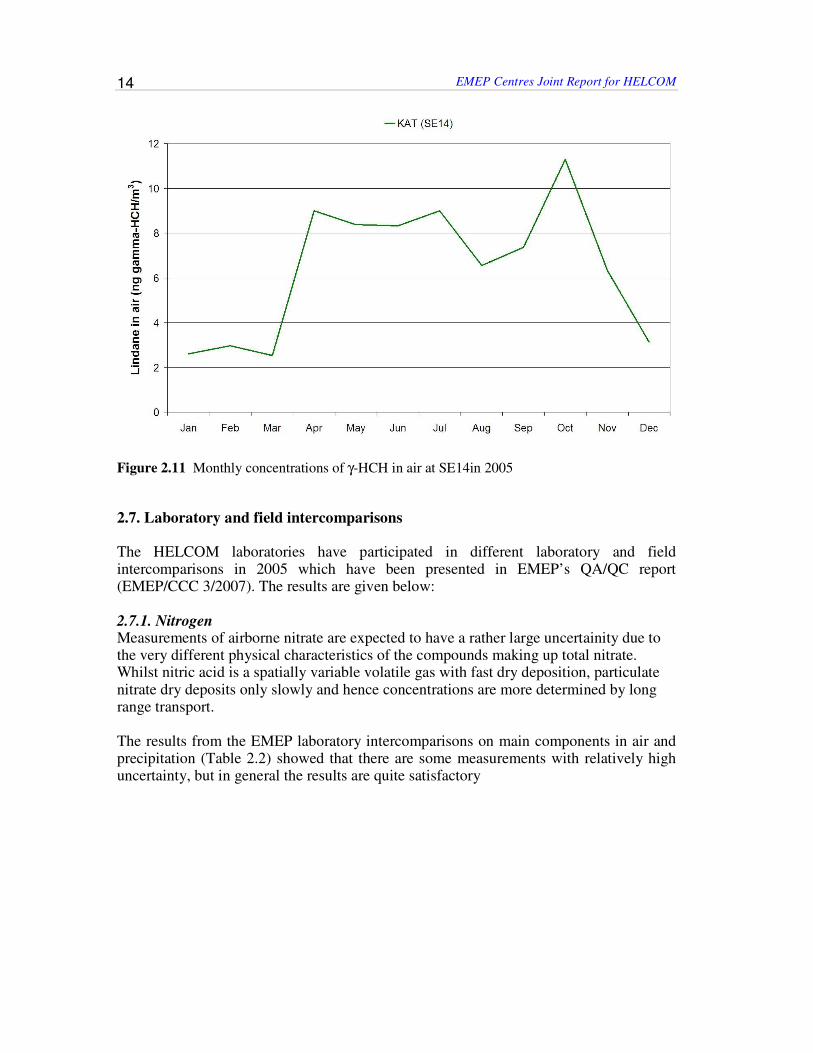
Fig. 2.12 displays monthly averages of γ-HCH in air at SE14. From this, it is to be
observed that the temporal patterns for γ-HCH show a summer maximum. In western
countries the use of lindane (containing >95% γ-HCH) in agricultural application is still allowed, explaining the summer maximum. The deposition data are not shown, because different sampling methods make these difficult to compare. The data are found in appendix A.
EMEP Centres Joint Report for HELCOM
14
Figure 2.11 Monthly concentrations of γ-HCH in air at SE14in 2005
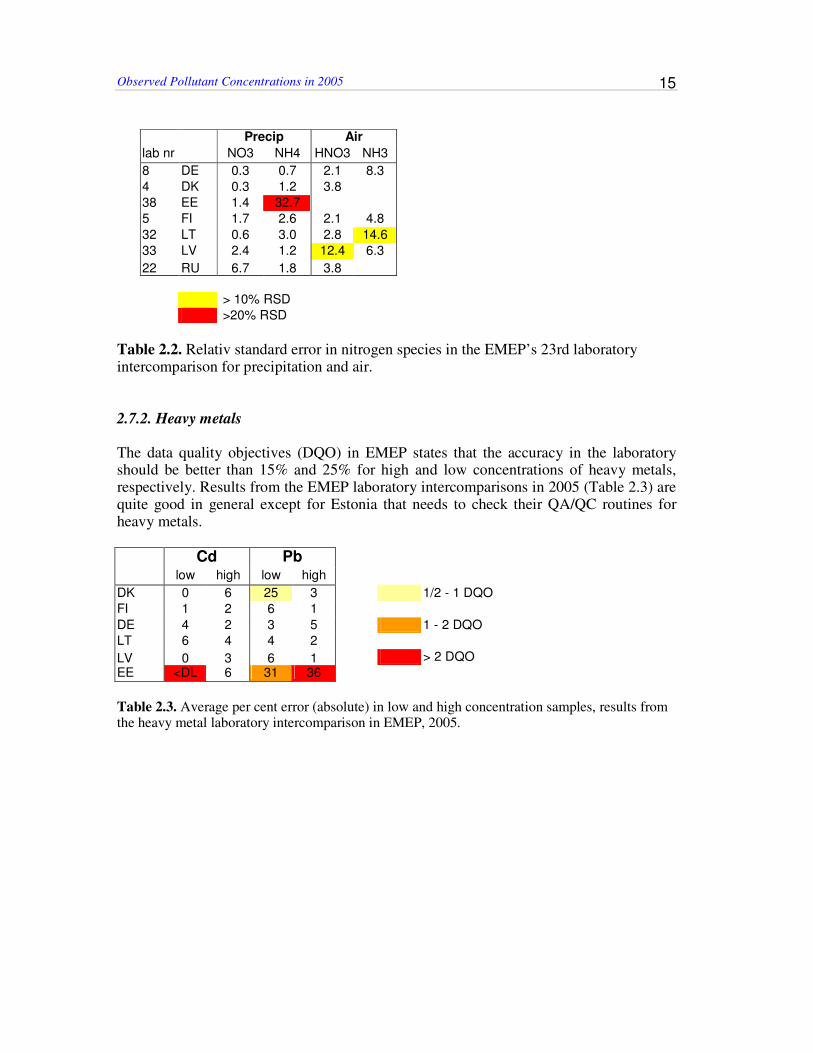
2.7. Laboratory and field intercomparisons The HELCOM laboratories have participated in different laboratory and field intercomparisons in 2005 which have been presented in EMEP’s QA/QC report (EMEP/CCC 3/2007). The results are given below: 2.7.1. Nitrogen Measurements of airborne nitrate are expected to have a rather large uncertainity due to the very different physical characteristics of the compounds making up total nitrate. Whilst nitric acid is a spatially variable volatile gas with fast dry deposition, particulate nitrate dry deposits only slowly and hence concentrations are more determined by long range transport. The results from the EMEP laboratory intercomparisons on main components in air and precipitation (Table 2.2) showed that there are some measurements with relatively high uncertainty, but in general the results are quite satisfactory
Observed Pollutant Concentrations in 2005
15
Precip Air
lab nr NO3 NH4 HNO3 NH3
8 DE 0.3 0.7 2.1 8.3
4 DK 0.3 1.2 3.8
38 EE 1.4 32.7
5 FI 1.7 2.6 2.1 4.8
32 LT 0.6 3.0 2.8 14.6
33 LV 2.4 1.2 12.4 6.3
22 RU 6.7 1.8 3.8
> 10% RSD
>20% RSD
Table 2.2. Relativ standard error in nitrogen species in the EMEP’s 23rd laboratory intercomparison for precipitation and air. 2.7.2. Heavy metals The data quality objectives (DQO) in EMEP states that the accuracy in the laboratory should be better than 15% and 25% for high and low concentrations of heavy metals, respectively. Results from the EMEP laboratory intercomparisons in 2005 (Table 2.3) are quite good in general except for Estonia that needs to check their QA/QC routines for heavy metals.
Cd Pb
low high low high
DK 0 6 25 3 1/2 - 1 DQO
FI 1 2 6 1
DE 4 2 3 5 1 - 2 DQO
LT 6 4 4 2
LV 0 3 6 1 > 2 DQO
EE <DL 6 31 36
Table 2.3. Average per cent error (absolute) in low and high concentration samples, results from the heavy metal laboratory intercomparison in EMEP, 2005.

EMEP Centres Joint Report for HELCOM
16