Embed Size (px)
Citation preview

Oi S.A. | 0
Rio de Janeiro, 15 May 2014 1Q14 results
Oi S.A. | 1
IMPORTANT NOTICE
This release contains forward-looking statements, according to the U.S. Private Securities Litigation Reform Act of 1995. Statements that are not historical facts, including statements about perspectives and expectations, are forward-looking statements. The words "anticipates", "believes", "estimates", "expects", "forecasts", "intends", "plans", and similar terms, when related to the Company or its management, indicate forward-looking statements. These statements reflect the current view of management and are subject to various risks and uncertainties. These statements are based on various assumptions and factors, including general economic, market, industry, and operational factors. Any changes to these assumptions or factors may lead to practical results different from current expectations. Excessive reliance should not be placed on those statements. Forward-looking statements relate only to the date they are made, and the Company is not obligated to update them as new information or future developments arise.

Oi S.A. | 2
Progress against Our business priorities
Oi S.A. | 3
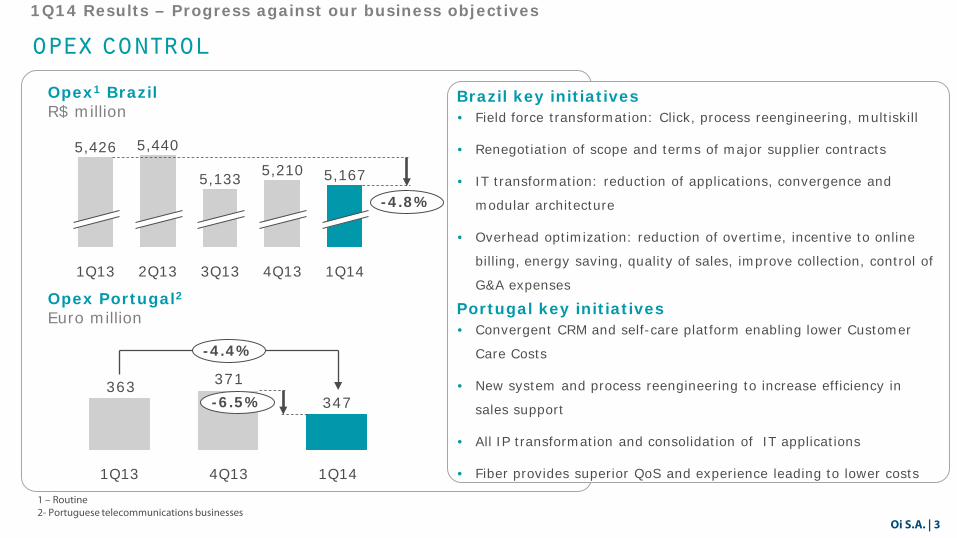
1Q14 Results – Progress against our business objectives OPEX CONTROL
347371363
1Q14
-6.5%
-4.4%
4Q13 1Q13
Opex Portugal2
Euro million Portugal key initiatives • Convergent CRM and self-care platform enabling lower Customer
Care Costs
• New system and process reengineering to increase efficiency in
sales support
• All IP transformation and consolidation of IT applications
• Fiber provides superior QoS and experience leading to lower costs
Brazil key initiatives Opex1 Brazil R$ million • Field force transformation: Click, process reengineering, multiskill
• Renegotiation of scope and terms of major supplier contracts
• IT transformation: reduction of applications, convergence and
modular architecture
• Overhead optimization: reduction of overtime, incentive to online
billing, energy saving, quality of sales, improve collection, control of
G&A expenses 1Q14
5,167 5,133 -4.8%
3Q13 4Q13
5,210
2Q13
5,440
1Q13
5,426
1 – Routine 2- Portuguese telecommunications businesses
Oi S.A. | 4
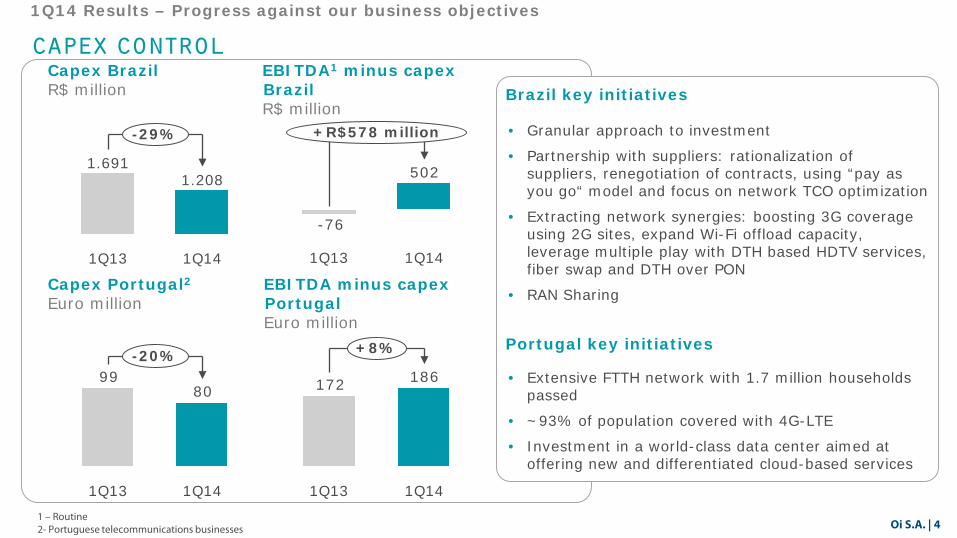
capex CONTROL
Capex Portugal2
Euro million
Portugal key initiatives
• Extensive FTTH network with 1.7 million households passed
• ~93% of population covered with 4G-LTE
• Investment in a world-class data center aimed at offering new and differentiated cloud-based services
Brazil key initiatives Capex Brazil R$ million
• Granular approach to investment
• Partnership with suppliers: rationalization of suppliers, renegotiation of contracts, using “pay as you go“ model and focus on network TCO optimization
• Extracting network synergies: boosting 3G coverage using 2G sites, expand Wi-Fi offload capacity, leverage multiple play with DTH based HDTV services, fiber swap and DTH over PON
• RAN Sharing
8099
-20%
1Q14 1Q13
-29%
1Q14
1.208
1Q13
1.691
186172
+8%
1Q14 1Q13
502
-76
+R$578 million
1Q14 1Q13
EBITDA1 minus capex Brazil R$ million
EBITDA minus capex Portugal Euro million
1Q14 Results – Progress against our business objectives
1 – Routine 2- Portuguese telecommunications businesses
Oi S.A. | 5
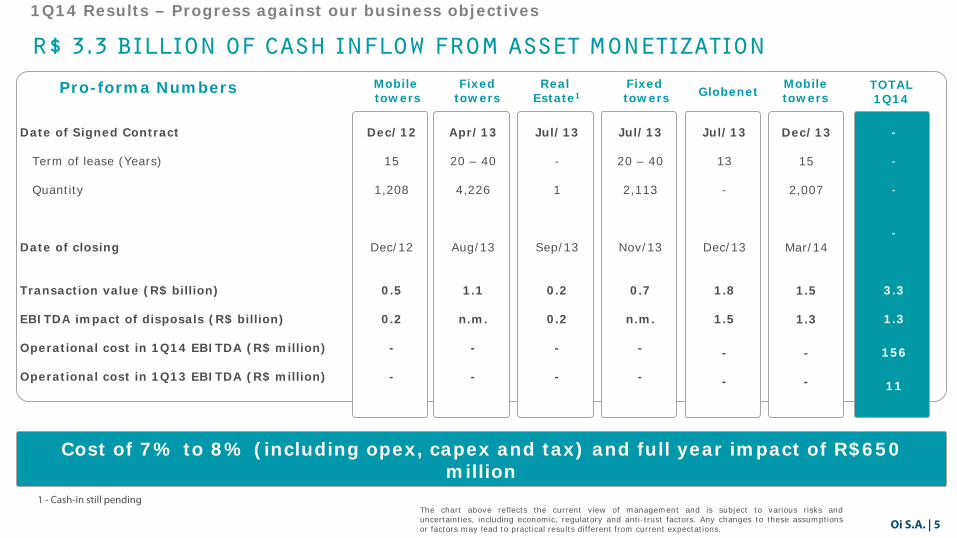
R$ 3.3 billion of cash inflow from asset monetization Fixed
towers Real
Estate1 Mobile towers
Date of Signed Contract Term of lease (Years) Quantity Date of closing Transaction value (R$ billion) EBITDA impact of disposals (R$ billion) Operational cost in 1Q14 EBITDA (R$ million) Operational cost in 1Q13 EBITDA (R$ million)
Dec/12
15
1,208
Dec/12
0.5
0.2 - -
Jul/13
20 – 40
2,113
Nov/13
0.7
n.m. - -
Jul/13
13 -
Dec/13
1.8
1.5
- -
Jul/13 - 1
Sep/13
0.2
0.2
- -
Pro-forma Numbers
The chart above reflects the current view of management and is subject to various risks and uncertainties, including economic, regulatory and anti-trust factors. Any changes to these assumptions or factors may lead to practical results different from current expectations.
Cost of 7% to 8% (including opex, capex and tax) and full year impact of R$650 million
Fixed towers
Apr/13
20 – 40
4,226
Aug/13
1.1
n.m. - -
1 - Cash-in still pending
Mobile towers
Dec/13
15
2,007
Mar/14
1.5
1.3
- -
Globenet TOTAL 1Q14
- - - -
3.3
1.3
156
11
1Q14 Results – Progress against our business objectives
Oi S.A. | 6
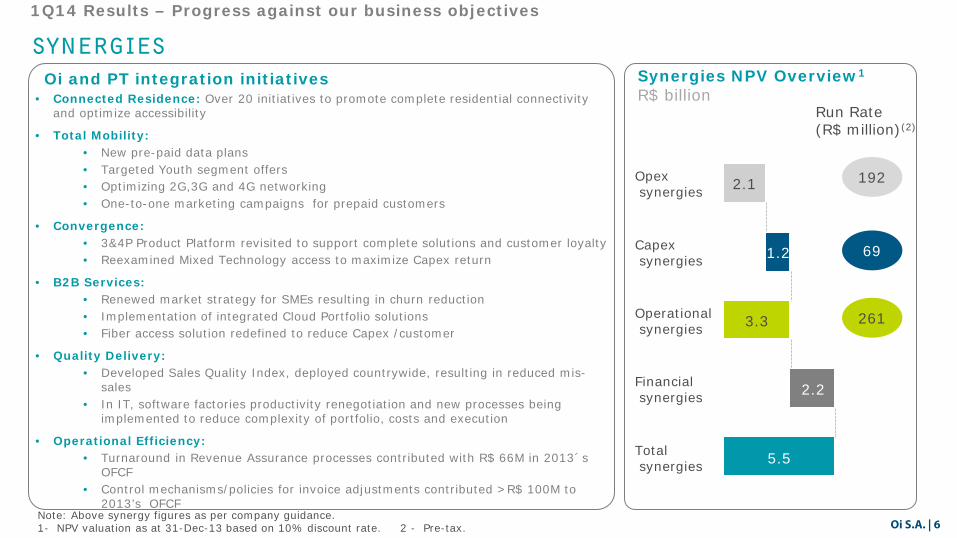
SYNERGIES
192
261
69
Run Rate (R$ million)(2)
Synergies NPV Overview1
R$ billion
Total synergies 5.5
Financial synergies 2.2
Operational synergies 3.3
Capex synergies 1.2
Opex synergies 2.1
• Connected Residence: Over 20 initiatives to promote complete residential connectivity and optimize accessibility
• Total Mobility: • New pre-paid data plans • Targeted Youth segment offers • Optimizing 2G,3G and 4G networking • One-to-one marketing campaigns for prepaid customers
• Convergence: • 3&4P Product Platform revisited to support complete solutions and customer loyalty • Reexamined Mixed Technology access to maximize Capex return
• B2B Services: • Renewed market strategy for SMEs resulting in churn reduction • Implementation of integrated Cloud Portfolio solutions • Fiber access solution redefined to reduce Capex /customer
• Quality Delivery: • Developed Sales Quality Index, deployed countrywide, resulting in reduced mis-
sales • In IT, software factories productivity renegotiation and new processes being
implemented to reduce complexity of portfolio, costs and execution
• Operational Efficiency: • Turnaround in Revenue Assurance processes contributed with R$ 66M in 2013´s
OFCF • Control mechanisms/policies for invoice adjustments contributed >R$ 100M to
2013’s OFCF
Oi and PT integration initiatives
Note: Above synergy figures as per company guidance. 1- NPV valuation as at 31-Dec-13 based on 10% discount rate. 2 - Pre-tax.
1Q14 Results – Progress against our business objectives
Oi S.A. | 7
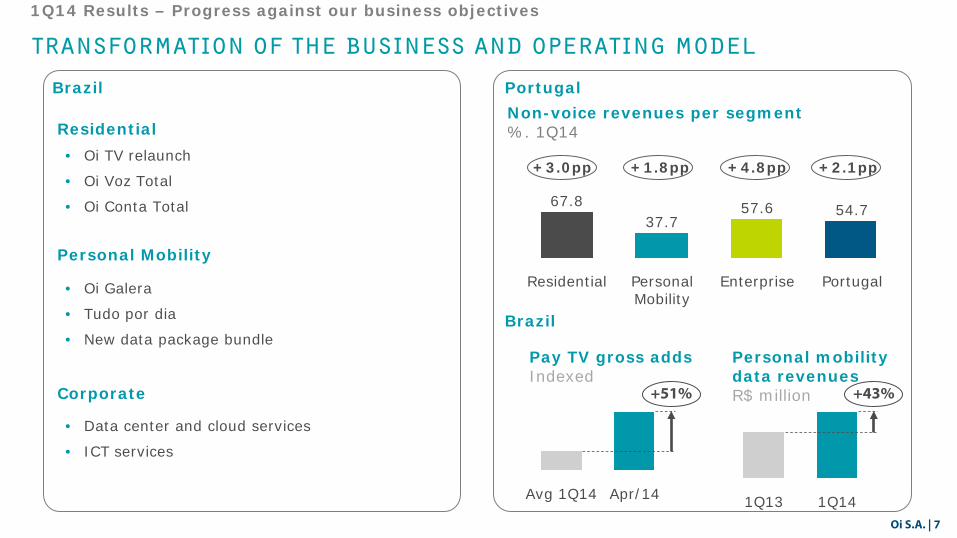
Transformation of the business and operating model
Non-voice revenues per segment %. 1Q14
Portugal
54.7
Enterprise
57.6
Personal Mobility
37.7
Residential
67.8
+3.0pp +1.8pp +4.8pp +2.1pp
1Q14 Results – Progress against our business objectives
Brazil
• Oi TV relaunch
• Oi Voz Total
• Oi Conta Total
Residential
Personal Mobility
Corporate
• Oi Galera
• Tudo por dia
• New data package bundle
• Data center and cloud services
• ICT services
Portugal
+51%
Apr/14 Avg 1Q14
Pay TV gross adds Indexed
1Q13 1Q14
+43%
Personal mobility data revenues
R$ million
Brazil

Oi S.A. | 8
highlights
Oi S.A. | 9
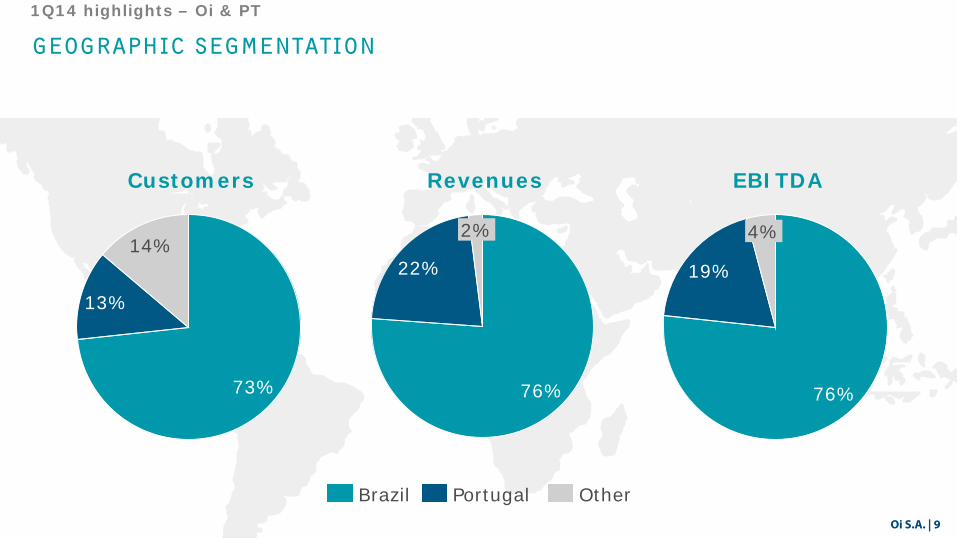
1Q14 highlights – Oi & PT
GEOGRAPHIC segmentation
14%
13%
73%
Customers
22%
2%
76%
4%
19%
76%
Revenues EBITDA
Other Portugal Brazil Oi S.A. | 9
Oi S.A. | 10
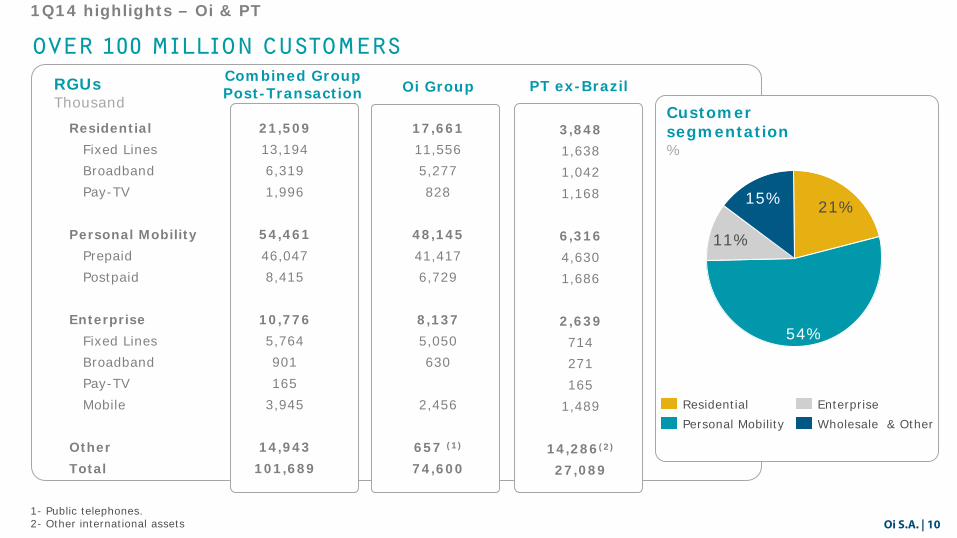
OVER 100 MILLION CUSTOMERs
RGUs Thousand
Oi Group Residential Fixed Lines Broadband Pay-TV Personal Mobility Prepaid Postpaid Enterprise Fixed Lines Broadband Pay-TV Mobile Other Total
21,509 13,194 6,319 1,996
54,461 46,047 8,415
10,776 5,764 901 165
3,945
14,943 101,689
PT ex-Brazil
17,661 11,556 5,277 828
48,145 41,417 6,729
8,137 5,050 630
2,456
657 (1)
74,600
3,848 1,638 1,042 1,168
6,316 4,630 1,686
2,639 714 271 165
1,489
14,286(2) 27,089
1- Public telephones.
2- Other international assets
Customer segmentation %
15%
11%
54%
21%
Wholesale & Other Enterprise
Personal Mobility Residential
Combined Group Post-Transaction
1Q14 highlights – Oi & PT
Oi S.A. | 11
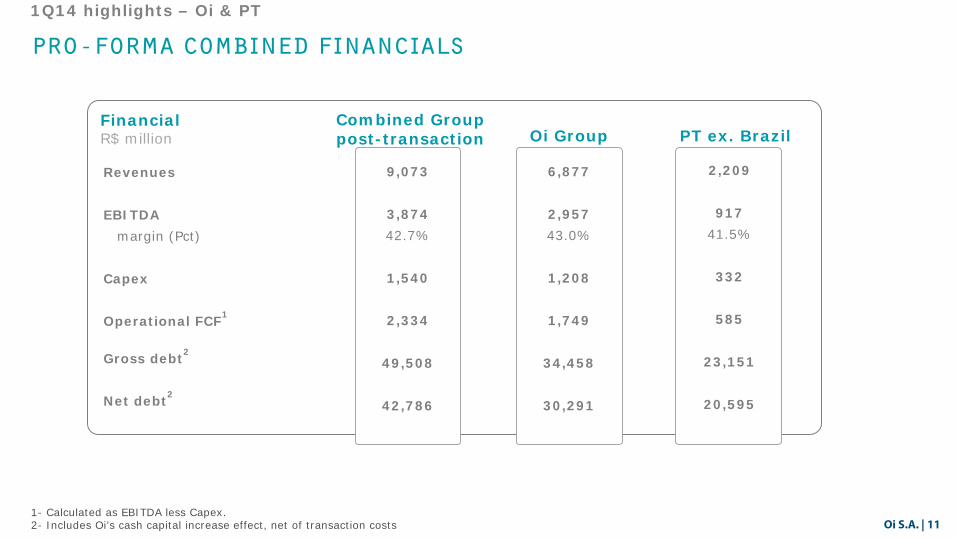
PRO-FORMA COMBINED FINANCIALS
1- Calculated as EBITDA less Capex. 2- Includes Oi’s cash capital increase effect, net of transaction costs
Financial R$ million
Revenues EBITDA margin (Pct) Capex Operational FCF1
Gross debt2
Net debt2
Combined Group post-transaction Oi Group PT ex. Brazil
9,073
3,874 42.7%
1,540
2,334
49,508
42,786
6,877
2,957 43.0%
1,208
1,749
34,458
30,291
2,209
917 41.5%
332
585
23,151
20,595
1Q14 highlights – Oi & PT
Oi S.A. | 12
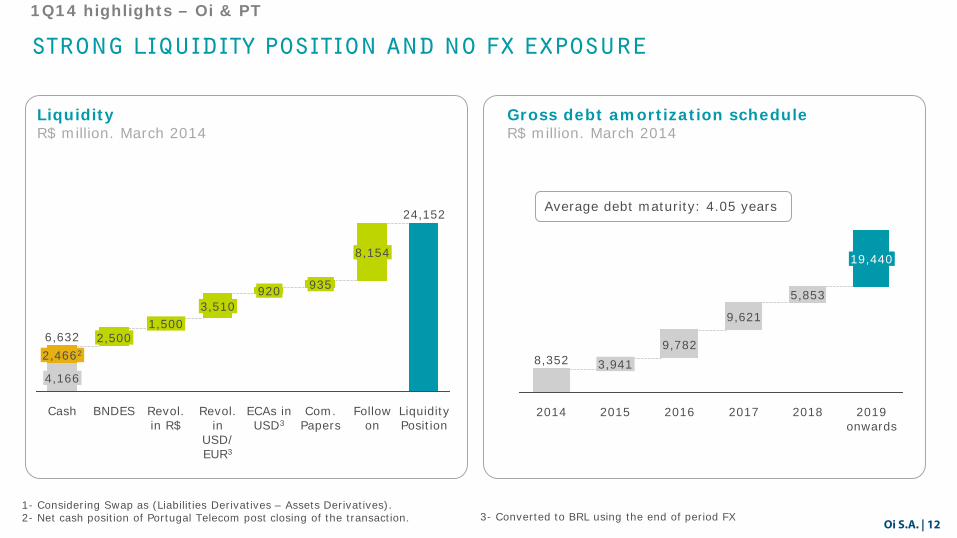
Strong liquidity position and no fx exposure
1- Considering Swap as (Liabilities Derivatives – Assets Derivatives). 2- Net cash position of Portugal Telecom post closing of the transaction.
Liquidity R$ million. March 2014
Gross debt amortization schedule R$ million. March 2014
Average debt maturity: 4.05 years
3- Converted to BRL using the end of period FX
2,500
Cash
6,632
4,166
2,4662
Follow on
935
8,154
Liquidity Position
Com. Papers
24,152
ECAs in USD3
920
Revol. in
USD/ EUR3
3,510
Revol. in R$
1,500
BNDES 2019 onwards
2018
19,440
5,853
2017
9,621
2016
9,782
2015
3,941
2014
8,352
1Q14 highlights – Oi & PT

Oi S.A. | 13
BRAZIL
Oi S.A. | 14
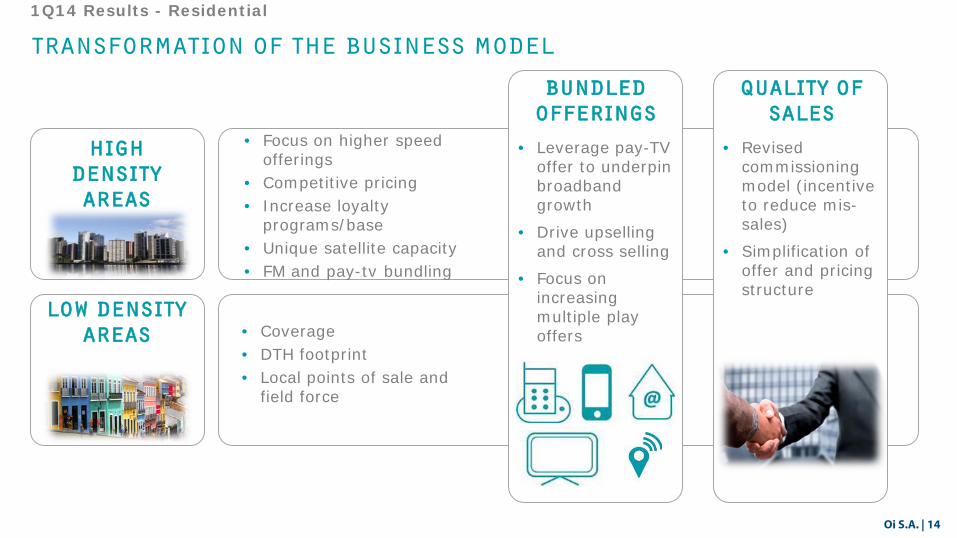
Transformation of the business model
1Q14 Results - Residential
High density areas
Low density areas
• Revised commissioning model (incentive to reduce mis-sales)
• Simplification of offer and pricing structure
Quality of sales
Bundled offerings
• Leverage pay-TV offer to underpin broadband growth
• Drive upselling and cross selling
• Focus on increasing multiple play offers
• Increase ARPU
• Specific channel offers
• Focus on higher speed offerings
• Competitive pricing • Increase loyalty
programs/base • Unique satellite capacity • FM and pay-tv bundling
• Coverage • DTH footprint • Local points of sale and
field force
Oi S.A. | 15
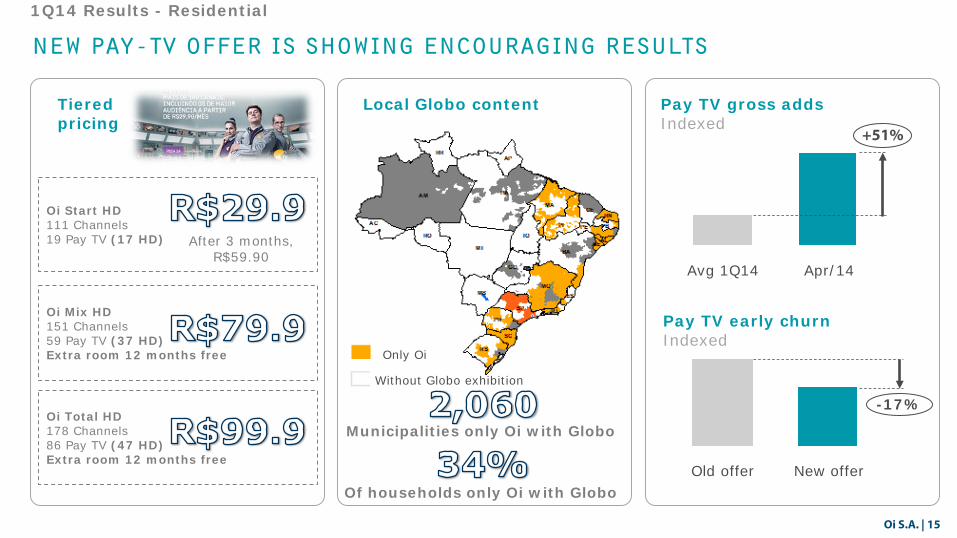
new pay-tv offer is showing encouraging results
1Q14 Results - Residential
Oi Start HD 111 Channels 19 Pay TV (17 HD)
Tiered pricing
Local Globo content
Oi Mix HD 151 Channels 59 Pay TV (37 HD) Extra room 12 months free
Oi Total HD 178 Channels 86 Pay TV (47 HD) Extra room 12 months free
Only Oi
After 3 months, R$59.90
Municipalities only Oi with Globo
Of households only Oi with Globo
Without Globo exhibition
Pay TV gross adds Indexed
Pay TV early churn Indexed
-17%
New offer Old offer
+51%
Apr/14 Avg 1Q14
Oi S.A. | 16
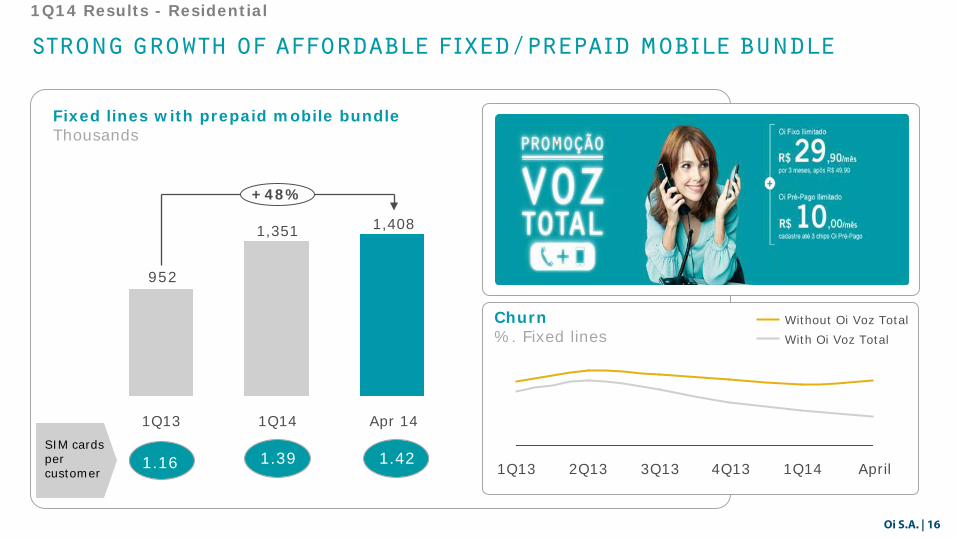
Strong growth of affordable fixed/prepaid mobile bundle
1Q14 Results - Residential
Fixed lines with prepaid mobile bundle Thousands
Churn %. Fixed lines
952
+48%
Apr 14
1,408
1Q14
1,351
1Q13
April 1Q14 4Q13 3Q13 2Q13 1Q13
With Oi Voz Total Without Oi Voz Total
1.16 1.42 1.39 SIM cards per customer
Oi S.A. | 17
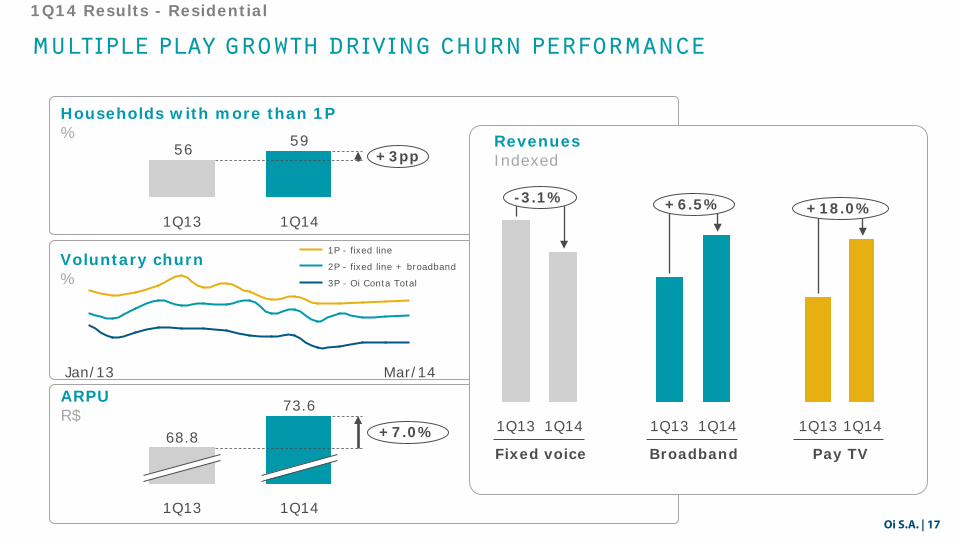
Multiple play growth driving churn performance
1Q14 Results - Residential
Revenues Indexed
Fixed voice Broadband Pay TV
-3.1%
1Q14 1Q13
+6.5%
1Q14 1Q13 1Q14 1Q13
+18.0%
Voluntary churn %
Mar/14 Jan/13
3P - Oi Conta Total
2P - fixed line + broadband
1P - fixed line
5956 +3pp
1Q14 1Q13
Households with more than 1P %
73.6
1Q14 1Q13
68.8 +7.0%
ARPU R$
Oi S.A. | 18
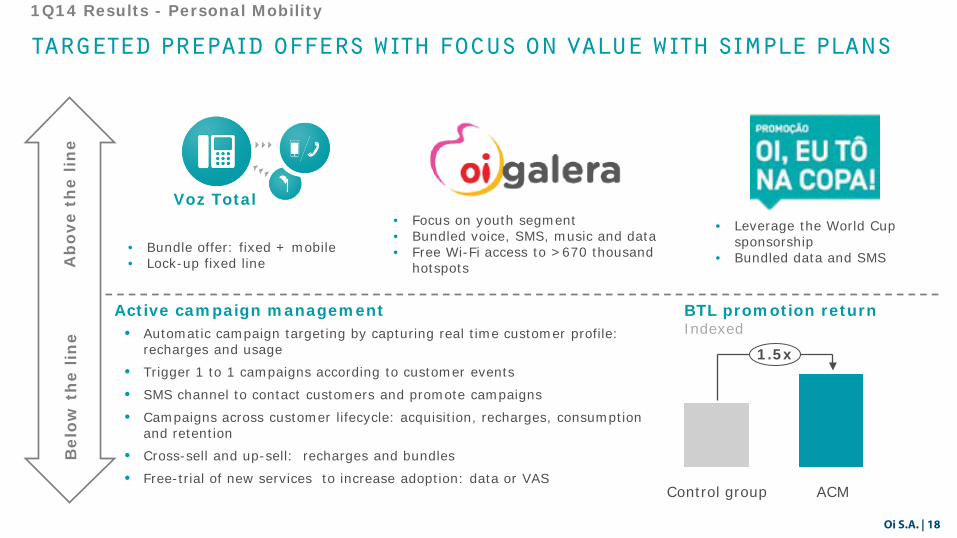
Targeted prepaid offers with focus on value with simple plans
1Q14 Results - Personal Mobility
Bel
ow
th
e lin
e A
bo
ve t
he
line
Voz Total
• Bundle offer: fixed + mobile • Lock-up fixed line
• Focus on youth segment • Bundled voice, SMS, music and data • Free Wi-Fi access to >670 thousand
hotspots
• Leverage the World Cup sponsorship
• Bundled data and SMS
• Automatic campaign targeting by capturing real time customer profile: recharges and usage
• Trigger 1 to 1 campaigns according to customer events
• SMS channel to contact customers and promote campaigns
• Campaigns across customer lifecycle: acquisition, recharges, consumption and retention
• Cross-sell and up-sell: recharges and bundles
• Free-trial of new services to increase adoption: data or VAS
BTL promotion return Indexed
1.5x
ACM Control group
Active campaign management
Oi S.A. | 19
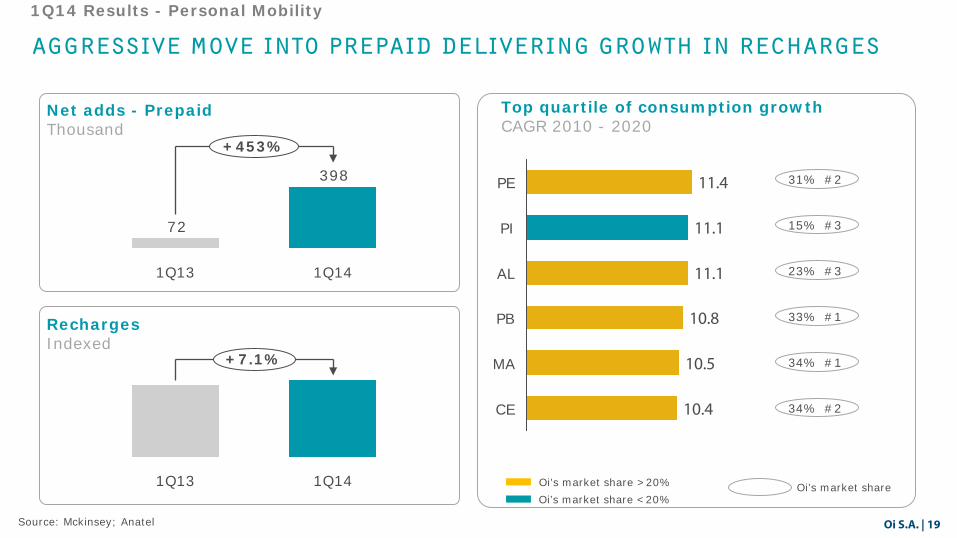
Aggressive move into prepaid delivering growth in recharges
Recharges Indexed
1Q14 Results - Personal Mobility
+7.1%
1Q14 1Q13
Top quartile of consumption growth
CAGR 2010 - 2020
Oi’s market share >20% Oi’s market share <20%
CE 10.4
MA 10.5
PB 10.8
AL 11.1
PI 11.1
PE 11.4 31% #2
15% #3
Oi’s market share
23% #3
33% #1
34% #1
34% #2
Source: Mckinsey; Anatel
Net adds - Prepaid Thousand
398
72
1Q14 1Q13
+453%
Oi S.A. | 20
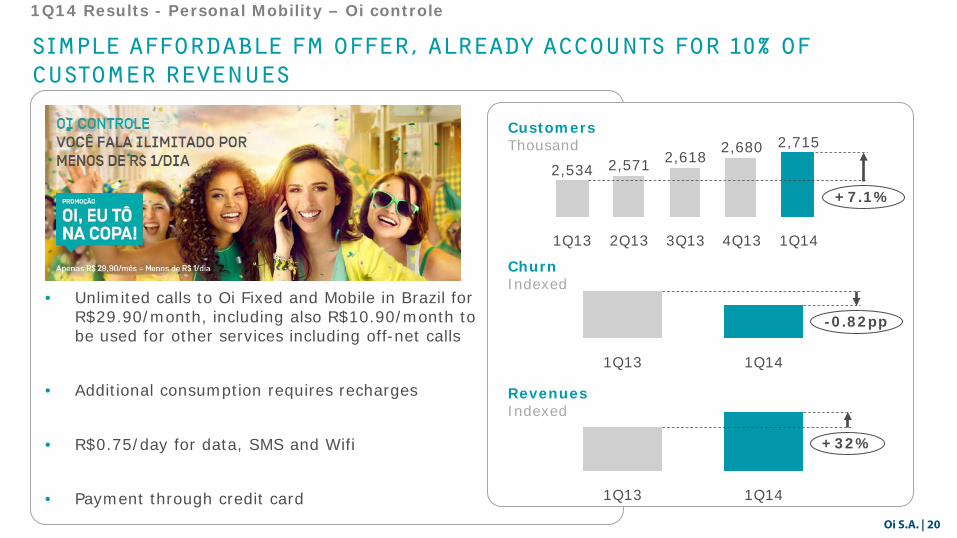
Simple affordable FM offer, already accounts for 10% of customer revenues
1Q14 Results - Personal Mobility – Oi controle
• Unlimited calls to Oi Fixed and Mobile in Brazil for R$29.90/month, including also R$10.90/month to be used for other services including off-net calls
• Additional consumption requires recharges
• R$0.75/day for data, SMS and Wifi
• Payment through credit card
Revenues Indexed
+32%
1Q14 1Q13
Churn Indexed
-0.82pp
1Q14 1Q13
Customers Thousand
1Q14
2,715
4Q13
+7.1%
2,571 2,618
2Q13
2,534
3Q13
2,680
1Q13
Oi S.A. | 21
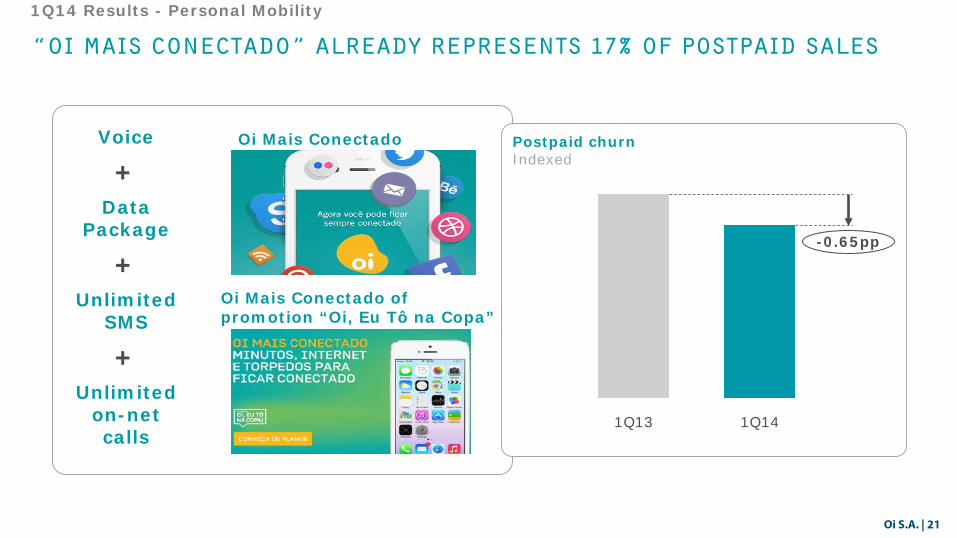
“Oi Mais Conectado” already represents 17% of postpaid sales
1Q14 Results - Personal Mobility
Voice
+ Data
Package
+ Unlimited
SMS
+ Unlimited
on-net calls
Oi Mais Conectado
Oi Mais Conectado of promotion “Oi, Eu Tô na Copa”
Postpaid churn Indexed
-0.65pp
1Q13 1Q14
Oi S.A. | 22
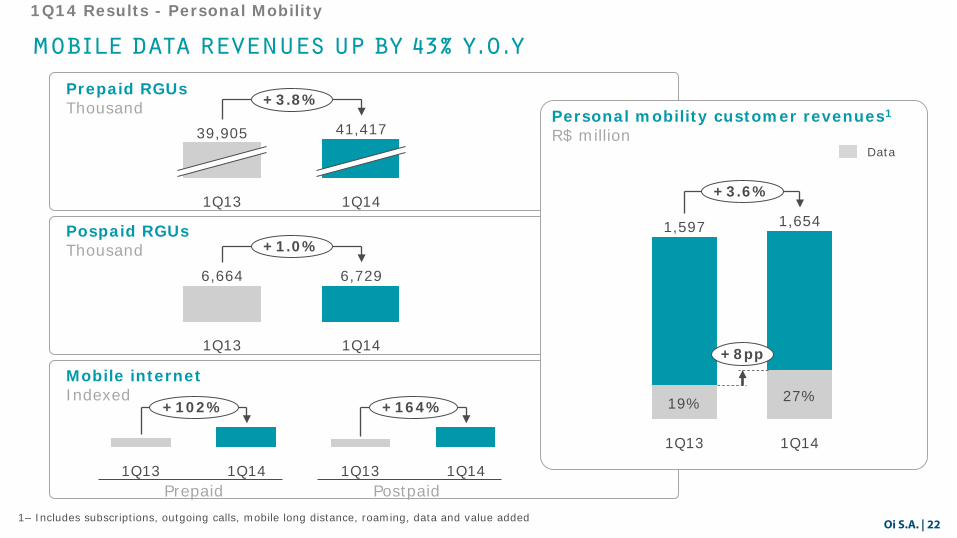
Mobile data revenues up by 43% y.o.y
1Q14 Results - Personal Mobility
Pospaid RGUs Thousand
Personal mobility customer revenues1
R$ million Data
1,654
+8pp
+3.6%
1Q14
27%
1Q13
1,597
19%
Prepaid RGUs Thousand +3.8%
1Q14
41,417
1Q13
39,905
+1.0%
1Q14
6,729
1Q13
6,664
Mobile internet Indexed
1Q14 1Q13
+102%
1Q13 1Q14
+164%
Prepaid Postpaid 1– Includes subscriptions, outgoing calls, mobile long distance, roaming, data and value added

Oi S.A. | 23
Commercial turnaround in progress…
1Q14 Results - SMEs
1– Confirmation of sales with the customer
2– Transformation of inbound customer interactions in new sales
Quality of sales
Jun 13 Sep 13 Jan 14 Today
• Review of commissioning model
• Launch of quality call1
• Offers • Convergent offers • Redesign of existing mobile
and fixed offers
• Channels • Internal sales force • Branded stores • Service to Sales2
• Stronger support to partners
• Improvement in the ratio Gross Sales / Activation
• Revised credit policies • Website redesigned • Improvement of
registration process • Data mining and analysis
to improve sales process
Competitiveness Productivity
Oi S.A. | 24
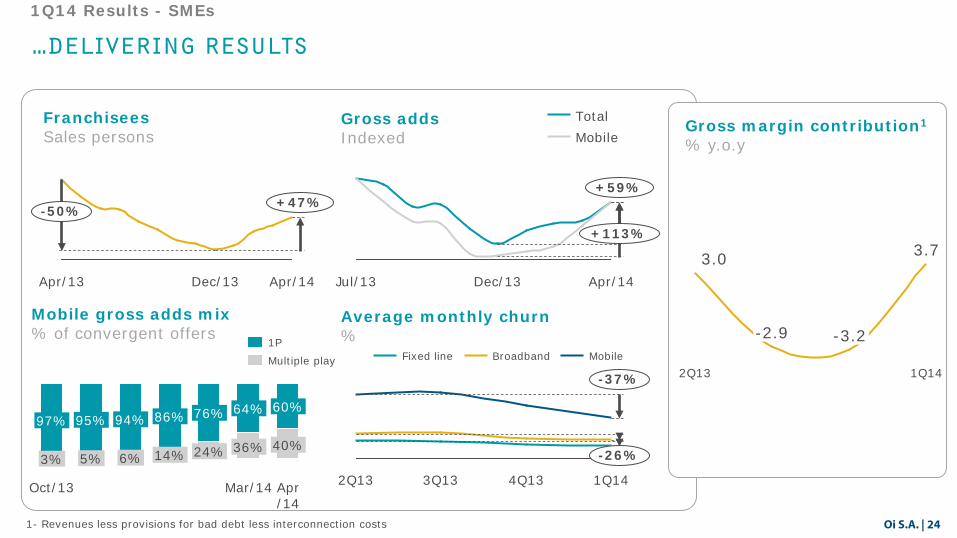
…delivering results
1Q14 Results - SMEs
Average monthly churn %
2Q13
-26%
-37%
1Q14 4Q13 3Q13
Mobile Broadband Fixed line
Franchisees Sales persons
Mobile gross adds mix % of convergent offers
-50% +47%
Apr/14 Dec/13 Apr/13
Apr /14
40%
60%
Mar/14
36%
64%
24%
76%
14%
86%
6%
94%
5%
95%
Oct/13
3%
97%
Multiple play
1P
Gross adds Indexed
+113%
+59%
Apr/14 Jul/13 Dec/13
Mobile Total Gross margin contribution1
% y.o.y
1- Revenues less provisions for bad debt less interconnection costs
-3.2 -2.9
1Q14
3.7
2Q13
3.0
Oi S.A. | 25
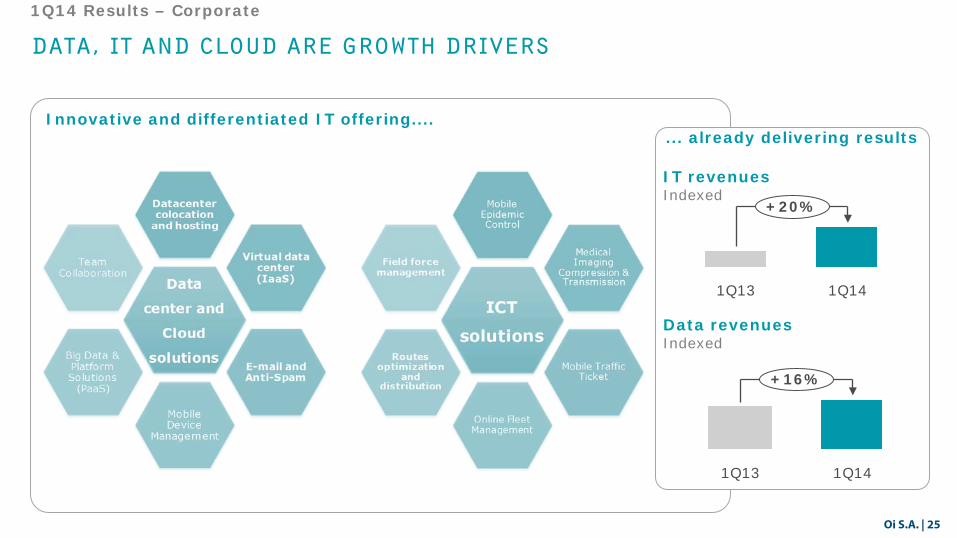
Data, it and cloud are growth drivers
1Q14 Results – Corporate
Innovative and differentiated IT offering.... ... already delivering results
IT revenues Indexed
1Q14 1Q13
+20%
Data revenues Indexed
1Q13
+16%
1Q14
Oi S.A. | 26
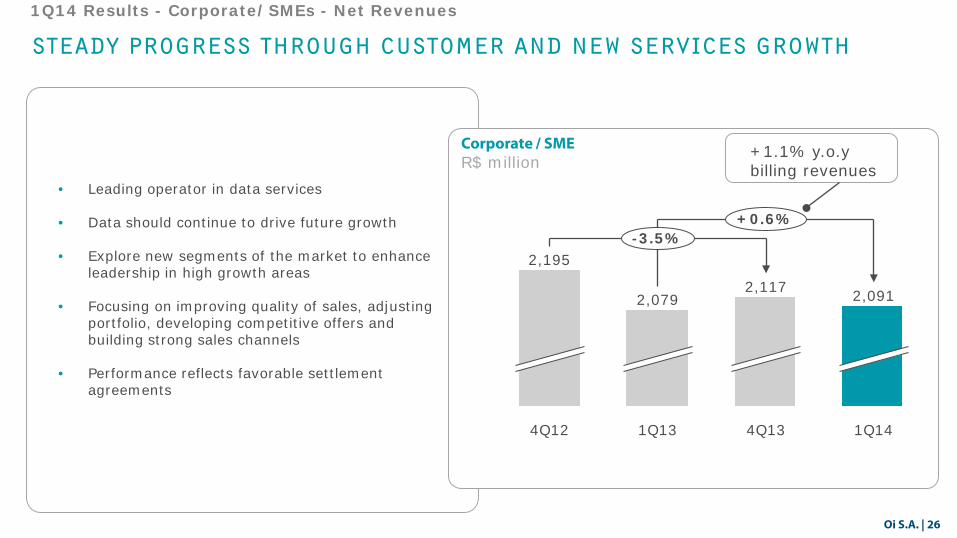
Steady progress through customer and new services growth
1Q14 Results - Corporate/SMEs - Net Revenues
-3.5% +0.6%
1Q14
2,091
4Q13
2,117
1Q13
2,079
4Q12
2,195
• Leading operator in data services
• Data should continue to drive future growth
• Explore new segments of the market to enhance leadership in high growth areas
• Focusing on improving quality of sales, adjusting portfolio, developing competitive offers and building strong sales channels
• Performance reflects favorable settlement agreements
Corporate / SME R$ million
+1.1% y.o.y billing revenues
Oi S.A. | 27
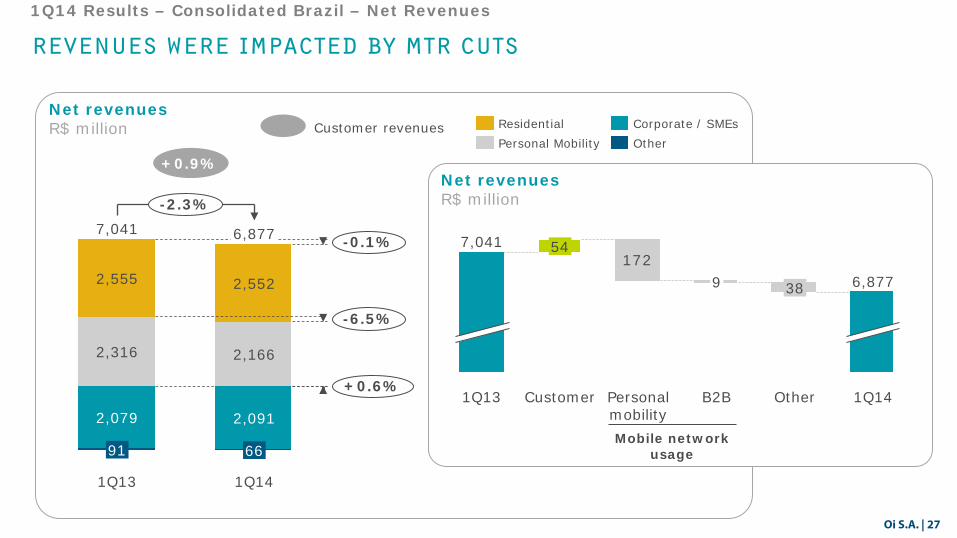
Revenues were impacted by mtr cuts
1Q14 Results – Consolidated Brazil – Net Revenues
6,877 -0.1%
-6.5%
+0.6%
-2.3%
1Q14
66
2,091
2,166
2,552
1Q13
7,041
91
2,079
2,316
2,555
Personal Mobility Residential
Other Corporate / SMEs
Net revenues R$ million
172
1Q14
6,877
Other
38
B2B
9
Personal mobility
Customer
54
1Q13
7,041
Net revenues R$ million
Mobile network usage
+0.9%
Customer revenues
Oi S.A. | 28
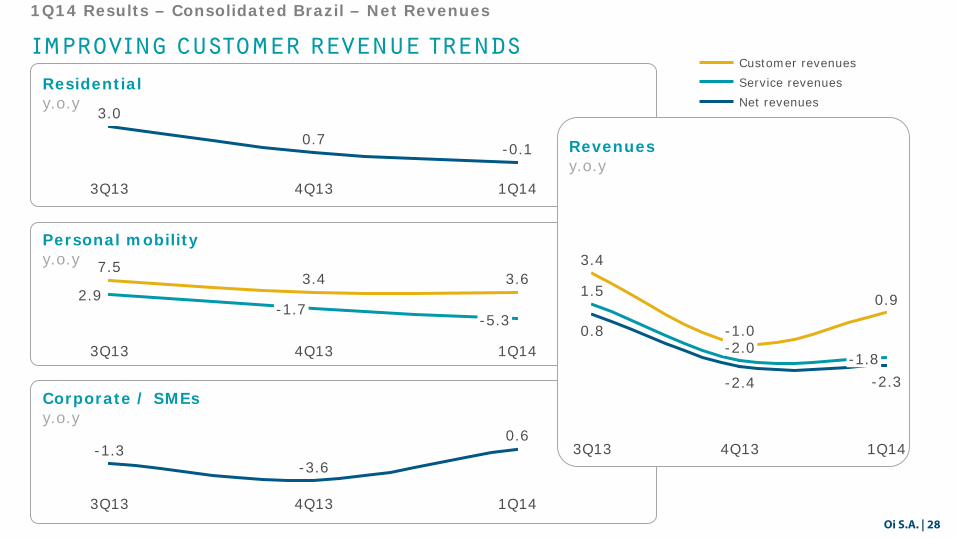
Improving customer revenue trends
1Q14 Results – Consolidated Brazil – Net Revenues
Residential y.o.y
Personal mobility y.o.y
Corporate / SMEs y.o.y
Revenues y.o.y
1Q14
-0.1
4Q13
0.7
3Q13
3.0
1Q14
-5.3
3.6
4Q13
-1.7
3.4
3Q13
2.9
7.5
1Q14 4Q13 3Q13
-1.3 -3.6
0.6
3.4
1.5
4Q13
0.8
-1.8 -2.0
0.9
-2.4 -2.3
-1.0
3Q13 1Q14
Service revenues Customer revenues
Net revenues
Oi S.A. | 29
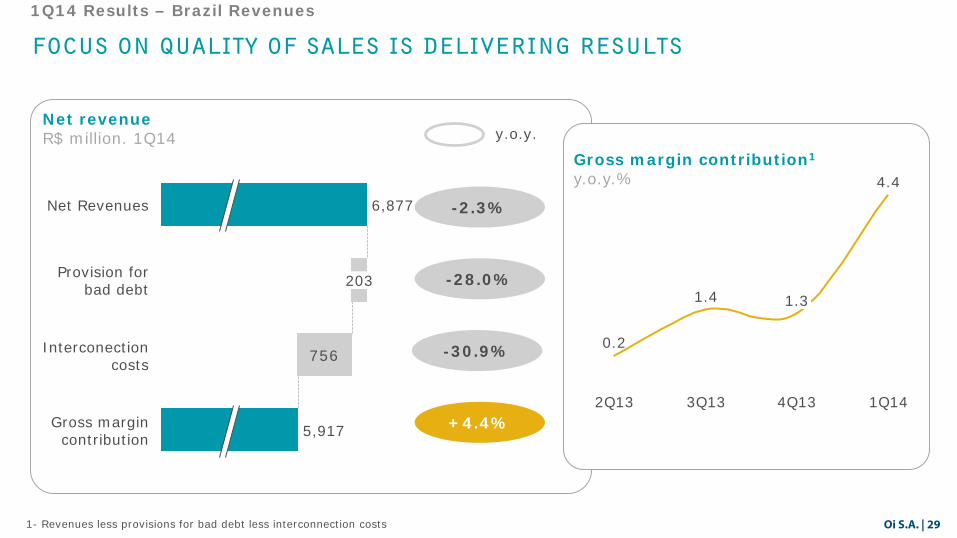
Focus on quality of sales is delivering results
1Q14 Results – Brazil Revenues
756
Gross margin contribution 5,917
Interconection costs
Provision for bad debt 203
Net Revenues 6,877
Net revenue R$ million. 1Q14 y.o.y.
1Q14
4.4
4Q13
1.3
3Q13
1.4
2Q13
0.2
Gross margin contribution1 y.o.y.%
1- Revenues less provisions for bad debt less interconnection costs
-2.3%
-28.0%
+4.4%
-30.9%
Oi S.A. | 30
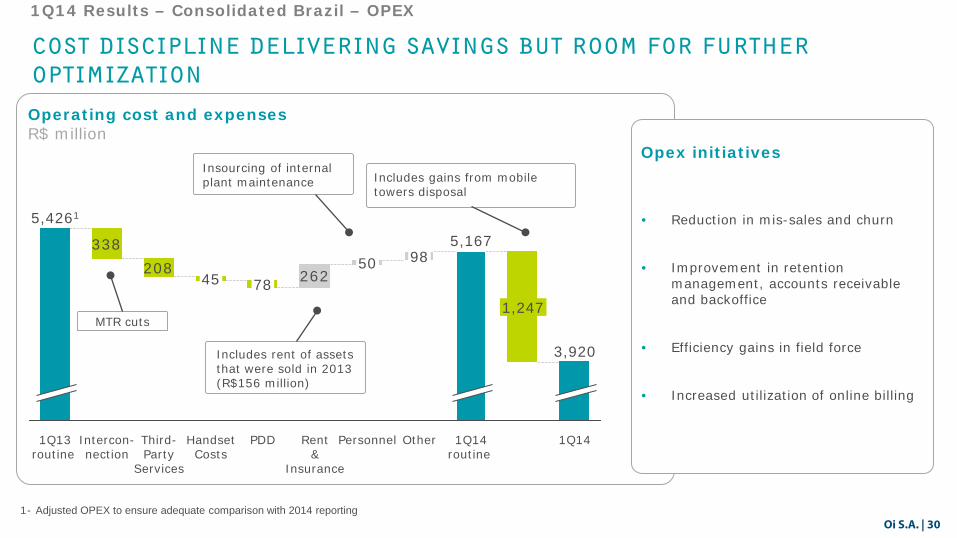
Operating cost and expenses R$ million
cost discipline delivering savings but room for further optimization
1Q14 Results – Consolidated Brazil – OPEX
Insourcing of internal plant maintenance
1- Adjusted OPEX to ensure adequate comparison with 2014 reporting
• Reduction in mis-sales and churn
• Improvement in retention management, accounts receivable and backoffice
• Efficiency gains in field force
• Increased utilization of online billing
Opex initiatives
262208338
1,247
1Q14
3,920
1Q14 routine
5,167
Rent &
Insurance
50
Personnel
98
Other PDD
78
Handset Costs
Third-Party
Services
45
Intercon-nection
1Q13 routine
5,4261
MTR cuts
Includes rent of assets that were sold in 2013 (R$156 million)
Includes gains from mobile towers disposal
Oi S.A. | 31
+5.9%
1Q14
1,710
1Q13
1,615
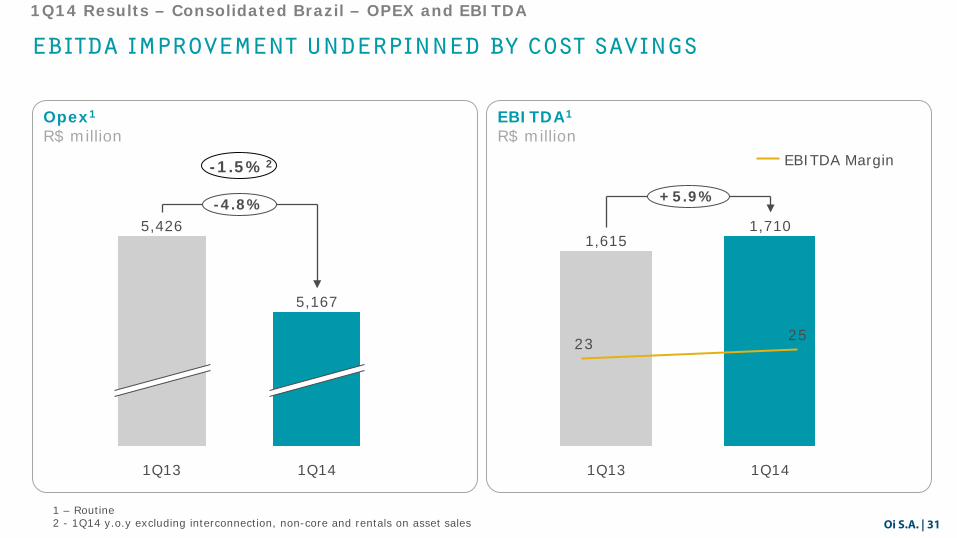
Ebitda improvement underpinned by cost savings
1Q14 Results – Consolidated Brazil – OPEX and EBITDA
EBITDA1 R$ million
Opex1
R$ million
-4.8%
1Q14
5,167
1Q13
5,426
1 – Routine 2 - 1Q14 y.o.y excluding interconnection, non-core and rentals on asset sales
2523
EBITDA Margin -1.5%2
Oi S.A. | 32
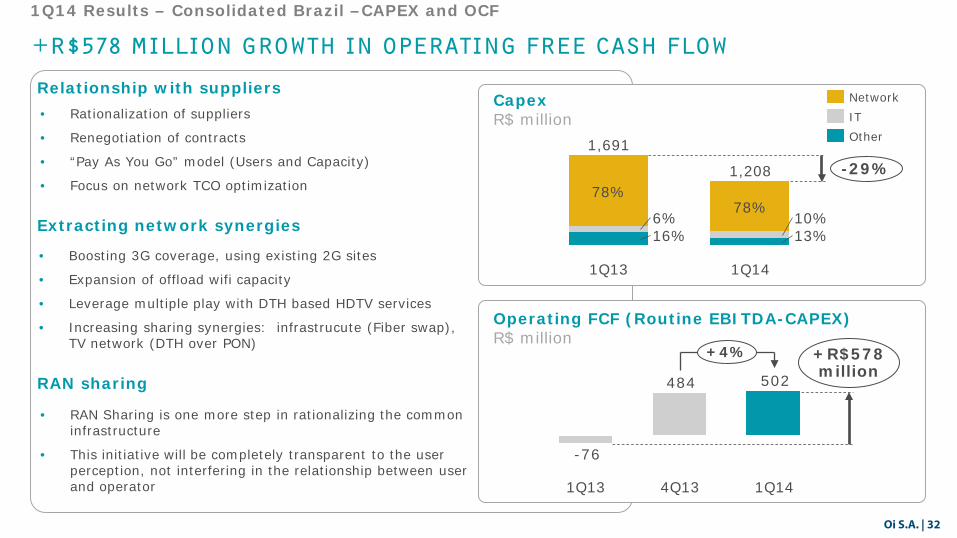
+R$578 million growth in operating free cash flow
1Q14 Results – Consolidated Brazil –CAPEX and OCF
Operating FCF (Routine EBITDA-CAPEX) R$ million
502484
-76
+R$578 million
+4%
1Q14 4Q13 1Q13
78%
1,691
13% 16%
1Q14
10%
-29% 1,208
6%
1Q13
78%
Capex R$ million
Other
Network IT • Rationalization of suppliers
• Renegotiation of contracts
• “Pay As You Go” model (Users and Capacity)
• Focus on network TCO optimization
• RAN Sharing is one more step in rationalizing the common infrastructure
• This initiative will be completely transparent to the user perception, not interfering in the relationship between user and operator
• Boosting 3G coverage, using existing 2G sites
• Expansion of offload wifi capacity
• Leverage multiple play with DTH based HDTV services
• Increasing sharing synergies: infrastrucute (Fiber swap), TV network (DTH over PON)
Relationship with suppliers
RAN sharing
Extracting network synergies
Oi S.A. | 33
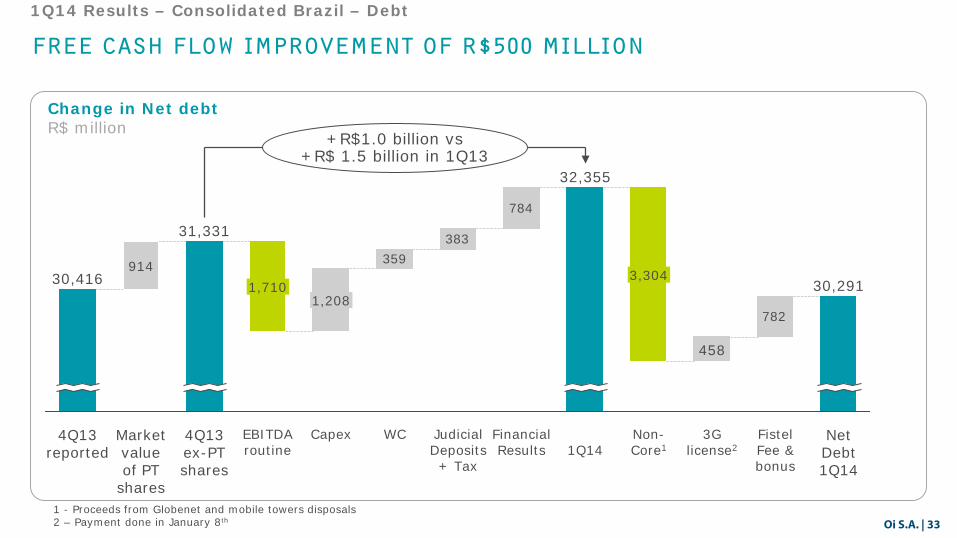
Free cash flow improvement of R$500 million
1Q14 Results – Consolidated Brazil – Debt
Change in Net debt
R$ million
1 - Proceeds from Globenet and mobile towers disposals 2 – Payment done in January 8th
782
784
383359914
4Q13 reported
30,416
+R$1.0 billion vs +R$ 1.5 billion in 1Q13
Net Debt 1Q14
Fistel Fee & bonus
3G license2
Market value of PT
shares
4Q13 ex-PT shares
31,331
EBITDA routine
1,710 1,208
Capex WC Judicial Deposits + Tax
Financial Results
30,291
32,355
1Q14
3,304
Non-Core1
458

Oi S.A. | 34
portugal
Oi S.A. | 35
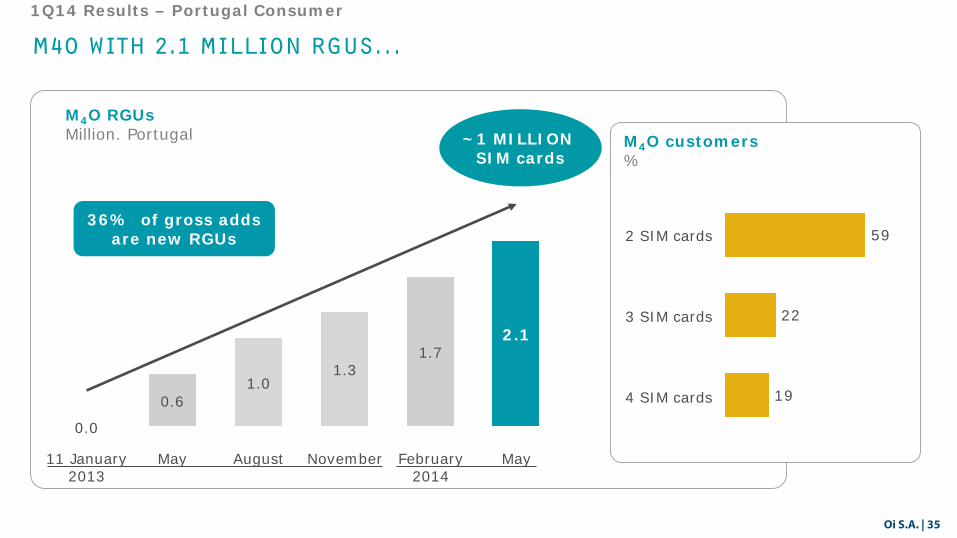
M4O with 2.1 million RGUs...
1Q14 Results – Portugal Consumer
M4O RGUs Million. Portugal
May February 2014
1.7
November
1.3
August
1.0
May
0.6
11 January 2013
0.0
2.1
M4O customers %
19
22
59
4 SIM cards
3 SIM cards
2 SIM cards 36% of gross adds
are new RGUs
~1 MILLION SIM cards
Oi S.A. | 36
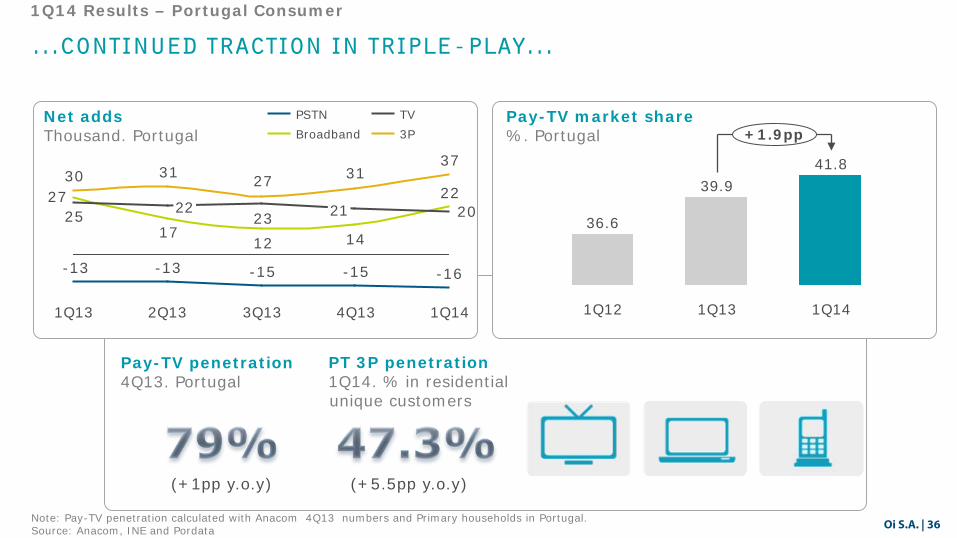
...Continued traction in triple-play...
1Q14 Results – Portugal Consumer
(+1pp y.o.y)
Note: Pay-TV penetration calculated with Anacom 4Q13 numbers and Primary households in Portugal. Source: Anacom, INE and Pordata
Net adds Thousand. Portugal
Pay-TV penetration 4Q13. Portugal
Pay-TV market share %. Portugal
1Q13 1Q14
41.8 39.9
1Q12
+1.9pp
36.6
-16-15-15-13-13
22
141217
27202325
3731273130
1Q14 4Q13
21
3Q13 2Q13
22
1Q13
3P TV
Broadband PSTN
(+5.5pp y.o.y)
PT 3P penetration 1Q14. % in residential unique customers
Oi S.A. | 37
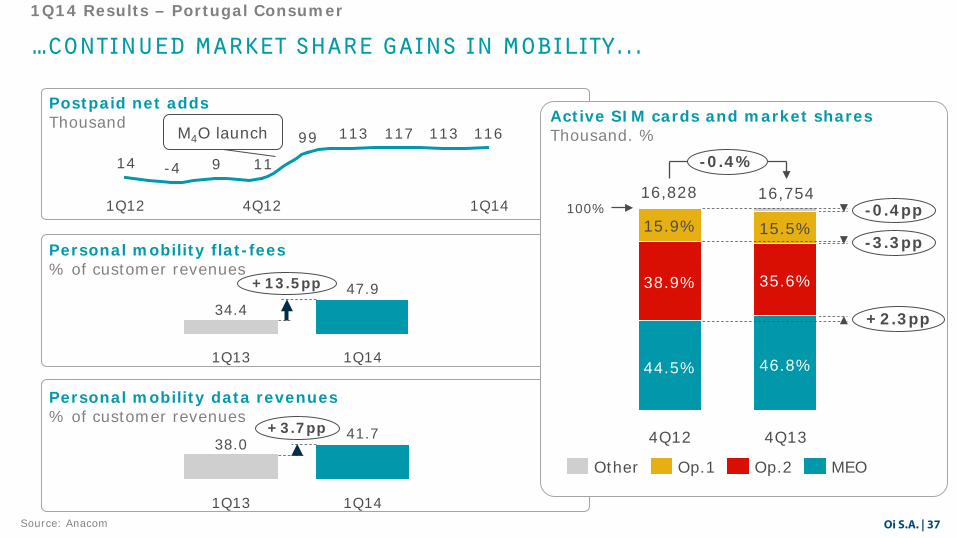
…continued MARKET SHARE gains IN MOBILITY...
1Q14 Results – Portugal Consumer
Source: Anacom
47.9 +13.5pp
1Q14 1Q13
34.4
Personal mobility flat-fees % of customer revenues
Personal mobility data revenues % of customer revenues
41.7 +3.7pp
1Q14 1Q13
38.0
Postpaid net adds Thousand
11611311711399
119-414
4Q12 1Q12 1Q14
M4O launch Active SIM cards and market shares Thousand. %
100% -0.4pp
-3.3pp
+2.3pp
4Q13
46.8%
35.6%
15.5%
4Q12
44.5%
38.9%
15.9%
MEO Op.2 Op.1 Other
-0.4%
16,754 16,828
Oi S.A. | 38
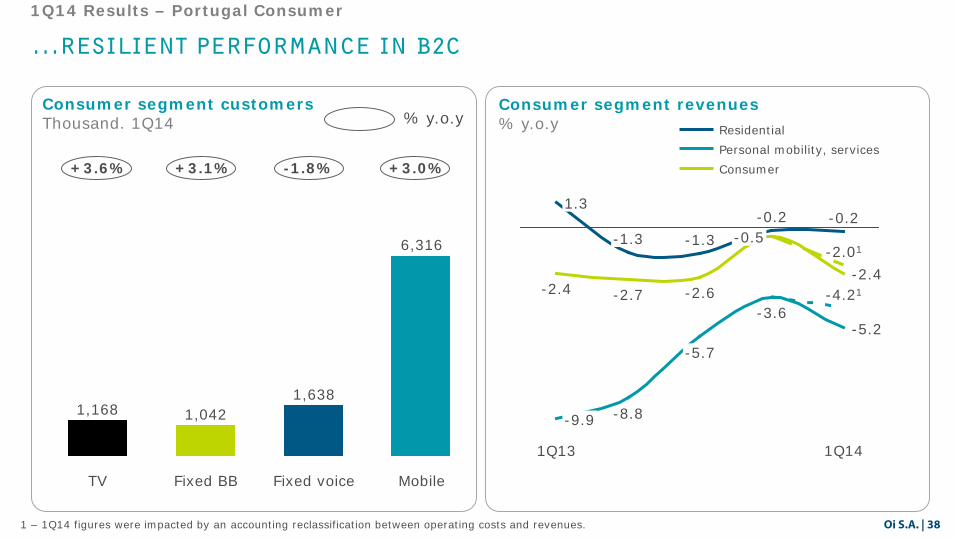
...resilient performance in b2c
1Q14 Results – Portugal Consumer
-2.01
1Q14
-4.21 -2.4
-5.2
-0.2 -0.5
-3.6
-0.2
-2.6
-5.7
-1.3
-2.7
-8.8
-1.3
1Q13
-2.4
-9.9
1.3
Consumer Personal mobility, services Residential
Consumer segment revenues % y.o.y
Consumer segment customers Thousand. 1Q14
Fixed BB
1,042
TV
1,168
Mobile
6,316
Fixed voice
1,638
+3.6% +3.1% -1.8% +3.0%
% y.o.y
1 – 1Q14 figures were impacted by an accounting reclassification between operating costs and revenues.
Oi S.A. | 39
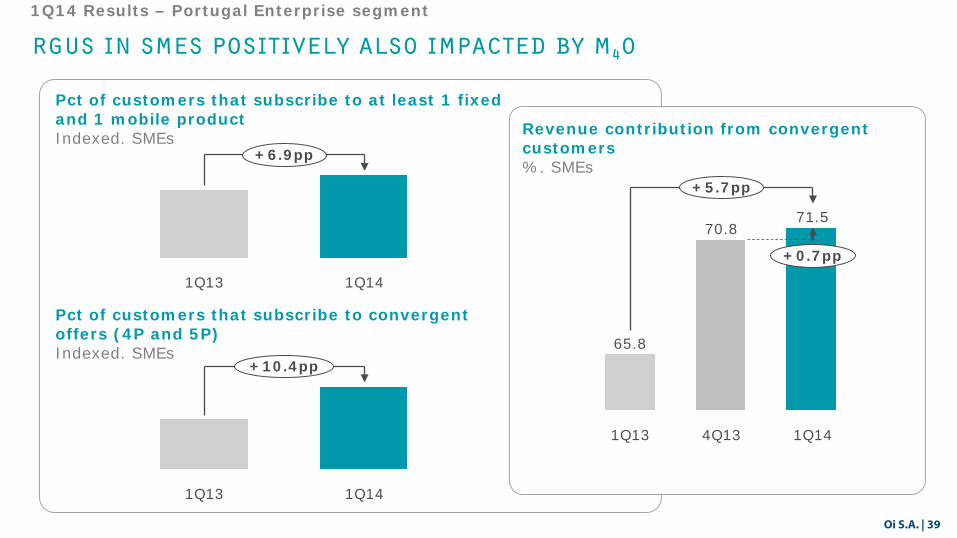
RGUs IN SMEs POSITIVELY also IMPACTED BY M4O
1Q14 Results – Portugal Enterprise segment
Revenue contribution from convergent customers %. SMEs
Pct of customers that subscribe to at least 1 fixed and 1 mobile product Indexed. SMEs
Pct of customers that subscribe to convergent offers (4P and 5P) Indexed. SMEs
+6.9pp
1Q14 1Q13
+10.4pp
1Q14 1Q13
4Q13 1Q14
+5.7pp
71.5
+0.7pp
70.8
1Q13
65.8
Oi S.A. | 40
FOCUS ON CAPTURING NEW SERVICE REVENUES AND DRIVing EFFICIENCY
1Q14 Results – Portugal Enterprise segment
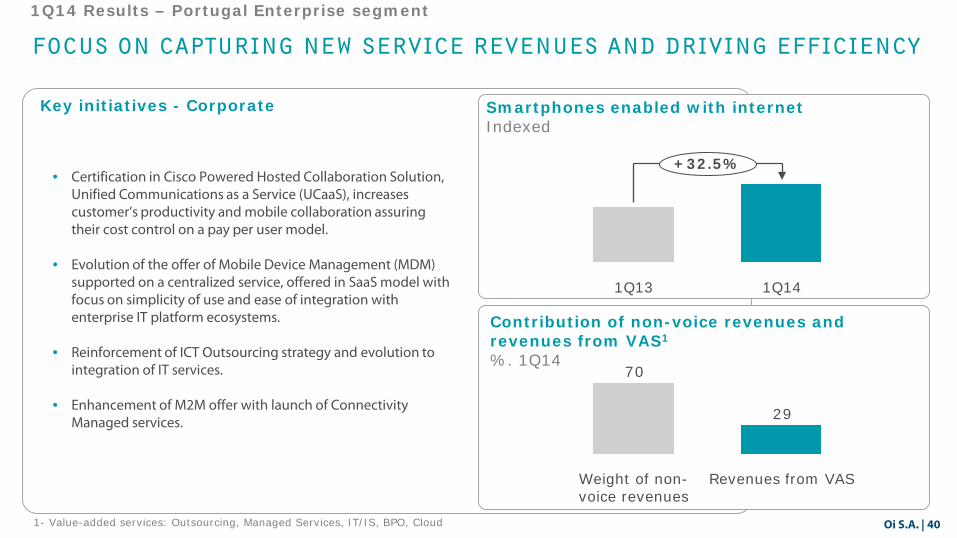
Contribution of non-voice revenues and revenues from VAS1
%. 1Q14
1- Value-added services: Outsourcing, Managed Services, IT/IS, BPO, Cloud
• Certification in Cisco Powered Hosted Collaboration Solution, Unified Communications as a Service (UCaaS), increases customer’s productivity and mobile collaboration assuring their cost control on a pay per user model.
• Evolution of the offer of Mobile Device Management (MDM) supported on a centralized service, offered in SaaS model with focus on simplicity of use and ease of integration with enterprise IT platform ecosystems.
• Reinforcement of ICT Outsourcing strategy and evolution to integration of IT services.
• Enhancement of M2M offer with launch of Connectivity Managed services.
Key initiatives - Corporate Smartphones enabled with internet Indexed
29
70
Weight of non-voice revenues
Revenues from VAS
+32.5%
1Q14 1Q13
Oi S.A. | 41
DELIVERING RESULTS DESPITE PRICING PRESSURE
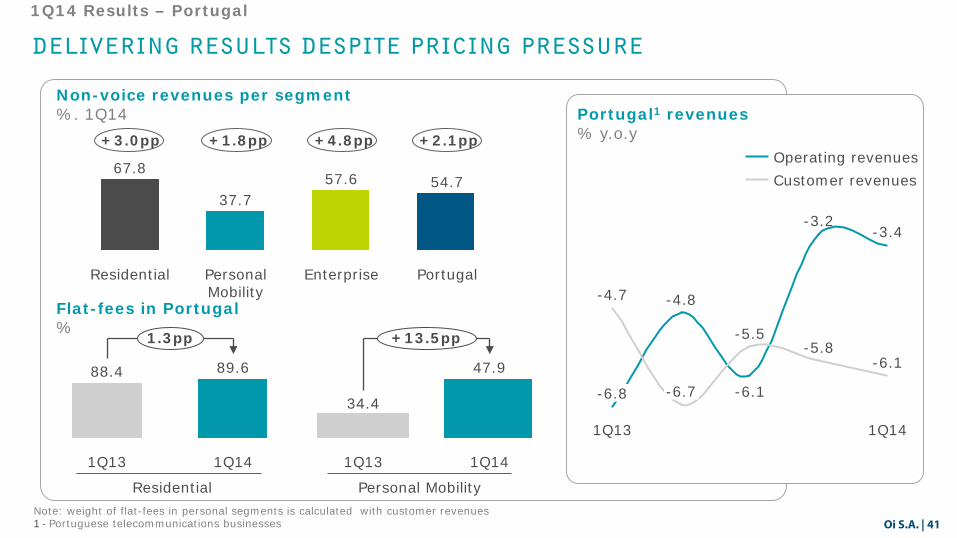
1Q14 Results – Portugal
Portugal1 revenues % y.o.y
Non-voice revenues per segment %. 1Q14
Flat-fees in Portugal %
-4.8
-3.2
-6.1 -6.8
-4.7
-6.7
-5.5 -5.8
-6.1
1Q14
-3.4
1Q13
57.6
Personal Mobility
Residential Portugal
54.7
Enterprise
67.8
37.7
+3.0pp +1.8pp +4.8pp +2.1pp
89.6
1Q13 1Q14
88.4
1.3pp
Residential Personal Mobility Note: weight of flat-fees in personal segments is calculated with customer revenues 1 - Portuguese telecommunications businesses
47.9
+13.5pp
1Q13 1Q14
34.4
Customer revenues Operating revenues
Oi S.A. | 42
Residential
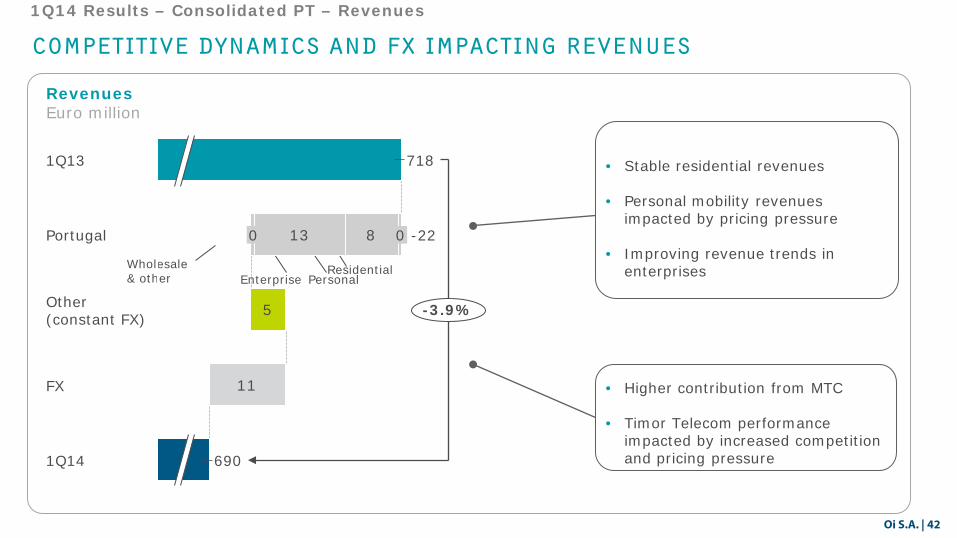
Competitive dynamics and fx impacting revenues
1Q14 Results – Consolidated PT – Revenues
Revenues Euro million
• Higher contribution from MTC
• Timor Telecom performance impacted by increased competition and pricing pressure
• Stable residential revenues
• Personal mobility revenues
impacted by pricing pressure
• Improving revenue trends in enterprises
-2.9%
Wholesale & other Enterprise Personal
11
5
13 8
690
FX
Other (constant FX) -3.9%
1Q14
Portugal -22 0 0
1Q13 718
Oi S.A. | 43
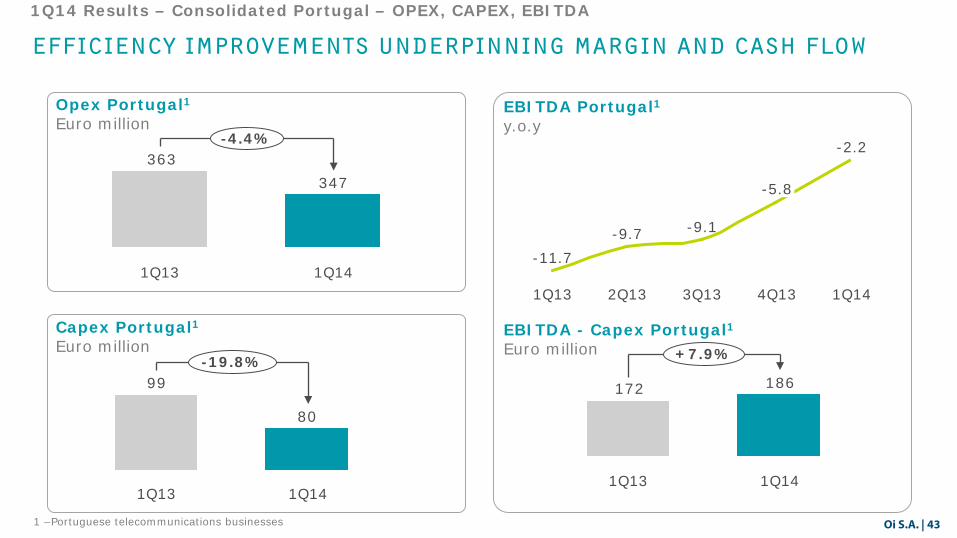
EFFICIENCY IMPROVEMENTs underpinning margin AND CASH FLOW
1Q14 Results – Consolidated Portugal – OPEX, CAPEX, EBITDA
Opex Portugal1 Euro million
347363
-4.4%
1Q14 1Q13
Capex Portugal1 Euro million
80
99-19.8%
1Q14 1Q13
EBITDA Portugal1 y.o.y
186172
+7.9%
1Q14 1Q13
EBITDA - Capex Portugal1 Euro million
1Q14
-2.2
4Q13
-5.8
3Q13
-9.1
2Q13
-9.7
1Q13
-11.7
1 –Portuguese telecommunications businesses
Oi S.A. | 44
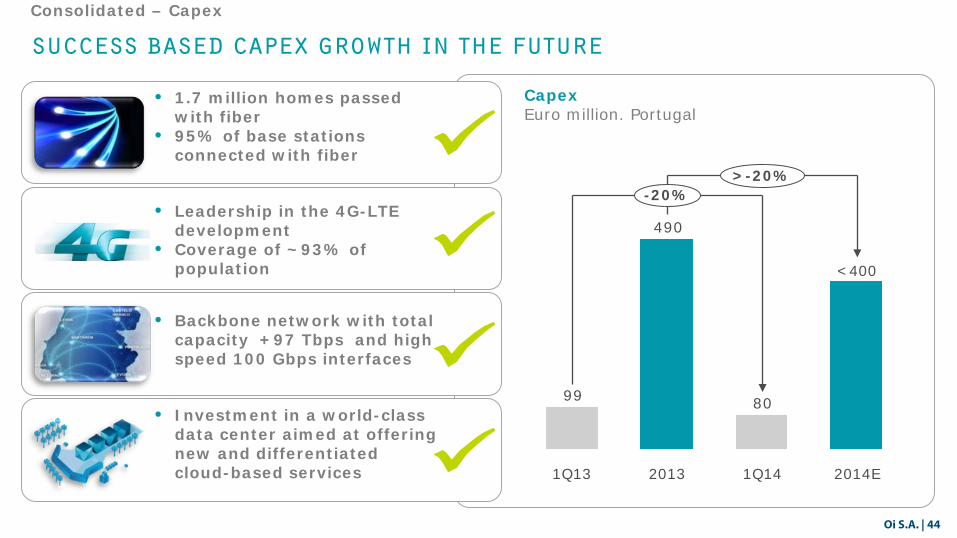
success based capex growth in the future
Consolidated – Capex
Capex Euro million. Portugal
• 1.7 million homes passed with fiber
• 95% of base stations connected with fiber
• Leadership in the 4G-LTE development
• Coverage of ~93% of population
• Backbone network with total capacity +97 Tbps and high speed 100 Gbps interfaces
• Investment in a world-class data center aimed at offering new and differentiated cloud-based services
80
490
99
2014E
<400
-20%
2013 1Q13 1Q14
>-20%

Oi S.A. | 45
Wrap up
Oi S.A. | 46
Progress against Our business priorities
1Q14 Results – Wrap up
Opex control
Capex control
Asset monetization
Synergies
Business model transformation @ @

Oi S.A. | 47
For further information:
Nuno Vieira | Investor Relations Director
+351 21 500 1701 | [email protected]
ir.telecom.pt | www.telecom.pt


![1Q14 RESULTS PRESENTATION - NOS · 1Q14 RESULTS PRESENTATION Monthly Bill per Unique Corporate, SME and SoHo subscribers [Euros] 0 ä 200 ä 1Q13 2Q13 3Q13 4Q13 1Q14 Monthly Bill](https://img.dokumen.tips/doc/110x75/5f4bf904fbd0f2207a556b26/1q14-results-presentation-nos-1q14-results-presentation-monthly-bill-per-unique.jpg)