Embed Size (px)
Citation preview
RESEARCH ARTICLE
1HNMR-Based metabolomic profiling method
to develop plasma biomarkers for sensitivity
to chronic heat stress in growing pigs
Samir Dou1, Nathalie Villa-Vialaneix2, Laurence Liaubet3, Yvon Billon4, Mario Giorgi5,
Helène Gilbert3, Jean-Luc Gourdine6, Juliette Riquet3, David Renaudeau1*
1 PEGASE, INRA, Agrocampus Ouest, St Gilles, France, 2 MIA-T, INRA, Universite de Toulouse, INP,
ENSAT, ENVT, Castanet Tolosan, France, 3 GenPhySE, INRA, Universite de Toulouse, INP, ENSAT,
ENVT, Castanet Tolosan, France, 4 PTEA, INRA, Petit-Bourg (Guadeloupe), France, 5 GenESI, INRA,
Surgères, France, 6 URZ, INRA, Petit-Bourg (Guadeloupe), France
Abstract
The negative impact of heat stress (HS) on the production performances in pig faming is of
particular concern. Novel diagnostic methods are needed to predict the robustness of pigs
to HS. Our study aimed to assess the reliability of blood metabolome to predict the sensitiv-
ity to chronic HS of 10 F1 (Large White × Creole) sire families (SF) reared in temperate
(TEMP) and in tropical (TROP) regions (n = 56±5 offsprings/region/SF). Live body weight
(BW) and rectal temperature (RT) were recorded at 23 weeks of age. Average daily feed
intake (AFDI) and average daily gain were calculated from weeks 11 to 23 of age, together
with feed conversion ratio. Plasma blood metabolome profiles were obtained by Nuclear
Magnetic Resonance spectroscopy (1HNMR) from blood samples collected at week 23 in
TEMP. The sensitivity to hot climatic conditions of each SF was estimated by computing a
composite index of sensitivity (Isens) derived from a linear combination of t statistics applied
to familial BW, ADFI and RT in TEMP and TROP climates. A model of prediction of sensitiv-
ity was established with sparse Partial Least Square Discriminant Analysis (sPLS-DA)
between the two most robust SF (n = 102) and the two most sensitive ones (n = 121) using
individual metabolomic profiles measured in TEMP. The sPLS-DA selected 29 buckets that
enabled 78% of prediction accuracy by cross-validation. On the basis of this training, we pre-
dicted the proportion of sensitive pigs within the 6 remaining families (n = 337). This propor-
tion was defined as the predicted membership of families to the sensitive category. The
positive correlation between this proportion and Isens (r = 0.97, P < 0.01) suggests that
plasma metabolome can be used to predict the sensitivity of pigs to hot climate.
Introduction
The economic losses in pig industry due to heat stress (HS) are important both for tropical
countries where the average ambient temperature frequently exceeds 25˚C but also for temper-
ate countries exposed to summer heat waves. For example, HS leads to a global yearly
PLOS ONE | https://doi.org/10.1371/journal.pone.0188469 November 27, 2017 1 / 18
a1111111111
a1111111111
a1111111111
a1111111111
a1111111111
OPENACCESS
Citation: Dou S, Villa-Vialaneix N, Liaubet L, Billon
Y, Giorgi M, Gilbert H, et al. (2017) 1HNMR-Based
metabolomic profiling method to develop plasma
biomarkers for sensitivity to chronic heat stress in
growing pigs. PLoS ONE 12(11): e0188469.
https://doi.org/10.1371/journal.pone.0188469
Editor: Marinus F. W. te Pas, Wageningen UR
Livestock Research, NETHERLANDS
Received: August 11, 2017
Accepted: November 7, 2017
Published: November 27, 2017
Copyright: © 2017 Dou et al. This is an open
access article distributed under the terms of the
Creative Commons Attribution License, which
permits unrestricted use, distribution, and
reproduction in any medium, provided the original
author and source are credited.
Data Availability Statement: All the raw data
necessary to reproduce our analysis are present in
the supplementary data file (.xlsx).
Funding: Production of the data used in the
present study was funded by the French National
Agency of Research (ANR PigHeaT, ANR-12-
ADAP-0015 to DR). SD was supported by a
postdoctoral fellowship from the Region Bretagne
(Dispositif « Strategie d’attractivite durable »
2016). The funders had no role in study design,
economic loss of about $300 million in the US pig industry [1]. According to the predicted
consequence of global warming, especially the increase in the frequency and the severity of
summer heat waves, it is clear that HS is not only a current but also an emerging issue for the
world pig production. Under these circumstances, a better understanding of the impact of HS
on swine physiology and metabolism and the promotion of innovative strategies are needed to
limit the economic consequences of HS on pig farms profitability.
Several studies showed that the pig’s thermoregulatory responses for avoiding HS are acti-
vated above 25˚C [2]. This threshold temperature varies according to various factors including
animal related factors (genotype, body weight, physiological stage) and environmental factors
like relative humidity. Regarding the genotype, genetic selection for high lean deposition rate
in growing pigs has resulted in an increased sensitivity to high ambient temperatures [3]. In
HS conditions, a significant reduction of the voluntary feed intake is generally observed in
swine. This response is considered as the main adaptation mechanism for reducing metabolic
heat production [4], which has negative subsequent effects on growth performance [5].
Various mitigation options are applied against HS, including costly heat abatement (spray
or floor cooling) and/or nutritional strategies. In practice, animal responses to HS are highly
variable within a population and a part of this variability has a genetic basis [6,7]. Given this
definition, robust pigs are animals that combine high production levels and adaptation capa-
bility in a wide variety of environmental conditions [8]. Identifying novel diagnostic tools or
biomarkers of sensitivity to HS will be an important step towards the management of HS in
pigs. These new tools could be used to prevent HS related problems, to improve the efficiency
of current coping options by targeting the most thermosensitive pigs and/or to improve
genetic program by the identification of genomic variants associated with heat tolerance. In
the objective of diagnostic and development of biomarker tools based on metabolomic analy-
ses, plasma is a suitable target tissue as it is easy to obtain with minimal stress for animals.
Plasma is also the main carrier of different metabolites whose concentrations can be affected
by heat stress [9]. Among the existing technics, the 1HNMR method has the ability to accu-
rately quantify metabolites from a complex biological matrix (blood plasma) with high preci-
sion and with a fast and cheap sample preparation procedure [10]. The objectives of the
present study are: 1/ to propose a strategy to evaluate HS sensitivity in ten pig sire families (SF)
using performance of descendants raised either in temperate (TEMP) or in tropical (TROP)
environments, and 2/ to build a predictive model of pig sensitivity to HS based on plasma
metabolomic signature, using the sparse partial least square discriminant analysis (sPLS-DA)
statistical approach.
Materials and methods
All experimental procedures involving the use of animals were approved by the local Animal
Care and Use Committees at the Poitou-Charentes and French West Indies and Guyana INRA
centers (authorizations N˚ CE202-9 and 69-2012-2, respectively).
Experimental design
Data used in the present study were obtained in a population designed to examine the genetic
background of heat tolerance in growing pigs [11].To sum up, genetically related Large White
sows reared in two different locations (temperate and tropical areas) were sired with the same
ten crossbred Large White×Creole boars. A total of 634 backcross pigs from 60 Large White
sows (raised in 11 contemporary groups or batches) and 664 BC from 70 Large White sows (12
batches) were obtained in temperate (TEMP, INRA experimental facility Le Magneraud, Gen-
ESI, Surgères, Charentes, France) and tropical (TROP, INRA experimental facility PTEA,
Prediction of sensitivity to heat stress by metabolome in pig
PLOS ONE | https://doi.org/10.1371/journal.pone.0188469 November 27, 2017 2 / 18
data collection and analysis, decision to publish, or
preparation of the manuscript.
Competing interests: The authors have declared
that no competing interests exist.
Petit-Bourg, Guadeloupe, France) conditions, respectively. As it was extensively described and
discussed in [12], the surrounding temperature and humidity are higher in TROP region than in
TEMP over the years. Several studies showed that the combination of both factors increases the
actual temperature perceived by livestock especially in tropical humid conditions [3,13,14]. In
this study, the effective ambient temperature was quantified by calculation of a thermal humidity
index (THI) which combines the average daily ambient temperature and the average daily rela-
tive humidity [12]. Based on the THI calculations, pigs raised in tropical conditions were
exposed to heat stress during the experiment (S1 Fig). Finally, on average, each crossbred boar
produced of average 56±5 offspring per environment, females and castrated males. Pigs were
weaned at 4 weeks of age (week 4) (26.9 ± 1.7 d). During the growing period (between weeks 10
to 23), pigs of a given batch were housed in 6 pens of 10 animals. The animal phenotyping period
started after one week of adaptation (week 11) and ended at week 23. Each pen was equipped
with nipple drinkers and animals had free access to water. They were fed ad libitum with a com-
mercial diet presented as pellets and formulated to meet or exceed the nutritional requirements
of growing-finishing pigs according to the standard INRA recommendations.
Data recording
Phenotypic measurements. All pigs were weighed (BW) from week 11 (BW11) to week
23 (BW23). The average daily BW gain (ADG, g/d) was calculated by dividing the BW gain
from 11 to 23 weeks of age divided by the period duration in days. On week 23, the backfat
thickness was measured ultrasonically (Agroscan, E.C.M, Angoulême, France) at 6 different
sites, measured directly above the point of the elbow, last rib (P2 site) and last lumbar vertebra
locations, respectively, and taken 5 cm off the midline on each side of the pig. The average
back fat thickness (ABFT, mm) was the average value of these 6 measurements. Individual
daily feed intake was recorded using electronic feeders (ACEMA 128, ACEMO, Pontivy,
France) either only during test weeks 11–12, 15–16 and 19–20 (defined as period 1) for half of
the pigs or only during test weeks 13–14, 17–18 and 21–23 (defined as period 2) for the other
pigs. During the remaining test weeks, pigs had free access to a conventional feed dispenser.
We calculated the average daily feed intake (ADFI) over the whole trial based on these mea-
surements, as proposed by [15]. Rectal temperature (RT) and skin temperature (ST) were mea-
sured at 23 weeks of age on resting animals. RT was measured using a digital thermometer
(Microlife Corp., Paris, France), and ST was measured on the back at the P2 site using a skin
surface thermocouple probe (type K, model 88002K-IEC, Omega Engineering Inc., Stamford,
ST, USA) connected to a microprocessor-based handheld thermometer (model HH-21,
Omega Engineering Inc).
Plasma sample preparation. From the 1298 pigs, data from 560 animals sampled for
plasma at 23 weeks of age in TEMP climate were used in the present study. For each sampling,
the same protocol was applied. Pigs were restrained in a V shaped system for avoiding stress.
Plasma samples were obtained by a jugular vein puncture using a 9 ml-vacutainer plasma col-
lection system that contains heparin. This vein puncture procedure required less than 2 min
per pig. Plasma samples were centrifuged at 2,500 g for 20 min to separate plasma. Plasma
samples were stored frozen (-80˚C) until they were assayed.1HNuclear Magnetic Resonance (1HNMR) spectroscopy analysis. Generation and nor-
malization of metabolomics spectra were carried out on MetaToul platform (Toulouse meta-
bolomics and fluxomics facilities, www.metatoul.fr). Plasma samples (200 μL) were diluted
with 500 μL of D2O and centrifuged at 5,000 g for 10 min at 4˚C before they were placed in 5
mm 1HNMR tubes. All 1HNMR spectra were obtained on a Bruker DRX-600-Avance 1HNMR
spectrometer operating at 600.13 MHz for 1H resonance frequency using an inverse detection
Prediction of sensitivity to heat stress by metabolome in pig
PLOS ONE | https://doi.org/10.1371/journal.pone.0188469 November 27, 2017 3 / 18
5 mm 1H-13C-15N cryoprobe attached to a CryoPlatform (the preamplifier cooling unit). The1HNMR spectra were acquired at 300 K using the Carr-Purcell-Meiboom-Gill (CPMG) spin-
echo pulse sequence with pre-saturation, with a total spin echo delay (2nτ) of 240 ms to attenu-
ate broad signals from proteins and lipoproteins. A total of 128 transients were collected in
32,000 data points using a spectral width, a relaxation delay and an acquisition time of 20 ppm,
2.5 sec, and 2.28 sec, respectively. The spectra were Fourier transformed by multiplication of
the free induction decay FIDs by an exponential weighting function corresponding to a line-
broadening of 0.3 Hz. All spectra were manually phased and baseline corrected, and referenced
to 3-trimethylsilylpropionate TMSP using the Bruker TopSpin 2.1 software (Bruker, GMBH,
and Karlsruhe, Germany). Data were reduced using the AMIX software (version 3.9, Bruker,
Rheinstetten, Germany) to integrate 0.01 ppm wide regions (i.e., buckets) corresponding to
the δ 9.00–0.70 ppm region for plasma samples. The 5.10–4.50 region, comprising water reso-
nances, was excluded. To account for differences in the amount of used material, each inte-
grated region was normalized to the total spectral area [16]. Spectral assignment was based on
matching data to reference spectra in a home-made reference database, as well as with others
database (http://www.bmrb.wisc.edu and http://www.hmdb.ca), and reports available in the
literature [17,18]. In practice, each identified metabolite can correspond to several buckets.
Finally, each plasma metabolomic profile was described with 333 and 112 annotated and non-
annotated buckets, respectively. Non-annotated buckets were labeled “unknown”.
Statistical analyses
General purpose of statistical analyses. Statistical analyses were performed with the R
software [19]. First of all, the phenotypic and metabolomic data were adjusted for undesirable
batch and sex effects. All the subsequent statistical analyses were made on the surrogate
adjusted variables. Analysis of variance was done with the Type III ANOVA. The metabolomic
data and metadata that were used in this study are provided in the S1 Data File.
The present study aimed to assess and predict the sensitivity of sire families to HS encoun-
tered in TROP region using metabolomic records obtained in TEMP conditions. As shown in
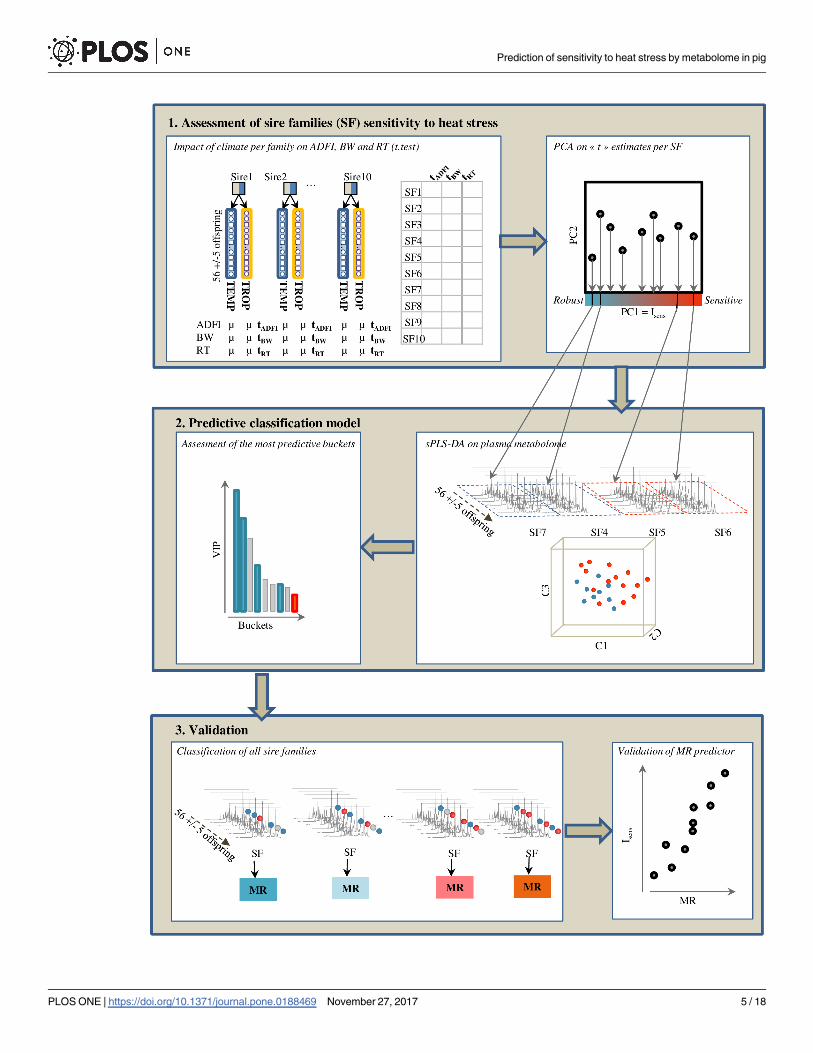
Fig 1, three main steps were taken:
1. We firstly quantified the actual average sensitivity of SF to TROP climate using phenotypic
traits.
2. In a second step, we selected the 4 SF that showed extreme degrees of sensitivity (2 SF) and
robustness (2 SF) to HS to build a predictive classification model using the profiled metabo-
lomes in TEMP climate and sPLS-DA method. The proportion of offspring predicted as con-
tributing to the sensitivity of the SF was considered as a predicted index of sensitivity of that SF.
3. Ultimately, we validated the ability of our classification model to predict the sensitivity of
SF by testing the correlation between the observed and predicted average sensitivity of the 6
remaining SF.
Phenotypic and metabolomic data adjustment. In order to adjust the metabolomic and
phenotypic data sets for batch and sex effects, we used the empirical Bayesian method
described in [20] accounting for climate, sire family (SF), batch and sex effects. To validate the
adjustment of the data, we used the principal variance component analysis (PVCA) method to
determine the proportion of variance of each effect before and after adjustment [21]. Before
adjustment, the percentage of variance due to climate, SF, batch and sex effects on phenotypic
data were 18.9, 4.4, 5.3 and 7.6%, respectively (S2A Fig). For metabolomic data, the
Prediction of sensitivity to heat stress by metabolome in pig
PLOS ONE | https://doi.org/10.1371/journal.pone.0188469 November 27, 2017 4 / 18
Prediction of sensitivity to heat stress by metabolome in pig
PLOS ONE | https://doi.org/10.1371/journal.pone.0188469 November 27, 2017 5 / 18
corresponding values were 4.9, 4.4, 6.5 and 0.8%, respectively (S2C Fig). After adjustment, S2B
and S2D Fig showed that the contributions of batch and sex effects were successfully removed
from the variance of data sets.
Assessment of sensitivity to heat stress. As shown in the [11], ADFI, BW and RT are par-
ticularly affected by climate. Additionally, it’s commonly admitted that the reduction of feed
intake in case of heat stress is a strategy of thermal adaption to reduce internal temperature.
First, to quantify the degree of the sensitivity of each SF to the TROP climate (n = 46 to 65
observations per SF in TEMP and 41 to 60 observations per SF in TROP), the familial
between-climate deviations were assessed for ADFI, BW and RT using t-tests (with Welsh cor-
rection) (Fig 1). Unlike the Student’s t-test, the Welch’s t-test is designed to compare two pop-
ulations with unequal variances. Changes of average growing performances and ability to
maintain internal body temperature between TEMP and TROP environments within each SF
were thus considered as indicative of the familial sensitivity. From these t-tests, a 10 sires x 3
traits matrix of the t statistics values (S1 Table) was built. For convenience, the “t” statistics
were written tADFI, tBW and tTR for ADFI, BW and RT, respectively. Thus, each SF was charac-
terized by three unit-free variables. We performed a principal component analysis (PCA) on
this matrix to assess the components of SF differences in HS sensitivity by considering perfor-
mance (tADFI and tBW) and thermoregulation (tRT) related traits. We retained the first compo-
nent of the PCA (PC) as indicator of sensitivity to HS, the scores of each SF for the first PC
being considered as a composite index of familial sensitivity (Isens).
Predictive classification model. In order to predict sensitivity to TROP climate, our strat-
egy was to use 1HRMN metabolomic data obtained in TEMP climate to predict the SF sensitivity
status to TROP climate. The most extreme SF regarding sensitivity were identified based on Isens
values. The metabolomics data of the pigs from these SF in TEMP climate were used to train a
classifier that identified the most predictive buckets of sensitivity. The model was validated using
cross validation (CV). Details about the different steps of this analysis are described below.
According to the index of sensitivity, we built two extreme groups: 1) a robust group
(n = 102 pigs) composed of the 2 most robust SF according to their Isens and, 2) a sensitive
group composed of the 2 most sensitive SF according to their Isens (n = 121 pigs). The metabo-
lomic data of robust and sensitive groups in TEMP climate were used as a calibration set in a
multivariate discriminant analysis performed via sPLS-DA, discriminating robust/sensitive
families. Contrary to a classical PLS-DA, sPLS-DA, as described and implemented in the R
package mixOmics, performs variable selection on the basis of a soft thresholding that approxi-
mates the Lasso penalization [22]. The purpose of this variable selection is to remove the less
informative buckets and to make the interpretation of the model easier. To choose the optimal
number of buckets to select, we used the method described by Lê Cao et al (2011) [23]. We set
up the tuning process until obtaining the minimum number of buckets between 5 and 20 that
allowed the lowest balanced error rate (BER). At the default decision threshold of sPLS-DA
(0.5), BER is an average error rate of prediction. BER is a suitable metric of a model’s inaccu-
racy in case of imbalanced groups.
BER ¼ 1 � 0:5� ðmodel sensitivity þmodel specificityÞ
Fig 1. Statistical workflow. Statistical approach that lead to: 1) assess sensitivity of each SF to TROP climate according to a
composite index of sensitivity (Isens) that took into account the between-climate variations of average daily feed intake (ADFI), body
weight (BW) at 23 weeks and rectal temperature (RT) at 23 weeks, 2) Build a supervised classification model on metabolomic data
between the robust and climate sensitive groups by sPLS-DA, 3) predict the membership rate (MR) of the other SF to the sensitive
group using sPLS-DA. The relevance of MR interpretation as predictive index of sensitivity was confirmed through its highly significant
correlation with index of sensitivity (Isens).
https://doi.org/10.1371/journal.pone.0188469.g001
Prediction of sensitivity to heat stress by metabolome in pig
PLOS ONE | https://doi.org/10.1371/journal.pone.0188469 November 27, 2017 6 / 18
The sensitivity of the model (true positive rate) is the number of animals truly predicted as sen-
sitive to HS over the actual number of animals sensitive to HS. The specificity (true negative
rate) of the model is the number of animals truly predicted as robust to HS over the actual
number of animals robust to HS. Finally, the sensitivity and 100%-specificity (false positive
rate) were computed at different decision thresholds and were plotted as the receiver operating
characteristic curve (ROC). The area under the curve (AUC) showed the average prediction
performances overall the varying decision thresholds. The closer the AUC is to 1 the better the
accuracy of the model is [24].
Once the optimal number of buckets was chosen, the sPLS-DA model was re-learnt with it
and provided loading values for every selected bucket. A large absolute loading value of a bucket
reflects a high covariance between that bucket and the variable to explain. Moreover, the variable
influence in projection (VIP) was computed for each component of sPLS-DA. Variables that
show a VIP> 1 are usually considered as significant contributors to the prediction model [25].
Additionally, we provided a stability criterion of selected variables in the model. Variable
selection was repeated across a 10-fold CV and different sets of selected buckets were obtained
at each replicate of CV. The reproducibility of the variable selection across the 10-fold CV was
assessed by means of its frequency of selection, similarly as what was proposed for bootstrap
method by [26,27]. The stability measure ranges between 0 and 1, and is equal to one for the
buckets that are always selected. Conversely, buckets can be selected in one run over the 10
and the stability measure is thus equal to 0.1, meaning that the selection of this bucket is
weakly reproducible.
Validation of the predictive model. Metabolomic profiles from descendants of the 6
other SF (n = 337 pigs) were used as a validation set to assess the predictive ability of the
model. The validation method was declined in two steps. First, prediction of classes (robust or
sensitive) was computed for each pig. A membership rate (MR) to the sensitive group was then
calculated for each SF in the validation set. This MR was equal to the percentage of animals
predicted as sensitive in the SF, and was interpreted as a predicted indicator of sensitivity to
HS for the SF. In a second step, a Pearson correlation test was performed between the MR
(predicted sensitivity) and the Isens (real sensitivity).
From the predictive model, a number of buckets and metabolites with VIP> 1, i.e. contrib-
uting most to the discrimination between sensitive and robust families to HS based on the
TEMP samplings, were selected. We assessed the correlations between the median values per
SF of these selected buckets in TEMP climate and the average phenotypic traits per SF both in
TEMP and TROP climates.
Results
Impact of climate on animal performance and thermoregulatory responses
All performance and thermoregulation traits were significantly affected by climate. For most
of the traits, the effect of climate differed according to the SF (P< 0.01, S2 Table) suggesting
high genetic × climatic environment interactions. The final BW and ADFI decreased signifi-
cantly in TROP climate in comparison to TEMP climate (S2 Table). Conversely, RT increased
significantly in TROP compared to TEMP climate (P< 0.001, S2 Table). The increase of RT in
TROP environment was dependent on the SF (P = 0.03, S2 Table).
Assessment of sensitivity to heat stress
For each Sire Family (SF), the variation between climates of each quantitative phenotype was
assessed with a Welch’s t-statistic, producing a matrix of t values (S1 Table). The first and sec-
ond components of the PCA applied to this matrix explained 75% and 17% of the total inertia,
Prediction of sensitivity to heat stress by metabolome in pig
PLOS ONE | https://doi.org/10.1371/journal.pone.0188469 November 27, 2017 7 / 18
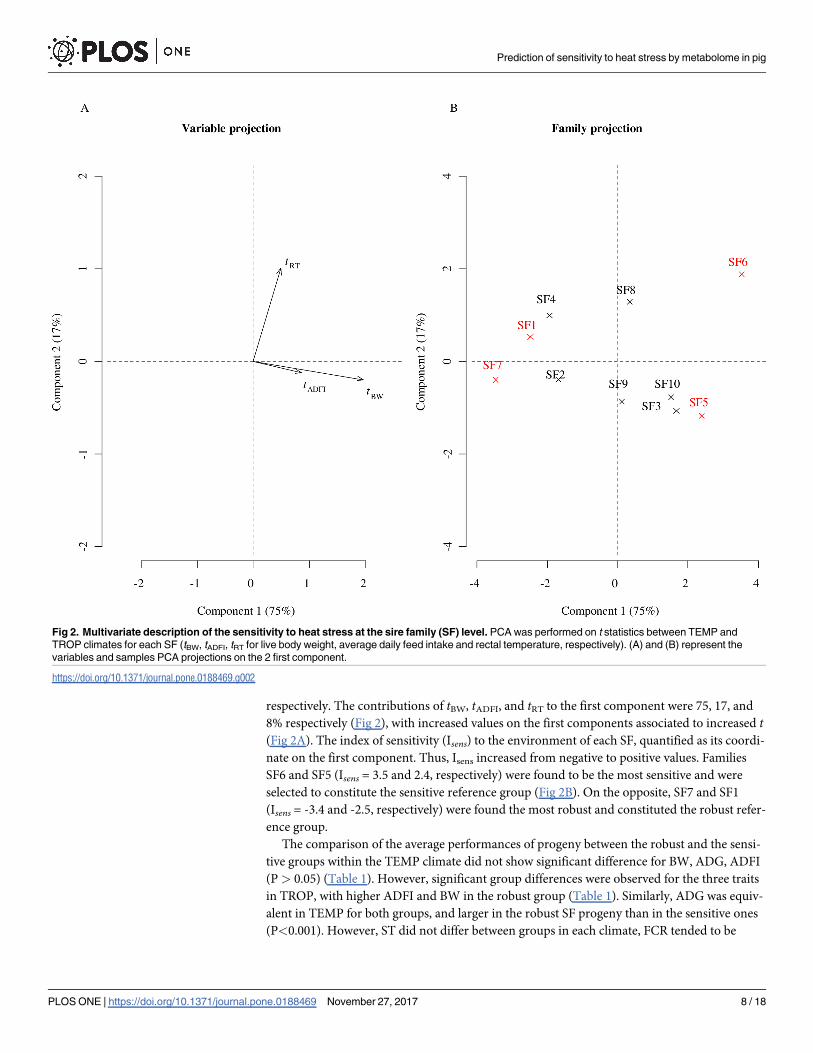
respectively. The contributions of tBW, tADFI, and tRT to the first component were 75, 17, and
8% respectively (Fig 2), with increased values on the first components associated to increased t(Fig 2A). The index of sensitivity (Isens) to the environment of each SF, quantified as its coordi-
nate on the first component. Thus, Isens increased from negative to positive values. Families
SF6 and SF5 (Isens = 3.5 and 2.4, respectively) were found to be the most sensitive and were
selected to constitute the sensitive reference group (Fig 2B). On the opposite, SF7 and SF1
(Isens = -3.4 and -2.5, respectively) were found the most robust and constituted the robust refer-
ence group.
The comparison of the average performances of progeny between the robust and the sensi-
tive groups within the TEMP climate did not show significant difference for BW, ADG, ADFI
(P> 0.05) (Table 1). However, significant group differences were observed for the three traits
in TROP, with higher ADFI and BW in the robust group (Table 1). Similarly, ADG was equiv-
alent in TEMP for both groups, and larger in the robust SF progeny than in the sensitive ones
(P<0.001). However, ST did not differ between groups in each climate, FCR tended to be
Fig 2. Multivariate description of the sensitivity to heat stress at the sire family (SF) level. PCA was performed on t statistics between TEMP and
TROP climates for each SF (tBW, tADFI, tRT for live body weight, average daily feed intake and rectal temperature, respectively). (A) and (B) represent the
variables and samples PCA projections on the 2 first component.
https://doi.org/10.1371/journal.pone.0188469.g002
Prediction of sensitivity to heat stress by metabolome in pig
PLOS ONE | https://doi.org/10.1371/journal.pone.0188469 November 27, 2017 8 / 18
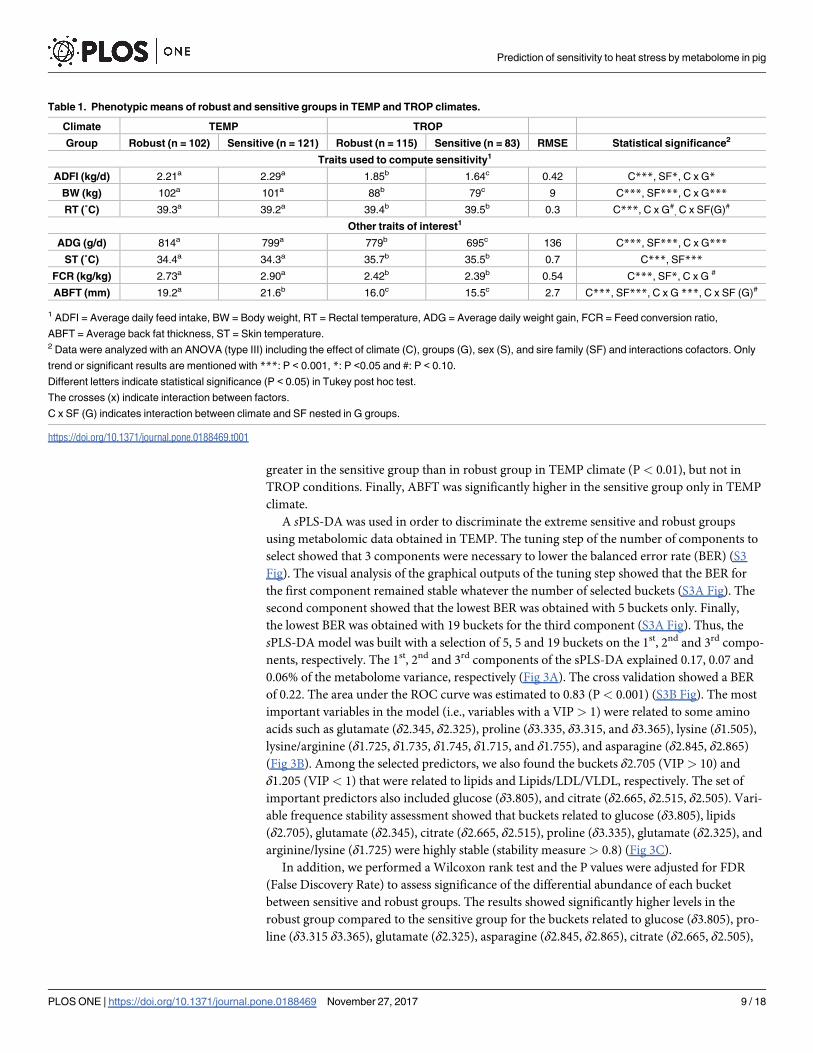
greater in the sensitive group than in robust group in TEMP climate (P< 0.01), but not in
TROP conditions. Finally, ABFT was significantly higher in the sensitive group only in TEMP
climate.
A sPLS-DA was used in order to discriminate the extreme sensitive and robust groups
using metabolomic data obtained in TEMP. The tuning step of the number of components to
select showed that 3 components were necessary to lower the balanced error rate (BER) (S3
Fig). The visual analysis of the graphical outputs of the tuning step showed that the BER for
the first component remained stable whatever the number of selected buckets (S3A Fig). The
second component showed that the lowest BER was obtained with 5 buckets only. Finally,
the lowest BER was obtained with 19 buckets for the third component (S3A Fig). Thus, the
sPLS-DA model was built with a selection of 5, 5 and 19 buckets on the 1st, 2nd and 3rd compo-
nents, respectively. The 1st, 2nd and 3rd components of the sPLS-DA explained 0.17, 0.07 and
0.06% of the metabolome variance, respectively (Fig 3A). The cross validation showed a BER
of 0.22. The area under the ROC curve was estimated to 0.83 (P< 0.001) (S3B Fig). The most
important variables in the model (i.e., variables with a VIP > 1) were related to some amino
acids such as glutamate (δ2.345, δ2.325), proline (δ3.335, δ3.315, and δ3.365), lysine (δ1.505),
lysine/arginine (δ1.725, δ1.735, δ1.745, δ1.715, and δ1.755), and asparagine (δ2.845, δ2.865)
(Fig 3B). Among the selected predictors, we also found the buckets δ2.705 (VIP > 10) and
δ1.205 (VIP < 1) that were related to lipids and Lipids/LDL/VLDL, respectively. The set of
important predictors also included glucose (δ3.805), and citrate (δ2.665, δ2.515, δ2.505). Vari-
able frequence stability assessment showed that buckets related to glucose (δ3.805), lipids
(δ2.705), glutamate (δ2.345), citrate (δ2.665, δ2.515), proline (δ3.335), glutamate (δ2.325), and
arginine/lysine (δ1.725) were highly stable (stability measure > 0.8) (Fig 3C).
In addition, we performed a Wilcoxon rank test and the P values were adjusted for FDR
(False Discovery Rate) to assess significance of the differential abundance of each bucket
between sensitive and robust groups. The results showed significantly higher levels in the
robust group compared to the sensitive group for the buckets related to glucose (δ3.805), pro-
line (δ3.315 δ3.365), glutamate (δ2.325), asparagine (δ2.845, δ2.865), citrate (δ2.665, δ2.505),
Table 1. Phenotypic means of robust and sensitive groups in TEMP and TROP climates.
Climate TEMP TROP
Group Robust (n = 102) Sensitive (n = 121) Robust (n = 115) Sensitive (n = 83) RMSE Statistical significance2
Traits used to compute sensitivity1
ADFI (kg/d) 2.21a 2.29a 1.85b 1.64c 0.42 C***, SF*, C x G*
BW (kg) 102a 101a 88b 79c 9 C***, SF***, C x G***
RT (˚C) 39.3a 39.2a 39.4b 39.5b 0.3 C***, C x G#, C x SF(G)#
Other traits of interest1
ADG (g/d) 814a 799a 779b 695c 136 C***, SF***, C x G***
ST (˚C) 34.4a 34.3a 35.7b 35.5b 0.7 C***, SF***
FCR (kg/kg) 2.73a 2.90a 2.42b 2.39b 0.54 C***, SF*, C x G #
ABFT (mm) 19.2a 21.6b 16.0c 15.5c 2.7 C***, SF***, C x G ***, C x SF (G)#
1 ADFI = Average daily feed intake, BW = Body weight, RT = Rectal temperature, ADG = Average daily weight gain, FCR = Feed conversion ratio,
ABFT = Average back fat thickness, ST = Skin temperature.2 Data were analyzed with an ANOVA (type III) including the effect of climate (C), groups (G), sex (S), and sire family (SF) and interactions cofactors. Only
trend or significant results are mentioned with ***: P < 0.001, *: P <0.05 and #: P < 0.10.
Different letters indicate statistical significance (P < 0.05) in Tukey post hoc test.
The crosses (x) indicate interaction between factors.
C x SF (G) indicates interaction between climate and SF nested in G groups.
https://doi.org/10.1371/journal.pone.0188469.t001
Prediction of sensitivity to heat stress by metabolome in pig
PLOS ONE | https://doi.org/10.1371/journal.pone.0188469 November 27, 2017 9 / 18
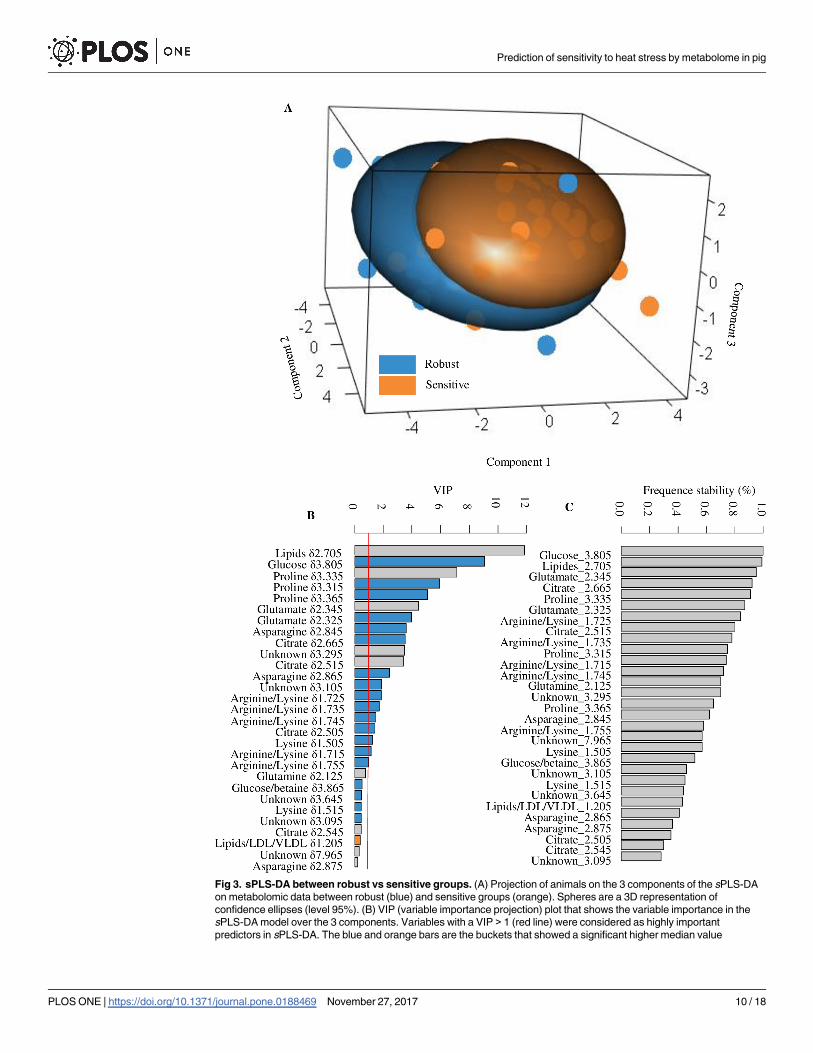
Fig 3. sPLS-DA between robust vs sensitive groups. (A) Projection of animals on the 3 components of the sPLS-DA
on metabolomic data between robust (blue) and sensitive groups (orange). Spheres are a 3D representation of
confidence ellipses (level 95%). (B) VIP (variable importance projection) plot that shows the variable importance in the
sPLS-DA model over the 3 components. Variables with a VIP > 1 (red line) were considered as highly important
predictors in sPLS-DA. The blue and orange bars are the buckets that showed a significant higher median value
Prediction of sensitivity to heat stress by metabolome in pig
PLOS ONE | https://doi.org/10.1371/journal.pone.0188469 November 27, 2017 10 / 18
lysine/arginine (δ1.725, δ1.735, δ1.745, δ1.715, δ1.755), lysine (δ1.505), and an unknown bucket
(δ3.105) (FDR< 0.05, VIP> 1) (Fig 3B). The bucket related to LDL/VLDL (δ1.205) was found
significantly more abundant in the sensitive group than in the robust group (Fig 3B).
Metabolomes of all animals from training and validation sets were submitted to sPLS-DA
model to predict their class membership (robust or sensitive). Among the already identified
robust group, the membership rate (% of sensitive pigs) was 30 and 18% of the animals from
SF7 and SF1, respectively. Conversely, 82 and 96% of the animals from SF5 and SF6 were pre-
dicted as sensitive, respectively. For the remaining validation set of SF, 49 and 45% of the ani-
mals from SF2 and SF4 were predicted as sensitive, respectively, and 58, 61, 64 and 71% of
the total number of the animals from SF9, SF8, SF3 and SF10, respectively. Finally, we ob-
served a strong significant positive correlation between the Isens index and MR of tested fami-
lies (r = 0.97, P< 0.01) (Fig 4A). Correlation coefficients were calculated between MR, Isens
and traits related to pig performance in both climates. In the TEMP climate, MR and Isens were
positively correlated to the mean SF value of ABFT (r = 0.71 and 0.71, respectively, P < 0.05)
(Fig 4B). In the TROP climate, MR and Isens showed significant negative correlations with BW
and ADG (MR: r = -0.67 and -0.65 respectively; Isens: r = -0.71 and -0.69, respectively; P<
0.05) (Fig 4B). All other correlations were not significantly different from zero.
We observed a significant negative correlation between MR or Isens with the median values
of selected buckets (VIP > 1) for buckets related to glucose (δ3.805), proline (δ3.365), aspara-
gine (δ2.845, δ2.865), lysine (δ1.505), citrate (δ2.665, δ2.505), and one unknown (δ3.105)
bucket (P< 0.05) (Fig 4C). The correlation analysis between these median values of selected
buckets and the familial mean of phenotypes showed that buckets related to glucose (δ3.805),
proline (δ3.315, δ3.365) and arginine/lysine (δ1.715) were negatively correlated with average
familial ABFT in the TEMP climate (P < 0.05) (Fig 4C). Additionally, the median values of
buckets related to proline (δ3.335, δ3.315, δ3.365), glucose (δ3.805), arginine/lysine (δ1.745,
δ1.735), and one unknown (δ3.295) showed a significant negative correlation with the average
value of RT in the TROP climate (Fig 4C). Finally, the median values of buckets related to
asparagine (δ2.845, δ2.865) and one unknown bucket in TEMP showed a significant positive
correlation with familial ADG, BW and ADFI in the TROP climate (Fig 4C). In TEMP, BW,
ADFI, FCR, ST and RT showed no correlation with the buckets abundancies, neither FCR, ST
and ABFT in TROP.
Discussion
Preventing the adverse effects of HS on animal productivity will be an increasingly challenging
goal for many livestock production systems in the future. Data obtained in the present study
confirm the negative impact of hot and humid tropical environment on growing-finishing pig
performances, with a significant reduction of voluntary feed intake leading to subsequent
negative effects on growth [28]. In the present study, ADG measured between 11 and 23 weeks
of age was reduced by about 10% in TROP compared to TEMP (759 vs. 836 g/d). This result is
in agreement with previous results published by Gilbert et al (2012) (-11%; 680 vs. 780 g/d)
[29]. Based on the average performance of sire progeny, the ranking of the sires changed
according to the climatic environment. In other words, this suggests that the best sires in
TEMP environment would not be the best ones in TROP conditions. Such re-ranking of per-
formance between thermoneutral and warm conditions has already been observed in cattle by
(Wilcoxon test: FDR < 0.05) in the robust or in the sensitive group, respectively. The grey bars indicate buckets that are
not significantly different between the robust and the sensitive group (Wilcoxon test: FDR > 0.05). (C) Frequencies
stability of selection of variable across the 100 models of CV.
https://doi.org/10.1371/journal.pone.0188469.g003
Prediction of sensitivity to heat stress by metabolome in pig
PLOS ONE | https://doi.org/10.1371/journal.pone.0188469 November 27, 2017 11 / 18
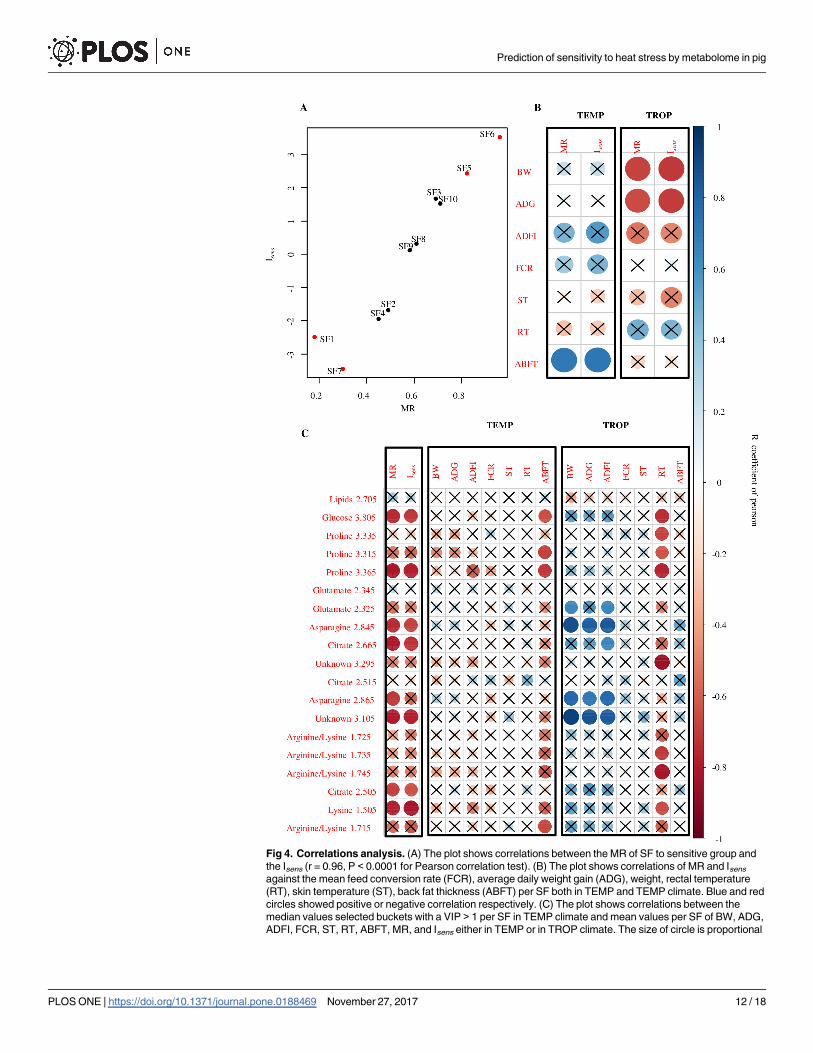
Fig 4. Correlations analysis. (A) The plot shows correlations between the MR of SF to sensitive group and
the Isens (r = 0.96, P < 0.0001 for Pearson correlation test). (B) The plot shows correlations of MR and Isens
against the mean feed conversion rate (FCR), average daily weight gain (ADG), weight, rectal temperature
(RT), skin temperature (ST), back fat thickness (ABFT) per SF both in TEMP and TEMP climate. Blue and red
circles showed positive or negative correlation respectively. (C) The plot shows correlations between the
median values selected buckets with a VIP > 1 per SF in TEMP climate and mean values per SF of BW, ADG,
ADFI, FCR, ST, RT, ABFT, MR, and Isens either in TEMP or in TROP climate. The size of circle is proportional
Prediction of sensitivity to heat stress by metabolome in pig
PLOS ONE | https://doi.org/10.1371/journal.pone.0188469 November 27, 2017 12 / 18
Bradford and al (2016) [30]. Our results confirm the existence of sire effect by climatic
environment interactions for most of the performance traits. In practice, genotype × environ-
ment interaction (G × E) is commonly considered as a potential source of inefficiency in pig
breeding programs. As suggested by Knap and Su (2008), G × E could be better exploited for
promoting innovating breeding programs [31]. Nowadays breeding programs are generally
transnational and consequently, the goals of such programs are to breed animals that can
perform well in a variety of environments. The improvement of animal robustness can be
achieved either by a direct inclusion of robustness indicators in a breeding goal or by selecting
animals for increased levels of production in diverse environments, i.e., lower environmental
sensitivity. In the case of HS sensitivity, these options require an access to easily measurable
heat adaptation related-traits or to performance traits in various climatic environmental con-
ditions. In practice, the estimation of the genetic values of a breeding animal in a large scale of
climatic environments can be costly. Additionally, the estimation of the genetic merit obtained
can be specific to the environments of the testing protocol. Traits to describe heat tolerance
relate the ability of the animals to fight against HS and are often based on body temperature
measurements (rectal and skin temperatures) or on other physiological parameters such as
heart or respiratory rates. These traits display genetic variation within and between breeds,
demonstrating the possibility for breeding animals in order to obtain heat tolerance responses
[32]. However, according to the genetic antagonism between heat adaptation and performance
related traits, selection for heat tolerance may have unfavorable consequences on growth per-
formance [33]. Moreover, heat adaptation traits are generally difficult and costly to measure.
One alternative option could be to develop a diagnostic tool for sorting the future reproducers
in the nucleus herd better suited for the specific needs of commercial herds localized in normal
or hot climatic conditions. The main objective of this study was to provide possible biomarkers
for a future diagnostic tool based on the fitness evaluation of sires in two contrasted climatic
environments (TEMP vs. TROP) using plasma 1HRMN metabolic information obtained from
blood samples collected in TEMP. For this purpose, we assessed the reliability of plasma meta-
bolome signature for prediction of a sensitivity index to heat tolerance in swine.
In pig breeding, robustness was defined by Knap et al (2005) as “the ability to combine a
high production potential with resilience to stressors, allowing for unproblematic expression
of a high production potential in a wide variety of environmental conditions” [8]. This defini-
tion can be applied for heat tolerance as the ability of pigs to maintain production and adapta-
tion in a wide variety of climatic environmental conditions[34,35]. In the present study, the
sensitivity was assessed with a composite index computed from the between-climate deviations
of consumption, body weight and rectal temperature. A similar approach has been already
used in the context of socioeconomic study on human well-being measurement in the Nether-
lands [36]. However, although this generic t-test-PCA based approach can be applied to a wide
variety of scientific fields to establish a multivariate measurement of communities’ responsive-
ness to a specific factor (here sire origin and climatic condition), such composite indices are
not generalizable reference values as they depend on the chosen initial variable, on the meth-
ods of measurement and on the sample size. Thus, our composite index, called “index of sensi-
tivity” (or Isens), should be interpreted as a relative measurement of sensitivity between SF
involved in our experimental set and accordingly to our definition of sensitivity.
The main objective of our study was to propose an effective predictive tool to assess the
environmental sensitivity (i.e., Isens) with a combination of blood metabolites obtained from a
to the absolute value of R coefficient of correlation of Pearson. The significance of correlation is P < 0.05
(Pearson correlation test) and the crosses indicate non-significant P values (P > 0.05).
https://doi.org/10.1371/journal.pone.0188469.g004
Prediction of sensitivity to heat stress by metabolome in pig
PLOS ONE | https://doi.org/10.1371/journal.pone.0188469 November 27, 2017 13 / 18
blood sample collected in thermoneutral conditions. Huiqing et al (2005) demonstrated that
using extreme patient samples in the training phase of statistical modeling leads to improved
prediction performances of survival time and risk of tumor metastasis or recurrence in com-
parison with models that are trained with non-extreme samples [37]. A similar approach was
used in our study and SF with extreme Isens indexes were taken as reference groups to model
robustness and sensitivity, being thus the most informative for selecting relevant features in
metabolomic data for predicting heat tolerance.
Our results highlighted differences in the average performance between the extremely sen-
sitive and the robust groups. The sensitive group was found to have a lower feed efficiency
(higher feed conversion ratio) and to be fatter at the end of the control period in TEMP. This
high fat deposition could be considered as a direct consequence of the lower feed efficiency.
However, average growth rate and final BW were similar in both groups. Our results suggest a
possible link between feed efficiency and the ability to cope with thermal stress in pigs. Simi-
larly, Hermesh et al (2015) suggested that genetic selection on feed efficiency may have an
impact on robustness of pigs in stressful conditions [38]. From a comparison between diver-
gent lines selected for a low or a high feed efficiency using the residual feed intake as a selection
criterion, it has been demonstrated that the line with a high feed efficiency had a lower basal
metabolite rate [39]. Based on the hypothesis that this reduced heat production would confer a
better heat tolerance to the high efficient line, the thermoregulatory responses of both lines
were measured in hot conditions [40]. From these studies, there is still no clear evidence of
the association between variability in feed efficiency and the sensitivity to HS but the initial
hypothesis of adverse correlations between production and response to HS, mentioned in [29],
might not be sustained.
Among the numerous supervised learning techniques, the partial least squares-discriminant
analysis (PLS-DA) is one of most widely used chemometric multivariate method in 1HNMR
data analysis. PLS-DA performs well in case of a large number of explanatory variables with
the presence of collinearity between variables [41]. To limit the number of predictors, to im-
prove prediction accuracy and to avoid over-fitting, sparse PLS-DA performs a variable selec-
tion in a Lasso-like manner [42]. The overall prediction error rate of 22% could be due to the
quality of the model and to the limits of blood metabolome to predict robustness more accu-
rately. However, this reasonable prediction error rate may be partly imputed to the presence of
potentially sensitive individuals within robust SF of the training set. Indeed, the Isens index is a
continuous variable indicating that sensitivity is not an “all or nothing” phenotypic trait but
that it spreads along a wide range of values. The observed strong significant correlation be-
tween the Isens index and the proportion of animals predicted as sensitive (i.e., Membership
Rate or MR) within each of the 10 SF confirmed the reliability of the selected metabolomic
markers by our model for prediction of the average sensitivity of SF. Practically, based on
blood metabolites profiles obtained in TEMP, our biomarkers could be used to sort pigs ac-
cording to their ability to cope with tropical conditions. Eventually, the application of such
sorting is to enrich with more robust animals the pig population that is intended for export to
warm regions. Additionally, the absence of correlation between the predicted sensitivity and
the average back fat thickness in TROP suggest that a selection based on our model would not
negatively impact fatness indicator. In addition, it would favor higher growth rates in TROP
without negative impact on production traits in thermoneutral conditions. Finally, the reliabil-
ity of our diagnostic method to improve the farm productivity needs to be validated in an inde-
pendent and larger scale trial. To the best of our knowledge, no similar result has previously
been shown in pigs.
In this study, we focused on identifying the best predictors of sensitivity. This does not pro-
vide evidence or causal link between the found predictors and the biological mechanisms that
Prediction of sensitivity to heat stress by metabolome in pig
PLOS ONE | https://doi.org/10.1371/journal.pone.0188469 November 27, 2017 14 / 18
lead to sensitivity to heat stress. The biological entities that are used as predictors (here meta-
bolome profiles) in machine learning based studies are not necessarily causally involved with
the phenotype of interest [43]. However, although the aim of the current article was not to dis-
sect the biological mechanisms of thermal tolerance, the highlighted metabolomic predictors
in our study showed interesting interconnections within the metabolic network. Indeed, pro-
line and arginine are both non-essential amino acids that derive from glutamate. Tian and a
(2015), using 1HNMR and LC-MC approaches, showed that proline, arginine, ornithine and
citruline among the most reliable plasma metabolomic biomarkers in lactating dairy cows
[44]. Additionally, proline and glutamate can be precursors of citrulline biosynthesis, which
has important hypothermic function, as shown in chicken [45]. Indeed, citrulline has been
shown to increase endogenous nitric oxide production that can promote heat dissipation from
skin [46]. However, higher proline levels in TEMP were associated to robustness and to lower
the average rectal temperature in TROP. From these observations, we may suppose that robust
SF would have a more active urea cycle which may prove more efficient for citrulline produc-
tion and for thermoregulation in warm environment. In the metabolomic profiles, the buckets
related to citrulline have not been identified yet. Further investigations on blood level of citrul-
line in TROP are needed to corroborate this hypothesis.
Conclusion
In conclusion, firstly we propose a novel approach to estimate sensitivity to long term heat
stress. Secondly, we showed that the plasma metabolomic profile is a promising tool to assess
the sensitivity to heat stress from thermoneutral sample collections. Further studies coupling
this metabolomic study with a genome wide association study could help highlighting differen-
tial mechanisms of adaptation to HS.
Supporting information
S1 Data File. Metabolomic and phenotypic datasets.
(XLSX)
S1 Fig. Monthly variations of THI. The figure shows variations of THI either in TEMP (red
curve) or in TROP (blue curve) region during the trail that occurs between the years 2013 and
2014.
(TIF)
S2 Fig. Principal variance component analysis. PVCA assessed the weighted average propor-
tion of variance (WAPV) imputed to batch (B), sire family (SF), sex (S), and climate (C) factors
on phenotypic or metabolomic dataset before adjustment (A and C respectively) and after
adjustment (B and D, respectively).
(TIF)
S3 Fig. Feature selection and validation method of sPLS-DA. The optimal numbers of buck-
ets to select on the 3 components of sPLS-DA were chosen so as to minimize the balanced
error rate of prediction assessed by cross validation (A). The sensitivity and specificity of
sPLS-DA that was built on the number of selected variables were assessed with ROC curve (B).
(TIF)
S1 Table. “t” dataset. Welsh “t” statistics for climate comparisons per SF on ADFI BW and
RT.
(XLSX)
Prediction of sensitivity to heat stress by metabolome in pig
PLOS ONE | https://doi.org/10.1371/journal.pone.0188469 November 27, 2017 15 / 18
S2 Table. Averaged animal performances and thermoregulation traits depending on the
climate (C), the SF and the sex1.
(XLSX)
Acknowledgments
The authors are grateful to K. Benony, D. Beramice, B. Bocage, M. Bructer et F. Silou from the
experimental unit INRA-PTEA, F. Meslier, J. Bailly, P Epagneaud and C. Lebourhis from the
experimental unit INRA-GenESI, K. Fève and Y. Labrune from INRA GenPhySe for their
technical assistance. MetaToul is part of the French National Infrastructure for Metabolomics
and Fluxomics MetaboHUB-AR-11-INBS-0010 (www.metabohub.fr). We thank the staff
members of MetaToul core facilities for technical assistance.
Author Contributions
Conceptualization: Helène Gilbert, Jean-Luc Gourdine, Juliette Riquet, David Renaudeau.
Formal analysis: Samir Dou, Nathalie Villa-Vialaneix, Laurence Liaubet, David Renaudeau.
Investigation: Yvon Billon, Mario Giorgi.
Methodology: Helène Gilbert, Jean-Luc Gourdine, Juliette Riquet, David Renaudeau.
Supervision: David Renaudeau.
Writing – original draft: Samir Dou, David Renaudeau.
Writing – review & editing: Helène Gilbert, Juliette Riquet, David Renaudeau.
References1. St-Pierre NR, Cobanov B, Schnitkey G. Economic losses from heat stress by US livestock Industries. J
Dairy Sci. 2003; 86: E52–E77. https://doi.org/10.3168/jds.S0022-0302(03)74040-5
2. Quiniou N, Noblet J. Influence of high ambient temperatures on performance of multiparous lactating
sows. J Anim Sci. 1999; 77: 2124–2134. https://doi.org/10.2527/1999.7782124x PMID: 10461991
3. Renaudeau D. Effects of short-term exposure to high ambient temperature and relative humidity on
thermoregulatory responses of European (Large White) and Caribbean (Creole) restrictively-fed grow-
ing pigs. Anim Res. 2005; 54: 81–93. https://doi.org/10.1051/animres:2005005
4. Nyachoti CM, Zijlstra RT, de Lange CFM, Patience JF. Voluntary feed intake in growing-finishing pigs:
A review of the main determining factors and potential approaches for accurate predictions. Can J Anim
Sci. 2004; 84: 549–566. https://doi.org/10.4141/A04-001
5. D’Allaire S, Drolet R, Brodeur D. Sow mortality associated with high ambient temperatures. Can Vet J.
1996; 37: 237–239. PMID: 8801022
6. Lan X, Hsieh JCF, Schmidt CJ, Zhu Q, Lamont SJ. Liver transcriptome response to hyperthermic stress
in three distinct chicken lines. BMC Genomics. 2016; 17. https://doi.org/10.1186/s12864-016-3291-0
PMID: 27875983
7. Renaudeau D, Collin A, Yahav S, de Basilio V, Gourdine JL, Collier RJ. Adaptation to hot climate and
strategies to alleviate heat stress in livestock production. Anim Int J Anim Biosci. 2012; 6: 707–728.
https://doi.org/10.1017/S1751731111002448 PMID: 22558920
8. Knap PW. Breeding robust pigs. Aust J Exp Agric. 2005; 45: 763–773. https://doi.org/10.1071/EA05041
9. Ippolito DL, Lewis JA, Yu C, Leon LR, Stallings JD. Alteration in circulating metabolites during and after
heat stress in the conscious rat: potential biomarkers of exposure and organ-specific injury. BMC Phy-
siol. 2014; 14: 14. https://doi.org/10.1186/s12899-014-0014-0 PMID: 25623799
10. Veenstra TD. Metabolomics: the final frontier? Genome Med. 2012; 4: 40. https://doi.org/10.1186/
gm339 PMID: 22546050
11. Rose R, Gilbert H, Loyau T, Giorgi M, Billon Y, Riquet, J J, et al. Interactions between sire family and
production environment (temperate vs. tropical) on performance and thermoregulation responses in
growing pigs. Journal of Animal Science. In press.
Prediction of sensitivity to heat stress by metabolome in pig
PLOS ONE | https://doi.org/10.1371/journal.pone.0188469 November 27, 2017 16 / 18
12. Rose R, Gilbert H, Loyau T, Giorgi M, Billon Y, Riquet, J J, et al. Interactions between sire family and
production environment (Temperate vs. Tropical) on performance and thermoregulation responses in
growing pigs. 2017; https://doi.org/10.2527/jas2017.1611
13. Bohmanova J, Misztal I, Cole JB. Temperature-humidity indices as indicators of milk production losses
due to heat stress. J Dairy Sci. 2007; 90: 1947–1956. https://doi.org/10.3168/jds.2006-513 PMID:
17369235
14. Wegner K, Lambertz C, Das G, Reiner G, Gauly M. Effects of temperature and temperature-humidity
index on the reproductive performance of sows during summer months under a temperate climate.
Anim Sci J Nihon Chikusan Gakkaiho. 2016; 87: 1334–1339. https://doi.org/10.1111/asj.12569 PMID:
26989052
15. Schulze V, Roehe R, Looft H, Kalm E. Effects of continuous and periodic feeding by electronic feeders
on accuracy of measuring feed intake information and their genetic association with growth perfor-
mances. J Anim Breed Genet. 2001; 118: 403–416. https://doi.org/10.1046/j.1439-0388.2001.00158.x
16. Databases and Software for NMR-Based Metabolomics [Internet]. [cited 5 Jul 2017]. Available: https://
www.ncbi.nlm.nih.gov/pmc/articles/PMC3832261/
17. New bioinformatics resources for metabolomics.—PubMed—NCBI [Internet]. [cited 5 Jul 2017]. Avail-
able: https://www.ncbi.nlm.nih.gov/pubmed/17990489
18. HMDB: the Human Metabolome Database.—PubMed—NCBI [Internet]. [cited 5 Jul 2017]. Available:
https://www.ncbi.nlm.nih.gov/pubmed/17202168
19. R Core Team. R: A language and environment for statistical computing [Internet]. Vienna, Austria: R
Foundation for Statistical Computing; 2016. Available: https://www.R-project.org/
20. Johnson WE, Li C, Rabinovic A. Adjusting batch effects in microarray expression data using empirical
bayes methods. Biostatistics. 2007; 8: 118–127. https://doi.org/10.1093/biostatistics/kxj037 PMID:
16632515
21. Chen C, Grennan K, Badner J, Zhang D, Gershon E, Jin L, et al. Removing batch effects in analysis of
expression microarray data: an evaluation of six batch adjustment methods. PLoS ONE. 2011; 6.
https://doi.org/10.1371/journal.pone.0017238 PMID: 21386892
22. LêCao K-A, Gonzalez I, Dejean S. integrOmics: an R package to unravel relationships between two
omics datasets. Bioinforma Oxf Engl. 2009; 25: 2855–2856. https://doi.org/10.1093/bioinformatics/
btp515 PMID: 19706745
23. LêCao K-A, Boitard S, Besse P. Sparse PLS discriminant analysis: biologically relevant feature selec-
tion and graphical displays for multiclass problems. BMC Bioinformatics. 2011; 12: 253. https://doi.org/
10.1186/1471-2105-12-253 PMID: 21693065
24. Metz CE. Basic principles of ROC analysis. Semin Nucl Med. 1978; 8: 283–298. https://doi.org/10.
1016/S0001-2998(78)80014-2 PMID: 112681
25. Cho H-W, Kim SB, Jeong MK, Park Y, Gletsu N, Ziegler TR, et al. Discovery of metabolite features for
the modelling and analysis of high-resolution NMR spectra. Int J Data Min Bioinforma. 2008; 2: 176–
192.
26. Meinshausen N, Buhlmann P. Stability selection. J R Stat Soc Ser B Stat Methodol. 2010; 72: 417–473.
https://doi.org/10.1111/j.1467-9868.2010.00740.x
27. Bach F. Model-consistent sparse estimation through the bootstrap. ArXiv09013202 Cs Stat. 2009;
Available: http://arxiv.org/abs/0901.3202
28. Renaudeau D, Huc E, Noblet J. Acclimation to high ambient temperature in Large White and Caribbean
Creole growing pigs. J Anim Sci. 2007; 85: 779–790. https://doi.org/10.2527/jas.2006-430 PMID:
17085727
29. Gilbert H, Billon Y, Fleury J, Noblet J, Gourdine JL, Renaudeau D. Are responses to selection in lines
divergently selected for residual feed intake in growing pigs affected by GxE interactions when bred in a
tropical environment? Proceedings of the AnGR-NordicNET Workshop Genotype-by-Environment
Interactions and Adaptation of Farm Animals on Phenotypic and Molecular Levels. Finland: Nordic
Genetic Resource Center (Norway).; 2012. pp. 26–27.
30. Bradford HL, Fragomeni BO, Bertrand JK, Lourenco D a. L, Misztal I. Genetic evaluations for growth
heat tolerance in Angus cattle. J Anim Sci. 2016; 94: 4143–4150. https://doi.org/10.2527/jas.2016-0707
PMID: 27898850
31. Knap PW, Su G. Genotype by environment interaction for litter size in pigs as quantified by reaction
norms analysis. animal. 2008; 2: 1742–1747. https://doi.org/10.1017/S1751731108003145 PMID:
22444079
32. Nguyen TTT, Bowman PJ, Haile-Mariam M, Pryce JE, Hayes BJ. Genomic selection for tolerance to
heat stress in Australian dairy cattle. J Dairy Sci. 2016; 99: 2849–2862. https://doi.org/10.3168/jds.
2015-9685 PMID: 27037467
Prediction of sensitivity to heat stress by metabolome in pig
PLOS ONE | https://doi.org/10.1371/journal.pone.0188469 November 27, 2017 17 / 18
33. Gourdine J-L, Mandonnet N, Giorgi M, Renaudeau D. Genetic parameters for thermoregulation and
production traits in lactating sows reared in tropical climate. animal. 2017; 11: 365–374. https://doi.org/
10.1017/S175173111600135X PMID: 27378416
34. Napel, J ten, Bianchi, F.J.J.A, Bestman, M.W.P. Utilising intrinsic robustness in agricultural production
systems. Invention for a sustainable development of agriculture Zoetermeer: TransForum.
2006. pp. 32–54.
35. Star L, Ellen ED, Uitdehaag K, Brom FWA. A plea to implement robustness into a breeding goal: poultry
as an example. J Agric Environ Ethics. 2008; 21: 109–125. https://doi.org/10.1007/s10806-007-9072-7
36. Boelhouwer J, Stoop I. Measuring well-being in the Netherlands: The SCP index from 1974 to 1997.
Soc Indic Res. 1999; 48: 51–75. https://doi.org/10.1023/A:1006931028334
37. Liu H, Li J, Wong L. Use of extreme patient samples for outcome prediction from gene expression data.
Bioinformatics. 2005; 21: 3377–3384. https://doi.org/10.1093/bioinformatics/bti544 PMID: 15961442
38. Hermesch S, Li L, Doeschl-Wilson AB, Gilbert H. Selection for productivity and robustness traits in pigs.
Anim Prod Sci. 2015; 55: 1437–1447. https://doi.org/10.1071/AN15275
39. Barea R, Dubois S, Gilbert H, Sellier P, van Milgen J, Noblet J. Energy utilization in pigs selected for
high and low residual feed intake. J Anim Sci. 2010; 88: 2062–2072. https://doi.org/10.2527/jas.2009-
2395 PMID: 20154162
40. Campos PHRF, Noblet J, Jaguelin-Peyraud Y, Gilbert H, Mormède P, Donzele RFM de O, et al.
Thermoregulatory responses during thermal acclimation in pigs divergently selected for residual feed
intake. Int J Biometeorol. 2014; 58: 1545–1557. https://doi.org/10.1007/s00484-013-0759-3 PMID:
24389687
41. Wold S, Sjostrom M, Eriksson L. PLS-regression: a basic tool of chemometrics. Chemom Intell Lab
Syst. 2001; 58: 109–130. https://doi.org/10.1016/S0169-7439(01)00155-1
42. Tibshirani R. Regression shrinkage and selection via the lasso: a retrospective. J R Stat Soc Ser B Stat
Methodol. 2011; 73: 273–282. https://doi.org/10.1111/j.1467-9868.2011.00771.x
43. Nilsson R, Peña JM, Bjorkegren J, Tegner J. Consistent Feature Selection for Pattern Recognition in
Polynomial Time. J Mach Learn Res. 2007; 8: 589–612.
44. Tian H, Wang W, Zheng N, Cheng J, Li S, Zhang Y, et al. Identification of diagnostic biomarkers and
metabolic pathway shifts of heat-stressed lactating dairy cows. J Proteomics. 2015; 125: 17–28. https://
doi.org/10.1016/j.jprot.2015.04.014 PMID: 25913299
45. Chowdhury VS, Shigemura A, Erwan E, Ito K, Bahry MA, Phuong TV, et al. Oral administration of L-Cit-
rulline, but not L-Arginine or L-Ornithine, acts as a hypothermic agent in chicks. J Poult Sci. 2015;
advpub. https://doi.org/10.2141/jpsa.0150014
46. Kellogg DL, Crandall CG, Liu Y, Charkoudian N, Johnson JM. Nitric oxide and cutaneous active vasodi-
lation during heat stress in humans. J Appl Physiol Bethesda Md 1985. 1998; 85: 824–829.
Prediction of sensitivity to heat stress by metabolome in pig
PLOS ONE | https://doi.org/10.1371/journal.pone.0188469 November 27, 2017 18 / 18