Embed Size (px)
Citation preview
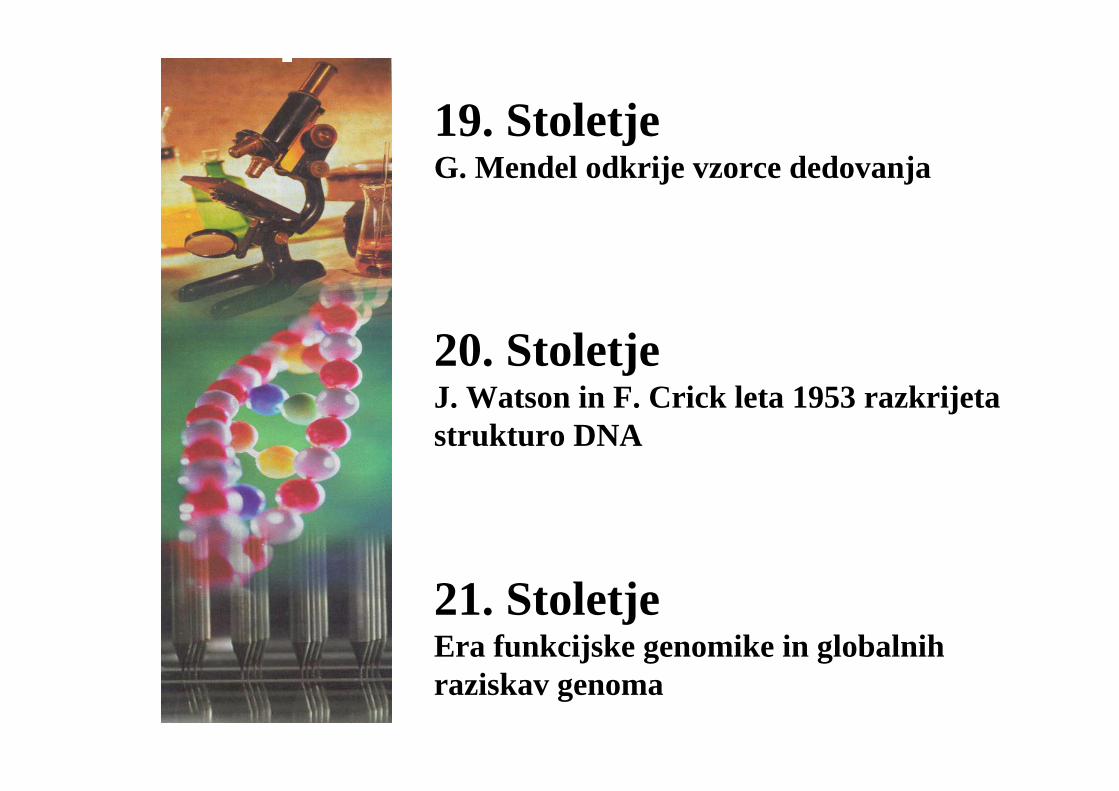
19. StoletjeG. Mendel odkrije vzorce dedovanja
20. StoletjeJ. Watson in F. Crick leta 1953 razkrijeta strukturo DNA
21. StoletjeEra funkcijske genomike in globalnih raziskav genoma
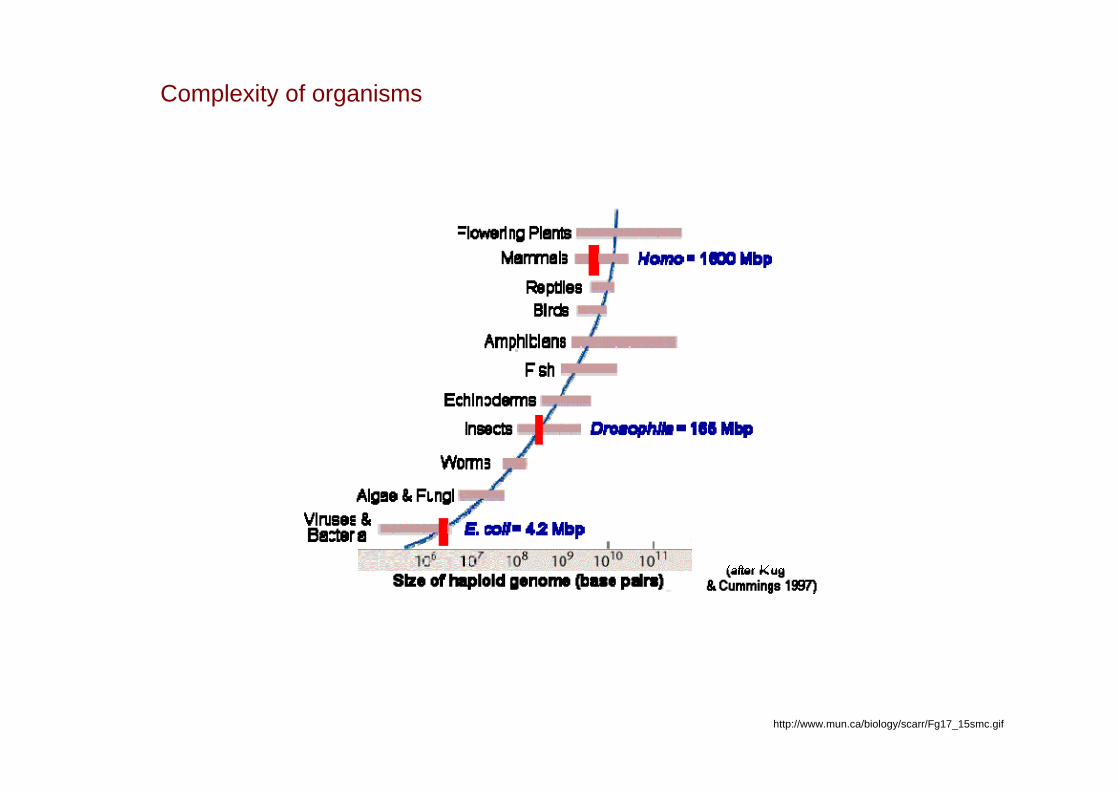
Complexity of organisms
http://www.mun.ca/biology/scarr/Fg17_15smc.gif
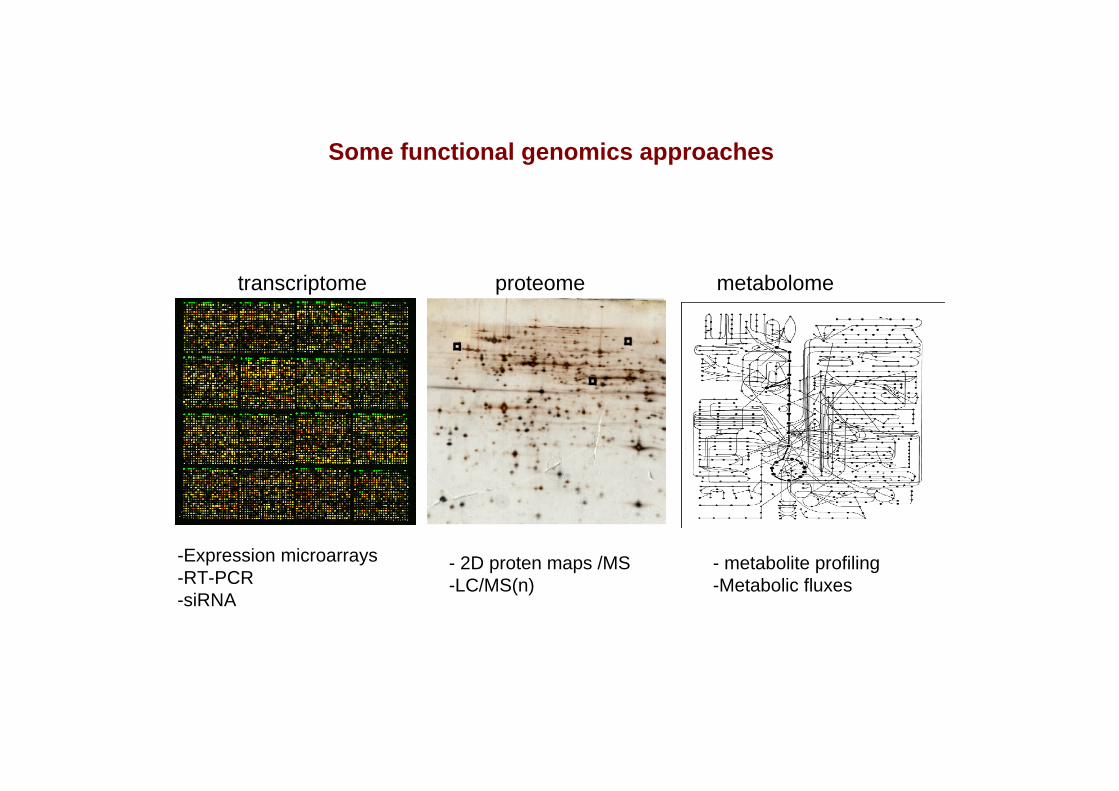
Some functional genomics approaches
transcriptome proteome metabolome
-Expression microarrays-RT-PCR-siRNA
- 2D proten maps /MS-LC/MS(n)
- metabolite profiling-Metabolic fluxes
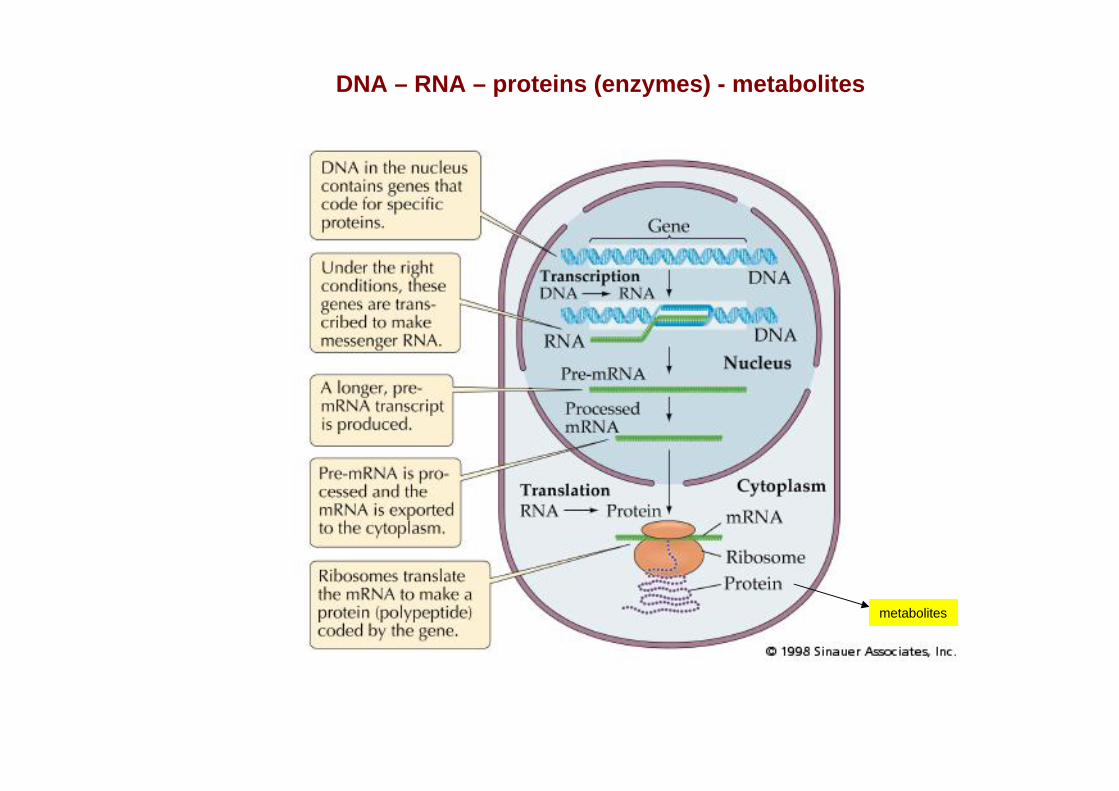
DNA – RNA – proteins (enzymes) - metabolites
metabolites
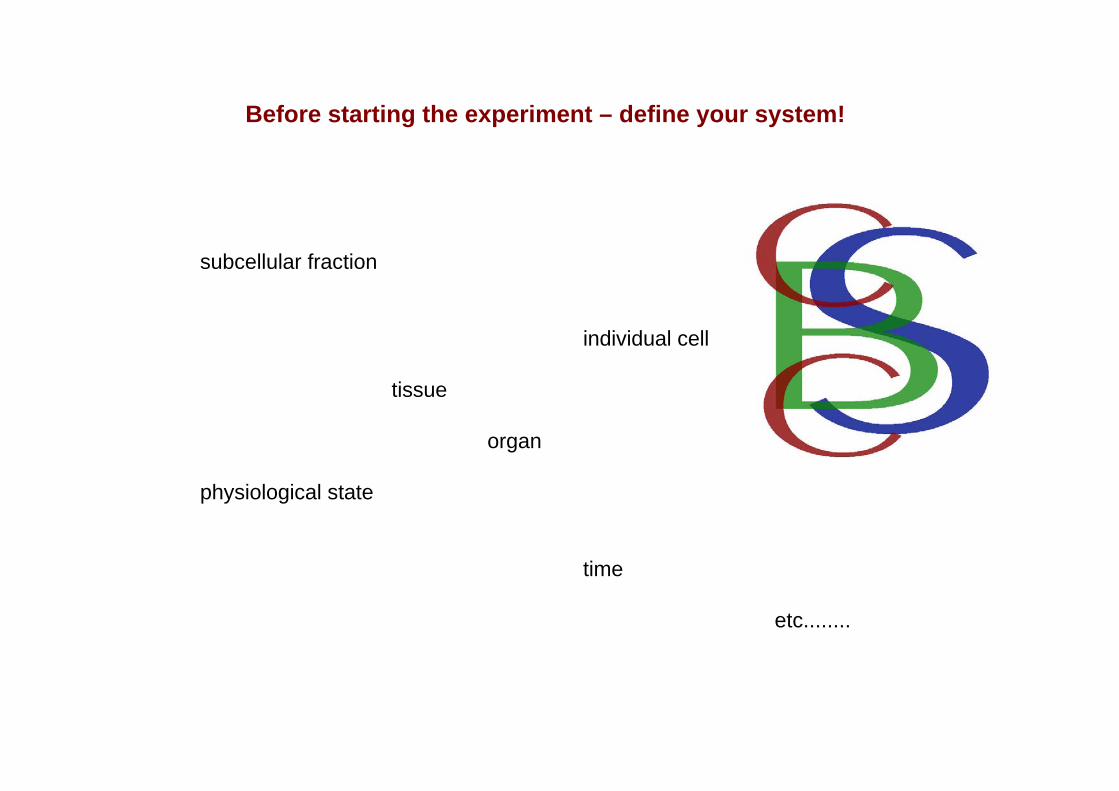
Before starting the experiment – define your system!
subcellular fraction
individual cell
tissue
organ
physiological state
time
etc........
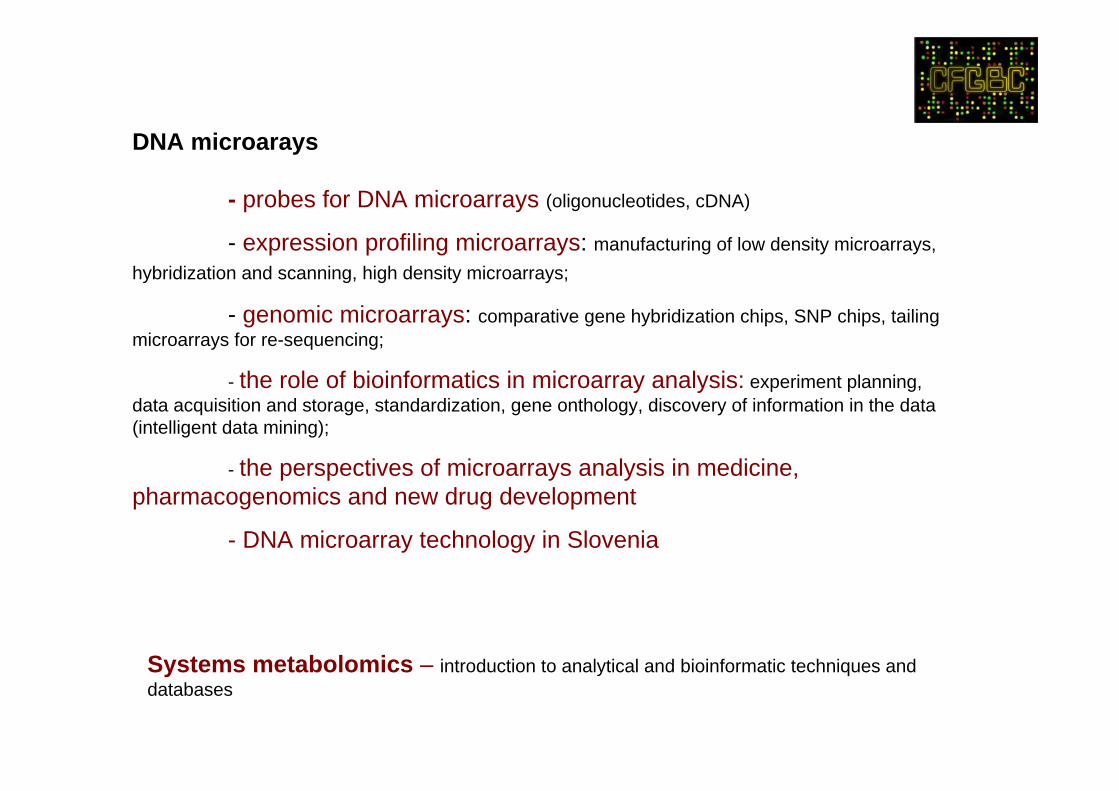
DNA microarays
- probes for DNA microarrays (oligonucleotides, cDNA)
- expression profiling microarrays: manufacturing of low density microarrays, hybridization and scanning, high density microarrays;
- genomic microarrays: comparative gene hybridization chips, SNP chips, tailing microarrays for re-sequencing;
- the role of bioinformatics in microarray analysis: experiment planning, data acquisition and storage, standardization, gene onthology, discovery of information in the data (intelligent data mining);
- the perspectives of microarrays analysis in medicine, pharmacogenomics and new drug development
- DNA microarray technology in Slovenia
Systems metabolomics – introduction to analytical and bioinformatic techniques and databases
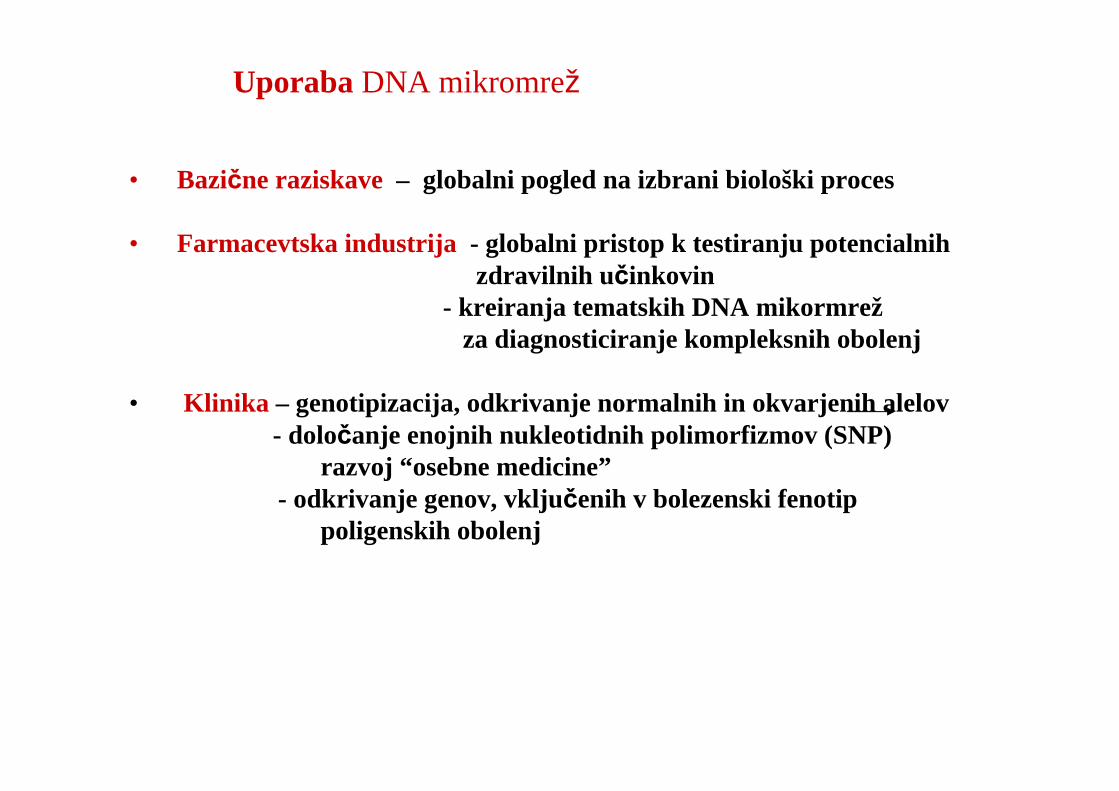
Uporaba DNA mikromrež
• Bazične raziskave – globalni pogled na izbrani biološki proces
• Farmacevtska industrija - globalni pristop k testiranju potencialnih zdravilnih učinkovin
- kreiranja tematskih DNA mikormrežza diagnosticiranje kompleksnih obolenj
• Klinika – genotipizacija, odkrivanje normalnih in okvarjenih alelov- določanje enojnih nukleotidnih polimorfizmov (SNP)
razvoj “osebne medicine”- odkrivanje genov, vključenih v bolezenski fenotip
poligenskih obolenj
Tehnologija DNA čipov
1. Definicije osnovnih pojmov.
2. Različni pristopi tehnologije DNA čipov.
• Analiza genomske DNA (genotpizacija enojnih nukleotidnih polimorfizmov SNP, analiza variance števila kopij CNV oz. CGH, resekvenciranje).
• Analiza izražanja genov (ekspresijsko profiliranje: 3' ekspresijski, eksonski ali genski čipi, čipi za sledenje izražanja miRNA).
• Študije uravnavanja izražanja genov (kromatinska imunoprecipitacija na čipu ChIP-on-Chip, mapiranje prepisov).
3. Nova generacija metod za sekvenciranje DNA.
4. Zasnova bioloških poskusov z upoštevanjem standardov.
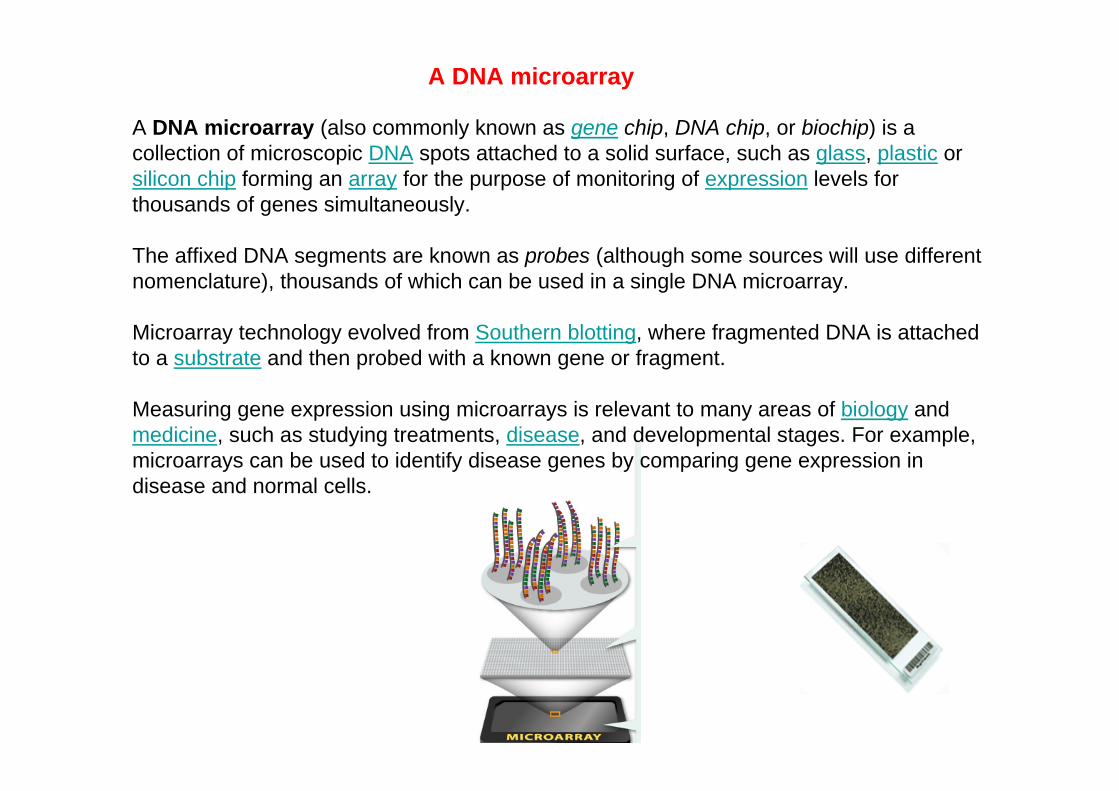
A DNA microarray (also commonly known as gene chip, DNA chip, or biochip) is a collection of microscopic DNA spots attached to a solid surface, such as glass, plastic or silicon chip forming an array for the purpose of monitoring of expression levels for thousands of genes simultaneously.
The affixed DNA segments are known as probes (although some sources will use different nomenclature), thousands of which can be used in a single DNA microarray.
Microarray technology evolved from Southern blotting, where fragmented DNA is attached to a substrate and then probed with a known gene or fragment.
Measuring gene expression using microarrays is relevant to many areas of biology and medicine, such as studying treatments, disease, and developmental stages. For example, microarrays can be used to identify disease genes by comparing gene expression in disease and normal cells.
A DNA microarray
Studying the nature and extent of structural variation in the human genome. The recent discovery of widespread copy number variation (CNV) in the human genome has ignited a new interest in this class of genomic variation, which is amenable to discovery using array comparative genome hybridization.
The relationship between structural variation and human disease. It has long been known that human disease can be caused by gene amplification or deletion, but it is only recently that genome-scale approaches have revealed the high frequency of de novo CNV and its potential association with autism.
The role of gene amplification in human evolution. Recently, it has been discovered that CNV at the AMY1 locus, encoding the salivary enzyme, amylase, has been under selective pressure through human history. It is likely that selection for or against CNV of particular loci will be a general theme in the human genome as it is in other organisms.
Genomic changes associated with cancers. Typically, genome-wide studies of somatic point mutations that are associated with cancers in humans have used Sanger sequencing approaches. Microarray-based approaches have the potential to address the various genomics events, including base pair changes, structural variation and possibly insertion variation, that are associated with cancers far more rapidly and efficiently.
The role of insertion sequences (for example, long interspersed nuclear elements, or LINEs) in generating cellular diversity and disease. A study has reported the potential role of LINE1 elements in generating neuronal diversity. This presents the tantalizing possibility that somatic mosaicism might be facilitated by mobile elements in the genome — a question that is readily amenable to microarray-based approaches.
The extent of insertional variation in humans. Mobile elements constitute most of the human genome. However, little is known about their variation throughout the human population. It is reasonable to expect that this variation is at least comparable to that observed for CNV.
Gresham D. et al., Nature Reviews Genetics 9, 291-302 (April 2008)
Applications of microarray-based approaches to studying human genome

Parts of a gene represented in different types of microarrays
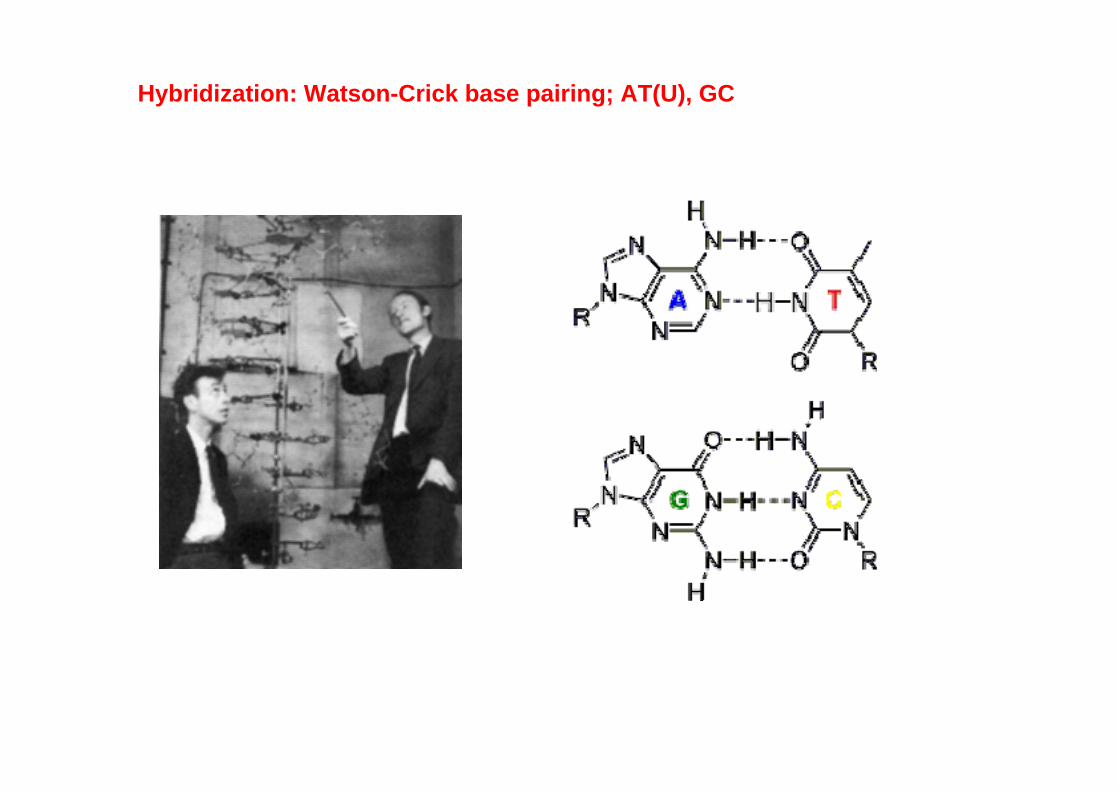
Hybridization: Watson-Crick base pairing; AT(U), GC

http://www.ieee.org/portal/cms_docs_sscs/sscs/07Fall/HamFig1s.jpg
Hybridization on the microarray
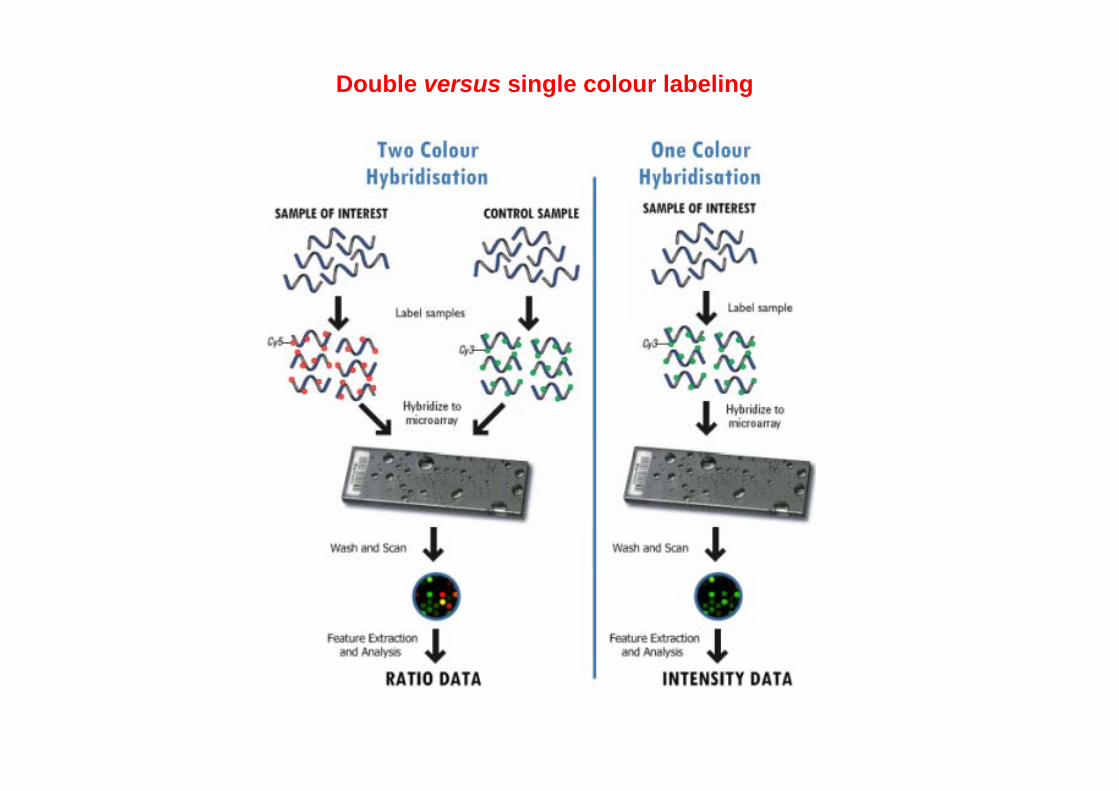
Double versus single colour labeling
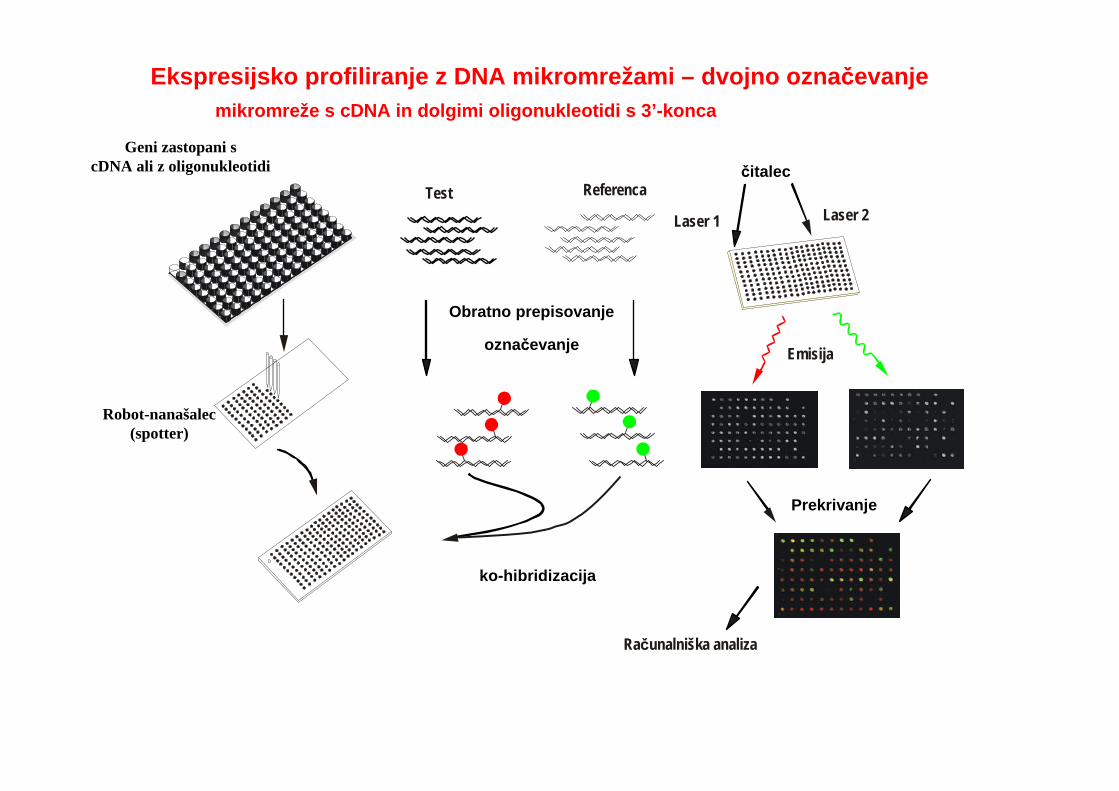
Principle of expression profilingčitalec
označevanje
Obratno prepisovanje
Emisija
Prekrivanje
Računalniška analiza
Laser 1Test Referenca
Laser 2
ko-hibridizacija
Ekspresijsko profiliranje z DNA mikromrežami – dvojno označevanje
Geni zastopani scDNA ali z oligonukleotidi
Robot-nanašalec(spotter)
mikromreže s cDNA in dolgimi oligonukleotidi s 3’-konca
Genotyping microarrays
DNA microarrays can be used to read the sequence of a genome in particular positions.
SNP microarrays are a particular type of DNA microarrays that are used to identify genetic variation in individuals and across populations.
Short oligonucleotide arrays can be used to identify the single nucleotide polymorphisms (SNPs) that are thought to be responsible for genetic variation and the source of susceptibility to genetically caused diseases.
Amplifications and deletions can also be detected using comparative genomic hybridization in conjuction with microarrays.
Resequencing arrays have also been developed to sequence portions of the genome in individuals. These arrays may be used to evaluate germlinemutations in individuals, or somatic mutations in cancer.Genome tiling arrays include overlapping oligonucleotides designed to blanket an entire genomic region of interest. Many companies have successfully designed tiling arrays that cover whole human chromosomes.
The complete human genome sequence announced in June 2000 is a "representative" genome sequence based on the DNA of just a few individuals.
Over the longer term, scientists will study DNA from many different people to identify where and what variations between individual genomes exist. Sequencing a genome is such a Herculean task that capturing its person-to-person variability on the first pass would be next to impossible.
www.genomenewsnetwork.org/.../ Chp4_1.shtml
If every human genome is different, what doesit mean to sequence "the" human genome?
Since every person's genome is unique, no one person is any more or less "representative" than any other and it hardly matters whose genome is sequenced first.
The vast majority of the genome's sequence is the same from one person to the next, with the same genes in the same places.
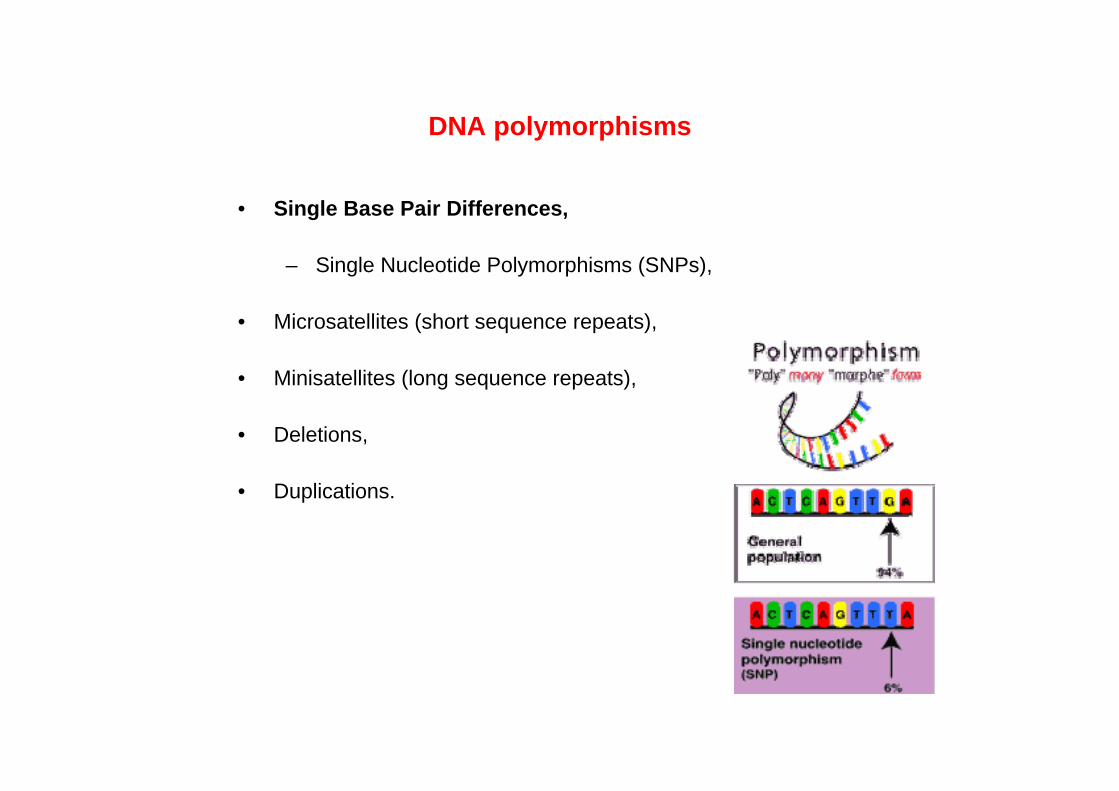
DNA polymorphisms
• Single Base Pair Differences,
– Single Nucleotide Polymorphisms (SNPs),
• Microsatellites (short sequence repeats),
• Minisatellites (long sequence repeats),
• Deletions,
• Duplications.
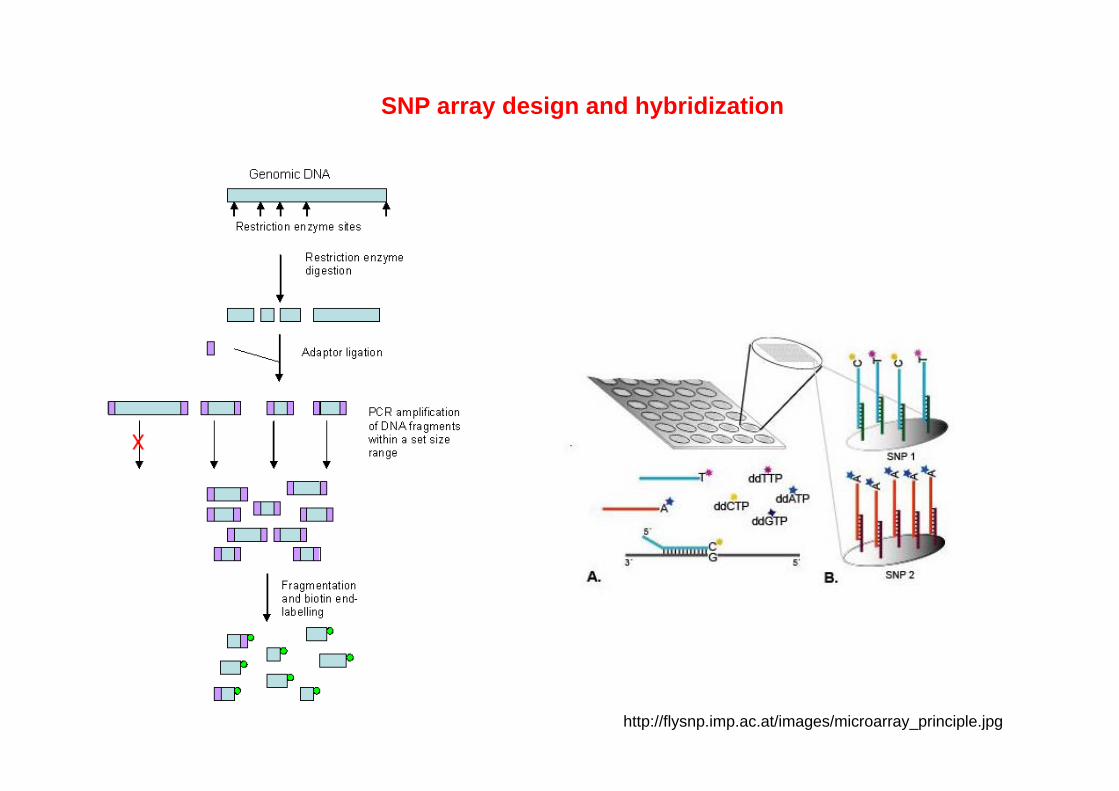
SNP array design and hybridization
http://flysnp.imp.ac.at/images/microarray_principle.jpg
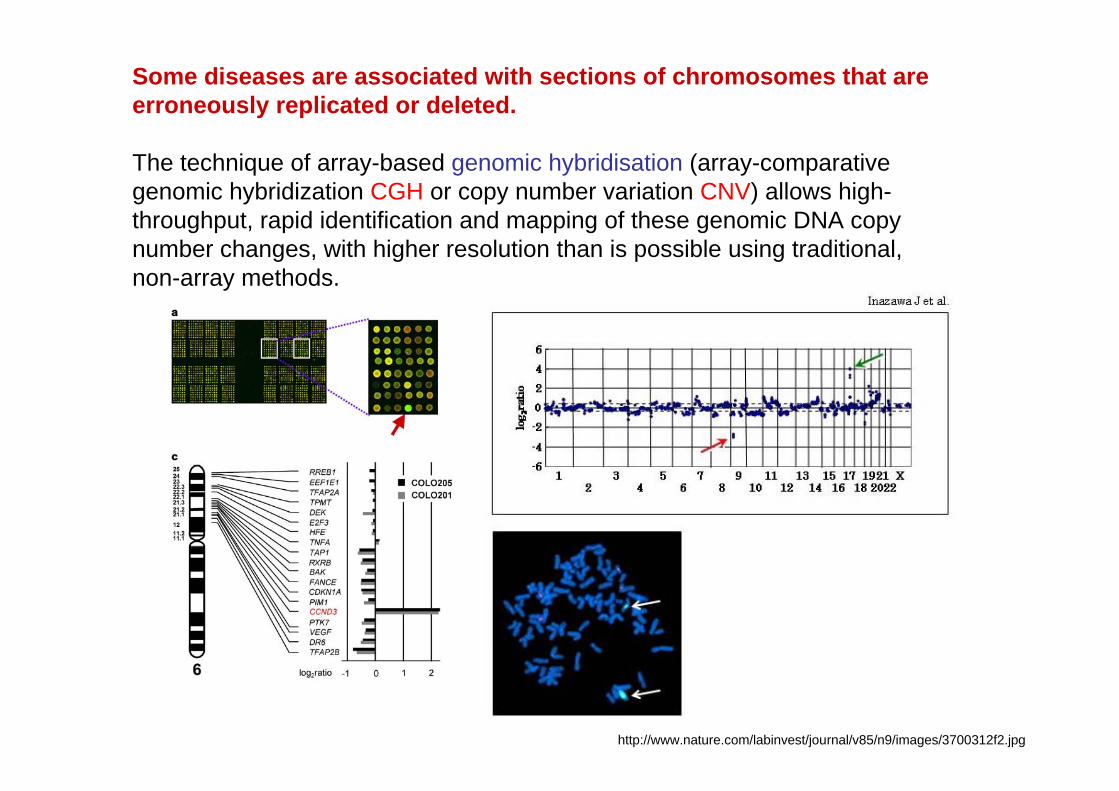
Some diseases are associated with sections of chromosomes that are erroneously replicated or deleted.
The technique of array-based genomic hybridisation (array-comparative genomic hybridization CGH or copy number variation CNV) allows high-throughput, rapid identification and mapping of these genomic DNA copy number changes, with higher resolution than is possible using traditional, non-array methods.
http://www.nature.com/labinvest/journal/v85/n9/images/3700312f2.jpg
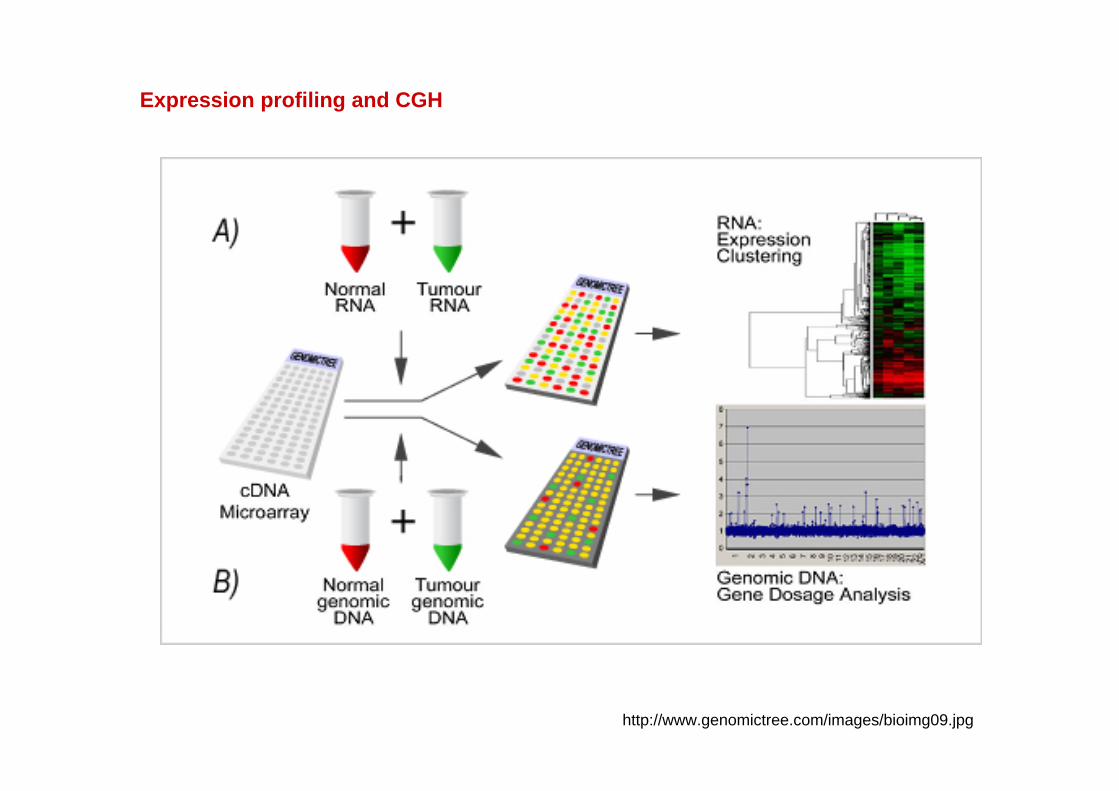
http://www.genomictree.com/images/bioimg09.jpg
Expression profiling and CGH
Resequencing Arrays
Tiling arrays - tools for resequencing, based on the concept of interrogating the genome in a systematic, unbiased fashion.
Before tiling arrays came along, other methods were used to predict genes that were unknown, including expressed-sequence tag (EST) sequencing, comparison with known protein-coding sequences, and ab initio prediction.
Tiling arrays are designed to address this problem by taking an empirical measurement across the entire genomic DNA. This allows a researcher to probe for to probe for transcribed sequences without a predetermined concept of thier location
Using the tiling chips it is possible to perform the most comprehensive analysis of the whole genome combined with transcript mapping. The probes are designed (tiled) at an average resolution of 35-bp throughout the whole genome, thus enabling a more accurate view of the transcription and discovery of novel RNA transcripts.
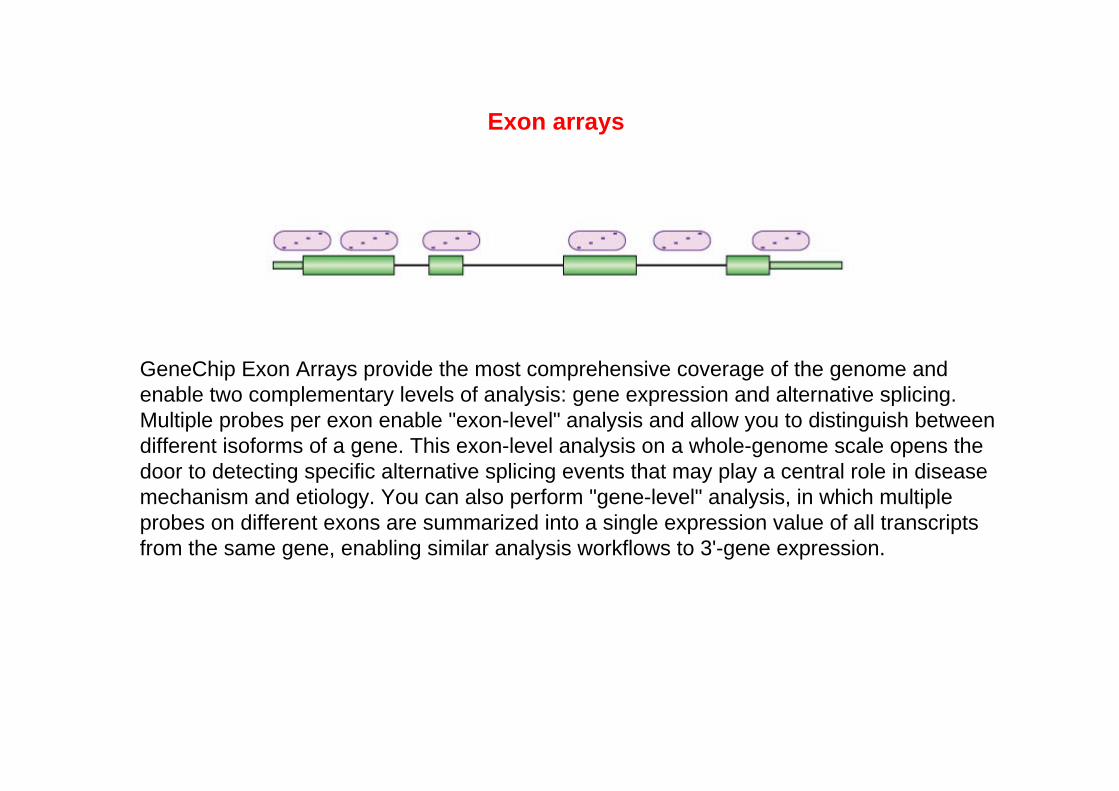
GeneChip Exon Arrays provide the most comprehensive coverage of the genome and enable two complementary levels of analysis: gene expression and alternative splicing. Multiple probes per exon enable "exon-level" analysis and allow you to distinguish between different isoforms of a gene. This exon-level analysis on a whole-genome scale opens the door to detecting specific alternative splicing events that may play a central role in disease mechanism and etiology. You can also perform "gene-level" analysis, in which multiple probes on different exons are summarized into a single expression value of all transcripts from the same gene, enabling similar analysis workflows to 3'-gene expression.
Exon arrays
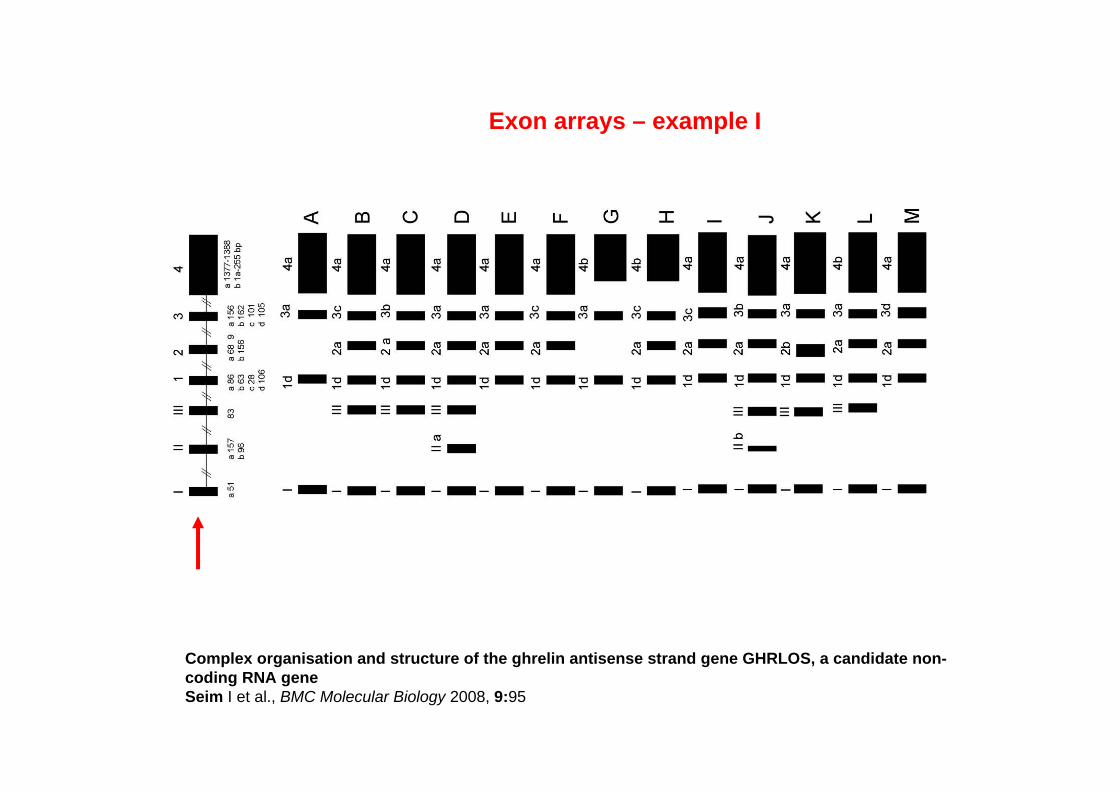
Complex organisation and structure of the ghrelin antisense strand gene GHRLOS, a candidate non-coding RNA geneSeim I et al., BMC Molecular Biology 2008, 9:95
Exon arrays – example I
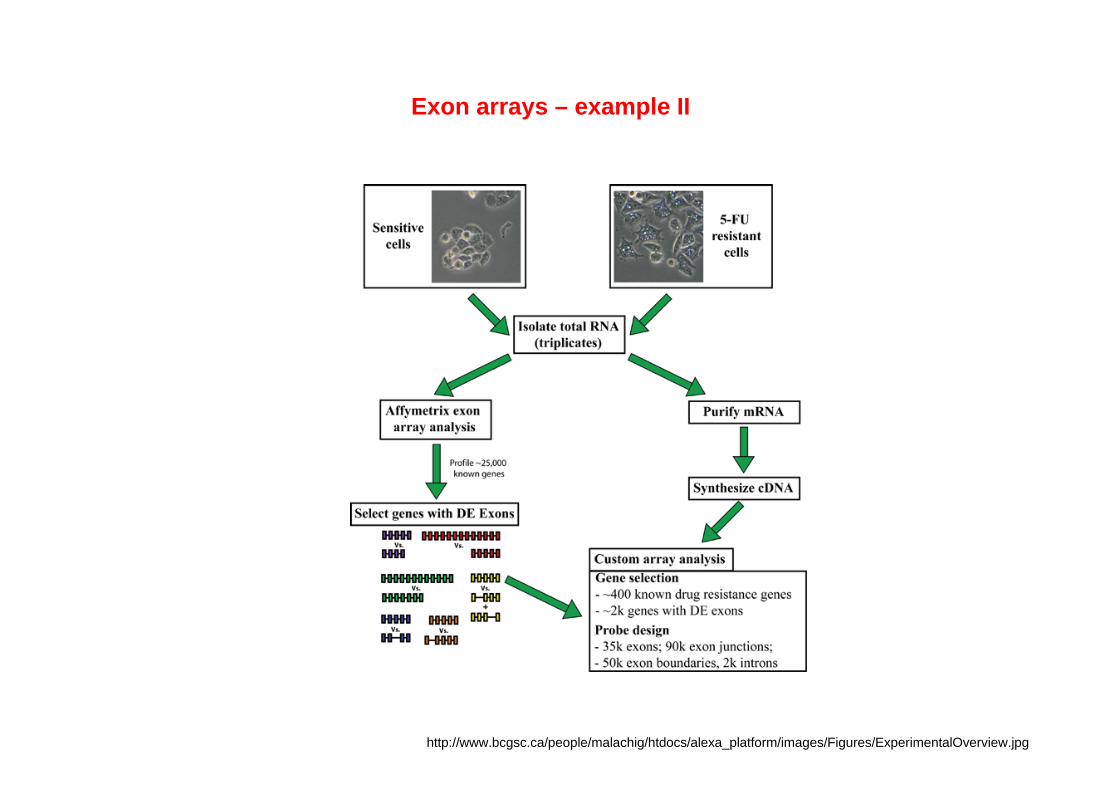
http://www.bcgsc.ca/people/malachig/htdocs/alexa_platform/images/Figures/ExperimentalOverview.jpg
Exon arrays – example II
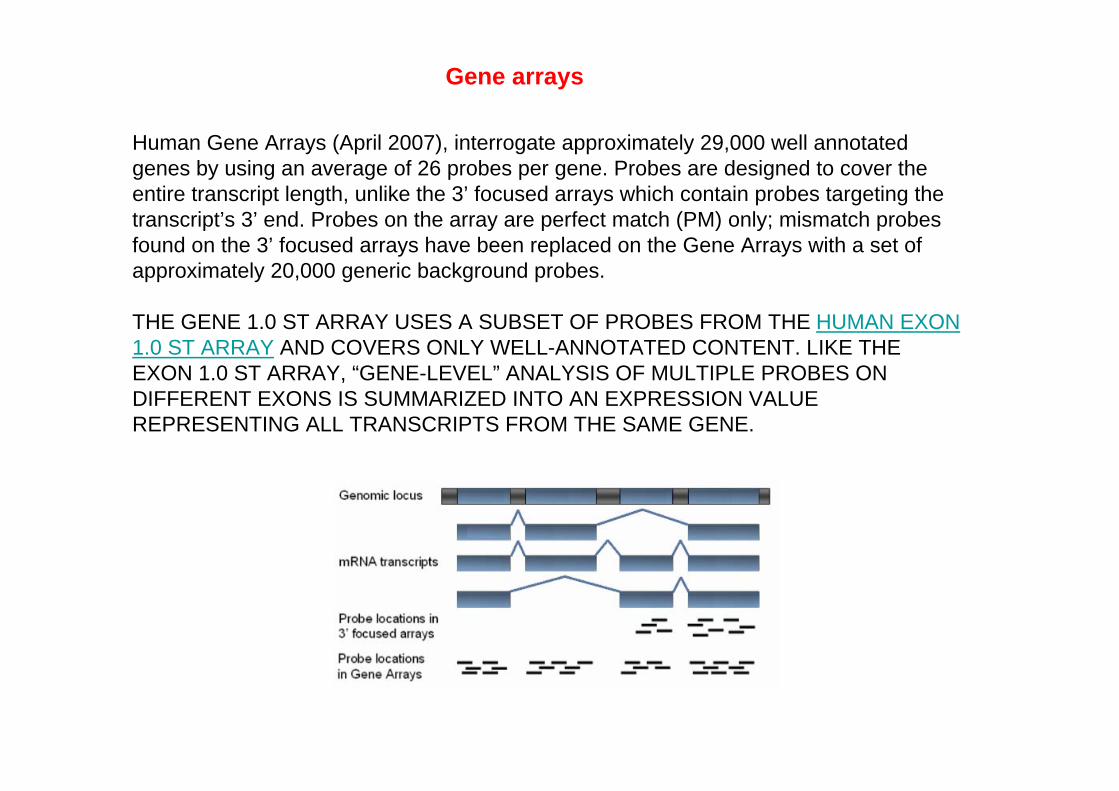
Human Gene Arrays (April 2007), interrogate approximately 29,000 well annotated genes by using an average of 26 probes per gene. Probes are designed to cover the entire transcript length, unlike the 3’ focused arrays which contain probes targeting the transcript’s 3’ end. Probes on the array are perfect match (PM) only; mismatch probes found on the 3’ focused arrays have been replaced on the Gene Arrays with a set of approximately 20,000 generic background probes.
THE GENE 1.0 ST ARRAY USES A SUBSET OF PROBES FROM THE HUMAN EXON 1.0 ST ARRAY AND COVERS ONLY WELL-ANNOTATED CONTENT. LIKE THE EXON 1.0 ST ARRAY, “GENE-LEVEL” ANALYSIS OF MULTIPLE PROBES ON DIFFERENT EXONS IS SUMMARIZED INTO AN EXPRESSION VALUE REPRESENTING ALL TRANSCRIPTS FROM THE SAME GENE.
Gene arrays
miRNA Profiling
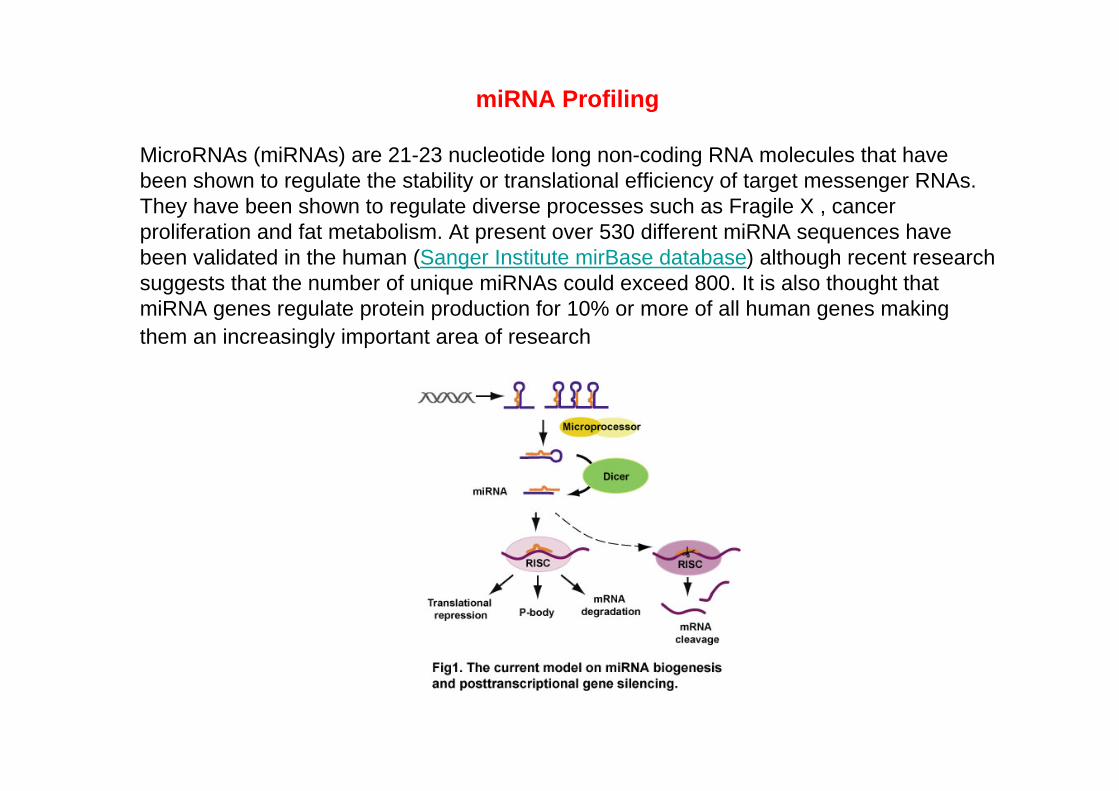
MicroRNAs (miRNAs) are 21-23 nucleotide long non-coding RNA molecules that have been shown to regulate the stability or translational efficiency of target messenger RNAs. They have been shown to regulate diverse processes such as Fragile X , cancer proliferation and fat metabolism. At present over 530 different miRNA sequences have been validated in the human (Sanger Institute mirBase database) although recent research suggests that the number of unique miRNAs could exceed 800. It is also thought that miRNA genes regulate protein production for 10% or more of all human genes making them an increasingly important area of research
miRNA isolation
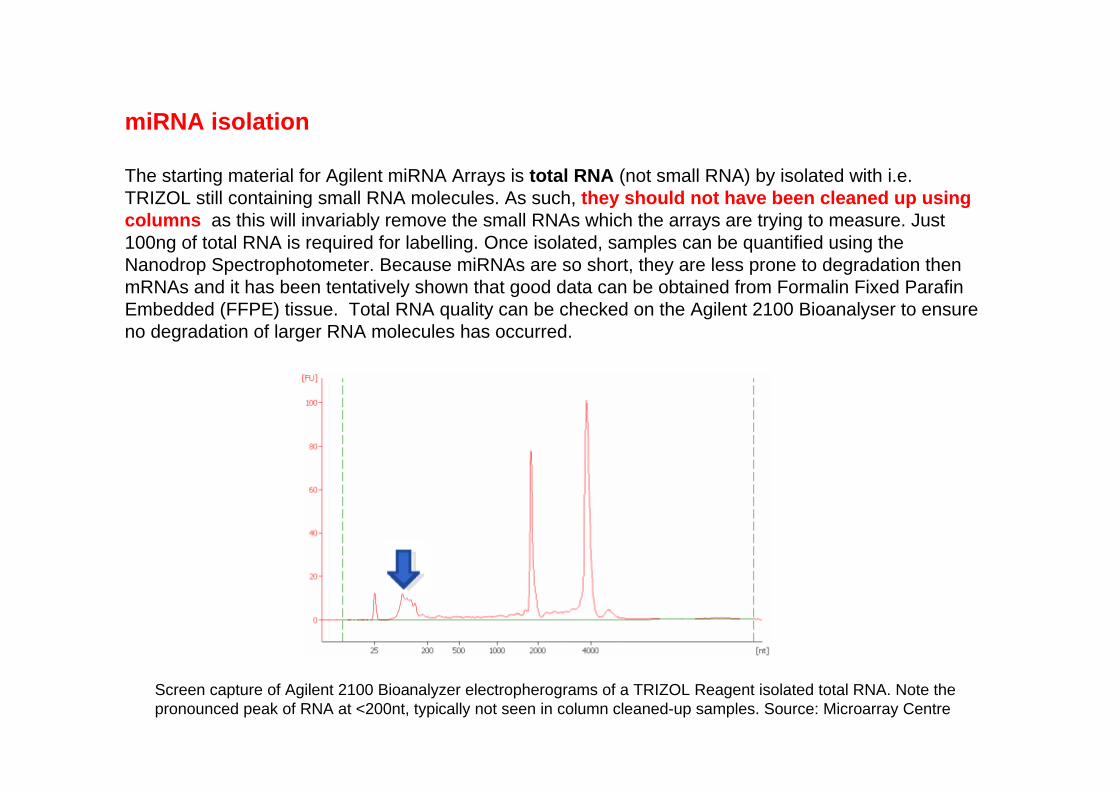
The starting material for Agilent miRNA Arrays is total RNA (not small RNA) by isolated with i.e. TRIZOL still containing small RNA molecules. As such, they should not have been cleaned up using columns as this will invariably remove the small RNAs which the arrays are trying to measure. Just 100ng of total RNA is required for labelling. Once isolated, samples can be quantified using the Nanodrop Spectrophotometer. Because miRNAs are so short, they are less prone to degradation then mRNAs and it has been tentatively shown that good data can be obtained from Formalin Fixed ParafinEmbedded (FFPE) tissue. Total RNA quality can be checked on the Agilent 2100 Bioanalyser to ensure no degradation of larger RNA molecules has occurred.
Screen capture of Agilent 2100 Bioanalyzer electropherograms of a TRIZOL Reagent isolated total RNA. Note the pronounced peak of RNA at <200nt, typically not seen in column cleaned-up samples. Source: Microarray Centre
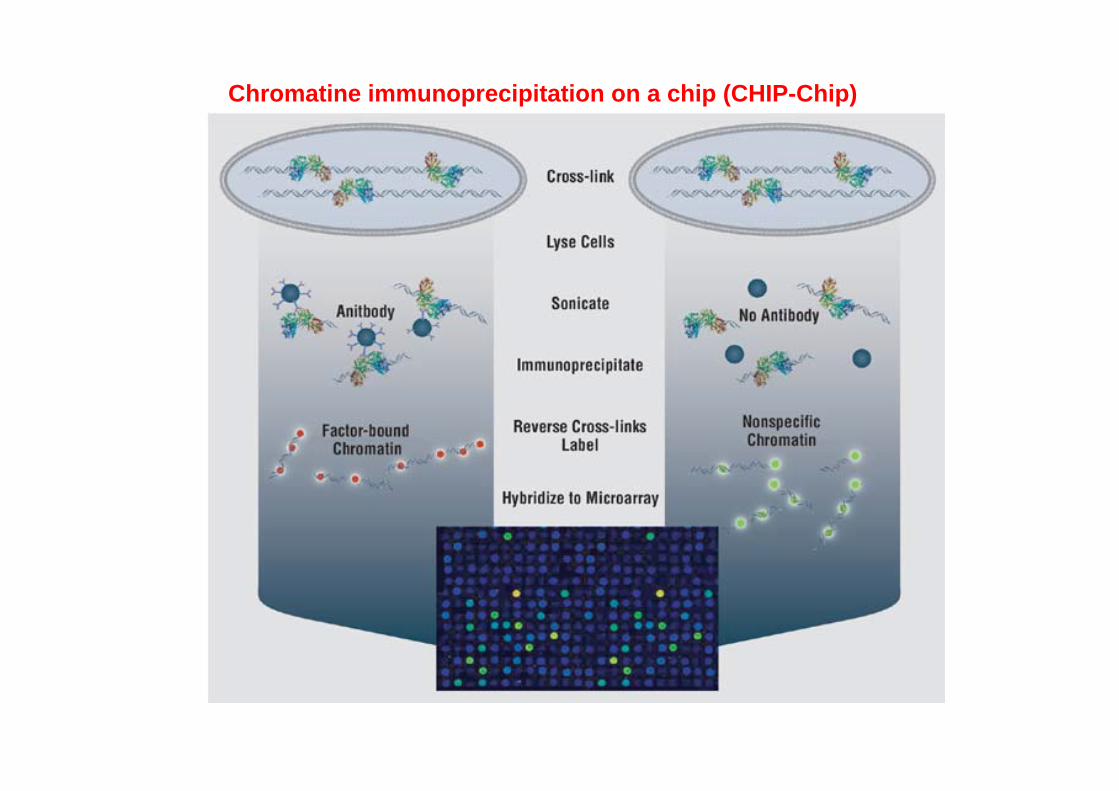
Chromatine immunoprecipitation on a chip (CHIP-Chip)
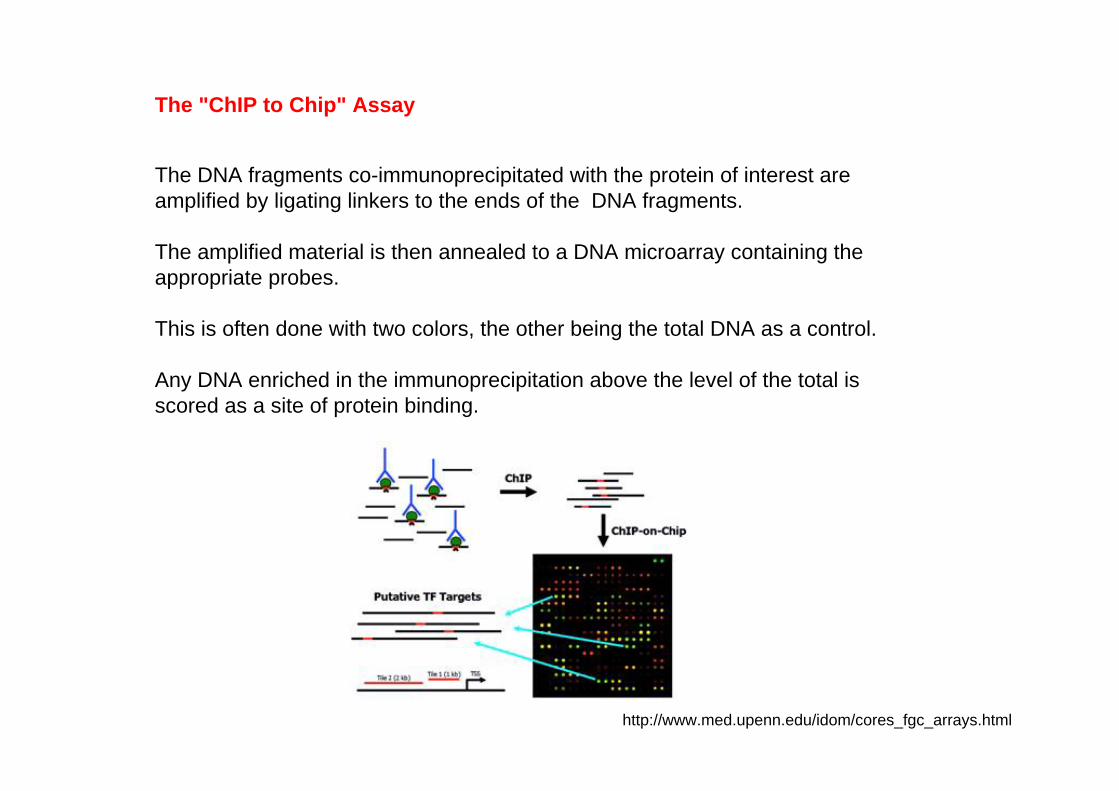
The "ChIP to Chip" Assay
The DNA fragments co-immunoprecipitated with the protein of interest are amplified by ligating linkers to the ends of the DNA fragments.
The amplified material is then annealed to a DNA microarray containing the appropriate probes.
This is often done with two colors, the other being the total DNA as a control.
Any DNA enriched in the immunoprecipitation above the level of the total is scored as a site of protein binding.
http://www.med.upenn.edu/idom/cores_fgc_arrays.html

Detection of Nkx2-5 binding to the Actc1 promoter and intron 1 (A) and the Nppa promoter (B) using the Integrated Genome Browser
Chip-chip – example I
www.nimr.mrc.ac.uk/devbiol/mohun/cardiacdiff/
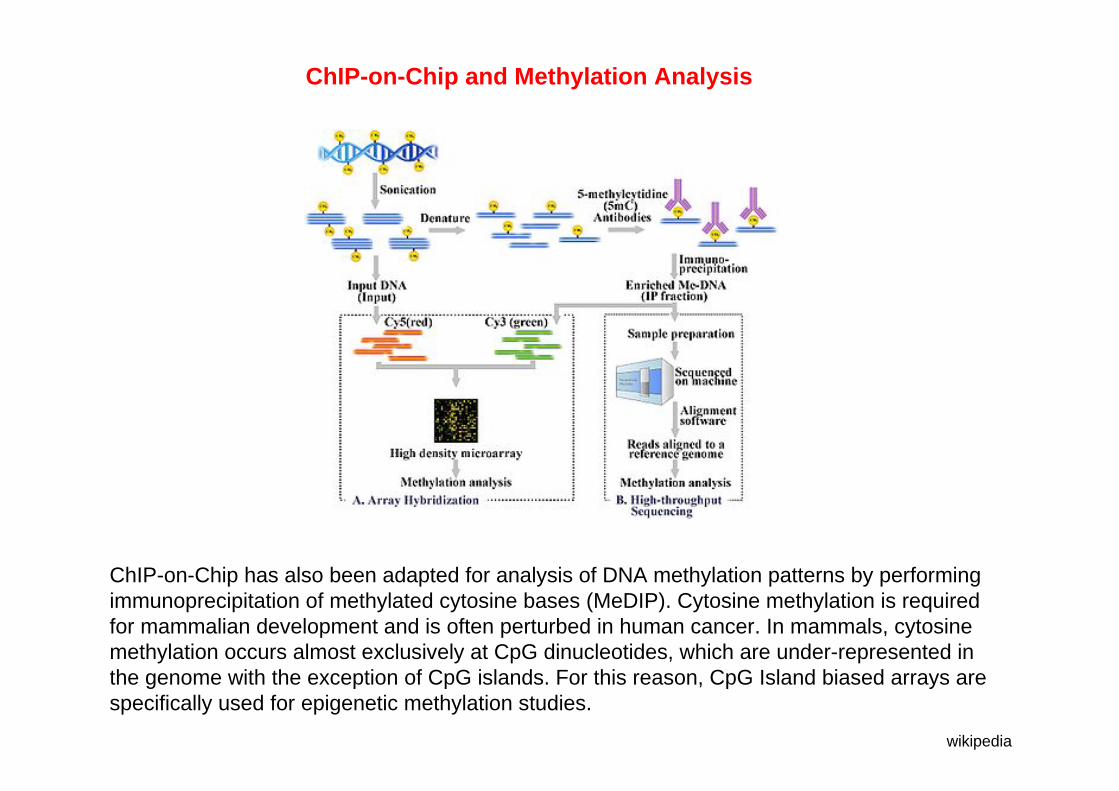
ChIP-on-Chip has also been adapted for analysis of DNA methylation patterns by performing immunoprecipitation of methylated cytosine bases (MeDIP). Cytosine methylation is required for mammalian development and is often perturbed in human cancer. In mammals, cytosine methylation occurs almost exclusively at CpG dinucleotides, which are under-represented in the genome with the exception of CpG islands. For this reason, CpG Island biased arrays are specifically used for epigenetic methylation studies.
ChIP-on-Chip and Methylation Analysis
wikipedia

DNA čipi so zbirka mikroskopskih “DNA točk”, cDNA ali oligonukleotidov, pritrjenihna trdo podlago.
Uporabljajo se za:
• Analizo genomske DNA (genotipizacija, SNP analiza, CHG, sekvenciranje).
• Analizo izražanja genov (ekspresijsko profiliranje) , kjer probe lahkopredstavljajo 3'–konce genov, eksone ali različne dele genov. Posebni čipi pa so za sledenje izražanja miRNA.
• Študije uravnavanja izražanja genov (določanje vezavnih mesttranskripcijskih faktorjev, metilacija kromatina), kjer probe predstavljajo 5’-neprevedene dele in nerepetitivne dele genov.
Povzetek

Next generation sequencing
www.gatc.co.uk/cgi-bin/wPrintpreview.cgi?sour...
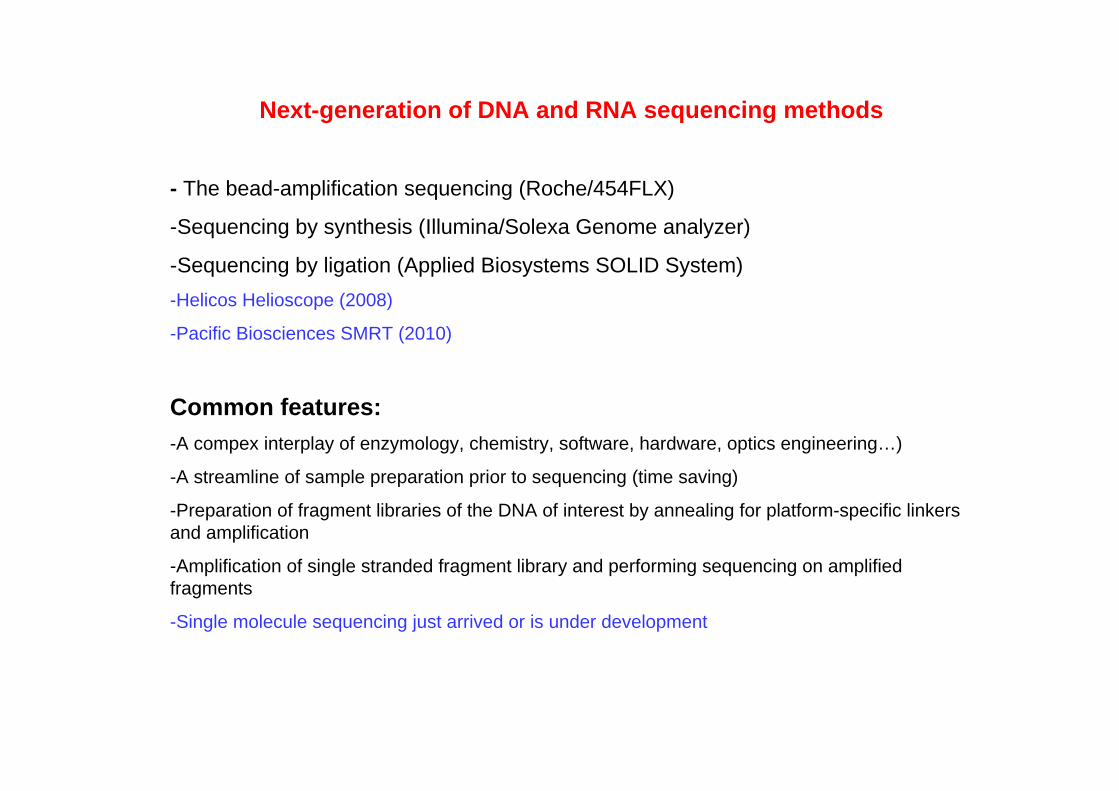
Next-generation of DNA and RNA sequencing methods
- The bead-amplification sequencing (Roche/454FLX)
-Sequencing by synthesis (Illumina/Solexa Genome analyzer)
-Sequencing by ligation (Applied Biosystems SOLID System)-Helicos Helioscope (2008)
-Pacific Biosciences SMRT (2010)
Common features:-A compex interplay of enzymology, chemistry, software, hardware, optics engineering…)
-A streamline of sample preparation prior to sequencing (time saving)
-Preparation of fragment libraries of the DNA of interest by annealing for platform-specific linkers and amplification
-Amplification of single stranded fragment library and performing sequencing on amplified fragments
-Single molecule sequencing just arrived or is under development
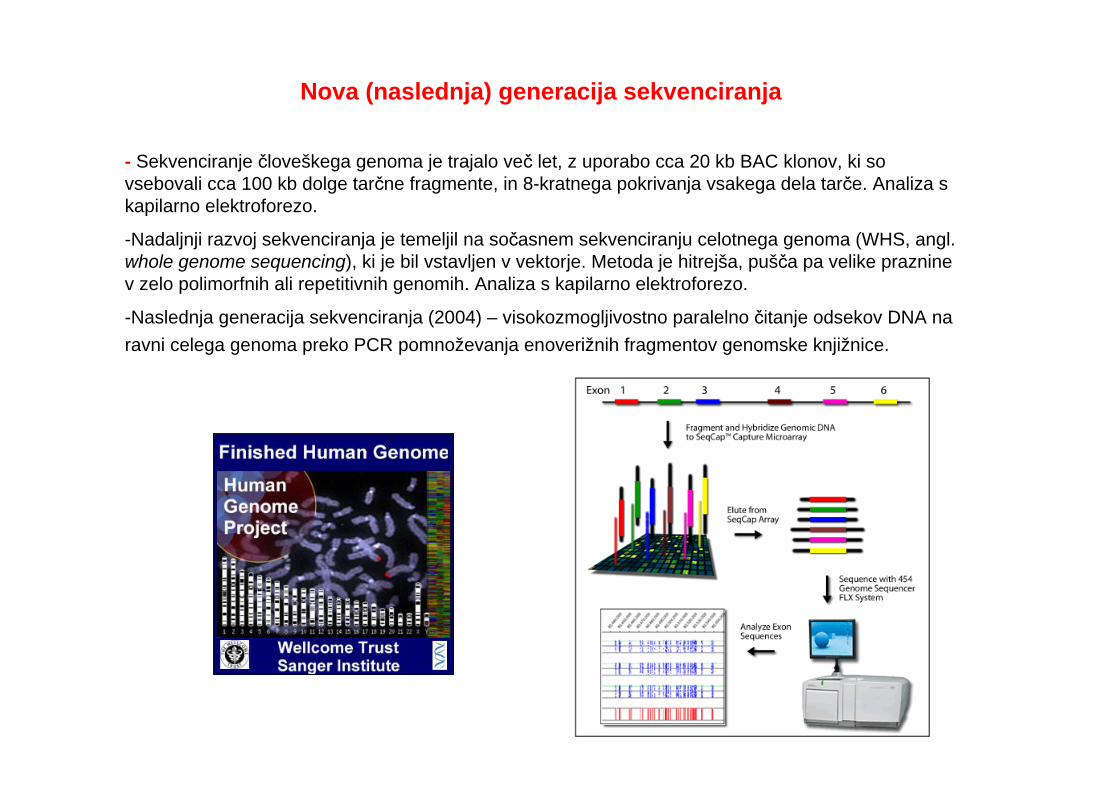
Nova (naslednja) generacija sekvenciranja
- Sekvenciranje človeškega genoma je trajalo več let, z uporabo cca 20 kb BAC klonov, ki so vsebovali cca 100 kb dolge tarčne fragmente, in 8-kratnega pokrivanja vsakega dela tarče. Analiza s kapilarno elektroforezo.
-Nadaljnji razvoj sekvenciranja je temeljil na sočasnem sekvenciranju celotnega genoma (WHS, angl. whole genome sequencing), ki je bil vstavljen v vektorje. Metoda je hitrejša, pušča pa velike prazninev zelo polimorfnih ali repetitivnih genomih. Analiza s kapilarno elektroforezo.
-Naslednja generacija sekvenciranja (2004) – visokozmogljivostno paralelno čitanje odsekov DNA naravni celega genoma preko PCR pomnoževanja enoverižnih fragmentov genomske knjižnice.

General concepts for clonal-array generation and sequencing
a | Bead-chips. Genomic DNA is fragmented and adaptors are ligated to create an insert library that is flanked by two universal priming sites. Because of the random fragmentation, the complexity of this signature sequence library is equivalent to the genome. This library is cloned on beads using emulsion PCR technology. A water-in-oil emulsion is created from a PCR mix that contains a limiting dilution of DNA and beads. The emulsion creates micro-compartments with, on average, a single bead and single DNA template each. After PCR, beads with clones are affinity selected and assembled onto a planar substrate. A subsequent cycle-sequencing reaction is used to read out the sequence on the clones. (Roche).
b | Sequencing by synthesis (SBS). A common anchor primer is annealed to a constant sequence (universal priming site) that is contained within the library clones that are located on the polony (clonalbead) array (the orientation of the immobilized target might vary depending on the platform that is used). The sequence is read out by polymerase extension in a base-by-base fashion using either reversible terminators or sequential nucleotide addition (pyrosequencing). After incorporation of a single base or base type, the incorporated base is identified by fluorescence (laser) or chemiluminescence (no laser required) (Ilumina-Solexa).
c | Sequencing by ligation. The polony array set-up is similar to SBS in which a common primer is annealed to an arrayed polony library and used to read out the sequence through a stepwise ligation of random oligomers. The labelled oligomers are designed to have random bases inserted at every site except the query site. The query site has one of four base substitutions, each matched to a particular fluorescent label on the oligonucleotide. After read-out of each ligation event, the primer and the ligatedoligomer are stripped, a new primer reannealed and the process repeated with an oligomer that contains a query base at a different position (ABI).
Fan et al. Nature Reviews Genetics 7, 632–644 (August 2006) | doi:10.1038/nrg1901

Fan et al. Nature Reviews Genetics 7, 632–644 (August 2006) | doi:10.1038/nrg1901
General concepts for clonal-array generation and sequencing
Bead chips
Sequencing bysynthesis
Sequencing byligation

Roche/454 FLX Pyrosequencer
Library fragments are mixed with agarosebeads with oligos complementary to adapter sequences on the library.
Each bead is associated with a single fragment.
Each fragment-bead complex is isolated into individual oil:water micelles with PCR mixture.
Thermal cycling of this emulsion PCR of the micelles produces amplified unique sequences on the bead surface.
“En mass” sequencing of PCR products on picotiter plates (PTP) with single beads in each picowell.
Enzyme/substrate containing beads for the pyrosequencing reaction are added to wells that act as floww cells for addition of individual pure nucleotide solutions. The CCD camera records the light emitted at each bead.
Mardis E.R. Annual Review of Genomics and Human Genetics 9: 387-403 (2008).
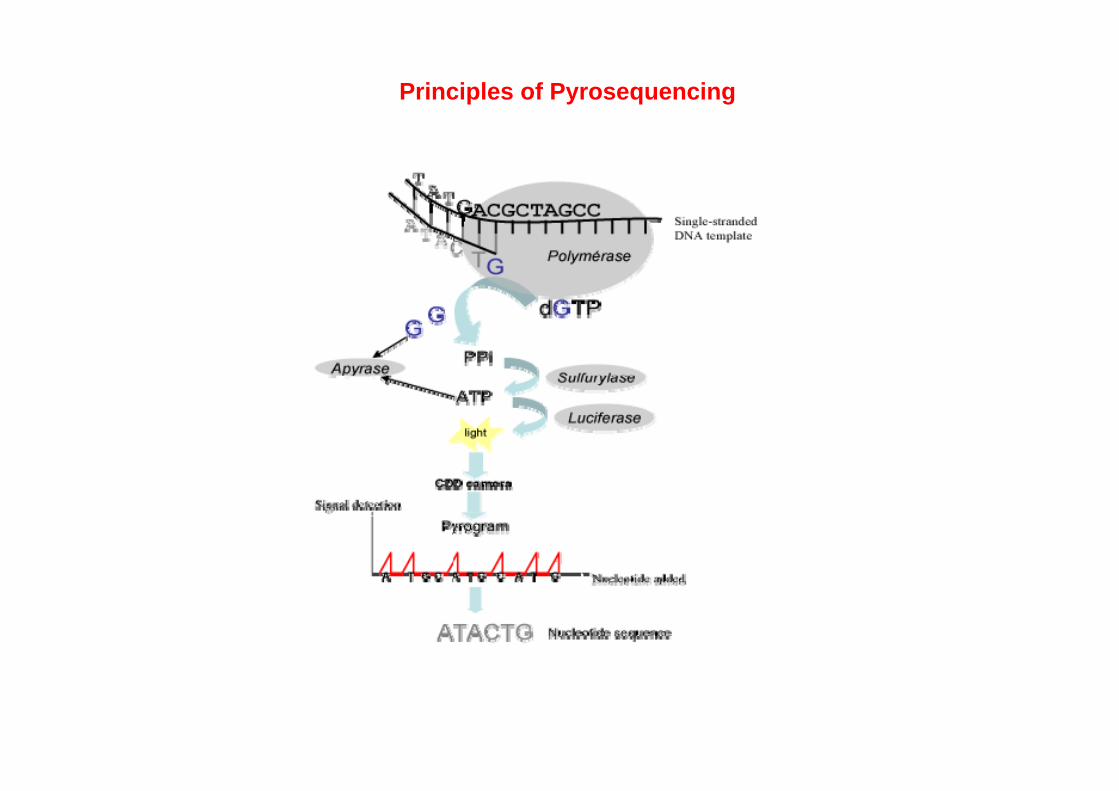
Principles of Pyrosequencing
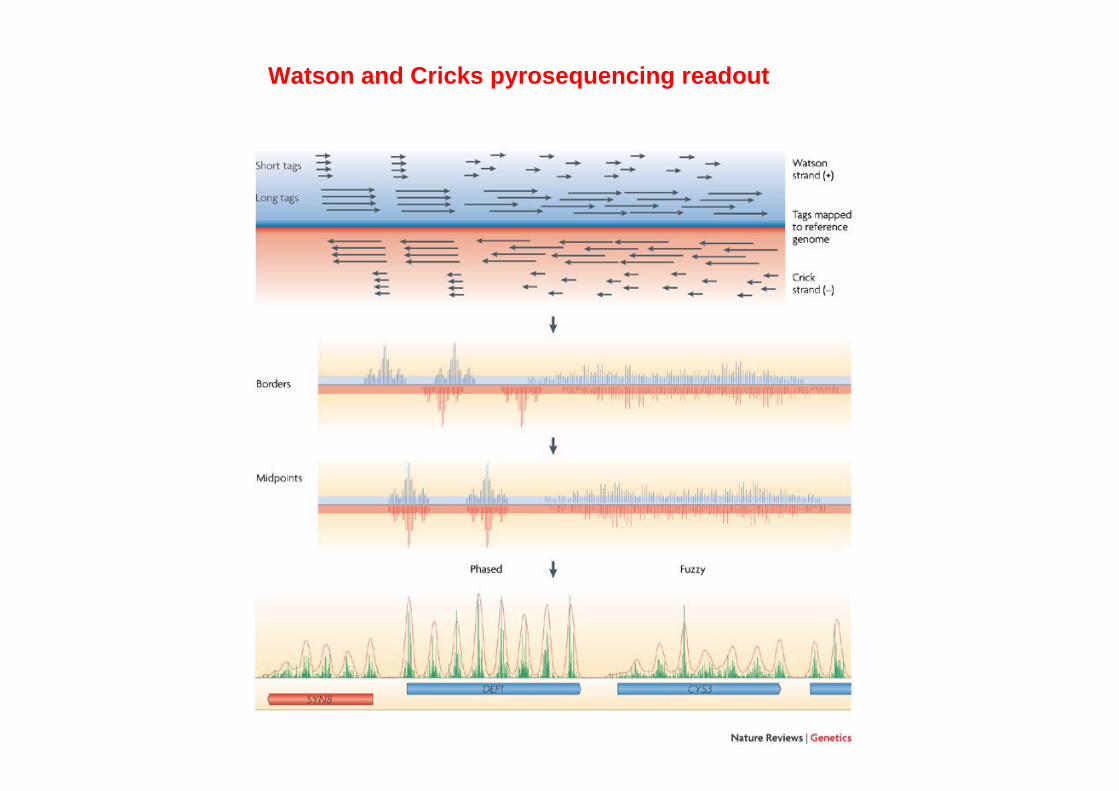
Watson and Cricks pyrosequencing readout
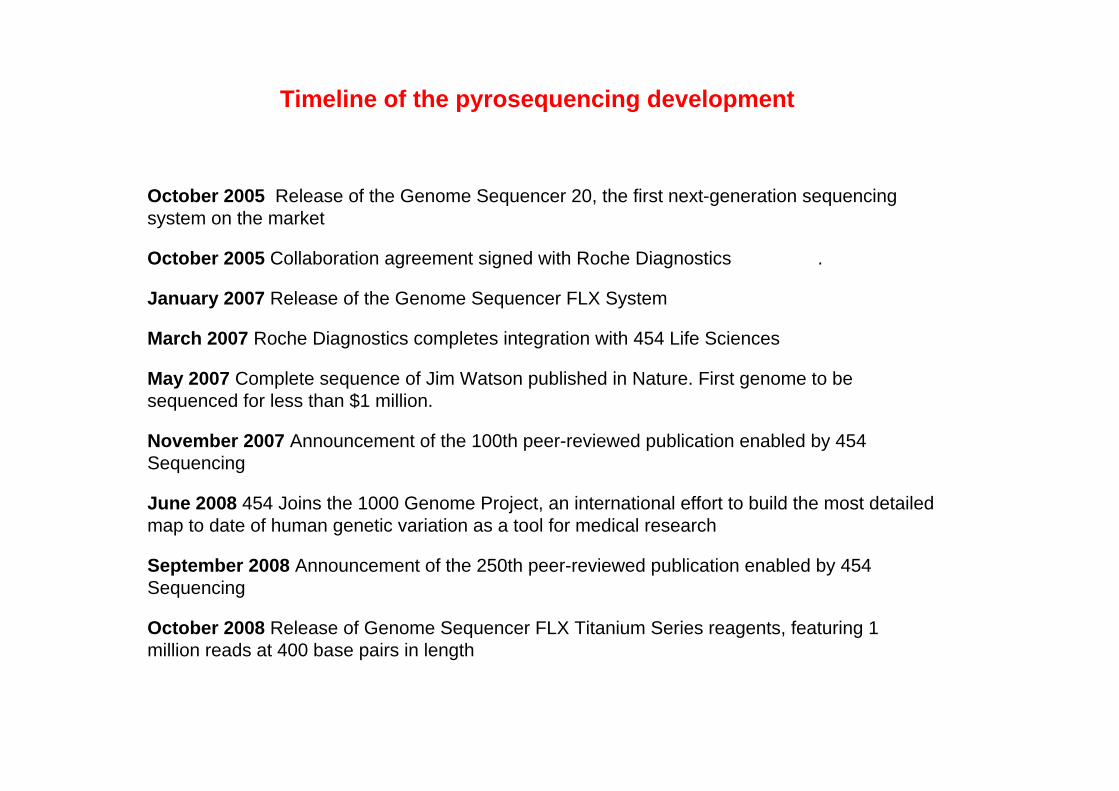
Timeline of the pyrosequencing development
October 2005 Release of the Genome Sequencer 20, the first next-generation sequencing system on the market
October 2005 Collaboration agreement signed with Roche Diagnostics .
January 2007 Release of the Genome Sequencer FLX System
March 2007 Roche Diagnostics completes integration with 454 Life Sciences
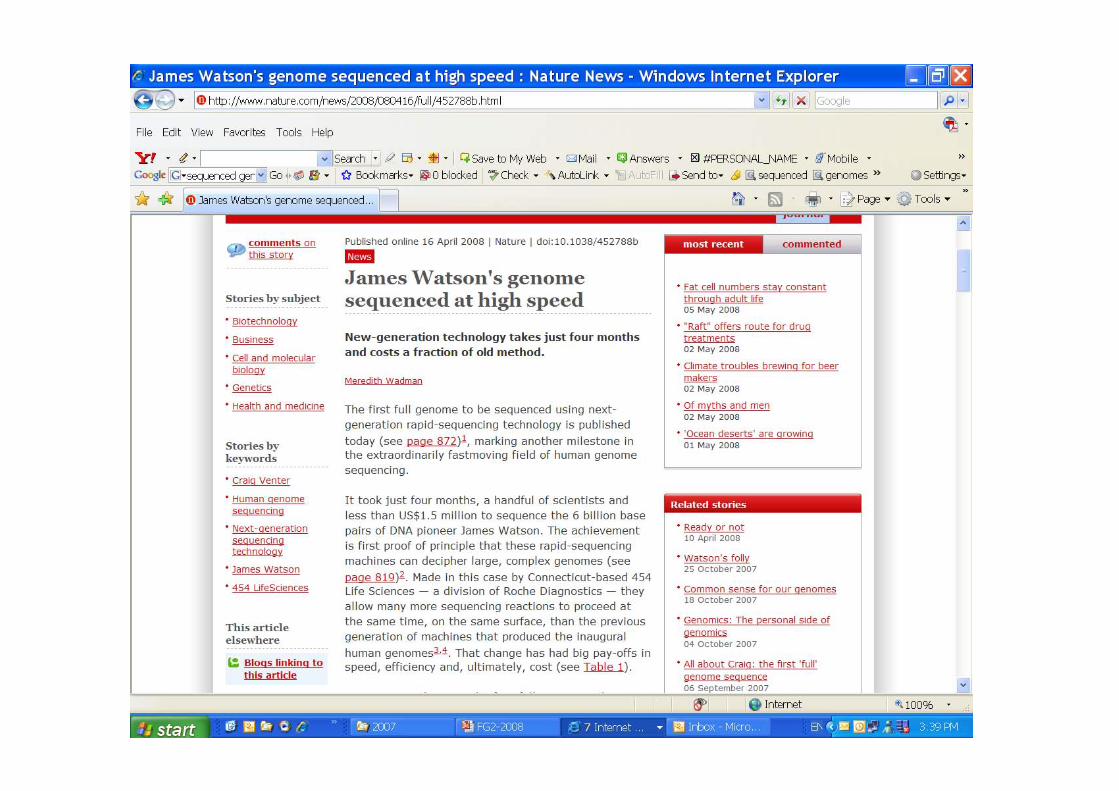
May 2007 Complete sequence of Jim Watson published in Nature. First genome to be sequenced for less than $1 million.
November 2007 Announcement of the 100th peer-reviewed publication enabled by 454 Sequencing
June 2008 454 Joins the 1000 Genome Project, an international effort to build the most detailed map to date of human genetic variation as a tool for medical research
September 2008 Announcement of the 250th peer-reviewed publication enabled by 454 Sequencing
October 2008 Release of Genome Sequencer FLX Titanium Series reagents, featuring 1 million reads at 400 base pairs in length
illumina sequencing technology
is based on arrays of randomly assembled glass (silica) beads;the beads have oligonucleotides covalently attached to the surface;each bead has about one million oligos on its surface;all oligos on each bead have the same sequence
Attached DNA fragments are extended and bridge amplified to create an ultra-high density sequencing flow cell with 80-100 million clusters, each containing ~1,000 copies of the same template. These templates are sequenced using a robust four-color DNA sequencing-by-synthesis technology that employs reversible terminators with removable fluorescent dyes. This novel approach ensures high accuracy and true base-by-base sequencing, eliminating sequence-context specific errors and enabling sequencing through homopolymers and repetitive sequences.
the beads are randomly assembled on the arrays, and the location of a particular probe is initially unknown;a process called decoding is used to find the location of each bead;
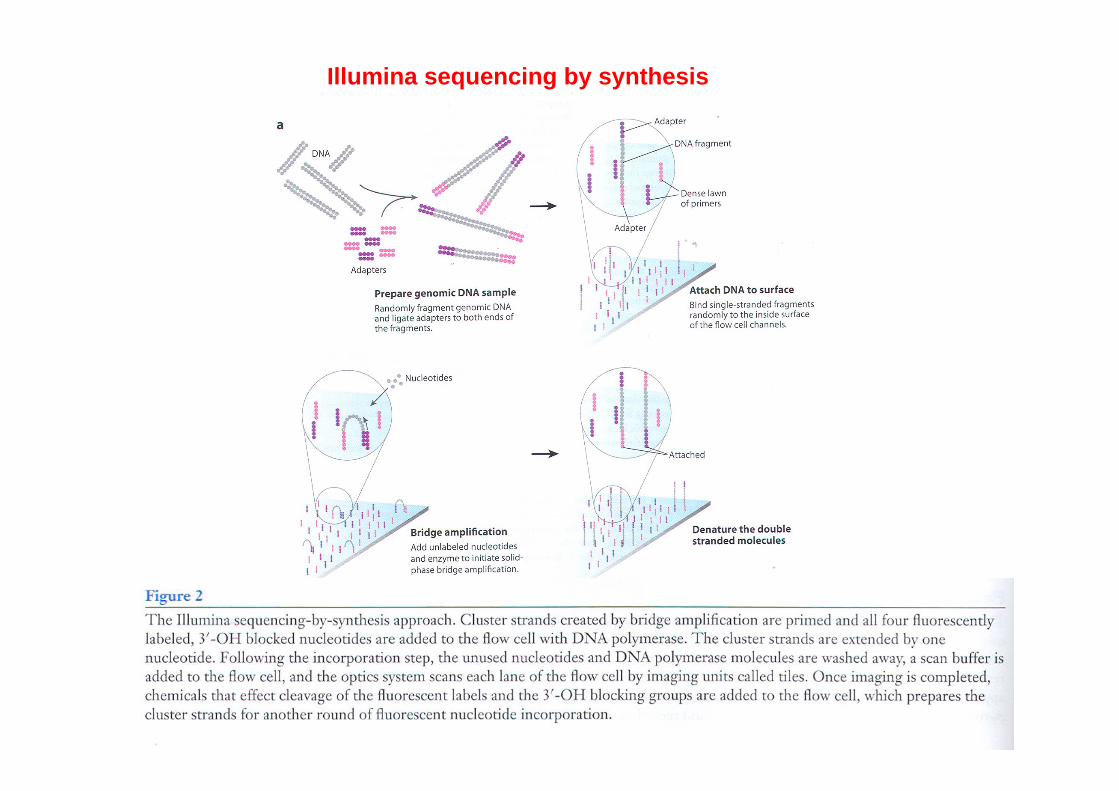
Illumina sequencing by synthesis
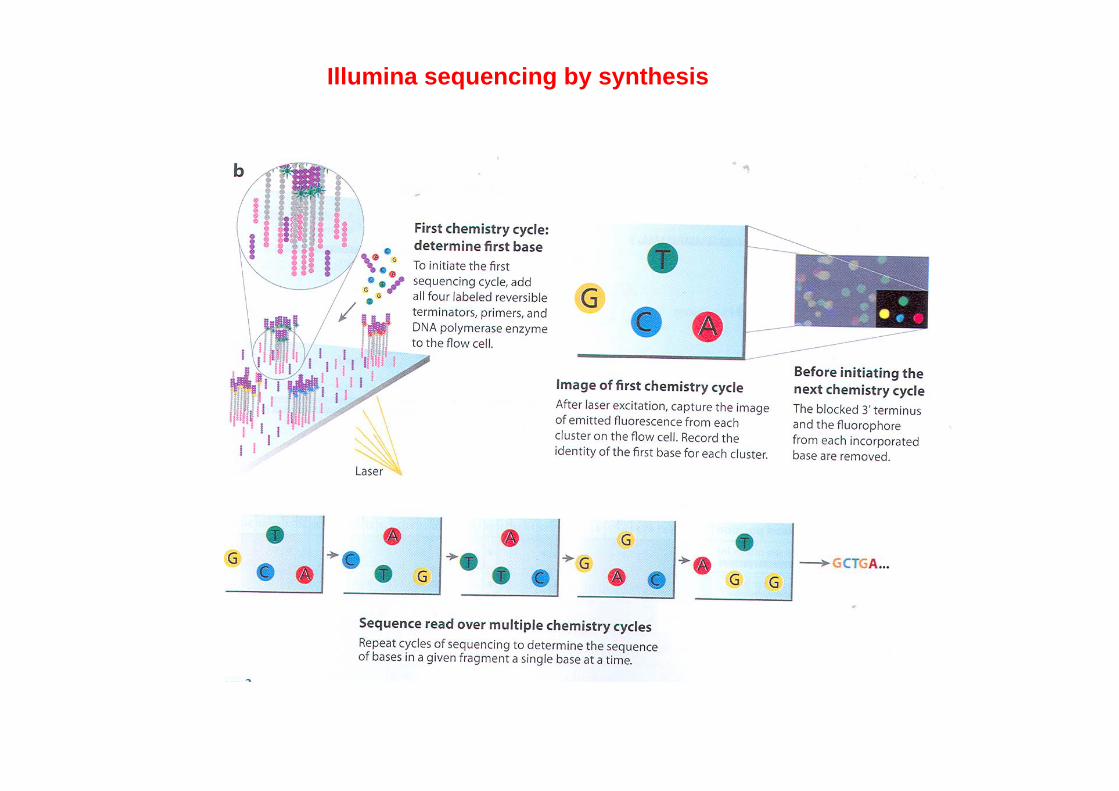
Illumina sequencing by synthesis
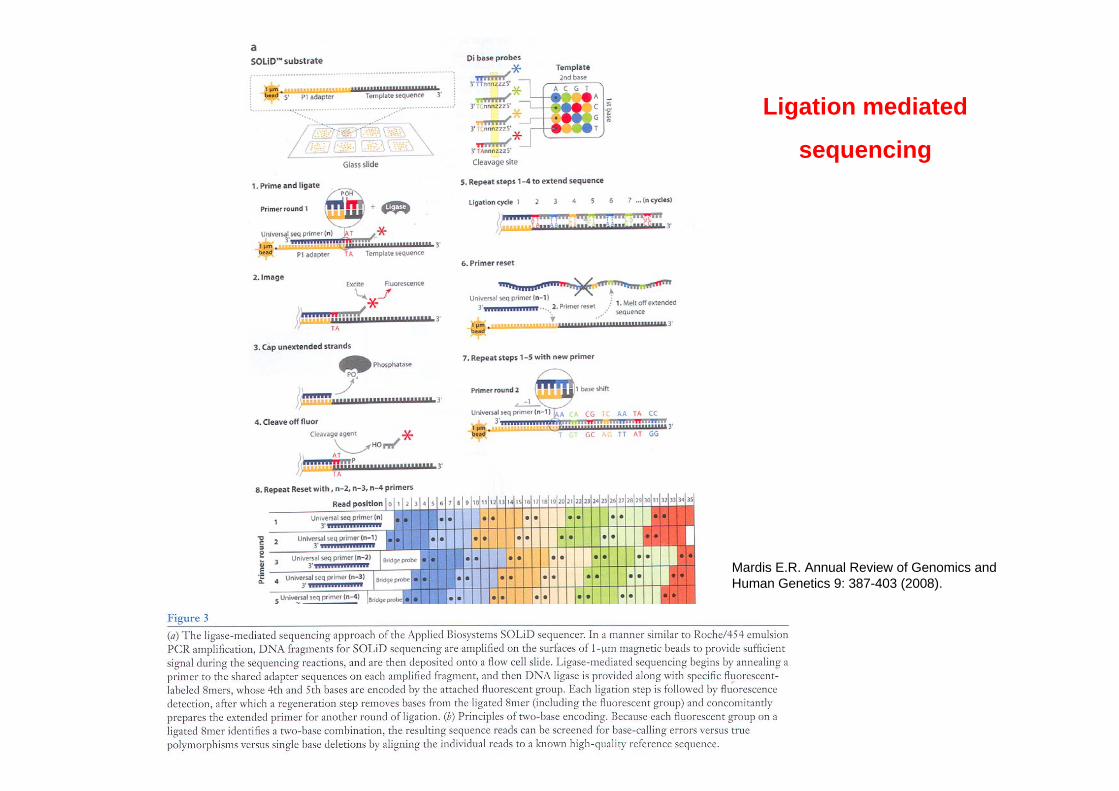
Ligation mediated
sequencing
Mardis E.R. Annual Review of Genomics and Human Genetics 9: 387-403 (2008).
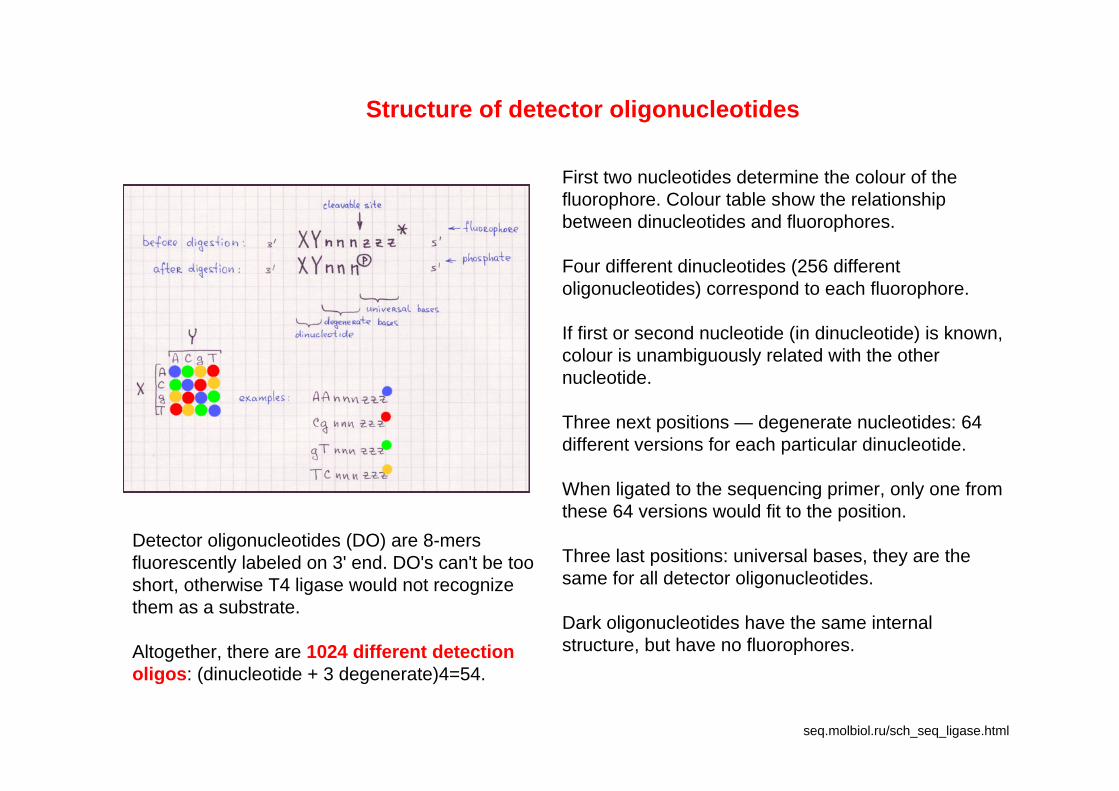
seq.molbiol.ru/sch_seq_ligase.html
Structure of detector oligonucleotides
First two nucleotides determine the colour of the fluorophore. Colour table show the relationship between dinucleotides and fluorophores.
Four different dinucleotides (256 different oligonucleotides) correspond to each fluorophore.
If first or second nucleotide (in dinucleotide) is known, colour is unambiguously related with the other nucleotide.
Three next positions — degenerate nucleotides: 64 different versions for each particular dinucleotide.
When ligated to the sequencing primer, only one from these 64 versions would fit to the position.
Three last positions: universal bases, they are the same for all detector oligonucleotides.
Dark oligonucleotides have the same internal structure, but have no fluorophores.
Detector oligonucleotides (DO) are 8-mers fluorescently labeled on 3' end. DO's can't be too short, otherwise T4 ligase would not recognize them as a substrate.
Altogether, there are 1024 different detection oligos: (dinucleotide + 3 degenerate)4=54.
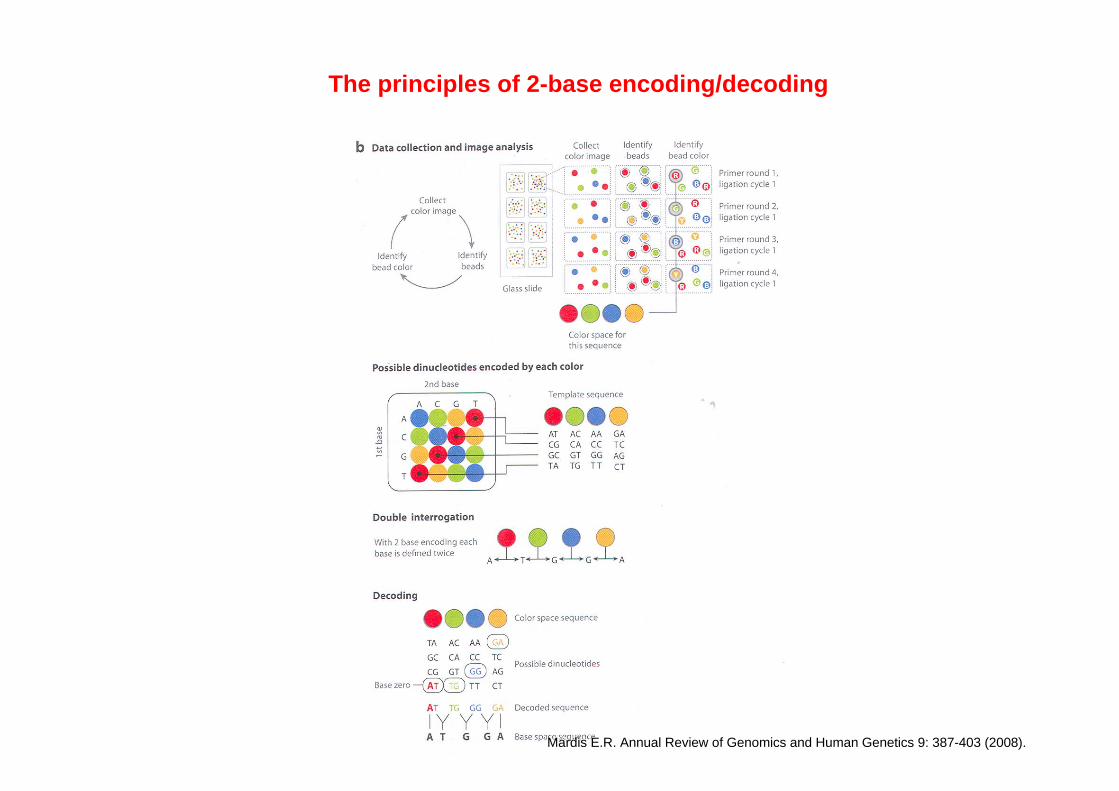
The principles of 2-base encoding/decoding
Mardis E.R. Annual Review of Genomics and Human Genetics 9: 387-403 (2008).
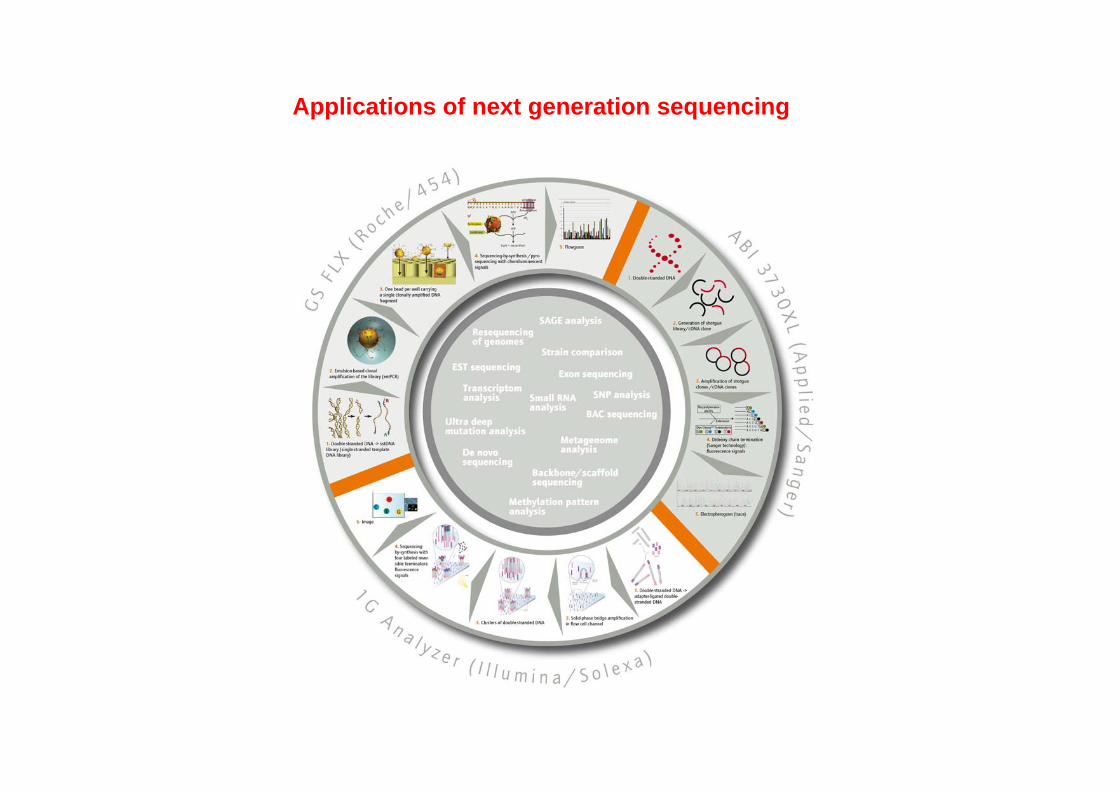
Applications of next generation sequencing
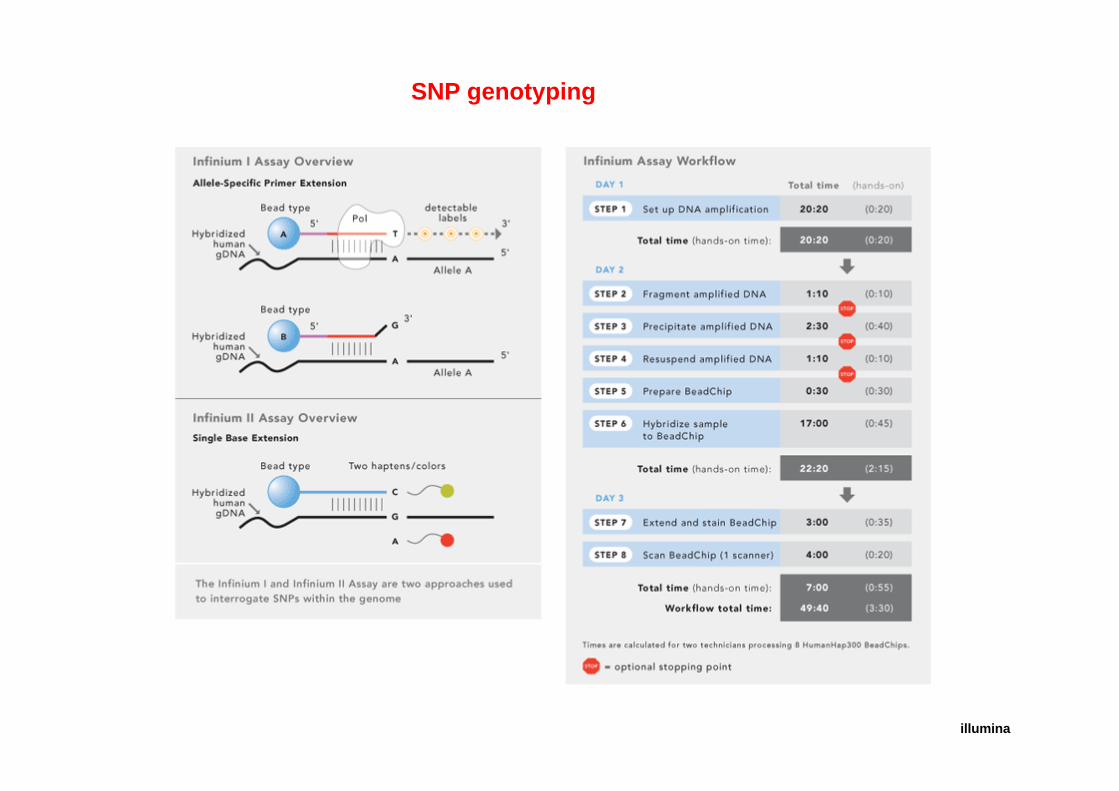
SNP genotyping
illumina
Fan et al. Nature Reviews Genetics 7, 632–644 (August 2006) | doi:10.1038/nrg1901
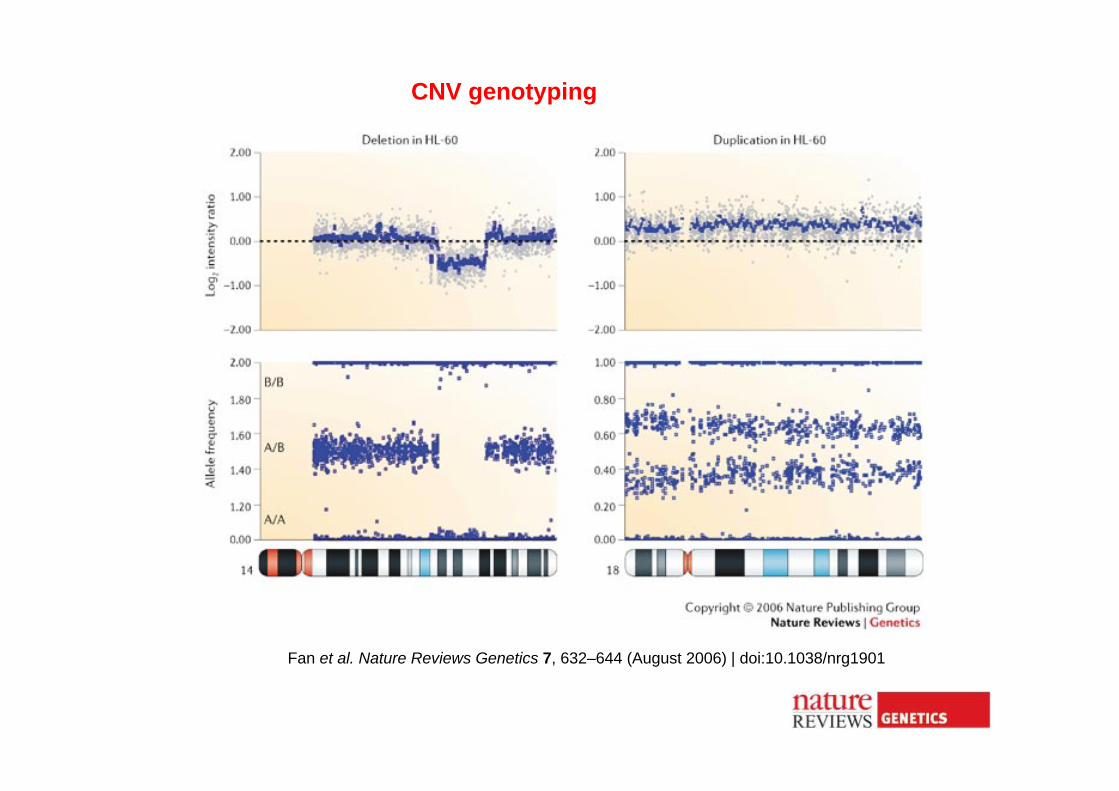
CNV genotyping
Fan et al. Nature Reviews Genetics 7, 632–644 (August 2006) | doi:10.1038/nrg1901
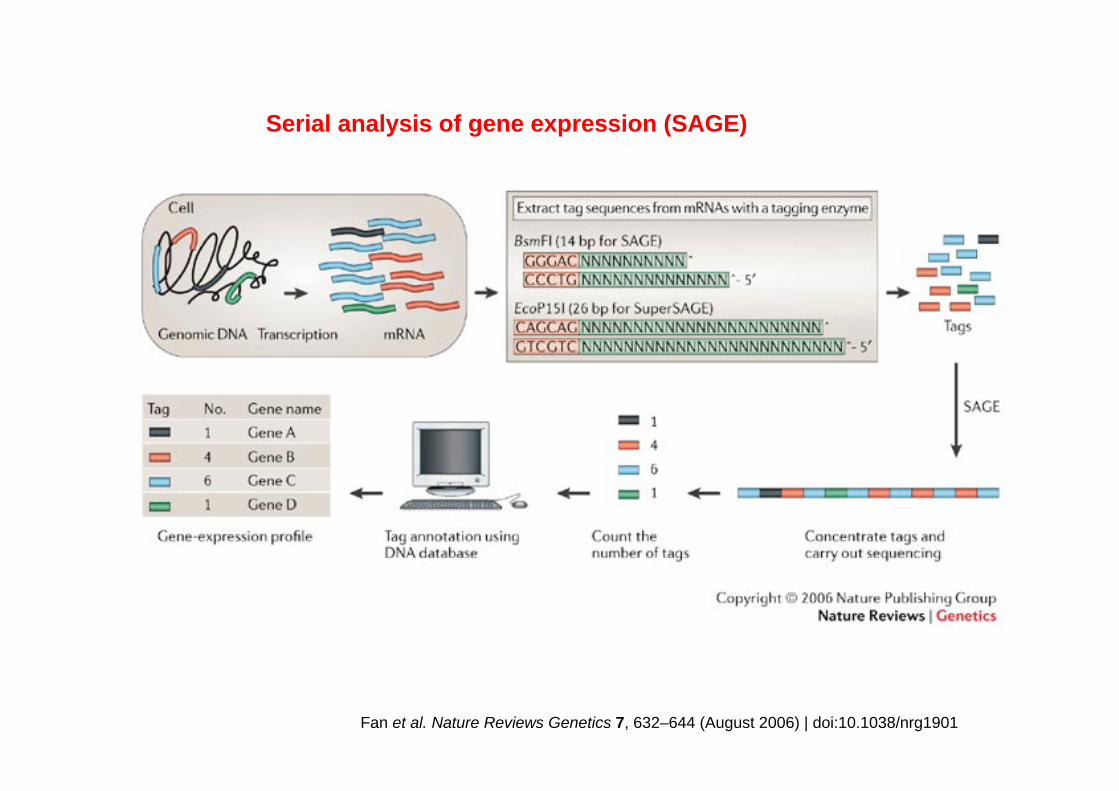
Serial analysis of gene expression (SAGE)
Povzetek
• Nova generacija visokozmogljivostnega sekvenciranje omogoča razpoznavanje zaporedijDNA na ravni celega genoma, z resolucijo posameznega baznega para.
• Iz vsakega vzorca se pripravi z adaptorji ligirana knjižnica, ki vsebuje vse v vzorcuprisotne fragmente DNA ali RNA (cDNA).
• Vse platforme bazirajo na ligaciji adaptorjev in pomnoževanju, imajo pa različne pristopesekvenciranja:
-Pirosekvenciranje (Roche-Nimblegen)
-Sekvenciranje s sintezo (Illumina-Solexa)
-Sekvenciranje z ligacijo (ABI)
•Razvijajo se tudi metode, ki pred sekvenciranjem ne potrebujejo pomnoževanja.
• Aplikacije so enake kot pri klasičnih mikromrežah (ekspresijsko profiliranje oz. SAGE, genotipizacija SNP in CNV, kroamtinska imunoprecipitacija, metilacija kromatina, itd.).
•Prednost pred klasičnimi mikromrežami je v preprosti pripravi vzorca in zmožnostiprocesiranja velikega števila vzorcev v kratkem času.
•Procesiranje velikega števila vzorcev na eni ali več aparaturah lahko upravlja en človek.
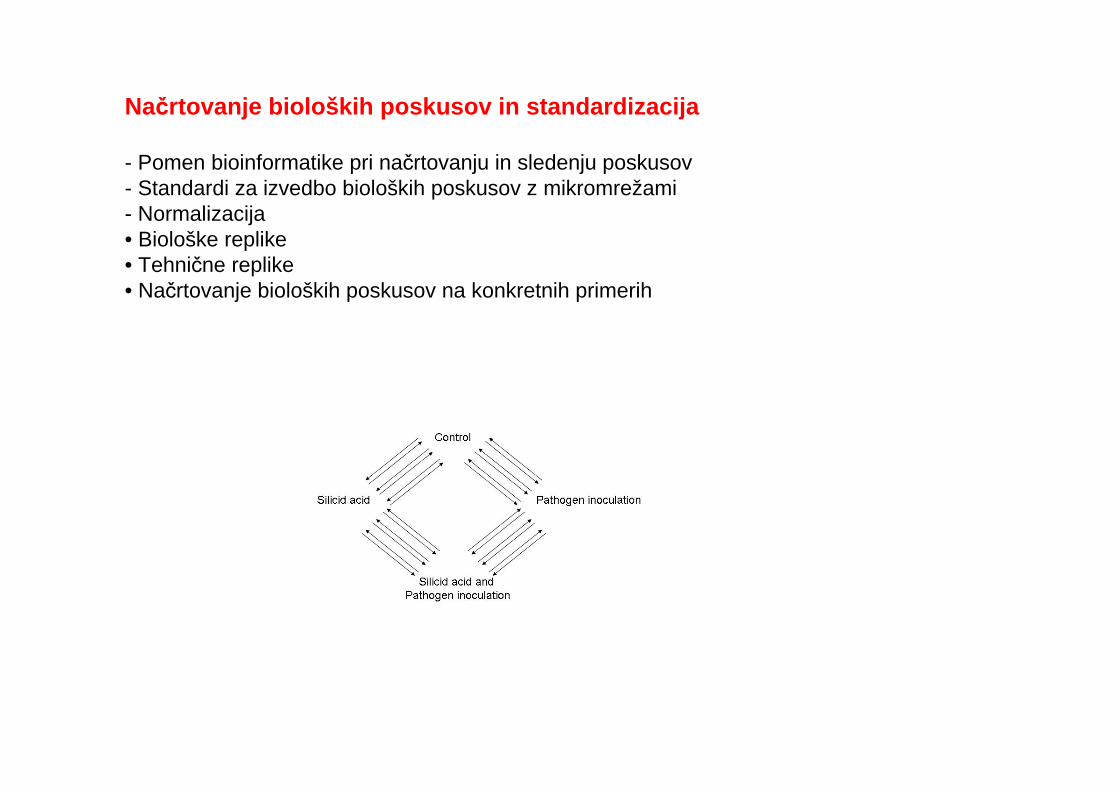
Načrtovanje bioloških poskusov in standardizacija
- Pomen bioinformatike pri načrtovanju in sledenju poskusov- Standardi za izvedbo bioloških poskusov z mikromrežami- Normalizacija• Biološke replike• Tehnične replike• Načrtovanje bioloških poskusov na konkretnih primerih
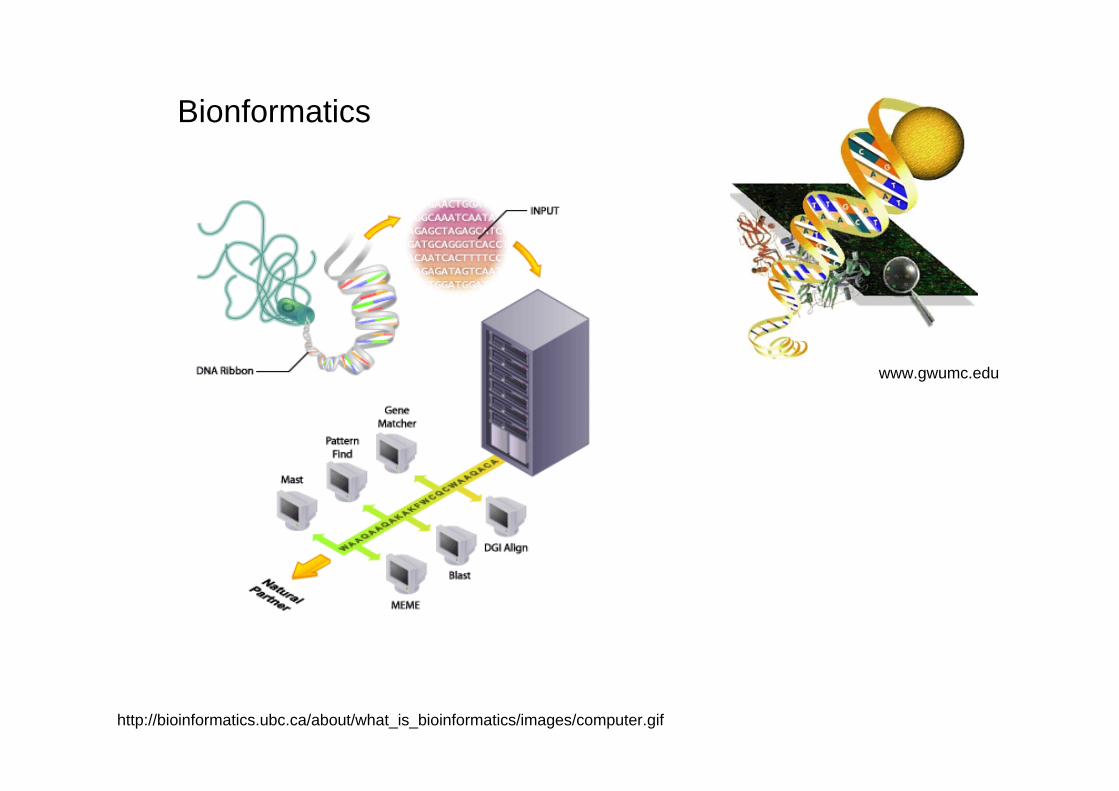
Bionformatics
http://bioinformatics.ubc.ca/about/what_is_bioinformatics/images/computer.gif
www.gwumc.edu
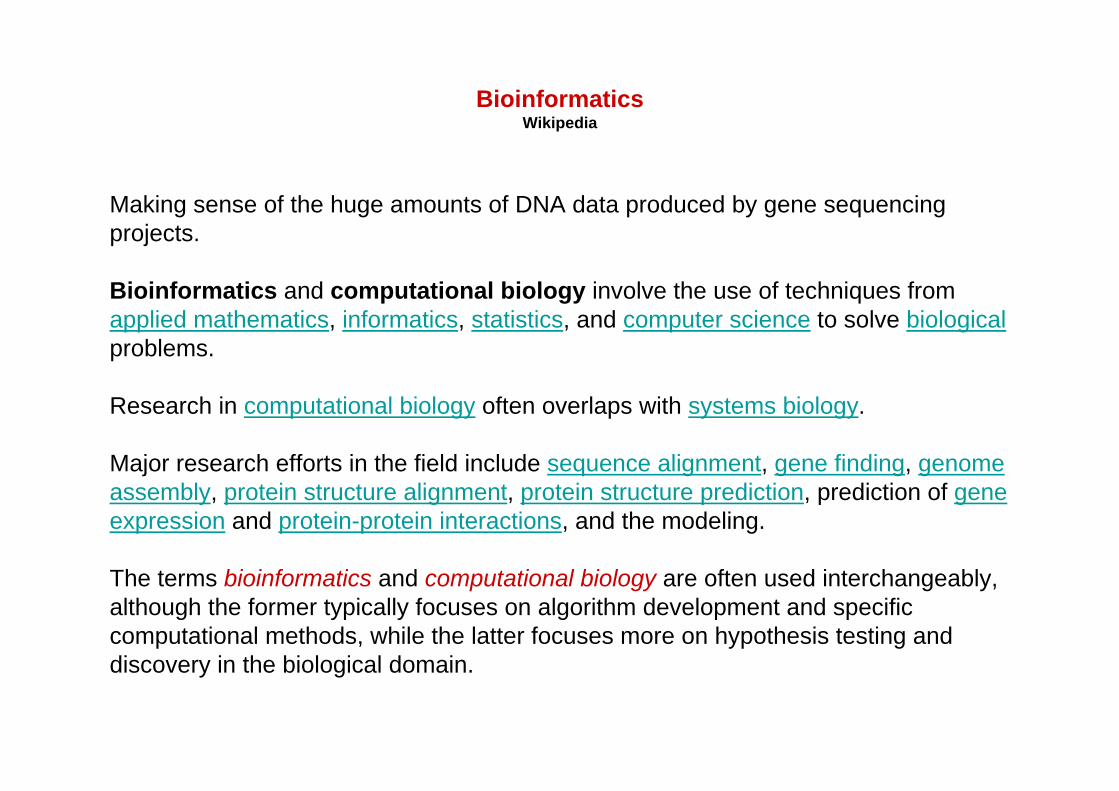
BioinformaticsWikipedia
Making sense of the huge amounts of DNA data produced by gene sequencing projects.
Bioinformatics and computational biology involve the use of techniques from applied mathematics, informatics, statistics, and computer science to solve biologicalproblems.
Research in computational biology often overlaps with systems biology.
Major research efforts in the field include sequence alignment, gene finding, genome assembly, protein structure alignment, protein structure prediction, prediction of gene expression and protein-protein interactions, and the modeling.
The terms bioinformatics and computational biology are often used interchangeably, although the former typically focuses on algorithm development and specific computational methods, while the latter focuses more on hypothesis testing and discovery in the biological domain.
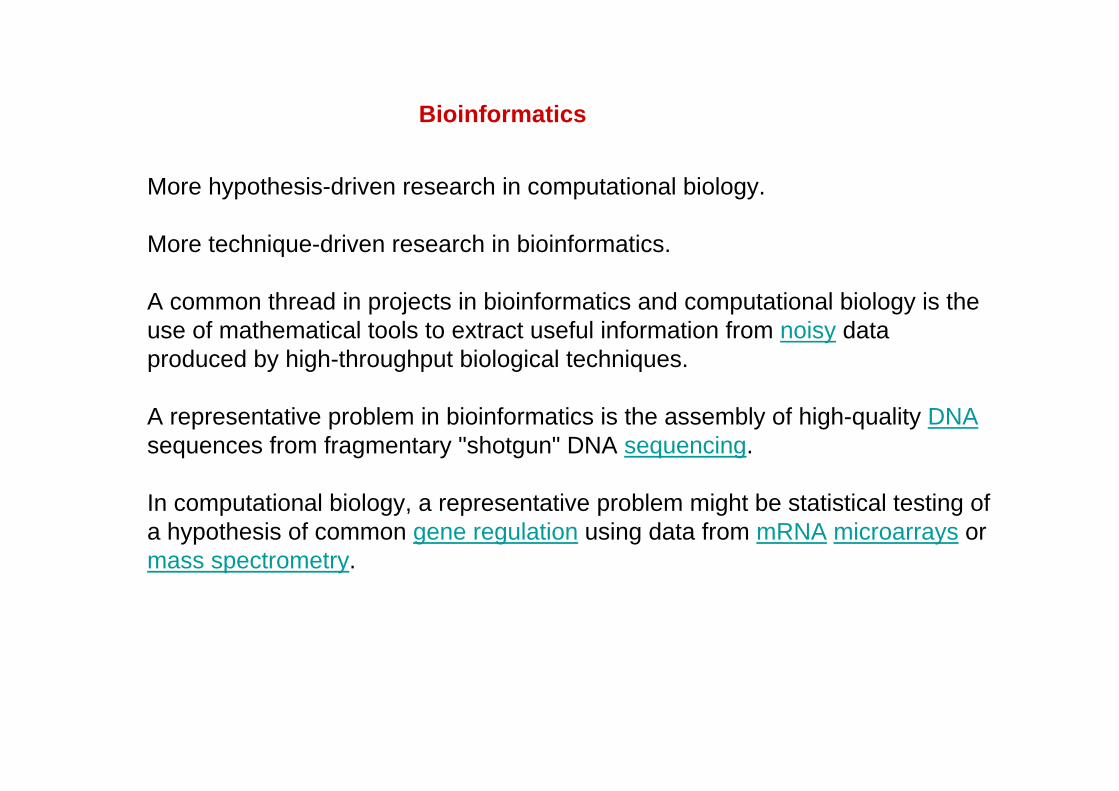
More hypothesis-driven research in computational biology.
More technique-driven research in bioinformatics.
A common thread in projects in bioinformatics and computational biology is the use of mathematical tools to extract useful information from noisy data produced by high-throughput biological techniques.
A representative problem in bioinformatics is the assembly of high-quality DNAsequences from fragmentary "shotgun" DNA sequencing.
In computational biology, a representative problem might be statistical testing of a hypothesis of common gene regulation using data from mRNA microarrays or mass spectrometry.
Bioinformatics
Microarrays and bioinformatics
StandardizationThe lack of standardization in arrays presents an interoperability problem in bioinformatics, which hinders the exchange of array data.
Various projects are attempting to facilitate the exchange and analysis of data produced with non-proprietary chips.
The "Minimum Information About a Microarray Experiment" (MIAME) XML based standard for describing a microarray experiment is being adopted by many journals as a requirement for the submission of papers incorporating microarray results.
http://www.mged.org/Workgroups/MIAME/miame.html
Experiment Design:
The goal of the experiment – one line maximum (e.g., the title from the related publication)
A brief description of the experiment (e.g., the abstract from the related publication)
Keywords, for example, time course, cell type comparison, array CGH (the use of MGED ontology terms is recommended).
Experimental factors - the parameters or conditions tested, such as time, dose, or genetic variation (the use of MGED ontology terms is recommended).
Experimental design - relationships between samples, treatments, extracts, labeling, and arrays (e.g., a diagram or table).
Quality control steps taken (e.g., replicates or dye swaps).
Links to the publication, any supplemental websites or database accession numbers.
MIAME – I.
Samples used, extract preparation and labeling:
The origin of each biological sample (e.g., name of the organism, the provider of the sample) and its characteristics (e.g., gender, age, developmental stage, strain, or disease state).
Manipulation of biological samples and protocols used (e.g., growth conditions, treatments, separation techniques).
Experimental factor value for each experimental factor, for each sample (e.g., ‘time = 30 min' for a sample in a time course experiment).
Technical protocols for preparing the hybridization extract (e.g., the RNA or DNA extraction and purification protocol), and labeling.
External controls (spikes), if used.
MIAME – II.
Hybridization procedures and parameters:
The protocol and conditions used for hybridization, blocking and washing, including any post-processing steps such as staining.
Measurement data and specifications:
The raw data, i.e. scanner or imager and feature extraction output (providing the images is optional). The data should be related to the respective array designs (typically each row of the imager output should be related to a feature on the array – see Array Designs).
The normalized and summarized data, i.e., set of quantifications from several arrays upon which the authors base their conclusions (for gene expression experiments also known as gene expression data matrix and may consist of averaged normalized log ratios). The data should be related to the respective array designs (typically each row of the summarized data will be related to one biological annotation, such as a gene name).
Data extraction and processing protocols.
Image scanning hardware and software, and processing procedures and parameters.
Normalization, transformation and data selection procedures and parameters.
MIAME – III.
Statistical analysis
The analysis of DNA microarrays poses a large number of statistical problems, including the normalisation of the data.
From a hypothesis-testing perspective, the large number of genes present on a single array means that the experimenter must take into account a multiple testing problem: even if each gene is extremely unlikely to randomly yield a result of interest, the combination of all the genes is likely to show at least one or a few occurrences of this result which are false positives.
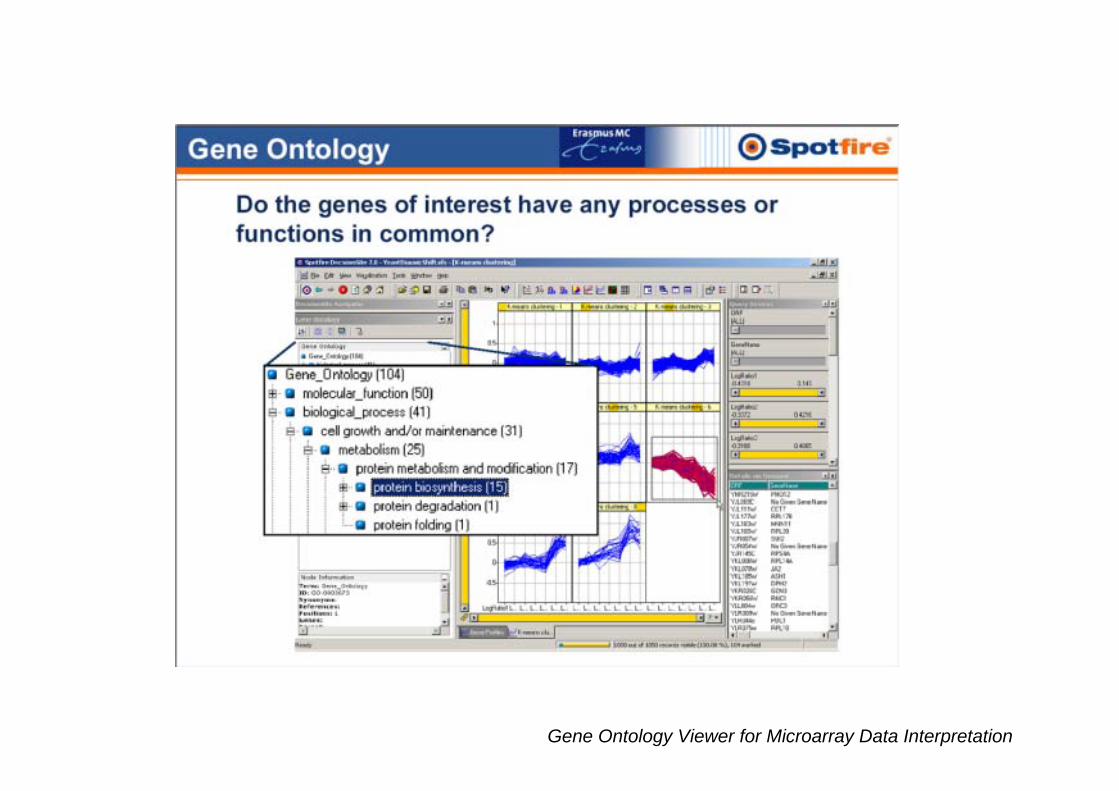
Gene Ontology Viewer for Microarray Data Interpretation
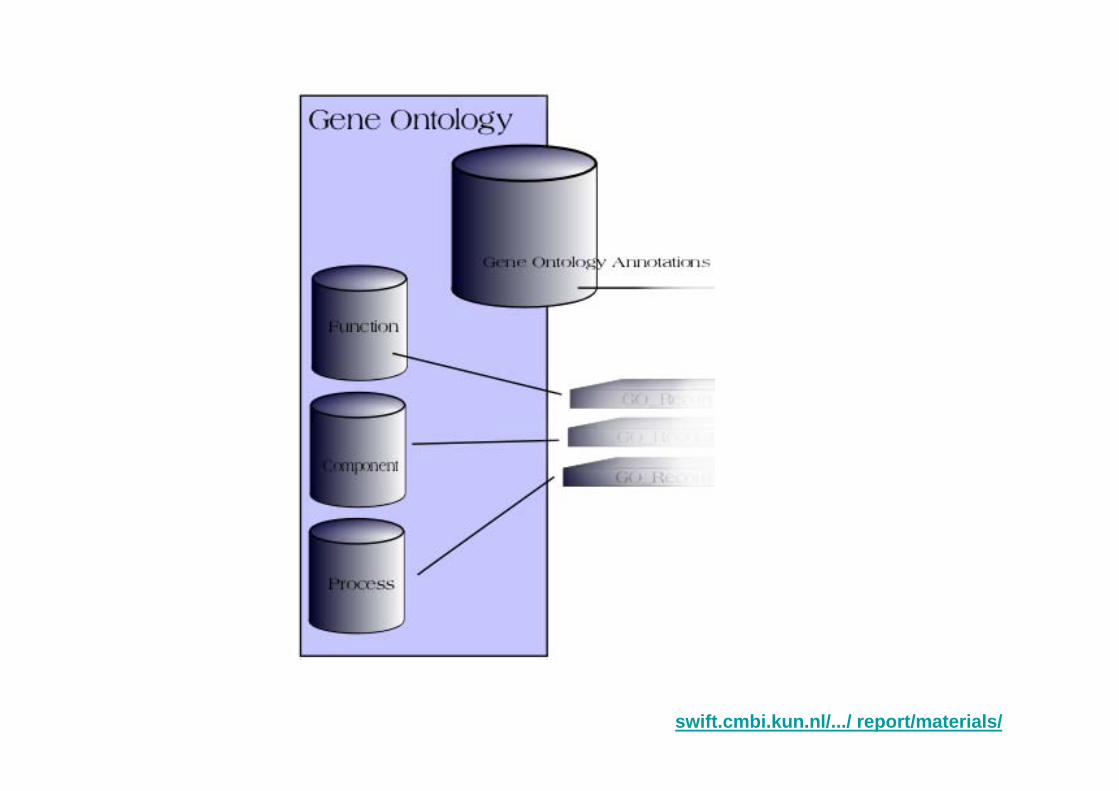
swift.cmbi.kun.nl/.../ report/materials/
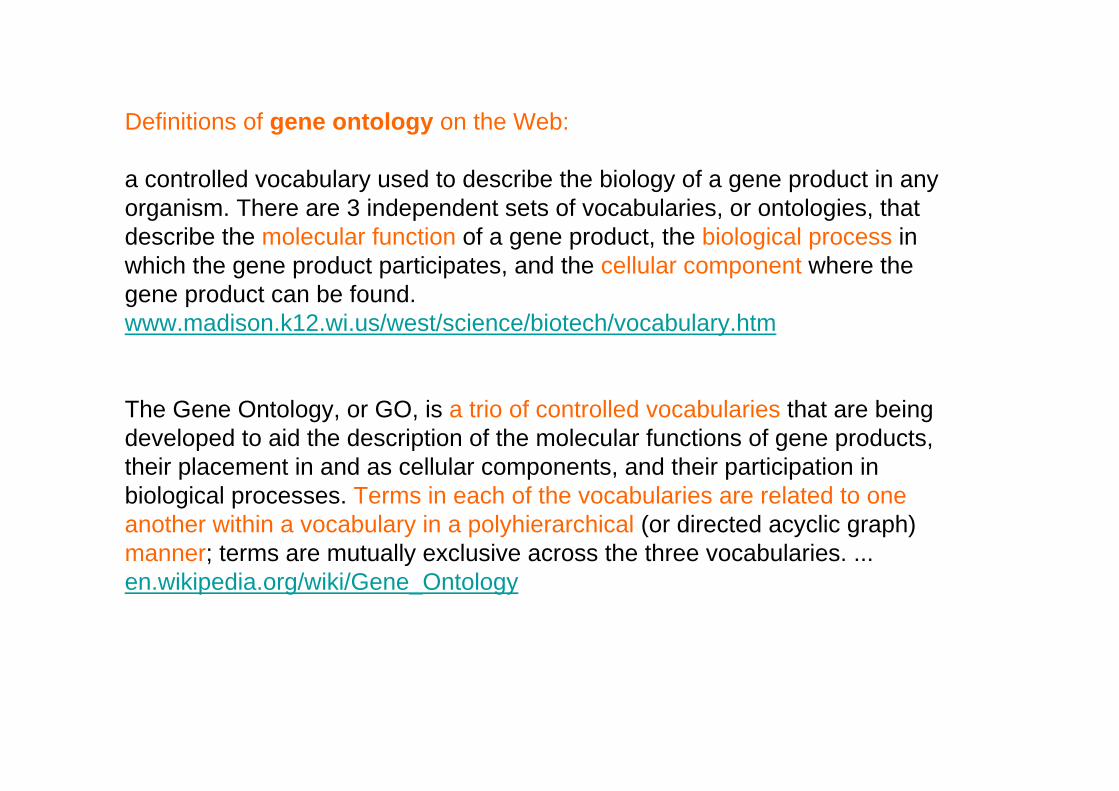
Definitions of gene ontology on the Web:
a controlled vocabulary used to describe the biology of a gene product in any organism. There are 3 independent sets of vocabularies, or ontologies, that describe the molecular function of a gene product, the biological process in which the gene product participates, and the cellular component where the gene product can be found.www.madison.k12.wi.us/west/science/biotech/vocabulary.htm
The Gene Ontology, or GO, is a trio of controlled vocabularies that are being developed to aid the description of the molecular functions of gene products, their placement in and as cellular components, and their participation in biological processes. Terms in each of the vocabularies are related to one another within a vocabulary in a polyhierarchical (or directed acyclic graph) manner; terms are mutually exclusive across the three vocabularies. ...en.wikipedia.org/wiki/Gene_Ontology
Gene Ontology
The adoption of common standards and ontologies for the management and sharing of microarray and/or mass spectrometry data is essential.
The Global Open Biological Ontologies GOBO effort, which has grown from work by the Gene Ontology Consortium, is seeking to collect ontologies for the domains of genomics and proteomics. Together with Spotfire the ErasmusMC bioinformatics group works on the improvement and further development of a GO tool that runs in the portal environment of the Spotfiredecision site product for functional genomics and proteomics applications.
The wealth of biological data that will be generated using high-throughput technologies from different modalities in the next decade has yet to be realized, as has the enormous potential for discoveries.
www.erasmusmc.nl/.../ research/gocp.shtml
KEGG: Kyoto Encyclopedia of Genes and Genomes
A grand challenge in the post-genomic era is a complete computer representation of the cell, the organism, and the biosphere, which will enable computational prediction of higher-level complexity of cellular processes and organism behaviors from genomic and molecular information. Towards this end we have been developing a bioinformatics resource named KEGG as part of the research projects of the Kanehisa Laboratories in the Bioinformatics Center of Kyoto University and the Human Genome Center of the University of Tokyo.
http://www.genome.jp/kegg/pathway.html
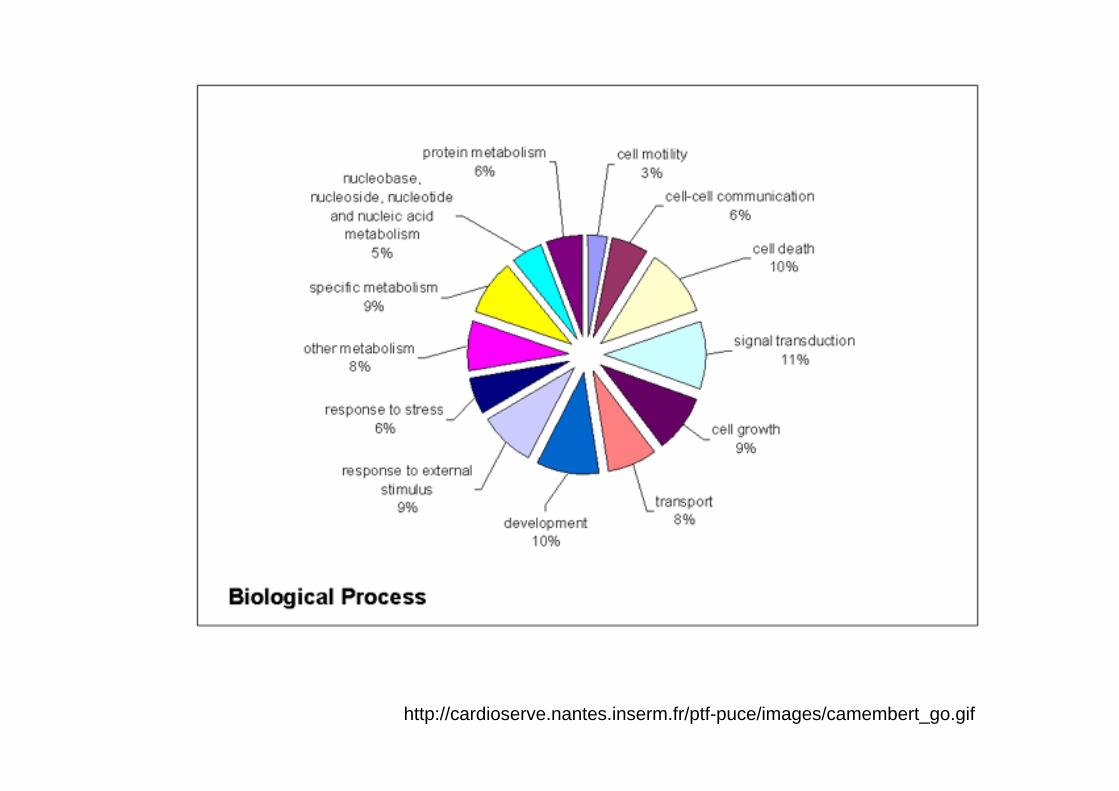
http://cardioserve.nantes.inserm.fr/ptf-puce/images/camembert_go.gif

irfgc.irri.org/cropbioportal/index.php?option...
Steps in microarray technology
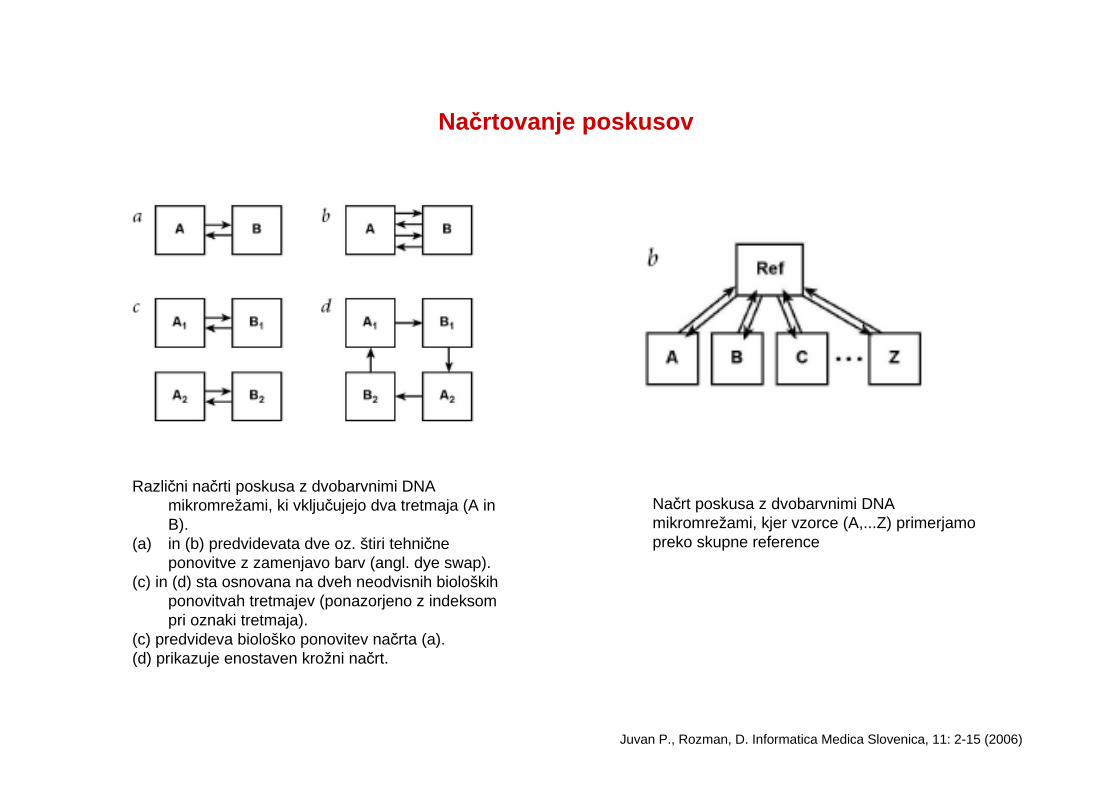
Načrtovanje poskusov
Različni načrti poskusa z dvobarvnimi DNA mikromrežami, ki vključujejo dva tretmaja (A in B).
(a) in (b) predvidevata dve oz. štiri tehnične ponovitve z zamenjavo barv (angl. dye swap).
(c) in (d) sta osnovana na dveh neodvisnih bioloških ponovitvah tretmajev (ponazorjeno z indeksom pri oznaki tretmaja).
(c) predvideva biološko ponovitev načrta (a). (d) prikazuje enostaven krožni načrt.
Juvan P., Rozman, D. Informatica Medica Slovenica, 11: 2-15 (2006)
Načrt poskusa z dvobarvnimi DNA mikromrežami, kjer vzorce (A,...Z) primerjamo preko skupne reference
Experimental design
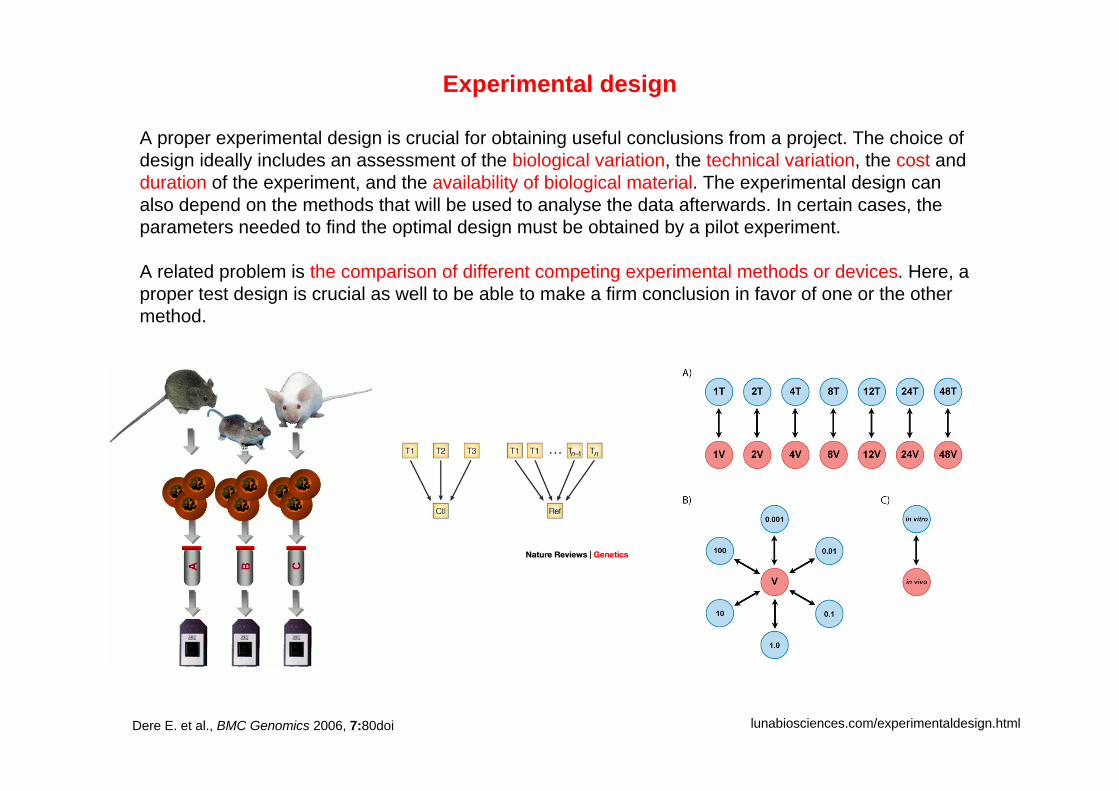
A proper experimental design is crucial for obtaining useful conclusions from a project. The choice of design ideally includes an assessment of the biological variation, the technical variation, the cost and duration of the experiment, and the availability of biological material. The experimental design can also depend on the methods that will be used to analyse the data afterwards. In certain cases, the parameters needed to find the optimal design must be obtained by a pilot experiment.
A related problem is the comparison of different competing experimental methods or devices. Here, a proper test design is crucial as well to be able to make a firm conclusion in favor of one or the other method.
lunabiosciences.com/experimentaldesign.htmlDere E. et al., BMC Genomics 2006, 7:80doi
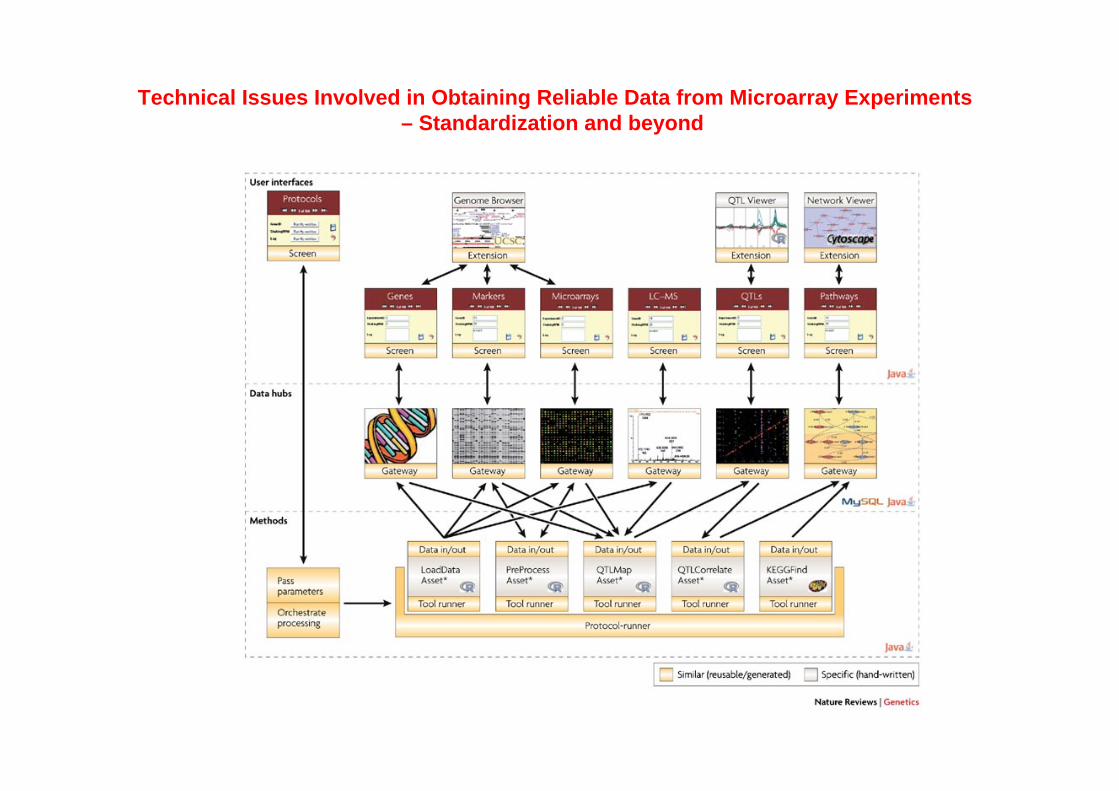
Technical Issues Involved in Obtaining Reliable Data from Microarray Experiments – Standardization and beyond
Wang Q.-Z et al., Appl Microbiol Biotechnol (2006) 70: 151–161
T. Rezen et al., BMC Genomics 2008, 9:76
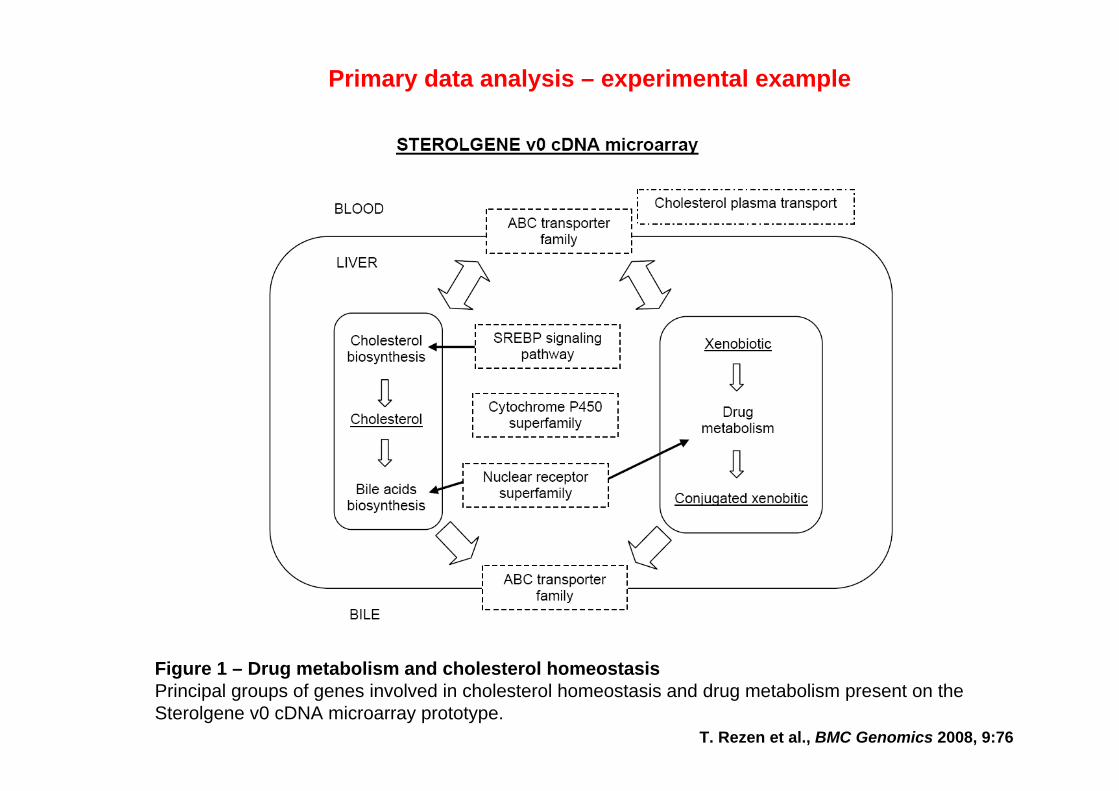
Figure 1 – Drug metabolism and cholesterol homeostasisPrincipal groups of genes involved in cholesterol homeostasis and drug metabolism present on the Sterolgene v0 cDNA microarray prototype.
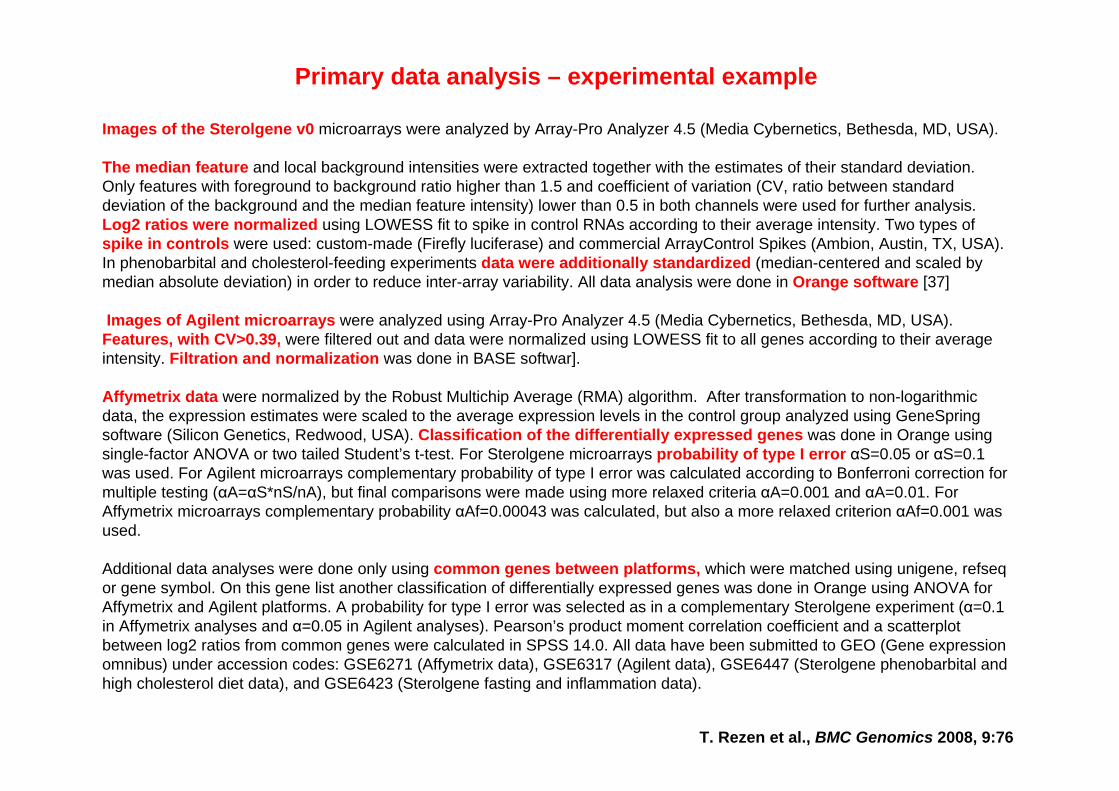
Primary data analysis – experimental example
Primary data analysis – experimental example
Images of the Sterolgene v0 microarrays were analyzed by Array-Pro Analyzer 4.5 (Media Cybernetics, Bethesda, MD, USA).
The median feature and local background intensities were extracted together with the estimates of their standard deviation. Only features with foreground to background ratio higher than 1.5 and coefficient of variation (CV, ratio between standard deviation of the background and the median feature intensity) lower than 0.5 in both channels were used for further analysis.Log2 ratios were normalized using LOWESS fit to spike in control RNAs according to their average intensity. Two types of spike in controls were used: custom-made (Firefly luciferase) and commercial ArrayControl Spikes (Ambion, Austin, TX, USA). In phenobarbital and cholesterol-feeding experiments data were additionally standardized (median-centered and scaled by median absolute deviation) in order to reduce inter-array variability. All data analysis were done in Orange software [37]
Images of Agilent microarrays were analyzed using Array-Pro Analyzer 4.5 (Media Cybernetics, Bethesda, MD, USA). Features, with CV>0.39, were filtered out and data were normalized using LOWESS fit to all genes according to their average intensity. Filtration and normalization was done in BASE softwar].
Affymetrix data were normalized by the Robust Multichip Average (RMA) algorithm. After transformation to non-logarithmic data, the expression estimates were scaled to the average expression levels in the control group analyzed using GeneSpringsoftware (Silicon Genetics, Redwood, USA). Classification of the differentially expressed genes was done in Orange using single-factor ANOVA or two tailed Student’s t-test. For Sterolgene microarrays probability of type I error αS=0.05 or αS=0.1 was used. For Agilent microarrays complementary probability of type I error was calculated according to Bonferroni correction for multiple testing (αA=αS*nS/nA), but final comparisons were made using more relaxed criteria αA=0.001 and αA=0.01. For Affymetrix microarrays complementary probability αAf=0.00043 was calculated, but also a more relaxed criterion αAf=0.001 was used.
Additional data analyses were done only using common genes between platforms, which were matched using unigene, refseqor gene symbol. On this gene list another classification of differentially expressed genes was done in Orange using ANOVA for Affymetrix and Agilent platforms. A probability for type I error was selected as in a complementary Sterolgene experiment (α=0.1 in Affymetrix analyses and α=0.05 in Agilent analyses). Pearson’s product moment correlation coefficient and a scatterplotbetween log2 ratios from common genes were calculated in SPSS 14.0. All data have been submitted to GEO (Gene expression omnibus) under accession codes: GSE6271 (Affymetrix data), GSE6317 (Agilent data), GSE6447 (Sterolgene phenobarbital and high cholesterol diet data), and GSE6423 (Sterolgene fasting and inflammation data).
T. Rezen et al., BMC Genomics 2008, 9:76
Sterolgene
4
1
11
Agilent Sterolgene
3
1
2
Agilent
Sterolgene
17
4
11
Affymetrix Sterolgene
36
6
9
Affymetrix
A B
C D
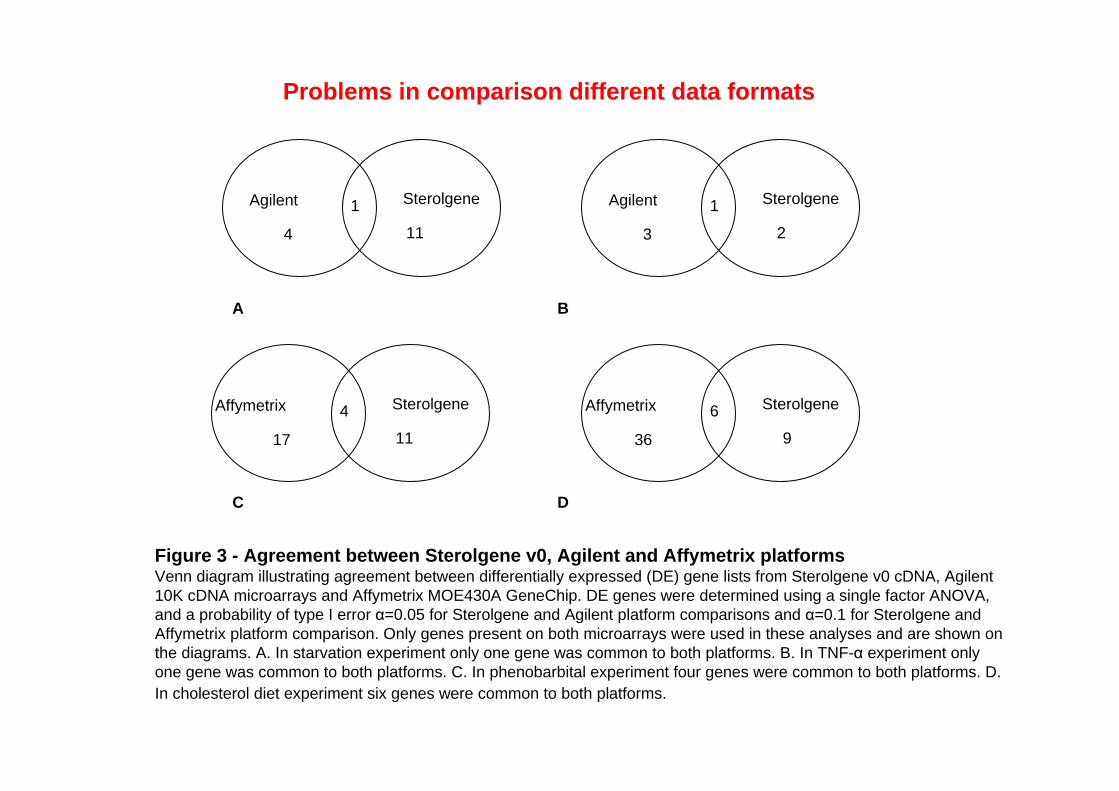
Figure 3 - Agreement between Sterolgene v0, Agilent and Affymetrix platformsVenn diagram illustrating agreement between differentially expressed (DE) gene lists from Sterolgene v0 cDNA, Agilent 10K cDNA microarrays and Affymetrix MOE430A GeneChip. DE genes were determined using a single factor ANOVA, and a probability of type I error α=0.05 for Sterolgene and Agilent platform comparisons and α=0.1 for Sterolgene and Affymetrix platform comparison. Only genes present on both microarrays were used in these analyses and are shown on the diagrams. A. In starvation experiment only one gene was common to both platforms. B. In TNF-α experiment only one gene was common to both platforms. C. In phenobarbital experiment four genes were common to both platforms. D. In cholesterol diet experiment six genes were common to both platforms.
Problems in comparison different data formats
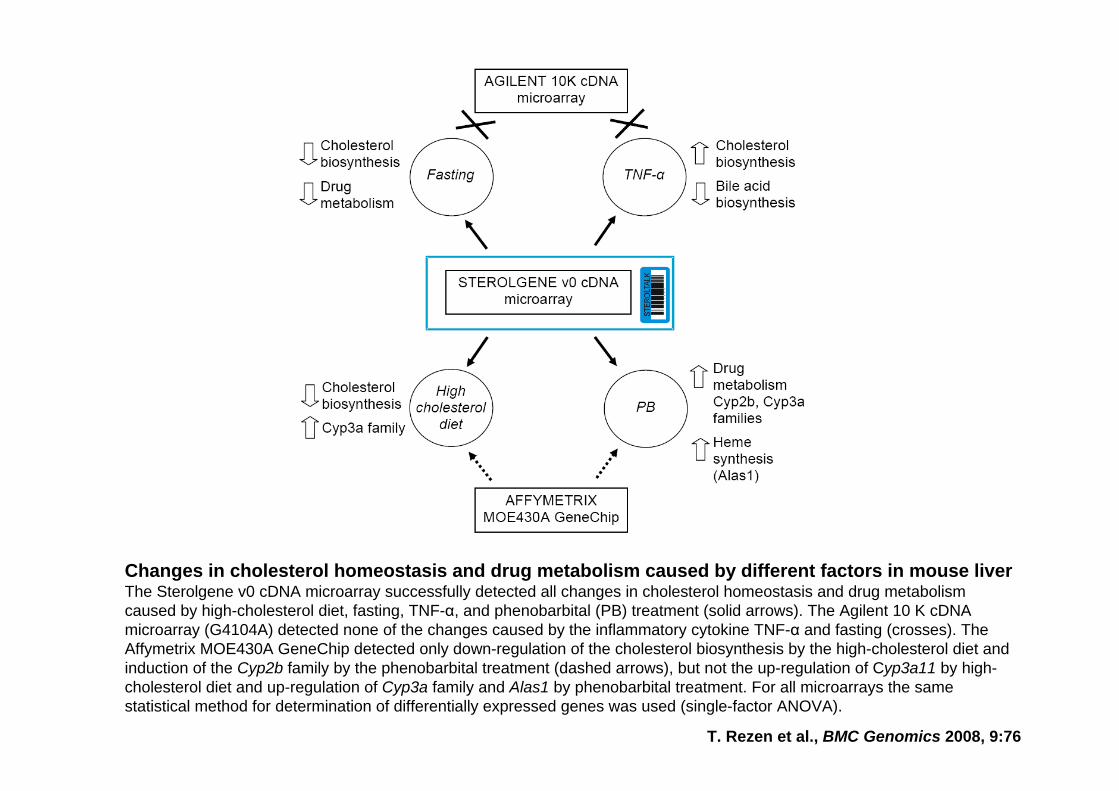
T. Rezen et al., BMC Genomics 2008, 9:76
Changes in cholesterol homeostasis and drug metabolism caused by different factors in mouse liverThe Sterolgene v0 cDNA microarray successfully detected all changes in cholesterol homeostasis and drug metabolism caused by high-cholesterol diet, fasting, TNF-α, and phenobarbital (PB) treatment (solid arrows). The Agilent 10 K cDNAmicroarray (G4104A) detected none of the changes caused by the inflammatory cytokine TNF-α and fasting (crosses). The Affymetrix MOE430A GeneChip detected only down-regulation of the cholesterol biosynthesis by the high-cholesterol diet and induction of the Cyp2b family by the phenobarbital treatment (dashed arrows), but not the up-regulation of Cyp3a11 by high-cholesterol diet and up-regulation of Cyp3a family and Alas1 by phenobarbital treatment. For all microarrays the same statistical method for determination of differentially expressed genes was used (single-factor ANOVA).
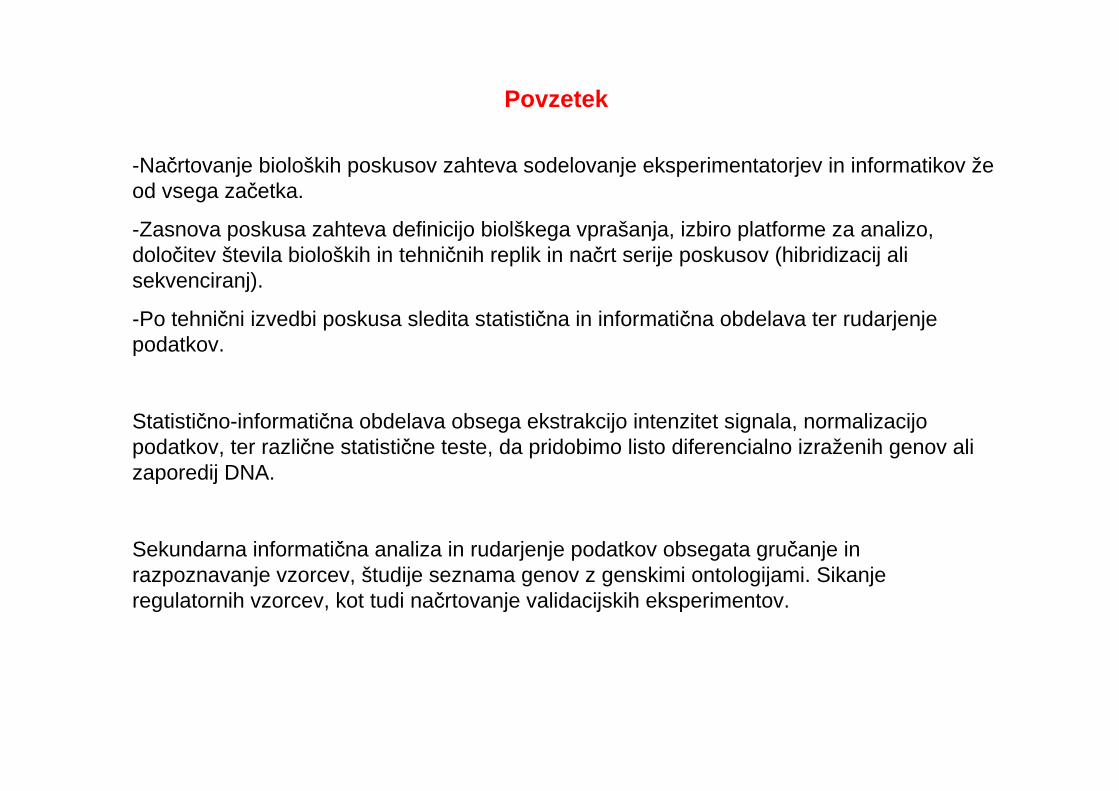
Povzetek
-Načrtovanje bioloških poskusov zahteva sodelovanje eksperimentatorjev in informatikov žeod vsega začetka.
-Zasnova poskusa zahteva definicijo biolškega vprašanja, izbiro platforme za analizo, določitev števila bioloških in tehničnih replik in načrt serije poskusov (hibridizacij ali sekvenciranj).
-Po tehnični izvedbi poskusa sledita statistična in informatična obdelava ter rudarjenjepodatkov.
Statistično-informatična obdelava obsega ekstrakcijo intenzitet signala, normalizacijopodatkov, ter različne statistične teste, da pridobimo listo diferencialno izraženih genov ali zaporedij DNA.
Sekundarna informatična analiza in rudarjenje podatkov obsegata gručanje in razpoznavanje vzorcev, študije seznama genov z genskimi ontologijami. Sikanjeregulatornih vzorcev, kot tudi načrtovanje validacijskih eksperimentov.
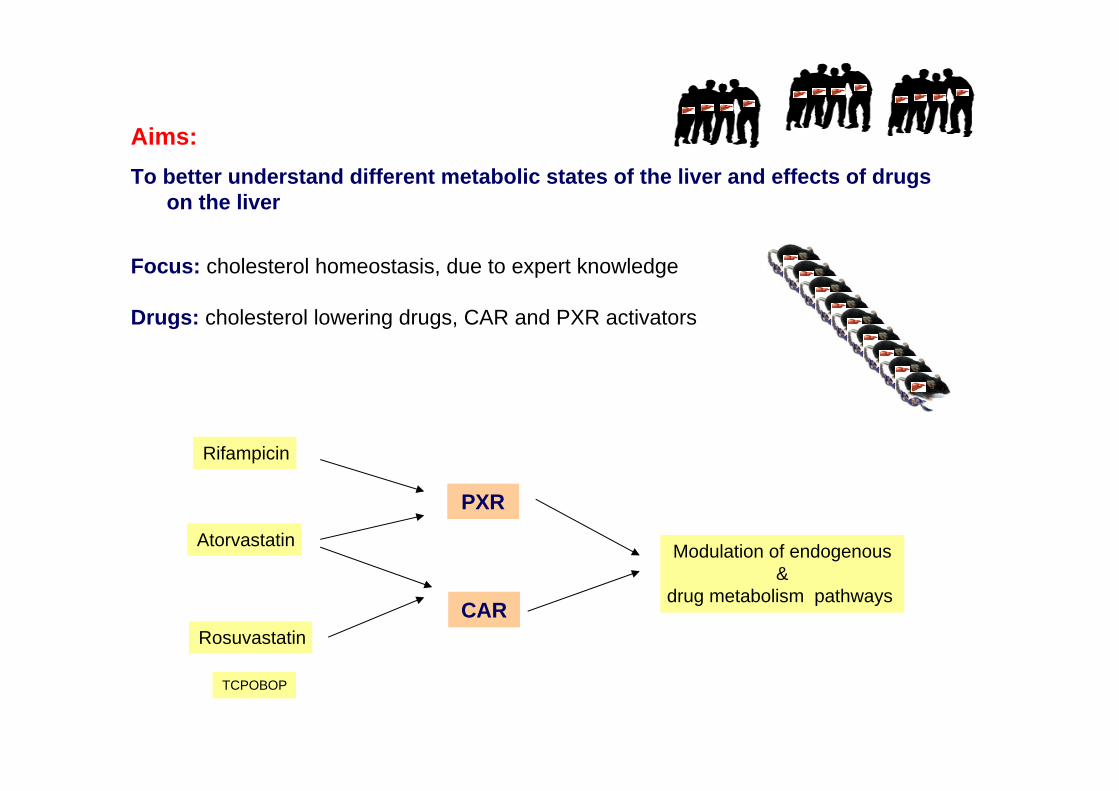
Aims: To better understand different metabolic states of the liver and effects of drugs
on the liver
Focus: cholesterol homeostasis, due to expert knowledge
Drugs: cholesterol lowering drugs, CAR and PXR activators
PXR
Rifampicin
Modulation of endogenous&
drug metabolism pathways CAR
Atorvastatin
Rosuvastatin
TCPOBOP
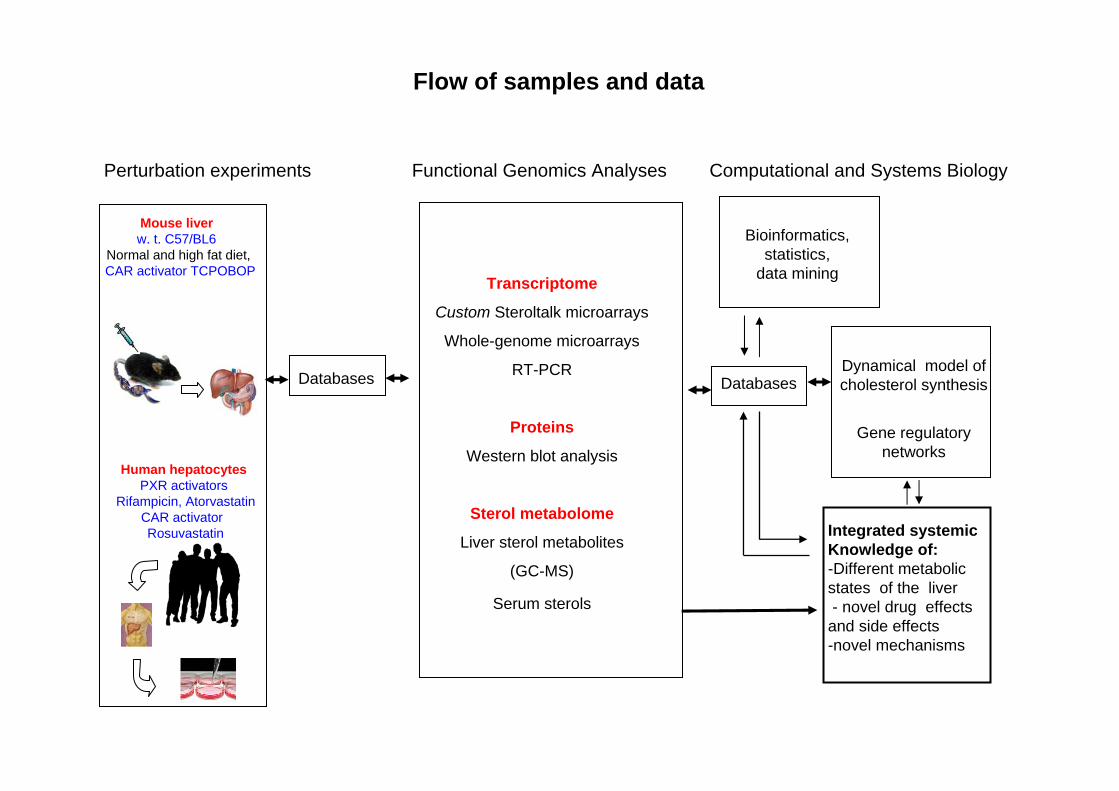
Flow of samples and data
Dynamical model of cholesterol synthesis
Gene regulatorynetworks
Transcriptome
Custom Steroltalk microarrays
Whole-genome microarrays
RT-PCR
Proteins
Western blot analysis
Sterol metabolome
Liver sterol metabolites
(GC-MS)
Serum sterols
Perturbation experiments Functional Genomics Analyses Computational and Systems Biology
Databases
Human hepatocytesPXR activators
Rifampicin, AtorvastatinCAR activatorRosuvastatin
Mouse liverw. t. C57/BL6
Normal and high fat diet,CAR activator TCPOBOP
Databases
Integrated systemicKnowledge of:-Different metabolic states of the liver- novel drug effects
and side effects-novel mechanisms
Bioinformatics, statistics,
data mining
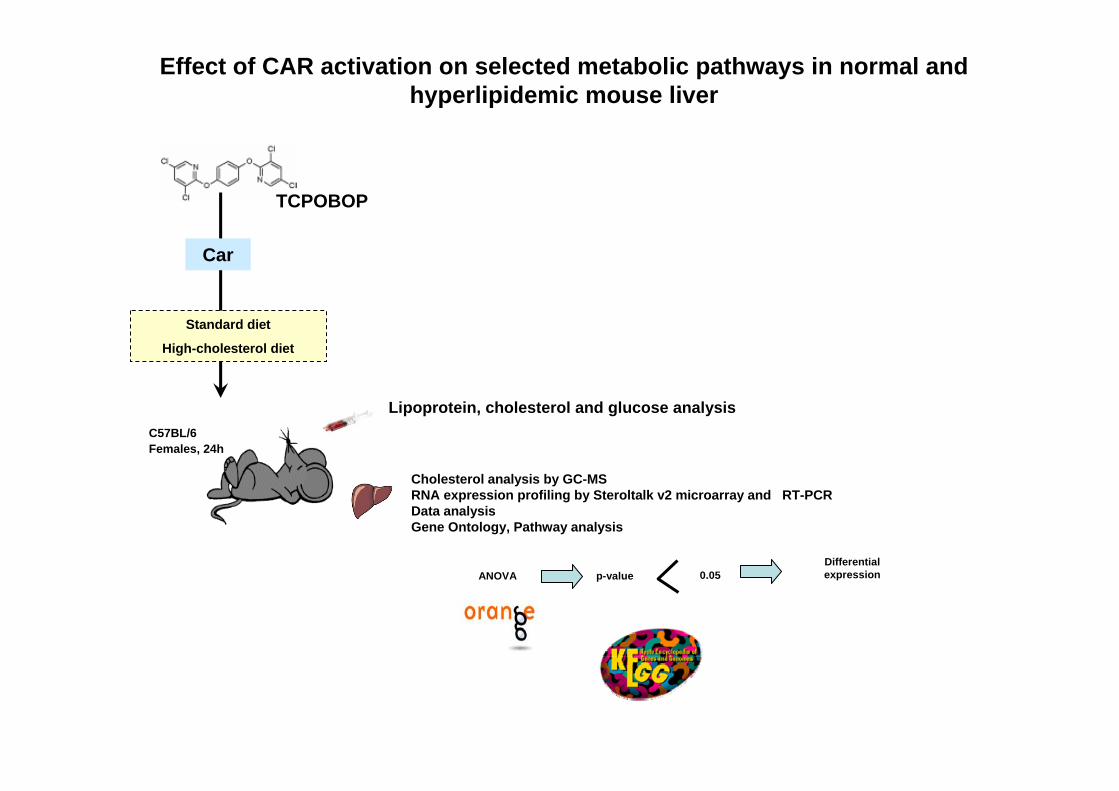
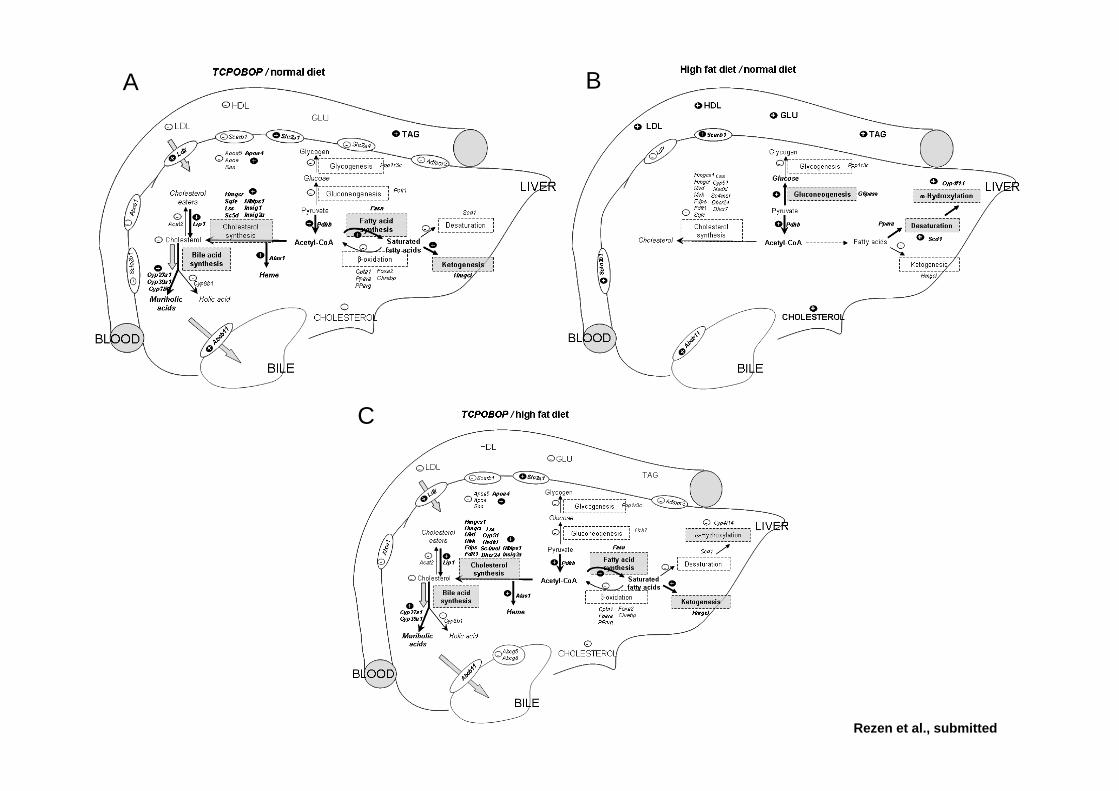
Effect of CAR activation on selected metabolic pathways in normal and hyperlipidemic mouse liver
TCPOBOP
Car
C57BL/6Females, 24h
Standard diet
High-cholesterol diet
Cholesterol analysis by GC-MSRNA expression profiling by Steroltalk v2 microarray and RT-PCRData analysis Gene Ontology, Pathway analysis
ANOVA p-value 0.05Differential expression
Lipoprotein, cholesterol and glucose analysis
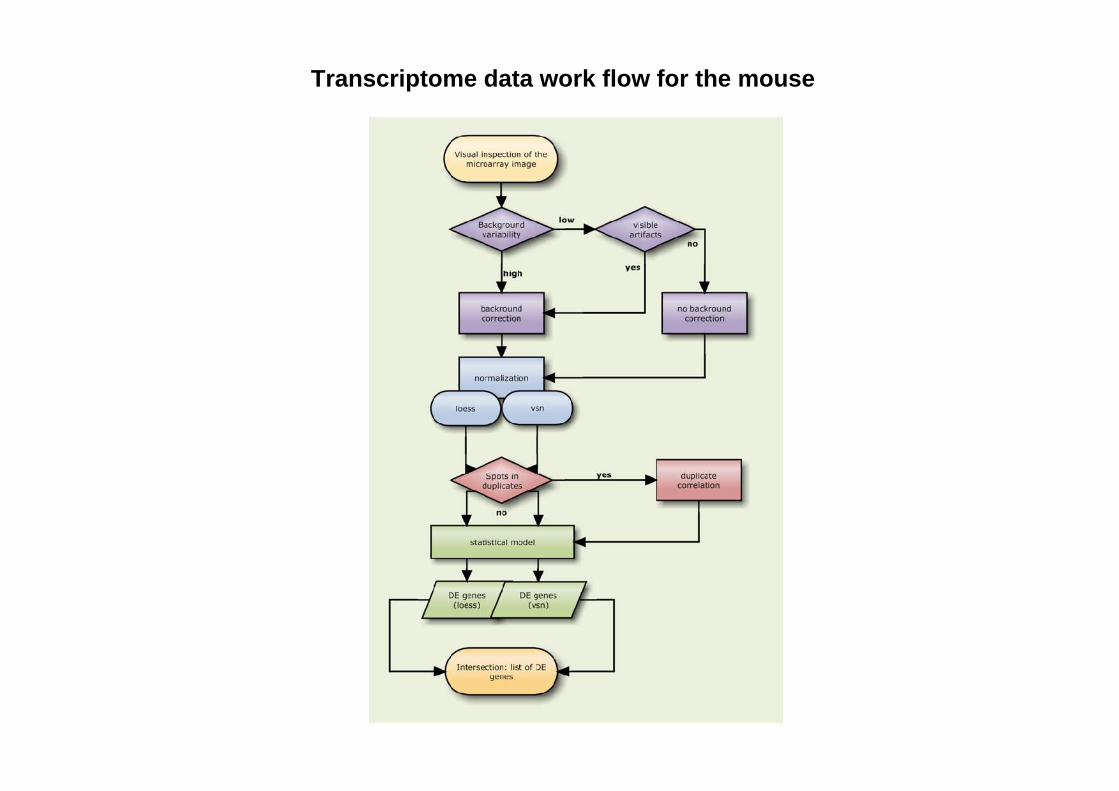
Transcriptome data work flow for the mouse
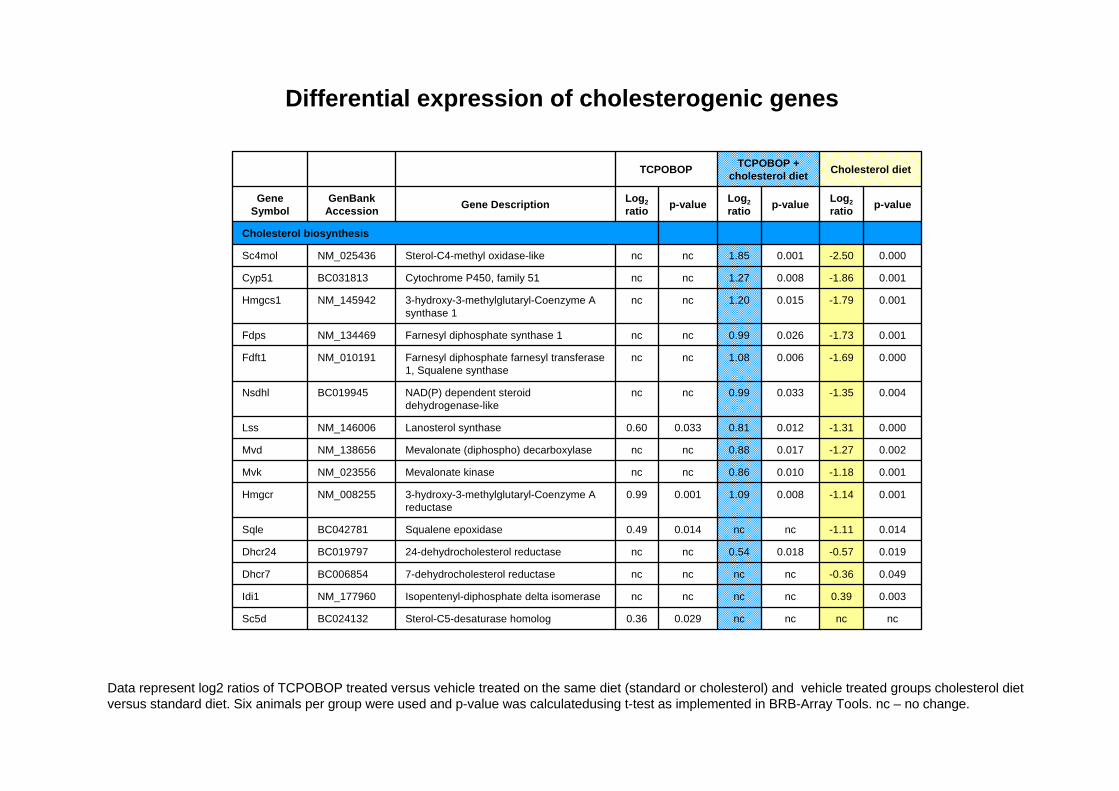
Differential expression of cholesterogenic genes
Data represent log2 ratios of TCPOBOP treated versus vehicle treated on the same diet (standard or cholesterol) and vehicle treated groups cholesterol diet versus standard diet. Six animals per group were used and p-value was calculatedusing t-test as implemented in BRB-Array Tools. nc – no change.
ncncncnc0.0290.36Sterol-C5-desaturase homologBC024132Sc5d
0.0030.39ncncncncIsopentenyl-diphosphate delta isomeraseNM_177960Idi1
0.049-0.36ncncncnc7-dehydrocholesterol reductaseBC006854Dhcr7
0.019-0.570.0180.54ncnc24-dehydrocholesterol reductaseBC019797Dhcr24
0.014-1.11ncnc0.0140.49Squalene epoxidaseBC042781Sqle
0.001-1.140.0081.090.0010.993-hydroxy-3-methylglutaryl-Coenzyme A reductase
NM_008255Hmgcr
0.001-1.180.0100.86ncncMevalonate kinaseNM_023556Mvk
0.002-1.270.0170.88ncncMevalonate (diphospho) decarboxylaseNM_138656Mvd
0.000-1.310.0120.810.0330.60Lanosterol synthaseNM_146006Lss
0.004-1.350.0330.99ncncNAD(P) dependent steroid dehydrogenase-like
BC019945Nsdhl
0.000-1.690.0061.08ncncFarnesyl diphosphate farnesyl transferase1, Squalene synthase
NM_010191Fdft1
0.001-1.730.0260.99ncncFarnesyl diphosphate synthase 1NM_134469Fdps
0.001-1.790.0151.20ncnc3-hydroxy-3-methylglutaryl-Coenzyme A synthase 1
NM_145942Hmgcs1
0.001-1.860.0081.27ncncCytochrome P450, family 51BC031813Cyp51
0.000-2.500.0011.85ncncSterol-C4-methyl oxidase-likeNM_025436Sc4mol
Cholesterol biosynthesis
p-valueLog2ratiop-valueLog2
ratiop-valueLog2ratioGene DescriptionGenBank
AccessionGene
Symbol
Cholesterol dietTCPOBOP + cholesterol dietTCPOBOP
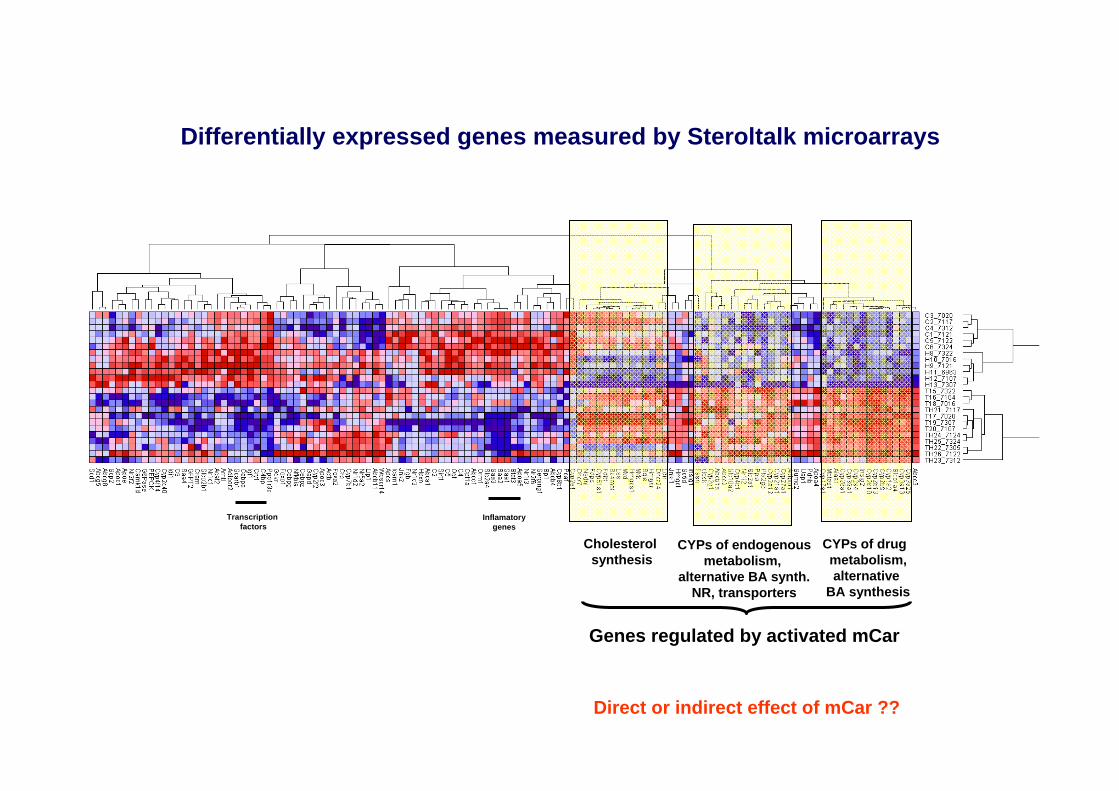
Differentially expressed genes measured by Steroltalk microarrays
Cholesterol synthesis
CYPs of drug metabolism,alternative
BA synthesis
CYPs of endogenousmetabolism,
alternative BA synth.NR, transporters
Genes regulated by activated mCar
Direct or indirect effect of mCar ??
Transcriptionfactors
Inflamatorygenes

No of genes
Genes
TCPOBOP in normal mouse liver Adipocytokine signaling pathway
10 Pck1, Adipor1, Ppara, Mapk9, Cpt1a, Slc2a1, Nfkbia, Stat3, Adipor2, Slc2a4
Metabolism of xenobiotics by cytochrome P450
8 Cyp1a2, Cyp2b13, Cyp2b10, Cyp2c40, Cyp2e1, Cyp2b9, Cyp3a25, Cyp3a13
PPAR signaling pathway 7 Pck1, Cyp8b1, Ppara, Apoa5, Cpt1, Cyp27a1, Pparg
ABC transporters - General 6 Abcc2, Abcb11, Abca1, Abcc1, Abcb4, Abcc3 Complement and coagulation cascade
6 Hc, C2, C4bp, Serping1, C9, Fgb
Insulin signaling pathway 5 Pck1, Fasn, Mapk9, Ppp1r3c, Slc2a4 Arachidonic acid metabolism
5 Cyp2b13, Cyp2b10, Cyp2c40, Cyp2e1, Cyp2b9
Linoleic acid metabolism 5 Cyp1a2, Cyp2c40, Cyp2e1, Cyp3a25, Cyp3a13 Biosynthesis of steroids 4 Lss, Sqle, Hmgcr, Sc5d Cholesterol diet Biosynthesis of steroids 13 Dhcr7, Lss, Mvk, Nsdhl, Idi1, Cyp51a1, Sqle,
Hmgcr, Mvd, Fdps, Fdft1, Dhcr24, Sc4mol Metabolism of xenobiotics by cytochrome P450
4 Cyp2f2, Cyp2c40, Cyp3a25, Cyp3a13
PPAR signaling pathway 4 Ppara, Scd1, Scp2, Apoc3 Terpenoid metabolism 4 Idi1, Sqle, Fdps, Fdft1 TCPOBOP in hyperlipidemic mouse liver Biosynthesis of steroids 10 Lss, Mvk, Nsdhl, Cyp51a1, Hmgcr, Mvd, Fdps,
Fdft1, Dhcr24, Sc4mol PPAR signaling pathway 7 Pck1, Cyp8b1, Ppara, Apoa5, Scd1, Cpt1,
Cyp27a1 Metabolism of xenobiotics by cytochrome P450
7 Cyp1a2, Cyp2b13, Cyp2b10, Cyp2c40, Cyp2b9, Cyp3a25, Cyp3a13
Adipocytokine signaling pathway
6 Pck1, Ppara, Cpt1, Slc2a1, Adipor2, Mapk8
Arachidonic acid metabolism
6 Cyp2b13, Cyp2b10, Cyp2c40, Cyp2b9, Cyp4f14
ABC transporters - General 5 Abcg5, Abcc2, Abca1, Abcc3, Abcg8 Linoleic acid metabolism 5 Pla2g6, Cyp1a2, Cyp2c40, Cyp3a25, Cyp3a13 Complement and coagulation cascade
5 C2, C4bp, Serping1, C9, Fgb
Butanoate metabolism 4 Hmgcl, Hmgcs1, Acat2, Pdhb
Gene annotation of differentially expressed genes by GeneCodissoftware and KEGG pathways -showing only pathways with at least 4 modulated genes. Down-regulated genes are underlined.
10.45±1.83#12.1±2.16*8.59±1.739.67±0.68Glucose (mmol/L)
1.15±0.251.39±0.43*0.82±0.12*0.54±0.1Total triglyceride (mmol/L)
1.46±0.371.76±0.39*0.81±0.18*1.03±0.05HDL-cholesterol (mmol/L)
0.34±0.09#0.68±0.06*0.12±0.02*0.33±0.05LDL-cholesterol (mmol/L)
2.67±0.61#4.09±0.80*1.91±0.21*3.21±1.52Total cholesterol (mmol/L)
1%cholesterol1%cholesterol-
StandardStandard-
DietTreatment
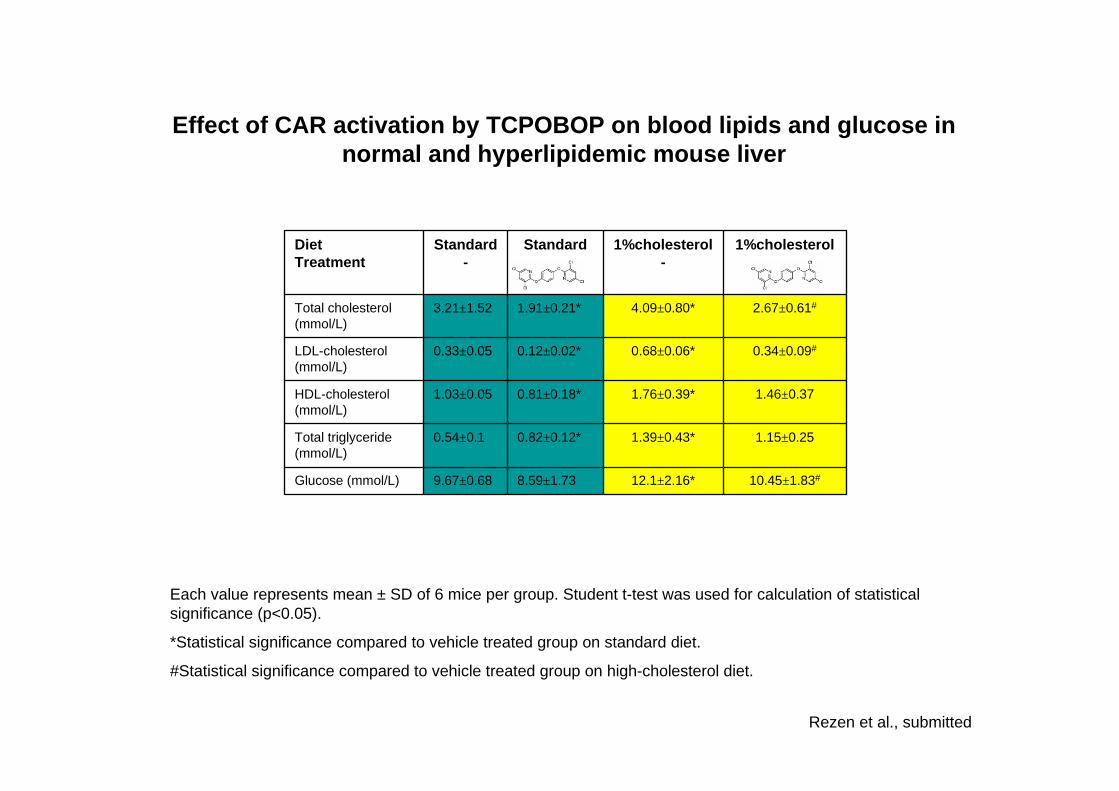
Each value represents mean ± SD of 6 mice per group. Student t-test was used for calculation of statistical significance (p<0.05).
*Statistical significance compared to vehicle treated group on standard diet.
#Statistical significance compared to vehicle treated group on high-cholesterol diet.
Rezen et al., submitted
Effect of CAR activation by TCPOBOP on blood lipids and glucose in normal and hyperlipidemic mouse liver
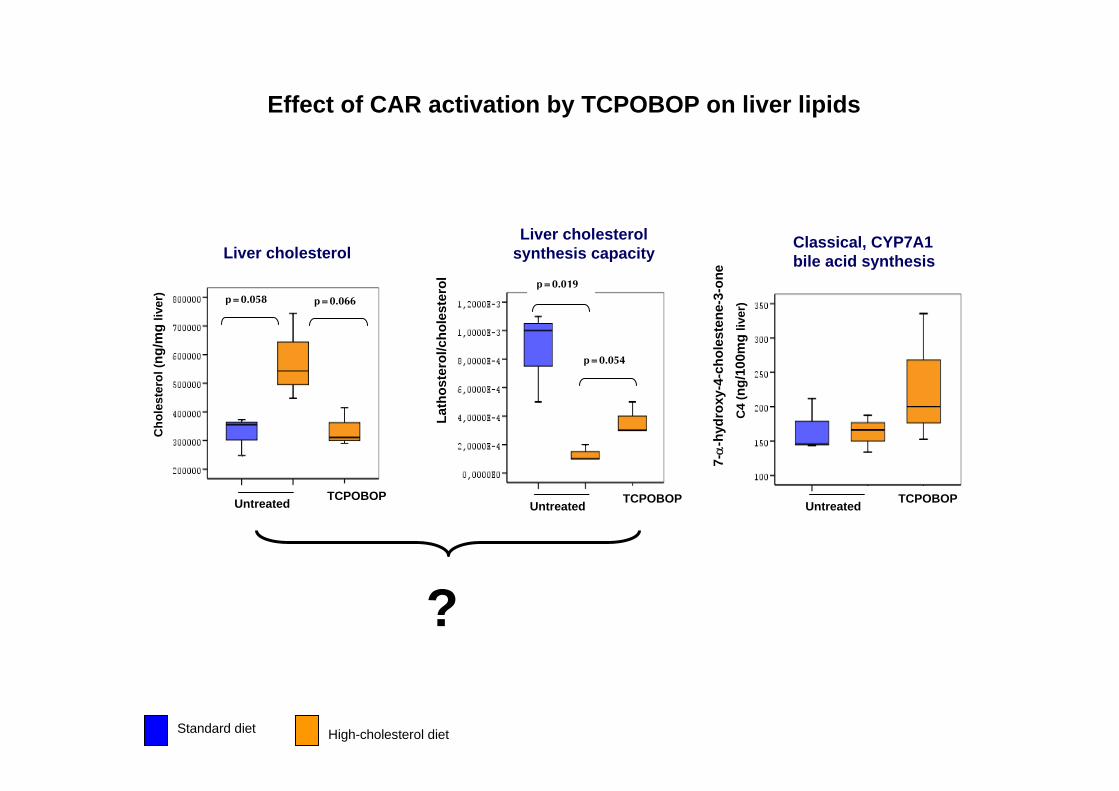
Standard diet High-cholesterol diet
Effect of CAR activation by TCPOBOP on liver lipids
?
Cho
lest
erol
(ng/
mg
liver
) p=0.058 p=0.066
Untreated TCPOBOP
Lath
oste
rol/c
hole
ster
ol
p=0.054
p=0.019
Untreated TCPOBOP
C4
(ng/
100m
gliv
er)
Untreated TCPOBOP
Liver cholesterolLiver cholesterol
synthesis capacityClassical, CYP7A1bile acid synthesis
7-α
-hyd
roxy
-4-c
hole
sten
e-3-
one

Differentially expressed genes measured by Steroltalk microarrays
Cholesterol synthesis
CYPs of drug metabolism,alternative
BA synthesis
CYPs of endogenousmetabolism,
alternative BA synth.NR, transporters
Genes regulated by activated mCar
Direct or indirect effect of mCar ??
Transcriptionfactors
Inflamatorygenes
A B
C
Rezen et al., submitted
400 x106 cells
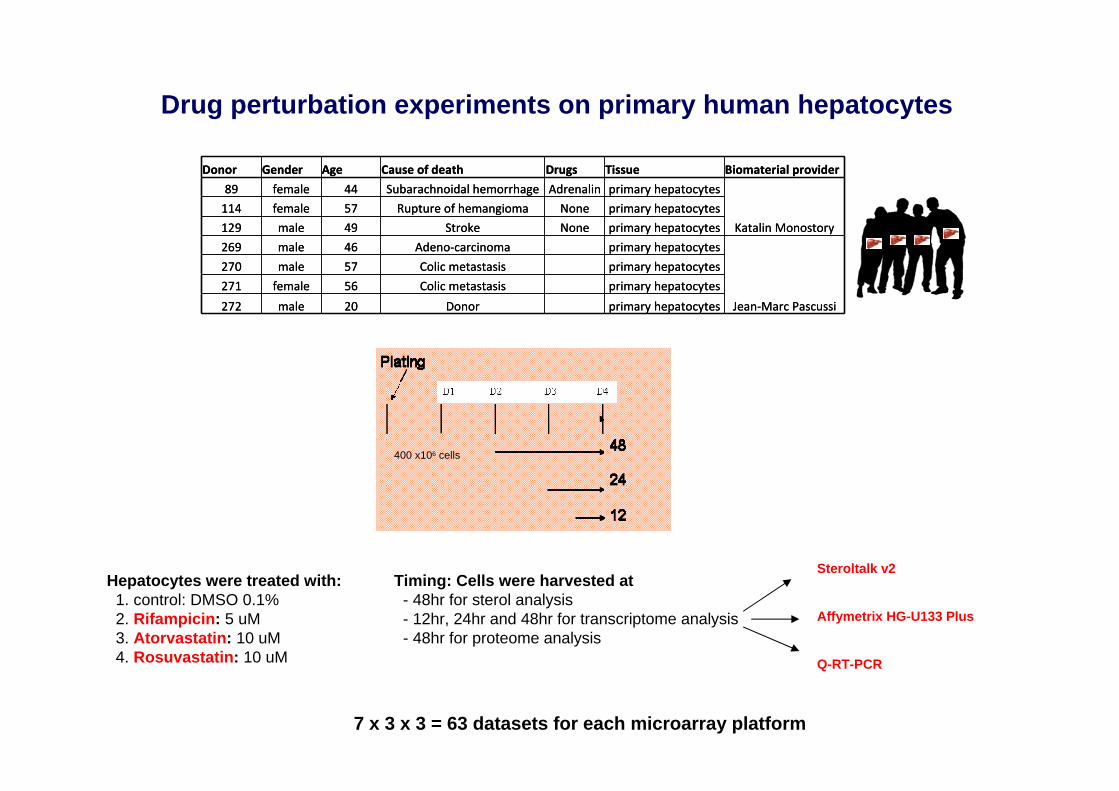
Hepatocytes were treated with: Timing: Cells were harvested at1. control: DMSO 0.1% - 48hr for sterol analysis2. Rifampicin: 5 uM - 12hr, 24hr and 48hr for transcriptome analysis 3. Atorvastatin: 10 uM - 48hr for proteome analysis4. Rosuvastatin: 10 uM
Drug perturbation experiments on primary human hepatocytes
Steroltalk v2
Affymetrix HG-U133 Plus
Q-RT-PCR
Donor Gender Age Cause of death Drugs Tissue Biomaterial provider
89 female 44 Subarachnoidal hemorrhage Adrenalin primary hepatocytes
Katalin Monostory
114 female 57 Rupture of hemangioma None primary hepatocytes
129 male 49 Stroke None primary hepatocytes
269 male 46 Adeno‐carcinoma primary hepatocytes
Jean‐Marc Pascussi
270 male 57 Colic metastasis primary hepatocytes
271 female 56 Colic metastasis primary hepatocytes
272 male 20 Donor primary hepatocytes
7 x 3 x 3 = 63 datasets for each microarray platform
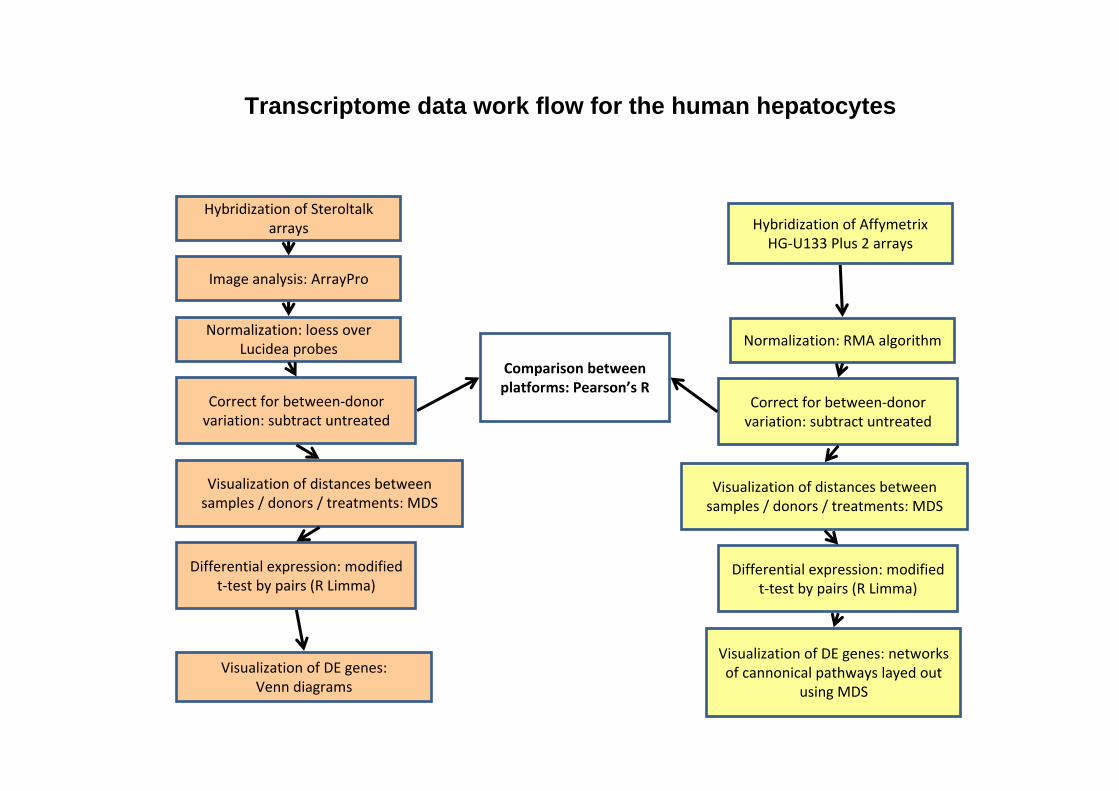
Hybridization of Steroltalk arrays
Image analysis: ArrayPro
Normalization: loess over Lucidea probes
Correct for between‐donor variation: subtract untreated
Hybridization of AffymetrixHG‐U133 Plus 2 arrays
Normalization: RMA algorithm
Differential expression: modified t‐test by pairs (R Limma)
Correct for between‐donor variation: subtract untreated
Differential expression: modified t‐test by pairs (R Limma)
Comparison between platforms: Pearson’s R
Visualization of distances between samples / donors / treatments: MDS
Visualization of distances between samples / donors / treatments: MDS
Visualization of DE genes: Venn diagrams
Visualization of DE genes: networks of cannonical pathways layed out
using MDS
Transcriptome data work flow for the human hepatocytes
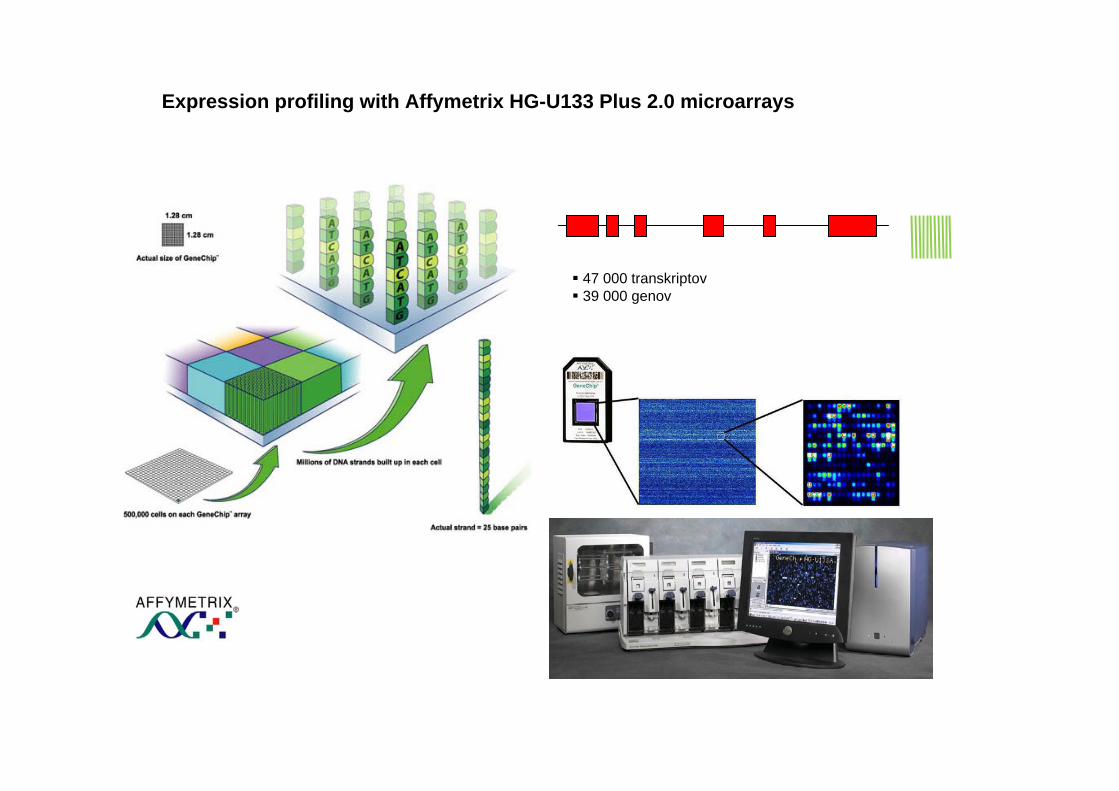
47 000 transkriptov39 000 genov
Expression profiling with Affymetrix HG-U133 Plus 2.0 microarrays
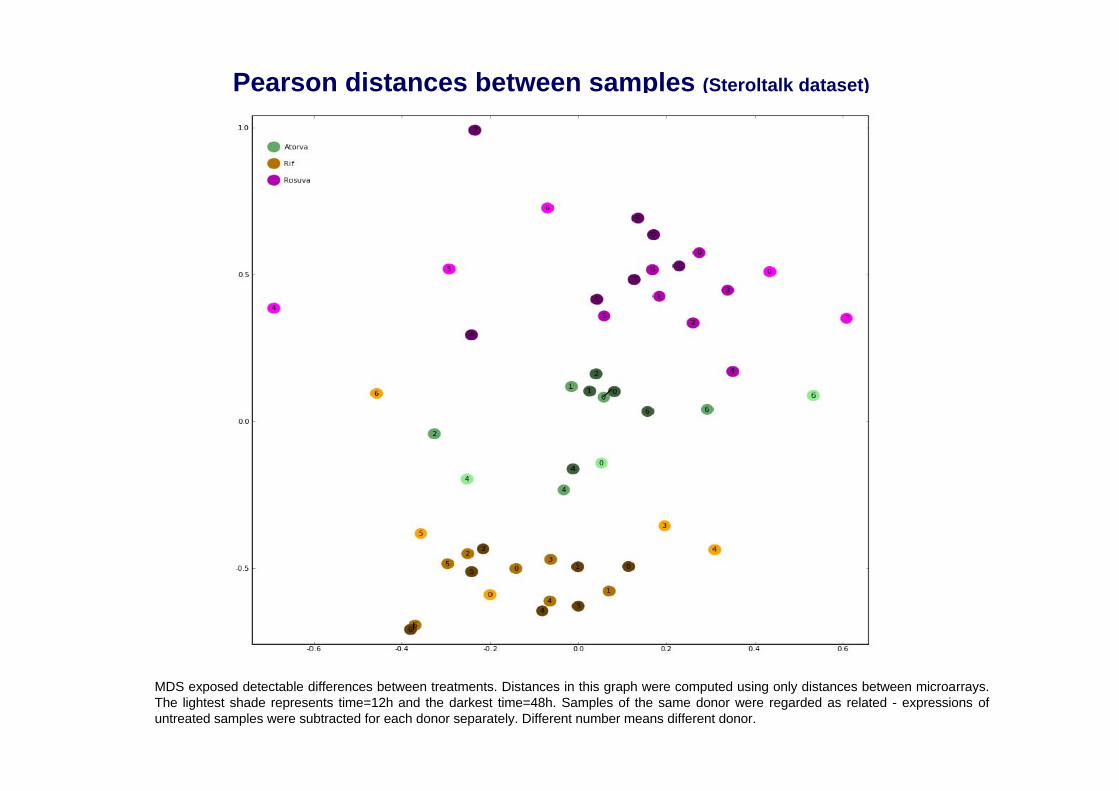
MDS exposed detectable differences between treatments. Distances in this graph were computed using only distances between microarrays. The lightest shade represents time=12h and the darkest time=48h. Samples of the same donor were regarded as related - expressions of untreated samples were subtracted for each donor separately. Different number means different donor.
Pearson distances between samples (Steroltalk dataset)
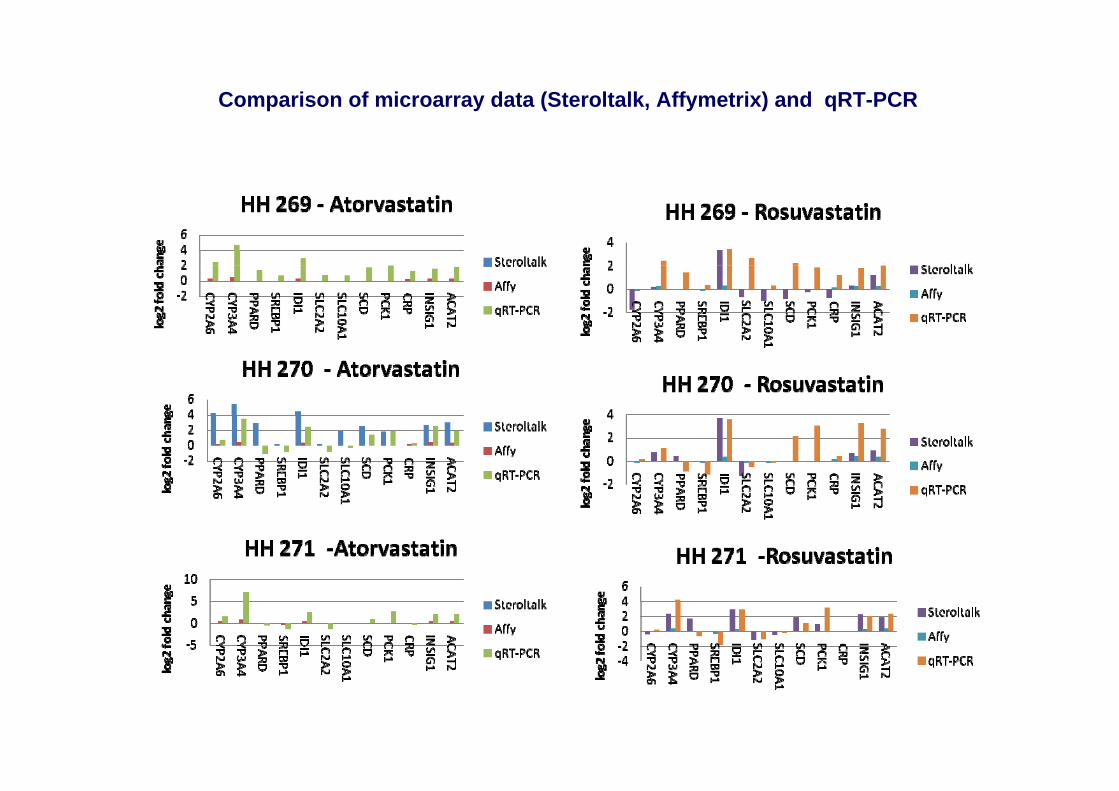
Comparison of microarray data (Steroltalk, Affymetrix) and qRT-PCR
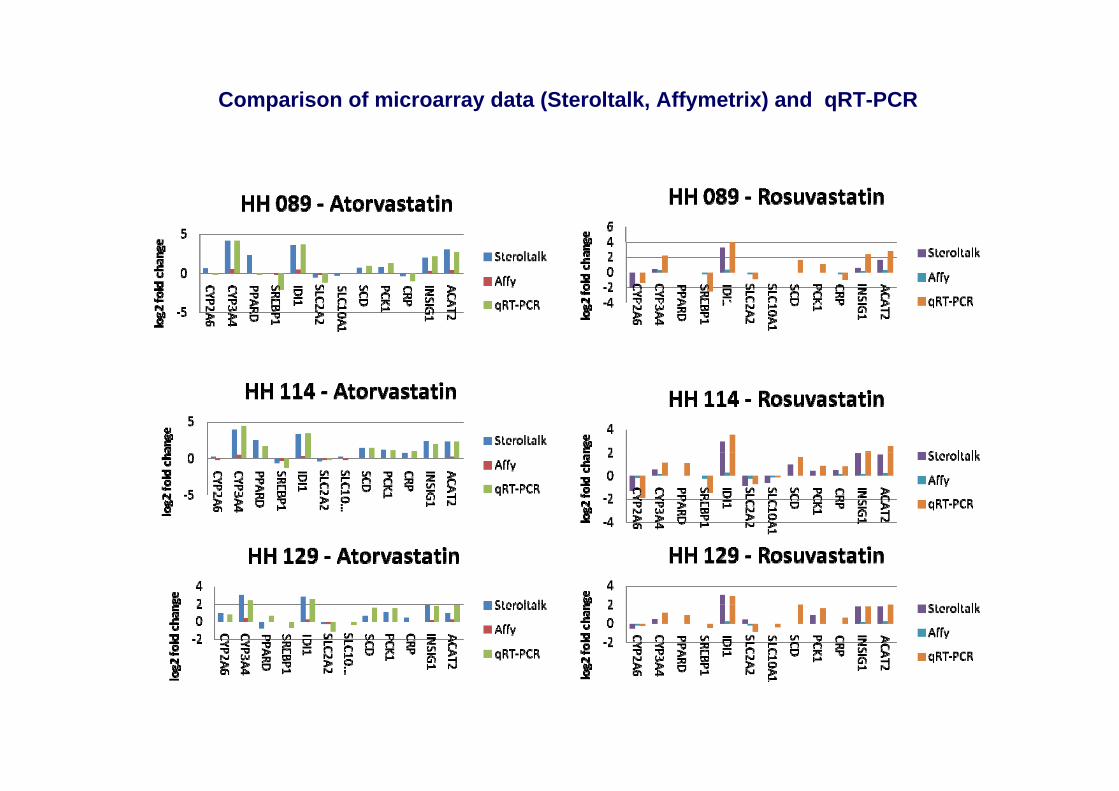
Comparison of microarray data (Steroltalk, Affymetrix) and qRT-PCR
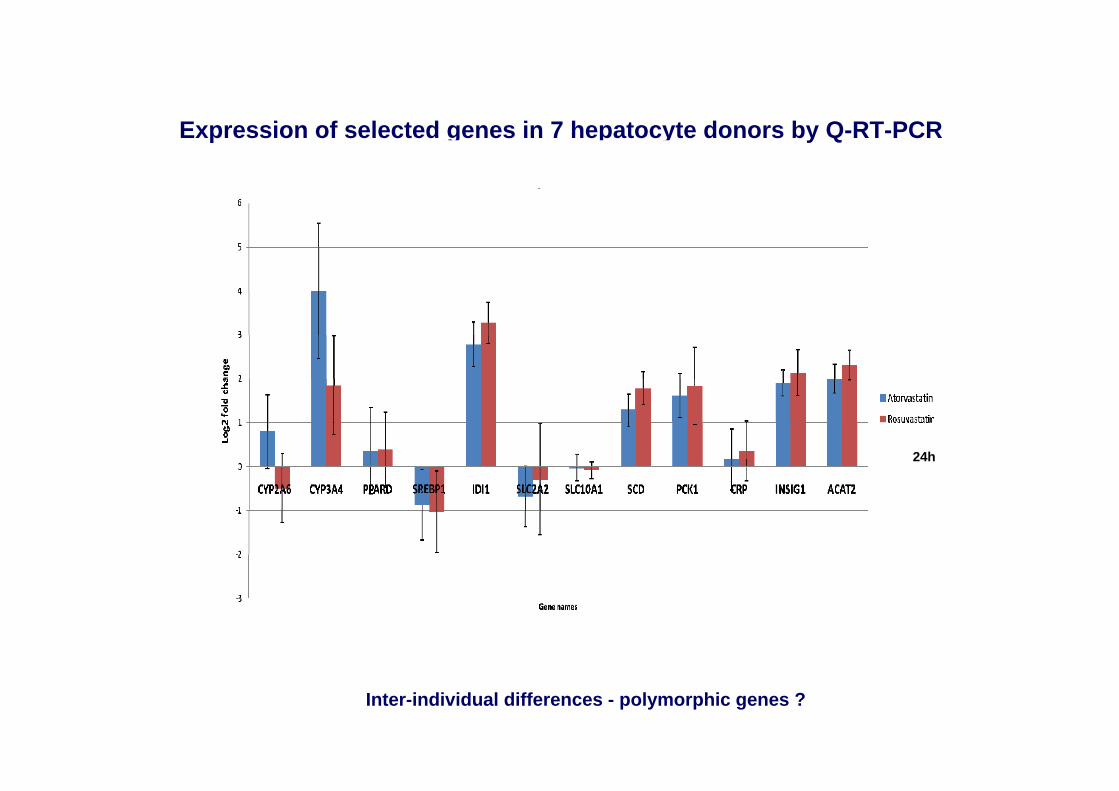
Expression of selected genes in 7 hepatocyte donors by Q-RT-PCR
24h
Inter-individual differences - polymorphic genes ?
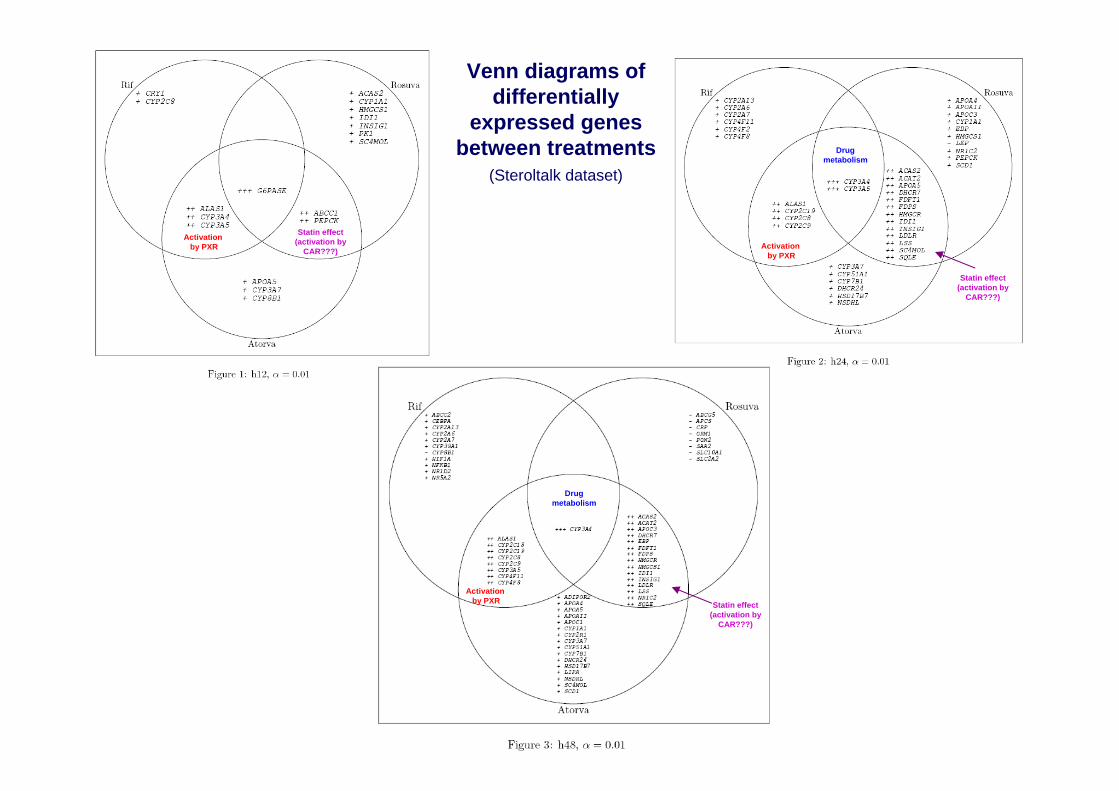
Venn diagrams of differentially
expressed genes between treatments
(Steroltalk dataset)
Activation by PXR
Activation by PXR
Activation by PXR
Drugmetabolism
Drugmetabolism
Statin effect(activation by
CAR???)
Statin effect(activation by
CAR???)
Statin effect(activation by
CAR???)
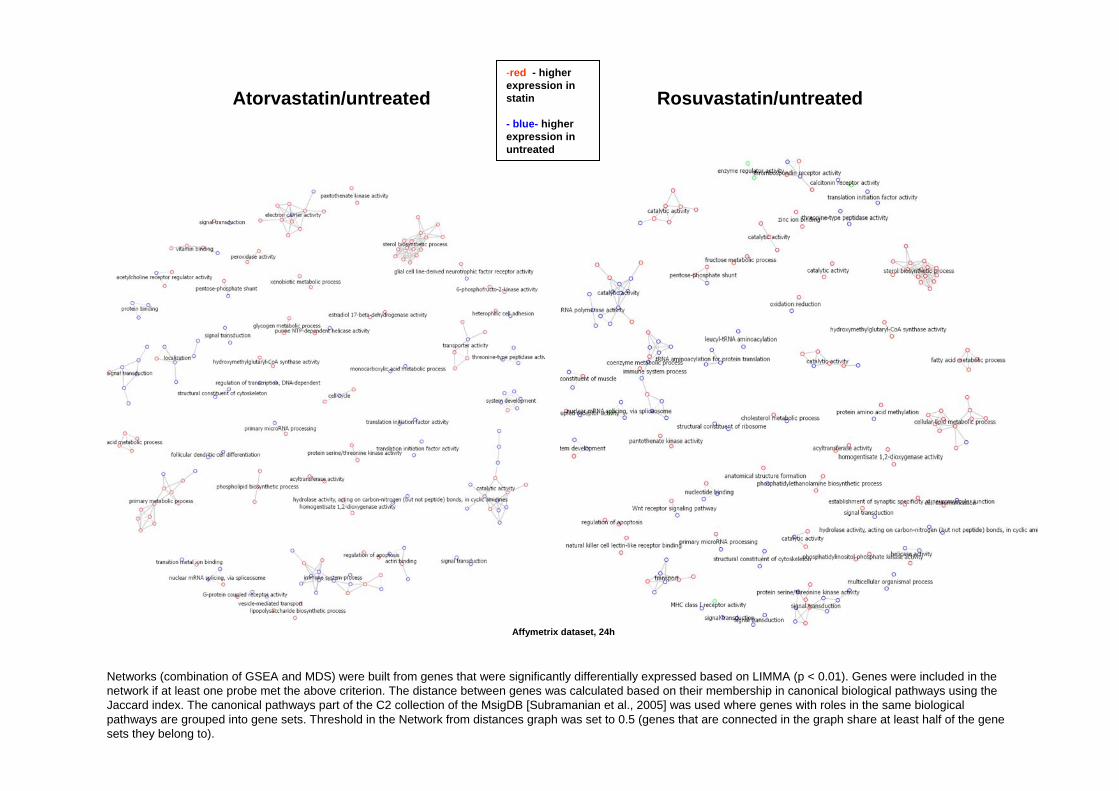
Atorvastatin/untreated Rosuvastatin/untreated-red - higher expression in statin
- blue- higher expression in untreated
Networks (combination of GSEA and MDS) were built from genes that were significantly differentially expressed based on LIMMA (p < 0.01). Genes were included in the network if at least one probe met the above criterion. The distance between genes was calculated based on their membership in canonical biological pathways using the Jaccard index. The canonical pathways part of the C2 collection of the MsigDB [Subramanian et al., 2005] was used where genes with roles in the same biological pathways are grouped into gene sets. Threshold in the Network from distances graph was set to 0.5 (genes that are connected in the graph share at least half of the gene sets they belong to).
Affymetrix dataset, 24h
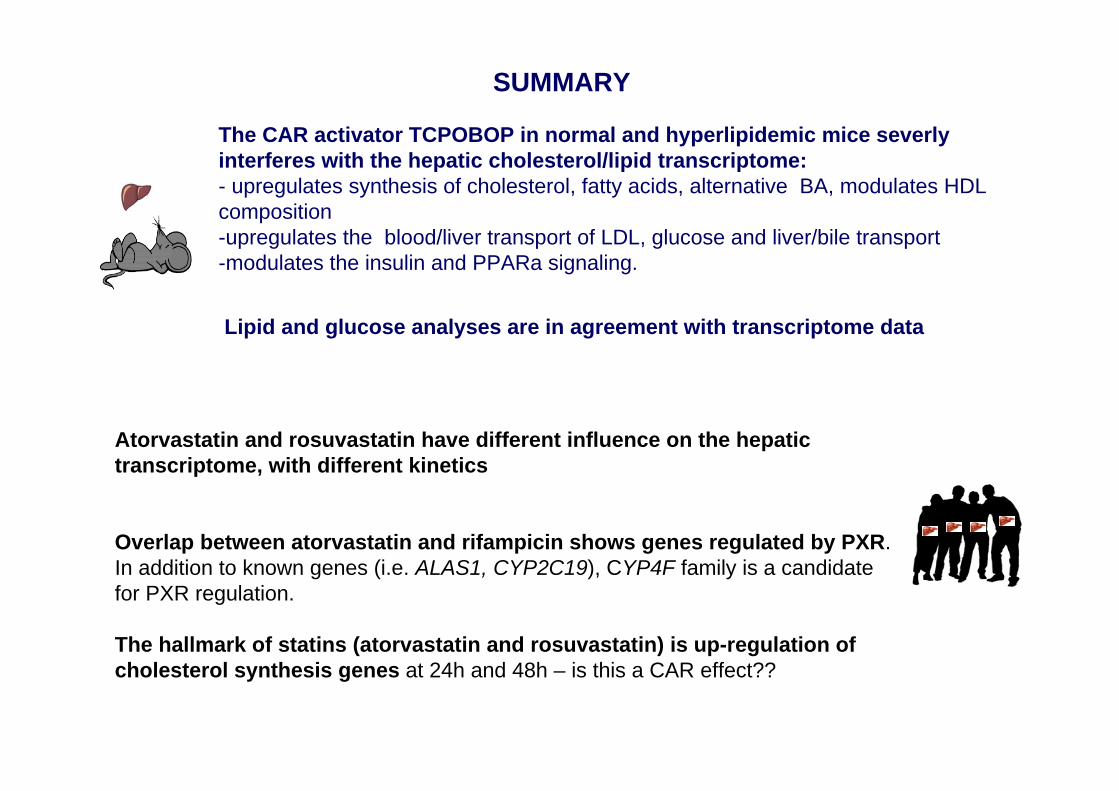
SUMMARY
The CAR activator TCPOBOP in normal and hyperlipidemic mice severlyinterferes with the hepatic cholesterol/lipid transcriptome:- upregulates synthesis of cholesterol, fatty acids, alternative BA, modulates HDL composition-upregulates the blood/liver transport of LDL, glucose and liver/bile transport-modulates the insulin and PPARa signaling.
Lipid and glucose analyses are in agreement with transcriptome data
Atorvastatin and rosuvastatin have different influence on the hepatic transcriptome, with different kinetics
Overlap between atorvastatin and rifampicin shows genes regulated by PXR. In addition to known genes (i.e. ALAS1, CYP2C19), CYP4F family is a candidate for PXR regulation.
The hallmark of statins (atorvastatin and rosuvastatin) is up-regulation of cholesterol synthesis genes at 24h and 48h – is this a CAR effect??