Embed Size (px)
Citation preview
Journal of The Electrochemical Society, 161 (4) H207-H213 (2014) H2070013-4651/2014/161(4)/H207/7/$31.00 © The Electrochemical Society
Electrochemical Impedance Spectroscopic Investigation of SodiumIon Diffusion in MnO2 Using a Constant Phase Element Activein Desired Frequency RangesSeung-Beom Yoon,a Jong-Pil Jegal,a Kwang Chul Roh,b,z and Kwang-Bum Kima,z
aDepartment of Material Science and Engineering, Yonsei University, Seodaemun-Gu, Seoul 120-749, South KoreabEnergy Efficient Materials Team, Energy & Environmental Division, Korea Institute of Ceramic Engineeringand Technology, Guemcheon-Gu, Seoul 153-801, South Korea
Herein, we report an equivalent circuit model for electrochemical impedance spectroscopic (EIS) investigation of the Na+ iondiffusion process in MnO2. We combine two constant phase elements (CPEs) active in the desired frequency ranges as the elementassociated with the diffusion reaction of ions in the solid active materials in a modified equivalent circuit model. Adoption of theseCPEs instead of a finite-space Warburg impedance allows for the more precise analysis of measured impedance data for a cavitymicroelectrode (CME). The dependence of electrochemical properties of manganese oxide (MnO2)/multiwall carbon nanotube(MWCNT) composites on the MnO2 content is then investigated using this EIS analysis. According to EIS analyzes, series resistance(Rs), electron-transfer resistance (Ret), degree of frequency dispersion in semi-infinite diffusion, and effective diffusion length isincreased with an increase in MnO2 loading amounts in the composites.© 2014 The Electrochemical Society. [DOI: 10.1149/2.046404jes] All rights reserved.
Manuscript submitted December 5, 2013; revised manuscript received January 30, 2014. Published February 11, 2014.
Electrochemical capacitors (ECs), which are electrochemical en-ergy storage devices with a high power density, have gained significantattention for use in a wide range of applications such as electrical vehi-cles and mobile power sources. From an electrode materials perspec-tive, various transition metal oxides for ECs have been actively inves-tigated owing to their high theoretical specific capacitance ascribedto fast faradaic reactions throughout their entire volume, as well asfor their double-layer charging characteristics. Among the transitionmetal oxides, manganese oxide (MnO2) has attracted attention due toits low cost, natural abundance, environmental friendliness, and hightheoretical specific capacitance (1370 F g−1). However, because ofits low electrical conductivity and dense morphology, MnO2 has alsoshown unsatisfactory electrochemical performance for utilization inEC applications.1–5 One of the major approaches undertaken to over-come these problems has been the synthesis of nanocomposites withhighly electrically conductive carbon nanotubes.6–8 Since the specificcapacitance of a composite system is ascribed to MnO2, the amount ofMnO2 in the composite is a very important factor in the fabrication ofelectrode materials with good electrochemical performance. Accord-ingly, this influence has been examined in the present study, wherebythe electrochemical properties of MnO2/multiwall carbon nanotube(MWCNT) composites were investigated by controlling MnO2
content.Electrochemical impedance spectroscopy (EIS) is a powerful and
widely used method for analyzing electrochemical devices or systems.Since EIS is one of the best techniques for monitoring and simulatingcharge storage processes in electrochemical energy storage materi-als, a large number of EIS studies on the electrochemical reactionsof MnO2 have been conducted accordingly.9–14 The charge storageprocess can be divided into several steps with different reaction ratesso that specific electrochemical phenomena with different relaxationtimes can be distinguished by EIS analysis.15,16 An equivalent circuitmodel should be constructed consisting of elements corresponding toeach step in an electrochemical reaction in order to analyze the EISdata. When the frequencies are swept from the high- to low-frequencyrange, EIS enables a sophisticated separation due to a different ACresponse depending on the kinetics of each electrochemical reactionstep. The charge storage process implemented by MnO2 consists ofsurface (ion adsorption and desorption)17 and bulk (ion diffusion inMnO2)18 reactions. However, although MnO2 has a specific chargestorage mechanism, there have been various models reported accord-ing to results of EIS data analysis.9,10,12,14,19–21
In this study, we have investigated the EIS data obtained fromMnO2/MCWNT composites using a modified equivalent circuit model
zE-mail: [email protected]; [email protected]
combining two constant phase elements (CPEs) active in the desiredfrequency ranges as the element associated with the diffusion reac-tion of ions in the solid active materials. This approach allows foran intuitive interpretation of EIS data, and an investigation of therelationships among the electrochemical reaction steps. Our aim isto use this EIS analytical method to investigate the effects of MnO2
content on its electrochemical properties. In particular, the chargestorage mechanism of MnO2 in the composites is of interest, sincethis mechanism must be taken into account when fabricating modifiedelectrode materials to achieve enhanced electrochemical performance.This developed equivalent circuit model could be not only applied toanalysis of various electrodes for electrochemical capacitors, but alsofor Li-ion batteries.
Experimental
Preparation of MnO2/MWCNT composites.— MnO2 was coatedonto MWCNTs through the direct redox reaction between the MWC-NTs and permanganate ions in an aqueous solution. The detailedprocedure for synthesis of the MnO2/MWCNT binary composite isdescribed elsewhere.6 Briefly, 200 mL of 0.1 M, 0.15 M, or 0.2 MKMnO4 solution was heated to 70◦C and 1.0 g of MWCNTs was addedto the solution. The solution temperature was maintained at 70◦Cduring the synthesis. The suspension was then filtered and washedrepeatedly with distilled water.
Characterization of MnO2/MWCNT composites.— The crystallinephase of the MnO2/MWCNT composite was determined by X-raydiffraction (XRD; Rigaku, Cu Kα, 40 kV, 20 mA). The morphol-ogy was characterized by performing scanning electron microscopy(SEM, S-4300SE, Hitachi) and high-resolution transmission electronmicroscopy (HR-TEM, JEM-3010, JEOL). The MnO2 loading in thecomposites was determined using thermogravimetric analysis (TGA,STA 409 PC), which was performed under an air flow at a heating rateof 10◦C min−1 from room temperature to 800◦C.
Electrochemical measurement of MnO2/MWCNT composites.—Electrochemical measurements of all MnO2/MWCNT composites
were made in a three-electrode electrochemical cell using a cavitymicroelectrode (CME) filled with the MnO2/MWCNT composite asthe working electrode and a platinum plate and an Ag/AgCl/saturatedKCl electrode as the counter and reference electrodes, respectively.Cyclic voltammetry was performed between 0.0 and 0.8 V (vs.Ag/AgCl) in 1 M Na2SO4 aqueous electrolyte at increasing poten-tial scan rates in the range from 50 mV s−1 to 1000 mV s−1 usinga potentiostat/galvanostat (Solartron 1470E, CellTest System). EIS
) unless CC License in place (see abstract). ecsdl.org/site/terms_use address. Redistribution subject to ECS terms of use (see 165.132.100.176Downloaded on 2014-03-02 to IP
H208 Journal of The Electrochemical Society, 161 (4) H207-H213 (2014)
measurements for the MnO2/MWCNT composites were performedat 0.4 V (vs. Ag/AgCl) in the AC frequency range from 200,000 to0.1 Hz and at an AC amplitude of 5 mV using an impedance analyzer(Solartron, 1260A Impedance/Gain-Phase Analyzer).
Results and Discussion
Equivalent circuit model of MnO2 with pseudocapacitivebehavior.— In the electrochemical reaction of MnO2, the measuredcurrent comes from the formation of an electrical double layer (non-faradaic reaction) and redox reaction of Mn3+/Mn4+ (faradaic reac-tion). Specifically, the current is mainly ascribed to the electron trans-fer of Mn3+/Mn4+ due to the low electrical double-layer capacitance(EDLC) of highly electrically resistive MnO2. Therefore, we focusedon the electron transfer in the MnO2-based electrochemical reactionsteps. In charge storage processes such as those found in pseudoca-pacitors or Li-ion batteries, since electroactive materials are anchoredto the electrode during a redox reaction, electroactive ions in the elec-trolyte are certainly necessary for their oxidation/reduction. In the caseof MnO2 (faradaic reaction of Mn3+/Mn4+) in aqueous electrolyte,cations (Na+, K+) are involved in electrochemical reactions through
adsorption/desorption or intercalation/deintercalation events.22,23 Inthis study, we assumed that both surface and bulk electrochemicalreaction sites are involved in charge storage processes. The surfaceelectrochemical reaction site is accessible to both electrons and ions,while the bulk electrochemical reaction site is inaccessible to eitherelectrons or ions at a given instance, or to both.24–27
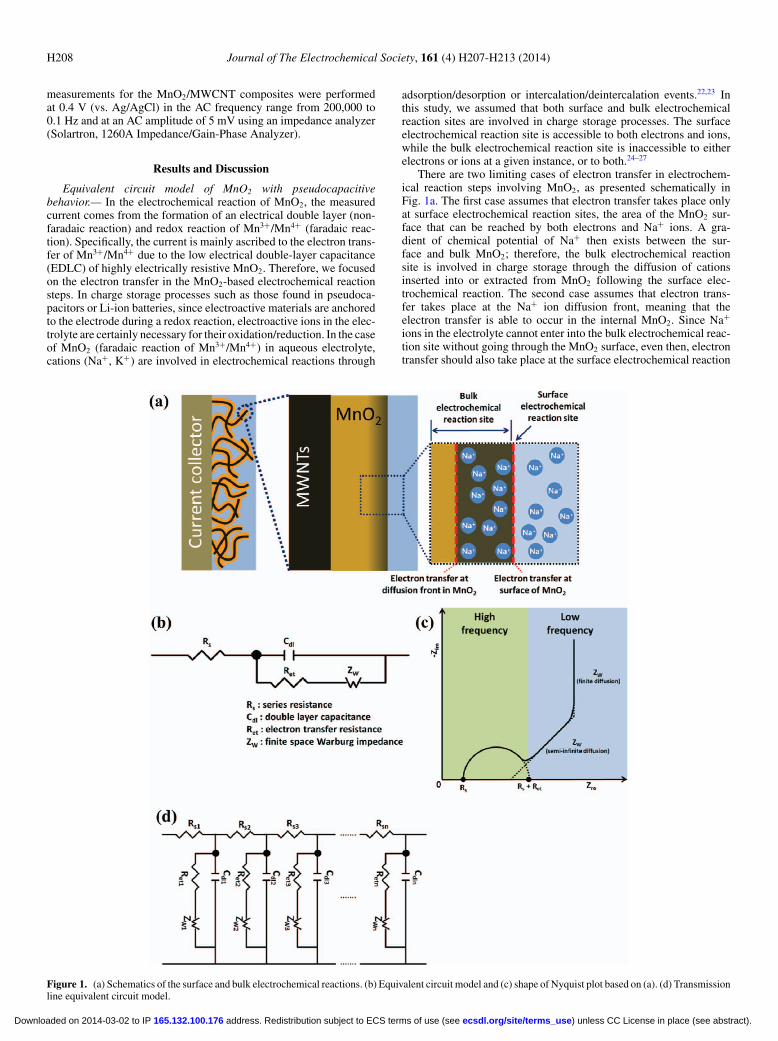
There are two limiting cases of electron transfer in electrochem-ical reaction steps involving MnO2, as presented schematically inFig. 1a. The first case assumes that electron transfer takes place onlyat surface electrochemical reaction sites, the area of the MnO2 sur-face that can be reached by both electrons and Na+ ions. A gra-dient of chemical potential of Na+ then exists between the sur-face and bulk MnO2; therefore, the bulk electrochemical reactionsite is involved in charge storage through the diffusion of cationsinserted into or extracted from MnO2 following the surface elec-trochemical reaction. The second case assumes that electron trans-fer takes place at the Na+ ion diffusion front, meaning that theelectron transfer is able to occur in the internal MnO2. Since Na+
ions in the electrolyte cannot enter into the bulk electrochemical reac-tion site without going through the MnO2 surface, even then, electrontransfer should also take place at the surface electrochemical reaction
Figure 1. (a) Schematics of the surface and bulk electrochemical reactions. (b) Equivalent circuit model and (c) shape of Nyquist plot based on (a). (d) Transmissionline equivalent circuit model.
) unless CC License in place (see abstract). ecsdl.org/site/terms_use address. Redistribution subject to ECS terms of use (see 165.132.100.176Downloaded on 2014-03-02 to IP
Journal of The Electrochemical Society, 161 (4) H207-H213 (2014) H209
site. It is noteworthy that this electron transfer takes place in eithercase, suggesting that current flow is measured only when Na+ ionsenter or leave the MnO2 through the surface electrochemical reactionsite; therefore, we assumed that electron transfer takes place at thissite. To summarize the reaction steps: (1) electrons and ions migratefrom/to the electron-transfer reaction site (surface electrochemical re-action site) at the beginning of the electrochemical reaction; (2) next,an electrical double layer is formed on the electrode material surface,along with simultaneous electron transfer; (3) finally, Na+ ions mi-grate into the bulk MnO2 by diffusion processes or sequential electrontransfer from surface to bulk. This energy storage process can also beapplicable to other pseudocapacitors and Li-ion batteries.
Fig. 1b shows a typical equivalent circuit model composed of fourelements based on the electrochemical reaction mentioned above. Inthe overall equivalent circuit model, the surface electrochemical reac-tion corresponds to the Randles circuit model made up of the seriesresistance (Rs), electric double layer at the active material/electrolyteinterface (Cdl), and electron transfer resistance (Ret). The bulk elec-trochemical reaction corresponds to finite-length chemical diffusionimpedance, typically referred to as the so-called finite-space Warburgimpedance (Zw). Rs includes the solution resistance, contact resis-tance, and intrinsic resistance of the MnO2/MWCNT composites, andis in series with Cdl at the interface between the MnO2 surface andelectrolyte, which is in parallel with Ret and Zw. Ret denotes the ki-netic resistance to Na+ ion transfer at the interface between the MnO2
surface and electrolyte.16 Finally, Zw is associated with the diffusionof Na+ ions in MnO2. The shape of the Nyquist plot according tothe proposed energy storage process in Fig. 1a and equivalent circuitmodel in Fig. 1b can be inferred as depicted in Fig. 1c. The semicircleat high frequencies corresponds to the Rs, Cdl, and Ret of the surfaceelectrochemical reaction, where the point intersecting with the realaxis indicates Rs and the diameter of the semicircle is Ret. At lowfrequencies, Zw is represented by two straight lines at 45◦ and 90◦ tothe Zre axis. Zw is given in Eq. 1:28
Zw = −(
dε
dδ
)Vm L
nF AD
coth√
iωL2
D√iωL2
D
[1]
where dε/dδ is the slope of the equilibrium potential versus the molefraction of active materials. In addition, Vm, L, n, F, A, D, and ω repre-sent the molar volume of active materials, effective diffusion length,stoichiometric number of electrons involved in the electrochemicalreaction, Faraday constant, diffusion area, diffusion coefficient, andfrequency, respectively. At higher frequencies (ω � D/L2) in the low-frequency range, Eq. 1 can be expressed as Eq. 2:
Zw = −(
dε
dδ
)Vm
nF A√
2D(1 − i) ω
− 12 [2]
As the frequency decreases, a 45◦ slope is obtained owing toNa+ ions undergoing semi-infinite diffusion. At lower frequencies(ω � D/L2), Eq. 1 can be expressed as Eq. 3:
Zw = −(
dε
dδ
)Vm L
nF AD
(1
3− D
ωL2i
)[3]
In this region, Zw traces a line at 90◦ to the Zre axis, which is similarto capacitive behavior and represents the accumulation of diffusedNa+ ions in MnO2. Therefore, the Na+ ions undergo finite diffusion.For Warburg impedance, the knee frequency is defined as the maxi-mum frequency below which predominantly capacitive behavior canbe maintained.20,29,30 The Na+ ions undergo semi-infinite diffusion atfrequencies above and finite diffusion at frequencies below the kneefrequency. Therefore, a high knee frequency is desirable for active ma-terials for electrochemical capacitor applications.29,31 From a kineticviewpoint, the surface electrochemical reaction is fast compared to thecorresponding bulk reaction.24,27 Therefore, the observed semicircle isascribed to the surface electrochemical reaction in the high-frequencyregion, while the straight line is related to the bulk electrochemicalreaction in the low-frequency region, as shown in Fig. 1c.
It should also be noted that commonly used electrodes are con-structed from MnO2 particles of various sizes and containing varioussized active materials and additives such as conducting agents and/orbinders; accordingly, each particle of electroactive material exhibitsvarious electrochemical behaviors according to its position in the elec-trode. Consequently, EIS data obtained from actual electrodes is thesum of impedance properties of each particle. The actual equivalentcircuit model of the general electrode is shown in Fig. 1d, indicatinga MnO2 electrode constructed with various MnO2 particles with dif-ferent Rs, Cdl, Rc, and Zw values. A non-uniform distribution of MnO2
in the electrode results in different electrical conductivities, ionicconductivities, specific surface areas, effective diffusion lengths, anddiffusion rates for each MnO2 particle.10 As a result, the semicircleis distorted in the high-frequency region and the slope of the straightline is changed in the low-frequency region due to the distributionof relaxation time (or frequency), suggesting that investigation of theinherent electrochemical properties of electrode materials would bedifficult due to the effects of electrode composition on electrochemicalreactions.
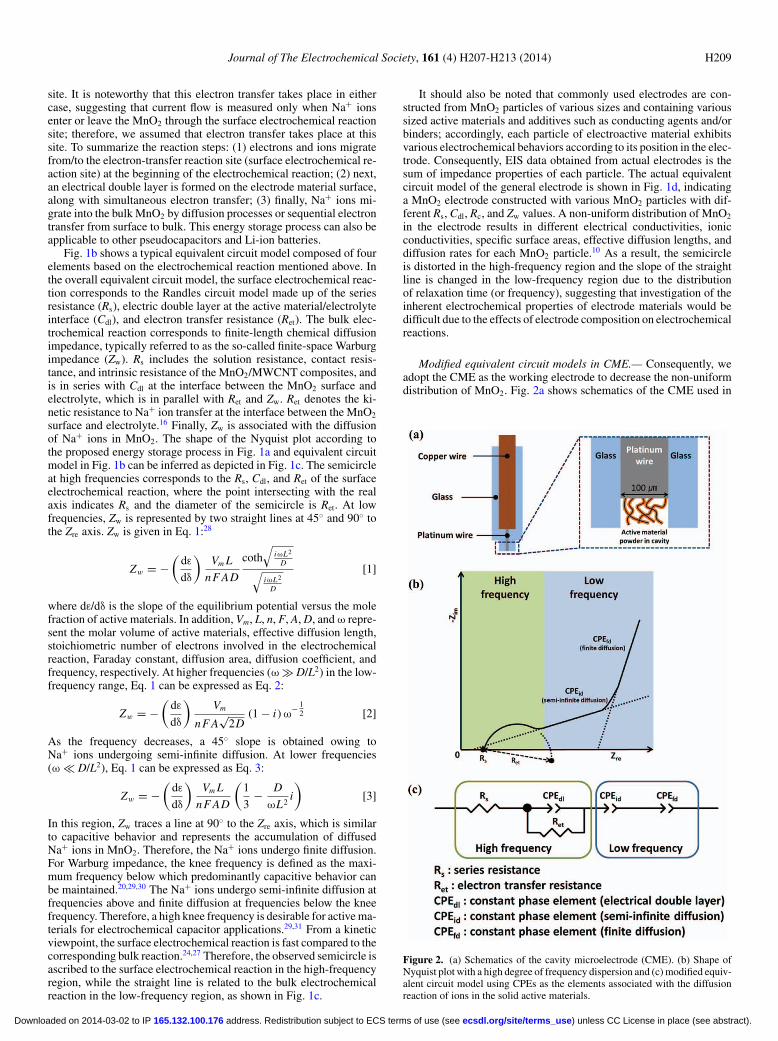
Modified equivalent circuit models in CME.— Consequently, weadopt the CME as the working electrode to decrease the non-uniformdistribution of MnO2. Fig. 2a shows schematics of the CME used in
Figure 2. (a) Schematics of the cavity microelectrode (CME). (b) Shape ofNyquist plot with a high degree of frequency dispersion and (c) modified equiv-alent circuit model using CPEs as the elements associated with the diffusionreaction of ions in the solid active materials.
) unless CC License in place (see abstract). ecsdl.org/site/terms_use address. Redistribution subject to ECS terms of use (see 165.132.100.176Downloaded on 2014-03-02 to IP
H210 Journal of The Electrochemical Society, 161 (4) H207-H213 (2014)
this study. The CME has many advantages when compared to otherkinds of electrodes commonly used in electrochemical experiments,including easy handling and reusability. Furthermore, electrochemicalproperties can be measured from very small amounts of material.32–34
For these reasons, CMEs have been used recently to perform elec-trochemical analyzes of electrode materials for Li-ion batteries andelectrochemical capacitors.32,35,36 As shown in Fig. 2a, the CME isfilled with a very small amount of MnO2 compared to other com-monly used electrodes. Therefore, CMEs are appropriate electrodesfor investigating the electrochemical properties of electrode materialsdue to the reduced number of MnO2 particles (n in Fig. 1d). How-ever, despite using the CME, EIS data still displays a deviation fromFig. 1c. When the EIS is measured using the CME, in some cases, thereis a high degree of frequency dispersion at a low frequency range,35
a phenomenon also observed in our study; the Nyquist plot with ahigh degree of frequency dispersion is depicted in Fig. 2b. Thus, thetypical equivalent circuit model shown in Fig. 1b cannot be applied toa practical MnO2 electrode; the model is also unsuitable for evaluat-ing electrochemical properties using the transmission line equivalentcircuit mode shown in Fig. 1d because the value, which represents theinherent electrochemical properties of electrode materials, cannot beobtained from EIS data.
We propose a modified equivalent circuit model with two constantphase elements (CPEs) active in the desired frequency ranges as theelement associated with the diffusion reaction of ions in the solid activematerials (Fig. 2c). The Randles circuit model including the CPEdl
instead of Cdl is commonly used for fitting EIS data with frequencydispersion according to surface electrochemical reactions in the high-frequency range (depressed semicircle in Nyquist plot). The CPE isgiven in Eq. 4:
CPE = 1
Q(iω)n[4]
The CPE is a capacitor with capacitance Q for n = 1 and a resistorwith resistance Q−1 for n = 0. In this study, we combine two CPEsin a modified equivalent circuit model to act as the impedance ele-ment related to the diffusion of Na+ ions in MnO2. When there areno resistance elements in parallel with CPE, a tilted straight line isproduced in the Nyquist plot when n has some value between 0 and 1.The slope of this straight line decreases from 90◦ to 0◦ with a decreasein the n value from 1 to 0. As a result, two CPEs with various n canbe substituted for the element associated with the diffusion reactionof ions in the solid active materials. However, a boundary conditionat the end of the relevant frequency range is needed before the CPEcan be used as an equivalent circuit model element, as shown in theNyquist plot of the EIS data with a high degree of frequency disper-sion in Fig. 2b. This approach (using a limited frequency range) mightcontradict the established basis for analyzing the EIS data; however,it is difficult or impossible to analyze the EIS data of CMEs using thegeneral modified equivalent circuit model (Fig. 3).
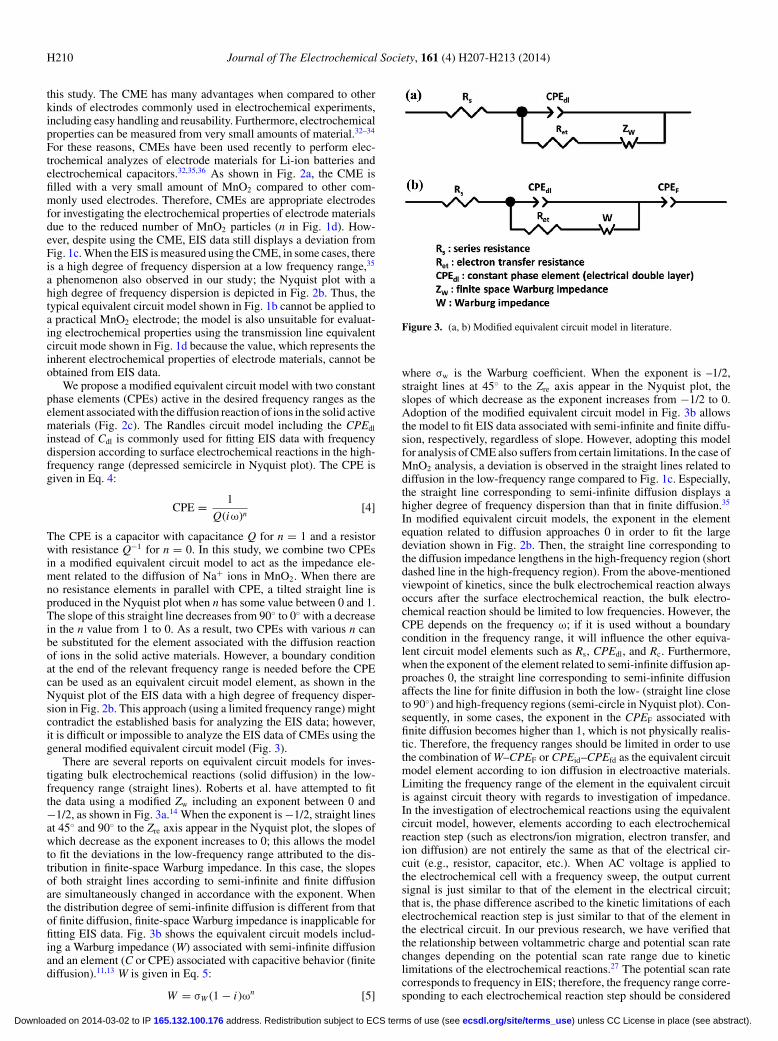
There are several reports on equivalent circuit models for inves-tigating bulk electrochemical reactions (solid diffusion) in the low-frequency range (straight lines). Roberts et al. have attempted to fitthe data using a modified Zw including an exponent between 0 and−1/2, as shown in Fig. 3a.14 When the exponent is −1/2, straight linesat 45◦ and 90◦ to the Zre axis appear in the Nyquist plot, the slopes ofwhich decrease as the exponent increases to 0; this allows the modelto fit the deviations in the low-frequency range attributed to the dis-tribution in finite-space Warburg impedance. In this case, the slopesof both straight lines according to semi-infinite and finite diffusionare simultaneously changed in accordance with the exponent. Whenthe distribution degree of semi-infinite diffusion is different from thatof finite diffusion, finite-space Warburg impedance is inapplicable forfitting EIS data. Fig. 3b shows the equivalent circuit models includ-ing a Warburg impedance (W) associated with semi-infinite diffusionand an element (C or CPE) associated with capacitive behavior (finitediffusion).11,13 W is given in Eq. 5:
W = σW (1 − i)ωn [5]
Figure 3. (a, b) Modified equivalent circuit model in literature.
where σw is the Warburg coefficient. When the exponent is –1/2,straight lines at 45◦ to the Zre axis appear in the Nyquist plot, theslopes of which decrease as the exponent increases from −1/2 to 0.Adoption of the modified equivalent circuit model in Fig. 3b allowsthe model to fit EIS data associated with semi-infinite and finite diffu-sion, respectively, regardless of slope. However, adopting this modelfor analysis of CME also suffers from certain limitations. In the case ofMnO2 analysis, a deviation is observed in the straight lines related todiffusion in the low-frequency range compared to Fig. 1c. Especially,the straight line corresponding to semi-infinite diffusion displays ahigher degree of frequency dispersion than that in finite diffusion.35
In modified equivalent circuit models, the exponent in the elementequation related to diffusion approaches 0 in order to fit the largedeviation shown in Fig. 2b. Then, the straight line corresponding tothe diffusion impedance lengthens in the high-frequency region (shortdashed line in the high-frequency region). From the above-mentionedviewpoint of kinetics, since the bulk electrochemical reaction alwaysoccurs after the surface electrochemical reaction, the bulk electro-chemical reaction should be limited to low frequencies. However, theCPE depends on the frequency ω; if it is used without a boundarycondition in the frequency range, it will influence the other equiva-lent circuit model elements such as Rs, CPEdl, and Rc. Furthermore,when the exponent of the element related to semi-infinite diffusion ap-proaches 0, the straight line corresponding to semi-infinite diffusionaffects the line for finite diffusion in both the low- (straight line closeto 90◦) and high-frequency regions (semi-circle in Nyquist plot). Con-sequently, in some cases, the exponent in the CPEF associated withfinite diffusion becomes higher than 1, which is not physically realis-tic. Therefore, the frequency ranges should be limited in order to usethe combination of W–CPEF or CPEid–CPEfd as the equivalent circuitmodel element according to ion diffusion in electroactive materials.Limiting the frequency range of the element in the equivalent circuitis against circuit theory with regards to investigation of impedance.In the investigation of electrochemical reactions using the equivalentcircuit model, however, elements according to each electrochemicalreaction step (such as electrons/ion migration, electron transfer, andion diffusion) are not entirely the same as that of the electrical cir-cuit (e.g., resistor, capacitor, etc.). When AC voltage is applied tothe electrochemical cell with a frequency sweep, the output currentsignal is just similar to that of the element in the electrical circuit;that is, the phase difference ascribed to the kinetic limitations of eachelectrochemical reaction step is just similar to that of the element inthe electrical circuit. In our previous research, we have verified thatthe relationship between voltammetric charge and potential scan ratechanges depending on the potential scan rate range due to kineticlimitations of the electrochemical reactions.27 The potential scan ratecorresponds to frequency in EIS; therefore, the frequency range corre-sponding to each electrochemical reaction step should be considered
) unless CC License in place (see abstract). ecsdl.org/site/terms_use address. Redistribution subject to ECS terms of use (see 165.132.100.176Downloaded on 2014-03-02 to IP
Journal of The Electrochemical Society, 161 (4) H207-H213 (2014) H211
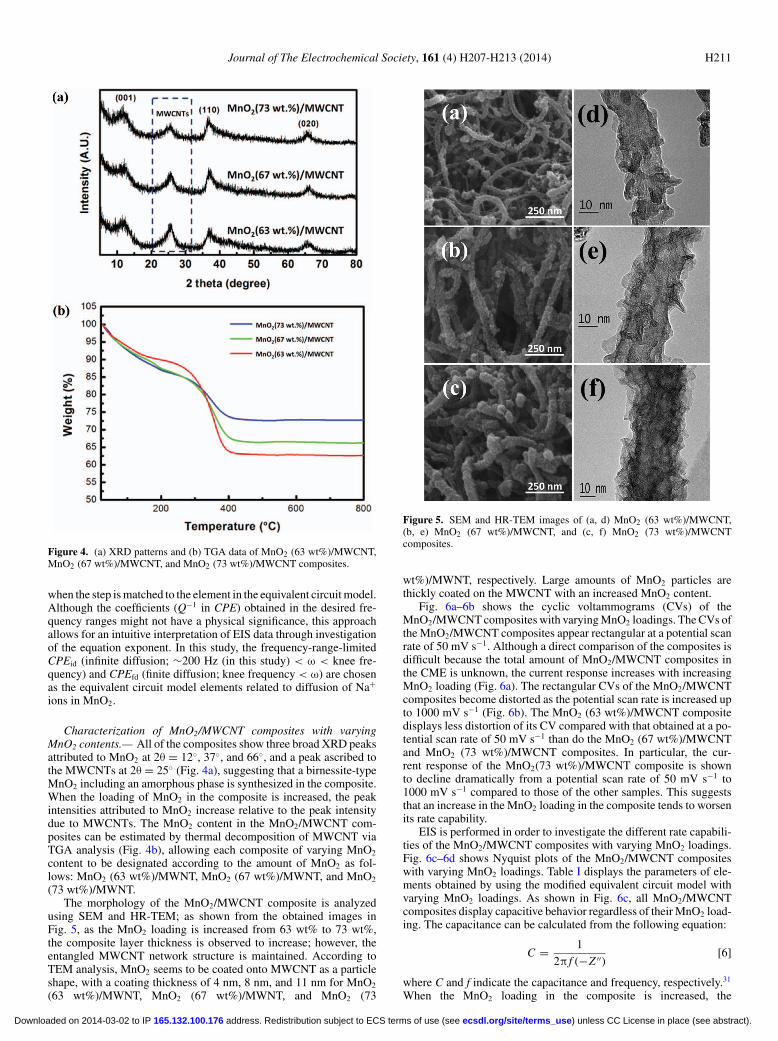
Figure 4. (a) XRD patterns and (b) TGA data of MnO2 (63 wt%)/MWCNT,MnO2 (67 wt%)/MWCNT, and MnO2 (73 wt%)/MWCNT composites.
when the step is matched to the element in the equivalent circuit model.Although the coefficients (Q−1 in CPE) obtained in the desired fre-quency ranges might not have a physical significance, this approachallows for an intuitive interpretation of EIS data through investigationof the equation exponent. In this study, the frequency-range-limitedCPEid (infinite diffusion; ∼200 Hz (in this study) < ω < knee fre-quency) and CPEfd (finite diffusion; knee frequency < ω) are chosenas the equivalent circuit model elements related to diffusion of Na+
ions in MnO2.
Characterization of MnO2/MWCNT composites with varyingMnO2 contents.— All of the composites show three broad XRD peaksattributed to MnO2 at 2θ = 12◦, 37◦, and 66◦, and a peak ascribed tothe MWCNTs at 2θ = 25◦ (Fig. 4a), suggesting that a birnessite-typeMnO2 including an amorphous phase is synthesized in the composite.When the loading of MnO2 in the composite is increased, the peakintensities attributed to MnO2 increase relative to the peak intensitydue to MWCNTs. The MnO2 content in the MnO2/MWCNT com-posites can be estimated by thermal decomposition of MWCNT viaTGA analysis (Fig. 4b), allowing each composite of varying MnO2
content to be designated according to the amount of MnO2 as fol-lows: MnO2 (63 wt%)/MWNT, MnO2 (67 wt%)/MWNT, and MnO2
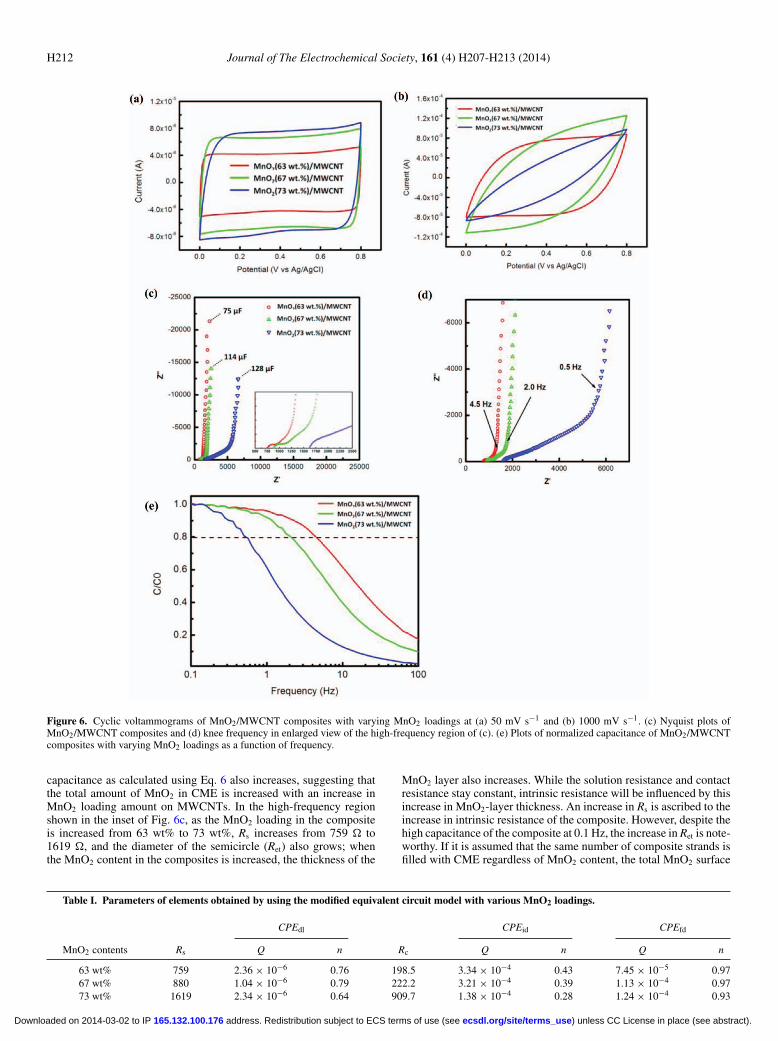
(73 wt%)/MWNT.The morphology of the MnO2/MWCNT composite is analyzed
using SEM and HR-TEM; as shown from the obtained images inFig. 5, as the MnO2 loading is increased from 63 wt% to 73 wt%,the composite layer thickness is observed to increase; however, theentangled MWCNT network structure is maintained. According toTEM analysis, MnO2 seems to be coated onto MWCNT as a particleshape, with a coating thickness of 4 nm, 8 nm, and 11 nm for MnO2
(63 wt%)/MWNT, MnO2 (67 wt%)/MWNT, and MnO2 (73
Figure 5. SEM and HR-TEM images of (a, d) MnO2 (63 wt%)/MWCNT,(b, e) MnO2 (67 wt%)/MWCNT, and (c, f) MnO2 (73 wt%)/MWCNTcomposites.
wt%)/MWNT, respectively. Large amounts of MnO2 particles arethickly coated on the MWCNT with an increased MnO2 content.
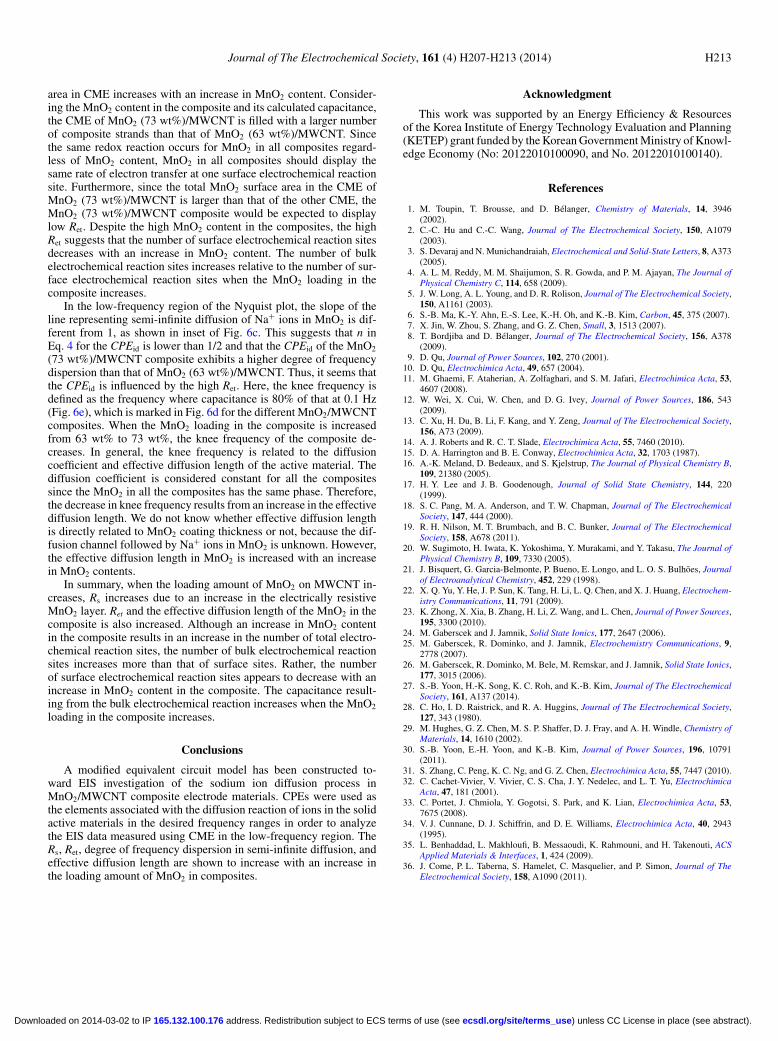
Fig. 6a–6b shows the cyclic voltammograms (CVs) of theMnO2/MWCNT composites with varying MnO2 loadings. The CVs ofthe MnO2/MWCNT composites appear rectangular at a potential scanrate of 50 mV s−1. Although a direct comparison of the composites isdifficult because the total amount of MnO2/MWCNT composites inthe CME is unknown, the current response increases with increasingMnO2 loading (Fig. 6a). The rectangular CVs of the MnO2/MWCNTcomposites become distorted as the potential scan rate is increased upto 1000 mV s−1 (Fig. 6b). The MnO2 (63 wt%)/MWCNT compositedisplays less distortion of its CV compared with that obtained at a po-tential scan rate of 50 mV s−1 than do the MnO2 (67 wt%)/MWCNTand MnO2 (73 wt%)/MWCNT composites. In particular, the cur-rent response of the MnO2(73 wt%)/MWCNT composite is shownto decline dramatically from a potential scan rate of 50 mV s−1 to1000 mV s−1 compared to those of the other samples. This suggeststhat an increase in the MnO2 loading in the composite tends to worsenits rate capability.
EIS is performed in order to investigate the different rate capabili-ties of the MnO2/MWCNT composites with varying MnO2 loadings.Fig. 6c–6d shows Nyquist plots of the MnO2/MWCNT compositeswith varying MnO2 loadings. Table I displays the parameters of ele-ments obtained by using the modified equivalent circuit model withvarying MnO2 loadings. As shown in Fig. 6c, all MnO2/MWCNTcomposites display capacitive behavior regardless of their MnO2 load-ing. The capacitance can be calculated from the following equation:
C = 1
2π f (−Z ′′)[6]
where C and f indicate the capacitance and frequency, respectively.31
When the MnO2 loading in the composite is increased, the
) unless CC License in place (see abstract). ecsdl.org/site/terms_use address. Redistribution subject to ECS terms of use (see 165.132.100.176Downloaded on 2014-03-02 to IP
H212 Journal of The Electrochemical Society, 161 (4) H207-H213 (2014)
Figure 6. Cyclic voltammograms of MnO2/MWCNT composites with varying MnO2 loadings at (a) 50 mV s−1 and (b) 1000 mV s−1. (c) Nyquist plots ofMnO2/MWCNT composites and (d) knee frequency in enlarged view of the high-frequency region of (c). (e) Plots of normalized capacitance of MnO2/MWCNTcomposites with varying MnO2 loadings as a function of frequency.
capacitance as calculated using Eq. 6 also increases, suggesting thatthe total amount of MnO2 in CME is increased with an increase inMnO2 loading amount on MWCNTs. In the high-frequency regionshown in the inset of Fig. 6c, as the MnO2 loading in the compositeis increased from 63 wt% to 73 wt%, Rs increases from 759 � to1619 �, and the diameter of the semicircle (Ret) also grows; whenthe MnO2 content in the composites is increased, the thickness of the
MnO2 layer also increases. While the solution resistance and contactresistance stay constant, intrinsic resistance will be influenced by thisincrease in MnO2-layer thickness. An increase in Rs is ascribed to theincrease in intrinsic resistance of the composite. However, despite thehigh capacitance of the composite at 0.1 Hz, the increase in Ret is note-worthy. If it is assumed that the same number of composite strands isfilled with CME regardless of MnO2 content, the total MnO2 surface
Table I. Parameters of elements obtained by using the modified equivalent circuit model with various MnO2 loadings.
CPEdl CPEid CPEfd
MnO2 contents Rs Q n Rc Q n Q n
63 wt% 759 2.36 × 10⁻⁶ 0.76 198.5 3.34 × 10⁻⁴ 0.43 7.45 × 10⁻⁵ 0.9767 wt% 880 1.04 × 10⁻⁶ 0.79 222.2 3.21 × 10⁻⁴ 0.39 1.13 × 10⁻⁴ 0.9773 wt% 1619 2.34 × 10⁻⁶ 0.64 909.7 1.38 × 10⁻⁴ 0.28 1.24 × 10⁻⁴ 0.93
) unless CC License in place (see abstract). ecsdl.org/site/terms_use address. Redistribution subject to ECS terms of use (see 165.132.100.176Downloaded on 2014-03-02 to IP
Journal of The Electrochemical Society, 161 (4) H207-H213 (2014) H213
area in CME increases with an increase in MnO2 content. Consider-ing the MnO2 content in the composite and its calculated capacitance,the CME of MnO2 (73 wt%)/MWCNT is filled with a larger numberof composite strands than that of MnO2 (63 wt%)/MWCNT. Sincethe same redox reaction occurs for MnO2 in all composites regard-less of MnO2 content, MnO2 in all composites should display thesame rate of electron transfer at one surface electrochemical reactionsite. Furthermore, since the total MnO2 surface area in the CME ofMnO2 (73 wt%)/MWCNT is larger than that of the other CME, theMnO2 (73 wt%)/MWCNT composite would be expected to displaylow Ret. Despite the high MnO2 content in the composites, the highRet suggests that the number of surface electrochemical reaction sitesdecreases with an increase in MnO2 content. The number of bulkelectrochemical reaction sites increases relative to the number of sur-face electrochemical reaction sites when the MnO2 loading in thecomposite increases.
In the low-frequency region of the Nyquist plot, the slope of theline representing semi-infinite diffusion of Na+ ions in MnO2 is dif-ferent from 1, as shown in inset of Fig. 6c. This suggests that n inEq. 4 for the CPEid is lower than 1/2 and that the CPEid of the MnO2
(73 wt%)/MWCNT composite exhibits a higher degree of frequencydispersion than that of MnO2 (63 wt%)/MWCNT. Thus, it seems thatthe CPEid is influenced by the high Ret. Here, the knee frequency isdefined as the frequency where capacitance is 80% of that at 0.1 Hz(Fig. 6e), which is marked in Fig. 6d for the different MnO2/MWCNTcomposites. When the MnO2 loading in the composite is increasedfrom 63 wt% to 73 wt%, the knee frequency of the composite de-creases. In general, the knee frequency is related to the diffusioncoefficient and effective diffusion length of the active material. Thediffusion coefficient is considered constant for all the compositessince the MnO2 in all the composites has the same phase. Therefore,the decrease in knee frequency results from an increase in the effectivediffusion length. We do not know whether effective diffusion lengthis directly related to MnO2 coating thickness or not, because the dif-fusion channel followed by Na+ ions in MnO2 is unknown. However,the effective diffusion length in MnO2 is increased with an increasein MnO2 contents.
In summary, when the loading amount of MnO2 on MWCNT in-creases, Rs increases due to an increase in the electrically resistiveMnO2 layer. Ret and the effective diffusion length of the MnO2 in thecomposite is also increased. Although an increase in MnO2 contentin the composite results in an increase in the number of total electro-chemical reaction sites, the number of bulk electrochemical reactionsites increases more than that of surface sites. Rather, the numberof surface electrochemical reaction sites appears to decrease with anincrease in MnO2 content in the composite. The capacitance result-ing from the bulk electrochemical reaction increases when the MnO2
loading in the composite increases.
Conclusions
A modified equivalent circuit model has been constructed to-ward EIS investigation of the sodium ion diffusion process inMnO2/MWCNT composite electrode materials. CPEs were used asthe elements associated with the diffusion reaction of ions in the solidactive materials in the desired frequency ranges in order to analyzethe EIS data measured using CME in the low-frequency region. TheRs, Ret, degree of frequency dispersion in semi-infinite diffusion, andeffective diffusion length are shown to increase with an increase inthe loading amount of MnO2 in composites.
Acknowledgment
This work was supported by an Energy Efficiency & Resourcesof the Korea Institute of Energy Technology Evaluation and Planning(KETEP) grant funded by the Korean Government Ministry of Knowl-edge Economy (No: 20122010100090, and No. 20122010100140).
References
1. M. Toupin, T. Brousse, and D. Belanger, Chemistry of Materials, 14, 3946(2002).
2. C.-C. Hu and C.-C. Wang, Journal of The Electrochemical Society, 150, A1079(2003).
3. S. Devaraj and N. Munichandraiah, Electrochemical and Solid-State Letters, 8, A373(2005).
4. A. L. M. Reddy, M. M. Shaijumon, S. R. Gowda, and P. M. Ajayan, The Journal ofPhysical Chemistry C, 114, 658 (2009).
5. J. W. Long, A. L. Young, and D. R. Rolison, Journal of The Electrochemical Society,150, A1161 (2003).
6. S.-B. Ma, K.-Y. Ahn, E.-S. Lee, K.-H. Oh, and K.-B. Kim, Carbon, 45, 375 (2007).7. X. Jin, W. Zhou, S. Zhang, and G. Z. Chen, Small, 3, 1513 (2007).8. T. Bordjiba and D. Belanger, Journal of The Electrochemical Society, 156, A378
(2009).9. D. Qu, Journal of Power Sources, 102, 270 (2001).
10. D. Qu, Electrochimica Acta, 49, 657 (2004).11. M. Ghaemi, F. Ataherian, A. Zolfaghari, and S. M. Jafari, Electrochimica Acta, 53,
4607 (2008).12. W. Wei, X. Cui, W. Chen, and D. G. Ivey, Journal of Power Sources, 186, 543
(2009).13. C. Xu, H. Du, B. Li, F. Kang, and Y. Zeng, Journal of The Electrochemical Society,
156, A73 (2009).14. A. J. Roberts and R. C. T. Slade, Electrochimica Acta, 55, 7460 (2010).15. D. A. Harrington and B. E. Conway, Electrochimica Acta, 32, 1703 (1987).16. A.-K. Meland, D. Bedeaux, and S. Kjelstrup, The Journal of Physical Chemistry B,
109, 21380 (2005).17. H. Y. Lee and J. B. Goodenough, Journal of Solid State Chemistry, 144, 220
(1999).18. S. C. Pang, M. A. Anderson, and T. W. Chapman, Journal of The Electrochemical
Society, 147, 444 (2000).19. R. H. Nilson, M. T. Brumbach, and B. C. Bunker, Journal of The Electrochemical
Society, 158, A678 (2011).20. W. Sugimoto, H. Iwata, K. Yokoshima, Y. Murakami, and Y. Takasu, The Journal of
Physical Chemistry B, 109, 7330 (2005).21. J. Bisquert, G. Garcia-Belmonte, P. Bueno, E. Longo, and L. O. S. Bulhoes, Journal
of Electroanalytical Chemistry, 452, 229 (1998).22. X. Q. Yu, Y. He, J. P. Sun, K. Tang, H. Li, L. Q. Chen, and X. J. Huang, Electrochem-
istry Communications, 11, 791 (2009).23. K. Zhong, X. Xia, B. Zhang, H. Li, Z. Wang, and L. Chen, Journal of Power Sources,
195, 3300 (2010).24. M. Gaberscek and J. Jamnik, Solid State Ionics, 177, 2647 (2006).25. M. Gaberscek, R. Dominko, and J. Jamnik, Electrochemistry Communications, 9,
2778 (2007).26. M. Gaberscek, R. Dominko, M. Bele, M. Remskar, and J. Jamnik, Solid State Ionics,
177, 3015 (2006).27. S.-B. Yoon, H.-K. Song, K. C. Roh, and K.-B. Kim, Journal of The Electrochemical
Society, 161, A137 (2014).28. C. Ho, I. D. Raistrick, and R. A. Huggins, Journal of The Electrochemical Society,
127, 343 (1980).29. M. Hughes, G. Z. Chen, M. S. P. Shaffer, D. J. Fray, and A. H. Windle, Chemistry of
Materials, 14, 1610 (2002).30. S.-B. Yoon, E.-H. Yoon, and K.-B. Kim, Journal of Power Sources, 196, 10791
(2011).31. S. Zhang, C. Peng, K. C. Ng, and G. Z. Chen, Electrochimica Acta, 55, 7447 (2010).32. C. Cachet-Vivier, V. Vivier, C. S. Cha, J. Y. Nedelec, and L. T. Yu, Electrochimica
Acta, 47, 181 (2001).33. C. Portet, J. Chmiola, Y. Gogotsi, S. Park, and K. Lian, Electrochimica Acta, 53,
7675 (2008).34. V. J. Cunnane, D. J. Schiffrin, and D. E. Williams, Electrochimica Acta, 40, 2943
(1995).35. L. Benhaddad, L. Makhloufi, B. Messaoudi, K. Rahmouni, and H. Takenouti, ACS
Applied Materials & Interfaces, 1, 424 (2009).36. J. Come, P. L. Taberna, S. Hamelet, C. Masquelier, and P. Simon, Journal of The
Electrochemical Society, 158, A1090 (2011).
) unless CC License in place (see abstract). ecsdl.org/site/terms_use address. Redistribution subject to ECS terms of use (see 165.132.100.176Downloaded on 2014-03-02 to IP


![Electrochemical miRNA Biosensors: The Benefits of ...€¦ · electrochemical nanobiosensors [6, 7]. The electrochemical nanobiosensors are pulling together the advantages of electrochemical](https://img.dokumen.tips/doc/110x75/5f5dab2fa5702b13b4580399/electrochemical-mirna-biosensors-the-benefits-of-electrochemical-nanobiosensors.jpg)


![Efficiency of the Electrochemical methods for the repair of ... ouarti-2018.pdf• Electrochemical chloride extraction [14-17] • Electrochemical realkalisation. [18.19] Electrochemical](https://img.dokumen.tips/doc/110x75/610237547e288528f40cbc06/efficiency-of-the-electrochemical-methods-for-the-repair-of-ouarti-2018pdf.jpg)