Embed Size (px)
Citation preview
080120044 METROLOGY AND MEASUREMENT LAB
THE KAVERY ENGINEERING COLLEGEMecheri, Salem-636453
Department of Mechanical Engineering
080120044- METROLOGY AND MEASUREMENT LAB
Name : ………………………………………
Reg No : ………………………………………
Branch : ………………………………………
Year & Semester : ………………………………………
THE KAVERY ENGINEERING COLLEGE Page 1
080120044 METROLOGY AND MEASUREMENT LAB
INDEX
Ex.No Name of the Experiment Page No.Marks
AwardedCYCLE - I
CYCLE - II
THE KAVERY ENGINEERING COLLEGE Page 2
080120044 METROLOGY AND MEASUREMENT LAB
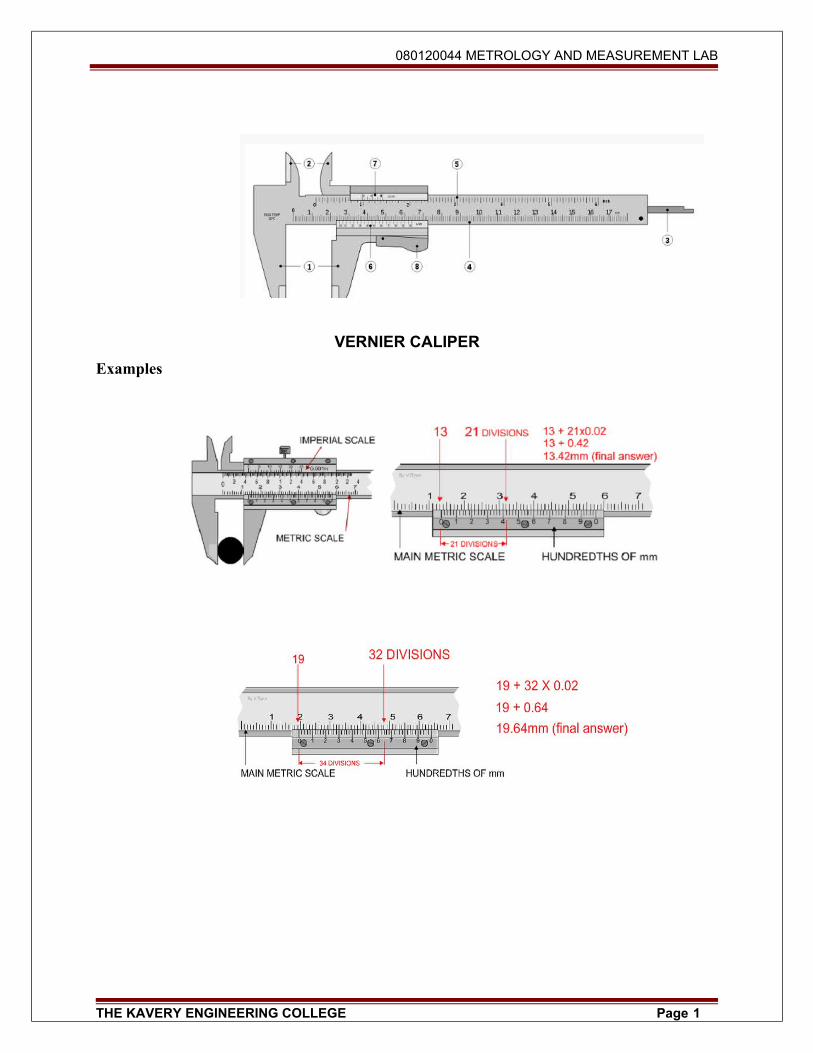
VERNIER CALIPER
Examples
THE KAVERY ENGINEERING COLLEGE Page 1
080120044 METROLOGY AND MEASUREMENT LAB
CALIBRATION AND MEASUREMENT OF COMPONENTS USING
VERNIER CALIPERExp No:
Date:
AIM:
To measure the dimensions of the given component using vernier caliper.
APPARATUS REQUIRED:
Vernier caliper Sample component
FORMULA USED:
MD=MSR+ (VSCXLC)
MD-Measured Dimension
MSR-Main Scale Reading
VSC-Vernier Scale Coincide
LC-Least Count
PROCEDURE:
• Vernier caliper is cleaned with a cloth.
• The clamping screws are loosened. • With the help of slip gauges as standard, calibrate the gauges
• The given component is fixed in both the two jaws.
• The component should be perfectly held.
• The outside diameter of component is noted.
• Then the inside diameter of the component is measured with the help of knife face.
• The thickness is measured with the external jaws.
THE KAVERY ENGINEERING COLLEGE Page 2
080120044 METROLOGY AND MEASUREMENT LAB
• The length of the component is measured by adjusting the movable jaws.
• The procedure is repeated for all the components.
• At least three readings should be taken and then average will give the accurate measurement
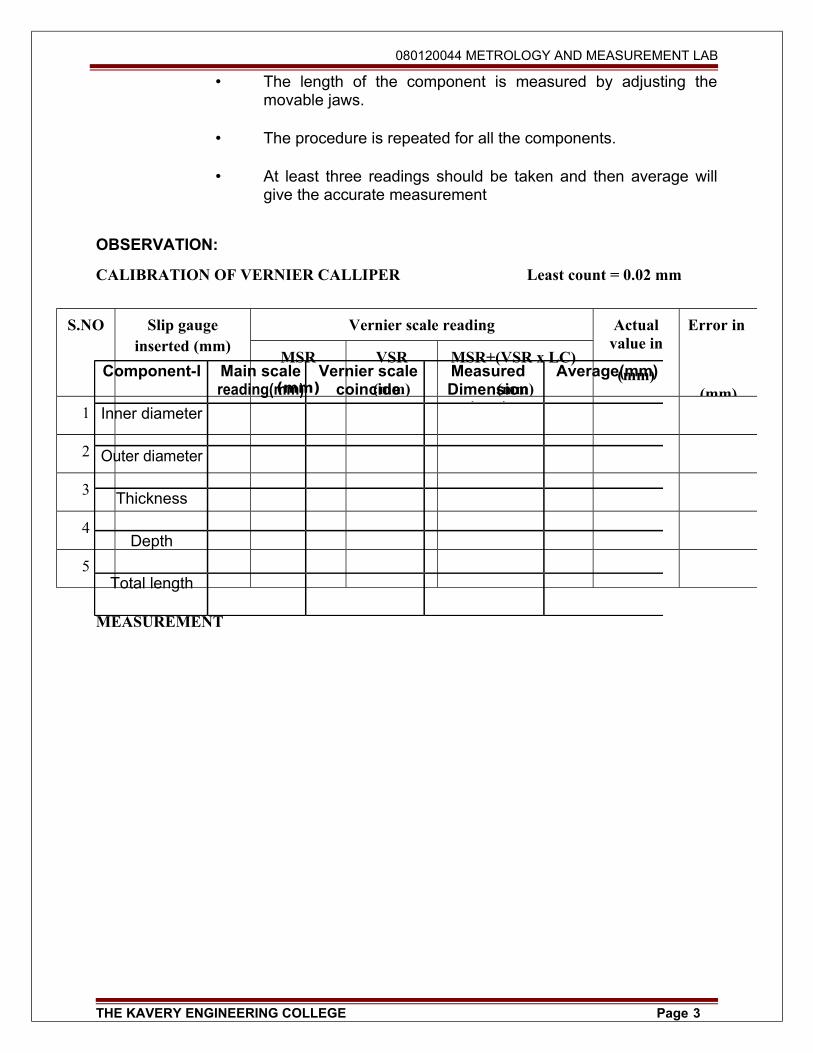
OBSERVATION:
CALIBRATION OF VERNIER CALLIPER Least count = 0.02 mm
MEASUREMENT
THE KAVERY ENGINEERING COLLEGE Page 3
S.NO Slip gauge inserted (mm)
Vernier scale reading Actual value in
(mm)
Error in
(mm)
MSR
(mm)
VSR
(mm)
MSR+(VSR x LC)
(mm)
1
2
3
4
5
Component-I Main scalereading(mm)
Vernier scalecoincide
MeasuredDimension
(mm)
Average(mm)
Inner diameter
Outer diameter
Thickness
Depth
Total length
080120044 METROLOGY AND MEASUREMENT LAB
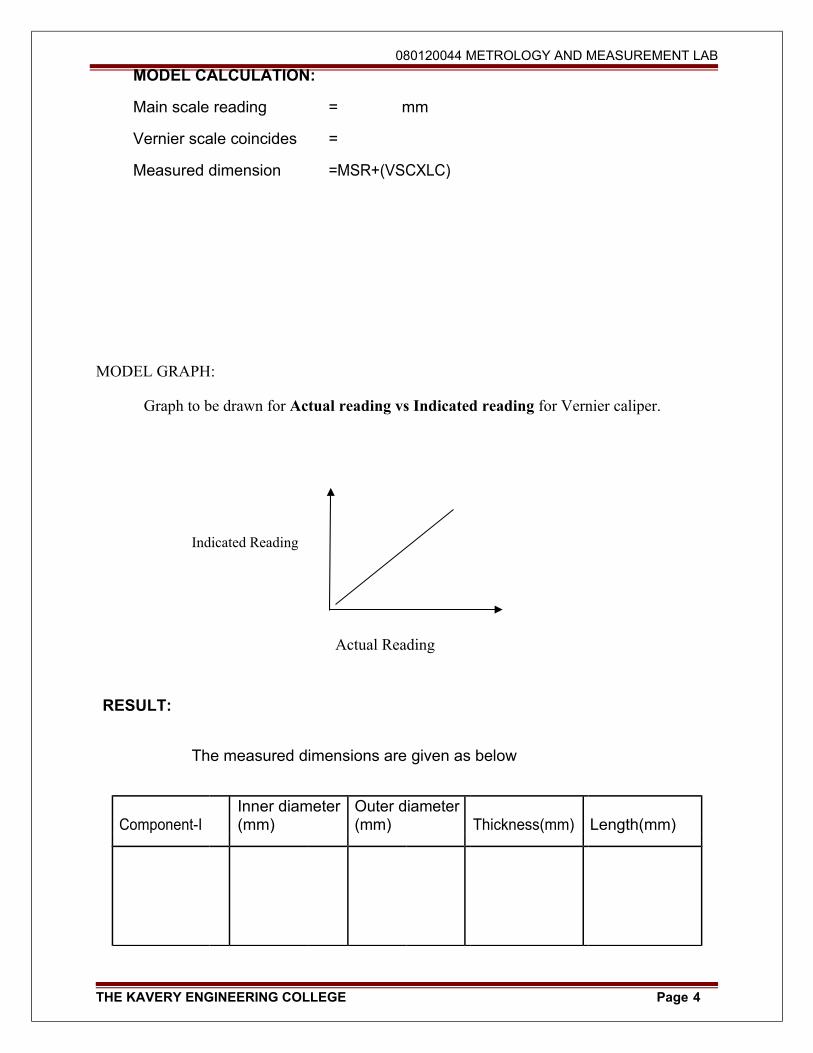
MODEL GRAPH:
Graph to be drawn for Actual reading vs Indicated reading for Vernier caliper.
Indicated Reading
Actual Reading
RESULT:
The measured dimensions are given as below
Component-IInner diameter (mm)
Outer diameter (mm) Thickness(mm) Length(mm)
THE KAVERY ENGINEERING COLLEGE Page 4
MODEL CALCULATION:
Main scale reading = mm
Vernier scale coincides =
Measured dimension =MSR+(VSCXLC)
080120044 METROLOGY AND MEASUREMENT LAB
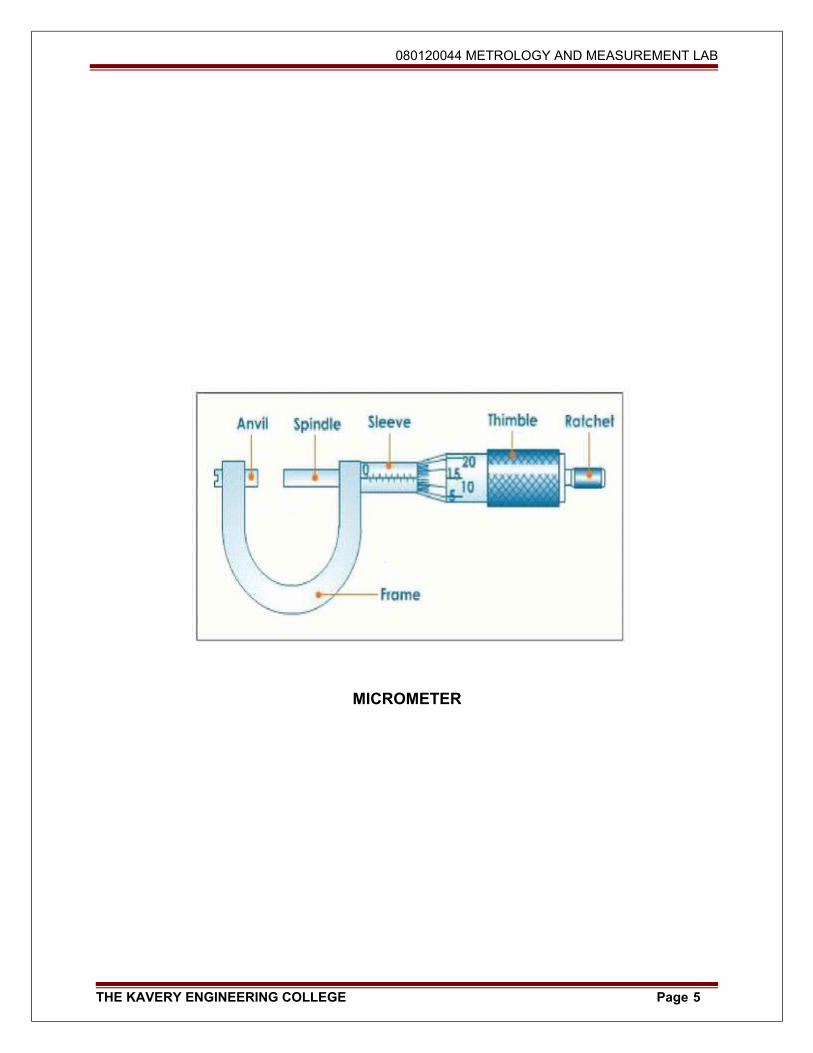
MICROMETER
THE KAVERY ENGINEERING COLLEGE Page 5
080120044 METROLOGY AND MEASUREMENT LAB
CALIBRATION AND MEASUREMENT OF COMPONENT USING MICROMETER
Exp No:
Date:
AIM:
To determine the diameter of a cylindrical component to an accuracy of 0.01mm
using micrometer to and check the result with digital micrometer.
TOOLS REQUIRED:
• Outside micrometer.
• Cylindrical component.
PROCEDURE:
1. The micrometer is checked for zero error.
2. With the help of slip gauges as standard, calibrate the gauges
3. The given component is held between the faces of the anvil and spindle.
4. The spindle is moved by rotating the thimble until the anvil and spindle
touches the cylindrical surface of the component.
5. Fine adjustment is made by ratchet .the main scale reading and thimble
scale reading are noted.
6. Two are more reading are taken at different places of the component.
7. The readings are tabulated and calculated.
THE KAVERY ENGINEERING COLLEGE Page 6
080120044 METROLOGY AND MEASUREMENT LAB
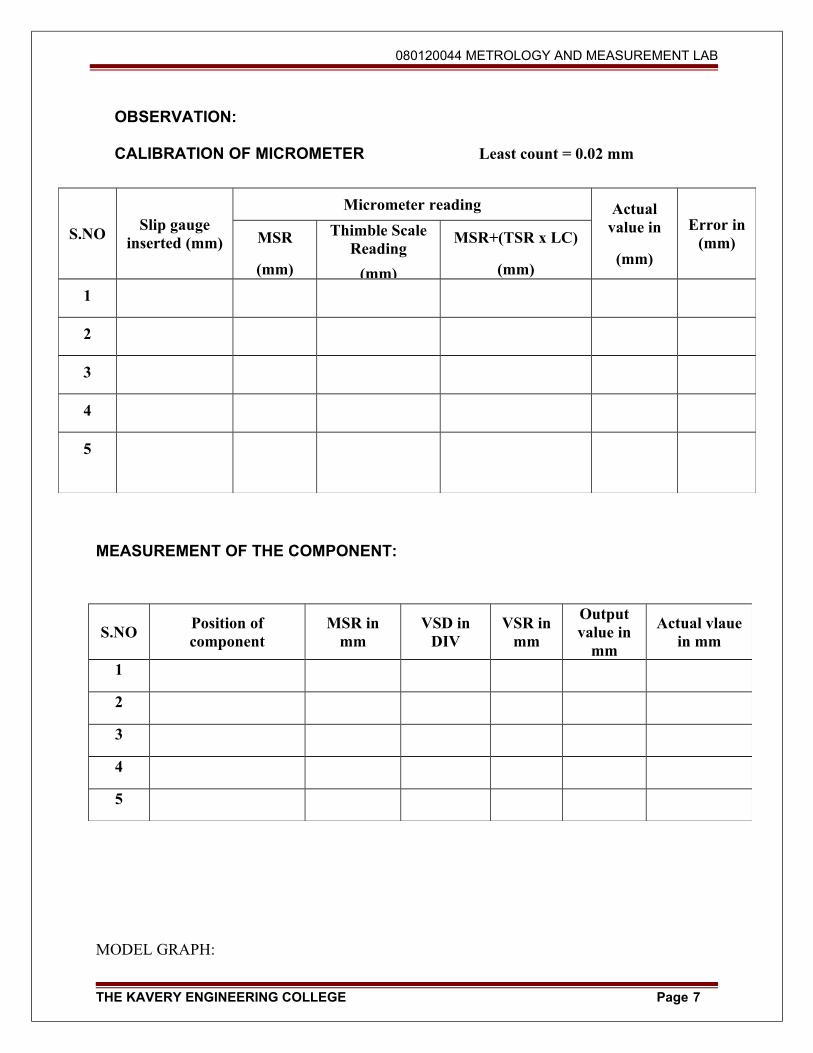
OBSERVATION:
CALIBRATION OF MICROMETER Least count = 0.02 mm
MEASUREMENT OF THE COMPONENT:
MODEL GRAPH:
THE KAVERY ENGINEERING COLLEGE Page 7
S.NOSlip gauge
inserted (mm)
Micrometer reading Actual value in
(mm)
Error in (mm)MSR
(mm)
Thimble Scale Reading
(mm)
MSR+(TSR x LC)
(mm)
1
2
3
4
5
S.NOPosition of component
MSR in mm
VSD in DIV
VSR in mm
Output value in
mm
Actual vlaue in mm
1
2
3
4
5

080120044 METROLOGY AND MEASUREMENT LAB
Graph to be drawn for Actual reading vs Indicated reading for Micrometer.
Indicated Reading
Actual Reading
RESULT:
The diameter of the given cylindrical component is
____________ mm.
THE KAVERY ENGINEERING COLLEGE Page 8
080120044 METROLOGY AND MEASUREMENT LAB
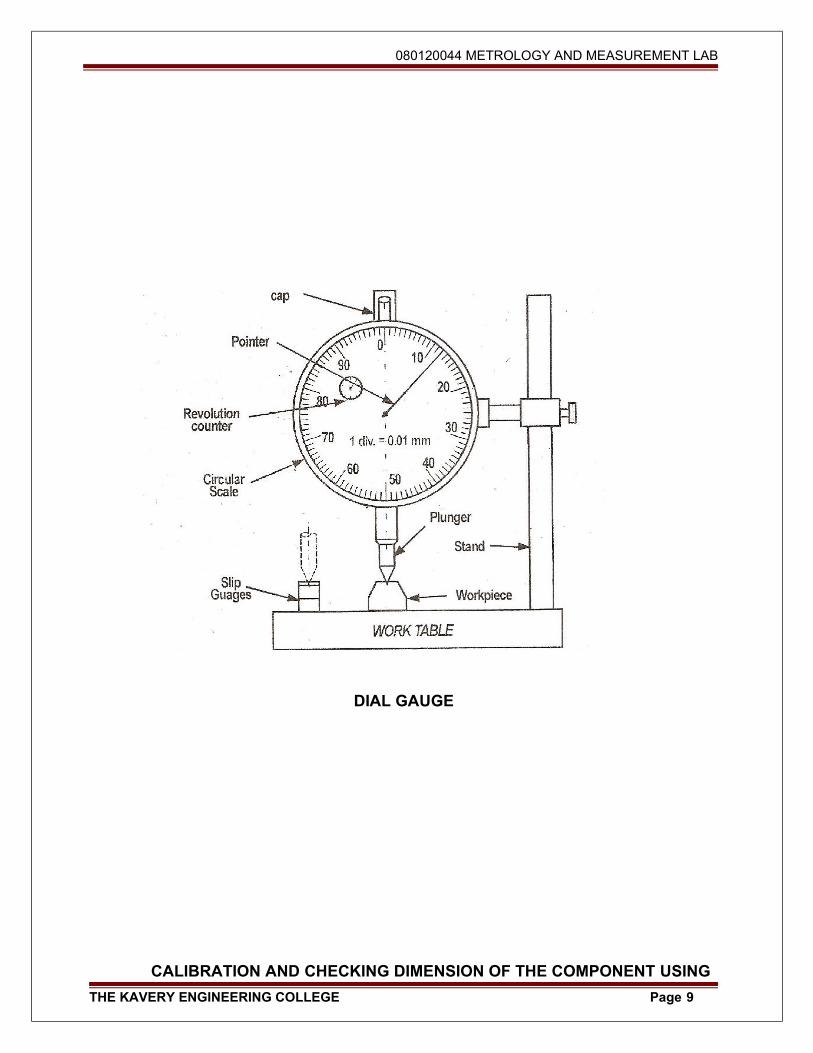
DIAL GAUGE
CALIBRATION AND CHECKING DIMENSION OF THE COMPONENT USING
THE KAVERY ENGINEERING COLLEGE Page 9
080120044 METROLOGY AND MEASUREMENT LAB
DIAL GAUGE
Exp No:
Date:
AIM:
To check the height of the machined component with standard dimensioned
component using dial gauge.
TOOLS REQUIRED:
• Slip gauge set
• Dial gauge with stand
• Surface plate
• Vernier caliper
PROCEDURE:
1. The slip gauges are built up to the given weight of the component.
2. Dial gauge with stand is placed on the surface plate.
3. The built up gauge is placed under the plunger.
4. The indicator is set to zero.
5. The built up gauge is removed.
6. The given machined component is placed under the plunger.
7. The variation in the height of the component is noted from the reading of the
dial.
THE KAVERY ENGINEERING COLLEGE Page 10
080120044 METROLOGY AND MEASUREMENT LAB
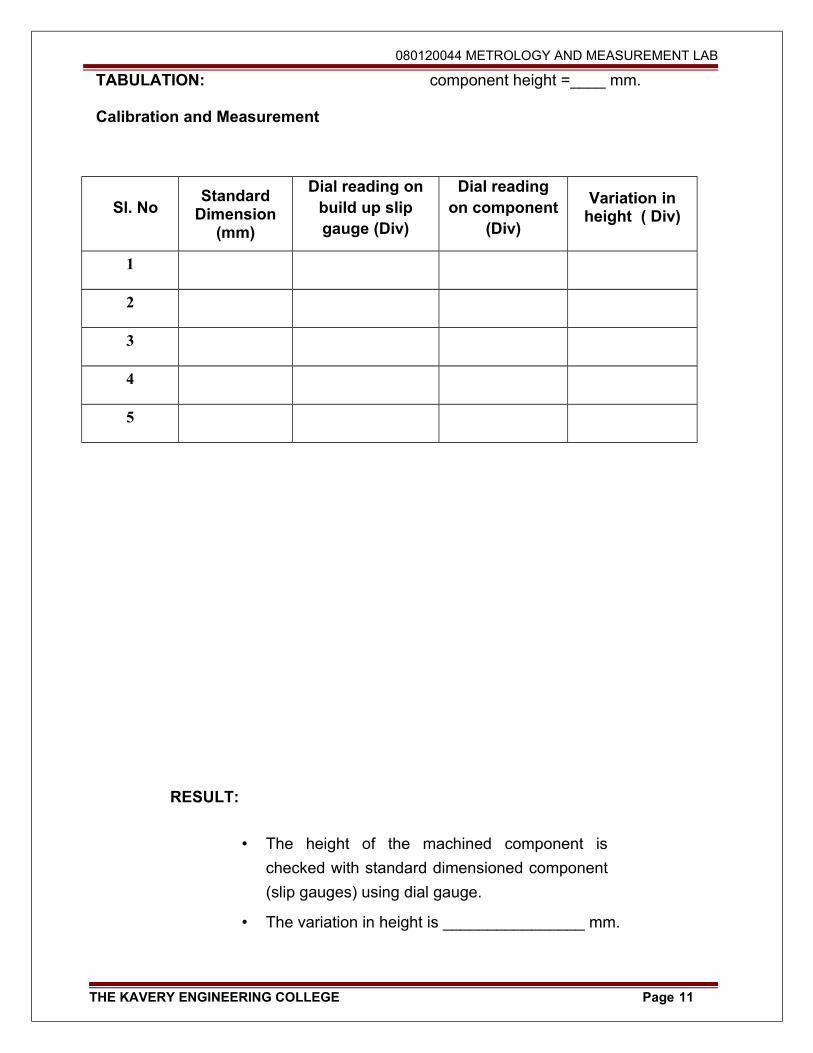
TABULATION: component height =____ mm.
Calibration and Measurement
Sl. NoStandard
Dimension (mm)
Dial reading on build up slip gauge (Div)
Dial reading on component
(Div)
Variation in height ( Div)
1
2
3
4
5
RESULT:
• The height of the machined component is
checked with standard dimensioned component
(slip gauges) using dial gauge.
• The variation in height is ________________ mm.
THE KAVERY ENGINEERING COLLEGE Page 11
080120044 METROLOGY AND MEASUREMENT LAB
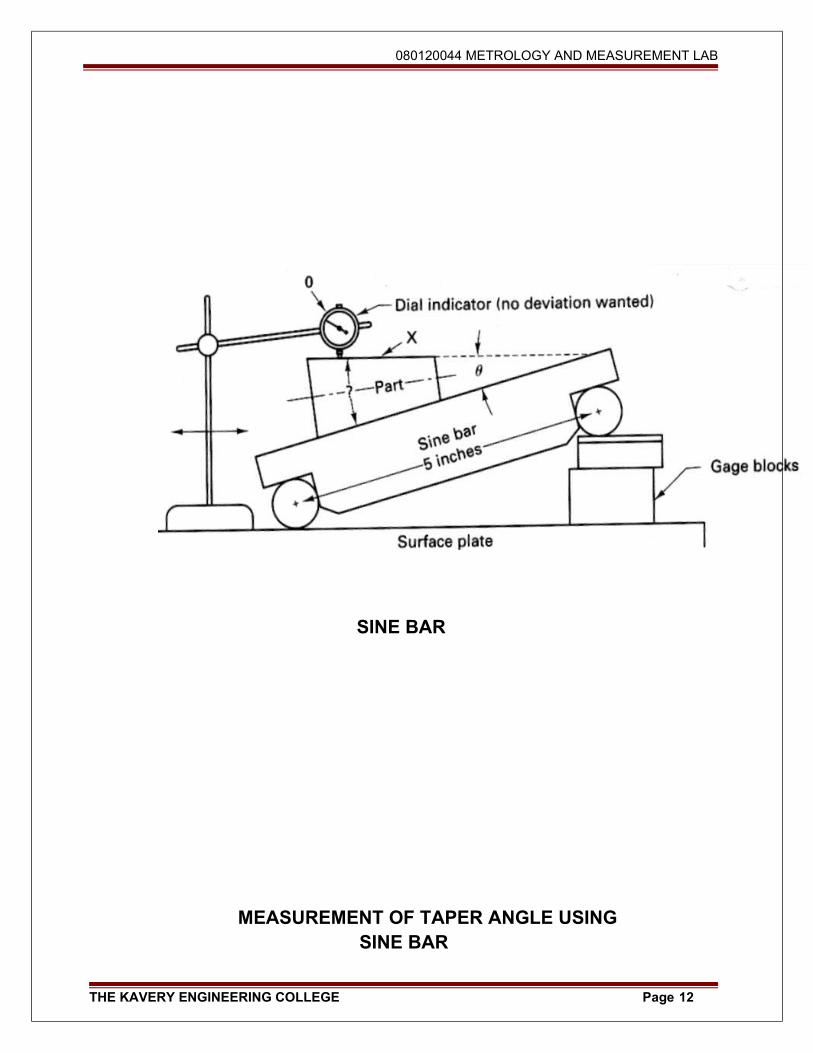
SINE BAR
MEASUREMENT OF TAPER ANGLE USING SINE BAR
THE KAVERY ENGINEERING COLLEGE Page 12
080120044 METROLOGY AND MEASUREMENT LAB
Exp no:
Date:
AIM:
To determine the taper of the given part using Sine bar.
APPARATUS REQUIRED:
• Sine bar
• Slip gauge
• Work piece
FORMULA USED:
PROCEDURE:
1. Clean the surface plate, Sine bar and Slip gauges using fine cotton
Cloth.
2. Place the Job in the smooth flat surface.
3. Place the sine bar in such a manner that the Lower surface of the Sine bar was uniformly touches the surface whose angle to be measured.
4. Calculate the angle using the Formula.
Where,
h = Vertical height of the slip gauge
L = Length of the sine bar (200 mm )
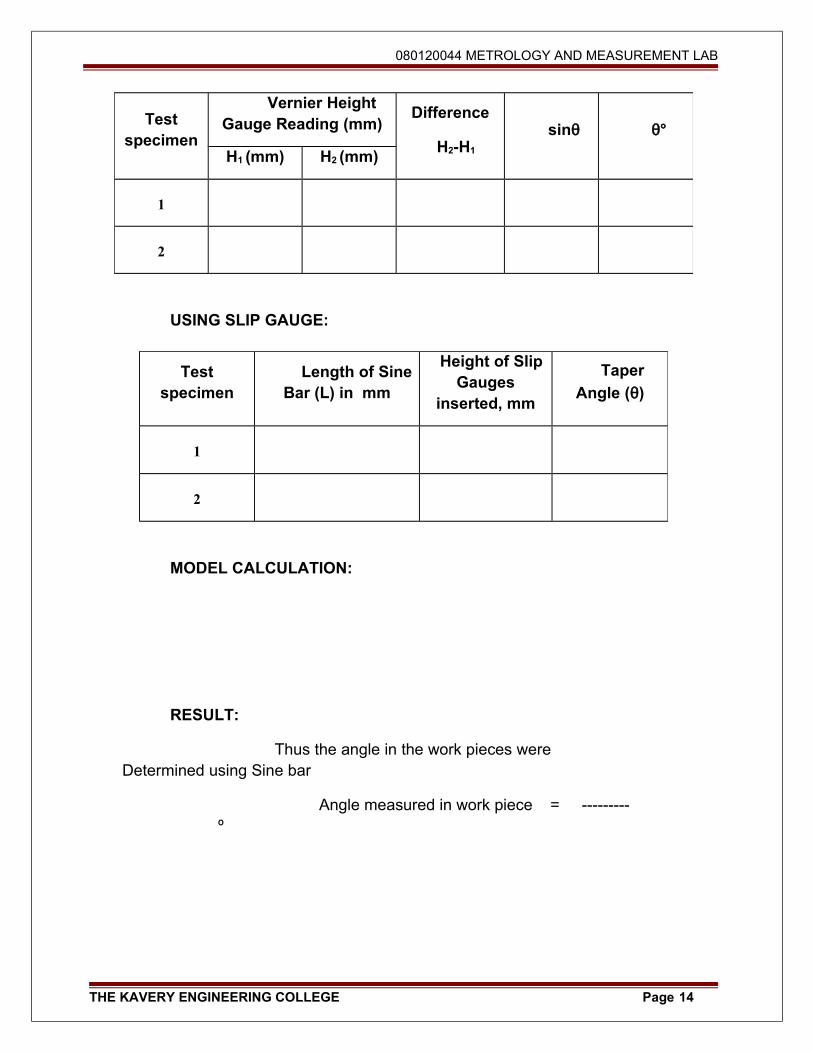
OBSERVATION:
USING VERNIER HEIGHT GAUGE:
THE KAVERY ENGINEERING COLLEGE Page 13
080120044 METROLOGY AND MEASUREMENT LAB
USING SLIP GAUGE:
MODEL CALCULATION:
RESULT:
Thus the angle in the work pieces were Determined using Sine bar
Angle measured in work piece = --------- º
THE KAVERY ENGINEERING COLLEGE Page 14
Test specimen
Vernier Height Gauge Reading (mm)
Difference
H2-H1
sinθ θ°
H1 (mm) H2 (mm)
1
2
Test specimen
Length of Sine Bar (L) in mm
Height of Slip Gauges
inserted, mm
Taper
Angle (θ)
1
2
080120044 METROLOGY AND MEASUREMENT LAB
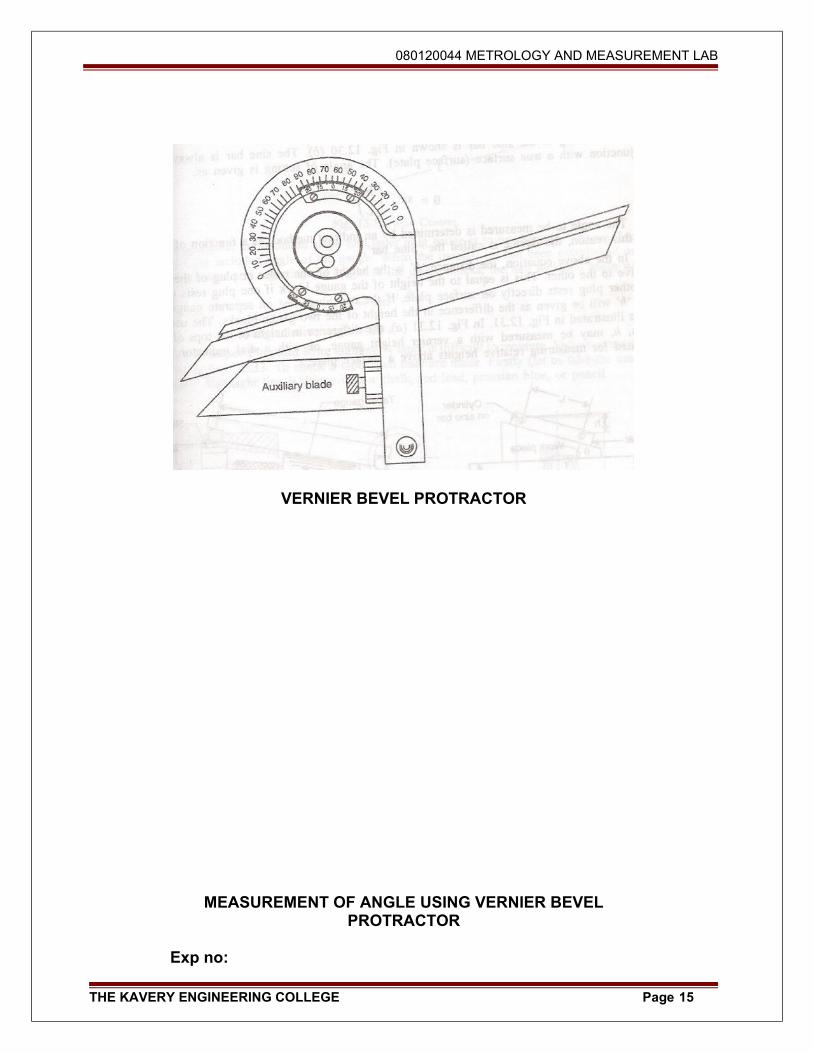
VERNIER BEVEL PROTRACTOR
MEASUREMENT OF ANGLE USING VERNIER BEVEL PROTRACTOR
Exp no:
THE KAVERY ENGINEERING COLLEGE Page 15
080120044 METROLOGY AND MEASUREMENT LAB
Date:
AIM:
To measure the angles of given specimen using bevel protractor.
APPARATUS REQUIRED:
Surface Plate, Dial Gauge, Slip Gauge, Bevel protractor, specimen
PROCEDURE:
1. Initially bevel protractor is adjusted as per
requirements.
2. Specimen is placed between the blades.
3. Reading noted directly from main scale and
Vernier scale
4. For measuring, taper angle of sine bar,
protractor is fixed to height gauge.
5. The protractor is corresponding adjusted.
6. Noted reading is tabulated.
RESULT:
Thus angle of given specimens was determined.
THE KAVERY ENGINEERING COLLEGE Page 16
080120044 METROLOGY AND MEASUREMENT LAB
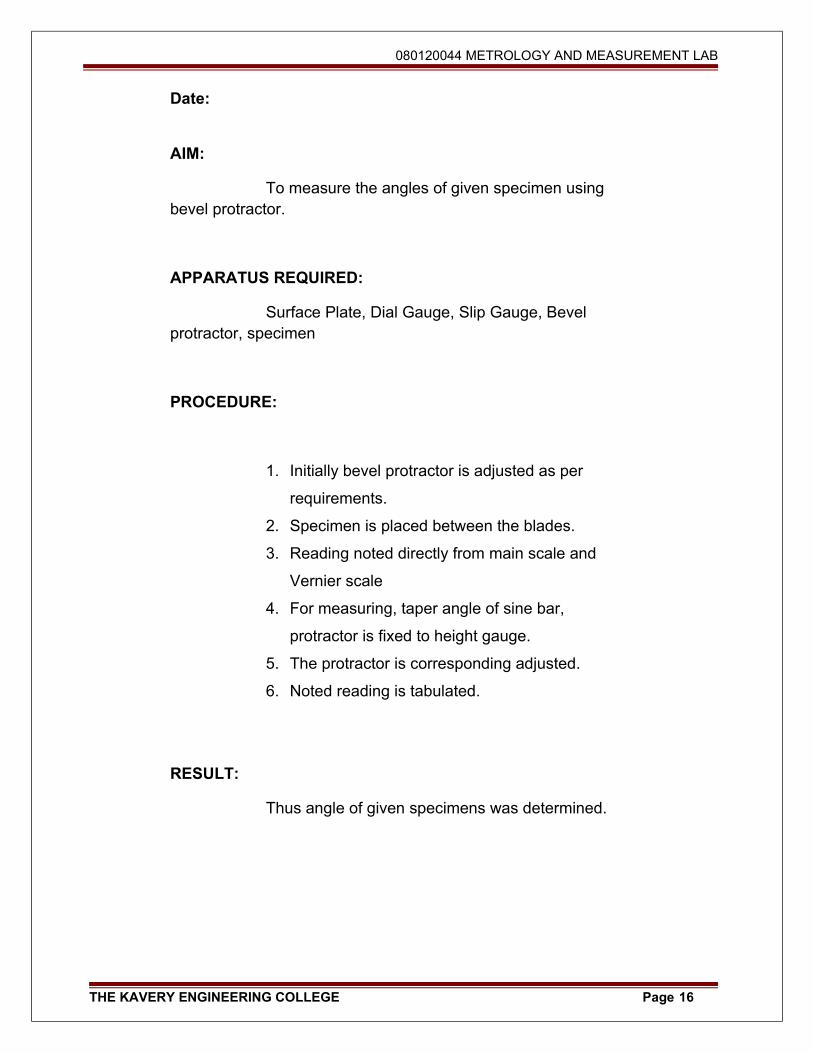
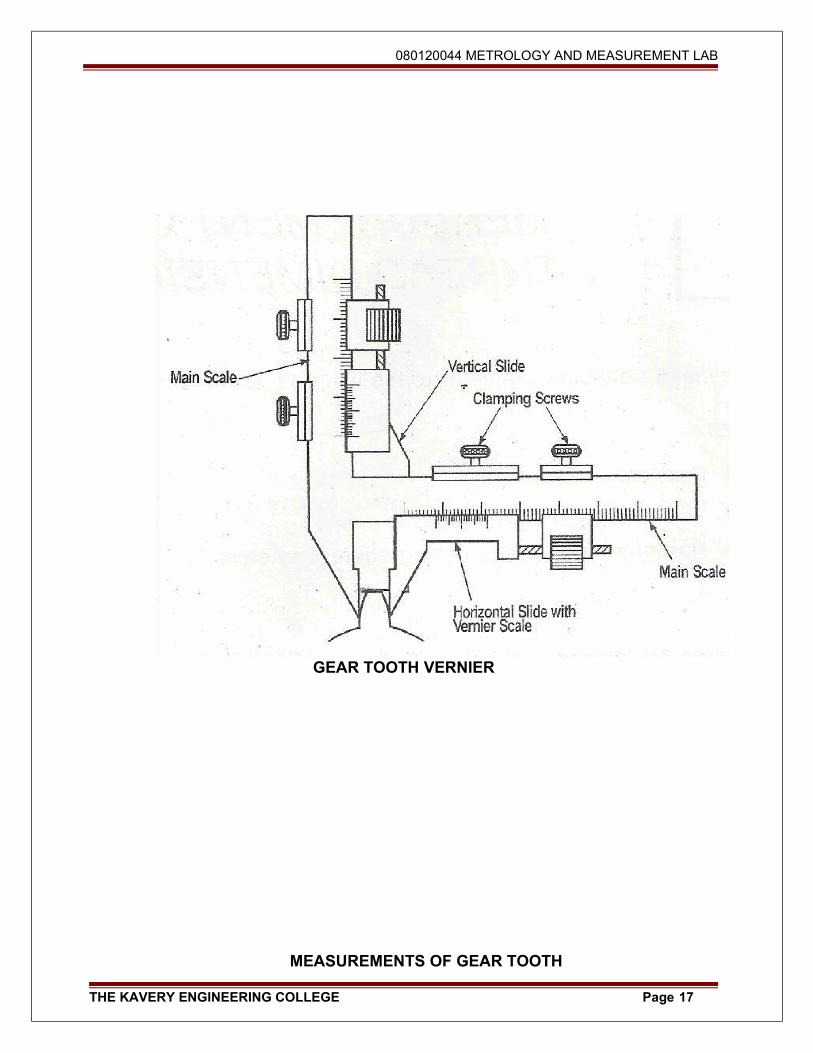
GEAR TOOTH VERNIER
MEASUREMENTS OF GEAR TOOTH
THE KAVERY ENGINEERING COLLEGE Page 17
080120044 METROLOGY AND MEASUREMENT LAB
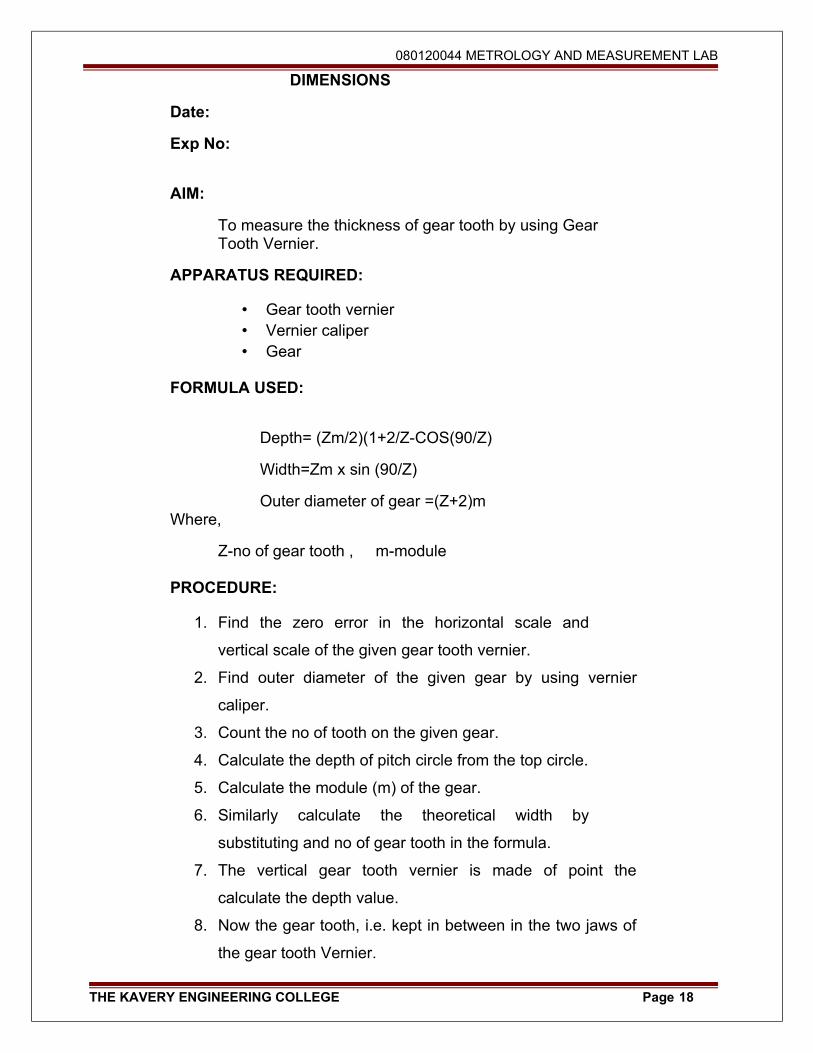
DIMENSIONS
Date:
Exp No:
AIM:
To measure the thickness of gear tooth by using Gear Tooth Vernier.
APPARATUS REQUIRED:
• Gear tooth vernier • Vernier caliper • Gear
FORMULA USED:
Depth= (Zm/2)(1+2/Z-COS(90/Z)
Width=Zm x sin (90/Z)
Outer diameter of gear =(Z+2)mWhere,
Z-no of gear tooth , m-module
PROCEDURE:
1. Find the zero error in the horizontal scale and
vertical scale of the given gear tooth vernier.
2. Find outer diameter of the given gear by using vernier
caliper.
3. Count the no of tooth on the given gear.
4. Calculate the depth of pitch circle from the top circle.
5. Calculate the module (m) of the gear.
6. Similarly calculate the theoretical width by
substituting and no of gear tooth in the formula.
7. The vertical gear tooth vernier is made of point the
calculate the depth value.
8. Now the gear tooth, i.e. kept in between in the two jaws of
the gear tooth Vernier.
THE KAVERY ENGINEERING COLLEGE Page 18
080120044 METROLOGY AND MEASUREMENT LAB
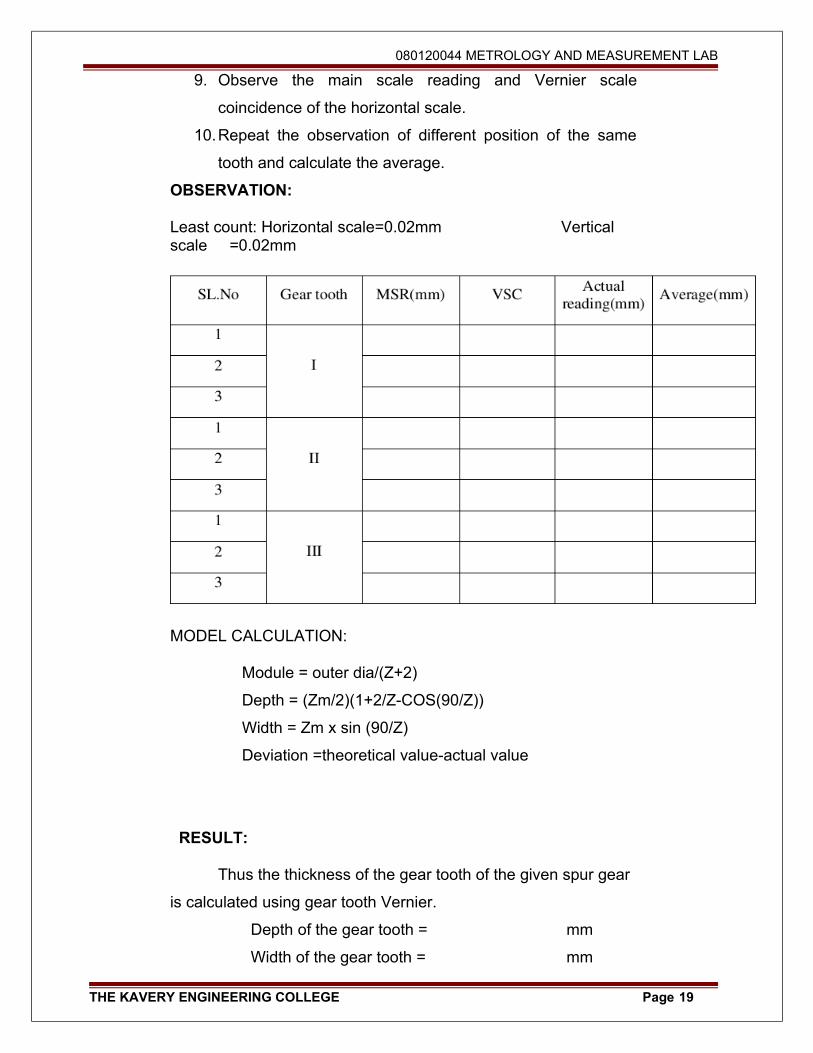
9. Observe the main scale reading and Vernier scale
coincidence of the horizontal scale.
10.Repeat the observation of different position of the same
tooth and calculate the average.
OBSERVATION:
Least count: Horizontal scale=0.02mm Vertical scale =0.02mm
MODEL CALCULATION:
Module = outer dia/(Z+2)
Depth = (Zm/2)(1+2/Z-COS(90/Z))
Width = Zm x sin (90/Z)
Deviation =theoretical value-actual value
RESULT:
Thus the thickness of the gear tooth of the given spur gear
is calculated using gear tooth Vernier.
Depth of the gear tooth = mm
Width of the gear tooth = mm
THE KAVERY ENGINEERING COLLEGE Page 19

080120044 METROLOGY AND MEASUREMENT LAB
Theoretical value = mm
Actual value = mm
TOOL MAKER’S MIXCROMETER
THE KAVERY ENGINEERING COLLEGE Page 20
080120044 METROLOGY AND MEASUREMENT LAB
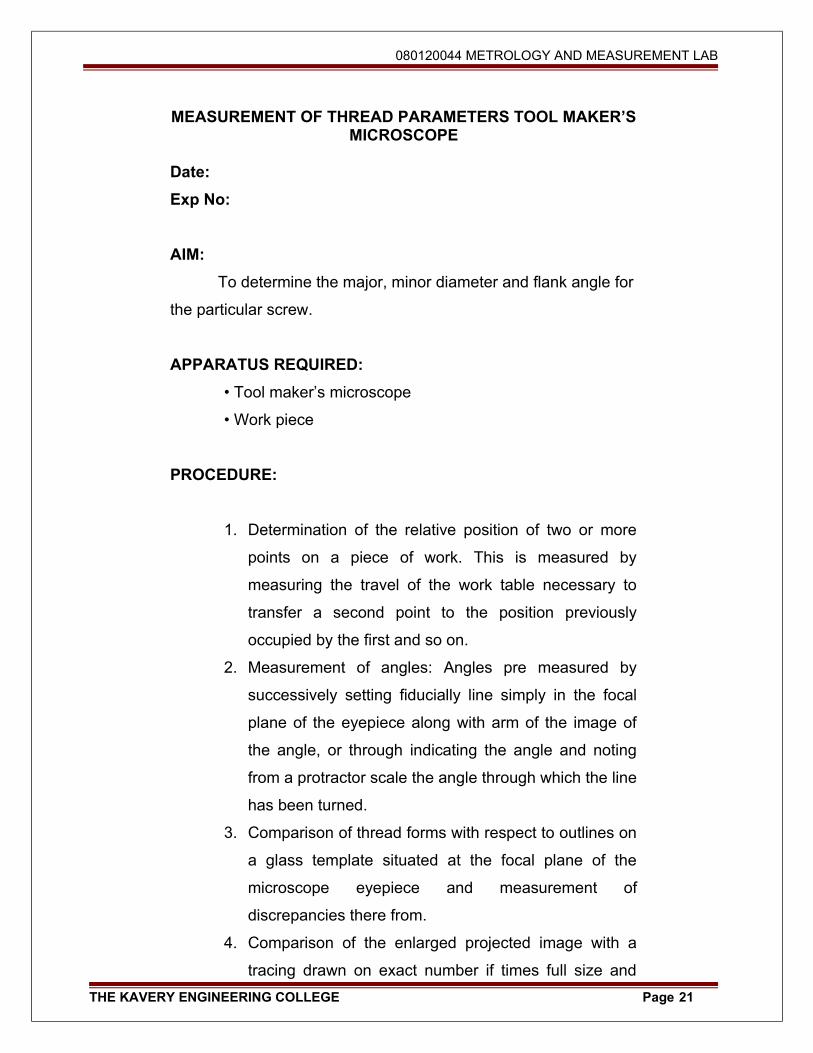
MEASUREMENT OF THREAD PARAMETERS TOOL MAKER’S MICROSCOPE
Date:
Exp No:
AIM:
To determine the major, minor diameter and flank angle for
the particular screw.
APPARATUS REQUIRED:
• Tool maker’s microscope
• Work piece
PROCEDURE:
1. Determination of the relative position of two or more
points on a piece of work. This is measured by
measuring the travel of the work table necessary to
transfer a second point to the position previously
occupied by the first and so on.
2. Measurement of angles: Angles pre measured by
successively setting fiducially line simply in the focal
plane of the eyepiece along with arm of the image of
the angle, or through indicating the angle and noting
from a protractor scale the angle through which the line
has been turned.
3. Comparison of thread forms with respect to outlines on
a glass template situated at the focal plane of the
microscope eyepiece and measurement of
discrepancies there from.
4. Comparison of the enlarged projected image with a
tracing drawn on exact number if times full size and
THE KAVERY ENGINEERING COLLEGE Page 21
080120044 METROLOGY AND MEASUREMENT LAB
affixed to the projection screen.
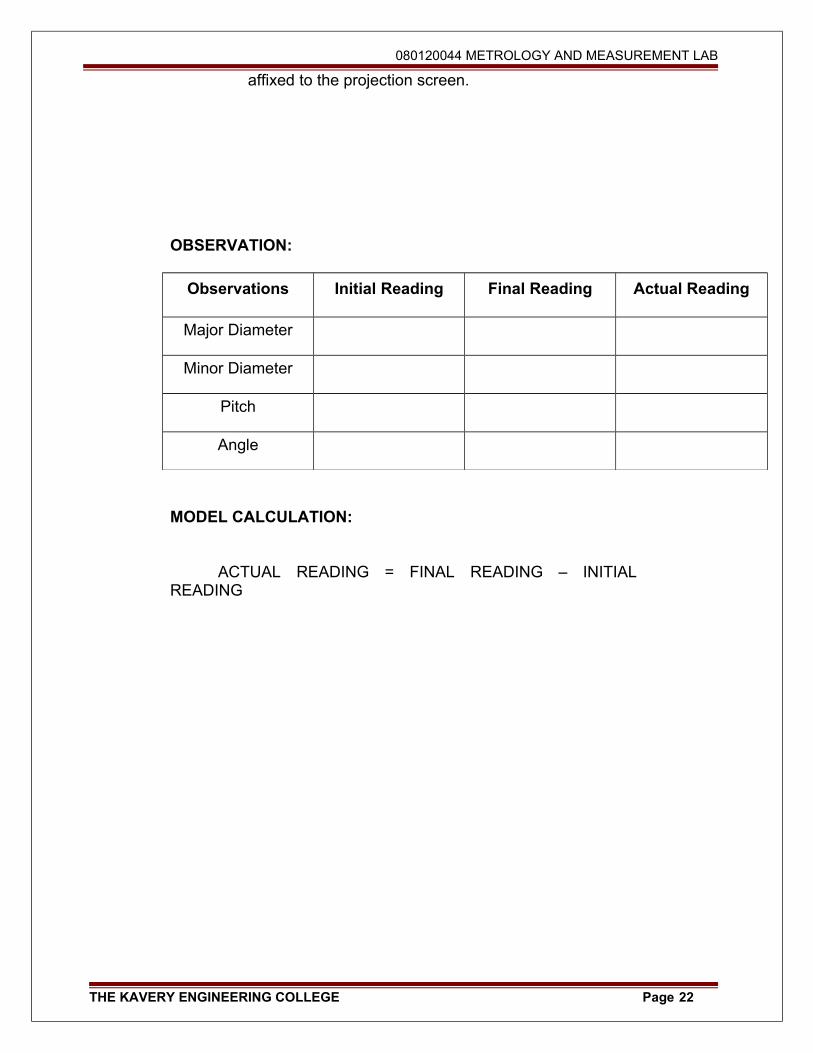
OBSERVATION:
Observations Initial Reading Final Reading Actual Reading
Major Diameter
Minor Diameter
Pitch
Angle
MODEL CALCULATION:
ACTUAL READING = FINAL READING – INITIAL READING
THE KAVERY ENGINEERING COLLEGE Page 22

080120044 METROLOGY AND MEASUREMENT LAB
RESULT:
Thus the all dimensions of the given particular screw were measured by using tool maker’s microscope.
MEASUREMENT SET UP
THE KAVERY ENGINEERING COLLEGE Page 23
080120044 METROLOGY AND MEASUREMENT LAB
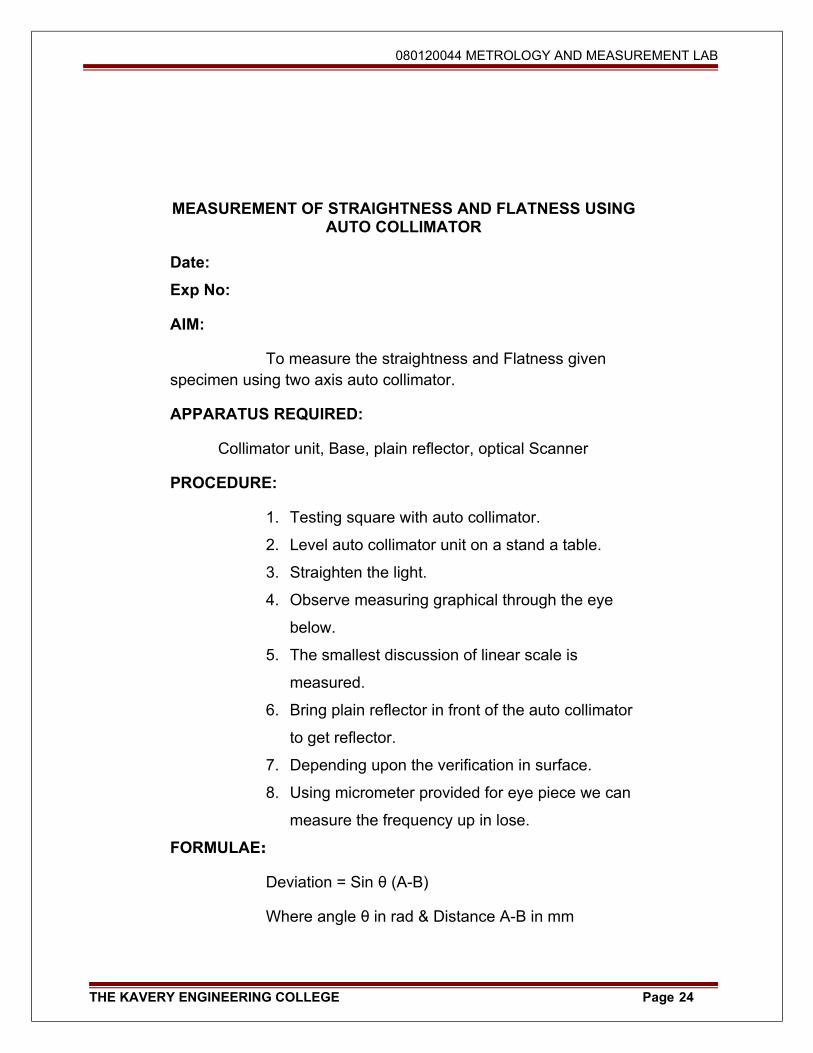
MEASUREMENT OF STRAIGHTNESS AND FLATNESS USING AUTO COLLIMATOR
Date:
Exp No:
AIM:
To measure the straightness and Flatness given specimen using two axis auto collimator.
APPARATUS REQUIRED:
Collimator unit, Base, plain reflector, optical Scanner
PROCEDURE:
1. Testing square with auto collimator.
2. Level auto collimator unit on a stand a table.
3. Straighten the light.
4. Observe measuring graphical through the eye
below.
5. The smallest discussion of linear scale is
measured.
6. Bring plain reflector in front of the auto collimator
to get reflector.
7. Depending upon the verification in surface.
8. Using micrometer provided for eye piece we can
measure the frequency up in lose.
FORMULAE:
Deviation = Sin θ (A-B)
Where angle θ in rad & Distance A-B in mm
THE KAVERY ENGINEERING COLLEGE Page 24
080120044 METROLOGY AND MEASUREMENT LAB
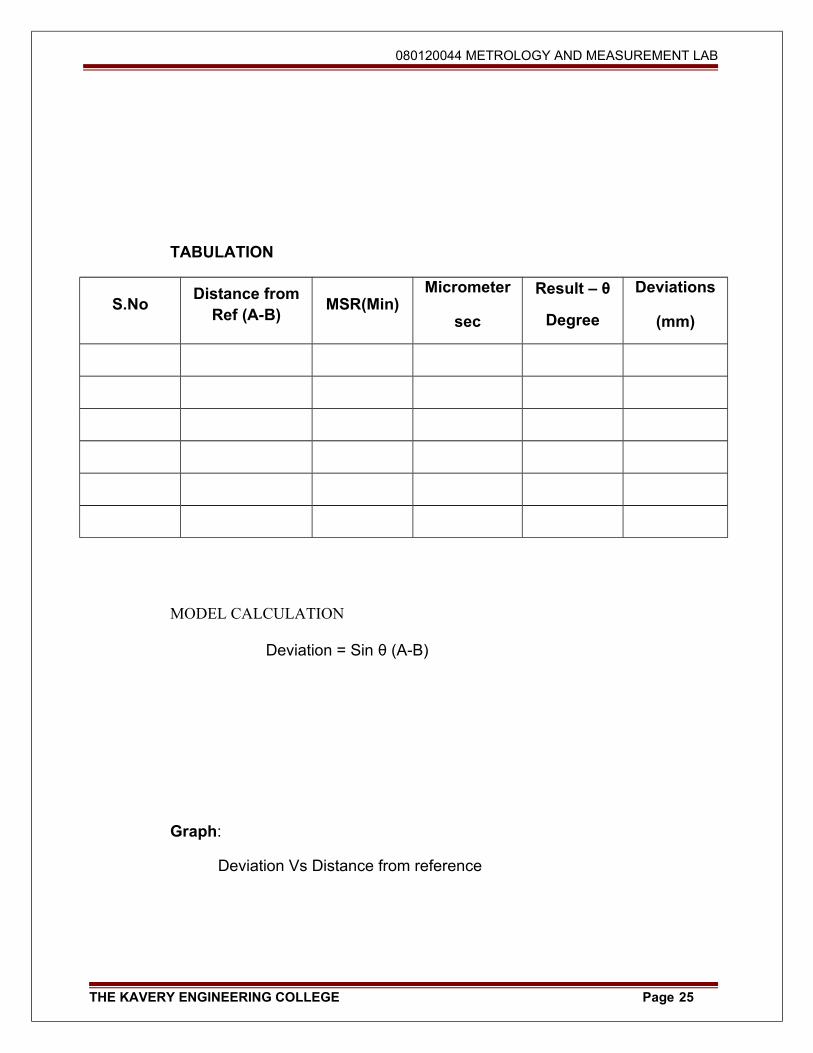
TABULATION
S.NoDistance from
Ref (A-B)MSR(Min)
Micrometer
sec
Result – θ
Degree
Deviations
(mm)
MODEL CALCULATION
Deviation = Sin θ (A-B)
Graph:
Deviation Vs Distance from reference
THE KAVERY ENGINEERING COLLEGE Page 25
080120044 METROLOGY AND MEASUREMENT LAB
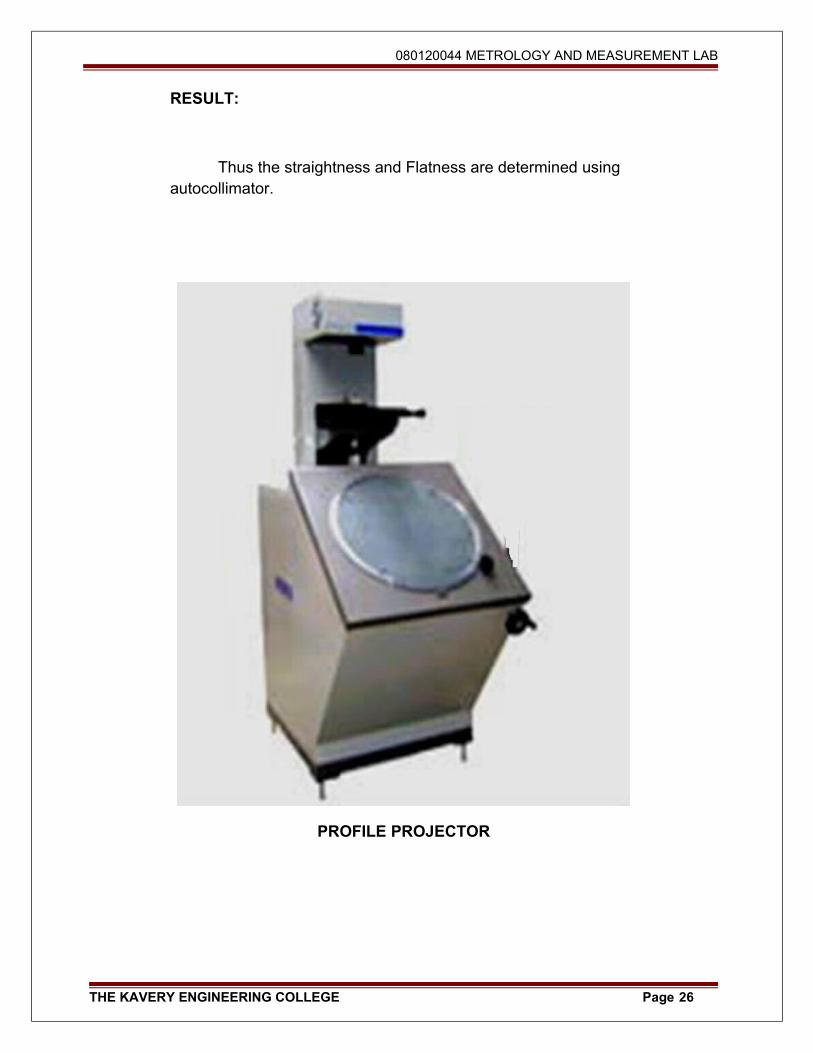
RESULT:
Thus the straightness and Flatness are determined using autocollimator.
PROFILE PROJECTOR
THE KAVERY ENGINEERING COLLEGE Page 26
080120044 METROLOGY AND MEASUREMENT LAB
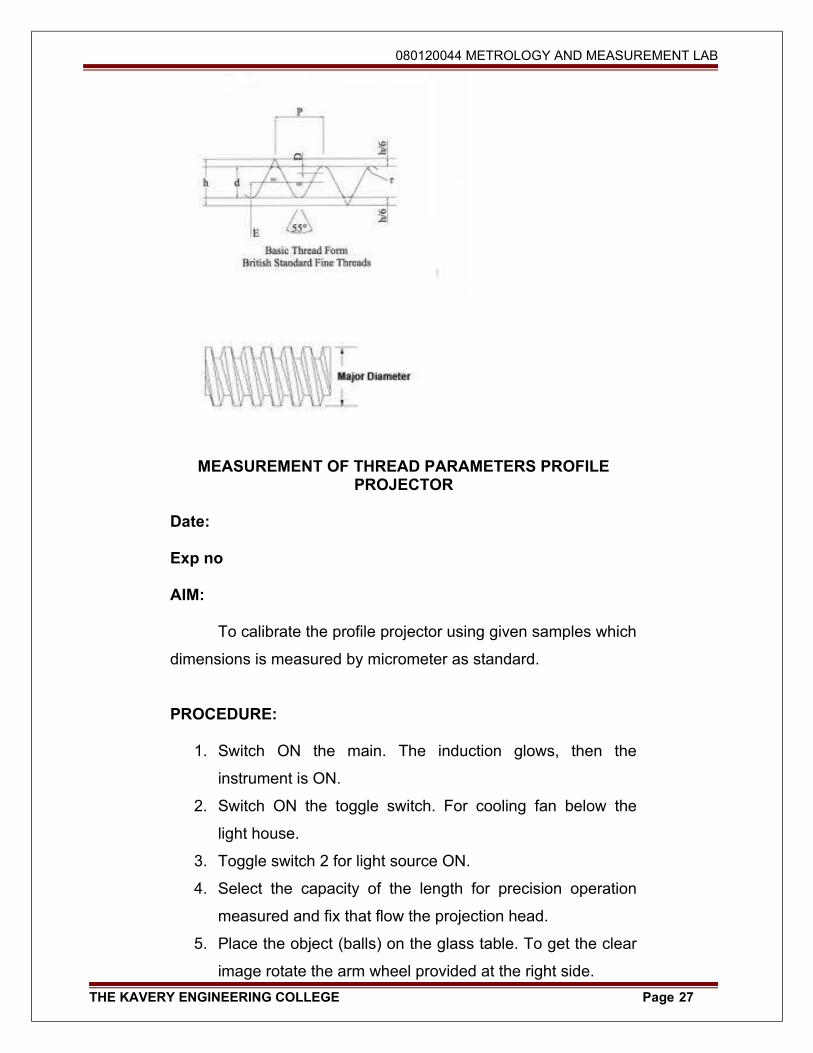
MEASUREMENT OF THREAD PARAMETERS PROFILE PROJECTOR
Date:
Exp no
AIM:
To calibrate the profile projector using given samples which
dimensions is measured by micrometer as standard.
PROCEDURE:
1. Switch ON the main. The induction glows, then the
instrument is ON.
2. Switch ON the toggle switch. For cooling fan below the
light house.
3. Toggle switch 2 for light source ON.
4. Select the capacity of the length for precision operation
measured and fix that flow the projection head.
5. Place the object (balls) on the glass table. To get the clear
image rotate the arm wheel provided at the right side.
THE KAVERY ENGINEERING COLLEGE Page 27
080120044 METROLOGY AND MEASUREMENT LAB
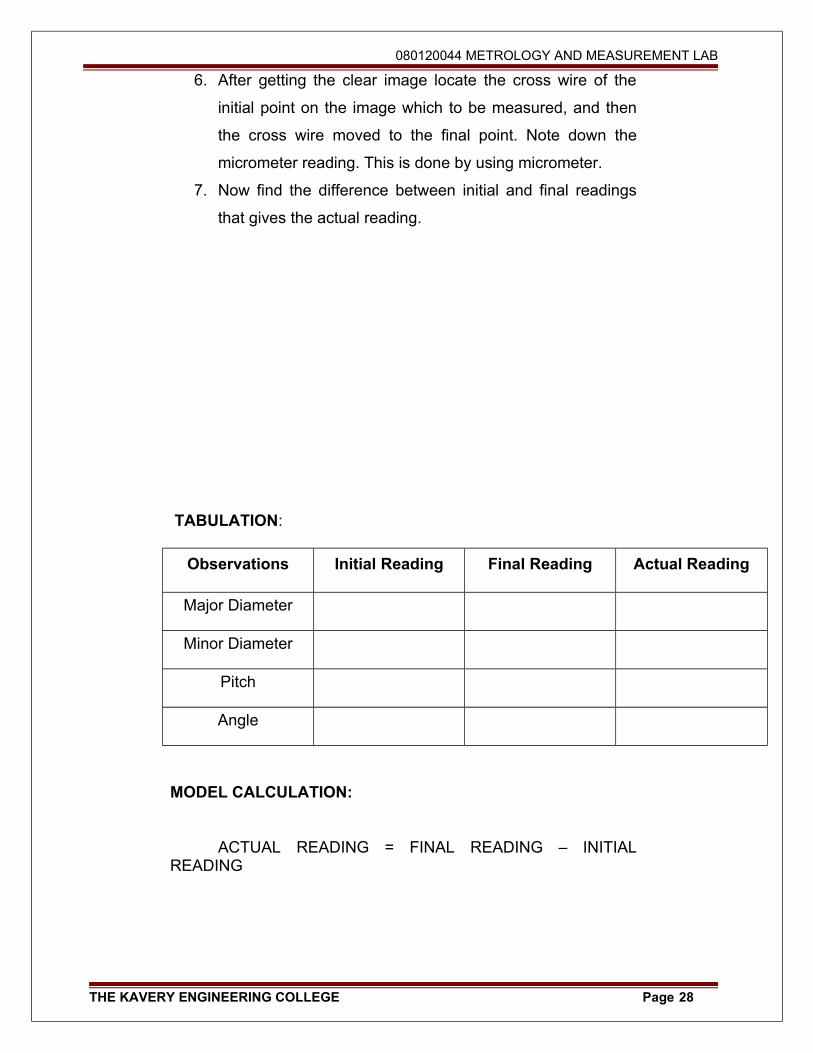
6. After getting the clear image locate the cross wire of the
initial point on the image which to be measured, and then
the cross wire moved to the final point. Note down the
micrometer reading. This is done by using micrometer.
7. Now find the difference between initial and final readings
that gives the actual reading.
TABULATION:
Observations Initial Reading Final Reading Actual Reading
Major Diameter
Minor Diameter
Pitch
Angle
MODEL CALCULATION:
ACTUAL READING = FINAL READING – INITIAL READING
THE KAVERY ENGINEERING COLLEGE Page 28
080120044 METROLOGY AND MEASUREMENT LAB
RESULT:
Thus the dimension of given samples are measured by using profile projector.
THE KAVERY ENGINEERING COLLEGE Page 29
080120044 METROLOGY AND MEASUREMENT LAB
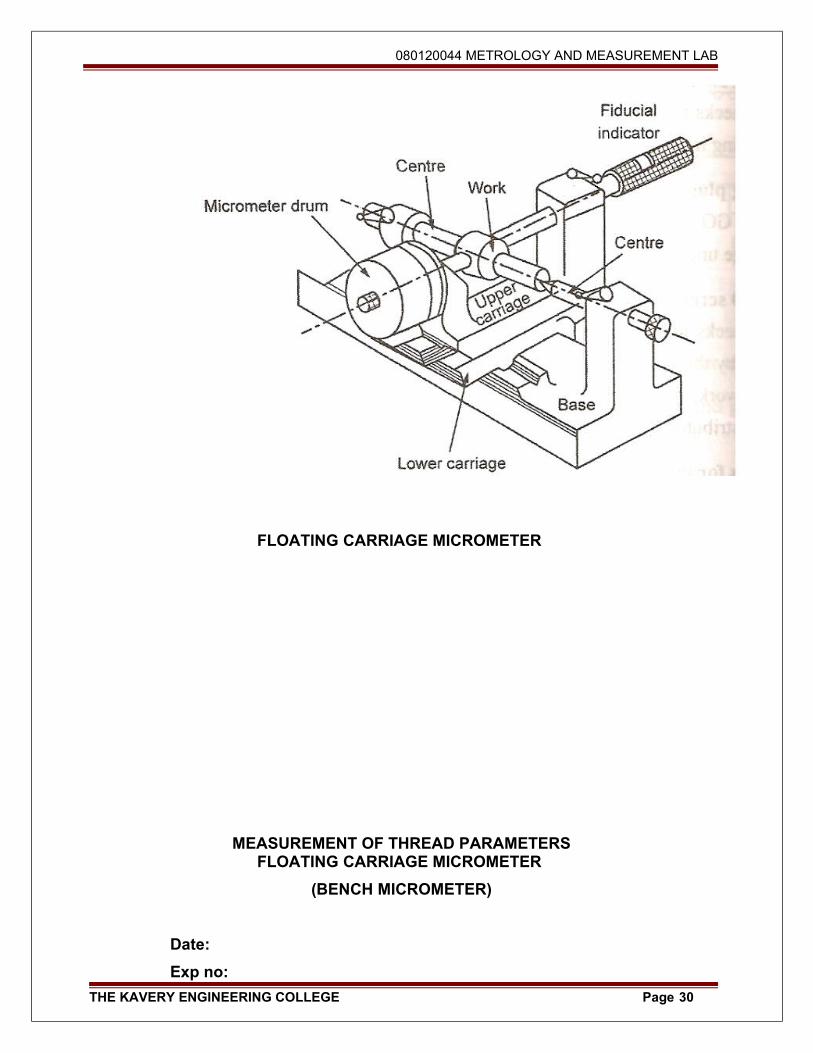
FLOATING CARRIAGE MICROMETER
MEASUREMENT OF THREAD PARAMETERS FLOATING CARRIAGE MICROMETER
(BENCH MICROMETER)
Date:
Exp no:
THE KAVERY ENGINEERING COLLEGE Page 30
080120044 METROLOGY AND MEASUREMENT LAB
AIM:
To measure the major diameter of screw thread using
floating carriage micrometer.
PROCEDURE:
1. Clear all the parts with tissue paper or soft cloth. Put the
base (A) on the form elevation table on surface plate level
the machine with the help of screw (E) in such a way that
the floating top remains steady at any position without
gravitational motion.
2. Put floating top (O) on the carriage with two balls between
the two stopper fins on one side V groove of carriage (B)
and floating top (C). Put one ball on other V groove on
other side of floating top between the stopper pins.
3. Insert the micrometer(F) provided with machine in one side
of the floating top nearer to observer and tight lever(Y) and
screw provided on floating top (C). Insert the ‘O’ indicator
(C) on the other side of the V groove on floating and tight
the lever and screw.
4. Now the machine is ready to take the readings.
MEASUREMENT AND CALCULATION:
Major diameter measurement
The dia of the setting master on a cylinder should be nearly
same as the dia of the thread gauge. The advantage of using
setting master is it gives similarly of contact of anvils and radius
error in measurement the setting is held between the centers. The
master cylinder is then replaced by the threaded work piece on
threaded gauge and then second reading is taken.
D-Diameter of setting master.
R1 - Micrometer reading over setting master.
THE KAVERY ENGINEERING COLLEGE Page 31
080120044 METROLOGY AND MEASUREMENT LAB
R2 - Micrometer reading of threaded work
piece or gauge.
Then, Major diameter D+ different between R1 and R2
The +or –is determined by relative size of master and work piece.
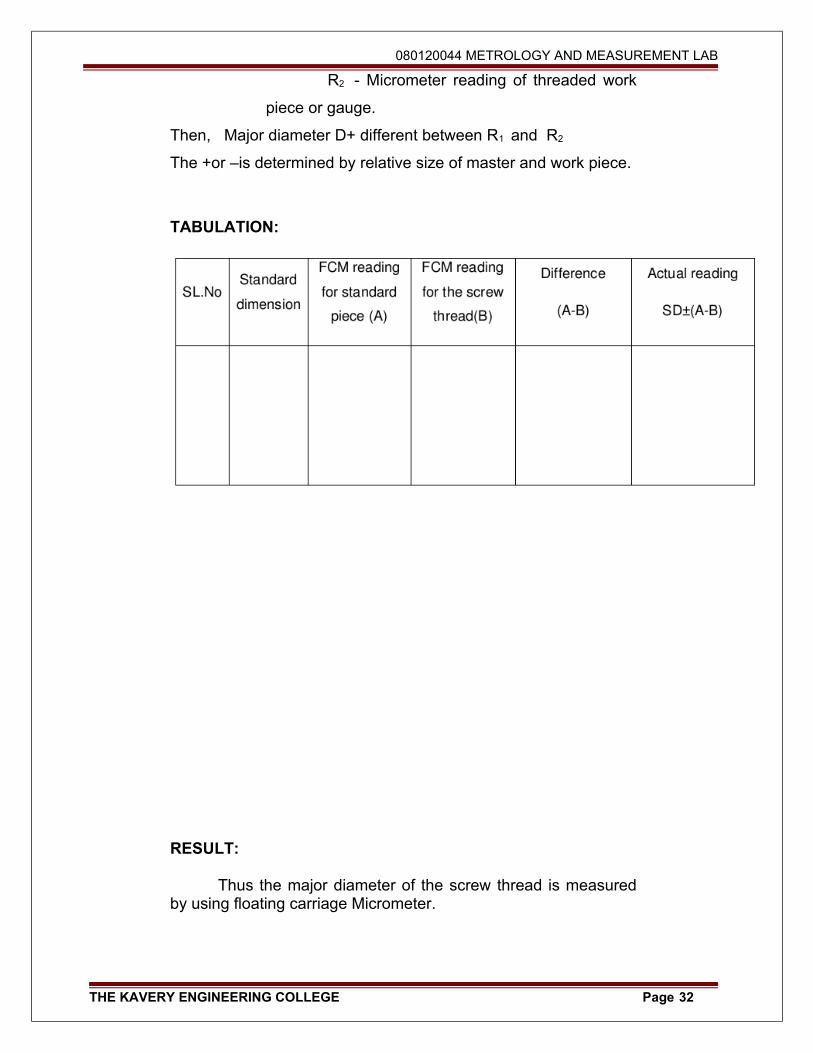
TABULATION:
RESULT:
Thus the major diameter of the screw thread is measured by using floating carriage Micrometer.
THE KAVERY ENGINEERING COLLEGE Page 32
080120044 METROLOGY AND MEASUREMENT LAB
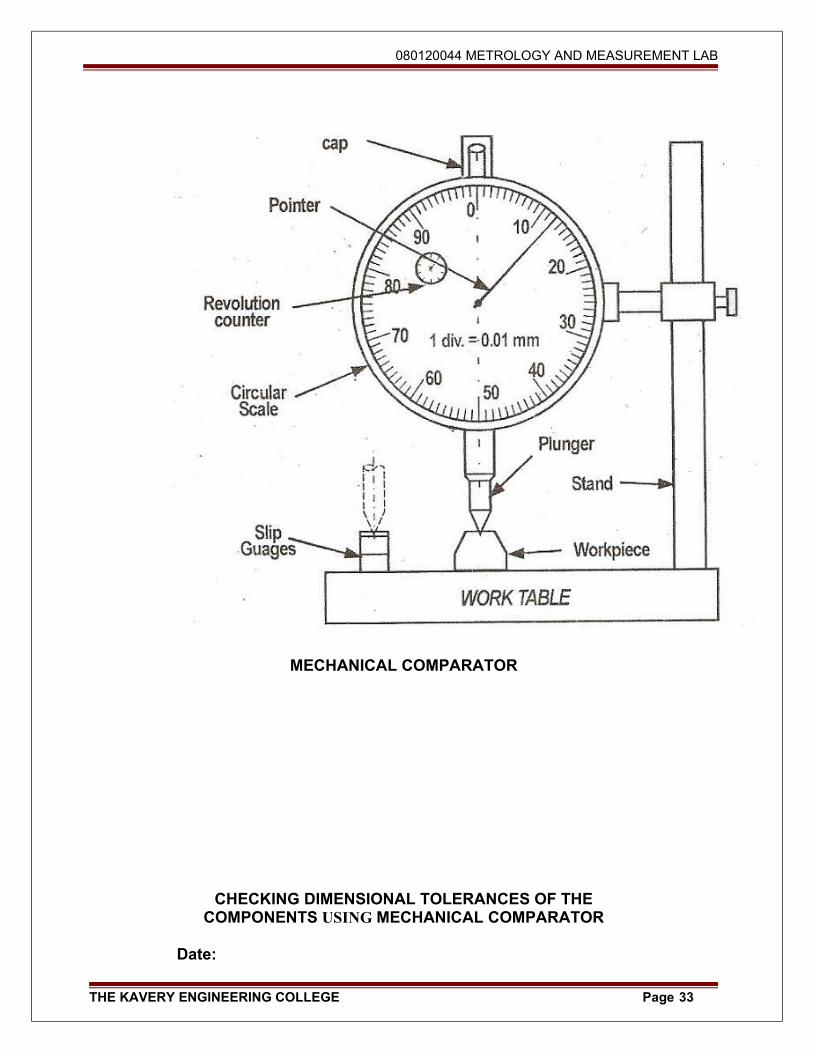
MECHANICAL COMPARATOR
CHECKING DIMENSIONAL TOLERANCES OF THE COMPONENTS USING MECHANICAL COMPARATOR
Date:
THE KAVERY ENGINEERING COLLEGE Page 33

080120044 METROLOGY AND MEASUREMENT LAB
Exp no:
AIM:
To check the height of the machined component with
standard dimensioned component using dial gauge.
TOOLS REQUIRED:
• Slip gauge set
• Dial gauge with stand
• Surface plate
• Vernier caliper
PROCEDURE:
1. The slip gauges are built up to the given Height of
the component.
2. Dial gauge with stand is placed on the surface
plate.
3. The built up gauge is placed under the plunger.
4. The indicator is set to zero.
5. The built up gauge is removed.
6. The given machined component is placed under
the plunger.
7. The variation in the height of the component is
noted from the reading of the dial.
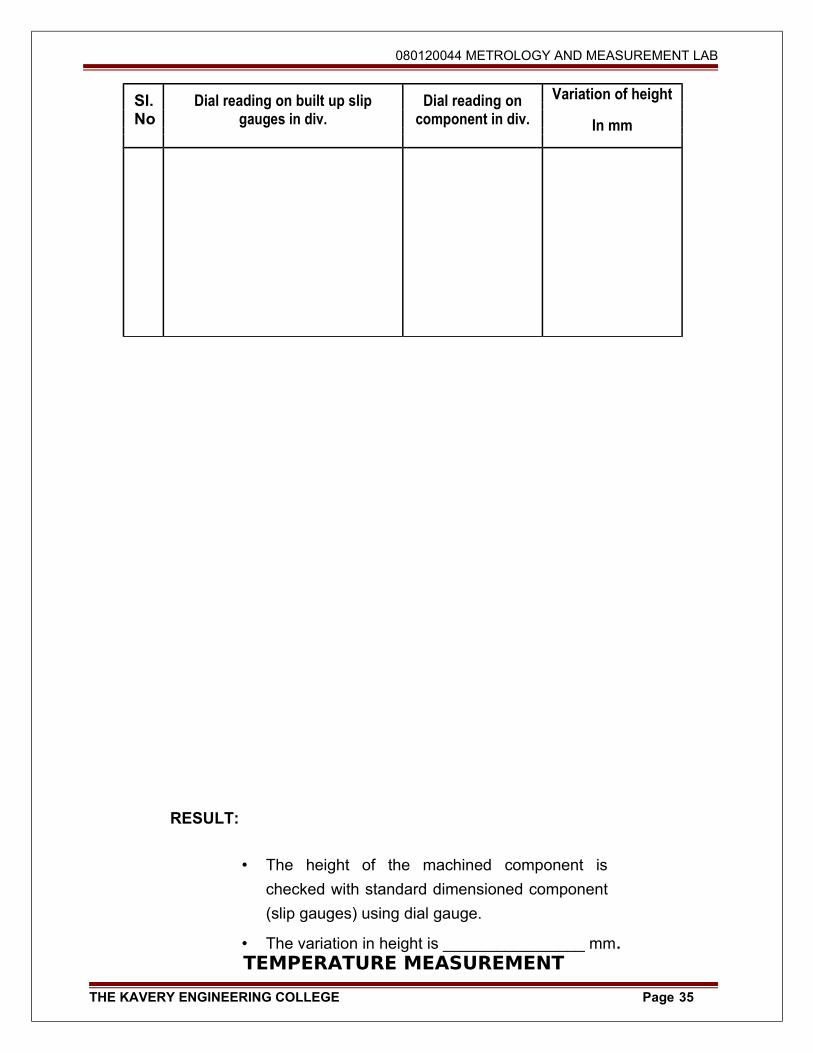
TABULATION: component height =____ mm.
THE KAVERY ENGINEERING COLLEGE Page 34
080120044 METROLOGY AND MEASUREMENT LAB
Sl. Dial reading on built up slip Dial reading on Variation of height
No gauges in div. component in div. In mm
RESULT:
• The height of the machined component is
checked with standard dimensioned component
(slip gauges) using dial gauge.
• The variation in height is ________________ mm. TEMPERATURE MEASUREMENT
THE KAVERY ENGINEERING COLLEGE Page 35

080120044 METROLOGY AND MEASUREMENT LAB
Date:
Exp no:
AIM:
To measure the temperature using copper constantan thermo couple.
APPARATUS REQUIRED:
1. Thermo couple
2. Temperature measuring setup.
3. Ice cubes.
PROCEDURE:
1. Connect the thermocouple supplied at the impute terminal
if copper constantan Thermocouple is used. Copper wire
must be connected to the terminal and constantan wire to –
ve terminal.
2. Immerse the junction of thermocouple in ice and adjust the
meter reading at 0° C using potentiometer.
3. Immerse the junction of thermocouple in boiling at 98° C by
using potentiometer marked max.
4. Repeat the procedure for 2 to 3 times.
THE KAVERY ENGINEERING COLLEGE Page 36

080120044 METROLOGY AND MEASUREMENT LAB
TABULATION:
SL.NO ACTUAL TEMPERATURE C°
INDICATED TEMPERATURE C°
1
2
3
4
5
GRAPH:
Indicated Temperature Vs Actual Temperature
THE KAVERY ENGINEERING COLLEGE Page 37
080120044 METROLOGY AND MEASUREMENT LAB
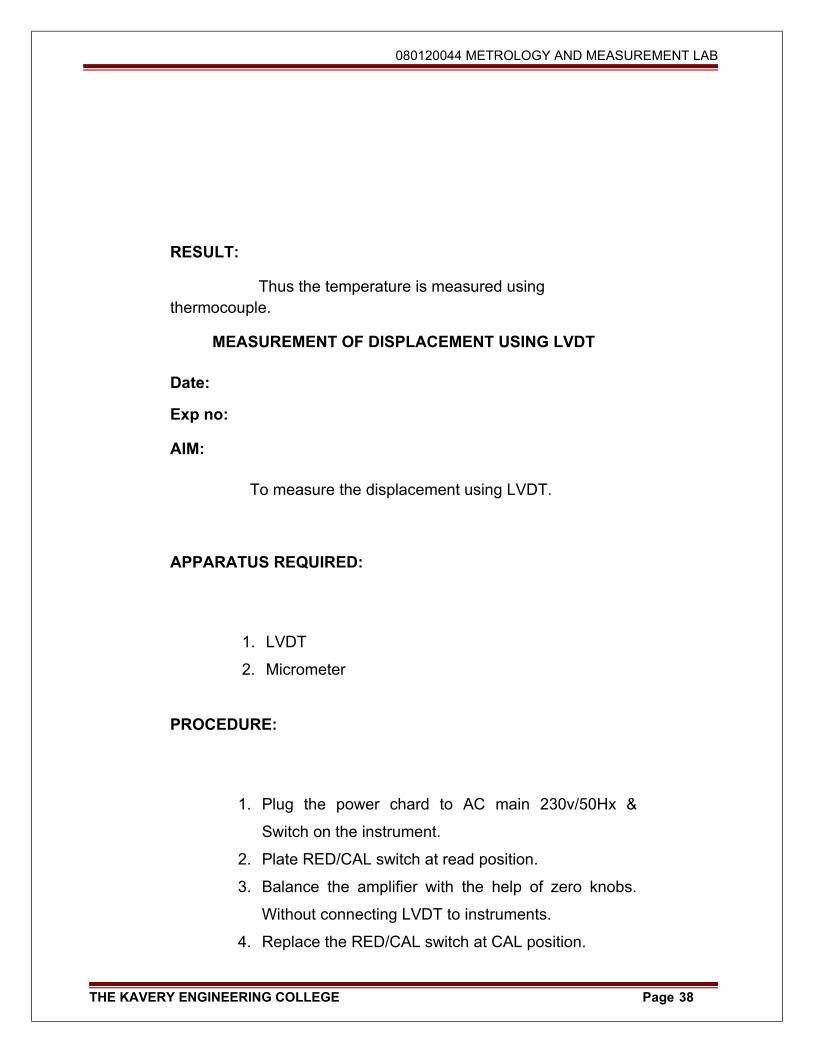
RESULT:
Thus the temperature is measured using thermocouple.
MEASUREMENT OF DISPLACEMENT USING LVDT
Date:
Exp no:
AIM:
To measure the displacement using LVDT.
APPARATUS REQUIRED:
1. LVDT
2. Micrometer
PROCEDURE:
1. Plug the power chard to AC main 230v/50Hx &
Switch on the instrument.
2. Plate RED/CAL switch at read position.
3. Balance the amplifier with the help of zero knobs.
Without connecting LVDT to instruments.
4. Replace the RED/CAL switch at CAL position.
THE KAVERY ENGINEERING COLLEGE Page 38
080120044 METROLOGY AND MEASUREMENT LAB
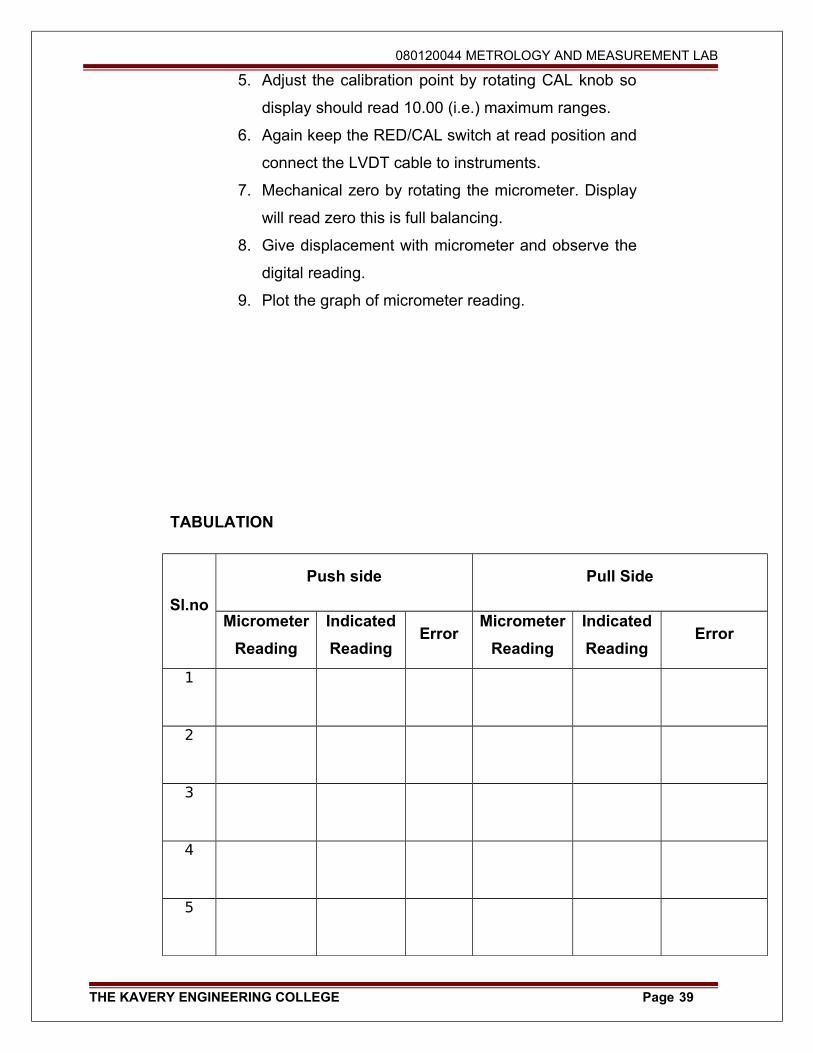
5. Adjust the calibration point by rotating CAL knob so
display should read 10.00 (i.e.) maximum ranges.
6. Again keep the RED/CAL switch at read position and
connect the LVDT cable to instruments.
7. Mechanical zero by rotating the micrometer. Display
will read zero this is full balancing.
8. Give displacement with micrometer and observe the
digital reading.
9. Plot the graph of micrometer reading.
TABULATION
Sl.no
Push side Pull Side
Micrometer
Reading
(mm)
Indicated
Reading
(mm)
ErrorMicrometer
Reading
(mm)
Indicated
Reading
(mm)
Error
1
2
3
4
5
THE KAVERY ENGINEERING COLLEGE Page 39
080120044 METROLOGY AND MEASUREMENT LAB
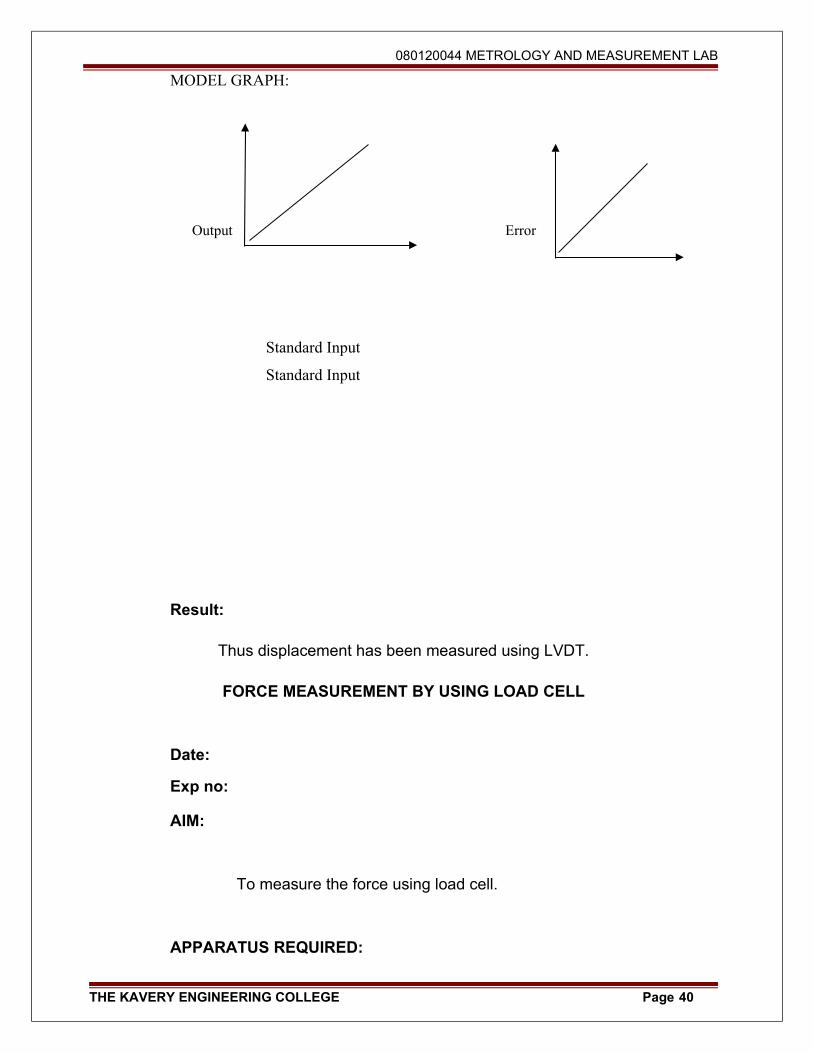
MODEL GRAPH:
Output Error
Standard Input
Standard Input
Result:
Thus displacement has been measured using LVDT.
FORCE MEASUREMENT BY USING LOAD CELL
Date:
Exp no:
AIM:
To measure the force using load cell.
APPARATUS REQUIRED:
THE KAVERY ENGINEERING COLLEGE Page 40
080120044 METROLOGY AND MEASUREMENT LAB
1. Proving Ring
2. Load cell
3. Force indicator
4. screw jack
5. Dial gauge.
PROCEDURE:
1. Ensure that proving ring along with load all is perfectly
in vertical position.
2. Check and ensure that the axis of screw jacks
perfectly aligned with load cell.
3. Ensure that load cell with socket is connected to the
rear side of the load indicator.
4. Apply a small load without any slip in the system.
5. Note down the reading of dial gauge of force indicator.
THE KAVERY ENGINEERING COLLEGE Page 41
080120044 METROLOGY AND MEASUREMENT LAB
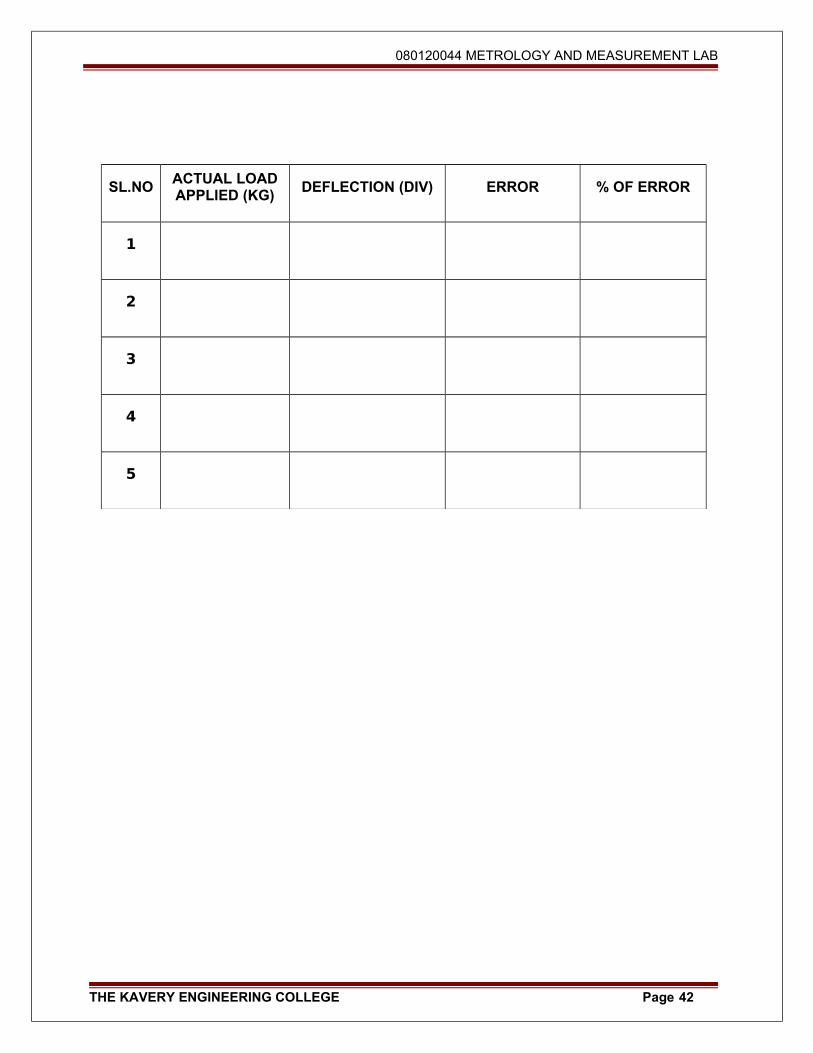
SL.NOACTUAL LOAD APPLIED (KG)
DEFLECTION (DIV) ERROR % OF ERROR
1
2
3
4
5
THE KAVERY ENGINEERING COLLEGE Page 42
080120044 METROLOGY AND MEASUREMENT LAB
RESULT:
Thus the force measurement has been measured using
load cell.
Graph: Deflection Vs Applied load
TORQUE MEASUREMENT
Date:
Exp no:
AIM:
To measure the torque using shear type load cell.
APPARATUS REQUIRED:
1. Torque measurement equipment
2. Stand
3. lever
4. stain gauge
5. Weight.
THE KAVERY ENGINEERING COLLEGE Page 43
080120044 METROLOGY AND MEASUREMENT LAB
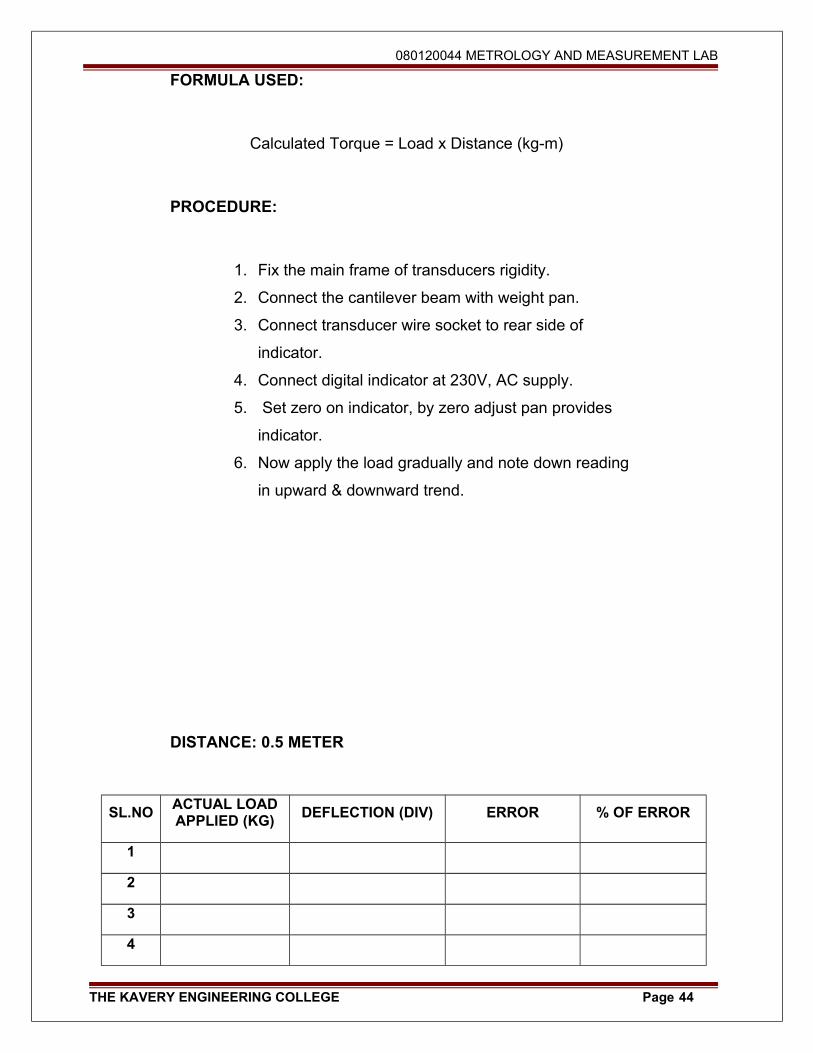
FORMULA USED:
Calculated Torque = Load x Distance (kg-m)
PROCEDURE:
1. Fix the main frame of transducers rigidity.
2. Connect the cantilever beam with weight pan.
3. Connect transducer wire socket to rear side of
indicator.
4. Connect digital indicator at 230V, AC supply.
5. Set zero on indicator, by zero adjust pan provides
indicator.
6. Now apply the load gradually and note down reading
in upward & downward trend.
DISTANCE: 0.5 METER
SL.NOACTUAL LOAD APPLIED (KG)
DEFLECTION (DIV) ERROR % OF ERROR
1
2
3
4
THE KAVERY ENGINEERING COLLEGE Page 44
080120044 METROLOGY AND MEASUREMENT LAB
5
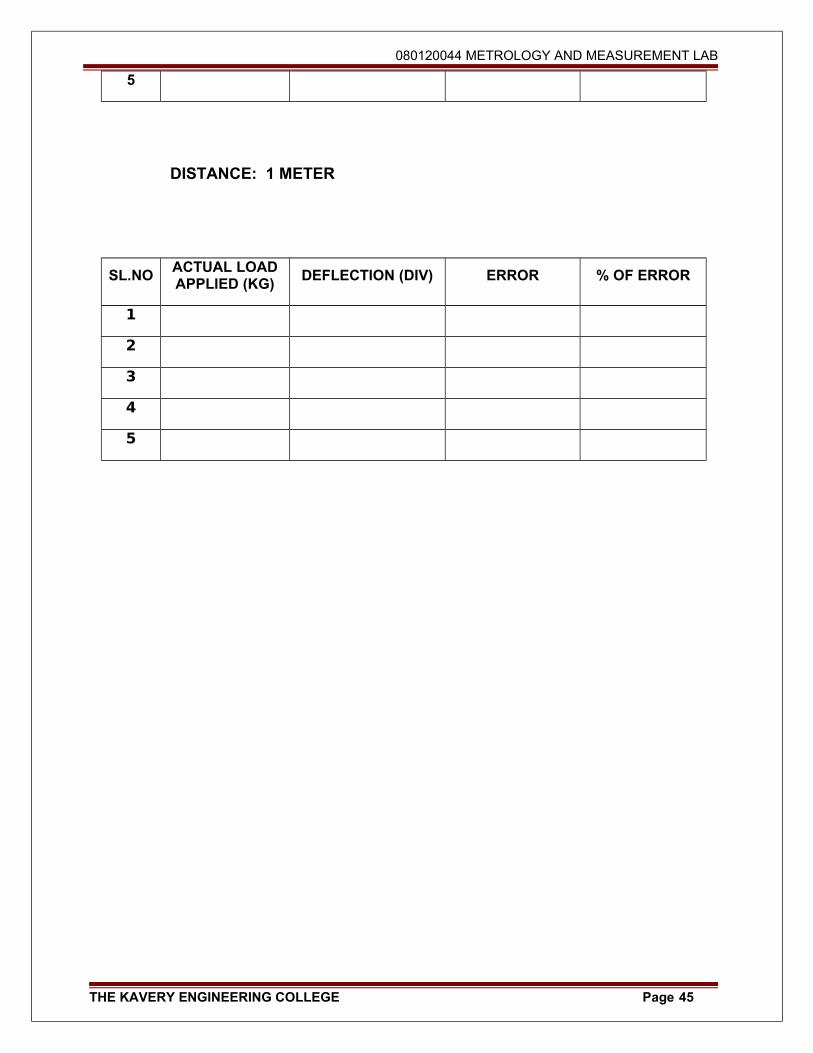
DISTANCE: 1 METER
SL.NOACTUAL LOAD APPLIED (KG)
DEFLECTION (DIV) ERROR % OF ERROR
1
2
3
4
5
THE KAVERY ENGINEERING COLLEGE Page 45
080120044 METROLOGY AND MEASUREMENT LAB
MODEL CALCULATION:
Calculated Torque =Load x Distance (kg-m)
GRAPH:
Observed torque Vs Calculated torque
THE KAVERY ENGINEERING COLLEGE Page 46
080120044 METROLOGY AND MEASUREMENT LAB
RESULT:
Thus measurement of torque using shear type load cell has been carried out.
MEASUREMENT OF VIBRATION PARAMETERS USING VIBRATION SET UP
Date:
Exp no:
AIM:
To study the various parameters involved in the vibrations of a given system.
To plot the characteristic curves of the given specimen
THE KAVERY ENGINEERING COLLEGE Page 47
080120044 METROLOGY AND MEASUREMENT LAB
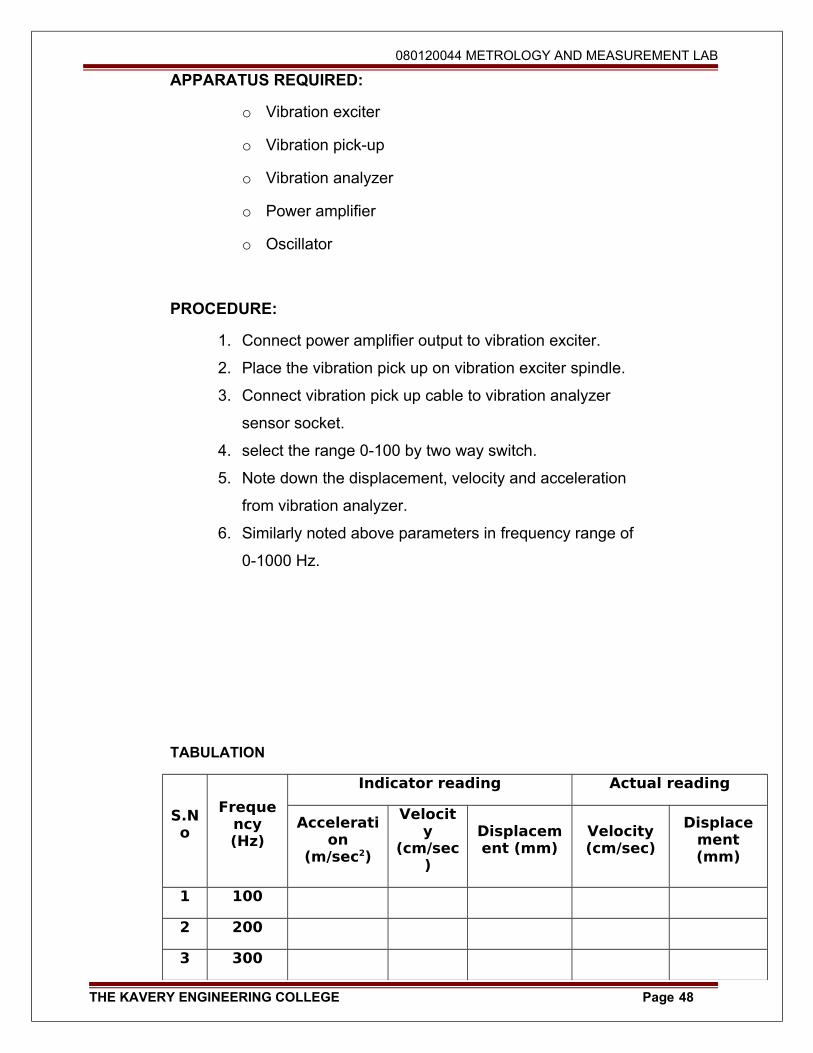
APPARATUS REQUIRED:
o Vibration exciter
o Vibration pick-up
o Vibration analyzer
o Power amplifier
o Oscillator
PROCEDURE:
1. Connect power amplifier output to vibration exciter.
2. Place the vibration pick up on vibration exciter spindle.
3. Connect vibration pick up cable to vibration analyzer
sensor socket.
4. select the range 0-100 by two way switch.
5. Note down the displacement, velocity and acceleration
from vibration analyzer.
6. Similarly noted above parameters in frequency range of
0-1000 Hz.
TABULATION
S.No
Frequency (Hz)
Indicator reading Actual reading
Acceleration
(m/sec2)
Velocity
(cm/sec)
Displacement (mm)
Velocity (cm/sec)
Displacement (mm)
1 100
2 200
3 300
THE KAVERY ENGINEERING COLLEGE Page 48
080120044 METROLOGY AND MEASUREMENT LAB
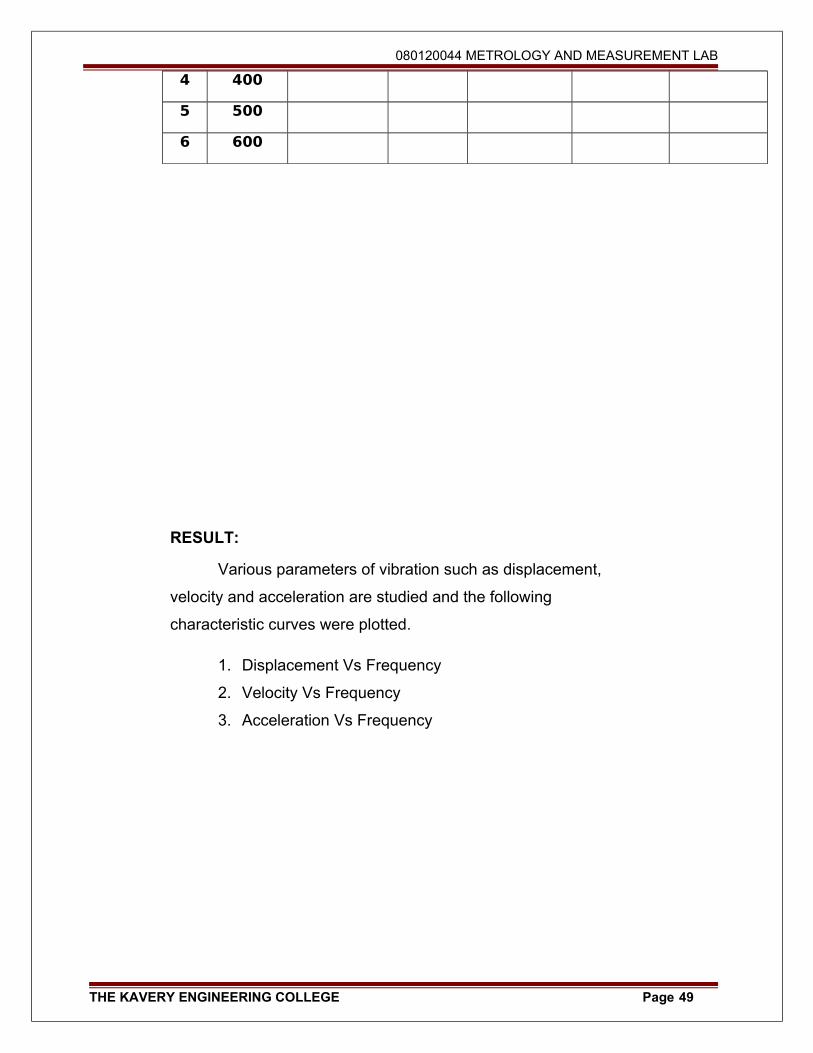
4 400
5 500
6 600
RESULT:
Various parameters of vibration such as displacement,
velocity and acceleration are studied and the following
characteristic curves were plotted.
1. Displacement Vs Frequency
2. Velocity Vs Frequency
3. Acceleration Vs Frequency
THE KAVERY ENGINEERING COLLEGE Page 49