Embed Size (px)
Citation preview

Presentation of financial results Q4 2013
2
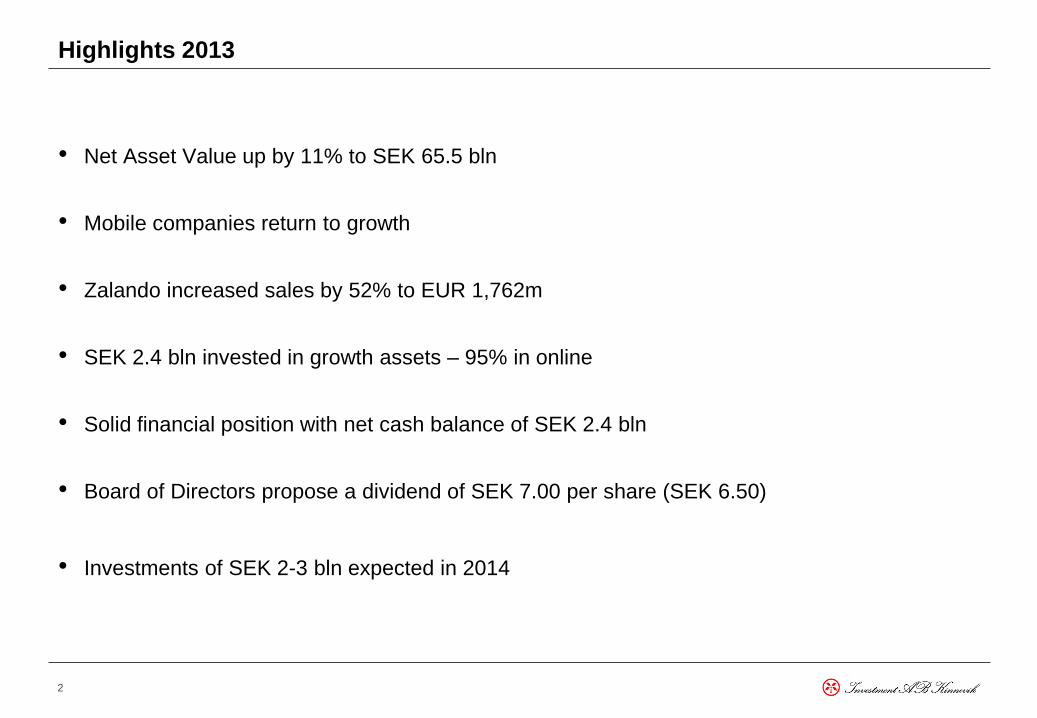
Highlights 2013
• Net Asset Value up by 11% to SEK 65.5 bln
• Mobile companies return to growth
• Zalando increased sales by 52% to EUR 1,762m
• SEK 2.4 bln invested in growth assets – 95% in online
• Solid financial position with net cash balance of SEK 2.4 bln
• Board of Directors propose a dividend of SEK 7.00 per share (SEK 6.50)
• Investments of SEK 2-3 bln expected in 2014
3
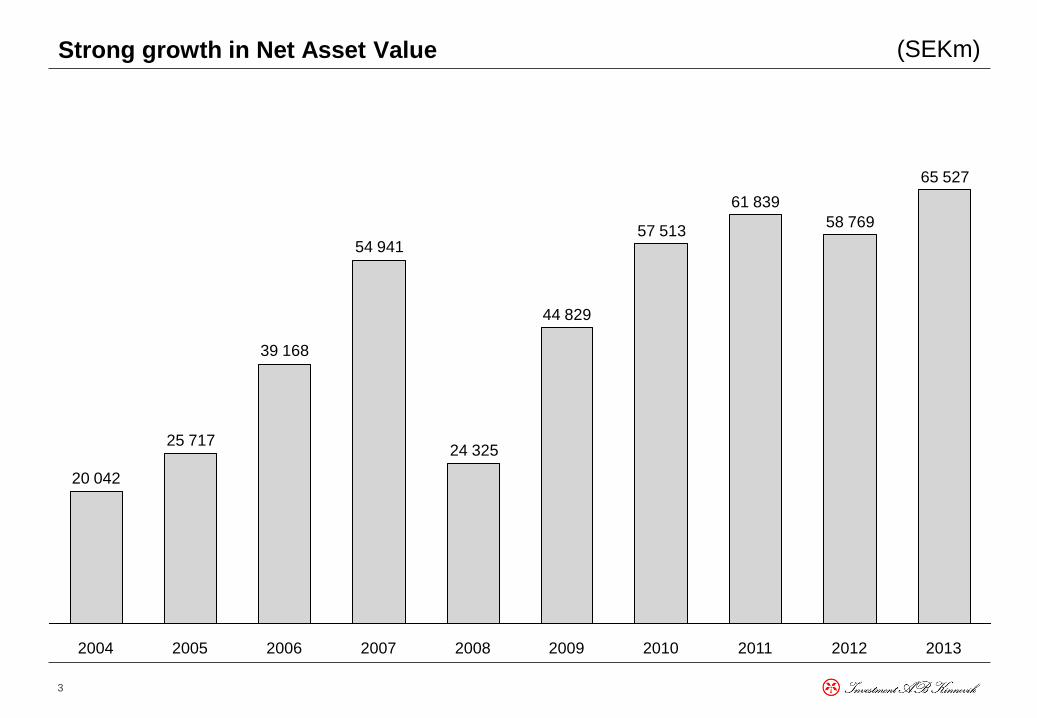
Strong growth in Net Asset Value
54 941
65 527
58 769
61 839
57 513
44 829
24 325
39 168
25 717
20 042
2008 2007 2009 2010 2013 2011 2012 2004 2005 2006
(SEKm)
4
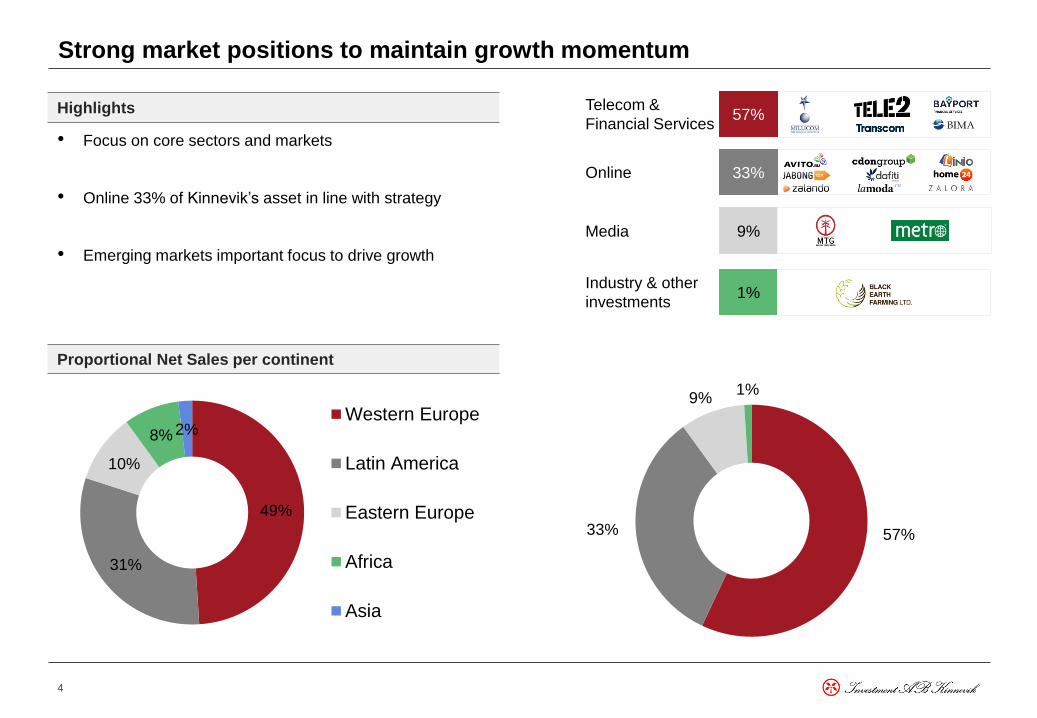
Strong market positions to maintain growth momentum
57%
33%
9%
1%
Telecom &
Financial Services
Online
Media
Industry & other
investments
• Focus on core sectors and markets
• Online 33% of Kinnevik’s asset in line with strategy
• Emerging markets important focus to drive growth
Highlights
Proportional Net Sales per continent
57% 33%
9% 1%
31%
Latin America
8%
Africa
49%
Western
Europe
10%
Eastern
Europe
2%
Asia
49%
31%
10%
8% 2% Western Europe
Latin America
Eastern Europe
Africa
Asia

5
Kinnevik is at the forefront of change
Telecom &
Financial Services
6
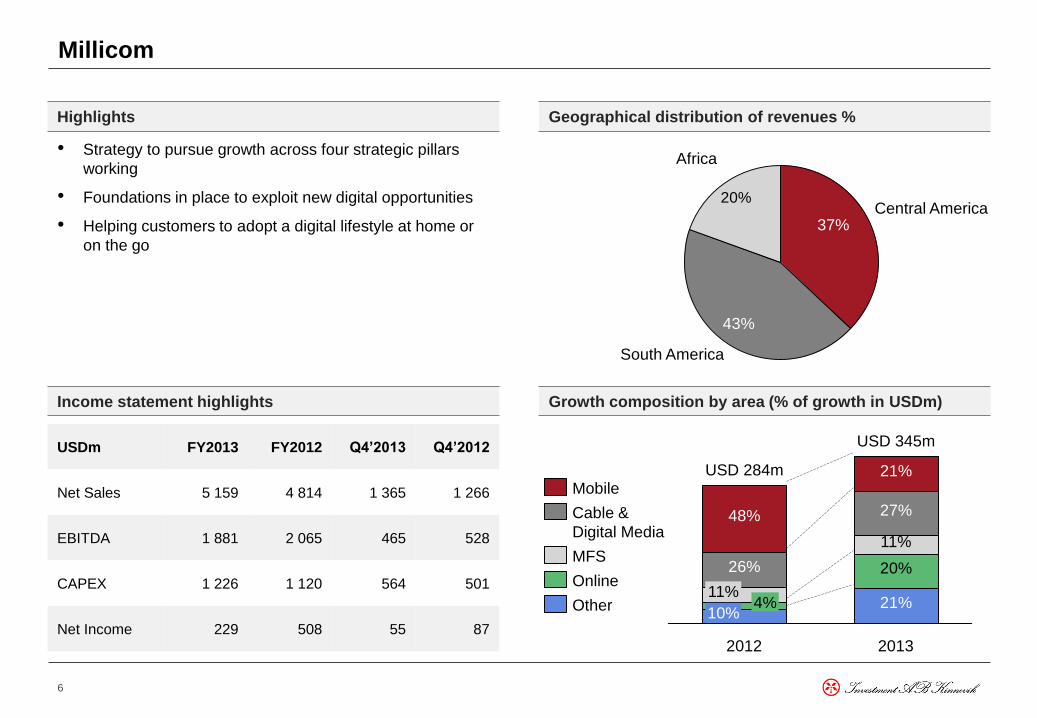
Millicom
Income statement highlights Growth composition by area (% of growth in USDm)
• Strategy to pursue growth across four strategic pillars
working
• Foundations in place to exploit new digital opportunities
• Helping customers to adopt a digital lifestyle at home or
on the go
Highlights Geographical distribution of revenues %
20%
Africa
South America
43%
Central America 37%
USD 284m
10% 4%
11%
26%
48%
2012 2013
21%
20%
11%
27%
21%
USD 345m
Other
Online
MFS
Cable &
Digital Media
Mobile
USDm FY2013 FY2012 Q4’2013 Q4’2012
Net Sales 5 159 4 814 1 365 1 266
EBITDA 1 881 2 065 465 528
CAPEX 1 226 1 120 564 501
Net Income 229 508 55 87
7
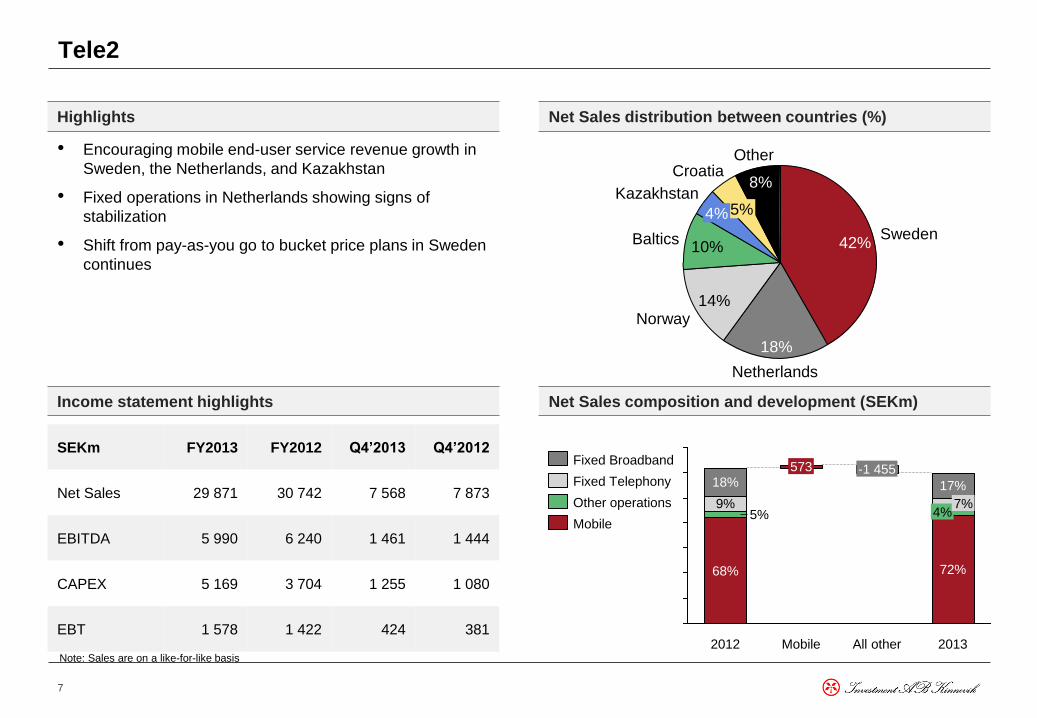
Tele2
Income statement highlights Net Sales composition and development (SEKm)
• Encouraging mobile end-user service revenue growth in
Sweden, the Netherlands, and Kazakhstan
• Fixed operations in Netherlands showing signs of
stabilization
• Shift from pay-as-you go to bucket price plans in Sweden
continues
Highlights Net Sales distribution between countries (%)
10%
14%
Other
8% Croatia
5% Kazakhstan
4%
Baltics
Norway
Netherlands
18%
Sweden 42%
SEKm FY2013 FY2012 Q4’2013 Q4’2012
Net Sales 29 871 30 742 7 568 7 873
EBITDA 5 990 6 240 1 461 1 444
CAPEX 5 169 3 704 1 255 1 080
EBT 1 578 1 422 424 381 2013
4% 7%
17%
All other
-1 455
Mobile
573
2012
5% 9%
18%
68% 72%
Mobile
Other operations
Fixed Telephony
Fixed Broadband
Note: Sales are on a like-for-like basis
8
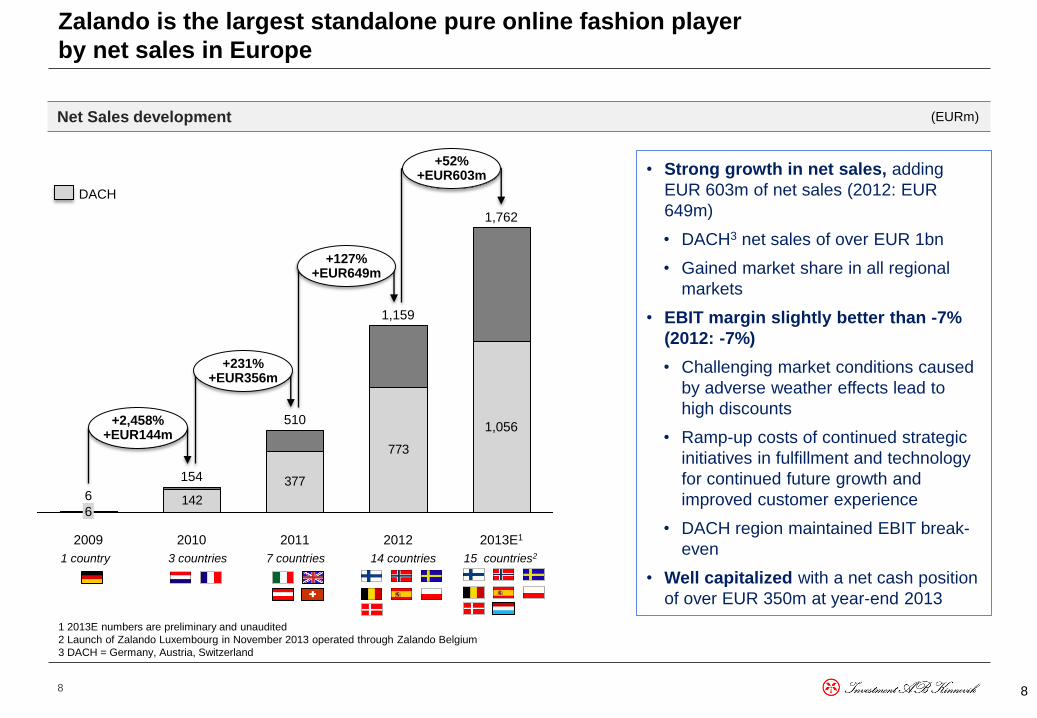
Zalando is the largest standalone pure online fashion player
by net sales in Europe
8
377
773
142
+52% +EUR603m
+2,458% +EUR144m
+231% +EUR356m
+127% +EUR649m
2013E1
1,762
6
1,056
2012
1,159
2011
510
2010
154
2009
6
• Strong growth in net sales, adding
EUR 603m of net sales (2012: EUR
649m)
• DACH3 net sales of over EUR 1bn
• Gained market share in all regional
markets
• EBIT margin slightly better than -7%
(2012: -7%)
• Challenging market conditions caused
by adverse weather effects lead to
high discounts
• Ramp-up costs of continued strategic
initiatives in fulfillment and technology
for continued future growth and
improved customer experience
• DACH region maintained EBIT break-
even
• Well capitalized with a net cash position
of over EUR 350m at year-end 2013
1 country 3 countries 7 countries 14 countries 15 countries2
1 2013E numbers are preliminary and unaudited
2 Launch of Zalando Luxembourg in November 2013 operated through Zalando Belgium
3 DACH = Germany, Austria, Switzerland
DACH
Net Sales development (EURm)
9
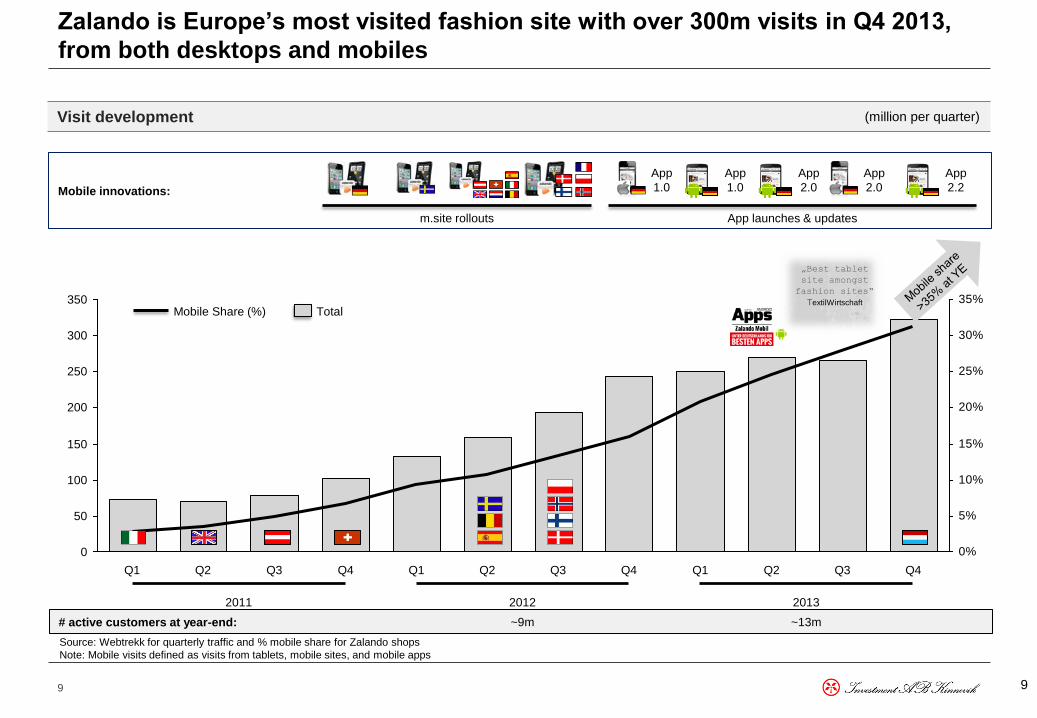
Mobile innovations:
Source: Webtrekk for quarterly traffic and % mobile share for Zalando shops
Note: Mobile visits defined as visits from tablets, mobile sites, and mobile apps
Zalando is Europe’s most visited fashion site with over 300m visits in Q4 2013,
from both desktops and mobiles
9
0%
5%
10%
15%
20%
25%
30%
35%350
300
250
200
150
100
50
0
Q4 Q3 Q2 Q1 Q4 Q3 Q2 Q1 Q4 Q3 Q2 Q1
Total Mobile Share (%)
2011 2013 2012
m.site rollouts App launches & updates
App
1.0
App
1.0
App
2.0
App
2.0
App
2.2
# active customers at year-end: ~13m ~9m
„Best tablet
site amongst
fashion sites“
TextilWirtschaft
Visit development (million per quarter)
10
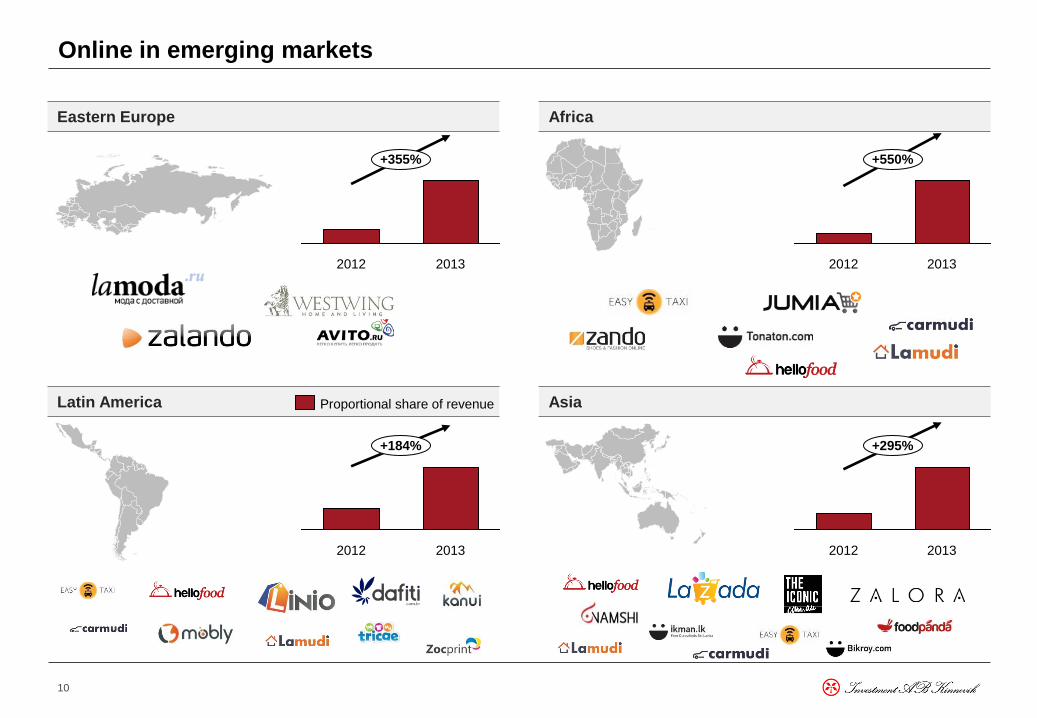
Online in emerging markets
Eastern Europe Africa
Latin America Asia
2012 2013
+184%
Proportional share of revenue
2012 2013
+355%
2012 2013
+550%
2012 2013
+295%
11
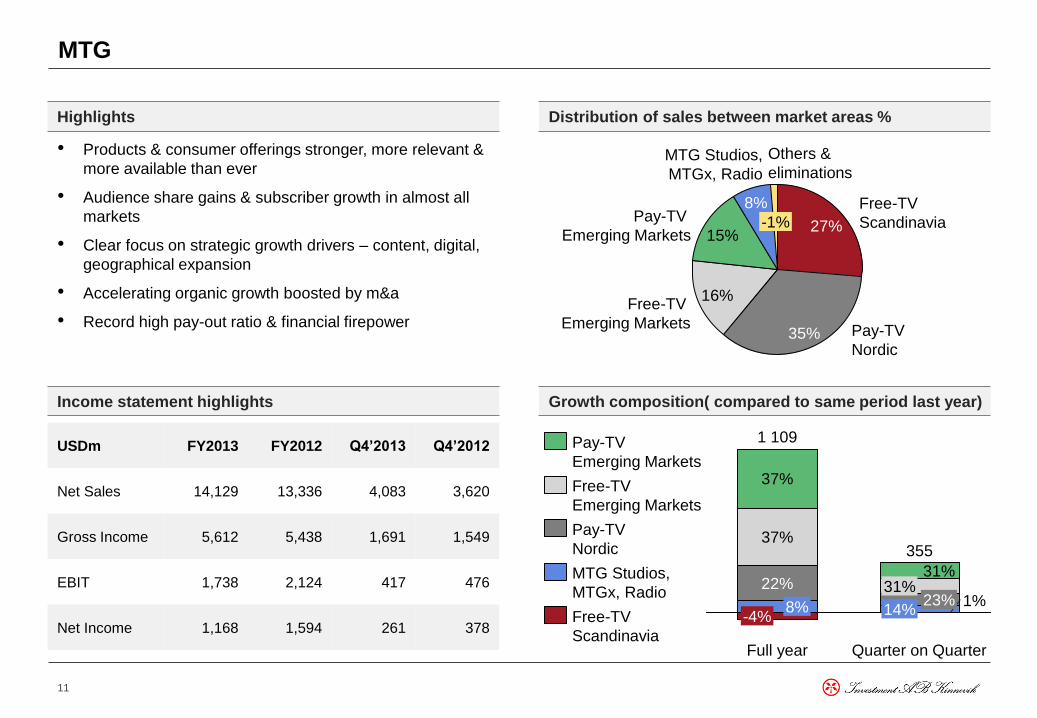
MTG
Income statement highlights Growth composition( compared to same period last year)
• Products & consumer offerings stronger, more relevant &
more available than ever
• Audience share gains & subscriber growth in almost all
markets
• Clear focus on strategic growth drivers – content, digital,
geographical expansion
• Accelerating organic growth boosted by m&a
• Record high pay-out ratio & financial firepower
Highlights Distribution of sales between market areas %
Others &
eliminations
8%
MTG Studios,
MTGx, Radio
15%
Pay-TV
Emerging Markets
16% Free-TV
Emerging Markets 35% Pay-TV
Nordic
27%
Free-TV
Scandinavia -1%
22%
Full year
1%
Quarter on Quarter
14%
31% 31%
355
-4% 23%
37%
1 109
37%
8%
MTG Studios,
MTGx, Radio
Free-TV
Emerging Markets
Pay-TV
Emerging Markets
Pay-TV
Nordic
Free-TV
Scandinavia
USDm FY2013 FY2012 Q4’2013 Q4’2012
Net Sales 14,129 13,336 4,083 3,620
Gross Income 5,612 5,438 1,691 1,549
EBIT 1,738 2,124 417 476
Net Income 1,168 1,594 261 378
12
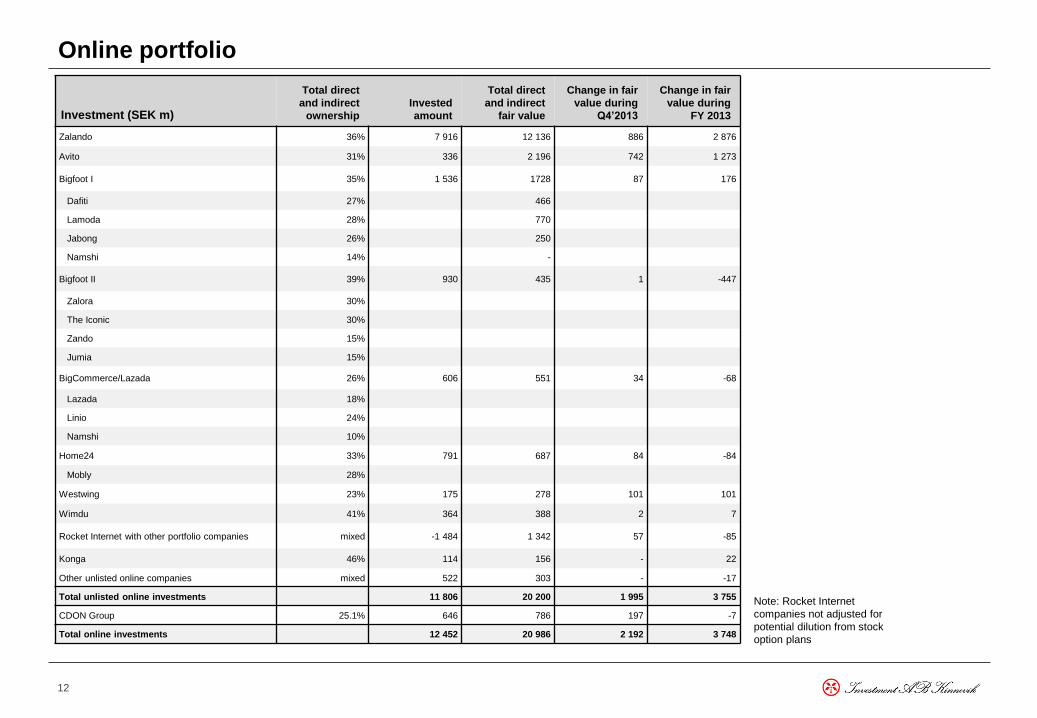
Online portfolio
Investment (SEK m)
Total direct
and indirect
ownership
Invested
amount
Total direct
and indirect
fair value
Change in fair
value during
Q4’2013
Change in fair
value during
FY 2013
Zalando 36% 7 916 12 136 886 2 876
Avito 31% 336 2 196 742 1 273
Bigfoot I 35% 1 536 1728 87 176
Dafiti 27% 466
Lamoda 28% 770
Jabong 26% 250
Namshi 14% -
Bigfoot II 39% 930 435 1 -447
Zalora 30%
The Iconic 30%
Zando 15%
Jumia 15%
BigCommerce/Lazada 26% 606 551 34 -68
Lazada 18%
Linio 24%
Namshi 10%
Home24 33% 791 687 84 -84
Mobly 28%
Westwing 23% 175 278 101 101
Wimdu 41% 364 388 2 7
Rocket Internet with other portfolio companies mixed -1 484 1 342 57 -85
Konga 46% 114 156 - 22
Other unlisted online companies mixed 522 303 - -17
Total unlisted online investments 11 806 20 200 1 995 3 755
CDON Group 25.1% 646 786 197 -7
Total online investments 12 452 20 986 2 192 3 748
Note: Rocket Internet
companies not adjusted for
potential dilution from stock
option plans
13
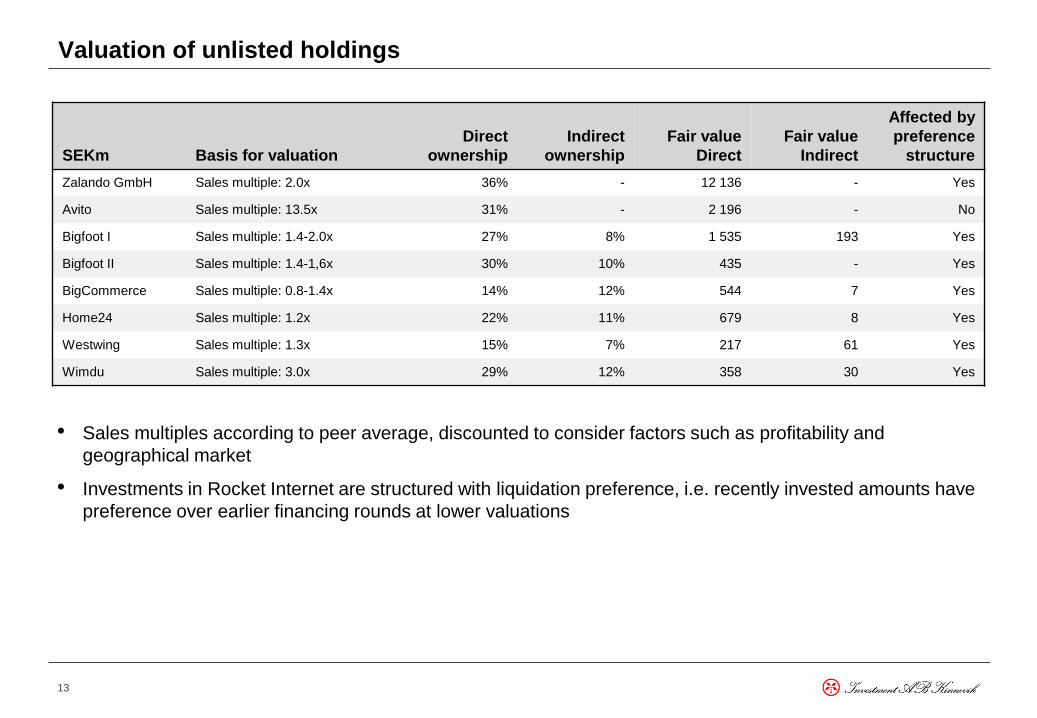
• Sales multiples according to peer average, discounted to consider factors such as profitability and
geographical market
• Investments in Rocket Internet are structured with liquidation preference, i.e. recently invested amounts have
preference over earlier financing rounds at lower valuations
SEKm Basis for valuation
Direct
ownership
Indirect
ownership
Fair value
Direct
Fair value
Indirect
Affected by
preference
structure
Zalando GmbH Sales multiple: 2.0x 36% - 12 136 - Yes
Avito Sales multiple: 13.5x 31% - 2 196 - No
Bigfoot I Sales multiple: 1.4-2.0x 27% 8% 1 535 193 Yes
Bigfoot II Sales multiple: 1.4-1,6x 30% 10% 435 - Yes
BigCommerce Sales multiple: 0.8-1.4x 14% 12% 544 7 Yes
Home24 Sales multiple: 1.2x 22% 11% 679 8 Yes
Westwing Sales multiple: 1.3x 15% 7% 217 61 Yes
Wimdu Sales multiple: 3.0x 29% 12% 358 30 Yes
Valuation of unlisted holdings
14
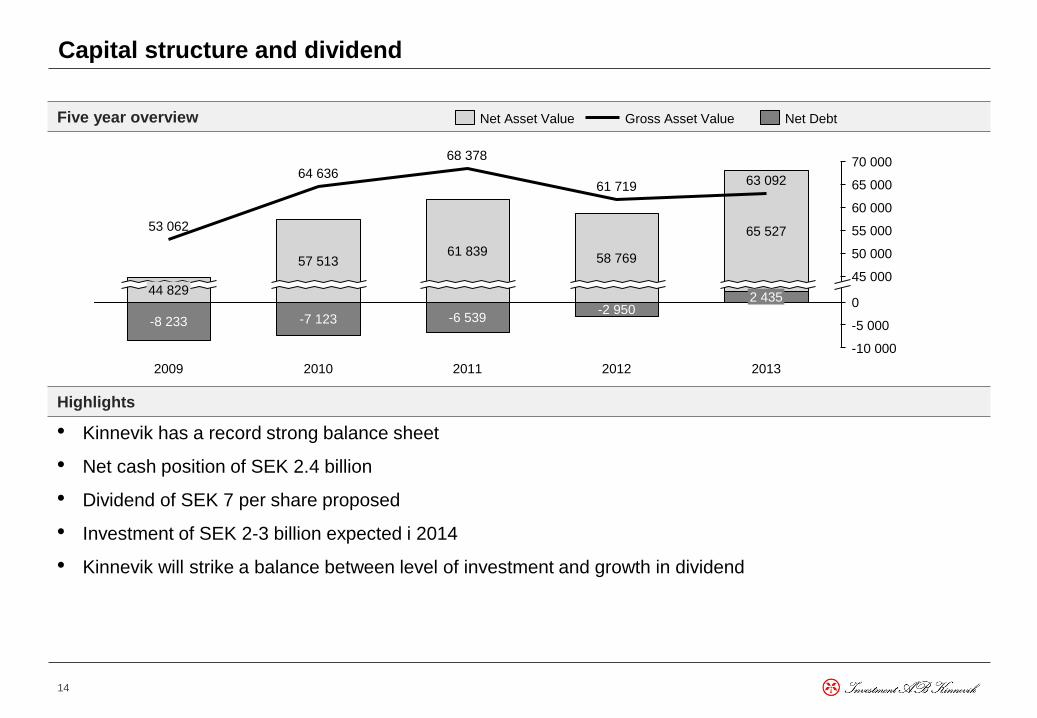
Five year overview
Capital structure and dividend
Highlights
50 000
60 000
-10 000
70 000
65 000
55 000
45 000
-5 000
0
2011
-6 539
68 378
61 839
2010 2013
64 636
57 513
2009
-8 233
53 062
44 829 2 435
63 092
65 527
2012
-2 950
61 719
58 769
-7 123
Net Debt Gross Asset Value Net Asset Value
• Kinnevik has a record strong balance sheet
• Net cash position of SEK 2.4 billion
• Dividend of SEK 7 per share proposed
• Investment of SEK 2-3 billion expected i 2014
• Kinnevik will strike a balance between level of investment and growth in dividend

Considerations on the Group
Cristina Stenbeck
Executive Chairman
16
Kinnevik today – strong position in growth sectors and markets
• Leading international TMT focused investment company
• Market capitalization of SEK 75.6bn, net cash position of SEK 2.4bn as of December 2013
• Investment strategy focused on long-term value creation and on delivering shareholder value
• Significant stakes in large, market-leading, cash flow generating Communications and
Entertainment companies
• A unique portfolio of investments in growth oriented e-Commerce, Marketplace and Financial
Services businesses
• Present in over 80 countries across five continents with a focus on key growth markets
• Invested in a growing number of internationally recognized consumer brands with strong
customer loyalty
• Experienced Management team and Board of Directors
• Support from entrepreneurial and long-term oriented lead-shareholders
17
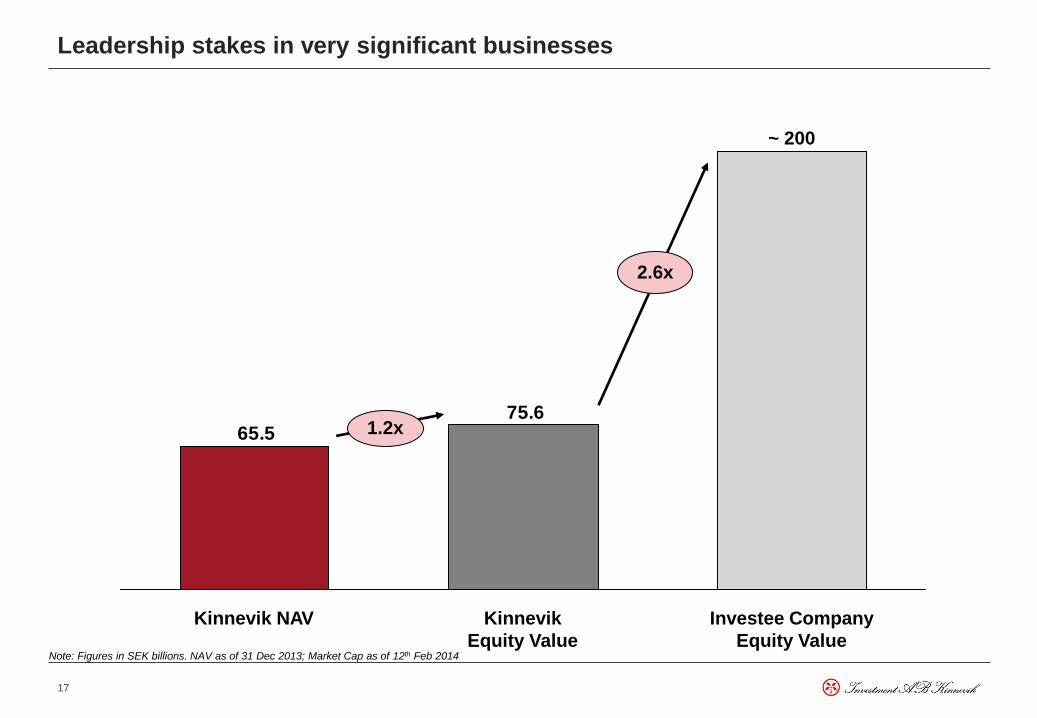
Leadership stakes in very significant businesses
Note: Figures in SEK billions. NAV as of 31 Dec 2013; Market Cap as of 12th Feb 2014
75.665.5
Investee Company
Equity Value
~ 200
Kinnevik
Equity Value
Kinnevik NAV
1.2x
2.6x
18
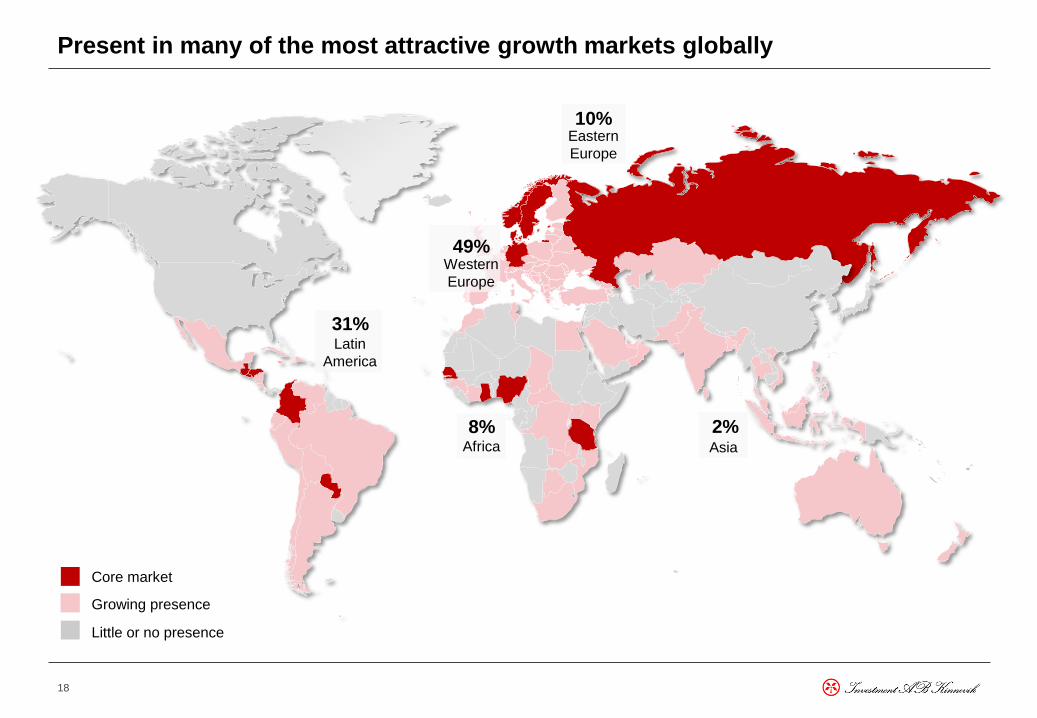
Present in many of the most attractive growth markets globally
Core market
Growing presence
Little or no presence
Latin
America
31%
8% Africa
10% Eastern
Europe
49% Western
Europe
2% Asia
19
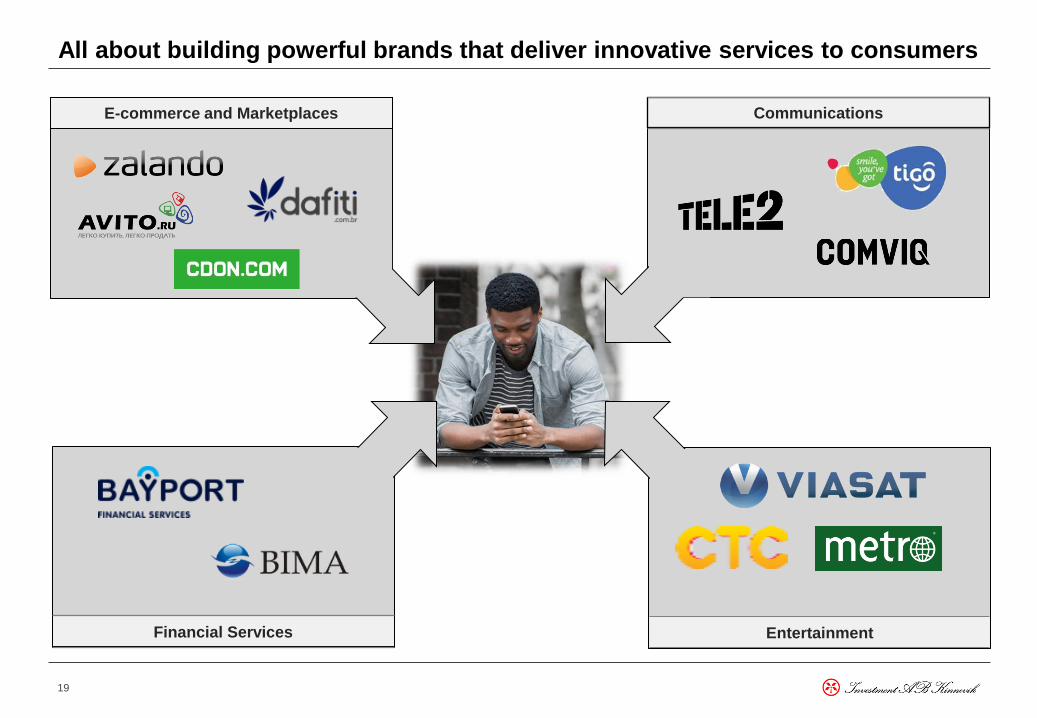
E-commerce and Marketplaces
Communications
Entertainment Financial Services
All about building powerful brands that deliver innovative services to consumers Check with Narva/Torun
for better silhouette
20
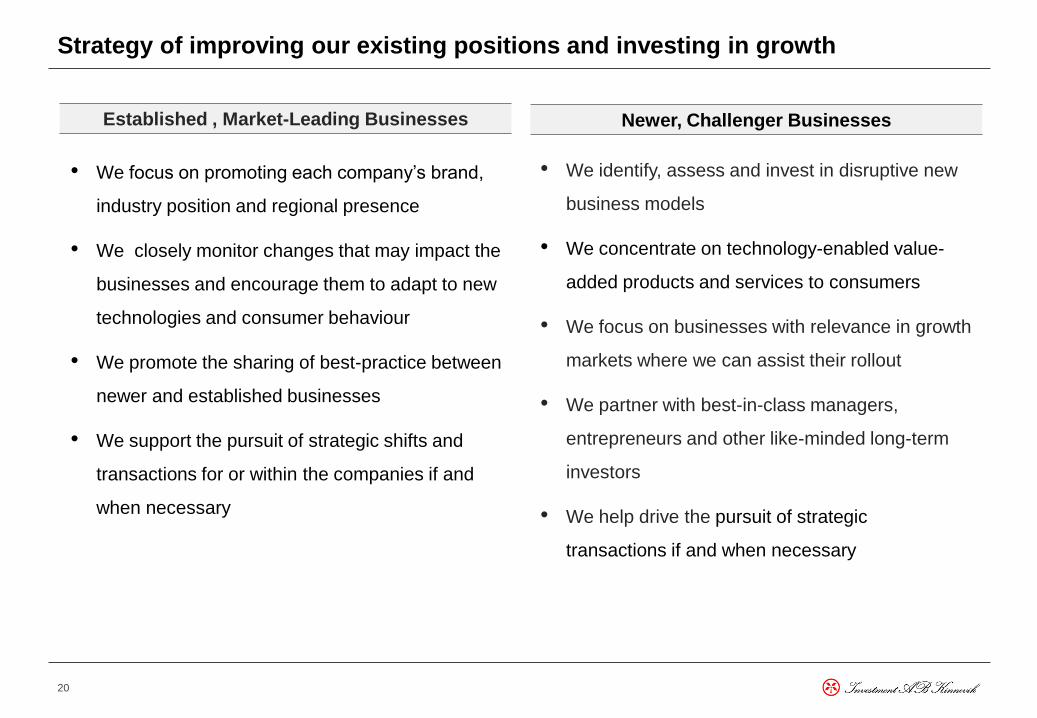
Strategy of improving our existing positions and investing in growth
Newer, Challenger Businesses Established , Market-Leading Businesses
Entertainment
• We identify, assess and invest in disruptive new
business models
• We concentrate on technology-enabled value-
added products and services to consumers
• We focus on businesses with relevance in growth
markets where we can assist their rollout
• We partner with best-in-class managers,
entrepreneurs and other like-minded long-term
investors
• We help drive the pursuit of strategic
transactions if and when necessary
• We focus on promoting each company’s brand,
industry position and regional presence
• We closely monitor changes that may impact the
businesses and encourage them to adapt to new
technologies and consumer behaviour
• We promote the sharing of best-practice between
newer and established businesses
• We support the pursuit of strategic shifts and
transactions for or within the companies if and
when necessary
65%
of NAV
21
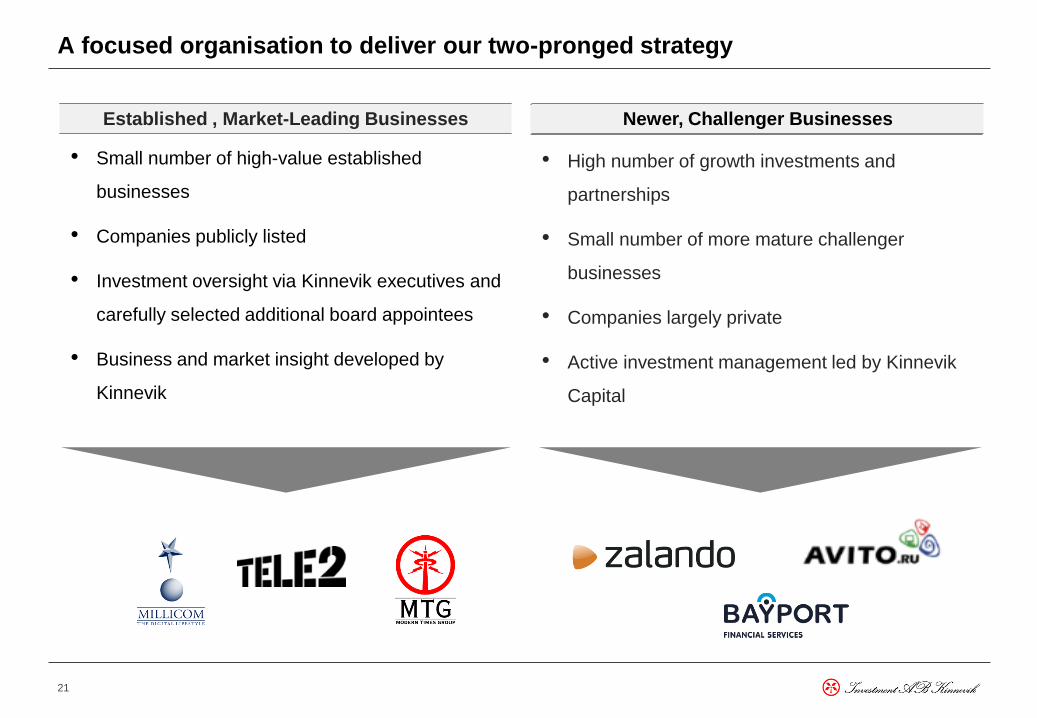
A focused organisation to deliver our two-pronged strategy
Newer, Challenger Businesses Established , Market-Leading Businesses
Entertainment
65%
of NAV
Newer, Challenger Businesses Established , Market-Leading Businesses
• Small number of high-value established
businesses
• Companies publicly listed
• Investment oversight via Kinnevik executives and
carefully selected additional board appointees
• Business and market insight developed by
Kinnevik
• High number of growth investments and
partnerships
• Small number of more mature challenger
businesses
• Companies largely private
• Active investment management led by Kinnevik
Capital
34%
of NAV
22
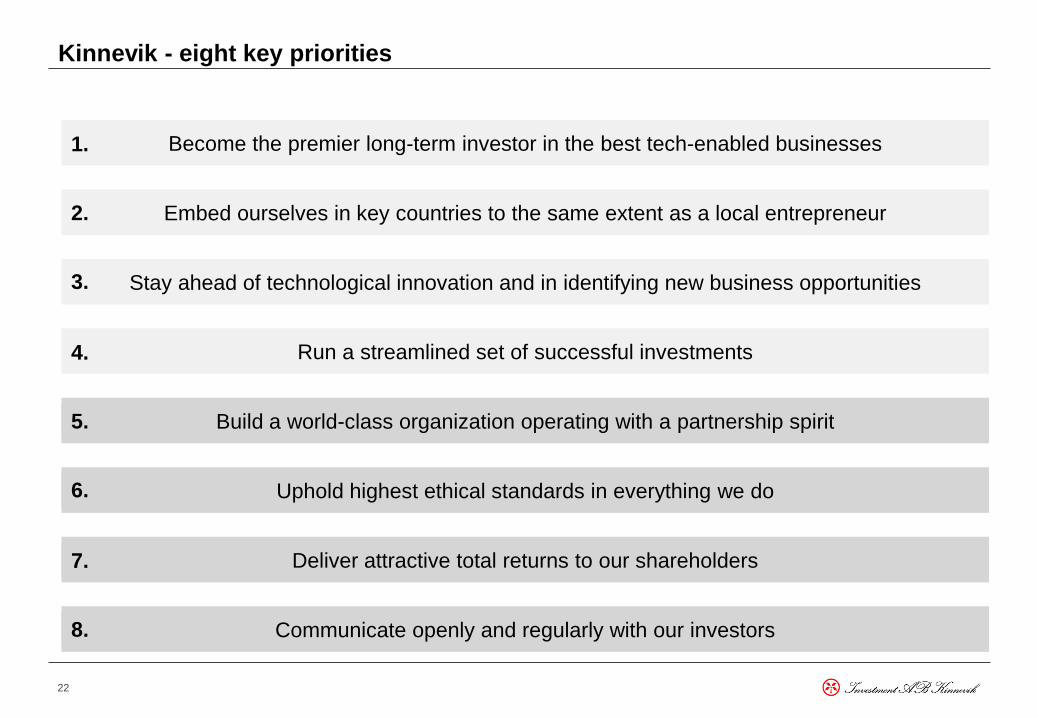
Kinnevik - eight key priorities
Become the premier long-term investor in the best tech-enabled businesses 1.
Embed ourselves in key countries to the same extent as a local entrepreneur 2.
Stay ahead of technological innovation and in identifying new business opportunities 3.
Run a streamlined set of successful investments 4.
Build a world-class organization operating with a partnership spirit 5.
Uphold highest ethical standards in everything we do 6.
Deliver attractive total returns to our shareholders 7.
Communicate openly and regularly with our investors 8.
23
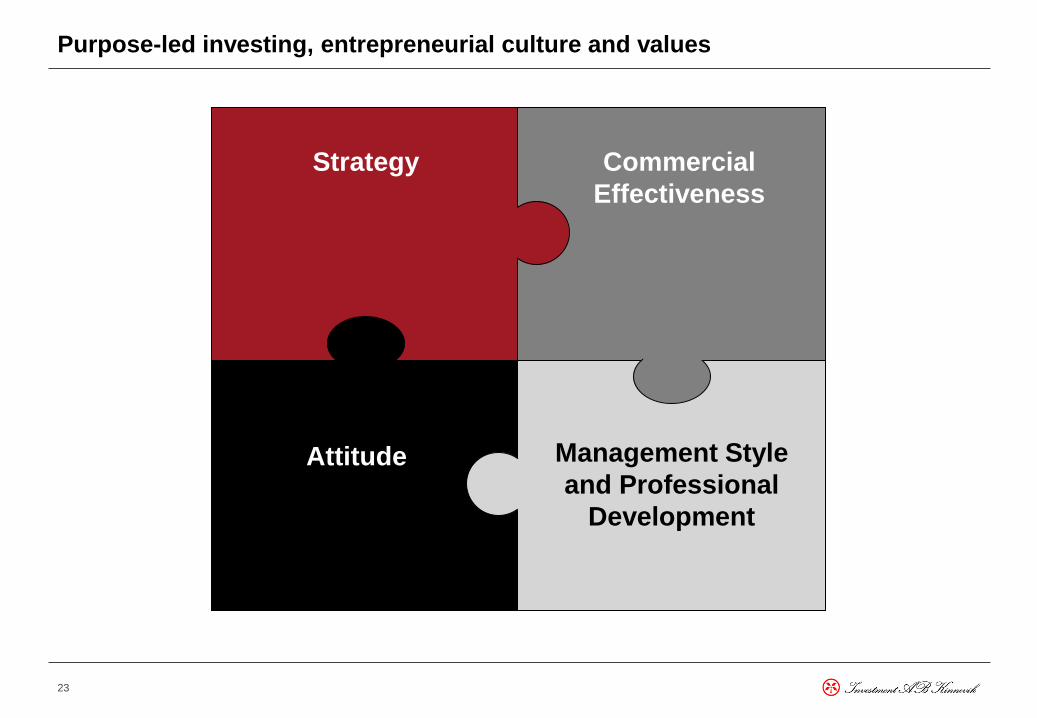
Purpose-led investing, entrepreneurial culture and values
Strategy Commercial
Effectiveness
Management Style
and Professional
Development
Attitude