Embed Size (px)
Citation preview
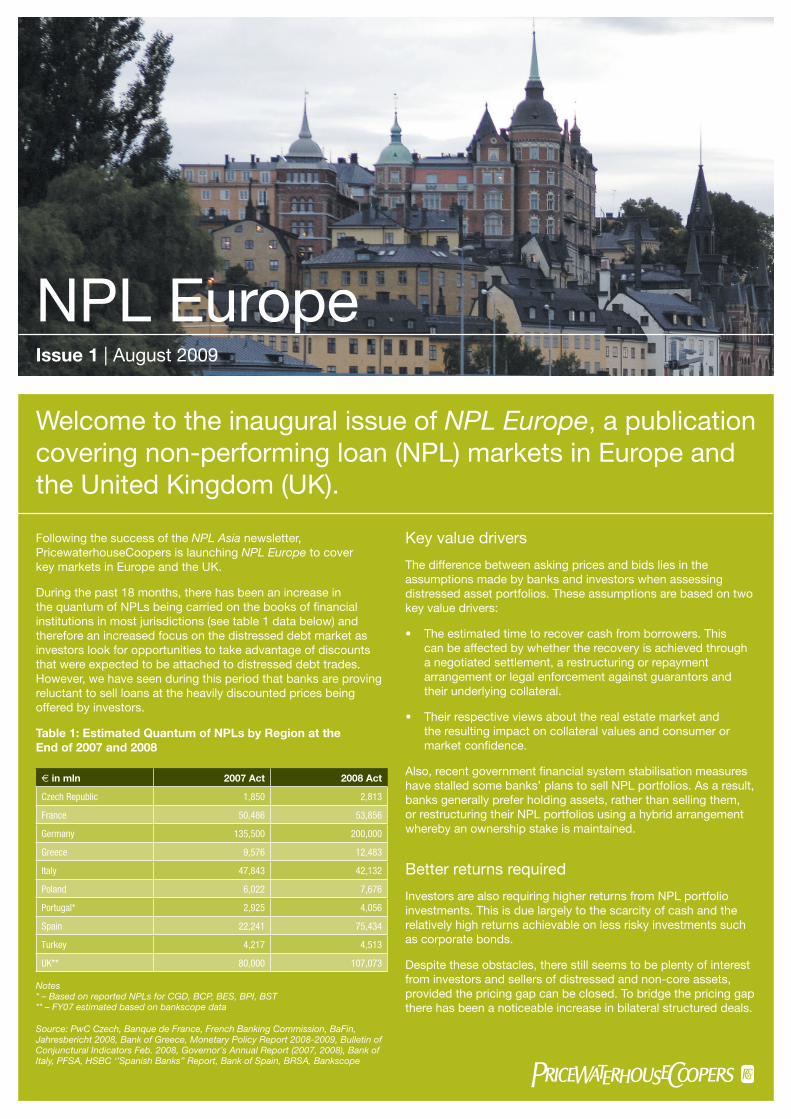
Following the success of the NPL Asia newsletter, PricewaterhouseCoopers is launching NPL Europe to cover key markets in Europe and the UK.
During the past 18 months, there has been an increase in the quantum of NPLs being carried on the books of fi nancial institutions in most jurisdictions (see table 1 data below) and therefore an increased focus on the distressed debt market as investors look for opportunities to take advantage of discounts that were expected to be attached to distressed debt trades. However, we have seen during this period that banks are proving reluctant to sell loans at the heavily discounted prices being offered by investors.
Table 1: Estimated Quantum of NPLs by Region at the End of 2007 and 2008
€ in mln 2007 Act 2008 Act
Czech Republic 1,850 2,813
France 50,486 53,856
Germany 135,500 200,000
Greece 9,576 12,483
Italy 47,843 42,132
Poland 6,022 7,676
Portugal* 2,925 4,056
Spain 22,241 75,434
Turkey 4,217 4,513
UK** 80,000 107,073
Notes * – Based on reported NPLs for CGD, BCP, BES, BPI, BST ** – FY07 estimated based on bankscope data
Source: PwC Czech, Banque de France, French Banking Commission, BaFin, Jahresbericht 2008, Bank of Greece, Monetary Policy Report 2008-2009, Bulletin of Conjunctural Indicators Feb. 2008, Governor’s Annual Report (2007, 2008), Bank of Italy, PFSA, HSBC ‘’Spanish Banks’’ Report, Bank of Spain, BRSA, Bankscope
NPL EuropeIssue 1 | August 2009
Welcome to the inaugural issue of NPL Europe, a publication covering non-performing loan (NPL) markets in Europe and the United Kingdom (UK).
Key value drivers
The difference between asking prices and bids lies in the assumptions made by banks and investors when assessing distressed asset portfolios. These assumptions are based on two key value drivers:
The estimated time to recover cash from borrowers. This can be affected by whether the recovery is achieved through a negotiated settlement, a restructuring or repayment arrangement or legal enforcement against guarantors and their underlying collateral.
Their respective views about the real estate market and the resulting impact on collateral values and consumer or market confi dence.
Also, recent government fi nancial system stabilisation measures have stalled some banks’ plans to sell NPL portfolios. As a result, banks generally prefer holding assets, rather than selling them, or restructuring their NPL portfolios using a hybrid arrangement whereby an ownership stake is maintained.
Better returns required
Investors are also requiring higher returns from NPL portfolio investments. This is due largely to the scarcity of cash and the relatively high returns achievable on less risky investments such as corporate bonds.
Despite these obstacles, there still seems to be plenty of interest from investors and sellers of distressed and non-core assets, provided the pricing gap can be closed. To bridge the pricing gap there has been a noticeable increase in bilateral structured deals.
•
•
Since late 2008, NPL portfolios have traded in the UK, Spain, Germany, Italy, Greece, Turkey, the Czech Republic, Portugal and Poland. However, due to the global fi nancial crisis, the number and value of deals closed have been below market expectations.
Several changes to the current regulatory and economic environment are required to help bridge the current bid-ask spread and stimulate NPL sale activity. These include the tightening of bond spreads, increased liquidity, clarity over government support and the stabilisation of economic indicators (such as consumer sentiment, real estate markets and foreign currencies).
Recent H109 results reported by major European and US banks have given renewed hope to equity traders that banks have turned the corner. However, almost all banks have continued to experience signifi cant deterioration in the quality of loan portfolios which in many cases more than outweighed the trading gains. There have been many restructuring and covenant waiver initiatives that have allowed banks to defer some of the losses into the future. Without a signifi cant economic turnaround it is likely that banks are going to need to deal with their pools of non-performing and sub-performing consumer and corporate customers in a more decisive manner, either through outsourcing the asset workout, outright sales or structured deals.
To further highlight the issues faced by the European economies, the tables below depict historical and forecast GDP and unemployment rates for 2009 and 2010. These suggest that generally there is still a long way to go before underlying consumer demand improves enough to turn economies back to a growth phase. In addition, with the majority of EU countries forecasting a continued increase in unemployment rates into 2010, it is reasonable to expect that this will lead to further deterioration in loan portfolio quality for banks in 2009 and 2010. Banks will then need to decide whether to “work out the assets” or dispose of the problems of the past in order to focus on the more profi table future business.
Table 2: GDP Trends and Expectations From 2008 to 2010
2008 Act 2009 LRP 2010 LRP
Czech Republic 3.2% -2.5% 1.2%
France 0.4% -3.0% 0.5%
Germany 1.3% -5.6% -1.0%
Greece 2.9% -1.7% -0.4%
Italy -1.0% -4.2% -0.3%
Poland 4.9% -1.4% 0.8%
Portugal 0.0% -3.7% -0.8%
Spain 1.2% -1.7% 0.2%
Turkey 1.1% -4.5% 1.0%
UK 0.7% -1.0% 0.4%
Euro Area 0.7% -4.0% -0.1%
EU 0.9% N/A N/A
Source: Eurostat, IMF and ECB
2 | NPL Europe • Issue 1 • August 2009
Table 3: Unemployment Trends and Expectations From 2006 to 2010
2008 Act Q109 Act 2009 LRP 2010 LRP
Czech Republic 4.4% 5.5% 8.4% 8.0%
France 7.8% 8.8% 9.6% 10.7%
Germany 7.3% 7.6% 8.9% 10.8/%
Greece 7.7% 9.3% 9.5% 10.5%
Italy 6.8% 7.9% 8.6% 8.7%
Poland 7.2% 7.7% 12.5% 11.0%
Portugal 7.8% 9.1% 9.1% 9.8%
Spain 13.9% 17.3% 17.7% 20.0%
Turkey 10.7% 14.9% 14.2% 14.6%
UK 5.6% 6.9% 10.5% 9.2%
Euro Area 7.6% 8.9% N/A N/A
EU 7.0% 8.4% N/A N/A
Source: Eurostat, IMF and ECB
Please note the information contained in NPL Europe has been obtained from numerous sources in the market and is believed to be accurate at the time of going to print. We trust that you will fi nd this publication useful and welcome any comments you may have.
United Kingdom
NPL portfolio sales quiet despite downturn
Over the past 18 months, some larger loan portfolios have traded in the UK as investors focus on what has traditionally been an inactive NPL market. However, most of these trades have taken place behind the scenes.
In recent years, the UK has experienced prolonged economic growth, real estate appreciation and increases in bank and non-bank lending. This has been coupled with an active residential mortgage-backed securities (RMBS) and commercial mortgage-backed securities (CMBS) origination market.
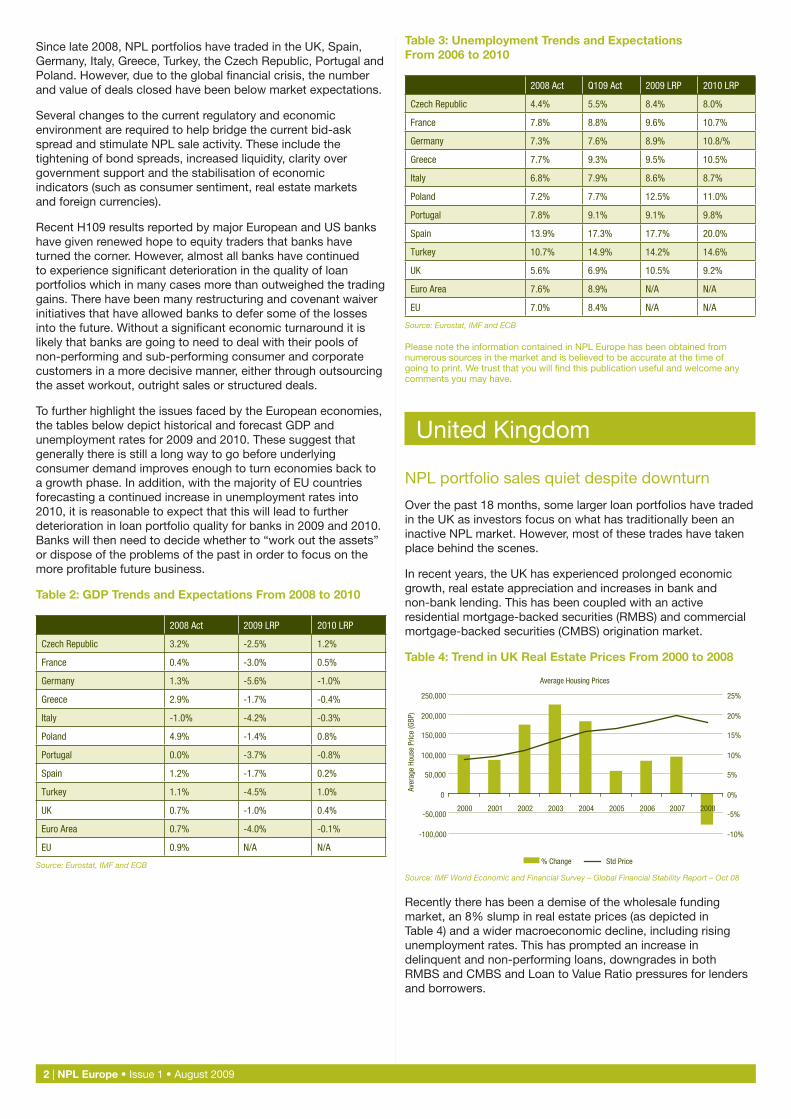
Table 4: Trend in UK Real Estate Prices From 2000 to 2008
Average Housing Prices
-100,000
-50,000
0
50,000
100,000
150,000
200,000
250,000
2000 2001 2002 2003 2004 2005 2006 2007 2008
Aver
age
Hous
e Pr
ice
(GBP
)
-10%
-5%
0%
5%
10%
15%
20%
25%
% Change Std Price
Source: IMF World Economic and Financial Survey – Global Financial Stability Report – Oct 08
Recently there has been a demise of the wholesale funding market, an 8% slump in real estate prices (as depicted in Table 4) and a wider macroeconomic decline, including rising unemployment rates. This has prompted an increase in delinquent and non-performing loans, downgrades in both RMBS and CMBS and Loan to Value Ratio pressures for lenders and borrowers.

Large fi nancial institutions may consider the disposal of non-core assets domiciled outside the UK. This could extend from loan portfolios to underlying platforms and branch networks.
Both non-UK and UK-based institutions are considering exiting markets or product types. These reviews could result in portfolio transactions.
•
•
£100 billion-plus in write-offs expected
From FY08 to FY11, UK banks are expected to write off £105 billion (€122 billion).1 In addition, many UK and non-UK institutions with local operations have sought to wind down or exit their UK lending platforms.
The changed environment has compromised the performance of underlying loans and the stability of banks and lenders. Loan defaults and arrears and loan to value (LTV) covenant breaches are increasing and fi nancial service providers are experiencing eroding capital bases and reduced liquidity.
These issues prompted government intervention to support larger mortgage lenders such as Bradford and Bingley, Northern Rock, HBOS and the Royal Bank of Scotland. This support is being extended to troubled building societies.
Second-tier banks such as Heritable Bank, non-bank fi nanciers such as Cattles and loan originators such as Morgan Stanley are also fi nding their business models severely tested.
Few transactions undertaken
While many would expect these developments to prompt fi nanciers to sell NPL and non-core loan portfolios, few transactions have taken place. The few that have occurred have been settled behind closed doors. The reasons for this include:
Government intervention – The government’s nationalisation of several lenders, introduction of an Asset Protection Scheme and other measures to protect defaulting borrowers have reduced the urgency for banks to rid themselves of NPLs. Banks and investors are uncertain about how these schemes work and their fi nancial impact.
Bank provisioning levels – Under International Financial Reporting Standards, UK banks do not have to account for NPLs on an incurred loss basis. This means that, banks are preferring to carry the defaulted assets on their books at the potentially higher values, rather than accept the potentially negative balance sheet impact of selling loans at current prices.
Macroeconomic expectations – A large number of lenders are yet to fully absorb the impact of real estate declines to date, let alone the continued deterioration in loan-to-value ratios and impairment calculations. Analysts place the likely decline in real estate prices at 25 per cent between 2008 and 2010.2 As a result, the views of many lenders are very different to those of investors.
Investor pricing – The withdrawal or collapse of several investors due largely to the credit crunch has further reduced the prices for loan portfolios, RMBS or CMBS. As seen in the Lehman Brothers, Kaupthing Bank and Heritable Bank sales processes, even insolvent institutions and their administrators believe greater value exists in running off loan portfolio (and related) assets.
In 2009–10, NPL sale activity is likely to focus on these areas:
The unsecured NPL sale market is likely to expand as banks proactively deal with defaulted credits and new investors enter the UK market and establish platforms.
Smaller distressed institutions are likely to continue to trade secured portfolios and RMBS/CMBS due to the falling real estate prices of 2008 and 2009. These institutions include former origination platforms and insolvent fi nancial services businesses. However, while the drivers for selling differ from those experienced by larger banks, portfolio pricing remains a barrier.
•
•
•
•
•
•
NPL Europe • Issue 1 • August 2009 | 3
1. RBS/ABN AMRO, UK Banks Investment View, January 2009
2. PwC “UK Economic Outlook Report - July 2009”
Spain
Slow for a while but the NPL market is expected to gain momentum
With an unemployment rate that reached 17.4 per cent at the end of March 2009 and an increase in the NPL ratio from 0.9 per cent at the end of 2007 to 4.4 per cent in April 2009, Spain is one of the most talked-about NPL markets in Europe.
As recently as August 2009, PwC successfully sold a residential mortgage portfolio on behalf of a major Spanish fi nancial institution and has a number of other current mandates with Spanish fi nancial institutions to sell additional residential mortgage and unsecured consumer portfolios in the coming months. Some of the other key deals over recent years are outlined below.
Table 5: Recent NPL Transactions in Spain
Entity UPB (€M) Type Buyer Date
Banco Sabadell 100 secured Treym/Aktive Kap.
Dec 05
Santander 230 unsecured Link Finanzas Mar 06
Santander 1,400 mixed Goldman Sachs y Intrum Justicia
Aug 06
BBVA 700 mixed Carval Investors
Jun 07
Banesto 300 secured UBS Sep 07
200 secured UBS Sep 07
ABN Amro 60 unsecured B of A Oct 07
Popular 1,000 mixed Apollo Investment
Nov 07
Caixa Galicia 100 secured Apollo Investment
Dec 07
Vodafone 200 receivables BofA & WestLB
Dec 07
Telefónica 200 receivables Aktiv Kapital Dec 07
Caixa Galicia 100 secured Carval Investors
May 08
GMAC 3,000 mixed Banesto & Bankinter
Jun 08
Morgan Stanley 300 mixed Lehman/Shinshei
Jun 08
Orange 100 receivables JZ International
Jun 08
Caixa Nova 30 unsecured consumer
Aktiv Kapital 2008
MBNA 90 unsecured consumer
Varde 2009
Confi dential 60 residential mortgage
Confi dential Aug 2009
Source: PwC
4 | NPL Europe • Issue 1 • August 2009
Relative to perceived opportunities, there have been only a few NPL portfolio sales in Spain in 2008 and 2009. This is due to:
The liquidity crisis.
Different expectations between buyers and sellers about likely decreases in property values.
Limited experience of local collection agencies in servicing certain classes of distressed assets, including residential mortgage and corporate loans, as these asset classes have traditionally been managed in-house by the banks.
Resource constraints of investor teams.
The creation of the Financial Assets Acquisition Fund, which was established in October 2008 with the objective of providing liquidity to eligible fi nancial institutions by purchasing qualifying AAA rated covered bonds held by them.
Price gap too wide for trades
The largest impediment to successful trades of NPL portfolios (especially secured portfolios) is the gap in price expectations between buyers and sellers. This bid-ask spread is explained mainly by the different expectations regarding property prices in Spain and the uncertainty over the recovery period. Financial services businesses are still reluctant to accept the defl ated prices being offered by investors, which factor in a signifi cant decrease in property values.
Existing debt recovery platforms are already operating at or near capacity and have a limited ability to take on new clients. These platforms are being adapted to new market requirements, but capacity expansion is lagging. Many investors are now looking to acquire or create a new servicing platform, meaning any potential purchases are being postponed until additional capacity is secured.
Merger activity between fi nancial institutions, in particular savings banks, is expected to increase over the next 12 months. This may be accompanied by a heightened focus on the divestment of non-core assets, whether performing or non-performing. The Bank of Spain’s recent decision to create a bank restructuring fund to take control of ailing institutions could force those affected to merge or sell non-core assets.
Interpretation change infl uential
On the other hand, the Bank of Spain has changed its interpretation of an existing regulation determining how fi nancial institutions can calculate delinquent mortgage debt provisions.
Under the new guidelines, which took immediate effect in July 2009, entities are required to calculate their provisions based on the difference between the debt exposure and 70% of the current (updated) value of the security, rather than calculate provisions based on 100 per cent of their debt exposure. However, we note banks are not allowed to release provisions that have already been raised.
•
•
•
•
•
There is no change to the policy for unsecured debt. However, in its statement, the Bank of Spain said the existing policy represented the minimum requirement and that institutions should calculate actual provisioning levels based on historic recoveries.
The exact impact on each bank depends on its NPL portfolio composition. However, we note that historical recovery rates may not represent the most appropriate basis for determining the collectability of more recently defaulted loans.
Both sellers and buyers are anticipating a signifi cant increase in deal fl ow (of both secured and unsecured portfolios) in the second half of 2009 and well into 2010–11.
Germany
Investors play a waiting game due to pricing gap and regulatory changes
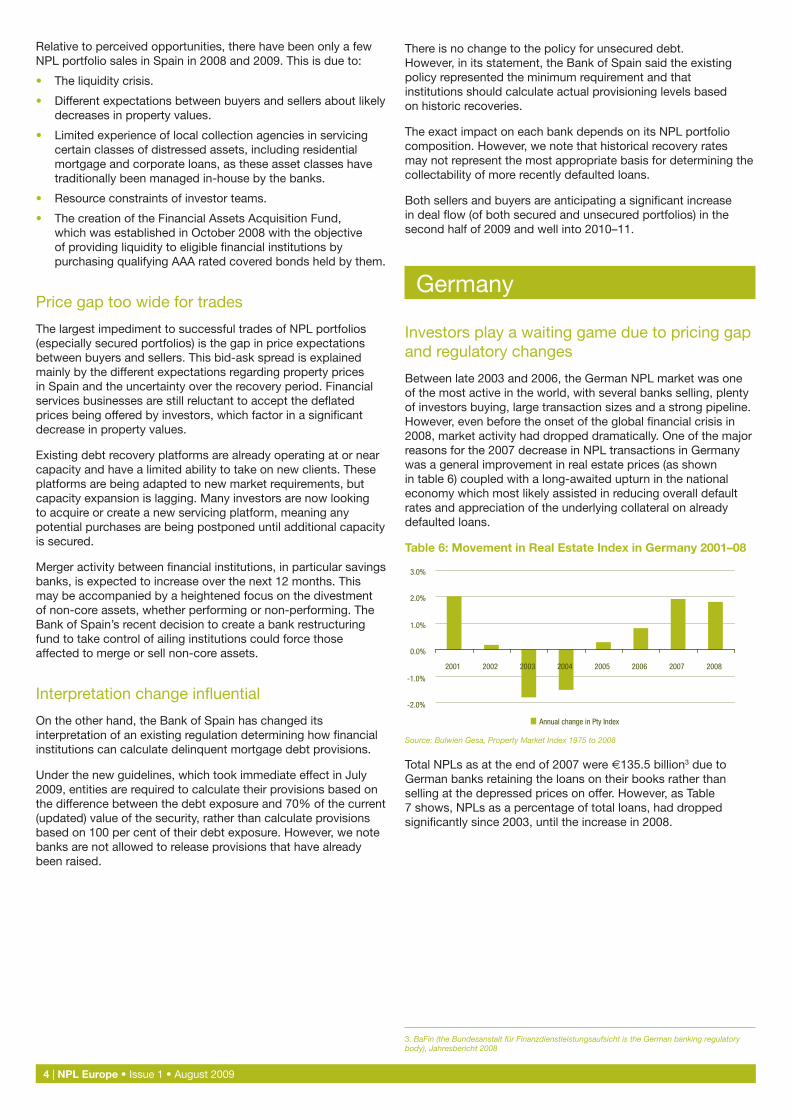
Between late 2003 and 2006, the German NPL market was one of the most active in the world, with several banks selling, plenty of investors buying, large transaction sizes and a strong pipeline. However, even before the onset of the global fi nancial crisis in 2008, market activity had dropped dramatically. One of the major reasons for the 2007 decrease in NPL transactions in Germany was a general improvement in real estate prices (as shown in table 6) coupled with a long-awaited upturn in the national economy which most likely assisted in reducing overall default rates and appreciation of the underlying collateral on already defaulted loans.
Table 6: Movement in Real Estate Index in Germany 2001–08
-2.0%
-1.0%
0.0%
1.0%
2.0%
3.0%
2001 2002 2003 2004 2005 2006 2007 2008
Annual change in Pty Index
Source: Bulwien Gesa, Property Market Index 1975 to 2008
Total NPLs as at the end of 2007 were €135.5 billion3 due to German banks retaining the loans on their books rather than selling at the depressed prices on offer. However, as Table 7 shows, NPLs as a percentage of total loans, had dropped signifi cantly since 2003, until the increase in 2008.
3. BaFin (the Bundesanstalt für Finanzdienstleistungsaufsicht is the German banking regulatory body), Jahresbericht 2008
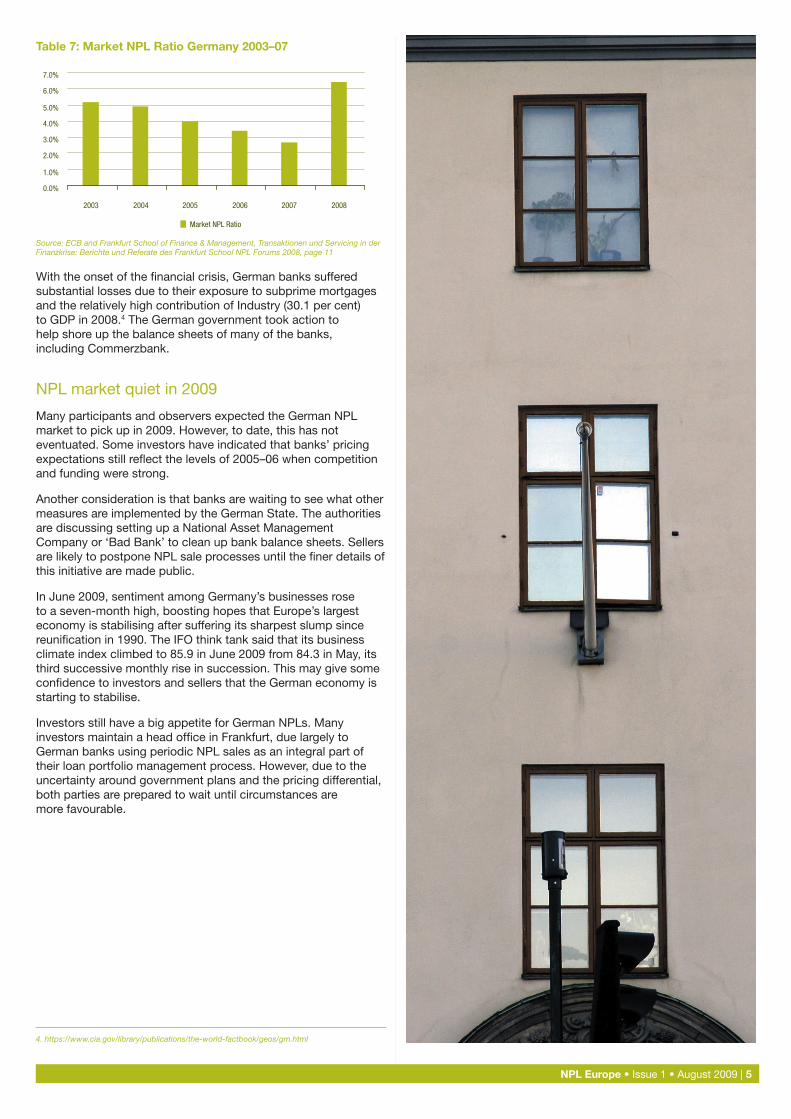
Table 7: Market NPL Ratio Germany 2003–07
0.0%
1.0%
2.0%
3.0%
4.0%
5.0%
6.0%
7.0%
2003 2004 2005 2006 2007 2008
Market NPL Ratio
Source: ECB and Frankfurt School of Finance & Management, Transaktionen und Servicing in der Finanzkrise: Berichte und Referate des Frankfurt School NPL Forums 2008, page 11
With the onset of the fi nancial crisis, German banks suffered substantial losses due to their exposure to subprime mortgages and the relatively high contribution of Industry (30.1 per cent) to GDP in 2008.4 The German government took action to help shore up the balance sheets of many of the banks, including Commerzbank.
NPL market quiet in 2009
Many participants and observers expected the German NPL market to pick up in 2009. However, to date, this has not eventuated. Some investors have indicated that banks’ pricing expectations still refl ect the levels of 2005–06 when competition and funding were strong.
Another consideration is that banks are waiting to see what other measures are implemented by the German State. The authorities are discussing setting up a National Asset Management Company or ‘Bad Bank’ to clean up bank balance sheets. Sellers are likely to postpone NPL sale processes until the fi ner details of this initiative are made public.
In June 2009, sentiment among Germany’s businesses rose to a seven-month high, boosting hopes that Europe’s largest economy is stabilising after suffering its sharpest slump since reunifi cation in 1990. The IFO think tank said that its business climate index climbed to 85.9 in June 2009 from 84.3 in May, its third successive monthly rise in succession. This may give some confi dence to investors and sellers that the German economy is starting to stabilise.
Investors still have a big appetite for German NPLs. Many investors maintain a head offi ce in Frankfurt, due largely to German banks using periodic NPL sales as an integral part of their loan portfolio management process. However, due to the uncertainty around government plans and the pricing differential, both parties are prepared to wait until circumstances are more favourable.
NPL Europe • Issue 1 • August 2009 | 5
4. https://www.cia.gov/library/publications/the-world-factbook/geos/gm.html
6 | NPL Europe • Issue 1 • August 2009
Table 8: Factors Affecting NPL Transactions in Germany
Investors Banks
• Banking secrecy uncertainty: The general assumption under German law is that no information on borrowers may be provided unless a credit agreement has been cancelled or the transaction is virtually agreed. In contrast, the consensus for NPL transactions is that the identity of the borrower may be provided.
• Complex accounting: German Generally Accepted Accounting Principles (GAAP) are very restrictive regarding balance sheet de-recognition of the loan portfolio, while International Financial Reporting Standards (IFRS) and US GAAP are more fl exible.
• Collateral transfer: This can be cumbersome and in some cases very diffi cult (i.e. mortgage collateral in the land register).
• Borrower consent: Change of lender may require the agreement of the borrower.
• Banking licence: May be required (for performing assets).
• Price: This remains the largest barrier to successful transactions in Germany. Investors have historically required an Internal Rate of Return (IRR) of at least 15 per cent post-tax. The recent decline in the value of underlying collateral (in particular real estate), underprovisioning, relatively poor due diligence information, banking secrecy and the lack of understanding of buyers’ needs all contribute to this.
• Government action: The German government has injected substantial resources into stabilising its banks. A number of banks appear to be capitalised to the extent that pressure to sell NPLs has been reduced.
• Servicing: As banks have expanded outside Germany, they face the challenging exercise of establishing top-quality cross-border servicing platforms.
Portugal
Improvement expected following the past 12 months which included Lehman departure, global fi nancial crisis and sizeable bid ask spreads
The Portuguese NPL market is small compared to many other European countries. However, it is mature and attracts a large number of international investors who see it as an extension of the Spanish market. NPL transactions started in 2003 after the restructuring of the banking system during the late 1990s, and in the last two years almost all of the major banks were active in the NPL market selling secured and unsecured portfolios (consumer, SME, corporate and mixed).
The current NPL market size is close to €5 billion (the NPL ratio was below 2 per cent at the end of 2008), with average provision coverage around 138 per cent of total NPLs.5 All major fi nancial institutions regularly assess the value of NPL portfolios for future sales to improve their bad debt and solvency ratios.
Table 9: Top Five Bank NPLs and NPL Ratio
-
500.0
1,000.0
1,500.0
2,000.0
2,500.0
3,000.0
3,500.0
4,000.0
4,500.0
2004 2005 2006 2007 2008
Top
5Ba
nkNP
Ls(E
URin
mill
ions
)
0.00%
0.20%
0.40%
0.60%
0.80%
1.00%
1.20%
1.40%
1.60%
1.80%
NPL
Ratio
(%)
NPLs NPL Ratio
Source: CGD, BCP, BES, BPI, BST Financial Statements
Legal authorities have recently introduced changes allowing creditors to start enforcement processes via the internet. This has reduced the time required to enforce real estate collateral to 28 months for residential loans and 21 months for corporate loans. These changes have helped to make the Portuguese NPL market more attractive to investors.
With most Portuguese banks servicing NPL portfolios in-house, there are few independent servicers with the experience and sophistication required by international investors. Expertise in third-party servicing for secured portfolios is currently concentrated in fi nancial services specialists Domusvenda and Whitestar. We expect this situation to change in the near future as investors try to establish their own platforms.
Another positive for the Portuguese NPL market is that, unlike neighbouring Spain, housing prices have remained relatively stable since 2002 and the construction industry represents only 7 per cent of GDP. However, a recent Financial Times article6 reported housing prices in Portugal fell 6.3 per cent in Q408.
Since June 2008, the volume of transactions has fallen signifi cantly and most of the transactions taken to market failed to close. The main reasons for this were the global fi nancial crisis; the entry into administration of Lehman, which had been a signifi cant buyer; and the increase in the bid-ask spread. In Q209 a few transactions were closed and NPL activity is expected to continue to improve in the second half of the year.
5. CGD, BCP, BES, BPI, BST, Annual Reports 2004-2008
6. Financial Times, 6 April 2009.

NPL Europe • Issue 1 • August 2009 | 7
Italy
Dry 2008 but outlook positive for Italian NPLs
With market NPLs of close to €50 billion and a relatively high NPL ratio as shown in table 10 below, Italy is one of the largest and most established NPL markets in Europe. The introduction of a securitisation law supporting NPL sales stimulated transactions in early 2001. From 2005 to 2007, the NPL market in Italy traded loans in excess of €25 billion to investors that included Fortress, Merrill Lynch, Deutsche Bank, Pirelli, ABN AMRO, Lehman Brothers and Goldman Sachs.
Table 10: Italian NPL Loans and Ratio From 2003 to 2008
-
10,000
20,000
30,000
40,000
50,000
60,000
2003 2004 2005 2006 2007 2008
NPL
(EUR
in m
illio
ns)
0.0%
1.0%
2.0%
3.0%
4.0%
5.0%
6.0%
7.0%
8.0%
NPL
Ratio
Gross NPL NPL Ratio
Source: Bank of Italy
However, during 2008 the market all but dried up. As a result, many top-tier investors have attempted to exit, creating a secondary market for NPLs. We understand from discussions with a number of the Italian banks that as property prices continue to deteriorate (as shown in table 11 below) sellers have had problems bridging the price expectation gap with potential buyers. With so many more ‘investor friendly’ NPL markets becoming active during 2008 and 2009 the seven year-plus Italian legal enforcement timeline is viewed negatively by most investors.
Table 11: Italian Real Estate Trends From 2003 to 2009
-4.0%
-2.0%
0.0%
2.0%
4.0%
6.0%
8.0%
H1
2003
H2
2003
H1
2004
H2
2004
H1
2005
H2
2005
H1
2006
H2
2006
H1
2007
H2
2007
H1
2008
2009
YOY Movement (%)
Source: Tecnocasa study (main real estate agency operator in Italy)
Key GDP factors under pressure
The Italian market is also experiencing growing pressure with a forecasted reduction in GDP in 2009 and 2010. The tertiary/services (71 per cent) and industrial (21 per cent) sectors that account for 92 per cent of GDP are at the forefront of this reduction. In March 2009, orders placed with Italian industry fell on a 12-month basis as foreign demand weakened further. The latest data from Istat, the national statistics agency, showed that orders slid 26 per cent in March after falls of 33 per cent in both January and February.
The Ministry of Finance and Treasury expects unemployment in Italy to increase almost 2 per cent during 2009 to 8.6 per cent, placing further pressure on the asset quality of banks. The ability of the Italian government to intervene should any of the major banks experience further liquidity shortages is limited, as Italy has one of the highest levels of public debt in the Eurozone at 104 per cent of GDP.7
NPLs an ‘illiquid’ investment
The sheer magnitude of NPLs and the proven transaction process for sales in Italy make it an interesting market for investors. However, in the face of the credit crisis, NPL portfolios are perceived as a relatively illiquid investment.
Investors departing the Italian market have cited a number of reasons for exiting, including: underperformance of investments made between 2005 and 2007 against business plans; high fi xed costs paid for management of NPL portfolios regardless of performance; the disappearance of the securitisation market in which to divest interests in NPL portfolios through the sale of notes; and the limited ability to leverage the assets due to the onset of the credit crunch. All these factors are driving a wedge between the pricing expectations of sellers and of buyers.
A number of changes need to occur before the NPL market in Italy becomes liquid again. Italian banks are likely to write off more loans during 2009 to improve balance sheet ratios, resulting in a fl ow of new NPLs to market. Also, as the global economy gradually recovers, returns from less risky assets, such as corporate bonds, should be lower. This makes the potential returns from NPL acquisitions more attractive.
Many well-known investors who have previously invested in Italy will most likely keep abreast of developments. The pricing expectations of some sellers declined during 2009 and the number of new NPLs coming onto the books of banks increased. These factors combined suggest there may be an up tick in NPL sales activity in the near future.
Capacity constraints a key driver
The driver for banks to sell NPLs is increasingly a commercial decision based on capacity constraints. With many fi nancial institutions restricting staff hiring, their ability to recover NPLs that become less valuable and more resource-intensive to collect on over time is constrained. The question becomes ‘do I have the resources to give these loans the attention needed to achieve the recoveries I have historically enjoyed?’ This question is pivotal in determining when and at what price sellers in Italy will come to market and whether investors will be interested in the prices being asked.
7. CIA World Factbook, November 2008.
8 | NPL Europe • Issue 1 • August 2009
France
Look abroad for opportunities with French banks
In a recent report by Debtwire, investors rated France as offering the fourth greatest opportunity in Europe for distressed investments during 2009.8 The country ranked behind the UK, Germany and Spain, but ahead of Russia, Italy and Eastern Europe. However, banks have indicated recently that, even as default rates in France rise, they remain at acceptable levels compared with other European countries.
In the past, most NPL transactions that have occurred in France have been relatively small. While they range between several thousand euros to €10 million, transactions above €5 million are relatively infrequent. This is due to the fact that banks are organised by region and by subgroups of agencies, combined with the fact many are mutual institutions with independent local entities.
With these small entities having previously managed their portfolios in-house, the potential size of NPL disposals is limited. However, some banks have expanded operations into Central and Eastern European economies which have experienced a much higher rise in default rates and greater deterioration in asset quality.
It is understood that a number of French banks fall into this category and that they are currently reviewing their exposures in each of these regions to determine whether any of the businesses have become ‘non-core’. Therefore, we believe that the NPL opportunities that originate in France will more likely be for operations abroad.
Greece
Fledgling NPL market could soar
Greece is a relatively new NPL market which started to develop in 2008 when the major Greek banks sold €1 billion-plus in Unpaid Principal Balances (UPB) of unsecured consumer loan portfolios. One Greek bank brought a €300 million corporate loan portfolio to market in March 2008 which, at time of writing, does not appear to have been sold. Following the collapse of Lehman Brothers in September 2008, the NPL market slowed. However in March 2009, a major Greek bank completed a €255 million UPB portfolio sale.
Table 12: Recent Completed NPL Transactions in Greece
Completed Transactions
Seller Name UPB (€M) Asset Class Date
Emporiki Bank 255.0 Consumer unsecured Mar 09
EFG Eurobank* 150.0 Consumer unsecured Sep 08
EFG Eurobank* 100.0 Consumer unsecured Nov 08
Alpha Bank* 120.0 Consumer unsecured Dec 08
* estimates Source: PwC
Greece has a relatively investor-friendly consumer NPL market, with a number of established and sophisticated collection agencies. In May 2009, the government passed legislation governing the operation of collection agents to formally recognise the role they play in the industry.
8. Debtwire European Distressed Debt Market Outlook 2009, 20 January 2009
9. Bank of Greece, http://eng.bankofgreece.gr/en/
10. International Herald Tribune, 18 June 2009
11. Bank of Greece, http://eng.bankofgreece.gr/en/
12. Bank of Greece, http://eng.bankofgreece.gr/en/
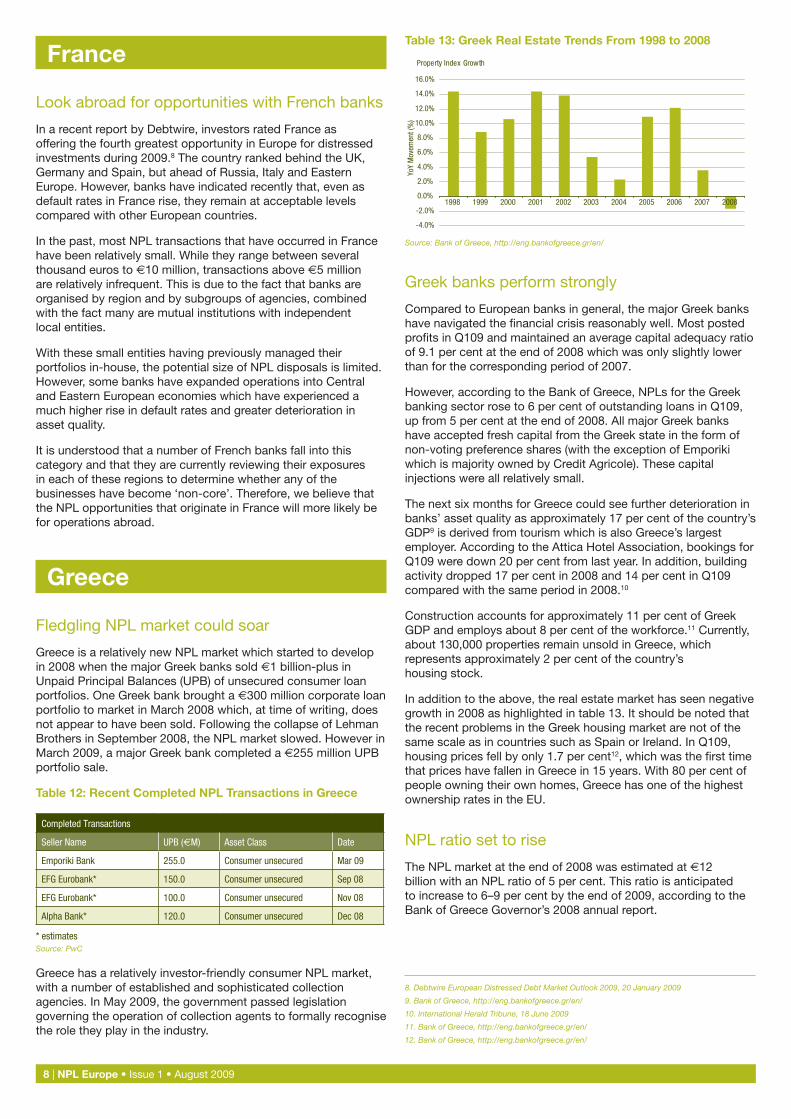
Table 13: Greek Real Estate Trends From 1998 to 2008
Property Index Growth
-4.0%
-2.0%
0.0%
2.0%
4.0%
6.0%
8.0%
10.0%
12.0%
14.0%
16.0%
1998 1999 2000 2001 2002 2003 2004 2005 2006 2007 2008
YoY
Mov
emen
t (%
)
Source: Bank of Greece, http://eng.bankofgreece.gr/en/
Greek banks perform strongly
Compared to European banks in general, the major Greek banks have navigated the fi nancial crisis reasonably well. Most posted profi ts in Q109 and maintained an average capital adequacy ratio of 9.1 per cent at the end of 2008 which was only slightly lower than for the corresponding period of 2007.
However, according to the Bank of Greece, NPLs for the Greek banking sector rose to 6 per cent of outstanding loans in Q109, up from 5 per cent at the end of 2008. All major Greek banks have accepted fresh capital from the Greek state in the form of non-voting preference shares (with the exception of Emporiki which is majority owned by Credit Agricole). These capital injections were all relatively small.
The next six months for Greece could see further deterioration in banks’ asset quality as approximately 17 per cent of the country’s GDP9 is derived from tourism which is also Greece’s largest employer. According to the Attica Hotel Association, bookings for Q109 were down 20 per cent from last year. In addition, building activity dropped 17 per cent in 2008 and 14 per cent in Q109 compared with the same period in 2008.10
Construction accounts for approximately 11 per cent of Greek GDP and employs about 8 per cent of the workforce.11 Currently, about 130,000 properties remain unsold in Greece, which represents approximately 2 per cent of the country’s housing stock.
In addition to the above, the real estate market has seen negative growth in 2008 as highlighted in table 13. It should be noted that the recent problems in the Greek housing market are not of the same scale as in countries such as Spain or Ireland. In Q109, housing prices fell by only 1.7 per cent12, which was the fi rst time that prices have fallen in Greece in 15 years. With 80 per cent of people owning their own homes, Greece has one of the highest ownership rates in the EU.
NPL ratio set to rise
The NPL market at the end of 2008 was estimated at €12 billion with an NPL ratio of 5 per cent. This ratio is anticipated to increase to 6–9 per cent by the end of 2009, according to the Bank of Greece Governor’s 2008 annual report.
NPL Europe • Issue 1 • August 2009 | 9
The IMF predicts that the unemployment rate in Greece will increase year-on-year by 1.8 per cent to 9.5 per cent by the end of 2009 and real GDP to contract by 1.7 per cent.
However, with Greece recording an average annual GDP growth of 3.8 per cent between 1995 and 2007 and having the Eurozone’s second highest public debt ratio as a percentage of GDP (94 per cent), the government is unlikely to provide further assistance to troubled banks.
If Greek banking NPL ratios begin to creep up towards 7 per cent, Greek banks may start coming to market with consumer and corporate NPL portfolios in Q409 in an effort to reduce their NPL ratios and free up cash and resources.
Turkey
Open approach expected to yield benefi ts
During the last Turkish fi nancial crisis in 2002, 22 banks were transferred to the government-controlled Saving Deposit Insurance Fund (SDIF). Since then, the SDIF has managed the run-off of the remaining assets and conducted corporate NPL sales. These include sales of approximately US$220 million (€154.5 million) in 2004 and US$1 billion (€702.1 million) in 2005.
In following years, Turkish banks have followed suit by selling predominantly corporate portfolios. In the past two years, these have largely been bought by a few asset management companies (AMCs) active in the market.
Vicious circle deters investors
Although the NPL market in Turkey is well established, it has also proved to be diffi cult for international investors to enter. The communiqué on establishment of AMCs require that an AMC has a minimum paid in capital of TL 10 million (approximately US$ 7 million). Whilst complying with Turkish regulatory requirements is not particularly diffi cult, the minimum capital requirement, coupled with the uncertainty regarding the total amount of future portfolio sales and the level of competition have made it diffi cult for investors to assess the feasibility of the up front investment required prior to actually acquiring a portfolio.
In addition, it can take between six and nine months to receive permission from the BRSA, which creates a vicious circle as investors fi nd it diffi cult to commit the capital required to establish the AMC until they have acquired a portfolio. While some have proposed breaking this circle by redrafting the pre-closing conditions in the Sale and Purchase Agreement, these changes require the agreement of the sellers. In addition, the price offered by the investor would need to be higher than that offered by the local AMCs to justify the longer closing period.
NPL stock increases
The stock of NPLs in the Turkish market increased by 73% or TL 8 bn (some US$5 bn) between 30 June 2008 to 30 June 2009, primarily due to increased default rates on SME and consumer loans. Total NPL volume reached TL 19 bn (some US$13 bn), which represents 5% of total loans as of 30 June 2009. SME and Consumer credits are relatively new asset classes in Turkey and only started in earnest in 2005. Loan loss ratio has risen to 6.6% on SME loans and 5.3% on consumer loans while it was 3.7% on corporate and commercial loans as at 30 June 2009. Due to their high return high risk structure, SME and consumer loans are an increasingly attractive asset class for future NPL sales.
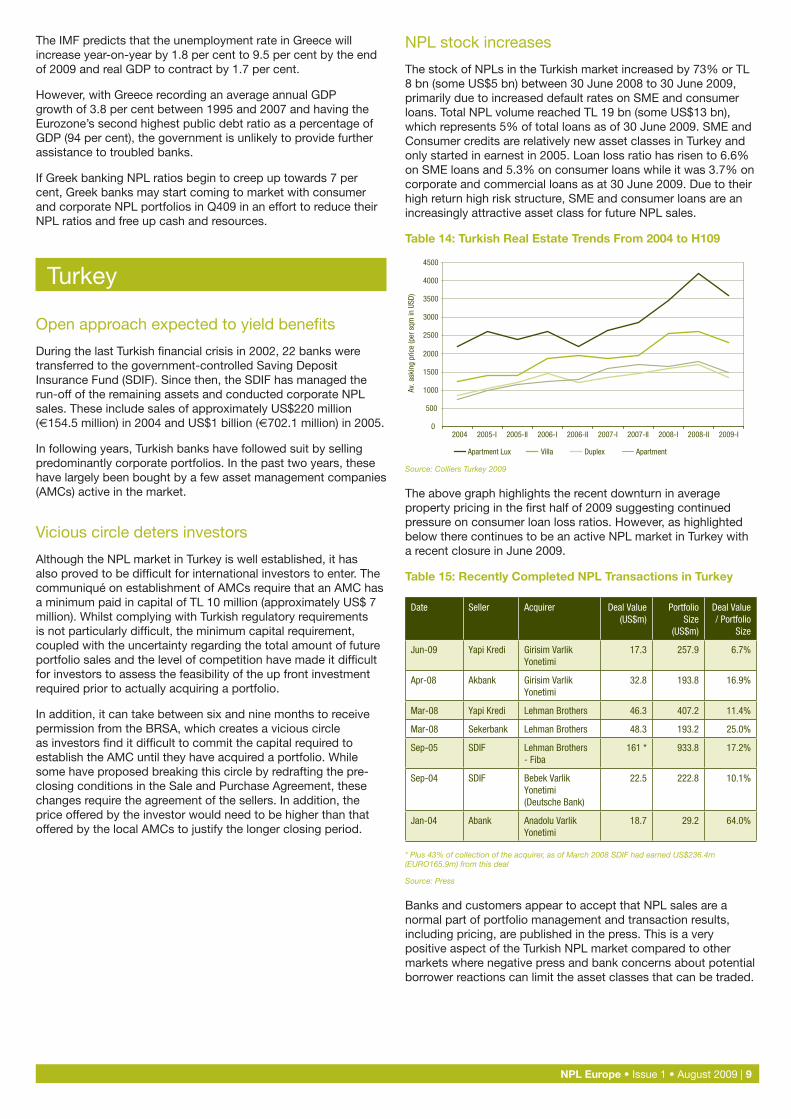
Table 14: Turkish Real Estate Trends From 2004 to H109
0
500
1000
1500
2000
2500
3000
3500
4000
4500
Av. a
skin
g pr
ice
(per
sqm
in U
SD)
2004 2005-I 2005-II 2006-I 2006-II 2007-I 2007-II 2008-I 2008-II 2009-I
Apartment Lux Villa Duplex Apartment
Source: Colliers Turkey 2009
The above graph highlights the recent downturn in average property pricing in the fi rst half of 2009 suggesting continued pressure on consumer loan loss ratios. However, as highlighted below there continues to be an active NPL market in Turkey with a recent closure in June 2009.
Table 15: Recently Completed NPL Transactions in Turkey
Date Seller Acquirer Deal Value (US$m)
Portfolio Size
(US$m)
Deal Value / Portfolio
Size
Jun-09 Yapi Kredi Girisim Varlik Yonetimi
17.3 257.9 6.7%
Apr-08 Akbank Girisim Varlik Yonetimi
32.8 193.8 16.9%
Mar-08 Yapi Kredi Lehman Brothers 46.3 407.2 11.4%
Mar-08 Sekerbank Lehman Brothers 48.3 193.2 25.0%
Sep-05 SDIF Lehman Brothers - Fiba
161 * 933.8 17.2%
Sep-04 SDIF Bebek Varlik Yonetimi (Deutsche Bank)
22.5 222.8 10.1%
Jan-04 Abank Anadolu Varlik Yonetimi
18.7 29.2 64.0%
* Plus 43% of collection of the acquirer, as of March 2008 SDIF had earned US$236.4m (EURO165.9m) from this deal
Source: Press
Banks and customers appear to accept that NPL sales are a normal part of portfolio management and transaction results, including pricing, are published in the press. This is a very positive aspect of the Turkish NPL market compared to other markets where negative press and bank concerns about potential borrower reactions can limit the asset classes that can be traded.
10 | NPL Europe • Issue 1 • August 2009
Czech Republic
Asset deterioration fuels opportunity
In 2008, the Czech Republic achieved GDP growth of 3.2 per cent but is expecting a contraction of 2.5 per cent in 2009. While one of the primary recent drivers of the Czech economy has been exports to other European countries (Germany represents 32 per cent of exports), faltering demand prompted a 17.5 per cent year-on-year fall in industrial production in Q109.
Domestic consumption is also expected to decline in 2009, due to an expected 3 per cent increase in unemployment.
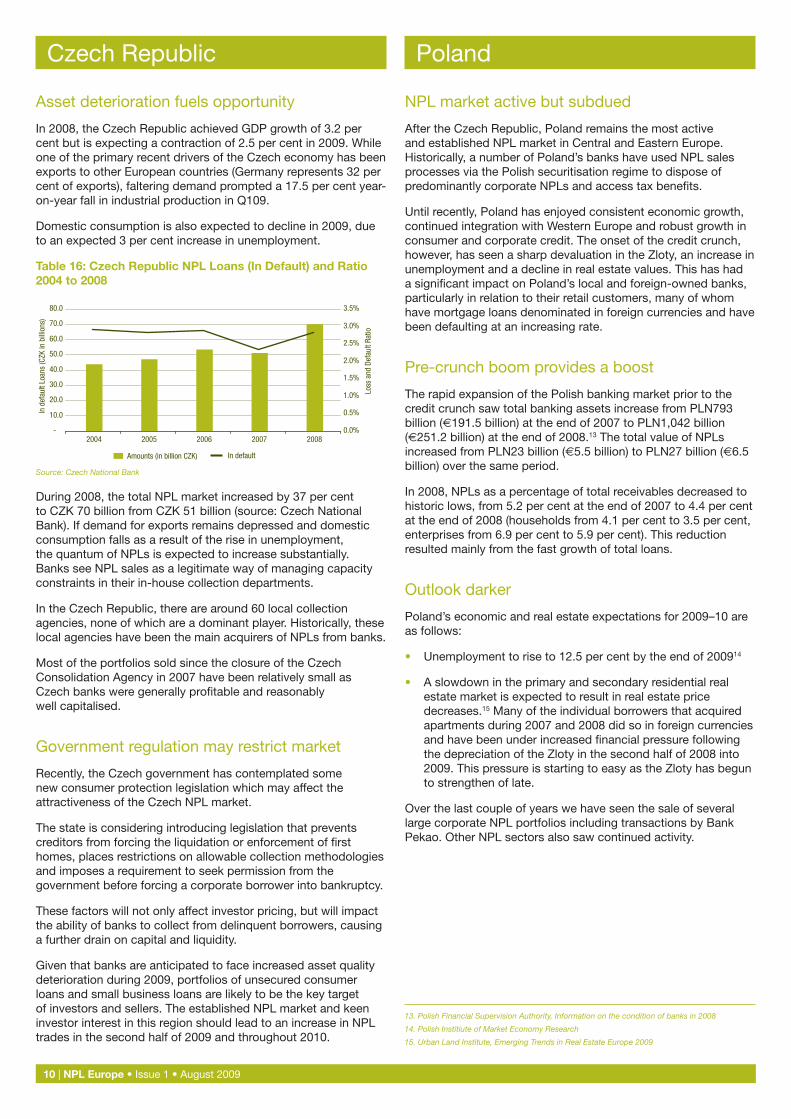
Table 16: Czech Republic NPL Loans (In Default) and Ratio 2004 to 2008
-
10.0
20.0
30.0
40.0
50.0
60.0
70.0
80.0
2004 2005 2006 2007 2008
In d
efau
lt Lo
ans
(CZK
in b
illio
ns)
0.0%
0.5%
1.0%
1.5%
2.0%
2.5%
3.0%
3.5%
Loss
and
Def
ault
Ratio
Amounts (in billion CZK) In default
Source: Czech National Bank
During 2008, the total NPL market increased by 37 per cent to CZK 70 billion from CZK 51 billion (source: Czech National Bank). If demand for exports remains depressed and domestic consumption falls as a result of the rise in unemployment, the quantum of NPLs is expected to increase substantially. Banks see NPL sales as a legitimate way of managing capacity constraints in their in-house collection departments.
In the Czech Republic, there are around 60 local collection agencies, none of which are a dominant player. Historically, these local agencies have been the main acquirers of NPLs from banks.
Most of the portfolios sold since the closure of the Czech Consolidation Agency in 2007 have been relatively small as Czech banks were generally profi table and reasonably well capitalised.
Government regulation may restrict market
Recently, the Czech government has contemplated some new consumer protection legislation which may affect the attractiveness of the Czech NPL market.
The state is considering introducing legislation that prevents creditors from forcing the liquidation or enforcement of fi rst homes, places restrictions on allowable collection methodologies and imposes a requirement to seek permission from the government before forcing a corporate borrower into bankruptcy.
These factors will not only affect investor pricing, but will impact the ability of banks to collect from delinquent borrowers, causing a further drain on capital and liquidity.
Given that banks are anticipated to face increased asset quality deterioration during 2009, portfolios of unsecured consumer loans and small business loans are likely to be the key target of investors and sellers. The established NPL market and keen investor interest in this region should lead to an increase in NPL trades in the second half of 2009 and throughout 2010.
Poland
NPL market active but subdued
After the Czech Republic, Poland remains the most active and established NPL market in Central and Eastern Europe. Historically, a number of Poland’s banks have used NPL sales processes via the Polish securitisation regime to dispose of predominantly corporate NPLs and access tax benefi ts.
Until recently, Poland has enjoyed consistent economic growth, continued integration with Western Europe and robust growth in consumer and corporate credit. The onset of the credit crunch, however, has seen a sharp devaluation in the Zloty, an increase in unemployment and a decline in real estate values. This has had a signifi cant impact on Poland’s local and foreign-owned banks, particularly in relation to their retail customers, many of whom have mortgage loans denominated in foreign currencies and have been defaulting at an increasing rate.
Pre-crunch boom provides a boost
The rapid expansion of the Polish banking market prior to the credit crunch saw total banking assets increase from PLN793 billion (€191.5 billion) at the end of 2007 to PLN1,042 billion (€251.2 billion) at the end of 2008.13 The total value of NPLs increased from PLN23 billion (€5.5 billion) to PLN27 billion (€6.5 billion) over the same period.
In 2008, NPLs as a percentage of total receivables decreased to historic lows, from 5.2 per cent at the end of 2007 to 4.4 per cent at the end of 2008 (households from 4.1 per cent to 3.5 per cent, enterprises from 6.9 per cent to 5.9 per cent). This reduction resulted mainly from the fast growth of total loans.
Outlook darker
Poland’s economic and real estate expectations for 2009–10 are as follows:
Unemployment to rise to 12.5 per cent by the end of 200914
A slowdown in the primary and secondary residential real estate market is expected to result in real estate price decreases.15 Many of the individual borrowers that acquired apartments during 2007 and 2008 did so in foreign currencies and have been under increased fi nancial pressure following the depreciation of the Zloty in the second half of 2008 into 2009. This pressure is starting to easy as the Zloty has begun to strengthen of late.
Over the last couple of years we have seen the sale of several large corporate NPL portfolios including transactions by Bank Pekao. Other NPL sectors also saw continued activity.
•
•
13. Polish Financial Supervision Authority, Information on the condition of banks in 2008
14. Polish Institiute of Market Economy Research
15. Urban Land Institute, Emerging Trends in Real Estate Europe 2009
NPL Europe • Issue 1 • August 2009 | 11
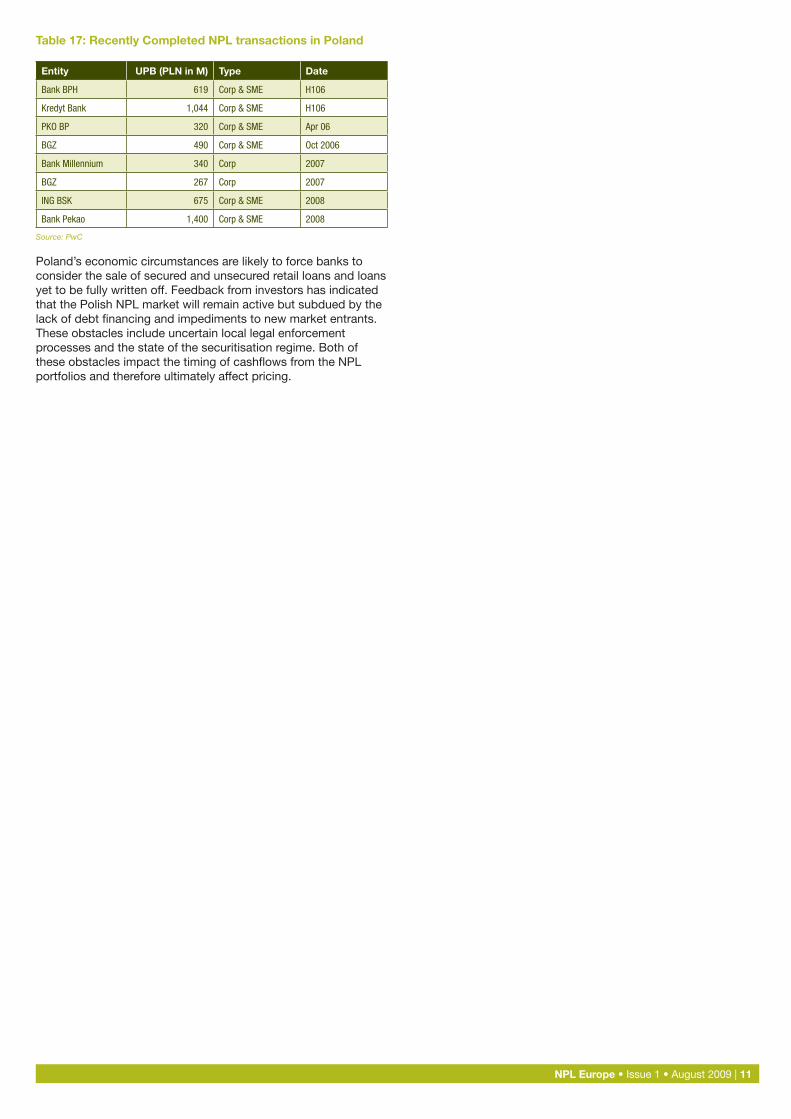
Table 17: Recently Completed NPL transactions in Poland
Entity UPB (PLN in M) Type Date
Bank BPH 619 Corp & SME H106
Kredyt Bank 1,044 Corp & SME H106
PKO BP 320 Corp & SME Apr 06
BGZ 490 Corp & SME Oct 2006
Bank Millennium 340 Corp 2007
BGZ 267 Corp 2007
ING BSK 675 Corp & SME 2008
Bank Pekao 1,400 Corp & SME 2008
Source: PwC
Poland’s economic circumstances are likely to force banks to consider the sale of secured and unsecured retail loans and loans yet to be fully written off. Feedback from investors has indicated that the Polish NPL market will remain active but subdued by the lack of debt fi nancing and impediments to new market entrants. These obstacles include uncertain local legal enforcement processes and the state of the securitisation regime. Both of these obstacles impact the timing of cashfl ows from the NPL portfolios and therefore ultimately affect pricing.

International Team:
Michael McCreadie
+61 3 8603 [email protected]
Stuart King
+34 638 [email protected]
Andrew Jenke
+44 7595 [email protected]
Bruno Guillermo Perri
+34 696 [email protected]
Frank Janik
+66 8 [email protected]
Hernan Magarinos
+1 646 469 [email protected]
Nick Colman
+49 170 [email protected]
Nicolas Malagamba Otegui
+34 696 [email protected]
David White
+60 122 [email protected]
Czech Republic
Jiri Klumpar
+420 251 [email protected]
France
Jean-Pascal Clédat
+33 1 5657 [email protected]
Germany
Jens Roennberg
+49 69 9585 [email protected]
Greece
Emil Yiannopoulos
+30 210 687 [email protected]
Italy
Antonella Pagano
+39 02 80646337 [email protected]
Poland
Janusz Sekowski
+48 22 523 [email protected]
Portugal
Manuel Luz
+351 21 35 99 [email protected]
Spain
Gonzalo Moro
+34 91 568 59 [email protected]
Turkey
Nuran Durmaz
+90 212 376 [email protected]
United Kingdom
Graham Martin
+44 20 7212 [email protected]
Our ContactsAcross Europe and the UK we have experienced partners and directors who can assist you with your NPL-related needs. In addition, PwC has a dedicated international NPL group that can act as an overall coordinator for worldwide NPL mandates and opportunity identifi cation. Through this group, both buyers and sellers of NPLs can receive consistent and seamless service across the world, integrated with country-specifi c knowledge and expertise.
www.pwc.com/loansales
©2009 PricewaterhouseCoopers. All rights reserved. ‘PricewaterhouseCoopers’ refers to the network of member fi rms of PricewaterhouseCoopers Limited, each of which is a separate and independent legal entity.
This publication has been prepared for general guidance on matters of interest only, and does not constitute professional advice. You should not act upon the information contained in this publication without obtaining specifi c professional advice. No representation or warranty (express or implied) is given as to the accuracy or completeness of the information contained in this publication and, to the extent permitted by law, PricewaterhouseCoopers does not accept or assume any liability, responsibility or duty of care for an consequences of you or anyone else acting, or refraining to act, in reliance on the information contained in this publication or for any decision based on it.