Embed Size (px)
Citation preview
13-1
Prediction, Correlation, and Lack of Fit in Regression (§11.4, 11.5, 11.7)
Outline• Confidence interval and prediction interval.• Regression Assumptions.• Checking Assumptions (model adequacy).• Correlation.• Influential observations.
13-2
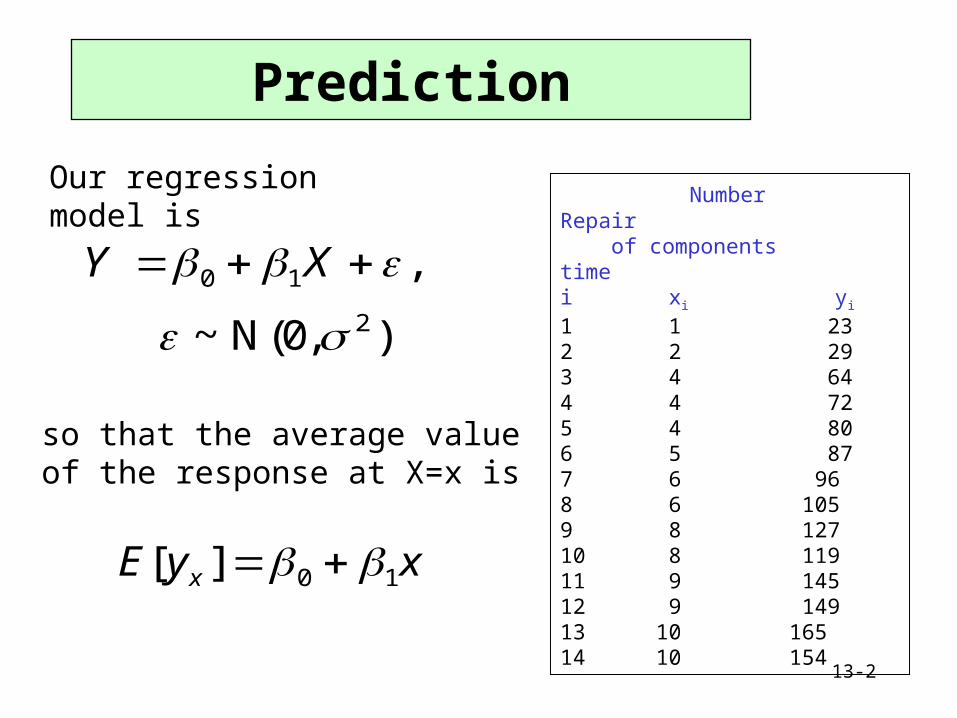
Number Repair of components time i xi yi
1 1 23 2 2 29 3 4 64 4 4 72 5 4 80 6 5 87 7 6 96 8 6 105 9 8 127 10 8 119 11 9 145 12 9 149 13 10 165 14 10 154
Our regression model is
),0(N~
,2
10
XY
so that the average value of the response at X=x is
xyE x 10][
Prediction
13-3
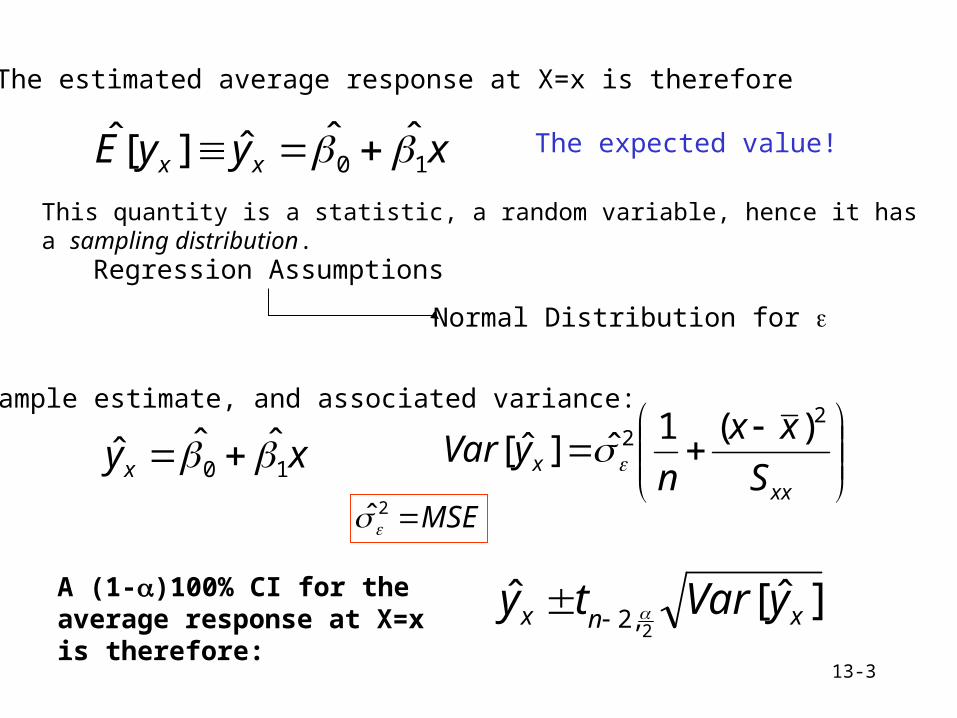
The estimated average response at X=x is therefore
xyyE xx 10ˆˆˆ][ˆ The expected value!
xxx S
xx
nyVar
22 )(1
ˆ]ˆ[
This quantity is a statistic, a random variable, hence it has a sampling distribution.
Normal Distribution for
Regression Assumptions
]ˆ[ˆ2,2 xnx yVarty
xyx 10ˆˆˆ
Sample estimate, and associated variance:
A (1-)100% CI for the average response at X=x is therefore:
MSE2ˆ

13-4
The best predictor of an individual response y at X=x, yx,pred, is simply the average response at X=x.
Prediction and Predictor Confidence
Random variables -- they vary from sample-to-sample.
Hence the predicted value is also a random variable.
Variance associated with an individual prediction is larger than that for the mean value! Why?
xxpredx S
xx
nyVar
22
,
)(11ˆ]ˆ[
A (1-)100% CI for an individual response at X=x:
xy predx 10,ˆˆˆ
]ˆ[ˆ ,2/,2, predxnpredx yVarty
13-5
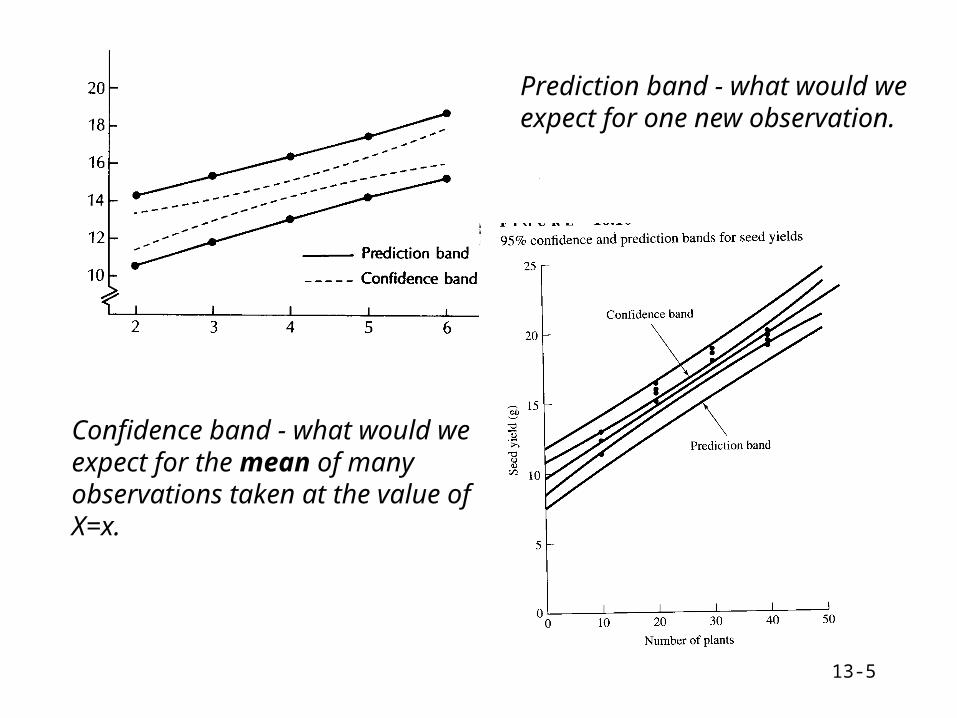
Prediction band - what would we expect for one new observation.
Confidence band - what would we expect for the mean of many observations taken at the value of X=x.

13-6
13-7
Regression Assumptions and
Lack of Fit
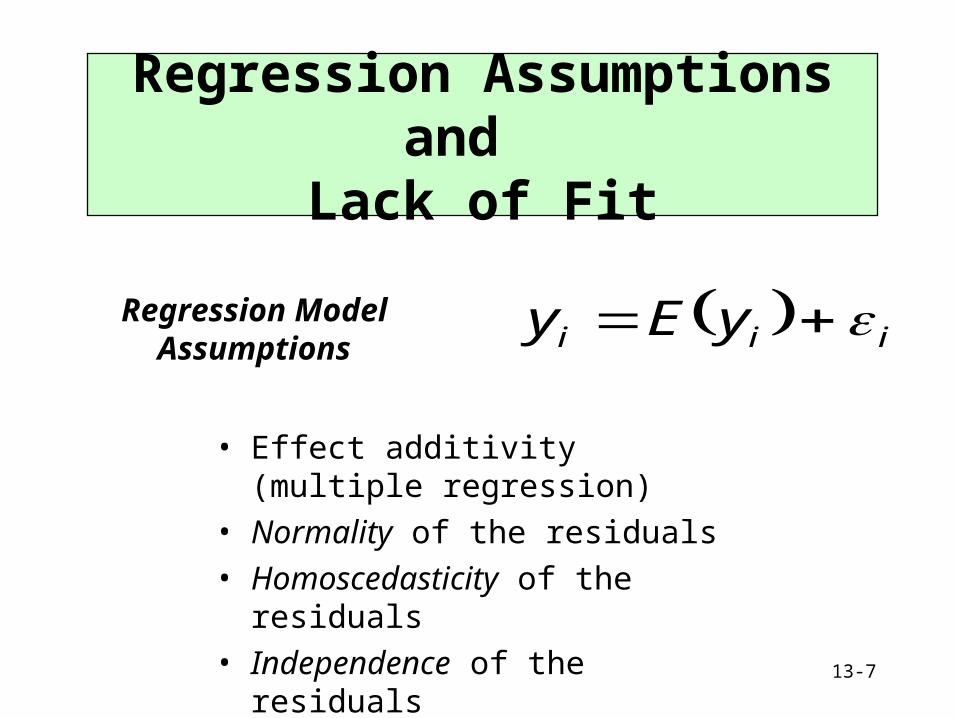
Regression Model Assumptions
• Effect additivity (multiple regression)• Normality of the residuals• Homoscedasticity of the residuals• Independence of the residuals
iii yEy
13-8
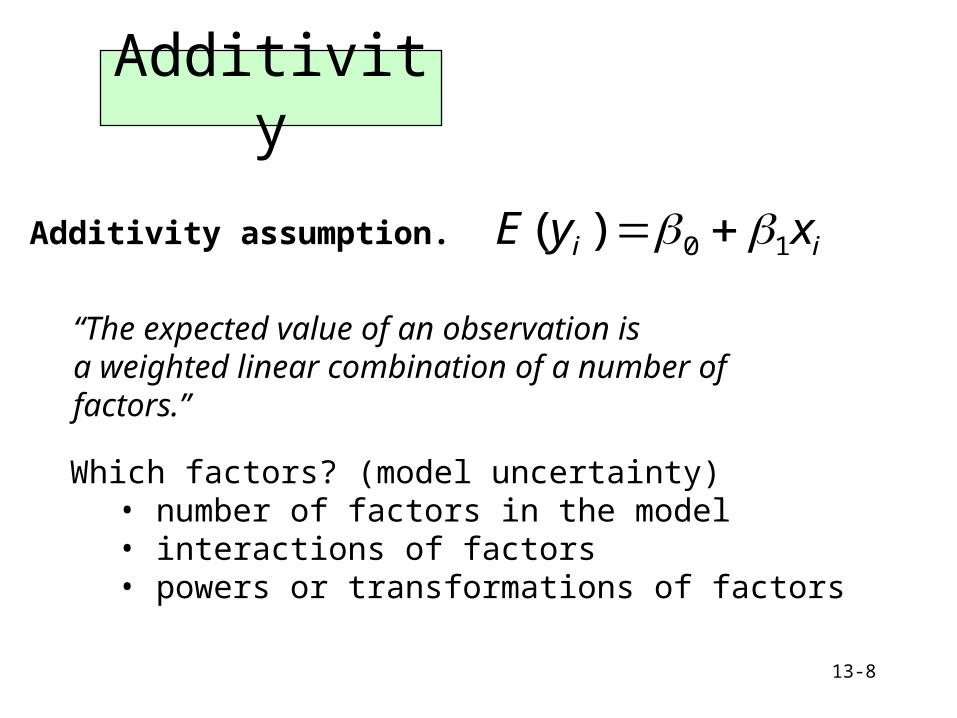
ii xyE 10)(
“The expected value of an observation isa weighted linear combination of a number of factors.”
Which factors? (model uncertainty)• number of factors in the model• interactions of factors• powers or transformations of factors
Additivity assumption.
Additivity

13-9
Homoscedasticity and Normality
iii yEy Observations never equal their expected values.
No systematic biases.
Homoscedasticity assumption.
0iE
Normality assumption.
2 iVar
2,0~ Ni
The unexplained componenthas a common variancefor all values i.
The unexplainedcomponent has a normal distribution.

13-10
Independence
iii yEy Independence assumption.
.for ,0Corr,Corr , jiyy jiji
Responses in one experimental unit are not correlated with, affected by, or related to, responses for other experimental units.
13-11
Correlation Coefficient
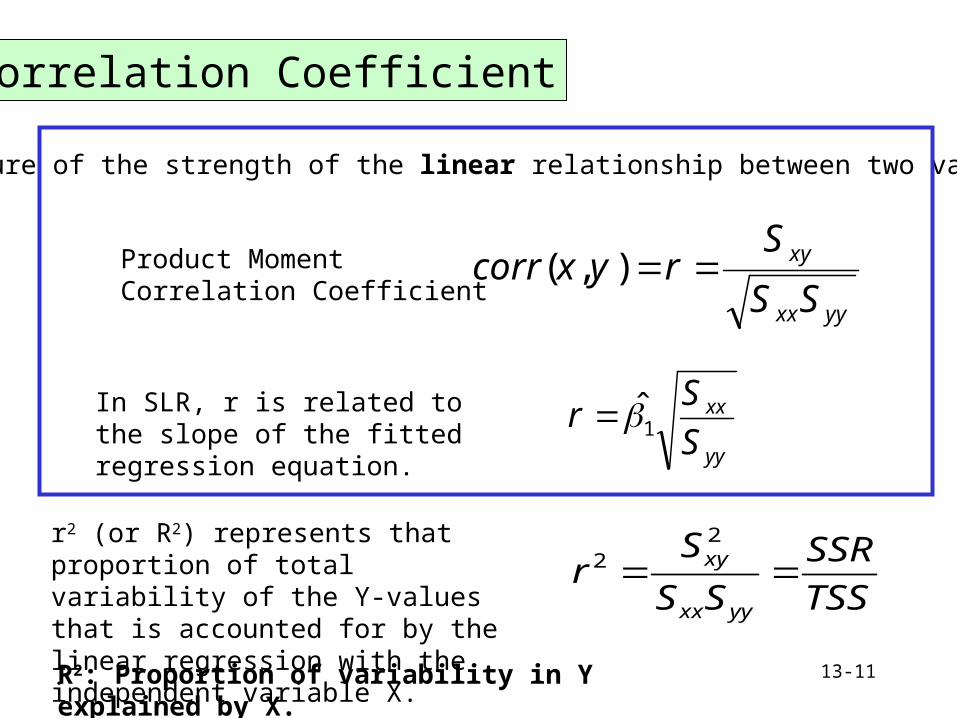
A measure of the strength of the linear relationship between two variables.
yyxx
xy
SS
Sryxcorr ),(Product Moment
Correlation Coefficient
yy
xx
S
Sr 1̂In SLR, r is related to the slope
of the fitted regression equation.
TSS
SSR
SS
Sr
yyxx
xy 2
2r2 (or R2) represents that proportion of total variability of the Y-values that is accounted for by the linear regression with the independent variable X.
R2: Proportion of variability in Y explained by X.
13-12
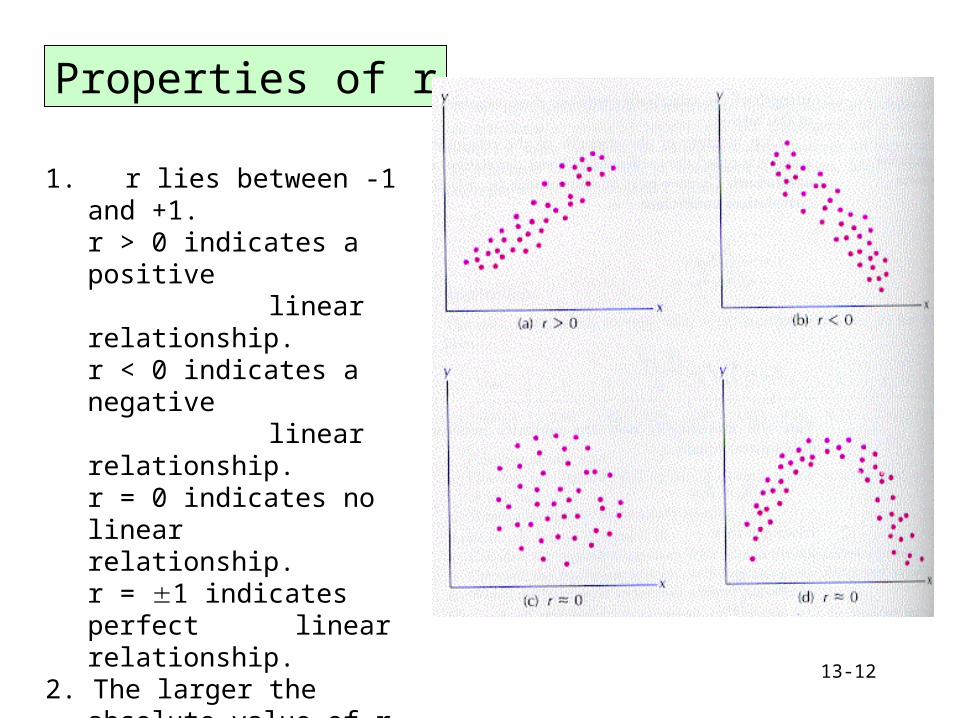
Properties of r
1. r lies between -1 and +1.r > 0 indicates a positive
linear relationship.r < 0 indicates a negative
linear relationship.r = 0 indicates no linear relationship.r = 1 indicates perfect linear relationship.
2. The larger the absolute value of r, the stronger the linear relationship.
3. r2 also lies between 0 and 1.

13-13
Checking Assumptions
How well does the model fit?
Do predicted values seem to be placed in the middle of observed values?
Do residuals satisfy the regression assumptions? (Problems seen in plot of X vs. Y will be reflected in residual plot.)
• Constant variance?• Regularities suggestive of
lack of independence or more complex model?
• Poorly fit observations?x
y

13-14
Model Adequacy
Studentized residuals (ei)
)h-(1MSE i(i)
iie
Allows us to gauge whether the residual is too large. It should have a standard normal distribution, hence it is very unlikely that any studentized residual will be outside the range [-3,3].
MSE(I) is the calculated MSE leaving
observation i out of the computations.hi is the ith diagonal of the projection matrix for
the predictor space (ith hat diagonal element).
13-15
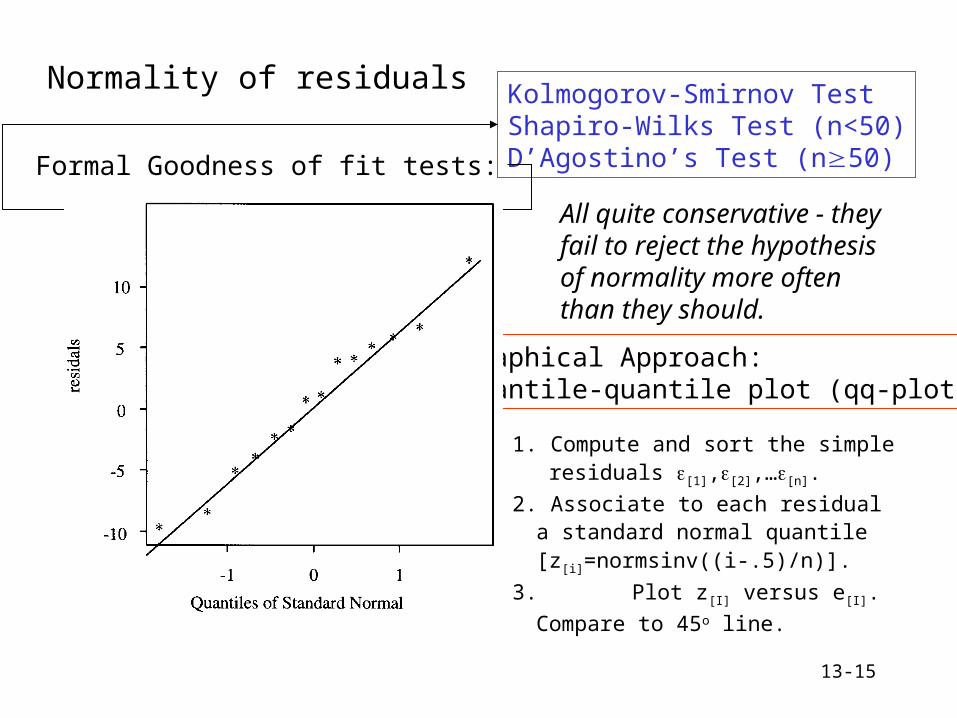
Normality of residuals
Formal Goodness of fit tests:
Kolmogorov-Smirnov TestShapiro-Wilks Test (n<50)D’Agostino’s Test (n50)
All quite conservative - they fail to reject the hypothesis of normality more often than they should.
Graphical Approach:Quantile-quantile plot (qq-plot)
1. Compute and sort the simple residuals [1],[2],…[n].
2. Associate to each residual a standard normal quantile [z[i]=normsinv((i-.5)/n)].
3. Plot z[I] versus e[I]. Compare to 45o
line.

13-16
13-17
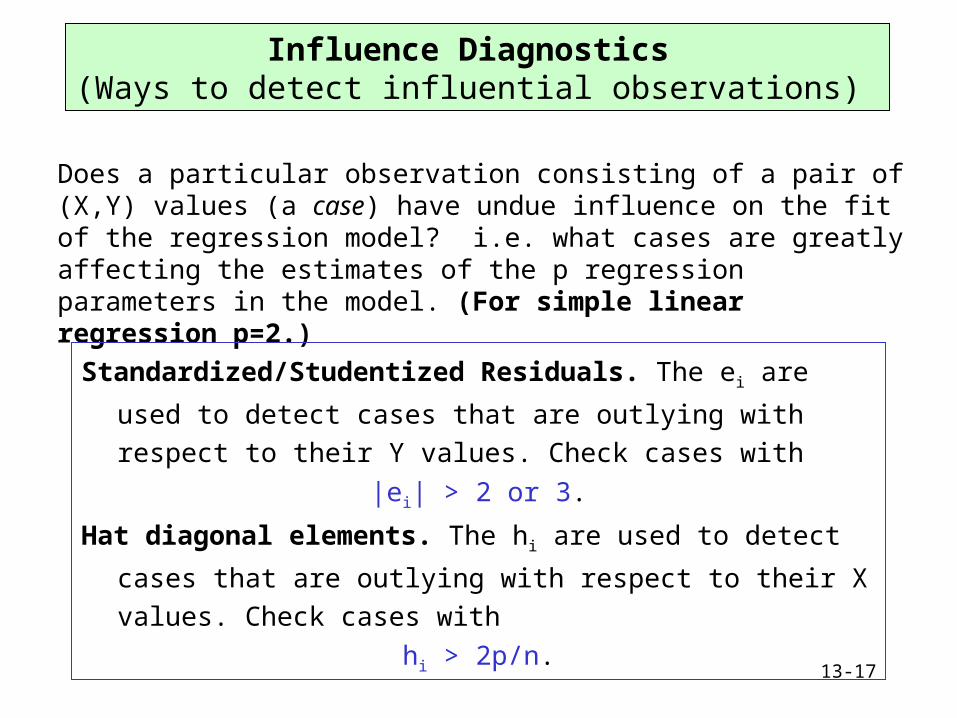
Does a particular observation consisting of a pair of (X,Y) values (a case) have undue influence on the fit of the regression model? i.e. what cases are greatly affecting the estimates of the p regression parameters in the model. (For simple linear regression p=2.)
Standardized/Studentized Residuals. The ei are used to detect
cases that are outlying with respect to their Y values. Check
cases with
|ei| > 2 or 3.
Hat diagonal elements. The hi are used to detect cases that are
outlying with respect to their X values. Check cases with
hi > 2p/n.
Influence Diagnostics (Ways to detect influential observations)
13-18
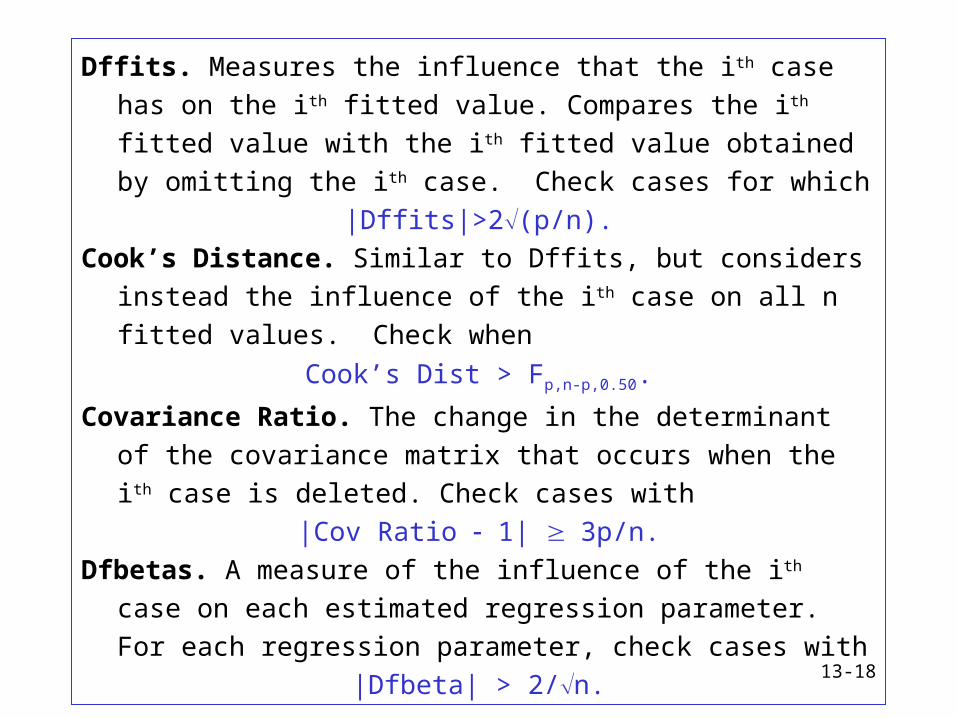
Dffits. Measures the influence that the ith case has on the ith fitted
value. Compares the ith fitted value with the ith fitted value
obtained by omitting the ith case. Check cases for which
|Dffits|>2(p/n).
Cook’s Distance. Similar to Dffits, but considers instead the
influence of the ith case on all n fitted values. Check when
Cook’s Dist > Fp,n-p,0.50.
Covariance Ratio. The change in the determinant of the
covariance matrix that occurs when the ith case is deleted.
Check cases with
|Cov Ratio 1| 3p/n.
Dfbetas. A measure of the influence of the ith case on each
estimated regression parameter. For each regression
parameter, check cases with
|Dfbeta| > 2/n.

13-19Cutoffs: Hat=0.29, CovRatio=0.43, Dffits=0.76, Dfbetas=0.53

13-20
10 9 8 7 6 5 4 3 2 1 0
170
120
70
20
X
Y
S = 6.43260 R-Sq = 98.1 % R-Sq(adj) = 98.0 %
Y = 7.71100 + 15.1982 X
Regression Plot
100-10
2
1
0
-1
-2
Nor
mal
Sco
re
Residual
Normal Probability Plot of the Residuals(response is Y)
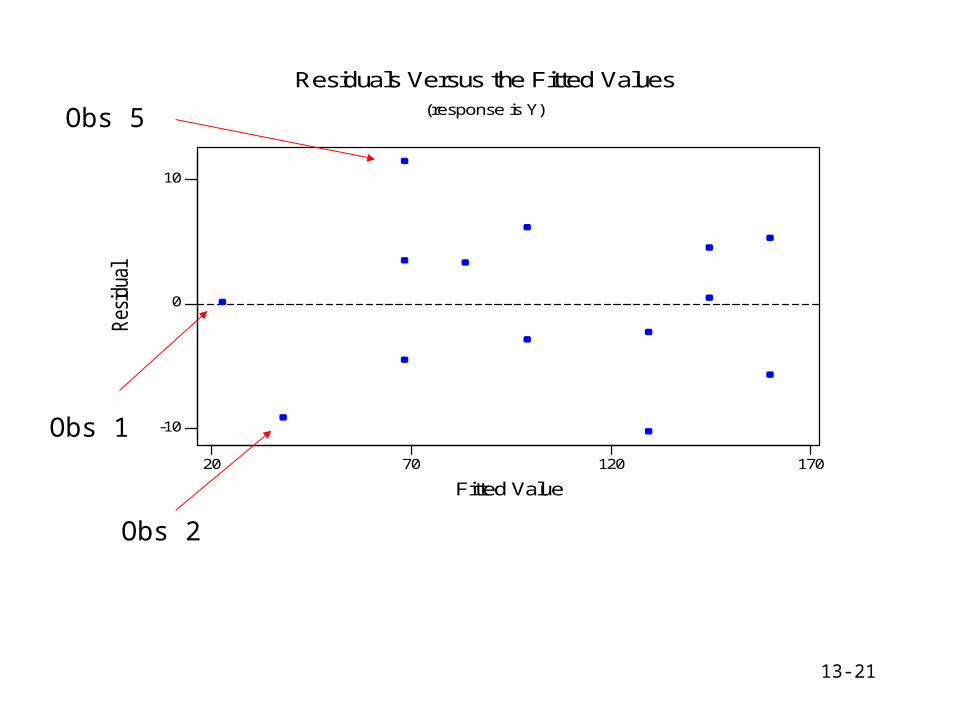
13-21
1701207020
10
0
-10
Fitted Value
Res
idua
l
Residuals Versus the Fitted Values(response is Y)
Obs 2
Obs 5
Obs 1