Embed Size (px)
Citation preview

Zitholele Consulting Reg. No. 2000/000392/07 PO Box 6002 Halfway House 1685, South Africa Building 1, Maxwell Office Park, Magwa Crescent West c/o Allandale Road & Maxwell Drive, Waterfall City, Midrand Tel + (27) 11 207 2060 Fax + (27) 86 674 6121 E-mail : [email protected]
Directors : Dr. R.G.M. Heath, S. Pillay, N. Rajasakran
REPORT ON
KENDAL POWER STATION: 30 YEAR ASH DISPOSAL FACILITY
PROJECT CONCEPTUAL ENGINEERING
REPORT
Report No : 12935-45-Rep-001-Rev5
Submitted to:
Eskom Holdings SOC Ltd P O Box 1091 Johannesburg
2000
DISTRIBUTION:
2 Copies - Eskom Holdings SOC Ltd 1 Copy - Zitholele Consulting (Pty) Ltd – Library
11 August 2016 12935


11 August 2016 i 12935-45-Rep-001-Rev55
ZITHOLELE CONSULTING
EXECUTIVE SUMMARY
Kendal Power Station (PS) was commissioned in the mid 1980’s, with a forty (40) year operating life. The initial dry ash dump site was designed to have a capacity for the operating life with an eight year contingency period. The life of the PS has since been upgraded to sixty (60) years, including a five (5) year contingency, and with some other contributing factors, such as the dry density and the load factor, the initial dry ash dump is now under capacity. The PS is therefore expected to be decommissioned at the end of 2053 with a five year added contingency. This means that area to accommodate the additional ash generated during this operational period will need to be established.
The area to the north of the existing Ash Disposal Facility (ADF) has been extended and optimised in order to receive this ash under the Kendal Continuous ADF Project, which was undertaken by Zitholele Consulting (ZC). The Conceptual Engineering designs indicate that ash may be accommodated at the existing Kendal PS ADF site until October 2031 and thereafter an alternative site will need to be licenced to receive ash up to the end of 2058, hence this project, the Kendal Power Station 30 Year Ash Disposal Facility Project.
At the onset of the project, a detailed site screening and identification process was undertaken to identify the most feasible site areas within a maximum radius of 10 km around Kendal PS.
A four phased approach was used to attain the most feasible sites within the study area. This included:
1. Identification of the study area;
2. Defining the developable areas;
3. Undertaking an environmental, social and technical site screening exercise; and
4. Rating and ranking of the identified site areas according to the identified site
sensitivities (Overlay analysis).
The outcome of the screening process was the selection of site H.
Eskom EIA Centre of Excellence (CoE) has appointed Zitholele Consulting (Pty) Ltd (Zitholele) to start with the environmental impact assessment (EIA) for the new ADF. Zitholele are also responsible for the conceptual engineering design. These engineering designs will be used to underpin and inform the EIA.
The Conceptual Engineering Report discusses the following:
• The design of the new Ash Disposal Facility (ADF) in compliance with Department of Environmental Affairs (DEA’s) Norms and Standards as promulgated on 23 August 2013;
• Design of pollution control dams and stormwater management infrastructure in compliance with GN704;
• Diversion of existing services at the site where the new ADF is to be built.

11 August 2016 ii 12935-45-Rep-001-Rev55
ZITHOLELE CONSULTING
The total air space volume required in Site H was calculated to be 176.2 Mm3. The ADF modelled achieved this volume. The proposed new ADF has a footprint area of 404.7 hectares. The stormwater management system comprises of seven proposed new dams, five (5) Pollution Control Dam’s (PCD) and two (2) clean water dams.
The conceptual design of the new ADF is discussed further in this report.

11 August 2016 iii 12935-45-Rep-001-Rev55
ZITHOLELE CONSULTING
TABLE OF CONTENTS
SECTION PAGE
1 INTRODUCTION ............................................................................................. 1 2 SITE SCREENING .......................................................................................... 1 3 BASIS OF DESIGN ......................................................................................... 2
3.1 Assumptions and limitations .............................................................................2 3.2 Ash characteristics ...........................................................................................2
3.2.1 Grading and Specific gravity...............................................................2 3.2.2 Stability ..............................................................................................3 3.2.3 Geology if Site H ................................................................................3 3.2.4 Permeability .......................................................................................4
3.3 Annual tonnages ..............................................................................................4 3.4 Capacity requirements .....................................................................................4 3.5 Dust suppression .............................................................................................4 3.6 Stormwater Management .................................................................................5
4 ADF CONCEPTUAL DESIGN ......................................................................... 5 4.1 Ash disposal ....................................................................................................5 4.2 Deviation of Transmission and Distribution Power Lines ..................................6 4.3 Road D1390 Diversion .....................................................................................7 4.4 Deviation of the Transnet Pipeline ...................................................................7
4.4.1 Options Considered ...........................................................................7 4.5 Kusile Bulk Water Pipeline ...............................................................................8 4.6 Liner system ....................................................................................................8
4.6.1 Liner System Installation ....................................................................9 4.6.2 Sub-soil drainage system ...................................................................9
4.7 Capping system .............................................................................................10 4.8 E-Dump .........................................................................................................11
5 STORMWATER MANAGEMENT PHILOSOPHY .......................................... 11 5.1 Objectives ......................................................................................................11 5.2 Existing Stormwater Management System .....................................................12
5.2.1 Power Station Terrace......................................................................12 5.2.2 Impacted Areas ................................................................................13 5.2.3 Clean Areas .....................................................................................13 5.2.4 Cross over plant ...............................................................................13 5.2.5 Silt Traps ..........................................................................................14 5.2.6 Dirty Water Dam...............................................................................14 5.2.7 Emergency Dirty Water Dam ............................................................15 5.2.8 Clean Water Diversion Berm and Channel .......................................16 5.2.9 Clean Water Dam .............................................................................16 5.2.10 Coal Stockyard Attenuation Basin ....................................................16 5.2.11 Emergency Dump Stormwater Management ....................................17 5.2.12 Pumps and Pipelines .......................................................................17
5.3 Objectives of Proposed Stormwater Management System.............................17 5.4 MODELING APPROACH AND ASSUMPTIONS ............................................18
5.4.1 Rainfall data .....................................................................................18 5.4.2 Operating flows ................................................................................19 5.4.3 Stormwater runoff calculations .........................................................19
5.5 Stages Modelled ............................................................................................22 5.6 Modelling Results ..........................................................................................23 5.7 Proposed Infrastructure .................................................................................23
5.7.1 Pollution Control Dams.....................................................................24 5.7.2 Clean Water Dams ...........................................................................28 5.7.3 Toe Paddocks ..................................................................................30

11 August 2016 iv 12935-45-Rep-001-Rev55
ZITHOLELE CONSULTING
5.7.4 Storage Reservoirs ..........................................................................30 5.7.5 Conveyance infrastructure (pumps, pipelines and channels) ............30
5.8 Dust Suppression Abstraction Philosophy ......................................................31 5.9 Hydraulic Analysis..........................................................................................31
5.9.1 Sizing of “Clean” stormwater diversion drains and berms .................31 5.9.2 Sizing of “Dirty” stormwater conveyance drains ................................32
5.10 Water Balance ...............................................................................................32 5.11 Operational Requirements .............................................................................33
5.11.1 Monitoring of Quality in Clean Water Dams ......................................33 5.11.2 Maintaining Open Ash Areas for Dust Suppression ..........................33 5.11.3 Maintaining Silt Traps .......................................................................33
5.12 Way Forward for Stormwater Management ....................................................33 6 PHASED APPROACH TO ASH DISPOSAL FACILITY ................................. 33 7 OPERATION AND MAINTENANCE PLAN .................................................... 34
7.1 Code requirements in terms of SABS 0286 ....................................................34 8 CAPITAL COST ESTIMATE .......................................................................... 34 9 CONSTRUCTION AND OPERATION PHASES ............................................ 34 10 WETLAND AVOIDANCE ............................................................................... 34 11 REFERENCES.............................................................................................. 35
LIST OF FIGURES
Figure 1: ADF Layer Heights ..............................................................................................6
Figure 2: Typical Class C Landfill Barrier System ...............................................................8
Figure 3: Proposed Class C Barrier System .......................................................................9
Figure 4: Layout of the sub-soil drainage system .............................................................10
Figure 5: Section through rehabilitated ADF .....................................................................10
Figure 6: Current Stormwater System ..............................................................................12
Figure 7: Kendal PS Concrete lined Silt Trap with adjustable overflow weir .....................14
Figure 8: Kendal PS Dirty Water Dam with spillway in background ..................................15
Figure 9: Kendal PS Emergency Dirty Water Dam overflow channel ................................15
Figure 10: Dirty Water Dam Levels for Simulation Period .................................................24
Figure 11: Emergency Dirty Water Dam Levels for Simulation Period ..............................25
Figure 12: Proposed Dam 1 Levels for Simulation Period ................................................25
Figure 13: Proposed Dam 2 Levels for Simulation Period ................................................26
Figure 14: Proposed Dam 4 Levels for Simulation Period ................................................26
Figure 15: Proposed Dam 6 Levels for Simulation Period ................................................27
Figure 16: Proposed Dam 7 Levels for Simulation Period ................................................27
Figure 17: Existing Clean Water Dam Levels for Simulation Period .................................28
Figure 18: Proposed Dam 3 Levels for Simulation Period ................................................29

11 August 2016 v 12935-45-Rep-001-Rev55
ZITHOLELE CONSULTING
Figure 19: Proposed Dam 5 Levels for Simulation Period ................................................29
Figure 20: Positioning of Temporary Toe Paddocks .........................................................30
Figure 21: Clean Water Drain ...........................................................................................32
Figure 22: Dirty Water Drain .............................................................................................32
LIST OF TABLES
Table 1: Ash grading ..........................................................................................................3
Table 2: Power Station Terrace - Catchment areas ..........................................................13
Table 3: Recorded rainfall statistics ..................................................................................18
Table 4: Operating flows used in time-step model ............................................................19
Table 5: Catchment areas ................................................................................................19
Table 6: C values calculated according to catchment characteristics ...............................20
Table 7: C values obtained from adjustment factors for each catchment area ..................22
Table 8: Stages modelled ................................................................................................23
Table 9: Modelling Results ...............................................................................................23
Table 10: Dam Capacities ................................................................................................24
LIST OF APPENDICES
Appendix A: Geotechnical Report
Appendix B: Waste Classification Report (Report no: JW030/13/D121-Rev3)
Appendix C: Conceptual Engineering Drawings
Appendix D: Water Balance Diagram
Appendix E: Site selction/screening report
Appendix F: Tech Memo Selection for barrier System
Appendix G: Construction Quality Assurance (CQA) Plan
Appendix H: High Level Capital Cost Breakdown
Appendix J: Construction and Operation Phases

11 August 2016 vi 12935-45-Rep-001-Rev55
ZITHOLELE CONSULTING
Appendix K: Technical Memo for Design Considerations to avoid Wetlands
Appendix L: Transnet Pipeline Technical Memo
GLOSSARY OF TERMS
ADF Ash Disposal Facility
ASTM American Society for Testing and Materials
CDS Consistent Data Set
CoE Centre of Excellence
CQA Construction Quality Assurance
DWS Department of Water and Sanitation
E-Dump Emergency Dump
EIA Environmental Impact Assessment
GN 704 Government Notice 704
NWA National Water Act
PCD Pollution Control Dam
PS Power Station
SANRAL South African National Roads Agency Limited
VAT Value-Added Tax
WUL Water Use Licence
WULA Water Use Licence Application
ZC Zitholele Consulting

11 August 2016 1 12935-45-Rep-001-Rev55
ZITHOLELE CONSULTING
1 INTRODUCTION
Kendal PS was commissioned in the mid 1980’s, with a 40 year operating life. The initial dry ash dump site was designed to have a capacity for the operating life with an eight (8) year contingency period. The life of the PS has since been upgraded to sixty (60) years plus five (5) year contingency and with some other contributing factors, such as the dry density and the load factor, the initial dry ash dump is now under capacity. The PS is therefore expected to be decommissioned at the end of 2053 with a five year added contingency. This means that the area to accommodate the additional ash generated during this operational period will need to be established.
The area to the north of the existing Ash Disposal Facility (ADF) has been extended and optimised in order to receive this ash under the Kendal Continuous ADF Project, which was undertaken by Zitholele Consulting. The Conceptual Engineering Designs indicate that ash may be accommodated at the existing Kendal PS ADF site until October 2031 and thereafter an alternative site will need to be licenced to receive ash up to the end of 2058, hence this project, the Kendal PS 30 Year ADF Project.
2 SITE SCREENING
At the onset of the project, a detailed site screening and identification process was undertaken to identify the most feasible site areas within a maximum radius of 10 km around Kendal PS.
A four phased approach was used to attain the most feasible sites within the study area. This included:
1. Identification of the study area;
2. Defining the developable areas;
3. Undertaking an environmental, social and technical site screening exercise; and
4. Rating and ranking of the identified site areas according to the identified site
sensitivities (Overlay analysis).
Based on the combined ratings for the environmental, social and technical elements, and further discussion with the specialist and Eskom technical teams, the following site areas were identified (in order of feasibility) as the most feasible site alternatives to be investigated further during the impact assessment phase: Site C, F, D and B. Refer to Appendix E for the screening report.
Following the Scoping Phase, more detailed specialist investigations were undertaken. Earlier on it was established that Site D had previous undermining, which rendered the site unfeasible from a geotechnical point of view. The site D was then eliminated.
Areas B, C and F were taken forward for detailed (specialist) site assessment. Upon undertaking field studies and further focussed public participation, more detailed mining information was revealed.

11 August 2016 2 12935-45-Rep-001-Rev55
ZITHOLELE CONSULTING
Upon the realisation that all these sites were earmarked for mining activities, it was decided to re-introduce Site H as a site alternative. Site H was the next best scoring site alternative in the initial site identification process. Site H is predominantly owned by Eskom. Kusile Mining holds prospecting rights on a large area, which includes Site H. Eskom have been in discussion with Kusile Mining and have obtained written confirmation from them that they would not require this area for mining.
A surface and groundwater interaction study will be undertaken on the pan situated within the pan footprint. This study will commence as soon as a Water Use Licence (WUL) is obtained to start the drilling programme.
Eskom EIA Centre of Excellence (CoE) has appointed Zitholele Consulting (Pty) Ltd (Zitholele) to start with the Environmental Impact Assessment (EIA) for the new ADF. Zitholele are also responsible for the Conceptual Engineering Design. These engineering designs will be used to underpin and inform the EIA.
3 BASIS OF DESIGN
3.1 Assumptions and limitations
The following assumptions were made in developing the conceptual designs presented herewith:
• The requirements for the clean and dirty water systems stipulated in Regulation 704 and Regulation 1560 of the National Water Act, 1998 will be adhered to;
• The Pollution Control Dam (PCD) will be a Stormwater Dam, classified in terms of the National Water Act, 1998;
• The life of the PS was extended up to the year 2058, which includes a five year contingency;
• Construction of the new ADF will start in 2025;
• Ashing on the new lined facility will start in November 2031;
• The Volume of ash per annum stays constant through the whole life of PS;
• All volumes, remaining life and timelines are subject to the dump models that are produced.
3.2 Ash characteristics
3.2.1 Grading and Specific gravity
The fly ash varies from silty sand to silty clay using a triangular soil classification chart (US corps of Engineers). The grading curve exhibits a uniform particle size distribution. According to ASTM D422-63:
• Clay sized particle is larger than 1 micrometre and smaller than 5 micrometre. • Silt sized particle is larger than 5 micrometre and smaller than 75 micrometre.

11 August 2016 3 12935-45-Rep-001-Rev55
ZITHOLELE CONSULTING
• Sand sized particle is larger than 75 micrometre and 425 micrometre.
Thus using the above mentioned envelopes the grading of ash are as follows:
Table 1: Ash grading Particle size Weathered fly ash Median Fly ash
Clay-sized (%) 5-77 16 14 Silt sized (%) 23-83 60 59 Sand sized (%) 0-64 30 27 D50 (µm) 3-120 23 27.5 Specific Gravity (Gs) 2-2.2 2.2 Data used from : J.S. Mahlaba et al. Fuel 90 (2011)
3.2.2 Stability
Preliminary slope stability analyses have been briefly considered, based on prior and equivalent studies undertaken for the Continuous Ashing Site, which is intended to serve as the interim extension for the current ADF at Kendal PS.
Owing to the generally non-cohesive nature of soils dominating much of Site H, it is anticipated that the likelihood of slope instability attributed to deep seated failures is very limited. With the exception of the specific deep alluvial areas identified during the study, along the margins of the existing alluvial floodplains, slope stability considerations will largely be attributed to operational issues surrounding the ash quality and strength parameters, with particular emphasis on the introduction of the composite liner which will tend to act as the weakest potential slip surface. Refer to Appendix A for the Geotechnical Report, Slope Stability.
3.2.3 Geology if Site H
Fieldwork carried out over Site H during the second fieldwork programme revealed that most of the area is underlain by pedogenic ferricrete of either nodular or hardpan ferricrete. Various sedimentary units of the Vryheid Formation, Karoo Supergroup, namely sandstone and shale were found to occur at some of the test positions located on Site H. Intrusive rocks of the Rooiberg Suite were encountered in two trial pits on the southern portion of the site.
The natural geology and ground profile of the (undisturbed) site comprises sandstones and mudstones of the Vryheid Formation, overlain by residual soils, which in turn are overlain by transported soils (of colluvial origin). In most areas, soils include some degree of ferruginisation with the presence of nodular ferricrete and hardpan ferricrete. This is evidence of historical groundwater.
Based on the available inferred traces, the approximate surface trace of the Ogies Dyke crosses west-east through the north-western corner of Site H. Refer to Appendix A for the Geotechnical Report

11 August 2016 4 12935-45-Rep-001-Rev55
ZITHOLELE CONSULTING
3.2.4 Permeability The permeability is largely dependent on the density of the ash on the ADF. A value of 11.5 m/year for medium dense ash was assumed. This is the mean of 3 m/y (dense ash) to 20 m/year (loose ash) (Brackley et al, 1987) (6.34*10-7 m/sec). This is required for calculating seepage pool to the leachate collection system.
3.3 Annual tonnages The indicated annual tonnage of ash placed on the ADF is 5500 kt/ annum. This information is from a previous report (Report nr: 11613601-10981-2) in which Golder Associates Africa did the development of an industry waste management plan for Eskom where all the waste type and quantities of all the power stations were considered.
The density of the ash is 850kg/m3 and thus the annual airspace required for the continuous ADF is approximately 6.5 Mm3/ annum. Based on this, the remaining life for the continuous ADF is determined.
Refer to Eskom document number: 240-71273834 for coal quality used and Eskom Consistent Data Set (CDS) – 36-623 for remaining life and coal burn plan utilised for coal consumption values.
3.4 Capacity requirements The existing ash disposal facility (ADF) was commissioned in the 1980’s for a forty (40) year life span and an eight (8) year contingency period. The operating life of the ADF has since then been increased to sixty (60) years and with a number of other design and material changes the existing dump geometry is grossly under capacity.
The total additional capacity required for the ADF is 292.7 Mm3 from January 2015 until December 2058. With the current boundary and operating machinery limitations, this capacity will not be reached on the current ashing site.
The remaining area between the western and northern streams does not have sufficient capacity to allow a new facility to be established. If the northern stream is diverted the continuous ash dump will only provide 116.5 Mm3 capacity, therefore 176.2 Mm3 of ash will need to be deposited on the new “30”year ADF site.
3.5 Dust suppression The current approach is to use water from the three (3) dam system (Dirty Water Dam, Emergency Dirty Water Dam and Clean Water Dam) that is located on the eastern side of the site and then via irrigation, spray the exposed ash areas to minimise the mobilisation of the ash. Key operational staff members at Kendal PS, are of the opinion that the current system is not fulfilling its intended purpose and that the system will have to be modified so that the ash mobilisation is minimal.
There are a number of techniques and products that can be used such as:
• Using a dust suppression chemical,

11 August 2016 5 12935-45-Rep-001-Rev55
ZITHOLELE CONSULTING
• Using a self-propelled spraying system; using pressure to propel itself forward, • Upgrading the current system with better controls in place, • 50mm subsoil cover.
The above mentioned options will have to be investigated further in the following phase of the design as there might be a lot of other innovative approaches that can be followed.
3.6 Stormwater Management The management philosophy for the routing and capturing of stormwater is summarised as follows: • The separation of the runoff draining south-easterly towards the extended ash dam (i.e.
from the area upslope of the ash dump) and runoff generated from within the footprint of the extended ash dump;
• The diversion of “clean” surface runoff generated from the upslope contributing catchments away from the extended ash dump, thereby isolating the ash dam as “dirty areas” in accordance with the requirements GN 704 in terms of the National Water Act, 1998;
• Containment of all “clean” surface runoff generated from the rehabilitated areas of the ash dump to clean water holding dams, with a “test and release” philosophy if the water meets the release standards;
• Containment of all “dirty” surface runoff generated from within the “dirty” catchment, conveyance and discharge into a dedicated pollution control dam sized in accordance with the requirements GN 704 in terms of the National Water Act, 1998.
The current and proposed stormwater management philosophy is discussed in depth in Section 5 of this report.
4 ADF CONCEPTUAL DESIGN
4.1 Ash disposal
The following forms part of the Conceptual Engineering Design of the ADF:
• Two fixed conveyors will be constructed from the existing Emergency Dump (E-dump) at the PS and will cross under Road 545 to the western side of the road where a new E-dump will be constructed.
• A sump will be placed at the conveyor-road crossing with a pipe leading to the new proposed E-Dump Dirty Water Dam;
• Two fixed conveyors will extend from the new E-Dump towards the ADF on to each extendable and then shift-able conveyors and stackers will be placed in order to dispose ash on the footprint of the new ADF starting from the eastern side of the site and progressing to the western side of the site;
• A starter platform will be built on the eastern side of the site first and will be constructed with bulldozers. The rest of the ash dump will be constructed with the conveyor-stacker system;

11 August 2016 6 12935-45-Rep-001-Rev55
ZITHOLELE CONSULTING
• A 1:15 sloped ramp will be constructed on the eastern side of the new ADF and will reach a maximum height of 75 metres which is the maximum height of the ADF;
• The new ADF should be in operation for 27 years; • The new ADF is tapered on the south western corner due to parcels of land that have
mining rights attached to them, situated on the western side of the site, and the need to avoid utilising these parcels of land;
• The proposed new ADF will have a ring access road constructed around its perimeter together with stormwater canals intercepting impacted runoff and directing to a PCD;
• A distance of 362 metres has been achieved between the existing silos, on the north eastern side of the proposed new ADF, and the perimeter of the proposed ADF;
• There will be three access points to the proposed new ADF, with the main access point being at the south eastern corner of the new ADF;
• A proposed Contractor’s camp is situated at the south eastern corner of the site; • A proposed topsoil stockpile area will be situated south of the new ADF.
The figure below, Figure 1, show the ADF layer heights:
Figure 1: ADF Layer Heights
4.2 Deviation of Transmission and Distribution Power Lines
Several power lines require diversion to accommodate the footprint area of the new ADF on the site:
• 11 kV Distribution Power Line: 1 No. Off; • 22 kV Distribution Power Line: 1 No. Off; • 88 kV Distribution Power Line: 2 No. Off; • 132 kV Distribution Power Line: 2 No. Off; • 400 kV Transmission Power Line: 2 No. Off.
The Eskom power line servitude and clearance information was obtained from the Eskom document 34-600 DGL Rev 0.
11 August 2016 7 12935-45-Rep-001-Rev55
ZITHOLELE CONSULTING
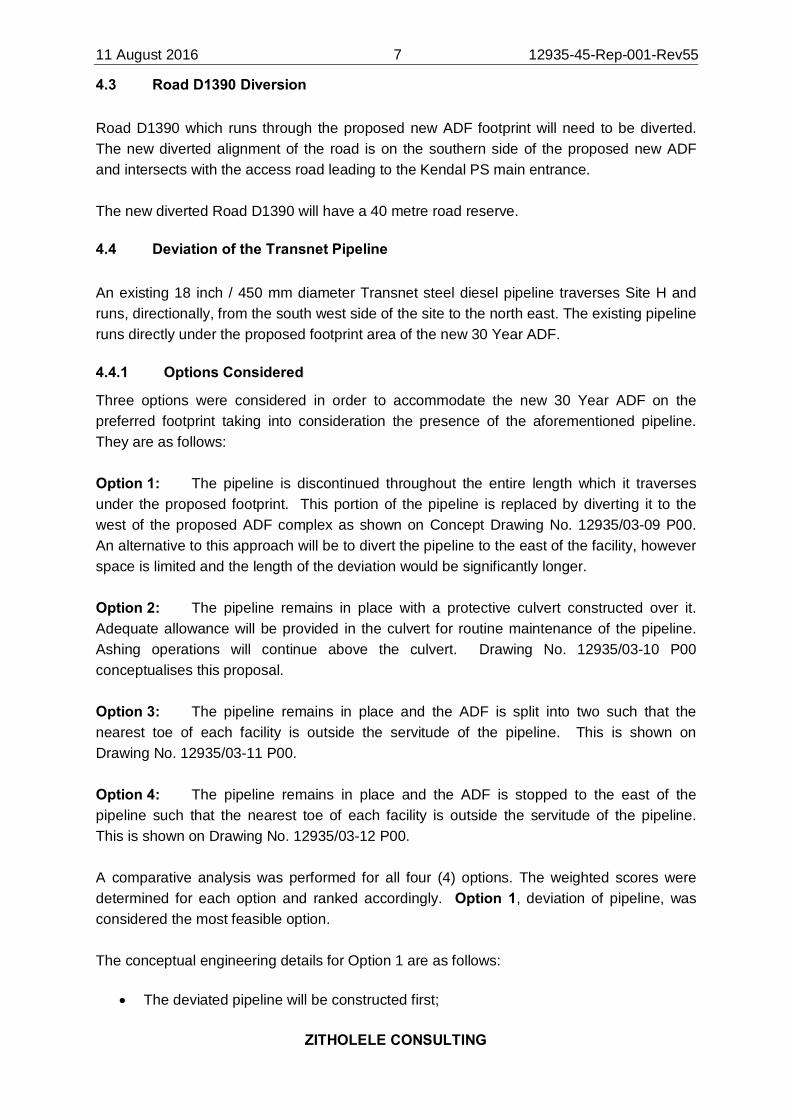
4.3 Road D1390 Diversion
Road D1390 which runs through the proposed new ADF footprint will need to be diverted. The new diverted alignment of the road is on the southern side of the proposed new ADF and intersects with the access road leading to the Kendal PS main entrance.
The new diverted Road D1390 will have a 40 metre road reserve.
4.4 Deviation of the Transnet Pipeline
An existing 18 inch / 450 mm diameter Transnet steel diesel pipeline traverses Site H and runs, directionally, from the south west side of the site to the north east. The existing pipeline runs directly under the proposed footprint area of the new 30 Year ADF.
4.4.1 Options Considered
Three options were considered in order to accommodate the new 30 Year ADF on the preferred footprint taking into consideration the presence of the aforementioned pipeline. They are as follows:
Option 1: The pipeline is discontinued throughout the entire length which it traverses under the proposed footprint. This portion of the pipeline is replaced by diverting it to the west of the proposed ADF complex as shown on Concept Drawing No. 12935/03-09 P00. An alternative to this approach will be to divert the pipeline to the east of the facility, however space is limited and the length of the deviation would be significantly longer.
Option 2: The pipeline remains in place with a protective culvert constructed over it. Adequate allowance will be provided in the culvert for routine maintenance of the pipeline. Ashing operations will continue above the culvert. Drawing No. 12935/03-10 P00 conceptualises this proposal.
Option 3: The pipeline remains in place and the ADF is split into two such that the nearest toe of each facility is outside the servitude of the pipeline. This is shown on Drawing No. 12935/03-11 P00.
Option 4: The pipeline remains in place and the ADF is stopped to the east of the pipeline such that the nearest toe of each facility is outside the servitude of the pipeline. This is shown on Drawing No. 12935/03-12 P00.
A comparative analysis was performed for all four (4) options. The weighted scores were determined for each option and ranked accordingly. Option 1, deviation of pipeline, was considered the most feasible option.
The conceptual engineering details for Option 1 are as follows:
• The deviated pipeline will be constructed first;

11 August 2016 8 12935-45-Rep-001-Rev55
ZITHOLELE CONSULTING
• The deviated pipeline will run in a northerly direction around the western side of the new proposed ADF;
• Stop valves will placed on either side of the existing piece of pipeline to facilitate a shorter duration for tapping in;
• The new deviated pipeline will have an unobstructed servitude of 9 metres; • The new deviated pipeline will have long radius bends to facilitate pigging; • The soil cover to the pipeline will be a minimum of 2 metres.
A technical memorandum compiled for the deviation of the Transnet pipelines is attached in Appendix L.
4.5 Kusile Bulk Water Pipeline
The Kusile Bulk Water Pipeline, which runs from Kendal PS to Kusile PS traverses the southern boundary of the site. This pipeline will not be required to be deviated.
4.6 Liner system A waste classification was carried out on the ash and it was classified as a Type 3 waste – low hazard waste (Report no: JW030/13/D121-Rev3) which requires disposal on a landfill with a Class C barrier system. A Class C barrier system entails the use of clay or a feasible alternative. Clay is not available on the footprint of the ADF. Tests were done on the in-situ soils to be considered as an alternative to the clay component of the liner. Falling head permeability tests proved that reworking the in-situ material could result in a permeability of 10-5 cm/s. It is recommended that the in-situ soils, in conjunction with a 2 mm geo-membrane be used in the barrier system.
Figure 2: Typical Class C Landfill Barrier System

11 August 2016 9 12935-45-Rep-001-Rev55
ZITHOLELE CONSULTING
Figure 3: Proposed Class C Barrier System
4.6.1 Liner System Installation The liner construction will be constructed in stages, as per the ash disposal requirements. At any given point there should be at least one to two years of available footprint of constructed liner. The liner system must be constructed with best practice in relation to manufacturing, transport, storage and installation. The liner system will be installed according to the manufacturer’s specifications where applicable.
4.6.2 Sub-soil drainage system The subsoil drainage system will be installed to prevent hydrostatic pressures on the liner system and to convey clean ground water away from the ash disposal site. The subsoil drain consists of a 110mm or 160mm perforated pipe enclosed in 19mm washed stone. The drains are at a 20m horizontal spacing.

11 August 2016 10 12935-45-Rep-001-Rev55
ZITHOLELE CONSULTING
Figure 4: Layout of the sub-soil drainage system
4.7 Capping system
It is proposed that the current system of topsoiling and grassing be continued on the 30 year new ADF site.
Figure 5: Section through rehabilitated ADF
Ash
Soil saver
300mm Topsoil
Grass/hydroseed
Soil saver
Proposed Dam 1 (PCD)
Proposed Dam 3 (Clean) Proposed Dam 4
(PCD)
Proposed Dam 7 (PCD)
Proposed Dam 6 (PCD)
Proposed Dam 5 (Clean)

11 August 2016 11 12935-45-Rep-001-Rev55
ZITHOLELE CONSULTING
4.8 E-Dump
A new Emergency Dump, E-dump, will be constructed to the south of the ADF. The facility will operate as an emergency storage of ash. Ash will be transported to the new E-dump on the conveyor system, which will run from the existing E-dump near the PS site to the new E-dump.
The storage capacity of the new E-dump will accommodate an ash volume of maximum continuous rating of the station for 7 days ash production. The total footprint area of the surface bed is 29,024 m² and will accommodate a total volume of 190,000 m3. The area will be bunded within a 1 metre high reinforce concrete wall. The facility will comprise of an impoundment facility and a silt trap. Water from the impoundment facility will be used in that area for washwater and dust suppression.
The surface bed will be cast in 25 m2 panels, with expansion joints in between the panels. The expansion joints will comprise of expandable polypropylene filler and will be sealed off at the surface with a two component polyurethane sealant. This will render the joint water tight. The surface beds will be cast with a floor slope of 1 in 200 to facilitate the drainage of stormwater off the beds.
It is proposed to use fibre reinforced concrete due to the ease of construction. The strength and durability of the concrete and its functionality will not be compromised by this choice of material.
5 STORMWATER MANAGEMENT PHILOSOPHY
The PCDs as indicated above will need to be designed in compliance with Government Notice 704. More specifically, Clause 6 (d) of the regulation indicates that:
“Design, construct, maintain and operate any dirty water system at the mine or activity so that it is not likely to spill into any clean water system more than once in 50 years.”
In order to achieve the above, a continuous model was set-up to simulate the duration as mentioned in the regulation in order to determine the performance of the proposed stormwater impoundment infrastructure under normal operating conditions. Following the finalisation of the model, the water balance may be derived for the new ADF once all proposed stormwater infrastructure has been determined.
5.1 Objectives
In order to understand the stormwater management system and the relevance of each of the proposed impoundment and conveyance structures, an integrated water balance needs to be consulted.

11 August 2016 12 12935-45-Rep-001-Rev55
ZITHOLELE CONSULTING
This also informs the design of any facility that needs to comply with Government Notice 704. Kendal PS does not have an integrated water balance therefore a conceptual water balance is being proposed for the stormwater management system.
5.2 Existing Stormwater Management System
Currently, the clean water and impacted water are separated within the PS terrace and handled separately. The clean water reports to the Clean Water Dam and the impacted water reports to the Dirty Water Dam via a water Crossover Plant and Silt Trap. Surface runoff within the catchment draining naturally to the above Dirty Water Dams are diverted around it to the Clean Water Dam by means of a berm, located to the north of the dams, and conveyed via a concrete channel located to the south of the dams.
The Farm Dam, located to the west of the existing ADF, does not form part of Kendal Power Station’s water balance and is therefore not included in this report.
The current stormwater management is summarised in Figure 6 below and is described in detail thereafter.
Figure 6: Current Stormwater System
Power Station Terrace
The PS terrace is predominantly considered to be clean with most of the impacted water coming from the process drains. Table 2 below gives a list of the clean and impacted (dirty) catchment areas on the PS terrace.

11 August 2016 13 12935-45-Rep-001-Rev55
ZITHOLELE CONSULTING
Table 2: Power Station Terrace - Catchment areas Catchment Area (m²) Drains To
Dirty Area 274,787 Dirty Water Dam Station Transformer Yard - Clean 142,469 Clean Water Dam Generator Roof – Clean 30,929 Clean Water Dam SW Corner - Clean 176,341 Clean Water Dam North Clean Area 290,390 Veld discharge (Clean) Total Power Station Terrace area = 914,916
5.2.2 Impacted Areas
The impacted area within the PS terrace is located centrally, in the vicinity of the Boiler and Turbine houses. An underground dirty water pipe system, located centrally within the plant, conveys dirty wash water and some runoff to the cross-over plant, where the water is treated, the sludge is removed and then the treated water is conveyed to the dirty water dam.
The Coal Stockyard is also classified as an impacted area. Concrete channels constructed along the boundary of the coal stock yard discharge storm water into an existing settling and attenuation basin which is located at the coal stockyard. At the settling basin the solids settle out of suspension and the liquid are then conveyed via a pipe to the Dirty Water Dam.
Stormwater runoff from the emergency dump is contained locally within a pollution control facility.
5.2.3 Clean Areas
Clean surface water runoff from the PS terrace is collected in an underground clean water pipe system, located centrally within the plant, conveying clean storm water runoff to the cross-over plant then to the Clean Water Dam. Clean storm water runoff that is not collected in the central underground clean water pipe system is collected in concrete channels constructed along the boundary of the plant. On the southern side of the plant the water collected in the channels is discharged and is collected in the Clean Water Dam and on the northern side of the plant the clean water is discharged into the surrounding veld area.
Clean Stormwater runoff from the surrounding veld area on the southern side of the plant is caught by an existing earth berm which directs the storm water runoff to a canal that conveys the water to the clean water dam. This berm is not currently effective as it has been eroded over time and also removed in areas for access.
5.2.4 Cross over plant
No information was available for the design capacity of this facility as well as the process flow. All information contained within the attached Water balance is assumed, based on the

11 August 2016 14 12935-45-Rep-001-Rev55
ZITHOLELE CONSULTING
diameter of the clarifiers. The percentage of sludge produced was assumed as approximately 2%.
5.2.5 Silt Traps
Before discharging into the Dirty Water Dam, silt is first settled out at the silt trap which is located in close proximity to the dam. The silt trap is divided into two compartments to facilitate maintenance. Each compartment is concrete lined. An adjustable weir controls the outflow from each compartment to the Dirty Water Dam, which is assumed to be designed to attenuate the outflow to settle out the solids.
Figure 7: Kendal PS Concrete lined Silt Trap with adjustable overflow weir
No information was provided for this facility. Assumptions on functionality were based on its footprint area.
5.2.6 Dirty Water Dam
The Dirty Water Dam is a licenced facility (DWS Licence No: 04/B20E/BCEG/1048) with an annual waste throughput of 1,095 Mℓ. The approved size of the facility is not stated in the licence. According to the latest (June 2013) hydrographic survey conducted by Kendal PS, the capacity of this dam was found to be 236,553 m3.
Impacted water is conveyed to the facility at an average rate of 35 ℓ/s via a 1500 mm diameter concrete pipeline, as reported by the power station. The current licence for this dirty water dam does not require it to be lined. In-situ weathered granite and felsite underlays the site and acts as a natural barrier.
The Dirty Water Dam has an earth wall with a concrete weir spillway which overflows into the Emergency Dirty Water Dam. A filter drain is located within the dam wall. Upstream and downstream faces of the dam wall, constructed at slopes of 1:2.5 (v:h), are lined with rip-rap for erosion protection against wave action. The base of the dam wall is keyed into the in-situ stiff residual material to prevent against sliding.

11 August 2016 15 12935-45-Rep-001-Rev55
ZITHOLELE CONSULTING
Figure 8: Kendal PS Dirty Water Dam with spillway in background
5.2.7 Emergency Dirty Water Dam
The Emergency Dirty Water Dam is a licenced facility to receive a maximum of 55 Mℓ of impacted water (duration not specified in the WUL) as an overflow from the Dirty Water Dam when the Dirty Water Dam is full. The approved size of the facility is not stated in the licence. According to the latest (June 2013) hydrographic survey conducted by Kendal PS, the capacity of this dam was found to be 89,335 m3.
Design and construction of the dam wall is as per the Dirty Water Dam. However, the overflow spillway is a trapezoidal channel (approximately 20 metres wide, lined with reno-mattresses). The spillway discharges to the Clean Water Dam.
Figure 9: Kendal PS Emergency Dirty Water Dam overflow channel

11 August 2016 16 12935-45-Rep-001-Rev55
ZITHOLELE CONSULTING
5.2.8 Clean Water Diversion Berm and Channel
An earth berm was designed to divert clean stormwater run-off around the dirty water dams and discharge it to a concrete lined channel which discharges to the Clean Water Dam. However, only remnants of this berm remain due to erosion and removal to open vehicular accesses.
The concrete lined stream diversion trapezoidal channel, approximately 23 metres wide at the top, discharges to the Clean Water Dam. In order to prevent erosion at the discharge point to the Clean Water Dam, a still basin was constructed at the discharged end. This drains to the dam via a reno-mattress lined chute.
5.2.9 Clean Water Dam
The Clean Water Dam is a licenced facility and is contained within the same licence as referenced previously. Design and construction of the Clean Water Dam is the same as the Dirty Water and Emergency Dirty Water Dams. It is licenced to have a storage capacity of 90 Mℓ. According to the latest (June 2013) hydrographic survey conducted by Kendal PS, the capacity of this dam was found to be 86,790 m3. A concrete overflow spillway discharges to the natural watercourse.
5.2.10 Coal Stockyard Attenuation Basin
The coal stockyard is located to the south east of the PS terrace and covers an area of approximately 73 hectares. This area comprises of the following infrastructure:
• Coal stockpile, • Concrete lined channels intercepting stormwater run-off and discharging it to the settling
basin, • Settling and attenuation basin with a combined capacity of 10 Mℓ.
The surface runoff is conveyed via concrete lined open drains which are located to the west of the coal stockyard. Two sets of drains, one running in a southern direction and the other northerly, drain to an attenuation dam located centrally to the western boundary of the site.
Upstream of the attenuation basin is a settling basin. The settling basin is concrete lined and facilitates the settlement of solids mobilised from the coal during the storm event. The combined structure is not sized in compliance with the requirements of GN 704 and excess flow reports to the Dirty Water Dam via a 1.2 metre diameter concrete pipe.
Mixing of water in the settling basin and attenuation basin is allowed in the current design. This will need to be modified. Excess flow exits the facility via the settling basin. It is proposed that the excess flow exits the facility via the attenuation basin.

11 August 2016 17 12935-45-Rep-001-Rev55
ZITHOLELE CONSULTING
5.2.11 Emergency Dump Stormwater Management
The existing E- Dump is located between the PS and the existing ash dump, on the PS terrace. The facility operates as an emergency storage of ash if the spreaders or stacker at the continuous ash dump is inoperable. The existing area of the E-Dump comprises of a reinforced concrete surface bed with an area of approximately 5,500m². The existing E-Dump includes a silt-trap and stormwater impoundment facility, approximately 1,000m³ in capacity. This impoundment facility has not been designed to comply with GN704 and a separate project is underway to ensure compliance and also to extend the current footprint area and capacity of the E-Dump, which will be required during the operation of the existing ADF.
5.2.12 Pumps and Pipelines
The pumps serving the Dirty Water Dam, Emergency Dam and Clean Water Dam are located downstream of the Clean Water Dam. These pumps deliver water to the ash dump, for dust suppression, and to the PS for wash water and ash conditioning. Ten (10) pumpsets are provided for this, of which four (4) are dedicated to the ash dump and the remainder to wash water at the PS terrace. The combined flow to the ash dump is 60 ℓ/s on average and 80 ℓ/s on average to the PS terrace.
Two dedicated sets of steel pipelines leave the pump station, a 150mm diameter in a westerly direction to the ash dump and a 350mm diameter in a north-easterly direction to the PS terrace. Currently, the latter pipeline is in the process of being replaced. Both pipelines, painted in conspicuous colours as per the conditions of the WUL, are located above ground and fixed onto concrete plinths.
5.3 Objectives of Proposed Stormwater Management System
The new stormwater system will need to manage the stormwater run-off from the 30 Year ADF, as well as manage the impacts that this has on the existing three (3) dam system. All dams proposed in this system will need to be in compliance with GN704. This will entail the following:
• Confine any unpolluted water to a clean water system, away from any dirty area; • Design, construct, maintain and operate any clean water system so that it is unlikely to
spill into any dirty water system more than once in 50 years; • Collect the water arising within any dirty area, including seepage; • Design, construct and maintain all stormwater systems in such a manner as to guarantee
the serviceability of such conveyances for flows up to and including those arising as a result of the maximum flood with and average period of recurrence on once in 50 years;
• Design, construct, maintain and operate any dirty water system so that it is unlikely to spill into any clean water system more than once in 50 years.

11 August 2016 18 12935-45-Rep-001-Rev55
ZITHOLELE CONSULTING
During the proposed activity, clean water that originally contributed to the runoff within the catchment would temporarily be lost as this water will be diverted to the proposed pollution control dams as impacted water. The proposed activity will be constructed and operated in phases relating to a temporary loss of a maximum ten year period. The ten year period compromises of a five year preparation and operating footprint and five year rehabilitation footprint. The maximum footprint temporarily removed as a contributor to the catchment runoff is 170 hectares.
The proposed activity spans two quaternary catchments, B20 E and B20F. The maximum mean Annual Runoff (MAR) recorded on these two quaternary catchments is 34 mm, which equates to a yearly volume of 57,800 m3 loss in the catchment. This is merely a 0.03% loss within the catchment over a ten year period. The catchment runoff will be reinstated to the natural state once the activity has been completed and the footprint is rehabilitated fully.
5.4 MODELING APPROACH AND ASSUMPTIONS
A fifty (50) year daily time-step model was built using Microsoft Excel for the different scenarios and options as described in the subsequent sections of this report.
5.4.1 Rainfall data
The model takes into consideration daily recorded rainfall closest to the site under investigation. An uninterrupted data set could not be found for Kendal PS, so the one for Cologne in Mpumalanga (Station No. 0478008_W) was used to make-up the required rainfall data. Cologne is located approximately six (6) kilometres south-east of Kendal PS. Data for the period from May 1963 to August 2000 was used from Cologne. Recorded data for Kendal PS was used for the period from September 2000 to May 2013. The combined data set represents fifty (50) years of recorded rainfall. The table below gives the statistics of the data set used.
Table 3: Recorded rainfall statistics Recurrence Interval
(1 in) 1 Day Rainfall
Depth (Cologne) 1 Day Rainfall
Depth Range (mm) No. of Occurrences
in Data Set
2 54 50 - 65 24
5 74 66 – 85 16
10 90 86 – 100 4
20 106 101 – 124 1
50 131* 125 - 135 1
* A rainfall value of 106mm was changed to 131mm to simulate the 50 year 24 hour rainfall depth

11 August 2016 19 12935-45-Rep-001-Rev55
ZITHOLELE CONSULTING
5.4.2 Operating flows
Table 4: Operating flows used in time-step model Use Quality Description Ml/a m3/d
Process Waste Dirty Power station to dirty water dam
4350 11918
* Process Waste Dirty Power station to dirty water dam
88 241
** Washwater Dirty Dirty Water Dam to SSC + Washwater
1720 4712
Ash Conditioning Dirty Dirty Water Dam to Ash Conditioning
630 1726
* This area was previously deemed “clean”.
** This flow increase from 1,570 Ml/a to 1,720 Ml/a, due to a change in the power station operations.
*** This information was received from Maxwell Makhanya and Jacobus Van Den Bergh of Kendal Power Station.
5.4.3 Stormwater runoff calculations
The steps for the calculation of stormwater runoff volumes for the areas and dams are given below.
Step 1: Catchment areas are calculated for each area and dam.
Table 5: Catchment areas Catchment Hectares
Power Station Clean Area 35 Power Station Dirty Area 27 Coal Stockyard 73 Dirty Water Dam 15 Emergency Dirty Water Dam 5
Clean Water Dam 330 Dam 1 83 Dam 2 5.2 Dam 3 115.5 Dam 4 56 Dam 5 147.6 Dam 6 61 Dam 7 84

11 August 2016 20 12935-45-Rep-001-Rev55
ZITHOLELE CONSULTING
Step 2: The Run-off coefficient (C) for each catchment area is calculated. The C-values are calculated as per the SANRAL Drainage Manual. Table 3.7 in the manual provides a description of recommended values of C.
The recommended values are selected according to three characteristics of the catchment under consideration. They are namely:-
a) Surface slope classification b) Permeability classification c) Vegetation classification
A C-value for each characteristic is selected and the sum of which is the overall C-value, known as C1, for a particular catchment. C1 is then multiplied by adjustment factors for each return period, i.e. 2, 5, 10, 20, 50, 100 years. The return period for each storm event was determined using the rainfall depth and comparing it against the one day depth as contained in Table 3. Table 3.8 in the aforementioned Manual provides adjustment factors for the value of C1. Table 6: C values calculated according to catchment characteristics Catchment Area
(m²) Surface Slope
Classification
Cs Permeability Classification
Cp Vegetation Classification
Cv C1
Power Station Clean Area
354 414 Flat Areas (3-10%)
0.08 Semi-permeable
0.16 Grasslands 0.21 0.45
Power Station Dirty Area
274 787 Flat Areas (3-10%)
0.08 Impermeable 0.26 No vegetation
0.28 0.62
Coal Stockyard
732 903 Hilly (10-30%)
0.16 Semi-permeable
0.16 No vegetation
0.28 0.6
Dirty Water Dam
150 000 Flat Areas (3-10%)
0.08 Permeable 0.08 Grasslands 0.21 0.37
Emergency Dirty Water Dam
50 000 Flat Areas (3-10%)
0.08 Permeable 0.08 Grasslands 0.21 0.37
Clean Water Dam
3 300 000 Flat Areas (3-10%)
0.08 Permeable 0.08 Grasslands 0.21 0.37
Dam 1A –ADF Catchment
649 687 Hilly (10-30%)
0.16 Permeable 0.08 No Vegetation
0.28 0.52
Dam 1B – Grassland Area
176 770 Flat Areas (3-10%)
0.08 Permeable 0.08 Grasslands 0.21
0.37

11 August 2016 21 12935-45-Rep-001-Rev55
ZITHOLELE CONSULTING
Dam 2A – E-dump Area
30 000 Flat Areas (3-10%)
0.08 Impermeable 0.26 No Vegetation
0.28 0.62
Dam 2B – Grassland Area
22 000 Flat Areas (3-10%)
0.08 Permeable 0.08 Grasslands 0.21 0.37
Dam 3A – ADF Catchment Steep
563 000 Hilly (10-30%)
0.16 Permeable 0.08 No Vegetation
0.28 0.52
Dam 3B – ADF Catchment Flat
490 000 Vlies & Pans (<3%)
0.03 Permeable 0.08 No Vegetation
0.28 0.39
Dam 3C – Grassland Area
102 000 Flat Areas (3-10%)
0.08 Permeable 0.08 Grasslands 0.21 0.37
Dam 4A – ADF Catchment Steep
410 000 Hilly (10-30%)
0.16 Permeable 0.08 No Vegetation
0.28 0.52
Dam 4B – ADF Catchment Flat
150 000 Vlies & Pans (<3%)
0.03 Permeable 0.08 No Vegetation
0.28 0.39
Dam 5A – ADF Catchment Steep
858 000 Hilly (10-30%)
0.16 Permeable 0.08 No Vegetation
0.28 0.52
Dam 5B – ADF Catchment Flat
35 000 Vlies & Pans (<3%)
0.03 Permeable 0.08 No Vegetation
0.28 0.39
Dam 5C – Grassland Area
583 000 Flat Areas (3-10%)
0.08 Permeable 0.08 Grasslands 0.21 0.37
Dam 6A – ADF Catchment Steep
410 000 Hilly (10-30%)
0.16 Permeable 0.08 No Vegetation
0.28 0.52
Dam 6B – ADF Catchment
200 000 Vlies & Pans (<3%)
0.03 Permeable 0.08 No Vegetation
0.28 0.39

11 August 2016 22 12935-45-Rep-001-Rev55
ZITHOLELE CONSULTING
Dam 7A – ADF Catchment
700 000 Hilly (10-30%)
0.16 Permeable 0.08 No Vegetation
0.28 0.52
Dam 7C – Grassland Area
141 265 Flat Areas (3-10%)
0.08 Permeable 0.08 Grasslands 0.21 0.37
Table 7: C values obtained from adjustment factors for each catchment area RP PS
Clean Area
PS Dirty Area
CSY Dirty Water Dam
Emerg Dirty
Water Dam
Clean Water Dam
Dam 1A
Dam 1B
Dam 2A
Dam 2B
Dam 3A
0 0.00 0.00 0.00 0.00 0.00 0.00 0.00 0.00 0.00 0.00 0.00 1 0.21 0.23 0.26 0.18 0.18 0.18 0.25 0.25 0.19 0.19 0.25 2 0.23 0.31 0.30 0.19 0.19 0.19 0.32 0.24 0.31 0.19 0.32 5 0.25 0.34 0.33 0.20 0.20 0.20 0.34 0.26 0.34 0.20 0.34 10 0.27 0.37 0.36 0.22 0.22 0.22 0.37 0.28 0.37 0.22 0.37 20 0.30 0.42 0.40 0.25 0.25 0.25 0.40 0.30 0.42 0.25 0.40 50 0.37 0.51 0.50 0.31 0.31 0.31 0.49 0.36 0.51 0.31 0.49
100 0.45 0.62 0.60 0.37 0.37 0.37 0.58 0.43 0.62 0.37 0.58
RP Dam 3B
Dam 3C
Dam 4A
Dam 4B
Dam 5A
Dam 5B
Dam 5C
Dam 6A
Dam 6B
Dam 7A
Dam 7C
0 0.00 0.00 0.00 0.00 0.00 0.00 0.00 0.00 0.00 0.00 0.00 1 0.25 0.25 0.25 0.25 0.25 0.25 0.25 0.25 0.25 0.25 0.25 2 0.25 0.24 0.32 0.25 0.32 0.25 0.24 0.32 0.25 0.32 0.24 5 0.27 0.26 0.34 0.27 0.34 0.27 0.26 0.34 0.27 0.34 0.26 10 0.29 0.28 0.37 0.29 0.37 0.29 0.28 0.37 0.29 0.37 0.28 20 0.32 0.30 0.40 0.32 0.40 0.32 0.30 0.40 0.32 0.40 0.30 50 0.38 0.36 0.49 0.38 0.49 0.38 0.36 0.49 0.38 0.49 0.36
100 0.45 0.43 0.58 0.45 0.58 0.45 0.43 0.58 0.45 0.58 0.43
Step 3: The adjusted C-values for the PCD’s are increased by 7% to take leachate into account.
Step 4: Rainfall, catchment area and C-values are multiplied with each other to obtain a volume of runoff for each area and dam.
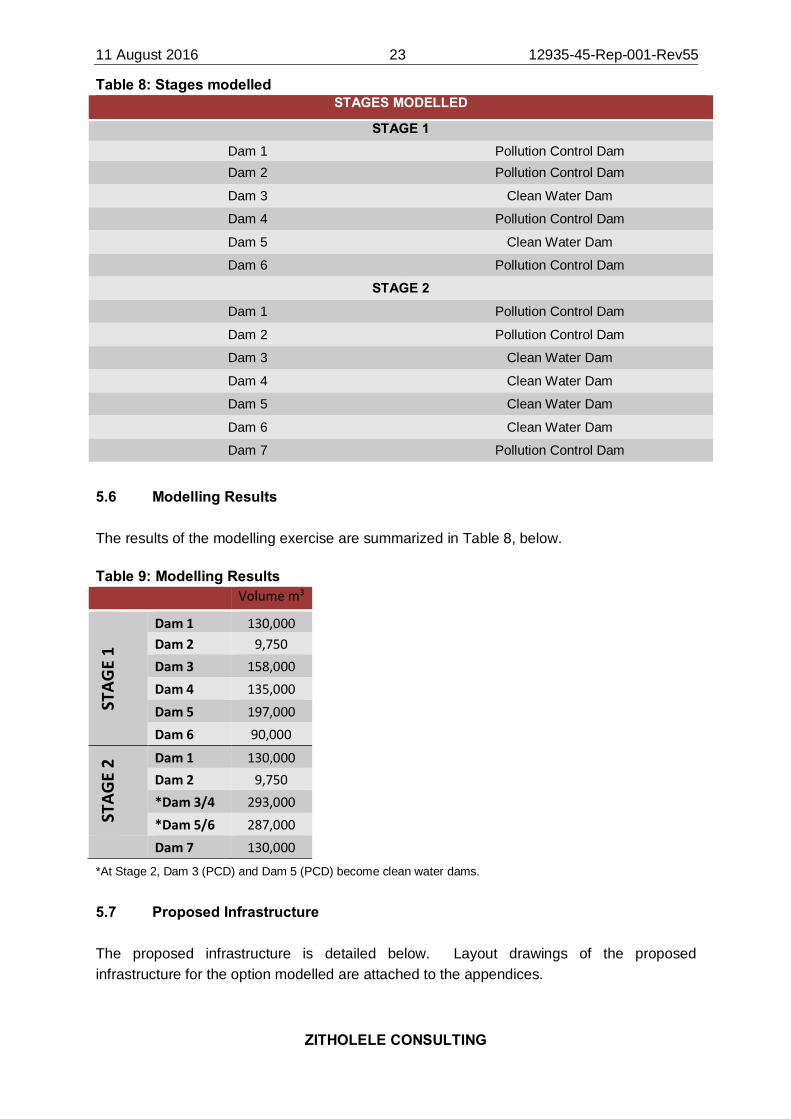
5.5 Stages Modelled
Two stages of construction of the dams were modelled. Table 7, below, describes each stage.
11 August 2016 23 12935-45-Rep-001-Rev55
ZITHOLELE CONSULTING
Table 8: Stages modelled STAGES MODELLED
STAGE 1 Dam 1 Pollution Control Dam Dam 2 Pollution Control Dam
Dam 3 Clean Water Dam
Dam 4 Pollution Control Dam
Dam 5 Clean Water Dam
Dam 6 Pollution Control Dam
STAGE 2 Dam 1 Pollution Control Dam
Dam 2 Pollution Control Dam
Dam 3 Clean Water Dam
Dam 4 Clean Water Dam
Dam 5 Clean Water Dam
Dam 6 Clean Water Dam
Dam 7 Pollution Control Dam
5.6 Modelling Results
The results of the modelling exercise are summarized in Table 8, below.
Table 9: Modelling Results Volume m3
STAG
E 1
Dam 1 130,000 Dam 2 9,750 Dam 3 158,000 Dam 4 135,000 Dam 5 197,000 Dam 6 90,000
STAG
E 2 Dam 1 130,000
Dam 2 9,750 *Dam 3/4 293,000 *Dam 5/6 287,000
Dam 7 130,000 *At Stage 2, Dam 3 (PCD) and Dam 5 (PCD) become clean water dams.
5.7 Proposed Infrastructure
The proposed infrastructure is detailed below. Layout drawings of the proposed infrastructure for the option modelled are attached to the appendices.

11 August 2016 24 12935-45-Rep-001-Rev55
ZITHOLELE CONSULTING
5.7.1 Pollution Control Dams
The two (2) existing pollution control dams, dirty water dam and emergency dirty water dam, remain in place. Additional Dams 1, 2, 4, 6 and 7 are proposed. The capacities of the dams are given in Table 9, below.
Table 10: Dam Capacities Dam Volume m3
Dam 1 *140,000 Dam 2 9,750 Dam 4 135,000 Dam 6 90,000 Dam 7 130,000 * + 2 days storage for dust suppression water.
The performance (dam levels) of these PCD’s for the fifty (50) year simulation period is shown on the respective graphs below.
Figure 10: Dirty Water Dam Levels for Simulation Period

11 August 2016 25 12935-45-Rep-001-Rev55
ZITHOLELE CONSULTING
Figure 11: Emergency Dirty Water Dam Levels for Simulation Period
Figure 12: Proposed Dam 1 Levels for Simulation Period

11 August 2016 26 12935-45-Rep-001-Rev55
ZITHOLELE CONSULTING
Figure 13: Proposed Dam 2 Levels for Simulation Period
Figure 14: Proposed Dam 4 Levels for Simulation Period

11 August 2016 27 12935-45-Rep-001-Rev55
ZITHOLELE CONSULTING
Figure 15: Proposed Dam 6 Levels for Simulation Period
Figure 16: Proposed Dam 7 Levels for Simulation Period

11 August 2016 28 12935-45-Rep-001-Rev55
ZITHOLELE CONSULTING
0%
20%
40%
60%
80%
100%
120%
Dam Level Dam Max Capacity
5.7.2 Clean Water Dams
In addition to the existing Clean Water Dam, two (2) more dams are proposed for clean water containment emanating from the rehabilitated areas. These dams will be operated on a controlled release principle which is based on the receiving water quality. It is not the intention to impound clean water if not required, provided that the discharge quality is acceptable. If the water in these clean water dams are deemed impacted, it will be irrigated onto the areas that it emanated from or utilised in the PS water balance if possible.
The following are the proposed Clean Water Dams:
• Dam 3:158 Mℓ • Dam 5:197 Mℓ
The performance (dam levels) of these three (including the existing Clean Water Dam) clean water dams for the fifty (50) year simulation period is shown on the respective graphs below.
Figure 17: Existing Clean Water Dam Levels for Simulation Period

11 August 2016 29 12935-45-Rep-001-Rev55
ZITHOLELE CONSULTING
Figure 18: Proposed Dam 3 Levels for Simulation Period
Figure 19: Proposed Dam 5 Levels for Simulation Period

11 August 2016 30 12935-45-Rep-001-Rev55
ZITHOLELE CONSULTING
5.7.3 Toe Paddocks
In order to prevent siltation within the channels and reduce the required velocities, it is proposed that paddocks be constructed at the toe of the advancing face to intercept run-off from the new ADF and allow this to overflow to the discharge channels.
The temporary structures will facilitate siltation. It is envisaged that the paddocks will be constructed from earth and with the lining over the paddock wall. The walls will have spillways to allow cascading of water from one paddock into the next. The paddocks will be covered over when dozing the side slope down to the final 1:5 slope for rehabilitation of that section of the facility.
Figure 20: Positioning of Temporary Toe Paddocks
5.7.4 Storage Reservoirs
Apart from capturing runoff from its respective areas, water for dust suppression will also be stored in Dam 1. It is proposed that an additional two days of storage be allowed for, in the capacity of this dam.
5.7.5 Conveyance infrastructure (pumps, pipelines and channels)
The proposed operational philosophy around stormwater management will involve the construction of new infrastructure. Apart from the dams, as mentioned in the previous sections of this report, conveyance infrastructure will be required for the following reasons:
• Conveyance of spills from one facility to the next; • Conveyance of dust suppression water from the relevant dams to the dedicated storage
reservoirs; • Conveyance of rehabilitated irrigation water from the relevant dams to the dedicated
storage reservoirs; • Dust suppression from storage reservoir to open ash area of the new ADF;
CLEAN WATER CUT-OFF BERM
ACCESS ROAD
CHANNEL TO PCD
TEMPORARY TOE PADDOCK
CONSTRUCTED FROM ASH
ON TOP OF LINER
ADVANCING FACE OF ADF
REHABILITATED FACE OF ADF
ASH BODY
LINER UP TO DIRTY
WATER CHANNEL

11 August 2016 31 12935-45-Rep-001-Rev55
ZITHOLELE CONSULTING
• Irrigation from storage reservoir to the rehabilitated area of the new ADF; • Irrigation of the PS terrace grassed areas from the existing Clean Water Dam.
5.8 Dust Suppression Abstraction Philosophy
Impacted (dirty) Stormwater will be contained in six (6) pollution control dams, namely:
1. Dirty Water Dam (existing) 2. Emergency Dirty Water Dam (existing) 3. Dam 1 (proposed) 4. Dam 4 (proposed) 5. Dam 6 (proposed) 6. Dam 7 (proposed)
The operating philosophies of these dams are interlinked with respect to the abstraction of water for dust suppression, and will need to be managed effectively to ensure peak performance. The relationship between these dams is as follows:
• The Emergency Dirty Water Dam will need to always have 55 Mℓ available storage capacity therefore it should be given priority for dust suppression to maintain this volume.
• If the Emergency Dirty Water Dam has the available storage available, then water for dust suppression will have to be abstracted from the existing Dirty Water Dam, Dam 1, Dam 4, Dam 6 or Dam 7. Water will be abstracted from the dam with the highest volume by percentage of its storage capacity.
• Dam 1 will be used as a storage reservoir for dust suppression. Water from the five (5) other PCD’s are pumped to Dam 1 for dust suppression. Dam 1 will be sized to accommodate a two (2) day storage capacity for dust suppression.
• The dust suppression depth ranges used in the water balance model are as follows: - Winter Months: 5.7 mm – 7 mm - Summer Months: 11.3 mm – 14 mm
5.9 Hydraulic Analysis
5.9.1 Sizing of “Clean” stormwater diversion drains and berms
Clean surface water runoff generated from rehabilitated areas of the new ADF will ultimately report into clean water drains running along the northern and southern toe lines of the new ADF.

11 August 2016 32 12935-45-Rep-001-Rev55
ZITHOLELE CONSULTING
Figure 21: Clean Water Drain
5.9.2 Sizing of “Dirty” stormwater conveyance drains
Dirty surface water runoff generated from the open ash area of the new ADF will ultimately report into dirty water drains running along the perimeter of the new ADF.
Figure 22: Dirty Water Drain 5.10 Water Balance
The Water Balance is shown in Appendix D. Normal operating levels for the dams, both existing and proposed, are shown on the graphs in Section Error! Reference source not found..

11 August 2016 33 12935-45-Rep-001-Rev55
ZITHOLELE CONSULTING
5.11 Operational Requirements
In sizing the proposed infrastructure, several assumptions were made for the operational philosophy surrounding the new ADF and its infrastructure. These assumptions need to be realised during operation in order to ensure the optimum performance of the new infrastructure.
5.11.1 Monitoring of Quality in Clean Water Dams
The Clean Water Dams, Dams 3 and 5 have been sized so that they do not spill more than once in fifty years, after also taking into consideration the irrigation onto the rehabilitated areas. The above mentioned dams will need to be monitored for water quality on a continuous basis. If the water is deemed clean (with respect to the discharge quality of the receiving environment), then it may be released. However, if the quality does not meet the discharge quality, then this water must be irrigated onto the rehabilitated areas or utilised in the PS water balance.
5.11.2 Maintaining Open Ash Areas for Dust Suppression
The option takes into account three open ash area sizes, of 93, 82 and 67 hectares to be maintained during operations and to balance the dirty water system using dust suppression without the need for a Water Treatment Plant. The respective dams have been sized accordingly. If significantly smaller areas are maintained, the dams recommended in this report will be too small to ensure that we do not spill more than once in fifty years from the pollution control dams.
5.11.3 Maintaining Silt Traps
The storage capacity of the proposed dams does not assume a continuous influx of silt into it as it is equipped with a silt trap. If these silt traps are not maintained as per their design requirements, the performance of the dams will be compromised. The silt traps will be finalised during Detailed Design and the operations thereof need to be communicated to the PS operators.
5.12 Way Forward for Stormwater Management
It is recommended that a Water Use Licence Application (WULA) be made for the water uses, as described in this report.
6 PHASED APPROACH TO ASH DISPOSAL FACILITY
A starter platform for the extendible and shiftable conveyors will be built first on the eastern side of the site. A 1:15 average sloped ramp (made of ash) will then be constructed using parallel shifts (1:10 slope between shifts plus level shiftable conveyor platforms) and will reach a maximum height of 75 metres which is the maximum height of the new ADF. The

11 August 2016 34 12935-45-Rep-001-Rev55
ZITHOLELE CONSULTING
rest of the new ADF will be constructed with the conveyor-stacker system using parallel shifts and ending with radial shifts.
7 OPERATION AND MAINTENANCE PLAN
There is currently an Operational Manual in place for the existing Kendal ADF which provides insight into all current activities on site. This Operational Manual will be revised during Detailed Design of the New 30 Year ADF.
7.1 Code requirements in terms of SABS 0286
The following needs to be in accordance with SABS 0286
• Management • Operational phase appointment • Facility audit • Hazard classification • Operating manual • Operation of the ash dump • Operation of silt trap/s and pollution control dam • Monitoring and maintenance requirements • Rehabilitation and environmental considerations
8 CAPITAL COST ESTIMATE ZC conducted a high level capital cost estimate. The total capital cost for the new ADF is
estimated to be R 2, 172, 440, 336.74 (Excluding VAT) and excluding the costs for the deviation of the Eskom Transmission and Distribution power lines. See Appendix H for a
high level cost breakdown. (The breakdown also does not include costs for land acquisition
and relocation of communities).
9 CONSTRUCTION AND OPERATION PHASES ZC has compiled a table and drawing that documents the phasing of the project from the
estimated start of construction (2025) to the planned end of operations (2055). Refer to Appendix J for the Construction and Operation Phases table and drawing.
10 WETLAND AVOIDANCE Due to several restrictions on the Site H footprint, the new ADF as well as appurtenant
infrastructure has been proposed to be constructed on wetlands and a pan. This could not
be avoided in meeting the design objectives i.e. accommodating ash within the boundaries
of the site. A technical memorandum has been drafted, which documents the implications on the project if the above-mentioned wetlands and pan are to be avoided. See Appendix K for
this technical memorandum.

11 August 2016 35 12935-45-Rep-001-Rev55
ZITHOLELE CONSULTING
11 REFERENCES
11.1 Ramdayal, N., & Owens-Collins, S. (2016). 13615779-304421-1 REV3 Preliminary Geotechnical Investigation of Preferred Sites B, C, F and H for Proposed Eskom 30 yeah Kendal Ash Disposal Facility Rev 3. Midrand, Gauteng: Golder Associates.
11.2 The South African National Roads Agency Limited. (2007). Drainage Manual 5th Edition. Pretoria, Gauteng: SANRAL.
11.3 van Zyl, M. (2013). JW030/13/D121 - Rev2 Kusile and Kendal Power Stations Ash Disposal Facilities Waste Classification Report. Sandton, Gauteng: Jones & Wagener.
ZITHOLELE CONSULTING (PTY) LTD
J Heera N Rajasakran PrEng Civil Engineering Technologist Lead Engineer
Z:\PROJECTS\12935 - KENDAL 30YR ASH\4 REPORTS\45 ENGINEERING\CONCEPTUAL ENGINEERING DESIGN REPORT\REV 5 UPDATED WITH ESKOM'S
COMMENTS\12935-45-REP-001-KENDAL 30 YEAR ADF PROJECT CONCEPTUAL ENGINEERING REPORT-REV5.DOCX

ZITHOLELE CONSULTING
APPENDIX A
Geotechnical Report

ZITHOLELE CONSULTING
APPENDIX B
Waste Classification Report

ZITHOLELE CONSULTING
APPENDIX C
Conceptual Engineering Drawings

ZITHOLELE CONSULTING
APPENDIX D
Water Balance Diagram

ZITHOLELE CONSULTING
APPENDIX E
Screening Report

ZITHOLELE CONSULTING
APPENDIX F
Technical Memo: Selection of Barrier System

ZITHOLELE CONSULTING
APPENDIX G
Construction Quality Assurance (CQA) Plan

ZITHOLELE CONSULTING
APPENDIX H
High Level Capital Cost Breakdown

ZITHOLELE CONSULTING
APPENDIX J
Construction & Operation Phases

ZITHOLELE CONSULTING
APPENDIX K
Technical Memo for Design Considerations to avoid Wetlands

ZITHOLELE CONSULTING
APPENDIX L
Technical Memo for Transnet Pipeline