Embed Size (px)
Citation preview

DORROUGH ELECTRONICS5221 Collier Place
Woodland Hills, CA 91364(818) 999-1132
DORROUGH STEREO SIGNAL TEST SET
Model 1200
Technical Instruction Manual
LEFT/SUM RIGHT/DIFF
DORROUGH ELECTRONICS•CHATSWORTH, CA 91311•USA
STEREO SIGNAL TEST SET
RANGE FUNCTION
MODEL 1200
STEREO SUM/DIFF+20 - -10 -10 - -40HIGH LOW
dBv IN
+20
+18
+16
+14+12
+10
+8
+6
-2 -4
+4
+2
0 -6
-8
-10
/-10
/-12
/-14
/-40
/-16-18/
-20/
-22/
-24/
-26/
-28/
-30/
-32/ /-34
/-36
/-38
++
+RELATIVE LOUDNESS
TO PEAK MODULATION
USA MODEL 12-B
-16 -14 -12 -10 -8-6
-4-2
01
23
-18-20-22-24
-26-28
-30
-32
-34
-36
1.6125
100
8063
5040
3225201612108
6.35
43.2
2.5
2
dBm dBm
% MODULATION
++
+RELATIVE LOUDNESS
TO PEAK MODULATION
USA MODEL 12-B
-16 -14 -12 -10 -8-6
-4-2
01
23
-18-20-22-24
-26-28
-30
-32
-34
-36
1.6125
100
8063
5040
3225201612108
6.35
43.2
2.5
2
dBm dBm
% MODULATION

1
The DORROUGH Stereo Signal Test Set, Model 1200, is a simple and easy-to-operate gain set that will allow you to quickly monitor and dynamicallybalance stereo broadcast lines. The Model 1200 offers the widest range everdesigned for accurate measurement of level, balance, crosstalk, and signal-to-noise of your system from noise floor to signal clipping. Now you can easilyverify stereo system performance without having to call for an oscilloscopeor DVM from the maintenance shop. Yet if incorrect conditions are spotted,just connect test equipment to one of the Monitor Jacks to examine asuspected problem in detail.
Description
The DORROUGH Stereo Signal Test Set contains a pair of input amplifiers, aprecision 30 dB-step RANGE Attenuator, a RANGE Selector offering aselection of two 30 dB measurement ranges, a stereo or sum/differenceFUNCTION Selector, a pair of DORROUGH Relative Loudness To PeakModulation Meters (Model 12-B), and two buffered Monitor Outputs, asshown in block diagram form in Fig.1.
INTRODUCTION
Fig. 1. Block diagram of DORROUGH Stereo Signal Test Set, Model 1200.
POWERSUPPLY
+15 VDC-15 VDC
+3.5 VDC
4 VAC
meter LED's
circuits
meterlamps
1
4
2
3
L THRU
XLR3-F
1
4
2
3
XLR3-M
L INPUT
1
4
2
3
R THRU
XLR3-F
1
4
2
3
XLR3-M
R INPUT
R INPUT
L INPUT+
-
+
-
SUM
DIFF
30 dB GAIN
HIGH
LOW
RANGE Control
Input Matrix BoardFUNCTION Control
SUM
DIFF
R
L
RANGE Attenuator Input Matrix Board
++
+RELATIVE LOUDNESS
TO PEAK MODULATION
USA MODEL 12-B
-16 -14 -12 -10 -8-6
-4-2
01
23
-18-20-22-24
-26-28
-30
-32
-34
-36
1.6125
100
8063
5040
3225201612108
6.35
43.2
2.5
2
dBm dBm
% MODULATION
++
+RELATIVE LOUDNESS
TO PEAK MODULATION
USA MODEL 12-B
-16 -14 -12 -10 -8-6
-4-2
01
23
-18-20-22-24
-26-28
-30
-32
-34
-36
1.6125
100
8063
5040
3225201612108
6.35
43.2
2.5
2
dBm dBm
% MODULATION
LEFT/SUM
RIGHT/DIFF
(Front)
MONITORL/R S/D
(Rear)
+3.5 VDC
(L/R S/D)
2
The Model 1200 has a measurement range of 96 dB (-76 to +20 dB). Thedesign features inputs that are transformerless and electronically servo-balanced to guarantee a constant gain for all input feed configurations (i.e.,balanced, unbalanced, etc.). Barrier strip and parallel XLR connections, withan “audio loop-thru” feature, are included to provide installation flexibility.Input impedance is set at 40 kOhms to insure stereo program monitoringwithout any loading effects.
The Model 1200 uses two “B” Type LED meters to simultaneously measuretrue peak and average audio levels over a 40 dB range in 1 dB increments. Areference level is set 3 dB below full scale and is designated as 0 dB or 100%Modulation.
A Monitor Jack is provided on both the front and rear panels for use with anoscilloscope, headphones, or monitor amplifier. The output level of the frontjack can be internally set for any gain level up to +20 dB, and both jacks willfollow the action of the RANGE attenuator and FUNCTION selector.
About This Manual
This Technical Instruction Manual is divided into the following sections:Installation, Operation, Applications, Circuit Theory, Field Alignment, andSchematics. Before you install the unit, we suggest you take a moment toread through the Operation and Applications sections to fully understandthe capabilities of the Model 1200. After you have determined how best touse the DORROUGH Stereo Test Set for your purposes, then follow theinstructions listed in the Installation section.

3
To install your DORROUGH Stereo Signal Test Set, Model 1200, perform theinstructions described in the following sections.
Unpacking
Your DORROUGH Stereo Signal Test Set, Model 1200, was carefully packedat the factory. Take a moment to examine the unit for any signs of shippingdamage. If damage is evident, retain the carton and notify the transit carrierand your local distributor about your claim.
Once you are satisfied with the physical integrity of the unit, follow the stepslisted below in Initial Set-Up. Upon completion of this section, proceed tothe section on Operation and Applications.
Initial Set-up
1. To rack-mount your Model 1200, locate a ventilated area that pro-vides a minimum depth of 10" for proper cable routing. Consider alocation that not only will offer easy observation of the meter move-ments, but will also allow convenient access to the front panelcontrols.
2. After mounting the unit, plug the AC cord into a convenient AC lineand observe that the two meter displays on the front panel becomebacklit.
NOTE: If you do not see this action, check your AC line for power, or testthe 3.0 Amp fuse for continuity.
3. Feed a mono +4 dB test signal (i.e. 1 kHz tone) to the unit through theappropriate LEFT input connection located on the back panel, asshown in Fig. 2.
NOTE: The Model 1200 provides you with a choice of barrier strip or XLRconnections that are tied together internally. An additional “loop-thru”M-XLR connector is provided at each channel input to facilitate systeminstallation. Because of the servo-balanced input circuits, any XLR wiringconvention may be used, as long as both incoming and outgoing L and Rcables are wired the same.
INSTALLATION
21
3
LEFT
PUSH
12
3
21
3
RIGHT+ - - +
LEFT RIGHT
INPUTS 40K BRIDGING
STEREO SIGNAL TEST SET
MONITORL/R S/D
ESUF
E SUF
110/220
SERIAL NO.
DORROUGH ELECTRONICS • CHATSWORTH, CA 91311 • U.S.A.
MODEL 1200
MADE IN U.S.A.
PUSH
12
3
Fig. 2. Rear panel of DORROUGH Stereo Signal Test Set, Model 1200.
☛
☛

4
If you do not have a wiring standard, we suggest implementing thefollowing pin assignments:
BALANCED UNBALANCED
Pin 1 = GROUND Pin 1 = GROUNDPin 2 = HIGH Pin 2 = HIGHPin 3 = LOW Pin 3 = LOW tied to pin 1
4. On the front panel, set the FUNCTION control to STEREO andposition the RANGE attenuator control to +4 dB, as shown in Fig. 3.Make sure the HIGH/LOW range control is set to HIGH.
5. Verify that the left LED meter indicates 0 dBm, as shown in Fig. 4.
6. Repeat step 3 for the RIGHT input connection and verify that theright LED meter indicates 0 dBm.
RANGE FUNCTION
MODEL 1200
STEREO SUM/DIFF+20 - -10 -10 - -40HIGH LOW
dBv IN
+20
+18
+16
+14+12
+10
+8
+6
-2 -4
+4
+2
0 -6
-8
-10
/-10
/-12
/-14
/-40
/-16-18/
-20/
-22/
-24/
-26/
-28/
-30/
-32/ /-34
/-36
/-38
Fig. 3. Initial control settings on Model 1200.
Fig. 4. Example showing Left and Rights meter indicating 0 dB.
++
+RELATIVE LOUDNESS
TO PEAK MODULATION
USA MODEL 12-B
-16 -14 -12 -10 -8-6
-4-2
01
23
-18-20-22-24
-26-28
-30
-32
-34
-36
1.6125
100
8063
5040
3225201612108
6.35
43.2
2.5
2
dBm dBm
% MODULATION
++
+RELATIVE LOUDNESS
TO PEAK MODULATION
USA MODEL 12-B
-16 -14 -12 -10 -8-6
-4-2
01
23
-18-20-22-24
-26-28
-30
-32
-34
-36
1.6125
100
8063
5040
3225201612108
6.35
43.2
2.5
2
dBm dBm
% MODULATION

5
You can use the DORROUGH Stereo Test Set to quickly measure or verify:Stereo Program Balance, Separation, Crosstalk, Line Polarity, Signal-to-NoiseRatio, Clipping Threshold, and System Headroom. These measurements areall made from the Model 1200 front panel, as shown in Fig. 5.
Front Panel Controls
The Model 1200 front panel is equipped with two Relative Loudness to PeakModulation meters (Type B Scale), a precision 30-step RANGE Attenuator, aHIGH/LOW Range Selector, a FUNCTION Control for selecting eitherSTEREO or SUM/DIFF monitoring, and a Headphone Monitor jack.
Relative Loudness to Peak Modulation Meters
The Model 1200 uses two Relative Loudness to Peak Modulation meters(Model 12-B) to provide indication of measured audio levels. Each meter isdesigned to indicate ascending signal levels from left to right across the rowof LED’s. There are two scales on the meter face plate: a dB scale, graduatedin 1 dB increments from -36 dB to +3 dB, and a Modulation scale rangingfrom 0% to 125% modulation.
NOTE: A reference level set point is indicated 3 dB below full scale. At this point, aknown 0 dB peak audio level can be associated with 100% modulation.
The “B” Type meter uses the same ballistics as the standard “A” Type meter.To read average signals on this meter, observe the value of the LED’s withinthe consecutively lit bar display. The largest valued LED is the averagereading. Peak signal strength is indicated by the single lit LED farthest to theright of the consecutively lit bar display, as shown in Fig. 6.
OPERATION
LEFT/SUM RIGHT/DIFF
DORROUGH ELECTRONICS•CHATSWORTH, CA 91311•USA
STEREO SIGNAL TEST SET
RANGE FUNCTION
MODEL 1200
STEREO SUM/DIFF+20 - -10 -10 - -40HIGH LOW
dBv IN
+20
+18
+16
+14+12
+10
+8
+6
-2 -4
+4
+2
0 -6
-8
-10
/-10
/-12
/-14
/-40
/-16-18/
-20/
-22/
-24/
-26/
-28/
-30/
-32/ /-34
/-36
/-38
++
+RELATIVE LOUDNESS
TO PEAK MODULATION
USA MODEL 12-B
-16 -14 -12 -10 -8-6
-4-2
01
23
-18-20-22-24
-26-28
-30
-32
-34
-36
1.6125
100
8063
5040
3225201612108
6.35
43.2
2.5
2
dBm dBm
% MODULATION
++
+RELATIVE LOUDNESS
TO PEAK MODULATION
USA MODEL 12-B
-16 -14 -12 -10 -8-6
-4-2
01
23
-18-20-22-24
-26-28
-30
-32
-34
-36
1.6125
100
8063
5040
3225201612108
6.35
43.2
2.5
2
dBm dBm
% MODULATION
Fig. 5. Front Panel of DORROUGH Stereo Test Set, Model 1200.
++
+RELATIVE LOUDNESS
TO PEAK MODULATION
USA MODEL 12-B
-16 -14 -12 -10 -8-6
-4-2
01
23
-18-20-22-24
-26-28
-30
-32
-34
-36
1.6125
100
8063
5040
3225201612108
6.35
43.2
2.5
2
dBm dBm
% MODULATION
AVERAGE = -10 dB
PEAK = 0 dBFig. 6. An example of peakand average indications fora pink noise source. Withtest tones (i.e. 1 kHz), thepeak and average levelindication will coincide withthe last illuminated LEDhaving a double brightness.
☛
++
+RELATIVE LOUDNESS
TO PEAK MODULATION
USA MODEL 12-B
-16 -14 -12 -10 -8-6
-4-2
01
23
-18-20-22-24
-26-28
-30
-32
-34
-36
1.6125
100
8063
5040
3225201612108
6.35
43.2
2.5
2
dBm dBm
% MODULATION

6
STEREO SUM/DIFF
RANGE Attenuator
The RANGE Attenuator provides 30 precision steps of attenuationin 1 dB increments. Two scales provide an accurate measurement of theattenuated signal. The HIGH scale ranges from +20 to -10 dB and is usedwhen the HIGH/LOW Range Selector is in the HIGH position.
The LOW scale ranges from -10 to -40 dB and is used when the HIGH/LOWRange Selector is in the LOW position.
FUNCTION Control
The FUNCTION Control provides two ways of monitoring stereo signals.When STEREO is selected, the left meter displays L audio signal peaks andthe right meter shows the R audio signal peaks. When SUM/DIFF is se-lected, the left meter displays SUM audio signal peaks, and the right meterdisplays DIFF(erence) audio signal peaks.
When viewing a stereo signal as a SUM signal, you can expect up to 6 dBincrease in the meter reading, depending on signal content or correlation.
Headphone Monitor
The Model 1200 provides two monitor jacks (front and rear panels) for use inmonitoring selected signals and functions. Both jacks follow the RANGEAttenuator as well as the FUNCTION Control selection. In addition, theHeadphone Monitor on the front panel is powered by an internal 1W ampli-fier for driving a stereo headset or a set of small loudspeakers. The Head-phone Monitor can be adjusted internally for a nominal loudness level (seeHeadphone Monitor Adjustment at end of manual).
Keep in mind the following signal assignments when you access eithermonitor jack:
Tip = LEFT or SUM Ring = RIGHT or DIFFSleeve = GROUND
NOTE: Although the 1W amplifier has acceptable distortion specifications, use therear panel monitor jack to perform any critical measurements. This connection tapsthe audio signals before the internal amplifier. If needed, refer to the circuit sche-matic to locate the signal path to both monitor jacks.
☛
MONITORL/R S/D
RANGE
+20 - -10 -10 - -40HIGH LOW
dBv IN
+20
+18
+16
+14+12
+10
+8
+6
-2 -4
+4
+2
0 -6
-8
-10
/-10
/-12
/-14
/-40
/-16-18/
-20/
-22/
-24/
-26/
-28/
-30/
-32/ /-34
/-36
/-38

7
Measuring A Stereo Signal
This procedure instructs how to use your DORROUGH Stereo Signal Test Setto perform the variety of tests listed in the Applications section. We suggestyou take a few moments and try these steps on your favorite stereo programor test signal.
Initially set the RANGE Attenuator to +20 db, the HIGH/LOW RangeSelector to the HIGH position, and the FUNCTION Control to STEREO, asshown in Fig. 7.
1. Feed a stereo signal (i.e., -10 dB, 0 dB, +4 dB, etc.) through theappropriate connections on the back panel, as described in theInstallation section.
2. Turn the RANGE Attenuator clockwise a step at a time while youobserve the meters. Continue rotating the RANGE Attenuatorclockwise until you see near full scale indications on the meters, asshown in Fig. 8.
NOTE: If all the LED’s are lit, turn the RANGE Attenuator counter-clockwise to attenuate the signal until you see near full scale indications.
Fig. 7. Initial settings for measuring a stereo signal.
Fig. 8. This example illustrates the action of the LED bar display as theRANGE attenuation is increased (clockwise).
☛
dBv IN
+20
+18
+16
+14+12
+10
+8
+6
-2 -4
+4
+2
0 -6
-8
-10
/-10
/-12
/-14
/-40
/-16-18/
-20/
-22/
-24/
-26/
-28/
-30/
-32/ /-34
/-36
/-38
UT RN
++
+RELATIVE LOUDNESS
TO PEAK MODULATION
USA MODEL 12-B
-16 -14 -12 -10 -8-6
-4-2
01
23
-18-20-22-24
-26-28
-30
-32
-34
-36
1.6125
100
8063
5040
3225201612108
6.35
43.2
2.5
2
dBm dBm
% MODULATION
LIT LEDS
RANGE FUNCTION
MODEL 1200
STEREO SUM/DIFF+20 - -10 -10 - -40HIGH LOW
dBv IN
+20
+18
+16
+14+12
+10
+8
+6
-2 -4
+4
+2
0 -6
-8
-10
/-10
/-12
/-14
/-40
/-16-18/
-20/
-22/
-24/
-26/
-28/
-30/
-32/ /-34
/-36
/-38
8
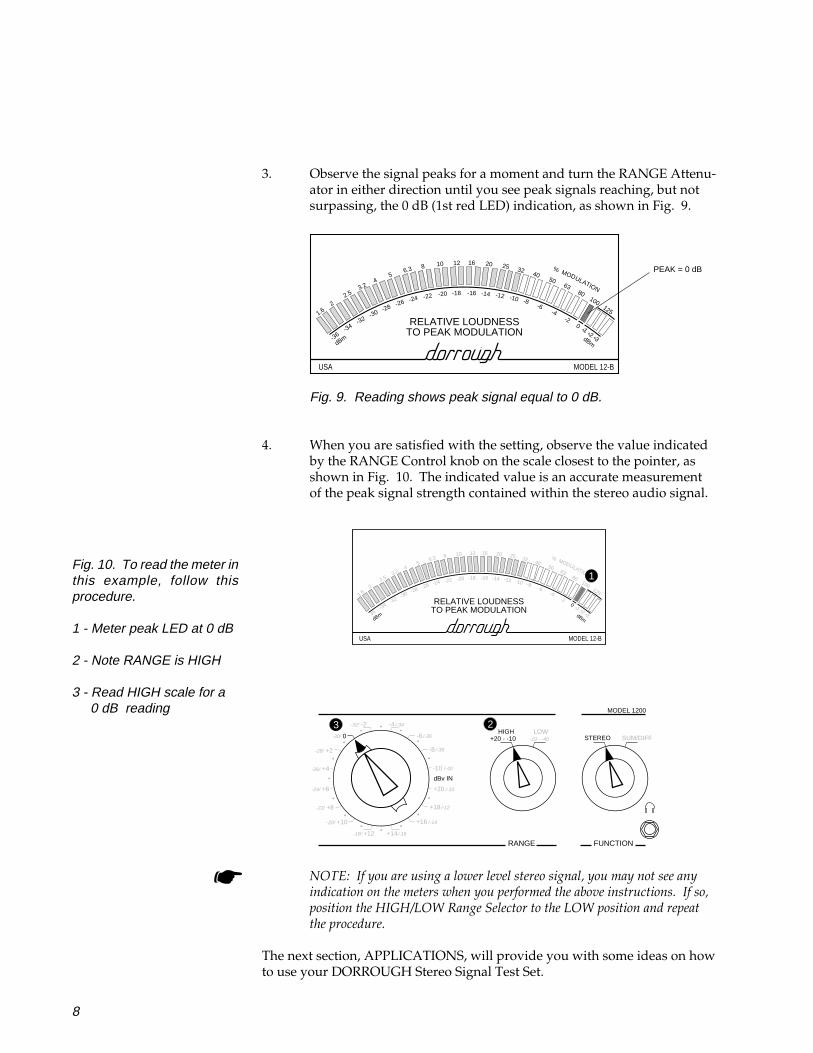
3. Observe the signal peaks for a moment and turn the RANGE Attenu-ator in either direction until you see peak signals reaching, but notsurpassing, the 0 dB (1st red LED) indication, as shown in Fig. 9.
4. When you are satisfied with the setting, observe the value indicatedby the RANGE Control knob on the scale closest to the pointer, asshown in Fig. 10. The indicated value is an accurate measurementof the peak signal strength contained within the stereo audio signal.
NOTE: If you are using a lower level stereo signal, you may not see anyindication on the meters when you performed the above instructions. If so,position the HIGH/LOW Range Selector to the LOW position and repeatthe procedure.
The next section, APPLICATIONS, will provide you with some ideas on howto use your DORROUGH Stereo Signal Test Set.
++
+RELATIVE LOUDNESS
TO PEAK MODULATION
USA MODEL 12-B
-16 -14 -12 -10 -8-6
-4-2
01
23
-18-20-22-24
-26-28
-30
-32
-34
-36
1.6125
100
8063
5040
3225201612108
6.35
43.2
2.5
2
dBm dBm
% MODULATION
PEAK = 0 dB
Fig. 9. Reading shows peak signal equal to 0 dB.
☛
Fig. 10. To read the meter inthis example, follow thisprocedure.
1 - Meter peak LED at 0 dB
2 - Note RANGE is HIGH
3 - Read HIGH scale for a 0 dB reading
RANGE FUNCTION
MODEL 1200
STEREO SUM/DIFF+20 - -10 -10 - -40HIGH LOW
dBv IN
+20
+18
+16
+14+12
+10
+8
+6
-2 -4
+4
+2
0 -6
-8
-10
/-10
/-12
/-14
/-40
/-16-18/
-20/
-22/
-24/
-28/
-30/
-32/ /-34
/-36
/-38
++
+RELATIVE LOUDNESS
TO PEAK MODULATION
USA MODEL 12-B
-16 -14 -12 -10 -8-6
-4-2
01
23
-18-20-22-24
-26-28
-30
-32
-34
-36
1.6125
100
8063
5040
3225201612108
6.35
43.2
2.5
2
dBm dBm
% MODULATION
-26/
1
3 2
9
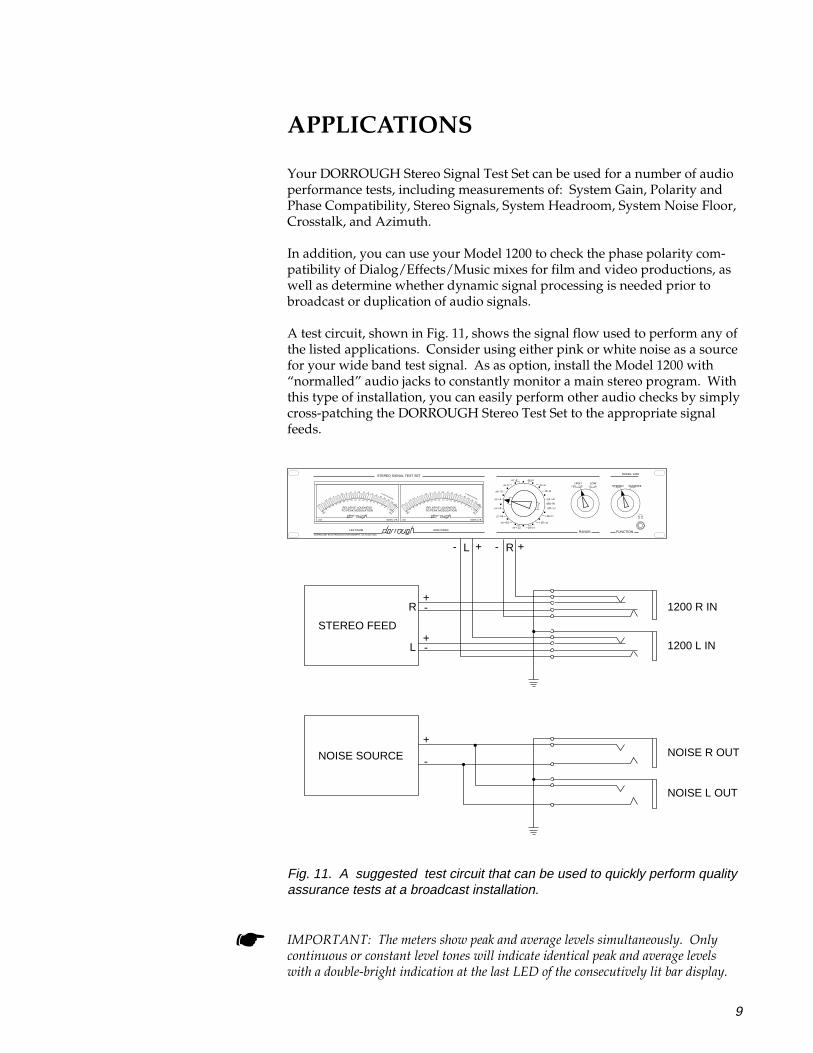
Your DORROUGH Stereo Signal Test Set can be used for a number of audioperformance tests, including measurements of: System Gain, Polarity andPhase Compatibility, Stereo Signals, System Headroom, System Noise Floor,Crosstalk, and Azimuth.
In addition, you can use your Model 1200 to check the phase polarity com-patibility of Dialog/Effects/Music mixes for film and video productions, aswell as determine whether dynamic signal processing is needed prior tobroadcast or duplication of audio signals.
A test circuit, shown in Fig. 11, shows the signal flow used to perform any ofthe listed applications. Consider using either pink or white noise as a sourcefor your wide band test signal. As as option, install the Model 1200 with“normalled” audio jacks to constantly monitor a main stereo program. Withthis type of installation, you can easily perform other audio checks by simplycross-patching the DORROUGH Stereo Test Set to the appropriate signalfeeds.
IMPORTANT: The meters show peak and average levels simultaneously. Onlycontinuous or constant level tones will indicate identical peak and average levelswith a double-bright indication at the last LED of the consecutively lit bar display.
APPLICATIONS
STEREO FEED
R
L
+-
LEFT/SUM RIGHT/DIFF
DORROUGH ELECTRONICS•CHATSWORTH, CA 91311•USA
STEREO SIGNAL TEST SET
RANGE FUNCTION
MODEL 1200
STEREO SUM/DIFF+20 - -10 -10 - -40HIGH LOW
dBv IN
+20
+18
+16
+14+12
+10
+8
+6
-2 -4
+4
+2
0 -6
-8
-10
/-10
/-12
/-14
/-40
/-16-18/
-20/
-22/
-24/
-26/
-28/
-30/
-32/ /-34
/-36
/-38
++
+RELATIVE LOUDNESS
TO PEAK MODULATION
USA MODEL 12-B
-16 -14 -12 -10 -8-6
-4-2
01
23
-18-20-22-24
-26-28
-30
-32
-34
-36
1.6125
100
8063
5040
3225201612108
6.35
43.2
2.5
2
dBm dBm
% MODULATION
++
+RELATIVE LOUDNESS
TO PEAK MODULATION
USA MODEL 12-B
-16 -14 -12 -10 -8-6
-4-2
01
23
-18-20-22-24
-26-28
-30
-32
-34
-36
1.6125
100
8063
5040
3225201612108
6.35
43.2
2.5
2
dBm dBm
% MODULATION
+-
RL + +--
NOISE SOURCE
+
-
1200 R IN
1200 L IN
NOISE R OUT
NOISE L OUT
Fig. 11. A suggested test circuit that can be used to quickly perform qualityassurance tests at a broadcast installation.
☛
10
Measuring System Gain
1. Feed a test signal (i.e., pink noise) at a standard line level to one orboth inputs of the device or system you wish to test.
2.. Adjust the gain of the device or system under test to its minimumsetting.
3. Connect or patch the output(s) of the device or system under test tothe inputs of the Model 1200.
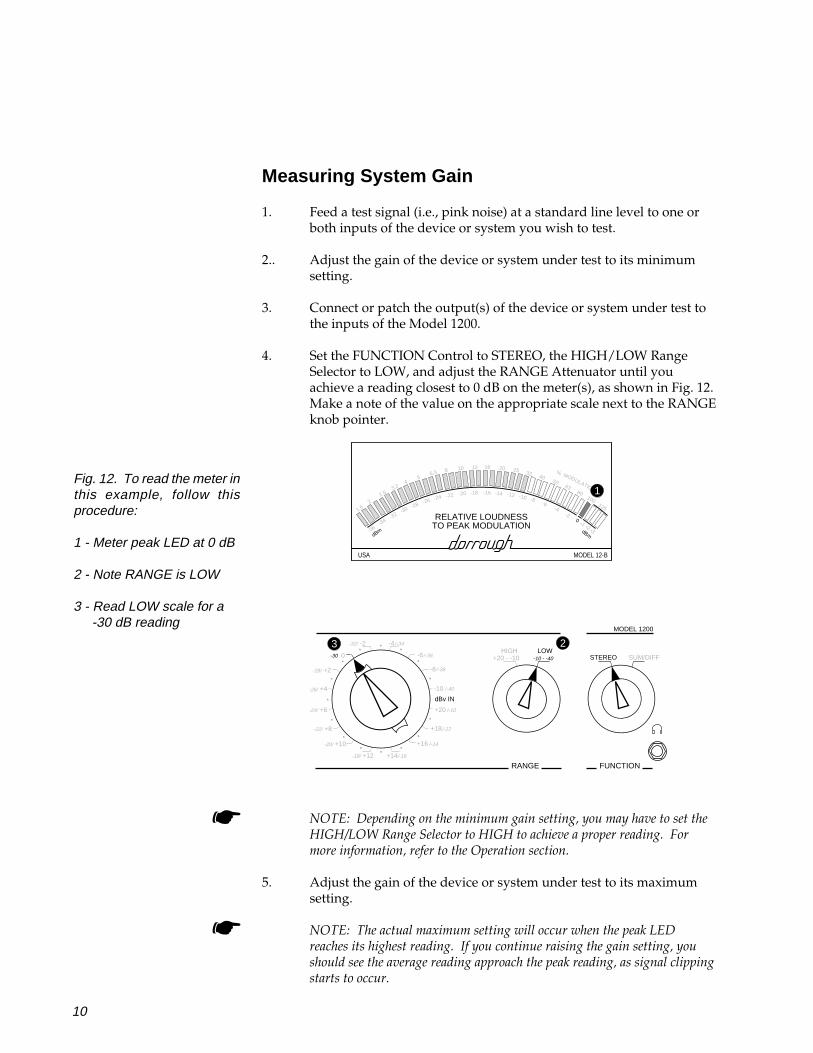
4. Set the FUNCTION Control to STEREO, the HIGH/LOW RangeSelector to LOW, and adjust the RANGE Attenuator until youachieve a reading closest to 0 dB on the meter(s), as shown in Fig. 12.Make a note of the value on the appropriate scale next to the RANGEknob pointer.
NOTE: Depending on the minimum gain setting, you may have to set theHIGH/LOW Range Selector to HIGH to achieve a proper reading. Formore information, refer to the Operation section.
5. Adjust the gain of the device or system under test to its maximumsetting.
NOTE: The actual maximum setting will occur when the peak LEDreaches its highest reading. If you continue raising the gain setting, youshould see the average reading approach the peak reading, as signal clippingstarts to occur.
RANGE FUNCTION
MODEL 1200
STEREO SUM/DIFF+20 - -10 -10 - -40HIGH LOW
dBv IN
+20
+18
+16
+14+12
+10
+8
+6
-2 -4
+4
+2
0 -6
-8
-10
/-10
/-12
/-14
/-40
/-16-18/
-20/
-22/
-24/
-28/
-30
-32/ /-34
/-36
/-38
++
+RELATIVE LOUDNESS
TO PEAK MODULATION
USA MODEL 12-B
-16 -14 -12 -10 -8-6
-4-2
01
23
-18-20-22-24
-26-28
-30
-32
-34
-36
1.6125
100
8063
5040
3225201612108
6.35
43.2
2.5
2
dBm dBm
% MODULATION
-26/
1
3 2
☛
☛
Fig. 12. To read the meter inthis example, follow thisprocedure:
1 - Meter peak LED at 0 dB
2 - Note RANGE is LOW
3 - Read LOW scale for a -30 dB reading

11
6. Rotate the RANGE Attenuator in the either direction until you get areading closest to 0 dB on the meter(s). Make a note of the value onthe appropriate scale next to the RANGE knob pointer.
NOTE: Depending on the amount of gain being introduced, you may haveto set the HIGH/LOW Range Selector to HIGH to achieve a proper reading.For more information, refer to the Operation section.
7. The system gain is the difference between the two values noted insteps 6 and 4.
Testing For L/R Polarity and Phase Compatibility
1. First, measure the system gain of both Left and Right channels of thedevice or system you wish to test. Use the method described inMeasuring System Gain Application.
If needed, adjust the individual channel of gain settings (of thedevice or system being tested) so that the Left and Right channelsexhibit equal gain structure.
NOTE: Make sure that any equalization settings added to each channel areset exactly the same or are in the flat or bypassed position.
2. Feed a known mono signal into both channels of the device orsystem being tested. Set the FUNCTION Control to SUM/DIFF, andadjust the RANGE Attenuator and HIGH/LOW Range Selector toeither setting until you achieve a reading closest to -6 dB on theLEFT/SUM Meter.
3. Set the FUNCTION Control to STEREO and then back to SUM/DIFF. Note the difference in readings on the LEFT/SUM meter aswell as the RIGHT/DIFF meter.
4. When SUM/DIFF is selected, two audio channels having the samepolarity and no phase problems will exhibit an +6 dB increase on theLEFT/SUM meter. In addition, the RIGHT/DIFF meter will showno reading, as shown in Fig. 13 (page 12).
If the meter readings are reversed, then one of the channels undertest has reversed polarity.
If there are readings on both meters, then the phase response of thedevice or system under test is not flat.
NOTE: Connect an oscilloscope to the Monitor Jack on rear panel toexamine the frequency response of each channel.
☛
☛
☛

12
++
+RELATIVE LOUDNESS
TO PEAK MODULATION
USA MODEL 12-B
-16 -14 -12 -10 -8-6
-4-2
01
23
-18-20-22-24
-26-28
-30
-32
-34
-36
1.6125
100
8063
5040
3225201612108
6.35
43.2
2.5
2
dBm dBm
% MODULATION
++
+RELATIVE LOUDNESS
TO PEAK MODULATION
USA MODEL 12-B
-16 -14 -12 -10 -8-6
-4-2
01
23
-18-20-22-24
-26-28
-30
-32
-34
-36
1.6125
100
8063
5040
3225201612108
6.35
43.2
2.5
2
dBm dBm
% MODULATION
LEFT RIGHT
++
+RELATIVE LOUDNESS
TO PEAK MODULATION
USA MODEL 12-B
-16 -14 -12 -10 -8-6
-4-2
01
23
-18-20-22-24
-26-28
-30
-32
-34
-36
1.6125
100
8063
5040
3225201612108
6.35
43.2
2.5
2
dBm dBm
% MODULATION
++
+RELATIVE LOUDNESS
TO PEAK MODULATION
USA MODEL 12-B
-16 -14 -12 -10 -8-6
-4-2
01
23
-18-20-22-24
-26-28
-30
-32
-34
-36
1.6125
100
8063
5040
3225201612108
6.35
43.2
2.5
2
dBm dBm
% MODULATION
SUM DIFF
Testing Stereo Signals
1. First, measure the system gain of both Left and Right channels of thedevice or system you wish to test. Use the method described inMeasuring System Gain Application.
If needed, adjust the individual gain settings so that the Left andRight channels exhibit equal gain structure.
2. Set the FUNCTION Control to SUM/DIFF, and adjust the RANGEAttenuator and HIGH/LOW Range Selector to either setting untilyou achieve a reading closest to 0 dB on the LEFT/SUM Meter.
(a) An example of a known wide-band mono signal displayed on STEREOmeters.
(b) An example of a known wide-band mono signal displayed in (a) abovewhen viewed as SUM/DIFF. A signal having the same polarity and no phaseproblems will exhibit a 6 dB increase on the SUM meter and no reading onthe DIFF meter.
Fig. 13. An example of meter readings with FUNCTION Control set toSTEREO (a) and SUM/DIFF (b).

13
++
+RELATIVE LOUDNESS
TO PEAK MODULATION
USA MODEL 12-B
-16 -14 -12 -10 -8-6
-4-2
01
23
-18-20-22-24
-26-28
-30
-32
-34
-36
1.6125
100
8063
5040
3225201612108
6.35
43.2
2.5
2
dBm dBm
% MODULATION
++
+RELATIVE LOUDNESS
TO PEAK MODULATION
USA MODEL 12-B
-16 -14 -12 -10 -8-6
-4-2
01
23
-18-20-22-24
-26-28
-30
-32
-34
-36
1.6125
100
8063
5040
3225201612108
6.35
43.2
2.5
2
dBm dBm
% MODULATION
SUM DIFF
3. A stereo signal will provide readings on both the LEFT/SUM andRIGHT/DIFF meters, as shown in Fig. 14. For proper stereo signals,the LEFT/SUM meter will show a higher reading than the RIGHT/DIFF meter. The amount of difference will depend on the amount ofcorrelated signals contained within the audio mix.If you observe a larger reading on the RIGHT/DIFF meter, check thestereo signals for an out-of-polarity condition, as discussed in theTesting for L/R Polarity and Phase Compatibility Application.
NOTE: If the audio program is highly correlated stereo, the RIGHT/DIFFmay only show an occasional reading, or the portion of the audio programyou are monitoring may actually contain substantial mono information (i.e.dialog). Use the Monitor Jack on the rear panel to feed an oscilloscope forverification of program content.
Testing System Headroom
1. Feed a test signal (i.e., pink noise) at a standard line level to one orboth inputs of the device or system you wish to test.
2.. Adjust the gain of the device or system under test to its normaloperation setting.
3. Connect or patch the output(s) of the device or system under test tothe inputs of the Model 1200.
4. Set the FUNCTION Control to STEREO, the HIGH/LOW RangeSelector to HIGH, and adjust the RANGE Attenuator until you get areading closest to 0 dB on the meter(s), as shown in Fig. 15 (page 14).Make a note of the value on the appropriate scale next to the RANGEknob pointer.
NOTE: Depending on the gain structure of the device or system under test,you may have to set the HIGH/LOW Range Selector to LOW to achieve aproper reading. For more information, refer to the Operation section.
Fig. 14. An example of a SUM/DIFF reading for a typical stereo signal.
☛
☛

14
RANGE FUNCTION
MODEL 1200
STEREO SUM/DIFF+20 - -10 -10 - -40HIGH LOW
dBv IN
+20
+18
+16
+14+12
+10
+8
+6
-2 -4
+4
+2
0 -6
-8
-10
/-10
/-12
/-14
/-40
/-16-18/
-20/
-22/
-24/
-28/
-30 /
-32/ /-34
/-36
/-38
++
+RELATIVE LOUDNESS
TO PEAK MODULATION
USA MODEL 12-B
-16 -14 -12 -10 -8-6
-4-2
01
23
-18-20-22-24
-26-28
-30
-32
-34
-36
1.6125
100
8063
5040
3225201612108
6.35
43.2
2.5
2
dBm dBm
% MODULATION
-26/
1
3 2
5. Adjust the gain of the device or system under test to its maximumsetting.
6. Rotate the RANGE Attenuator switch clockwise and HIGH/LOWRange Selector to either setting until you achieve a reading closest to0 dB on the meter(s).
7. While observing the meters, slowly lower the gain of the device orsystem under test. Observe that the average reading will start todrop lower as you lower the gain. Continue lowering the gain untilyou see a corresponding drop of the peak LED on the meter, asshown in Fig. 16 (page 15).
Stop adjusting the gain, since this is where signal clipping starts tooccur and useable system headroom is measured. Readjust theRANGE Attenuator to once again get a reading closest to 0 dB on themeter. Make a note of the value on the appropriate scale next to theRANGE knob pointer.
8. The system headroom is the difference between the two values notedin steps 7 and 4.
Fig. 15. To read the meter inthis example, follow thisprocedure:
1 - Meter peak LED at 0 dB
2 - Note RANGE is HIGH
3 - Read HIGH scale for a 0 dB reading

15
++
+RELATIVE LOUDNESS
TO PEAK MODULATION
USA MODEL 12-B
-16 -14 -12 -10 -8-6
-4-2
01
23
-18-20-22-24
-26-28
-30
-32
-34
-36
1.6125
100
8063
5040
3225201612108
6.35
43.2
2.5
2
dBm dBm
% MODULATION
AVERAGE = -10 dB
PEAK = -1 dB
++
+RELATIVE LOUDNESS
TO PEAK MODULATION
USA MODEL 12-B
-16 -14 -12 -10 -8-6
-4-2
01
23
-18-20-22-24
-26-28
-30
-32
-34
-36
1.6125
100
8063
5040
3225201612108
6.35
43.2
2.5
2
dBm dBm
% MODULATION
AVERAGE = -2 dB
PEAK = 0 dB
(a) In this example, gain is set to maximum and results in an averagereading of -2 dB and a peak reading at 0 dB. This type of indication showsthe system or device is producing distortion products from signal clipping, asthe difference between peak and average readings is only 2 dB.
(b) When the gain is lowered from (a) above, note that the average readingdrops dramatically. When the peak reading drops 1 dB, the true, undistortedheadroom gain setting is achieved.
Fig. 16. An example of maximum gain set for testing of system headroom.
Testing System Noise Floor
1. Feed a test signal (i.e., pink noise) at a standard line level to one orboth inputs of the device or system you wish to test.
2.. Adjust the gain of the device or system under test to its normaloperation setting.
3. Connect or patch the output(s) of the device or system under test tothe inputs of the Model 1200.

16
4. Set the FUNCTION Control to STEREO, the HIGH/LOW RangeSelector to HIGH, and adjust the RANGE Attenuator until you get areading closest to 0 dB on the meter(s), as shown in Fig. 17. Make anote of the value on the appropriate scale next to the RANGE knobpointer.
NOTE: Depending on the gain structure of the device or system under test,you may have to set the HIGH/LOW Range Selector to LOW to achieve aproper reading. For more information, refer to the Operation section.
5. Turn off the test signal, set the HIGH/LOW Range Selector to LOWand adjust the RANGE Attenuator until you get a reading closest to0 dB on the meter(s), as shown in Fig. 18 (page 17). Make a note ofthe value on the appropriate scale next to the RANGE knob pointer.
6. The system noise floor is the difference between the two valuesnoted in steps 5 and 4. Generally, this value is specified at a dBvalue below operating level (i.e., -36 dB below operating level).
NOTE: If a 0 dB reading cannot be obtained with the HIGH/LOW RangeSelector set at LOW and the RANGE Attenuator set at-40 dB, note the reading on the meter and add the value to -40 db, as shownin Fig. 18. The system noise floor is the difference between this value andthe one obtained in step 4.
RANGE FUNCTION
MODEL 1200
STEREO SUM/DIFF+20 - -10 -10 - -40HIGH LOW
dBv IN
+20
+18
+16
+14+12
+10
+8
+6
-2 -4
+4
+2
0 -6
-8
-10
/-10
/-12
/-14
/-40
/-16-18/
-20/
-22/
-24/
-28/
-30/
-32/ /-34
/-36
/-38
++
+RELATIVE LOUDNESS
TO PEAK MODULATION
USA MODEL 12-B
-16 -14 -12 -10 -8-6
-4-2
01
23
-18-20-22-24
-26-28
-30
-32
-34
-36
1.6125
100
8063
5040
3225201612108
6.35
43.2
2.5
2
dBm dBm
% MODULATION
-26/
1
3 2
Fig. 17. To read the meter inthis example, follow thisprocedure:
1 - Meter peak LED at 0 dB
2 - Note RANGE is HIGH
3 - Read HIGH scale for a 0 dB reading
☛
☛

17
Testing For Crosstalk
1. Feed a test signal (i.e., pink noise) at a standard line level to bothchannels of the device or system you wish to test.
2.. Adjust the gain of the device or system under test to its normaloperation setting.
3. Connect or patch the channel output of the device or system undertest to the inputs of the Model 1200.
4. Set the FUNCTION Control to STEREO, the HIGH/LOW RangeSelector to HIGH, and adjust the RANGE Attenuator until you get areading closest to 0 dB on the meter(s), as shown in Fig. 19 (page 18).Make a note of the value on the appropriate scale next to the RANGEknob pointer.
NOTE: Depending on the gain structure of the device or system under test,you may have to set the HIGH/LOW Range Selector to LOW to achieve aproper reading. For more information, refer to the Operation section.
5. Disconnect the RIGHT channel signal feed to the device or systembeing tested. Disconnect the LEFT output of the device or systembeing tested from the LEFT input of Model 1200.
Fig. 18. To read the meter inthis example, follow thisprocedure:
1 - Meter peak LED at -30 dB
2 - Note RANGE is LOW
3 - Read LOW scale at -40 dB and add value from (1) for a total reading of -70 dB.
☛
RANGE FUNCTION
MODEL 1200
STEREO SUM/DIFF+20 - -10 -10 - -40HIGH LOW
dBv IN
+20
+18
+16
+14+12
+10
+8
+6
-2 -4
+4
+2
0 -6
-8
-10
/-10
/-12
/-14
-40
/-16-18/
-20/
-22/
-24/
-28/
-30/
-32/ /-34
/-36
/-38
++
+RELATIVE LOUDNESS
TO PEAK MODULATION
USA MODEL 12-B
-16 -14 -12 -10 -8-6
-4-2
01
23
-18-20-22-24
-26-28
-30
-32
-34
-36
1.6125
100
8063
5040
3225201612108
6.35
43.2
2.5
2
dBm dBm
% MODULATION
-26/
1
3
2

18
NOTE: This action is neccessary to avoid overloading the input circuits ofthe Model 1200 LEFT input channel as you perform the following steps.
6. Set the HIGH/LOW Range Selector to LOW and adjust the RANGEAttenuator until you get a reading closest to 0 dB on the RIGHTmeter, as shown in Fig. 20 (page 19). Make a note of the value on theappropriate scale next to the RANGE knob pointer.
7. LEFT Channel Crosstalk is the amount of signal crossing from theactive LEFT channel circuitry into the inactive RIGHT channel, andis measured as the difference in values noted in steps 6 and 4. Thisvalue is specified at a dB value (i.e. -30 dB) below operating level.
NOTE: If a 0 dB reading cannot be obtained with the HIGH/LOW RangeSelector set at LOW and the RANGE Attenuator set at -40 dB, note thereading on the meter and add the value to -40 db, as shown earlier in Fig.18. Crosstalk is then the difference between this value and the one obtainedin step 4.
8. To measure crosstalk in the RIGHT channel, repeat steps 1 through 6,except for a connection reversal in step 5.
NOTE: In step 5, disconnect the LEFT channel signal feed to the device orsystem under test. Then disconnect the RIGHT output of the device orsystem being tested from the RIGHT input of Model 1200.
RANGE FUNCTION
MODEL 1200
STEREO SUM/DIFF+20 - -10 -10 - -40HIGH LOW
dBv IN
+20
+18
+16
+14+12
+10
+8
+6
-2 -4
+4
+2
0 -6
-8
-10
/-10
/-12
/-14
/-40
/-16-18/
-20/
-22/
-24/
-28/
-30/
-32/ /-34
/-36
/-38
++
+RELATIVE LOUDNESS
TO PEAK MODULATION
USA MODEL 12-B
-16 -14 -12 -10 -8-6
-4-2
01
23
-18-20-22-24
-26-28
-30
-32
-34
-36
1.6125
100
8063
5040
3225201612108
6.35
43.2
2.5
2
dBm dBm
% MODULATION
-26/
1
3 2
Fig. 19. To read the meter inthis example, follow thisprocedure:
1 - Meter peak LED at 0 dB
2 - Note RANGE is HIGH
3 - Read HIGH scale for a 0 dB reading
☛
☛
☛

19
RANGE FUNCTION
MODEL 1200
STEREO SUM/DIFF+20 - -10 -10 - -40HIGH LOW
dBv IN
+20
+18
+16
+14+12
+10
+8
+6
-2 -4
+4
+2
0 -6
-8
-10
/-10
/-12
/-14
/-40
/-16-18/
-20/
-22/
-24/
-28/
-30
-32/ /-34
/-36
/-38
++
+RELATIVE LOUDNESS
TO PEAK MODULATION
USA MODEL 12-B
-16 -14 -12 -10 -8-6
-4-2
01
23
-18-20-22-24
-26-28
-30
-32
-34
-36
1.6125
100
8063
5040
3225201612108
6.35
43.2
2.5
2
dBm dBm
% MODULATION
-26/
1
3 2
Azimuth Adjustment
Playback Azimuth
1. After performing a playback alignment of the analog tape recorderunder test, locate a mid frequency tone (i.e. 1 kHz) on a playbackalignment tape. Make sure the analog tape recorder is in the repro-duce (tape) mode.
2. Connect or patch two channel outputs of the analog tape recorderunder test to the inputs of the Model 1200.
3. Set the FUNCTION Control to SUM/DIFF, the HIGH/LOW RangeSelector to HIGH, and adjust the RANGE Attenuator to-14 dB, asshown in Fig. 21 (page 20).
4. Place the analog tape recorder into the PLAY mode, and observe theLEFT/SUM meter as you adjust the reproduce head azimuth.
Fig. 20. To read the meter inthis example, follow thisprocedure:
1 - Meter peak LED at 0 dB
2 - Note RANGE is LOW
3 - Read LOW scale for a -30 dB reading

20
5. Continue the adjustment until you see a peak indication on theLEFT/SUM meter. At this point, observe the SUM/DIFF meter andadjust the reproduce azimuth until you see a minimum meterindication. For precise alignment, rotate the RANGE Attenuatorclockwise, to read lower DIFF signals, and move the HIGH/LOWRange Selector to the LOW position, as shown in Fig. 22 (page 21).
6. Repeat steps 4 and 5 using a 8 kHz tone and then a 16 kHz tonelocated on the playback alignment tape.
NOTE: This measurement will provide a minimal phase error reading forany two selected channels. For multi-track recorders (i.e., 8, 16, 24), look atthe phase error response for several different channel pairs (i.e., 1 and 8, or12 and 24) to achieve the best compromise in azimuth adjustment.
Record Azimuth
1. Feed a known mono test signal at a standard line level to twoparalleled channel inputs of the analog tape recorder you wish totest. Make sure the analog tape recorder is in the reproduce (tape)mode.
NOTE: Playback azimuth must be correctly set, since the followingprocedure relies on an accurate playback reference. If you are unsure of theplayback azimuth setting, perform the Playback Azimuth procedure first.
☛
☛
Fig. 21. To read the SUMmeter in this example, followthis procedure:
1 - Meter peakLED at -14 dB
2 - Note RANGE is HIGH
3 - Read HIGH scale at +18 dB and add value from (1) for a total reading of +4 dB.
RANGE FUNCTION
MODEL 1200
STEREO SUM/DIFF+20 - -10 -10 - -40HIGH LOW
dBv IN
+20
+18
+16
+14+12
+10
+8
+6
-2 -4
+4
+2
0 -6
-8
-10
/-10
/-12
/-14
/-40
/-16-18/
-20/
-22/
-24/
-28/
-30/
-32/ /-34
/-36
/-38
++
+RELATIVE LOUDNESS
TO PEAK MODULATION
USA MODEL 12-B
-16 -14 -12 -10 -8-6
-4-2
01
23
-18-20-22-24
-26-28
-30
-32
-34
-36
1.6125
100
8063
5040
3225201612108
6.35
43.2
2.5
2
dBm dBm
% MODULATION
-26/
1
3
2
SUM

21
2. Use a blank, degaussed tape to record the test signal and adjust therecord gain of the analog tape recorder for a normal operationsetting. Adjust the individual channel record equalizers to achieveequal gain settings.
NOTE: Refer to your tape recorder owner’s manual for specific informationon test tone levels and frequencies used during a record alignment.
3. Connect or patch the corresponding outputs of the analog taperecorder under test to the inputs of the Model 1200. Set Model 1200Controls to those listed in step 3 of Playback Azimuth adjustment.
4. Start and place the analog tape recorder into RECORD, and observethe LEFT/SUM meter as you adjust record head azimuth.
5. Continue the adjustment until you see a peak indication on theLEFT/SUM meter. At this point, observe the SUM/DIFF meter andadjust the record azimuth until you see a minimum meter indication.For precise alignment, rotate the RANGE Attenuator clockwise toread lower DIFF signals and move the HIGH/LOW Range Selectorto the LOW position, as shown in Fig. 22.
NOTE: This measurement will provide a minimal phase error reading forthe two selected channels. For multi-track recorders (i.e., 8, 16, 24), look atthe phase error response for several different channel pairs (i.e., 1 and 8, or12 and 24) to achieve the best compromise in azimuth adjustment.
RANGE FUNCTION
MODEL 1200
STEREO SUM/DIFF+20 - -10 -10 - -40HIGH LOW
dBv IN
+20
+18
+16
+14+12
+10
+8
+6
-2 -4
+4
+2
0 -6
-8
-10
/-10
/-12
/-14
/-40
/-16-18/
-20/
-22/
-24/
-28/
-30/
-32/ /-34
/-36
/-38
++
+RELATIVE LOUDNESS
TO PEAK MODULATION
USA MODEL 12-B
-16 -14 -12 -10 -8-6
-4-2
01
23
-18-20-22-24
-26-28
-30
-32
-34
-36
1.6125
100
8063
5040
3225201612108
6.35
43.2
2.5
2
dBm dBm
% MODULATION
-26/
1
3
2
DIFF
Fig. 22. To read the DIFFmeter in this example, followthis procedure:
1 - Meter peak LED at -14 dB
2 - Note RANGE is LOW
3 - Read LOW scale at -40 dB and add value from (1) for a totalreading of -54 dB
☛
☛

22
Phase Polarity Compatibilty of Music/Dialog/Effects
In general, most television broadcast networks require mono dialog that iscenter-panned in an overall mix (although left/right panning may be usedfor effect). Effects are either mono panned for left/right perspective, or aretrue stereo recordings done with a M-S microphone. Music is almost alwaysstereo and is made of mono panned instruments, synthetic stereo processing(i..e. digital reverb), and true stereo pickups (i.e. M-S microphone on anacoustic piano or vocal chorus).
Mono compatibility problems can occur when these elements are combinedinto a stereo mix. With the DORROUGH Stereo Test Set, you can check thephase polarity compatibility prior to broadcast or duplication of the individ-ual elements or combinations of dialog, effects, and music during the mixingprocess.
By using a combination of the techniques discussed earlier in Applicationson Testing For L/R Polarity and Phase Compatibility and Testing StereoSignals, you also can quickly verify whether the sound elements will sumcorrectly in mono during a stereo mix.
For example, use the Model 1200 to set levels of panned effects in a stereomix. Leave the FUNCTION Control in the SUM/DIFF position and observethe mono sum as you build your mix. While adjusting the level of a center-panned effect, observe the SUM/DIFF reading to see the mono compatibleresult. Compare the SUM/DIFF reading of this effect against those pannedto extreme right and left positions. A large discrepancy in meter readingsmeans the center-panned effect will be louder than the others in mono.
Determining the Need for Dynamic Signal Processing
Use the Model 1200 to measure peak signal excursions of audio material thatis going to be broadcast or duplicated. If the meters indicate peak levelsabove your chosen reference (i.e. +4 dB = 100% modulation), you know thatcompression and/or limiting is required.
Once you have inserted a compressor/limiter in the audio chain, observe theModel 1200 meters as you adjust the compression threshold, ratio, attack/release, and gain controls.
With the DORROUGH Stereo Test Set, you can satisfy the broadcast orduplication technical requirements, yet achieve better-sounding audio withminimal use of the right combination of compressor/limiter controls.
For example, use the Model 1200 to observe the signal action of yourstation’s STL compressor. Under ideal conditions, you should see a decreasein the range between the peak and average readings when the compressor ison-line. If you observe an increase in this range, then the compressor attack/release controls need to be adjusted for a faster response time. If an adjust-ment does not improve this condition, suspect an equipment malfunction orpoor design.

23
The circuits that make up the DORROUGH Stereo Signal Test Set, Model1200, are grouped onto two circuit boards and one sub-assembly: an InputMatrix Board, a Power Supply Board, and a dual Model 12-B Panel MeterSub-Assembly, as shown in Fig. 23.
The first part of this section is devoted to a description of the Model 1200circuits, while the second half details the theory behind the DORROUGHModel 12-B panel meter circuits.
Model 1200 Circuits
A block diagram, shown in Fig. 24 (page 24), shows the overall signal flowfor the Model 1200. Refer to this diagram, as well as the circuit schematic(back of the manual), throughout the following discussion.
The inputs feed left and right servo-balanced differential amplifiers (U1 andU 26) that each have a preset gain of +30 dB and an input impedance of 40kOhms. The HIGH/LOW Range Selector (front panel) reduces the gain tounity whenever LOW is selected.
The outputs of the differential amplifiers are routed to the FUNCTIONControl (front control), as well as a pair of summing amplifiers (U51). Theseamplifiers provide sum and difference results that also feed the FUNCTIONControl.
CIRCUIT THEORY
Fig. 23. Simplified top view of Model 1200 internal chassis layout.
Power Supply Board
Dual 12-B Meter Sub-Assembly Input Matrix Board
VR1 VR26VR76 VR86 VR77
J6
LOW Meter Cal
L R
{
L R L R
{ {
Monitor (rear)
(front)
VR13
VR14 VR46 VR44 VR48 VR49
VR13
VR14 VR46 VR44 VR48 VR49
L METER R METER
VR87

24
Fig. 24. Block diagram of DORROUGH StereoSignal Test Set, Model 1200.
The output of the FUNCTION Control feeds the selected signals (L/R orSUM/DIFF) to the RANGE Attenuator (front panel). This control is aprecision 30 dB attenuator, having a -1 dB step for each clockwise indent.
The output of the RANGE Attenuator is routed to the Model 12-B PanelMeter Sub-Assembly and two pairs of Monitor amplifiers U76 and U77)whose outputs appear on the front and rear panels. The front panel Monitoroutput is fed by a 1 W amplifier (U77) and is sufficient for driving head-phones or a set of small speakers. The rear panel Monitor output shouldonly be used for test equipment monitoring.
VR76 (L or SUM) and VR86 (R or DIFF) provide level adjustment of amplifi-ers outputs at the rear panel jack. VR77 (L or SUM) and VR87 (R or DIFF)provide level adjustment of the amplifier outputs at the front panel jack.
The Power Supply Board provides the following voltages: regulated bipolar15 VDC, unregulated 3.5 VDC, and 4 VAC. The regulated bipolar 15 VDC isused to power the processing circuits on the Input Matrix Board and the dualModel 12-B Meter Sub assembly.
The unregulated 3.5 VDC is used to power the bargraph LED’s on the Model12-B meters. The 4 VAC powers the front panel meter illumination lamps.
POWERSUPPLY
+15 VDC-15 VDC
+3.5 VDC
4 VAC
meter LED's
circuits
meterlamps
1
4
2
3
L THRU
XLR3-F
1
4
2
3
XLR3-M
L INPUT
1
4
2
3
R THRU
XLR3-F
1
4
2
3
XLR3-M
R INPUT
R INPUT
L INPUT+
-
+
-
SUM
DIFF
30 dB GAIN
HIGH
LOW
RANGE Control
Input Matrix BoardFUNCTION Control
SUM
DIFF
R
L
RANGE Attenuator Input Matrix Board
++
+RELATIVE LOUDNESS
TO PEAK MODULATION
USA MODEL 12-B
-16 -14 -12 -10 -8-6
-4-2
01
23
-18-20-22-24
-26-28
-30
-32
-34
-36
1.6125
100
8063
5040
3225201612108
6.35
43.2
2.5
2
dBm dBm
% MODULATION
++
+RELATIVE LOUDNESS
TO PEAK MODULATION
USA MODEL 12-B
-16 -14 -12 -10 -8-6
-4-2
01
23
-18-20-22-24
-26-28
-30
-32
-34
-36
1.6125
100
8063
5040
3225201612108
6.35
43.2
2.5
2
dBm dBm
% MODULATION
LEFT/SUM
RIGHT/DIFF
(Front)
MONITORL/R S/D
(Rear)
+3.5 VDC
(L/R S/D)

25
Model 12-B Meter Circuits
The circuits that make up the DORROUGH Relative Loudness to PeakModulation meter) are grouped onto two circuit boards: an Input SignalProcessing Board, and a Bar and Peak Driver Circuit Board. Power issupplied by the Power Supply Board. A block diagram, shown in Fig. 25,discloses the circuit elements and connections in a simplified form. Refer tothis diagram, as well as the circuit schematics (located at the end of thismanual), throughout the following discussion.
The input is fed into the left and right differential amplifiers. The differentialinputs are configured so that the input impedance is 20K, for balanced inputsand 10K for unbalanced inputs (negative terminal is grounded for unbal-anced operation).
The left input level is controlled by R-13 and the right input by R-14. Theoutput of these two controls are fed to a summing amplifier. The feedbackresistor R-18 controls the input sensitivity of the instrument. As shipped,the value of R-18 is 20K which provides an input sensitivity of -18 dBm.Changing the value of R-18 to 100K increases the sensitivity to -30 dBm.
The output of the summing amplifier feeds a precision rectifier. The outputof the precision rectifier feeds a split to PEAK and PERSISTENCE circuits.
Since the desired display is to be logarithmic, the signals are fed to corre-sponding “linear/logarithmic” converters. The outputs of these convertersfeed the display drivers. The driver for the PEAK display is configured as adot, while the driver for the PERSISTENCE display is configured as abargraph.
Each of the 40 LEDs derives an input from both of the drivers. A steady statesine-wave will illuminate a bargraph at a given amplitude, with the last-displayed LED brighter than the remainder. This gives an indication that theamplitude of the PERSISTENCE and the amplitude of the PEAK are equal,showing proper alignment of the instrument.
Fig. 25. Block diagram of Model 12-B meter.
DIFFERENTIAL AMPLIFIER
DIFFERENTIAL AMPLIFIER
REFERENCEGENERATOR
PEAKDETECTORAND HOLD LIMITER
FILTER
LINEARLOGARITHMIC CONVERTOR
LINEARLOGARITHMIC CONVERTOR
DOT LEDDRIVER
BAR GRAPH LEDDRIVER
LEDARRAY
SUMMING AMPLIFIER
PRECISIONRECTIFIER
LEFT
RIGHT

26
To occasionally check the accuracy of your DORROUGH Stereo Signal TestSet, perform the Field Alignment listed in this section.
IMPORTANT: The following alignment assumes the Model 12-B meters arereading accurately. Although the meters are designed for exceptionallystable performance, you may want to satisfy your curiosity or verify per-formance after a repair has been made. In that case, perform the Model 12-BAlignment Procedure first. Once you are satisfied that the meters arereading correctly, then proceed to the Model 1200 Alignment Procedure.
Model 1200 Alignment Procedure
NOTE: The designators listed in the following procedure refer to parts contained ona single meter p.c. board, and therefore apply to the alignment of either the Left orRight channel.
Refer to the schematic, Fig. 23, and Fig. 24 for circuit board part locations asyou perform the following instructions.
1. Connect a 1 kHz sinusodial source at 0 dB to the Left terminal orXLR on the rear panel.
2. Set the FUNCTION Control to STEREO, the HIGH/LOW RANGESelector to HIGH, and the RANGE Attenuator to 0 dB.
3. Observe the left meter and verify a 0 dB indication. If the meter isnot reading 0 dB, adjust VR-13 on the Left meter signal board until 0dB is achieved.
4. Move the test signal to the Right terminal or XLR and repeat step 3for the Right meter.
5. Lower the test signal to -30 dB, set the HIGH/LOW RANGE Selectorto LOW and position the RANGE Attenuator to -30 dB.
6. Observe the Right meter and verify a 0 dB indication. If the meter isnot reading 0 dB, adjust VR-26 on the Input Matrix Board until 0 dBis achieved.
7. Move the test signal back to the Left terminal or XLR. Observe theLeft meter and verify a 0 dB indication. If the meter is not reading 0dB, adjust VR 1 on the Input Matrix Board until 0 dB is achieved.
FIELD ALIGNMENT
☛
❋ ❋ ❋
27
Model 12-B Alignment Procedure
All adjustments for the alignment of the LED display are located on the dualModel 12-B Panel Meter Sub-Assembly.
NOTE: The designators listed in the following procedure refer to parts contained ona single meter p.c. board, and therefore apply to the alignment of either the Left orRight meter.
Refer to the schematic, Fig. 23, and Fig. 24 for circuit board part locations asyou perform the following instructions.
Left Meter Alignment
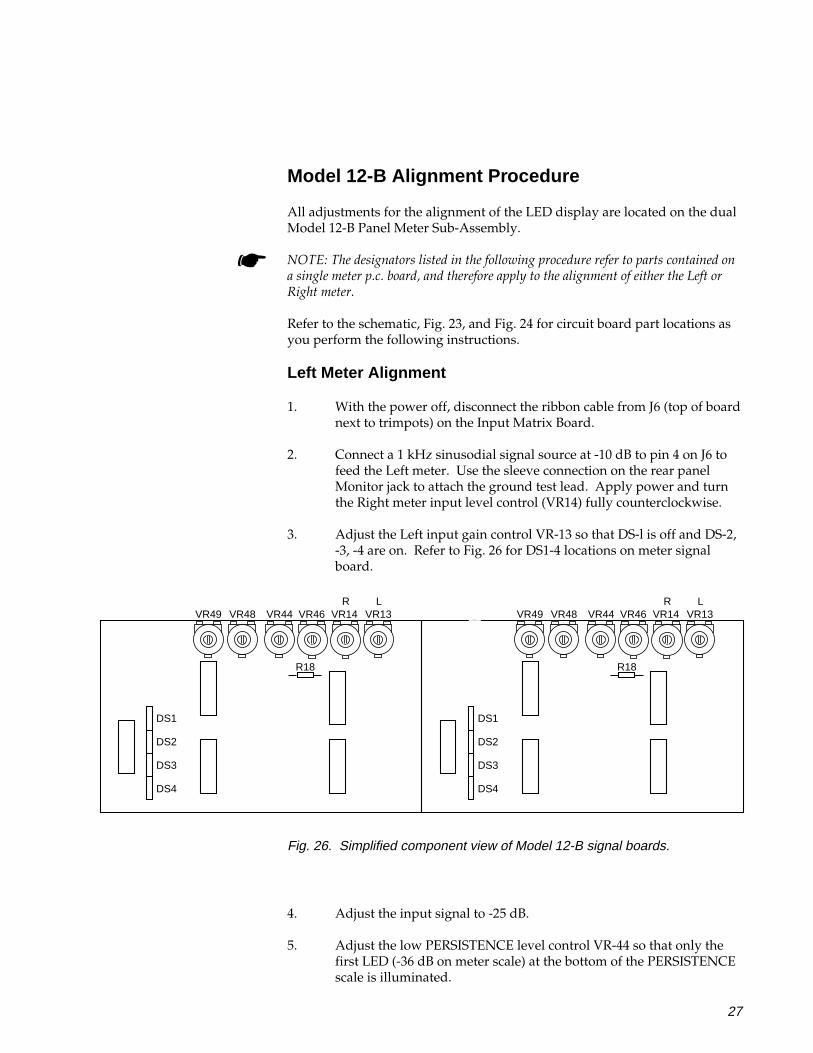
1. With the power off, disconnect the ribbon cable from J6 (top of boardnext to trimpots) on the Input Matrix Board.
2. Connect a 1 kHz sinusodial signal source at -10 dB to pin 4 on J6 tofeed the Left meter. Use the sleeve connection on the rear panelMonitor jack to attach the ground test lead. Apply power and turnthe Right meter input level control (VR14) fully counterclockwise.
3. Adjust the Left input gain control VR-13 so that DS-l is off and DS-2,-3, -4 are on. Refer to Fig. 26 for DS1-4 locations on meter signalboard.
4. Adjust the input signal to -25 dB.
5. Adjust the low PERSISTENCE level control VR-44 so that only thefirst LED (-36 dB on meter scale) at the bottom of the PERSISTENCEscale is illuminated.
DS1
DS2
DS3
DS4
R18
VR49 VR48 VR44 VR46 VR14 VR13R L
DS1
DS2
DS3
DS4
R18
VR49 VR48 VR44 VR46 VR14 VR13R L
Fig. 26. Simplified component view of Model 12-B signal boards.
☛
28
6. Adjust the low PEAK level control VR-46 so only the first LED (-36dB on meter scale) at the bottom of the PERSISTENCE scale bright-ens.
NOTE: This indicates that both the PEAK and the PERSISTENCE driversare providing current to this LED.
7. Change the input signal to +5 dB (a 30 dB increase).
8. Adjust the high PERSISTENCE level control VR-48 so that thebargraph illuminates LEDs up to and including the -6 dB LED.
9. Adjust the high PEAK level control VR-49 until the -6 dB LEDbrightens.
NOTE: This indicates that both the PEAK and the PERSISTENCE driversare both providing current to this LED.
10. Increase input signal to +14 dB and observe that the +3 dB LEDilluminates.
NOTE: The +3 dB LED should indicate drive from both PEAK andPERSISTENCE drivers.
11. Decrease input signal to +13 dB; observe that the +3 dB LED turnsoff.
12. Decrease input signal to +4 dB and adjust VR-13 for -11 dB on thescale.
13. Then, feed input signal of +4 dB to Right input terminals, and adjustVR-14 for -11 dB on the scale. This duplicates the factory settings.
Right Meter Alignment
14. Move the 1 kHz sinusodial signal source at -10 dB to pin 6 on J6 tofeed the Right meter. Turn the Left meter input level control (VR14)fully counterclockwise.
15. Repeat steps 3 through 13 for the Right meter.
☛
☛
☛


![Lecture 8 Active stereo& - Stanford UniversitySilvio Savarese Lecture 7 - 12-Feb-18 Lecture 8 Active stereo& Volumetric stereo Reading: [Szelisky] Chapter 11 “Multi-view stereo”](https://img.dokumen.tips/doc/110x75/5f0f7f2f7e708231d444745e/lecture-8-active-stereo-stanford-university-silvio-savarese-lecture-7-12-feb-18.jpg)