Embed Size (px)
Citation preview

1 of 28 The National Strategies ⏐ Secondary Secondary Framework in Science, 1.2 How science works – Practical and enquiry skills
1.2 How science works – Practical and enquiry skills
1.2a Using investigative approaches: planning an approach Year Yearly learning
objectives Amplification – pupils could learn to Strategies for progression – using HSW to
deliver content Rich questions
7 describe an appropriate approach to answer a scientific question using a limited range of information and making relevant observations or measurements
recognise characteristics of a question that can be answered scientifically, e.g. identify questions that don’t depend on opinions
decide on appropriate observations or measurements for an investigation, e.g. agree how often to measure temperature and appearance of a material whose change of state is being investigated
recognise the role of different approaches to the gathering of data in answering questions, e.g. explore the advantages and disadvantages of using surveys, fair tests, extended observations, ‘pattern seeking’ ( for living things where it is less easy to control all variables), research and reference, classification, testing someone else’s ideas.
recognise that not all questions can be answered by a fair test, e.g. identify that not all variables can be controlled in investigations involving living organisms
Explore and evaluate different approaches to finding the answer to a question, e.g. survey, fair testing, observation, exploration, research.
Model how to develop a question into a scientific question, i.e. one that is testable.
Discuss with pupils how the question being investigated can be made clearer, i.e. naming the independent and dependent variables in the question, and those variables to control.
Help pupils phrase questions and predictions using graph axes, e.g. present them with a graph and show them how to use the titles of each axis in a question or prediction.
Model how to use science planning-posters to scaffold planning and include the range of variables.
Create opportunities for pupils to compare good and not-so-good planning examples to agree a checklist of features.
Model for pupils how to decide on the number of observations or measurements needed.
Create opportunities for pupils to explore the purpose of different types of scientific equipment.
Model a less successful approach to plan an investigation and ask pupils to criticise it constructively.
How thick is a sheet of tracing paper?
Why do I need to plan?
Aren’t scientists supposed to ‘just find things out’?
Can scientists find everything out?
Does the equipment I use make a difference to the outcome?
Does having more data make an investigation better?
Do I need sophisticated equipment to be a scientist?
Are data always numbers?
Is a test tube the key element of success in an investigation?
00215-2009PDF-EN-01 © Crown copyright 2009

2 of 28 The National Strategies ⏐ Secondary Secondary Framework in Science, 1.2 How science works – Practical and enquiry skills
Year Yearly learning objectives
Amplification – pupils could learn to Strategies for progression – using HSW to deliver content
Rich questions
Make sure that pupils know that ‘fair test’ is the name for an investigation in which all the independent and dependent variables are identified and all other variables are controlled.
Emphasise the importance of preliminary work to ‘get a feel’ for what will happen, the range of the independent variable, sensible values for the fixed variables and how long might be needed.
Further activities to support these strategies can be found in Mini-booster 6: Progression to level 6 and beyond:
Understanding variables
8 describe an appropriate approach to answer a scientific question using sources of evidence and, where appropriate, making relevant observations or measurements using appropriate apparatus
compare alternative approaches to answer a scientific question, identify different ways to answer the question, e.g. ‘how do metals oxidise?’
consider what is already known before planning the investigation, e.g. highlight key pieces of information from a small range provided
make sensible decisions about the choice of apparatus to produce useful data, e.g. whether to use a lung bag, peak-flow meter or displacement of water to measure the volume of a person’s lungs
Create opportunities for pupils to select an approach to an investigation from a range of options and justify why they have chosen that approach.
Model how to decide when a fair test is an appropriate type of scientific enquiry.
Explore with pupils how to use their scientific knowledge and secondary sources in aspects of planning a scientific enquiry, e.g. in a prediction or question to investigate.
Demonstrate how validity of a scientific enquiry and reliability of results are affected by various aspects, including sample size.
Ask pupils to develop analogies to explain what they understand by accuracy, reliability and precision.
Create experimental opportunities for pupils to compare different ways of measuring the same variable in order to decide how to make
Why might different scientists answer the same question in different ways?
Will answering scientific questions in different ways always give the same answer?
Which should come first, observations or questions?
How do you decide what the most accurate equipment is for an investigation?
Why can an
00215-2009PDF-EN-01 © Crown copyright 2009

3 of 28 The National Strategies ⏐ Secondary Secondary Framework in Science, 1.2 How science works – Practical and enquiry skills
Year Yearly learning objectives
Amplification – pupils could learn to Strategies for progression – using HSW to deliver content
Rich questions
a choice about appropriate apparatus and measuring instruments.
Ask pupils to decide what they could measure or observe to provide the evidence for a given investigation.
Create opportunities for pupils to plan practical activities over longer timescales
Further activities to support these strategies can be found in the Mini-booster 3: Progressing to level 6 and beyond:
What do we mean by evidence?
investigation with lots of results still be unreliable?
Should an investigation always be trying to answer a question?
Should you always use the most accurate measuring instruments?
How can you increase the validity of an investigation?
9 explain how the planned approach to answer a scientific question was informed by scientific knowledge, understanding or other sources of evidence
give reasons for selecting a particular approach, e.g. when deciding how to answer the question ‘what do woodlice eat?’ justify selecting a research approach rather than using a choice chamber
research existing evidence in order to inform an aspect of the investigation, e.g. independently research information about the reactivity of metals when planning an experiment involving reactions
Demonstrate the importance of preliminary work to refine planning and decide the range of variables.
Create opportunities for pupils to determine the limitations of the apparatus, with respect to reliability and accuracy.
Model examples of where variables are less easily controlled as well as strategies to manage this during planning.
Involve pupils in exploring evidence and to suggest how this might influence the planning.
Evaluate different solutions to known science questions which are arrived at by different means.
Plan opportunities for pupils to justify the
Why do surveys not always give scientific answers?
Can opinions be scientifically measured?
Are elections scientific?
Why might scientists conduct an investigation that is not a fair test?
Should existing evidence affect how I plan an
00215-2009PDF-EN-01 © Crown copyright 2009

4 of 28 The National Strategies ⏐ Secondary Secondary Framework in Science, 1.2 How science works – Practical and enquiry skills
Year Yearly learning objectives
Amplification – pupils could learn to Strategies for progression – using HSW to deliver content
Rich questions
choice of apparatus, linked to the precision of the task.
Model how to decide if evidence gathered is relevant to the planning of an investigation.
investigation?
10 explain how the planned approach was informed by a range of scientific knowledge, understanding and evidence and, where appropriate, how this influenced the method of data collected
explain how ideas and sources of evidence can affect the planning of an approach, e.g. using models and considering available instruments when investigating an aspect of wave behaviour
explain how the planning of an approach influences the method of data collection, e.g. making it clear in a plan to investigate how much dust there is in the atmosphere that they would gather data by using agar-covered slides in a variety of locations and compare the density of the dust under a microscope
research and select information from different sources to inform the planning process, e.g. combine data from a number of different studies about factors affecting the germination rates of seeds in various natural habitats
Create opportunities for pupils to draw together ideas and evidence from various sources to inform the planning process.
Create opportunities for pupils to explain to what extent they have controlled the variables in a range of complex contexts.
Plan structured whole-class discussion on how investigations can still be conducted even if the variables cannot easily be controlled.
Plan investigations to determine the effect of not controlling some variables adequately. Do this in concrete everyday contexts, then apply the results to a complex situation, e.g. the use of historic data on global temperatures to make predictions into the future.
Create opportunities for pupils to evaluate examples of investigations that were not based on direct experimentation, e.g. evidence for an expanding universe.
Are thought experiments valid?
What is the optimum amount of evidence?
00215-2009PDF-EN-01 © Crown copyright 2009

5 of 28 The National Strategies ⏐ Secondary Secondary Framework in Science, 1.2 How science works – Practical and enquiry skills
Year Yearly learning objectives
Amplification – pupils could learn to Strategies for progression – using HSW to deliver content
Rich questions
11 explain how to plan appropriate approaches to investigatory work by synthesising information from a range of sources in complex contexts and where variables are less easily controlled
identify situations in which variables cannot easily be controlled and how to take this into account, e.g. in an investigation into the effect of caffeine on pulse rate explain which variables are less easy to control and what steps were taken to minimise the impact of this
realise that not all investigative work is experimental, e.g. weigh up various sources of evidence for and against the theory of global warming to answer the question ‘Is the climate changing?’
Create opportunities for pupils to compare each other’s proposed data collection for the same investigation and how the collection has been directed by the way the investigation was planned.
Plan opportunities for pupils to peer-assess how well ideas and evidence have been used to inform the planning process.
Create opportunities for pupils to explore the process of a randomised control trial.
What is the difference between research, experiment and investigation?
Can models and analogies help me plan well?
What happens in a clinical trial?
What is the placebo effect?
Extension explain why different approaches are required to investigate different kinds of scientific questions and how scientific knowledge, understanding and sources of evidence are used in the different approaches
explain some of the more complex experimental design structures and where they could be used, e.g. randomised control trials, field studies, and where some of the variables are deliberately not controlled but allowed to mirror normal conditions, e.g. light levels when investigating an aspect of plant growth
explain how ideas and sources of evidence are used in different approaches, e.g. how Mendeleev used incomplete information about elements to build an overarching view
00215-2009PDF-EN-01 © Crown copyright 2009

6 of 28 The National Strategies ⏐ Secondary Secondary Framework in Science, 1.2 How science works – Practical and enquiry skills
1.2b Using investigative approaches: selecting and managing variables Year Yearly learning
objectives Amplification – pupils could learn to Strategies for progression – using HSW to
deliver content Rich questions
7 recognise the range of variables involved in an investigation and decide which to control
identify relevant variables in an investigation, e.g. identify what would affect the rate at which a trolley rolls down a slope and therefore which variables to alter and which to keep the same
list all the variables and make sensible choices about the dependent and independent variables, e.g. when investigating the effect of indigestion powders realise that colour of powder would not be a sensible choice
explain the difference between independent and dependent variables, e.g. articulate their own way of remembering the difference between the two
Create opportunities for pupils to identify all the possible variables and then identify the independent and dependent variables and the fixed (control) variables.
Involve pupils in identifying a range of possible variables and turning them into investigable questions.
Create opportunities for pupils to compare the differences between using numeric and non-numeric variables.
Explore the effect of different variable ranges and intervals on the outcome of an enquiry.
Model how to make sensible decisions about which variables to change.
Create opportunities to identify the variables represented by a bar chart/line graph, i.e. from the axes.
Ask pupils to discuss what they understand by the words ‘factor’ and ‘variable’, independent (input), dependent (outcome) and fixed (control) variables.
Encourage pupils to think of as many different and fun ways to remember which variable is which (e.g. through cartoons, silly poems, mnemonics, etc.).
Model the process of identifying and controlling all the possible variables in a fair test.
Teach pupils that not all scientific enquiries are ‘fair testing’ and that there are some instances when all the variables cannot be
What makes a good variable?
Are numerical variables best?
Do we need to control all possible variables?
00215-2009PDF-EN-01 © Crown copyright 2009

7 of 28 The National Strategies ⏐ Secondary Secondary Framework in Science, 1.2 How science works – Practical and enquiry skills
Year Yearly learning objectives
Amplification – pupils could learn to Strategies for progression – using HSW to deliver content
Rich questions
controlled.
Encourage pupils to see that selecting a sample size has to be a compromise because of the constraints of time and resources.
Further activities to support these strategies can be found in the Mini-booster 6: Progressing to level 6 and beyond:
Understanding variables
8 describe and identify key variables in an investigation and assign appropriate values to these
correctly identify the different variables in an investigation and whether the dependent variable may or may not be affected by the independent variable, e.g. would seed germination be affected by the size or colour of the container?
assign appropriate values to variables, e.g. select appropriate range of weights sufficient to stretch a spring without causing permanent deformation
Explore pupils’ understanding of the correct language for talking about variables and require them to use it appropriately in oral and written work.
Model how to select suitable quantities for the variables and identify a suitable range of values for the independent variable to give reliable results.
Model the difference between selecting and not selecting an appropriate number of evenly spaced values for the independent variable, i.e. enough to show a pattern.
Create opportunities for pupils to discuss the titles of some investigations and decide briefly what they would do. Share this with another pair to see if the correct variables are being measured or changed.
Encourage pupils to justify why they have chosen particular ranges for variables, particular measuring instruments and numbers of repeats in plans.
Give pupils the opportunity to carry out some short trial runs of simple investigations to generate some preliminary data that they
Does it matter if variables don’t increase in equal intervals?
Does the investigation title help me decide the variables?
Do all investigations have variables?
00215-2009PDF-EN-01 © Crown copyright 2009

8 of 28 The National Strategies ⏐ Secondary Secondary Framework in Science, 1.2 How science works – Practical and enquiry skills
Year Yearly learning objectives
Amplification – pupils could learn to Strategies for progression – using HSW to deliver content
Rich questions
could use to make decisions about appropriate range, degree of accuracy and number of repeats.
Provide pupils with a series of graphs and variables and ask them to match the variables to the appropriate type of graph.
Ask pupils to look at fixed variables and identify the degree of control they have over these variables. Explain why it is hard to control them and how these variables might have to be taken into account when drawing any conclusions.
Provide pupils with the titles of some investigations and ask them to discuss how they would measure each variable and then to give a possible prediction to show a likely relationship between the two.
Further activities to support these strategies can be found in the Mini-boosters 1 and 6: Progressing to level 6 and beyond:
1 Accuracy and reliability
6 Understanding variables
00215-2009PDF-EN-01 © Crown copyright 2009

9 of 28 The National Strategies ⏐ Secondary Secondary Framework in Science, 1.2 How science works – Practical and enquiry skills
Year Yearly learning objectives
Amplification – pupils could learn to Strategies for progression – using HSW to deliver content
Rich questions
9 use and apply independent and dependent variables in an investigation by choosing an appropriate range, number and value for each one
identify and select independent and dependent variables, e.g. decide, when investigating factors affecting rates of corrosion, which of the variables to keep constant, which to vary and which to measure
explain why the range and number of readings of relevant variables affecting the rate at which a trolley rolls down a ramp are sensible (e.g. don’t have angles of 90o or more)
Model for pupils how the choice and range of variable might affect the quality of the conclusion drawn, e.g. whether the range of temperatures used in an enzyme investigation is appropriate.
Demonstrate how the choice of variable might affect the incidence/likelihood of getting anomalous results.
Model the effect of inappropriate numbers of measurements on the precision and shape of a graph.
Explore with pupils the types of investigations where variables are less easily controlled.
Model how to decide when a control sample is necessary.
Do the measurements I make affect the end result?
What makes a sensible variable?
10 identify key factors in complex contexts where variables are less easily controlled
explain that it is easy to control the mass of a particular reactant through accurate measurement, but it is less easy to control and maintain a constant temperature
Model how to use quantitative relationships between variables in predictions and analysis of data and explain the advantages of this.
Create experimental opportunities for pupils to explain how they have managed variables that are less easy to control.
What makes a good prediction?
What makes a difficult variable?
When would I use a control?
11 use and apply key variables in complex contexts, including ones in which variables are less easily controlled
apply key variables in less easily controlled situations, e.g. gathering data about the wavelength of light when looking at stars, gathering evidence for an expanding universe
Create opportunities for pupils to compare and evaluate investigations with more and less easily controlled variables.
Create experimental opportunities for pupils to identify, control and manipulate more than one variable, e.g. compare the effect of biological and non-biological washing powders at different temperatures on a range of fabrics.
Explain what a randomised controlled trial is.
Can I have more than one independent variable?
00215-2009PDF-EN-01 © Crown copyright 2009

10 of 28 The National Strategies ⏐ Secondary Secondary Framework in Science, 1.2 How science works – Practical and enquiry skills
Year Yearly learning objectives
Amplification – pupils could learn to Strategies for progression – using HSW to deliver content
Rich questions
Extension identify and manage a range of variables in complex contexts including ones in which variables are less easily controlled
identify a range of variables in a complex situation, e.g. identify ways in which human behaviour has affected the biosphere
control multiple variables, e.g. manage the range of factors that might affect the rate of a chemical reaction
00215-2009PDF-EN-01 © Crown copyright 2009

11 of 28 The National Strategies ⏐ Secondary Secondary Framework in Science, 1.2 How science works – Practical and enquiry skills
1.2c Using investigative approaches: assessing risk and working safely Year Yearly learning
objectives Amplification – pupils could learn to Strategies for progression – using HSW to
deliver content Rich questions
7 explain how action has been taken to control obvious risk and how methods are adequate for the task
recognise risk, e.g. identify the hazards present when a liquid is being heated
understand the need for the control of risk, e.g. explain why spillage of water is a hazard
recognise an effective control method, e.g. explain the reasons for acids being managed in a particular way and specific safety precautions being deployed
Discuss and clarify what constitutes a risk and a hazard.
Create opportunities for pupils to identify common hazard signs at home and at school.
Model safe working practice, e.g. no cups of coffee in the lab.
Demonstrate aspects of remedial aids.
Are all acids dangerous?
Are all non-acids safe?
What is the difference between a hazard and a risk?
Am I a hazard or a risk?
8 explain how to take action to control the risks to themselves and others, and demonstrate competence in their practical techniques
be mindful of safety in the use of equipment, e.g. when taking samples of cheek cells it should be the person from whom the cells are being taken who handles and disposes of the equipment
explain how one course of action is better than another in the control of risk, e.g. explain why, when working with cultures, incineration is better than disinfecting
Involve pupils in checking that their peers are following safety procedures.
Involve pupils in discussing how operating procedures should be modified following an accident or incident.
What is the difference between a right and a responsibility?
Is anything risk free?
9 explain how approaches to practical work were adapted to control risk
recognise adaptation of approach, e.g. when planning a series of experiments on reactivity series that the procedure for the use of certain metals has to be different
connect adaptation to safety considerations, e.g. explain why techniques proposed for sampling water in an environmental study may have to be modified to reduce risk because of the in situ hazard of gathering samples
Model how to adapt a risk assessment for particular situations.
Plan opportunities for pupils to discuss in small groups whether they think a demonstrated procedure is safe and, if not, how to improve it.
Model a simple risk assessment based on rating both the hazard and the likelihood of it happening on a scale of 1–5. Multiplying these would give a top score of 25. Ask pupils to apply this to everyday scenarios and then to consider how to reduce the risk.
When does risk become acceptable?
Is a risk assessment a lot of unnecessary paperwork?
00215-2009PDF-EN-01 © Crown copyright 2009

12 of 28 The National Strategies ⏐ Secondary Secondary Framework in Science, 1.2 How science works – Practical and enquiry skills
Year Yearly learning objectives
Amplification – pupils could learn to Strategies for progression – using HSW to deliver content
Rich questions
10 use and apply risk assessment in carrying out practical procedures
understand the form and function of risk assessment, e.g. explain how information from a risk assessment relating to the use of particular chemicals is set out and made use of
respond to risk assessment in carrying out procedure, e.g. plan an investigation into reactions between chemicals taking into account information on risk assessments
Model how to use Hazcards and require pupils to refer to Hazcards when planning an investigation.
Create experimental opportunities for pupils to explicitly use and apply risk assessment in their planning
Has society become ‘risk averse’, and is this a problem?
11 explain why the chosen approach to practical work needed to be adapted to control risk
make connections between hazard and changed approach, e.g. give reasons why some reagents need to be handled or controlled in a particular way when developing the plan for an investigation into the energy content of alcohols
Involve pupils in comparing a good and a less satisfactory plan in respect of controlling risk.
Explore the difference between perceived and actual risk.
Create opportunities for pupils to research why particular substances are hazardous.
Does society tend to overestimate or underestimate risks?
Is chemistry the most dangerous area of science?
Extension explain how hazards are identified and risks managed to collect data in a safe and skilful manner
give reasons for activities or artefacts being identified as hazardous, e.g. explain with reference to electron structure why alkali metals are hazardous
00215-2009PDF-EN-01 © Crown copyright 2009

13 of 28 The National Strategies ⏐ Secondary Secondary Framework in Science, 1.2 How science works – Practical and enquiry skills
1.2d Using investigative approaches: obtaining and presenting primary evidence Year Yearly learning
objectives Amplification - pupils could learn to Strategies for progression – using HSW to
deliver content Rich questions
7 describe and record observations and evidence systematically
recognise that the presentation of experimental results through the routine use of tables, bar charts and simple graphs makes it easier to see patterns and trends
select appropriate way of recording observations, e.g. when investigating the combustion of various materials, deciding which observations are appropriate and how to tabulate them to make comparisons easier
select appropriate terminology and structure for the description of evidence, e.g. to understand the difference between quantitative and qualitative data when studying a habitat
recognise that the way data are displayed is important, e.g. when gathering evidence on variation between pupils in a class, comment on whether bar charts, histograms or line graphs make comparison easier
recognise patterns and trends in data, e.g. recognise trends in data when comparing the number and arrangement of components in a circuit with the current that is flowing
Model how to construct tables and charts from results, e.g. using correct variables as headings, evenly spacing the values of independent variables to make it easier to see patterns, recording a sufficient number of results.
Create opportunities for pupils to plot information as bar charts or line graphs and to select appropriate scales for the axes of graphs.
Demonstrate how the use of unequal scales on axes can distort a graph.
Model how to describe the pattern of a line graph, recognising the importance of the shape and how it can be sectioned to give two or three distinct parts.
Explore the value of deciding whether to take repeat readings and calculate the mean. Be very explicit that this is not the same thing as a fair test or always taking three repeat readings.
Discuss with pupils what is meant by ‘systematic observations’, and qualitative and quantitative data.
Create opportunities for pupils to read different scales on a variety of measuring instruments and agree some ‘top tips’.
Explore the concepts of accuracy and reliability by asking pupils to justify the results that they have gathered from a simple experiment.
Give pupils a selection of different graphs and ask them to decide what is shown by each and which clues made them secure about their
Do graphs tell stories?
Are all graphs telling the truth?
Are the axes really important?
Do graphs let us predict?
00215-2009PDF-EN-01 © Crown copyright 2009

14 of 28 The National Strategies ⏐ Secondary Secondary Framework in Science, 1.2 How science works – Practical and enquiry skills
Year Yearly learning objectives
Amplification - pupils could learn to Strategies for progression – using HSW to deliver content
Rich questions
judgements.
Ask pupils to label horizontal and vertical axes, origin, factors that are being changed (independent variables) and those factors that are being measured (dependent variables) on each of the graph types.
Emphasise to pupils the need to start reading the line graph on the left-hand side – just like reading a sentence.
Teach pupils how to construct a table for their results that will help them see patterns.
Further activities to support these strategies can be found in the following Mini-boosters 1 and 4: Progressing to level 6 and beyond:
1 Accuracy and reliability
4 Making sense of graphical data
8 explain how the observation and recording methods are appropriate to the task
describe ways in which the presentation of experimental results through the routine use of tables, charts and line graphs makes it easier to see patterns and trends
make connections between the task and the gathering of data, e.g. if an environmental study is being conducted, it may be appropriate to count organisms or to estimate percentage cover within a quadrat
compare various forms of data display, e.g. to explain why comparing data about the various nutrients in different foodstuffs is easier from a table, a bar chart or a pie chart
Model how to order data in different ways to show patterns and relationships more clearly.
Explore with pupils when it is appropriate to use which type of graph (ensure consistency with Mathematics and Geography departments) and agree some guidelines.
Create opportunities for pupils to draw their own axes using more complex number scales, including negative numbers.
Model how to interpolate and extrapolate graphs and spot anomalous results.
Create opportunities for pupils to present data in different ways and compare the outcomes to decide if they show the same effect or a different effect.
Do graphs, charts and tables do the same job?
Should all graphs go through the origin?
What is the best way to show results?
00215-2009PDF-EN-01 © Crown copyright 2009
15 of 28 The National Strategies ⏐ Secondary Secondary Framework in Science, 1.2 How science works – Practical and enquiry skills
Year Yearly learning objectives
Amplification - pupils could learn to Strategies for progression – using HSW to deliver content
Rich questions
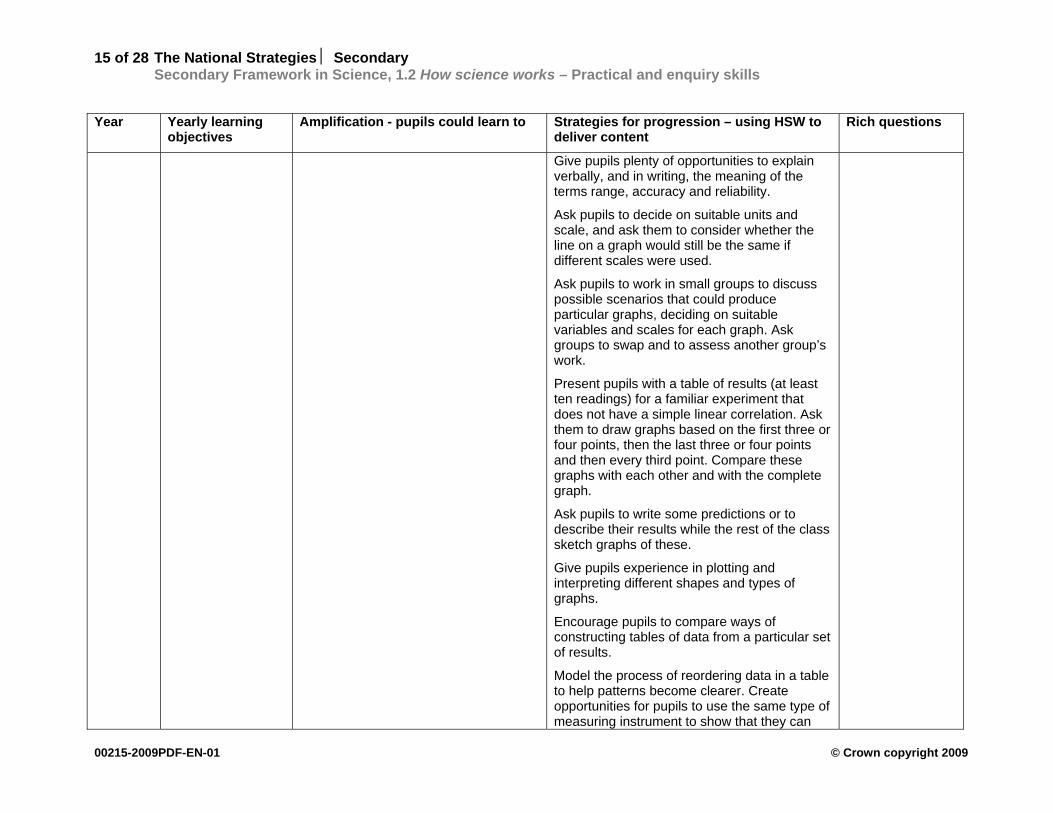
Give pupils plenty of opportunities to explain verbally, and in writing, the meaning of the terms range, accuracy and reliability.
Ask pupils to decide on suitable units and scale, and ask them to consider whether the line on a graph would still be the same if different scales were used.
Ask pupils to work in small groups to discuss possible scenarios that could produce particular graphs, deciding on suitable variables and scales for each graph. Ask groups to swap and to assess another group’s work.
Present pupils with a table of results (at least ten readings) for a familiar experiment that does not have a simple linear correlation. Ask them to draw graphs based on the first three or four points, then the last three or four points and then every third point. Compare these graphs with each other and with the complete graph.
Ask pupils to write some predictions or to describe their results while the rest of the class sketch graphs of these.
Give pupils experience in plotting and interpreting different shapes and types of graphs.
Encourage pupils to compare ways of constructing tables of data from a particular set of results.
Model the process of reordering data in a table to help patterns become clearer. Create opportunities for pupils to use the same type of measuring instrument to show that they can
00215-2009PDF-EN-01 © Crown copyright 2009

16 of 28 The National Strategies ⏐ Secondary Secondary Framework in Science, 1.2 How science works – Practical and enquiry skills
Year Yearly learning objectives
Amplification - pupils could learn to Strategies for progression – using HSW to deliver content
Rich questions
give different readings and to compare readings of the same quantity from different instruments.
Further activities to support these strategies can be found in the Mini-boosters 1, 4, 5 and 7: Progressing to level 6 and beyond:
1 Accuracy and reliability
4 Making sense of graphical data
5 Describing and explaining patterns
7 Evaluation
9 use and apply qualitative and quantitative methods to obtain and record sufficient data systematically
explain how the presentation of experimental results through the routine use of tables, charts and line graphs makes it easier to see patterns and trends
recognise appropriate qualitative and quantitative methods, e.g. when studying certain reactions in test tubes, recognise that a temperature rise could be felt or measured as appropriate
explain the need for data to be systematic, e.g. when investigating turning effects in a number of contexts, to record the size of the force, its direction, the position of the fulcrum and the perpendicular distance from the force to the fulcrum
state, with reasons, why one form of display makes it easier to spot patterns and trends than another, e.g. when displaying data relating to the reflection and refraction of light in a Perspex block, it is easier to see the patterns if the data are ordered according to the size of the incident angle
Discuss how to decide the number of decimal places to which results need to be measured (accuracy) and how this should influence the choice of apparatus.
Explain the uncertainty surrounding points on a graph and model how to draw lines of best fit.
Create opportunities for pupils to explain why they decided to take a number of repeat readings and use a mean value.
Consider the strengths and weaknesses of using mean values by comparing graphs drawn from mean values with graphs drawn using all of the data.
Create opportunities for pupils to use a range of techniques to present their results, justifying their choices to their peers.
Use graphs from past papers, textbooks and pupils’ work to consider the best use of a ‘line of best fit’. Discuss whether the graph line should go through the origin and check that pupils are able to explain why.
Should all axes begin at 0?
Do repeat readings mean better data?
Is a histogram a joined-up bar chart?
00215-2009PDF-EN-01 © Crown copyright 2009

17 of 28 The National Strategies ⏐ Secondary Secondary Framework in Science, 1.2 How science works – Practical and enquiry skills
Year Yearly learning objectives
Amplification - pupils could learn to Strategies for progression – using HSW to deliver content
Rich questions
10 explain how inherent variation, e.g. from human error, sensitivity and accuracy of instrument, needs to be considered when collecting data
apply and use appropriate ways of recording relevant observations and comparisons, clearly identifying points of particular significance
recognise various sources of variation, e.g. when measuring the speed of sound by timing echoes from a distant wall, to recognise that there may be variation due to reaction times, other echoes, limits of the equipment, etc.
describe ways of dealing with various sources of variation, e.g. in radioactive decay measurements that random variation is dealt with by averaging readings, but systematic error, such as background count, is dealt with by measuring it and adjusting all readings accordingly
use various forms of data display, e.g. in an environmental study, use bar charts to show the populations of different species in a particular locality but scatter graphs to show how the population of one species varies in relation to the distance from a particular point
identify significant points in observations and comparisons, e.g. in a cooling curve that includes a change of state, indicating where the change began and ended
Create opportunities for pupils to evaluate different ways of presenting the same data taking into account audience and purpose.
Create opportunities for pupils to explain how they used a trend or pattern in results to make numerical predictions.
Model how inherent variation, e.g. from human error, sensitivity and accuracy of instrument, needs to be considered when collecting and interpreting data.
Structure discussions for pupils to explore the extent to which the conclusion is strongly based upon the primary evidence provided.
Is human error inevitable?
Why is a ‘yardstick’ important in science?
Can measuring instruments be uncertain?
How do we know the length of a metre?
11 use and apply systematic observation and precise measuring with a range of apparatus, whilst taking account of inherent variation, to obtain and
explain how observations can be made systematic, e.g. in the study of behaviour, that recording responses can be made systematic by agreeing upon a definition as to what is a significant response
make measurements with precision, e.g. measuring the thickness of a wire by using a micrometer when investigating
Discuss with pupils how to evaluate an investigation for unexplored variables and how this might raise uncertainty about conclusions drawn.
Model the drawing of different conclusions from the same set of data or from the selective use of the data.
How accurate is calibration?
Is precision the same as accuracy?
Can measurements be indirect?
00215-2009PDF-EN-01 © Crown copyright 2009

18 of 28 The National Strategies ⏐ Secondary Secondary Framework in Science, 1.2 How science works – Practical and enquiry skills
Year Yearly learning objectives
Amplification - pupils could learn to Strategies for progression – using HSW to deliver content
Rich questions
record reliable data
explain how the chosen presentation of data has been used to support a valid conclusion
strain under load
use data to support a conclusion, e.g. use data from a series of chemical reactions with different elements to substantiate a conclusion about differing levels of reactivity
describe the effective use of data to support a conclusion, e.g. when gathering data in relation to levels of pollution near a road, describing the extent to which the data gathered has made the conclusion secure
Extension use and apply systematic observation and precise measuring with a range of apparatus, whilst taking account of inherent variation, to obtain and record reliable data in a more demanding context
explain how the chosen presentation of data takes account of uncertainty or alternative conclusions
explain how the nature of the context affects the way the measuring and observation are carried out, e.g. when carrying out research into beach ecosystems, recording descriptions of rock pool habitats as well as measurements in recognition of multiple variables
recognise uncertainty in the basing of conclusions on data, e.g. when identifying a correlation between diet and fitness, accepting that there may be other unexplored variables that have an impact
describe how the same data will support different conclusions, e.g. understanding that a star appearing red may be due to its relative motion or to its temperature
00215-2009PDF-EN-01 © Crown copyright 2009

19 of 28 The National Strategies ⏐ Secondary Secondary Framework in Science, 1.2 How science works – Practical and enquiry skills
1.2e Working critically with primary evidence Year Yearly learning
objectives Amplification - pupils could learn to Strategies for progression – using HSW to
deliver content Rich questions
7 describe patterns and trends in results and link this evidence to any prediction made
describe and suggest how planning and implementation could be improved
spot patterns and trends in results, e.g. spot the link between the load on a spring and the extension produced
recognise the connection between prediction made and results obtained, e.g. look at the observations made on a series of chemical reactions and go back to the prediction to see if the reasoning suggested is supported
describe key features of planning and implementation, e.g. identifying the variables in an experiment to investigate a vehicle rolling down a slope and deciding which to vary, which to keep constant and which should be measured as an outcome
Model how to look for simple patterns in tables and use evidence from data to draw a conclusion.
Create opportunities to explore with pupils the difference between continuous and categorical variables and the ease with which patterns can be seen.
Create opportunities for pupils to describe simple relationships shown by data, e.g. qualitative patterns as generalisations (the longer the wire the dimmer the bulb).
Model how limited data can lead to unreliable evidence, e.g. concluding that copper is the best conductor after only testing six different metals.
Use good and less satisfactory examples of pupils’ work to develop a checklist to support effective evaluation of their investigations, including consideration of, for example, sample size and value of variables.
Discuss with pupils any simple conclusions that they can draw from data provided to check their understanding of accuracy, reliability, fair testing, and independent and dependent variables.
Explicitly illustrate when results support each other (are reliable) and when they do not. Discuss how close results need to be to be considered close enough to each other.
Further activities to support these strategies can be found in the Mini-booster 1: Progressing to level 6 and beyond:
Does reliability depend on accuracy?
What is a good sample size?
Is a bigger data set better?
00215-2009PDF-EN-01 © Crown copyright 2009

20 of 28 The National Strategies ⏐ Secondary Secondary Framework in Science, 1.2 How science works – Practical and enquiry skills
Year Yearly learning objectives
Amplification - pupils could learn to Strategies for progression – using HSW to deliver content
Rich questions
Accuracy and reliability
8 describe how the patterns and trends in the results link to the conclusions drawn and whether the evidence is sufficient
describe and suggest, with reasons, how planning and implementation could be improved
explain whether evidence is sufficient for a sound conclusion, e.g. whether the force meter readings when stretching polythene in different directions are sufficient to assert whether or not the difference is significant
recognise that error and uncertainty can affect the reliability of readings and how this could lead to incorrect patterns being identified or justified
identify whether or not a pattern supports a prediction, e.g. say whether or not evidence about the reactivity of metals going down a particular group in the periodic table supports a prediction made
describe deficiencies in the plan and implementation, e.g. if energy being released by burning a fuel is to be measured by being absorbed by a boiling tube of water above it
Explore with pupils the nature of anomalous or unreliable results and how they can affect the validity of their evidence.
Model how to write a conclusion that links evidence to the original question.
Review the evaluation checklist devised in Year 7 to include consideration of accuracy, reliability, range of values and how this might improve the quality of an evaluation.
Use a range of possible conclusions from a given set of data and ask pupils to identify which are consistent with the data.
Ask pupils to discuss the reliability of a set of results and rank the explanations provided to identify the most likely reasons for any anomalies.
Carry out a practical task in front of the pupils and ask them to identify where errors might occur that could lead to unreliable or inaccurate results, how the errors could have been avoided and the likely impact on the results.
Model how to decide if it is necessary to increase the number or repetition of some readings to improve the conclusions drawn.
Discuss with pupils that sometimes there might be an ‘odd’ or anomalous result and ask them why they think the result is odd, what they would do if it was their experiment and whether they can suggest a more realistic result.
Challenge pupils to sketch graphs of what they think will happen in the investigation. After they
Does an exception prove the rule?
Does uncertainty make you a better scientist?
How do you decide if the measurements are good enough?
00215-2009PDF-EN-01 © Crown copyright 2009

21 of 28 The National Strategies ⏐ Secondary Secondary Framework in Science, 1.2 How science works – Practical and enquiry skills
Year Yearly learning objectives
Amplification - pupils could learn to Strategies for progression – using HSW to deliver content
Rich questions
have completed their enquiry they can compare this graph with one drawn from their data.
Model how to write a conclusion that links the original question, the prediction and the patterns found in the data.
Ask pupils to plot different graphs using the same data, and to decide which type of graph helps to best answer the original question.
Challenge pupils to make up a ‘complete’ table of results from a familiar practical, and ask them to construct their own tables of results with different ranges and numbers of variables. Any common variables will have the same results as the ‘complete table’, but others may need to be added. Compare the conclusions drawn from their tables to the ones that could be drawn from the ‘complete’ table.
Further activities to support these strategies can be found in the Mini-boosters 1 – 3 and 5 – 7: Progressing to level 6 and beyond:
1 Accuracy and reliability
2 Evaluating a practical technique
3 What do we mean by evidence?
5 Describing and explaining patterns
6 Understanding variables
7 Evaluation
9 explain how patterns and trends in results can be manipulated to be consistent with the
give reasons for a pattern identified, e.g. suggest why it should be that pressure exerted increases with force but decreases as the area is increased
Model how to describe and explain more complex and quantitative relationships shown by data, and use these to make predictions or develop hypotheses, e.g. with data on an
What makes a good scientific relationship?
When do data
00215-2009PDF-EN-01 © Crown copyright 2009

22 of 28 The National Strategies ⏐ Secondary Secondary Framework in Science, 1.2 How science works – Practical and enquiry skills
Year Yearly learning objectives
Amplification - pupils could learn to Strategies for progression – using HSW to deliver content
Rich questions
evidence gathered and the predictions made
explain how improvements to the planning and implementation would have led to the collection of more valid and reliable evidence and a more secure conclusion
explain the connection between evidence and conclusion, e.g. when looking at the capacity of various people’s lungs, suggesting how this could be connected to their physical fitness
give reasons for improvements offered, e.g. explain why it is thought that using data loggers to measure light and temperature over a 24-hour cycle will give a better coverage
ecosystem.
Create opportunities for pupils to peer-assess how well scientific knowledge, understanding or models have been used to structure a conclusion.
Discuss with pupils the dangers of simplistic analysis and application of data, e.g. by taking a small sample and generalising to a whole population, or treating large variation by averaging.
Demonstrate how limitations in the selected measuring instruments can affect reliability and accuracy of evidence.
become evidence?
10 explain how the numerical data have been manipulated to make valid comparisons and conclusions linked to the original scientific question
evaluate the planning and implementation, and explain how this could account for errors and anomalies and how inadequacies could be remedied
describe how numerical data can be manipulated to make a comparison, e.g. when comparing the stiffness of springs, to convert the data so that it is all in the form of force per unit size of extension
explain sources of potential errors and anomalies in an investigation
describe the connection between planning and errors, e.g. when investigating rates of reaction, using the same container for the reactions; even though when cleaned it may be hotter each time used
Create opportunities for pupils to discuss the manipulation and interrogation of their experimental data.
Challenge pupils to identify the benefits and drawbacks of the manipulation of data.
Discuss with pupils the importance of linking scientific knowledge and understanding from more than one key idea, e.g. particles and energy, to explain their evidence.
Discuss with pupils examples of where a cause could be erroneously drawn from a correlation, e.g. thinking that deafness is caused by having white hair instead of realising that both can be a result of old age.
Are anomalous results always bad?
What is enough evidence?
Why is replication important in science?
Does correlation imply a cause?
00215-2009PDF-EN-01 © Crown copyright 2009

23 of 28 The National Strategies ⏐ Secondary Secondary Framework in Science, 1.2 How science works – Practical and enquiry skills
Year Yearly learning objectives
Amplification - pupils could learn to Strategies for progression – using HSW to deliver content
Rich questions
11 synthesise and manipulate data, analyse findings and draw valid and reliable conclusions consistent with the evidence and linked to the original scientific question
recognise that correlation does not always imply causation
evaluate the planning and implementation, and explain how this could account for errors and anomalies and the subsequent impact on the conclusion in simple contexts
draw together data from various sources, e.g. when investigating possible reasons why the population of a particular plant may have declined
distinguish between validity and reliability in conclusions, e.g. that data gathered about the energy released by burning fuel could be gathered reliably but this wouldn’t make it a valid measure of the energy content
distinguish between correlation and causation, e.g. in a study into reasons for the limited range of invertebrate life in river water, why this might reliably show that the levels of nitrates are higher than average but this wouldn’t prove that the nitrates were responsible for the limited range of life
explain the relationship between the errors and anomalies in a simple investigation and the conclusion based on them, e.g. in an experiment to investigate the factors affecting the resistance of a wire, a systematic error in the voltmeter readings would cause the calculated resistance to be incorrect, but wouldn’t invalidate conclusions about the greater length causing the resistance to be more
Create opportunities for pupils to peer-assess how well data have been collated and analysed from a series of experiments, or sources, to produce a valid model or conclusion.
Create opportunities for pupils to identify how, and to what extent, different aspects of planning could lead to systematic errors or anomalies and the impact of this on the conclusion drawn.
Is there a difference between cause and effect, and correlation?
Is all evidence helpful?
Is there ever any good science in ‘old wives tales?”
Is there ever any good science in urban myths?
00215-2009PDF-EN-01 © Crown copyright 2009

24 of 28 The National Strategies ⏐ Secondary Secondary Framework in Science, 1.2 How science works – Practical and enquiry skills
Year Yearly learning objectives
Amplification - pupils could learn to Strategies for progression – using HSW to deliver content
Rich questions
Extension synthesise and manipulate data, analyse findings, draw valid and reliable conclusions consistent with the evidence, and explain how strongly the evidence relates to the original scientific question
explain why correlation does not always imply causation
evaluate the planning and implementation, and explain how this could account for errors and anomalies and the subsequent impact on the conclusion in more complex contexts
evaluate the strength of the link between a scientific question and the evidence gathered to investigate it, e.g. when investigating the effect of caffeine upon heart rate, being aware of the extent to which the evidence indicates a clear causal link
explain the relationship between the errors and anomalies in a complex investigation and the conclusion based on them, e.g. when sampling the distribution of populations in an ecosystem, being able to evaluate how errors might negate conclusions
00215-2009PDF-EN-01 © Crown copyright 2009

25 of 28 The National Strategies ⏐ Secondary Secondary Framework in Science, 1.2 How science works – Practical and enquiry skills
1.2f Working critically with secondary evidence Year Yearly learning
objectives Amplification - pupils could learn to Strategies for progression – using HSW to
deliver content Rich questions
7 describe patterns and trends in secondary evidence and link these to the prediction or conclusion drawn
recognise that different conclusions may be drawn from secondary data
describe how a conclusion is based on evidence, e.g. describe how evidence about the effect of various types of food on health might influence a diet
look for other possible conclusions that could be drawn from a set of data
identify what constitutes a pattern or trend, e.g. being able to see that planets a greater distance from the Sun have a longer period of orbit
Model how to locate information from secondary sources.
Model how to distinguish between reliable and unreliable evidence, and between fact and opinion.
Plan opportunities for pupils to identify whether sets of secondary data have patterns or trends.
What is a pattern?
What is a trend?
Should I believe everything I read?
8 describe what needs to be considered in the collection and manipulation of simple secondary evidence to evaluate the conclusion or interpretation made
recognise that the selection, ordering or rejection of secondary data could lead to different conclusions
offer reasons for the strength of the link between the evidence and the conclusion, e.g. in data on factors affecting road safety, whether the data show a clear trend with a strong correlation and link with scientific ideas to explain causality
describe the connection between data and conclusion, e.g. understanding that the data relating to road traffic accidents at a location may be used to make a case for safety measures being installed
Plan opportunities for pupils to explore links between the quality of secondary evidence and the strength of a conclusion.
Explore with pupils how well a writer has made connections between their conclusion and the supporting evidence.
Provide pupils with opportunities to use criteria to evaluate sources of data from the internet.
Model how writers can manipulate data for different purposes.
Support pupils in deciding whether something is evidence or just ‘true but not helpful’, e.g. by getting them to read information and highlighting statements that are true, but are not relevant.
Create opportunities for pupils to use and evaluate secondary data and appreciate its importance in different scientific contexts.
If evidence is unreliable, is it evidence?
Can the same data tell different stories?
Where do scientists go for the evidence they need?
00215-2009PDF-EN-01 © Crown copyright 2009

26 of 28 The National Strategies ⏐ Secondary Secondary Framework in Science, 1.2 How science works – Practical and enquiry skills
Year Yearly learning objectives
Amplification - pupils could learn to Strategies for progression – using HSW to deliver content
Rich questions
Further activities to support these strategies can be found in the Mini-boosters 3 and 7: Progressing to level 6 and beyond:
3 What do we mean by evidence?
7 Evaluation
9 explain whether the collection and manipulation of secondary evidence is sufficient or insufficient to support the conclusion or interpretation made
explain how secondary numerical data have been manipulated to support a conclusion or particular viewpoint
suggest how the insufficiency of evidence could be addressed e.g. look at data from a food manufacturer on storage requirements and question the reliability of the data based on sample size, whether it has come from other researchers and if there could be self-interest
explain how data can be manipulated, e.g. the data relating to nutrients in food can be presented differently in order to influence, so that ‘This food is over 95% fat free’ and ‘This food has less fat than ever before’ may both be true but may support different inferences
Provide opportunities for discussion of the implications of insufficient evidence and the formulation of appropriate responses.
Create opportunities for pupils to evaluate secondary sources and identify if evidence has been misrepresented.
Explore how and why scientists make inferences.
Should data be manipulated?
Can ‘a little data go a long way’?
Does evidence get in the way of a good story?
10 explain, using scientific knowledge and understanding, how some of the limitations in the collection and manipulation of secondary evidence can distort the conclusion drawn
use scientific ideas to identify implications of limited evidence, e.g. when looking at solubility curves, knowing that different ions have different effects should influence which curves should be included
select an example of a scientific controversy that arose from differing interpretations of evidence, e.g. different conclusions have arisen from looking at data about ice floes and melt rates depending upon the selection of the
Discuss with pupils the difficulties in challenging the validity, reliability and accuracy of secondary data.
Create opportunities for pupils to formulate and peer-assess questions to assist in assessing the quality of secondary data.
Encourage pupils to identify the features of strong inferences from data and to identify good and less satisfactory examples of this in the media.
Is a little knowledge a dangerous thing?
What is enough evidence?
Why is replication important in science?
00215-2009PDF-EN-01 © Crown copyright 2009

27 of 28 The National Strategies ⏐ Secondary Secondary Framework in Science, 1.2 How science works – Practical and enquiry skills
Year Yearly learning objectives
Amplification - pupils could learn to Strategies for progression – using HSW to deliver content
Rich questions
recognise that scientific controversies can arise from different interpretations of the same evidence
period. Challenge pupils to research, present and discuss examples in which the credibility of data may be questioned.
11 evaluate the conclusions drawn by others, including scientists, in familiar or less complex contexts and consider how strongly the evidence supports these conclusions or claims
describe a range of issues that can affect the credibility of data
explain how a conclusion can be evaluated, e.g. analyse whether a conclusion about the best way to train dogs is based on clear evidence and conforms to accepted scientific thinking
describe an issue that can affect the credibility of data, e.g. when testing drugs, judge whether the people administering the test could conceivably influence the results
Create opportunities for pupils to evaluate conclusions based on unfamiliar contexts and to explain their thinking.
Provide opportunities for pupils to locate and explain how evidence has been used to perpetrate a hoax.
Create opportunities for pupils to explain how different interpretations could be drawn from the same set of evidence.
Is inference dangerous?
Is controversy helpful?
What makes a good science report?
00215-2009PDF-EN-01 © Crown copyright 2009

28 of 28 The National Strategies ⏐ Secondary Secondary Framework in Science, 1.2 How science works – Practical and enquiry skills
Year Yearly learning objectives
Amplification - pupils could learn to Strategies for progression – using HSW to deliver content
Rich questions
Extension evaluate the conclusions drawn by others, including scientists, in less familiar or more complex contexts and consider how strongly the evidence supports these conclusions or claims
explain how scientific controversies can arise from different ways of interpreting evidence
describe how a conclusion from a less familiar context can be evaluated, e.g. whether a report on an unfamiliar context is nevertheless based on clear evidence and accepted scientific thinking
explain how and why different interpretations are applied to evidence
00215-2009PDF-EN-01 © Crown copyright 2009