Embed Size (px)
Citation preview
Nuclear Instruments and Methods in Physics Research B29 (1987) 203-206
North-Holland, Amsterdam
203
“Be MEASUREMENTS ON POLAR ICE: COMPARISON OF ARCTIC AND ANTARCTIC RECORDS
J. BEER, G. BONANI, H.J. HOFMANN, M. SUTER, A. SYNAL and W. WGLFLI
Insiitut fir Mittelenergiephysik, ETH-Hoenggerberg, CH-8093 Ziirich, Switzerland
H. OESCHGER and U. SIEGENTHALER
Physics Institute, University of Bern, CH-3012 Bern, Switzerland
R.C. FINKEL
Lawrence Livermore National Laboratory, 94550 Livermore, CA, USA
A new semicontinuous lo Be record from Byrd station, Antarctica, is presented and compared with the Camp Century record from
Greenland. Although the comparison of the Holocene parts of the two profiles is seriously hampered by lack of a reliable time scale for the Byrd core, there is evidence for common features. The establishment of the existence of global features in toBe records is of
great importance for the interpretation of “Be concentrations in terms of production rate changes due to helio- and geomagnetic
modulation. In addition “Be time marks could be used to synchronize the climatic records of the Northern and Southern
hemispheres.
1. Introduction
During the last ten years, following the invention of the accelerator mass spectrometry technique, a steadily increasing number of “Be measurements has been car- ried out on various terrestrial archives [l]. Besides dat- ing, which in the case of ice has proven to be far from straightforward [2,3], one of the most important poten- tial applications of “Be is to reconstruct the history of solar activity and geomagnetic field intensity. Both magnetic fields carried by solar wind as well as those associated with the geomagnetic dipole moment mod- ulate the cosmic ray flux impinging on the atmosphere and thereby influence the production rates of radioiso- topes. As a consequence the “Be concentration mea- sured in natural archives such as polar ice sheets con- tains information on production rates in the past. Pro- duction variations by factors up to 1.6 for solar and up to 3 for geomagnetic modulation are to be expected [4,5]. There is, however, a serious problem which com- plicates the interpretation of measured “Be variations in terms of solar and geomagnetic modulation: the “Be concentration in ice is not only determined by the production rate but also by transport and deposition processes. On a short time scale of days, variations of up to a factor of ten can be observed (unpublished data). About 2/3 of the “Be is produced in the strato- sphere which, considering the mean residence time of more than one year, can be assumed to be well mixed.
0168-583X/87/$03.50 0 Elsevier Science Publishers B.V. (North-Holland Physics Publishing Division)
About l/3 is produced in the troposphere where the residence time is relatively short (l-3 weeks), de- termined mostly by precipitation frequency. The ex- change between stratosphere and troposphere usually takes place in the mid-latitudes during the first part of the year and is also subject to strong fluctuations. The “Be concentration measured at a certain location may therefore be strongly influenced by temporal and re- gional variations of the atmospheric transport processes. This leads to fundamental questions in interpreting “Be profiles: how representative for global changes is a “Be record from one specific location? Are the observed concentration variations caused by local, regional or global effects, and how can we distinguish between the different causes?
There are two approaches to answer these questions. The first is to compare “Be with other records such as i4C and “0. Since 14C is produced in a similar way but shows a completely different geochemical behaviour, a comparison of these two isotopes helps to distinguish between production and transport variations. In fact a detailed “Be study of the Milcent [6] and the Camp Century (Beer et al., in preparation) ice cores revealed short term variations which could unambiguously be related to the so-called “Suess wiggles” in the i4C tree
ring record, indicating the common effect of solar mod- ulation on both isotopes. On the other hand, there is good agreement between “Be and #so records during the Wisconsin, which strongly supports the explanation
III(b). GLACIOLOGY/CLIMATOLOGY
204 J. Beer et al. / “Be measurements on polar ice
that these “Be fluctuations are mainly due to climatic effects.
The second approach, which is the main subject of this paper, is to compare “Be records from different
sites. Since the most detailed continuous “Be record so far available was obtained from the Camp Century ice core in northern Greenland, we have chosen the Byrd core from Antarctica as a counterpart.
2. Experimental
The Byrd core (80° S, 120° W) was drilled by CRREL and reached bedrock at a depth of 2164 m in 1968 [7]. The present-day accumulation rate is about 14 cm of water-equivalent. The mean annual temperature is - 28O C so that melting of ice can be excluded at least in recent year. In contrast to Camp Century, the ice rheology at Byrd station is rather complicated due to the topography of the bedrock and the more variable Holcene climate in the Antarctic than in the Arctic [8]. Unfortunately the core quality is poor for the depth interval 400-900 m.
In order to obtain a semicontinuous profile, a thin slice was cut from every second core tube resulting in samples of l-2 kg of ice corresponding to a depth )I interval of about 10 m. The ice samples were cleaned by rinsing them with deionised water. After melting in a microwave oven 0.5 mg 9Be carrier was added. Then the volume was reduced to about 10 ml by evaporation. Be(OH), was precipitated by adding NH,OH and con- verted into Be0 at 900°C. All measurements were
carried out using the accelerator mass spectrometer of the ETH Zurich [9]. The accuracy of the measurements is 3-lo%, the data are calibrated using our internal “Be standard with an assumed “Be/‘Be ratio of 101.4 X
lo-‘* [lo].
3. Results
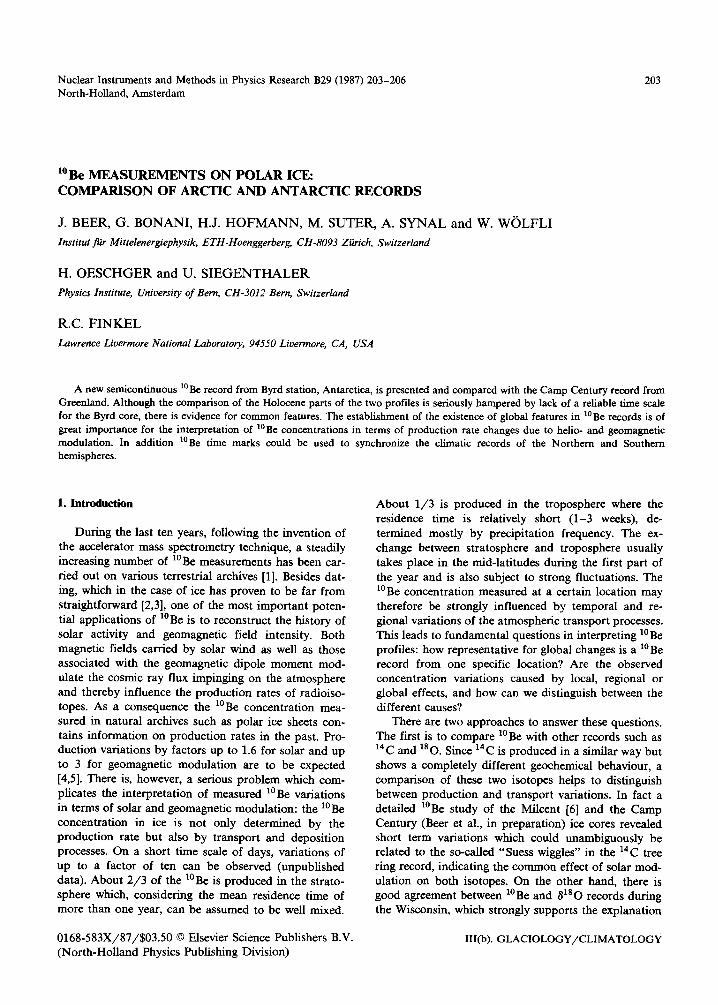
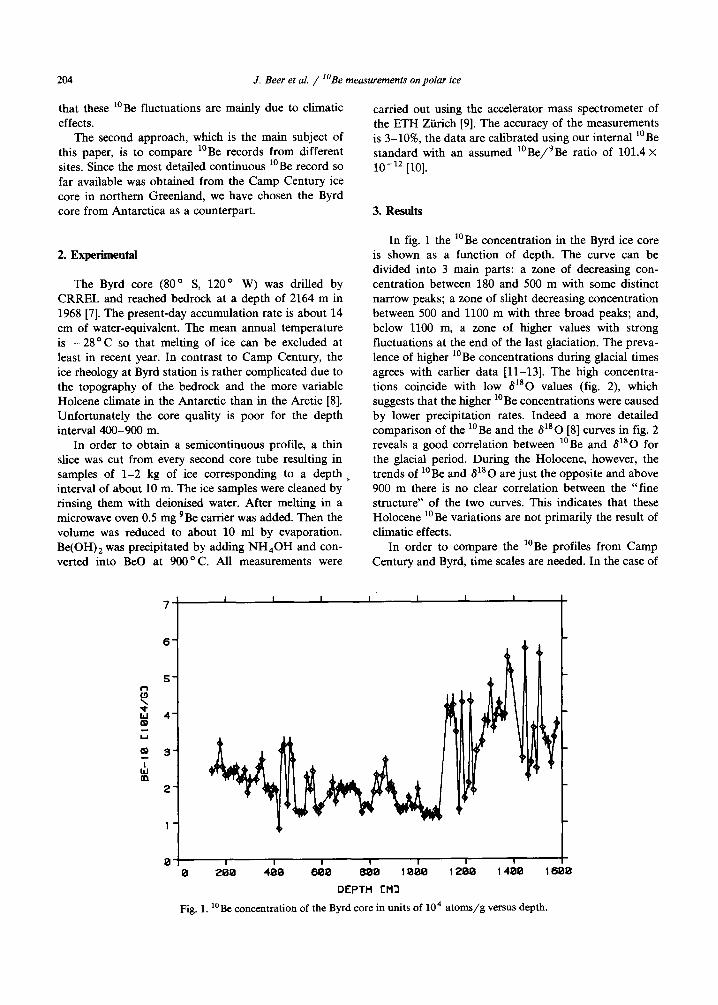
In fig. 1 the loBe concentration in the Byrd ice core is shown as a function of depth. The curve can be divided into 3 main parts: a zone of decreasing con- centration between 180 and 500 m with some distinct narrow peaks; a zone of slight decreasing concentration between 500 and 1100 m with three broad peaks; and, below 1100 m, a zone of higher values with strong fluctuations at the end of the last glaciation. The preva- lence of higher “Be concentrations during glacial times agrees with earlier data [ll-131. The high concentra- tions coincide with low 6180 values (fig. 2) which suggests that the higher “Be concentrations were caused by lower precipitation rates. Indeed a more detailed comparison of the “Be and the S’*O [8] curves in fig. 2 reveals a good correlation between “Be and S’*O for the glacial period. During the Holocene, however, the trends of “Be and al80 are just the opposite and above 900 m there is no clear correlation between the “fine structure” of the two curves. This indicates that these Holocene ‘cBe variations are not primarily the result of climatic effects.
In order to compare the “Be profiles from Camp Century and Byrd, time scales are needed. In the case of
5’
s
is 4- 8 Y
CD 3
IL 0
2-
1-
0 I I I I I I 1 0 200 400 600 600 I000 1200 1400 16
DEPTH CM3
Fig. 1. “Be concentration of the Byrd core in units of lo4 atoms/g versus depth.
J. Beer et al. / “Be measurements on polar ice
I I I
BE-10
I I I
205
-40
a-l
?
-35 s
s L
-30
0 500 1000 1500 2000
DEPTH Ovl)
Fig. 2. “Be concentration and al80 [8] of the Byrd core versus depth.
Camp Century a time scale was constructed using two time marks, the Maunder Minimum period (1645-1715 A.D.) and the transition to the the Younger Dryas (11000 BP). By means of an ice flow model [14] the intermediate depth range was converted into time as- suming a constant accumulation rate. Comparison be-
tween lo Be and l4 C revealed an excellent synchroneity of all the major wiggles during the last 5000 yr. In the
case of the Byrd core, the situation is more difficult. There is an indication of a dip in the 61s0 profile at 1130 m depth, at the end of the Glacial-Holocene transition, which can be interpreted as Younger Dryas cold phase with an age of about 11000 years [15]. However, due to the complex rheological regime it is difficult to accurately model the age-depth relation of the Byrd core. We therefore used the ice flow model
1.5
z ;; 1
W 0
5
0 7- I
: ’
0.5
I I I I I
BYRD
CAMP CENTURY
I I I I I
8000 6000 4000 2000 0 2000
YEAR (f3c/A~)
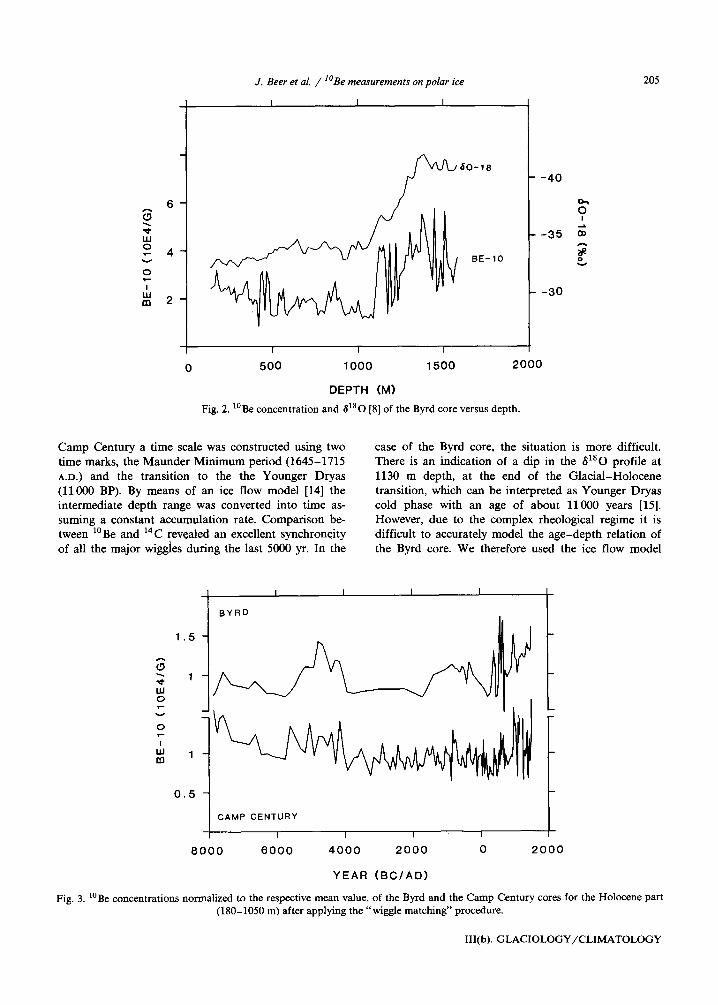
Fig. 3. “Be concentrations normalized to the respective mean value, of the Byrd and the Camp Century cores for the Holocene part
(180-1050 m) after applying the “wiggle matching” procedure.
III(b). GLACIOLOGY/CLIMATOLOGY
206 J. Beer et al. / “Be measurements on polar ice
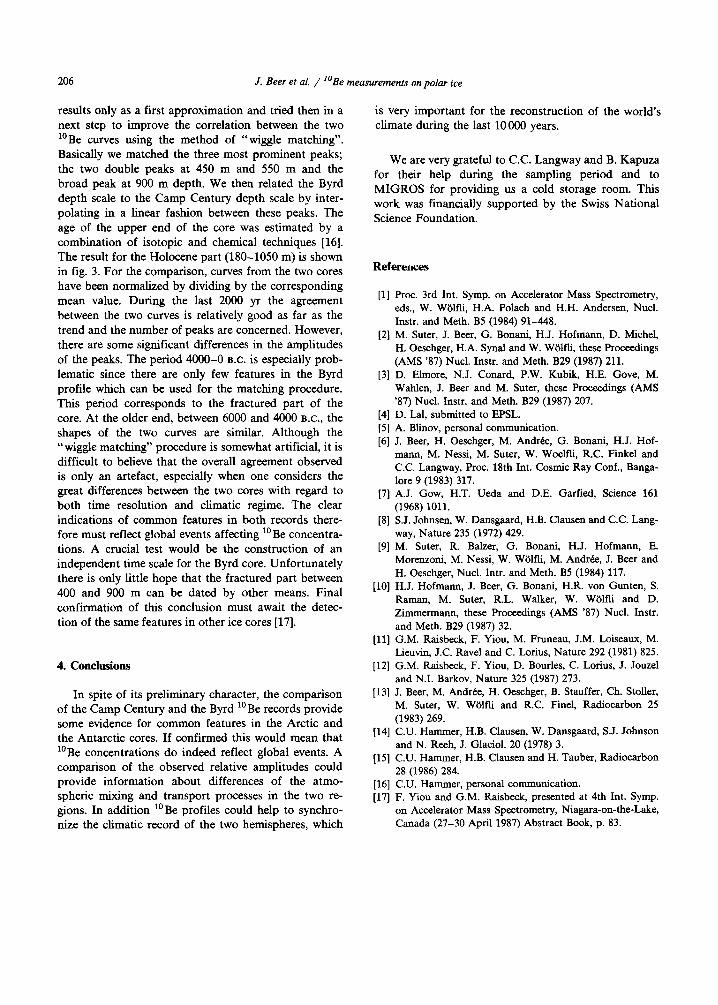
results only as a first approximation and tried then in a next step to improve the correlation between the two “Be curves using the method of “wiggle matching”. Basically we matched the three most prominent peaks; the two double peaks at 450 m and 550 m and the broad peak at 900 m depth. We then related the Byrd depth scale to the Camp Century depth scale by inter- polating in a linear fashion between these peaks. The age of the upper end of the core was estimated by a combination of isotopic and chemical techniques [16]. The result for the Holocene part (180-1050 m) is shown in fig. 3. For the comparison, curves from the two cores have been normalized by dividing by the corresponding mean value. During the last 2000 yr the agreement between the two curves is relatively good as far as the trend and the number of peaks are concerned. However, there are some significant differences in the amplitudes of the peaks. The period 4000-O B.C. is especially prob- lematic since there are only few features in the Byrd profile which can be used for the matching procedure. This period corresponds to the fractured part of the core. At the older end, between 6000 and 4000 B.C., the shapes of the two curves are similar. Although the “wiggle matching” procedure is somewhat artificial, it is difficult to believe that the overall agreement observed is only an artefact, especially when one considers the great differences between the two cores with regard to both time resolution and climatic regime. The clear indications of common features in both records there- fore must reflect global events affecting “Be concentra- tions. A crucial test would be the construction of an independent time scale for the Byrd core. Unfortunately there is only little hope that the fractured part between 400 and 900 m can be dated by other means. Final confirmation of this conclusion must await the detec- tion of the same features in other ice cores [17].
4. Conclusions
In spite of its preliminary character, the comparison of the Camp Century and the Byrd “Be records provide some evidence for common features in the Arctic and the Antarctic cores. If confirmed this would mean that “Be concentrations do indeed reflect global events. A comparison of the observed relative amplitudes could provide information about differences of the atmo- spheric mixing and transport processes in the two re- gions. In addition “Be profiles could help to synchro- nize the climatic record of the two hemispheres, which
is very important for the reconstruction of the world’s climate during the last 10000 years.
We are very grateful to C.C. Langway and B. Kapuza for their help during the sampling period and to MIGROS for providing us a cold storage room. This work was financially supported by the Swiss National Science Foundation.
References
[l] Proc. 3rd Int. Symp. on Accelerator Mass Spectrometry,
eds., W. Wi%li, H.A. Polach and H.H. Andersen, Nucl.
Instr. and Meth. B5 (1984) 91-448.
[2] M. Suter, J. Beer, G. Bonani, H.J. Hofmann, D. Michel,
H. Oeschger, H.A. Spa1 and W. Wolfli, these Proceedings
(AMS ‘87) Nucl. Instr. and Meth. B29 (1987) 211.
[3] D. Elmore, N.J. Conard, P.W. Kubik, H.E. Gove, M.
WahIen, J. Beer and M. Suter, these Proceedings (AMS
‘87) Nucl. Instr. and Meth. B29 (1987) 207.
[4] D. LaI, submitted to EPSL.
[5] A. Blinov, personal communication.
[6] J. Beer, H. Oeschger, M. And&e, G. Bonani, H.J. Hof-
mama, M. Nessi, M. Suter, W. Woelfli, R.C. Finkel and
C.C. Langway, Proc. 18th Int. Cosmic Ray Conf., Banga-
lore 9 (1983) 317. [7] A.J. Gow, H.T. Ueda and D.E. Garfied, Science 161
(1968) 1011. [8] S.J. Johnsen, W. Dansgaard, H.B. Clausen and C.C. Lang-
way, Nature 235 (1972) 429.
[9] M. Suter, R. Balzer, G. Bonani, H.J. Hofmann, E.
Morenzoni, M. Nessi, W. Wolfli, M. And&e, J. Beer and
H. Oeschger, Nucl. Intr. and Meth. BS (1984) 117.
[lo] H.J. Hofmamr, J. Beer, G. Bonani, H.R. von Gunten, S.
Raman, M. Suter, R.L. WaIker, W. Wolfli and D.
Zimmermamr, these Proceedings (AMS ‘87) Nucl. Instr.
and Meth. B29 (1987) 32.
[ll] G.M. Raisbeck, F. Yiou, M. Fnmeau, J.M. Loiseaux, M.
Lieuvin, J.C. Ravel and C. Lorius, Nature 292 (1981) 825.
[12] G.M. Raisbeck, F. Yiou, D. Bourles, C. Lorius, J. Jouzel
and N.I. Barkov, Nature 325 (1987) 273.
[13] J. Beer, M. And&, H. Oeschger, B. Stauffer, Ch. StolIer,
M. Suter, W. Wolfli and R.C. Finel, Radiocarbon 25
(1983) 269. [14] C.U. Hammer, H.B. Clausen, W. Dansgaard, S.J. Johnson
and N. Reeh, J. Glacial. 20 (1978) 3.
[15] C.U. Hammer, H.B. Clausen and H. Tauber, Radiocarbon
28 (1986) 284. [16] C.U. Hammer, personal communication.
[17] F. Yiou and G.M. Raisbeck, presented at 4th Int. Symp.
on Accelerator Mass Spectrometry, Niagara-on-the-Lake,
Canada (27-30 April 1987) Abstract Book, p. 83.