Embed Size (px)
Citation preview
Awareness as an adaptation strategy for reducing health impact from Heat Waves: Evidence from a
Disaster Risk Management Program in India
Saudamini Das, Asso Prof. Institute of Economic Growth, Delhi & SANDEE Fellow
Economics of Climate Change Adaptation Workshop, UNDP, ADAPT ASIA-PACIFIC Workshop, 24-26 Oct 2012, Bangkok
The views expressed are those of the presenter and should not be attributed to either UNDP or USAID. Furthermore, it is strongly recommended that both the PowerPoint slides and the videos of the presentation of content included herein are viewed in conjunction in order that statements appearing in the PowerPoint slides are not interpreted out of context.
Heat Waves – Spell of hot & humid weather
Under normal conditions, the body’s internal thermostat produces perspiration that evaporates and cools the body.
In extreme heat and high humidity, evaporation is slowed and the body has to work extra hard to maintain normal temperature. If core body temperature exceeds 40.6 C, heat stroke occurs causing death.
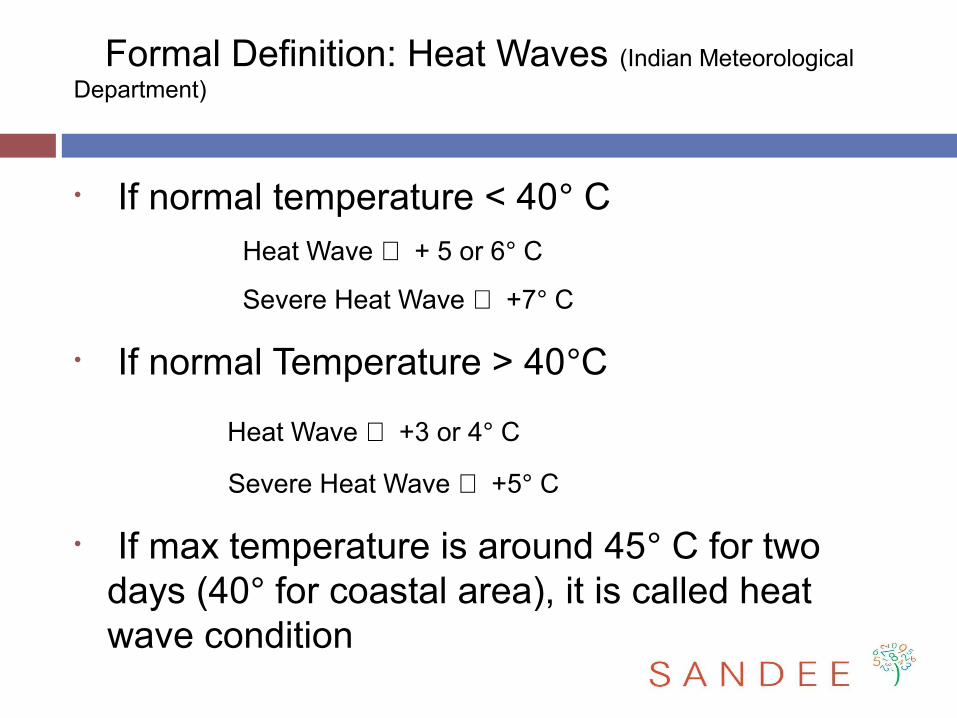
• If normal temperature < 40° C Heat Wave ⇒ + 5 or 6° C
Severe Heat Wave ⇒ +7° C
• If normal Temperature > 40°C
Heat Wave ⇒ +3 or 4° C
Severe Heat Wave ⇒ +5° C
• If max temperature is around 45° C for two days (40° for coastal area), it is called heat wave condition
Formal Definition: Heat Waves (Indian Meteorological Department)
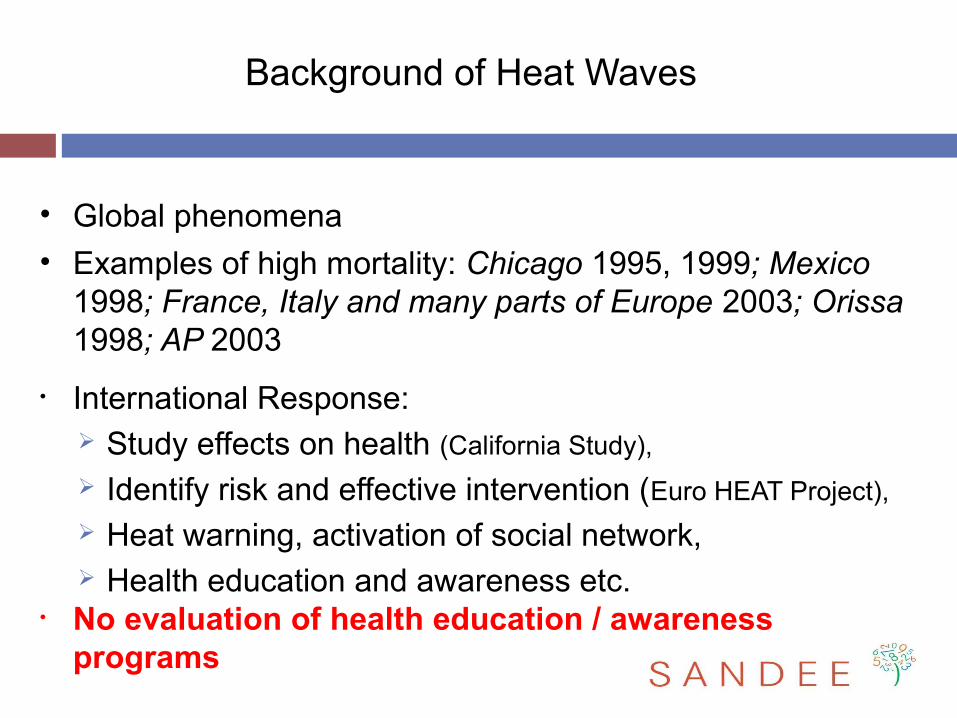
Background of Heat Waves
• Global phenomena
• Examples of high mortality: Chicago 1995, 1999; Mexico 1998; France, Italy and many parts of Europe 2003; Orissa 1998; AP 2003
• International Response: Study effects on health (California Study),
Identify risk and effective intervention (Euro HEAT Project),
Heat warning, activation of social network, Health education and awareness etc.
• No evaluation of health education / awareness programs
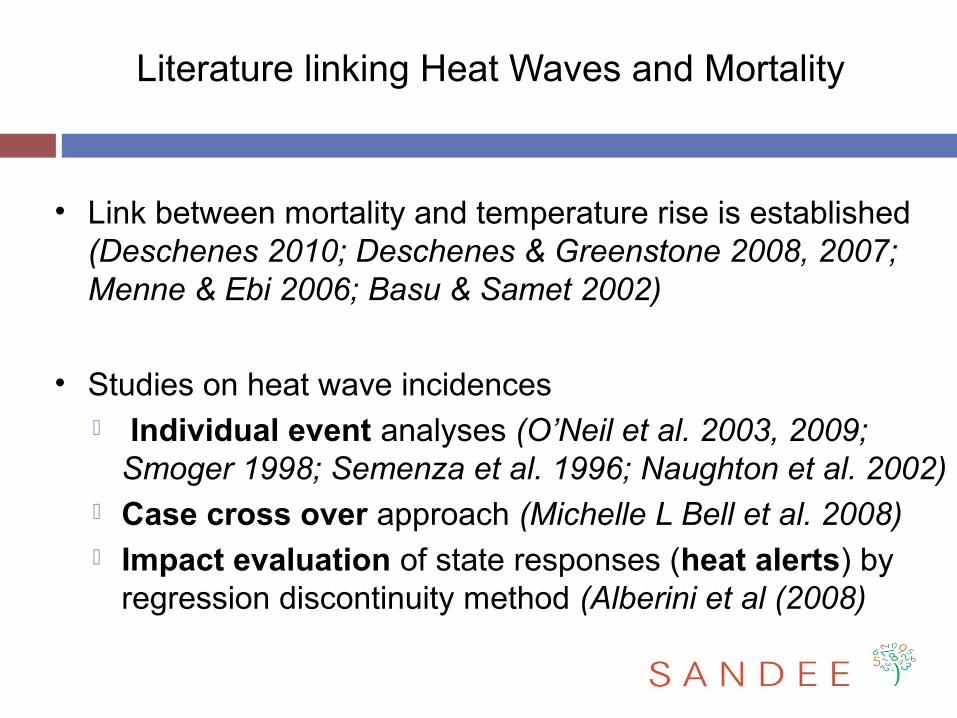
Literature linking Heat Waves and Mortality
• Link between mortality and temperature rise is established (Deschenes 2010; Deschenes & Greenstone 2008, 2007; Menne & Ebi 2006; Basu & Samet 2002)
• Studies on heat wave incidences Individual event analyses (O’Neil et al. 2003, 2009;
Smoger 1998; Semenza et al. 1996; Naughton et al. 2002) Case cross over approach (Michelle L Bell et al. 2008) Impact evaluation of state responses (heat alerts) by
regression discontinuity method (Alberini et al (2008)
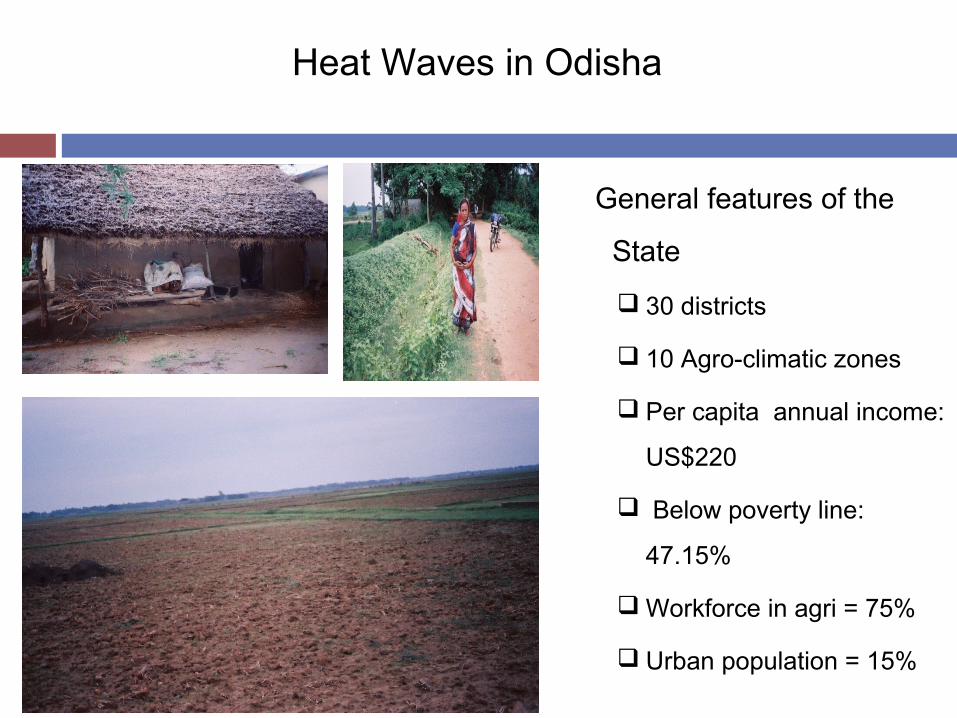
Heat Waves in Odisha
General features of the
State
30 districts
10 Agro-climatic zones
Per capita annual income:
US$220
Below poverty line:
47.15%
Workforce in agri = 75%
Urban population = 15%
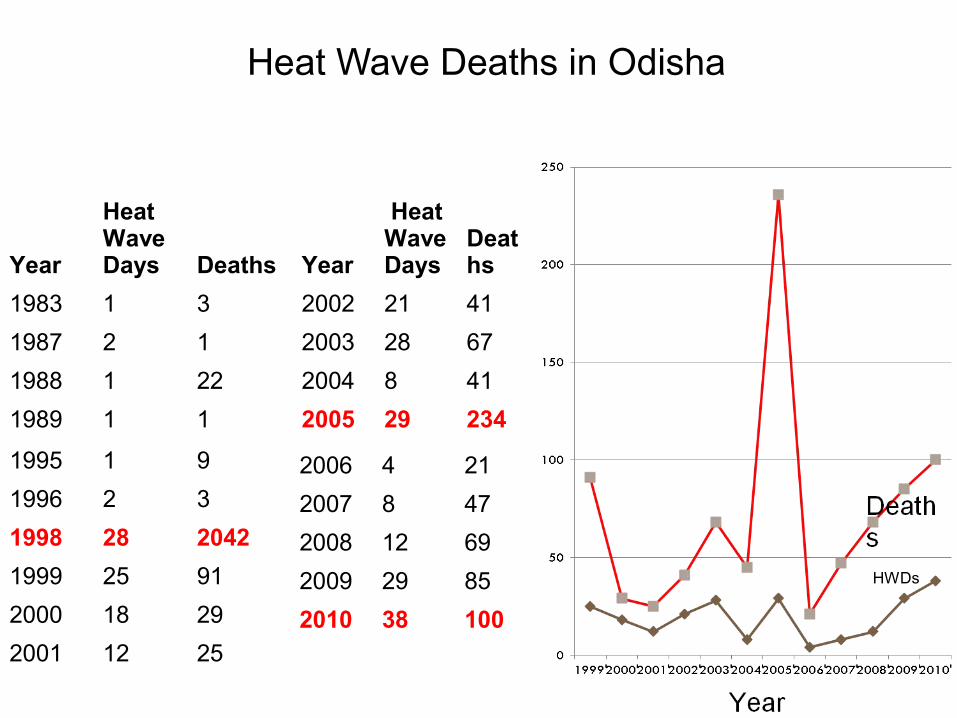
Heat Wave Deaths in Odisha
Year
Heat Wave Days Deaths Year
Heat Wave Days
Deaths
1983 1 3 2002 21 41
1987 2 1 2003 28 67
1988 1 22 2004 8 41
1989 1 1 2005 29 234
1995 1 9 2006 4 21
1996 2 3 2007 8 47
1998 28 2042 2008 12 69
1999 25 91 2009 29 85
2000 18 29 2010 38 100
2001 12 25
HWDs
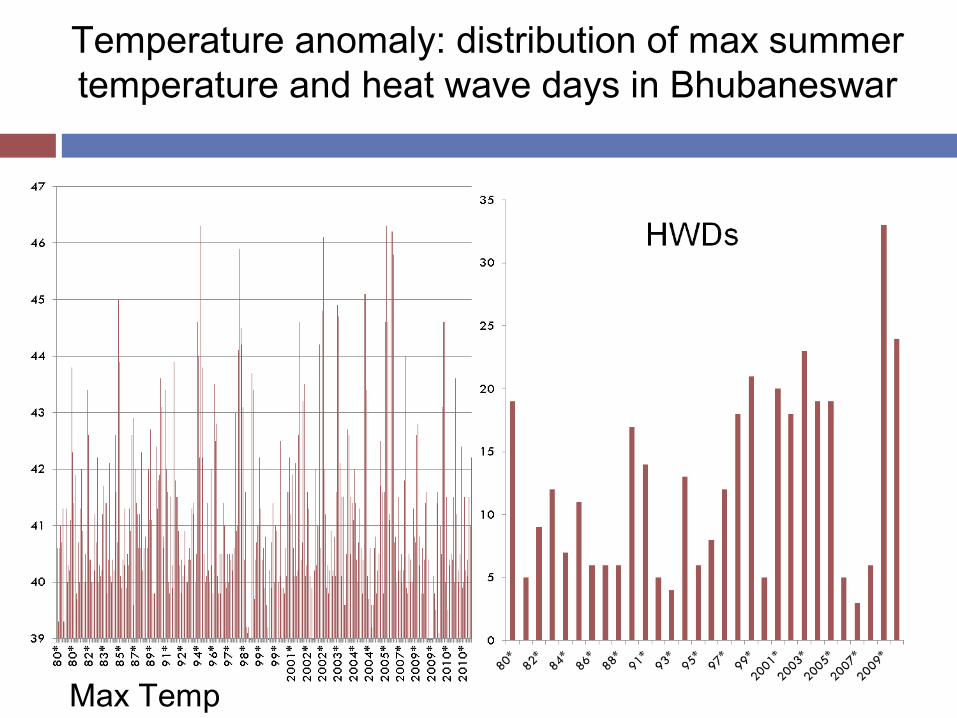
Temperature anomaly: distribution of max summer temperature and heat wave days in Bhubaneswar
Max Temp
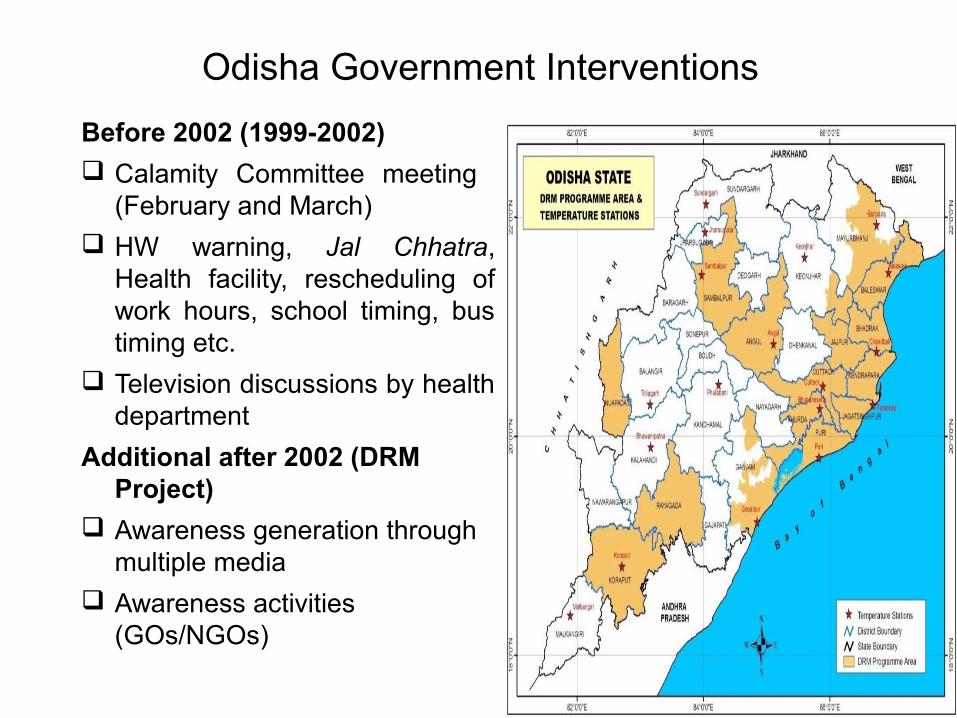
Odisha Government Interventions
Before 2002 (1999-2002)
Calamity Committee meeting (February and March)
HW warning, Jal Chhatra, Health facility, rescheduling of work hours, school timing, bus timing etc.
Television discussions by health department
Additional after 2002 (DRM Project)
Awareness generation through multiple media
Awareness activities (GOs/NGOs)

Posters & Advertisements
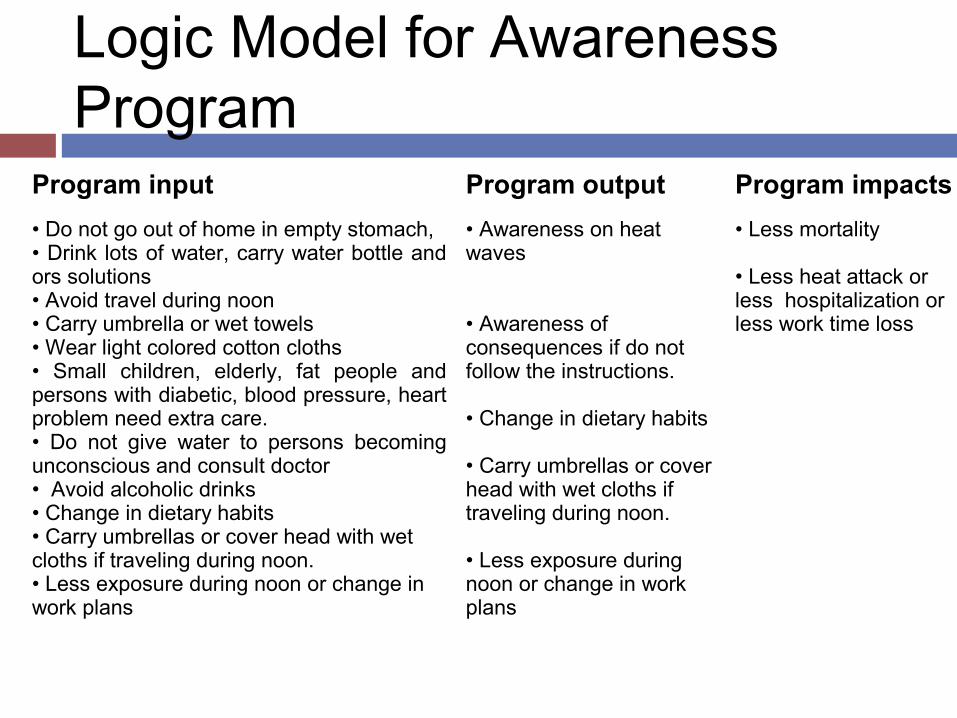
Logic Model for Awareness Program
Program input Program output Program impacts
• Do not go out of home in empty stomach,• Drink lots of water, carry water bottle and ors solutions• Avoid travel during noon• Carry umbrella or wet towels• Wear light colored cotton cloths• Small children, elderly, fat people and persons with diabetic, blood pressure, heart problem need extra care.• Do not give water to persons becoming unconscious and consult doctor• Avoid alcoholic drinks• Change in dietary habits• Carry umbrellas or cover head with wet cloths if traveling during noon.• Less exposure during noon or change in work plans
• Awareness on heat waves
• Awareness of consequences if do not follow the instructions.
• Change in dietary habits
• Carry umbrellas or cover head with wet cloths if traveling during noon.
• Less exposure during noon or change in work plans
• Less mortality
• Less heat attack or less hospitalization or less work time loss
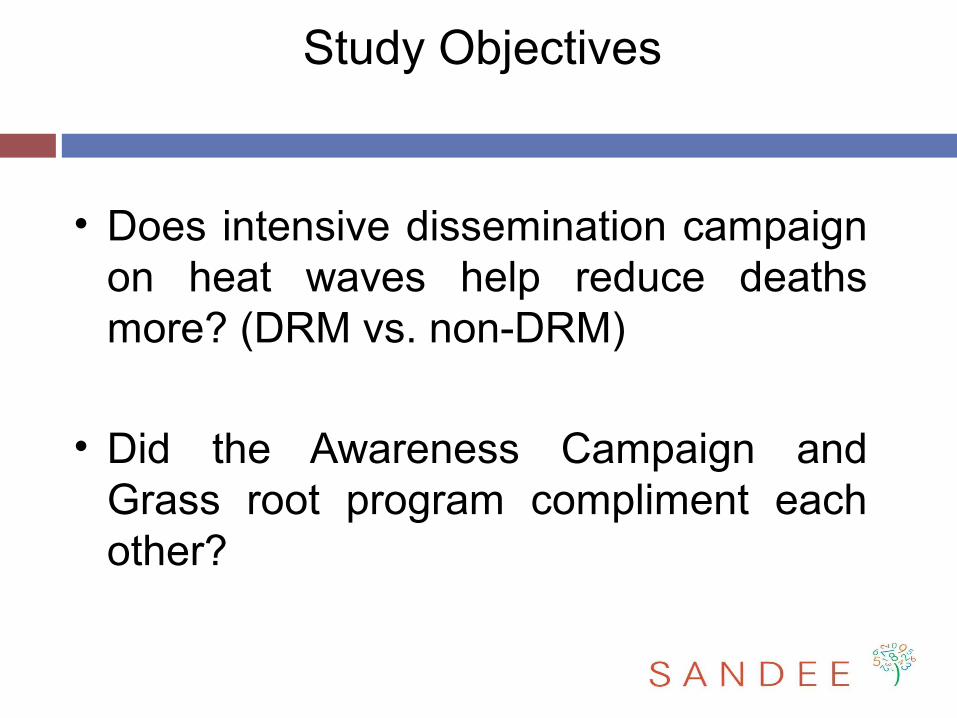
Study Objectives
• Does intensive dissemination campaign on heat waves help reduce deaths more? (DRM vs. non-DRM)
• Did the Awareness Campaign and Grass root program compliment each other?
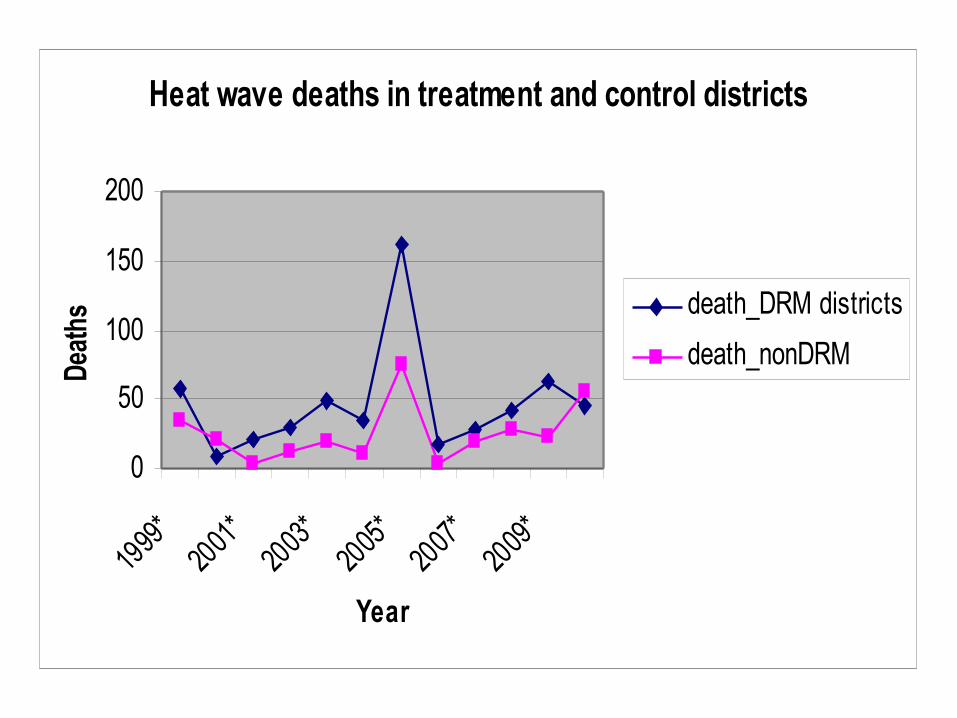
Heat wave deaths in treatment and control districts
0
50
100
150
200
1999
*20
01*
2003
*20
05*
2007
*20
09*
Year
Deat
hs
death_DRM districts
death_nonDRM
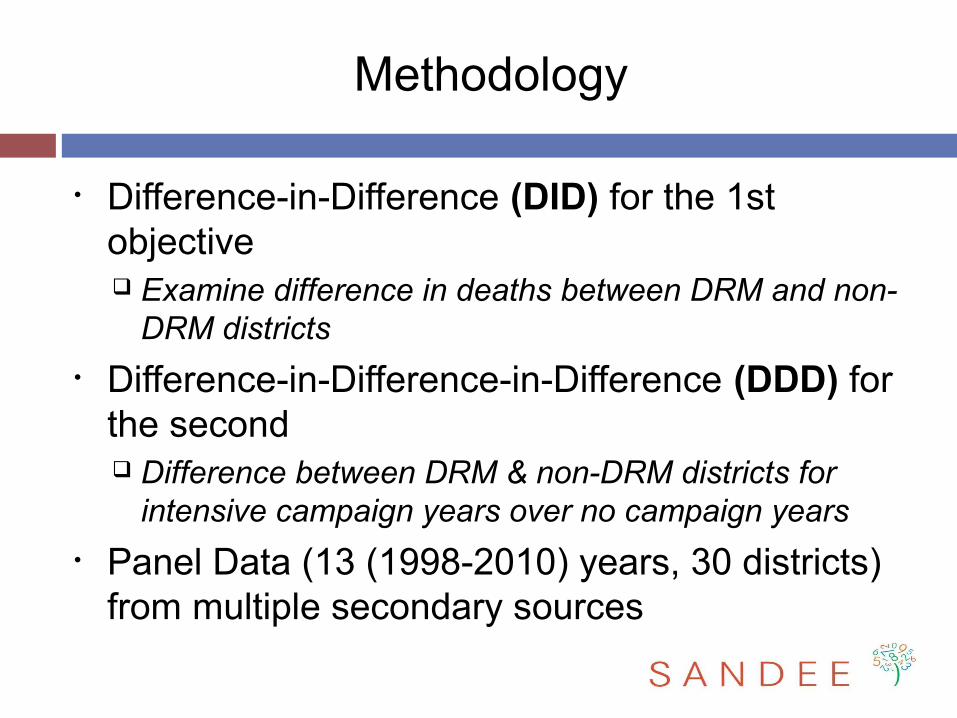
Methodology
• Difference-in-Difference (DID) for the 1st objective Examine difference in deaths between DRM and non-
DRM districts
• Difference-in-Difference-in-Difference (DDD) for the second Difference between DRM & non-DRM districts for
intensive campaign years over no campaign years
• Panel Data (13 (1998-2010) years, 30 districts) from multiple secondary sources
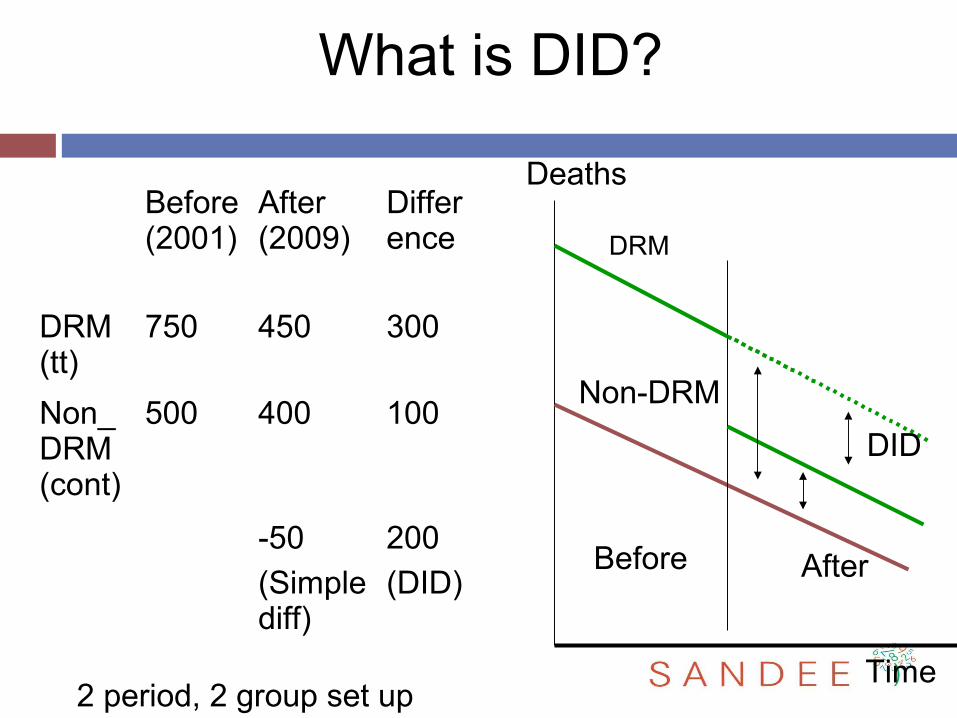
What is DID?
Before (2001)
After (2009)
Difference
DRM (tt)
750 450 300
Non_DRM (cont)
500 400 100
-50
(Simple diff)
200
(DID)
Deaths
Time
Before After
DRM
Non-DRM
DID
2 period, 2 group set up
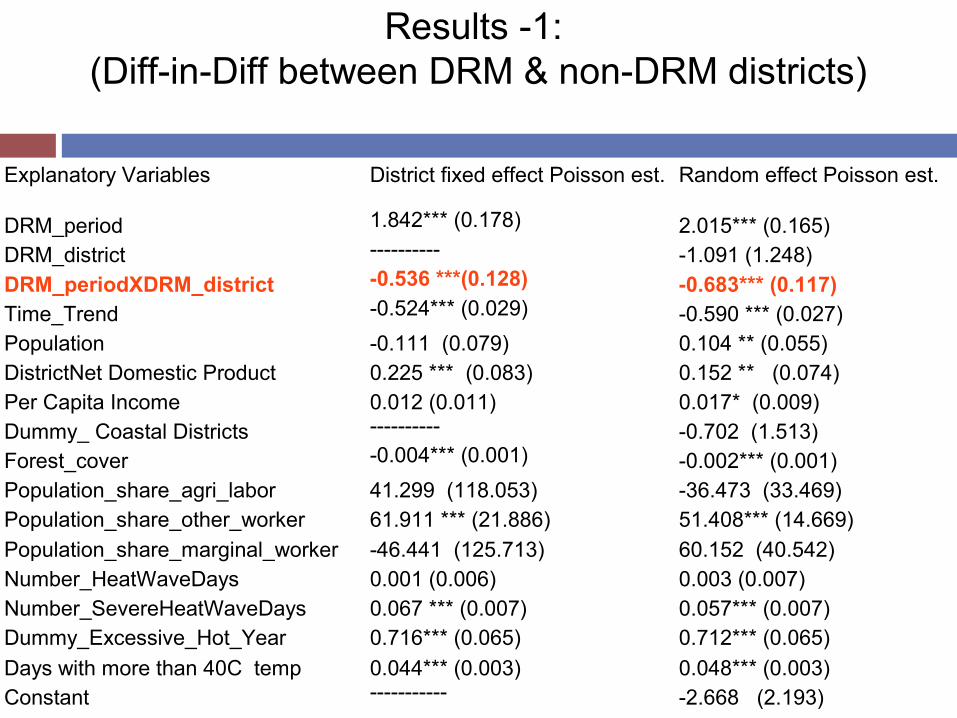
Results -1: (Diff-in-Diff between DRM & non-DRM districts)
Explanatory Variables District fixed effect Poisson est. Random effect Poisson est.
DRM_period 1.842*** (0.178) 2.015*** (0.165)DRM_district ---------- -1.091 (1.248)DRM_periodXDRM_district -0.536 ***(0.128) -0.683*** (0.117)Time_Trend -0.524*** (0.029) -0.590 *** (0.027)Population -0.111 (0.079) 0.104 ** (0.055)DistrictNet Domestic Product 0.225 *** (0.083) 0.152 ** (0.074)Per Capita Income 0.012 (0.011) 0.017* (0.009)Dummy_ Coastal Districts ---------- -0.702 (1.513)Forest_cover -0.004*** (0.001) -0.002*** (0.001)Population_share_agri_labor 41.299 (118.053) -36.473 (33.469)Population_share_other_worker 61.911 *** (21.886) 51.408*** (14.669)
Population_share_marginal_worker -46.441 (125.713) 60.152 (40.542)Number_HeatWaveDays 0.001 (0.006) 0.003 (0.007)Number_SevereHeatWaveDays 0.067 *** (0.007) 0.057*** (0.007)Dummy_Excessive_Hot_Year 0.716*** (0.065) 0.712*** (0.065)
Days with more than 40C temp 0.044*** (0.003) 0.048*** (0.003)Constant ----------- -2.668 (2.193)
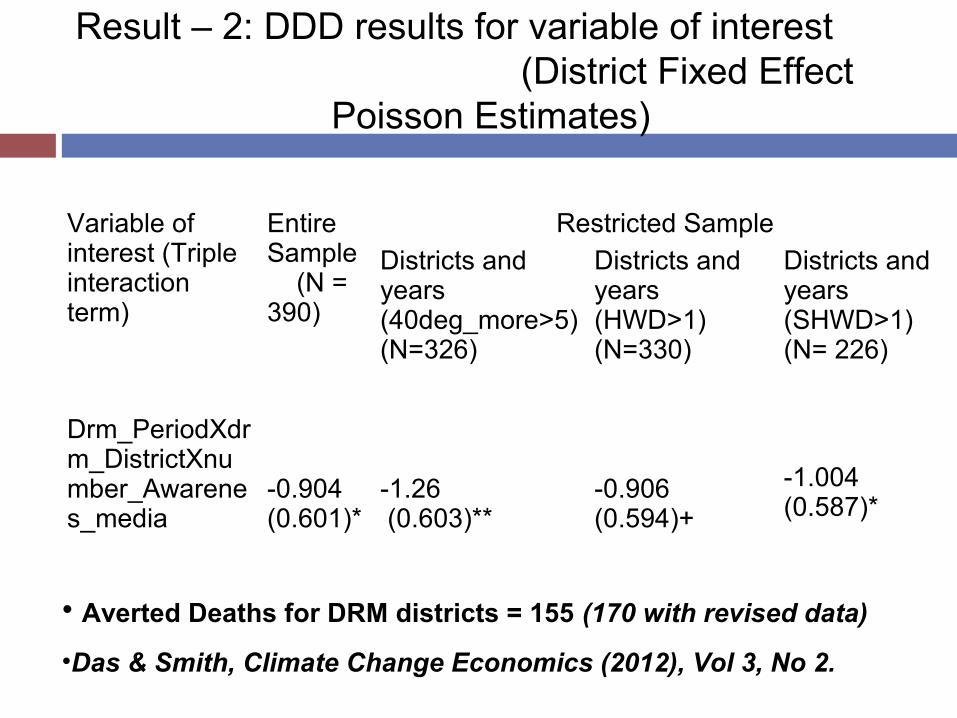
Result – 2: DDD results for variable of interest (District Fixed Effect
Poisson Estimates)
Variable of interest (Triple interaction term)
Entire Sample (N = 390)
Restricted Sample
Districts and years (40deg_more>5) (N=326)
Districts and years (HWD>1) (N=330)
Districts and years (SHWD>1) (N= 226)
Drm_PeriodXdrm_DistrictXnumber_Awarenes_media
-0.904 (0.601)*
-1.26 (0.603)**
-0.906 (0.594)+
-1.004 (0.587)*
• Averted Deaths for DRM districts = 155 (170 with revised data)
•Das & Smith, Climate Change Economics (2012), Vol 3, No 2.
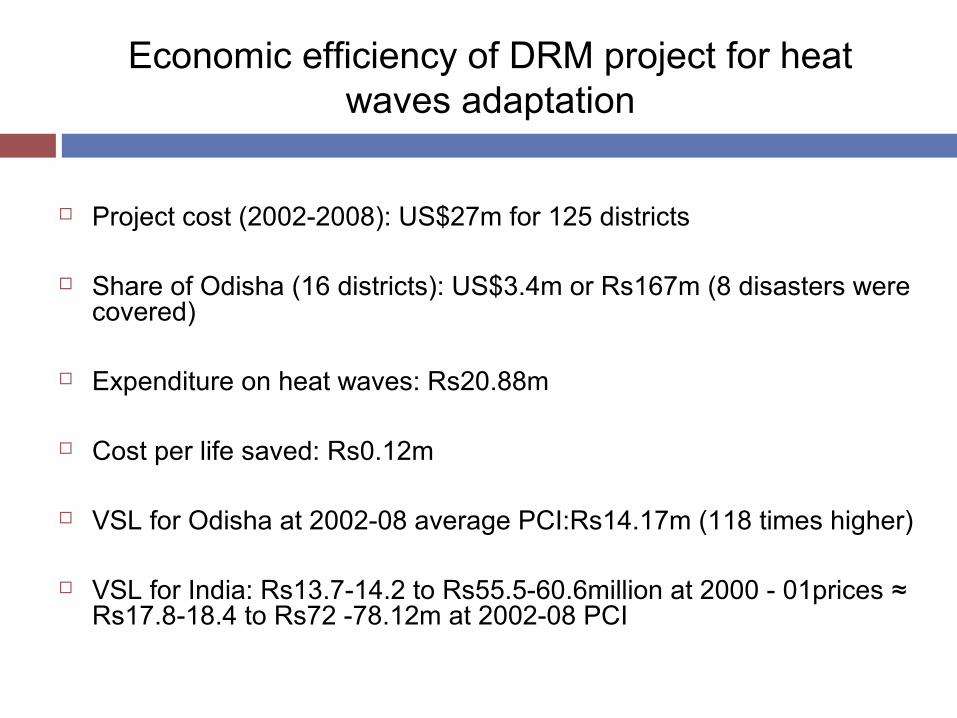
Economic efficiency of DRM project for heat waves adaptation
Project cost (2002-2008): US$27m for 125 districts
Share of Odisha (16 districts): US$3.4m or Rs167m (8 disasters were covered)
Expenditure on heat waves: Rs20.88m
Cost per life saved: Rs0.12m
VSL for Odisha at 2002-08 average PCI:Rs14.17m (118 times higher)
VSL for India: Rs13.7-14.2 to Rs55.5-60.6million at 2000 - 01prices ≈ Rs17.8-18.4 to Rs72 -78.12m at 2002-08 PCI
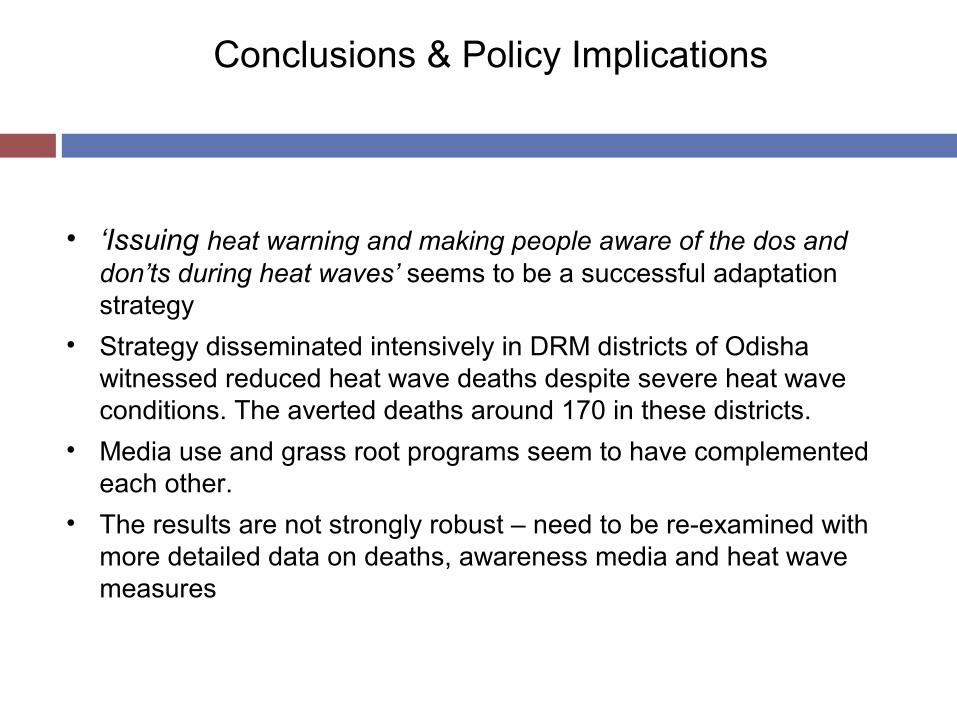
Conclusions & Policy Implications
• ‘Issuing heat warning and making people aware of the dos and don’ts during heat waves’ seems to be a successful adaptation strategy
• Strategy disseminated intensively in DRM districts of Odisha witnessed reduced heat wave deaths despite severe heat wave conditions. The averted deaths around 170 in these districts.
• Media use and grass root programs seem to have complemented each other.
• The results are not strongly robust – need to be re-examined with more detailed data on deaths, awareness media and heat wave measures
THANKS !!!!