Embed Size (px)
Citation preview

1 23
Lasers in Medical Science ISSN 0268-8921 Lasers Med SciDOI 10.1007/s10103-019-02894-2
Elastic scattering spectroscopy formonitoring skin cancer transformation andtherapy in the near infrared window
Kawthar Shurrab, Nabil Kochaji &Wesam Bachir
1 23
Your article is protected by copyright and all
rights are held exclusively by Springer-Verlag
London Ltd., part of Springer Nature. This e-
offprint is for personal use only and shall not
be self-archived in electronic repositories. If
you wish to self-archive your article, please
use the accepted manuscript version for
posting on your own website. You may
further deposit the accepted manuscript
version in any repository, provided it is only
made publicly available 12 months after
official publication or later and provided
acknowledgement is given to the original
source of publication and a link is inserted
to the published article on Springer's
website. The link must be accompanied by
the following text: "The final publication is
available at link.springer.com”.
ORIGINAL ARTICLE
Elastic scattering spectroscopy for monitoring skin cancertransformation and therapy in the near infrared window
Kawthar Shurrab1& Nabil Kochaji2 & Wesam Bachir3,4
Received: 1 August 2019 /Accepted: 26 September 2019# Springer-Verlag London Ltd., part of Springer Nature 2019
AbstractThere is a pressing need for monitoring cancerous tissue response to laser therapy. In this work, we evaluate the viability of elasticscattering spectroscopy (ESS) to monitor malignant transformations and effects of laser therapy of induced skin cancer in ahamster model. Skin tumors were induced in 35 mice, half of which were irradiated with 980 nm laser diode. Physiological andmorphological transformations in the tumor were monitored over a period of 36 weeks using elastic scattering spectroscopy, inthe near infrared window. Analytical model for light scattering was used to derive scattering optical properties for both trans-formed tissue and laser-treated cancer. The tissue scattering over the wavelength range (700–950 nm) decreased remarkably asthe carcinogen-induced tissue transformed towards higher stages. Conversely, reduced scattering coefficient noticeably increasedwith increasing the number of laser irradiation sessions for the treated tumors. The relative changes in elastic scattering signal fortransformed tissue were significantly different (p < .05). Elastic scattering signal intensity for laser-treated tissue was alsosignificantly different (p < .05). Reduced scattering coefficient of treated tissue exhibited nearly 80% recovery of its normalskin value at the end of the experiment, and the treatment outcome could be improved by adjusting the number of sessions, whichwe can predict through spectroscopic optical feedback. This study demonstrates that ESS can quantitatively provide functionalinformation that closely corresponds to the degree of pathologic transformation. ESS may well be a viable technique to optimizesystemic melanoma and non-melanoma skin cancer treatment based on noninvasive tumor response.
Keywords Optical properties . Elastic scattering . Skin cancer . Diode laser . Spectroscopy
Introduction
To date, sustained and long-term recovery has been the mainobjective of most cancer treatments. Commonly used treat-ment methods such as radiation therapy and chemotherapy
are used to decrease tumor size especially at advanced stagesbefore surgical resection [1, 2]. This may allow full resectionand function preservation. Nevertheless, patients do responddifferently to these therapies. This may be attributed to differ-ences in tissue functionality among individuals, which re-quires different treatment dosimetry [3]. An effective lasertherapy can be related to reduction in tumor size, but thiscan take up to several months to observe [4]. On the otherhand, tissue transformations in tumor functional and physicalproperties can be noticed well before changes in tumor shapeare observed [5, 6].
Accordingly, a wide array of methods that are sensitive tothese changes was devised to allow for early and effectivetreatment plan. Commonly used methods are positron emis-sion tomography [7, 8], magnetic resonance imaging [9], andcomputed tomography [10, 11]. In fact, these modalities re-quire the injection of contrast agents for accurate diagnosis.Moreover, contrast agents provide information about tumorvascular parameters such as blood flow and permeability thatcan be difficult to quantify accurately [12]. Alternatively,
We state that this is an original article that has not been previouslypublished, and that it is not simultaneously under consideration by anyother journal
* Kawthar [email protected]
1 Biomedical Photonics Laboratory, Higher Institute for LaserResearch and Applications, Damascus University, Damascus, Syria
2 Faculty of Dentistry, Al-Sham Private University, Damascus, Syria3 Biomedical Photonics Laboratory, Higher Institute for Laser
Research and Applications, Damascus University, Damascus, Syria4 Faculty of Informatics Engineering, Al-Sham Private University,
Al-Baramkeh, Damascus, Syria
Lasers in Medical Sciencehttps://doi.org/10.1007/s10103-019-02894-2
Author's personal copy
optical techniques have shown great potential for monitoringlaser therapy such as optical coherence tomography (OCT)which can potentially give a required diagnostic informationeliminating the need for undesired biopsies that may causepain, anxiety, and trauma to the patients [13]. In addition,quantitative analysis of OCT images has been investigated todifferentiate biological tissue [14]. Recent research has fo-cused on low-cost diffuse optical methods that are frequentlyused for diagnostic purposes as well [15]. These methodsallow therapy outcome to be predicted as well as providefeedback to enhance tumor therapy. Also, optical techniquesallow the extraction of inherent optical properties, mainly ab-sorption and scattering coefficients, of living tissue. Tissueabsorption contains information related to the concentrationof biological chromophores, such as hemoglobin, water,lipids, and many others. This can be used to quantify physio-logical responses of treated tumors to laser therapy [16]. Also,the scattering parameters provide information about the struc-ture and composition of tissue including cells and subcellularelements [17]. This information can indicate variation in phys-iological activities taking place in growing tumors and thusleads to increased scattering coefficient for the tumor.Therefore, optical diagnostic instrumentation can providefunctional and structural information about tissue transforma-tion before and after laser therapy [18, 19].
The aim of the present study is to investigate the efficacy ofelastic scattering spectroscopy to monitor the scattering com-ponent of skin cancer response in the near infrared spectrumduring cancer transformations and after treatment with 980 nmlaser diode using a hamster model for induced skin cancer.
Materials and methods
Animal model
In this work, 35 hamsters (10–12 weeks of age) were used.They were kept in healthy conditions and at the laboratorytemperature. A solution of 9, 10-dime thy 1-1, 2-benzanthracene (DMBA) was mainly used as a carcinogensolution in hamster skin [20, 21]. The area of interest on theskin was marked by a permanent ink pen to follow up thepossible changes throughout the experiment. Specific solu-tions were applied topically on the back of hamster that is onthe skin surface. A 980 nm Diode laser was used in a contin-uous mode with laser irradiation of 0.5 W, and the powerdensity of the laser at the skin surface was 50 W/cm2. Thetreatment fiber diameter was 200 μm. Laser irradiation wasapplied once a week, from the onset of tumor until the end ofthe experiment [22]. All hamsters were checked on a weeklybasis, and monitored until spontaneous death, or were killedduring the experiment.
Skin tissue sample was sandwiched between two glass mi-croscope slides. The slides were cleaned with pure cellulosetissue that were wetted with isopropyl alcohol to get rid of anyimpurities or stains might be placed on the surface, and thenimmersing these slides in isopropyl alcohol for 1 min followedby a drying process with proper hot air.
All elastic scattering spectra were recorded at the sameangle with reference to the surface of the slide and at the fixeddistance from the sample, and then the scattering measure-ments were taken in the wavelength range of (400–1000nm). The sources of uncertainties were maintaining stable,like (light, temperature, and humidity), and uncertainty wereapproximately ± 1%. The spectrum was measured in a darkroomwith ambient laboratory conditions. Also, the calibrationprocedures were used to normalize variability in the spectralresponse. The samples were fixed in formalin until the timingof spectroscopic measurements.
Elastic scattering spectroscopy
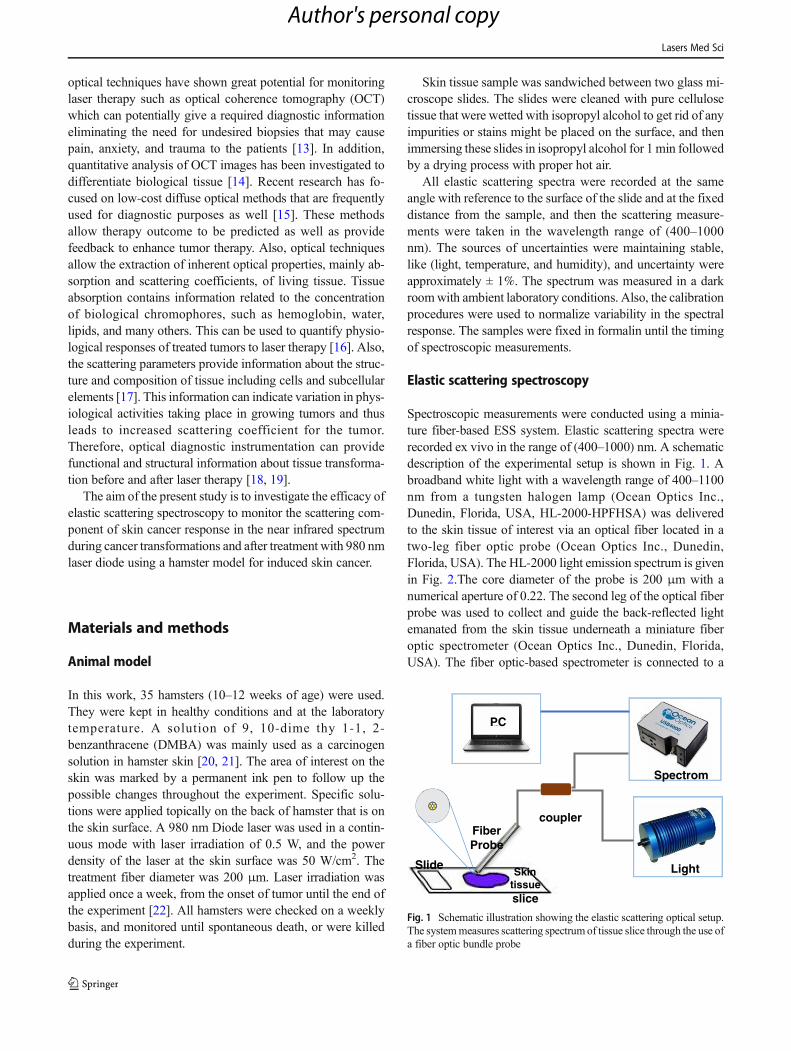
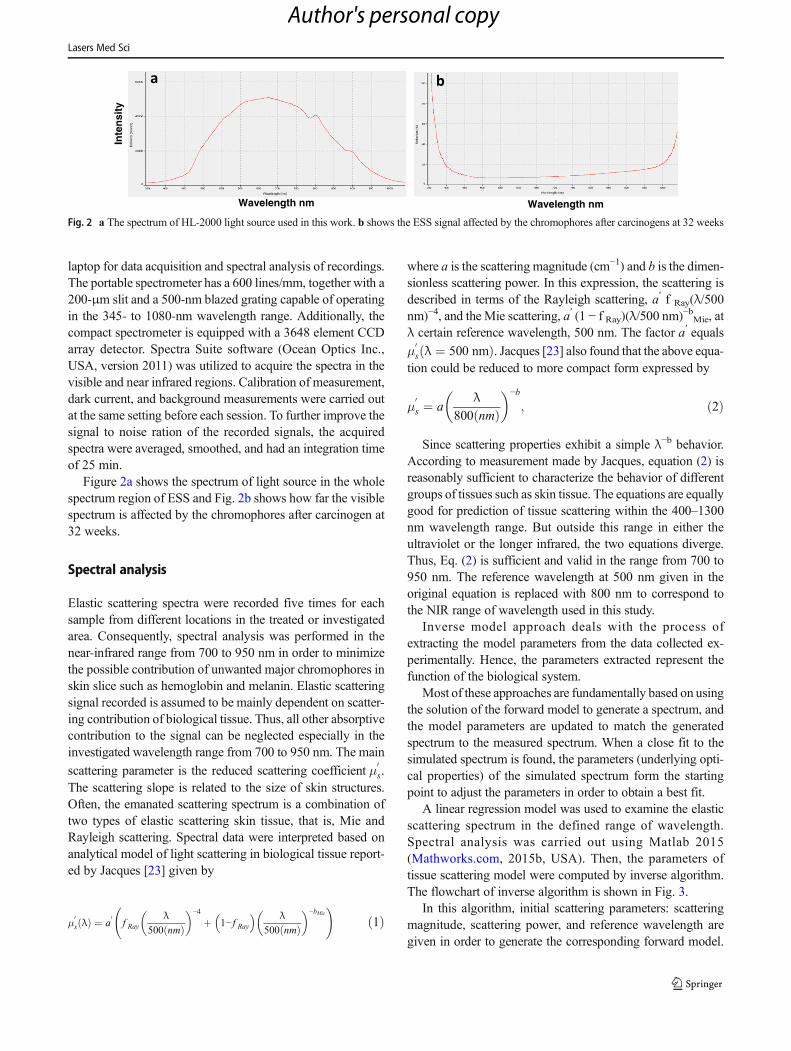
Spectroscopic measurements were conducted using a minia-ture fiber-based ESS system. Elastic scattering spectra wererecorded ex vivo in the range of (400–1000) nm. A schematicdescription of the experimental setup is shown in Fig. 1. Abroadband white light with a wavelength range of 400–1100nm from a tungsten halogen lamp (Ocean Optics Inc.,Dunedin, Florida, USA, HL-2000-HPFHSA) was deliveredto the skin tissue of interest via an optical fiber located in atwo-leg fiber optic probe (Ocean Optics Inc., Dunedin,Florida, USA). The HL-2000 light emission spectrum is givenin Fig. 2.The core diameter of the probe is 200 μm with anumerical aperture of 0.22. The second leg of the optical fiberprobe was used to collect and guide the back-reflected lightemanated from the skin tissue underneath a miniature fiberoptic spectrometer (Ocean Optics Inc., Dunedin, Florida,USA). The fiber optic-based spectrometer is connected to a
Fiber Probe
coupler
PC
Spectrom
Light Skintissueslice
Slide
Fig. 1 Schematic illustration showing the elastic scattering optical setup.The systemmeasures scattering spectrumof tissue slice through the use ofa fiber optic bundle probe
Lasers Med Sci
Author's personal copy
laptop for data acquisition and spectral analysis of recordings.The portable spectrometer has a 600 lines/mm, together with a200-μm slit and a 500-nm blazed grating capable of operatingin the 345- to 1080-nm wavelength range. Additionally, thecompact spectrometer is equipped with a 3648 element CCDarray detector. Spectra Suite software (Ocean Optics Inc.,USA, version 2011) was utilized to acquire the spectra in thevisible and near infrared regions. Calibration of measurement,dark current, and background measurements were carried outat the same setting before each session. To further improve thesignal to noise ration of the recorded signals, the acquiredspectra were averaged, smoothed, and had an integration timeof 25 min.
Figure 2a shows the spectrum of light source in the wholespectrum region of ESS and Fig. 2b shows how far the visiblespectrum is affected by the chromophores after carcinogen at32 weeks.
Spectral analysis
Elastic scattering spectra were recorded five times for eachsample from different locations in the treated or investigatedarea. Consequently, spectral analysis was performed in thenear-infrared range from 700 to 950 nm in order to minimizethe possible contribution of unwanted major chromophores inskin slice such as hemoglobin and melanin. Elastic scatteringsignal recorded is assumed to be mainly dependent on scatter-ing contribution of biological tissue. Thus, all other absorptivecontribution to the signal can be neglected especially in theinvestigated wavelength range from 700 to 950 nm. The main
scattering parameter is the reduced scattering coefficient μ0s.
The scattering slope is related to the size of skin structures.Often, the emanated scattering spectrum is a combination oftwo types of elastic scattering skin tissue, that is, Mie andRayleigh scattering. Spectral data were interpreted based onanalytical model of light scattering in biological tissue report-ed by Jacques [23] given by
μ0s λð Þ ¼ a
0f Ray
λ500 nmð Þ
� �−4
þ 1− f Ray� � λ
500 nmð Þ� �−bMie
!ð1Þ
where a is the scattering magnitude (cm−1) and b is the dimen-sionless scattering power. In this expression, the scattering isdescribed in terms of the Rayleigh scattering, a′ f Ray(λ/500nm)−4, and the Mie scattering, a′ (1 − f Ray)(λ/500 nm)−bMie, atλ certain reference wavelength, 500 nm. The factor a′ equalsμ
0s λ ¼ 500 nmð Þ. Jacques [23] also found that the above equa-
tion could be reduced to more compact form expressed by
μ0s ¼ a
λ800 nmð Þ� �−b
; ð2Þ
Since scattering properties exhibit a simple λ−b behavior.According to measurement made by Jacques, equation (2) isreasonably sufficient to characterize the behavior of differentgroups of tissues such as skin tissue. The equations are equallygood for prediction of tissue scattering within the 400–1300nm wavelength range. But outside this range in either theultraviolet or the longer infrared, the two equations diverge.Thus, Eq. (2) is sufficient and valid in the range from 700 to950 nm. The reference wavelength at 500 nm given in theoriginal equation is replaced with 800 nm to correspond tothe NIR range of wavelength used in this study.
Inverse model approach deals with the process ofextracting the model parameters from the data collected ex-perimentally. Hence, the parameters extracted represent thefunction of the biological system.
Most of these approaches are fundamentally based on usingthe solution of the forward model to generate a spectrum, andthe model parameters are updated to match the generatedspectrum to the measured spectrum. When a close fit to thesimulated spectrum is found, the parameters (underlying opti-cal properties) of the simulated spectrum form the startingpoint to adjust the parameters in order to obtain a best fit.
A linear regression model was used to examine the elasticscattering spectrum in the defined range of wavelength.Spectral analysis was carried out using Matlab 2015(Mathworks.com, 2015b, USA). Then, the parameters oftissue scattering model were computed by inverse algorithm.The flowchart of inverse algorithm is shown in Fig. 3.
In this algorithm, initial scattering parameters: scatteringmagnitude, scattering power, and reference wavelength aregiven in order to generate the corresponding forward model.
Inte
nsi
ty
Wavelength nm
a
Wavelength nm
b
Fig. 2 a The spectrum of HL-2000 light source used in this work. b shows the ESS signal affected by the chromophores after carcinogens at 32 weeks
Lasers Med Sci
Author's personal copy

The forward model spectra generated (by updating the modelscattering parameters) are compared to the measured spectra,and an error function is defined. The inverse method in thiswork uses the least squares error to compute the minimumerror function followed by an update of the model parameterson error function value.
As a result, the parameters of the model at which the sum ofthe squared residuals is minimized are referred to as the best fit.The nonlinear least squares error method is considered in
models where the forward model is a nonlinear function ofmodel parameters. In our system, the forward model of lighttransport has a nonlinear dependence on the model parameters.
Figure 3 shows the flowchart of the algorithm used forextracting the scattering properties of the measured spectra,that is, transformed tissue and treated tumor tissue samples.When a best fit is obtained based on the value of error func-tion, the inverse process is terminated and the final parametersof the model are defined to be the output parameters.
Start
Initial Scattering Parameters
Analytical Scattering Model
Measured Spectrum
= [ ( ) − ( )]
Optimization Updated Scattering Parameters
Fig. 3 Flowchart of the inversemodel for fitting the measuredscattering spectrum to theanalytical scattering model
400.00 600.00 800.00 1000.00
5
10
15
20
25
30
35
%langisgnirettacs
citsalE
Wavelength (nm)
Normal Tissue 12w 16w 20w 24w 28w 32w 36w
756.00 819.00 882.00 945.00
5
10
15
20
25
30
35
%langisgni re ttacs
c it salE
Wavelength (nm)
Normal Tissue 12w 16w 20w 24w 28w 32w 36wa b
Fig. 4 Mean and standard deviation of elastic scattering spectra obtainedfrom skin samples. Lines represent normal tissue spectrum and sevenstages of cancer transformation starting from 12 to 36 weeks. a Over
the entire range of wavelength (400–1080 nm). b Over the NIR rangeof wavelength (700–950 nm)
Lasers Med Sci
Author's personal copy
Variation in scattering parameters between control groupand treated tissue groups were examined using nonparametricANOVA analysis. Significance level was set at p ≤ 0.05.Similarly, nonparametric ANOVA was used to examine thescattering coefficient variation between control group andcancer-induced tissue samples.
Results
Mean values and standard deviation of elastic scattering spec-tra for normal tissue sample and different stages following theapplication of carcinogen are shown in Fig. 4a. Skin tissue
transformations due to the carcinogen can be noticed overthe entire follow-up period of 36 weeks. It can be noticed thatthe most pronounced difference between spectra is in the NIRwindow, that is, from 700 to 1000 nm.
It is noteworthy to say that the peakwavelength shift can beattributed to the variation in optical properties of the samplesdue to thermal effect of laser radiation. Another factor thatmay contribute to this shift is the presence of impurities andpossibly remnants of chromophores in the tissue samples.Thus, the focus of this study was on the NIR window.
Figure 4b shows the spectroscopic recordings from 700 to950 nm. All spectra exhibit characteristic decline over thedefined range of wavelength.
700 900800 100015
20
25
30
35
%langisgnirettacs
citsalE
Wavelength (nm)
Normal Tissue Treated tissue @ 24w Treated tissue @ 28w Treated tissue @ 32w Treated tissue @ 36w
400 600 800 1000
15
20
25
30
35
40
%langisgnirettacs
citsalE
Wavelength (nm)
Normal Tissue Treated tissue @ 24w Treated tissue @ 28w Treated tissue @ 32w Treated tissue @ 36w
a b
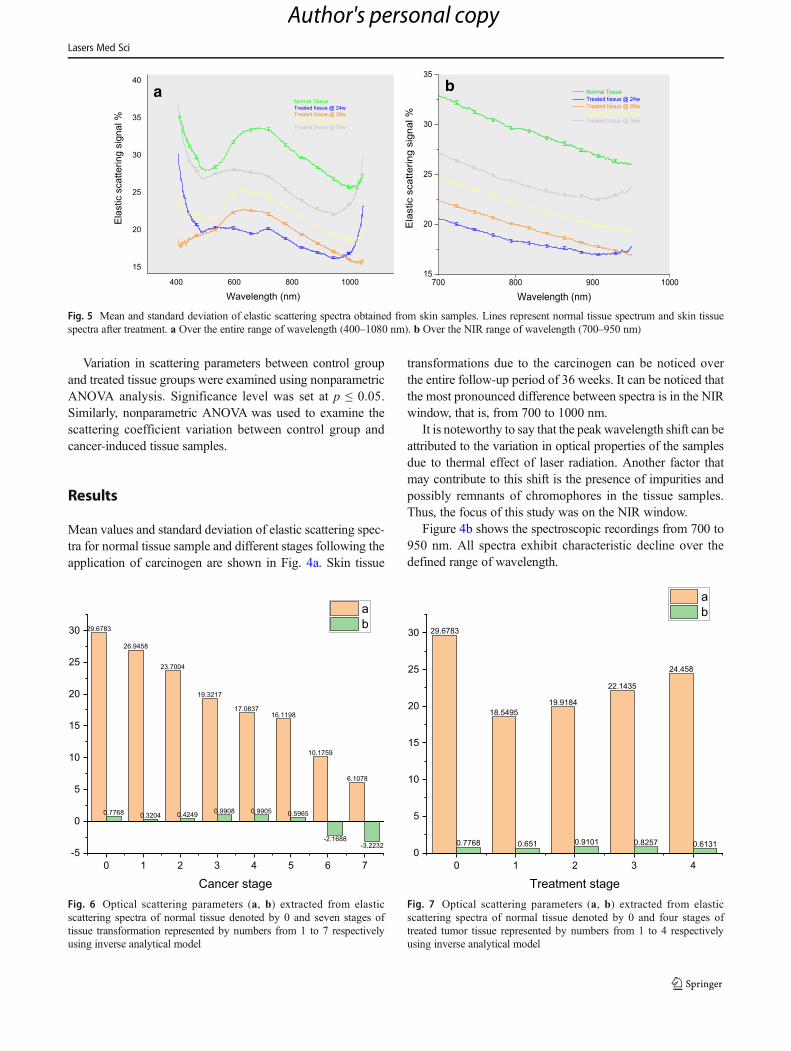
Fig. 5 Mean and standard deviation of elastic scattering spectra obtained from skin samples. Lines represent normal tissue spectrum and skin tissuespectra after treatment. a Over the entire range of wavelength (400–1080 nm). b Over the NIR range of wavelength (700–950 nm)
29.6783
26.9458
23.7004
19.3217
17.083716.1198
10.1759
6.1078
0.7768 0.3204 0.4249 0.9908 0.9905 0.5965
-2.1688-3.2232
0 1 2 3 4 5 6 7-5
0
5
10
15
20
25
30
Cancer stage
ab
Fig. 6 Optical scattering parameters (a, b) extracted from elasticscattering spectra of normal tissue denoted by 0 and seven stages oftissue transformation represented by numbers from 1 to 7 respectivelyusing inverse analytical model
29.6783
18.549519.9184
22.1435
24.458
0.7768 0.651 0.9101 0.8257 0.6131
0 1 2 3 40
5
10
15
20
25
30
Treatment stage
ab
Fig. 7 Optical scattering parameters (a, b) extracted from elasticscattering spectra of normal tissue denoted by 0 and four stages oftreated tumor tissue represented by numbers from 1 to 4 respectivelyusing inverse analytical model
Lasers Med Sci
Author's personal copy
Scattering signals showed an increased intensity followinglaser application starting from 20 weeks until the end of theexperiment, indicating an improvement in skin tissue asshown in Fig. 5a.
Reduced scattering coefficient of treated tissue exhibitednearly 80% recovery of its normal skin value at the end ofthe experiment. Figure 5b shows the spectroscopic recordingsof healthy tissue and skin after laser treatment over the NIRrange of wavelength (700–950 nm).
A significant difference (p < 0.05) in the elastic scatteringcoefficients was found between samples tested for both trans-formed tissue and treated tissue groups.
The scattering magnitude, which is given in Eq. 2 and ob-tained from inverse algorithm model, shows a decrease withincreasing cancer transformation stage as shown in Fig. 6 andreturns to its original value after laser treatment as depicted inFig. 7. Whereas, scattering power value b is inconsistentlychanged. Therefore, only the scattering parameter a can berelied on for evaluation of cancer transformation and treatment.
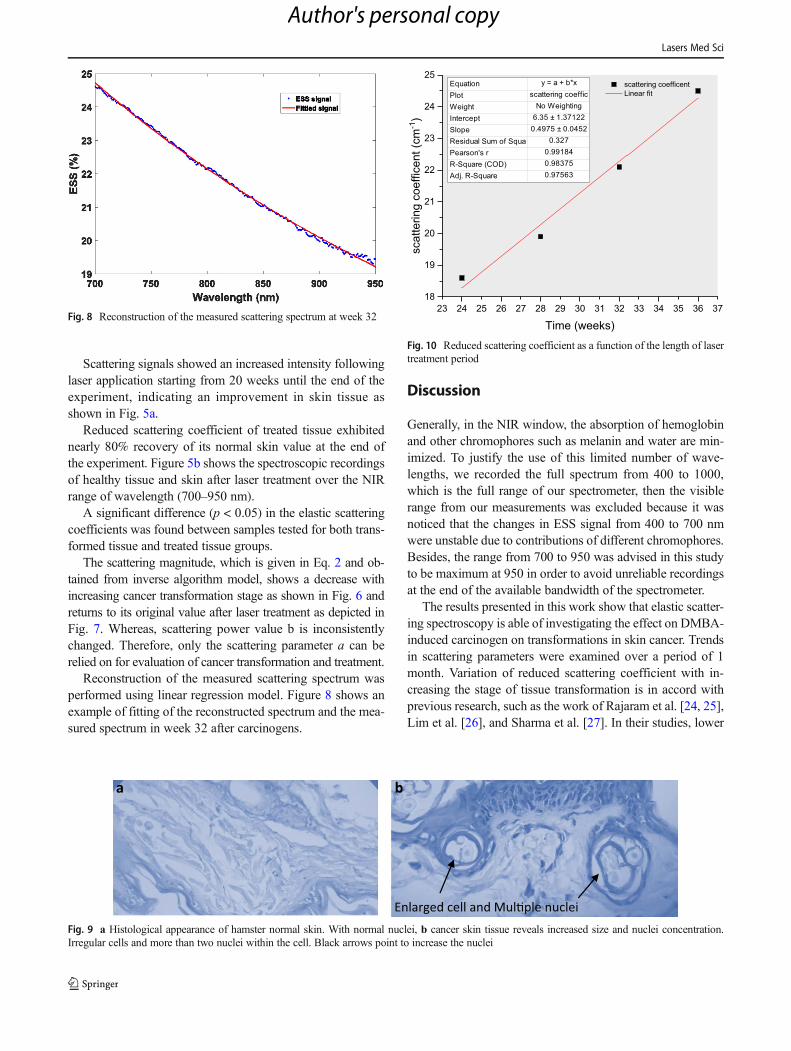
Reconstruction of the measured scattering spectrum wasperformed using linear regression model. Figure 8 shows anexample of fitting of the reconstructed spectrum and the mea-sured spectrum in week 32 after carcinogens.
Discussion
Generally, in the NIR window, the absorption of hemoglobinand other chromophores such as melanin and water are min-imized. To justify the use of this limited number of wave-lengths, we recorded the full spectrum from 400 to 1000,which is the full range of our spectrometer, then the visiblerange from our measurements was excluded because it wasnoticed that the changes in ESS signal from 400 to 700 nmwere unstable due to contributions of different chromophores.Besides, the range from 700 to 950 was advised in this studyto be maximum at 950 in order to avoid unreliable recordingsat the end of the available bandwidth of the spectrometer.
The results presented in this work show that elastic scatter-ing spectroscopy is able of investigating the effect on DMBA-induced carcinogen on transformations in skin cancer. Trendsin scattering parameters were examined over a period of 1month. Variation of reduced scattering coefficient with in-creasing the stage of tissue transformation is in accord withprevious research, such as the work of Rajaram et al. [24, 25],Lim et al. [26], and Sharma et al. [27]. In their studies, lower
Fig. 8 Reconstruction of the measured scattering spectrum at week 32
a b
Enlarged cell and Mul�ple nucleiFig. 9 a Histological appearance of hamster normal skin. With normal nuclei, b cancer skin tissue reveals increased size and nuclei concentration.Irregular cells and more than two nuclei within the cell. Black arrows point to increase the nuclei
23 25 27 29 31 33 35 3724 26 28 30 32 34 3618
19
20
21
22
23
24
25 scattering coefficent Linear fit
mc( tneciffeoc gnirettacs-1
)
Time (weeks)
Equation y = a + b*xPlot scattering coefficWeight No WeightingIntercept 6.35 ± 1.37122Slope 0.4975 ± 0.0452Residual Sum of Squa 0.327Pearson's r 0.99184R-Square (COD) 0.98375Adj. R-Square 0.97563
Fig. 10 Reduced scattering coefficient as a function of the length of lasertreatment period
Lasers Med Sci
Author's personal copy
values of reduced scattering coefficient are noticed with in-creasing the transformation stage towards high-grade cancer.
It is noteworthy to say that the in the last two spectra at 32 and36weeks in Fig. 5, the intensity of light increasedwith increasingwavelength; this can be explained by the fact that the optical pathlength of final signal of scattered photons is shorter than diffusedphoton paths in tissue. In addition, the nuclei concentration andsize are increased within cancer tissue, which may affect spectralslope, as shown in histological image in Fig. 9a, b.
The observed decline in scattering parameter a with in-creasing cancer transformation stage indicates lower scatter-ing. This could be attributed to the increase in nuclei concen-tration within cancerous tissues (e.g., formation of multiplenuclei). Also, this could be explained by light scattering oncellular microstructures that are changed and becoming morecondensed towards cancer. In contrast, Scattering parameter aincreased after treatment.
Another important finding is that the reduced scatteringcoefficient can reliably be adopted as an optical characteristicparameter for discriminating the morphology and function ofthe cancerous/treated regions thus defining the stage of tissuetransformation in both forward and backward direction corre-sponding to malignancy and normality, respectively.
In addition, our findings reveal a close relationship be-tween the laser treatment period and the reduced scatteringcoefficient as shown in Fig. 10. Thus, the number of lasertreatment sessions required for restoring normal reduced scat-tering coefficient value can be predicted. In other words, lasertreatment plan and dosimetry can be adjusted accordingly.
It may be possible to use the information and resultsgained from this study to optimize the dose and adjust thelaser therapy protocol for each specific tumor based on theoptical feedback provided by optical spectroscopic modali-ty. Boone et al. [28] report the use of promising opticalimaging known as optical coherence tomography for differ-entiating benign skin lesions from malignant ones.However, the presented low-cost and portable elastic scat-tering spectroscopic technique in this work allows sharpdifferentiation between normal and cancerous skin regions.
The results demonstrated that the ESS parameters in thetreated hamsters differed significantly from the untreatedcancer-induced hamsters.
A clear understanding of the origins of the optical proper-ties in terms of elastic scattering could provide more physio-logical information leading to an improved in vivo tissue treat-ment and dosimetry.
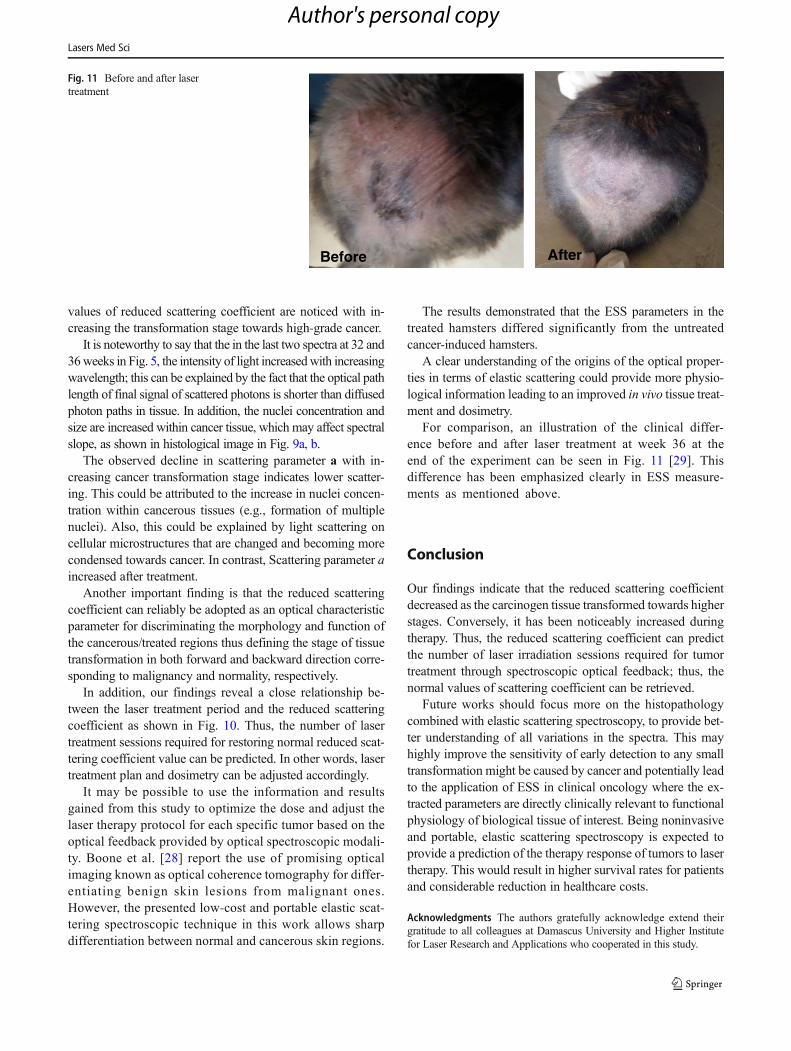
For comparison, an illustration of the clinical differ-ence before and after laser treatment at week 36 at theend of the experiment can be seen in Fig. 11 [29]. Thisdifference has been emphasized clearly in ESS measure-ments as mentioned above.
Conclusion
Our findings indicate that the reduced scattering coefficientdecreased as the carcinogen tissue transformed towards higherstages. Conversely, it has been noticeably increased duringtherapy. Thus, the reduced scattering coefficient can predictthe number of laser irradiation sessions required for tumortreatment through spectroscopic optical feedback; thus, thenormal values of scattering coefficient can be retrieved.
Future works should focus more on the histopathologycombined with elastic scattering spectroscopy, to provide bet-ter understanding of all variations in the spectra. This mayhighly improve the sensitivity of early detection to any smalltransformation might be caused by cancer and potentially leadto the application of ESS in clinical oncology where the ex-tracted parameters are directly clinically relevant to functionalphysiology of biological tissue of interest. Being noninvasiveand portable, elastic scattering spectroscopy is expected toprovide a prediction of the therapy response of tumors to lasertherapy. This would result in higher survival rates for patientsand considerable reduction in healthcare costs.
Acknowledgments The authors gratefully acknowledge extend theirgratitude to all colleagues at Damascus University and Higher Institutefor Laser Research and Applications who cooperated in this study.
Before After
Fig. 11 Before and after lasertreatment
Lasers Med Sci
Author's personal copy
Compliance with ethical standards
Conflict of interest The authors declare that they have no conflict ofinterest.
Ethical approval All procedures were approved by institutional ethical,according to Damascus University ethical committee decision no. 3164
References
1. McCarthy K, Pearson K, Fulton R, Hewitt J (2012) Pre-operativechemoradiation for non-metastatic locally advanced rectal cancer.Cochrane Database Syst Rev 12:CD008368
2. Rydzewska L, Tierney J, Vale CL, Symonds PR (2012)Neoadjuvant chemotherapy plus surgery versus surgery for cervicalcancer. Cochrane Database Syst Rev 12:CD007406
3. Ueda S, Roblyer D, Cerussi A et al (2012) Baseline tumor oxygensaturation correlates with a pathologic complete response in breastcancer patients undergoing neoadjuvant chemotherapy. Cancer Res72:4318–4328
4. GarlandML, Vather R, Bunkley N et al (2014) Clinical tumour sizeand nodal status predict pathologic complete response followingneoadjuvant chemoradiotherapy for rectal cancer. Int J Color Dis29:301–307
5. Jiang S, Pogue BW, Kaufman PA et al (2014) Predicting breasttumor response to neoadjuvant chemotherapy with diffuse opticalspectroscopic tomography prior to treatment. Clin Cancer Res 20:6006–6015
6. Vaupel P, Kallinowski F, Okunieff P (1989) Blood flow, oxygenand nutrient supply, and metabolic microenvironment of humantumors: a review. Cancer Res 49:6449–6465
7. Lehtio K, Eskola O, Viljanen T et al (2004) Imaging perfusion andhypoxia with PET to predict radiotherapy response in head-and-neck cancer. Int J Radiat Oncol Biol Phys 59:971–982
8. Jacobson O, Chen X (2013) Interrogating tumor metabolism andtumor microenvironments using molecular positron emission to-mography imaging. Theranostic approaches to improve therapeu-tics. Pharmacol Rev 65:1214–1256
9. DeVries AF, Kremser C, Hein PA et al (2003) Tumor microcircu-lation and diffusion predict therapy outcome for primary rectal car-cinoma. Int J Radiat Oncol Biol Phys 56:958–965
10. Hermans R, Lambin P, Van der Goten A et al (1999) Tumouralperfusion as measured by dynamic computed tomography in headand neck carcinoma. Radiother Oncol 53:105–111
11. Preda L, Calloni SF, Moscatelli ME et al (2014) Role of CT perfu-sion inmonitoring and prediction of response to therapy of head andneck squamous cell carcinoma. Biomed Res Int 2014:917150
12. Anderson H, Price P, BlomleyM et al (2001) Measuring changes inhuman tumour vasculature in response to therapy using functionalimaging techniques. Br J Cancer 85:1085–1093
13. Turani Z, Fatemizadeh E, Blumetti T, et al (2019) Optical radiomicsignatures derived from optical coherence tomography images im-prove identification of melanoma. Cancer Res 79(8):2021-2030
14. Avanaki MRN, Podoleanu AG, Schofield JB, Jones C, Sira M, LiuY, Hojjat A (2013) Quantitative evaluation of scattering in optical
coherence tomography skin images using the extended Huygens–Fresnel theorem. Appl Opt 52:1574–1580
15. Hafez R, Hamadah O, Bachir W (2015) Mapping of healthy oralmucosal tissue using diffuse reflectance spectroscopy: ratiometric-based total hemoglobin comparative study. LasersMed Sci 30:2135https://doi.org/10.1007/s10103-015-1765-y
16. Mourant JR, Freyer JP, Hielscher AH et al (1998) Mechanisms oflight scattering from biological cells relevant to noninvasiveoptical-tissue diagnostics. Appl Opt 37:3586–3593
17. Mourant JR, Fuselier T, Boyer J et al (1997) Predictions and mea-surements of scattering and absorption over broad wavelengthranges in tissue phantoms. Appl Opt 36:949–957
18. Cheung C, Culver JP, Takahashi K et al (2001) In vivo cerebrovas-cular measurement combining diffuse near-infrared absorption andcorrelation spectroscopies. Phys Med Biol 46:2053–2065
19. Laughney AM, Krishnaswamy V, Rizzo EJ et al (2012) Scatterspectroscopic imaging distinguishes between breast pathologies intissues relevant to surgical margin assessment. Clin Cancer Res 18:6315–6325
20. Sugimura T (1986) Studies on environmental chemical carcinogen-esis in Japan. Science 233:312 Academic OneFile
21. SHubik P, Pietra G, Dellaporta G (1960) Studies of skin carcino-genesis in the Syrian golden hamster. Cancer Res 20:100–105
22. Shurrab K, Kochaji N, Bachir W (2017) Development of tempera-ture distribution and light propagation model in biological tissueirradiated by 980 nm laser diode and using COMSOL simulation.J Laser Med Sci 8(3):118–122
23. Jacques SL (2013) Optical properties of biological tissues: a review.Phys Med Biol 58(11):R37–R61. https://doi.org/10.1088/0031-9155/58/11/r37
24. Rajaram N, Aramil TJ, Lee K, Reichenberg JS, Nguyen TH,Tunnell JW (2010) Design and validation of a clinical instrumentfor spectral diagnosis of cutaneous malignancy. Appl Opt 49(2):142–152
25. Rajaram N, Reichenberg JS, MigdenMR, Nguyen TH, Tunnell JW(2010) Pilot clinical study for quantitative spectral diagnosis of non-melanoma skin cancer. Lasers Surg Med 42(10):716–727
26. Lim L, Nichols B, Migden MR, Rajaram N, Reichenberg JS,Markey MK, Ross MI, Tunnell JW (2014) Clinical study of non-invasive in vivo melanoma and nonmelanoma skin cancers usingmultimodal spectral diagnosis. J Biomed Opt 19:117003
27. Sharma M, Marple E, Reichenberg J, Tunnell JW (2014) Designand characterization of a novel multimodal fiber-optic probe andspectroscopy system for skin cancer applications. Rev Sci Instrum85:083101
28. Boone MALM, Suppa M, Dhaenens F et al (2016) In vivo assess-ment of optical properties of melanocytic skin lesions and differen-tiation of melanoma from non-malignant lesions by high-definitionoptical coherence tomography. Arch Dermatol Res 308:7. https://doi.org/10.1007/s00403-015-1608-5
29. Shurrab K, Kochaji N, Bachir W (2019) Effect of laser irradiationon the progression of skin cancer using carcinogen among ham-sters. Iran J Med Phys 16(4):314–318
Publisher’s note Springer Nature remains neutral with regard to jurisdic-tional claims in published maps and institutional affiliations.
Lasers Med Sci
Author's personal copy