Embed Size (px)
Citation preview

100% RENEWABLE ENERGY FOR AUSTRALIA Decarbonising Australia’s Energy Sector Within One Generation Prepared for: GetUp! and Solar Citizens
2016
MARCH 2016
ABOUT THE AUTHORS The Institute for Sustainable Futures (ISF) was established by the University of Technology Sydney in 1996 to work with industry, government and the community to develop sustainable futures through research and consultancy. Our mission is to create change toward sustainable futures that protect and enhance the environment, human well-being and social equity. We seek to adopt an inter-disciplinary approach to our work and engage our partner organisations in a collaborative process that emphasises strategic decision-making.
For further information visit: www.isf.uts.edu.au
Research team: Dr. Sven Teske, Elsa Dominish, Nicky Ison, Kristian Maras
COOPERATION PARTNER This project has been conducted in cooperation with the German Aerospace Centre: Deutsches Zentrum für Luft- und Raumfahrt e.V. (DLR) Institut für Technische Thermodynamik | Systemanalyse und Technikbewertung | Wankelstrasse 5 | 70563 Stuttgart.
The energy scenario software has been developed by the DLR Institute and applied for over 100 energy scenario simulations for global, regional and national energy analysis.
For further information visit: www.DLR.de
DLR support team: Dr. Sonja Simon, Dr Tobias Naegler, Dr Thomas Pregger
CITATION Teske, S., Dominish, E., Ison, N. and Maras, K. (2016) 100% Renewable Energy for Australia – Decarbonising Australia’s Energy Sector within one Generation. Report prepared by ISF for GetUp! and Solar Citizens, March 2016.
ACKNOWLEDGEMENTS The authors gratefully acknowledge data and advice contributed by ClimateWorks, the CSIRO and the Clean Energy Council, as well as feedback received from Paul Graham, Amandine Denis, Jenny Riesz, Ben Elliston, Dylan McConnell, Tim Buckley, Kane Thornton, Ian McAuley, Catherine Burrows, Jay Rutovitz and Edward Langham. All conclusions and any errors that remain are the authors’ own.
Front cover image by CSIRO, CC BY 3.0 https://commons.wikimedia.org/w/index.php?curid=35460612
DISCLAIMER The authors have used all due care and skill to ensure the material is accurate as at the date of this report. UTS and the authors do not accept any responsibility for any loss that may arise by anyone relying upon its contents.
INSTITUTE FOR SUSTAINABLE FUTURES University of Technology Sydney PO Box 123 Broadway, NSW, 2007
www.isf.edu.au
© UTS March 2016
100% RENEWABLE ENERGY FOR AUSTRALIA i
MARCH 2016
TABLE OF CONTENTS 1 Introduction ................................................................................................................... 1
1.1 Global context ..................................................................................................... 1 1.2 The Australian context ........................................................................................ 1 1.3 The role of scenarios in energy policies .............................................................. 2
2 Key Results ................................................................................................................... 3
2.1 Key results for the Advanced Renewables scenario ........................................... 3
3 Methodology and Assumptions .................................................................................. 5
3.1 Modelling overview.............................................................................................. 5 3.2 Overview of the scenarios ................................................................................... 6 3.3 Scenario assumptions ....................................................................................... 10
4 Results ......................................................................................................................... 15
4.1 Electricity consumption/demand ....................................................................... 15 4.2 Electricity generation ......................................................................................... 21 4.3 Energy supply for heating ................................................................................. 24 4.4 Transport ........................................................................................................... 26 4.5 CO2 emissions trajectories ................................................................................ 28 4.6 Cost analysis ..................................................................................................... 29
5 Conclusions & Implications....................................................................................... 34
Appendix A: Technology Cost Assumptions ............................................................... 35
Appendix B: Investment Costs ...................................................................................... 37
Appendix C: Results Summaries ................................................................................... 39
100% RENEWABLE ENERGY FOR AUSTRALIA ii
MARCH 2016
FIGURES Figure 1: Breakdown of electricity generation by technology ................................................................................. 4
Figure 2: Projection of total final energy demand by sector (excluding non-energy use and heat from CHP auto producers) ............................................................................................................................................. 16
Figure 3: Development of electricity demand by sector in both renewable scenarios .......................................... 17
Figure 4: Development of heat demand by sector in the renewable scenarios .................................................... 18
Figure 5: Development of the final energy demand for transport by sector in the renewable scenarios .............. 19
Figure 6: Projection of total primary energy demand by energy carrier (incl. electricity import balance) ............. 20
Figure 7: Breakdown of electricity generation by technology ............................................................................... 21
Figure 8: Average annual capacity change by technology in the Advanced Renewables case ........................... 23
Figure 9: Projection of heat supply by energy carrier ........................................................................................... 24
Figure 10: Final energy consumption transport under the scenarios .................................................................... 26
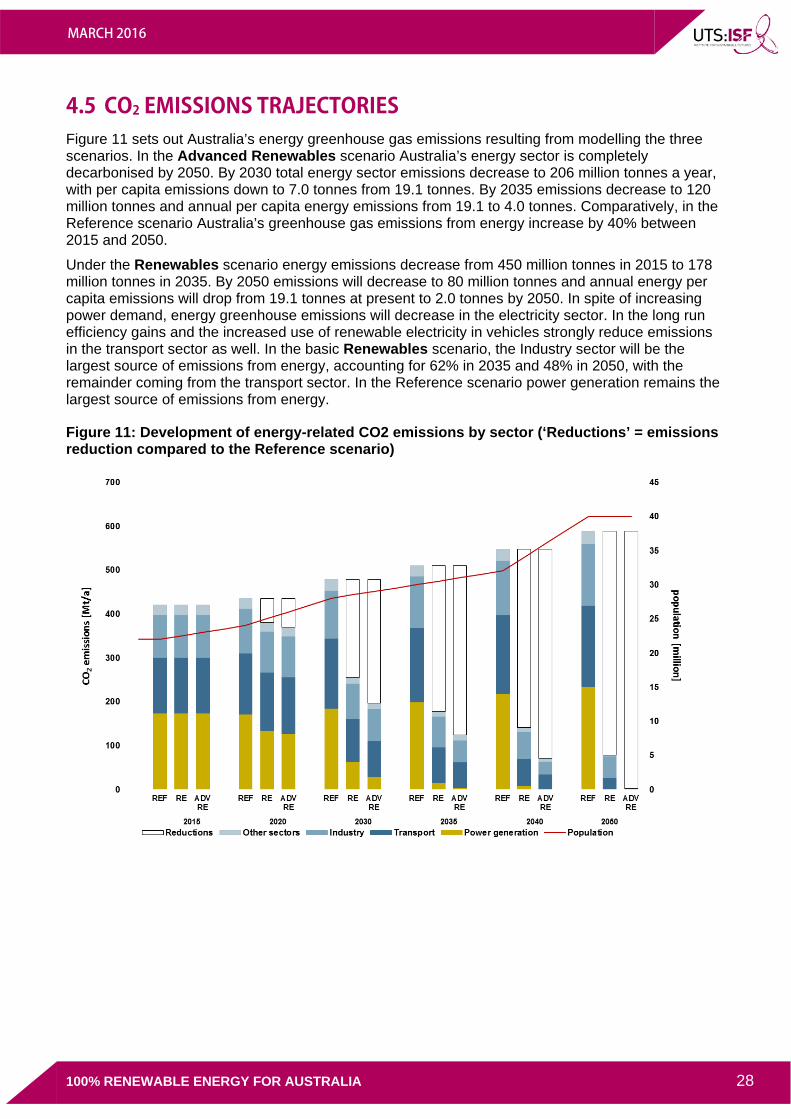
Figure 11: Development of CO2 emissions by sector (‘Efficiency’ = reduction compared to the Reference scenario) .............................................................................................................................................. 28
Figure 12: Share of investment between renewable, fossil and CHP technologies by scenario .......................... 30
Figure 13: Share of investment for renewable heat generation technologies ...................................................... 30
Figure 14: Fuel costs by Scenario ......................................................................................................................... 31
Figure 15: Average electricity generation costs for each scenario (low coal and low gas price) .......................... 32
Figure 16: Average electricity generation costs for each scenario under two fuel cost assumptions .................. 32
Figure 17: Annual electricity and fuel costs by sector and scenario (assumed low coal and gas prices) ............ 33
TABLES Table 1: Australia’s population projection ............................................................................................................. 10
Table 2: Development projections for fossil fuel and biomass prices in AUS$/GJ (Source IEA WEO 2014, DLR/GPI - Energy [R]evolution 2015) .................................................................................................... 11
Table 3: Renewable Energy Potential (AEMO 2013) ............................................................................................ 14
Table 4: Required area for Solar PV and Wind ..................................................................................................... 14
Table 5: Projection of renewable electricity generation capacity .......................................................................... 22
Table 6: Projection of renewable heat supply ....................................................................................................... 25
Table 7: Installed capacities for renewable heat generation ................................................................................. 25
Table 8: Projection of transport energy demand by mode .................................................................................... 27
Table 9: Specific investment costs for power generation ...................................................................................... 35
Table 10: Operation and maintenance cost for power generation technologies .................................................. 36
100% RENEWABLE ENERGY FOR AUSTRALIA iii
MARCH 2016
1 INTRODUCTION The Institute of Sustainable Futures (ISF) at the University of Technology Sydney has produced an economic and technical scenario model for a transition towards a renewable energy system. The model describes Australia's future energy system, including an assessment of technology pathways and cost implications of three future energy scenarios. The model used by ISF was created by the German Aerospace Agency in cooperation with Greenpeace International and has previously been used to inform the German government's 'Energiewende' and climate mitigation scenarios for the Intergovernmental Panel on Climate Change (IPCC). This research was commissioned by GetUp! and Solar Citizens to provide the technical basis for the Homegrown Power Plan. The key results of the modelling are presented in Section 2, followed by methodology and assumptions in Section 3 and detailed results and cost analysis in Section 4.
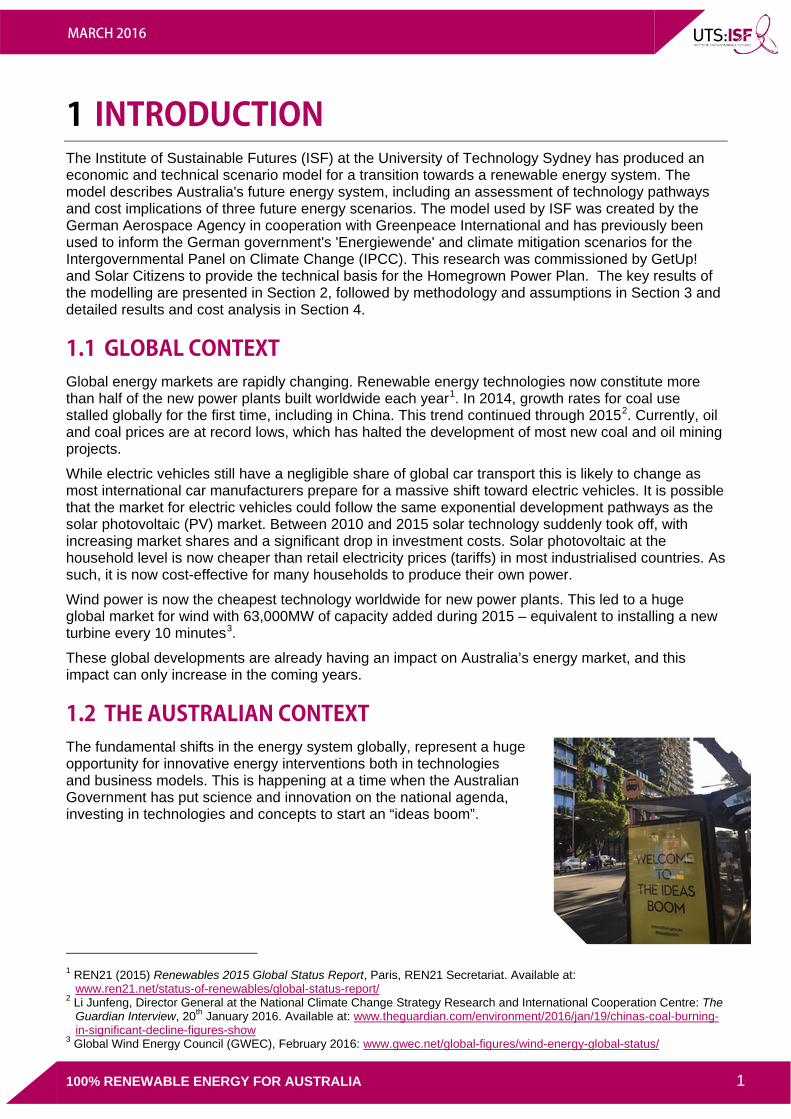
1.1 GLOBAL CONTEXT Global energy markets are rapidly changing. Renewable energy technologies now constitute more than half of the new power plants built worldwide each year1. In 2014, growth rates for coal use stalled globally for the first time, including in China. This trend continued through 20152. Currently, oil and coal prices are at record lows, which has halted the development of most new coal and oil mining projects.
While electric vehicles still have a negligible share of global car transport this is likely to change as most international car manufacturers prepare for a massive shift toward electric vehicles. It is possible that the market for electric vehicles could follow the same exponential development pathways as the solar photovoltaic (PV) market. Between 2010 and 2015 solar technology suddenly took off, with increasing market shares and a significant drop in investment costs. Solar photovoltaic at the household level is now cheaper than retail electricity prices (tariffs) in most industrialised countries. As such, it is now cost-effective for many households to produce their own power.
Wind power is now the cheapest technology worldwide for new power plants. This led to a huge global market for wind with 63,000MW of capacity added during 2015 – equivalent to installing a new turbine every 10 minutes3.
These global developments are already having an impact on Australia’s energy market, and this impact can only increase in the coming years.
1.2 THE AUSTRALIAN CONTEXT The fundamental shifts in the energy system globally, represent a huge opportunity for innovative energy interventions both in technologies and business models. This is happening at a time when the Australian Government has put science and innovation on the national agenda, investing in technologies and concepts to start an “ideas boom”.
1 REN21 (2015) Renewables 2015 Global Status Report, Paris, REN21 Secretariat. Available at: www.ren21.net/status-of-renewables/global-status-report/
2 Li Junfeng, Director General at the National Climate Change Strategy Research and International Cooperation Centre: The Guardian Interview, 20th January 2016. Available at: www.theguardian.com/environment/2016/jan/19/chinas-coal-burning-in-significant-decline-figures-show
3 Global Wind Energy Council (GWEC), February 2016: www.gwec.net/global-figures/wind-energy-global-status/
100% RENEWABLE ENERGY FOR AUSTRALIA 1

MARCH 2016
While most renewable power generation technologies are mature and ready for large-scale market deployment, there is still a need for system-supporting technologies that ensure Australia has a resilient power supply system into the future. Australia is very well positioned to tap into the new large-scale global renewable market with a well-known tendency to be an “early adopter” of technologies – especially information technologies.
The need to transform Australia’s energy system is further strengthened by the ageing coal power plant fleet. Indeed, the age of the fleet necessitates an almost complete replacement within the next two decades. This opens up a historic window of opportunity to restructure Australia’s power sector, moving from our current reliance on fossil fuels to a resilient and carbon-free renewable power system. Innovation is needed to develop new business models for future renewable power supply. At the same time, we can redefine the role of energy as a service rather than a commodity and to evolve the role of network companies and retailers as energy service organisations. International examples of power markets with a high share of renewable energy such as Germany, Denmark, Spain and USA states such as Texas have paved the way to 100% renewable energy is technically feasible, and our research indicates that Australia is in a good position to do likewise.
1.3 THE ROLE OF SCENARIOS IN ENERGY POLICIES Scenarios are necessary to describe possible future development paths, giving decision-makers a broad overview outlining the implications of various options. A scenario is by no means a prognosis of what will happen, but an “if-then” analysis. The scenarios provide decision-makers with an indication of how they can shape the future energy system.
Three scenarios have been developed to show possible pathways for Australia’s future energy supply system:
• Reference scenario based on Australian government forecasts and reflecting a continuation ofthe status quo.4
• Renewable scenario focused on renewable energy in the stationary power sector by 2030 whilethe transport and industry sectors remain dependent on fossil fuels.
• Advanced Renewable scenario for a fully decarbonised power sector by 2030 and a fullyrenewable energy supply system – including transport, and industry – by 2050.
Changes to energy markets require long term decision-making, because of the potential for changes in infrastructure to be required. They are not dependent on short-term market developments. Without long term planning for infrastructure, the power market cannot function optimally. Grid modifications and the roll-out of smart metering infrastructure, for example, require several years to implement. These technologies build the basis for the energy market and enable for energy trading.
It should be noted that long term energy scenarios have a different role to ‘grid and dispatch’ scenarios and simulate the energy system in annual or 5-year rather than 15-minute steps. Energy scenarios develop the ‘big picture’ for a country, while a grid or dispatch model develops the details on how to implement such a concept. This project uses one of the main models that underpinned Germany’s “Energiewende”, in which the German Government has a target of 80% renewable electricity by 2050.
This report specifically looks at energy generation. An important parallel stream of research is the analysis of organisations like CSIRO and others, for example through the Future Grid Research Program to better understand the role of and needs of Australian electricity grids in a future powered by increasing levels of renewable energy. The Institute for Sustainable Futures has developed its own grid investment model and has significant knowhow in grid modelling, with a number of other specialised power grid simulation models, however this analysis was not within the scope of this project.
4 We note that some of the assumptions embodied in these forecasts, such as the replacement of existing coal power plants with additional coal power plants, are increasingly unlikely to be realised given the very factors covered in this report.
100% RENEWABLE ENERGY FOR AUSTRALIA 2
MARCH 2016
2 KEY RESULTS
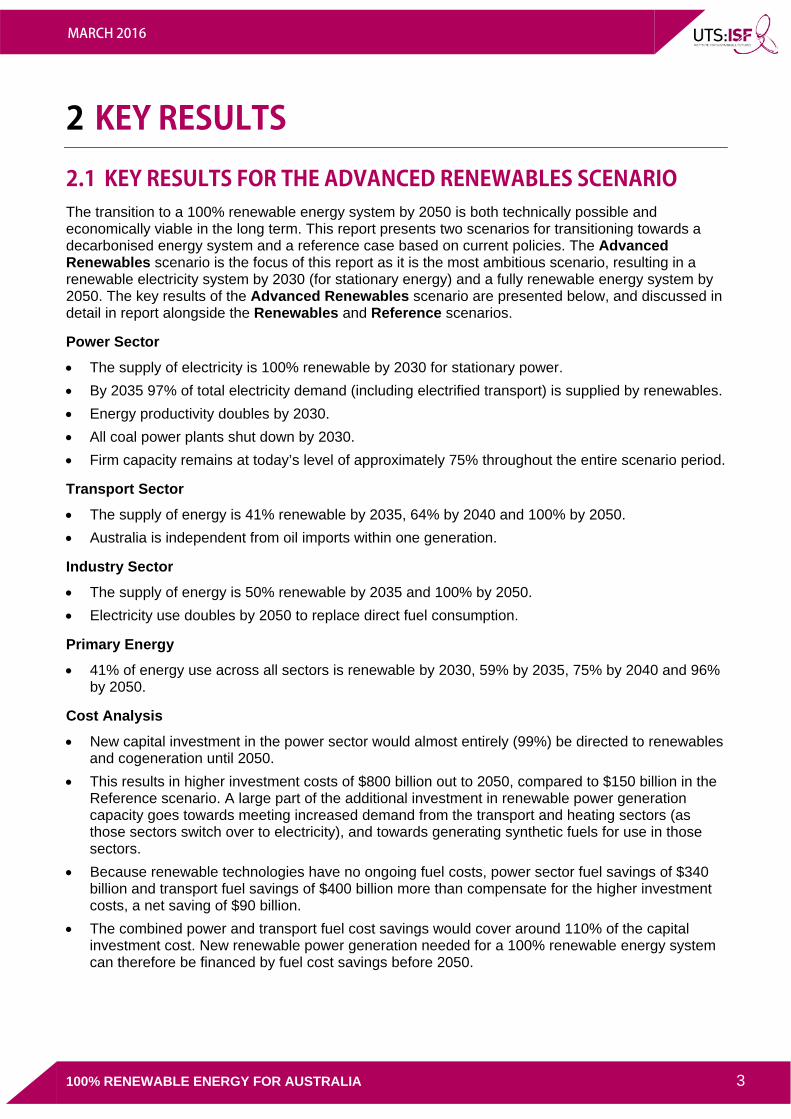
2.1 KEY RESULTS FOR THE ADVANCED RENEWABLES SCENARIO The transition to a 100% renewable energy system by 2050 is both technically possible and economically viable in the long term. This report presents two scenarios for transitioning towards a decarbonised energy system and a reference case based on current policies. The Advanced Renewables scenario is the focus of this report as it is the most ambitious scenario, resulting in a renewable electricity system by 2030 (for stationary energy) and a fully renewable energy system by 2050. The key results of the Advanced Renewables scenario are presented below, and discussed in detail in report alongside the Renewables and Reference scenarios.
Power Sector
• The supply of electricity is 100% renewable by 2030 for stationary power. • By 2035 97% of total electricity demand (including electrified transport) is supplied by renewables. • Energy productivity doubles by 2030. • All coal power plants shut down by 2030. • Firm capacity remains at today’s level of approximately 75% throughout the entire scenario period.
Transport Sector
• The supply of energy is 41% renewable by 2035, 64% by 2040 and 100% by 2050. • Australia is independent from oil imports within one generation.
Industry Sector
• The supply of energy is 50% renewable by 2035 and 100% by 2050. • Electricity use doubles by 2050 to replace direct fuel consumption.
Primary Energy
• 41% of energy use across all sectors is renewable by 2030, 59% by 2035, 75% by 2040 and 96% by 2050.
Cost Analysis
• New capital investment in the power sector would almost entirely (99%) be directed to renewables and cogeneration until 2050.
• This results in higher investment costs of $800 billion out to 2050, compared to $150 billion in the Reference scenario. A large part of the additional investment in renewable power generation capacity goes towards meeting increased demand from the transport and heating sectors (as those sectors switch over to electricity), and towards generating synthetic fuels for use in those sectors.
• Because renewable technologies have no ongoing fuel costs, power sector fuel savings of $340 billion and transport fuel savings of $400 billion more than compensate for the higher investment costs, a net saving of $90 billion.
• The combined power and transport fuel cost savings would cover around 110% of the capital investment cost. New renewable power generation needed for a 100% renewable energy system can therefore be financed by fuel cost savings before 2050.
100% RENEWABLE ENERGY FOR AUSTRALIA 3
MARCH 2016
Figure 1: Breakdown of electricity generation by technology
0
100
200
300
400
500
600
700
800
REF READV RE REF READV RE REF READV RE REF READV RE REF READV RE REF READV RE
2015 2020 2030 2035 2040 2050
TWh/
a
Coal Brown Coal GasOil Diesel HydrogenHydro Wind - for stationary power PV - for stationary powerBiomass Geothermal CSPOcean Energy Wind - for Transport supply PV - for transport supply
100% RENEWABLE ENERGY FOR AUSTRALIA 4
MARCH 2016
3 METHODOLOGY AND ASSUMPTIONS
3.1 MODELLING OVERVIEW The modelling approach used in this research is the development of target-orientated scenarios. In this approach a target is set and technical scenarios are developed to meet this target and then compared to a reference case. The scenarios are based on detailed input data sets, which take into account defined targets, renewable and fossil fuel energy potential and specific parameters for power, heat and fuel generation in the energy systems. The data sets are then fed into a model developed by DLR that uses MESAP/PlaNet software, an accounting framework for the calculation of the complete energy system balance to 2050.
The simulation model PlaNet that includes MESAP, an energy and environmental planning package (MESAP, 2008), was created to assist long-term strategic planning at a national, regional, or local level. PlaNet consists of two independent modules:
1. A flow calculation module, balancing energy supply and demand annually; and 2. A cost calculation module for the calculation of the corresponding generation and fuel costs. The PlaNet flow calculation uses a set of linear equations, which can be solved sequentially. Note that this is not a dispatch model (such as UNSW CEEM’s NEM simulation model), a cost optimisation model, DigSilent technical grid simulation model or a geo-spatial grid model (Such as the [R]E 24/7 model developed by Dr Teske). Rather, it is a bottom-up integrated energy balance model. Different modelling approaches each have their benefits and drawbacks. This model is particularly good at helping policy makers and analysts understand the relationships between different energy demand types in an economy.
Historically, heating, electricity and mobility have been quite separate in terms of their energy sources, requiring different infrastructure and therefore planning – electricity for stationary power, petrol and diesel for mobility and onsite heat for buildings and industrial processes. However, things are changing, with electricity projected to be used increasingly for heating and mobility (via electric vehicles). Thus, it is important to take an integrated approach across heat, mobility and electricity/stationary power when developing future energy system scenarios, as this model does.
In a simulation model, the user specifies the drivers of energy consumption, including forecast population growth, GDP and energy intensities.
Specific energy intensities are assumed for:
• Electricity consumption per person, • The industrial heat demand to GDP ratio, • Demand for energy services, such as useful heat, and • Different transport modes.
For heat as well as electricity production, the model distinguishes between different technologies, characterised by their primary energy source, their efficiency and their costs. Examples include biomass or gas burners, heat pumps, solar thermal and geothermal technologies and several power generation technologies (PV, wind, biomass, gas, coal, nuclear, combined heat and power).
For each technology, the market share with respect to total heat or electricity production is specified according to a range of assumptions including targets, potentials, costs and societal, structural and economic barriers.
100% RENEWABLE ENERGY FOR AUSTRALIA 5
MARCH 2016
The main outputs of the model are:
• Final and primary energy demand, broken down by fuel, technology and sectors of the economy as defined by the International Energy Agency (IEA) – industry, power generation, transport and other (buildings, forestry and fisheries)5,
• Results broken down by the three main types of energy demand – electricity, heating and mobility (transport) – specifically, the energy required, technology deployment and investment costs for each of these types of energy demand.
• Total energy budget – the total cost of energy for the whole energy system, and • Energy-related greenhouse gas emissions over the projection period.
3.2 OVERVIEW OF THE SCENARIOS The average age of a power plant in Australia is 36 years6 meaning most are reaching their optimal lifespan. For this reason, Australia needs to renew its power plant fleet over the coming decades. Building new power plants – no matter what technology – will increase production costs for generated electricity and increase wholesale market prices, because most coal power plants are fully paid off, so they are operating on marginal costs with no capital costs. The need to build new plants means that an increase in the cost of generation is therefore unavoidable.
With the decrease in the price of solar photovoltaic and onshore wind in recent years renewables have become an economic alternative to building new coal and gas power plants. As a result, renewables achieved a global market share of over 50% of all new build power plants in 2014 and 2015. Australia is blessed with some of the best solar and wind resources world-wide and renewables generation costs are generally lower than in other parts of the world. However constantly shifting policy frameworks have lead to high investment risks and therefore higher project development and installation costs for solar and wind projects relative to countries with more stable policy.
The scenario-building process for all scenarios includes assumptions on policy stability, the role of future energy utilities, nuclear power generation and carbon capture and storage (CCS), population and GDP, firm capacity and future costs.
• Policy stability: This research assumes that Australia will establish a secure and stable framework for the deployment of renewable power generation. In essence, financing a coal power plant or a wind farm is quite similar. In both cases a power purchase agreement, which ensures a relatively stable price for a specific quantity of electricity, is required to finance the project. Daily spot market prices for electricity and/or renewable energy or carbon are not sufficient for long-term investment decisions for power plants with technical lifetimes of 20 years or longer.
• Strengthened energy efficiency policies: Existing policy settings, namely those outlined in the National Energy Productivity Plan, will need to be strengthened in order to deliver on Australia’s well-demonstrated potential to double energy productivity by 2030.7
• Role of future energy utilities: With ‘grid parity’ of rooftop solar PV under most current retail tariffs, this modelling assumes that the energy utilities of the future take up the challenge of increased local generation and develop new business models which focus on energy services rather than only selling kilowatt-hours.
• Nuclear power generation and carbon capture and storage (CCS): As they are not classified as renewable energy resources, the scenarios do not include these options in the modelled future energy mix as they fall outside the 100% renewable energy scenario definition. In the case of nuclear, high costs, uncertainties over social license to operate, and very long construction times
5 Note these industry sectors correspond to IEA energy statistics that are input to the model. 6 Climate Council (2014) Australia’s Electricity Sector: Ageing, Inefficient and Unprepared, available at:
http://www.climatecouncil.org.au/uploads/f9ba30356f697f238d0ae54e913b3faf.pdf 7 ClimateWorks (2015) ‘Australia’s Energy Productivity Potential’, ClimateWorks Australia, Melbourne, Victoria
100% RENEWABLE ENERGY FOR AUSTRALIA 6
MARCH 2016
(an average of 12 years based on all currently operating nuclear power plants worldwide8) would likely exclude this option from featuring in a rapid energy system transition. Uncertainties surrounding the technical and economic case for carbon capture and storage may also preclude that technology from featuring within a rapid energy system transition scenario.9
• Population and GDP: The three scenarios are based on the same population and GDP assumptions. Projections of population growth are taken from the Australian Bureau of Statistics (ABS) while the GDP projection assumes long-term average growth of around 2.0% per year over the scenario period, as documented in Section 3.3.1.
• Firm Capacity: The scale of each technology deployed and the combinations of technologies in each of the three scenarios target a firm capacity in line with the current Australian energy system’s firm capacity (75%). Firm capacity is the “proportion of the maximum possible power that can reliably contribute towards meeting peak power demand when needed.”10 Firm capacity is important to ensure a reliable and secure energy system. Note that fluctuating or variable renewables still have a firm capacity rating and the combination of technology options increases the firm capacity of the portfolio of options (see also ‘security of energy supply’ point in the RE scenarios).
• Cost assumptions: The same cost assumptions are used across the three scenarios. As technology costs decline with deployment scale rather than time, the renewable energy cost reduction potentials in both renewable cases may even be larger than in the reference case because market sizes are bigger. The reverse is true for the fuel cost assumptions as all three scenarios are based on low fossil fuel price projections, while both renewable scenarios have a significant drop in demand; the reference case assumes increased demand that might lead to higher fuel costs. As such, the costs should be considered to be conservative. The cost assumptions are documented in section 3.3.3.
3.2.1 The Reference Scenario The Reference scenario (REF) reflects a continuation of current policies and is based on Australian Government forecasts. Energy statistics are taken from the International Energy Agency’s “Energy Balances of OECD Countries 2016”11 as well as “Australian Energy Update 2015” published by the Commonwealth Department of Industry, Innovation and Science12. The Australian energy demand projections use a combination of recent regulatory reporting forecasts where available, and the Australian Bureau of Resources and Energy Economics (BREE) Australian Energy Projections published November 201413. Official market forecast sources include the Australian Energy Market Operator (AEMO) national electricity and gas forecasts14 and the IMO 2015 Gas forecast for Western Australia15. This results in a forecast incorporating the most recent outlook from official sources where available.
8 Mycle Schneider, Antony Froggatt et al. World Nuclear Industry Status Report 2015 9 See, for example, Steffen, W (2015), ‘Unburnable Carbon: why we need to leave fossil fuels in the ground’, and Stock, A
(2014), ‘Australia’s Electricity Sector: Ageing, Inefficient and Unprepared’ Climate Council of Australia 10 http://igrid.net.au/resources/downloads/project4/D-CODE_User_Manual.pdf 11 International Energy Agency, 2015, Energy Balances of OECD Countries. Available at:
https://www.iea.org/statistics/relateddatabases/energybalancesofoecdcountries/ 12 Department of Industry and Science. 2015. 2015 Australian energy update Available at:
http://www.industry.gov.au/Office-of-the-Chief-Economist/Publications/Documents/aes/2015-australian-energy-statistics.pdf
13 Commonwealth of Australia Bureau of Resources and Energy Economics. 2014. Australian Energy Projections to 2049-50. Available at: http://www.industry.gov.au/Office-of-the-Chief-Economist/Publications/Documents/aep/aep-2014-v2.pdf
14 Australian Energy Market Operator (AEMO). 2015. National Electricity and Gas Forecasting. [ONLINE]. Available at: http://forecasting.aemo.com.au/Electricity/AnnualConsumption/Operational
15 Independent Market Operator (IMO). 2015. Gas Statement of Opportunities. Available at: http://wa.aemo.com.au/docs/default-source/Reserve-Capacity/november-2015-gas-statement-of-opportunities_v28968963f29c46dc8b2c9ff0000bd36b5.pdf?sfvrsn=0
100% RENEWABLE ENERGY FOR AUSTRALIA 7
MARCH 2016
3.2.2 Assumptions for both renewable scenarios Both the Renewables (RE) and Advanced Renewables (ADV RE) scenarios are built on a framework of targets and assumptions that strongly influences the development of individual technological and structural pathways for each sector. The main assumptions considered for this scenario-building process are detailed below:
• Emissions reductions: Strong improvements in energy efficiency and the dynamic expansion of renewable energy across all sectors are the main measures to meet CO2 emission reductions targets.
• Renewables industry growth: A dynamic growth in new capacities for renewable heat and power generation is assumed based on current knowledge about potentials (see energy potentials discussed in Section 3.3.5), costs and recent trends in renewable energy deployment.
• Fossil fuel phase out: The operational lifetime for coal power plants is conservatively estimated to be 40 years. In both scenarios brown coal power plants are phased out early on, followed by hard coal power plants and finally gas power plants.
• Future power supply: The capacity of large hydropower remains flat in Australia over the entire scenario period,16 while the quantities of bioenergy grow within the potential for sustainable biomass for Australia (see dot point on sustainable biomass levels below). Wind power and solar power, both photovoltaic and concentrating solar power (CSP), are expected to be the main pillars of future power supply, complemented by smaller contributions from bioenergy, geothermal (hydrothermal and Enhanced Geothermal Systems [EGS]), and the future expansion of small and medium sized ocean energy. Note that solar PV figures combine both rooftop and greenfield development.
• Annual renewable energy installation market: In the process of defining the input assumptions for this modelling, ISF contacted the Clean Energy Council (CEC) to identify Australia’s current and future potential renewable industry capacity in regards to installations (MW) per year for solar PV, concentrated solar power, wind, bioenergy and different forms of geothermal energy technologies. The annual installation numbers modelled between 2015 and 2020 for the Advanced Renewables scenario are in line with the capacities identified by the CEC.
• Security of energy supply: The scenarios limit the share of fluctuating or variable power generation and maintain a sufficient share of controllable, secured capacity. Power generation from biomass and CSP, as well as a share of gas-fired back-up capacities and storage, are considered important for the security of supply in a future energy system, related to the output of firm capacity discussed above.
• Sustainable biomass levels: The sustainable level of biomass use for Australia is assumed to be limited to 1500 PJ, based on background studies on sustainable biomass potentials17. Low-tech biomass use, for example inefficient household wood-burners, are largely replaced in the renewable scenarios by state-of-the-art technologies, primarily highly efficient cogeneration plants.
• CSP technology: CSP implementation after 2030 was assumed to have a solar multiple of three18, which then enables thermal energy storage to provide energy for 12 hours per day of full-load operation of the turbine.
16 Increased droughts due to climate change pose risks to large-scale hydro’s potential to continue generating at the same level as it has in the past, a risk which may be partly addressed through efficiency upgrades to existing installations and the addition of run-of-river, mini and micro hydro schemes. Geoscience Australia and ABARE (2010), ‘Hydro Energy’, chapter 8, Australian Energy Resource Assessment, Canberra
17 Global Biomass Potentials: Investigation and assessment of data Country-specific energy crop potentials, Remote sensing in biomass potential research, Global Biomass Potentials -Investigation and assessment of data, Country-specific energy crop potentials, Remote sensing in biomass potential research; Thilo Seidenberger et. al. (2008) German Biomass Research Centre
18 Oversizing the heliostat field by three times, to ensure both peak output and overnight thermal storage.
100% RENEWABLE ENERGY FOR AUSTRALIA 8

MARCH 2016
• Electrification of transport: Efficiency savings in the transport sector are a result of fleet penetration with new highly efficient vehicles, such as electric vehicles, but also assumed changes in mobility patterns and the implementation of efficiency measures for combustion engines. The scenarios assume a limited use of biofuels for transportation as the supply of sustainable biofuels is limited.
• Hydrogen and synfuels: Hydrogen and synfuels generated by electrolysis using renewable electricity is introduced as a third renewable fuel in the transportation sector, complementary to biofuels, the direct use of renewable electricity and battery storage. Hydrogen generation can have high energy losses; however the limited potentials of biofuels and mostly likely also battery storage for electric mobility mean it is necessary to have a third renewable option in the transport sector. Alternatively, this renewable hydrogen could be converted into synthetic methane and liquid fuels depending on economic benefits (storage costs vs. additional losses) as well as technology and market development in the transport sector (combustion engines vs. fuel cells).
3.2.3 The Renewables scenario The Renewables scenario (RE) is designed to meet targets of halving Australia’s energy related carbon dioxide emissions by 2035 and reducing them by 70% by 2050 compared to 1990 levels. These targets are in line with those that underpin ClimateWorks’ Deep Decarbonisation Pathways modelling and are focused mainly on stationary power generation. Further to these targets are the objectives of phasing out all coal power plants by 2035, doubling energy productivity by 2030 and tripling it by 2050.
The energy efficiency projections for each sector are taken from research by ClimateWorks, ANU and CSIRO in “Pathways to deep decarbonisation in 2050”19. The renewable energy trajectories for the first decades are taken from the ClimateWorks projections with solar photovoltaic figures updated with market figures from the Australian PV Institute for 2015. Renewable energy markets are projected to grow at a rate equal to the renewable energy markets of OECD countries with consistent reliable energy policies over the past decade and into the next decade. In addition, pathways for the deployment of renewable energy and efficiency measures reflect the technology trends of the last few years and market estimations of the solar photovoltaic, wind industry and other innovative technologies.
This scenario includes significant efforts to fully exploit the large potential for energy efficiency, available through current best-practice technology. At the same time, various proven renewable energy sources are integrated, to a large extent for electricity generation and also to a lesser extent for the production of synthetic fuels and hydrogen for heating (domestic, commercial and industrial) and transport.
3.2.4 The Advanced Renewables scenario The Advanced Renewables scenario (ADV RE) takes a more ambitious approach to transforming Australia’s entire energy system towards 100% renewable energy supply. The consumption pathways remain almost the same as in the Renewables scenario, however under this scenario a much faster introduction of new technologies leads to a complete decarbonisation of energy for stationary energy (electricity), heating (including process heat for industry) and transportation. The latter requires a strong role for storage technologies such as batteries, synthetic fuels and hydrogen.
The resulting final energy demand for transportation is lower compared to the Renewables scenario based on the assumptions that:
• Future vehicles and particularly electric vehicles will be more efficient and • There will be greater changes in the transport mode-shift i.e. a greater use of public transport
19 ClimateWorks Australia, ANU, CSIRO and CoPS, 2014, Pathways to Deep Decarbonisation in 2050: How Australia can prosper in a low carbon world: Technical report. Available at: http://www.climateworksaustralia.org/sites/default/ files/documents/publications/climateworks_pdd2050_technicalreport_20140923.pdf
100% RENEWABLE ENERGY FOR AUSTRALIA 9
MARCH 2016
The Advanced Renewables scenario increases the share of electric and fuel cell vehicles. This scenario also relies on a greater production of synthetic fuels from renewable electricity for use in the transport and industry sectors. Renewable hydrogen is converted into synthetic hydrocarbons, which replace the remaining fossil fuels, especially for heavy duty vehicles and air transportation, albeit with low overall efficiency of the synfuel system. Note that since renewable synfuels would use the current gas infrastructure, they could, with investment, become an export industry for Australia, in addition to what is modelled in these scenarios. To compensate for the high energy losses associated with the production of synthetic fuels, this scenario requires more fundamental changes in mobility patterns, behaviour and infrastructure.
In the heating sector (mainly heat for industry) electricity and hydrogen play a larger role in substituting for remaining fossil fuels. In the power sector, natural gas is also replaced by hydrogen. Therefore, electricity generation increases significantly in this scenario, assuming power from renewable energy sources to be the main “primary energy” of the future.
The Advanced Renewables scenario also models a shift in the heat sector towards an increase in the direct use of electricity, because of the enormous and diverse potential for renewable power and the limited availability of renewable fuels for high-temperature process heat in industry. A rapid expansion in the use of district heating and geothermal heat pumps is assumed, leading to an increase in electricity demand, which partly offsets the efficiency savings in these sectors. A rapid expansion of solar and geothermal heating systems is also assumed.
The increasing shares of variable renewable power generation, principally by wind farms and photovoltaics, will require the implementation of smart grids and a fast expansion of transmission grids, storage, and other load balancing capacities. Other infrastructure needs will also result, for example from the increasing role of on-site renewable process heat generation for industries and mining and the generation and distribution of synthetic fuels. The Advanced Renewables scenario therefore assumes that such infrastructure projects will be implemented in all parts of Australia without serious societal, financial or political barriers.
Scenarios by no means claim to predict the future; they provide a useful tool to describe and compare potential development pathways out of the broad range of possible ‘futures’. The Advanced Renewables scenario was designed to indicate the efforts and actions required to achieve the ambitious objective of a 100% renewable energy system and to illustrate the options available to change our energy supply system into one that is truly sustainable. They may serve as a reliable basis for further analyses of possible concepts and actions needed to implement pathways for an energy transition.
3.3 SCENARIO ASSUMPTIONS
3.3.1 Population and economic development Future population and economic growth are important factors in energy scenario building because they affect the size and composition of energy demand, directly and through its impact on economic growth and development. For population the Australian Bureau of Statistics projections20 are used (see Table 1) while GDP growth is assumed to converge with the long-term OECD average at 2.0% per annum over the next 35 years.21
Table 1: Australia’s population projection
Year 2015 2020 2030 2040 2050
Population 22,000,000 24,000,000 28,000,000 32,000,000 40,000,000
20 Australian Bureau of Statistics 3222.0 - Population Projections, Australia, 2012 (base) to 2101 - Series A http://www.abs.gov.au/ausstats/[email protected]/Lookup/3222.0main+features52012%20(base)%20to%202101
21 OECD Shifting Gear: Policy Challenges for the next 50 Years, Economics Department Policy Notes, 24 July 2014.
100% RENEWABLE ENERGY FOR AUSTRALIA 10
MARCH 2016
3.3.2 Fuel price projections Global oil prices have fluctuated dramatically over recent years and this has been considered in the price projections for this modelling. In the IEA’s World Energy Outlook 2014 oil price projections by 2040 range from $100 per barrel in the ‘450-ppm scenario’ up to $155 per barrel in the ‘Current Policies scenario’ (in 2013 USD). At the time of this analysis (January 2016), the oil price was at a historic low of only $30 per barrel with gas prices also showing significant fluctuation. The international coal price fell significantly and reached a low of $50 dollar per ton in early 2016.
To account for these fluctuations the IEA projections from 2014 have been adjusted to the fuel prices of January 2016, which were less than half the price originally projected for this year. While there are coal price projections for export coal22, there are no long term price projections for domestic thermal coal. Furthermore Australian coal power plants do not pay the full international export price, a factor which can in many cases be classified as an effective subsidy.
The oil price assumption for all futures is taken from IEA World Energy Outlook 2014 ‘450-ppm scenario’.
Given the very high uncertainties of fossil fuel price projections, this research has taken into account the following cost projections for the power generation sector (coal and gas):
• The IEA WEO High Coal and Gas Price Scenario (WEO 2014) • A continuing low coal price (as of January 2016) with the price staying at this current low price
through to 2050. • A low coal price (as of January 2016) with the price recovering (escalating) in line with the IEA’s
trajectory • A low gas price (as of January 2016) with the price recovering (escalating) in line with the IEA’s
trajectory • The average coal price of the past 5 years and prices increasing according to the IEA’s trajectory.
Table 2: Development projections for fossil fuel and biomass prices in AUS$/GJ (Source IEA WEO 2014, DLR/GPI - Energy [R]evolution 2015)
in AUS$/GJ 2015 2020 2025 2030 2035 2040 2045 2050
Hard coal IEA WEO High Price 5.9 6.5 7.5 8.0 8.4 8.9 9.3 9.6
Historic low price 2.0 2.2 2.5 2.7 2.8 3.0 3.1 3.2
Average price 2.9 3.2 3.8 4.0 4.2 4.5 4.6 4.8
Current and continuing low price 2.9 3.2 3.2 3.2 3.2 3.2 3.2 3.2
Natural gas
IEA WEO High Price 20.5 24.2 26.1 28.0 29.9 31.8 34.7 37.6
Historic low price 6.8 8.1 8.7 9.3 10.0 10.6 11.6 12.5
High price 9.8 11.5 12.4 13.3 14.2 15.1 16.5 17.9
Current and continuing low price 9.8 11.5 11.5 11.5 11.5 11.5 11.5 11.5
Crude oil IEA WEO 23.2 27.2 29.3 31.4 31.4 31.4 31.4 31.4
Biomass and waste
DLR 4.5 4.9 5.2 5.5 5.8 6.0 6.4 6.7
Biomass and waste 2.1 2.3 2.5 2.6 2.7 2.9 3.0 3.2
22 Bullen, J., Kouparitsas, M. and Krolikowski, M; Long-Run Forecasts of Australia’s Terms of Trade; Treasury Working Paper 2, 2014–01 http://www.treasury.gov.au/~/media/Treasury/Publications%20and%20Media/Publications/2014/ Long%20run%20forecasts%20of%20Australias%20terms%20of%20trade/Documents/PDF/long_run_tot.ashx
100% RENEWABLE ENERGY FOR AUSTRALIA 11

MARCH 2016
These coal and gas fuel cost projections are combined into the following three possible fuel cost futures and in two cases a relatively low carbon price which the three scenarios are tested against:
1. A current and continuing low coal price, with a low gas price and no carbon price
2. A low coal price, a low gas price and a carbon price of $20/tonne in 2020 rising to $30/tonne in 2030 and staying stable at this price until 2050
3. The average coal price, high gas price (from IEA WEO) and a carbon price as in 2.
It should be noted that the impact of the carbon price is only relevant to the resulting costs of electricity generation as outlined in Section 4.2.2. In this model a carbon price is not applied to the investment cost or the fuel costs, and is therefore not assumed in the calculation of the fuel cost savings delivered by either renewable scenario.
3.3.3 Cost projections for investment, operation and maintenance costs The assumptions for the specific investment and operation costs of coal, gas, brown coal and oil power plants have been made according to the World Energy Outlook (WEO) 2014 Special Report on Investments23. Because these technologies are at an advanced stage of technology and market development, the potential for cost reductions is limited.
The different renewable energy technologies available today all have different costs, levels of technical maturity and development potential. While hydropower has been widely used for decades, other technologies, such as the gasification of biomass or ocean energy, have yet to find their way to market maturity. Other types of renewable technologies being employed today are at a relatively early stage of market development, while others already developed mature markets. It is expected, however that large cost reductions can come from technical advances, manufacturing improvements and large-scale production, unlike conventional technologies. The dynamic trend of cost developments over time plays a crucial role in identifying economically sensible expansion strategies for scenarios spanning several decades.
Some renewable sources by their very nature, including wind and solar power, provide a variable supply, requiring a revised coordination with the grid network. But although in many cases renewable energy technologies are ‘distributed’ - their output being generated and delivered locally to the consumer – they also have large-scale applications like offshore wind parks, photovoltaic power plants or concentrating solar power stations.
To identify long-term cost developments, learning curves have been applied to the model calculations to reflect how the cost of a particular technology changes in relation to the cumulative production volumes. For many technologies, the learning factor (or progress ratio) sits between 0.75 for less mature systems to and 0.95 and higher for well-established technologies. A learning factor of 0.9 means that costs are expected to fall by 10% every time the cumulative output from the technology doubles. Empirical data shows, for example, that the learning factor for PV solar modules has been fairly constant at 0.8 over 30 years whilst that for wind energy varies from 0.75 in the UK to 0.94 in the German market.
The ISF research partners, the German Aerospace Centre (DLR) Institute for Technical Thermodynamics, Technology and System-Analysis, developed cost projections for renewable energy technologies. Assumptions on future costs for renewable electricity technologies were derived from a review of learning curve studies of Lena Neij24, the analysis of technology foresight and road mapping studies, including the European Commission funded NEEDS project (New Energy Externalities Developments for Sustainability)25, the IEA Energy Technology Perspectives 2008, projections by the
23 IEA 2014: Power Generation in the New Policies and 450 Scenarios - Assumed investment costs, operation and maintenance costs and efficiencies in the IEA World Energy Investment Outlook 2014, data file download: http://www.worldenergyoutlook.org/investment/
24 Neij, L, ‘Cost development of future technologies for power generation - a study based on experience curves and complementary bottom-up assessments’, Energy Policy 36 (2008), 2200-2211
25 www.needs-project.org
100% RENEWABLE ENERGY FOR AUSTRALIA 12
MARCH 2016
European Renewable Energy Council published in April 2010 (“Re-Thinking 2050”) and discussions with experts from different sectors of the renewable energy industry.
In 2014 and 2015 DLR updated and revised those cost projection for the Greenpeace International Energy [R]evolution research26. Due to significant cost decreases between 2014 and 2016, recent market developments have been taken into account, leading to further reduction of cost assumptions – especially for photovoltaics and solar thermal power plants (including heat storage). However, to increase consistency in the modelling, cost assumptions from WEO 2014 are adopted for biomass power plants, hydro, wind power and ocean energy.
These cost assumptions – especially for the base years – have been adapted to current Australian costs on the basis of the Australian Power Generation Technology Report27. Future cost projections have been compared with several other projections, including the International Renewable Energy Agency (IRENA), Renewable Power Generation Costs in 2014.28
It should be noted that all the publications referred to above are within the same cost estimation range. These cost assumptions (investment, operation and maintenance costs) are detailed in Appendix A. It should be noted that the solar PV costs listed in Appendix A assume an average between rooftop and utility scale solar PV, as it is assumed that Australia will see both.
3.3.4 Assumptions for hydrogen and synfuel production from renewable electricity In the Advanced Renewables scenarios hydrogen and sustainable synthetic fuels (synfuels) are introduced as a substitute for natural gas, and make up a significant share of transport fuels after 2030. Hydrogen is assumed to be produced via electrolysis, resulting in an additional electricity demand supplied by extra renewable power production capacity mainly from wind, PV and CSP.29 Renewable hydrogen and synthetic fuels are essential for a variety of sectors:
• For the industry sector, hydrogen serves as an additional renewable fuel option for high-temperature applications, supplementing biomass in industrial processes, whenever direct use of renewable electricity is not applicable.
• The transport sector also increasingly relies on hydrogen as a renewable fuel, where battery supported electric vehicles reach their limitations and where limited biomass potentials restrict the extension of biofuel use. However, future application of hydrogen might not suffice to replace all fossil fuel demand, especially in aviation, heavy-duty vehicles and navigation. The Advanced Renewables study introduces synthetic hydrocarbons from renewable hydrogen, electricity and biogenic/atmospheric CO2. These synfuels are introduced after 2030 and provide for the remaining fossil fuel demand that cannot be supplied by biofuels due to limited potentials.
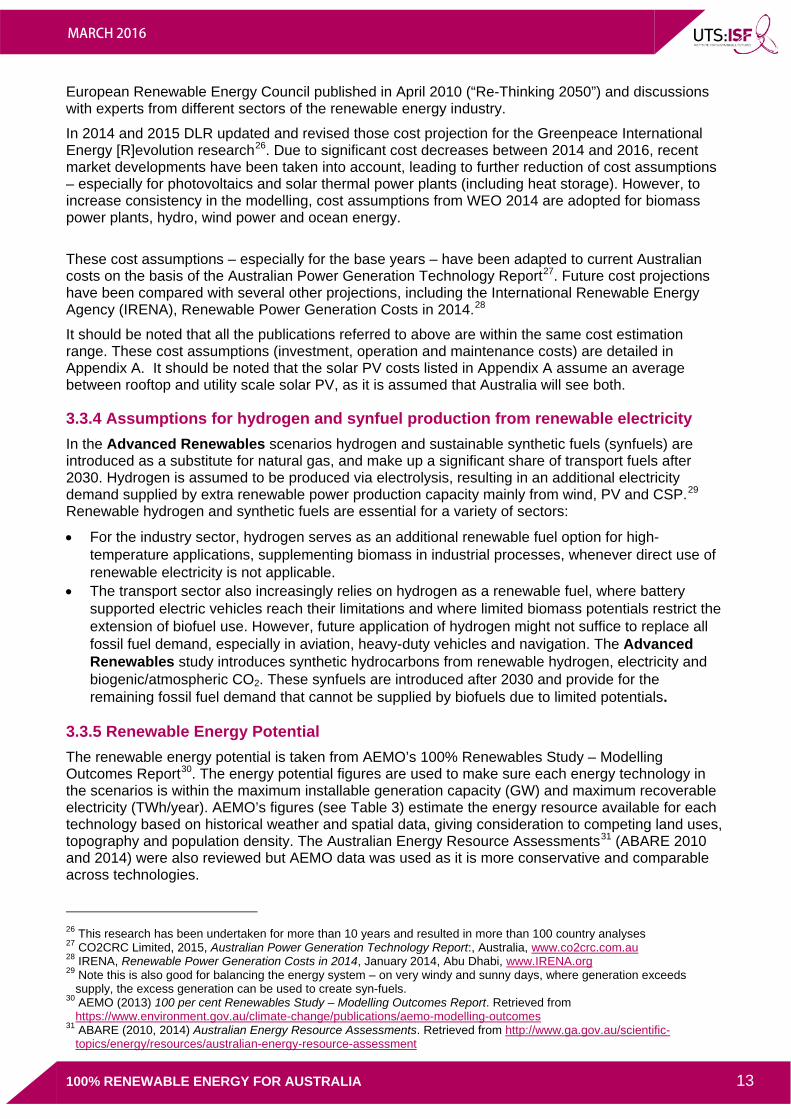
3.3.5 Renewable Energy Potential The renewable energy potential is taken from AEMO’s 100% Renewables Study – Modelling Outcomes Report30. The energy potential figures are used to make sure each energy technology in the scenarios is within the maximum installable generation capacity (GW) and maximum recoverable electricity (TWh/year). AEMO’s figures (see Table 3) estimate the energy resource available for each technology based on historical weather and spatial data, giving consideration to competing land uses, topography and population density. The Australian Energy Resource Assessments31 (ABARE 2010 and 2014) were also reviewed but AEMO data was used as it is more conservative and comparable across technologies.
26 This research has been undertaken for more than 10 years and resulted in more than 100 country analyses 27 CO2CRC Limited, 2015, Australian Power Generation Technology Report:, Australia, www.co2crc.com.au 28 IRENA, Renewable Power Generation Costs in 2014, January 2014, Abu Dhabi, www.IRENA.org 29 Note this is also good for balancing the energy system – on very windy and sunny days, where generation exceeds
supply, the excess generation can be used to create syn-fuels. 30 AEMO (2013) 100 per cent Renewables Study – Modelling Outcomes Report. Retrieved from
https://www.environment.gov.au/climate-change/publications/aemo-modelling-outcomes 31 ABARE (2010, 2014) Australian Energy Resource Assessments. Retrieved from http://www.ga.gov.au/scientific-
topics/energy/resources/australian-energy-resource-assessment
100% RENEWABLE ENERGY FOR AUSTRALIA 13
MARCH 2016
Table 3: Renewable Energy Potential (AEMO 2013)
Resource
Maximum installable generation capacity (GW)
Maximum recoverable electricity (TWh/year)
Wind – onshore (greater than 35% capacity factor)
880 3100
Wind – offshore (greater than 50% capacity factor)
660 3100
Solar – CST/PV 18,500 / 24,100 41,600 / 71,700
Geothermal (EGS) 5,140 36,040
Geothermal (HSA) 360 2,530
Biomass 16 108
Wave 133 275
Hydro 8 12
Total 25,700 / 31,300 86,800 / 116,900
Table 4 shows the required areas for three types of renewable energy technologies.
Table 4: Required area for Solar PV and Wind
Technology Unit 2015 2020 2030 2040 2050
PV Total installed capacity GW 3 28 72 111 166
Specific nominal capacity (per m2) kW/m2 0.14 0.15 0.16 0.17 0.17
Area km2 22.3 174.2 449.2 654.4 976.5
Wind onshore
Total installed capacity GW 4 13 29 37 47
Average capacity MW 2.0 3.0 3.5 4.0 4.3
Number of plants # 2,087 4,354 7,143 9,138 10,960
Wind offshore
Total installed capacity GW 0 0 6 7 9
Average capacity MW 5.4 6.2 7.5 8.5 9.0
Number of plants # 0 0 797 1,011 1,022
100% RENEWABLE ENERGY FOR AUSTRALIA 14
MARCH 2016
4 RESULTS In this section, we outline the key results across a range of areas, both in terms of the impacts and the costs of the different scenarios. First, we consider stationary energy, focusing on electricity generation, capacity and breakdown by technology. We then examine energy supply for heating, focusing on industrial heat supply. This is followed by a section considering the impacts and costs of the different scenarios on transport and on the development of CO2 emissions. The section ends with an examination of the final costs, outlining the required energy budget.
4.1 ELECTRICITY CONSUMPTION/DEMAND To understand the results, it is first necessary to clarify the metrics used. Two of the main metrics used in the energy industry to analyse energy are primary energy consumption and final energy demand.
Final energy demand “is a measure of the energy that is delivered to energy end users in the economy to undertake activities as diverse as manufacturing, movement of people and goods, essential services and other day-to-day energy requirements of living.”32
Primary energy consumption is defined as the “direct energy use at the source, or supply to users without transformation, of crude energy; that is, energy that has not been subjected to any conversion or transformation process.”33 Primary energy statistics often make the renewables share appear lower than other forms of energy. For example, IEA 2010 statistics listed the global primary energy share for nuclear energy as 6% and hydropower at 2%, however both technologies produced the same amount of power generation in Terawatt hours. This is due to the fact that nuclear power is a thermal process with an average efficiency of around 30% - thus the input of uranium (the primary energy resource) is therefore three times higher, than the final energy (3:1), while hydropower which does not involve a thermal process is calculated as final energy equals primary energy (1:1).
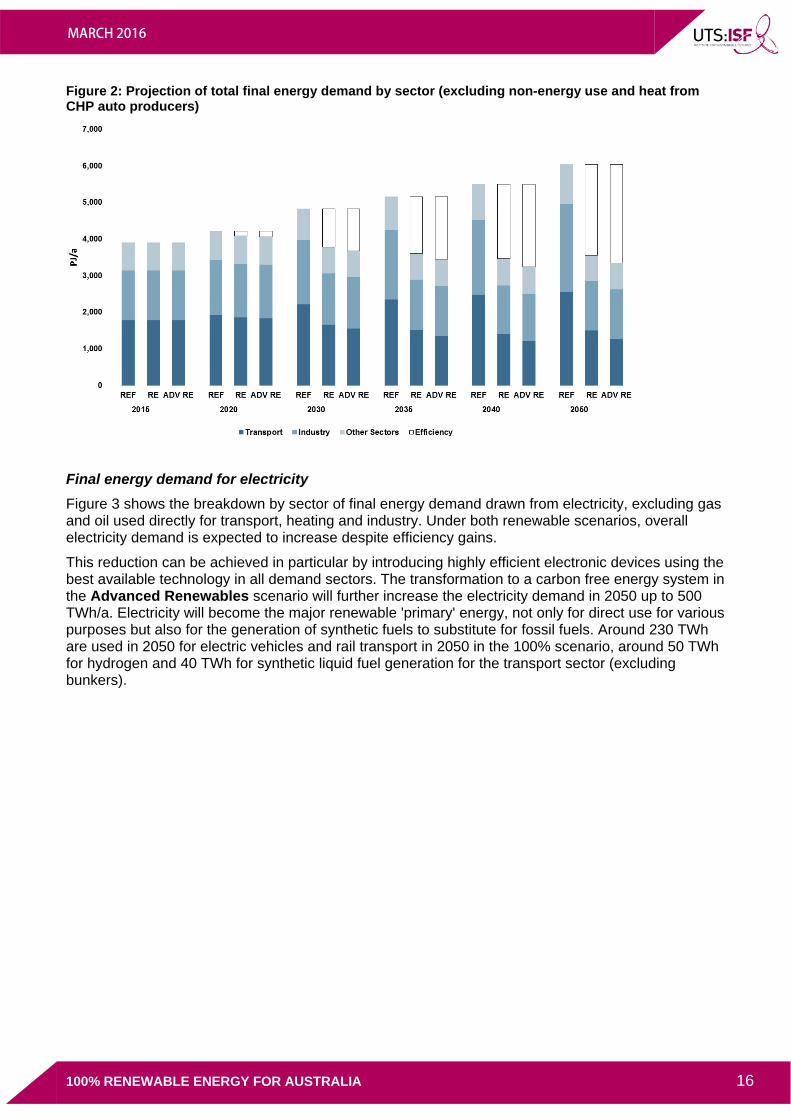
4.1.1 Final Energy Demand Total final energy demand Combining the population development GDP growth and energy intensity projections results in future development pathways for Australia’s final energy demand under all three scenarios (Figure 2).
Under the Reference scenario, the total final energy demand increases by 54% from 3900 PJ/a in 2015 to 6000 PJ/a in 2050. In the basic Renewables scenario, final energy demand decreases by 8% compared to current consumption, equating to 3600 PJ/a of energy in 2050. The Advanced Renewables scenario results in further reductions due to a higher share of electric cars.
32 http://www.seai.ie/Energy-Data-Portal/Frequently-Asked-Questions/Energy_Use_FAQ/ 33 https://stats.oecd.org/glossary/detail.asp?ID=2112
100% RENEWABLE ENERGY FOR AUSTRALIA 15
MARCH 2016
Figure 2: Projection of total final energy demand by sector (excluding non-energy use and heat from CHP auto producers)
Final energy demand for electricity Figure 3 shows the breakdown by sector of final energy demand drawn from electricity, excluding gas and oil used directly for transport, heating and industry. Under both renewable scenarios, overall electricity demand is expected to increase despite efficiency gains.
This reduction can be achieved in particular by introducing highly efficient electronic devices using the best available technology in all demand sectors. The transformation to a carbon free energy system in the Advanced Renewables scenario will further increase the electricity demand in 2050 up to 500 TWh/a. Electricity will become the major renewable 'primary' energy, not only for direct use for various purposes but also for the generation of synthetic fuels to substitute for fossil fuels. Around 230 TWh are used in 2050 for electric vehicles and rail transport in 2050 in the 100% scenario, around 50 TWh for hydrogen and 40 TWh for synthetic liquid fuel generation for the transport sector (excluding bunkers).
100% RENEWABLE ENERGY FOR AUSTRALIA 16
MARCH 2016
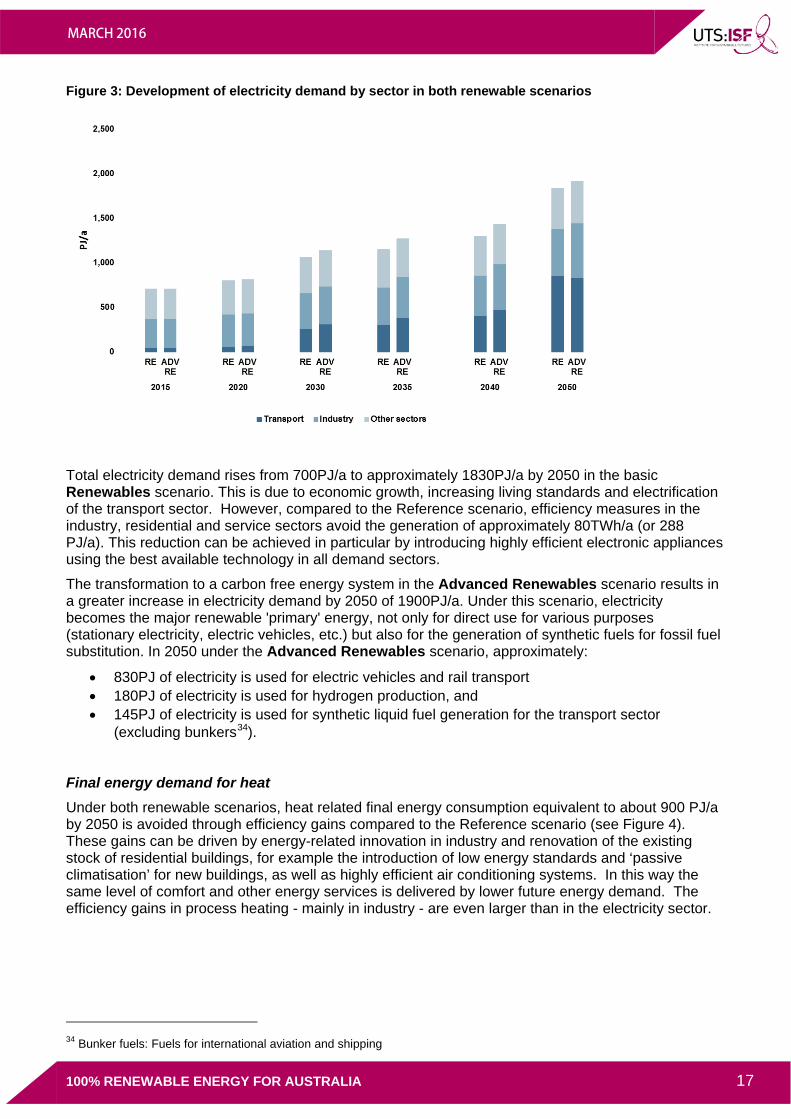
Figure 3: Development of electricity demand by sector in both renewable scenarios
Total electricity demand rises from 700PJ/a to approximately 1830PJ/a by 2050 in the basic Renewables scenario. This is due to economic growth, increasing living standards and electrification of the transport sector. However, compared to the Reference scenario, efficiency measures in the industry, residential and service sectors avoid the generation of approximately 80TWh/a (or 288 PJ/a). This reduction can be achieved in particular by introducing highly efficient electronic appliances using the best available technology in all demand sectors.
The transformation to a carbon free energy system in the Advanced Renewables scenario results in a greater increase in electricity demand by 2050 of 1900PJ/a. Under this scenario, electricity becomes the major renewable 'primary' energy, not only for direct use for various purposes (stationary electricity, electric vehicles, etc.) but also for the generation of synthetic fuels for fossil fuel substitution. In 2050 under the Advanced Renewables scenario, approximately:
• 830PJ of electricity is used for electric vehicles and rail transport • 180PJ of electricity is used for hydrogen production, and • 145PJ of electricity is used for synthetic liquid fuel generation for the transport sector
(excluding bunkers34).
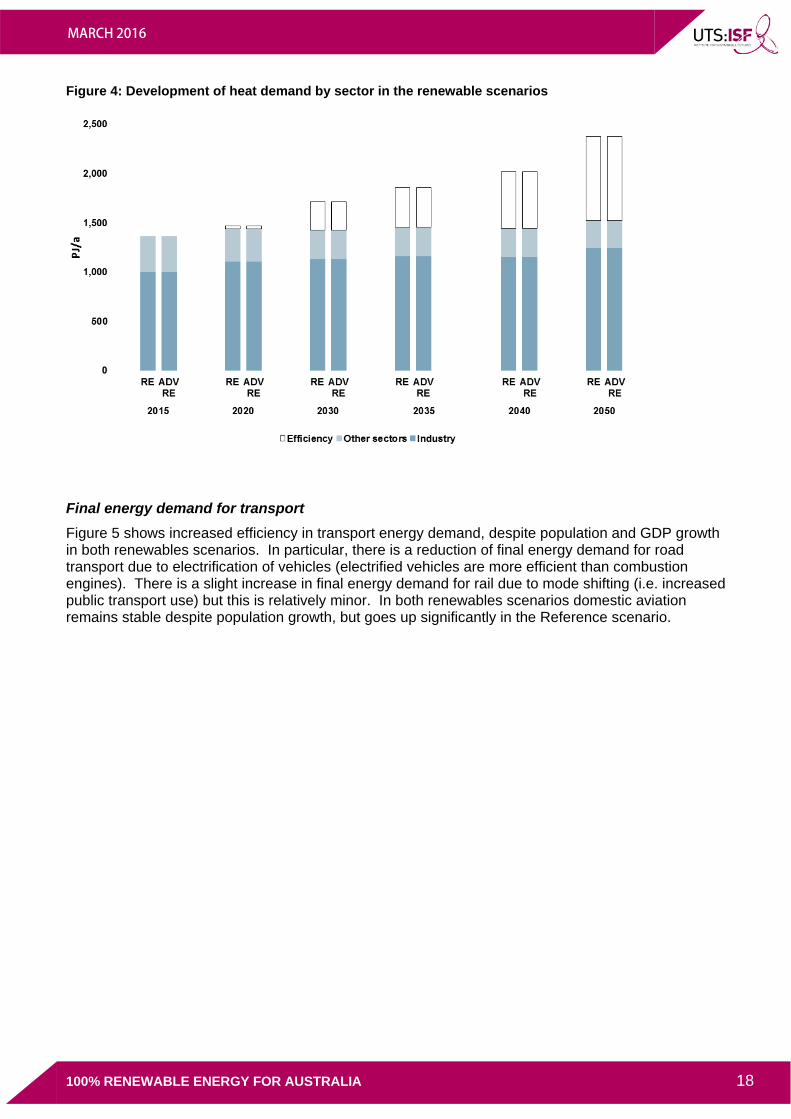
Final energy demand for heat Under both renewable scenarios, heat related final energy consumption equivalent to about 900 PJ/a by 2050 is avoided through efficiency gains compared to the Reference scenario (see Figure 4). These gains can be driven by energy-related innovation in industry and renovation of the existing stock of residential buildings, for example the introduction of low energy standards and ‘passive climatisation’ for new buildings, as well as highly efficient air conditioning systems. In this way the same level of comfort and other energy services is delivered by lower future energy demand. The efficiency gains in process heating - mainly in industry - are even larger than in the electricity sector.
34 Bunker fuels: Fuels for international aviation and shipping
100% RENEWABLE ENERGY FOR AUSTRALIA 17
MARCH 2016
Figure 4: Development of heat demand by sector in the renewable scenarios
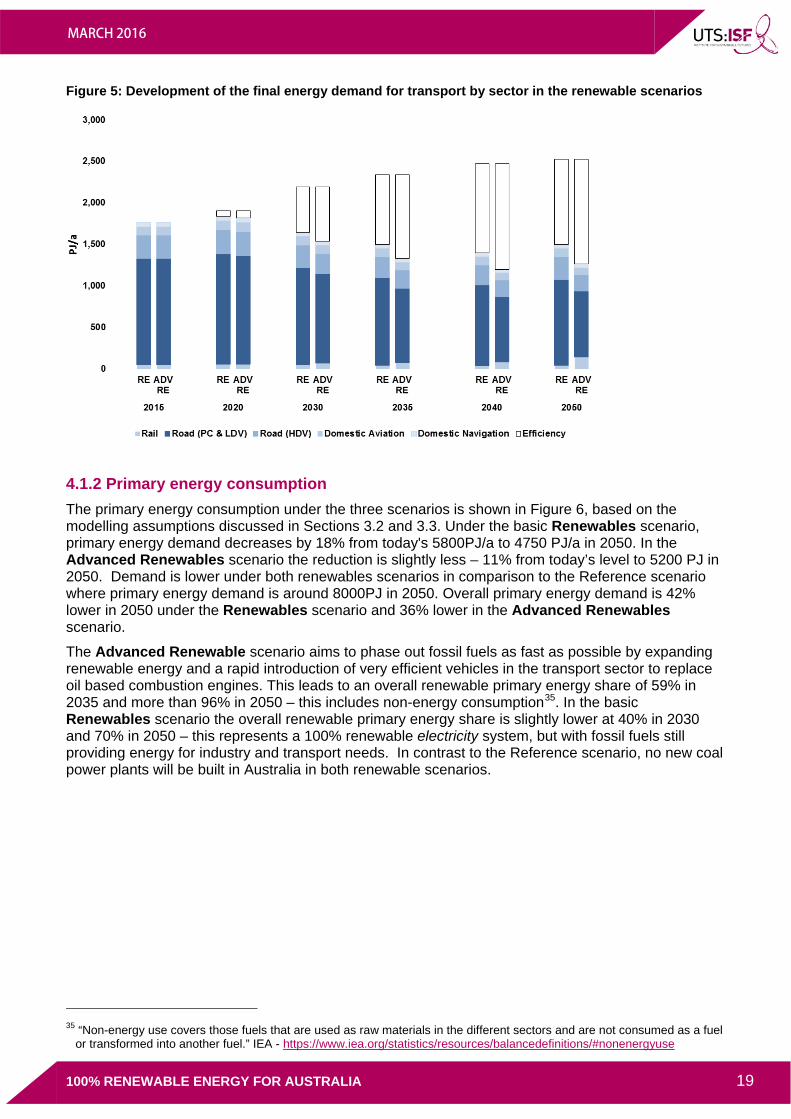
Final energy demand for transport Figure 5 shows increased efficiency in transport energy demand, despite population and GDP growth in both renewables scenarios. In particular, there is a reduction of final energy demand for road transport due to electrification of vehicles (electrified vehicles are more efficient than combustion engines). There is a slight increase in final energy demand for rail due to mode shifting (i.e. increased public transport use) but this is relatively minor. In both renewables scenarios domestic aviation remains stable despite population growth, but goes up significantly in the Reference scenario.
100% RENEWABLE ENERGY FOR AUSTRALIA 18
MARCH 2016
Figure 5: Development of the final energy demand for transport by sector in the renewable scenarios
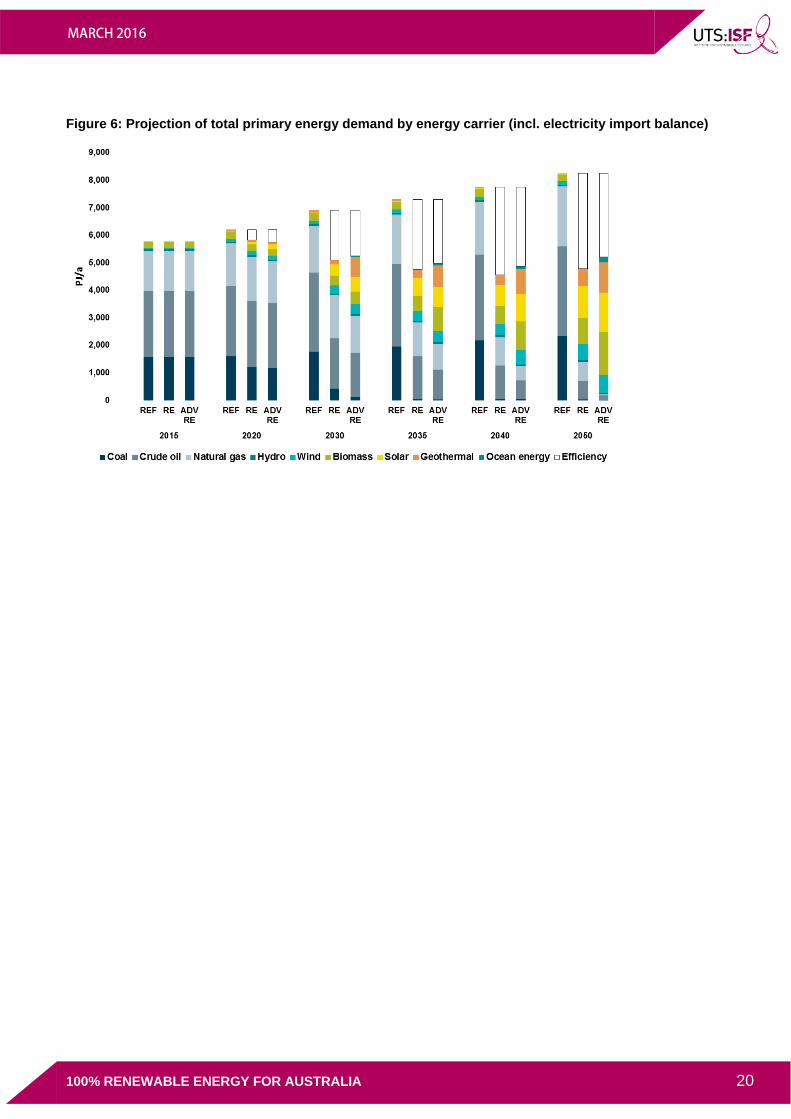
4.1.2 Primary energy consumption The primary energy consumption under the three scenarios is shown in Figure 6, based on the modelling assumptions discussed in Sections 3.2 and 3.3. Under the basic Renewables scenario, primary energy demand decreases by 18% from today's 5800PJ/a to 4750 PJ/a in 2050. In the Advanced Renewables scenario the reduction is slightly less – 11% from today’s level to 5200 PJ in 2050. Demand is lower under both renewables scenarios in comparison to the Reference scenario where primary energy demand is around 8000PJ in 2050. Overall primary energy demand is 42% lower in 2050 under the Renewables scenario and 36% lower in the Advanced Renewables scenario.
The Advanced Renewable scenario aims to phase out fossil fuels as fast as possible by expanding renewable energy and a rapid introduction of very efficient vehicles in the transport sector to replace oil based combustion engines. This leads to an overall renewable primary energy share of 59% in 2035 and more than 96% in 2050 – this includes non-energy consumption35. In the basic Renewables scenario the overall renewable primary energy share is slightly lower at 40% in 2030 and 70% in 2050 – this represents a 100% renewable electricity system, but with fossil fuels still providing energy for industry and transport needs. In contrast to the Reference scenario, no new coal power plants will be built in Australia in both renewable scenarios.
35 “Non-energy use covers those fuels that are used as raw materials in the different sectors and are not consumed as a fuel or transformed into another fuel.” IEA - https://www.iea.org/statistics/resources/balancedefinitions/#nonenergyuse
100% RENEWABLE ENERGY FOR AUSTRALIA 19
MARCH 2016
Figure 6: Projection of total primary energy demand by energy carrier (incl. electricity import balance)
100% RENEWABLE ENERGY FOR AUSTRALIA 20
MARCH 2016
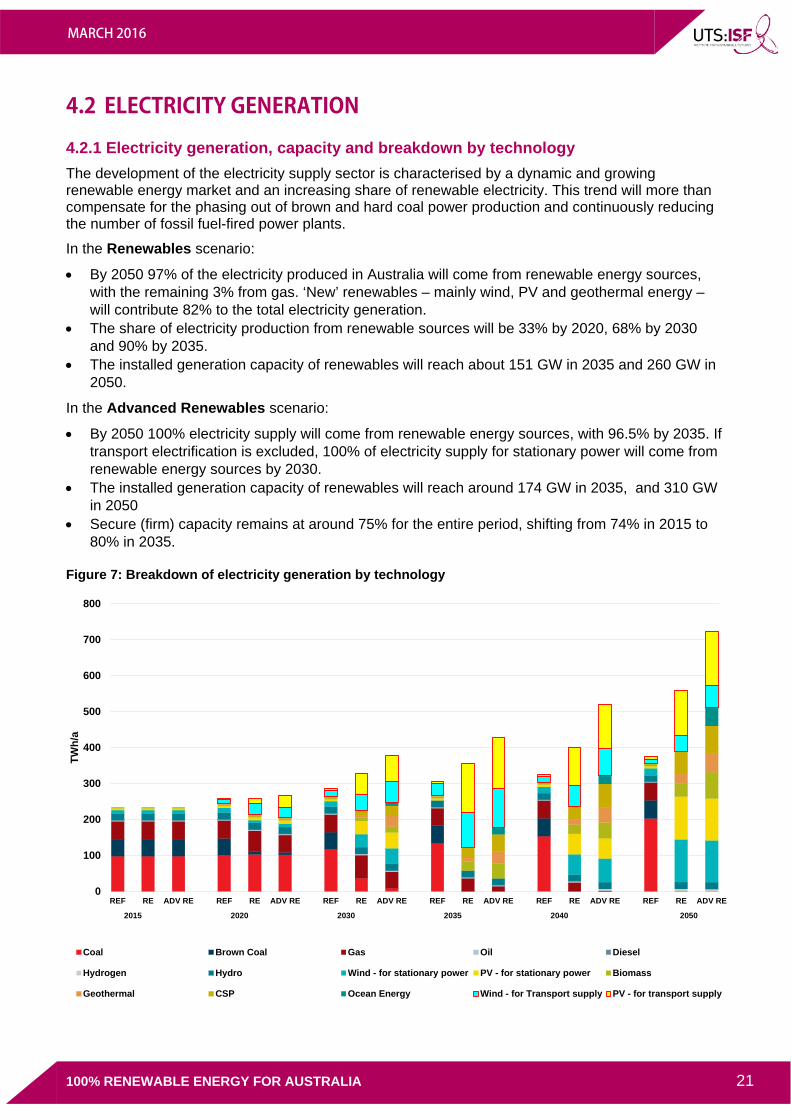
4.2 ELECTRICITY GENERATION
4.2.1 Electricity generation, capacity and breakdown by technology The development of the electricity supply sector is characterised by a dynamic and growing renewable energy market and an increasing share of renewable electricity. This trend will more than compensate for the phasing out of brown and hard coal power production and continuously reducing the number of fossil fuel-fired power plants.
In the Renewables scenario:
• By 2050 97% of the electricity produced in Australia will come from renewable energy sources, with the remaining 3% from gas. ‘New’ renewables – mainly wind, PV and geothermal energy – will contribute 82% to the total electricity generation.
• The share of electricity production from renewable sources will be 33% by 2020, 68% by 2030 and 90% by 2035.
• The installed generation capacity of renewables will reach about 151 GW in 2035 and 260 GW in 2050.
In the Advanced Renewables scenario:
• By 2050 100% electricity supply will come from renewable energy sources, with 96.5% by 2035. If transport electrification is excluded, 100% of electricity supply for stationary power will come from renewable energy sources by 2030.
• The installed generation capacity of renewables will reach around 174 GW in 2035, and 310 GW in 2050
• Secure (firm) capacity remains at around 75% for the entire period, shifting from 74% in 2015 to 80% in 2035.
Figure 7: Breakdown of electricity generation by technology
0
100
200
300
400
500
600
700
800
REF RE ADV RE REF RE ADV RE REF RE ADV RE REF RE ADV RE REF RE ADV RE REF RE ADV RE
2015 2020 2030 2035 2040 2050
TWh/
a
Coal Brown Coal Gas Oil Diesel
Hydrogen Hydro Wind - for stationary power PV - for stationary power Biomass
Geothermal CSP Ocean Energy Wind - for Transport supply PV - for transport supply
100% RENEWABLE ENERGY FOR AUSTRALIA 21
MARCH 2016
Figure 7 shows the structure of power generation by technology type. The supply for stationary power will reach 100% in 2030 under the Advanced Renewables scenario, with electricity generation for transport excluded. By 2020 there will already be solar PV and wind capacity dedicated to supply electricity for the transport sector, either for electrified public transport or individual transport vehicles.36 Battery technologies as well as the production of synfuels for heavy duty vehicles, mining and shipping, will also be required for the transport sector where it is not connected to the grid. Geothermal and Concentrated Solar Power (CSP) plants will also be vital for providing additional dispatchable capacity while storage technologies will be expanded significantly after 2020 particularly in providing electricity for transport (see Section 4.4).
Table 5: Projection of renewable electricity generation capacity
In GW
2015 2020 2030 2040 2050
Hydro
REF 8 8 7 7 7
RE 8 8 8 8 8
ADV 8 8 8 8 8
Biomass
REF 0 1 1 1 1
RE 0 1 2 5 9
ADV 0 1 3 8 20
Wind
REF 4 11 15 15 15
RE 4 18 37 52 72
ADV 4 18 45 63 80
Geothermal
REF 0 0 1 0 0
RE 0 0 1 3 7
ADV 0 0 7 9 10
PV
REF 3 3 4 4 4
RE 3 14 59 102 153
ADV 3 26 72 111 166
CSP
REF 0 0 0 0 0
RE 0 0 6 7 12
ADV 0 0 10 13 16
Ocean
REF 0 0 0 0 0
RE 0 0 0 0 0
ADV 0 0 3 6 13
Total
REF 15 23 28 27 27
RE 15 41 113 176 260
ADV 15 54 146 217 311
36 Note this is already starting to happen with the NSW Government putting out a request for tender for renewable electricity to supply a new train line in Sydney. http://reneweconomy.com.au/2016/nsw-seeks-renewable-energy-to-power-north-west-rail-line-63247
100% RENEWABLE ENERGY FOR AUSTRALIA 22
MARCH 2016
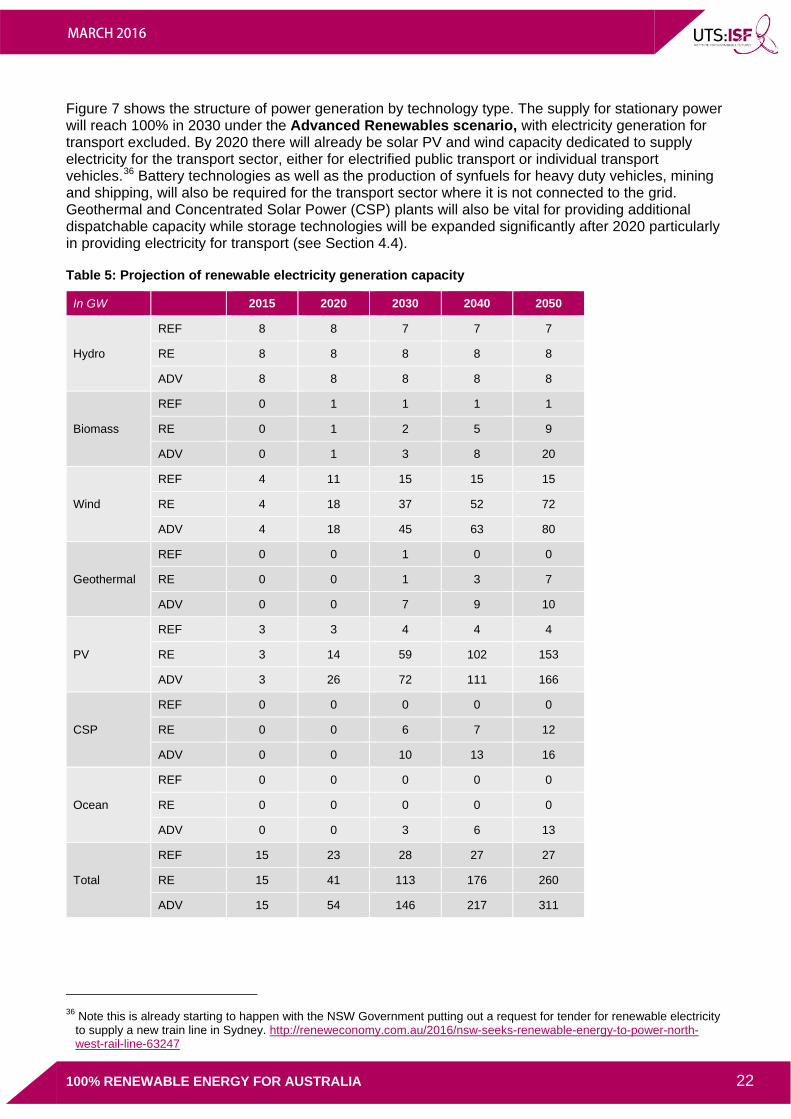
Table 5 shows the comparative evolution of the different renewable technologies in Australia over time. By 2020 wind and solar PV overtake hydropower, which is currently the main renewable power source. After 2020, wind and solar PV will continue to grow, complemented by electricity from solar thermal, geothermal and ocean energy. Both renewable scenarios will lead to a high share of variable power generation sources (PV and onshore-wind) of 54% and 60% by 2030 and 79% and 83% by 2050, which underscores the importance of robust generation forecasts. Smart grids, demand side management (DSM), energy storage capacities and other options need to be expanded in order to increase the flexibility of the power system for grid integration, load balancing and a secure supply of electricity.
Figure 8 shows the average annual capacity changes in the Advanced Renewable scenario by electricity generating technology.
Figure 8: Average annual capacity change by technology in the Advanced Renewables case
The average annual installations for solar PV between 2015 and 2030 are at around 4,500 MW, only four times more than the PV market size of 2011, 2012 and 2015. The wind turbine installations will need to remain at 2,600 MW a year for the coming 15 years. This is equal to the development in the German wind power market between 1999 and 2014, a country smaller in area than New South Wales. There are neither space nor wind resource constraints to building the wind and solar capacities projected in the Advanced Renewables case until 2050 or exceeding this market size.
The renewable energy capacity will be built up in moderate annual steps, based on the experiences of other OECD countries of the past 15 years. Existing coal power plants will be retired step-by-step at a rate of approximately 750 MW per year, equal to one or two average coal power plant blocks.
100% RENEWABLE ENERGY FOR AUSTRALIA 23
MARCH 2016
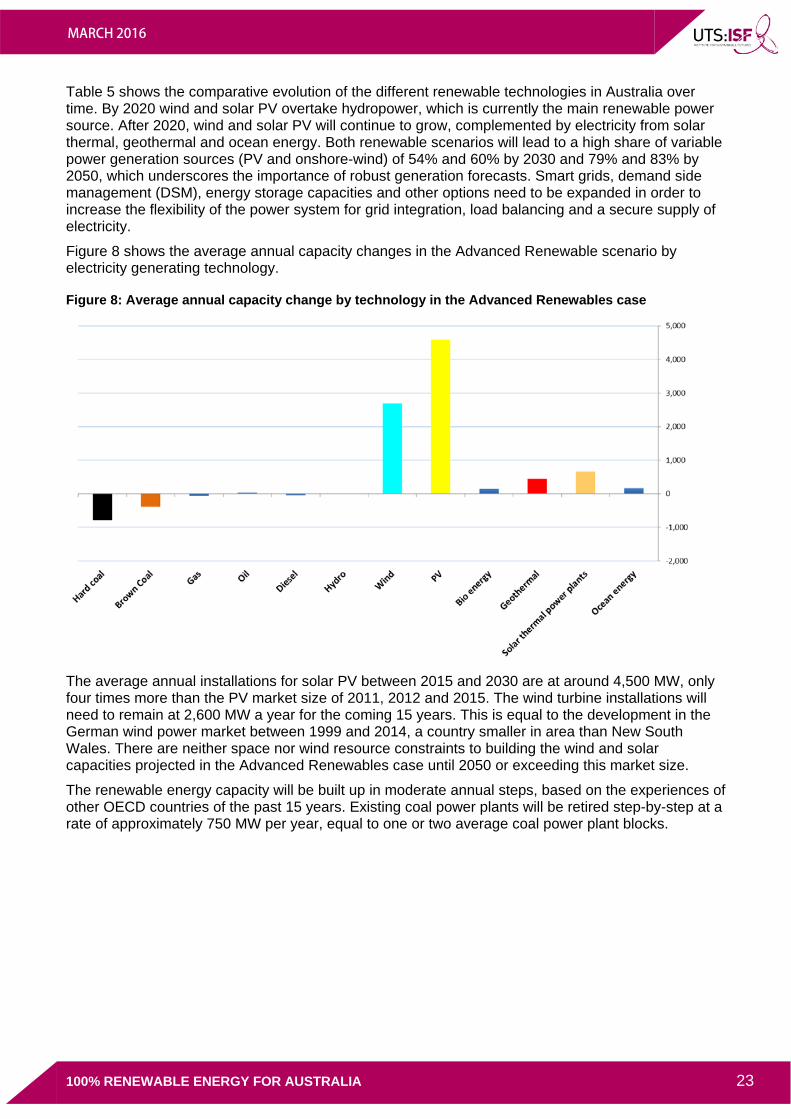
4.3 ENERGY SUPPLY FOR HEATING
4.3.1 Industrial heat supply and breakdown by energy carrier Renewables already supply around 10% of Australia’s energy demand for heating, mainly in the commercial buildings and industrial sectors. This is mainly supplied from the use of biomass. Dedicated support instruments are required to ensure the development needed for renewable heating technologies for buildings and process heat production.
In the basic Renewables scenario, renewables provide 21% of Australia’s total heat demand in 2030 and 49% in 2050. In the Advanced Renewables scenario renewables also supply approximately 25% of heat demand by 2030 and reach 100% by 2050.
Figure 9: Projection of heat supply by energy carrier
Figure 9 shows the projection of heat supply by energy carrier in Australia over time. In spite of improving living standards and economic growth, energy efficiency measures help to reduce the growing energy demand for heating by 36% between now and 2050 in both renewable scenarios (relative to the reference scenario). Biomass remains the main renewable energy source for heating, with increasing investments in highly efficient modern biomass technology. After 2030, a massive growth of solar collectors and a growing share of geothermal (including geothermal heat pumps) as well as heat from renewable hydrogen can further reduce the demand for fossil fuel based heating systems. A shift from coal and oil to natural gas in the remaining conventional applications leads to a further reduction of CO2 emissions. The Advanced Renewable scenario results in a complete substitution of the remaining gas consumption by hydrogen generated from renewable electricity.
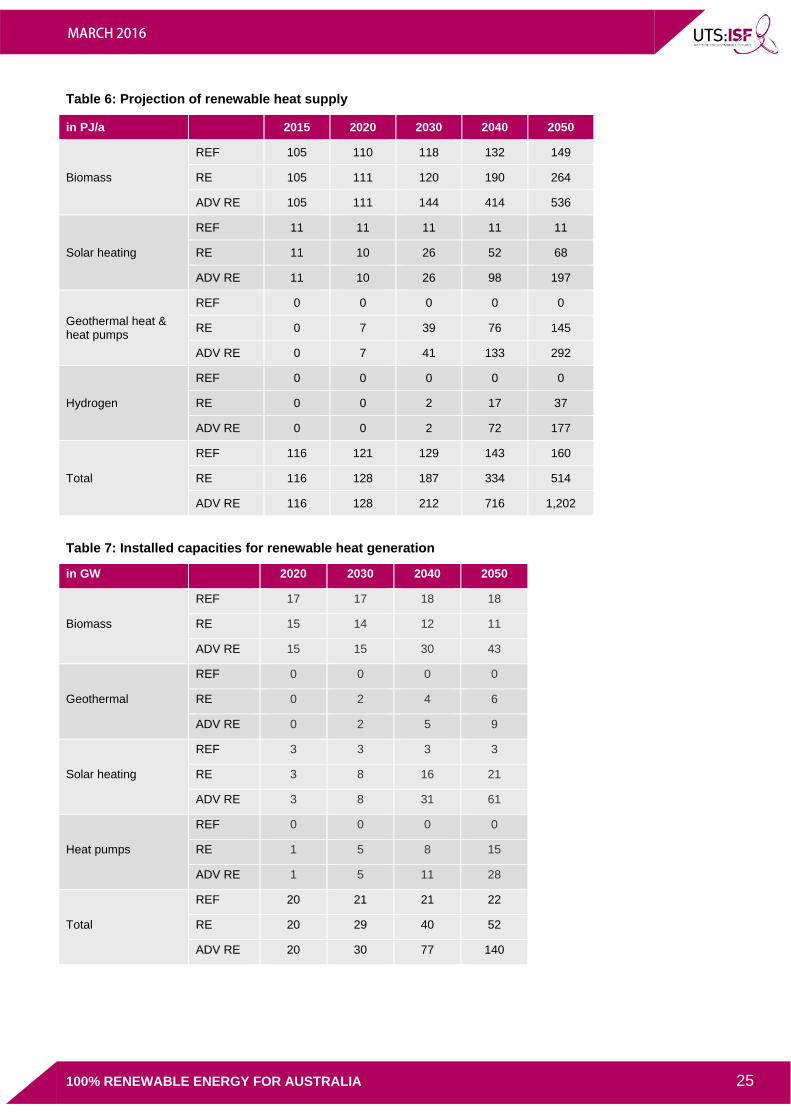
Table 6 shows the development of different renewable technologies for heating in Australia over time in terms of energy and Table 7 shows the installed capacity for each technology.
100% RENEWABLE ENERGY FOR AUSTRALIA 24
MARCH 2016
Table 6: Projection of renewable heat supply
in PJ/a 2015 2020 2030 2040 2050
Biomass
REF 105 110 118 132 149
RE 105 111 120 190 264
ADV RE 105 111 144 414 536
Solar heating
REF 11 11 11 11 11
RE 11 10 26 52 68
ADV RE 11 10 26 98 197
Geothermal heat & heat pumps
REF 0 0 0 0 0
RE 0 7 39 76 145
ADV RE 0 7 41 133 292
Hydrogen
REF 0 0 0 0 0
RE 0 0 2 17 37
ADV RE 0 0 2 72 177
Total
REF 116 121 129 143 160
RE 116 128 187 334 514
ADV RE 116 128 212 716 1,202
Table 7: Installed capacities for renewable heat generation
in GW 2020 2030 2040 2050
Biomass
REF 17 17 18 18
RE 15 14 12 11
ADV RE 15 15 30 43
Geothermal
REF 0 0 0 0
RE 0 2 4 6
ADV RE 0 2 5 9
Solar heating
REF 3 3 3 3
RE 3 8 16 21
ADV RE 3 8 31 61
Heat pumps
REF 0 0 0 0
RE 1 5 8 15
ADV RE 1 5 11 28
Total
REF 20 21 21 22
RE 20 29 40 52
ADV RE 20 30 77 140
100% RENEWABLE ENERGY FOR AUSTRALIA 25

MARCH 2016
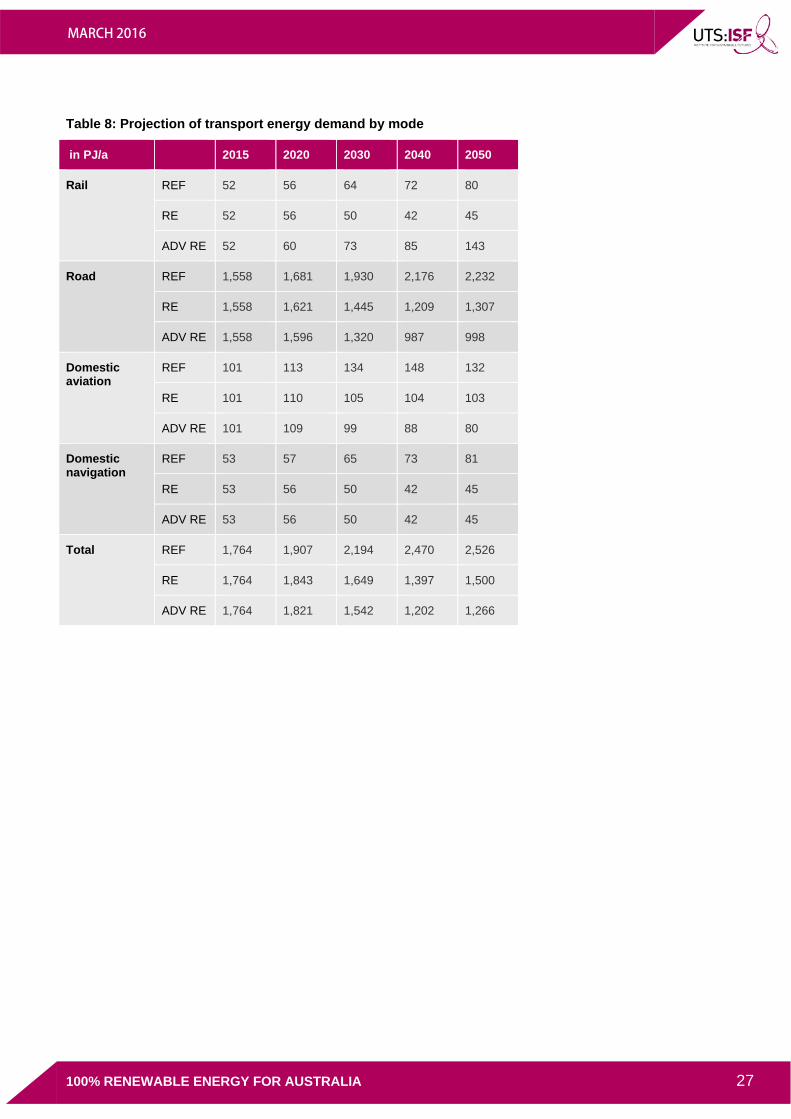
4.4 TRANSPORT To decarbonise the transport sector in Australia a key requirement is the introduction of incentives for people to drive more efficient vehicles. It is also vital to develop infrastructure to shift transport use to more efficient modes like rail, light rail and buses, especially in the expanding large metropolitan areas. These requirements, along with rising prices for fossil fuels, reduce the projected growth in car sales in both renewables scenarios in comparison to the projections in the Reference scenario.
Due to population increase, GDP growth and higher living standards, energy demand from the transport sector is expected to increase in the Reference scenario by around 40% to 2540 PJ/a in 2050. However in the Renewables scenario, efficiency measures and modal shifts will save 41% (1040 PJ/a) in 2050 in comparison to the Reference scenario. Greater modal shifts and technology switching will lead to even higher energy savings in the Advanced Renewable scenario of 50% (1270 PJ/a) in 2050 compared to the Reference scenario.
Figure 10: Final energy consumption transport under the scenarios
Highly efficient propulsion technology with hybrid, plug-in hybrid and battery-electric power cars and trains will bring about large efficiency gains. Table 8 shows the projection of transport energy demand by different modes in the Renewables scenario. Figure 10 shows the projection of transport energy supply by energy carrier in Australia over time. Specifically, it shows that electricity will provide 16% of the transport sector’s total energy demand by 2030, while in 2050 the share will be 57%. In the Advanced Renewables scenario electricity would provide 66% of total energy demand by 2050. The remaining transport energy supply (up to 130 PJ/a or around 5%) will be delivered by biofuels, hydrogen and other synthetic fuels generated using renewable electricity.
100% RENEWABLE ENERGY FOR AUSTRALIA 26
MARCH 2016
Table 8: Projection of transport energy demand by mode
in PJ/a 2015 2020 2030 2040 2050
Rail REF 52 56 64 72 80
RE 52 56 50 42 45
ADV RE 52 60 73 85 143
Road REF 1,558 1,681 1,930 2,176 2,232
RE 1,558 1,621 1,445 1,209 1,307
ADV RE 1,558 1,596 1,320 987 998
Domestic aviation
REF 101 113 134 148 132
RE 101 110 105 104 103
ADV RE 101 109 99 88 80
Domestic navigation
REF 53 57 65 73 81
RE 53 56 50 42 45
ADV RE 53 56 50 42 45
Total REF 1,764 1,907 2,194 2,470 2,526
RE 1,764 1,843 1,649 1,397 1,500
ADV RE 1,764 1,821 1,542 1,202 1,266
100% RENEWABLE ENERGY FOR AUSTRALIA 27
MARCH 2016
4.5 CO2 EMISSIONS TRAJECTORIES Figure 11 sets out Australia’s energy greenhouse gas emissions resulting from modelling the three scenarios. In the Advanced Renewables scenario Australia’s energy sector is completely decarbonised by 2050. By 2030 total energy sector emissions decrease to 206 million tonnes a year, with per capita emissions down to 7.0 tonnes from 19.1 tonnes. By 2035 emissions decrease to 120 million tonnes and annual per capita energy emissions from 19.1 to 4.0 tonnes. Comparatively, in the Reference scenario Australia’s greenhouse gas emissions from energy increase by 40% between 2015 and 2050.
Under the Renewables scenario energy emissions decrease from 450 million tonnes in 2015 to 178 million tonnes in 2035. By 2050 emissions will decrease to 80 million tonnes and annual energy per capita emissions will drop from 19.1 tonnes at present to 2.0 tonnes by 2050. In spite of increasing power demand, energy greenhouse emissions will decrease in the electricity sector. In the long run efficiency gains and the increased use of renewable electricity in vehicles strongly reduce emissions in the transport sector as well. In the basic Renewables scenario, the Industry sector will be the largest source of emissions from energy, accounting for 62% in 2035 and 48% in 2050, with the remainder coming from the transport sector. In the Reference scenario power generation remains the largest source of emissions from energy.
Figure 11: Development of energy-related CO2 emissions by sector (‘Reductions’ = emissions reduction compared to the Reference scenario)
100% RENEWABLE ENERGY FOR AUSTRALIA 28
MARCH 2016
4.6 COST ANALYSIS The previous sections have outlined the technical results of the modelling, and the following section outlines the results of the cost analysis. Specifically, the report sets out the following for the three scenarios:
• Capital investment costs to meet Australia’s power (electricity) and heating needs, • Fuel costs (and savings) to meet Australia’s power, heating and transport needs, • Impact of these capital and fuel costs on the electricity generation prices, and • Combined energy budget for Australia including capital investment, operations and fuel costs.
As set out in the assumptions, it should be noted that there are costs and savings that are outside the scope of this research:
• Grid infrastructure costs, including the costs of smart meters and greater integration with communications technologies,
• Transport capital investment such as the cost of new cars or charging infrastructure, and • Demand management and energy storage costs.
It should also be noted that these costs are Australia wide and are not an analysis of how consumer electricity bills will be impacted, as this involves a highly complex set of factors including the extent to which consumers own some of the generation infrastructure, price, volume and tariff structures, grid charges, as well as local network credits for decentralized generation.
4.5.1 Capital investment Electricity Under the Renewables and Advanced Renewables scenarios Australia would shift almost 98% and 99% respectively of new power sector capital investment towards renewables and cogeneration between now and 2050 (see Figure 12). This will result in higher investment costs than the reference scenario, in significant part due to the fact that electricity becomes the ‘primary’ fuel to meet an increased proportion of Australia’s heating and transport energy needs. We assume, as in almost every other country worldwide, that this will be private sector investment. As such, the power sector investment costs should not be considered in isolation from transport and heating costs – particularly operational/fuel cost savings (see Section 4.5.4 for the combined energy budget for Australia).
Around $600 billion will be required in investment in the power sector over the period to 2050 for the basic Renewables scenario, approximately $13.8 billion per year between 2015 and 2030 and on average $17 billion per year over the entire period until 2050. Investments for the Advanced Renewable scenario are around $800 billion until 2050, on average $22 billion per year between 2015 and 2030 and on average $23 billion per year over the whole time span. This includes investments for replacement after the economic lifetime of the current power plants. The costs increase slightly over time as the level of more expensive dispatchable renewables required grows. However, this also means there is time to bring these technologies down the cost curve to a greater extent than projected, and as such these investment projections should be considered to be conservative (i.e. on the high side of the likely costs).
In the Reference scenario the total investment would be around $150 billion. This includes the assumption that 4000 MW of new coal power plant capacity will be installed, replacing power stations to be closed by 2050 (we note however that this is unlikely to eventuate given current cost projections). Under the Reference scenario, conventional power plants account for approximately 43% of total power sector investment, while the remaining 57% would be invested in renewable energy and cogeneration technology.
100% RENEWABLE ENERGY FOR AUSTRALIA 29
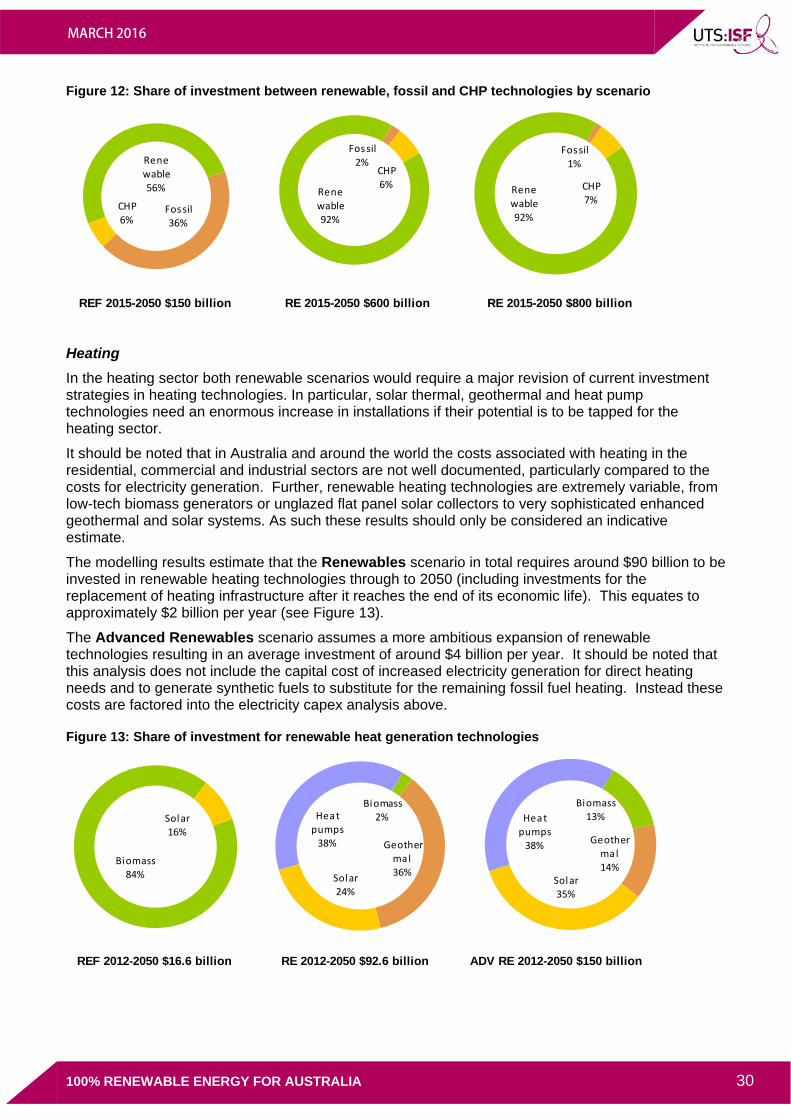
MARCH 2016
Figure 12: Share of investment between renewable, fossil and CHP technologies by scenario
Heating In the heating sector both renewable scenarios would require a major revision of current investment strategies in heating technologies. In particular, solar thermal, geothermal and heat pump technologies need an enormous increase in installations if their potential is to be tapped for the heating sector.
It should be noted that in Australia and around the world the costs associated with heating in the residential, commercial and industrial sectors are not well documented, particularly compared to the costs for electricity generation. Further, renewable heating technologies are extremely variable, from low-tech biomass generators or unglazed flat panel solar collectors to very sophisticated enhanced geothermal and solar systems. As such these results should only be considered an indicative estimate.
The modelling results estimate that the Renewables scenario in total requires around $90 billion to be invested in renewable heating technologies through to 2050 (including investments for the replacement of heating infrastructure after it reaches the end of its economic life). This equates to approximately $2 billion per year (see Figure 13).
The Advanced Renewables scenario assumes a more ambitious expansion of renewable technologies resulting in an average investment of around $4 billion per year. It should be noted that this analysis does not include the capital cost of increased electricity generation for direct heating needs and to generate synthetic fuels to substitute for the remaining fossil fuel heating. Instead these costs are factored into the electricity capex analysis above.
Figure 13: Share of investment for renewable heat generation technologies
REF 2015-2050 $150 billion RE 2015-2050 $600 billion RE 2015-2050 $800 billion
Fossil36%
CHP6%
Renewable56%
Fossil2%
CHP6%
Renewable92%
Fossil1%
CHP7%
Renewable92%
Other sectors
REF 2012-2050 $16.6 billion RE 2012-2050 $92.6 billion ADV RE 2012-2050 $150 billion
Biomass84%
Solar16%
Biomass13%
Geothermal14%
Solar35%
Heat pumps
38%
Biomass2%
Geothermal36%Solar
24%
Heat pumps
38%
100% RENEWABLE ENERGY FOR AUSTRALIA 30
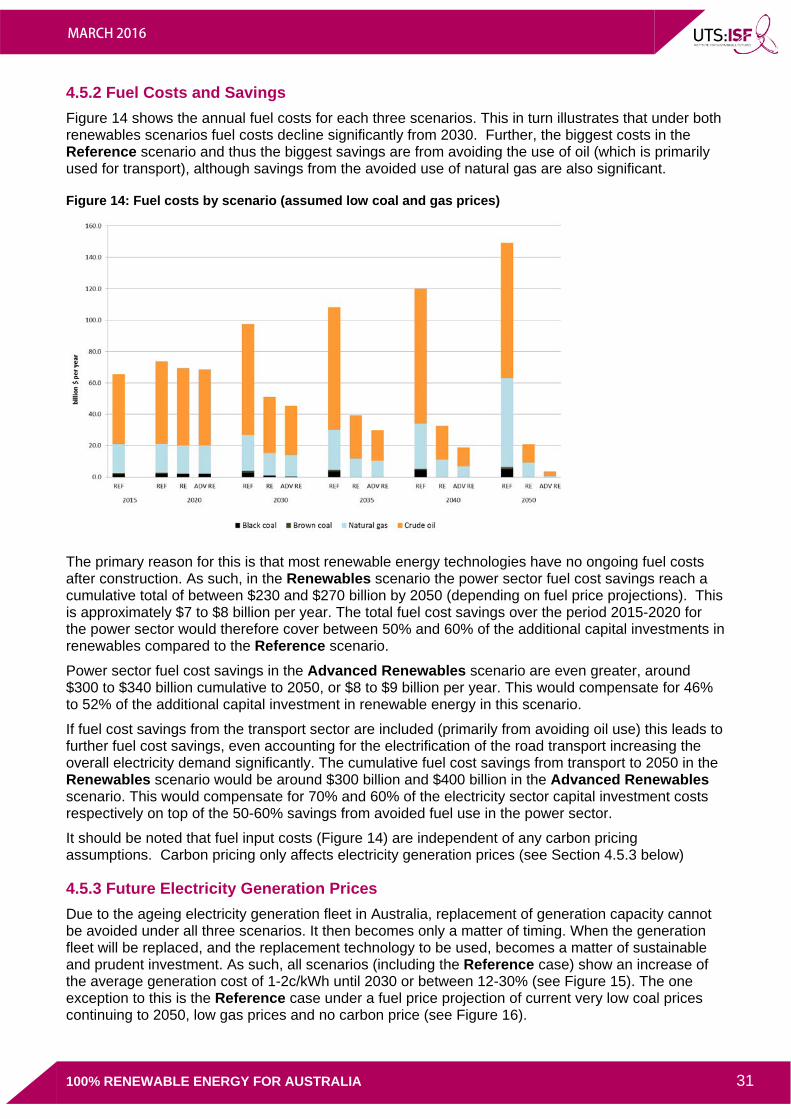
MARCH 2016
4.5.2 Fuel Costs and Savings Figure 14 shows the annual fuel costs for each three scenarios. This in turn illustrates that under both renewables scenarios fuel costs decline significantly from 2030. Further, the biggest costs in the Reference scenario and thus the biggest savings are from avoiding the use of oil (which is primarily used for transport), although savings from the avoided use of natural gas are also significant.
Figure 14: Fuel costs by scenario (assumed low coal and gas prices)
The primary reason for this is that most renewable energy technologies have no ongoing fuel costs after construction. As such, in the Renewables scenario the power sector fuel cost savings reach a cumulative total of between $230 and $270 billion by 2050 (depending on fuel price projections). This is approximately $7 to $8 billion per year. The total fuel cost savings over the period 2015-2020 for the power sector would therefore cover between 50% and 60% of the additional capital investments in renewables compared to the Reference scenario.
Power sector fuel cost savings in the Advanced Renewables scenario are even greater, around $300 to $340 billion cumulative to 2050, or $8 to $9 billion per year. This would compensate for 46% to 52% of the additional capital investment in renewable energy in this scenario.
If fuel cost savings from the transport sector are included (primarily from avoiding oil use) this leads to further fuel cost savings, even accounting for the electrification of the road transport increasing the overall electricity demand significantly. The cumulative fuel cost savings from transport to 2050 in the Renewables scenario would be around $300 billion and $400 billion in the Advanced Renewables scenario. This would compensate for 70% and 60% of the electricity sector capital investment costs respectively on top of the 50-60% savings from avoided fuel use in the power sector.
It should be noted that fuel input costs (Figure 14) are independent of any carbon pricing assumptions. Carbon pricing only affects electricity generation prices (see Section 4.5.3 below)
4.5.3 Future Electricity Generation Prices Due to the ageing electricity generation fleet in Australia, replacement of generation capacity cannot be avoided under all three scenarios. It then becomes only a matter of timing. When the generation fleet will be replaced, and the replacement technology to be used, becomes a matter of sustainable and prudent investment. As such, all scenarios (including the Reference case) show an increase of the average generation cost of 1-2c/kWh until 2030 or between 12-30% (see Figure 15). The one exception to this is the Reference case under a fuel price projection of current very low coal prices continuing to 2050, low gas prices and no carbon price (see Figure 16).
100% RENEWABLE ENERGY FOR AUSTRALIA 31

MARCH 2016
Figure 15: Average electricity generation costs for each scenario (low coal and low gas price)
Figure 15 and Figure 16 show that under both renewable energy scenarios and all coal and gas price projections generation costs will be lower than the reference scenario in the long-term. By 2050, the generation costs of the Advanced Renewable scenario will be between 1.1c/kWh and 3.7c/kWh below those in the Reference case under a high fuel cost future and low fuel cost future respectively. This is because renewable power generation with the exception of biomass do not include fuel costs, while conventional power plants have ongoing fuel costs. This also means that for renewables generation costs are stable and predictable over the entire technical lifetime, unlike conventional power generation that is subject to fuel cost fluctuations.
Figure 16: Average electricity generation costs for each scenario under two fuel cost assumptions
While both renewables scenarios ultimately end up cheaper under all fuel price assumptions, they become cheaper at different dates depending on the scenario and the fuel price projections as shown in Figures 15 and 16. For example at one extreme, which assumes the current low coal prices will remain low over the next 35 years to 2050, low gas prices and no carbon price, renewable scenarios become cheaper in 2040. At the other extreme under an average coal, high gas and a small future carbon price, renewable energy scenarios become cheaper as soon as 2025.
In 2030, the difference in full cost of generation compared to the Reference case under the low fuel price projection will between 0.8-1.9c/kWh in the Renewable scenario and 0.6 – 1.6c/kWh in the Advanced Renewables scenario.
100% RENEWABLE ENERGY FOR AUSTRALIA 32
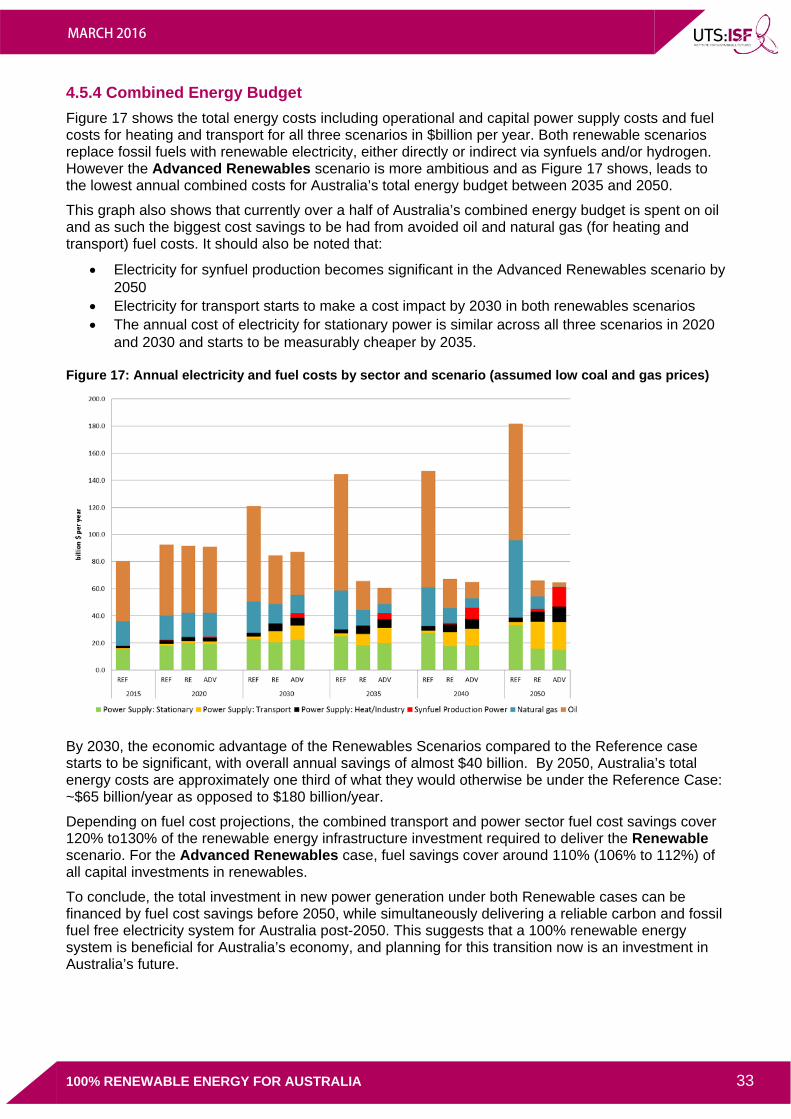
MARCH 2016
4.5.4 Combined Energy Budget Figure 17 shows the total energy costs including operational and capital power supply costs and fuel costs for heating and transport for all three scenarios in $billion per year. Both renewable scenarios replace fossil fuels with renewable electricity, either directly or indirect via synfuels and/or hydrogen. However the Advanced Renewables scenario is more ambitious and as Figure 17 shows, leads to the lowest annual combined costs for Australia’s total energy budget between 2035 and 2050.
This graph also shows that currently over a half of Australia’s combined energy budget is spent on oil and as such the biggest cost savings to be had from avoided oil and natural gas (for heating and transport) fuel costs. It should also be noted that:
• Electricity for synfuel production becomes significant in the Advanced Renewables scenario by 2050
• Electricity for transport starts to make a cost impact by 2030 in both renewables scenarios • The annual cost of electricity for stationary power is similar across all three scenarios in 2020
and 2030 and starts to be measurably cheaper by 2035.
Figure 17: Annual electricity and fuel costs by sector and scenario (assumed low coal and gas prices)
By 2030, the economic advantage of the Renewables Scenarios compared to the Reference case starts to be significant, with overall annual savings of almost $40 billion. By 2050, Australia’s total energy costs are approximately one third of what they would otherwise be under the Reference Case: ~$65 billion/year as opposed to $180 billion/year.
Depending on fuel cost projections, the combined transport and power sector fuel cost savings cover 120% to130% of the renewable energy infrastructure investment required to deliver the Renewable scenario. For the Advanced Renewables case, fuel savings cover around 110% (106% to 112%) of all capital investments in renewables.
To conclude, the total investment in new power generation under both Renewable cases can be financed by fuel cost savings before 2050, while simultaneously delivering a reliable carbon and fossil fuel free electricity system for Australia post-2050. This suggests that a 100% renewable energy system is beneficial for Australia’s economy, and planning for this transition now is an investment in Australia’s future.
100% RENEWABLE ENERGY FOR AUSTRALIA 33

MARCH 2016
5 CONCLUSIONS & IMPLICATIONS The transition towards 100% renewable energy supply is technically and economically viable for Australia. The abundant local renewable energy potentials of solar, wind, geothermal and sustainable bioenergy production exceed the current and future energy demand by an order of magnitude.
Renewable energy technologies are mature, available, and significant recent price reductions – especially for solar PV and wind power – offer an economic alternative to the current coal based electricity sector for future power generation in Australia.
Under every fossil fuel price projection, the renewables scenarios are the least cost alternative for future generations. Depending on fuel cost developments and whether or not a carbon price is implemented, the timing of when overall generation cost in the renewable scenarios fall below the Reference scenario ranges from 8 to 20 years from now.
When power generation moves closer to the consumer, an increase of actual power generation costs do not necessarily lead to higher power bills, as the cost structure changes for end-use customers. While current rooftop solar generation costs are more than twice as high as the current wholesale electricity price, it is already significantly cheaper than the average end-consumer price for power.
Required technologies for a 100% renewable energy supply for Australia are available and mature. However, the integration of large shares of variable power generation requires a “systems-thinking” approach, to adapt to new infrastructure needs and operational strategy, and change business models for energy retailers as well as power and gas grid operators.
Baseload power generation is not a technical concept, but a business concept supported by the traditional power sector over the past decades in order to maximise the quantum and value of electricity supplied by an individual conventional power plant.37 With high shares of variable renewable power generation operating in a wholesale market with no fuel cost, this approach to maintaining ‘baseload’ generation is no longer feasible. The focus for the energy sector will have to shift towards the management of wind and solar photovoltaic which will represent the ‘base-generation’, and reactive dispatch power plants such as hydro, concentrated solar power with storage, geothermal, bio energy plants and a cascade of storage technologies combined with demand side management. The future value chain for the power sector will replace fuel production with power system management – a field that requires more research and is not within the scope of this analysis.
A transition towards a 100% renewable energy supply for Australia can spark a series of innovations that represent huge potential for societal value, while the transition away from fossil fuels must be organised with sound social policies so no worker will be left behind. This will lead to a greater acceptance of renewable energy, which is required as power generation moves closer to the consumer and will be increasingly visible in daily life.
Long-term stable energy policies are required as the transition will take one generation. International experiences such as in Denmark, Germany, China, as well as parts of the USA and Latin America, show that an energy transition is possible and is well under way in many countries.
This 100% renewable energy system analysis has been developed by applying global technology development trends into Australia’s energy sector. While there is still significant research needed towards a full renewable energy supply by 2050, there are no technical barriers to starting the transition process immediately.
37 Hansen, L. and Lovins, A. (2010) ‘Keeping the Lights on While Transforming Electric Utilities’, Rocky Mountain Institute
100% RENEWABLE ENERGY FOR AUSTRALIA 34
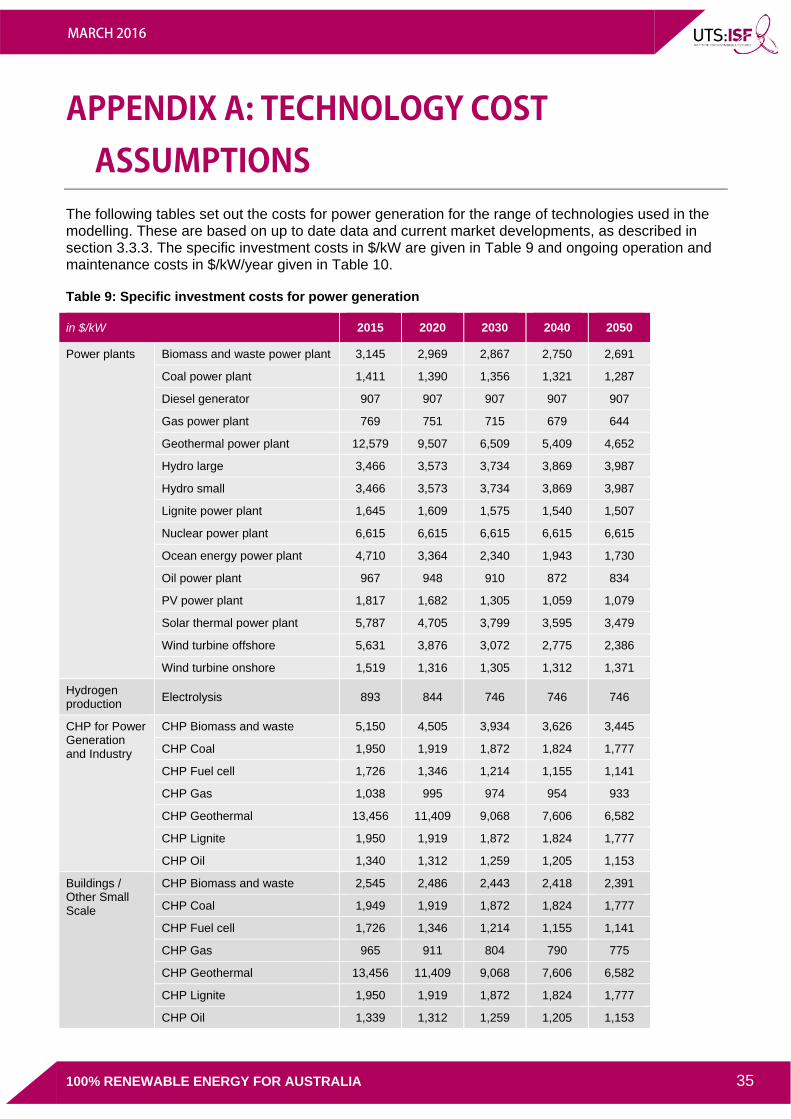
MARCH 2016
APPENDIX A: TECHNOLOGY COST
ASSUMPTIONS The following tables set out the costs for power generation for the range of technologies used in the modelling. These are based on up to date data and current market developments, as described in section 3.3.3. The specific investment costs in $/kW are given in Table 9 and ongoing operation and maintenance costs in $/kW/year given in Table 10.
Table 9: Specific investment costs for power generation
in $/kW 2015 2020 2030 2040 2050
Power plants Biomass and waste power plant 3,145 2,969 2,867 2,750 2,691
Coal power plant 1,411 1,390 1,356 1,321 1,287
Diesel generator 907 907 907 907 907
Gas power plant 769 751 715 679 644
Geothermal power plant 12,579 9,507 6,509 5,409 4,652
Hydro large 3,466 3,573 3,734 3,869 3,987
Hydro small 3,466 3,573 3,734 3,869 3,987
Lignite power plant 1,645 1,609 1,575 1,540 1,507
Nuclear power plant 6,615 6,615 6,615 6,615 6,615
Ocean energy power plant 4,710 3,364 2,340 1,943 1,730
Oil power plant 967 948 910 872 834
PV power plant 1,817 1,682 1,305 1,059 1,079
Solar thermal power plant 5,787 4,705 3,799 3,595 3,479
Wind turbine offshore 5,631 3,876 3,072 2,775 2,386
Wind turbine onshore 1,519 1,316 1,305 1,312 1,371
Hydrogen production Electrolysis 893 844 746 746 746
CHP for Power Generation and Industry
CHP Biomass and waste 5,150 4,505 3,934 3,626 3,445
CHP Coal 1,950 1,919 1,872 1,824 1,777
CHP Fuel cell 1,726 1,346 1,214 1,155 1,141
CHP Gas 1,038 995 974 954 933
CHP Geothermal 13,456 11,409 9,068 7,606 6,582
CHP Lignite 1,950 1,919 1,872 1,824 1,777
CHP Oil 1,340 1,312 1,259 1,205 1,153
Buildings / Other Small Scale
CHP Biomass and waste 2,545 2,486 2,443 2,418 2,391
CHP Coal 1,949 1,919 1,872 1,824 1,777
CHP Fuel cell 1,726 1,346 1,214 1,155 1,141
CHP Gas 965 911 804 790 775
CHP Geothermal 13,456 11,409 9,068 7,606 6,582
CHP Lignite 1,950 1,919 1,872 1,824 1,777
CHP Oil 1,339 1,312 1,259 1,205 1,153
100% RENEWABLE ENERGY FOR AUSTRALIA 35
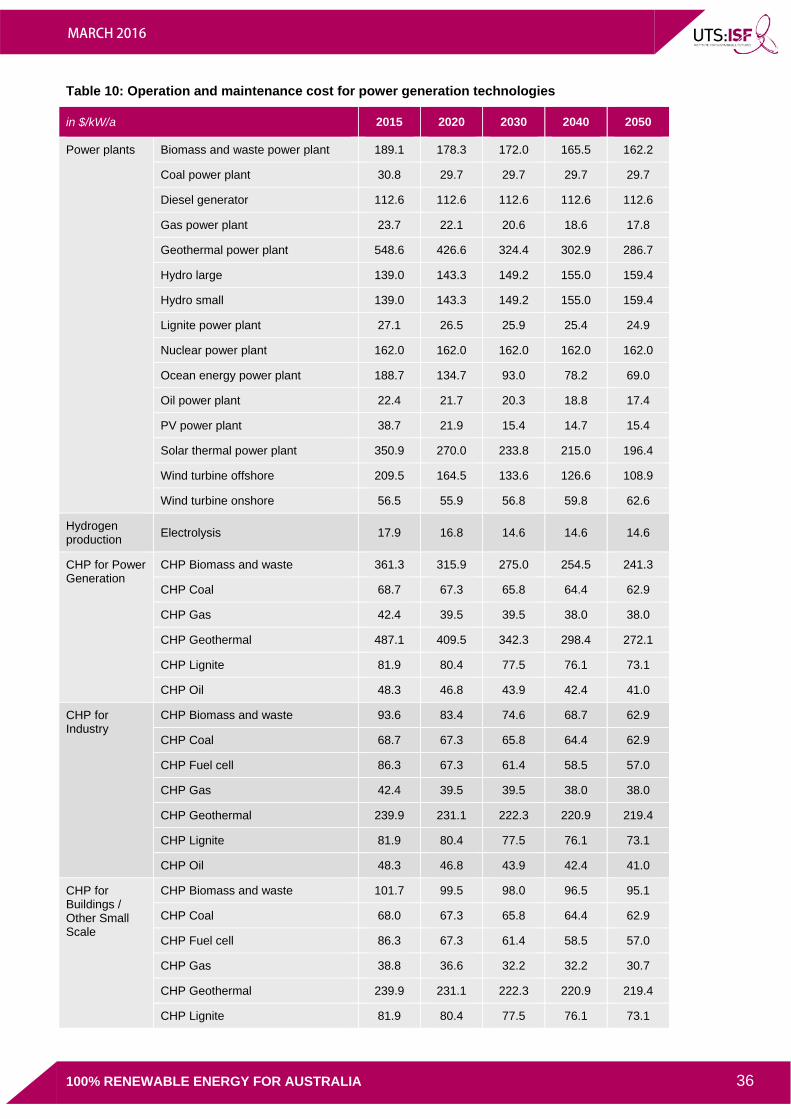
MARCH 2016
Table 10: Operation and maintenance cost for power generation technologies
in $/kW/a 2015 2020 2030 2040 2050
Power plants Biomass and waste power plant 189.1 178.3 172.0 165.5 162.2
Coal power plant 30.8 29.7 29.7 29.7 29.7
Diesel generator 112.6 112.6 112.6 112.6 112.6
Gas power plant 23.7 22.1 20.6 18.6 17.8
Geothermal power plant 548.6 426.6 324.4 302.9 286.7
Hydro large 139.0 143.3 149.2 155.0 159.4
Hydro small 139.0 143.3 149.2 155.0 159.4
Lignite power plant 27.1 26.5 25.9 25.4 24.9
Nuclear power plant 162.0 162.0 162.0 162.0 162.0
Ocean energy power plant 188.7 134.7 93.0 78.2 69.0
Oil power plant 22.4 21.7 20.3 18.8 17.4
PV power plant 38.7 21.9 15.4 14.7 15.4
Solar thermal power plant 350.9 270.0 233.8 215.0 196.4
Wind turbine offshore 209.5 164.5 133.6 126.6 108.9
Wind turbine onshore 56.5 55.9 56.8 59.8 62.6
Hydrogen production Electrolysis 17.9 16.8 14.6 14.6 14.6
CHP for Power Generation
CHP Biomass and waste 361.3 315.9 275.0 254.5 241.3
CHP Coal 68.7 67.3 65.8 64.4 62.9
CHP Gas 42.4 39.5 39.5 38.0 38.0
CHP Geothermal 487.1 409.5 342.3 298.4 272.1
CHP Lignite 81.9 80.4 77.5 76.1 73.1
CHP Oil 48.3 46.8 43.9 42.4 41.0
CHP for Industry
CHP Biomass and waste 93.6 83.4 74.6 68.7 62.9
CHP Coal 68.7 67.3 65.8 64.4 62.9
CHP Fuel cell 86.3 67.3 61.4 58.5 57.0
CHP Gas 42.4 39.5 39.5 38.0 38.0
CHP Geothermal 239.9 231.1 222.3 220.9 219.4
CHP Lignite 81.9 80.4 77.5 76.1 73.1
CHP Oil 48.3 46.8 43.9 42.4 41.0
CHP for Buildings / Other Small Scale
CHP Biomass and waste 101.7 99.5 98.0 96.5 95.1
CHP Coal 68.0 67.3 65.8 64.4 62.9
CHP Fuel cell 86.3 67.3 61.4 58.5 57.0
CHP Gas 38.8 36.6 32.2 32.2 30.7
CHP Geothermal 239.9 231.1 222.3 220.9 219.4
CHP Lignite 81.9 80.4 77.5 76.1 73.1
100% RENEWABLE ENERGY FOR AUSTRALIA 36
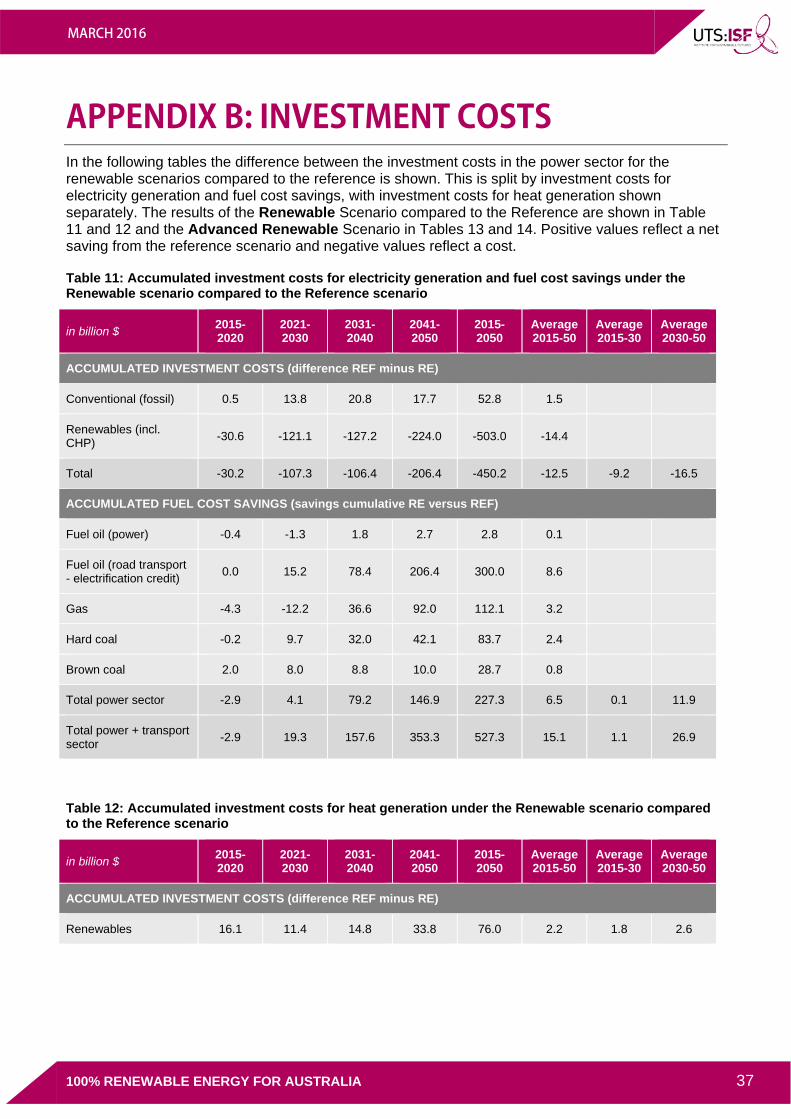
MARCH 2016
APPENDIX B: INVESTMENT COSTS In the following tables the difference between the investment costs in the power sector for the renewable scenarios compared to the reference is shown. This is split by investment costs for electricity generation and fuel cost savings, with investment costs for heat generation shown separately. The results of the Renewable Scenario compared to the Reference are shown in Table 11 and 12 and the Advanced Renewable Scenario in Tables 13 and 14. Positive values reflect a net saving from the reference scenario and negative values reflect a cost.
Table 11: Accumulated investment costs for electricity generation and fuel cost savings under the Renewable scenario compared to the Reference scenario
in billion $ 2015-2020
2021-2030
2031-2040
2041-2050
2015-2050
Average 2015-50
Average 2015-30
Average 2030-50
ACCUMULATED INVESTMENT COSTS (difference REF minus RE)
Conventional (fossil) 0.5 13.8 20.8 17.7 52.8 1.5
Renewables (incl. CHP) -30.6 -121.1 -127.2 -224.0 -503.0 -14.4
Total -30.2 -107.3 -106.4 -206.4 -450.2 -12.5 -9.2 -16.5
ACCUMULATED FUEL COST SAVINGS (savings cumulative RE versus REF)
Fuel oil (power) -0.4 -1.3 1.8 2.7 2.8 0.1
Fuel oil (road transport - electrification credit) 0.0 15.2 78.4 206.4 300.0 8.6
Gas -4.3 -12.2 36.6 92.0 112.1 3.2
Hard coal -0.2 9.7 32.0 42.1 83.7 2.4
Brown coal 2.0 8.0 8.8 10.0 28.7 0.8
Total power sector -2.9 4.1 79.2 146.9 227.3 6.5 0.1 11.9
Total power + transport sector -2.9 19.3 157.6 353.3 527.3 15.1 1.1 26.9
Table 12: Accumulated investment costs for heat generation under the Renewable scenario compared to the Reference scenario
in billion $ 2015-2020
2021-2030
2031-2040
2041-2050
2015-2050
Average 2015-50
Average 2015-30
Average 2030-50
ACCUMULATED INVESTMENT COSTS (difference REF minus RE)
Renewables 16.1 11.4 14.8 33.8 76.0 2.2 1.8 2.6
100% RENEWABLE ENERGY FOR AUSTRALIA 37
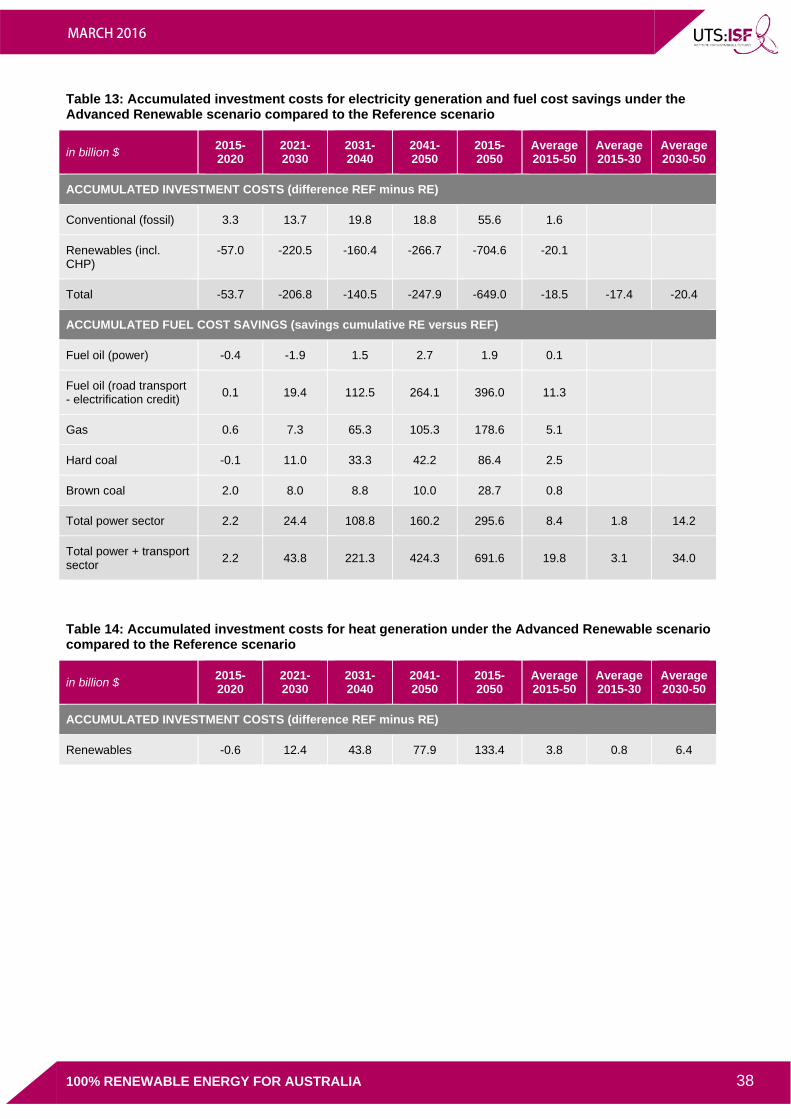
MARCH 2016
Table 13: Accumulated investment costs for electricity generation and fuel cost savings under the Advanced Renewable scenario compared to the Reference scenario
in billion $ 2015-2020
2021-2030
2031-2040
2041-2050
2015-2050
Average 2015-50
Average 2015-30
Average 2030-50
ACCUMULATED INVESTMENT COSTS (difference REF minus RE)
Conventional (fossil) 3.3 13.7 19.8 18.8 55.6 1.6
Renewables (incl. CHP)
-57.0 -220.5 -160.4 -266.7 -704.6 -20.1
Total -53.7 -206.8 -140.5 -247.9 -649.0 -18.5 -17.4 -20.4
ACCUMULATED FUEL COST SAVINGS (savings cumulative RE versus REF)
Fuel oil (power) -0.4 -1.9 1.5 2.7 1.9 0.1
Fuel oil (road transport - electrification credit) 0.1 19.4 112.5 264.1 396.0 11.3
Gas 0.6 7.3 65.3 105.3 178.6 5.1
Hard coal -0.1 11.0 33.3 42.2 86.4 2.5
Brown coal 2.0 8.0 8.8 10.0 28.7 0.8
Total power sector 2.2 24.4 108.8 160.2 295.6 8.4 1.8 14.2
Total power + transport sector 2.2 43.8 221.3 424.3 691.6 19.8 3.1 34.0
Table 14: Accumulated investment costs for heat generation under the Advanced Renewable scenario compared to the Reference scenario
in billion $ 2015-2020
2021-2030
2031-2040
2041-2050
2015-2050
Average 2015-50
Average 2015-30
Average 2030-50
ACCUMULATED INVESTMENT COSTS (difference REF minus RE)
Renewables -0.6 12.4 43.8 77.9 133.4 3.8 0.8 6.4
100% RENEWABLE ENERGY FOR AUSTRALIA 38
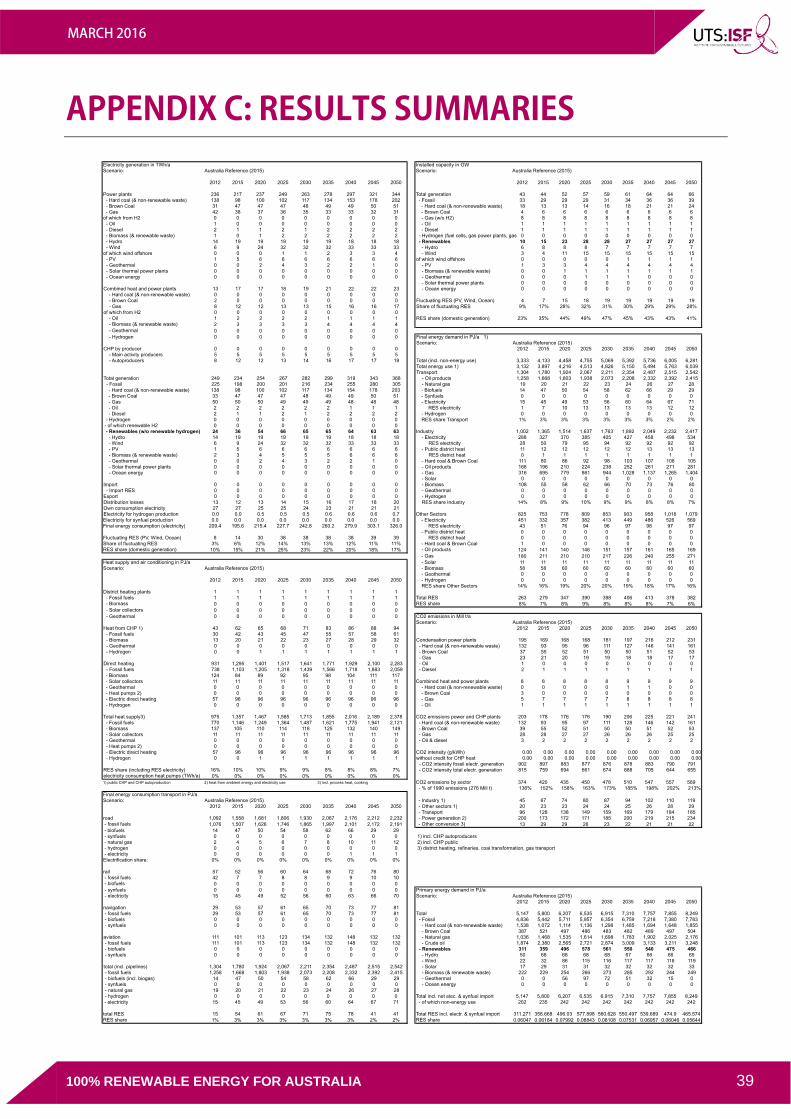
MARCH 2016
APPENDIX C: RESULTS SUMMARIES
100% RENEWABLE ENERGY FOR AUSTRALIA 39
Electricity generation in TWh/a Installed capacity in GWScenario: Australia Reference (2015) Scenario: Australia Reference (2015)
2012 2015 2020 2025 2030 2035 2040 2045 2050 2012 2015 2020 2025 2030 2035 2040 2045 2050
Power plants 236 217 237 249 263 278 297 321 344 Total generation 43 44 52 57 59 61 64 64 66138 98 100 102 117 134 153 178 202 - Fossil 33 29 29 29 31 34 36 36 3931 47 47 47 48 49 49 50 51 - Hard coal (& non-renewable waste) 18 13 13 14 16 18 21 21 24
- Hard coal (& non-renewable waste) - Brown Coal - Gas 42 38 37 36 35 33 33 32 31 - Brown Coal 4 6 6 6 6 6 6 6 6of which from H2 0 0 0 0 0 0 0 0 0 - Gas (w/o H2) 8 8 8 8 8 8 8 8 8
1 0 0 0 0 0 0 0 0 - Oil 1 1 1 1 1 1 1 1 12 1 1 2 1 2 2 2 2 - Diesel 1 1 1 1 1 1 1 1 11 0 1 2 2 2 2 2 2 - Hydrogen (fuel cells, gas power plants, gas 0 0 0 0 0 0 0 0 014 19 19 19 19 19 18 18 18 - Renewables 10 15 23 28 28 27 27 27 27
- Oil - Diesel - Biomass (& renewable waste) - Hydro - Wind 6 9 24 32 32 32 33 33 33 - Hydro 6 8 8 8 7 7 7 7 7of which wind offshore 0 0 0 1 1 2 3 3 4 3 4 11 15 15 15 15 15 15
1 5 6 6 6 6 6 6 6 - Windof which wind offshore 0 0 0 0 0 1 1 1 1
0 0 2 4 3 2 2 1 0 1 3 3 4 4 4 4 4 40 0 0 0 0 0 0 0 0 0 0 1 1 1 1 1 1 1
- PV - Geothermal - Solar thermal power plants - Ocean energy 0 0 0 0 0 0 0 0 0 0 0 0 1 1 1 0 0 0
0 0 0 0 0 0 0 0 0Combined heat and power plants 13 17 17 18 19 21 22 22 23
- PV - Biomass (& renewable waste) - Geothermal - Solar thermal power plants - Ocean energy 0 0 0 0 0 0 0 0 0
0 0 0 0 0 0 0 0 02 0 0 0 0 0 0 0 0 Fluctuating RES (PV, Wind, Ocean) 4 7 15 18 19 19 19 19 19
- Hard coal (& non-renewable waste) - Brown Coal - Gas 8 12 12 13 13 15 16 16 17 Share of fluctuating RES 9% 17% 28% 32% 31% 30% 29% 29% 28%
of which from H2 0 0 0 0 0 0 0 0 01 2 2 2 2 1 1 1 1 RES share (domestic generation) 23% 35% 44% 49% 47% 45% 43% 43% 41%2 3 3 3 3 4 4 4 40 0 0 0 0 0 0 0 0
- Oil - Biomass (& renewable waste) - Geothermal - Hydrogen 0 0 0 0 0 0 0 0 0 Final energy demand in PJ/a 1)
Scenario: Australia Reference (2015)CHP by producer 0 0 0 0 0 0 0 0 0 2012 2015 2020 2025 2030 2035 2040 2045 2050
- Main activity producers 5 5 5 5 5 5 5 5 5 - Autoproducers 8 12 12 13 14 16 17 17 18 Total (incl. non-energy use) 3,333 4,133 4,458 4,755 5,069 5,392 5,736 6,005 6,281
Total energy use 1) 3,132 3,897 4,216 4,513 4,826 5,150 5,494 5,763 6,039Transport 1,304 1,780 1,924 2,067 2,211 2,354 2,487 2,515 2,542
Total generation 249 234 254 267 282 299 319 343 368 - Oil products 1,258 1,668 1,803 1,938 2,073 2,208 2,332 2,392 2,415 - Fossil 225 198 200 201 216 234 255 280 305 - Natural gas 19 20 21 22 23 24 26 27 28
138 98 100 102 117 134 154 178 203 - Biofuels 14 47 50 54 58 62 66 29 2933 47 47 47 48 49 49 50 51 - Synfuels 0 0 0 0 0 0 0 0 050 50 50 49 49 49 48 48 48 - Electricity 15 45 49 53 56 60 64 67 712 2 2 2 2 2 1 1 1 RES electricity 1 7 10 13 13 13 13 12 12
- Hard coal (& non-renewable waste) - Brown Coal - Gas - Oil - Diesel 2 1 1 2 1 2 2 2 2 - Hydrogen 0 0 0 0 0 0 0 0 0
0 0 0 0 0 0 0 0 0 RES share Transport 1% 3% 3% 3% 3% 3% 3% 2% 2%0 0 0 0 0 0 0 0 0
- Hydrogen - of which renewable H2 - Renewables (w/o renewable hydrogen) 24 36 54 66 65 65 64 63 63 Industry 1,002 1,365 1,514 1,637 1,763 1,892 2,049 2,232 2,417
14 19 19 19 19 19 18 18 18 - Electricity 288 327 370 385 405 427 458 498 5346 9 24 32 32 32 33 33 33 RES electricity 28 50 79 95 94 92 92 92 921 5 6 6 6 6 6 6 6 - Public district heat 11 12 12 12 12 12 13 13 132 3 4 5 5 5 6 6 6 RES district heat 0 1 1 1 1 1 1 1 10 0 2 4 3 2 2 1 0 - Hard coal & Brown Coal 111 80 86 92 98 103 107 108 1050 0 0 0 0 0 0 0 0 - Oil products 168 196 210 224 238 252 261 271 281
- Hydro - Wind - PV - Biomass (& renewable waste) - Geothermal - Solar thermal power plants - Ocean energy 0 0 0 0 0 0 0 0 0 - Gas 316 695 779 861 944 1,028 1,137 1,265 1,404
- Solar 0 0 0 0 0 0 0 0 0Import 0 0 0 0 0 0 0 0 0 - Biomass 108 55 58 62 66 70 73 76 80
0 0 0 0 0 0 0 0 0 - Geothermal 0 0 0 0 0 0 0 0 00 0 0 0 0 0 0 0 0 - Hydrogen 0 0 0 0 0 0 0 0 013 12 13 14 15 16 17 18 20 RES share Industry 14% 8% 9% 10% 9% 9% 8% 8% 7%27 27 25 25 24 23 21 21 210.0 0.0 0.5 0.5 0.5 0.6 0.6 0.6 0.7 Other Sectors 825 753 778 809 853 903 958 1,016 1,0790.0 0.0 0.0 0.0 0.0 0.0 0.0 0.0 0.0 - Electricity 451 332 357 382 413 449 486 526 569
- Import RESExportDistribution lossesOwn consumption electricityElectricity for hydrogen productionElectricity for synfuel productionFinal energy consumption (electricity) 209.4 195.6 215.4 227.7 242.8 260.2 279.9 303.1 326.0 RES electricity 43 51 76 94 96 97 98 97 97
- Public district heat 0 0 0 0 0 0 0 0 0Fluctuating RES (PV, Wind, Ocean) 8 14 30 38 38 38 38 39 39 RES district heat 0 0 0 0 0 0 0 0 0Share of fluctuating RES 3% 6% 12% 14% 13% 13% 12% 11% 11% - Hard coal & Brown Coal 1 0 0 0 0 0 0 0 0RES share (domestic generation) 10% 15% 21% 25% 23% 22% 20% 18% 17% - Oil products 124 141 140 146 151 157 161 165 169
- Gas 180 211 210 210 217 226 240 255 271 - Solar 11 11 11 11 11 11 11 11 11Heat supply and air conditioning in PJ/a
Scenario: Australia Reference (2015) - Biomass 58 58 60 60 60 60 60 60 60 - Geothermal 0 0 0 0 0 0 0 0 0
2012 2015 2020 2025 2030 2035 2040 2045 2050 - Hydrogen 0 0 0 0 0 0 0 0 0 RES share Other Sectors 14% 16% 19% 20% 20% 19% 18% 17% 16%
District heating plants 1 1 1 1 1 1 1 1 1 - Fossil fuels 1 1 1 1 1 1 1 1 1 Total RES 263 279 347 390 398 406 413 378 382 - Biomass 0 0 0 0 0 0 0 0 0 RES share 8% 7% 8% 9% 8% 8% 8% 7% 6% - Solar collectors 0 0 0 0 0 0 0 0 0 - Geothermal 0 0 0 0 0 0 0 0 0 CO2 emissions in Mill t/a
Scenario: Australia Reference (2015)Heat from CHP 1) 43 62 65 68 71 83 86 88 94 2012 2015 2020 2025 2030 2035 2040 2045 2050 - Fossil fuels 30 42 43 45 47 55 57 58 61 - Biomass 13 20 21 22 23 27 28 29 32 Condensation power plants 195 169 168 168 181 197 216 212 231 - Geothermal 0 0 0 0 0 0 0 0 0 132 93 95 96 111 127 146 141 161 - Hydrogen 0 0 1 1 1 1 1 1 1 37 55 52 51 50 50 51 52 53
23 21 20 19 19 18 18 17 17Direct heating 931 1,295 1,401 1,517 1,641 1,771 1,929 2,100 2,283 1 0 0 0 0 0 0 0 0 - Fossil fuels 738 1,103 1,205 1,318 1,439 1,566 1,718 1,883 2,059
- Hard coal (& non-renewable waste) - Brown Coal - Gas - Oil - Diesel 2 1 1 1 1 1 1 1 1
- Biomass 124 84 89 92 95 98 104 111 117 - Solar collectors 11 11 11 11 11 11 11 11 11 Combined heat and power plants 8 8 8 8 8 9 9 9 9 - Geothermal 0 0 0 0 0 0 0 0 0 0 0 0 0 0 1 1 0 0 - Heat pumps 2) 0 0 0 0 0 0 0 0 0 3 0 0 0 0 0 0 0 0 - Electric direct heating 57 96 96 96 96 96 96 96 96 5 7 7 7 7 8 8 8 8 - Hydrogen 0 0 0 0 0 0 0 0 0
- Hard coal (& non-renewable waste) - Brown Coal - Gas - Oil 1 1 1 1 1 1 1 1 1
Total heat supply3) 975 1,357 1,467 1,585 1,713 1,855 2,016 2,189 2,378 CO2 emissions power and CHP plants 203 178 176 176 190 206 225 221 241 - Fossil fuels 770 1,146 1,249 1,364 1,487 1,621 1,775 1,941 2,121 132 93 95 97 111 128 146 142 161 - Biomass 137 105 110 114 118 125 132 140 149 39 55 52 51 50 50 51 52 53 - Solar collectors 11 11 11 11 11 11 11 11 11 28 28 27 27 26 26 26 25 25 - Geothermal 0 0 0 0 0 0 0 0 0
- Hard coal (& non-renewable waste) - Brown Coal - Gas - Oil & diesel 3 2 2 2 2 2 2 2 2
- Heat pumps 2) 0 0 0 0 0 0 0 0 0 - Electric direct heating 57 96 96 96 96 96 96 96 96 0.00 0.00 0.00 0.00 0.00 0.00 0.00 0.00 0.00 - Hydrogen 0 0 1 1 1 1 1 1 1
CO2 intensity (g/kWh)without credit for CHP heat 0.00 0.00 0.00 0.00 0.00 0.00 0.00 0.00 0.00
902 897 883 877 876 878 883 790 79116% 10% 10% 9% 9% 8% 8% 8% 7%
- CO2 intensity fossil electr. generation - CO2 intensity total electr. generation 815 759 694 661 674 688 705 644 655RES share (including RES electricity)
electricity consumption heat pumps (TWh/a) 0% 0% 0% 0% 0% 0% 0% 0% 0%1) public CHP and CHP autoproduction 2) heat from ambient energy and electricity use incl. process heat, cooking3) CO2 emissions by sector 374 420 435 450 478 510 547 557 589
- % of 1990 emissions (276 Mill t) 136% 152% 158% 163% 173% 185% 198% 202% 213%Final energy consumption transport in PJ/aScenario: Australia Reference (2015) - Industry 1) 45 67 74 80 87 94 102 110 119
2012 2015 2020 2025 2030 2035 2040 2045 2050 - Other sectors 1) 20 23 23 24 24 25 26 28 29 - Transport 96 128 138 149 159 169 179 184 185
road 1,092 1,558 1,681 1,806 1,930 2,067 2,176 2,212 2,232 - Power generation 2) 200 173 172 171 185 200 219 215 234 - fossil fuels 1,076 1,507 1,626 1,746 1,865 1,997 2,101 2,172 2,191 - Other conversion 3) 13 29 29 26 23 22 21 21 22 - biofuels 14 47 50 54 58 62 66 29 29 - synfuels 0 0 0 0 0 0 0 0 0 1) incl. CHP autoproducers - natural gas 2 4 5 6 7 8 10 11 12 2) incl. CHP public - hydrogen 0 0 0 0 0 0 0 0 0 district heating, refineries, coal transformation, gas transport 3) - electricity 0 0 0 0 0 0 1 1 1Electrification share: 0% 0% 0% 0% 0% 0% 0% 0% 0%
rail 57 52 56 60 64 68 72 76 80 - fossil fuels 42 7 7 8 8 9 9 10 10 - biofuels 0 0 0 0 0 0 0 0 0 - synfuels 0 0 0 0 0 0 0 0 0 Primary energy demand in PJ/a - electricity 15 45 49 52 56 60 63 66 70 Scenario: Australia Reference (2015)
2012 2015 2020 2025 2030 2035 2040 2045 2050navigation 29 53 57 61 65 70 73 77 81 - fossil fuels 29 53 57 61 65 70 73 77 81 Total 5,147 5,800 6,207 6,535 6,915 7,310 7,757 7,855 8,249 - biofuels 0 0 0 0 0 0 0 0 0 - Fossil 4,836 5,442 5,711 5,957 6,354 6,759 7,218 7,380 7,783 - synfuels 0 0 0 0 0 0 0 0 0 1,538 1,072 1,114 1,136 1,298 1,485 1,694 1,648 1,855
387 521 497 486 483 482 489 497 504aviation 111 101 113 123 134 132 148 132 132 1,036 1,468 1,535 1,614 1,698 1,783 1,902 2,025 2,176 - fossil fuels 111 101 113 123 134 132 148 132 132
- Hard coal (& non-renewable waste) - Brown Coal - Natural gas - Crude oil 1,874 2,380 2,565 2,721 2,874 3,009 3,133 3,211 3,248
- biofuels 0 0 0 0 0 0 0 0 0 - Renewables 311 359 496 578 561 550 540 475 466 - synfuels 0 0 0 0 0 0 0 0 0 50 68 68 68 68 67 66 66 65
22 32 86 115 116 117 117 118 119total (incl. pipelines) 1,304 1,780 1,924 2,067 2,211 2,354 2,487 2,515 2,542
- Hydro - Wind - Solar 17 29 31 31 32 32 32 32 33
- fossil fuels 1,258 1,668 1,803 1,938 2,073 2,208 2,332 2,392 2,415 222 229 254 266 273 285 292 244 249 - biofuels (incl. biogas) 14 47 50 54 58 62 66 29 29 0 0 56 97 72 51 32 15 0 - synfuels 0 0 0 0 0 0 0 0 0
- Biomass (& renewable waste) - Geothermal - Ocean energy 0 0 0 0 0 0 0 0 0
- natural gas 19 20 21 22 23 24 26 27 28 - hydrogen 0 0 0 0 0 0 0 0 0 Total incl. net elec. & synfuel import 5,147 5,800 6,207 6,535 6,915 7,310 7,757 7,855 8,249 - electricity 15 45 49 53 56 60 64 67 71 - of which non-energy use 202 235 242 242 242 242 242 242 242
total RES 15 54 61 67 71 75 78 41 41RES share 1% 3% 3% 3% 3% 3% 3% 2% 2%
Total RES incl. electr. & synfuel importRES share
311.271 358.668 496.03 577.898 560.628 550.497 539.689 474.9 465.5740.06047 0.06184 0.07992 0.08843 0.08108 0.07531 0.06957 0.06046 0.05644
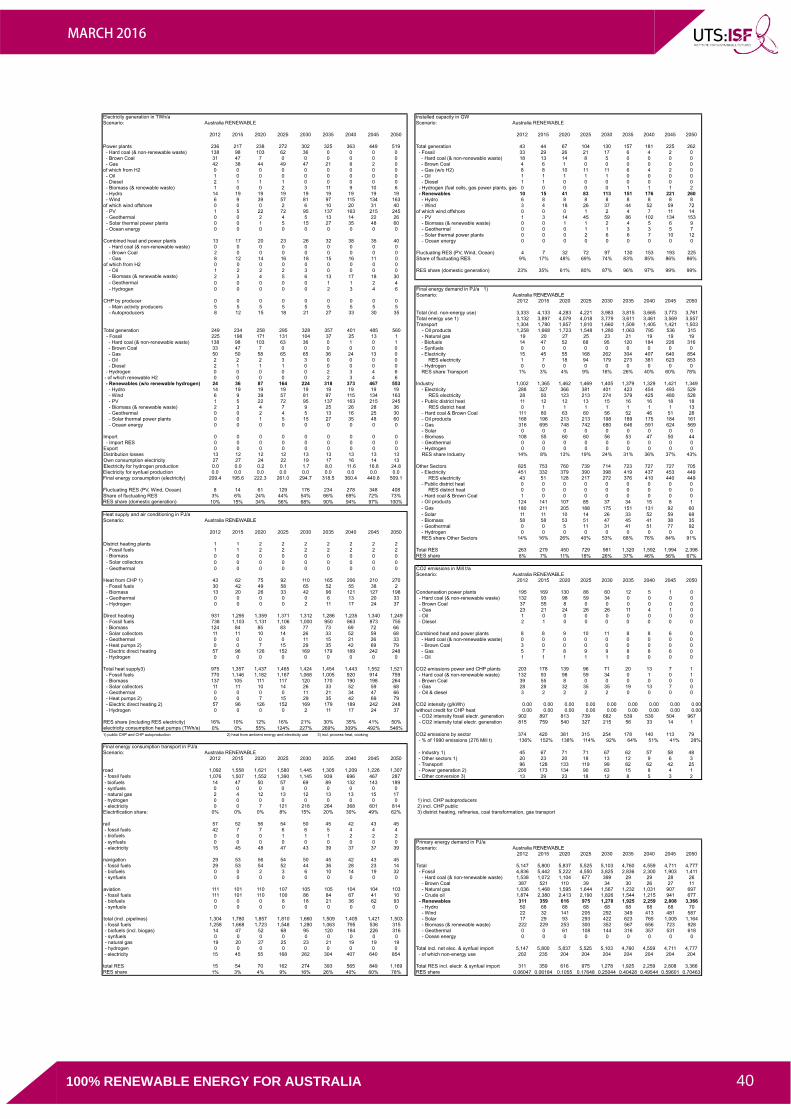
MARCH 2016
100% RENEWABLE ENERGY FOR AUSTRALIA 40
Electricity generation in TWh/a Installed capacity in GWScenario: Australia RENEWABLE Scenario: Australia RENEWABLE
2012 2015 2020 2025 2030 2035 2040 2045 2050 2012 2015 2020 2025 2030 2035 2040 2045 2050
Power plants 236 217 238 272 302 325 363 449 519 Total generation 43 44 67 104 130 157 181 225 262138 98 103 62 36 0 0 0 0 - Fossil 33 29 26 21 17 6 4 2 031 47 7 0 0 0 0 0 0 - Hard coal (& non-renewable waste) 18 13 14 8 5 0 0 0 0
- Hard coal (& non-renewable waste) - Brown Coal - Gas 42 38 44 49 47 21 8 2 0 - Brown Coal 4 6 1 0 0 0 0 0 0of which from H2 0 0 0 0 0 0 0 0 0 - Gas (w/o H2) 8 8 10 11 11 6 4 2 0
1 0 0 0 0 0 0 0 0 - Oil 1 1 1 1 1 0 0 0 02 1 1 1 0 0 0 0 0 - Diesel 1 1 0 0 0 0 0 0 01 0 0 2 3 11 9 10 6 - Hydrogen (fuel cells, gas power plants, gas 0 0 0 0 0 1 1 1 214 19 19 19 19 19 19 19 19 - Renewables 10 15 41 83 113 151 176 221 260
- Oil - Diesel - Biomass (& renewable waste) - Hydro - Wind 6 9 39 57 81 97 115 134 163 - Hydro 6 8 8 8 8 8 8 8 8of which wind offshore 0 0 0 2 6 10 20 31 40 3 4 18 26 37 44 52 59 72
1 5 22 72 95 137 163 215 245 - Windof which wind offshore 0 0 0 1 2 4 7 11 14
0 0 2 4 5 13 14 22 26 1 3 14 45 59 86 102 134 1530 0 1 5 15 27 35 48 60 0 0 1 1 2 4 5 6 9
- PV - Geothermal - Solar thermal power plants - Ocean energy 0 0 0 0 0 0 0 0 0 0 0 0 1 1 3 3 5 7
0 0 0 2 6 6 7 10 12Combined heat and power plants 13 17 20 23 26 32 38 35 40
- PV - Biomass (& renewable waste) - Geothermal - Solar thermal power plants - Ocean energy 0 0 0 0 0 0 0 0 0
0 0 0 0 0 0 0 0 02 0 0 0 0 0 0 0 0 Fluctuating RES (PV, Wind, Ocean) 4 7 32 72 97 130 153 193 225
- Hard coal (& non-renewable waste) - Brown Coal - Gas 8 12 14 16 18 15 16 11 0 Share of fluctuating RES 9% 17% 48% 69% 74% 83% 85% 86% 86%
of which from H2 0 0 0 0 0 0 0 0 01 2 2 2 3 0 0 0 0 RES share (domestic generation) 23% 35% 61% 80% 87% 96% 97% 99% 99%2 3 4 5 6 13 17 18 300 0 0 0 0 1 1 2 4
- Oil - Biomass (& renewable waste) - Geothermal - Hydrogen 0 0 0 0 0 2 3 4 6 Final energy demand in PJ/a 1)
Scenario: Australia RENEWABLECHP by producer 0 0 0 0 0 0 0 0 0 2012 2015 2020 2025 2030 2035 2040 2045 2050
- Main activity producers 5 5 5 5 5 5 5 5 5 - Autoproducers 8 12 15 18 21 27 33 30 35 Total (incl. non-energy use) 3,333 4,133 4,283 4,221 3,983 3,815 3,665 3,773 3,761
Total energy use 1) 3,132 3,897 4,079 4,018 3,779 3,611 3,461 3,569 3,557Transport 1,304 1,780 1,857 1,810 1,660 1,509 1,405 1,421 1,503
Total generation 249 234 258 295 328 357 401 485 560 - Oil products 1,258 1,668 1,723 1,548 1,280 1,063 795 536 315 - Fossil 225 198 171 131 104 37 25 13 1 - Natural gas 19 20 27 25 23 21 19 19 19
138 98 103 63 36 0 1 0 1 - Biofuels 14 47 52 68 95 120 184 226 31633 47 7 0 0 0 0 0 0 - Synfuels 0 0 0 0 0 0 0 0 050 50 58 65 65 36 24 13 0 - Electricity 15 45 55 168 262 304 407 640 8542 2 2 3 3 0 0 0 0 RES electricity 1 7 18 94 179 273 381 623 853
- Hard coal (& non-renewable waste) - Brown Coal - Gas - Oil - Diesel 2 1 1 1 0 0 0 0 0 - Hydrogen 0 0 0 0 0 0 0 0 0
0 0 0 0 0 2 3 4 6 RES share Transport 1% 3% 4% 9% 16% 26% 40% 60% 78%0 0 0 0 0 2 3 4 6
- Hydrogen - of which renewable H2 - Renewables (w/o renewable hydrogen) 24 36 87 164 224 318 373 467 553 Industry 1,002 1,365 1,462 1,469 1,405 1,379 1,329 1,421 1,349
14 19 19 19 19 19 19 19 19 - Electricity 288 327 366 381 401 423 454 493 5296 9 39 57 81 97 115 134 163 RES electricity 28 50 123 213 274 379 425 480 5281 5 22 72 95 137 163 215 245 - Public district heat 11 12 12 13 15 16 16 18 182 3 4 7 9 25 26 28 36 RES district heat 0 1 1 1 1 1 1 1 130 0 2 4 5 13 16 25 30 - Hard coal & Brown Coal 111 80 63 60 56 52 46 51 280 0 1 5 15 27 35 48 60 - Oil products 168 196 213 213 198 189 175 184 161
- Hydro - Wind - PV - Biomass (& renewable waste) - Geothermal - Solar thermal power plants - Ocean energy 0 0 0 0 0 0 0 0 0 - Gas 316 695 748 742 680 646 591 624 569
- Solar 0 0 0 0 0 0 0 0 0Import 0 0 0 0 0 0 0 0 0 - Biomass 108 55 60 60 56 53 47 50 44
0 0 0 0 0 0 0 0 0 - Geothermal 0 0 0 0 0 0 0 0 00 0 0 0 0 0 0 0 0 - Hydrogen 0 0 0 0 0 0 0 0 013 12 12 12 13 13 13 13 13 RES share Industry 14% 8% 13% 19% 24% 31% 36% 37% 43%27 27 24 22 19 17 16 14 130.0 0.0 0.2 0.1 1.7 8.0 11.6 16.8 24.8 Other Sectors 825 753 760 739 714 723 727 727 7050.0 0.0 0.0 0.0 0.0 0.0 0.0 0.0 0.0 - Electricity 451 332 379 390 398 419 437 453 449
- Import RESExportDistribution lossesOwn consumption electricityElectricity for hydrogen productionElectricity for synfuel productionFinal energy consumption (electricity) 209.4 195.6 222.3 261.0 294.7 318.5 360.4 440.8 509.1 RES electricity 43 51 128 217 272 376 410 440 449
- Public district heat 0 0 0 0 0 0 0 0 0Fluctuating RES (PV, Wind, Ocean) 8 14 61 129 176 234 278 348 408 RES district heat 0 0 0 0 0 0 0 0 0Share of fluctuating RES 3% 6% 24% 44% 54% 66% 69% 72% 73% - Hard coal & Brown Coal 1 0 0 0 0 0 0 0 0RES share (domestic generation) 10% 15% 34% 56% 68% 90% 94% 97% 100% - Oil products 124 141 107 85 37 34 15 8 1
- Gas 180 211 205 188 175 151 131 92 60 - Solar 11 11 10 14 26 33 52 59 68Heat supply and air conditioning in PJ/a
Scenario: Australia RENEWABLE - Biomass 58 58 53 51 47 45 41 38 35 - Geothermal 0 0 5 11 31 41 51 77 92
2012 2015 2020 2025 2030 2035 2040 2045 2050 - Hydrogen 0 0 0 0 0 0 0 0 0 RES share Other Sectors 14% 16% 26% 40% 53% 68% 76% 84% 91%
District heating plants 1 1 2 2 2 2 2 2 2 - Fossil fuels 1 1 2 2 2 2 2 2 2 Total RES 263 279 450 729 981 1,320 1,592 1,994 2,398 - Biomass 0 0 0 0 0 0 0 0 0 RES share 8% 7% 11% 18% 26% 37% 46% 56% 67% - Solar collectors 0 0 0 0 0 0 0 0 0 - Geothermal 0 0 0 0 0 0 0 0 0 CO2 emissions in Mill t/a
Scenario: Australia RENEWABLEHeat from CHP 1) 43 62 75 92 110 165 206 210 270 2012 2015 2020 2025 2030 2035 2040 2045 2050 - Fossil fuels 30 42 49 58 65 52 55 38 2 - Biomass 13 20 26 33 42 96 121 127 198 Condensation power plants 195 169 130 86 60 12 5 1 0 - Geothermal 0 0 0 0 0 6 13 20 33 132 93 98 59 34 0 0 0 0 - Hydrogen 0 0 0 0 2 11 17 24 37 37 55 8 0 0 0 0 0 0
23 21 24 26 26 11 4 1 0Direct heating 931 1,295 1,359 1,371 1,312 1,286 1,235 1,340 1,249 1 0 0 0 0 0 0 0 0 - Fossil fuels 738 1,103 1,131 1,106 1,000 950 863 873 755
- Hard coal (& non-renewable waste) - Brown Coal - Gas - Oil - Diesel 2 1 0 0 0 0 0 0 0
- Biomass 124 84 85 83 77 73 69 72 66 - Solar collectors 11 11 10 14 26 33 52 59 68 Combined heat and power plants 8 8 9 10 11 8 8 6 0 - Geothermal 0 0 0 0 11 15 21 26 33 0 0 0 0 0 0 0 0 0 - Heat pumps 2) 0 0 7 15 29 35 42 69 79 3 0 0 0 0 0 0 0 0 - Electric direct heating 57 96 126 152 169 179 189 242 248 5 7 8 9 9 8 8 6 0 - Hydrogen 0 0 0 0 0 0 0 0 0
- Hard coal (& non-renewable waste) - Brown Coal - Gas - Oil 1 1 1 1 1 0 0 0 0
Total heat supply3) 975 1,357 1,437 1,465 1,424 1,454 1,443 1,552 1,521 CO2 emissions power and CHP plants 203 178 139 96 71 20 13 7 1 - Fossil fuels 770 1,146 1,182 1,167 1,068 1,005 920 914 759 132 93 98 59 34 0 1 0 1 - Biomass 137 105 111 117 120 170 190 198 264 39 55 8 0 0 0 0 0 0 - Solar collectors 11 11 10 14 26 33 52 59 68 28 28 32 35 35 19 13 7 0 - Geothermal 0 0 0 0 11 21 34 47 66
- Hard coal (& non-renewable waste) - Brown Coal - Gas - Oil & diesel 3 2 2 2 2 0 0 0 0
- Heat pumps 2) 0 0 7 15 29 35 42 69 79 - Electric direct heating 2) 57 96 126 152 169 179 189 242 248 0.00 0.00 0.00 0.00 0.00 0.00 0.00 0.00 0.00 - Hydrogen 0 0 0 0 2 11 17 24 37
CO2 intensity (g/kWh)without credit for CHP heat 0.00 0.00 0.00 0.00 0.00 0.00 0.00 0.00 0.00
902 897 813 739 682 539 530 504 96716% 10% 12% 16% 21% 30% 35% 41% 50%
- CO2 intensity fossil electr. generation - CO2 intensity total electr. generation 815 759 540 327 215 56 33 14 1RES share (including RES electricity)
electricity consumption heat pumps (TWh/a) 0% 0% 55% 124% 227% 269% 309% 492% 546%1) public CHP and CHP autoproduction 2) heat from ambient energy and electricity use 3) incl. process heat, cooking CO2 emissions by sector 374 420 381 315 254 178 140 113 79
- % of 1990 emissions (276 Mill t) 136% 152% 138% 114% 92% 64% 51% 41% 28%Final energy consumption transport in PJ/aScenario: Australia RENEWABLE - Industry 1) 45 67 71 71 67 62 57 58 48
2012 2015 2020 2025 2030 2035 2040 2045 2050 - Other sectors 1) 20 23 20 18 13 12 9 6 3 - Transport 96 128 133 119 99 82 62 42 25
road 1,092 1,558 1,621 1,580 1,445 1,305 1,209 1,226 1,307 - Power generation 2) 200 173 134 90 63 15 8 4 1 - fossil fuels 1,076 1,507 1,552 1,390 1,145 939 696 467 287 - Other conversion 3) 13 29 23 18 12 8 5 3 2 - biofuels 14 47 50 57 69 89 132 143 189 - synfuels 0 0 0 0 0 0 0 0 0 - natural gas 2 4 12 13 12 13 13 15 17 - hydrogen 0 0 0 0 0 0 0 0 0 1) incl. CHP autoproducers - electricity 0 0 7 121 218 264 368 601 814 2) incl. CHP publicElectrification share: 0% 0% 0% 8% 15% 20% 30% 49% 62% district heating, refineries, coal transformation, gas transport 3)
rail 57 52 56 54 50 45 42 43 45 - fossil fuels 42 7 7 6 6 5 4 4 4 - biofuels 0 0 0 1 1 1 2 2 2 - synfuels 0 0 0 0 0 0 0 0 0 Primary energy demand in PJ/a - electricity 15 45 48 47 43 39 37 37 39 Scenario: Australia RENEWABLE
2012 2015 2020 2025 2030 2035 2040 2045 2050navigation 29 53 56 54 50 45 42 43 45 - fossil fuels 29 53 54 52 44 36 28 23 14 Total 5,147 5,800 5,837 5,525 5,103 4,760 4,559 4,711 4,777 - biofuels 0 0 2 3 6 10 14 19 32 - Fossil 4,836 5,442 5,222 4,550 3,825 2,836 2,300 1,903 1,411 - synfuels 0 0 0 0 0 0 0 0 0 1,538 1,072 1,104 677 399 29 29 28 26
387 521 110 39 34 30 26 27 11aviation 111 101 110 107 105 105 104 104 103 1,036 1,468 1,595 1,644 1,567 1,232 1,031 907 697 - fossil fuels 111 101 110 100 86 84 67 41 10
- Hard coal (& non-renewable waste) - Brown Coal - Natural gas - Crude oil 1,874 2,380 2,413 2,190 1,826 1,544 1,215 941 677
- biofuels 0 0 0 8 18 21 36 62 93 - Renewables 311 359 616 975 1,278 1,925 2,259 2,808 3,366 - synfuels 0 0 0 0 0 0 0 0 0 50 68 68 68 68 68 68 68 70
22 32 141 205 292 349 413 481 587total (incl. pipelines) 1,304 1,780 1,857 1,810 1,660 1,509 1,405 1,421 1,503
- Hydro - Wind - Solar 17 29 93 293 422 623 765 1,005 1,164
- fossil fuels 1,258 1,668 1,723 1,548 1,280 1,063 795 536 315 222 229 253 300 352 567 656 723 928 - biofuels (incl. biogas) 14 47 52 68 95 120 184 226 316 0 0 61 108 144 316 357 531 618 - synfuels 0 0 0 0 0 0 0 0 0
- Biomass (& renewable waste) - Geothermal - Ocean energy 0 0 0 0 0 0 0 0 0
- natural gas 19 20 27 25 23 21 19 19 19 - hydrogen 0 0 0 0 0 0 0 0 0 Total incl. net elec. & synfuel import 5,147 5,800 5,837 5,525 5,103 4,760 4,559 4,711 4,777 - electricity 15 45 55 168 262 304 407 640 854 - of which non-energy use 202 235 204 204 204 204 204 204 204
total RES 15 54 70 162 274 393 565 849 1,169 311 359 616 975 1,278 1,925 2,259 2,808 3,366RES share 1% 3% 4% 9% 16% 26% 40% 60% 78%
Total RES incl. electr. & synfuel importRES share 0.06047 0.06184 0.1055 0.17648 0.25044 0.40428 0.49544 0.59601 0.70463
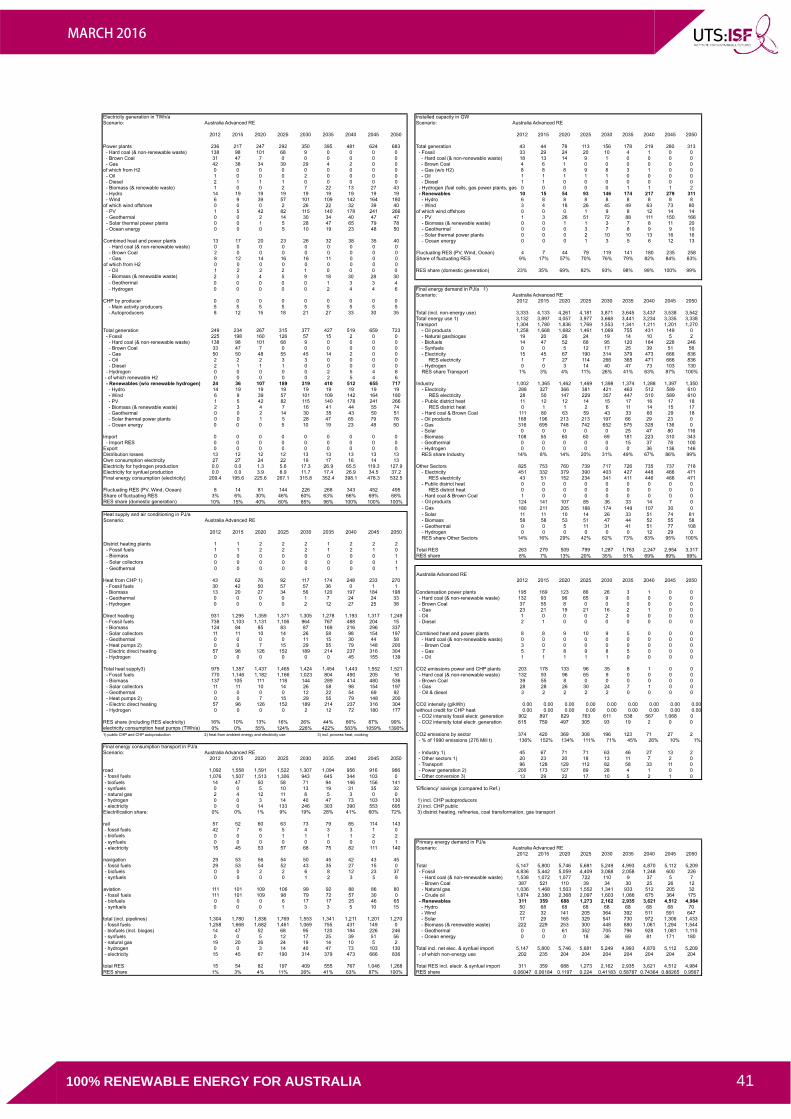
MARCH 2016
100% RENEWABLE ENERGY FOR AUSTRALIA 41
Electricity generation in TWh/a Installed capacity in GWScenario: Australia Advanced RE Scenario: Australia Advanced RE
2012 2015 2020 2025 2030 2035 2040 2045 2050 2012 2015 2020 2025 2030 2035 2040 2045 2050
Power plants 236 217 247 292 350 395 481 624 683 Total generation 43 44 78 113 156 178 219 280 313138 98 101 68 9 0 0 0 0 - Fossil 33 29 24 20 10 4 1 0 031 47 7 0 0 0 0 0 0 - Hard coal (& non-renewable waste) 18 13 14 9 1 0 0 0 0
- Hard coal (& non-renewable waste) - Brown Coal - Gas 42 38 34 39 29 4 2 0 0 - Brown Coal 4 6 1 0 0 0 0 0 0of which from H2 0 0 0 0 0 0 0 0 0 - Gas (w/o H2) 8 8 8 9 8 3 1 0 0
1 0 0 0 2 0 0 0 0 - Oil 1 1 1 1 1 0 0 0 02 1 1 1 0 0 0 0 0 - Diesel 1 1 0 0 0 0 0 0 01 0 0 2 7 22 13 27 43 - Hydrogen (fuel cells, gas power plants, gas 0 0 0 0 0 1 1 1 214 19 19 19 19 19 19 19 19 - Renewables 10 15 54 93 146 174 217 279 311
- Oil - Diesel - Biomass (& renewable waste) - Hydro - Wind 6 9 39 57 101 109 142 164 180 - Hydro 6 8 8 8 8 8 8 8 8of which wind offshore 0 0 0 2 26 22 32 39 40 3 4 18 26 45 49 63 73 80
1 5 42 82 115 140 178 241 266 - Windof which wind offshore 0 0 0 1 9 8 12 14 14
0 0 2 14 30 34 40 47 47 1 3 26 51 72 88 111 150 1660 0 1 5 28 47 65 79 78 0 0 1 1 3 7 8 11 20
- PV - Geothermal - Solar thermal power plants - Ocean energy 0 0 0 5 10 19 23 48 50 0 0 0 3 7 8 9 9 10
0 0 0 2 10 10 13 16 16Combined heat and power plants 13 17 20 23 26 32 38 35 40
- PV - Biomass (& renewable waste) - Geothermal - Solar thermal power plants - Ocean energy 0 0 0 1 3 5 6 12 13
0 0 0 0 0 0 0 0 02 0 0 0 0 0 0 0 0 Fluctuating RES (PV, Wind, Ocean) 4 7 44 79 119 141 180 235 258
- Hard coal (& non-renewable waste) - Brown Coal - Gas 8 12 14 16 16 11 0 0 0 Share of fluctuating RES 9% 17% 57% 70% 76% 79% 82% 84% 83%
of which from H2 0 0 0 0 0 0 0 0 01 2 2 2 1 0 0 0 0 RES share (domestic generation) 23% 35% 69% 82% 93% 98% 99% 100% 99%2 3 4 5 9 18 30 28 300 0 0 0 0 1 3 3 4
- Oil - Biomass (& renewable waste) - Geothermal - Hydrogen 0 0 0 0 0 2 4 4 6 Final energy demand in PJ/a 1)
Scenario: Australia Advanced RECHP by producer 0 0 0 0 0 0 0 0 0 2012 2015 2020 2025 2030 2035 2040 2045 2050
- Main activity producers 5 5 5 5 5 5 5 5 5 - Autoproducers 8 12 15 18 21 27 33 30 35 Total (incl. non-energy use) 3,333 4,133 4,261 4,181 3,871 3,645 3,437 3,538 3,542
Total energy use 1) 3,132 3,897 4,057 3,977 3,668 3,441 3,234 3,335 3,338Transport 1,304 1,780 1,836 1,769 1,553 1,341 1,211 1,201 1,270
Total generation 249 234 267 315 377 427 519 659 723 - Oil products 1,258 1,668 1,682 1,461 1,069 755 431 149 0 - Fossil 225 198 160 126 57 15 2 0 0 - Natural gas/biogas 19 20 26 24 19 14 10 5 2
138 98 101 68 9 0 0 0 0 - Biofuels 14 47 52 68 95 120 184 226 24633 47 7 0 0 0 0 0 0 - Synfuels 0 0 5 12 17 25 39 51 5650 50 48 55 45 14 2 0 0 - Electricity 15 45 67 190 314 379 473 666 8362 2 2 3 3 0 0 0 0 RES electricity 1 7 27 114 266 365 471 666 836
- Hard coal (& non-renewable waste) - Brown Coal - Gas - Oil - Diesel 2 1 1 1 0 0 0 0 0 - Hydrogen 0 0 3 14 40 47 73 103 130
0 0 0 0 0 2 5 4 6 RES share Transport 1% 3% 4% 11% 26% 41% 63% 87% 100%0 0 0 0 0 2 5 4 6
- Hydrogen - of which renewable H2 - Renewables (w/o renewable hydrogen) 24 36 107 189 319 410 512 655 717 Industry 1,002 1,365 1,462 1,469 1,398 1,374 1,288 1,397 1,350
14 19 19 19 19 19 19 19 19 - Electricity 288 327 366 381 421 463 512 589 6106 9 39 57 101 109 142 164 180 RES electricity 28 50 147 229 357 447 510 589 6101 5 42 82 115 140 178 241 266 - Public district heat 11 12 12 14 15 17 16 17 182 3 4 7 16 41 44 55 74 RES district heat 0 1 1 2 6 11 14 15 170 0 2 14 30 35 43 50 51 - Hard coal & Brown Coal 111 80 63 59 43 33 60 29 180 0 1 5 28 47 65 79 78 - Oil products 168 196 213 213 197 66 29 23 0
- Hydro - Wind - PV - Biomass (& renewable waste) - Geothermal - Solar thermal power plants - Ocean energy 0 0 0 5 10 19 23 48 50 - Gas 316 695 748 742 652 575 328 136 0
- Solar 0 0 0 0 0 25 47 80 116Import 0 0 0 0 0 0 0 0 0 - Biomass 108 55 60 60 69 181 223 310 343
0 0 0 0 0 0 0 0 0 - Geothermal 0 0 0 0 0 15 37 78 1000 0 0 0 0 0 0 0 0 - Hydrogen 0 0 0 0 0 0 36 136 14613 12 12 12 13 13 13 13 13 RES share Industry 14% 8% 14% 20% 31% 49% 67% 86% 99%27 27 24 22 19 17 16 14 130.0 0.0 1.3 5.6 17.3 26.9 65.5 119.3 127.9 Other Sectors 825 753 760 739 717 726 735 737 7180.0 0.0 3.9 8.9 11.7 17.4 26.9 34.5 37.2 - Electricity 451 332 379 390 403 427 448 466 471
- Import RESExportDistribution lossesOwn consumption electricityElectricity for hydrogen productionElectricity for synfuel productionFinal energy consumption (electricity) 209.4 195.6 225.6 267.1 315.8 352.4 398.1 478.3 532.5 RES electricity 43 51 152 234 341 411 446 466 471
- Public district heat 0 0 0 0 0 0 0 0 0Fluctuating RES (PV, Wind, Ocean) 8 14 81 144 226 268 343 452 495 RES district heat 0 0 0 0 0 0 0 0 0Share of fluctuating RES 3% 6% 30% 46% 60% 63% 66% 69% 68% - Hard coal & Brown Coal 1 0 0 0 0 0 0 0 0RES share (domestic generation) 10% 15% 40% 60% 85% 96% 100% 100% 100% - Oil products 124 141 107 85 36 33 14 7 0
- Gas 180 211 205 188 174 149 107 30 0 - Solar 11 11 10 14 26 33 51 74 81Heat supply and air conditioning in PJ/a
Scenario: Australia Advanced RE - Biomass 58 58 53 51 47 44 52 55 58 - Geothermal 0 0 5 11 31 41 51 77 108
2012 2015 2020 2025 2030 2035 2040 2045 2050 - Hydrogen 0 0 0 0 0 0 12 29 0 RES share Other Sectors 14% 16% 29% 42% 62% 73% 83% 95% 100%
District heating plants 1 1 2 2 2 1 2 2 2 - Fossil fuels 1 1 2 2 2 1 2 1 0 Total RES 263 279 509 799 1,287 1,763 2,247 2,954 3,317 - Biomass 0 0 0 0 0 0 0 0 1 RES share 8% 7% 13% 20% 35% 51% 69% 89% 99% - Solar collectors 0 0 0 0 0 0 0 0 1 - Geothermal 0 0 0 0 0 0 0 0 1
Australia Advanced REHeat from CHP 1) 43 62 76 92 117 174 248 233 270 2012 2015 2020 2025 2030 2035 2040 2045 2050 - Fossil fuels 30 42 50 57 57 36 0 1 1 - Biomass 13 20 27 34 56 120 197 184 198 Condensation power plants 195 169 123 86 26 3 1 0 0 - Geothermal 0 0 0 0 1 7 24 24 33 132 93 96 65 9 0 0 0 0 - Hydrogen 0 0 0 0 2 12 27 25 38 37 55 8 0 0 0 0 0 0
23 21 19 21 16 2 1 0 0Direct heating 931 1,295 1,359 1,371 1,305 1,278 1,193 1,317 1,249 1 0 0 0 2 0 0 0 0 - Fossil fuels 738 1,103 1,131 1,106 964 767 488 204 15
- Hard coal (& non-renewable waste) - Brown Coal - Gas - Oil - Diesel 2 1 0 0 0 0 0 0 0
- Biomass 124 84 85 83 87 169 216 296 337 - Solar collectors 11 11 10 14 26 58 98 154 197 Combined heat and power plants 8 8 9 10 9 5 0 0 0 - Geothermal 0 0 0 0 11 15 30 44 58 0 0 0 0 0 0 0 0 0 - Heat pumps 2) 0 0 7 15 29 55 79 148 200 3 0 0 0 0 0 0 0 0 - Electric direct heating 57 96 126 152 189 214 237 316 304 5 7 8 9 8 5 0 0 0 - Hydrogen 0 0 0 0 0 0 45 155 139
- Hard coal (& non-renewable waste) - Brown Coal - Gas - Oil 1 1 1 1 1 0 0 0 0
Total heat supply3) 975 1,357 1,437 1,465 1,424 1,454 1,443 1,552 1,521 CO2 emissions power and CHP plants 203 178 133 96 35 8 1 0 0 - Fossil fuels 770 1,146 1,182 1,166 1,023 804 490 205 16 132 93 96 65 9 0 0 0 0 - Biomass 137 105 111 118 144 289 414 480 536 39 55 8 0 0 0 0 0 0 - Solar collectors 11 11 10 14 26 58 98 154 197 28 28 26 30 24 7 1 0 0 - Geothermal 0 0 0 0 12 22 54 69 92
- Hard coal (& non-renewable waste) - Brown Coal - Gas - Oil & diesel 3 2 2 2 2 0 0 0 0
- Heat pumps 2) 0 0 7 15 29 55 79 148 200 - Electric direct heating 57 96 126 152 189 214 237 316 304 0.00 0.00 0.00 0.00 0.00 0.00 0.00 0.00 0.00 - Hydrogen 0 0 0 0 2 12 72 180 177
CO2 intensity (g/kWh)without credit for CHP heat 0.00 0.00 0.00 0.00 0.00 0.00 0.00 0.00 0.00
902 897 829 763 611 538 567 1,068 016% 10% 13% 16% 26% 44% 66% 87% 99%
- CO2 intensity fossil electr. generation - CO2 intensity total electr. generation 815 759 497 305 93 19 2 0 0RES share (including RES electricity)
electricity consumption heat pumps (TWh/a) 0% 0% 55% 124% 226% 422% 583% 1059% 1390%1) public CHP and CHP autoproduction 2) heat from ambient energy and electricity use 3) incl. process heat, cooking CO2 emissions by sector 374 420 369 308 196 123 71 27 2
- % of 1990 emissions (276 Mill t) 136% 152% 134% 111% 71% 45% 26% 10% 1%Final energy consumption transport in PJ/aScenario: Australia Advanced RE - Industry 1) 45 67 71 71 63 46 27 13 2
2012 2015 2020 2025 2030 2035 2040 2045 2050 - Other sectors 1) 20 23 20 18 13 11 7 2 0 - Transport 96 128 129 112 82 58 33 11 0
road 1,092 1,558 1,591 1,522 1,307 1,094 956 916 966 - Power generation 2) 200 173 127 89 28 4 1 0 0 - fossil fuels 1,076 1,507 1,513 1,306 943 645 344 103 0 - Other conversion 3) 13 29 22 17 10 5 2 1 0 - biofuels 14 47 50 58 71 94 146 156 141 - synfuels 0 0 5 10 13 19 31 35 32 'Efficiency' savings (compared to Ref.) - natural gas 2 4 12 11 8 5 3 0 0 - hydrogen 0 0 3 14 40 47 73 103 130 1) incl. CHP autoproducers - electricity 0 0 14 133 246 303 390 553 695 2) incl. CHP publicElectrification share: 0% 0% 1% 9% 19% 28% 41% 60% 72% 3) district heating, refineries, coal transformation, gas transport
rail 57 52 60 63 73 79 85 114 143 - fossil fuels 42 7 6 5 4 3 3 1 0 - biofuels 0 0 0 1 1 1 1 2 2 - synfuels 0 0 0 0 0 0 0 0 1 Primary energy demand in PJ/a - electricity 15 45 53 57 68 75 82 111 140 Scenario: Australia Advanced RE
2012 2015 2020 2025 2030 2035 2040 2045 2050navigation 29 53 56 54 50 45 42 43 45 - fossil fuels 29 53 54 52 43 35 27 15 0 Total 5,147 5,800 5,746 5,681 5,249 4,993 4,870 5,112 5,209 - biofuels 0 0 2 2 6 8 12 23 37 - Fossil 4,836 5,442 5,059 4,409 3,088 2,058 1,248 600 226 - synfuels 0 0 0 0 1 2 3 5 8 1,538 1,072 1,077 722 110 9 37 5 7
387 521 110 39 34 30 25 26 12aviation 111 101 109 106 99 92 88 86 80 1,036 1,468 1,503 1,552 1,341 933 512 205 32 - fossil fuels 111 101 109 98 79 72 57 30 0
- Hard coal (& non-renewable waste) - Brown Coal - Natural gas - Crude oil 1,874 2,380 2,368 2,097 1,603 1,086 675 364 175
- biofuels 0 0 0 6 17 17 25 46 65 - Renewables 311 359 688 1,273 2,162 2,935 3,621 4,512 4,984 - synfuels 0 0 0 1 3 3 5 10 15 50 68 68 68 68 68 68 68 70
22 32 141 205 364 392 511 591 647total (incl. pipelines) 1,304 1,780 1,836 1,769 1,553 1,341 1,211 1,201 1,270
- Hydro - Wind - Solar 17 29 165 329 541 730 972 1,306 1,433
- fossil fuels 1,258 1,668 1,682 1,461 1,069 755 431 149 0 222 229 253 300 448 880 1,061 1,294 1,544 - biofuels (incl. biogas) 14 47 52 68 95 120 184 226 246 0 0 61 352 705 796 928 1,081 1,110 - synfuels 0 0 5 12 17 25 39 51 56
- Biomass (& renewable waste) - Geothermal - Ocean energy 0 0 0 18 36 69 81 171 180
- natural gas 19 20 26 24 19 14 10 5 2 - hydrogen 0 0 3 14 40 47 73 103 130 Total incl. net elec. & synfuel import 5,147 5,800 5,746 5,681 5,249 4,993 4,870 5,112 5,209 - electricity 15 45 67 190 314 379 473 666 836 - of which non-energy use 202 235 204 204 204 204 204 204 204
total RES 15 54 82 197 409 555 767 1,046 1,268 311 359 688 1,273 2,162 2,935 3,621 4,512 4,984RES share 1% 3% 4% 11% 26% 41% 63% 87% 100%
Total RES incl. electr. & synfuel importRES share 0.06047 0.06184 0.1197 0.224 0.41183 0.58787 0.74364 0.88265 0.9567

MARCH 2016
100% RENEWABLE ENERGY FOR AUSTRALIA 42