Embed Size (px)
Citation preview
PNNL-19120
Prepared for the U.S. Department of Energy under Contract DE-AC05-76RL01830
100-N Area Strontium-90 Treatability Demonstration Project: Phytoextraction Along the 100-N Columbia River Riparian Zone – Field Treatability Study RJ Fellows CJ Driver JS Fruchter CC Ainsworth January 2010
PNNL-19120
100-N Area Strontium-90 Treatability Demonstration Project: Phytoextraction Along the 100-N Columbia River Riparian Zone – Field Treatability Study RJ Fellows CJ Driver JS Fruchter CC Ainsworth January 2010 Prepared for the U.S. Department of Energy under Contract DE-AC05-76RL01830 Pacific Northwest National Laboratory Richland, Washington 99352

iii
Summary
Strontium-90 (90Sr) exceeds the U.S. Environmental Protection Agency’s drinking water standards for groundwater (8 picocuries/liter) by as much as a factor of 1000 at several locations within the Hanford 100-N Area and along the Columbia River shoreline (100-NR-2). The isotope is present both in the aquifer near the river and in the vadose and riparian zones of the river’s shore.
Phytoremediation, or more specifically the phytoextraction of 90Sr is being considered as a potential remediation system along the riparian zone of the Columbia River as part of a treatment train that includes an apatite barrier to immobilize groundwater transport of 90Sr. Phytoextraction would employ coyote willow (Salix exigua) to extract 90Sr from the vadose zone soil and aquifer sediments (phytoextraction) and filter 90Sr (rhizofiltration) from the shallow groundwater along the riparian zone of the Columbia River.
A successful application of a phytoextraction strategy would require demonstration of: (1) the ability of willow roots to accumulate Sr and transport it to above-ground portions of the plant enabling the removal of the contaminant from the shoreline; (2) no discrimination in uptake between molecular Sr and 90Sr; (3) a low probability of herbivore access to the plants and, where access prevention is not possible, a low potential for contaminant bioaccumulation and subsequent food chain transfer; (4) proof that the selected plant species can survive in the diverse environmental conditions that exist on the 100-NR-2 shoreline; and (5) the production of sufficient annual biomass to remove a significant amount of the contaminant.
Past growth chamber and greenhouse studies have shown that willow roots share uptake mechanisms for Sr with Ca, a plant macronutrient. Laboratory hydroponic and 100-NR-2 soil experiments demonstrated no discrimination between Sr and 90Sr. Willow 90Sr concentration ratios [CR’s; (pCi 90Sr/g dry wt. of new growth tissue)/(pCi 90Sr/g soil porewater)] were consistently greater than 65 with three-quarters of the assimilated label partitioned into the above ground shoot. Finally, insect herbivore experiments with aphids and moths feeding on 100-NR-2 sediment-grown willow shoots demonstrated no significant potential for bioaccumulation or food chain transfer from their natural activities.
Therefore the objectives of this field study were three-fold: (1) to demonstrate that a viable, “managed” plot of coyote willows can be established on the shoreline of the Columbia River that would survive the same microenvironment to be encountered at the 100-NR-2 shoreline; (2) to show through engineered barriers that large and small animal herbivores can be prevented from feeding on these plants; and (3) to show that once established, the plants will provide sufficient biomass annually to support the phytoextraction technology.
A field treatability demonstration plot was established on the Columbia River shoreline alongside the 100-K West water intake about 2 miles upstream from the 100-NR-2 area at the end of January 2007. The plot was delimited by a 3.05 m high chain-link fence and was approximately 10 x 25 m in size. A layer of fine mesh metal small animal screening was placed around the plot at the base of the fencing to a depth of 45 cm. A total of sixty plants were placed in six slightly staggered rows with 1-m spacing between plants. The actual plot size was 0.00461 hectare (ha).

iv
At the time of planting (March 12, 2007), the plot was located about 10 m from the river’s edge. Less than two weeks later (March 21), the river began the spring rise. Periodic (daily) or continuous flooding occurred at the site over the next 3 to 4 months. River levels at times were over the top of the enclosure’s fence. This same pattern was repeated for the next 2 years. It was however evident that even submerged for part, or all of the day, that the plants continued to flourish. Further none of the plants were uprooted or damaged during these flooding events over the three years the study was conducted.
There were no indications of herbivory (eaten or half-eaten leaves or branches, teeth marks on trunks) or animal tracks observed within the plot although animals were present in the area. Birds were periodically observed within the plot but there was no indication that the birds were damaging the leaves of the plants. Conservatively, a larger plot in the contaminated sediment might consider netting to prevent birds for using any of the trees as a source for nesting material.
One of the possible projections for a tree management strategy was the need for two harvests during the growth season should they initiate flowering and pollen production. During the first growing season randomly selected plants were harvested twice, in July and October. These plants yielded a biomass that was statistically insignificant from those left undisturbed and harvested in October.
Biomass production over the three years followed a typical growth curve with a yield of about 1 kg for the first year when the trees were establishing themselves, 4 kg for the second, and over 20 kg for the third when the trees were entering the exponential phase of growth. On a metric Ton per hectare (mT/ha) basis this would be 0.2 mT/ha in 2007, 0.87 mT/ha in 2008, and 4.3 mT/ha in 2009. Growth curve extrapolation predicts 13.2 mT/ha during a fourth year and potentially 29.5 mT/ha following a fifth year.
Using the observed Ca and Sr concentrations found in the plant tissues, and Sr CR’s calculated from groundwater analysis, projected biomass yields suggest the trees could prove effective in removing the contaminant from the 100-NR-2 riparian zone. The results of this study indicate that the plants could function as a successful phytoextractant of 90Sr at the 100-NR-2 riparian zone.

v
Acknowledgments
Funding for this project was provided by U.S. Department of Energy EM-22, with additional funding from the CH2M Hill Plateau Remediation Contractor. The authors would like to thank Rick Herrington, Danielle Saunders, and Lucia Enriquez for their excellent technical help during the study.

vii
Acronyms and Abbreviations
90Sr strontium-90 Ca calcium cm centimeter(s) CR concentration ratio DOE U.S. Department of Energy ft foot/feet ha hectare (10,000 m2) ICP-AES inductively coupled plasma-atomic emission spectroscopy in inch(es) ITRD Innovative Technology and Remediation Demonstration kcfs thousand cubic feet per second kg kilogram(s) L liter(s) LWDF Liquid Waste Disposal Facility m meter(s) mm millimeter(s) MNA monitored natural attenuation mT metric tons pCi picocuries µg microgram

ix
Contents
Summary ............................................................................................................................................... iiiAcknowledgments................................................................................................................................. vAcronyms and Abbreviations................................................................................................................ vii1.0 Introduction................................................................................................................................... 1.1
1.1 The Problem ......................................................................................................................... 1.11.2 Proposed Solutions ............................................................................................................... 1.2
1.2.1 Apatite Sequestration ................................................................................................ 1.21.2.2 Phytoextraction.......................................................................................................... 1.2
2.0 Materials and Methods ................................................................................................................. 2.12.1 Plant Culture......................................................................................................................... 2.12.2 Field Plot Siting and Construction ....................................................................................... 2.12.3 Harvesting Strategy and Methodology................................................................................. 2.4
2.3.1 2007 ........................................................................................................................... 2.42.3.2 2008 and 2009 ........................................................................................................... 2.5
2.4 Groundwater Sampling ........................................................................................................ 2.52.5 Chemical Analysis................................................................................................................ 2.6
3.0 Results and Discussion ................................................................................................................. 3.13.1 Plant Establishment .............................................................................................................. 3.13.2 Animal Intrusion .................................................................................................................. 3.33.3 Biomass Production.............................................................................................................. 3.5
3.3.1 First Year (2007) ....................................................................................................... 3.53.3.2 Second Year (2008)................................................................................................... 3.73.3.3 Third Year (2009)...................................................................................................... 3.8
3.4 Calcium and Strontium Contents of Plants and Groundwater ............................................. 3.113.5 Tentative Calculations of Phytoextraction Potential ............................................................ 3.13
4.0 Conclusions................................................................................................................................... 4.15.0 Literature Cited............................................................................................................................. 5.1
x
Figures
1.1 Picture of 100-N, and Accompanying 90Sr Activity Graph at Sampling Well Whose Location is Shown by Arrow Along Columbia River Shoreline ................................................ 1.1
1.2 Diagram of Predicted Apatite Permeable Barrier Formation Following Ca-Phosphate/ Citrate Injection Along 100-N Shoreline .................................................................................... 1.3
1.3 Image of 100-NR2 Operating Unit with Potential Phytoextraction Plantings Marked in Yellow; River Bank Looking North Illustrating Possible Width of Plantings............................ 1.4
1.4 Illustration of Typical Sigmoidal Growth Curve for Biological Organisms............................... 1.52.1 One-Meter Long Cuttings of Coyote Willow Following Imbibition of Rootone and
Showing Root Initials; and Single Cutting Showing Root Initials ............................................. 2.12.2 Selected Field Plot Site at 100-K West ....................................................................................... 2.22.3 Plot Enclosure January 2007 Prior to Clearing and Planting ...................................................... 2.32.4 Diagram of Field Treatability Study Placed at 100-K West Shoreline ....................................... 2.32.5 Pounding of Coyote Willow Cuttings into Pre-Drilled Holes; and Planted Cuttings ................. 2.42.6 Harvesting of Coyote Willows; Removing Stems; and Stripping Leaves .................................. 2.53.1 Columbia River Water Outflow from Priest Rapids Dam During 2007, 2008, and 2009 .......... 3.13.2 Field Plot on March 21, 2007...................................................................................................... 3.23.3 Images of Plot Showing Flooding Events on 4-12-07; 6-1-07; 5-22-08; 6-18-08;
and 6-3-09 ................................................................................................................................... 3.23.4 Location of Plants Deceased before October 2009 ..................................................................... 3.33.5 Preparation for Placing the Smaller Mesh Fencing Along the Base of the Large Fence............ 3.43.6 Willow Pine Cone Gall on Coyote Willow at 100-K West Plot ................................................. 3.43.7 Plants at Beginning and End of First Growing Season ............................................................... 3.53.8 Graph Illustrating Growth of Leaves and Stems During the First Growing Season................... 3.63.9 Plants Following Harvest in October 2007 and Left Undisturbed over Winter.......................... 3.63.10 Plot at Beginning of Second Year ............................................................................................... 3.73.11 Plants at an Early Portion and End of Second Growing Season ................................................. 3.73.12 Bar Graph Showing 2008 Harvested Dry Weight of Leaves and Stems at Their
Positions Within the Plot............................................................................................................. 3.83.13 Plants at Beginning and End of Third Growing Season ............................................................. 3.93.14 Total Biomass Production for the Three Years of the Project .................................................... 3.93.15 2009 Biomass by Position Within the Plot, Plot Diagram with Positions Shown in
Relation to River and Three-Dimensional Graph Showing Yield in Relation to Position ......... 3.103.16 Growth Patterns Within the Plot in Dry Matter Accumulation Over the 3 Years ...................... 3.113.17 Diagram of Plot Showing Sites of Groundwater Sampling and [Ca]/[Sr] Ratios at
1.5 m Depth in April of 2008 ...................................................................................................... 3.133.18 Plot of Observed Biomass Produced at the 100-K West Plot for the 3 Years of
Experiment Duration................................................................................................................... 3.14

xi
Table
3.1 Calcium and Sr Contents of Willow Leaves and Stems in µg/g, and Groundwater in mg/L, and Their Corresponding Ratios ........................................................................................ 3.12

1.1
1.0 Introduction
1.1 The Problem
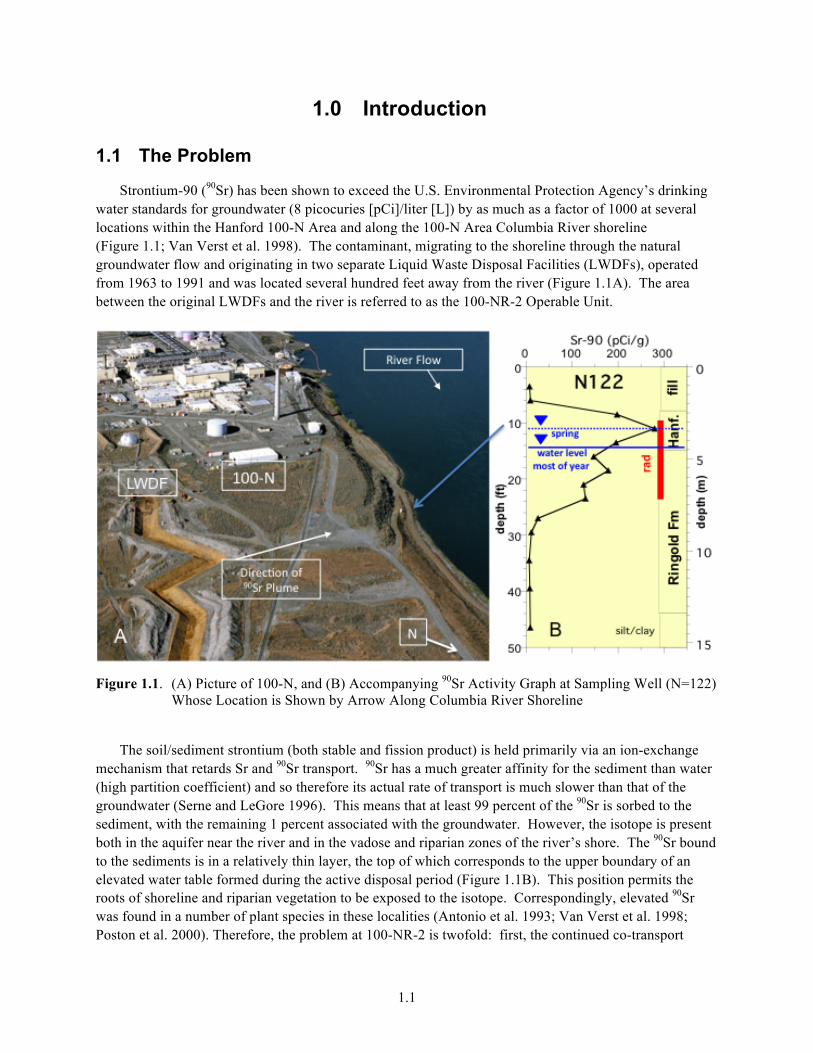
Strontium-90 (90Sr) has been shown to exceed the U.S. Environmental Protection Agency’s drinking water standards for groundwater (8 picocuries [pCi]/liter [L]) by as much as a factor of 1000 at several locations within the Hanford 100-N Area and along the 100-N Area Columbia River shoreline (Figure 1.1; Van Verst et al. 1998). The contaminant, migrating to the shoreline through the natural groundwater flow and originating in two separate Liquid Waste Disposal Facilities (LWDFs), operated from 1963 to 1991 and was located several hundred feet away from the river (Figure 1.1A). The area between the original LWDFs and the river is referred to as the 100-NR-2 Operable Unit.
Figure 1.1. (A) Picture of 100-N, and (B) Accompanying 90Sr Activity Graph at Sampling Well (N=122)
Whose Location is Shown by Arrow Along Columbia River Shoreline
The soil/sediment strontium (both stable and fission product) is held primarily via an ion-exchange
mechanism that retards Sr and 90Sr transport. 90Sr has a much greater affinity for the sediment than water (high partition coefficient) and so therefore its actual rate of transport is much slower than that of the groundwater (Serne and LeGore 1996). This means that at least 99 percent of the 90Sr is sorbed to the sediment, with the remaining 1 percent associated with the groundwater. However, the isotope is present both in the aquifer near the river and in the vadose and riparian zones of the river’s shore. The 90Sr bound to the sediments is in a relatively thin layer, the top of which corresponds to the upper boundary of an elevated water table formed during the active disposal period (Figure 1.1B). This position permits the roots of shoreline and riparian vegetation to be exposed to the isotope. Correspondingly, elevated 90Sr was found in a number of plant species in these localities (Antonio et al. 1993; Van Verst et al. 1998; Poston et al. 2000). Therefore, the problem at 100-NR-2 is twofold: first, the continued co-transport
1.2
movement of 90Sr with the natural groundwater towards the river, and second, the previously transported contaminant now deposited in the subsurface sediment along the shoreline’s riparian zone. While the former possesses a much larger 90Sr inventory potentially to contribute to future groundwater, the latter is presently exposed to biota and possible river erosion.
1.2 Proposed Solutions
The U.S. Department of Energy (DOE) Richland Operations is evaluating remedial technologies and addressing issues to develop a final remediation approach for remediation of 90Sr at the 100-N Area. An Innovative Technology and Remediation Demonstration (ITRD) review process for the 100-N Area identified technologies that could be used to remediate 90Sr-contaminated groundwater in the 100-NR-2 Operable Unit. The review evaluated monitored natural attenuation (MNA), a clinoptilolite barrier, phytoremediation, sheet pile/cryogenic barrier, and soil flushing. The ITRD report published at the end of the process identified monitored natural attenuation, reactive barriers (apatite sequestration), and phytoremediation (phytoextraction) as options for further study.
1.2.1 Apatite Sequestration
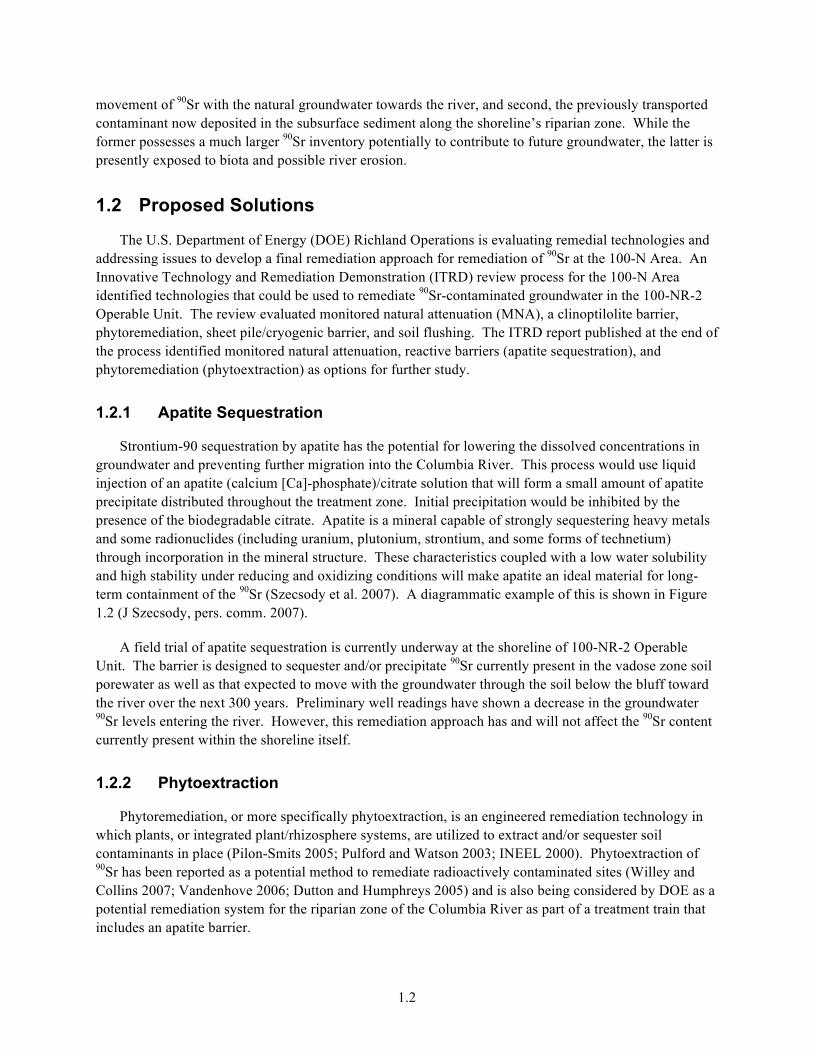
Strontium-90 sequestration by apatite has the potential for lowering the dissolved concentrations in groundwater and preventing further migration into the Columbia River. This process would use liquid injection of an apatite (calcium [Ca]-phosphate)/citrate solution that will form a small amount of apatite precipitate distributed throughout the treatment zone. Initial precipitation would be inhibited by the presence of the biodegradable citrate. Apatite is a mineral capable of strongly sequestering heavy metals and some radionuclides (including uranium, plutonium, strontium, and some forms of technetium) through incorporation in the mineral structure. These characteristics coupled with a low water solubility and high stability under reducing and oxidizing conditions will make apatite an ideal material for long-term containment of the 90Sr (Szecsody et al. 2007). A diagrammatic example of this is shown in Figure 1.2 (J Szecsody, pers. comm. 2007).
A field trial of apatite sequestration is currently underway at the shoreline of 100-NR-2 Operable Unit. The barrier is designed to sequester and/or precipitate 90Sr currently present in the vadose zone soil porewater as well as that expected to move with the groundwater through the soil below the bluff toward the river over the next 300 years. Preliminary well readings have shown a decrease in the groundwater 90Sr levels entering the river. However, this remediation approach has and will not affect the 90Sr content currently present within the shoreline itself.
1.2.2 Phytoextraction
Phytoremediation, or more specifically phytoextraction, is an engineered remediation technology in which plants, or integrated plant/rhizosphere systems, are utilized to extract and/or sequester soil contaminants in place (Pilon-Smits 2005; Pulford and Watson 2003; INEEL 2000). Phytoextraction of 90Sr has been reported as a potential method to remediate radioactively contaminated sites (Willey and Collins 2007; Vandenhove 2006; Dutton and Humphreys 2005) and is also being considered by DOE as a potential remediation system for the riparian zone of the Columbia River as part of a treatment train that includes an apatite barrier.
1.3
Figure 1.2. Diagram of Predicted Apatite Permeable Barrier Formation Following Ca-Phosphate/Citrate
Injection Along 100-N Shoreline . Also Shown is 90Sr-Contaminated Riparian Zone.
1.2.2.1 Placement
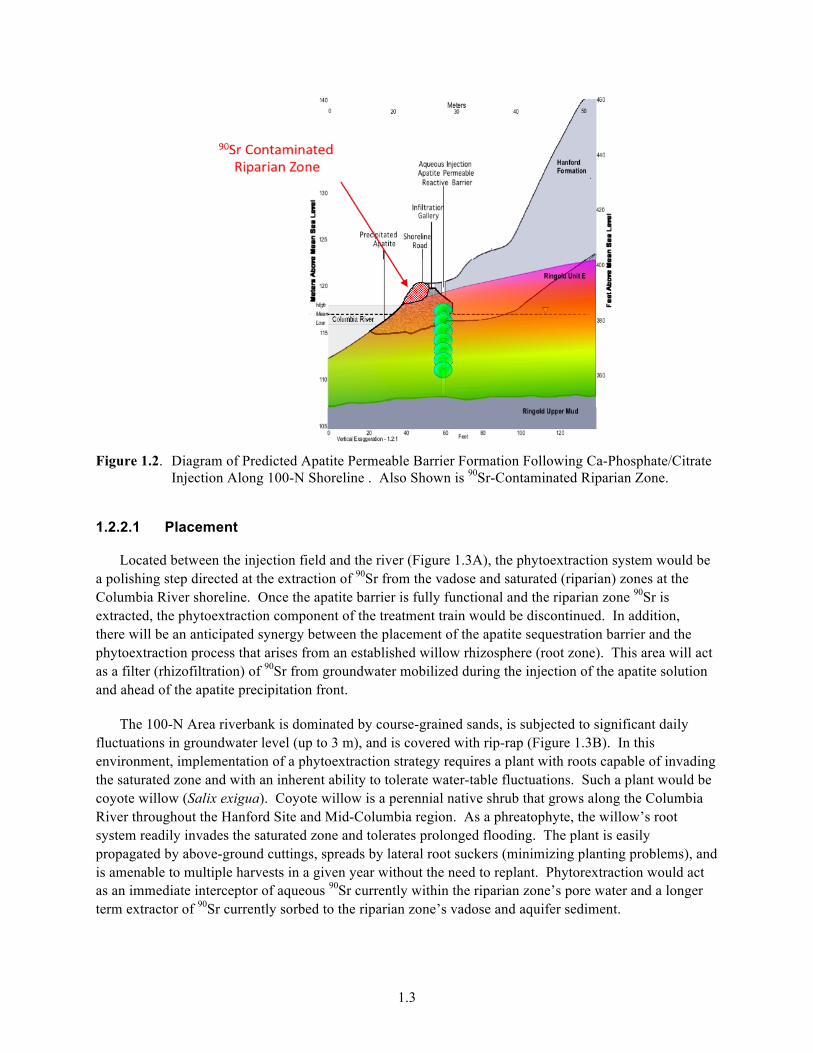
Located between the injection field and the river (Figure 1.3A), the phytoextraction system would be a polishing step directed at the extraction of 90Sr from the vadose and saturated (riparian) zones at the Columbia River shoreline. Once the apatite barrier is fully functional and the riparian zone 90Sr is extracted, the phytoextraction component of the treatment train would be discontinued. In addition, there will be an anticipated synergy between the placement of the apatite sequestration barrier and the phytoextraction process that arises from an established willow rhizosphere (root zone). This area will act as a filter (rhizofiltration) of 90Sr from groundwater mobilized during the injection of the apatite solution and ahead of the apatite precipitation front.
The 100-N Area riverbank is dominated by course-grained sands, is subjected to significant daily fluctuations in groundwater level (up to 3 m), and is covered with rip-rap (Figure 1.3B). In this environment, implementation of a phytoextraction strategy requires a plant with roots capable of invading the saturated zone and with an inherent ability to tolerate water-table fluctuations. Such a plant would be coyote willow (Salix exigua). Coyote willow is a perennial native shrub that grows along the Columbia River throughout the Hanford Site and Mid-Columbia region. As a phreatophyte, the willow’s root system readily invades the saturated zone and tolerates prolonged flooding. The plant is easily propagated by above-ground cuttings, spreads by lateral root suckers (minimizing planting problems), and is amenable to multiple harvests in a given year without the need to replant. Phytorextraction would act as an immediate interceptor of aqueous 90Sr currently within the riparian zone’s pore water and a longer term extractor of 90Sr currently sorbed to the riparian zone’s vadose and aquifer sediment.
1.4
Figure 1.3. (A) Image of 100-NR-2 Operating Unit with Potential Phytoextraction Plantings Marked in
Yellow; (B) River Bank Looking North Illustrating Possible Width of Plantings
1.2.2.2 Requirements for Successful Deployment of Phytoextraction Technology
A successful application of a phytoextraction strategy to remove the 90Sr-contaminant within the riverbank/riparian zone at 100-NR-2, however, would require demonstration of five factors: (1) the ability of plant roots to accumulate Sr at levels much higher than those present in the plant rhizosphere and transport it to other (above-ground) portions of the plant permitting the removal of the contaminant from the shoreline; (2) no discrimination in uptake between molecular Sr and 90Sr; (3) a low probability of herbivore access to the plants and, where access prevention is not possible, a low potential for contaminant bioaccumulation and subsequent food chain transfer; (4) proof that the selected plant species can survive in the diverse environmental conditions that exist on the 100-NR-2 shoreline; and (5) the production of sufficient biomass annually to remove a significant amount of the contaminant within a time span of 10 to 20 years.
Six years of laboratory, greenhouse, and field studies have provided the following information for these requirements.
1. Plant roots share uptake mechanisms for Ca with Sr (Collander 1941; Jacobson and Overstreet 1947, 1948; Francis 1978). Calcium, a plant macronutrient, may account for 0.1 to more than 5.0 percent of a plant’s dry weight, depending on growing conditions and species (Marschner 1995; Buchanan, Gruissem, and Jones 2000). Strontium has no known metabolic function in plants, but its uptake has both a metabolic and passive component (Handly and Overstreet 1963). Hydroponic experiments performed in our greenhouse demonstrated a high correlation (r2= 0.98–0.99) between the [Ca]/[Sr] ratio found in the nutrient solution to that found in the plant (coyote willow; Ainsworth and Fellows 2007). This same observation held true for growth chamber plants grown in shoreline sediment from 100-NR-2.

1.5
2. Growth chamber studies have confirmed that the coyote willow accumulates Sr and 90Sr at the same rate that it accumulates Ca from 100-NR-2 sediment (Ainsworth and Fellows 2007; Fellows, Fruchter, and Driver 2009). Plants grown in the sediment from 100-NR-2 consistently averaged concentration ratios (CRs) of over 70 (Fellows, Fruchter, and Driver 2009). The plant CR, defined as [(pCi 90Sr/g dry wt. of new growth tissue)/(pCi 90Sr/g soil porewater)], is a measure of a plant’s ability to take up (accumulate) Sr in relation to the concentration the root is exposed to in the rhizosphere.
3. Engineered fencing can prevent the intrusion of large and small herbivores into the area where the plants would be grown. Herbivorous insects do have the potential to penetrate most fencing however. Laboratory studies, conducted to date with sucking (aphid), and juvenile to adult (moth larvae) insects have demonstrated insignificant potential for off-site or food-chain transfer of 90Sr from coyote willows growing in 100-NR-2 sediment (Fellows, Fruchter, and Driver 2009).
4. Coyote willow is a recognized component of the vegetation naturally occurring in the riparian zones along the Columbia River in the Hanford Site (Sackschewsky et al. 1992). Unknown is the ability to establish a “managed” (specific number of plants precisely separated in a selected area) stand of the willows on the river’s shore and to show that these can be capable of surviving the daily and seasonal fluctuations in water level that the river routinely undergoes.
5. Also unknown is the ability of this “managed” stand to produce sufficient biomass (dry weight of leaves and stems) over time. Most plant species, and other biological organisms undergo a sigmoidal growth curve (Figure 1.4) which starts with a slow “lag phase” wherein the organism establishes itself in its environment and mobilizes its stored reserves of nutrients to produce the means for subsequent nutrient acquisition (Erickson 1976). This is followed by a rapidly accelerating “logarithmic or exponential” growth phase as the organism explores and exploits its environment. Trees are slower growing perennials and, as such, continue to grow for many years (Erickson 1976). Eventually after several growing seasons, through crowding or shading, the growth rate declines to a steady, lower level. Growth curves of this type have previously been shown for a number of willow species (Kopp et al. 2001).
Figure 1.4. Illustration of Typical Sigmoidal Growth Curve for Biological Organisms

1.6
Given the available laboratory and greenhouse data for the coyote willow, the objectives of this study were three-fold: (1) to demonstrate that a viable, “managed” plot of coyote willows can be established on the shoreline of the Columbia River that would survive the same microenvironment to be encountered at the 100-NR-2 shoreline; (2) to show through engineered barriers that large and small animal herbivores can be prevented from feeding on these plants; and (3) to show that once established, the plants will provide sufficient biomass annually to support the phytoextraction technology.
2.1
2.0 Materials and Methods
This chapter describes the materials used and the experimental procedures followed to establish a viable stand of coyote willows along the Columbia River shoreline and determine their biomass production capability.
2.1 Plant Culture
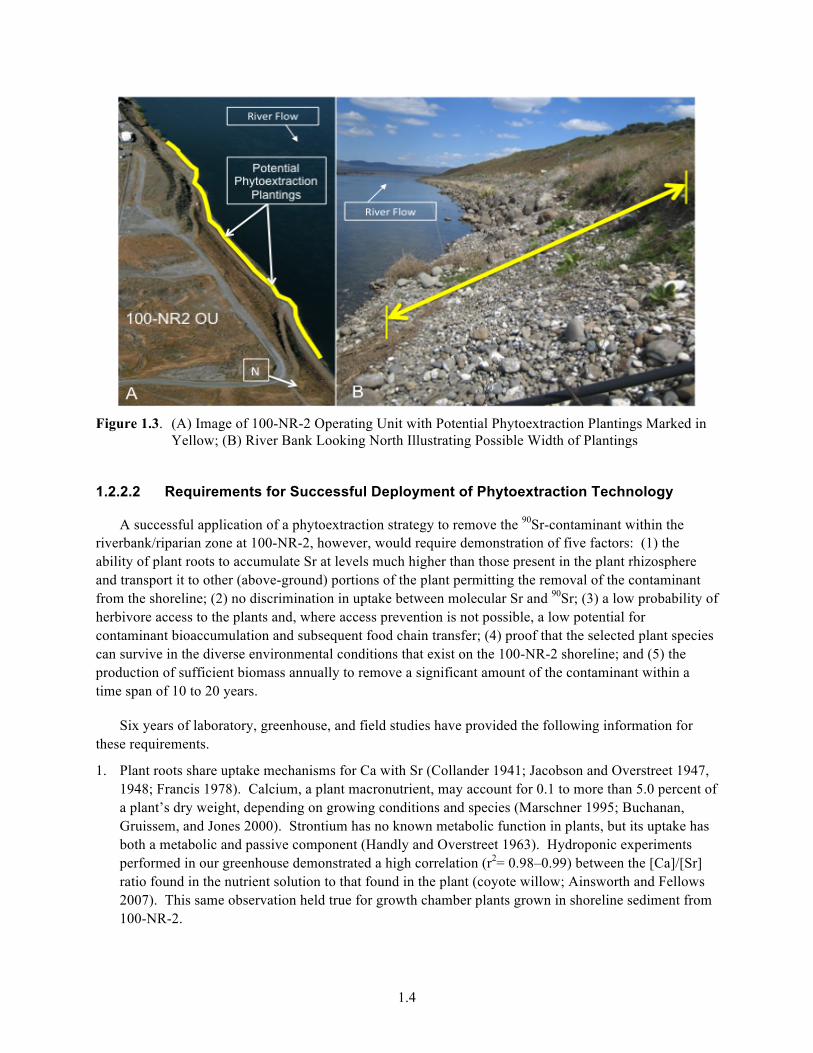
One-meter (m) long stem cuttings of coyote willow were obtained from Wildlands Nursery, Inc., Benton City, WA. All plant stock came from along the Yakima River in Benton County, WA. The cuttings were stored in moistened cloth at 5°C until needed. The lower portion (proximal) of the stems were wetted, dipped in a commercial form of the growth hormone gibberillic acid -3 (GA3) (Rootone®; TechPac LLC, Lexington, KY), and then placed in plastic tray containing 5 L of distilled water (10 centimeters [cm] deep). They were maintained in the greenhouse at 25°C and using ambient light where the cuttings were allowed to initiate shoot and root development (about 10 to 14 days) prior to use (Figure 2.1).
Figure 2.1. (A) One-Meter Long Cuttings of Coyote Willow Following Imbibition of Rootone and
Showing Root Initials; and (B) Single Cutting Showing Root Initials
2.2 Field Plot Siting and Construction
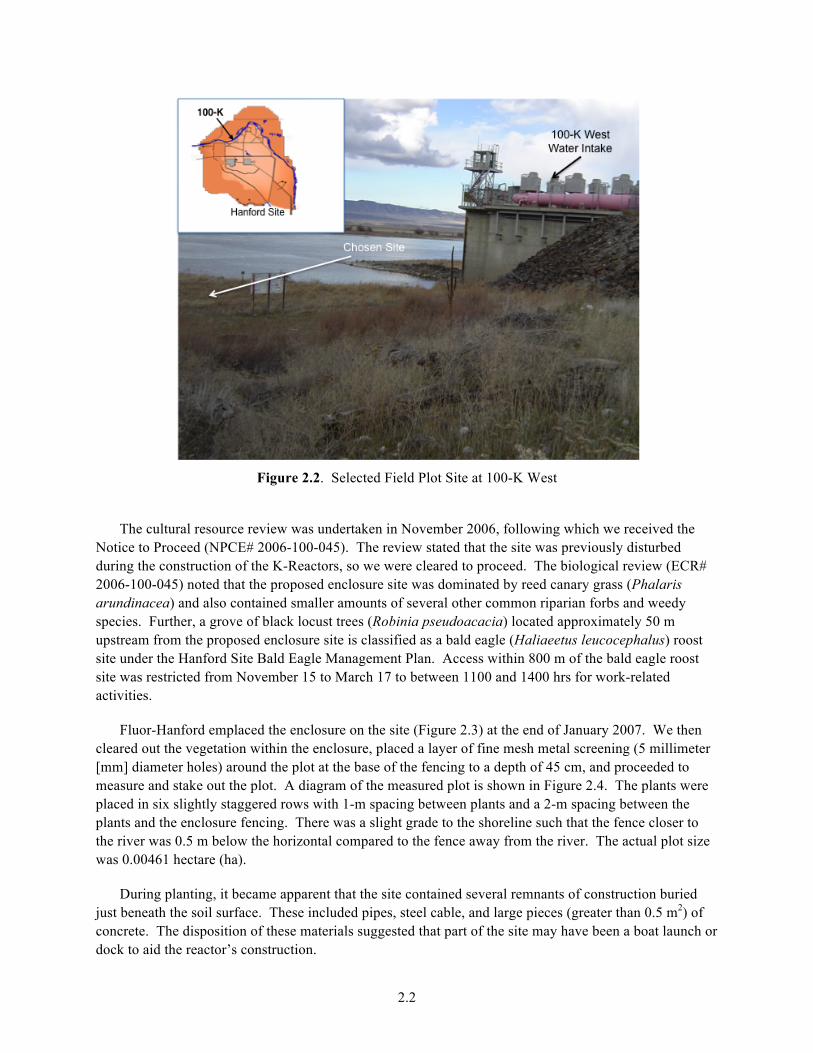
There were three requirements for the siting of the field demonstration plot: (1) it had to be next to the river with sediment composition similar to that found at the 100-NR-2 shore; (2) it could not contain any potential cultural or archeological artifacts; and (3) it could not disturb any ecologically sensitive species or areas. Several locations were considered in the 100-N, 100-D, and 100-B Areas. All were considered sensitive to some extent. The final site considered was in the 100-K Area alongside the western water intake (Figure 2.2).
2.2
Figure 2.2. Selected Field Plot Site at 100-K West
The cultural resource review was undertaken in November 2006, following which we received the
Notice to Proceed (NPCE# 2006-100-045). The review stated that the site was previously disturbed during the construction of the K-Reactors, so we were cleared to proceed. The biological review (ECR# 2006-100-045) noted that the proposed enclosure site was dominated by reed canary grass (Phalaris arundinacea) and also contained smaller amounts of several other common riparian forbs and weedy species. Further, a grove of black locust trees (Robinia pseudoacacia) located approximately 50 m upstream from the proposed enclosure site is classified as a bald eagle (Haliaeetus leucocephalus) roost site under the Hanford Site Bald Eagle Management Plan. Access within 800 m of the bald eagle roost site was restricted from November 15 to March 17 to between 1100 and 1400 hrs for work-related activities.
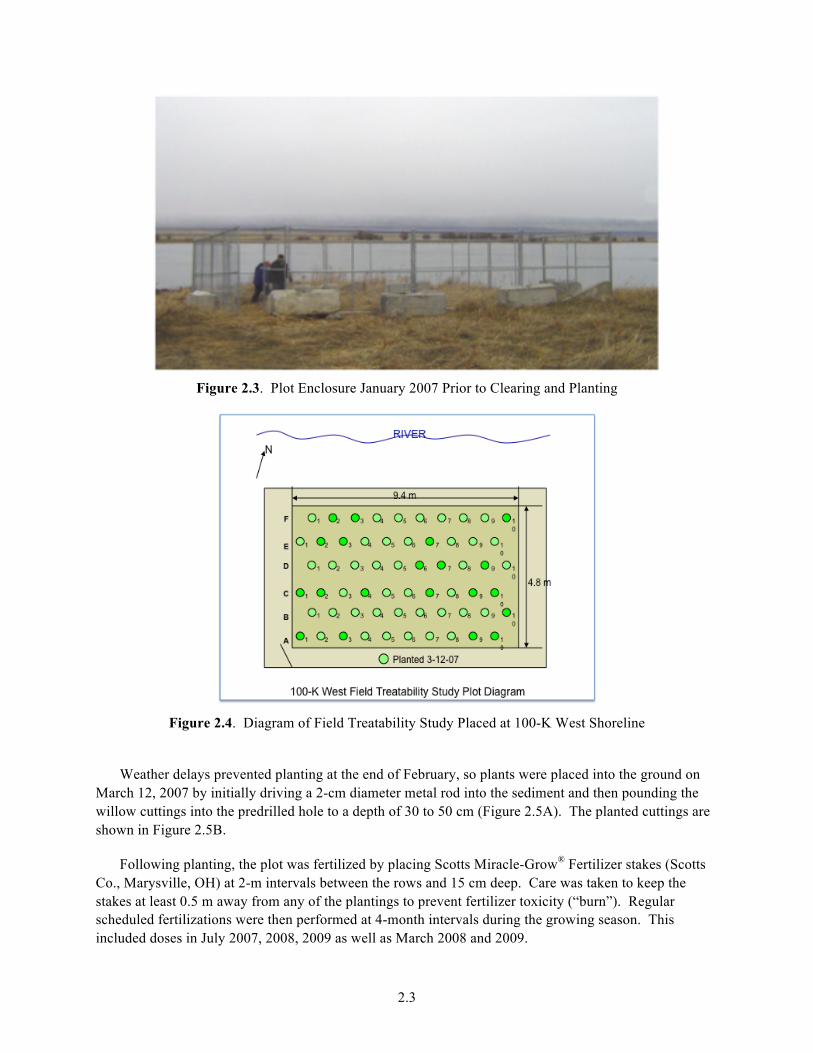
Fluor-Hanford emplaced the enclosure on the site (Figure 2.3) at the end of January 2007. We then cleared out the vegetation within the enclosure, placed a layer of fine mesh metal screening (5 millimeter [mm] diameter holes) around the plot at the base of the fencing to a depth of 45 cm, and proceeded to measure and stake out the plot. A diagram of the measured plot is shown in Figure 2.4. The plants were placed in six slightly staggered rows with 1-m spacing between plants and a 2-m spacing between the plants and the enclosure fencing. There was a slight grade to the shoreline such that the fence closer to the river was 0.5 m below the horizontal compared to the fence away from the river. The actual plot size was 0.00461 hectare (ha).
During planting, it became apparent that the site contained several remnants of construction buried just beneath the soil surface. These included pipes, steel cable, and large pieces (greater than 0.5 m2) of concrete. The disposition of these materials suggested that part of the site may have been a boat launch or dock to aid the reactor’s construction.
2.3
Figure 2.3. Plot Enclosure January 2007 Prior to Clearing and Planting
Figure 2.4. Diagram of Field Treatability Study Placed at 100-K West Shoreline
Weather delays prevented planting at the end of February, so plants were placed into the ground on
March 12, 2007 by initially driving a 2-cm diameter metal rod into the sediment and then pounding the willow cuttings into the predrilled hole to a depth of 30 to 50 cm (Figure 2.5A). The planted cuttings are shown in Figure 2.5B.
Following planting, the plot was fertilized by placing Scotts Miracle-Grow® Fertilizer stakes (Scotts Co., Marysville, OH) at 2-m intervals between the rows and 15 cm deep. Care was taken to keep the stakes at least 0.5 m away from any of the plantings to prevent fertilizer toxicity (“burn”). Regular scheduled fertilizations were then performed at 4-month intervals during the growing season. This included doses in July 2007, 2008, 2009 as well as March 2008 and 2009.
2.4
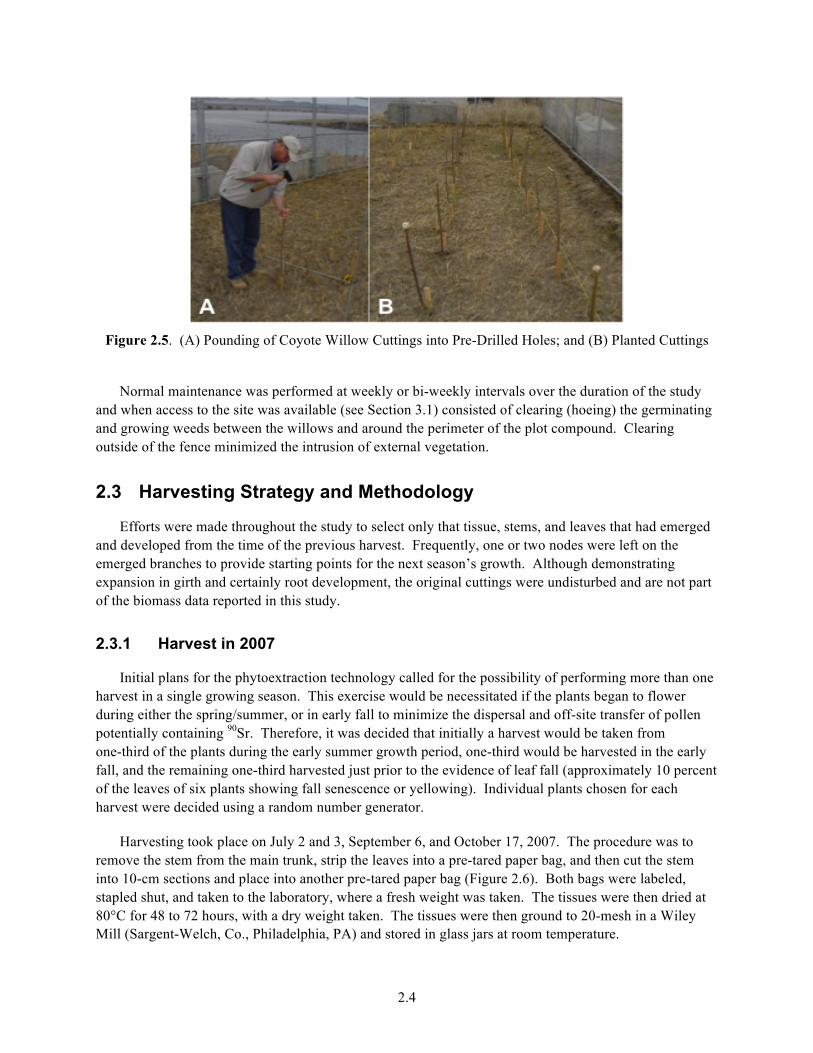
Figure 2.5. (A) Pounding of Coyote Willow Cuttings into Pre-Drilled Holes; and (B) Planted Cuttings
Normal maintenance was performed at weekly or bi-weekly intervals over the duration of the study
and when access to the site was available (see Section 3.1) consisted of clearing (hoeing) the germinating and growing weeds between the willows and around the perimeter of the plot compound. Clearing outside of the fence minimized the intrusion of external vegetation.
2.3 Harvesting Strategy and Methodology
Efforts were made throughout the study to select only that tissue, stems, and leaves that had emerged and developed from the time of the previous harvest. Frequently, one or two nodes were left on the emerged branches to provide starting points for the next season’s growth. Although demonstrating expansion in girth and certainly root development, the original cuttings were undisturbed and are not part of the biomass data reported in this study.
2.3.1 Harvest in 2007
Initial plans for the phytoextraction technology called for the possibility of performing more than one harvest in a single growing season. This exercise would be necessitated if the plants began to flower during either the spring/summer, or in early fall to minimize the dispersal and off-site transfer of pollen potentially containing 90Sr. Therefore, it was decided that initially a harvest would be taken from one-third of the plants during the early summer growth period, one-third would be harvested in the early fall, and the remaining one-third harvested just prior to the evidence of leaf fall (approximately 10 percent of the leaves of six plants showing fall senescence or yellowing). Individual plants chosen for each harvest were decided using a random number generator.
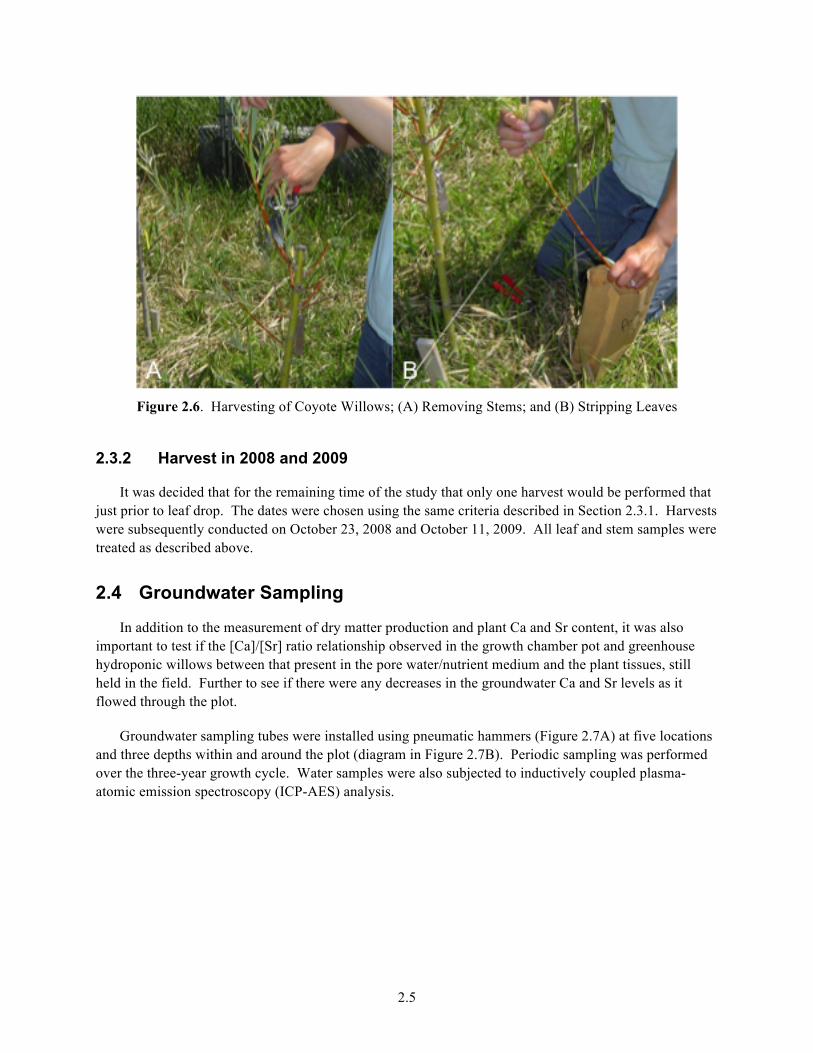
Harvesting took place on July 2 and 3, September 6, and October 17, 2007. The procedure was to remove the stem from the main trunk, strip the leaves into a pre-tared paper bag, and then cut the stem into 10-cm sections and place into another pre-tared paper bag (Figure 2.6). Both bags were labeled, stapled shut, and taken to the laboratory, where a fresh weight was taken. The tissues were then dried at 80°C for 48 to 72 hours, with a dry weight taken. The tissues were then ground to 20-mesh in a Wiley Mill (Sargent-Welch, Co., Philadelphia, PA) and stored in glass jars at room temperature.
2.5
Figure 2.6. Harvesting of Coyote Willows; (A) Removing Stems; and (B) Stripping Leaves
2.3.2 Harvest in 2008 and 2009
It was decided that for the remaining time of the study that only one harvest would be performed that just prior to leaf drop. The dates were chosen using the same criteria described in Section 2.3.1. Harvests were subsequently conducted on October 23, 2008 and October 11, 2009. All leaf and stem samples were treated as described above.
2.4 Groundwater Sampling
In addition to the measurement of dry matter production and plant Ca and Sr content, it was also important to test if the [Ca]/[Sr] ratio relationship observed in the growth chamber pot and greenhouse hydroponic willows between that present in the pore water/nutrient medium and the plant tissues, still held in the field. Further to see if there were any decreases in the groundwater Ca and Sr levels as it flowed through the plot.
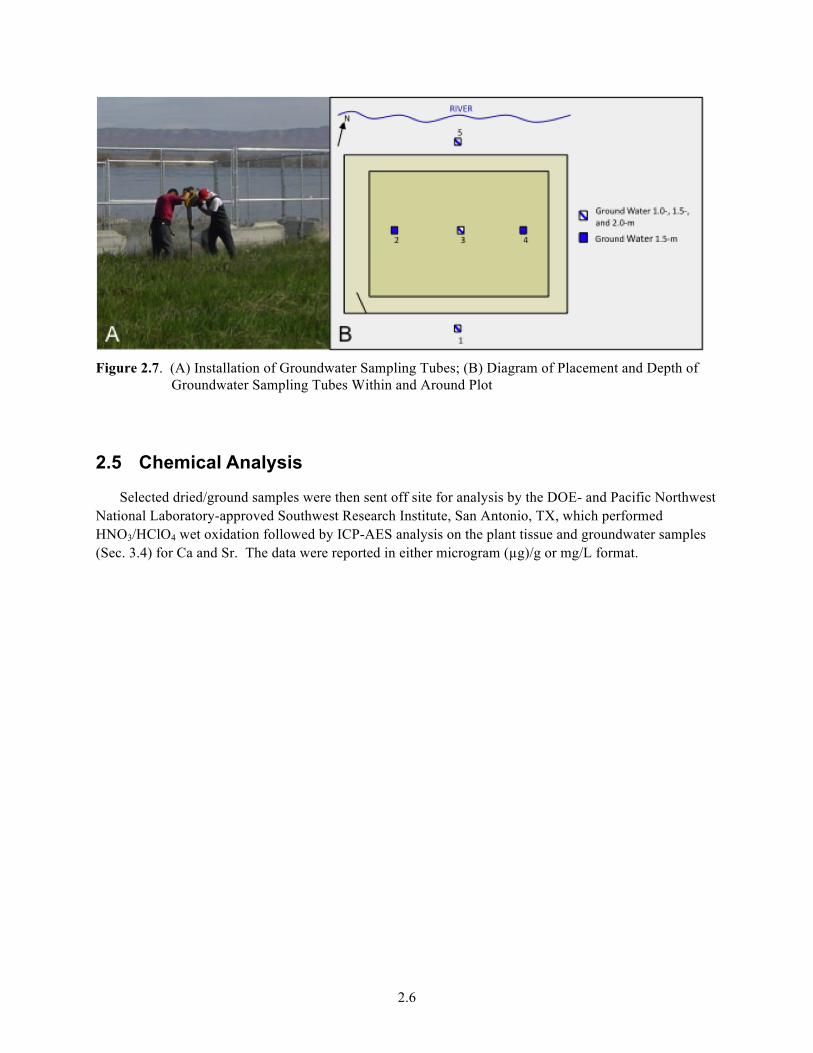
Groundwater sampling tubes were installed using pneumatic hammers (Figure 2.7A) at five locations and three depths within and around the plot (diagram in Figure 2.7B). Periodic sampling was performed over the three-year growth cycle. Water samples were also subjected to inductively coupled plasma-atomic emission spectroscopy (ICP-AES) analysis.
2.6
Figure 2.7. (A) Installation of Groundwater Sampling Tubes; (B) Diagram of Placement and Depth of
Groundwater Sampling Tubes Within and Around Plot
2.5 Chemical Analysis
Selected dried/ground samples were then sent off site for analysis by the DOE- and Pacific Northwest National Laboratory-approved Southwest Research Institute, San Antonio, TX, which performed HNO3/HClO4 wet oxidation followed by ICP-AES analysis on the plant tissue and groundwater samples (Sec. 3.4) for Ca and Sr. The data were reported in either microgram (µg)/g or mg/L format.
3.1
3.0 Results and Discussion
This project was a three-year field treatability study to determine the suitability of coyote willow for use as a phytoextractant of 90Sr from shoreline sediment along the Columbia River. The goals for the study were to show that the willows were adaptable to a managed planting, could be protected from herbivores, and could grow abundant biomass under these conditions.
3.1 Plant Establishment
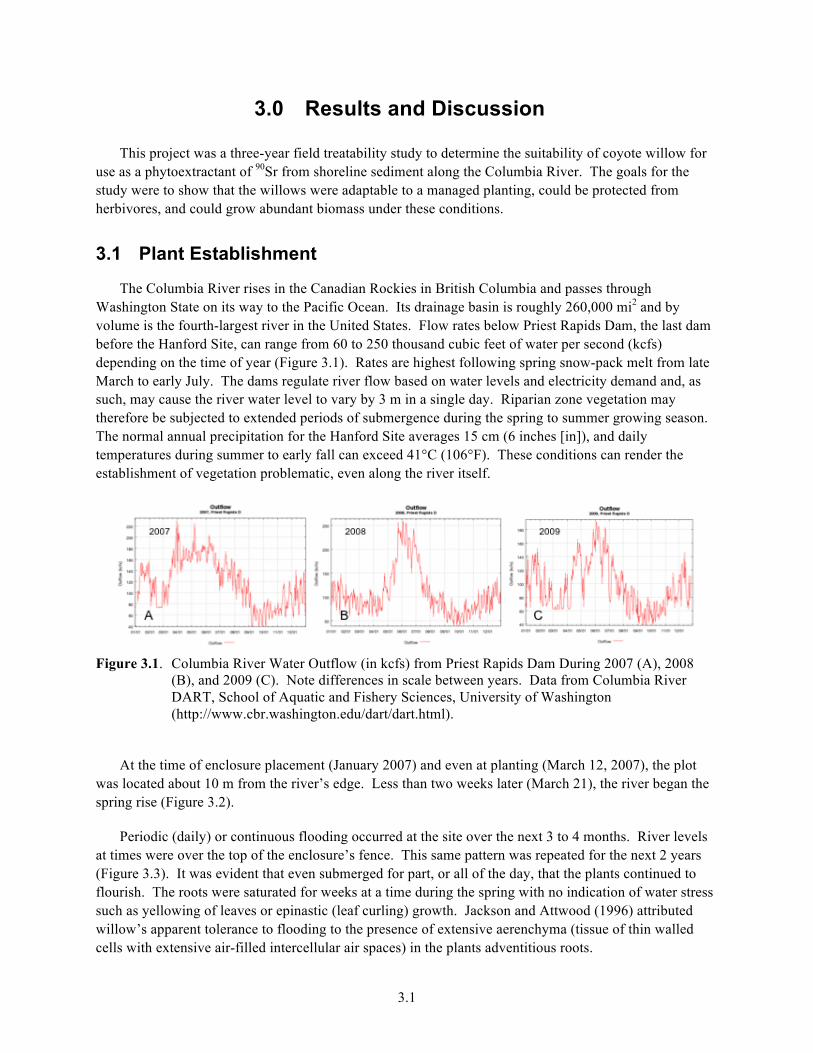
The Columbia River rises in the Canadian Rockies in British Columbia and passes through Washington State on its way to the Pacific Ocean. Its drainage basin is roughly 260,000 mi2 and by volume is the fourth-largest river in the United States. Flow rates below Priest Rapids Dam, the last dam before the Hanford Site, can range from 60 to 250 thousand cubic feet of water per second (kcfs) depending on the time of year (Figure 3.1). Rates are highest following spring snow-pack melt from late March to early July. The dams regulate river flow based on water levels and electricity demand and, as such, may cause the river water level to vary by 3 m in a single day. Riparian zone vegetation may therefore be subjected to extended periods of submergence during the spring to summer growing season. The normal annual precipitation for the Hanford Site averages 15 cm (6 inches [in]), and daily temperatures during summer to early fall can exceed 41°C (106°F). These conditions can render the establishment of vegetation problematic, even along the river itself.
Figure 3.1. Columbia River Water Outflow (in kcfs) from Priest Rapids Dam During 2007 (A), 2008
(B), and 2009 (C). Note differences in scale between years. Data from Columbia River DART, School of Aquatic and Fishery Sciences, University of Washington (http://www.cbr.washington.edu/dart/dart.html).
At the time of enclosure placement (January 2007) and even at planting (March 12, 2007), the plot
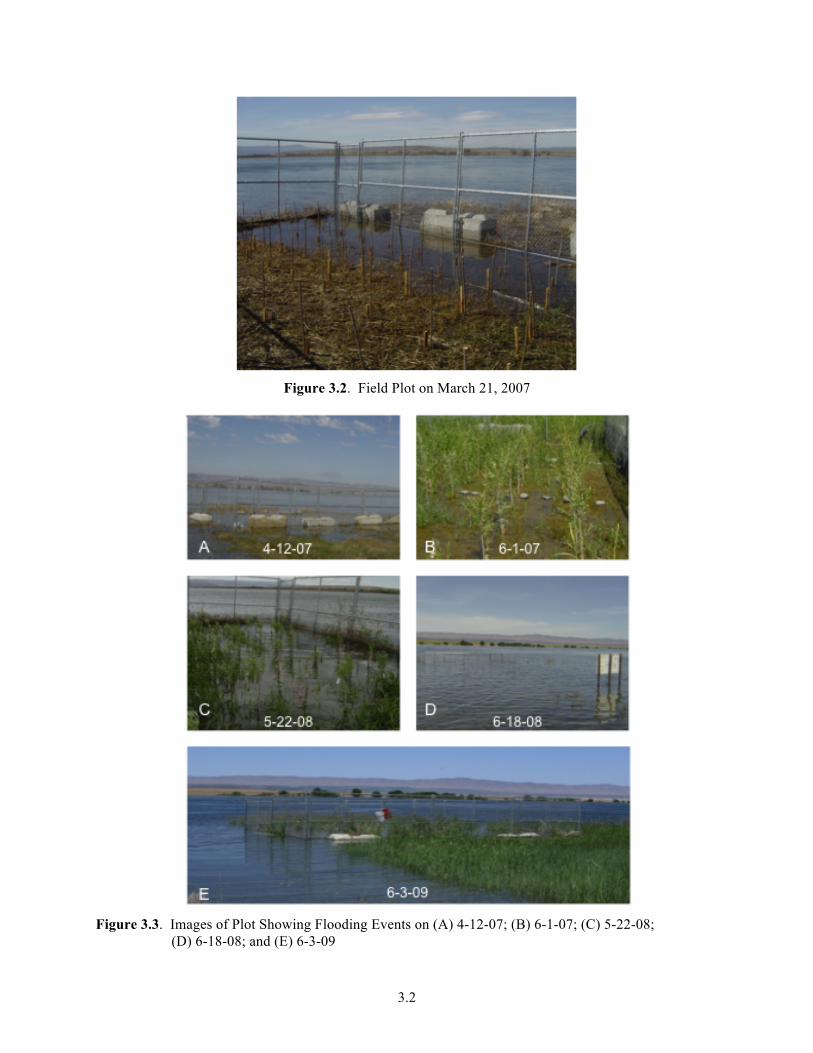
was located about 10 m from the river’s edge. Less than two weeks later (March 21), the river began the spring rise (Figure 3.2).
Periodic (daily) or continuous flooding occurred at the site over the next 3 to 4 months. River levels at times were over the top of the enclosure’s fence. This same pattern was repeated for the next 2 years (Figure 3.3). It was evident that even submerged for part, or all of the day, that the plants continued to flourish. The roots were saturated for weeks at a time during the spring with no indication of water stress such as yellowing of leaves or epinastic (leaf curling) growth. Jackson and Attwood (1996) attributed willow’s apparent tolerance to flooding to the presence of extensive aerenchyma (tissue of thin walled cells with extensive air-filled intercellular air spaces) in the plants adventitious roots.
3.2
Figure 3.2. Field Plot on March 21, 2007
Figure 3.3. Images of Plot Showing Flooding Events on (A) 4-12-07; (B) 6-1-07; (C) 5-22-08;
(D) 6-18-08; and (E) 6-3-09
3.3
Li et al. (2005) have reported that black willow (Salix nigra) cuttings can maintain total photosynthetic capability in partial flooding conditions. Further, partial flooding lowered the root/shoot ratio of dry matter partitioning (more biomass to the shoot).
These observations, plus the fact that there were no uprooted plants during these events, confirm that coyote willows, native to these environs, can be placed in a specific pattern along the shoreline of the Columbia River and will survive and prosper in place.
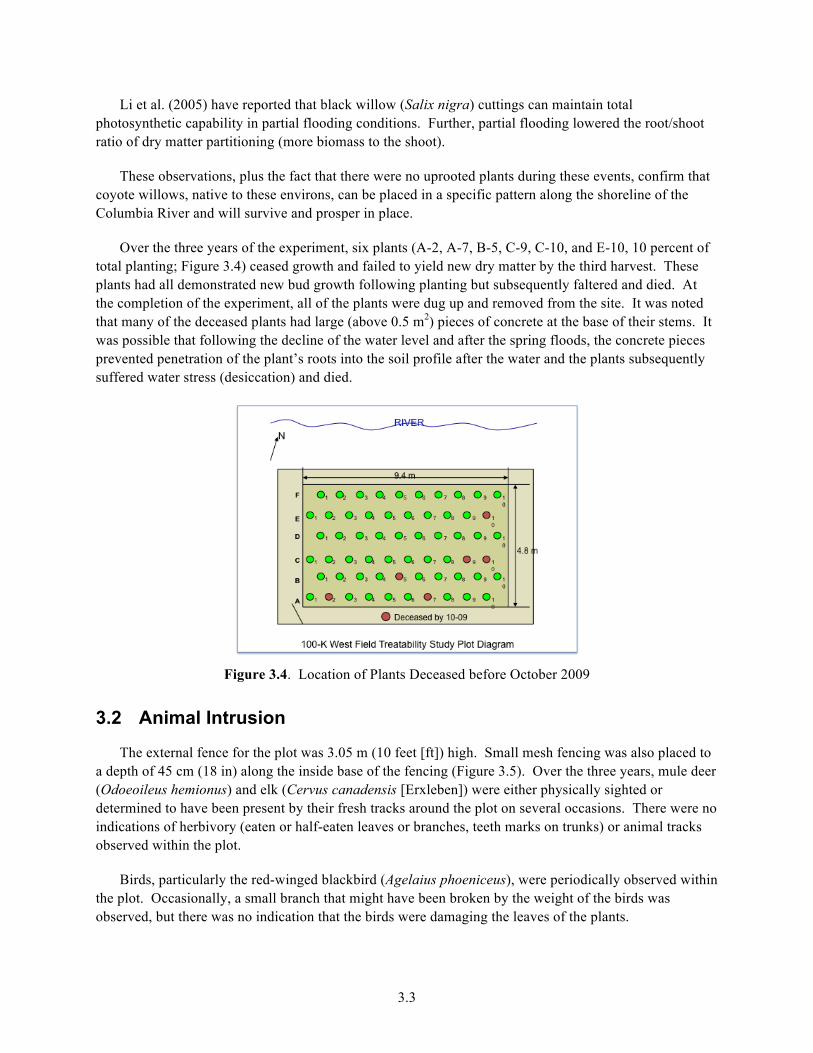
Over the three years of the experiment, six plants (A-2, A-7, B-5, C-9, C-10, and E-10, 10 percent of total planting; Figure 3.4) ceased growth and failed to yield new dry matter by the third harvest. These plants had all demonstrated new bud growth following planting but subsequently faltered and died. At the completion of the experiment, all of the plants were dug up and removed from the site. It was noted that many of the deceased plants had large (above 0.5 m2) pieces of concrete at the base of their stems. It was possible that following the decline of the water level and after the spring floods, the concrete pieces prevented penetration of the plant’s roots into the soil profile after the water and the plants subsequently suffered water stress (desiccation) and died.
Figure 3.4. Location of Plants Deceased before October 2009
3.2 Animal Intrusion
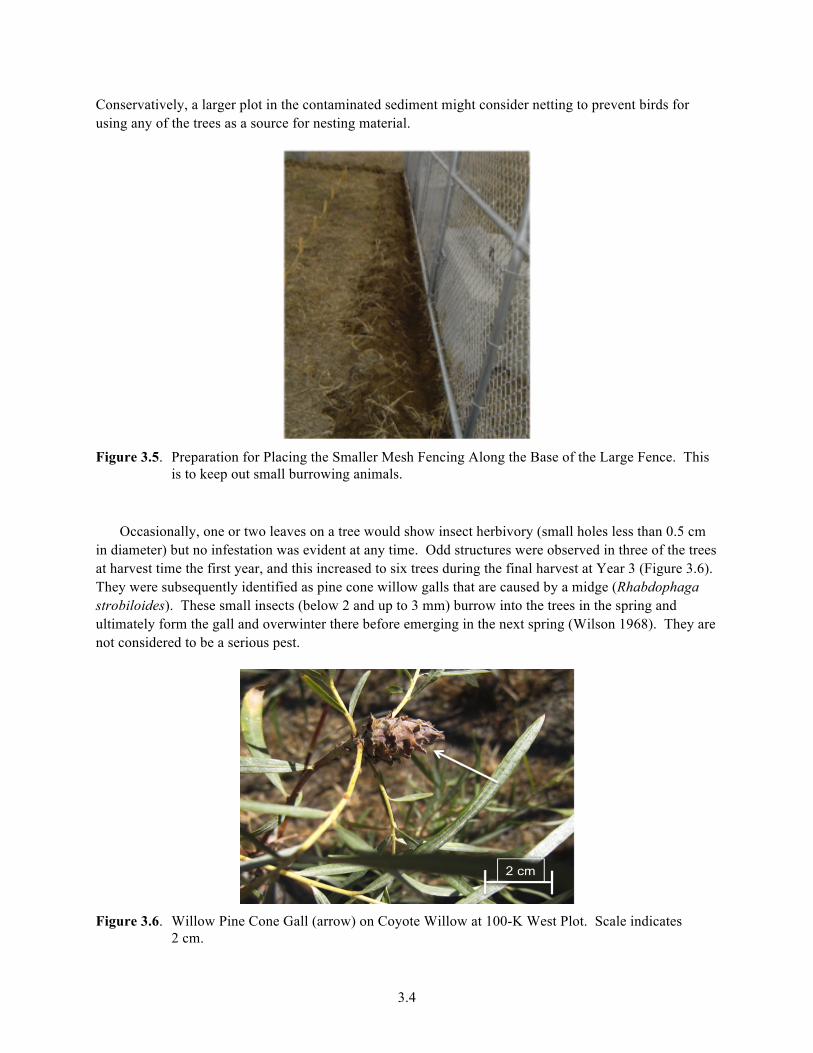
The external fence for the plot was 3.05 m (10 feet [ft]) high. Small mesh fencing was also placed to a depth of 45 cm (18 in) along the inside base of the fencing (Figure 3.5). Over the three years, mule deer (Odoeoileus hemionus) and elk (Cervus canadensis [Erxleben]) were either physically sighted or determined to have been present by their fresh tracks around the plot on several occasions. There were no indications of herbivory (eaten or half-eaten leaves or branches, teeth marks on trunks) or animal tracks observed within the plot.
Birds, particularly the red-winged blackbird (Agelaius phoeniceus), were periodically observed within the plot. Occasionally, a small branch that might have been broken by the weight of the birds was observed, but there was no indication that the birds were damaging the leaves of the plants.
3.4
Conservatively, a larger plot in the contaminated sediment might consider netting to prevent birds for using any of the trees as a source for nesting material.
Figure 3.5. Preparation for Placing the Smaller Mesh Fencing Along the Base of the Large Fence. This
is to keep out small burrowing animals.
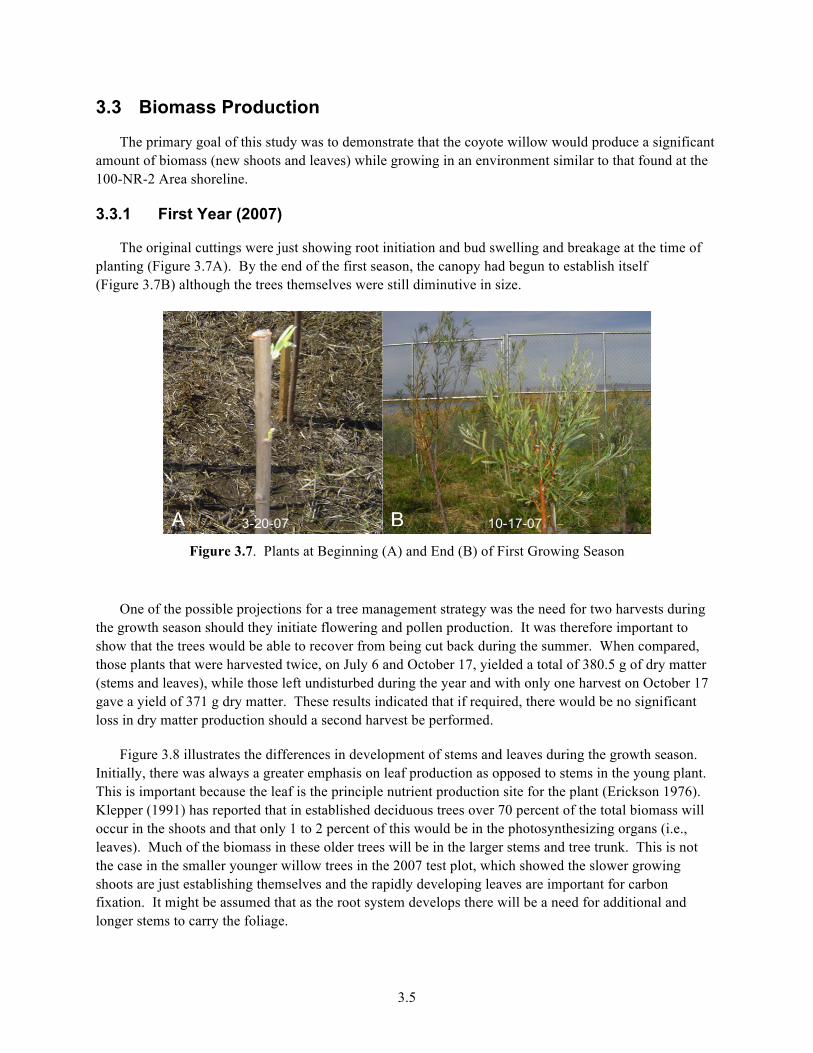
Occasionally, one or two leaves on a tree would show insect herbivory (small holes less than 0.5 cm in diameter) but no infestation was evident at any time. Odd structures were observed in three of the trees at harvest time the first year, and this increased to six trees during the final harvest at Year 3 (Figure 3.6). They were subsequently identified as pine cone willow galls that are caused by a midge (Rhabdophaga strobiloides). These small insects (below 2 and up to 3 mm) burrow into the trees in the spring and ultimately form the gall and overwinter there before emerging in the next spring (Wilson 1968). They are not considered to be a serious pest.
Figure 3.6. Willow Pine Cone Gall (arrow) on Coyote Willow at 100-K West Plot. Scale indicates
2 cm.
3.5
3.3 Biomass Production
The primary goal of this study was to demonstrate that the coyote willow would produce a significant amount of biomass (new shoots and leaves) while growing in an environment similar to that found at the 100-NR-2 Area shoreline.
3.3.1 First Year (2007)
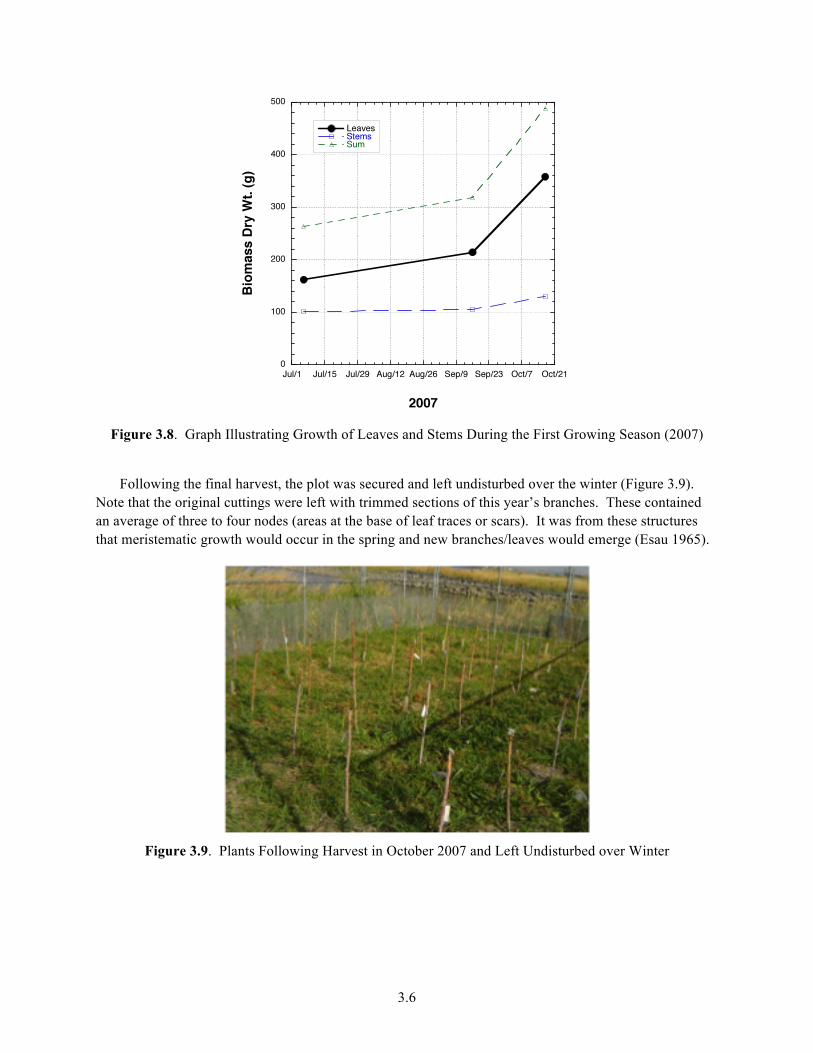
The original cuttings were just showing root initiation and bud swelling and breakage at the time of planting (Figure 3.7A). By the end of the first season, the canopy had begun to establish itself (Figure 3.7B) although the trees themselves were still diminutive in size.
Figure 3.7. Plants at Beginning (A) and End (B) of First Growing Season
One of the possible projections for a tree management strategy was the need for two harvests during the growth season should they initiate flowering and pollen production. It was therefore important to show that the trees would be able to recover from being cut back during the summer. When compared, those plants that were harvested twice, on July 6 and October 17, yielded a total of 380.5 g of dry matter (stems and leaves), while those left undisturbed during the year and with only one harvest on October 17 gave a yield of 371 g dry matter. These results indicated that if required, there would be no significant loss in dry matter production should a second harvest be performed.
Figure 3.8 illustrates the differences in development of stems and leaves during the growth season. Initially, there was always a greater emphasis on leaf production as opposed to stems in the young plant. This is important because the leaf is the principle nutrient production site for the plant (Erickson 1976). Klepper (1991) has reported that in established deciduous trees over 70 percent of the total biomass will occur in the shoots and that only 1 to 2 percent of this would be in the photosynthesizing organs (i.e., leaves). Much of the biomass in these older trees will be in the larger stems and tree trunk. This is not the case in the smaller younger willow trees in the 2007 test plot, which showed the slower growing shoots are just establishing themselves and the rapidly developing leaves are important for carbon fixation. It might be assumed that as the root system develops there will be a need for additional and longer stems to carry the foliage.
3.6
Figure 3.8. Graph Illustrating Growth of Leaves and Stems During the First Growing Season (2007)
Following the final harvest, the plot was secured and left undisturbed over the winter (Figure 3.9).
Note that the original cuttings were left with trimmed sections of this year’s branches. These contained an average of three to four nodes (areas at the base of leaf traces or scars). It was from these structures that meristematic growth would occur in the spring and new branches/leaves would emerge (Esau 1965).
Figure 3.9. Plants Following Harvest in October 2007 and Left Undisturbed over Winter
3.7
3.3.2 Second Year (2008)
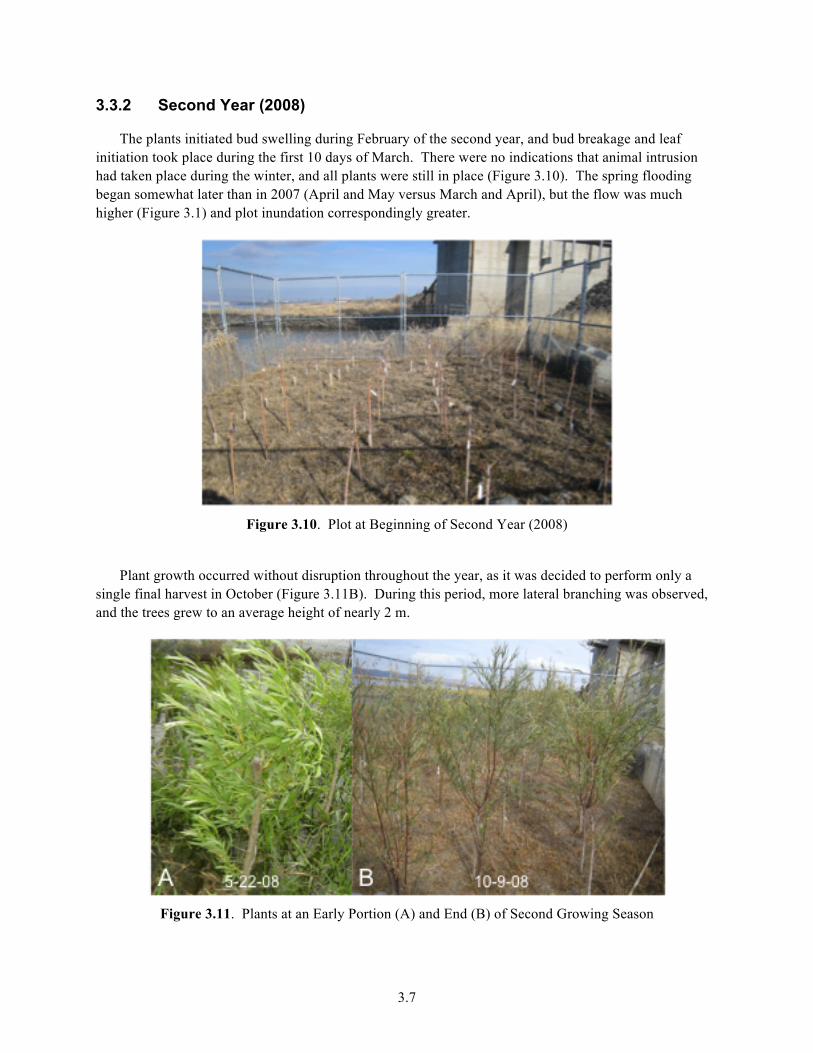
The plants initiated bud swelling during February of the second year, and bud breakage and leaf initiation took place during the first 10 days of March. There were no indications that animal intrusion had taken place during the winter, and all plants were still in place (Figure 3.10). The spring flooding began somewhat later than in 2007 (April and May versus March and April), but the flow was much higher (Figure 3.1) and plot inundation correspondingly greater.
Figure 3.10. Plot at Beginning of Second Year (2008)
Plant growth occurred without disruption throughout the year, as it was decided to perform only a
single final harvest in October (Figure 3.11B). During this period, more lateral branching was observed, and the trees grew to an average height of nearly 2 m.
Figure 3.11. Plants at an Early Portion (A) and End (B) of Second Growing Season
3.8
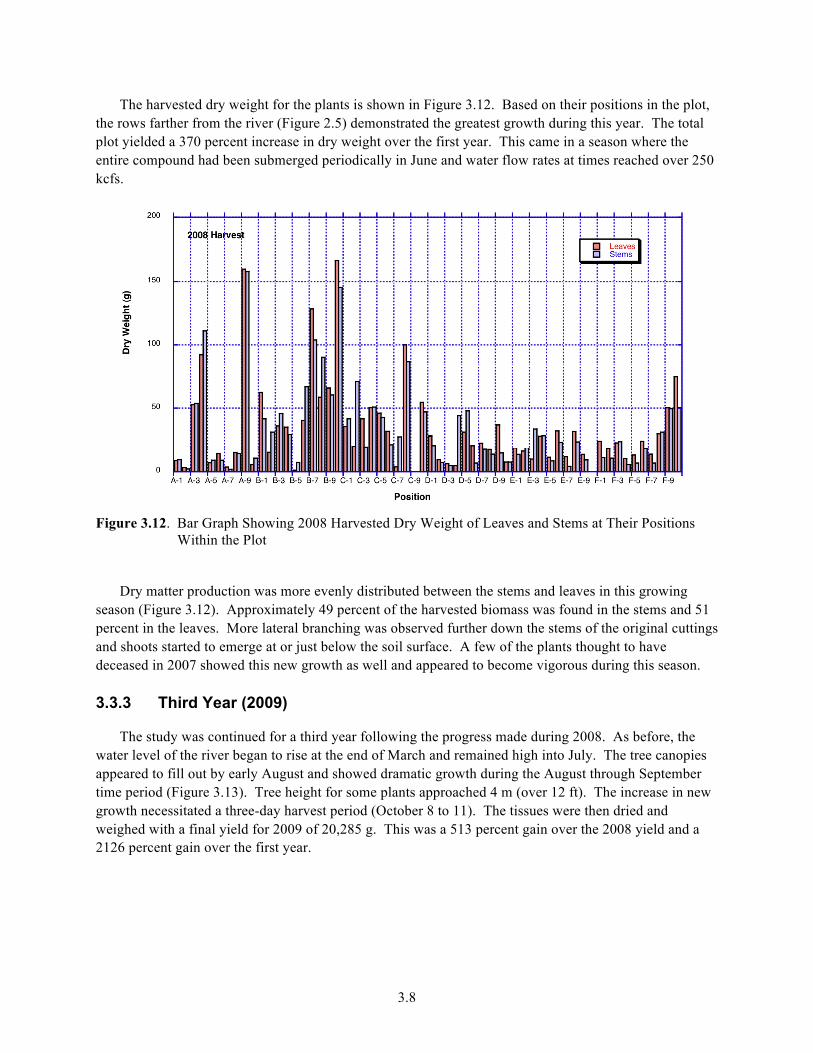
The harvested dry weight for the plants is shown in Figure 3.12. Based on their positions in the plot, the rows farther from the river (Figure 2.5) demonstrated the greatest growth during this year. The total plot yielded a 370 percent increase in dry weight over the first year. This came in a season where the entire compound had been submerged periodically in June and water flow rates at times reached over 250 kcfs.
Figure 3.12. Bar Graph Showing 2008 Harvested Dry Weight of Leaves and Stems at Their Positions
Within the Plot
Dry matter production was more evenly distributed between the stems and leaves in this growing
season (Figure 3.12). Approximately 49 percent of the harvested biomass was found in the stems and 51 percent in the leaves. More lateral branching was observed further down the stems of the original cuttings and shoots started to emerge at or just below the soil surface. A few of the plants thought to have deceased in 2007 showed this new growth as well and appeared to become vigorous during this season.
3.3.3 Third Year (2009)
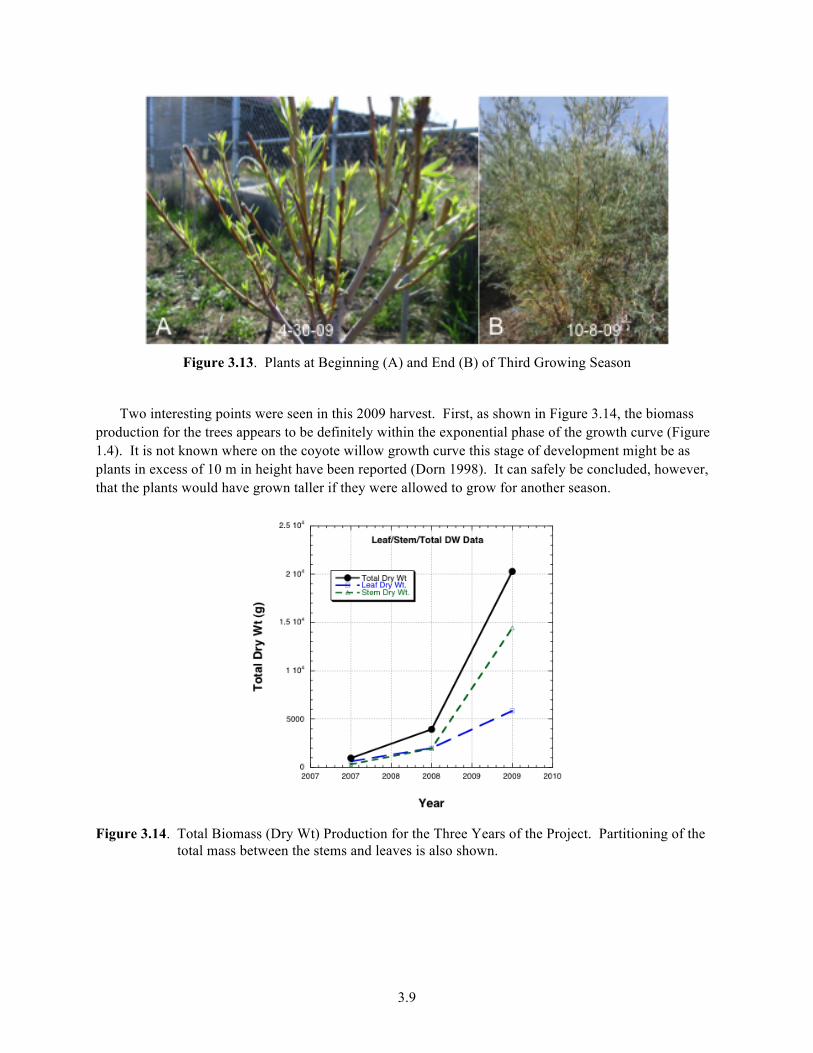
The study was continued for a third year following the progress made during 2008. As before, the water level of the river began to rise at the end of March and remained high into July. The tree canopies appeared to fill out by early August and showed dramatic growth during the August through September time period (Figure 3.13). Tree height for some plants approached 4 m (over 12 ft). The increase in new growth necessitated a three-day harvest period (October 8 to 11). The tissues were then dried and weighed with a final yield for 2009 of 20,285 g. This was a 513 percent gain over the 2008 yield and a 2126 percent gain over the first year.
3.9
Figure 3.13. Plants at Beginning (A) and End (B) of Third Growing Season
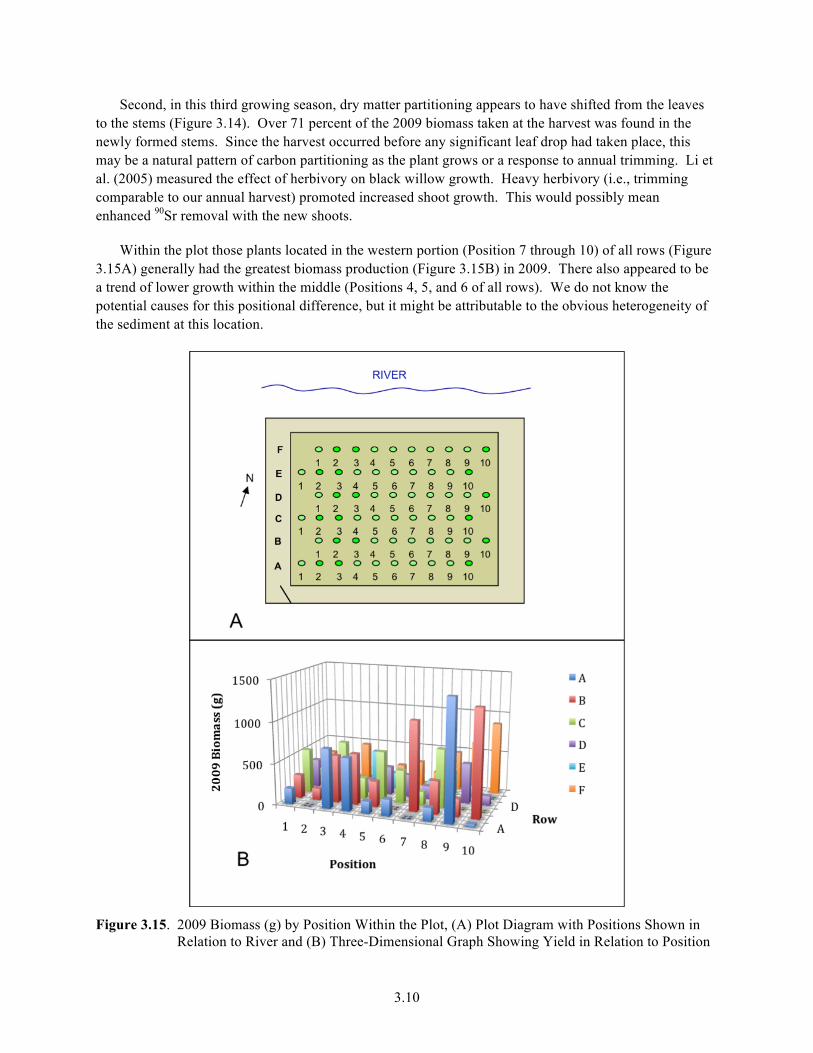
Two interesting points were seen in this 2009 harvest. First, as shown in Figure 3.14, the biomass
production for the trees appears to be definitely within the exponential phase of the growth curve (Figure 1.4). It is not known where on the coyote willow growth curve this stage of development might be as plants in excess of 10 m in height have been reported (Dorn 1998). It can safely be concluded, however, that the plants would have grown taller if they were allowed to grow for another season.
Figure 3.14. Total Biomass (Dry Wt) Production for the Three Years of the Project. Partitioning of the
total mass between the stems and leaves is also shown.
3.10
Second, in this third growing season, dry matter partitioning appears to have shifted from the leaves to the stems (Figure 3.14). Over 71 percent of the 2009 biomass taken at the harvest was found in the newly formed stems. Since the harvest occurred before any significant leaf drop had taken place, this may be a natural pattern of carbon partitioning as the plant grows or a response to annual trimming. Li et al. (2005) measured the effect of herbivory on black willow growth. Heavy herbivory (i.e., trimming comparable to our annual harvest) promoted increased shoot growth. This would possibly mean enhanced 90Sr removal with the new shoots.
Within the plot those plants located in the western portion (Position 7 through 10) of all rows (Figure 3.15A) generally had the greatest biomass production (Figure 3.15B) in 2009. There also appeared to be a trend of lower growth within the middle (Positions 4, 5, and 6 of all rows). We do not know the potential causes for this positional difference, but it might be attributable to the obvious heterogeneity of the sediment at this location.
Figure 3.15. 2009 Biomass (g) by Position Within the Plot, (A) Plot Diagram with Positions Shown in
Relation to River and (B) Three-Dimensional Graph Showing Yield in Relation to Position
3.11
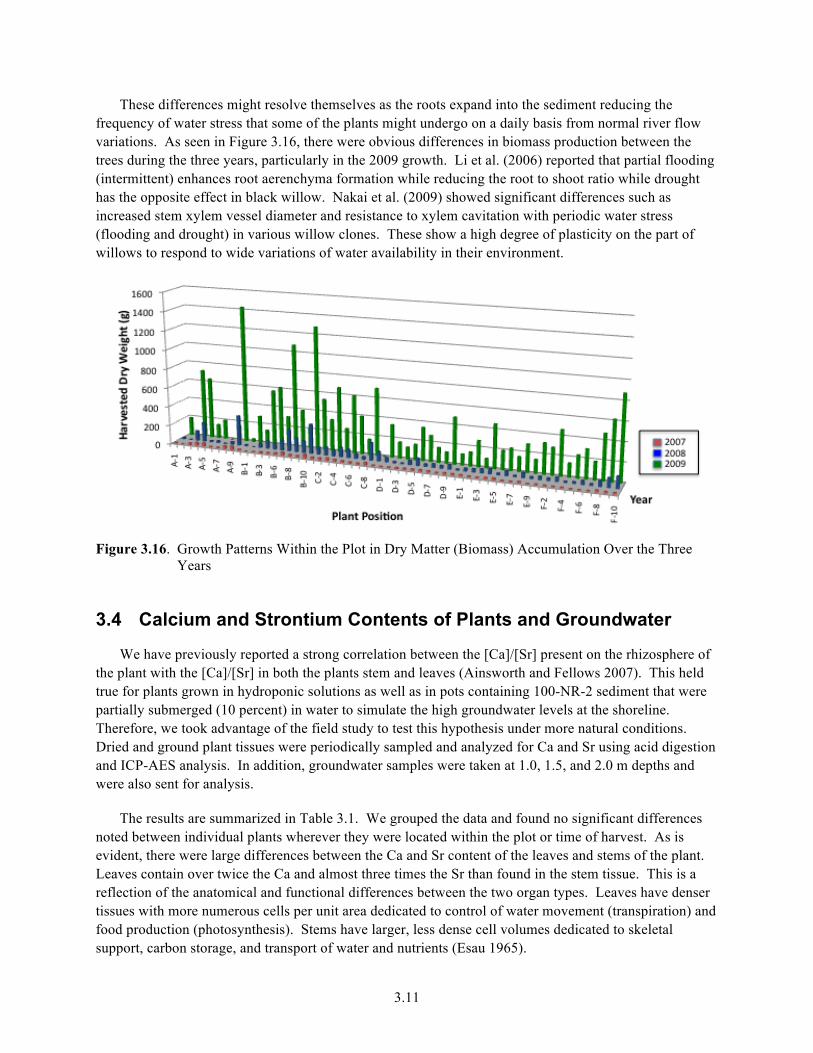
These differences might resolve themselves as the roots expand into the sediment reducing the frequency of water stress that some of the plants might undergo on a daily basis from normal river flow variations. As seen in Figure 3.16, there were obvious differences in biomass production between the trees during the three years, particularly in the 2009 growth. Li et al. (2006) reported that partial flooding (intermittent) enhances root aerenchyma formation while reducing the root to shoot ratio while drought has the opposite effect in black willow. Nakai et al. (2009) showed significant differences such as increased stem xylem vessel diameter and resistance to xylem cavitation with periodic water stress (flooding and drought) in various willow clones. These show a high degree of plasticity on the part of willows to respond to wide variations of water availability in their environment.
Figure 3.16. Growth Patterns Within the Plot in Dry Matter (Biomass) Accumulation Over the Three
Years
3.4 Calcium and Strontium Contents of Plants and Groundwater
We have previously reported a strong correlation between the [Ca]/[Sr] present on the rhizosphere of the plant with the [Ca]/[Sr] in both the plants stem and leaves (Ainsworth and Fellows 2007). This held true for plants grown in hydroponic solutions as well as in pots containing 100-NR-2 sediment that were partially submerged (10 percent) in water to simulate the high groundwater levels at the shoreline. Therefore, we took advantage of the field study to test this hypothesis under more natural conditions. Dried and ground plant tissues were periodically sampled and analyzed for Ca and Sr using acid digestion and ICP-AES analysis. In addition, groundwater samples were taken at 1.0, 1.5, and 2.0 m depths and were also sent for analysis.
The results are summarized in Table 3.1. We grouped the data and found no significant differences noted between individual plants wherever they were located within the plot or time of harvest. As is evident, there were large differences between the Ca and Sr content of the leaves and stems of the plant. Leaves contain over twice the Ca and almost three times the Sr than found in the stem tissue. This is a reflection of the anatomical and functional differences between the two organ types. Leaves have denser tissues with more numerous cells per unit area dedicated to control of water movement (transpiration) and food production (photosynthesis). Stems have larger, less dense cell volumes dedicated to skeletal support, carbon storage, and transport of water and nutrients (Esau 1965).
3.12
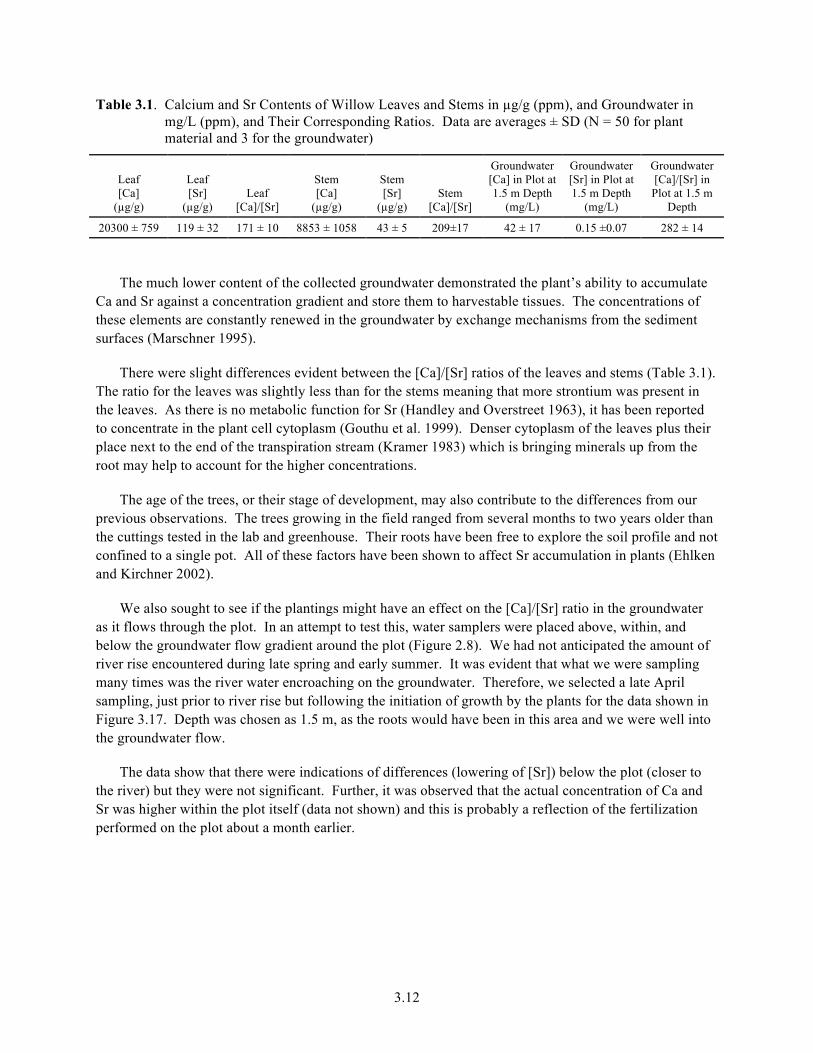
Table 3.1. Calcium and Sr Contents of Willow Leaves and Stems in µg/g (ppm), and Groundwater in mg/L (ppm), and Their Corresponding Ratios. Data are averages ± SD (N = 50 for plant material and 3 for the groundwater)
Leaf [Ca]
(µg/g)
Leaf [Sr]
(µg/g) Leaf
[Ca]/[Sr]
Stem [Ca]
(µg/g)
Stem [Sr]
(µg/g) Stem
[Ca]/[Sr]
Groundwater [Ca] in Plot at 1.5 m Depth
(mg/L)
Groundwater [Sr] in Plot at 1.5 m Depth
(mg/L)
Groundwater [Ca]/[Sr] in Plot at 1.5 m
Depth
20300 ± 759 119 ± 32 171 ± 10 8853 ± 1058 43 ± 5 209±17 42 ± 17 0.15 ±0.07 282 ± 14
The much lower content of the collected groundwater demonstrated the plant’s ability to accumulate Ca and Sr against a concentration gradient and store them to harvestable tissues. The concentrations of these elements are constantly renewed in the groundwater by exchange mechanisms from the sediment surfaces (Marschner 1995).
There were slight differences evident between the [Ca]/[Sr] ratios of the leaves and stems (Table 3.1). The ratio for the leaves was slightly less than for the stems meaning that more strontium was present in the leaves. As there is no metabolic function for Sr (Handley and Overstreet 1963), it has been reported to concentrate in the plant cell cytoplasm (Gouthu et al. 1999). Denser cytoplasm of the leaves plus their place next to the end of the transpiration stream (Kramer 1983) which is bringing minerals up from the root may help to account for the higher concentrations.
The age of the trees, or their stage of development, may also contribute to the differences from our previous observations. The trees growing in the field ranged from several months to two years older than the cuttings tested in the lab and greenhouse. Their roots have been free to explore the soil profile and not confined to a single pot. All of these factors have been shown to affect Sr accumulation in plants (Ehlken and Kirchner 2002).
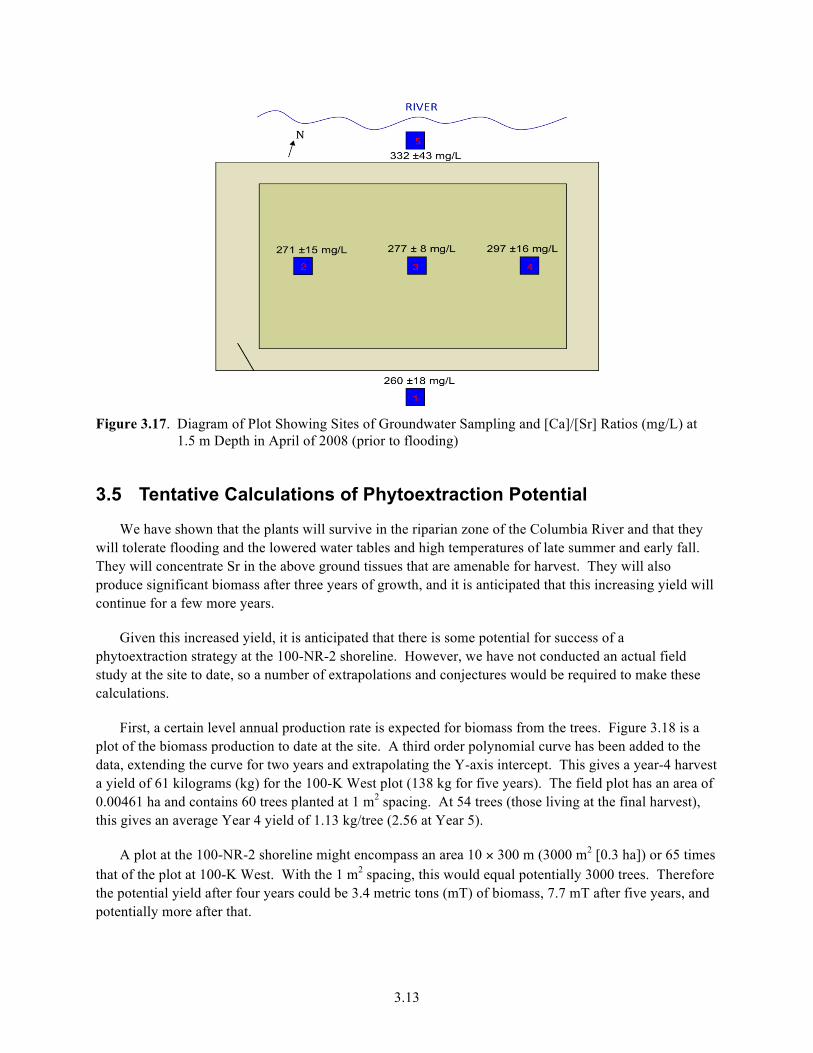
We also sought to see if the plantings might have an effect on the [Ca]/[Sr] ratio in the groundwater as it flows through the plot. In an attempt to test this, water samplers were placed above, within, and below the groundwater flow gradient around the plot (Figure 2.8). We had not anticipated the amount of river rise encountered during late spring and early summer. It was evident that what we were sampling many times was the river water encroaching on the groundwater. Therefore, we selected a late April sampling, just prior to river rise but following the initiation of growth by the plants for the data shown in Figure 3.17. Depth was chosen as 1.5 m, as the roots would have been in this area and we were well into the groundwater flow.
The data show that there were indications of differences (lowering of [Sr]) below the plot (closer to the river) but they were not significant. Further, it was observed that the actual concentration of Ca and Sr was higher within the plot itself (data not shown) and this is probably a reflection of the fertilization performed on the plot about a month earlier.
3.13
Figure 3.17. Diagram of Plot Showing Sites of Groundwater Sampling and [Ca]/[Sr] Ratios (mg/L) at
1.5 m Depth in April of 2008 (prior to flooding)
3.5 Tentative Calculations of Phytoextraction Potential
We have shown that the plants will survive in the riparian zone of the Columbia River and that they will tolerate flooding and the lowered water tables and high temperatures of late summer and early fall. They will concentrate Sr in the above ground tissues that are amenable for harvest. They will also produce significant biomass after three years of growth, and it is anticipated that this increasing yield will continue for a few more years.
Given this increased yield, it is anticipated that there is some potential for success of a phytoextraction strategy at the 100-NR-2 shoreline. However, we have not conducted an actual field study at the site to date, so a number of extrapolations and conjectures would be required to make these calculations.
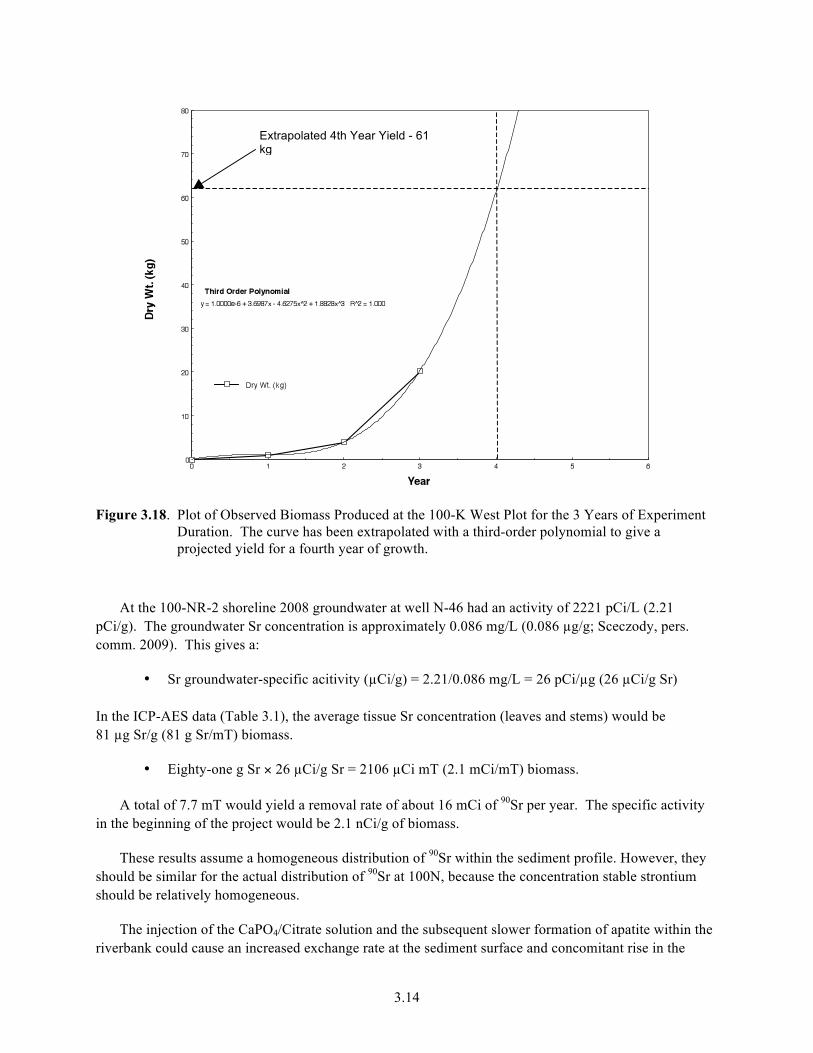
First, a certain level annual production rate is expected for biomass from the trees. Figure 3.18 is a plot of the biomass production to date at the site. A third order polynomial curve has been added to the data, extending the curve for two years and extrapolating the Y-axis intercept. This gives a year-4 harvest a yield of 61 kilograms (kg) for the 100-K West plot (138 kg for five years). The field plot has an area of 0.00461 ha and contains 60 trees planted at 1 m2 spacing. At 54 trees (those living at the final harvest), this gives an average Year 4 yield of 1.13 kg/tree (2.56 at Year 5).
A plot at the 100-NR-2 shoreline might encompass an area 10 × 300 m (3000 m2 [0.3 ha]) or 65 times that of the plot at 100-K West. With the 1 m2 spacing, this would equal potentially 3000 trees. Therefore the potential yield after four years could be 3.4 metric tons (mT) of biomass, 7.7 mT after five years, and potentially more after that.
3.14
Figure 3.18. Plot of Observed Biomass Produced at the 100-K West Plot for the 3 Years of Experiment Duration. The curve has been extrapolated with a third-order polynomial to give a projected yield for a fourth year of growth.
At the 100-NR-2 shoreline 2008 groundwater at well N-46 had an activity of 2221 pCi/L (2.21 pCi/g). The groundwater Sr concentration is approximately 0.086 mg/L (0.086 µg/g; Sceczody, pers. comm. 2009). This gives a:
• Sr groundwater-specific acitivity (µCi/g) = 2.21/0.086 mg/L = 26 pCi/µg (26 µCi/g Sr) In the ICP-AES data (Table 3.1), the average tissue Sr concentration (leaves and stems) would be 81 µg Sr/g (81 g Sr/mT) biomass.
• Eighty-one g Sr × 26 µCi/g Sr = 2106 µCi mT (2.1 mCi/mT) biomass.
A total of 7.7 mT would yield a removal rate of about 16 mCi of 90Sr per year. The specific activity in the beginning of the project would be 2.1 nCi/g of biomass.
These results assume a homogeneous distribution of 90Sr within the sediment profile. However, they should be similar for the actual distribution of 90Sr at 100N, because the concentration stable strontium should be relatively homogeneous.
The injection of the CaPO4/Citrate solution and the subsequent slower formation of apatite within the riverbank could cause an increased exchange rate at the sediment surface and concomitant rise in the
Extrapolated 4th Year Yield - 61 kg

3.15
concentration of free Sr within the sediment porewater. Seasonal increases in the river level also raise the concentrations of 90Sr dissolved in the groundwater. White (2001) has shown that much of the Ca, and therefore Sr, uptake by plants is apoplastic. This means that the material enters the plant’s xylem stream passively and the rate is dependent on the porewater concentration itself. An increase in the Sr and Ca porewater content will mean the plants will have a higher tissue content which will mean a higher extraction rate and a shorter time period to remove the contaminant. An actual field test at the 100N site is recommended in order to refine the numbers and ascertain the effect from the apatite work.


4.1
4.0 Conclusions
Strontium-90 is a fission product of uranium processing for the production of plutonium. As a result of over 20 years (1962 to 1986) of operations and waste management, nearly 3000 Ci of 90Sr were discharged to liquid waste disposal facilities at the Hanford Site’s 100-N Area. These discharges have impacted the groundwater and, through passive movement with the groundwater flow, the Columbia River shoreline and the river itself.
Currently, DOE has commenced an aggressive endeavor to protect the environment along the river. This effort includes the prevention of further 90Sr transport through the groundwater using a permeable apatite barrier to immobilize the 90Sr. In addition the use of coyote willows, a plant native to the Hanford Site, is being considered as a means to phytoextract 90Sr deposited in the sediment along the river’s riparian zone at the 100-NR-2 shoreline.
The coyote willow does not discriminate between Ca and Sr (or Sr and 90Sr); hence, the amount of 90Sr it will remove during a growing season or multiple growing seasons can be related to the amount of Ca needed to produce new biomass as it grows annually. It was therefore important to show that the plant could be managed and thrive under the conditions that occur in the river’s riparian zone. A three-year field treatability study was undertaken to determine the biomass production potential of the willow. The results have indicated the following:
• After locating a suitable site just upstream of the 100-K West water intake and placing protective fencing around the plot, 60 willow cuttings were planted and fertilized in March 2007.
• The trees survived and thrived under multiple flooding events during the late spring and early summer for three years. These events included total immersion for multiple days. No plants were uprooted or displaced during this time and most survived.
• Biomass production followed a typical growth curve with the plants finally entering the exponential, or logarithmic stage of growth in the third year of the experiment. It is unknown how many more years the plants would have been in this phase, but one to two years additional are a strong possibility.
• No large or small animal herbivore intrusion took place over the three years. Engineered barriers (fencing) prevented loss or off-site transport of biomass to animals.
• Using the observed Ca and Sr concentrations found in the plant tissues, and Sr CR’s calculated from groundwater analysis, projected biomass yields suggest the trees could prove effective in removing the contaminant from the 100-NR-2 riparian zone.
The results of this study indicate that the plants could function as a successful phytoextractant of 90Sr at the 100-NR-2 riparian zone.

5.1
5.0 Literature Cited
Ainsworth CC and RJ Fellows. 2007. Strontium-90 Phytoremediation Study Final Report. PNNL-16714, Pacific Northwest National Laboratory, Richland, Washington.
Antonio EJ, TM Poston, and WH Rickard, Jr. 1993. Radiological Survey of Shoreline Vegetation from the Hanford Reach of the Columbia River, 1990-1992. PNL-8797, Pacific Northwest Laboratory, Richland, Washington.
Buchanan BB, W Gruissem, and RL Jones. 2000. Biochemistry and Molecular Biology of Plants. American Society of Plant Physiologists, Rockville MD. 1365 pp.
Collander R. 1941. “Selective Absorption of Cations by Higher Plants.” Plant Physiol. 16(4):691-720.
Dorn RD. 1998. “A Taxonomic Study of Salix Section Longifoliae (Salicaceae).” Brittonia. 50(2):193–210.
Dutton MV and PN Humphreys. 2005. “Assessing the Potential of Short Rotation Coppice (SRC) for Cleanup of Radionuclide-Contaminated Sites.” International Journal of Phytoremediation 7(4):279–293.
Ehlken S and G Kirchner. 2002. “Environmental Processes Affecting Plant Root Uptake of Radioactive Trace Elements and Variability of Transfer Factor Data: A Review.” Journal of Environmental Radioactivity 58:97–112.
Erickson RO. 1976. “Modeling of Plant Growth.” Ann. Rev. Plant. Physiol. 27:407–434.
Esau K. 1965. Plant Anatomy. John Wiley & Sons, New York, New York.
Fellows, R J, J S Fruchter and CJ Driver. 2009. 100-N Area Strontium-90 Treatability Demonstration Project: Food Chain Transfer Studies for Phytoremediation Along the 100-N Columbia River Riparian Zone. PNNL-18294, Pacific Northwest National Laboratory, Richland, WA.
Francis CW. 1978. Radiostrontium Movement in Soils and Uptake in Plants. DOE Critical Review Series. Technical Information Center. U.S. Department of Energy.
Gouthu S, R Weginwar, T Arie, S Ambe, T Ozaki, S Enomoto, F Ambe, and I Yamaguchi. 1999. “Subcellular Distribution and Translocation of Radionuclides in Plants.” Environ. Toxicol. Chem. 18(9):2023-2027.
Handley R and R Overstreet. 1963. “Uptake of Strontium by Roots of Zea mays.” Plant Physiol. 38(2):180-184.
INEEL – Idaho National Engineering and Environmental Laboratory. 2000. Proceedings from the Workshop on Phtyoremediation of Inorganic Contaminants. INEEL/EXT-2000-00207, February 2000, November 30–December 2, 1999, Argonne National Laboratory, Chicago, Illinois, Idaho National Engineering and Environmental Laboratory, Idaho Falls, Idaho.
5.2
Jackson MB and PA Attwood. 1996. “Roots of Willow (Salix viminalis L.) Show Marked Tolerance to Oxygen Shortage in Flooded Soils and in Solution Culture.” Plant and Soil. 187(1):37–45.
Jacobson, L and R Overstreet. 1947. “A Study of the Mechanism of Ion Absorption by Plant Roots Using Radioactive Elements”. Am. J. Bot. 34:415-420.
Jacobson, L and R Overstreet. 1948. “The Uptake by Plants of Plutonium and Some Products of Nuclear Fission Absorbed on Soil Colloids.” Soil Sci. 65:129-134.
Klepper B. 1991. “Root-Shoot Relationships.” In Plant Roots – The Hidden Half. Y Waisel, A Eshel, and U Kafkafi (eds.), Marcel Dekker, Inc., New York, New York.
Kopp RF, LP Abrahamson, EH White, TA Volk, CA Nowak, and RC Fillhart. 2001. “Willow Biomass Production During 10 Successive Annual Harvests.” Biomass Bioenerg. 20:1–7.
Kramer PJ. 1983. Water Relations of Plants. Academic Press, New York, New York
Li S, LT Martin, SR Pezeshki, and FD Shields. 2005. “Responses of Black Willow (Salix nigra) Cuttings to Simulated Herbivory and Flooding.” Acta Oecologica. 28:173–180.
Li S, SR Pezeshki, and FD Shields. 2006. “Partial Flooding Enhances Aeration in Adventitious Roots of Black Willow (Salix nigra) Cuttings.” J. Plant Physiol. 163:619–628.
Marschner H. 1995. Mineral Nutrition of Higher Plants. 2nd ed., Academic Press, New York, New York.
Nakai A, Y Yurugi, and H Kisanuki. 2009. “Growth Responses of Salix gracilistyla Cuttings to a Range of Substrate Moisture and Oxygen Availability.” Ecolog. Res. 24(5):1057–1065.
Pilon-Smits E. 2005. “Phytoremediation.” Annual Review of Plant Biololy 56:15–39.
Poston TM, RW Hanf, and RL Dirkes (eds.). 2000. Hanford Site Environmental Report for Calendar Year 1999. PNNL-13230, Pacific Northwest National Laboratory, Richland, Washington.
Pulford ID and C Watson. 2003. “Phytoremediation of Heavy Metal-Contaminated Land by Trees – A Review.” Environment International 29:529–540.
Sackschewsky MR, DS Landeen, JL Downs, WH Rickard, and GI Baird. 1992. Vascular Plants of the Hanford Site. WHC-EP-0554, Westinghouse Hanford Company, Richland, Washington.
Serne RJ and VL LeGore. 1996. Strontium-90 Adsorption-Desorption Properties and Sediment Characterization at the 100-N Area. PNL-10899, Pacific Northwest National Laboratory, Richland, Washington.
Szecsody JE. 2009. Personal communication with James Szecsody of PNNL. November 23.
Szecsody JE, MD Williams, CA Burns, DC Girvin, RC Moore, JP McKinley, JS Fruchter, MJ Truex, VR Vermeul, and JL Phillips. 2007. Hanford 100-N Area Apatite Emplacement: Laboratory Results of
5.3
Ca-Citrate-PO4 Solution Injection and Sr-90 Immobilization in 100-N Sediments. PNNL-16891, Pacific Northwest National Laboratory, Richland, Washington.
Vandenhove H. 2006. “Phytomanagement of Radioactively Contaminated Sites.” Chapter 6 (pp. 191–228) of Phytoremediation of Metals-Contaminated Soils. NATO Science Series IV. Earth and Environmental Sciences. JL Morel, G Echevarria, and N Goncharova (eds.), Springer-Verlag, New York, New York.
Van Verst SP, CL Albin, GW Patton, and ML Blanton. 1998. Survey of Radiological Contaminants in the Near-Shore Environment at the Hanford Site 100-N Reactor Area. PNNL-11933, Pacific Northwest National Laboratory, Richland, Washington.
Willey N and C Collins. 2007. “Phytoremediation of Soils Contaminated with Radionuclides.” Radiation in the Environment 10:43–69.
Wilson LF. 1968. “Life History and Habits of Pine Cone Willow Gall Midge Rhabdophagia strobiloides (Diptera - Cecidomyiidae) in Michigan.” Can. Entomol. 100(4):430–437.


PNNL-XXXXX
Distribution
No. of No. of Copies Copies
Distr.1
Offsite
G Chamberlain Office of Environmental Management U.S. Department of Energy 1000 Independence Avenue, S.W. Washington, D.C. 20585-2040
Onsite 5 U.S. Department of Energy Richland Operations Office KM Thompson (3) A6-38 CH2M Hill Plateau Remediation Company NA Bowles R3-60 Washington State Department of Ecology Ecology Hanford Project Office D Goswami HO-57 8 Pacific Northwest National Laboratory CJ Driver K2-21 RJ Fellows (5) K2-21 JS Fruchter (2) K6-96