Embed Size (px)
Citation preview
1 W a t e r R e s o u r c e s S p e c i a l i s t M a n u a l
i W a t e r R e s o u r c e s S p e c i a l i s t M a n u a l
Contents
CHAPTER 1 - INTRODUCTION ......................................................................................................1
1.1 How This Manual is Organized ..............................................................................................11.2 ODOT’s Water Resources Program ........................................................................................2
Water Resources Goals .....................................................................................................21.3 Role of the Water Resources Specialist ..................................................................................41.4 ODOT Staff Roles ...................................................................................................................4
CHAPTER 2 - SUBMITTALS AND REVIEWS ..............................................................................7
2.1 Project Delivery Process .........................................................................................................72.2 Project Development Phases ...................................................................................................7
Draft STIP .........................................................................................................................7Project Initiation ................................................................................................................8Design Acceptance ............................................................................................................8Advance Plans ...................................................................................................................9Final Plans .........................................................................................................................9PS&E Submittal ................................................................................................................9
2.3 Process Overview .................................................................................................................102.4 Reports, Documents and Submittals .....................................................................................13
Prospectus, Part 3 ............................................................................................................13STIP Scoping Summary Report and Environmental Baseline Report ............................14Initial Design ...................................................................................................................16Water Resource Impact Assessment ...............................................................................18Preliminary Stormwater Report ......................................................................................20Conceptual Stormwater Management Plan .....................................................................21Water Resources Technical Report .................................................................................22Stormwater Management Plan ........................................................................................23Advance Plans .................................................................................................................26Final Plans and PS&E .....................................................................................................27
CHAPTER 3 - PERMITTING .........................................................................................................29
3.1 Actions Requiring Permits ....................................................................................................29Land Disturbance ............................................................................................................29Creation or Modification of Impervious Area ................................................................30Fill or Removal of Material in Wetlands or Waterways .................................................30Floodplain Modifications ................................................................................................30Construction or Repair of Bridges ..................................................................................31Other Instream Work ......................................................................................................31Stormwater Infiltration Facilities ....................................................................................31Activities Within or Near Regulated Locations ..............................................................31
3.2 Permit Categories ..................................................................................................................32Water Quality Permits .....................................................................................................32
W a t e r R e s o u r c e s S p e c i a l i s t M a n u a l ii
Removal, Fill, and Floodplain Permits ...........................................................................34Rivers and Harbors Act ...................................................................................................35Fish-Related Permits .......................................................................................................36Miscellaneous .................................................................................................................41
3.3 Streamlined Permitting Process ............................................................................................42ODOT Stormwater Stakeholders Working Group ..........................................................42SLOPES IV .....................................................................................................................42Joint Permit Application .................................................................................................42
CHAPTER 4 - HIGHWAY HYDROLOGY AND STORMWATER MANAGEMENT ............44
4.1 Highway Hydrology ..............................................................................................................44Climate and Rainfall .......................................................................................................44Design Storms .................................................................................................................46Where Does Stormwater Go? .........................................................................................49Transportation Projects – Hydrology Considerations .....................................................51Calculating Discharges ...................................................................................................53
4.2 Stormwater Drainage Systems ..............................................................................................56Stormwater Conveyance .................................................................................................56Stormwater Flow Control ...............................................................................................58
CHAPTER 5 - WATER QUALITY .................................................................................................63
5.1 Major Pollutants of Concern and Their Sources ...................................................................63Sources ............................................................................................................................64Pollutants .........................................................................................................................65
5.2 Water Chemistry ...................................................................................................................67pH ....................................................................................................................................67Hardness ..........................................................................................................................67Salinity and Temperature ................................................................................................68
5.3 Transport of Stormwater Pollutants ......................................................................................68Initial Transport ..............................................................................................................68During “First Flush” .......................................................................................................68After Entry into a Water Body ........................................................................................69During Downstream Transport .......................................................................................69
5.4 Impacts of Water Quality Pollution on Aquatic Organisms .................................................69Water Temperature .........................................................................................................70Sediment .........................................................................................................................70Metals ..............................................................................................................................71Nutrients ..........................................................................................................................72Organic Pollutants ...........................................................................................................72Acute and Chronic Effects ..............................................................................................72
5.5 Indirect Impacts to Water Quality .........................................................................................73Riparian Zones ................................................................................................................73Wetlands .........................................................................................................................73Development ...................................................................................................................74
5.6 Water Quality Monitoring .....................................................................................................74
iii W a t e r R e s o u r c e s S p e c i a l i s t M a n u a l
Hydrologic Monitoring ...................................................................................................74Sample Collection ...........................................................................................................75Laboratory Analysis ........................................................................................................75
CHAPTER 6 - CHANNEL IMPACTS OF TRANSPORTATION PROJECTS .........................77
6.1 Hydrology of Streams ...........................................................................................................77Base Flow ........................................................................................................................77Storm Flow ......................................................................................................................78
6.2 Potential Channel Impacts of Transportation Projects ..........................................................78Alterations in Hydrology, Sediment, and Wood Supply ................................................79Direct Channel Alterations and Impacts .........................................................................81
6.3 Identifying Existing Channel Impacts ..................................................................................84Bank Erosion ...................................................................................................................84Channel Incision .............................................................................................................87Channel Aggradation ......................................................................................................89Mechanical Channel Alteration ......................................................................................90Impacted Riparian Vegetation ........................................................................................95
6.4 Other Fluvial Geomorphology Principles .............................................................................98Stream Channel Classification ........................................................................................98Ordinary High Water Mark ...........................................................................................100Streambed Particle-Size Distribution ............................................................................101
CHAPTER 7 - WETLANDS ...........................................................................................................103
7.1 Introduction .........................................................................................................................1037.2 Definition and Functions .....................................................................................................103
Water Quality Improvement .........................................................................................104Hydrologic Functions ....................................................................................................104Flood Protection ............................................................................................................104Ecological Productivity .................................................................................................104
7.3 Identification .......................................................................................................................105Hydrophytic Vegetation ................................................................................................105Hydric Soils ..................................................................................................................107Wetland Hydrology .......................................................................................................108
7.4 Wetland Determination .......................................................................................................1097.5 Wetland Delineation ...........................................................................................................1107.6 Stormwater Impacts on Wetlands .......................................................................................110
Stormwater Runoff Impacts ..........................................................................................1107.7 Stormwater Management for Wetland Protection ..............................................................1117.8 Wetland Regulations ...........................................................................................................111
CHAPTER 8 - EVALUATING AND DOCUMENTING WATER RESOURCES ...................113
8.1 Identifying Water Resources ...............................................................................................113Area of Potential Impact ...............................................................................................114Types of Receiving Waters ...........................................................................................114Water Quality of Receiving Waters ..............................................................................115
W a t e r R e s o u r c e s S p e c i a l i s t M a n u a l iv
Streamflow Data for Receiving Waters ........................................................................116Groundwater as a Receiving Water ..............................................................................118Regulatory Floodways/Floodplains ..............................................................................120
CHAPTER 9 - WATERSHED DELINEATION ..........................................................................123
9.1 Delineating a Watershed .....................................................................................................123Determining Location of Watershed Outlet ..................................................................124Determining Watershed Boundary and Area ................................................................125Hydrologic Unit Code ...................................................................................................128Ground-Truthing the Watershed Boundary ..................................................................128
9.2 Contributing Impervious Area ............................................................................................128Definition of the CIA ....................................................................................................129Delineating the CIA ......................................................................................................129
CHAPTER 10 - METHODS FOR ESTIMATING IMPACTS ...................................................133
10.1 Overview of Methods .........................................................................................................134FHWA Driscoll Method ...............................................................................................134Modified WSDOT Method ...........................................................................................136Stochastic Empirical Loading and Dilution Model (SELDM) .....................................138HI-RUN Model .............................................................................................................141Comparison of FHWA and Modified WSDOT Method ...............................................141
10.2 Method Limitations .............................................................................................................142
CHAPTER 11 - STORMWATER TREATMENT .......................................................................144
11.1 BMP Treatment Mechanisms .............................................................................................144Stormwater Treatment for Stormwater .........................................................................144
11.2 Types of Treatment BMPs ..................................................................................................146LID BMPs .....................................................................................................................147Descriptions of BMPs ...................................................................................................147Infiltration BMPs ..........................................................................................................148Other BMPs ..................................................................................................................169
11.3 Low Impact Development Design Considerations .............................................................182Benefits of LID .............................................................................................................182Project and Site Constraints ..........................................................................................183
11.4 BMP Selection ....................................................................................................................187Maintenance Requirements of Proposed BMP .............................................................188
CHAPTER 12 - DEFINITIONS .....................................................................................................191
CHAPTER 13 - ABBREVIATIONS AND ACRONYMS ............................................................203
CHAPTER 14 - REFERENCES .....................................................................................................205
CHAPTER 15 - INDEX ...................................................................................................................211
CHAPTER 16 - OTHER RESOURCES ........................................................................................215
v W a t e r R e s o u r c e s S p e c i a l i s t M a n u a l
Tables
Table 4-1. Flow Control Design Storms .......................................................................................... 60
Table 9-1. Flood recurrence interval. ............................................................................................. 118
Table 10-1. List of Input Variables for the FHWA Driscoll method. ............................................. 135
Table 10-2. Inputs for Modified WSDOT Method to Evaluate Highway Project Impacts. ............ 137
Table 10-3. Runoff Concentration Input Values used in the WSDOT Method to Evaluate Highway Project Impacts. ............................................................................................................ 138
Table 10-4. Comparison of FHWA Driscoll and Modified WSDOT methods. .............................. 142
Table 11-2. Effluent pollutant concentrations from conventional and permeable pavements. ....... 158
Table 11-1. Applicability of LID measures and BMPs for transportation projects. ........................ 186
W a t e r R e s o u r c e s S p e c i a l i s t M a n u a l vi
Figures
Figure 2-1. Water Resources Specialist Process for Project Approval. ............................................ 11
Figure 4-1. SCS Hyetographs. .......................................................................................................... 47
Figure 4.2 Sample Hydrograph for Mock Basin Pre-Development and Post-Development (with and without detention) ........................................................................................................... 51
Figure 4-3. Detention Applied in Upper Subbasin (none in lower subbasins) ................................. 59
Figure 4-4. Detention Applied in Lower Subbasin (none in lower subbasins) ................................. 59
Figure 5-1. Flume to collect stormwater runoff from Interstate 205 in Washington State, Herrera Environmental Consultants. ........................................................................................... 75
Figure 6-1. Bank erosion on Bronson Creek, Washington County, Oregon. Herrera Environmental Consultants. .................................................................................................................... 86
Figure 6-2. Bank erosion on Schooner Creek, Lincoln City, Oregon. Herrera Environmental Consultants ..................................................................................................................... 86
Figure 6-3. Active headcut in Bronson Creek, Washington County, Oregon. Herrera Environmental Consultants. .................................................................................................................... 88
Figure 6-4. Incision of Bronson Creek, Washington County, Oregon. Herrera Environmental Consultants. .................................................................................................................... 88
Figure 6-5. Aggradation along the banks of Hansen Creek in rural Skagit County, Washington. Herrera Environmental Consultants. .............................................................................. 91
Figure 6-6. Aggradation upstream of Gallop Creek, Whatcom County, Washington. Herrera Environmental Consultants. ........................................................................................... 91
Figure 6-7. Aggradation upstream of a small creek in rural King County, Washington. Herrera Environmental Consultants. ........................................................................................... 92
Figure 6-8. Riprap along the Wenatchee River in rural Chelan County, Washington. Herrera Environmental Consultants. ........................................................................................... 93
Figure 6-9. More obscure riprap along the Calapooia River near Albany, Oregon. Herrera Environmental Consultants. ........................................................................................... 93
Figure 6-10.Blackberry covered riprapped bank near Mt. Vernon, Washington. Herrera Environmental Consultants. ........................................................................................... 94
Figure 6-11.Earthen levees, or “push-up dikes”, near Dungeness, Washington. Herrera Environmental Consultants. ........................................................................................... 94
Figure 6-12.Reed canarygrass on a small stream in Washington County, Oregon. Herrera Environmental Consultants. ........................................................................................... 96
vii W a t e r R e s o u r c e s S p e c i a l i s t M a n u a l
Figure 6-13.Reed canarygrass on a small stream in Washington County, Oregon. Herrera Environmental Consultants. ........................................................................................... 96
Figure 6-14.Manicured lawns adjacent to stream in suburban Seattle. Herrera Environmental Consultants. .................................................................................................................... 97
Figure 9-1. Contributing Impervious Area Schematic .................................................................... 130
Figure 10-1.Evaluation Criteria for WSDOT Method Comparison of Pre and Post Project Conditions. ................................................................................................................... 139

1 W a t e r R e s o u r c e s S p e c i a l i s t M a n u a l
C HA P T E R 1 - INT R ODUC T ION
Water Resources Specialists play a key role in ensuring that the Oregon Department of Transportation (ODOT) designs and builds projects that conform to both environmental protection laws and measures that protect receiving waters. By providing guidance on submittal and review responsibilities and background information on various technical topics and tools, this manual is intended to provide Water Resources Specialists with the tools needed to do their job and improve consistency across ODOT’s five regions.
1.1 How T his Manual is Organized
Chapter 1 Introduction: A summary of ODOT policies and key ODOT personnel. This chapter should be reviewed in detail by first time manual users and ODOT personnel or consultants who want to better understand the Water Resources Specialist process.
Chapter 2 Submittals and Reviews: Describes submittals and review responsibilities during the stages of ODOT project development.
Chapters 3 – 9: Background technical information on a variety of topics relevant to the Water Resources Specialist position.
Chapter 10 Methods for Estimating Impacts: Describes spreadsheet tools that can help to calculate water quality impacts of a proposed project.
Chapter 11 Stormwater Treatment: Describes low impact development (LID) treatment options, treatment mechanisms for various best management practices (BMPs), and provides guidance on BMP selection.
Chapters 12 - 15: Provide additional information including key definitions, acronyms and abbreviations; and references.
Templates, checklists and spreadsheets to help Water Resources Specialists complete their submittal and review responsibilities are available from the Water Resources Program Coordinator, ODOT Geo/Environmental Section.
W a t e r R e s o u r c e s S p e c i a l i s t M a n u a l 2
Flow control (detention) facilities are designed to temporarily store large volumes of water during a storm, so that downstream stormwater systems or properties are not flooded
1.2 ODOT ’s Water R es ources P rogram
ODOT is committed to protecting and improving the quality of Oregon’s water resources as it carries out its transportation mission. ODOT’s stormwater management program has been developed to address both policy (e.g., ODOT’s stormwater management initiative) and regulations. ODOT’s mission statement specifically calls for protecting and enhancing the environment.
Fulfilling ODOT’s commitment to protect Oregon’s water resources requires consideration of water resources throughout the planning, development, construction, and operation and maintenance of state highways and related facilities. In conjunction with state and federal resource and regulatory agencies, ODOT has defined goals and objectives for the management of highway runoff. Procedures, tools and techniques for selecting and designing water quality and flow control facilities are available for use by project teams and designers (available on the following website: oregon.gov/ODOT/HWY/GEOENVIRONMENTAL/water_resources.shtml). ODOT also sponsors water quality research to improve the understanding and management of stormwater, by identifying which pollutants (and what concentrations) occur in highway runoff and evaluating the effectiveness of stormwater BMPs.
Water R es ourc es G oals
ODOT directive PD-05 and Geo/Environmental Technical Bulletin 09-02(b) identify project elements that trigger water quality treatment and flow control, and provide management goals for both triggered actions.
Triggers for Water Quality Treatment Water quality treatment of highway runoff is required on projects that include one or more of the following:
• Addition of impervious surface area. This includes new roads, new lanes, turn refuges, widened lanes, widened shoulders and sidewalks, and projects that pave a new area and remove an equivalent or greater area elsewhere. Separated bike paths and walkways where stormwater flows onto adjacent, non-paved land are not required to provide additional treatment. Very minor additions of impervious surface, on the order of a guardrail flare or a police pull out, are usually not required to provide additional treatment.
• Change in the Contributing Impervious Area (see Section 9.2). This includes directing highway runoff into the project from areas that did not
3 W a t e r R e s o u r c e s S p e c i a l i s t M a n u a l
flow to the project area before, and collecting stormwater from within the project into the drainage system when before it sheet flowed onto adjacent undeveloped land.
• Change in the stormwater conveyance system. Enlarging or relocating the conveyance, relocating the outfall, or changing the type of conveyance. Relocation of inlets alone is not a trigger.
• Replacement or widening of stream crossing structures, both culverts and bridges. Does not include replacement of cross culverts for highway drainage.
• Involve impervious surface area and require a Clean Water Act Section 404 permit. This means that the permitted action must actively affect the impervious surface; being associated with a highway (such as placing riprap to protect a road) is not considered “involve impervious surface area”.
• Removal of existing pavement to base grade and replacement entirely within the pre-project profile, when the project is covered by SLOPES IV (see Section 3.3). This is intended to cover major road reconstruction, and does not apply to minor actions such as utility access, repair of sink holes, etc.
• Flow control for the protection of channel form and process is required when a project will increase peak flow from the 10-year 24-hour storm into the receiving water by more than 0.5 cfs, unless the receiving water is a river or other large water body, such as a lake, reservoir or estuary.
Highway Runoff Treatment Goals The goals for treatment of highway runoff from projects with water quality triggers are to:
• Treat runoff from the project’s Contributing Impervious Area (see Section 9.2)
• Provide treatment for runoff generated by the Water Quality Design Storm (see Section 4.1)
• Use a Preferred Best Management Practice where possible (see Section 11.2)
Not all projects can achieve these goals. Depending on the permits required for the project, shortfalls may have to be mitigated with off-project treatment, but for
W a t e r R e s o u r c e s S p e c i a l i s t M a n u a l 4
minor cases it can be sufficient to clearly show that treatment has been provided to the maximum extent practicable.
Flow Control Goals Flow control management goals are intended to protect receiving water channel form and processes. Therefore, projects are expected to maintain the frequency and duration of flows at pre-project levels for events equivalent in frequency to the range of the most important channel forming flows (see Chapter 6).
1.3 R ole of the Water R es ources S pec ialis t
The Water Resources Specialist has several responsibilities both during and beyond the project development process, including:
• Identifying water resources that could be affected by projects
• Assessing the impact of projects on water resources
• Assisting project teams with the selection of stormwater treatment techniques
• Coordinating with other ODOT environmental staff and resource and regulatory agency staff
• Documenting water resources, impacts and treatment for environmental reports, such as environmental impact statements (EISs)
• Developing permit and certification submittals
• Providing input on program, policy and research issues
• The work of the Water Resources Specialist is tied closely to that of the hydraulics engineer and other resource specialists. The Water Resources Specialist should therefore make an effort to gain a familiarity with those disciplines.
1.4 ODOT S taff R oles
When questions arise for a specific project, the most helpful contacts are likely to be Water Resources Specialists from other regions or the Water Resources Program Coordinator in the Geo/Environmental Section. For questions outside of
The specific individuals on the project development team will depend on the type and complexity of the project and the site characteristics
5 W a t e r R e s o u r c e s S p e c i a l i s t M a n u a l
the purview of the Water Resources Specialist, the staff listed below may be helpful:
• The Region Environmental Coordinator (REC) is responsible for preparing the Prospectus Part 3, and assigning a National Environmental Policy Act (NEPA) classification for all projects within their region. The REC is also the initial contact for environmental issues involved with the region’s construction and operation and maintenance programs. REC’s also prepare the categorical exclusion (CE) closeout document (part of the NEPA classification process). The REC is responsible for environmental permitting throughout the entire process for projects that are environmental classification 2.
• The Environmental Project Manager (EPM) is responsible for overseeing environmental documentation for a specific project, including an environmental assessment (EA) or environmental impact statement. EPMs make sure that projects that are environmental classification 1 and environmental classification 3 address all environmental issues and stay on track in terms of the NEPA process and documentation.
• The Project Leader manages project development; advancing projects from the statewide transportation improvement plan (STIP) to preliminary design and managing the project scoping team. The project leader is responsible for developing the project scope, schedule, and budget and preparing cost estimates for preliminary engineering and construction. The project leader may manage both internal ODOT and outside consultant staff.
• The Roadway Designer is responsible for design of roadways and intersections and ensuring conformance with ODOT and American Association of State Highway and Transportation Officials (AASHTO) safety design standards. The roadway designer is also responsible for stormwater conveyance design.
• The Hydraulics Engineer prepares the preliminary stormwater report, if required, and conducts analysis and design of stormwater management facilities, including conveyance, flow control, and stormwater treatment facilities.
• The Wetland Specialist is responsible for the identification, determination, and delineation of wetlands. This person also evaluates projects’ impacts on jurisdictional wetlands and develops mitigation.
• The Permit Specialist is responsible for preparing Clean Water Act (CWA) Section 404 permits, Oregon Department of State Lands (DSL)
W a t e r R e s o u r c e s S p e c i a l i s t M a n u a l 6
removal-fill permits, and any local permits required for impact to wetlands and waters that apply to a proposed project.
• The Biologist is responsible for ensuring that ODOT projects comply with the state and federal endangered species acts (ESAs). They are the primary contact for questions related to biological resources.
More information on ODOT staff roles may be found in the Project Delivery Guidebook.
7 W a t e r R e s o u r c e s S p e c i a l i s t M a n u a l
C HA P T E R 2 - S UB MIT T A L S A ND R E V IE W S
Water Resources Specialists have plan review, permit submittal, and analysis responsibilities at various milestones during the project delivery process.
2.1 P roject Delivery P roces s
The project delivery process is composed of six phases:
• Draft STIP
• Project initiation
• Design acceptance
• Advanced plans
• Final plans
• Plans, specifications and estimates (PS&E).
The ODOT project delivery process is described in more detail in the Project Delivery Guidebook.
2.2 P roject Development P has es
Draft S T IP A proposed scope, schedule and budget is developed at this phase for potential adoption of a project into the STIP. The approval authority and programming staff use this information to ultimately approve the project and send it to the Highway Finance Office for programming into the final STIP.
There may be several months between approval of the draft STIP by the Oregon Transportation Commission (OTC) and approval of the final STIP. This time allows for further refinement of proposed scope, schedule, budget for draft STIP projects and any necessary adjustments to the project list. Additional changes to scope, schedule and budget may occur between adoption of the Final STIP and project initiation.
W a t e r R e s o u r c e s S p e c i a l i s t M a n u a l 8
The Water Resources Specialist provides information to the REC for the project Prospectus, Part 3, which assigns an environmental classification to a project and identifies resources potentially impacted by the project, potential project elements that could affect those resources, environmental work required, and permits that will be required.
P rojec t Initiation
This is the project team’s starting point for development of the STIP-adopted scope, schedule, and budget, once the prospectus has been approved and a preliminary engineering expenditure account is in place. Team assignments are made, consultant contracts are in progress or in place, and the project development work plan is established.
• The Water Resources Specialist produces the water resources baseline report, provides input on the level of effort needed to meet water quality goals, and begins evaluating potential impacts and efforts to manage highway runoff.
• Between project initiation and design acceptance, the initial design phase, the roadway designer will develop the drainage plan. The Water Resources Specialist provides advice and assistance to the roadway designer, and evaluates the drainage plan to determine if additional stormwater treatment is required. This determination is documented in the water resources impact assessment (WRIA).
• The Water Resources Specialist begins coordination with the resource and regulatory agencies.
Des ign A c c eptance
This phase (referred to as the design acceptance package, or DAP) is a critical decision point that establishes the geometric boundaries of the project and allows for the concurrent right-of-way (ROW), permitting, and construction contract document activities to move forward.
Design acceptance also provides for environmental and land use requirements, and subsequently how they affect permitting and the development of construction contract documents. It occurs at the end of the initial design phase and requires all project disciplines to review the design for consistency with standards and policies. It is the primary opportunity for both technical and non-technical stakeholders to review design elements according to their specific interests.
9 W a t e r R e s o u r c e s S p e c i a l i s t M a n u a l
• The Water Resources Specialist provides input and assistance to the hydraulic engineer as they develop the preliminary stormwater report. By the completion of the design acceptance phase, stormwater treatment and flow control BMPs have been selected.
• If an EIS or EA is required for the project, the Water Resources Specialist may write the water resources technical report for the document.
Before the end of DAP, the resource and regulatory agencies should be familiar with the project and how stormwater will be managed. The conceptual stormwater plan may be produced near the end of DAP to support streamlined permitting.
A dvanc e P lans
The advance plans phase is a key part of contract document, and requires all project disciplines to review draft contract documents for completeness and accuracy. It is the primary opportunity for technical staff to provide quality control review of the project plans, specifications, and estimate as a package.
• By the end of this phase there will be enough design information for the Water Resources Specialist to complete the stormwater management plan (SWMP) for submittal as part of the CWA Section 401 water quality certification and as part of a biological assessment (BA), if required.
F inal P lans
This phase occurs in follow-up to the plans-in-hand meeting review and comment on the advanced plans and specifications. It is the last opportunity for contract documents to be reviewed by technical staff for quality control and document completeness, before the project is ready to move forward for Federal Highway Administration (FHWA) review (when needed) and PS&E submittal.
• The Water Resources Specialist should review the final plans to ensure that all requested modifications to stormwater management have been made.
P S & E S ubmittal
The PS&E submittal phase evaluates the completeness of a project for bid advertisement through commission services. Decision making with any desired interim milestones between design acceptance and PS&E submittal (e.g., preliminary, advanced, final plans) should be addressed through individual quality control plans and project development change requests as needed. Deliverables
W a t e r R e s o u r c e s S p e c i a l i s t M a n u a l 10
include all items identified on the PS&E checklist (criteria and requirements as determined by the state roadway engineer).
CWA Section 401 water quality certification must be received prior to PS&E for projects requiring CWA Section 404 permits.
2.3 P rocess Overview
Figure 2-1 illustrates the Water Resources Specialist submittal and review process. The steps shown reflect ODOT’s project delivery process and summarize the major responsibilities of the Water Resources Specialist during each step. For each step, there may be both submittal and review responsibilities. Because regulatory and activity thresholds determine the extent of treatment and review required, not all steps are required for every project.

1 1 W a t e r R e s o u r c e s S p e c i a l i s t M a n u a l
Figure 2-1. Water Resources Specialist Process for Project Approval.
8.5 X 11 color

W a t e r R e s o u r c e s S p e c i a l i s t M a n u a l 12
blank page for the back of Figure 2
1 3 W a t e r R e s o u r c e s S p e c i a l i s t M a n u a l
2.4 R eports , Documents and S ubmittals
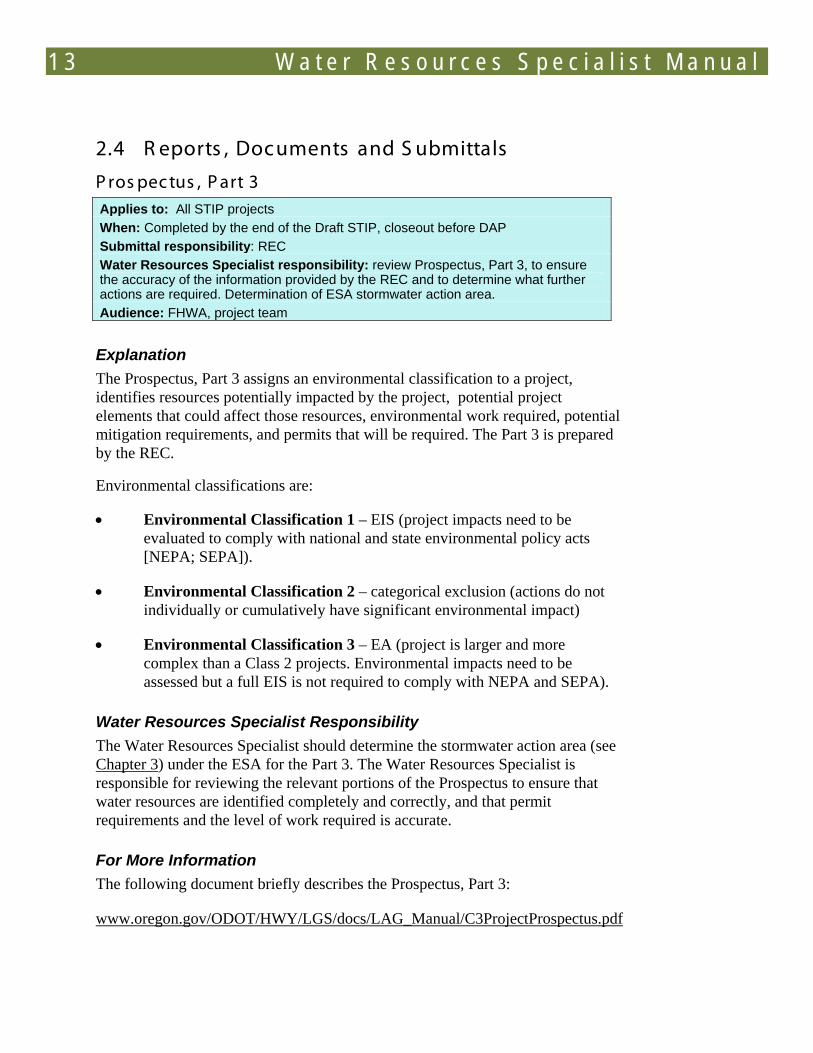
P ros pec tus , P art 3 Applies to: All STIP projects When: Completed by the end of the Draft STIP, closeout before DAP Submittal responsibility: REC Water Resources Specialist responsibility: review Prospectus, Part 3, to ensure the accuracy of the information provided by the REC and to determine what further actions are required. Determination of ESA stormwater action area. Audience: FHWA, project team Explanation The Prospectus, Part 3 assigns an environmental classification to a project, identifies resources potentially impacted by the project, potential project elements that could affect those resources, environmental work required, potential mitigation requirements, and permits that will be required. The Part 3 is prepared by the REC.
Environmental classifications are:
• Environmental Classification 1 – EIS (project impacts need to be evaluated to comply with national and state environmental policy acts [NEPA; SEPA]).
• Environmental Classification 2 – categorical exclusion (actions do not individually or cumulatively have significant environmental impact)
• Environmental Classification 3 – EA (project is larger and more complex than a Class 2 projects. Environmental impacts need to be assessed but a full EIS is not required to comply with NEPA and SEPA).
Water Resources Specialist Responsibility The Water Resources Specialist should determine the stormwater action area (see Chapter 3) under the ESA for the Part 3. The Water Resources Specialist is responsible for reviewing the relevant portions of the Prospectus to ensure that water resources are identified completely and correctly, and that permit requirements and the level of work required is accurate.
For More Information The following document briefly describes the Prospectus, Part 3:
www.oregon.gov/ODOT/HWY/LGS/docs/LAG_Manual/C3ProjectProspectus.pdf
W a t e r R e s o u r c e s S p e c i a l i s t M a n u a l 14
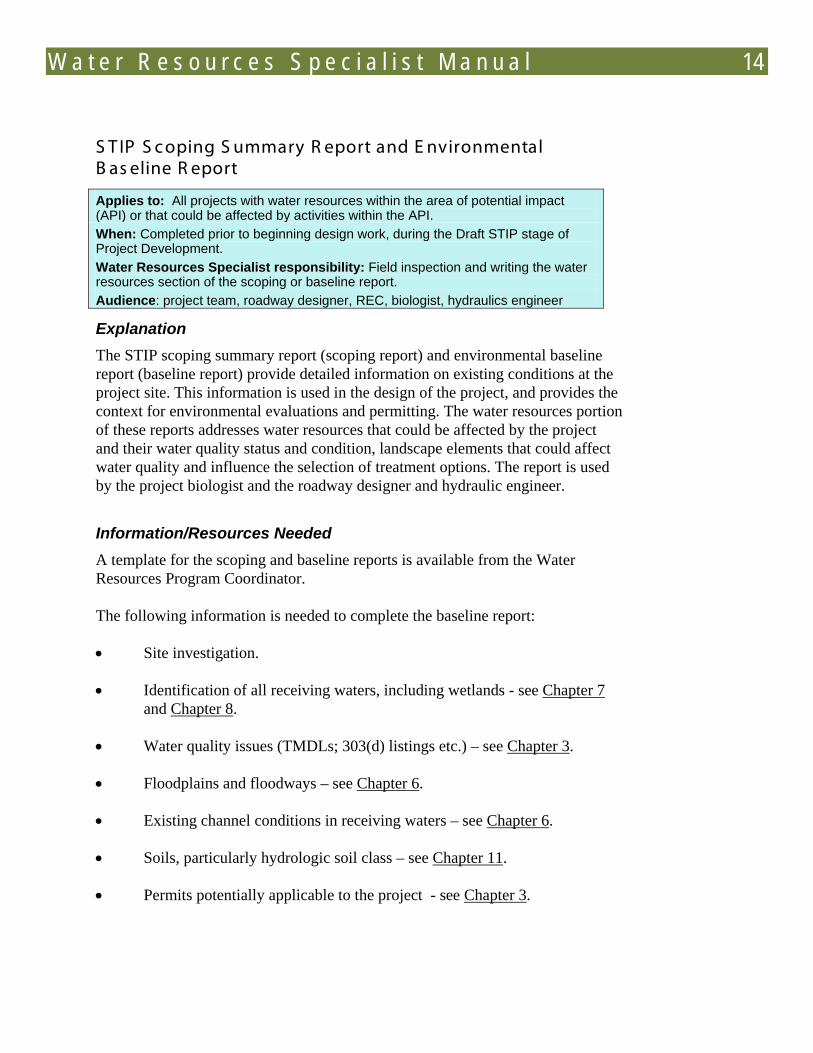
S T IP S c oping S ummary R eport and E nvironmental B as eline R eport
Applies to: All projects with water resources within the area of potential impact (API) or that could be affected by activities within the API. When: Completed prior to beginning design work, during the Draft STIP stage of Project Development. Water Resources Specialist responsibility: Field inspection and writing the water resources section of the scoping or baseline report. Audience: project team, roadway designer, REC, biologist, hydraulics engineer
Explanation The STIP scoping summary report (scoping report) and environmental baseline report (baseline report) provide detailed information on existing conditions at the project site. This information is used in the design of the project, and provides the context for environmental evaluations and permitting. The water resources portion of these reports addresses water resources that could be affected by the project and their water quality status and condition, landscape elements that could affect water quality and influence the selection of treatment options. The report is used by the project biologist and the roadway designer and hydraulic engineer.
Information/Resources Needed A template for the scoping and baseline reports is available from the Water Resources Program Coordinator.
The following information is needed to complete the baseline report:
• Site investigation.
• Identification of all receiving waters, including wetlands - see Chapter 7 and Chapter 8.
• Water quality issues (TMDLs; 303(d) listings etc.) – see Chapter 3.
• Floodplains and floodways – see Chapter 6.
• Existing channel conditions in receiving waters – see Chapter 6.
• Soils, particularly hydrologic soil class – see Chapter 11.
• Permits potentially applicable to the project - see Chapter 3.
1 5 W a t e r R e s o u r c e s S p e c i a l i s t M a n u a l
• Description and assessment of the water quality effectiveness of the current storm drainage system – see below.
• Identification of opportunities and constraints that could affect selection of stormwater treatment options – see below.
Evaluating the Effectiveness of the Existing Drainage System The Water Resources Specialist should conduct a site visit as part of developing the baseline/scoping reports. During this visit, they should evaluate existing drainage system performance.
Some evaluation considerations (described in detail in Chapters 4, 5 and 11) include:
• Is stormwater runoff from the existing roadway concentrated in an enclosed or open ditch conveyance system, or dispersed?
• Are there existing stormwater treatment BMPs? These may include structural features like detention basins, or less obvious elements such as broad, vegetated side slopes.
• Is there any unintended bypass or short-circuiting of stormwater treatment BMPs?
• Is there any visual evidence of BMP failure or maintenance problems?
• What is the anticipated pollutant removal effectiveness of existing BMPs, assuming they are properly designed, sited, and maintained? (see Chapter 11 for more information). Diffuse flow through vegetation provides good to excellent treatment, given adequate vegetation density and enough distance, though any flow through vegetation is beneficial. Concentrated flow (as in a ditch) through vegetation can provide good treatment if the flow is shallow and vegetation dense. Open ditch flow with little or no vegetation may allow for some infiltration, but is generally ineffective and may cause problems if there is erosion. Curbs and pipes provide no treatment, though catch basins may be moderately effective at trapping sediment. BMPs that were constructed for previous ODOT projects are usually effective for their target pollutants, though older ones focus solely on sediment, and not dissolved constituents.
Bypass refers to stormwater that is intended to receive treatment but does not enter the treatment facility
Short Circuiting refers to the passage of runoff through a BMP in less than the design treatment time.
Visual evidence of BMP failure or maintenance problems may include sediment buildup in a surface BMP, clogging of inlets/outlets, or a sheen or layer of algae or scum at the water surface of a pond.

W a t e r R e s o u r c e s S p e c i a l i s t M a n u a l 16
Initial Des ign
Applies to: All projects When: Following project initiation. Submittal responsibility: Roadway designer. Water Resources Specialist responsibility: Coordination, with advice and suggestions on the inclusion of LID techniques for stormwater management Audience: Project team, Water Resources Specialist
Explanation The initial design includes the project alignment, road width, cut and fill slopes, and drainage. The drainage design should include water quality treatment elements that do not require hydraulic design. LID techniques should be used as much as possible. BMPs incorporated during this phase generally involve little or no hydraulic engineering. This is also an opportunity to identify potential locations for engineered BMPs. Considering stormwater management for water quality is the first step in facilitating regulatory approval of stormwater management plans.
Water Resources Specialist Responsibility The Water Resources Specialist should work with the roadway designer to help them understand water quality goals and objectives. The Water Resources Specialist can also discuss stormwater treatment options with the designer, particularly opportunities for LID techniques. If it becomes clear that the project has substantial constraints that may affect the ability to meet water quality goals and objectives, the Water Resources Specialist may begin coordination with resource and regulatory agency staff.
Working with the Design Team to Identify Opportunities for LID To effectively incorporate LID BMPs, such as infiltration and amended vegetated BMPs, these techniques must be considered as early as possible in project development. The Water Resources Specialist should work with the design team to identify feasible options given safety and site considerations. The Water Resources Specialist must be aware of stormwater treatment constraints and confirm the following:
• Have designers maximized LID design practices to the extent feasible given safety, right-of-way, and adjacent land use considerations (see Chapter 11)?
• Have designers avoided concentrating runoff if feasible (i.e. if curbs are not required)?

1 7 W a t e r R e s o u r c e s S p e c i a l i s t M a n u a l
• Have designers maximized opportunities for infiltration BMPs if site and soil conditions are appropriate (see Chapter 11)?
• Have designers maximized the opportunities for amended vegetated BMPs if infiltration is not feasible (see Chapter 11)?
W a t e r R e s o u r c e s S p e c i a l i s t M a n u a l 18
Water R es ourc e Impac t A s s es s ment
Applies to: Projects requiring stormwater management for water quality When: Following completion of the initial design, prior to DAP Submittal Responsibility: Water Resources Specialist. Audience: project team, hydraulic engineer, project biologist
Explanation The water resource impact assessment (WRIA) is used to determine if the stormwater management included in the initial design is sufficient to meet ODOT and regulatory water quality goals and objectives. If the initial design is not able to meet those goals, the WRIA describes the extent of the shortfall and the remaining treatment targets to be addressed by the hydraulic engineer in the preliminary stormwater report.
The WRIA should be as short and concise as possible. Assess the treatment provided by the initial design and describe the remaining treatment requirements and goals, if any.
Information Required • Initial design with drainage plan
• Baseline and scoping reports
Evaluating Initial Drainage Plans The Water Resources Specialist must evaluate proposed stormwater management facilities – both the effectiveness of the proposed stormwater treatment BMPs and the flow control design, if applicable.
For water quality, check to see if:
• Stormwater from the entire contributing impervious area (CIA) (see Chapter 3 for a definition of CIA) is directed to stormwater treatment BMPs.
• The BMPs address the pollutants of concern, as identified in the baseline or scoping report and are appropriate for site-specific design constraints.
• The size and configuration of the BMPs are sufficient to treat stormwater runoff from the water quality design storm (see Chapter 11).
1 9 W a t e r R e s o u r c e s S p e c i a l i s t M a n u a l
The Water Resources Specialist should note deficiencies of the proposed stormwater treatment. Identify CIA that is not treated, which pollutants of concern are not addressed by the proposed BMPs, and any concerns about incorrect or insufficient sizing of BMPs.
For flow control, if the project is not exempt because of the size of the receiving water, review flow control calculations in the stormwater design report:
• Confirm that flow control facilities are sized to the correct detention standards;
• Verify assumptions on existing and proposed impervious areas, time of concentration, and precipitation;
• Confirm that flows calculated by designer are correct, using the simple SBUH spreadsheet tool available from the Water Resources Program Coordinator, or by requesting this information from the roadway designer or hydraulic engineer.
• Verify that calculations demonstrate that outflows will meet design standards. Request assistance from roadway designer or hydraulic engineer, if necessary.
• Verify that drainage plans match the calculations in terms of facility volume, elevation, and orifice and overflow size and elevations.
Identify any areas where flow control standards are not being met. On large projects that drain to multiple drainage basins, different parts of the project may be subject to different flow control standards (e.g., if part of the project drains to a flow control-exempt large receiving water while the remainder of the project is subject to flow control).
The WRIA is also the opportunity to identify where the purchase of additional ROW could allow for the implementation of LID techniques. The report acts as documentation for efforts to determine the most efficient way to meet water resources requirements.
W a t e r R e s o u r c e s S p e c i a l i s t M a n u a l 20
P reliminary S tormwater R eport
Applies to: projects not able to meet water quality goals and objectives based on the initial design (identified in the water resource impact assessment) When: following completion of the WRIA, prior to DAP Submittal Responsibility: hydraulic engineer. Water Resources Specialist responsibility: coordination and advice. Audience: project team, Water Resources Specialist
Explanation The preliminary stormwater report identifies and evaluates the stormwater treatment options for a project. The report includes the types of BMPs evaluated, location and approximate sizing for those that can (or most closely) meet water quality goals, costs and recommendations. The evaluation and recommendations are based in large part on the BMP selection tool (see Chapter 11). If no “preferred” BMP can be used, or the water quality treatment goals cannot otherwise be entirely met, the preliminary stormwater report documents the determining constraints and explains how the recommended plan most closely meets water quality goals.
The project team will use the preliminary stormwater report to make the final decision on how highway runoff will be managed. The recommendations are usually approved, but there may be cases when additional considerations lead to selecting an alternative.
Water Resources Specialist Responsibility The Water Resources Specialist provides the hydraulic engineer with the goals and targets for the stormwater treatment facilities. When there are constraints that might prevent the use of preferred BMPs, the Water Resources Specialist and the hydraulic engineer work together to evaluate whether or not the cost associated with overcoming the constraints are justified. At this point in the project it is still possible to recommend an increase in ROW without disrupting project timelines. Along with the REC, the Water Resources Specialist should make sure that the hydraulic engineer is aware of potentially conflicting resources that could affect the placement and design of BMPs.
If the project presents serious constraints that prevent achieving the water quality goals and objectives, the Water Resources Specialist should coordinate discussions with the resource and regulatory agencies. The agencies should understand the constraints and alternative options. Having the agencies approve a project’s stormwater management early is important for maintaining permit acquisition timelines.
2 1 W a t e r R e s o u r c e s S p e c i a l i s t M a n u a l
C onc eptual S tormwater Management P lan
Applies to: Projects requiring CWA 404 permits that involve impervious surface area When: Concurrent with the preliminary stormwater report, prior to DAP Submittal Responsibility: Water Resources Specialist. Audience: Project biologist, Oregon Department of Environmental Quality, NOAA Fisheries Service, US Fish and Wildlife Service, Project Team
Explanation The conceptual SWMP is not mandatory, but supports streamlined SWMP approval by the Oregon Department of Environmental Quality (DEQ) as part of CWA Section 401 water quality certification. The conceptual SWMP documents the type and general location of BMPs, and the percentage of the CIA that is being treated, but does not include design details. Constraints that prevent the complete achievement of water quality goals should be identified, along with a description of the best efforts to overcome or compensate for the constraints. By the time the conceptual SWMP is completed, the Water Resources Specialist should have reached agreement with DEQ that the plan is adequate to receive approval if implemented.
W a t e r R e s o u r c e s S p e c i a l i s t M a n u a l 22
Water R es ourc es T ec hnic al R eport
Applies to: Environmental Class 1 and 3 projects (EIS and EA) When: Following completion of the Initial Design, prior to completion of Draft EA/EIS and DAP Submittal Responsibility: Water Resources Specialist. Audience: EPM, Hydraulic Engineer
Explanation All EISs and many EAs require a detailed evaluation of the impact of the proposed project on water resources. This evaluation includes:
• Existing conditions (in part from the baseline or scoping reports)
• Pre- and post-project pollutant loading estimates for each alternative
• Hydrologic impacts of each alternative
• Activities other than highway runoff discharges that could affect water quality
• Proposed stormwater management and mitigation, with estimated effectiveness
• Impacts on receiving waters
• Non-stormwater impacts on water quality
• Secondary and cumulative impacts
• The information and analysis in the water resources technical report are incorporated into the EIS or EA, and are taken into account in selecting the preferred alternative.
2 3 W a t e r R e s o u r c e s S p e c i a l i s t M a n u a l
S tormwater Management P lan
Applies to: Projects requiring CWA 404 permits that involve impervious surface area, or projects requiring water quality treatment that have listed threatened and endangered species within the ESA stormwater action area. When: Following DAP, prior to CWA 404 permit submittal Submittal Responsibility: Water Resources Specialist. Audience: DEQ, NOAA Fisheries Service, US Fish and Wildlife Service, Project Biologist, Project Team
Explanation The SWMP is prepared and submitted to DEQ to comply with the requirements under CWA Section 401. The SWMP is part of the information evaluated for Section 401 Water Quality Certification. Information on the receiving waters, relevant project elements, and the BMPs used to treat stormwater are provided in enough detail to allow DEQ to determine whether project runoff is being treated to the “maximum extent practicable”. If the project is not able to fully achieve the water quality goals and objectives, the SWMP provides an explanation of the constraints, steps taken to try to overcome the constraints, and an explanation of how the project is meeting “maximum extent practicable (MEP)”.
NOAA Fisheries Service expects the same information on stormwater management to be included in BAs; a SWMP may need to be prepared even if a 404 permit is not required. NOAA Fisheries Service and DEQ can have somewhat different jurisdictional boundaries on a given project. If the differences are significant, the SWMP should clearly identify the limits for each agency.
Information Resources • Baseline/scoping report
• Initial design
• WRIA
• Preliminary stormwater report
• Conceptual SWMP
• Advanced plans
• DEQ stormwater management plan guidance and checklist
W a t e r R e s o u r c e s S p e c i a l i s t M a n u a l 24
Development of the Stormwater Management Plan SWMP Organization/Content The SWMP is primarily information that has already been developed; the Water Resources Specialist must organize the information in a form that is easy to review and understand. DEQ has a checklist of required elements that can be used as an organizational template. The Water Resources Program Coordinator also has examples and templates that can be used. Any other template should explicitly incorporate all of the information requested in the DEQ checklist.
SWMPs are expected to be “commensurate with the scope and scale of the project”. Projects involving relatively small disturbance and small amounts of impervious surface require considerably less detail than large, complicated projects. For example, a guardrail flare may be covered by a plan sheet and a short statement that indicates the stormwater will flow over vegetation as sheet flow for some distance until it reaches a receiving water. No hydrologic calculations would be required. A major project like adding travel lanes, on the other hand, would require considerable detail.
Projects requiring individual 404 permits are reviewed by DEQ for all potential impacts to water quality, broadly defined, for Section 401 Certification. In those cases, along with the SWMP, the Water Resources Specialist may need to append additional information on items such as riparian planting plans, sediment quality evaluations, and stream stability analysis. The development of this information is the responsibility of other technical specialists, including hydraulic engineers, biologists, and wetlands specialists.
Evaluating MEP/Constraints The most difficult parts of the SWMP are those concerning constraints, efforts to overcome the constraints, and an explanation of how the project achieves MEP treatment of highway runoff.
Ideally, these issues have already been addressed in discussions with resource and regulatory agencies before the SWMP is assembled. The hydraulic engineer and the roadway designer should have documentation of the constraints.
The use of the BMP selection tool provides information on potential constraints for each type of BMP, and any discussion should follow that as far as it is applicable. The discussion of constraints is necessary only when no preferred BMP can be used; in which case there must be a description of why each preferred BMP was not feasible at the site. This information may need to be consolidated from documentation provided by the hydraulic engineer. It is accepted that if a project meets the water quality goals and objectives, then MEP has been achieved. Otherwise the constraints discussion must be combined with
2 5 W a t e r R e s o u r c e s S p e c i a l i s t M a n u a l
an explanation of why the selected treatment strategy is the best for the project, and how close it comes to meeting the water quality goals.
W a t e r R e s o u r c e s S p e c i a l i s t M a n u a l 26
A dvanc e P lans
Applies to: All projects When: Following DAP Submittal Responsibility: Hydraulic Engineer and/or Roadway Designer. Water Resources Specialist Responsibility: Review Audience: Project Team, Water Resources Specialist
Explanation Advance plans consist of the engineered design for the entire project, and are produced for review. At this point the location, size, and design details of stormwater BMPs are generally complete. Minor adjustments to the design can still be made based on the result of review, but major revisions should not be needed.
Water Resources Specialist Responsibility Advance plans provide the design detail needed for SWMP submittals. The Water Resources Specialist should review the plans to ensure that they are in alignment with the conceptual SWMP, if there is one, and with the recommendations of the preliminary stormwater report (or the decision of the project team if different). During the development of the advance plans for water quality BMPs the Water Resources Specialist may be actively involved with the roadway designer or hydraulics engineer.
The level of detail is generally sufficient for SWMP submittals. If there are gaps, the Water Resources Specialist should identify them, so they can be filled as soon as possible.
A design is selected for advancement. This design is advanced to (approximately) the 30 percent level of completion, with distinguishing features and location identified. Stormwater BMPs (see Chapter 11) are also selected and sited during this phase.
2 7 W a t e r R e s o u r c e s S p e c i a l i s t M a n u a l
F inal P lans and P S & E
Applies to: All projects When: Following Advanced Plans Submittal Responsibility: Hydraulic Engineer and/or Roadway Designer. Water Resources Specialist Responsibility: Review Audience: Project team, Water Resources Specialist
Explanation Final plans allow for a final review to ensure that all comments, corrections and modifications requested at the review of the advance plans have been addressed. At PS&E, all final corrections have been made and all of the elements necessary to allow a project to go out to bid have been met. All permits should have been issued by PS&E, including any applicable CWA Section 401 CWA certifications. Exceptions to the rule that permits must have been issued are given only in exceptional circumstances, and must receive approval from the Deputy Director of ODOT.
Water Resources Specialist Responsibility The Water Resources Specialist should review the final plans to ensure that all requested changes have been made.
Coordination with Resource and Regulatory Agencies Coordination between ODOT and the resource and regulatory agencies is the key to efficient permitting of projects. The Water Resources Specialist usually acts as the primary contact for issues related to water quality and flow control. This coordination is especially important for projects that face significant challenges that limit their ability to fully meet water quality goals. Resource and regulatory agency staff are a valuable resource. They provide expertise in their agencies’ regulations, and know where and how much flexibility is in the interpretation of the rules.
The Water Resources Specialist should keep the resource and regulatory agencies informed of issues that affect stormwater management. Discuss constraints, alternative approaches and potential mitigation as soon as they appear, and preferably no later than during the development of the preliminary stormwater plan. Resource and regulatory agency staff should be helped to fully understand the nature of the constraints and the efforts to overcome them.
The Water Resources Specialist should facilitate meetings between agency staff and the designers and engineers where problems can be discussed. By the time the conceptual SWMP or the preliminary stormwater report is completed, there

W a t e r R e s o u r c e s S p e c i a l i s t M a n u a l 28
should be agreement between ODOT and the resource and regulatory agencies that the plan is acceptable.
Documentation of these discussions and negotiations is valuable. Not only does it allow for all parties to check that what they said was what was understood, but it provides back-up if there is a change in personnel.
29 W a t e r R e s o u r c e s S p e c i a l i s t M a n u a l
C HA P T E R 3 - P E R MIT T ING
Permitting on ODOT projects is overseen by the permit specialist, but the Water Resources Specialist is usually responsible for assembling submittal packages for water quality related permits and certifications. The Water Resources Specialist should be aware of stormwater management-related actions that may trigger additional permit requirements that may delay schedules and increase costs.
Projects may be covered by one or more permits. These permits could require project-specific review (individual review by resource and regulatory agencies), or could be programmatic (approved with set conditions but not requiring individual review by resource and regulatory agencies).
3.1 A ctions R equiring P ermits
Any action that may affect stormwater runoff, receiving waters (including wetlands and floodplains), or fish species in these waters may require permits.
Permits applicable to a particular project or activity depend on whether the project has either a DEQ nexus (projects subject to DEQ review under CWA Section 401 or requiring Section 404 permits) or a federal nexus (projects receiving federal funds or requiring a federal permit).
L and Dis turbanc e
Construction of roads or any other transportation facility that involves land disturbance could pose a threat to water quality, due to erosion and discharge of sediment in stormwater runoff. Construction projects involving 1 acre or more of disturbed area require a National Pollutant Discharge Elimination System (NPDES) 1200-C Permit for the discharge of stormwater from the construction site. Each ODOT region holds a NPDES 1200-CA permit (for construction agencies) that covers all projects in the region.
Projects receiving a CWA 404 permit or federal funding have a nexus to the ESA. If listed threatened and endangered (T&E) fish are within the project’s ESA Action Area, the project must be evaluated for potential effects to the species. Stormwater discharges from construction sites may trigger consultation and the preparation of a SWMP.

W a t e r R e s o u r c e s S p e c i a l i s t M a n u a l 30
Under Oregon´s Removal-Fill Law (ORS 196.795-990), waters of the state are defined as "natural waterways including all tidal and nontidal bays, intermittent streams, constantly flowing streams, lakes, wetlands and other bodies of water in this state, navigable and nonnavigable, including that portion of the Pacific Ocean that is in the boundaries of this state.
C reation or Modific ation of Impervious A rea
New road construction, road widening or road realignment creates new impervious surfaces, which increase the volume and peak flows of stormwater runoff. If the project requires a CWA Section 404 permit for fill in waters of the US, a DEQ Section 401 Water Quality Certification is required, certifying that the project does not violate state water quality standards. If the project involves impervious surface area that drains to waters of the state, then a SWMP must be submitted to DEQ for review and approval (see Chapter 2).
Projects receiving a CWA 404 permit or federal funding have a nexus to the ESA. If listed T&E fish are within the project’s ESA Action Area, the project must be evaluated for potential effects to the species. Stormwater discharges may trigger consultation and the preparation of a SWMP.
F ill or R emoval of Material in Wetlands or Waterways
If a road project or proposed stormwater management facility will place fill in a jurisdictional wetland or waterway, the project will be need a CWA 404 permit from the US Army Corps of Engineers (Corps), and a CWA Section 401 Water Quality Certification from DEQ. Fill or removal of more than 50 cubic yards of material in state jurisdictional waters or wetlands require a DSL removal-fill permit. DEQ is a commenting agency on removal-fill permits.
F loodplain Modific ations
If a project involves work within a floodplain or floodway, a No-Rise Certification is likely required.
A floodway is an area that includes that channel of a river, stream, or other watercourse and adjacent lands that conveys floodwaters. The floodway is composed of the active river channel and those parts of the floodplain which experience flows of significant velocity and convey flow during flood events.
A floodplain is an area adjacent to a river or stream channel that is usually fairly flat and experiences occasional or periodic inundation during floods. The floodplain includes the floodway and other areas sometimes referred to as the flood fringe, which are inundated during floods but do not contribute significantly to flood flow conveyance and do not experience significant flow velocities.
3 1 W a t e r R e s o u r c e s S p e c i a l i s t M a n u a l
C ons truc tion or R epair of B ridges
ODOT has developed a programmatic permitting strategy to streamline permitting of the approximately 300 bridges requiring construction or repair by 2011 (ODOT 2007).
The streamlining process resulted in the following major actions (for background information only – The Water Resources Specialist will not be involved in any of these permits):
• Batched Biological Assessment/Biological Opinion (BA/BO) with NOAA Fisheries Service and US Fish and Wildlife Service (USFWS)
• Wetlands and waterways – regional general permit from the Corps and general authorization from DSL.
• Section 401 Water Quality Certification notification through a regional general permit.
Other Ins tream Work
Culvert replacement or bank stabilization is subject to review by the Corps under the River and Harbors Act, and Section 404 of the CWA. Any work conducted within waters of the state also is subject to Oregon Fish Passage Approval requirements, and Oregon In-water Blasting and Screening Requirements.
S tormwater Infiltration F ac ilities
If infiltration is proposed for stormwater treatment or disposal, the BMP may need to be registered under the Underground Injection Control (UIC) program administered by DEQ.
A c tivities Within or Near R egulated L oc ations
Scenic Waterways Oregon's State Scenic Waterways law (ORS 390.805-390.925) stipulates that fills and removals in State Scenic Waterways require a removal-fill permit regardless of the fill volume. The Oregon Parks and Recreation Department (OPRD) must be notified of certain activities proposed within ¼ mile of the bank of Oregon’s designated scenic waterways and issue a Scenic Waterway Permit. Such activities include cutting of trees, construction of roads, utilities, buildings, or other
W a t e r R e s o u r c e s S p e c i a l i s t M a n u a l 32
structures. The proposed uses or activities may not be started until the written notification is approved, or until one year after the notice is accepted.
Coastal Zone The coastal zone boundary was laid out to approximate a natural ecological unit: the coastal watershed. All shorelands and drainage basins which have a significant and direct effect on coastal waters are included, with the exception of the Columbia, Umpqua, and Rogue River basins, which are included only to the extent of significant tidal influence.
Ocean Shore Area If a project includes work within the ocean shore area (for example, an outfall to the Pacific Ocean or excavation of sand dunes), it is subject to an Ocean Shore Alteration Permit. Ocean Shore Alteration Permits are issued by OPRD.
3.2 P ermit C ategories
The permits described in this section can be summarized into four categories:
Water Quality P ermits
Water quality permits required for ODOT projects include both those that are project-specific and programmatic.
Project-Specific
Section 401 Water Quality Certification (DEQ) Clean Water Act Section 401 Water Quality Certification is required for projects receiving federal permits, including CWA Section 404 permits. DEQ determines if a project meets state water quality standards. The CWA 404 permit is not issued until the CWA 401 Certification is granted.
The CWA 401 Certification review covers all aspects of a project that could impact water quality. Stormwater discharges, in-water work, riparian modification and other project elements and actions are evaluated. DEQ has granted 401 pre-certification to select categories of Nationwide 404 permits, including Nationwide 3 (Maintenance) and 14 (Transportation), with the condition that projects involving impervious surfaces develop and submit SWMPs for approval.
3 3 W a t e r R e s o u r c e s S p e c i a l i s t M a n u a l
Project applying for individual 404 permits are reviewed by DEQ. SWMPs for ODOT projects that qualify for pre-certified Nationwide permits are reviewed internally, with the plans subsequently sent to DEQ for their files. Non-ODOT projects, including Local Agency projects funded through ODOT, must submit their SWMPs to DEQ.
UIC Registration (DEQ). In accordance with Part C of the Federal Safe Drinking Water Act (SDWA), Protection of Underground Sources of Drinking Water, Oregon has a UIC program which regulates discharges to UIC wells to protect groundwater quality. The UIC program is administered by DEQ under Oregon Administrative Rules (OAR) Chapter 340, Division 44.
All UIC wells must be registered with DEQ, except wells located on tribal land. Tribal land wells must be registered with EPA. UICs are any man-made design, structure or activity which discharges below the ground or subsurface.
The Water Resources Specialist needs to determine whether or not infiltration BMPs fall under the definition of UIC.
More information can be found on DEQ’s website.
Programmatic - Clean Water Act, Section 402: National Pollutant Discharge Elimination System In 1972, as part of the CWA, the U.S. Congress initiated the federal NPDES program. To comply with the NPDES program, as amended in 1987, municipalities and many types of industrial sites are required to obtain a permit to discharge stormwater pollutants into navigable or regulated waters. The requirements in these permits include BMPs to improve stormwater runoff quality, including structural treatment facilities and maintenance activities.
Municipalities with separate sewer and stormwater systems require a Municipal Separate Sewer System (MS4) permit. ODOT has a system-wide NPDES MS4 permit that is administered by DEQ.
• Section 402 of the CWA also requires management of runoff from construction sites for water resource protection. DEQ administers 1200-C (individual project) and 1200-CA (construction agency) permits for construction sites equal to or greater than 1 acre in size. This permit defines requirements for erosion and sediment control (ESC) measures that must be implemented during construction to prevent discharge of eroded sediment during storm events. Each ODOT Region has a 1200-CA permit for construction activities and does not need to apply for an
General Permits are pre-issued nationwide or regional permits for activities having no more than minimal effects on the environment.
Stormwater discharge to infiltration facilities such as drywells, trench drains, sumps, and perforated piping is regulated under the UIC program.
W a t e r R e s o u r c e s S p e c i a l i s t M a n u a l 34
Waters of the U.S. include: • Rivers, streams, most
creeks and some ditches,
• Bays, estuaries and tidal marshes,
• Lakes and some ponds,
• Permanent and seasonal wetlands,
• All lands, public or private, except tribal lands.
NPDES 1200-C permit for each project, unless the project is on an Indian Reservation. In that case, a project specific NPDES permit must be obtained from EPA.
R emoval, F ill, and F loodplain P ermits Oregon Wetlands/Waterways Removal-Fill Permit Program (DSL) DSL administers the Oregon removal-fill Permit which may be required for projects in wetlands or waterways. Other state water-related permits and reviews are coordinated through the removal-fill permitting process. The Oregon Removal Fill Permit applies to work in “Waters of the State” or “Waters of the U.S.”
Wetland determination and delineation (discussed in the Chapter 7) is required if wetlands are present in areas that would be affected by proposed work. Regulated activities in these waters include:
• Placement of fill material
• Alteration of stream banks or stream course
• Ditching and draining
• Excavation or dredging of material
• Bank stabilization (e.g., riprap or retaining walls)
• In-water construction such as piers (may also require a lease from DSL)
• Stump removal (large land-clearing projects)
• Commercial timber harvest.
Removal-fill permits come in three types: individual permit, general authorization, and emergency authorization. The JPA is used to apply for a removal-fill permit.
For more information, refer to the Oregon DSL Wetlands/Waterways Removal Fill Webpage.
CWA Section 404 Permit (Corps) Section 404 of the CWA regulates the discharge of dredged or fill material into waters of the United States, including wetlands. Activities in waters of the United
3 5 W a t e r R e s o u r c e s S p e c i a l i s t M a n u a l
States regulated under this program include fill for development, water resource projects (such as dams and levees), infrastructure development (such as highways and airports) and mining projects. A permit must be received from the US Army Corps of Engineers (USACE) before dredged or fill material may be discharged into waters of the United States, unless the activity is exempt from Section 404 regulation (e.g. certain farming and forestry activities). Most ODOT projects are covered by Nationwide Permit (NWP) 14 for Linear Transportation Facilities or NWP 3 for Maintenance.
As described above, projects requiring 404 permits must obtain CWA Section 401 Water Quality Certification from DEQ.
No-Rise Certification (county administration of Federal Emergency Management Act program). The Federal Emergency Management Act (FEMA) requirements for preventing increases in flooding impacts are administered by local agencies, typically by county ordinance. An engineering analysis must be conducted for work within a floodplain to document that floodwater elevations will not increase. This is called a No-Rise Certification.
A No-Rise Certification will typically be required of projects where there will be construction activities in a floodway. An engineering analysis, prepared by a registered professional engineer, is required to determine whether the project is predicted to increase floodwater elevations.
R ivers and Harbors A c t
Section 10 of the Rivers and Harbors Act gives the Corps authority to regulate certain activities in navigable waters. Regulated activities include diking, deepening, filling, excavating, and placing of structures. The Corps regulatory authority under Section 10 of the Rivers and Harbors Act does not extend to bridge projects. Under Section 9 of the Rivers and Harbors Act, the U.S. Coast Guard has authority over bridge structures in navigable waters of the United States, including construction, operation, and maintenance (OBDP undated).
The Rivers and Harbors Act also triggers 401 Water Quality Certification by DEQ. Compliance with the Rivers and Harbors Act is determined by the Corps review of the project JPA.
W a t e r R e s o u r c e s S p e c i a l i s t M a n u a l 36
F is h-R elated P ermits
Federal ESA (USFWS, NOAA Fisheries Service) The purpose of the ESA is to protect and promote recovery of imperiled species and the ecosystems upon which they depend. The federal ESA is administered by NOAA Fisheries Service for marine mammal species and anadromous salmonid species. USFWS administers the ESA for freshwater fish species, and for birds, mammals, reptiles, amphibians, invertebrates, and plants.
Three provisions of the ESA may apply directly to stormwater management: Section 4(d) rules, Section 7 consultations and Section 10 habitat conservation plans.
Section 4(d) of the ESA requires USFWS or NOAA Fisheries Service to implement protective measures that prevent further damage to threatened species. Section 4(d) applies only to threatened species; endangered species are afforded full legal protection without room for maneuvering. “Take” of any species listed as endangered is prohibited by the ESA. Take of threatened species may be allowable under permit, provided project-related take does not interfere with species survival or recovery.
ESA compliance involves determination of effect on listed species, and may lead to consultation with USFWS/NOAA Fisheries Service under Section 7. Determination of effect involves the following:
Action Area Determination The presence or absence of a listed T&E species within a project’s action area is the first step in deciding if ESA consultation is required. The action area of a project is the area within which the effects of a project can be measured or meaningfully analyzed. For projects where FHWA is the federal action agency, the action area for stormwater impacts extends from the project downstream to where the once-in-three-year (3-year) in-stream concentration of the primary pollutant of concern falls below a specified level. The stormwater action area is to be determined for all projects that trigger the requirement for stormwater management (see Chapter 11 for the triggers).
The requirement to provide water quality treatment for stormwater is based on the project elements, not on whether or not listed T&E species are in the stormwater action area.
Delineation of the stormwater action area is influenced by several factors. These are:
• Variation in the volume of stormwater discharge due to varying storm size
As defined in the Endangered Species Act (ESA Section 3), take means "…to harass, harm, pursue, hunt, shoot, wound, kill, trap, capture, or collect, or to attempt to engage in any such conduct" with respect to federally listed endangered species of wildlife.
3 7 W a t e r R e s o u r c e s S p e c i a l i s t M a n u a l
• Variation in the concentration of pollutants between storms
• Variation in the discharge of the receiving water
• Decrease in the concentration of pollutants from the stormwater in the downstream direction due to dilution, dispersion and pollutant removal
• The selected threshold concentration of the pollutant of concern.
By using the 3-year concentration to define the action area the effect of the first three factors is explicitly taken into account in determining the extent of the action area.
Definition of the threshold concentration is based on the lowest concentration with demonstrated effects on the target species and the usual detection limit in water quality monitoring. The threshold concentration should be substantially below the level with demonstrated adverse effects, and at or below the usual detection limit. For dissolved copper the selected threshold is 0.4 ug/l, which is the standard detection limit and less than half the reported value for effects on juvenile salmonids. New research may lead to revisions in this value.
Determination of the Stormwater Action Area The determination of the stormwater action area involves the following steps (described in greater detail below):
Step 1 – Determine Project’s Post Construction Impervious Area
The project contributing area is the post project impervious area within the project limits that discharges stormwater to the receiving water of interest. Do not include parts of a project that discharge to another, completely separate watershed (those sections will require their own evaluations). At the Draft STIP phase of project development only approximate impervious surface areas will be available. Use the largest reasonable estimate of impervious surface area. If this is reduced in size during the design phase the stormwater action area can be recalculated and a no effect call made if justified. Underestimating the impervious surface, on the other hand, may result in having to initiate an unplanned BA and consultation.
Step 2 - The project biologist identifies the upstream extent of the T&E species’ habitat.
Step 3 - Determine the area of the watershed above the upper limit of T&E species habitat
W a t e r R e s o u r c e s S p e c i a l i s t M a n u a l 38
The watershed area above the upstream extent of the T&E species habitat can be automatically calculated using mapping tools provided on the web sites of the U.S. Geological Survey (USGS) and the Oregon Water Resources Department (see Chapter 9). These tools can also be used to find the downstream extent of the stormwater action area, if that is necessary, though that could take several iterations.
Step 4 - Determine the once-in-three-year in-stream concentration at the upper limit of the T&E species habitat resulting from the project’s stormwater discharge.
The FHWA method developed by Driscoll et al (1990) (See Chapter 10) can be used to determine the once-in-three-year in-stream concentration. Use the impervious area determined in Step 1 above, and set the watershed area to that calculated in Step 3.
The pollutant of concern should be the pollutant in highway runoff with the highest ratio between the median concentration in runoff and the concentration of concern to the target species. For salmonids this is usually dissolved copper.
Median concentration of the pollutant of concern should be based on the most recent available information. Until more data become available, the median concentrations used are for very high average daily traffic (ADT) (over 100,000) highways, and moderate ADT highways (30,000 – 100,000). While low and very low ADT highways (<30,000, and <15,000 [rural roads] or <7,500 [urban roads]) probably have even lower median concentrations for most pollutants, not enough information is available yet to assign values. For those low ADT highways the values for moderate highways are recommended.
Step 5 – Determine whether project is “no effect”; provide results to REC and project biologist.
If the 3-year concentration is above the target concentration, the T&E species is in the Action Area. If the concentration is below the target concentration, the species in not in the action area and the project is a “no effect” for stormwater impacts.
The results are to be given to the REC and the project biologist. The presence of a listed T&E species in the stormwater action area does not automatically result in any particular effect determination.
Assessment of Potential Impact Under the ESA, a project can be categorized as “No Effect”, “May Affect, Not Likely to Adversely Affect”, or “May Affect, Likely to Adversely Affect”. Effect determinations of a project on listed species are made by the relevant federal
A streamlined process (programmatic BO) called SLOPES-IV has been developed for common in-stream activities.
3 9 W a t e r R e s o u r c e s S p e c i a l i s t M a n u a l
agency (e.g., FHWA) for federally-listed species, or by the relevant state agency (e.g., ODOT) for state-listed species.
• If it is determined by the project biologist that a project will have no effect on listed species, a No Effect memorandum is prepared, preparation of a BA is not required, and no consultation is required with USFWS and/or NOAA Fisheries Service. The relevant regulatory agency will respond in writing to confirm that the project will have no effect.
• If potential project effects on listed species are characterized as “May Affect, Not Likely to Adversely Affect” or “May Affect, Likely to Adversely Affect”, a BA is written to document the species and effect determination for the project.
• If the project is determined “Not Likely to Adversely Affect” listed species, informal consultation is conducted with USFWS and/or NOAA Fisheries Service, who then issue a Letter of Concurrence with the finding, or request additional information/project amendment before issuing the letter.
• If the project is “Likely to Adversely Affect” listed species, a BA is written, and USFWS and/or NOAA Fisheries Service author a project BO that documents approval of the project activities and conditions of the approval.
USFWS and NOAA Fisheries Service – Incidental Take Permits An incidental take permit is required whenever a "take" of a T&E species is to be performed. A take is broadly defined as any activity that will impact the species including harassing, capturing, moving, killing, or impairing essential behavior. A habitat conservation plan must be submitted as part of an application for an Incidental Take Permit.
ODFW Fish Passage Requirements ODFW administers the state fish passage laws (OAR 635-412-0005 through 0040). These laws apply when a project involves placing obstructions in a waterway in which native migratory fish are, or were historically, present. The owner or operator of an artificial obstruction already located or to be installed in waters in which native migratory fish are currently or were historically present must address fish passage requirements prior to certain trigger events.
• Trigger events include installation, major replacement, a fundamental change in permit status (e.g., new water right, renewed hydroelectric license), or abandonment of the artificial obstruction. Thresholds of
W a t e r R e s o u r c e s S p e c i a l i s t M a n u a l 40
actions triggering fish passage laws vary for different types of artificial obstructions.
• Native migratory fish include native salmon, trout, lamprey, sturgeon, and suckers, and a few other species. It is ODFW's responsibility to determine the current or historical presence of native migratory fish. If the owner/operator knows that native migratory fish are or were present at the site, then the owner/operator does not need to contact ODFW for this determination and may proceed with meeting fish passage requirements.
To address fish passage requirements ODOT must obtain from ODFW:
1) approval for a passage plan when passage will be provided, 2) a waiver from providing passage, 3) an exemption from providing passage, or 4) a deferral if there is an imminent or immediate threat to human safety. When passage will be provided, approval of plans may occur on a site-by-site basis, on a program basis if an entity is responsible for a large number of artificial obstructions or by following Oregon Department of Forestry requirements if on non-federal forestlands.
Fish passage approval can be obtained from ODFW through the JPA process provided that an adequate passage plan is submitted.
In-water Timing Guidelines ODFW reviews JPAs submitted for in-water work to ensure that they will meet the appropriate timing guidelines for the water body. These guidelines apply if the project will involve work below the ordinary high water (OHW) elevation of a stream, lake or pond; or in wetlands or ditches that have a surface water connection to a stream, lake or pond.
Time periods are established for in-water work to avoid the vulnerable life stages (including migration, spawning, and rearing) of important fish species including anadromous and other game fish and threatened, endangered, or sensitive species. The guidelines provide the public a way of planning in-water work during periods of time that would have the least impact on important fish, wildlife, and habitat resources. Other state and federal agencies typically incorporate the timing guidelines as conditions of their permits for work in water.
Other ODFW Permits/Requirements There are additional ODFW permits, including the following:
• In-Water Blasting Permit
In-water timing guidelines are typically applied to activities that are proposed in streams, rivers, upstream tributaries, and associated reservoirs and lakes. The timing guidelines are not typically applied in ocean waters or wetlands.
4 1 W a t e r R e s o u r c e s S p e c i a l i s t M a n u a l
• Fish Screening Requirements
• Ocean Shore Alteration Permit.
However, these permits are rarely necessary for transportation projects.
Mis c ellaneous
Scenic Waterway Permit (OPRD) Notification must be made to OPRD prior to any alteration, development or improvement within 1/4 mile of the banks of designated state scenic waterways. Notification is made using a Notification of Intent form. For a complete list of designated scenic waterways, go to the OPRD Website. This requirement applies to all private and nonfederal public lands within the described corridor. Some examples of affected activities are construction, timber harvest, road building, mining, and vegetation management.
Ocean Shore Alteration Permit (Oregon Department of Land Conservation [DLCD]) The Ocean Shore Alteration Permit (OPRD OAR 736-020-0001) requires a separate application from the JPA. This permit would apply if a project is located within the ocean shore area.
This is a permit for the alteration, improvement or development on the ocean shore. Some examples are shoreline protection structures, stairways, marine algae collection and sand dune management.
Coastal Zone Certification (DLCD) DLCD - OAR Chapter 660 – Coastal Zone Certification: Applies if a project is located within the Coastal Zone.
Oregon has a federally approved coastal management program. This program applies within the state's coastal zone. Projects requiring a federal license or permit within this area must be consistent with the enforceable policies of the coastal management program. The formal term for these requirements is "federal consistency." The Coastal Zone Certification is the certification that federal consistency has been met for the project.
The ocean shore area includes the area between extreme low tide and statutory vegetation line (16-foot elevation line) or line of established upland vegetation, whichever is further inland. Refer to the DLCD website for more information
W a t e r R e s o u r c e s S p e c i a l i s t M a n u a l 42
Limited License (OWRD) In rare cases, a temporary diversion of water may be required for construction of highway projects, which may require approval from the Oregon Water Resources Department (OWRD) in the form of a limited license.
3.3 S treamlined P ermitting P roces s
ODOT S tormwater S takeholders Working G roup ODOT initiated a collaborative working group representing stormwater stakeholders, including NOAA National Marine Fisheries Service (NOAA Fisheries Service); USFWS; FHWA; DEQ; the Environmental Protection Agency (EPA); and Oregon Department of Fish and Wildlife (ODFW). The working group focused on identifying the types of projects requiring stormwater treatment and establishing stormwater treatment and flow control standards, discussed in Chapter 11. Meeting these standards can streamline the process for compliance with federal ESA, Oregon ESA, and Water Quality Certification requirements.
The basic goal developed by the working group is to treat all of the stormwater from a project’s contributing impervious area (CIA, see Section 9-2) generated by the water quality design storm (see Section 4.1) using a preferred BMP (see Section 11.2).
S L OP E S IV
The Standard Local Operating Procedures for Endangered Species-IV (SLOPES-IV) is a programmatic biological opinion (BO) authored by the Corps and NOAA Fisheries Service that covers maintenance and construction activities associated with roads, culverts, bridges and utility lines. SLOPES-IV only applies to projects affecting anadromous salmonid species regulated by NOAA Fisheries Service. If the conditions described in SLOPES-IV are met, the streamlined permitting process can be used to meet federal ESA, Section 10 of the Rivers and Harbors Act, and Section 404 CWA Certification requirements.
J oint P ermit A pplic ation
In Oregon, a single permit application is used for compliance with many state and federal regulations. The Joint Permit Application (JPA) is submitted to the Corps and to DSL primarily for compliance with Section 10 of the Rivers and Harbors Act, Section 404 of the CWA, and the Oregon removal-fill permit program. The
The Joint Permit Application (JPA) may be obtained from the DSL website.

4 3 W a t e r R e s o u r c e s S p e c i a l i s t M a n u a l
JPA is also used to coordinate the Section 401 Water Quality Certification with DEQ, and fish passage and in-water work timing guideline review by ODFW.
44 W a t e r R e s o u r c e s S p e c i a l i s t M a n u a l
C HA P T E R 4 - HIG HWA Y HY DR OL OG Y A ND S T OR MWA T E R MA NA G E ME NT
4.1 Highway Hydrology
Hydrology is the study of water— its properties, where it occurs, how it moves, and how it interacts with the rest of the environment. The process that describes how water moves in its various forms is called the hydrologic cycle.
This section describes one part of the hydrologic cycle: what happens to water when it reaches the earth’s surface as rain or snow. It also describes how that water may impact receiving waters, particularly when ground cover is modified and vegetation is removed by transportation projects.
C limate and R ainfall
Climate and rainfall information is crucial to understanding the volume of stormwater that must be managed.
Precipitation amounts vary widely in Oregon. Portland experiences an average of 36 inches of rainfall, with most precipitation occurring as rain. On the Oregon coast, Tillamook receives an average of 89 inches of rainfall. In eastern Oregon, Pendleton receives 13 inches in an average year.
Individual Storms For stormwater management, however, the amount of rainfall during individual or back-to-back events (storms) is more important than average annual rainfall because stormwater management facilities must convey, treat, and control runoff from those storms.
ODOT designs stormwater management facilities based on design storms of specific recurrence intervals or probabilities of occurrence. The design storms are specified by the recurrence interval and the duration of the individual event; for example, the 10-year, 24-hour storm. Design standards are based on acceptable risk and cost considerations. Recurrence intervals, whether for precipitation or flood events, are referred to either by the average time span between events or by their exceedance probability. The exceedance probability of an event with a specific recurrence interval is equal to 1 divided by the recurrence interval ”N” (1/N). For example, the probability of a 50-year design storm occurring in any
The exceedance probability is the chance that a storm of a given chance or greater will occur in any given year. A 50-year design storm, for example, would be expected to occur on average once every 50 years but could occur more or less frequently.
4 5 W a t e r R e s o u r c e s S p e c i a l i s t M a n u a l
given year is 1/50, which is 0.02 or 2 percent. The probability of exceeding the N year event once or more within “x” number successive years is 1-(1 - 1/N)x. For example, the chance that a 50-year or larger event will occur during a 20-year span is 1 – (1 – 1/50)20, which is 0.33 or 33 percent.
The ODOT Precipitation Data Viewer GIS gives the precipitation for 24 hour events for any location selected on the map. The recurrence intervals included in this tool are 6 months, and 2, 5, 10, 25, 50, 100, 500, and 1000 years.
ODOT Precipitation Data Viewer
The National Oceanic Atmospheric Administration (NOAA) has published precipitation frequency maps for the western United States that contain isopluvial maps for common design storms for the state of Oregon. These design storms are defined by the recurrence interval (in years) and the duration (in hours). The maps may be accessed at https://www.wrcc.dri.edu/pcpnfreq.html. If the specific location of interest is located between two isopluvials, use an average (scaled as appropriate depending on the location’s proximity to one of the isopluvials) to estimate the precipitation.
For ODOT stormwater management facilities, the following design storms are most frequently used (Table 3-1 of the Hydraulics Manual [ODOT 2005]):
2-year, 24-hour (the water quality design storm is a fraction of the 2-year, 24-hour design storm, with the fraction dependent on project location).
10-year, 24-hour (for storm drains).
25-year, 24-hour (for storm drainage facilities such as outfalls from sags, energy dissipaters, and culverts, located on low traffic [less than 750 ADT] roads).
50-year, 24-hour (most culverts, bridges, energy dissipaters and outfalls from sags [for roads with greater than 750 ADT]).
Storm Shape In addition to the differences in average annual precipitation depth, there are differences in typical storm characteristics in different parts of the state. The Soil Conservation Service (formerly SCS; now NRCS) developed hyetographs for various storm types based on climate data and storm observations in various parts of the United States. These standard storm types (Types I, IA, and II apply in Oregon) approximate the distribution of rainfall during a typical storm in a particular location, and thus are used in the SCS method to determine peak storm flows, which are used as the basis for design. However, actual storms may vary significantly from the standard distributions.
An isopluvial is a line through geographical locations on a map with the same precipitation.
Hyetographs are graphical representations of the distribution of rainfall over time.
W a t e r R e s o u r c e s S p e c i a l i s t M a n u a l 46
Figure 4-1 shows the hyetographs for the three main storm types that are used for design purposes in Oregon. As noted previously, not every storm will match this pattern, but they represent the characteristics of the more frequent, lower peak storms experienced in the western part of the state (Type IA) and the less frequent, high intensity storms experienced elsewhere in the state.
The Oregon Engineering Handbook Hydrology Guide (USDA 1987) provides a map showing the geographic boundaries for each storm type in the state.
The western part of the state, from the eastern slopes of the Cascade Mountains to the Pacific Ocean, is characterized by a Type 1A storm distribution. The peak rainfall intensities associated with the Type IA storm distribution occurs approximately 8 hours after the storm begins.
Type I storms apply to areas east of the Cascade Mountains. The peak of the Type I storm occurs at approximately 10 hours from the beginning of the storm. The rainfall distribution rises much more sharply than the Type IA storm, with 21 percent of the rainfall at the peak.
Some areas in eastern and northeastern Oregon represented by Type II storms. The Type II storm has its peak at approximately 12 hours. Like the Type I storm, the Type II has a much sharper peak than the Type IA storm, with nearly 28 percent of the rainfall occurring at its peak.
Des ign S torms
Design storms are used to determine the size and configuration of stormwater conveyance, storage and treatment facilities. ODOT uses several different design storms, depending on the purpose (see Table 3-1 from the ODOT Hydraulics Manual). Of particular interest for the Water Resources Specialist are the water quality design storm and the range of storms for flow control.
Water Quality Design Storm The Water Quality Design Storm defines the magnitude of the precipitation event that must be managed for water quality. Treatment facilities are to be designed to handle the volume and peak flow rate generated by the CIA during the Water Quality Design Storm.
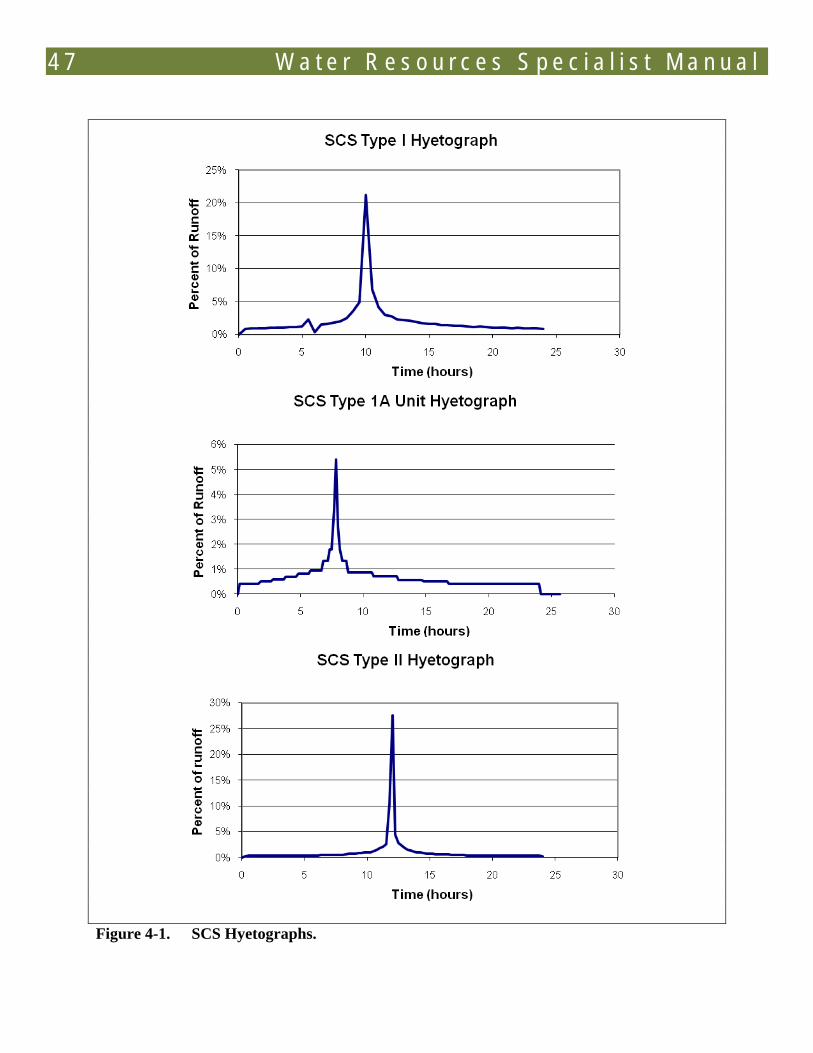
4 7 W a t e r R e s o u r c e s S p e c i a l i s t M a n u a l
Figure 4-1. SCS Hyetographs.
W a t e r R e s o u r c e s S p e c i a l i s t M a n u a l 48
Because Oregon’s climate varies across the state, each major climate zone has its own Water Quality Design Storm. Storms larger than the water quality design storm contribute only a small percentage of the annual runoff, so capturing large events has little water quality benefit, especially since the beginning part of the storm is treated.
For cumulative rainfall
• Climate Zone 4: 67 percent
from the 2-year, 24-hour storm for the project site, the Water Quality Design Storm is 50 percent except as follows:
• Climate Zone 5: 75 percent
• Climate Zone 9: 67 percent.
The ODOT Precipitation Data Viewer shows the water quality design storm zones.
Although in some parts of the state the calculated water quality design storm depth will be greater than 2.5 inches, ODOT uses a maximum design storm depth of 2.5 inches. ODOT has determined that this storm provides for enough wash off of pollutants and dilution so concentrations will be low. The minimum water quality design storm depth is 0.7 inches, even if the design storm depth calculated using the ratios above is less than that. Most of the design storms for the state fall within these bounds.
Flow Control Design Storms The Flow Control Design Storms define the range of events that are managed to protect channel form and processes. The storms correspond to the events with the same frequency in the receiving water that, if substantially modified, are likely to result in changes to the stream channel.
The goal is to maintain the frequency and duration of flows from pre –project to post-project from the lower endpoint of 42% of the 2-year event (west side) or 50% of the 2-year event (east side), to the upper endpoint of the smaller of either the 10-year event or the bank overtopping event.
Criteria are given as 24-hour precipitation events, with recurrence intervals equivalent to the receiving water’s flood recurrence interval. The range of flows varies between the east side and the west side of the state, and between incised and non-incised streams.
The lower end of the flows is roughly equal to the discharge where substantial bedload transport begins, or about two-thirds of bankfull. The frequency of
4 9 W a t e r R e s o u r c e s S p e c i a l i s t M a n u a l
bankfull discharge varies by region; therefore, the lower end is different for the west side of the state than the east side. The upper end is set at a point where larger events have little additional impact on the stream. Storms larger than the 10-year, 24-hour rainfall are infrequent, and the amount of runoff from them is not too affected by increases in impervious surface area. The alternative upper end, bank overtopping, results in little additional increase in stream flow velocities with further increases in discharge.
Precipitation events do not necessarily (or normally) correspond with stream flows with the same return frequency. However, by maintaining a sites’ pre-project hydrology, the impact to the stream from any given storm will not change after a project is completed.
Where Does S tormwater G o?
Regardless of what depth or distribution of rainfall occurs during a storm, the water that reaches the ground will take one of the following paths:
Evapotranspiration Rainfall that is intercepted by trees or other vegetation or taken up from shallow soil by plant roots returns to the atmosphere via evapotranspiration.
Abstraction Some rainfall is stored in surface depressions, eventually evaporating back into the atmosphere.
Infiltration Where the rate of precipitation is less than the permeability of soils and where there is no barrier to water entering the ground (paved surface, shallow bedrock or water table), water soaks into the ground in a process called infiltration. Where there is a barrier (less pervious soils; bedrock; shallow groundwater table) under the surface soil layers, water may infiltrate to a shallow depth below ground surface, then become shallow subsurface flow, or interflow. Interflow can contribute to storm discharges in streams, but at a much slower rate than surface runoff.
Some shallow subsurface water may also be taken up by vegetation and returned to the atmosphere via evapotranspiration.
Evapotranspiration is the transformation of water from liquid to vapor state from the combined processes of evaporation from open water or soil and transpiration (water that passes through plants then is returns to the atmosphere through the plant surface).

W a t e r R e s o u r c e s S p e c i a l i s t M a n u a l 50
Runoff Rain that is not returned to the atmosphere or infiltrated via the processes described above becomes stormwater runoff. The flow path and rate at which stormwater runoff moves along the surface depends on the steepness of the slope and the characteristics of the ground surface (e.g., dense or sparse vegetation, paved or unpaved, smooth or rough surface, compacted or loose soils, constant or variable slope).
At the top of slopes and on pavement, water will flow downhill at a relatively uniform, shallow depth. This is known as sheet flow. At some distance determined by topography and surface characteristics, the runoff will consolidate into shallow concentrated flow. The distance from the upper end of the watershed to the head of the concentrated flow is the sheet flow length. This length depends upon many factors including slopes, ground cover and precipitation, but will generally not exceed 300 feet. Typically, sheet flow length is longer with steep, impervious surfaces and shorter with shallow-sloped, pervious surfaces.
Runoff that has converged and flows in channelized routes is concentrated flow. The transition between sheet flow and channelized flow is shallow concentrated flow. Concentrated flow typically has a much faster conveyance than sheet flow. Eventually, the concentrated flow becomes large and powerful enough to begin forming a channel. First as rills, these eventually merge and form streams. Characteristics of channel flow vary greatly and must be considered on an individual basis. (See Chapter 6)
Time of Concentration Time of concentration is a measure of the time it takes the drop of water falling on the hydraulically most remote point in the watershed to travel to the outlet (point of concentration). During a storm, as the drop moves downstream it is joined by other drops, so the discharge steadily increases.
Complex drainage systems with multiple tributaries do not have a single time of concentration. Different parts will have different times of concentration, so peak flow from one tributary may reach the outlet sooner or later than peak flows from another tributary, complicating the calculation of the peak flow at the outlet. When assessing a watershed (undisturbed or developed), it is important to understand the timing of the runoff to determine whether a large percentage of the total volume of precipitation will pass the same point at the same time, producing a high, sharp peak, or whether it will have a broader but lower peak. Appendix 7-F of the Hydraulics Manual provides methods for calculating the time of concentration.
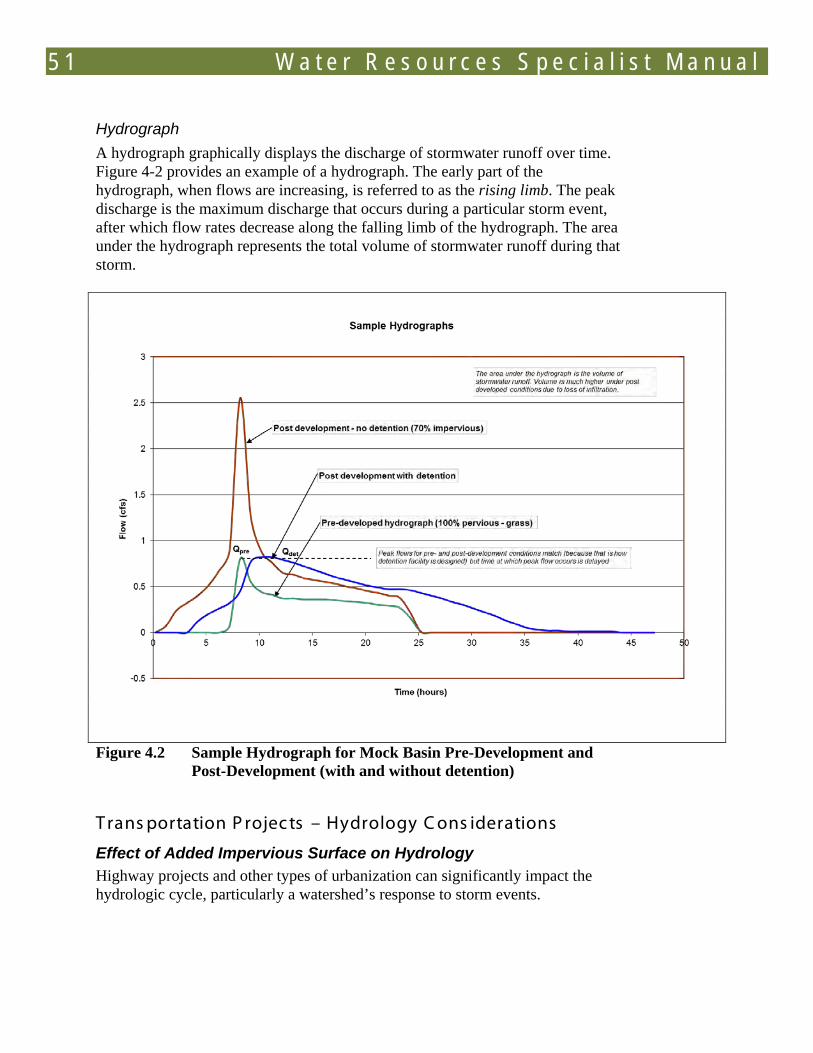
5 1 W a t e r R e s o u r c e s S p e c i a l i s t M a n u a l
Hydrograph A hydrograph graphically displays the discharge of stormwater runoff over time. Figure 4-2 provides an example of a hydrograph. The early part of the hydrograph, when flows are increasing, is referred to as the rising limb. The peak discharge is the maximum discharge that occurs during a particular storm event, after which flow rates decrease along the falling limb of the hydrograph. The area under the hydrograph represents the total volume of stormwater runoff during that storm.
Figure 4.2 Sample Hydrograph for Mock Basin Pre-Development and
Post-Development (with and without detention)
T rans portation P rojec ts – Hydrology C ons iderations
Effect of Added Impervious Surface on Hydrology Highway projects and other types of urbanization can significantly impact the hydrologic cycle, particularly a watershed’s response to storm events.
W a t e r R e s o u r c e s S p e c i a l i s t M a n u a l 52
The amount of stormwater that occurs as runoff is greatly increased as the watershed develops. The loss of vegetation that accompanies development means that less water is intercepted or evapotranspired by vegetation. The smooth grading and compaction of soils adjacent to roadways results in less infiltration or storage capacity on the unpaved surfaces.
Hydrograph Illustration of Development Impacts Figure 4-2 shows a hydrograph after development. For this example, the predevelopment conditions were 100 percent pervious (grass) and post-development conditions were 70 percent impervious and 30 percent pervious.
Development can affect the hydrograph by:
• Changing the timing at which the peak flow occurs, usually earlier in the storm
• Increasing the peak flow rate
• Increasing durations (the time period during which a receiving water experiences elevated flows)
• Increasing the runoff volume associated with a storm event.
• Reducing base flow discharge between storms.
Design Considerations Careful design and construction practices can reduce some of the hydrologic impacts of transportation projects. Incorporating LID practices (see Chapter 11) should be a priority where feasible, as they are designed to reduce the impact of development on site hydrology.
Rural and suburban highways frequently have some distance between the edge of the pavement and drainage ditches where highway runoff discharges as sheet flow. If vegetated, this area can function as a filter strip, providing water quality and hydrologic benefits. Depending on the length of the flow path and the quality of the soils, a substantial amount of the runoff may infiltrate in a filter strip.
Stormwater Management Stormwater runoff that is generated on or intercepted by an ODOT facility must be safely conveyed to an acceptable location to avoid becoming a traffic hazard. Often, this stormwater must be treated to protect receiving waters from water
5 3 W a t e r R e s o u r c e s S p e c i a l i s t M a n u a l
quality impacts and, depending on the project location, flow control facilities may be needed to prevent flooding and downstream channel erosion.
Stormwater conveyance may be an enclosed system consisting of pipes, catch basins or inlets, and manholes. This is most typical of urban settings with curbs and sidewalks. Alternatively, conveyance may consist of roadside ditches, as in many rural settings.
Stormwater treatment options are discussed in Chapter 11. LID and amended vegetated treatment facilities should be implemented to the extent feasible.
Flow control facilities are designed to temporarily store large volumes of water during a storm, so that downstream stormwater systems or properties are not flooded.
Stormwater management, conveyance, and treatment facilities are designed based on specific design recurrence intervals, typically ranging from a fraction of the 2-year event to the 100-year design storm. Table 3-1 of the Hydraulics Manual provides recurrence intervals to be used by hydraulic engineers when designing water quality and conveyance facilities for ODOT. The design recurrence intervals vary; for example, higher design recurrence intervals are used for facilities with higher risks in the event of failure during an extreme storm event.
Design storms for water quality treatment and flow control facilities are focused on minimizing impacts to receiving water. Many of the most significant impacts occur during smaller, more frequent events. Water quality design storms for ODOT projects are included in Table 3-1 of the Hydraulics Manual.
C alc ulating Dis c harges
Hydraulics engineers have several different models they can use to calculate discharges. The most common are single event models such as TR-55, the Santa Barbara Urban Hydrograph (SBUH) Method, or the Rational Method. Continuous flow models, often developed based on Hydrologic Simulation Program – FORTRAN (HSPF) are becoming more popular, but are rarely used in Oregon.
The Rational Method is typically used for sizing of conveyance systems, while TR-55 or SBUH are used to size many flow control and water quality treatment facilities. When calculating discharges to storm drains and receiving waters, it is important to assess both the resulting peak flows of storm events and the total volume. Peak flow has a direct impact on flooding hazards. If the capacity of any system is exceeded, be it man-made conveyance or a natural channel, it will flood. Predicting peak flows therefore helps in determining design capacity for conveyance. Total volume is important for the design of storage and detention
W a t e r R e s o u r c e s S p e c i a l i s t M a n u a l 54
facilities to ensure that their capacity is adequate to contain design storms. Changes in peak flow and total volume due to development will also have large impacts on stream hydrology and morphology.
Rational Method The Rational Method is a simple equation that estimates peak runoff discharge and is commonly used for sizing conveyance systems and stormwater facilities in small basins. The Rational Method formula is:
Q=Cf
Where:
CIA
Q = peak flow, cubic feet per second (cfs)
Cf
C = runoff coefficient, dimensionless
= runoff coefficient adjustment factor to account for reduction of infiltration and other losses during large storm events
I = rainfall intensity (function of Tc), inches per hour (in/hr)
A = Drainage Area (acres)
The Rational Method is described in detail in Appendix 7-F of the Hydraulics Manual. The description also includes a table of runoff coefficients and formulas for calculating the time of concentration (Tc).
Rainfall Intensity Rainfall Intensity- Duration- Recurrence Interval (IDR) curves are used to determine rainfall intensity (I) for the Rational Method, which is used to calculate peak flows. ODOT conducted a regional rainfall analysis comparing the IDR curves for 136 cities and areas throughout the state of Oregon in accordance with methods described in Precipitation-Frequency Atlas of the Western United States, Volume X – Oregon (NOAA 1973). Thirteen climate zones were established, reflecting areas with similar rainfall intensities. Appendix 7-A of the Hydraulics Manual lists the zones for cities in Oregon, and provides a hyperlink to a rainfall zone map which shows rainfall zones of the entire state. Designers can find the corresponding IDR curves in the remainder of the appendix.
5 5 W a t e r R e s o u r c e s S p e c i a l i s t M a n u a l
Runoff Coefficients Runoff coefficients, the factor “C” in the Rational reflect the ratio of rainfall to surface runoff. It is intended to capture several complex factors, including water storage in surface depressions, infiltration, ground cover, ground slopes, and soil types. The larger the number, the greater the percentage of precipitation that becomes surface runoff. Impervious surfaces have high (usually 0.9) runoff coefficients. Table 1 in Appendix F of Chapter 7 of the Hydraulics Manual lists runoff coefficients for various land uses as a function of slope (flat, rolling, or hilly).
The Soil Conservation Service (SCS) curve number (CN) is an index based on land use and hydrologic soil groups that is used in models such as TR-55 to determine runoff amounts. Though the runoff coefficient and SCS CN represent similar information, they are not interchangeable.
SBUH and TR-55 SBUH and TR-55 are single-event models that estimate a flow hydrograph for a representative rainfall event. The SBUH method was developed by the Santa Barbara County Flood Control and Water Conservation District. Applicable to urban areas, it converts design storm incremental excess rainfall depths into instantaneous unit hydrographs and routes them through an imaginary reservoir (Debo and Reese 2003).
The TR-55 method was developed by the Natural Resources Conservation Service (NRCS) to determine peak flows and discharge verses time for small rural watersheds. Appendix G of Chapter 7 of the Hydraulics Manual includes documents with detailed instructions for using the TR-55 method on ODOT projects.
The SBUH or TR-55 methods are appropriate for sizing most ODOT water quality and flow control facilities. There are proprietary stormwater models available that may be used to conduct SBUH modeling. Alternatively, a spreadsheet may be used. The standard design hyetograph for ODOT is the same as that used for TR-55 (the SCS Type I, Type 1A, or Type II 24-hour rainfall distribution resolved into 10-minute time intervals).
The Water Resources Program Coordinator can provide a spreadsheet model that may be used to perform SBUH modeling.
Continuous Flow Model Continuous modeling accounts for hydrologic responses over a wider range of time than single event modeling or the Rational Method. This allows for storms
W a t e r R e s o u r c e s S p e c i a l i s t M a n u a l 56
that may occur before or after design storms to be factored into the calculations and therefore produces a much more accurate, long-term representation of local hydrologic responses. Continuous models typically use local precipitation records, rather than a general storm hyetograph, to produce better estimations of runoff.
Single event modeling has several limitations that can affect the design of stormwater facilities. Inherent in the modeling are assumptions that detention facilities are empty and therefore have 100 percent capacity available, the ground is not already saturated, and that the watershed will fully return to a “normal” state before the next storm event. Therefore, facilities designed based on single event modeling may not perform well when these conditions do not apply. Continuous modeling allows for the consideration of adjacent events and can therefore account for long-term runoff and soil moisture conditions. Continuous modeling can also be used to determine flow duration and water level fluctuations, which are important considerations for discharging to streams and wetlands.
The HSPF is one example of a continuous model that can be used for runoff simulation. However, it requires specific expertise and requires a substantial effort. At present, there is no readily available, calibrated, continuous flow model for the state of Oregon. However, other regions in the Pacific Northwest have developed calibrated user-friendly programs based on HSPF that allow for design using continuous modeling (for example the Western Washington Hydrology Model).
4.2 S tormwater Drainage S ys tems
Stormwater drainage systems are natural or constructed facilities that provide conveyance, stormwater treatment and flow control for stormwater as it flows to groundwater and/or surface receiving waters. Stormwater conveyance systems can be enclosed pipes or open channels.
Stormwater treatment is described in Chapter 11.
S tormwater C onveyanc e
Enclosed Stormwater Conveyance Systems Enclosed conveyance systems used for road projects typically include curbs and gutters, which collect runoff and direct it to inlets or catch basins that serve as entry points to the piped storm sewer system. Storm sewers convey stormwater to treatment, detention, and/or receiving waters. Manholes provide access to the storm sewer system for maintenance and connecting pipe networks. Information
If stormwater is managed entirely through infiltration or dispersion, no conveyance system would be needed.
Pipe cover refers to the vertical separation between the pavement subgrade and the top of a pipe.
5 7 W a t e r R e s o u r c e s S p e c i a l i s t M a n u a l
about the design of these systems, including pipe materials, minimum pipe diameter, pipe slope, pipe cover, and minimum manhole spacing is provided in the ODOT Hydraulics Manual. Standard details for manholes, inlets, catch basins, and pipe trench sections are provided with the roadway drawings on the Oregon Standard Drawings and Oregon Standard Details web page.
Curbs, gutters and pipe systems have no water quality benefits, but they can be fitted with devices that do provide water quality treatment. Catch basins and manholes may be designed to include proprietary treatment systems.
Beyond the lack of any innate water quality improvement, enclosed stormwater conveyance systems risk illicit connections and/or dumping into drains. Unauthorized connections to the transportation storm sewer may be made by accident or intentionally, but in either case they can discharge pollutants into the storm sewer. Even legal connections may cause problems, as treatment facilities may not have been adequately sized for associated storm flows.
Open Ditch Stormwater Conveyance Systems Open ditch conveyance systems are channels alongside the side of a roadway designed and maintained to collect roadway drainage and convey it downstream. The sides and bottom of the ditch may be lined with vegetation, rock, concrete, or bare earth. The absence of curbs allows stormwater to discharge as sheet flow from the pavement down the side slopes of the ditch. When stormwater is conveyed in an open ditch system, culverts are needed to convey the stormwater under driveways and street crossings.
The function of an open ditch system contrasts with the function of a swale, which is designed to improve water quality. Vegetated swales have flat or moderate longitudinal slopes and large cross-sectional areas that increase the amount of time that stormwater is in contact with the vegetation, thereby increasing pollutant removal. However, a ditch conveyance system would be considered preferable to an enclosed conveyance system because of the level of treatment. Chapter 11 has information on stormwater treatment performance of various BMPs, including relative removal efficiencies of enclosed and ditch conveyance systems for various pollutants.
Infiltration or Filter strips Runoff for road projects has traditionally been managed with ditches and detention. As an effort to reduce impact, it is increasingly common on transportation projects to infiltrate road runoff using vegetative filter strips. These BMPs are designed to prevent concentration of runoff, so that water sheet flows away from the road over a highly pervious adjacent “strip”. These strips will often contain special vegetation, and subsurface filter layers to treat runoff. Well-
Concentrated flow (as in a ditch) through vegetation can provide good treatment if the flow is shallow and vegetation dense.
A water quality issue with ditches is erosion of the ditch line. Steep gradients or erodible soil may lead to downcutting or widening of the ditch, with downstream increases in turbidity or sedimentation. Ditches also sometimes intercept subsurface drainage from poorly placed septic tank drain fields.
W a t e r R e s o u r c e s S p e c i a l i s t M a n u a l 58
draining soils are typically required for full infiltration. In certain cases where soils are not ideal, a perforated pipe may be installed at the base of the filter strip structures to convey stormwater during large storm events.
Where soils are not appropriate for infiltration, filter strips function as biofiltration facilities, providing water quality treatment, but only incidental infiltration of runoff. Design of these facilities is not performed using one of the methods described previously; rather, they are designed using a variation of the Manning’s Equation.
S tormwater F low C ontrol
Hydrologic changes caused by increased development and impervious area can cause significant adverse impacts to channels and other receiving waters, increasing runoff volumes, peak flows, and flow duration, and decreasing groundwater recharge. To mitigate these hydrologic changes and their impacts, designers can use dispersion, infiltration, or detention. When designed to mimic the natural hydrologic system, the use of these techniques is often referred to as LID.
Flood Routing In addition to reducing peak flows and flow durations, detention systems may also affect the timing of flows in the stormwater drainage system, delaying the time at which peak flows occur. This can be beneficial if the detention facility is located in the upper part of the watershed, and the stormwater is released after the lower portion of the watershed has drained. However, detention in the lower portion of the watershed, if not carefully planned, may delay the flow just long enough to add it to the peak flow coming from the upper portion of the watershed, resulting in a more serious flooding problem.
To illustrate this concept, Figure 4-3 shows hydrographs from a basin where detention is applied to a project in an upper subbasin, and middle and lower subbasins are unchanged. The post-construction hydrograph for the whole basin has a lower peak flow than in the pre-construction condition, reducing channel impacts.
Conversely, Figure 4-4 shows hydrographs from a basin where detention is applied to a project in a lower subbasin, and the upper and middle subbasins are unchanged. The post-construction hydrograph for the whole basin has a higher peak flow than in the pre-construction condition, potentially aggravating flooding and erosion problems.
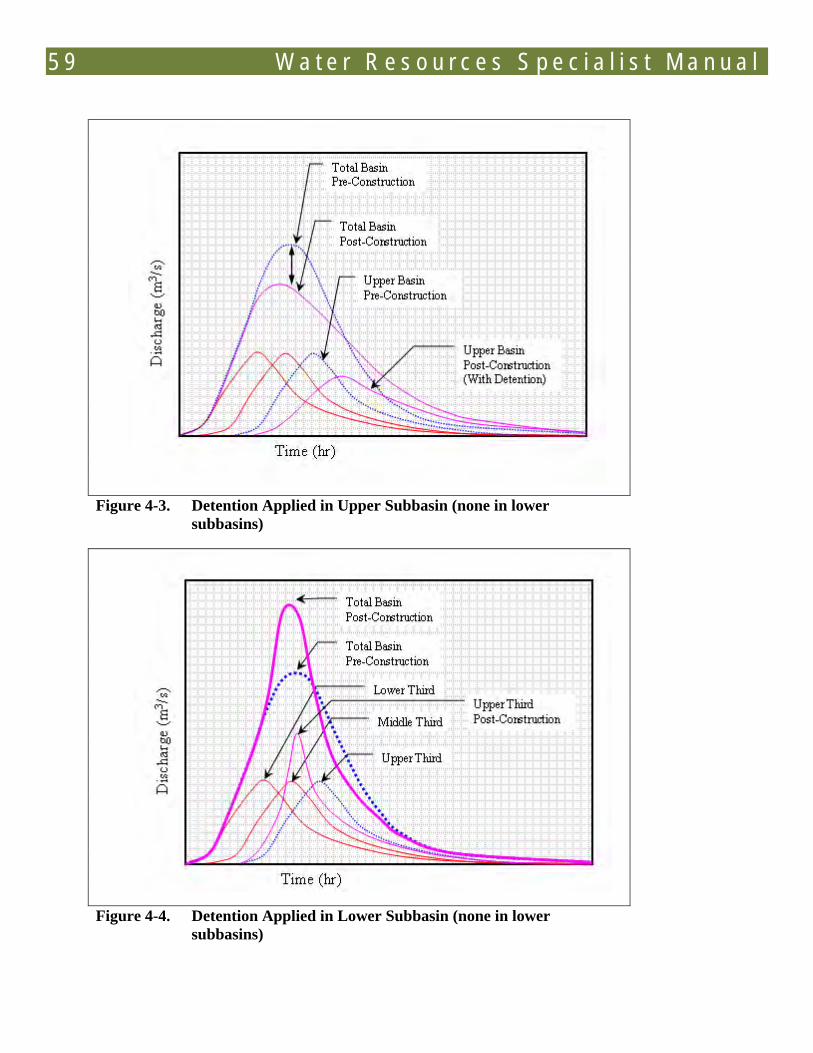
5 9 W a t e r R e s o u r c e s S p e c i a l i s t M a n u a l
Figure 4-3. Detention Applied in Upper Subbasin (none in lower
subbasins)
Figure 4-4. Detention Applied in Lower Subbasin (none in lower
subbasins)
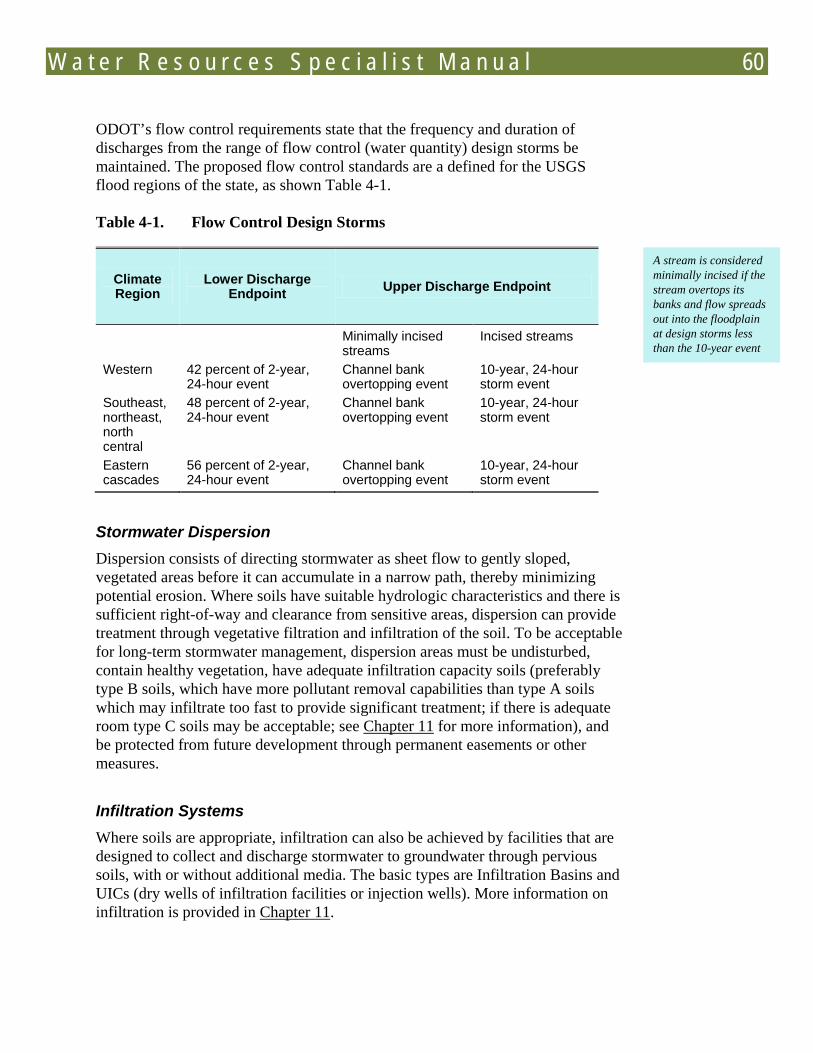
W a t e r R e s o u r c e s S p e c i a l i s t M a n u a l 60
ODOT’s flow control requirements state that the frequency and duration of discharges from the range of flow control (water quantity) design storms be maintained. The proposed flow control standards are a defined for the USGS flood regions of the state, as shown Table 4-1.
Table 4-1. Flow Control Design Storms
Climate Region
Lower Discharge Endpoint Upper Discharge Endpoint
Minimally incised streams
Incised streams
Western 42 percent of 2-year, 24-hour event
Channel bank overtopping event
10-year, 24-hour storm event
Southeast, northeast, north central
48 percent of 2-year, 24-hour event
Channel bank overtopping event
10-year, 24-hour storm event
Eastern cascades
56 percent of 2-year, 24-hour event
Channel bank overtopping event
10-year, 24-hour storm event
Stormwater Dispersion Dispersion consists of directing stormwater as sheet flow to gently sloped, vegetated areas before it can accumulate in a narrow path, thereby minimizing potential erosion. Where soils have suitable hydrologic characteristics and there is sufficient right-of-way and clearance from sensitive areas, dispersion can provide treatment through vegetative filtration and infiltration of the soil. To be acceptable for long-term stormwater management, dispersion areas must be undisturbed, contain healthy vegetation, have adequate infiltration capacity soils (preferably type B soils, which have more pollutant removal capabilities than type A soils which may infiltrate too fast to provide significant treatment; if there is adequate room type C soils may be acceptable; see Chapter 11 for more information), and be protected from future development through permanent easements or other measures.
Infiltration Systems Where soils are appropriate, infiltration can also be achieved by facilities that are designed to collect and discharge stormwater to groundwater through pervious soils, with or without additional media. The basic types are Infiltration Basins and UICs (dry wells of infiltration facilities or injection wells). More information on infiltration is provided in Chapter 11.
A stream is considered minimally incised if the stream overtops its banks and flow spreads out into the floodplain at design storms less than the 10-year event
6 1 W a t e r R e s o u r c e s S p e c i a l i s t M a n u a l
Low Impact Development LID designs reduce impervious surface and promote infiltration to mimic natural landscape function. LID techniques are preferred where site conditions and project constraints allow, because they reduce runoff volume and channel flow durations and peak flows. They also help recharge groundwater. For many transportation projects, soils, slopes, limited right-of-way, and neighboring land uses will prevent LID measures from managing all of the stormwater. For those sites, engineered detention systems may also be required to reduce peak flows and/or flow durations. See Chapter 11 for more information on LID design.
Detention Systems Detention systems store stormwater temporarily during storm events in ponds, vaults, tanks, or pipes; then release the stormwater gradually at a slower rate than the water entered the system. Detention systems reduce the peak flows to receiving waters that are associated with large storm events. Large detention facilities can also reduce the durations of elevated flows by releasing the water at a substantially lower rate. See the discussion on flood routing, previously in this chapter, for more information.

63 W a t e r R e s o u r c e s S p e c i a l i s t M a n u a l
C HA P T E R 5 - WA T E R QUA L IT Y
Knowledge of water quality and stormwater treatment is critical for estimating water quality impacts of transportation projects and ensuring that stormwater treatment BMPs are appropriate and effective. The Water Resources Specialist is not responsible for BMP design, but must understand how BMPs function and when to apply them. This chapter explains BMP function and application by addressing:
• Major pollutants of concern from road projects
• Water chemistry, including speciation, impacts of pH, salinity, and other factors that can affect the composition of stormwater and forms of pollutants present
• Impacts of water quality pollution on salmon
• Water quality monitoring.
See Chapter 11 for information on stormwater treatment mechanisms and BMPs.
5.1 Major P ollutants of C oncern and Their S ources
The major pollutants in roadway stormwater are:
• Sediments/solids
• Metals
• Petroleum products (oil and grease)
• PAHs
• Nutrients and organic compounds
• Chemical and Biological oxygen demand
• Bacteria
Increased stream temperatures are also a concern with highways, but in Oregon that is not usually associated with highway runoff.
W a t e r R e s o u r c e s S p e c i a l i s t M a n u a l 64
Each pollutant has unique physical and chemical characteristics that can impact aquatic organisms and affect treatment considerations.
S ourc es
Traffic Vehicles introduce pollutants on highway surfaces through combustion of fuel, rusting, and wear of vehicle parts and tires, drippings, and wear of the pavement.
While vehicles are the major source of pollutants, traffic volumes are not highly correlated with pollutant loads and concentrations in stormwater. Other sources and factors are more significant than ADT. For water quality purposes, high-traffic highways have ADTs greater than 100,000, moderate traffic highways have ADTs between 30,000 and 100,000, and low traffic highways below 30,000 ADT. Very low traffic highways are considered to be under 7,500 for urban roads, or under 15,000 for rural roads.
Maintenance Activities The major source of Maintenance-related pollutants is winter efforts to keep the highways open and drivable. ODOT uses gravel to increase friction on snow and ice, and magnesium chloride to prevent and remove ice build-up. Wash off and side casting of sanding gravel can contribute coarse and fine sediment into streams, ponds and lake, and can increase turbidity. Magnesium chloride can also migrate to surface waters, though so far elevated chloride levels have not been identified as a problem in Oregon.
Preventing vegetation from encroaching into the gravel shoulder and possibly disrupting the pavement may require the use of herbicides. Ditch cleaning can entirely remove lining vegetation, leaving the bed and side vulnerable to erosion. Opening clogged culverts will produce temporary sediment plumes if water is flowing.
Adjacent Land Uses Activities on properties next highways can send pollutants into the right-of-way and onto the road surface. Sediment can come from plowing, and applied fertilizer, herbicides and pesticides can drift towards the highway. Industry is a source of a multitude of chemicals; residential areas often have high use of lawn chemicals, and oils come from parked cars.
The density of adjacent development and amount of associated impervious surface are important factors in the concentration and load of pollutants in highway runoff.
6 5 W a t e r R e s o u r c e s S p e c i a l i s t M a n u a l
Airfall Any activity that sends pollutants into the atmosphere is a source of stormwater pollutants. Industry spews out metals and other chemicals in its emissions. Plowing in agricultural fields can stir up dust that carries nutrients and pesticides. Pthalates, which have become ubiquitous in the environment, get into highway runoff through airfall. The closer the source of airborne pollutants the greater the effect on highway pollutant load, but distant sources can also be contributors.
P ollutants
Sediment Sediments and solids are generated by:
• Vehicles (tire wear, brake wear, and body rust)
• Combustion byproducts
• Pavement wear
• Roadway maintenance (sanding and anti-icing chemicals)
• Soil erosion from adjacent agricultural and landscaped areas
• Atmospheric deposition.
Solids are transported in runoff in several ways: as bed load (large particles), in suspension (small and colloidal particles), and in solution (salts).
Metals Metals are largely derived from the wear of vehicle parts. Brake pads are a major source of copper. Tires and gasoline can also contribute metals. Offsite sources include airfall from industry, and agricultural chemicals.
These metals are partitioned between particulate (adsorbed to solids) and dissolved phases as they are transported in stormwater. Dissolved metal is the portion of the load that passes through a 0.45 micron filter, and consists of bound, complexed, and ionic components. Dissolved metals generally are more bio-available (readily absorbed by organisms), and have many adverse effects on fish and wildlife.
W a t e r R e s o u r c e s S p e c i a l i s t M a n u a l 66
Petroleum Products and Byproducts
Oil and grease come primarily from dripping from vehicles. Combustion of gasoline produces polycyclic aromatic hydrocarbons (PAHs). Tests of fresh asphalt (cured less than a day) shows that asphalt is not really a source of PAHs, but parking lot sealant is a major source. Combustion of petroleum outside of the right-of-way is another important source of PAHs.
Oil and grease are immiscible in water and float on the surface if not attached to sediments. PAHs are usually, but not always, bound to sediments, with some PAHs being more soluble than others.
Nutrients Nutrients are added to highway stormwater runoff by air deposition, dirt from vehicle tires, beds of vehicles that transport construction or agricultural materials, and roadside soil amendments and landscaping. The primary nutrients of concern are nitrates and phosphorus.
Phosphorus is transported by becoming attached to particles and in a dissolved phase. Nitrate is highly soluble, making it a special concern to groundwater. Nutrients in stormwater are usually reported as total phosphorus, ammonia and total kjeldal nitrogen.
Chemical and Biological Oxygen Demand Chemical and biological oxygen demand (COD and BOD) are measures of oxygen demand in water. Chemical oxygen demand is a measure of the total oxygen required to oxidize all compounds (both organic and inorganic) in water. Biological oxygen demand is a test used to measure the concentration of biodegradable organic matter in runoff. Chemical oxygen demand is related to both total suspended solids and oil and grease in the stormwater, but there does seem to be a correlation between ADT and Biological oxygen demand. The contributing pollutants will have multiple sources.
Other Chemical Pollutants A few select herbicides are used by ODOT Maintenance, with strict requirements for those that may be used near water bodies. Other herbicides may drift or be carried into the highway right-of-way. Other pollutants, such as pthalates, PCBs, phenols, are derived either from pre-highway contamination or transported from outside the right-of-way.
6 7 W a t e r R e s o u r c e s S p e c i a l i s t M a n u a l
Bacteria While bacteria in stormwater are not directly linked to vehicle traffic, roadways and adjacent right-of-way can be a bacterial source due to wildlife activity, roadkill, and garbage. Malfunctioning septic systems adjacent to the highway may contaminate stormwater in roadside ditches or storm sewers.
Bacteria, usually measured by either fecal coliform or by e. coli, impact the use of water for drinking and recreation. Contamination of shellfish is also an issue.
Temperature Highway projects can also cause temperature impacts on receiving water, but usually through the removal of shading riparian vegetation . Oregon’s climate, with dry summers, means that highway runoff is not usually a source of elevated stream temperatures. Even in eastern Oregon, where summer thunderstorms with rain are not uncommon, the low volumes of rainfall and relative infrequency of the events means that highway runoff is at most a minor factor.
5.2 Water C hemis try
Pollutants in stormwater can be affected by multiple chemical factors including pH, hardness, salinity, and temperature.
pH
In addition to direct impact on fish and other wildlife, pH also significantly affects other chemical characteristics of stormwater. Lowering pH increases the solubility of metals, resulting in a higher fraction of metals present in the dissolved state. Raising pH increases the levels of the more toxic form of ammonia (Pacific EcoRisk 2007).
Hardnes s
Water hardness measures the presence of multivalent cations (positively charged ions) dissolved in water, particularly calcium and magnesium divalent cations (ions with a charge of +2). Increased water hardness typically decreases the toxicity of metals for fish. Because of this, Oregon water quality criteria (WQC) for most metals in fresh water are calculated based on hardness (OAR 340-041-0033). Hardness does not have a substantial effect on the toxicity of metals for fish in marine waters. Oregon WQC for metals in marine waters therefore are not hardness-dependent.
pH is a measure of hydrogen ion concentration, with low pH (pH<7) being acidic, pH = 7 being neutral, and high pH (7<pH<14) being basic or alkaline.
W a t e r R e s o u r c e s S p e c i a l i s t M a n u a l 68
S alinity and T emperature
Salinity is the dissolved salts content of a body of water. Increases in salinity of surface waters can reduce the amount of oxygen that can be dissolved in the water. Increased temperature has a similar effect on dissolved oxygen. Salinity also affects metal toxicity, frequently increasing it.
5.3 T rans port of S tormwater P ollutants
Stormwater pollutants enter receiving waters through many routes. The following sections describe what happens to stormwater pollutants when these substances come into contact with stormwater.
Initial T rans port
Pollutants are deposited on road surface as particulates (e.g., brake pad dust, dirt, and salt) and liquids (e.g., oil, antifreeze, gasoline), then washed off the undercarriage of vehicles during storm events (e.g., rusted metal, hydrocarbons), or washed onto roads from adjacent exposed soils or landscaping. Pollutants on the roadway surface may coat or bind to soil particles, or may remain unbound on the road surface.
When precipitation hits impervious surfaces such as roadways, roofs, and sidewalks, contaminants may be picked up and transported in stormwater runoff, whether bound to particulate matter, dissolved in solution, or in suspension. Particulate material may be transported as suspended load or as bed load (bumping along the bottom or “bed” of the channel).
During “ F irs t F lus h”
Pollutant concentrations may peak during the “first flush” of a storm, but concentration peaks may or may not coincide with the load peaks since that is a factor of both concentration and volume of runoff. Different pollutants may also have peaks at different times during a storm, depending on how easily they are entrained. The prominence of the first flush varies considerably between storms and between locations. Factors influencing the magnitude of the first flush include the availability of pollutants on the road surface, and the form of the drainage area. The simpler and shorter a drainage area is, the more likely it is that the first flush will be clearly expressed.
Along with the storm event first flush, there may be a seasonal first flush when pollutants that have accumulated during an extended dry period are collected
First flush describes the elevated pollutant concentrations that are often experienced during the initial part of a storm (approximately the first half inch of rainfall in many parts of Oregon) as available pollutants are collected and transported.
6 9 W a t e r R e s o u r c e s S p e c i a l i s t M a n u a l
during the first storms of the season. Larger pollutant loads and higher median concentrations are often observed during the first storms of the season than storms later in the wet season or those closely following a series of storms. A seasonal first flush is not always present.
A fter E ntry into a Water B ody
Once stormwater carrying pollutants enters a receiving water body, several things can happen to the pollutant load. Compounds bound to soil and other solids may settle out of the water column or be filtered out by vegetation. Chemicals can be removed from the water column by biological uptake (i.e., plants and aquatic animals), or become attached to sediment and organic matter. Pollutants also may be degraded biologically (e.g., by microbes), chemically, or with sunlight (photodegradation). Compounds that are not removed from the water column may be transported to other water bodies. Pollutants that are deposited and removed from the water column may be re-entrained later, either by erosion, or by reentering a dissolved state if the chemical environment changes.
During Downs tream T rans port
During transport downstream, the concentration of pollutants from a discharge of highway runoff will decrease through three mechanisms. The first is dilution by increased flow in the stream from tributaries and additional base flow. Second is pollutant removal as described above. Finally, dispersion as the plume of stormwater becomes elongated due to mixing and irregular flow within the stream. This last effect means that the peak concentration in the plume will decrease, while the extent of the plume will increase. These mechanisms are important concepts in the justification of the delineation of the stormwater action area for ESA purposes (see Chapter 3).
5.4 Impacts of Water Quality P ollution on A quatic Organis ms
Fisheries are an important resource in Oregon. However, many crucial salmon populations have declined so low that they may not survive, with many populations listed as T&E under the ESA (see Chapter 3). Other listed fish species in Oregon include the bull trout, the Oregon chub, the eulachon (smelt), the green sturgeon, and the Lost River and longnose suckers. While these species have differing habitat requirements and tolerances, all are vulnerable to increased pollutant loads and concentrations.
Pollutant loads refer to the mass of pollutants, or the total amount delivered to the storm system or receiving waters independent of the volume of stormwater.

W a t e r R e s o u r c e s S p e c i a l i s t M a n u a l 70
Anthropogenic (human-caused) pollution via stormwater can harm fish by reaching lethal levels of toxicity, by affecting the health and viability of fish populations, by damaging or changing food sources (such as macorinvertebrates), and by physical changes to the aquatic habitat. To protect this dwindling resource, stormwater must be treated based on both pollutants generated and vulnerability of species in receiving waters.
The toxicity to fish of a given chemical is often not directly related to chemical concentration. Instead, toxicity to fish is affected by the bioavailability of the compound. Bioavailability of a compound to fish can be affected by water temperature, pH, dissolved organic carbon, suspended sediment, and hardness (pH and hardness are discussed in water chemistry section of this chapter); other water quality parameters are discussed below.
Water T emperature
Salmonids are cold-blooded organisms and require a cold water habitat. Elevated temperatures can have lethal or non-lethal effects, depending on the temperature and duration of exposure. Acute non-lethal effects of temperature include behavior adjustments such as reduced feeding and relocation to cooler waters. Chronic non-lethal effects of elevated temperatures include reduced growth and development, both of which can affect survival and reproduction (Sullivan et al. 2000).
S ediment
Sediment can affect fish both directly (when suspended) and indirectly (when settled and accumulating). In suspended form, sediment may damage gill tissue, particularly if the sediment particles are angular. Salmon are sight feeders, and murky waters decrease their ability to find food. Suspended solids also can increase the stress response in fish, which in time can disrupt the proper functioning of other systems and alter fish behavior. Suspended solids may have a substantial effect on the bioavailability of other pollutants. Contaminants can absorb or bond to the surface of the particles, preventing them from being absorbed by fish and becoming toxic.
When sediments settle and accumulate they can degrade fish habitat, including sensitive spawning habitat which usually requires clean gravel. Changes in a water body’s substrate due to excessive sedimentation can also lead to a change in the benthic macroinvertebrate community, and thus food sources for fish. Impairment of habitat can have long-term or delayed adverse effects on fish populations.
Bioavailability is the ability of a substance to interact with an organism in a physiologically meaningful way (e.g., tissue uptake, bioaccumulation in tissue, metabolism) (Pacific EcoRisk 2007).
7 1 W a t e r R e s o u r c e s S p e c i a l i s t M a n u a l
Metals
Stormwater from roadways contains metals in concentrations that may be toxic to fish, particularly copper, zinc, lead, and cadmium (Pacific EcoRisk 2007). The three known physiological pathways of metal exposure and uptake in salmonids are gill surfaces, olfactory receptor neurons, and the digestive system (Niyogi et al. 2004; Baldwin et al. 2003). Dissolved metals are the most bioavailable form, and can be taken up by the fish directly through the gills (Kerwin and Nelson 2000).
Toxicity is affected by water’s pH, hardness and salinity, and by other chemicals in the water.
Copper Dissolved copper is a common roadway stormwater pollutant that can have dramatic affects on salmon. Salmon may completely avoid areas with copper levels as low as 2.3 μg/L (Sprague 1964). Ingestion of copper or other metals tends to have long-term chronic effects. Copper rarely occurs at levels that are lethally toxic to fish by uptake through the gills, but sub-lethal damage is significant (Pacific EcoRisk 2007). Even at very low levels, dissolved copper can reduce the strength of a fish’s ability to smell. This can disrupt a number of essential functions, including locating prey, avoiding predators, kin and mate recognition, contaminant avoidance, and migratory recognition of natal streams (Pacific EcoRisk 2007). Exposure to elevated levels of dissolved copper, such as at a stormwater outfall, can cause lasting damage to the salmon olfactory nervous system within minutes of exposure (McIntyre 2008). Dissolved organic carbon has been shown to reduce the toxicity of dissolved copper.
Zinc Zinc can occur at high enough levels in roadway runoff to approach lethal levels, and could cause effects depending on its bioavailability. Sub-lethal levels of zinc may cause fish to avoid contaminated areas.
Lead Lead typically does not occur at high enough levels in roadway runoff to be lethal to fish, but sub-lethal levels may disrupt estrogen sensitivity and cause sexual dysfunction (Pacific EcoRisk 2007).
Other Metals Cadmium is unlikely to occur in roadway runoff at sufficient levels and durations to cause non-lethal toxic effects in fish (Pacific EcoRisk 2007). Chromium may
W a t e r R e s o u r c e s S p e c i a l i s t M a n u a l 72
be a contaminant of concern, but it is not clear if bioavailable concentrations in roadway runoff would be high enough to be toxic to salmonids.
Nutrients
Nutrients consist of chemicals that stimulate growth, particularly nitrogen and phosphorus. The largest concern about nutrients is their overstimulation of algal growth in receiving waters, particularly stagnant waters such as ponds, lakes or sloughs. Algae may affect the food chain by competing for surfaces with organisms that salmon use as a food source, or in more extreme cases, cause eutrophication. Eutrophic waters experience explosive growth in algae populations, followed by a crash as nutrients are depleted. The algal die-off and decomposition uses up the dissolved oxygen in the water, causing fish and other aquatic life to suffocate.
Different forms of nitrogen and phosphorous exhibit different degrees of algal growth, with orthophosphates typically having the highest potential to cause eutrophication, usually because phosphorus is the nutrient limiting plant growth—many algae can fix their own nitrogen from the atmosphere. Stagnant waters and slow moving streams are particularly vulnerable to these hazards.
Organic P ollutants
Many different organic pollutants are toxic to salmonids, including pesticides, herbicides, pthalates, phenols, and PAHs. Typical levels of these pollutants in roadway runoff are not clearly defined, and in many cases may be below toxic concentrations (Pacific EcoRisk 2007).
A c ute and C hronic E ffec ts
Acute (limited duration) and chronic (longer duration) exposure of fish to contaminants can result in various non-lethal effects. Physiological effects include altered respiration rate, blood chemistry (glucose levels, cortisol levels, etc.), swimming speed, breathing rate, and oxygen consumption (Heath 1995). Numerous chemicals act as endocrine-disrupting compounds (EDCs), including estrogenic compounds, PAHs, flame retardants, and metal compounds Chambers and Leiker 2006). Chronic exposure to these compounds can affect fish behaviorally, resulting in altered hormone-dependent behaviors (e.g., spawning, migration), and physiologically, resulting in physical changes (e.g., intersex, the presence of both male and female reproductive organs in an individual).
7 3 W a t e r R e s o u r c e s S p e c i a l i s t M a n u a l
5.5 Indirect Impacts to Water Quality
The placement and design of highway facilities can modify elements of the landscape that have beneficial hydrologic and water quality functions. Those modifications can affect the hydrology and water quality of receiving waters, even if no highway runoff reaches them. The most important of these landscape elements are riparian zones and wetlands.
R iparian Zones
Riparian zones can, when in good condition, provide several water quality benefits. Trees and shrubs produce shading, which is important for regulating temperature in smaller streams. They also act as sources of food and nutrients for the biotic community of the stream, including macroinvertebrates, fish, and amphibians. During high flow events, the same trees and shrubs slow down overbank floodwaters and provide refugia for fish. Vegetation on the stream bank is important for controlling lateral erosion. Riparian zones can also be effective at removing nutrients, sediment and other pollutants carried by runoff from adjacent developed or agricultural lands.
Destruction of riparian vegetation can therefore lead to the following adverse impacts:
• Increased stream temperature
• Increased pollutant loads derived from adjacent land use
• Reduced food supply for aquatic animals
• Increased bank erosion, which in turn leads to increased turbidity, and potentially sediment deposits on spawning gravels and modified stream geometry
• Loss of high flow refugia for fish.
Wetlands
Wetlands provide both water quality and hydrologic benefits (see Chapter 7). Even degraded wetlands can effectively provide those functions. The wetlands usually perform these functions for the drainage area as a whole, not just for highway runoff. Impacts to wetland can reduce the capability and the capacity of the wetland to perform certain water resources functions. Loss of capability could result from changes in vegetation composition, structure or density, or from
W a t e r R e s o u r c e s S p e c i a l i s t M a n u a l 74
altered hydrology. Loss of capacity would result from a reduction of size, diversion of water away from the wetland, or other modification of the hydrology.
Loss of wetlands can lead to the following adverse impacts:
• Increased pollutant loads discharged to streams and lakes
• Higher flood peaks downstream of the wetland
• Reduced low flow discharges downstream of the wetland
• Loss of aquatic habitat.
Development
Induced or facilitated development may also be considered a secondary or indirect impact of a project on water resources. In Oregon, highway projects support the designated land uses, so it is rare that a highway project can be said to cause development, but they do support planned and approved development. The result of development is that expected from the addition of impervious area with new roads, buildings and landscape modifications. It is not the responsibility of the Water Resources Specialist to analyze the impacts from associated development in any depth, but they should be addressed for EAs and EISs.
5.6 Water Quality Monitoring Water quality monitoring studies are conducted to quantify the level of pollutants in stormwater and receiving waters, and include three components: hydrologic monitoring, sample collection, and laboratory analysis. Monitoring studies should be carefully designed and include a Quality Assurance Project Plan (QAPP) documenting objectives, procedures, quality assurance and quality control measures, and data quality objectives. Water quality monitoring studies can be designed to characterize runoff quality, characterize receiving water quality, or to evaluate the pollutant removal effectiveness of stormwater treatment BMPs.
Hydrologic Monitoring
Hydrologic monitoring provides instantaneous or continuous flow data associated with the water quality sampling event. Hydrologic data can help to determine rainfall-runoff relationships for drainage areas, and provide information from which pollutant load estimates can be calculated. Collection of flow data can be as simple as a single flow measurement collected during a storm event, or can
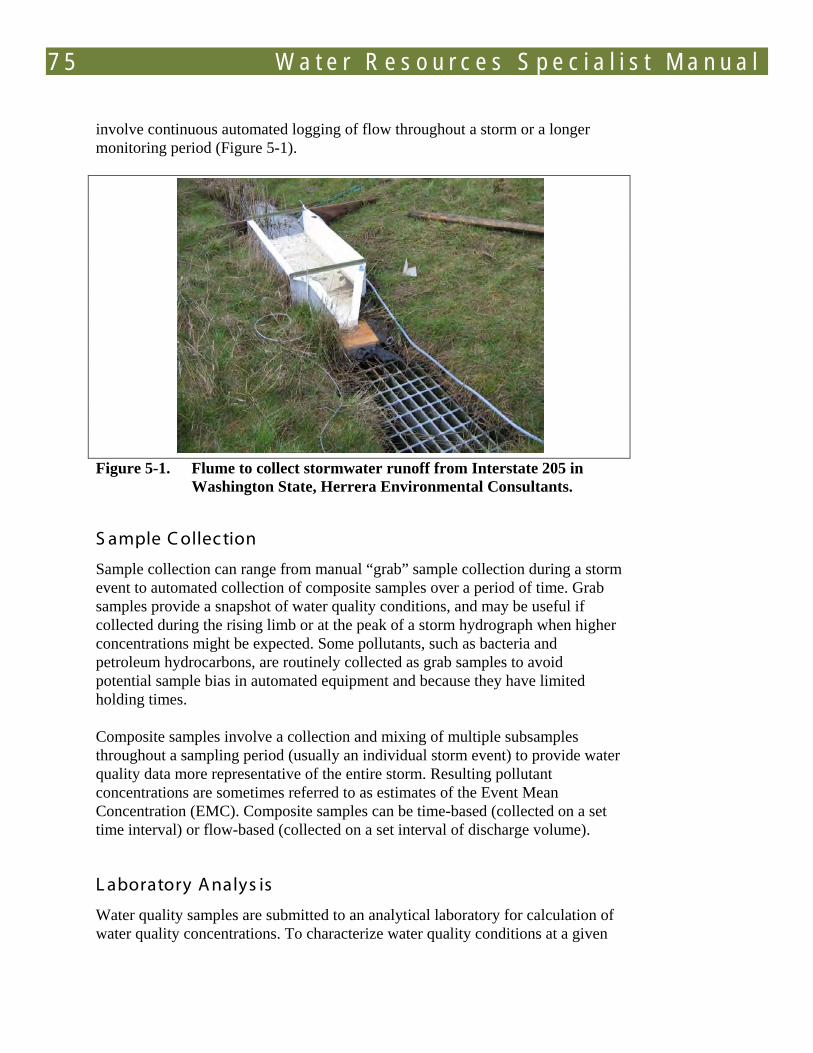
7 5 W a t e r R e s o u r c e s S p e c i a l i s t M a n u a l
involve continuous automated logging of flow throughout a storm or a longer monitoring period (Figure 5-1).
Figure 5-1. Flume to collect stormwater runoff from Interstate 205 in
Washington State, Herrera Environmental Consultants.
S ample C ollec tion
Sample collection can range from manual “grab” sample collection during a storm event to automated collection of composite samples over a period of time. Grab samples provide a snapshot of water quality conditions, and may be useful if collected during the rising limb or at the peak of a storm hydrograph when higher concentrations might be expected. Some pollutants, such as bacteria and petroleum hydrocarbons, are routinely collected as grab samples to avoid potential sample bias in automated equipment and because they have limited holding times.
Composite samples involve a collection and mixing of multiple subsamples throughout a sampling period (usually an individual storm event) to provide water quality data more representative of the entire storm. Resulting pollutant concentrations are sometimes referred to as estimates of the Event Mean Concentration (EMC). Composite samples can be time-based (collected on a set time interval) or flow-based (collected on a set interval of discharge volume).
L aboratory A nalys is
Water quality samples are submitted to an analytical laboratory for calculation of water quality concentrations. To characterize water quality conditions at a given
W a t e r R e s o u r c e s S p e c i a l i s t M a n u a l 76
site, many samples may be required to capture the natural variability of rainfall patterns and runoff water quality conditions. Pollutant loading estimates (estimates of mass of pollutant) over a given period of time (often one year) can be calculated using pollutant concentrations and knowledge of site hydrology.
Dissolved metals concentrations are routinely measured by filtering out particulates using a 0.45 micrometer filter; colloidal material smaller than 0.45 micrometers in size may pass through this filter. Therefore, the resulting metals concentrations measured may be an overestimate of the fraction that is truly in the dissolved state.
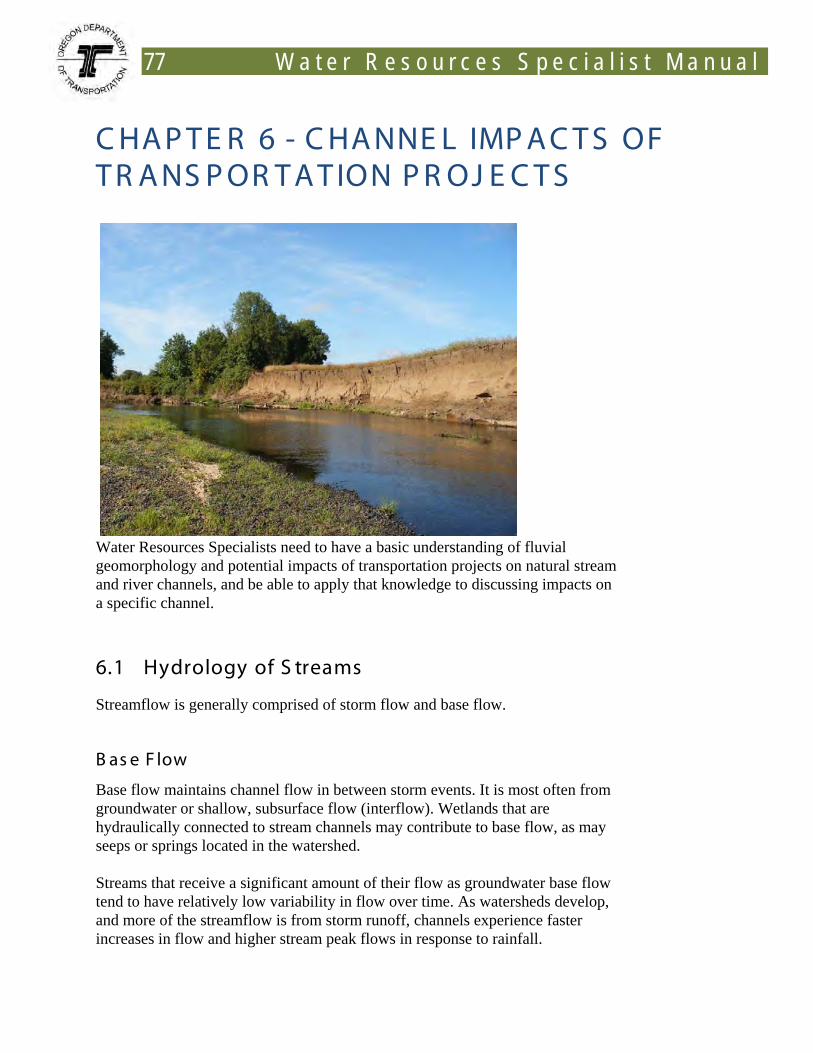
77 W a t e r R e s o u r c e s S p e c i a l i s t M a n u a l
C HA P T E R 6 - C HA NNE L IMP A C T S OF T R A NS P OR T A T ION P R OJ E C T S
Water Resources Specialists need to have a basic understanding of fluvial geomorphology and potential impacts of transportation projects on natural stream and river channels, and be able to apply that knowledge to discussing impacts on a specific channel.
6.1 Hydrology of S treams
Streamflow is generally comprised of storm flow and base flow.
B as e F low
Base flow maintains channel flow in between storm events. It is most often from groundwater or shallow, subsurface flow (interflow). Wetlands that are hydraulically connected to stream channels may contribute to base flow, as may seeps or springs located in the watershed.
Streams that receive a significant amount of their flow as groundwater base flow tend to have relatively low variability in flow over time. As watersheds develop, and more of the streamflow is from storm runoff, channels experience faster increases in flow and higher stream peak flows in response to rainfall.
W a t e r R e s o u r c e s S p e c i a l i s t M a n u a l 78
The hyporheic zone refers to the zone in the bed and banks of a river where there is interaction between river water and groundwater.
Methods of estimating streamflow for channels are discussed in Chapter 8.
S torm F low
Storm flow is surface runoff that enters streams promptly in response to rain or snowmelt events. Chapter 4 discusses factors that influence the amount and timing of storm flow that reaches stream channels.
Flood Frequency There is a statistically predictable relationship between size of a flood and the frequency of flood occurrence. A recurrence interval is the average time interval between the occurrences of a hydrologic event of a given or greater magnitude. The inverse of the recurrence interval is the probability that a storm of that size or greater will occur in a given year (see Chapter 4 for more information on recurrence intervals).
Certain frequency storms are significant for their impact on morphology or regulations (see Chapter 3). Some of the commonly used terms for channel stage (e.g. bankfull, OHW, channel overtopping, 2-year flood elevation) are discussed later in this chapter.
Though precipitation and climate information may use similar frequency statistics, a storm of a certain frequency (based on rainfall) usually does not cause a flood of the same frequency. Discharge in the stream at the start of the storm, other water sources such as snow melt, the extent of the storm (how much of the watershed is covered) and direction and speed of the movement of the storm across the watershed are among the factors influencing the effect of the precipitation on flood flows.
6.2 P otential C hannel Impacts of T rans portation P rojects
The most significant impacts of transportation projects on streams are related to one of the following:
• Channel response to alterations in hydrology or sediment and wood supply, resulting from an increase in impervious surface area or modifications in vegetation communities.
7 9 W a t e r R e s o u r c e s S p e c i a l i s t M a n u a l
• Direct channel alterations/impacts (present or future) at the interface between transportation projects and stream channels (e.g., bridges, culverts, bank and shoreline protection, construction of projects in the channel migration zone).
There are numerous resources that provide a detailed summary of physical effects of increased impervious surface area on streams (Paul and Meyer 2001; Walsh et al. 2005). The following is a very brief overview of the effect of transportation projects on hydrology and sediment/wood supply to stream channels.
A lterations in Hydrology, S ediment, and Wood S upply
Increases in impervious area associated with urbanization and development of transportation systems leads to “flashier” hydrology. “Flashier” means a greater percentage of rainfall is converted immediately to surface runoff, with man-made conduits shortening the time between when rain starts and when streams begin to rise. Less rainfall is lost to evapotranspiration or infiltration into the ground. Typically, streamflow peaks become greater, and the rising and falling limbs of the flood hydrograph become shorter in duration (see Chapter 4). Base flows in streams sustained by groundwater are commonly reduced, due to the reduction in infiltration and groundwater recharge.
Construction of transportation projects disturbs native soils and vegetation, disrupting natural hydrology and landscape processes through increases in impervious surface area. During (or immediately following) development of a watershed, sediment supply to streams typically increases as many forested or vegetated areas are stripped of vegetation that limits hillslope erosion.
In time, however, as disturbed areas become revegetated or stabilized, the overall sediment supply to stream channels is typically reduced. Land clearing practices, infrastructure constraints, and bank armoring placed on stream channels during and after development may lead to reduced availability of large woody debris (LWD) to the stream.
Channel Response to Alterations in Water, Sediment, and Wood Supply Lane (1955) established the concept of alluvial channel equilibrium, whereby sediment discharge (Qs) multiplied by the median sediment particle size (D50) is proportional to stream slope (S) multiplied by streamflow (Q), or
Q SDQs ∝5 0
Alluvial channels are those with bed composed of sediment mobilized and deposited by water
W a t e r R e s o u r c e s S p e c i a l i s t M a n u a l 80
In a state of equilibrium, the channel’s dimension, slope, and flow regime (range of flows and flow patterns) will form a balance with the size and distribution of available sediment particles that the stream can move. Alluvial channels may respond to alterations in sediment or water supply in an attempt to reestablish equilibrium conditions, such as steeper slopes or higher streamflow leading to higher sediment loads or larger particles in the channel. Altering sediment or water inputs can result in channel adjustments, including changes in slope and sediment size (Lane 1955) and width, depth, flow velocity, and bed roughness (Leopold and Maddock 1953).
Channels with immobile beds (such as bedrock channels or artificially lined concrete channels) cannot be classified as alluvial and do not respond according to Lane's relationship, because the bedrock or concrete does not allow the slope to adjust in response to a disturbance in flow or sediment supply. In the case of a concrete channel, there may be no source of sediment at all. In the case of a channel with a bedrock bottom and erodible banks, a typical response to increased stream flows would be the onset of lateral instability (bank erosion).
Responses to reductions in the supply of large woody debris vary widely, but typically the result is a decrease in hydraulic complexity and habitat value within the channel, and increased potential for channel incision and disconnection of floodplain areas from the influence of high flows.
The following are three examples of channel disturbances and responses that may occur from transportation projects:
• Increased peak streamflow from impervious surfaces: A larger quantity and size of sediment may be entrained by the channel at more frequent intervals, and the channel may respond by scouring, widening, or incising, to increase flow capacity and regain equilibrium. Bed sediment may become coarser.
• Channel slope is increased by channel straightening to accommodate road alignment: if streamflow remains the same, either the sediment load or size of particles mobilized must increase to regain equilibrium or the bed will coarsen to dissipate the increased flow energy. Incision or increased bank erosion could result.
• In a channel with an erosion-resistant bedrock bottom, or an alluvial channel already incised down to bedrock in response to earlier impacts, a common response is widening of the channel through erosion of less resistant banks.
8 1 W a t e r R e s o u r c e s S p e c i a l i s t M a n u a l
Direc t C hannel A lterations and Impac ts
Effect of Crossings on Stream Channels Road/stream crossings (bridges and culverts) can affect the ability of streams and floodplains to convey water sediment and woody debris. Bridges and culverts directly interact with channels and can affect channel morphology and channel migration patterns, and also local hydraulics that may impact the stream channel. When a road crossing disrupts the equilibrium of a natural stream channel, the channel will respond in ways similar to those described in Channel Response to Alternations in Water, Sediment, and Wood Supply. Some of the effects of culverts and bridges are described below.
Floodway or Functional Floodplain Constriction Elevated road grades crossing floodplains can constrict the floodway or functional floodplain and concentrate flood flows into a narrower channel. This may cause a backwater effect that results in sediment deposition upstream of the crossing, or channel incision at the crossing itself as the channel adjusts to compensate for the reduced flow capacity of a constricted floodplain. The backwater effect can also negatively affect floodwater surface elevation upstream of the crossing and reduce floodplain inundation downstream. See Chapter 8 for more information on floodways and functional floodplains.
Scour Scour will often be observed at crossing structures, with total scour comprising the following three components (FHWA 2001):
Long-term and degradation of the river bed (due to alterations in sediment supply).
General scour at the bridge, which is lowering of the streambed across the channel bed at the crossing structure. General scour is often cyclic or observed in response to storms.
Pier or abutment scour caused by the increased velocity caused by the flow obstruction.
The Hydraulic Engineer will calculate scour for new and existing bridges for the 100-year, 500-year, and roadway overtopping flood, using the methods described in Chapter 10 of the Hydraulics Manual and the FHWA publication, Evaluating Scour at Bridges (FHWA 2001).
Bridges and culverts can also hinder or block passage for aquatic organisms such as salmon as well as terrestrial organisms such as salamanders, tortoises, and in some cases even elk or bears which may use riparian areas as migration corridors.
Channel incision refers to the deepening of the channel of a stream by erosion.
W a t e r R e s o u r c e s S p e c i a l i s t M a n u a l 82
Alterations to Stream Gradient Straightening or rerouting of the existing channel for the sake of bridge or culvert construction may significantly alter the local stream gradient or slope, and the stream should be expected to respond as described in Channel Response to Alterations in Water/Sediment/Wood Supply.
Changes in Channel Migration Patterns Bridges and culverts create fixed points on a stream’s plan form, and may disrupt channel migration patterns. The result is often increased bank erosion caused by a relative loss in sediment supply that may threaten the crossing and the road grade adjacent to the crossing.
Bank Erosion Bridges and culverts may also constrict and direct flows in a way that exacerbates bank erosion in the areas around the crossing. If a crossing is aligned improperly, and does not take the natural course and migratory tendencies of the channel into consideration, then the result may include both bank or road-grade erosion and a backwater effect at high flows resulting in flooding and sediment deposition upstream of the crossing.
Sediment and Wood Supply Restrictions Undersized crossings (particularly undersized culverts) often restrict the flow of sediment and large woody debris creating sediment supply or woody supply limited conditions downstream of the crossing. Response to sediment supply changes are described by the Lane relationship in the Channel Response to Alterations in Water/Sediment/Wood supply section.
Additional information on the effects of crossings on both channel morphology and ecological function can be found at: https://www.stream.fs.fed.us/fishxing/publications/PDFs/AOP_PDFs/Chapter1.pdf
Minimizing Crossing Impacts Impacts of bridges and culverts on stream channels can be minimized if the crossing structure is properly designed to allow for unhindered passage of water, sediment, and wood, and accounts for expected channel migration patterns. To eliminate some impacts on channel morphology and habitat, ODOT, in conjunction with state and federal permitting agencies, has developed guidelines for bridge and culvert design and permitting that relate crossing structure span to a channel’s functional floodplain. The “Fluvial Performance Standard” and SLOPES IV (see Chapter 3) allow piers in the functional floodplain, but the end abutments should be outside the functional floodplain. If spanning the whole
SLOPES-IV is a programmatic biological opinion (BO) authored by the Corps and NOAA Fisheries Service that covers maintenance and construction activities associated with roads, culverts, bridges and utility lines. See Chapter 3 for more information.
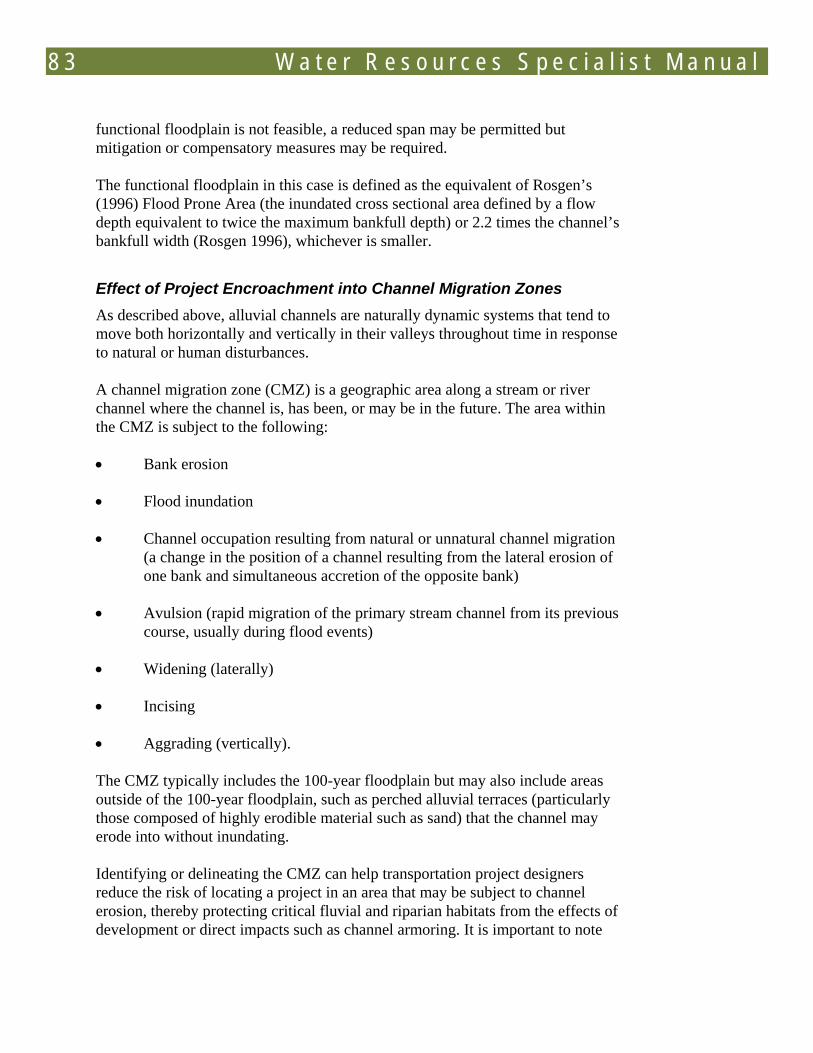
8 3 W a t e r R e s o u r c e s S p e c i a l i s t M a n u a l
functional floodplain is not feasible, a reduced span may be permitted but mitigation or compensatory measures may be required.
The functional floodplain in this case is defined as the equivalent of Rosgen’s (1996) Flood Prone Area (the inundated cross sectional area defined by a flow depth equivalent to twice the maximum bankfull depth) or 2.2 times the channel’s bankfull width (Rosgen 1996), whichever is smaller.
Effect of Project Encroachment into Channel Migration Zones As described above, alluvial channels are naturally dynamic systems that tend to move both horizontally and vertically in their valleys throughout time in response to natural or human disturbances.
A channel migration zone (CMZ) is a geographic area along a stream or river channel where the channel is, has been, or may be in the future. The area within the CMZ is subject to the following:
• Bank erosion
• Flood inundation
• Channel occupation resulting from natural or unnatural channel migration (a change in the position of a channel resulting from the lateral erosion of one bank and simultaneous accretion of the opposite bank)
• Avulsion (rapid migration of the primary stream channel from its previous course, usually during flood events)
• Widening (laterally)
• Incising
• Aggrading (vertically).
The CMZ typically includes the 100-year floodplain but may also include areas outside of the 100-year floodplain, such as perched alluvial terraces (particularly those composed of highly erodible material such as sand) that the channel may erode into without inundating.
Identifying or delineating the CMZ can help transportation project designers reduce the risk of locating a project in an area that may be subject to channel erosion, thereby protecting critical fluvial and riparian habitats from the effects of development or direct impacts such as channel armoring. It is important to note
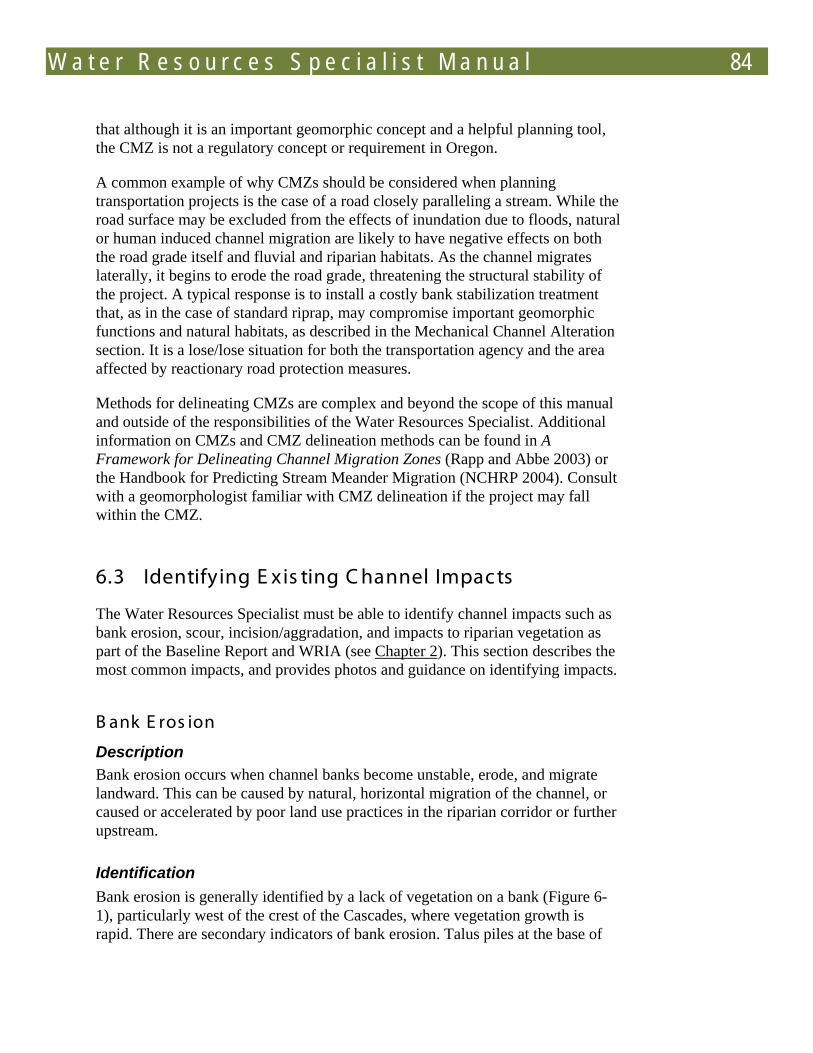
W a t e r R e s o u r c e s S p e c i a l i s t M a n u a l 84
that although it is an important geomorphic concept and a helpful planning tool, the CMZ is not a regulatory concept or requirement in Oregon.
A common example of why CMZs should be considered when planning transportation projects is the case of a road closely paralleling a stream. While the road surface may be excluded from the effects of inundation due to floods, natural or human induced channel migration are likely to have negative effects on both the road grade itself and fluvial and riparian habitats. As the channel migrates laterally, it begins to erode the road grade, threatening the structural stability of the project. A typical response is to install a costly bank stabilization treatment that, as in the case of standard riprap, may compromise important geomorphic functions and natural habitats, as described in the Mechanical Channel Alteration section. It is a lose/lose situation for both the transportation agency and the area affected by reactionary road protection measures.
Methods for delineating CMZs are complex and beyond the scope of this manual and outside of the responsibilities of the Water Resources Specialist. Additional information on CMZs and CMZ delineation methods can be found in A Framework for Delineating Channel Migration Zones (Rapp and Abbe 2003) or the Handbook for Predicting Stream Meander Migration (NCHRP 2004). Consult with a geomorphologist familiar with CMZ delineation if the project may fall within the CMZ.
6.3 Identifying E xis ting C hannel Impacts
The Water Resources Specialist must be able to identify channel impacts such as bank erosion, scour, incision/aggradation, and impacts to riparian vegetation as part of the Baseline Report and WRIA (see Chapter 2). This section describes the most common impacts, and provides photos and guidance on identifying impacts.
B ank E ros ion
Description Bank erosion occurs when channel banks become unstable, erode, and migrate landward. This can be caused by natural, horizontal migration of the channel, or caused or accelerated by poor land use practices in the riparian corridor or further upstream.
Identification Bank erosion is generally identified by a lack of vegetation on a bank (Figure 6-1), particularly west of the crest of the Cascades, where vegetation growth is rapid. There are secondary indicators of bank erosion. Talus piles at the base of
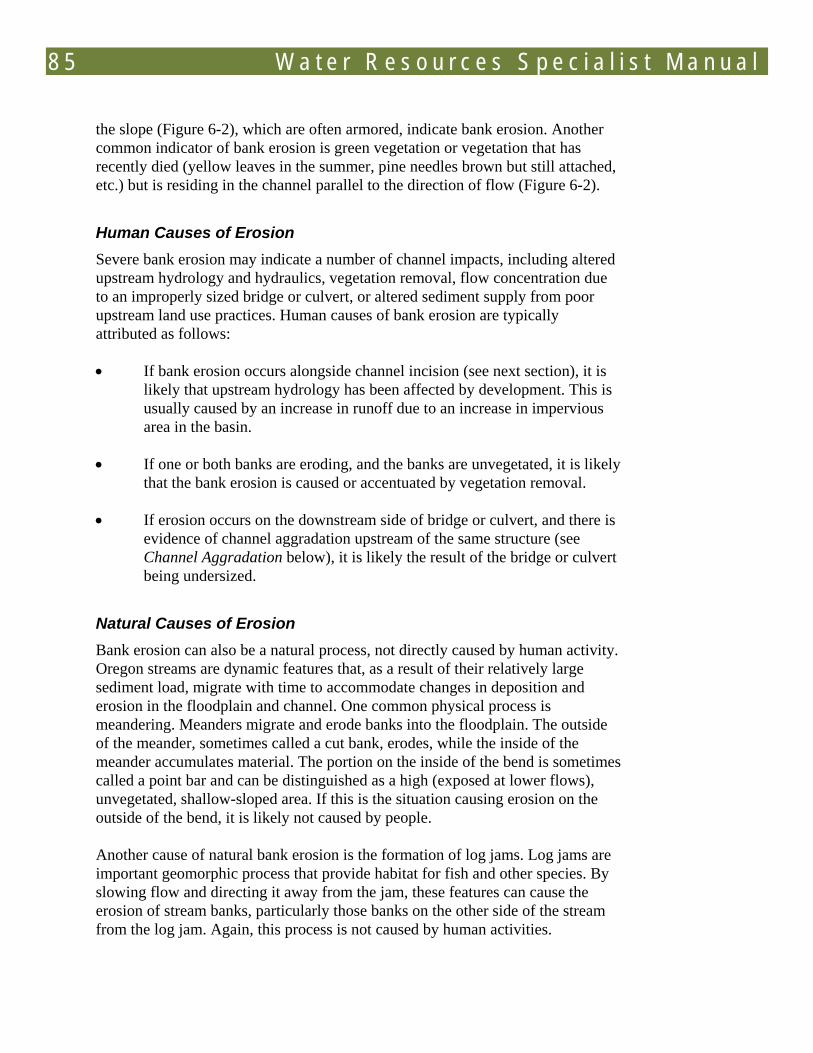
8 5 W a t e r R e s o u r c e s S p e c i a l i s t M a n u a l
the slope (Figure 6-2), which are often armored, indicate bank erosion. Another common indicator of bank erosion is green vegetation or vegetation that has recently died (yellow leaves in the summer, pine needles brown but still attached, etc.) but is residing in the channel parallel to the direction of flow (Figure 6-2).
Human Causes of Erosion Severe bank erosion may indicate a number of channel impacts, including altered upstream hydrology and hydraulics, vegetation removal, flow concentration due to an improperly sized bridge or culvert, or altered sediment supply from poor upstream land use practices. Human causes of bank erosion are typically attributed as follows:
• If bank erosion occurs alongside channel incision (see next section), it is likely that upstream hydrology has been affected by development. This is usually caused by an increase in runoff due to an increase in impervious area in the basin.
• If one or both banks are eroding, and the banks are unvegetated, it is likely that the bank erosion is caused or accentuated by vegetation removal.
• If erosion occurs on the downstream side of bridge or culvert, and there is evidence of channel aggradation upstream of the same structure (see Channel Aggradation below), it is likely the result of the bridge or culvert being undersized.
Natural Causes of Erosion Bank erosion can also be a natural process, not directly caused by human activity. Oregon streams are dynamic features that, as a result of their relatively large sediment load, migrate with time to accommodate changes in deposition and erosion in the floodplain and channel. One common physical process is meandering. Meanders migrate and erode banks into the floodplain. The outside of the meander, sometimes called a cut bank, erodes, while the inside of the meander accumulates material. The portion on the inside of the bend is sometimes called a point bar and can be distinguished as a high (exposed at lower flows), unvegetated, shallow-sloped area. If this is the situation causing erosion on the outside of the bend, it is likely not caused by people.
Another cause of natural bank erosion is the formation of log jams. Log jams are important geomorphic process that provide habitat for fish and other species. By slowing flow and directing it away from the jam, these features can cause the erosion of stream banks, particularly those banks on the other side of the stream from the log jam. Again, this process is not caused by human activities.
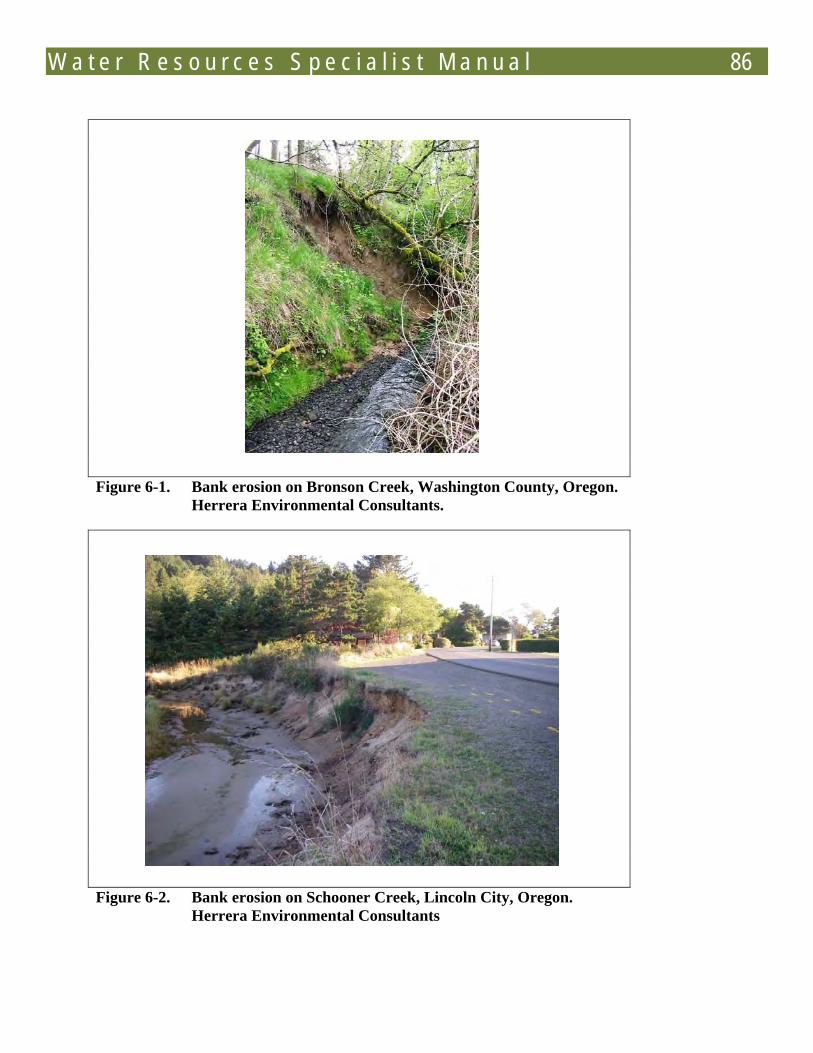
W a t e r R e s o u r c e s S p e c i a l i s t M a n u a l 86
Figure 6-1. Bank erosion on Bronson Creek, Washington County, Oregon.
Herrera Environmental Consultants.
Figure 6-2. Bank erosion on Schooner Creek, Lincoln City, Oregon.
Herrera Environmental Consultants
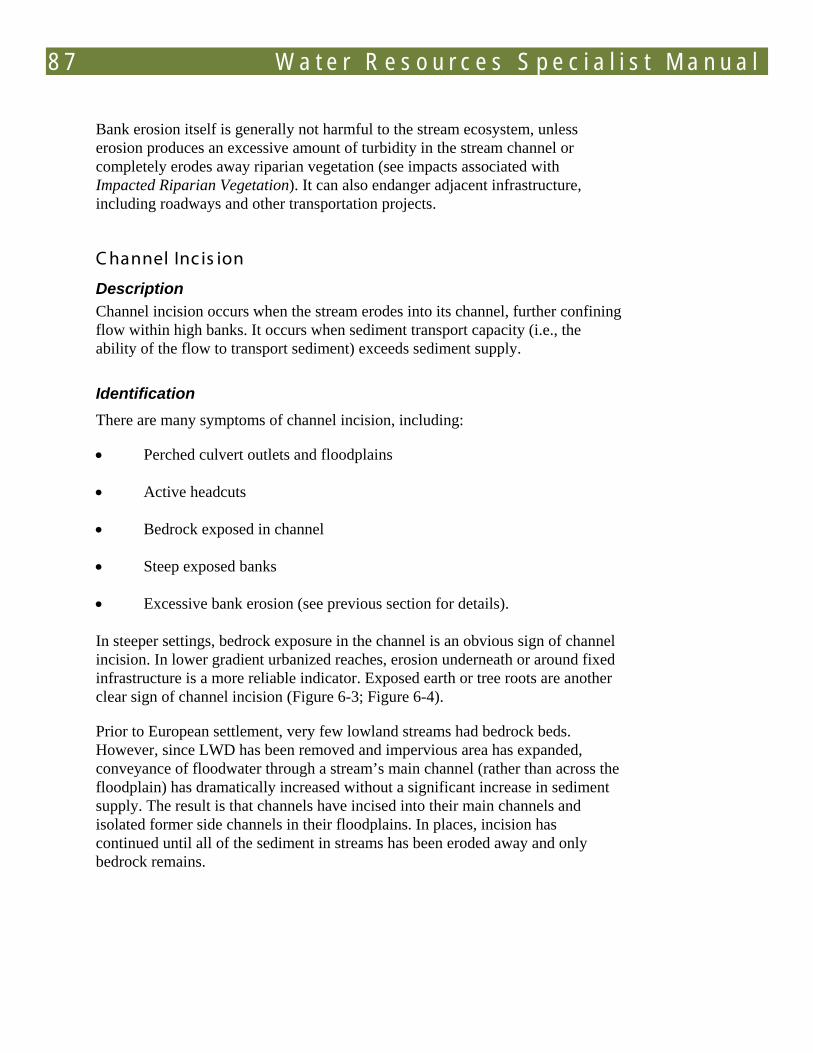
8 7 W a t e r R e s o u r c e s S p e c i a l i s t M a n u a l
Bank erosion itself is generally not harmful to the stream ecosystem, unless erosion produces an excessive amount of turbidity in the stream channel or completely erodes away riparian vegetation (see impacts associated with Impacted Riparian Vegetation). It can also endanger adjacent infrastructure, including roadways and other transportation projects.
C hannel Inc is ion
Description Channel incision occurs when the stream erodes into its channel, further confining flow within high banks. It occurs when sediment transport capacity (i.e., the ability of the flow to transport sediment) exceeds sediment supply.
Identification There are many symptoms of channel incision, including:
• Perched culvert outlets and floodplains
• Active headcuts
• Bedrock exposed in channel
• Steep exposed banks
• Excessive bank erosion (see previous section for details).
In steeper settings, bedrock exposure in the channel is an obvious sign of channel incision. In lower gradient urbanized reaches, erosion underneath or around fixed infrastructure is a more reliable indicator. Exposed earth or tree roots are another clear sign of channel incision (Figure 6-3; Figure 6-4).
Prior to European settlement, very few lowland streams had bedrock beds. However, since LWD has been removed and impervious area has expanded, conveyance of floodwater through a stream’s main channel (rather than across the floodplain) has dramatically increased without a significant increase in sediment supply. The result is that channels have incised into their main channels and isolated former side channels in their floodplains. In places, incision has continued until all of the sediment in streams has been eroded away and only bedrock remains.
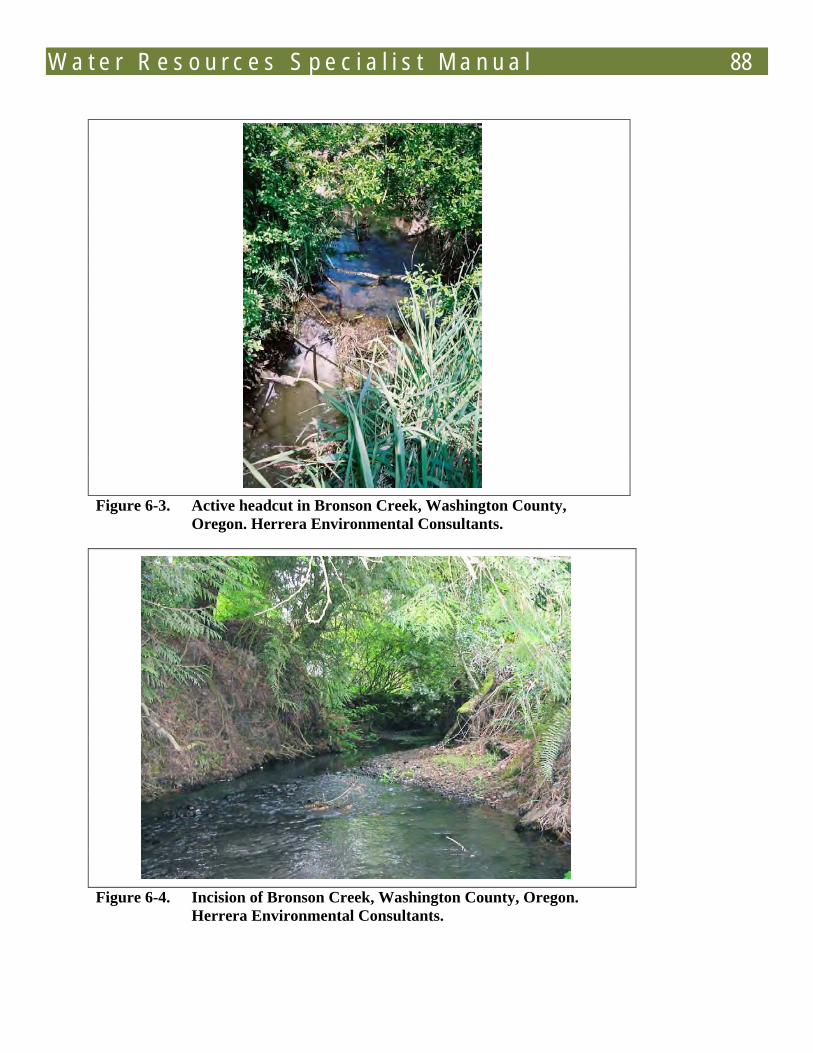
W a t e r R e s o u r c e s S p e c i a l i s t M a n u a l 88
Figure 6-3. Active headcut in Bronson Creek, Washington County,
Oregon. Herrera Environmental Consultants.
Figure 6-4. Incision of Bronson Creek, Washington County, Oregon.
Herrera Environmental Consultants.
8 9 W a t e r R e s o u r c e s S p e c i a l i s t M a n u a l
Interpretation Channel incision occurs when sediment transport capacity exceeds sediment supply. One of the most common causes of channel incision is hydrologic alterations (such as increased impervious area) that accompany urbanization or other land uses that increase stormwater runoff volume and duration. However, there are many causes of incision. For example, most streams west of the Cascade crest have incised since European settlement as a result of the removal of LWD. Incision can also be caused by the reduction or elimination of sediment supply to a stream. A common cause of sediment reduction in streams is the presence of dams further upstream. Streams downstream of dams are usually deeply incised due to the reduction or elimination of upstream sediment supply (i.e., the sediment is stored in the reservoir behind the dam).
The impacts of channel incision on local stream ecology are as diverse as the causes. Channel incision can reduce the incidence of floodplain and side-channel inundation, lower groundwater table elevations in riparian areas, and expose bedrock in the channel. Many fishes use areas of floodplain inundation as overwintering habitat or for refuge during large storm events, so these areas can be essential to fish survival. Floodplain inundation also provides nutrients for the proper maintenance of riparian corridor. Reducing or eliminating inundation of the floodplain can completely eliminate salmonid spawning opportunities and reduce the productivity of the stream ecosystem. Lowering of groundwater table elevations can also compromise the productivity of riparian areas. Finally, bedrock exposure can eliminate spawning areas for salmonids, and simplify the stream ecosystem to only those species that do not require sediment to survive.
In rare instances, channel incision is not caused by human activity, but rather by a geologic shift in basin area or runoff or a change in the position of the confluence with another stream. If a channel shows evidence of incision (see previous section) but there is no significant development upstream, the incision may be a natural phenomenon. If this is suspected, consult a geomorphologist for verification.
C hannel A ggradation
Description Aggradation occurs whenever sediment supply exceeds the sediment transport capacity in a given area. Aggradation often occurs when the stream is attempting to regain an equilibrium profile by increasing its gradient through deposition of sediment in the streambed. Sometimes this is a result of an artificial constriction of the stream channel, usually from a culvert or bridge. Aggradation along the stream banks often accompanies wholesale channel aggradation. Because the sedimentation patterns that indicate aggradation along stream banks are better
W a t e r R e s o u r c e s S p e c i a l i s t M a n u a l 90
preserved than those in the central channel (i.e., these deposits are less altered from subsequent flows), these areas are often valuable to examine.
Identification Channel aggradation is most obvious immediately after a large flood event. If an area is aggrading, there should be fresh, organic-poor sediment in or near the stream (Figure 6-5). Aggradation is most obvious when it is associated with constrictions of the channel. Bridge openings and culverts, if undersized, can accumulate material on their upstream side (Figure 6-6, 6-7). This is most obvious when abutments are buried.
Interpretation Observed channel aggradation may or may not be the result of natural processes. There are many situations where natural constrictions or changes in sediment supply can cause aggradation. If there is a concern about whether or not aggradation is a natural process, or whether it is occurring at all, consult a geomorphologist.
If aggradation occurs immediately upstream or downstream of a structure (e.g., bridge or culvert), it is probably not natural. This is often the result of an improper accounting of the sediment transport through the crossing. The constriction restricts flow, reducing stream velocity upstream and increasing aggradation upstream. The presence of aggradation indicates that the crossing is currently undersized and may indicate that the road or other development above the crossing is at risk of flooding. Emergency maintenance of the crossing, typically through dredging, will likely be necessary. Dredging is discussed in the next section.
Mec hanic al C hannel A lteration Description Mechanical channel alteration can include channel straightening, dredging, levee construction, bank armoring, bed armoring, putting the creek in a pipe, or lining the channel with concrete. While intending to protect infrastructure or improve conveyance, all of these actions disrupt natural fluvial processes and can result in significant channel instability, habitat degradation, and water quality degradation. Their precise impacts to local ecology are highly dependent on the type of the alteration and the geomorphic setting.
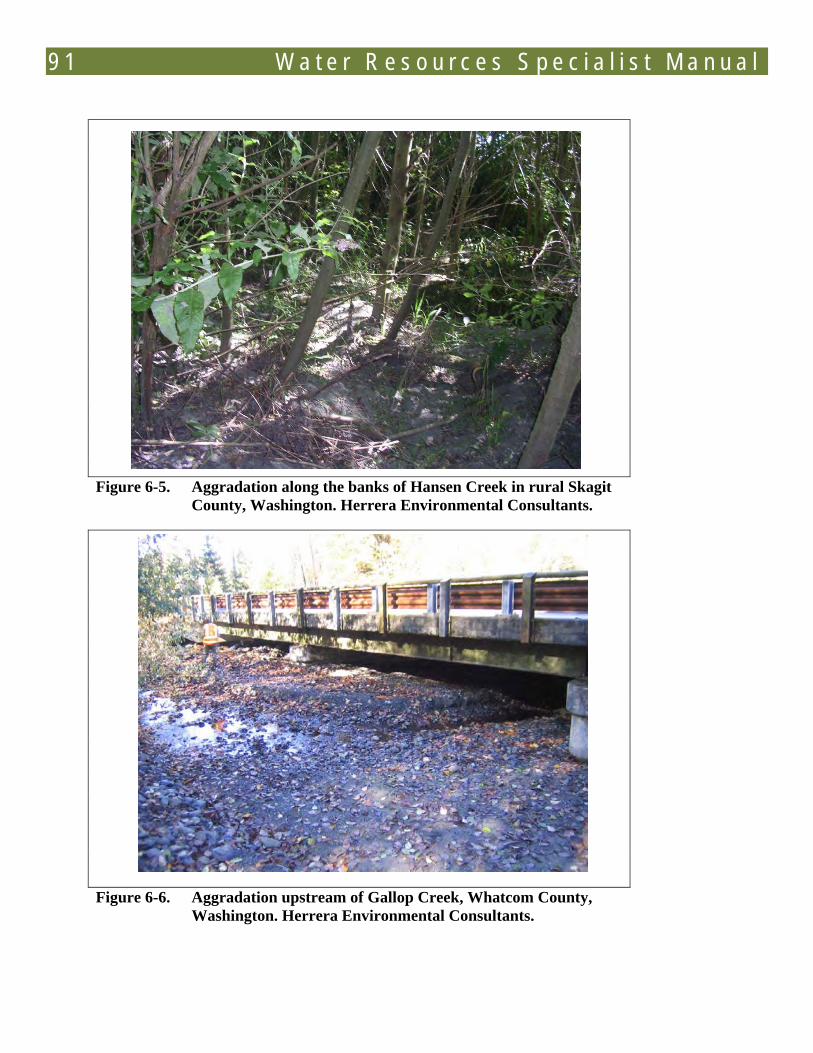
9 1 W a t e r R e s o u r c e s S p e c i a l i s t M a n u a l
Figure 6-5. Aggradation along the banks of Hansen Creek in rural Skagit
County, Washington. Herrera Environmental Consultants.
Figure 6-6. Aggradation upstream of Gallop Creek, Whatcom County,
Washington. Herrera Environmental Consultants.
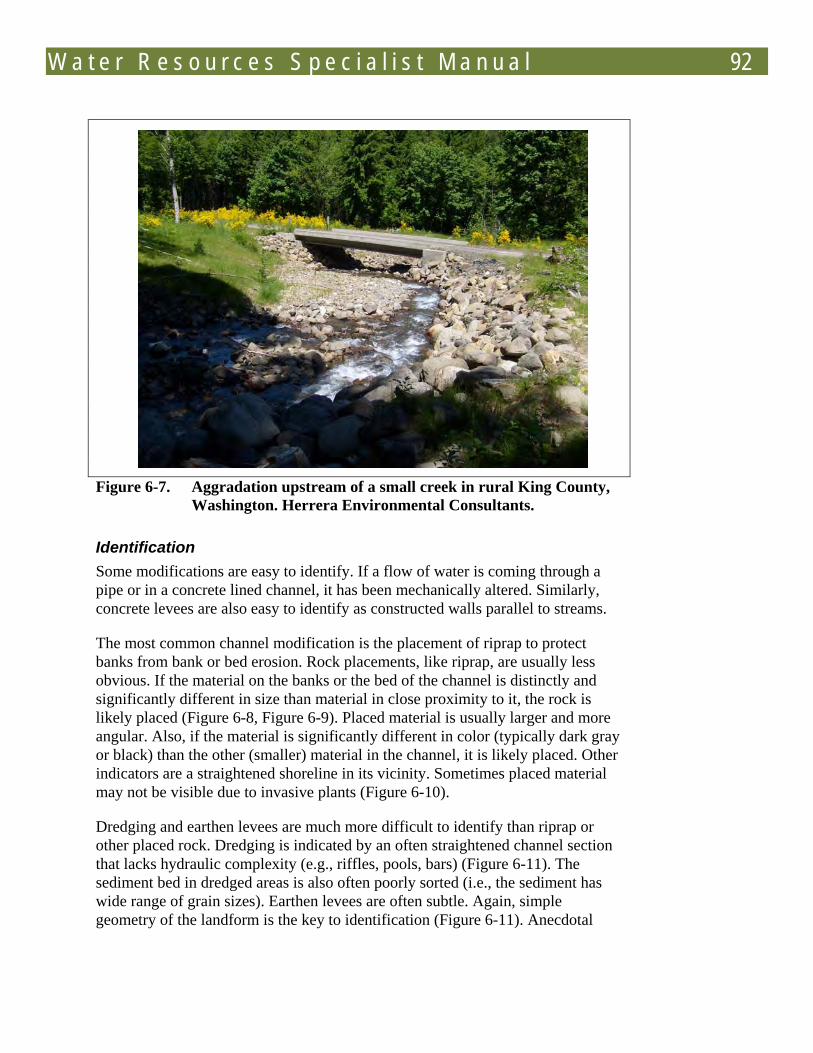
W a t e r R e s o u r c e s S p e c i a l i s t M a n u a l 92
Figure 6-7. Aggradation upstream of a small creek in rural King County,
Washington. Herrera Environmental Consultants.
Identification Some modifications are easy to identify. If a flow of water is coming through a pipe or in a concrete lined channel, it has been mechanically altered. Similarly, concrete levees are also easy to identify as constructed walls parallel to streams.
The most common channel modification is the placement of riprap to protect banks from bank or bed erosion. Rock placements, like riprap, are usually less obvious. If the material on the banks or the bed of the channel is distinctly and significantly different in size than material in close proximity to it, the rock is likely placed (Figure 6-8, Figure 6-9). Placed material is usually larger and more angular. Also, if the material is significantly different in color (typically dark gray or black) than the other (smaller) material in the channel, it is likely placed. Other indicators are a straightened shoreline in its vicinity. Sometimes placed material may not be visible due to invasive plants (Figure 6-10).
Dredging and earthen levees are much more difficult to identify than riprap or other placed rock. Dredging is indicated by an often straightened channel section that lacks hydraulic complexity (e.g., riffles, pools, bars) (Figure 6-11). The sediment bed in dredged areas is also often poorly sorted (i.e., the sediment has wide range of grain sizes). Earthen levees are often subtle. Again, simple geometry of the landform is the key to identification (Figure 6-11). Anecdotal
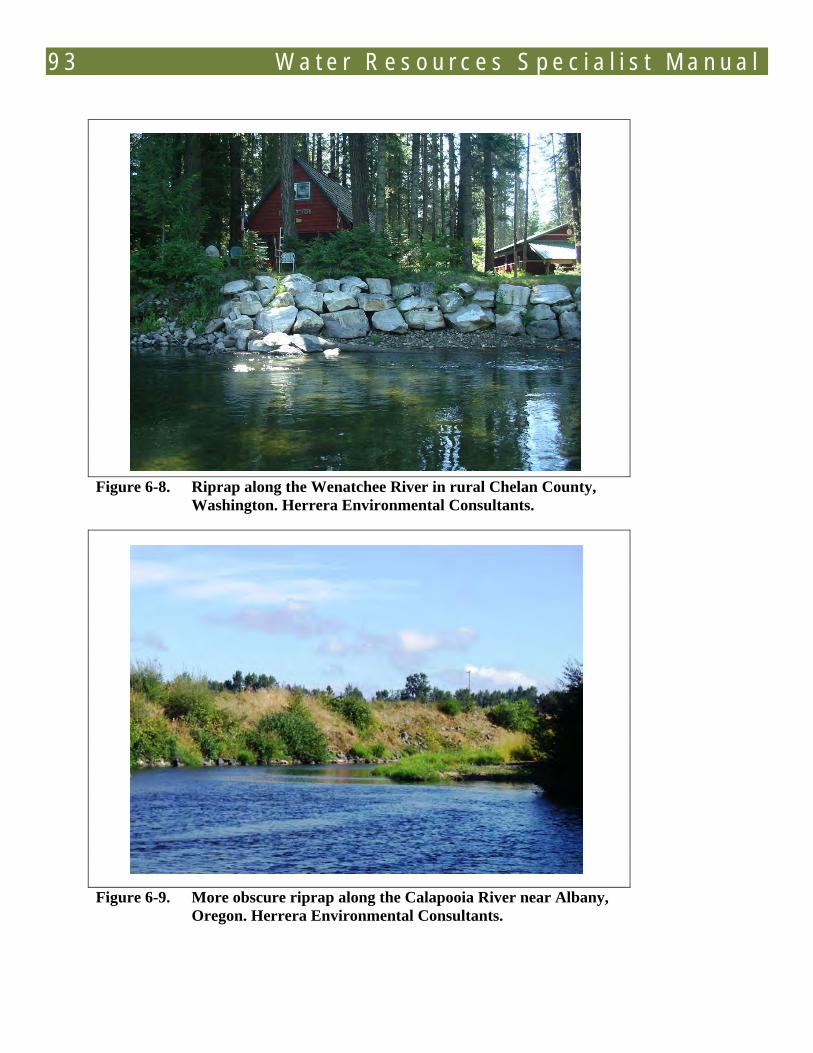
9 3 W a t e r R e s o u r c e s S p e c i a l i s t M a n u a l
Figure 6-8. Riprap along the Wenatchee River in rural Chelan County,
Washington. Herrera Environmental Consultants.
Figure 6-9. More obscure riprap along the Calapooia River near Albany,
Oregon. Herrera Environmental Consultants.
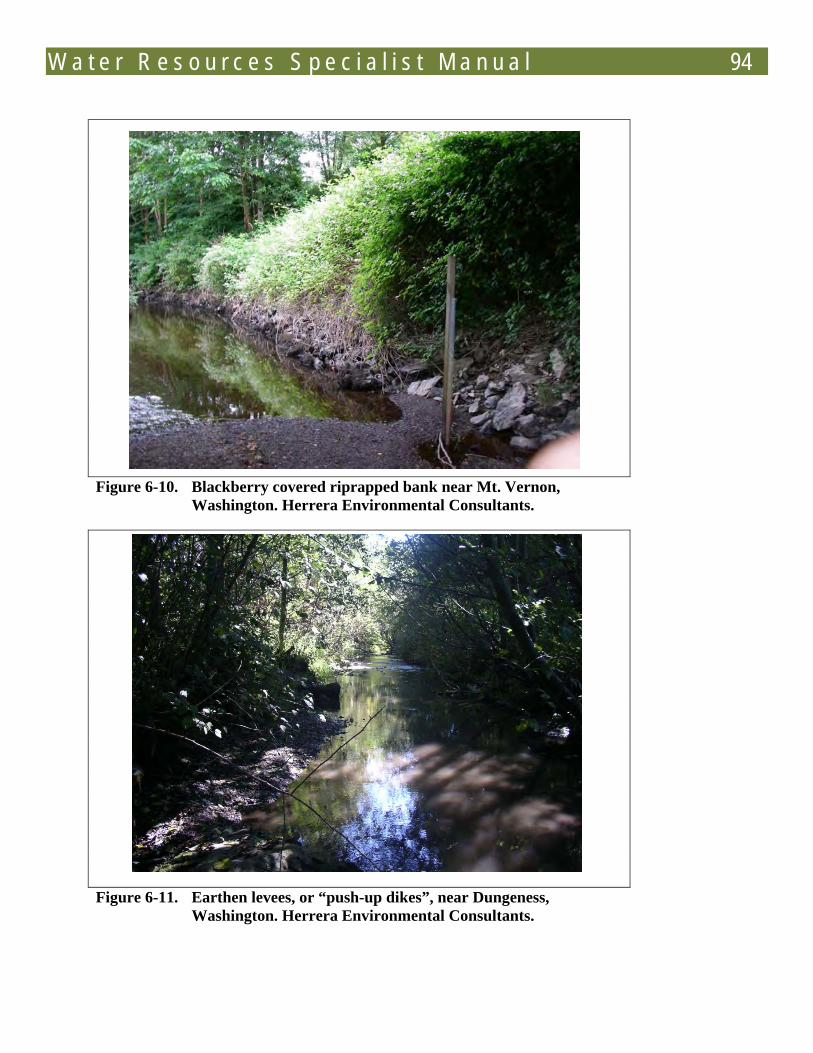
W a t e r R e s o u r c e s S p e c i a l i s t M a n u a l 94
Figure 6-10. Blackberry covered riprapped bank near Mt. Vernon,
Washington. Herrera Environmental Consultants.
Figure 6-11. Earthen levees, or “push-up dikes”, near Dungeness,
Washington. Herrera Environmental Consultants.
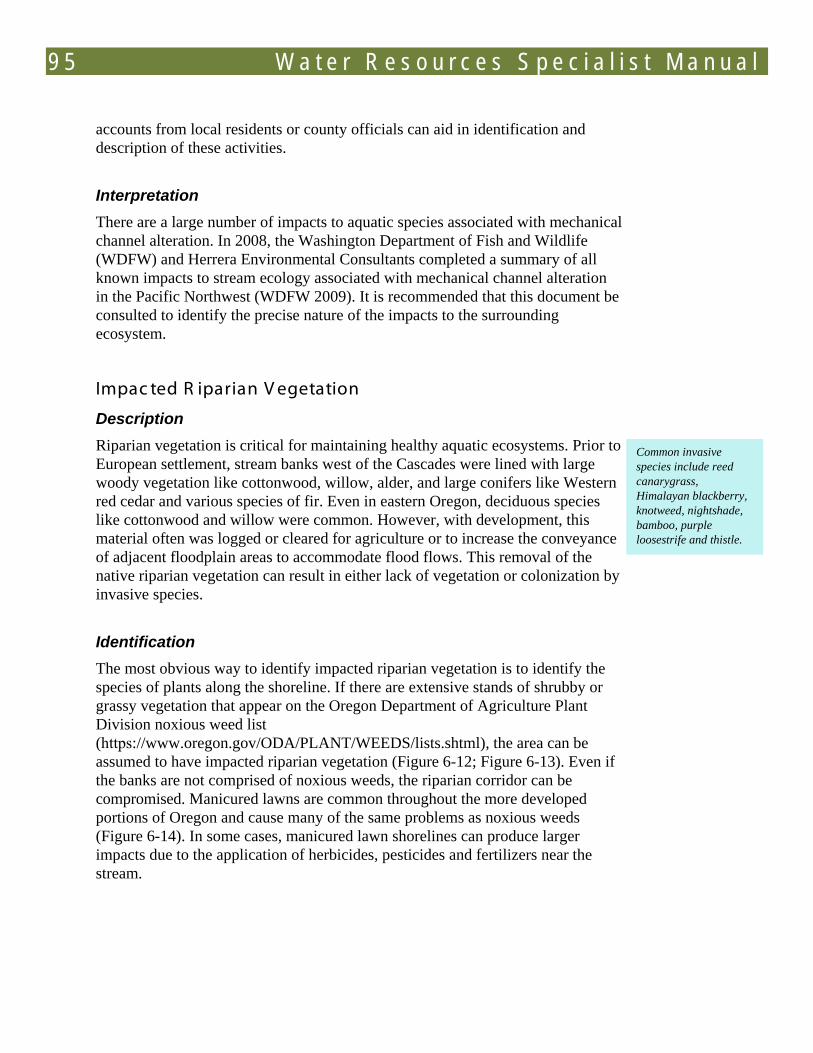
9 5 W a t e r R e s o u r c e s S p e c i a l i s t M a n u a l
accounts from local residents or county officials can aid in identification and description of these activities.
Interpretation There are a large number of impacts to aquatic species associated with mechanical channel alteration. In 2008, the Washington Department of Fish and Wildlife (WDFW) and Herrera Environmental Consultants completed a summary of all known impacts to stream ecology associated with mechanical channel alteration in the Pacific Northwest (WDFW 2009). It is recommended that this document be consulted to identify the precise nature of the impacts to the surrounding ecosystem.
Impac ted R iparian V egetation
Description Riparian vegetation is critical for maintaining healthy aquatic ecosystems. Prior to European settlement, stream banks west of the Cascades were lined with large woody vegetation like cottonwood, willow, alder, and large conifers like Western red cedar and various species of fir. Even in eastern Oregon, deciduous species like cottonwood and willow were common. However, with development, this material often was logged or cleared for agriculture or to increase the conveyance of adjacent floodplain areas to accommodate flood flows. This removal of the native riparian vegetation can result in either lack of vegetation or colonization by invasive species.
Identification The most obvious way to identify impacted riparian vegetation is to identify the species of plants along the shoreline. If there are extensive stands of shrubby or grassy vegetation that appear on the Oregon Department of Agriculture Plant Division noxious weed list (https://www.oregon.gov/ODA/PLANT/WEEDS/lists.shtml), the area can be assumed to have impacted riparian vegetation (Figure 6-12; Figure 6-13). Even if the banks are not comprised of noxious weeds, the riparian corridor can be compromised. Manicured lawns are common throughout the more developed portions of Oregon and cause many of the same problems as noxious weeds (Figure 6-14). In some cases, manicured lawn shorelines can produce larger impacts due to the application of herbicides, pesticides and fertilizers near the stream.
Common invasive species include reed canarygrass, Himalayan blackberry, knotweed, nightshade, bamboo, purple loosestrife and thistle.
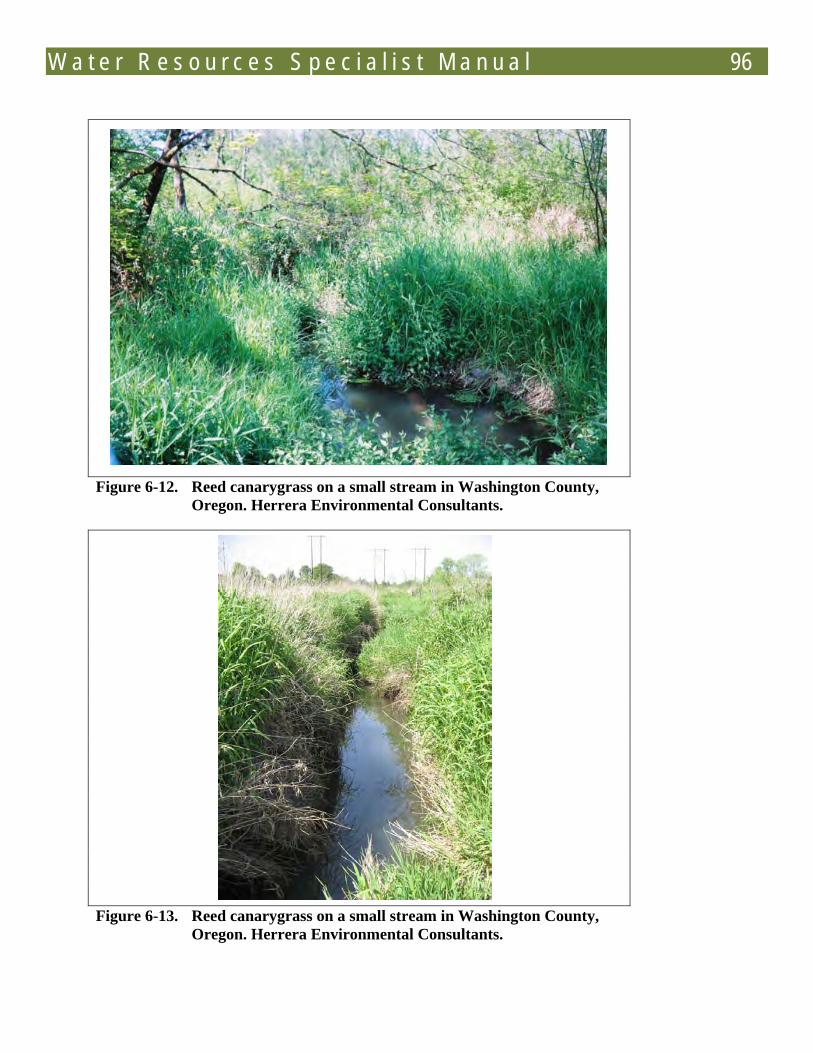
W a t e r R e s o u r c e s S p e c i a l i s t M a n u a l 96
Figure 6-12. Reed canarygrass on a small stream in Washington County,
Oregon. Herrera Environmental Consultants.
Figure 6-13. Reed canarygrass on a small stream in Washington County,
Oregon. Herrera Environmental Consultants.
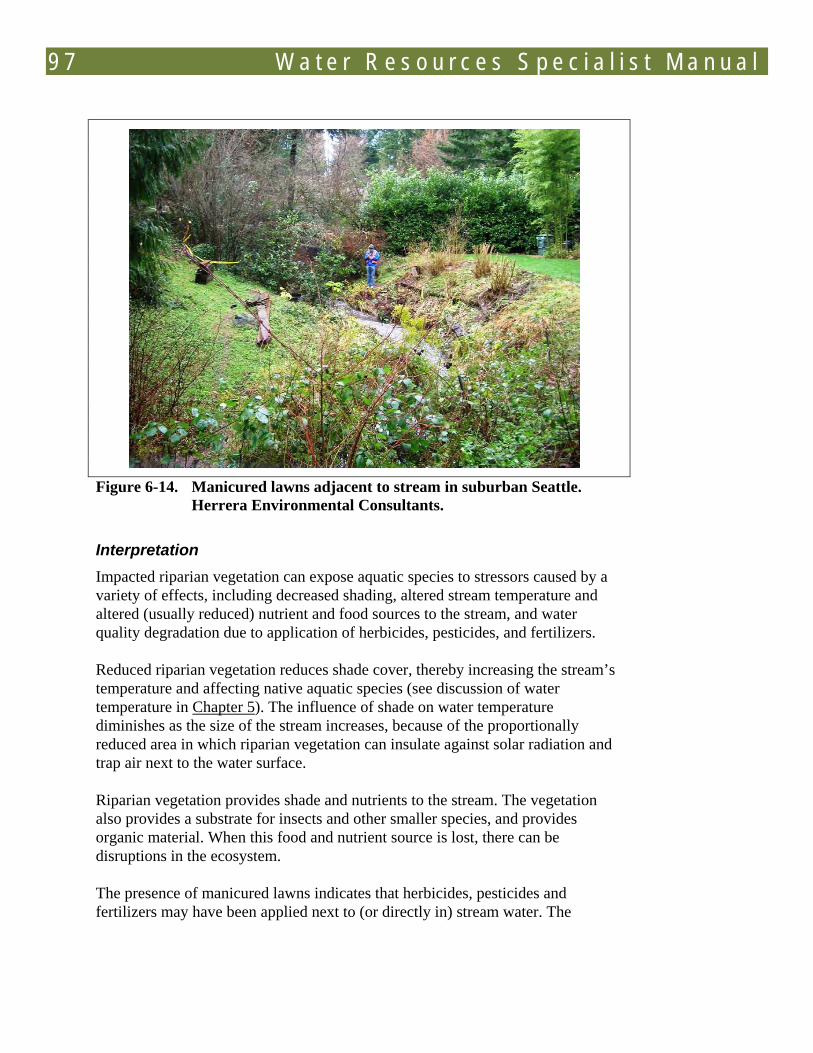
9 7 W a t e r R e s o u r c e s S p e c i a l i s t M a n u a l
Figure 6-14. Manicured lawns adjacent to stream in suburban Seattle.
Herrera Environmental Consultants.
Interpretation Impacted riparian vegetation can expose aquatic species to stressors caused by a variety of effects, including decreased shading, altered stream temperature and altered (usually reduced) nutrient and food sources to the stream, and water quality degradation due to application of herbicides, pesticides, and fertilizers.
Reduced riparian vegetation reduces shade cover, thereby increasing the stream’s temperature and affecting native aquatic species (see discussion of water temperature in Chapter 5). The influence of shade on water temperature diminishes as the size of the stream increases, because of the proportionally reduced area in which riparian vegetation can insulate against solar radiation and trap air next to the water surface.
Riparian vegetation provides shade and nutrients to the stream. The vegetation also provides a substrate for insects and other smaller species, and provides organic material. When this food and nutrient source is lost, there can be disruptions in the ecosystem.
The presence of manicured lawns indicates that herbicides, pesticides and fertilizers may have been applied next to (or directly in) stream water. The
W a t e r R e s o u r c e s S p e c i a l i s t M a n u a l 98
presence of these chemicals can disrupt the natural distribution of biota in a stream and threaten the survivability of a number of aquatic species.
6.4 Other F luvial G eomorphology P rinc iples
S tream C hannel C las s ification Today, the most common stream channel classifications systems used in the Pacific Northwest were developed by Montgomery and Buffington (1993, 1997) and Rosgen (1994, 1996); however, no one classification system can apply to every possible channel type and satisfy all purposes for classification.
Application of these classifications schemes is beyond the scope of the responsibilities of the Water Resources Specialist, unless they are specifically trained in their use and application.
Montgomery and Buffington The Montgomery and Buffington (1993, 1997) classification system is a process-based classification system, developed from observations of physical processes in mountain drainage basins in the Pacific Northwest. Process-based classifications assume that a common set of physical processes regulate channel form and pattern. Because these same physical processes can be present anywhere, this type of classification can be successfully applied outside the area it was developed. It classifies alluvial, bedrock, and colluvial channels into categories based on the following:
• Reach
• Scale
• Sediment supply and transport capacity
• Spatial location of reaches
• Factors related to valley form
• Hillslope processes
• Channel confining factors such as riparian vegetation and LWD.
9 9 W a t e r R e s o u r c e s S p e c i a l i s t M a n u a l
Channel types include:
• Colluvial
• Bedrock
• Alluvial (Cascade, Step-pool, Plane-bed, Pool-riffle, and Dune-ripple).
When applied by a trained geomorphologist familiar with the classification system, this system provides a way to predict how (and to what degree) a channel may respond to changes in sediment supply and discharge.
Montgomery and Buffington colluvial channels and pool-riffle and dune-ripple alluvial channels are more susceptible to impacts associated with transportation projects than bedrock channels and cascade, step-pool, and plane-bed alluvial channels.
Rosgen The Rosgen (1994, 1996) classification system is a form-based system that classifies channels based on measurement of six morphological characteristics: slope, sinuosity, width/depth ratio, entrenchment ratio, number of channels, and bed material gradation. Form-based classifications assume that geomorphic processes and stream function can be inferred from the current shape or form of a stream—an assumption that is not always correct, especially in dynamic or disturbed environments.
Central to this classification scheme is the determination of the extents of the bankfull channel, described by Rosgen (1994, 1996). This should not be confused with the concept of ordinary high water mark (OHWM, defined below.) This classification system has two levels. Level I breaks channels into 9 categories or subcategories (Aa+, A, B, C, D, DA, E, F, and G) based on slope, sinuosity, width/depth ratio, entrenchment ratio, and number of channels. Level II adds a number to the level I classification (1 through 6) to describe streambed material characteristics. Two channel measurements inherent to the Rosgen classification system—bankfull width and flood prone width—are used in the environmental performance standards for bridges.
Rosgen stream types C, D, DA, E, F, and G are more susceptible to human disturbance and changes in water and sediment supply that may result from transportation projects than stream types Aa+, A, and B. The Water Resources Specialists are encouraged to consult a geomorphologist to ensure proper application and interpretation of stream classification systems.
W a t e r R e s o u r c e s S p e c i a l i s t M a n u a l 100
Ordinary High Water Mark
ODOT defines the OHWM as the Corps and DSL jurisdictional boundary on freshwater streams that are not tidally influenced.
The Administrative Rules of the removal-fill Law (OAR 141-085-0510) and the Oregon Revised Statute for Submerged and Submersible (state-owned) Lands (ORS 274.005) define the OHWM as the line on the bank or shore to which the high water ordinarily rises annually in season. The OHWM excludes exceptionally high water levels caused by large flood events (e.g., 100 year events).
Removal and fill activities that occur below the OHWM will likely require a state or federal permit under these laws. In the absence of a clear OHWM line (e.g., OHWM is impossible to ascertain after a large storm event, since the OHWM indicators are obliterated by high flows), the calculated 2-year flood event can be used as a surrogate for the OHWM.
The Water Resources Specialist should be formally trained in how to determine the OHWM. Typically, during a site visit, the Water Resources Specialist will accompany another trained individual such as a hydrologist or biologist and collaborate in determining the OHWM.
OHWM is a regulatory term. There are several additional terms related to channel stage that are often incorrectly assumed to be synonymous with OHWM. They are described as follows, for information only.
2-year Flood Elevation As noted above, the calculated 2-year flood event can be used as a surrogate for the OHWM in the absence of a clear OHWM line. The 2-year flood elevation is the channel stage corresponding to a 2-year recurrence interval event.
Bankfull The term “bankfull” has been widely used in the field of geomorphology. It has been defined in several ways, as the elevation where incipient flooding begins (Rosgen 1996); the height at which the width : depth ratio is a minimum (Knighton 1998) or as the channel stage at which dominant or the “most effective”, channel-forming discharge occurs (Dunne and Leopold 1976).
More recent research has called this definition of bankfull into question, finding that bankfull discharge may not be the most effective flow in terms of sediment transport, bankfull elevation is difficult to identify in the field, and bankfull discharge can be variable within a single basin (Knighton 1998). Given the
1 0 1 W a t e r R e s o u r c e s S p e c i a l i s t M a n u a l
uncertainty and controversy over the definition of bankfull, the Water Resources Specialist should generally avoid use of this term.
The elevation of bankfull discharge is one of the parameters used in stream classification by Rosgen (1994, 1996) and other classification systems, so hydraulics engineers may refer to bankfull discharge or elevation as it relates to channel classification or design.
Channel Bank Overtopping Stage As its name suggests, the channel bank overtopping stage refers to the elevation at water will begin to leave the channel and enter the floodplain. This term is relevant primarily because the current flow control standards are based on the discharge corresponding to this stage (see Chapter 4).
S treambed P artic le-S ize Dis tribution
Particle-size distribution data of a streambed are used for several purposes including streambed monitoring, analyzing stream habitat, sediment transport calculations, flow hydraulics calculations and understanding stream processes (Bunte and Abt 2001).
Defining the particle size distribution of the channel substrate requires sampling streambed material, typically with a method known as a pebble count. Pebble counts are performed by measuring a number of randomly selected particles, though there are a number of specific methods catered to finding representative data depending on channel form, substrate material and study objectives. Where observable surface or armor layers are present in the bed-material, pebble counts for both the surface and subsurface should be taken.
Guidelines for selecting and performing appropriate pebble count techniques is available at: https://www.fs.fed.us/rm/pubs/rmrs_gtr74.html.

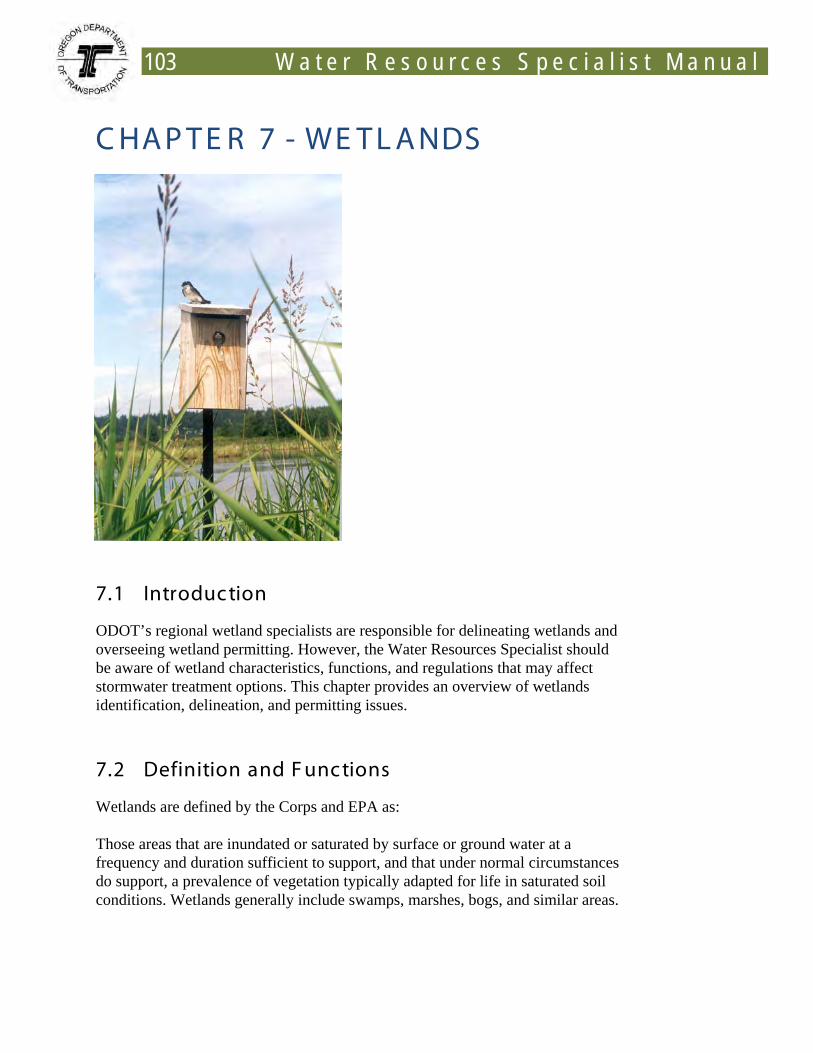
103 W a t e r R e s o u r c e s S p e c i a l i s t M a n u a l
C HA P T E R 7 - WE T L A NDS
7.1 Introduction
ODOT’s regional wetland specialists are responsible for delineating wetlands and overseeing wetland permitting. However, the Water Resources Specialist should be aware of wetland characteristics, functions, and regulations that may affect stormwater treatment options. This chapter provides an overview of wetlands identification, delineation, and permitting issues.
7.2 Definition and F unctions
Wetlands are defined by the Corps and EPA as:
Those areas that are inundated or saturated by surface or ground water at a frequency and duration sufficient to support, and that under normal circumstances do support, a prevalence of vegetation typically adapted for life in saturated soil conditions. Wetlands generally include swamps, marshes, bogs, and similar areas.

W a t e r R e s o u r c e s S p e c i a l i s t M a n u a l 104
Wetlands provide several functions, including water quality improvement, flood storage capacity, ecological productivity, fish and wildlife habitat, and recreational opportunities.
A high quality wetland would typically be undisturbed with an intact buffer area; would have structural diversity, vernal pools, and emergent vegetation that provides high quality habitat for wildlife; often displaying a diverse and/or mature vegetation community. Often, such wetlands provide water quality treatment, flood control, wildlife habitat, and contribute to biodiversity and landscape diversity.
Those functions most relevant to the Water Resources Specialist are briefly described below:
Water Quality Improvement
Wetlands improve water quality through a variety of processes, including sedimentation, filtration, adsorption, ion exchange, precipitation, plant uptake and biodegradation (USEPA 1993). These treatment processes are described in Chapter 8.
Hydrologic F unc tions
Wetland vegetation reduces water velocities and thereby the potential for erosion. Stored water in wetlands is released slowly, augmenting summer stream flows and recharging groundwater (EPA 2001, 2006c).
F lood P rotec tion
Wetlands trap and slowly release surface water, snowmelt, groundwater, and floodwater. One acre of wetland can store 1-1.5 million gallons of floodwater. This water holding capacity helps control flooding (EPA 2001, 2006d).
E c ologic al P roduc tivity
Wetland plants are important primary producers, capturing sunlight and producing plant tissues, which in turn support progressively higher levels of animal life. Wetlands provide habitat for a wide variety of fish and wildlife, including one-half of North American bird species, thirty-one percent of plant species in the U.S., and two-thirds of commercially-harvested fish and shellfish species in this country (EPA 2006a, 2001; DSL 2004).
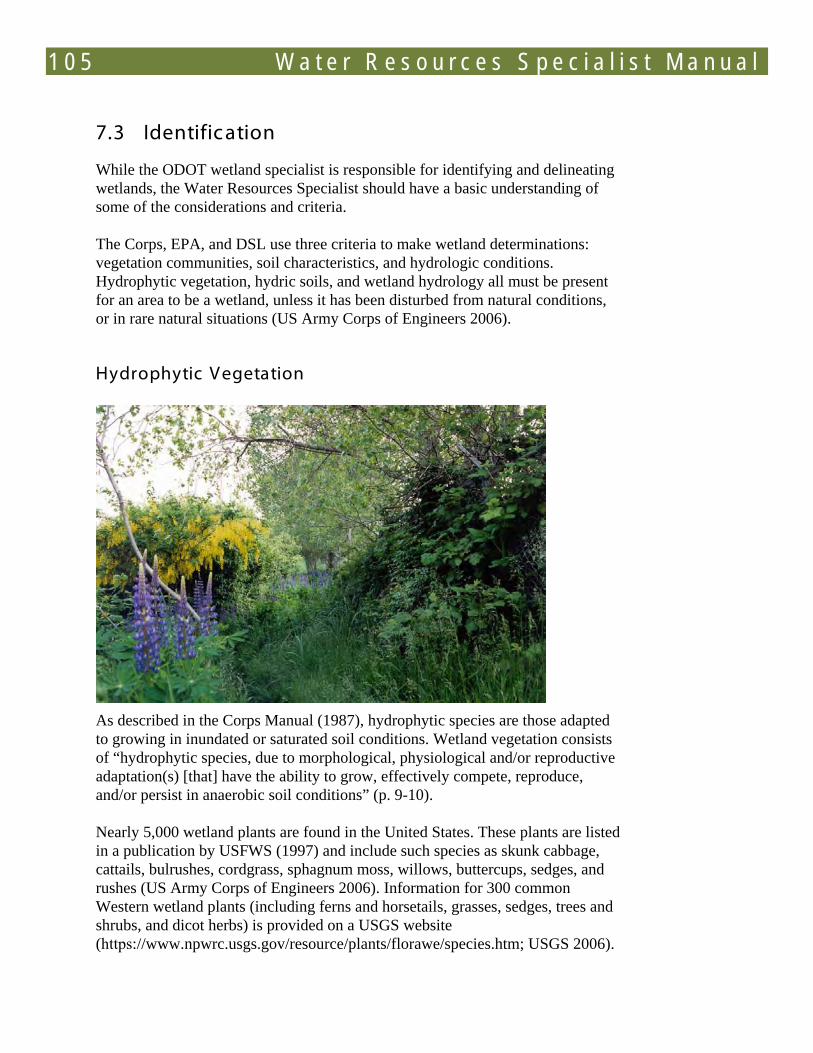
1 0 5 W a t e r R e s o u r c e s S p e c i a l i s t M a n u a l
7.3 Identification
While the ODOT wetland specialist is responsible for identifying and delineating wetlands, the Water Resources Specialist should have a basic understanding of some of the considerations and criteria.
The Corps, EPA, and DSL use three criteria to make wetland determinations: vegetation communities, soil characteristics, and hydrologic conditions. Hydrophytic vegetation, hydric soils, and wetland hydrology all must be present for an area to be a wetland, unless it has been disturbed from natural conditions, or in rare natural situations (US Army Corps of Engineers 2006).
Hydrophytic V egetation
As described in the Corps Manual (1987), hydrophytic species are those adapted to growing in inundated or saturated soil conditions. Wetland vegetation consists of “hydrophytic species, due to morphological, physiological and/or reproductive adaptation(s) [that] have the ability to grow, effectively compete, reproduce, and/or persist in anaerobic soil conditions” (p. 9-10).
Nearly 5,000 wetland plants are found in the United States. These plants are listed in a publication by USFWS (1997) and include such species as skunk cabbage, cattails, bulrushes, cordgrass, sphagnum moss, willows, buttercups, sedges, and rushes (US Army Corps of Engineers 2006). Information for 300 common Western wetland plants (including ferns and horsetails, grasses, sedges, trees and shrubs, and dicot herbs) is provided on a USGS website (https://www.npwrc.usgs.gov/resource/plants/florawe/species.htm; USGS 2006).
W a t e r R e s o u r c e s S p e c i a l i s t M a n u a l 106
As explained in the 1987 Corps Wetlands Delineation Manual (US Army Corps of Engineers 1987), when determining whether an area has wetland vegetation, the whole assemblage of plant species is considered, not just the presence of one or a few wetland “indicator” species, or scattered hydrophytic plants (plants that grow in water or highly-saturated soils).
The following elements may indicate the presence of hydrophytic (wetland) vegetation (US Army Corps of Engineers 1987):
• More than 50 percent of the dominant species are OBL, FACW, or FAC.These designations (which stand for obligate wetland, facultative wetland,and facultative plants) indicate the affinity of a plant species to occur inwetlands. Plants classified as “OBL” almost always occur in wetlands.Plants designated FACW usually occur in wetlands, and FAC plants areequally likely in wetlands or non-wetlands.
Other indicators, including the following:
• Visual observation of plant species growing in areas of prolongedinundation and/or soil saturation
• Morphological adaptations – physical characteristics that indicate theability of a plant to occur in wetlands
• Technical literature, including taxonomic references, botanical journals,and technical reports
• Physiological adaptations that make plants suited for saturated soilconditions
• Reproductive adaptations that enable the plant to become established andreproduce in saturated soil conditions.
For further identification assistance, the DSL wetlands resource website (https://www.oregon.gov/DSL/WETLAND/technical_resources.shtml) provides links to three wetland plant guides:
• USFWS National List of Plant Species That Occur in Wetlands(https://www.fws.gov/nwi/bha/lists.html)
• U.S. Department of Agriculture (USDA) List of Wetland Indicator Plants (https://plants.usda.gov/wetland.html)
• USGS Western Wetland Flora guide(https://www.npwrc.usgs.gov/resource/plants/florawe/species.htm).
1 0 7 W a t e r R e s o u r c e s S p e c i a l i s t M a n u a l
Hydric S oils
Hydric soils develop in conditions where soil is saturated (thus limiting oxygen) for long periods during the growing season.
There are approximately 2,000 hydric soil types in the United States, as listed by NRCS (US Army Corps of Engineers 2006). Soil survey maps and reports, and lists of hydric soils are available for individual Oregon counties on the NRCS website (https://www.or.nrcs.usda.gov/pnw_soil/or_data.html).
There are numerous indications that a soil might be hydric, including the following (US Army Corps of Engineers 2006):
• Soil consists predominantly of decomposed plant material (peats ormucks)
• Soil has a thick layer of decomposing plant material on the surface
• Soil has a bluish gray or gray color below the surface, or the major colorof the soil at this depth is dark (brownish black or black) and dull
• Soil has the odor of rotten eggs
• Soil is sandy and has a layer of decomposing plant material at the soilsurface
• Soil is sandy and has dark stains or dark streaks of organic material in theupper layer below the soil surface. These streaks are decomposed plantmaterial attached to soil particles. When soil from these streaks is rubbedbetween the fingers, a dark stain is left on the fingers.
The DSL technical wetland resources website (https://www.oregon.gov/DSL/WETLAND/technical_resources.shtml) provides a number of hydric soil links and guides, including a hydric soil field indicators spreadsheet, a list of hydric soil indicators, published soil surveys for Oregon, and other useful resources.
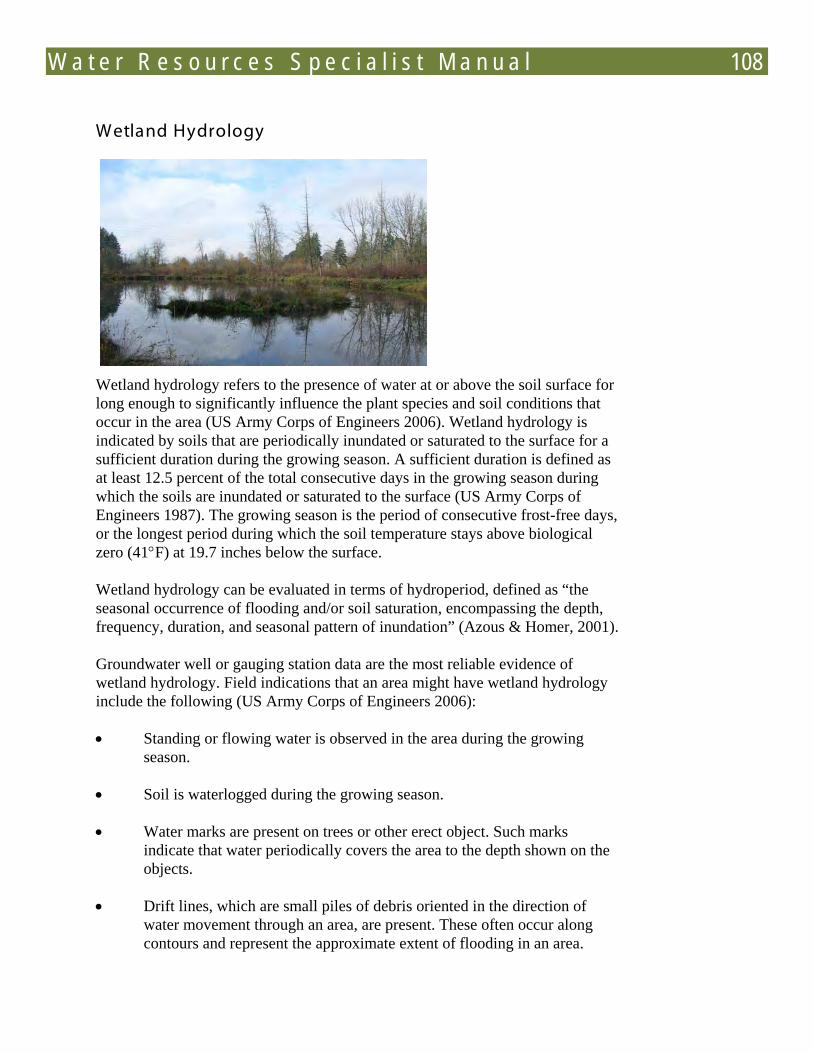
W a t e r R e s o u r c e s S p e c i a l i s t M a n u a l 108
Wetland Hydrology
Wetland hydrology refers to the presence of water at or above the soil surface for long enough to significantly influence the plant species and soil conditions that occur in the area (US Army Corps of Engineers 2006). Wetland hydrology is indicated by soils that are periodically inundated or saturated to the surface for a sufficient duration during the growing season. A sufficient duration is defined as at least 12.5 percent of the total consecutive days in the growing season during which the soils are inundated or saturated to the surface (US Army Corps of Engineers 1987). The growing season is the period of consecutive frost-free days, or the longest period during which the soil temperature stays above biological zero (41°F) at 19.7 inches below the surface.
Wetland hydrology can be evaluated in terms of hydroperiod, defined as “the seasonal occurrence of flooding and/or soil saturation, encompassing the depth, frequency, duration, and seasonal pattern of inundation” (Azous & Homer, 2001).
Groundwater well or gauging station data are the most reliable evidence of wetland hydrology. Field indications that an area might have wetland hydrology include the following (US Army Corps of Engineers 2006):
• Standing or flowing water is observed in the area during the growing season.
• Soil is waterlogged during the growing season.
• Water marks are present on trees or other erect object. Such marks indicate that water periodically covers the area to the depth shown on the objects.
• Drift lines, which are small piles of debris oriented in the direction of water movement through an area, are present. These often occur along contours and represent the approximate extent of flooding in an area.
1 0 9 W a t e r R e s o u r c e s S p e c i a l i s t M a n u a l
• Debris is lodged in trees or piled against other object by water.
• Thin layers of sediments are deposited on leaves or other objects.Sometimes these become consolidated with small plant parts to formdiscernible crust on the soil surface.
7.4 Wetland Determination
The ODOT wetland specialist is responsible for conducting the wetland determination. This section briefly of describes the wetland determination process.
If an area appears to have wetland habitat and may be affected by a proposed project, the first step is to verify the presence or absence of wetlands. A wetland determination is usually performed either entirely off-site or through a combination of offsite research and onsite assessment. DSL will perform an offsite (no field visit) wetland determination free of charge, provided a request form is submitted (https://www.oregon.gov/DSL/PERMITS/docs/wetland_determ_req.doc). These requests can take several weeks to process.
To determine whether wetlands might be present, DSL reviews wetland maps (National Wetlands Inventory (NWI) and Local Wetlands Inventory (LWI) maps), soil survey maps, and aerial photos. People wishing to perform an unofficial wetland determination can use the following resources, available online through DSL:
• NWI maps – https://www.oregon.gov/DSL/WETLAND/nwi.shtml
• LWI maps for numerous Oregon cities and regions –https://www.oregon.gov/DSL/WETLAND/lwi_disclaimer_agreed.shtml
• Hydric soils maps and lists for Oregon, and links to the NRCS information on hydric soils –https://www.oregon.gov/DSL/WETLAND/technical_resources.shtml.
Wetland determinations should be supported by conducting a field visit and digging test pits to verify site conditions. The onsite wetland determination procedure is described in detail in the 1987 Corps manual, and includes steps to verify the presence or absence of wetland plants, hydrology, and soils (US Army Corps of Engineers 1987).
W a t e r R e s o u r c e s S p e c i a l i s t M a n u a l 110
7.5 Wetland Delineation
If wetlands may be present in an area (based on results of a wetland determination and/or previous delineations conducted near the site), and a proposed project would alter the wetlands, a wetland delineation is required as part of the permitting process (described in subsequent sections).
Wetland delineation involves mapping jurisdictional wetland boundaries. Evidence of all three wetland criteria (presence of hydrology, hydric soils, and hydrophytic vegetation) must be present for an area to be considered a wetland, according to the Corps and EPA definition. Inside wetland boundaries, all three wetland criteria are present; outside the boundaries, at least one criterion is absent.
The ODOT wetland specialist or an outside consultant may conduct the wetland delineation, following the guidelines laid out in the Corps Manual (1987) and Manual supplements, (the Arid West Delineation Manual Supplement (https://www.oregon.gov/DSL/PERMITS/docs/aridwest_manual_supp.pdf; US Army Corps of Engineers 2008a) or Western Mountains, Valleys, and Coast Region Supplement (https://www.oregon.gov/DSL/WETLAND/docs/West_Mtns_sup.pdf; US Army Corps of Engineers 2008b), as appropriate for the area the project is located in.
7.6 S tormwater Impac ts on Wetlands
Potential impacts to wetlands related to transportation projects will depend on both the major functions of the impacted wetlands and proposed stormwater management techniques. For example, a wetland with a primary function of flood storage, and with low biological diversity, may be less impacted by an increase in peak flows or volumes to the wetland. Conversely, rerouting stormwater so that the wetland receives less water could negatively affect wetland functions.
S tormwater R unoff Impac ts
Vepraskas et al. (2004) and Azous and Horner (2001) provide overviews of urban stormwater runoff impacts on wetlands. Stormwater runoff can alter wetland hydroperiods, cause erosion and channelization in wetlands, affect water quality, and ultimately reduce habitat quality.
Alterations in wetland hydroperiod due to stormwater runoff frequently result in rapidly rising water levels after storm events and subsequent rapid drawdowns. These alterations typically reduce plant species diversity and can directly affect species such as amphibians, which are dependent on the water column.
Hydroperiod is A seasonal occurrence of flooding and/or soil saturation that encompasses depth, frequency, duration, and seasonal pattern of inundation.
1 1 1 W a t e r R e s o u r c e s S p e c i a l i s t M a n u a l
Large volumes of stormwater discharged at high velocities into wetlands or wetland buffer areas can create erosion channels. The channelized flow of stormwater through the wetland reduces the ability of the wetland to store, filter, and slow the discharge of stormwater. Rapid discharge of stormwater from wetlands can further impact aquatic habitat, affecting aquatic species including fish.
Stormwater runoff from urban areas typically contains numerous chemicals, including petroleum hydrocarbons, road salt, fertilizers, pesticides, and trace metals, particularly zinc. Phosphorus and contaminants may be bound to the soil particles of the sediments carried in the runoff. Chapter 7includes a description of some of the contaminants associated with road and other transportation projects. All of these compounds can negatively impact wetland water quality and biota. Although a wetland may be effective at removing some nutrients and pollutants, over time, a wetland's effectiveness may decrease based on its characteristics and nutrient and pollutant loads. Influx of certain nutrients can dramatically change the plant species composition in a wetland. Additionally, heavy contaminant loads can kill vegetation, soil invertebrates, and other animal life.
Stormwater discharged to wetlands also can deposit sediments, which in turn can affect wetland hydrologic regime and species composition.
7.7 S tormwater Management for Wetland P rotection
As described by Vepraskas et al. (2004), the objective of stormwater management in regards to wetlands is to maintain pre-development wetland hydrology and water quality. Some wetland types, particularly forested wetlands, are sensitive to changes in hydrology, while others are not. In some cases, such as reed canarygrass monocultures, modification of the hydrology may be desirable. Recommended stormwater management techniques are described in Chapter 11.
7.8 Wetland R egulations
Federal, state, and local regulations addressing wetland protection limit actions that impact or potentially impact wetlands. Agencies enforcing wetland regulations include the following:
• The Corps permits fill in wetland under the authority of Section 404 of the federal CWA and Section 10 of the federal Rivers and Harbors Act.
W a t e r R e s o u r c e s S p e c i a l i s t M a n u a l 112
• DSL permits both removal and fill in wetlands under the state removal-fill Law.
• DEQ reviews wetland permits for compliance with Section 401 of the CWA in Oregon indirectly, by enforcing the federal CWA. DEQ personnel may review removal-fill permit applications when water quality issues are involved.
• The Oregon Department of Fish and Wildlife may be involved in the wetland permitting process if listed species (protected under the federal ESA and Oregon ESA) are present in the wetland environment.
• Depending on the project location, there may be additional city or other local regulations in addition to county requirements restricting wetland activities (for example Clean Water Services in Washington County).
• County offices enforce local land use and zoning regulations.
Restrictions include:
• Physical modifications to wetlands that result in removal or fill of 50 yards or more of materials cannot be conducted without a removal-fill permit from DSL and the Corps.
• High functional quality wetlands should be protected, with project improvements and stormwater BMPs selected to maintain the hydrology, water quality, and vegetative communities. Constructed wetlands, described in Chapter 8, mimic the hydrologic and treatment functions of natural wetlands and are a good choice for stormwater treatment and/or flow control.
113 W a t e r R e s o u r c e s S p e c i a l i s t M a n u a l
C HA P T E R 8 - E V A L UA T ING A ND DOC UME NT ING WA T E R R E S OUR C E S
This Chapter provides guidance on identifying, characterizing and documenting water resources that may be impacted by a proposed project. This information is needed for the Water Resources Specialist to complete the baseline report and the WRIA (see Chapter 2).
8.1 Identifying Water R es ources
In developing the baseline report (see Chapter 2), the Water Resources Specialist will identify all receiving waters (both inside and outside the area of potential impact (API; see next section) that are affected by project activities.
To aid in this identification, the Water Resources Specialist should delineate the watershed or watersheds that are influenced by the API. Chapter 10 explains methods of delineating watersheds.
W a t e r R e s o u r c e s S p e c i a l i s t M a n u a l 114
A rea of P otential Impac t
Important water resources may include waters both inside and outside the API for the project. The API includes all areas directly or indirectly affected by the proposed project, including staging and stockpile areas. It may be helpful to think of the API as the “construction footprint” of a project. While receiving waters may be within the API, receiving waters outside the area can also have indirect contact with the API. In those instances, some sort of channel, conduit, groundwater, or overland flow delivers stormwater from the API to the receiving water. The API is typically defined in the Prospectus, Part 3 Report.
T ypes of R ec eiving Waters
The Water Resources Specialist should consider a receiving water to be any water resource (stream, river, lake, wetland, ocean, or groundwater) into which stormwater runoff from a project’s API may flow. The Water Resources Specialist should evaluate impacts within the action area (see explanation under federal ESA in Chapter 3).
Streams and Rivers Streams and river channels are probably the most common receiving water for ODOT projects. They are collecting points for runoff from both natural and developed watersheds. Potential impacts of stormwater on stream and river channel morphology and stability are described in detail in Chapter 6. The thermal, chemical, biological, and ecological effects of stormwater runoff on streams are outlined by Paul and Meyer (2001) in their paper Streams in the Urban Landscape.
Lakes and Ponds Lakes and ponds, like rivers, are collecting points for runoff from both natural and developed watersheds. Nutrient loading from polluted stormwater runoff has long been a concern for lakes. For more information on sources and impacts of nutrients, see Chapter 5. For treatment options for nutrients, see Chapter 11.
Wetlands Wetlands may be receiving waters for a given project. For more information on wetlands and their relationship with ODOT projects, see Chapter 11.
1 1 5 W a t e r R e s o u r c e s S p e c i a l i s t M a n u a l
Groundwater Some ODOT projects discharge stormwater runoff to groundwater through drywells or infiltration facilities. It is important to note that the process of infiltration does not necessarily eliminate pollutants from stormwater. If pollutants are not sequestered by soil or the roots and microorganisms it contains, there is a risk of groundwater pollution. Discharge to groundwater is often subject to UIC regulations (see Chapter 3) and depends on soil properties (see Chapter 11) and site restrictions to protect drinking water. This is most common in the eastern part of state. Groundwater as a Receiving Water discusses this topic in greater detail.
Pacific Ocean The Pacific Ocean may be a receiving water (e.g., for Highway 101 or coastal communities). Flow control is not required for these projects, but stormwater treatment would likely be required.
Water Quality of R ec eiving Waters
Once the receiving waters of a project are determined, the Water Resources Specialist will determine if there are any known water quality issues in the identified receiving waters. DEQ is the primary source of this information.
Total Maximum Daily Loads DEQ publishes and maintains a database associated with the Water Quality Assessment: Integrated 2004/2006 Section 303(d) list. This searchable database contains information on water quality status for water bodies in Oregon, Category 5 water quality limited waters needing a total maximum daily load (TMDL) (2004/2006 Section 303(d) list), and water bodies that were removed from prior year 303(d) lists (delisted). The database can be searched by watershed, water body, pollutant parameter, or listing status. Outputs may be viewed online or downloaded as a comma-separated file viewable in a spreadsheet program. This database is the primary source of known water quality impairment information for the state. The database is available at the following website: https://www.deq.state.or.us/wq/assessment/rpt0406/search.asp
The DEQ TMDL basin list web page includes links to scientific studies and information on water quality and TMDLs for Oregon basins and subbasins. To use this source, the Water Resources Specialist must know what basin or subbasin contains the receiving water. Because the TMDL process is not complete for each basin/subbasin, and each basin/subbasin has different water quality issues, the information for different basins/subbasins varies. Target dates for TMDL completion are listed when no other information is available. TMDL information
W a t e r R e s o u r c e s S p e c i a l i s t M a n u a l 116
is available at the following website: https://www.deq.state.or.us/wq/tmdls/basinlist.htm Known water quality issues from these sources should be documented in the Baseline report.
Database searches will also help to identify which pollutants should be analyzed as the Water Resources Specialist prepares the WRIA (see Chapter 2) evaluates project impacts (see Chapter 10) using the FHWA Driscoll method or an alternate method.
S treamflow Data for R ec eiving Waters
If project receiving waters include streams or rivers, the Water Resources Specialist should look for stream flow data for that receiving water.
Average Annual Discharge Average annual discharge for streams may be obtained from 1) stream gauge data; 2) extrapolation from other similar gauged streams; or 3) regression equations.
Stream Gauge Data The USGS operates a large network of stream gauges across Oregon. Some of these gauge sites record additional information such as temperature. Real time and historic data for sites operated by the USGS is available from the following website:
https://waterdata.usgs.gov/or/nwis/nwis
Additional stream gauge data is available from the Oregon Water Resources Department:
https://www.wrd.state.or.us/OWRD/PUBS/ToolsData.shtml#Surface_Water
The USGS StreamStats website is a useful source of stream flow data, drainage basin characteristics, and other useful information for gauged and ungauged streams.
https://water.usgs.gov/osw/streamstats/index.html
Extrapolation from Other Gauged Streams Not all streams and rivers contain a stream gauge. Also, stream gauges are not always located close enough to a project site for the data to be applied without
1 1 7 W a t e r R e s o u r c e s S p e c i a l i s t M a n u a l
modification (i.e., the gauge is hydrologically separated from the project area by significant tributaries or watershed area that will contribute additional flow to the receiving water).
The USGS StreamStats (https://water.usgs.gov/osw/streamstats/)and the OWRD website (https://www.oregon.gov/OWRD/SW/peak_flow.shtml) have tools for estimating peak discharge in the absence of stream flow data.
If gauge data is available for a receiving water but the gauge is not close enough to the project to be directly applicable, the Water Resources Specialist is encouraged to contact an experienced hydrologist to conduct a basin scaling exercise to modify the gauge data to better reflect the project location.
Regression Equations If gauge data is not available for a project site or receiving water, the Water Resources Specialist is encouraged to contact an experienced hydrologist to conduct the analysis required to estimate stream flow characteristics based on methods such as regional regression equations or hydraulic geometry relationships.
Regression equations for western and eastern Oregon may be obtained from USGS (Cooper 2005; USGS 1983).
Chapter 7 of the Hydraulics Manual (Appendices B through E) has links to these USGS reports and other documents containing procedures for estimating peak discharges on ungauged streams.
Flood Frequencies Flood frequencies are important for sizing of bridges and culverts, determining bankfull discharges and elevations (for the fluvial performance standard), and determining bank overtopping flows (for sizing flow control facilities).
Though precipitation and climate information may use similar frequency statistics, a storm of a certain frequency (based on rainfall) usually does not cause a flood of the same frequency. Discharge in the stream at the start of the storm, other water sources such as snow melt, the extent of the storm (how much of the watershed is covered) and direction and speed of the movement of the storm across the watershed are among the factors influencing the effect of the precipitation on flood flows.
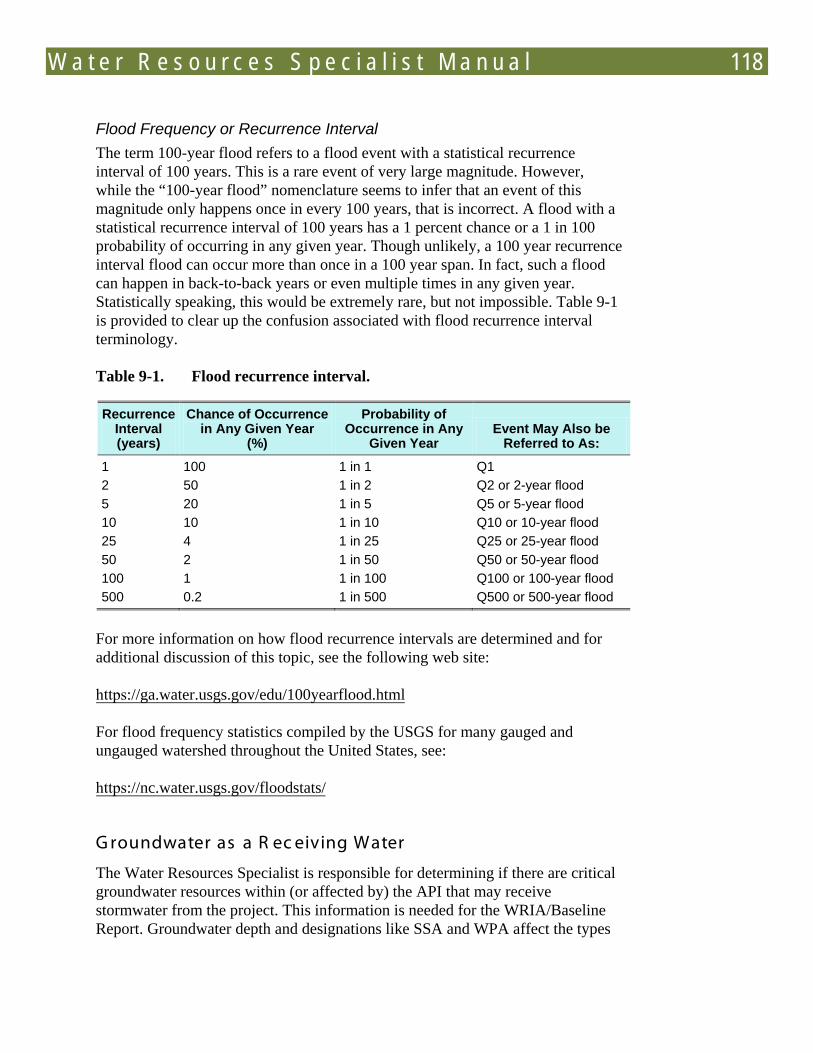
W a t e r R e s o u r c e s S p e c i a l i s t M a n u a l 118
Flood Frequency or Recurrence Interval The term 100-year flood refers to a flood event with a statistical recurrence interval of 100 years. This is a rare event of very large magnitude. However, while the “100-year flood” nomenclature seems to infer that an event of this magnitude only happens once in every 100 years, that is incorrect. A flood with a statistical recurrence interval of 100 years has a 1 percent chance or a 1 in 100 probability of occurring in any given year. Though unlikely, a 100 year recurrence interval flood can occur more than once in a 100 year span. In fact, such a flood can happen in back-to-back years or even multiple times in any given year. Statistically speaking, this would be extremely rare, but not impossible. Table 9-1 is provided to clear up the confusion associated with flood recurrence interval terminology.
Table 9-1. Flood recurrence interval.
Recurrence Interval (years)
Chance of Occurrence in Any Given Year
(%)
Probability of Occurrence in Any
Given Year Event May Also be
Referred to As:
1 100 1 in 1 Q1 2 50 1 in 2 Q2 or 2-year flood 5 20 1 in 5 Q5 or 5-year flood 10 10 1 in 10 Q10 or 10-year flood 25 4 1 in 25 Q25 or 25-year flood 50 2 1 in 50 Q50 or 50-year flood 100 1 1 in 100 Q100 or 100-year flood 500 0.2 1 in 500 Q500 or 500-year flood
For more information on how flood recurrence intervals are determined and for additional discussion of this topic, see the following web site:
https://ga.water.usgs.gov/edu/100yearflood.html
For flood frequency statistics compiled by the USGS for many gauged and ungauged watershed throughout the United States, see:
https://nc.water.usgs.gov/floodstats/
G roundwater as a R ec eiving Water
The Water Resources Specialist is responsible for determining if there are critical groundwater resources within (or affected by) the API that may receive stormwater from the project. This information is needed for the WRIA/Baseline Report. Groundwater depth and designations like SSA and WPA affect the types
1 1 9 W a t e r R e s o u r c e s S p e c i a l i s t M a n u a l
of stormwater treatment and flow control BMPs that can be implemented in an area.
The following website provides more information and links about groundwater in Oregon, including monitoring data and well logs. The site contains a link to an Oregon Water Resources Web Mapping program, which allows the user to search for ground water protection zones and other information within a given basin, township and range:
https://egov.oregon.gov/OWRD/GW/index.shtml
In addition to groundwater quality considerations, there are other critical groundwater resources that must be more strictly protected. These include wellhead protection areas (WPA) and Sole Source Aquifers (SSA).
A WPA includes the surface and subsurface areas surrounding a water well, spring, or wellfield that supply a public water system, through which contaminants are reasonably likely to move toward and reach the surrounded well, spring or wellfield. According to the Oregon Health Division and DEQ (1994), the size and location of a WPA:
“depends on several key issues, including the pump rate and the characteristics of the aquifer. In Oregon it is recommended that an area large enough to encompass 10 years of groundwater travel time be delineated so that if the aquifer becomes contaminated upgradient, there will be sufficient time to devise a plan to deal with the contamination. Delineations such as above may extend in excess of several thousand feet away from the wellhead.”
The Water Resources Specialist must determine whether proposed sites for infiltration BMPs are located within WPAs. If infiltration is proposed for treatment or flow control, contact the Health Service’s Groundwater Coordinator (541-726-2596 x21). If there is a WHPA, check local community ordinances for instructions. Typically, infiltration facilities are not permitted within Zone A, the Drinking Water Critical Impact Zone, but may be allowed within Zone B.
A sole source aquifer (SSA) is an underground water supply designated by the EPA as the "sole or principal” source of drinking water for an area. There is only one SSA in Oregon, the North Florence Dunal Aquifer, the drinking water source for Florence, on the central Oregon coast. Several lakes, including Collard, Clear, Ackerly, and Munsel Lakes, are connected to this SSA. For this reason, stormwater runoff to any of these lakes should be considered as having an effect on the North Florence Dunal Aquifer.
W a t e r R e s o u r c e s S p e c i a l i s t M a n u a l 120
GIS data and additional information on the extents of the North Florence Dunal Aquifer is available from the EPA, Region 10:
https://yosemite.epa.gov/r10/homepage.nsf/webpage/Contact+Us?opendocument The USGS operates a limited number of groundwater level monitoring stations. Data is available at the following website.
https://groundwaterwatch.usgs.gov/
R egulatory F loodways /F loodplains
There is often a great deal of confusion about regulatory floodways, floodplains, and the terminology used to describe them. While not required to model, define, or delineate these features, the Water Resources Specialist must understand concepts and terminology to effectively communicate with hydrologists, hydraulic engineers, and other technical staff involved in ODOT project that may be affected by overbank flows and floodplain inundation. This section defines and clarifies some important terms and concepts that the Water Resources Specialist will likely encounter.
Definitions and Key Concepts
Floodplain A floodplain is an area adjacent to a river or stream channel that experiences occasional or periodic inundation during floods. The floodplain includes the floodway and areas sometimes referred to as the flood fringe, both of which are inundated during floods but do not contribute significantly to flood flow conveyance and do not experience significant flow velocities.
Floodplains are typically referred to (and delineated) based on their inundation recurrence interval. For example, a 50 year floodplain is an area with a statistical probability of being inundated once every 50 years, and a 100 year floodplain is an area with a statistical probability of inundation once every 100 years. It is critical to understand that these are statistical odds used to quantify risk. Though unlikely, a 100 year flood can happen multiple times in a 100 year period. For example, two 100 year flood events can happen in back to back years, or even in the same year. See the Flood Frequency or Recurrence Interval section for more information.
The Water Resources Specialist should determine whether the proposed project falls within any previously delineated floodplains. Floodplain delineation maps are available through the FEMA Map Service Center:
1 2 1 W a t e r R e s o u r c e s S p e c i a l i s t M a n u a l
https://msc.fema.gov/webapp/wcs/stores/servlet/FemaWelcomeView?storeId=100 01&catalogId=10001&langId=-1
These maps were developed for insurance purposes and may not be current or accurate, especially in basins with severely altered hydrology resulting from increased impervious surface areas.
Floodway A floodway is an area that includes the channel of a river, stream, or other watercourse and adjacent lands that conveys floodwaters. A floodway is composed of the active river channel and those parts of the floodplain which experience flows of significant velocity and convey flow during flood events. The floodway concept has regulatory significance, imposing boundaries on developable area. According to FEMA,
“A "Regulatory Floodway" means the channel of a river or other watercourse and the adjacent land areas that must be reserved to discharge the base flood without cumulatively increasing the water surface elevation more than a designated height. Communities must regulate development in these floodways to ensure that there are no increases in upstream flood elevations. For streams and other watercourses where FEMA has provided Base Flood Elevations (BFEs), but no floodway has been designated, the community must review floodplain development on a case-by-case basis to ensure that increases in water surface elevations do not occur, or identify the need to adopt a floodway if adequate information is available.” (FEMA 2010).
Floodplains and floodways in Oregon are regulated by county ordinances. Consult county staff on specific regulations. A No-rise certification is required from local governments to comply with FEMA regulations (see Chapter 3).
Flood Prone Area A Flood Prone Area is a geometric parameter defined by Rosgen (1996) as the cross-sectional area between the stream bed and floodplain surface and a horizontal line (the flood prone elevation) at twice the maximum bankfull depth above the riffle’s thalweg. According to Rosgen, the Flood Prone Area represents the area prone to flooding after bankfull water surface elevation is reached. This is a physical parameter, not related to FEMA floodplain regulations nor to specific flood frequency intervals. A Flood Prone Area should not be confused or used interchangeably with the terms floodplain or floodway.
W a t e r R e s o u r c e s S p e c i a l i s t M a n u a l 122
This parameter is used by ODOT to determine the “functional floodplain”, which is a consideration in determining the appropriate size for bridges and culverts for environmental permitting. For more information, see Chapter 6.
Channel Migration Zone A CMZ is a geographic area along a stream or river channel where the channel is, has been, or may be in the future. The area within the CMZ is subject to bank erosion, flood inundation, channel occupation, or other results of the channel migrating, avulsing, or widening laterally or incising or aggrading vertically. The CMZ typically includes the 100-year floodplain, and may also include areas outside of the 100-year floodplain such as perched alluvial terraces (particularly those composed of highly erodible material such as sand) that the channel may erode into without inundating. For more information, see Chapter 6.
123 W a t e r R e s o u r c e s S p e c i a l i s t M a n u a l
C HA P T E R 9 - WA T E R S HE D DE L INE A T ION
A watershed, also called a drainage basin, river basin, or catchment, is the geographic area that contributes all of the water that flows to or through a specified point. The Contributing Impervious Area is a highway project’s portion of the watershed.
The Water Resources Specialist needs to delineate project area watersheds to support determination of a project’s action area (see Chapter 3) and calculations of a project’s impact on water quality (see Chapter 5). The Water Resource Specialist also needs to know the size and extent of the Contributing Impervious Area (CI).
Watershed delineations are also performed for the following reasons on ODOT projects:
• To gather drainage basin information to determine flows in support of the design of hydraulic structures (bridges or culverts) in ungauged streams without a long-term flow record. More information on streamflows is provided in Chapter 8. A watershed delineation for this reason would be performed by a hydraulics engineer, and is not covered in this chapter.
• When reviewed in conjunction with zoning maps or aerial photographs, watershed delineations can be useful in identifying predominant land uses within the areas that drain to a particular water body, allowing the Water Resources Specialist to determine likely pollutants of concern. This is particularly useful for streams that are not included on the state 303(d) list of impaired water bodies.
• To provide a graphical representation of the scale of a receiving water and the relative size of a project. A figure showing the delineated boundary of the watershed should be included in the SWMP and the baseline report for a given project (see Chapter 2).
9.1 Delineating a Waters hed
A watershed delineation is performed by following these basic steps, described in the following sections:
1. Determine the location of the watershed outlet. 2. Delineate the boundary of the watershed according to one of two methods
and calculate watershed area.

W a t e r R e s o u r c e s S p e c i a l i s t M a n u a l 124
3. Adjust the watershed boundary to compensate for human-made alterationsto the landscape or water conveyance features.
4. Ground-truth the boundary of the watershed.
More details and examples of the delineation process are available at: https://csc-s-maps-q.csc.noaa.gov/salmonid/html/water/back.htm.
Determining L oc ation of Waters hed Outlet
The watershed outlet is the geographic location where surface water leaves the watershed. The watershed outlet will be the point of lowest elevation within the watershed. A drop of water falling anywhere within the watershed that doesn’t infiltrate into the ground will ultimately reach the outlet. A watershed boundary can never cross a stream. A watershed boundary can cross a wetland or a lake, but only if that feature has multiple outlets that drain to different watersheds.
In the case of a lake that has no surface flow outlet, the watershed outlet is the lake itself, and the watershed is comprised of all areas from which a drop of water would flow downhill to the lake or wetland.
The location of the watershed outlet is determined either for design purposes or to determine the watershed area for use in dilution calculations, as described below.
Outlet Location for Design Purposes In a watershed delineation performed by a hydraulics engineer for design purposes (for example, to determine streamflow characteristics for a new culvert or bridge), the location of the watershed outlet would be at the stream cross-section corresponding to the proposed project location. The watershed would include all areas that contribute flow to that point. For ODOT projects, the project hydraulics engineer is responsible for designing or verifying hydrology for projects involving bridges or other in-stream structures.
Outlet Location for Determination of Watershed Area for Action Area Determination For determination of the action area under the federal ESA (see Chapter 3), the outlet is the upstream extent of the T&E species habitat (consult with project biologist).
Once the watershed outlet has been determined, the watershed delineation can be performed.
1 2 5 W a t e r R e s o u r c e s S p e c i a l i s t M a n u a l
Determining Waters hed B oundary and A rea
To estimate the watershed area above the upstream extent of the T&E species habitat, use one of the following methods.
OWRD Basin Auto-delineation Tool The Oregon Water Resources Department has an online tool for estimating peak discharges that includes an auto-delineation function. Currently, the tool is difficult to use and the resolution is very coarse, resulting in limited accuracy. It may be useful for checking a watershed area determined by another method, but it should not be used as the sole method of determining watershed size. The basin auto-delineation tool is available at: https://www.oregon.gov/OWRD/SW/peak_flow.shtml
Automated delineation methods, such as the OWRD basin delineation tool, are less suitable when natural surface drainage patterns defined by topography may be disrupted by ditches or pipe networks conveying stormwater not discernible by examining topography alone (Djokic and Ye, undated; Islam, undated).
GIS-Based Watershed Delineation Watershed delineations can be accomplished by using GIS technology. Data from a digital elevation model or other topographic data are used to delineate watersheds based on a number of possible inputs, such as a stream cross-section, a stream reach, a project area of interest, or a “pour point”. A pour point is the GIS term that describes the user-defined point from which a catchment is delineated. The pour point would be the watershed outlet point and the lowest point of that catchment.
GIS techniques can quickly, efficiently, and accurately delineate a surface watershed over large area and determine its areas for use in the Driscoll method. GIS techniques are outside the scope of this manual; the Water Resources Specialist is encouraged to seek the assistance of a qualified hydrologist with specific knowledge of GIS techniques and capabilities for more information.
StreamStats The watershed area can be readily estimated using StreamStats, an online tool developed by the USGS. StreamStats is a tool based on GIS that was developed to estimate peak discharge rates in streams. As a part of the estimation of watershed area, the tool delineates the watershed on the basis of a point on a stream system that is selected by the user. StreamStats for Oregon is available at: https://water.usgs.gov/osw/streamstats/oregon.html.
W a t e r R e s o u r c e s S p e c i a l i s t M a n u a l 126
This method involves zooming in to the project area and selecting the project discharge location. If the Water Resources Specialist uses StreamStats, it is important to check the basin delineation for accuracy. Verify that there aren’t visible errors in the boundary, and edit the boundary if necessary. Instructions for using StreamStats are available at: https://water.usgs.gov/osw/streamstats/instructions.html.
Before applying the results obtained from StreamStats or any automated procedure, the Water Resources Specialist should understand its limitations. It is recommended that users read the limitations of StreamStats at: https://water.usgs.gov/osw/streamstats/ssdis.html.
Manual Watershed Delineation For the manual watershed delineation method, the Water Resources Specialist will need to obtain or develop a topographic map that includes the watershed to be delineated and the surrounding area. The map must have an appropriate scale and contour intervals, and must be plotted or set to a known scale and unit system, so that the watershed area can be calculated from the delineated boundary.
Topographic maps can be obtained from the USGS (if low resolution and wide contour interval is acceptable) or the project engineers, who likely have a detailed and accurate topographic map of the project area based on survey information and light detection and ranging (Lidar) data. In many cases, topographic data from multiple sources will have to be combined to create the best possible map for use in the watershed delineation.
An appropriate topographic contour interval depends on several factors. As the size and scale of the watershed decrease, or the topographic complexity and number of human-made landscape alterations (such as roads, drainage ditches, and stormwater pipe networks) increase, the contour interval must be decreased. For flatter areas, a smaller contour interval is required to capture the topographic detail necessary for an adequate delineation. In addition, the more accuracy required for the delineation (based on, for example, project risk), the smaller the contour interval should be. Typically, contour intervals of 1 to 2 feet are appropriate at the site scale.
Detailed instructions for reading topographic maps and delineating watershed boundaries are available at:
• https://www.nh.nrcs.usda.gov/technical/Publications/Topowatershed.pdf
• ftp://ftp-fc.sc.egov.usda.gov/NCGC/products/watershed/hu-standards.pdf (Sections 4 and 5 are most relevant).
1 2 7 W a t e r R e s o u r c e s S p e c i a l i s t M a n u a l
For the manual method, use either a pencil and paper map, or a computer software mapping/drafting package such as ArcView or AutoCAD. The manual method is the same, whether performed with pencil or computer, although a digital delineation can greatly simplify the process and reduce the time required to calculate the area of the delineated watershed.
Methods Before sketching/digitizing the watershed boundary, it may help to draw arrows indicating the direction of flow (downhill), particularly if there are any localized depressions or peaks within the watershed boundaries. These arrows must cross contour lines at a 90 degree angle.
To draw the boundary, begin at the watershed outlet and draw a line that extends away from the stream bank and perpendicular to the topographic contour lines.
Continue drawing the boundary between contours until you have worked your way back around to the other side of the watershed outlet. The watershed line will then extend perpendicular to the contours and down to the watershed outlet on the opposite stream bank.
Once the watershed boundary has been delineated, the area of the watershed can be determined.
Manual Techniques for Measuring Watershed Area Instructions for measuring watershed areas through manual techniques, such as through use of a planimeter or the dot grid method are provided at: https://www.nh.nrcs.usda.gov/technical/Publications/Topowatershed.pdf
In recent years, computerized methods have all but replaced the manual methods for determining watershed area because of their simplicity and accuracy. Methods based on CAD or GIS greatly simplify the process of determining the area of a delineated watershed. If a watershed is manually delineated on paper, the watershed boundary may be digitized and the area of a watershed polygon computed automatically. If the watershed is manually digitized in AutoCAD or GIS, the area may be computed with no additional steps. Methods for determining area from digitized watershed boundaries vary between software packages.
Adjusting Watershed Boundary In areas where human activity has already altered the landscape by site development, natural surface drainage patterns defined by topography may be disrupted by the presence of ditches or pipe networks conveying stormwater in ways not discernible by looking at the topography alone. For example, stormwater
W a t e r R e s o u r c e s S p e c i a l i s t M a n u a l 128
from an impervious area located within an adjacent watershed may be rerouted across watershed boundaries and into the watershed where your area of potential impact is located. If prior site development is evident, you must obtain any existing stormwater drainage plans for the area and include the effects of existing stormwater infrastructure in the new watershed delineation.
Hydrologic Unit C ode
You will need to identify the 6th Field Hydrologic Unit Code (HUC) as part of the Baseline Report (see Chapter 2).
HUCs are a system of watershed delineation and identification developed by the USGS. HUCs are classified into a hierarchy of orders, with lower orders being subdivided into higher orders. There are 49 4th order HUCs in Oregon, which are split into 1,063 5th field HUC’s with an average size of 58,218 acres. Currently, the smallest watersheds delineated in Oregon are 6th field HUCs. Identification of the 6th order HUC is required for all projects. Geospatial maps for all HUC delineations in Oregon are available at: https://www.oregon.gov/DAS/EISPD/GEO/alphalist.shtml#H.
G round-T ruthing the Waters hed B oundary
Ground-truthing means conducting a field visit to confirm the watershed delineation (if the topographic map was unclear in specific areas). If necessary, you can arrange site visits with ODOT field staff to see the actual delineated boundary and determine if there drainage patterns differ from those assumed in the delineation. After the site visit, modify the original watershed delineation as needed to reflect the actual drainage patterns, including the effects of human-made alterations to the landscape and water conveyances.
9.2 C ontributing Impervious A rea
The CIA of an ODOT project consists of the impervious surface within the project boundaries and ODOT-owned or operated impervious surfaces that drain into the project boundaries. Projects that trigger the need for stormwater management (see Section 1.2) have as their water quality goal the treatment of the stormwater from the CIA. The CIA is used by the Water Resources Specialist in permitting and environmental documents to show to what extent water quality goals can be met. The BMP designer needs to know the extent and area of the CIA to correctly design and size treatment facilities.
1 2 9 W a t e r R e s o u r c e s S p e c i a l i s t M a n u a l
Definition of the C IA
Figure 9-1 shows the basic concept of the CIA. At its simplest, if a project occupied the low point or sag between two hills, the CIA extends from the crest of one hill to the crest of the next. However, the CIA may actually be smaller than that if the stormwater from the top of a hill is diverted before reaching the project area. The project only has responsibility to treat the stormwater that enters the project area.
Projects situated on the crest of a hill that do not extend all the way down to the low point have a CIA that only encompasses the project area, and are expected to provide treatment for the water that leaves the project, not that from the highway further downhill. However, if the treatment BMP is placed at the bottom of the hill, the entire roadway to the BMP should be included. Finally, projects that have their termini uphill of the low point and below the crest will have a CIA that extends from the crest to the low end of the project.
Delineating the C IA
The delineation of the CIA may be done by the Water Resources Specialist, the Hydraulics Engineer or Roadway Designer (depending on the Region), or both working together. How difficult the delineation is depends on the topography and the existing drainage system. Where the relief is pronounced and runoff flows in open ditches, identification of the uphill limit of the CIA is usually easy. Flat areas and highways with storm drainage in pipes can be more problematic.
Office resources for delineating the CIA include topographic maps and the as-built drawings for the pre-project highway, specifically the drainage plans. Neither are definitive, and should be field-checked. Also of use is the ODOT Outfall Inventory, available for the major urbanized areas of the Willamette Valley. The inventory does not include the drainage area for the outfall, but may help determine if all of a highway upgrade of a project drains into the project.
During a field inspection, look to see if there is continuous conveyance from the top of the grade to the project. Diversions of a ditch or drain may remove a segment of highway from a project’s CIA. Likewise, segments of highway that sheet flow runoff without collecting in are not included in the CIA. When a highway has subsurface storm drains, it may be necessary to inspect inlets to determine where the water is coming from and where it is going. A flashlight is helpful. The lowest pipe in an inlet or sump is typically the outflow, but there are exceptions.
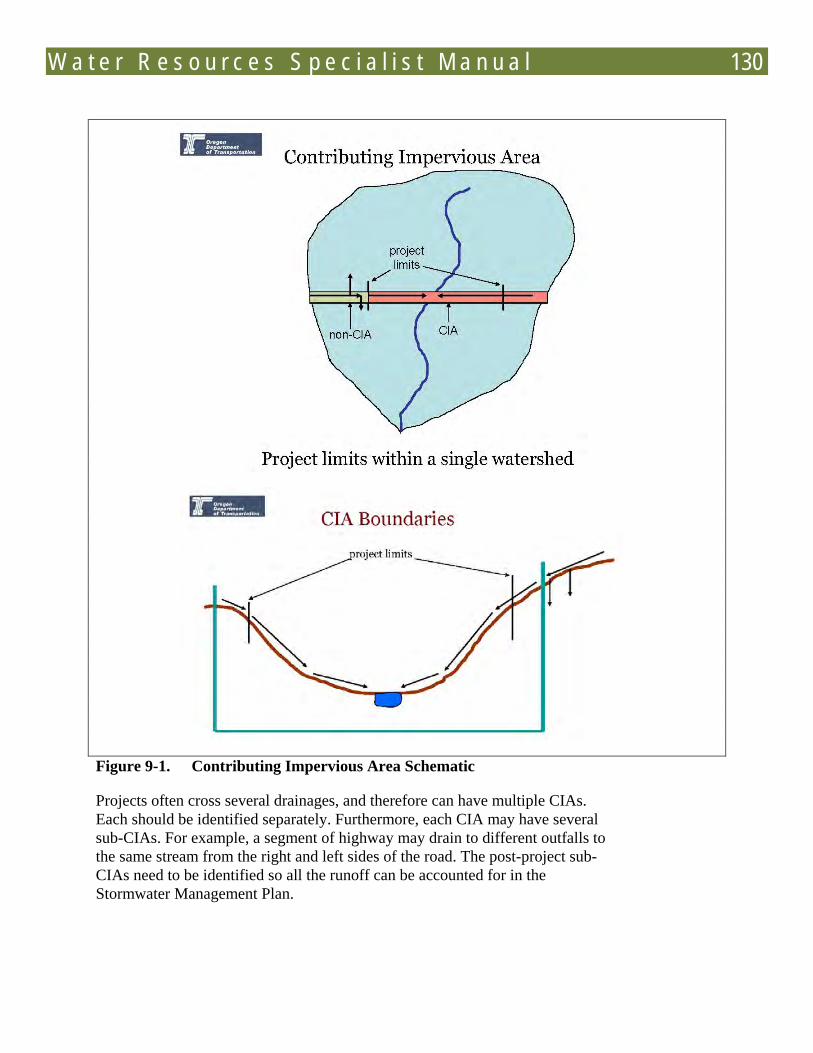
W a t e r R e s o u r c e s S p e c i a l i s t M a n u a l 130
Figure 9-1. Contributing Impervious Area Schematic
Projects often cross several drainages, and therefore can have multiple CIAs. Each should be identified separately. Furthermore, each CIA may have several sub-CIAs. For example, a segment of highway may drain to different outfalls to the same stream from the right and left sides of the road. The post-project sub-CIAs need to be identified so all the runoff can be accounted for in the Stormwater Management Plan.

1 3 1 W a t e r R e s o u r c e s S p e c i a l i s t M a n u a l
The actual area of the CIA and sub-CIAs is determined from the project plans. The Hydraulics Engineer or the Roadway Designer can quickly calculate the area from the design files.

133 W a t e r R e s o u r c e s S p e c i a l i s t M a n u a l
C HA P T E R 10 - ME T HODS F OR E S T IMA T ING IMP A C T S
Most ODOT projects classified as Class 2 (no significant environmental impacts) are not required to formally evaluate the impact of a project on the quality of receiving waters. However, projects requiring either an EA or an EIS usually do need a more detailed analysis. On rare occasions, detailed analysis may be required to support a BA or document compliance with a TMDL.
The two parameters that can be modeled are the pollutant load discharged to receiving waters, and the in-stream concentration of a pollutant resulting from the discharge of highway runoff. The load may be important when assessing the effect of a project on TMDLs. Pollutant concentration is particularly important when evaluating the potential intensity and extent of an impact on aquatic species.
There is no mandated evaluation method for ODOT projects. If a project requires detailed analysis, the WRS should select methods that address the pertinent issues.
This chapter discusses four methods for estimating impacts of transportation projects (two of which are currently under development):
• The FHWA Driscoll method uses a probabilistic analysis of stream flow, highway runoff flow, and pollutant concentration to calculate pollutant concentrations in receiving waters.
• The Washington State Department of Transportation (WSDOT) method is a mass balance tool that calculates pollutant loadings and concentrations in stormwater runoff.
• The Stochastic Empirical Loading and Dilution Model (SELDM) is currently under development by USGS.
• The Highway Runoff Dilution and Loading (HI-RUN) model is under development by WSDOT, and will replace the WSDOT method mentioned above.
• When a project discharges stormwater to a small receiving water, the FHWA Driscoll method should be used to determine the resulting in-stream pollutant concentrations. SELDM will become the preferred method when it is formally released. When the receiving water is a large
W a t e r R e s o u r c e s S p e c i a l i s t M a n u a l 134
river, extreme dilution renders a concentration analysis pointless, so mass loading becomes the important parameter.
• When estimating project impacts, the FHWA model can be used to determine the action area for federal ESA purposes (see Chapter 3).
10.1 Overview of Methods
F HWA Dris c oll Method
The FHWA Driscoll method (Driscoll et al. 1990) estimates mixed pollutant concentrations in a receiving water (assuming complete mixing.) This method is based on a probabilistic analysis of the mean and coefficient of variation (CV) values of stream flow, highway runoff flow and pollutant concentration.
The method assumes that the preceding variables are log-normally distributed. By log transforming the mean and CV values, the probability distributions of the stream dilution factor, stream concentration, and runoff concentration can be calculated. The probability distribution of the combined stream concentration due to highway runoff can be calculated from these distributions. The calculated stream concentration distribution can then be compared to the target pollutant level to evaluate the potential for adverse water quality impacts.
Table 10-1 lists the required inputs for the FHWA Driscoll method for stream and lake impact analysis. Most of the input variables require the mean and CV values.
Ideally, input values for rainfall, stream flow, and pollutant concentrations should be based on data measured within close proximity of the site being evaluated. If local data is unavailable, regional averages rainfall and stream data in Driscoll et al. (1990) can be used.
Step-by-step instructions for using the FHWA Driscoll method, including rainfall data for Oregon, a map of stream flow data, and site median concentrations (as a function of ADT) are available from the Water Resources Program Coordinator.
For stream impact analysis, the result of using the FHWA Driscoll method is the highest estimated pollutant concentration that will on average occur during one storm event in a 3-year period.
For lake impact analysis, the FHWA Driscoll method can be used to estimate the phosphorus concentration of a lake based on the mean inflow rate, lake surface area, and runoff phosphorus concentrations. Since the acceptable phosphorus concentration depends on the condition of each lake, the target level may vary. A
The CV, defined as the ratio of the standard deviation to the mean, provides a measure of the dispersion of the data distribution.
The mean is the sum of the observations divided by the number of observations
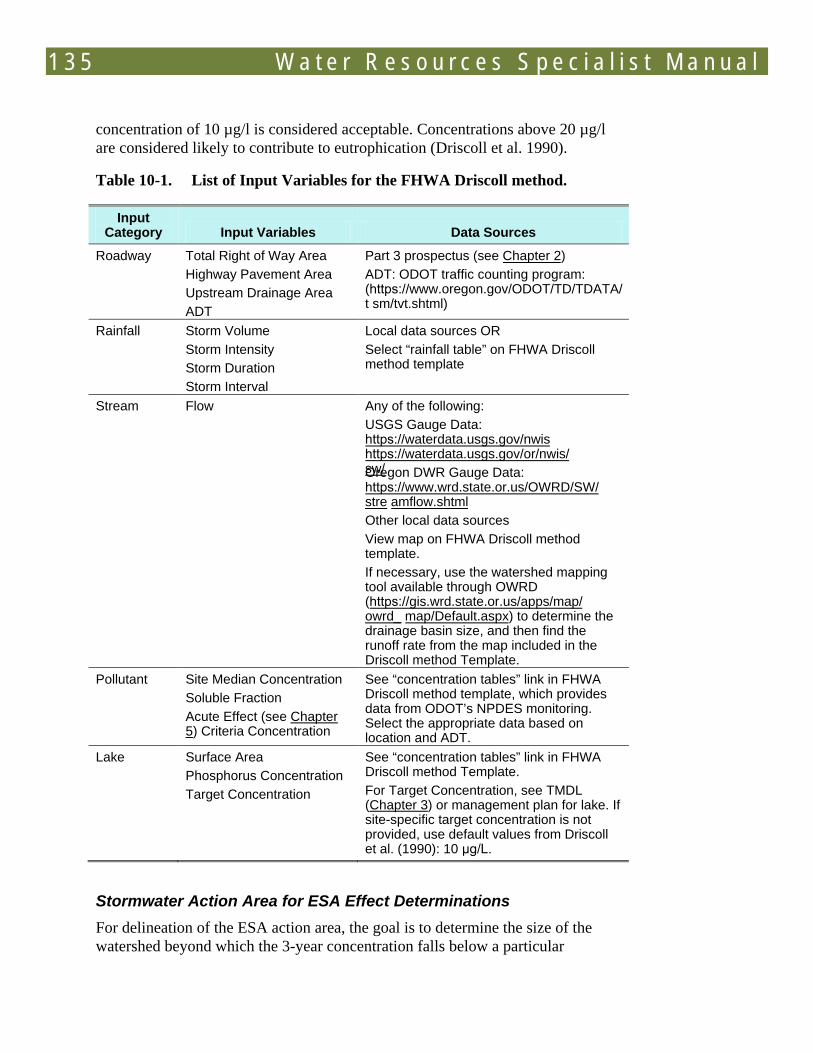
1 3 5 W a t e r R e s o u r c e s S p e c i a l i s t M a n u a l
concentration of 10 µg/l is considered acceptable. Concentrations above 20 µg/l are considered likely to contribute to eutrophication (Driscoll et al. 1990).
Table 10-1. List of Input Variables for the FHWA Driscoll method.
Input Category Input Variables Data Sources
Roadway Total Right of Way Area Highway Pavement Area Upstream Drainage Area ADT
Part 3 prospectus (see Chapter 2) ADT: ODOT traffic counting program: (https://www.oregon.gov/ODOT/TD/TDATA/t sm/tvt.shtml)
Rainfall Storm Volume Storm Intensity Storm Duration Storm Interval
Local data sources OR Select “rainfall table” on FHWA Driscoll method template
Stream Flow Any of the following: USGS Gauge Data: https://waterdata.usgs.gov/nwis https://waterdata.usgs.gov/or/nwis/sw/ Oregon DWR Gauge Data: https://www.wrd.state.or.us/OWRD/SW/stre amflow.shtml Other local data sources View map on FHWA Driscoll method template. If necessary, use the watershed mapping tool available through OWRD (https://gis.wrd.state.or.us/apps/map/owrd_ map/Default.aspx) to determine the drainage basin size, and then find the runoff rate from the map included in the Driscoll method Template.
Pollutant Site Median Concentration Soluble Fraction Acute Effect (see Chapter 5) Criteria Concentration
See “concentration tables” link in FHWA Driscoll method template, which provides data from ODOT’s NPDES monitoring. Select the appropriate data based on location and ADT.
Lake Surface Area Phosphorus Concentration Target Concentration
See “concentration tables” link in FHWA Driscoll method Template. For Target Concentration, see TMDL (Chapter 3) or management plan for lake. If site-specific target concentration is not provided, use default values from Driscoll et al. (1990): 10 μg/L.
Stormwater Action Area for ESA Effect Determinations For delineation of the ESA action area, the goal is to determine the size of the watershed beyond which the 3-year concentration falls below a particular
W a t e r R e s o u r c e s S p e c i a l i s t M a n u a l 136
“defining” value. Given the post construction project area, a presumed median pollutant concentration in the runoff and the defining concentration, iterations of the calculations can be done to identify the watershed size. Watershed delineation tools, such as those available from the USGS and OWRD (see Chapter 9), are then used to locate the point on the receiving water that constitutes the downstream limit of the action area. If listed species are present at or above that point, ESA coordination may be necessary. Alternatively, the watershed size at the upstream most limit of T&E species presence can be compared to the action area watershed size. If the T&E watershed size is smaller or equal to the Action Area watershed size, then the species is within the action area.
See Chapter 3 for step-by-step procedures on determining the action area under the federal ESA.
Modified WS DOT Method
WSDOT developed a model for estimating annual load and runoff concentration in project runoff (before mixing with receiving waters) for pre- and post-project conditions, based on a simple mass balance (WSDOT 2008a). WSDOT is currently developing an alternative analysis method (see HI-RUN Model section below).
A simplified version of the model that may be used for ODOT projects is available from the Water Resources Program Coordinator. This version differs from the WSDOT version in the following ways:
• The WSDOT model analyzes concentrations and loads on the Threshold Discharge Area (TDA) scale, while the simplified version can be applied to individual drainage basins. TDAs are drainage subbasins (or groups of subbasins) defined by Washington State Department of Ecology and WSDOT to determine applicable water quality treatment and flow control requirements, and are therefore not applicable to ODOT. The definition of TDA and a description of TDA delineation for highway projects are provided in the Highway Runoff Manual (WSDOT 2008b).
• The WSDOT model applies predefined runoff concentrations for “moderate risk” (ADT < 60,000) and “high risk” (ADT >60,000) projects. The simplified version includes a worksheet entitled “data” that summarizes roadway/highway monitoring data results (pollutant concentrations and loadings) from several studies from Oregon and elsewhere in the U.S. Site-specific data can also be used as inputs to the simplified version of the model.

1 3 7 W a t e r R e s o u r c e s S p e c i a l i s t M a n u a l
The WSDOT method for estimated highway project water quality impacts is based on a simple mass balance. The method estimates the annual load and runoff concentration for pre- and post-project conditions. Required calculation values are listed in Table 10-2. The roadway inputs are divided between the pre- and post-project impervious areas. The impervious area is divided into the subcategories of areas with and without stormwater treatment and areas with full infiltration. The pollutant inputs are the annual loading rates in lb/acre/year and runoff concentrations for treated and untreated runoff. The total pre- and post-project loads are the sum of the values for each sub-area category. The total pre- and post-project concentration is a volume-weighted average of the values for each sub-area category.
For load and concentration inputs, the WSDOT method uses the values listed in Table 10-3, based on monitoring done in western Washington (WSDOT 2005).
Table 10-2. Inputs for Modified WSDOT Method to Evaluate Highway Project Impacts.
Input Type Category Variable
Roadway Pre-Project Total Impervious Area Treated Impervious area Impervious area with full infiltration Untreated impervious area
Roadway Post-Project Pre-project impervious area retrofitted with treatment Pre-project impervious area retrofitted with full infiltration
Roadway Post-Project Total new impervious area New treated impervious area New untreated impervious area New impervious area with full infiltration
Pollutant Annual loading rate for treated and untreated runoff
Runoff concentration for treated and untreated runoff
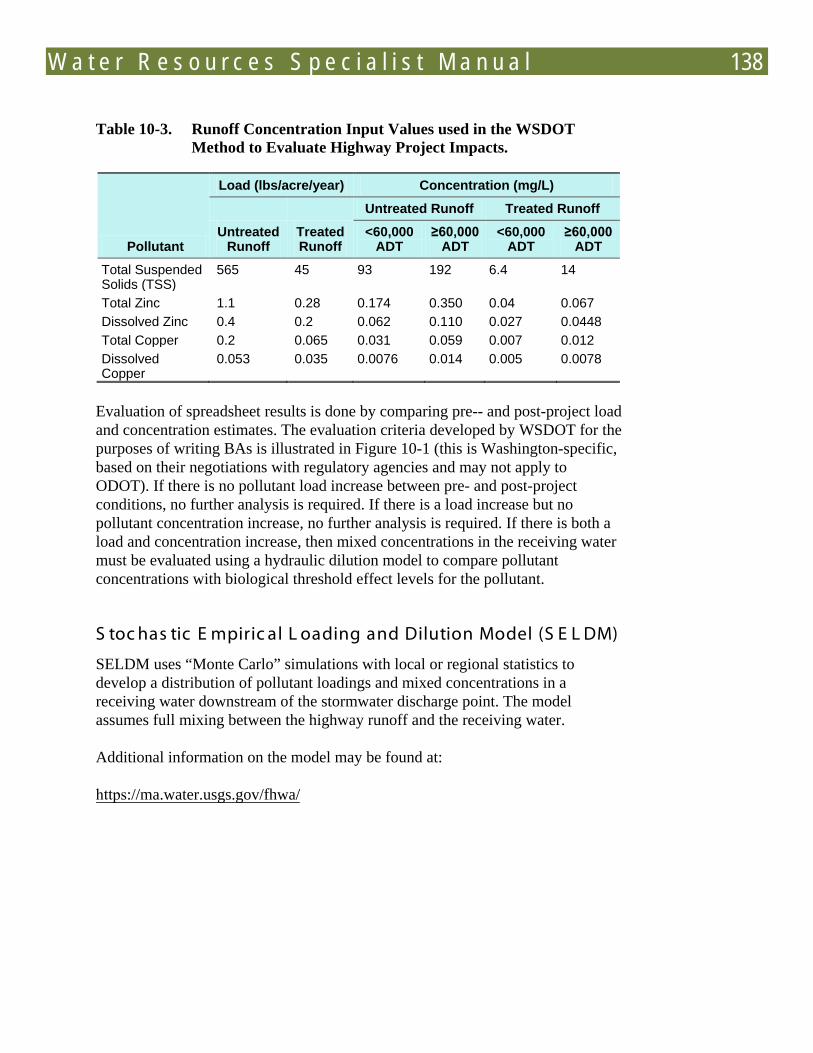
W a t e r R e s o u r c e s S p e c i a l i s t M a n u a l 138
Table 10-3. Runoff Concentration Input Values used in the WSDOT Method to Evaluate Highway Project Impacts.
Pollutant
Load (lbs/acre/year) Concentration (mg/L)
Untreated Runoff
Treated Runoff
Untreated Runoff Treated Runoff
<60,000 ADT
≥60,000 ADT
<60,000 ADT
≥60,000 ADT
Total Suspended Solids (TSS)
565 45 93 192 6.4 14
Total Zinc 1.1 0.28 0.174 0.350 0.04 0.067 Dissolved Zinc 0.4 0.2 0.062 0.110 0.027 0.0448 Total Copper 0.2 0.065 0.031 0.059 0.007 0.012 Dissolved Copper
0.053 0.035 0.0076 0.014 0.005 0.0078
Evaluation of spreadsheet results is done by comparing pre-- and post-project load and concentration estimates. The evaluation criteria developed by WSDOT for the purposes of writing BAs is illustrated in Figure 10-1 (this is Washington-specific, based on their negotiations with regulatory agencies and may not apply to ODOT). If there is no pollutant load increase between pre- and post-project conditions, no further analysis is required. If there is a load increase but no pollutant concentration increase, no further analysis is required. If there is both a load and concentration increase, then mixed concentrations in the receiving water must be evaluated using a hydraulic dilution model to compare pollutant concentrations with biological threshold effect levels for the pollutant.
S toc has tic E mpiric al L oading and Dilution Model (S E L DM)
SELDM uses “Monte Carlo” simulations with local or regional statistics to develop a distribution of pollutant loadings and mixed concentrations in a receiving water downstream of the stormwater discharge point. The model assumes full mixing between the highway runoff and the receiving water.
Additional information on the model may be found at:
https://ma.water.usgs.gov/fhwa/
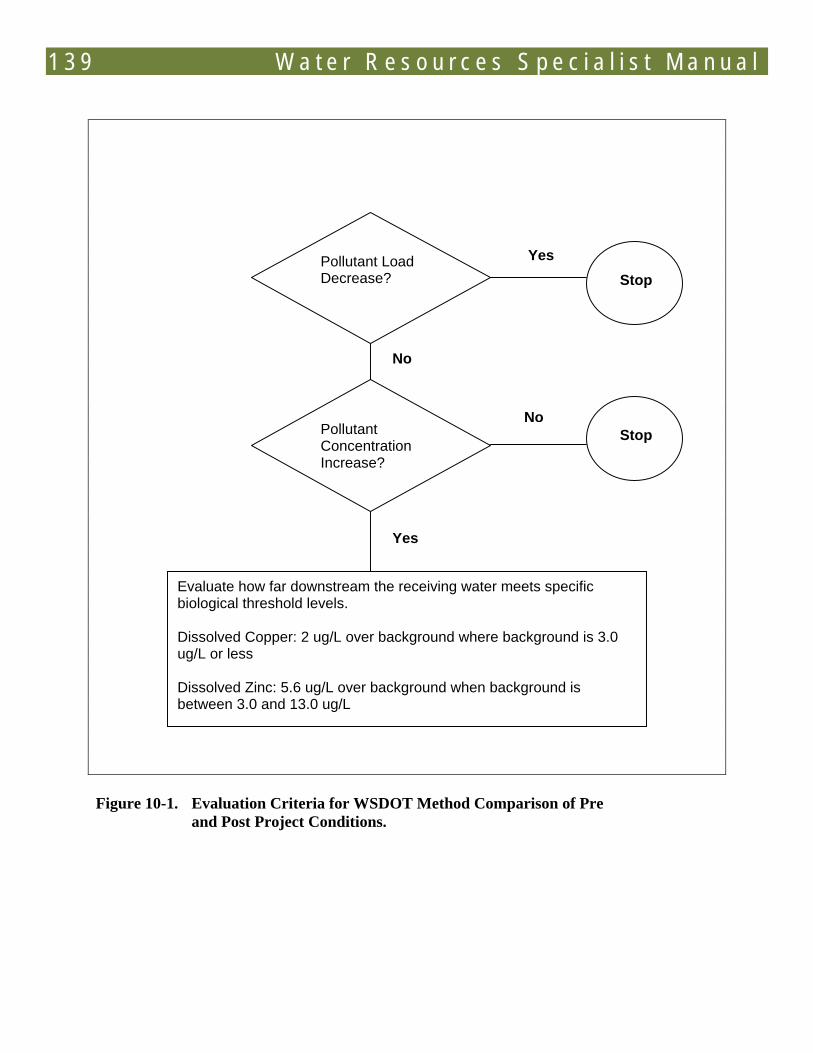
1 3 9 W a t e r R e s o u r c e s S p e c i a l i s t M a n u a l
Figure 10-1. Evaluation Criteria for WSDOT Method Comparison of Pre
and Post Project Conditions.
Pollutant Load Decrease?
Yes Stop
No
Pollutant Concentration Increase?
Stop No
Yes
Evaluate how far downstream the receiving water meets specific biological threshold levels. Dissolved Copper: 2 ug/L over background where background is 3.0 ug/L or less Dissolved Zinc: 5.6 ug/L over background when background is between 3.0 and 13.0 ug/L
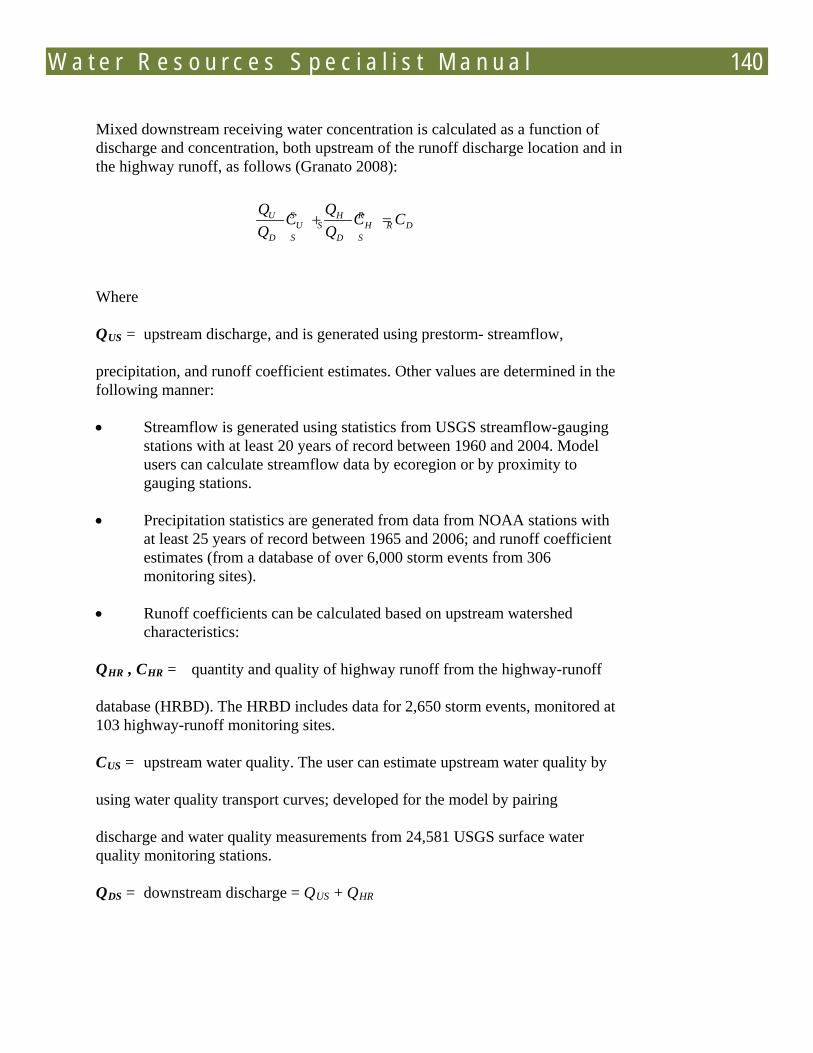
W a t e r R e s o u r c e s S p e c i a l i s t M a n u a l 140
Mixed downstream receiving water concentration is calculated as a function of discharge and concentration, both upstream of the runoff discharge location and in the highway runoff, as follows (Granato 2008):
Where
QUS
precipitation, and runoff coefficient estimates. Other values are determined in the following manner:
= upstream discharge, and is generated using prestorm- streamflow,
• Streamflow is generated using statistics from USGS streamflow-gaugingstations with at least 20 years of record between 1960 and 2004. Modelusers can calculate streamflow data by ecoregion or by proximity togauging stations.
• Precipitation statistics are generated from data from NOAA stations withat least 25 years of record between 1965 and 2006; and runoff coefficientestimates (from a database of over 6,000 storm events from 306monitoring sites).
• Runoff coefficients can be calculated based on upstream watershedcharacteristics:
QHR , CHR
database (HRBD). The HRBD includes data for 2,650 storm events, monitored at 103 highway-runoff monitoring sites.
= quantity and quality of highway runoff from the highway-runoff
CUS
using water quality transport curves; developed for the model by pairing
= upstream water quality. The user can estimate upstream water quality by
discharge and water quality measurements from 24,581 USGS surface water quality monitoring stations.
QDS = downstream discharge = QUS + QHR
DH RD S
H RU S
D S
U S CCQQC
=+
1 4 1 W a t e r R e s o u r c e s S p e c i a l i s t M a n u a l
HI-R UN Model
WSDOT recently developed a method for assessing water quality impacts of highway runoff on ESA-listed salmonids species that is more sophisticated than the spreadsheet model WSDOT previously used. This method involves a probability-based analysis using a macro-enabled spreadsheet model, the HI-RUN model.
This model applies to western Washington only, and incorporates Washington-specific runoff quality data and continuous hydrologic modeling data for specific locations using WSDOT’s stormwater design tool, MGS-Flood. HI-RUN can incorporate the water quality effects of stormwater treatment BMPs and the hydrologic effects of applying flow control to a highway project. HI-RUN allows the user to conduct two primary analyses: 1) end-of-pipe pollutant loading and concentration analyses, and 2) receiving water pollutant concentration analysis (dilution model). Currently, dissolved copper and zinc are the pollutants of interest in the HI-RUN analysis method, although the model can also analyze total copper, total zinc, and total suspended solids.
HI-RUN was designed to analyze effects against specific biological effects thresholds that have been agreed to by NOAA Fisheries Service and US Fish and Wildlife Service in Washington, and is specific to WSDOT projects. Applicability of this model to ODOT projects can be investigated by reviewing the HI-RUN Users Guide and HI-RUN Technical Documentation that accompany the model. The HI-RUN model and documentation can be accessed at <https://www.wsdot.wa.gov/Environment/Biology/BA/default.htm>
C omparis on of F HWA and Modified WS DOT Method
The two available analysis methods readily applicable to ODOT projects (FHWA Driscoll method and Modified WSDOT Method) are compared in this section. SELDM is still under development and not available for review. HI-RUN incorporates Washington-specific data and thresholds, and therefore has limited applicability in Oregon (potentially valid in Portland and other areas near the Washington border).
Table 10-4 compares the FHWA Driscoll method and Modified WSDOT method. The FHWA Driscoll method takes the distribution of the input statistics into account, while the Modified WSDOT method does not. The FHWA Driscoll method provides the mixed runoff/stream concentration, while the Modified WSDOT method calculates the runoff concentration. The FHWA Driscoll method is a more detailed method, requiring the additional input parameters of rainfall and stream flow data. Whether this is an advantage depends on the quality of the rainfall and stream flow data that is used.
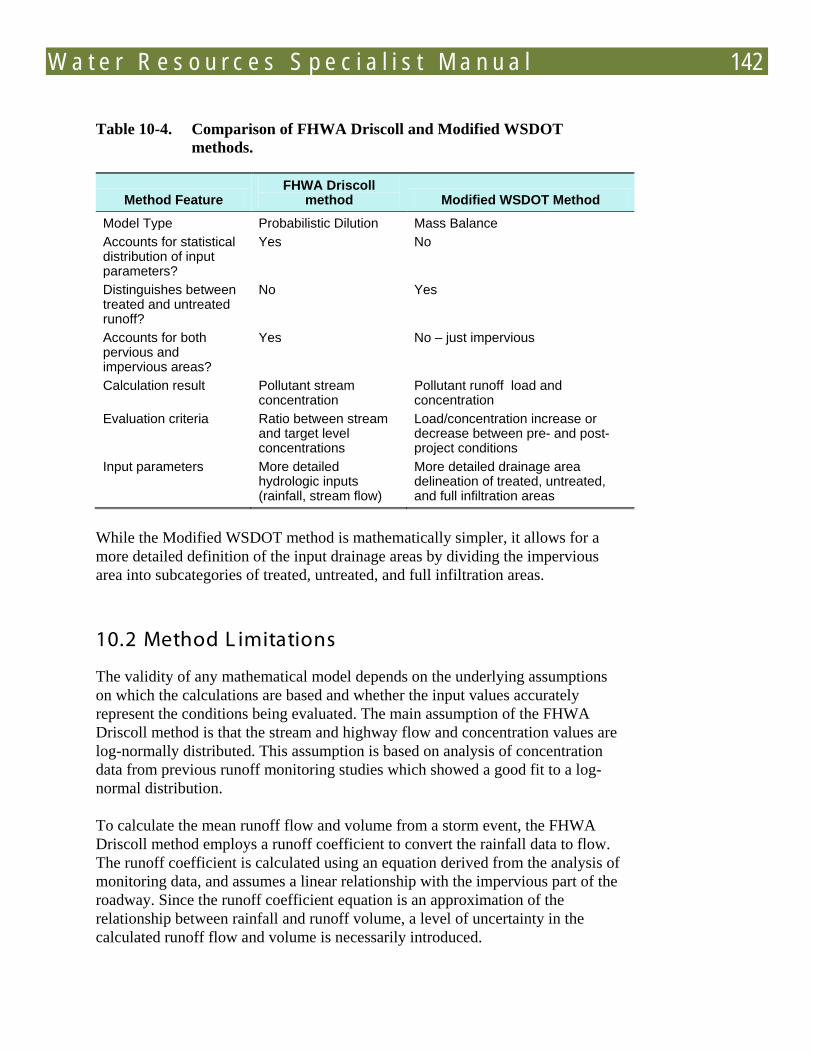
W a t e r R e s o u r c e s S p e c i a l i s t M a n u a l 142
Table 10-4. Comparison of FHWA Driscoll and Modified WSDOT methods.
Method Feature FHWA Driscoll
method Modified WSDOT Method
Model Type Probabilistic Dilution Mass Balance Accounts for statistical distribution of input parameters?
Yes No
Distinguishes between treated and untreated runoff?
No Yes
Accounts for both pervious and impervious areas?
Yes No – just impervious
Calculation result Pollutant stream concentration
Pollutant runoff load and concentration
Evaluation criteria Ratio between stream and target level concentrations
Load/concentration increase or decrease between pre- and post-project conditions
Input parameters More detailed hydrologic inputs (rainfall, stream flow)
More detailed drainage area delineation of treated, untreated, and full infiltration areas
While the Modified WSDOT method is mathematically simpler, it allows for a more detailed definition of the input drainage areas by dividing the impervious area into subcategories of treated, untreated, and full infiltration areas.
10.2 Method L imitations
The validity of any mathematical model depends on the underlying assumptions on which the calculations are based and whether the input values accurately represent the conditions being evaluated. The main assumption of the FHWA Driscoll method is that the stream and highway flow and concentration values are log-normally distributed. This assumption is based on analysis of concentration data from previous runoff monitoring studies which showed a good fit to a log-normal distribution.
To calculate the mean runoff flow and volume from a storm event, the FHWA Driscoll method employs a runoff coefficient to convert the rainfall data to flow. The runoff coefficient is calculated using an equation derived from the analysis of monitoring data, and assumes a linear relationship with the impervious part of the roadway. Since the runoff coefficient equation is an approximation of the relationship between rainfall and runoff volume, a level of uncertainty in the calculated runoff flow and volume is necessarily introduced.
1 4 3 W a t e r R e s o u r c e s S p e c i a l i s t M a n u a l
Often, no locally measured data is available for the input rainfall, stream flow, and runoff concentration inputs, requiring use of the regional values listed in the Driscoll report. In the report, Oregon is divided into two rainfall regions delineated by the areas east and west of 120º longitude. The report divides Oregon into three regions for average stream flow values. These regional delineations may not be representative of specific locations within that region. For site median concentration, the Driscoll report provides separate tables for urban (ADT >30,000) and rural (ADT < 30,000) highways. To compensate for site specific variations, the tables provide the 10, 20, 50, 80, and 90th percentile values based on the analysis of previous monitoring results.
The Modified WSDOT method has only two inputs: drainage area and pollutant concentration/loads for treated and untreated runoff. This means the accuracy of the method depends on the quality of the concentration and load inputs. The input load and concentration data used by WSDOT is from runoff monitoring performed along the I-5 corridor in western Washington, which may not accurately represent areas that are different in climate or land use. However, site-specific data can be entered into the simplified version of the model if available.
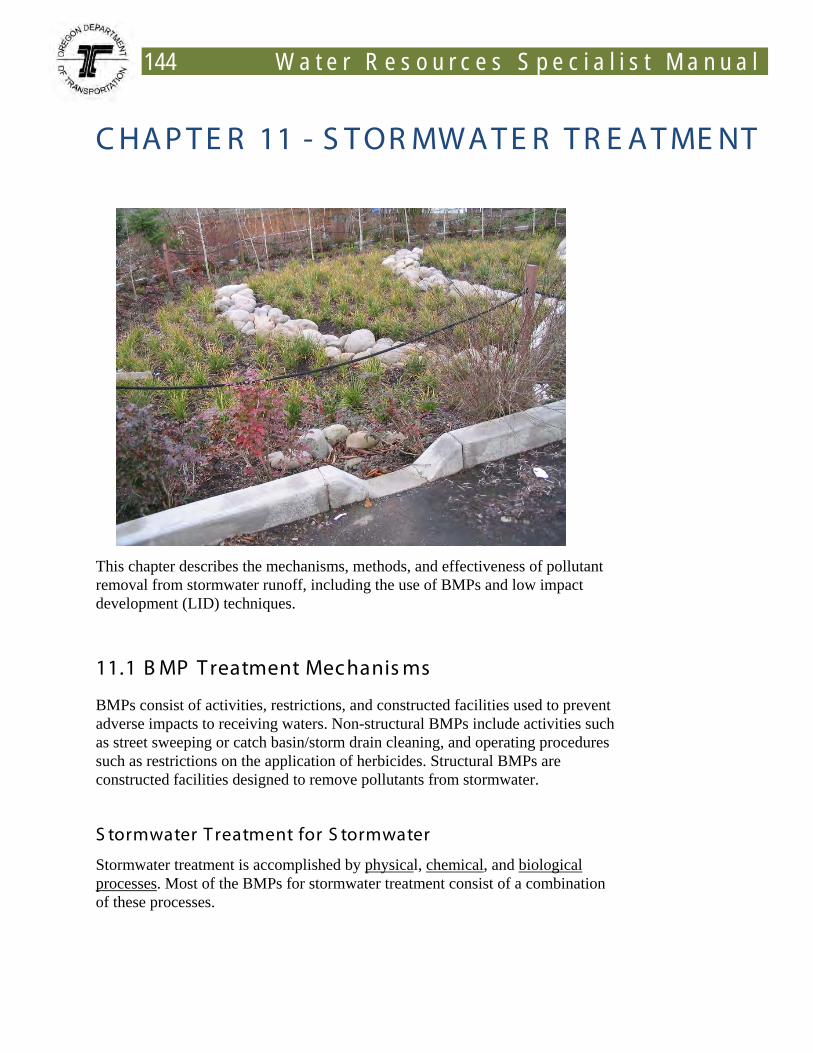
144 W a t e r R e s o u r c e s S p e c i a l i s t M a n u a l
C HA P T E R 11 - S T OR MWA T E R T R E A T ME NT
This chapter describes the mechanisms, methods, and effectiveness of pollutant removal from stormwater runoff, including the use of BMPs and low impact development (LID) techniques.
11.1 B MP T reatment Mechanis ms
BMPs consist of activities, restrictions, and constructed facilities used to prevent adverse impacts to receiving waters. Non-structural BMPs include activities such as street sweeping or catch basin/storm drain cleaning, and operating procedures such as restrictions on the application of herbicides. Structural BMPs are constructed facilities designed to remove pollutants from stormwater.
S tormwater T reatment for S tormwater
Stormwater treatment is accomplished by physical, chemical, and biological processes. Most of the BMPs for stormwater treatment consist of a combination of these processes.
1 4 5 W a t e r R e s o u r c e s S p e c i a l i s t M a n u a l
Physical Treatment Processes Physical treatment processes include sedimentation and filtration.
Sedimentation. Sedimentation refers to suspended solids settling out of the water column. Removing sediment from the water column prevents sedimentation of receiving waters and adverse effects of sedimentation on fish and amphibians in these waters (EPA 2006b). Sedimentation treatment facilities include large vaults, wet ponds, and proprietary hydrodynamic separators. By reducing velocities or creating vortices, these facilities create hydraulic conditions that allow larger particles to settle out.
Wet ponds or vaults should incorporate sediment storage below the outlet where settled materials can accumulate so that they do not become re-suspended in the stormwater as it is discharged from the facility. Sediment must then be periodically removed by maintenance staff to ensure continued function. Natural and constructed wetlands also provide sedimentation. Sedimentation rates are greater with larger particles and longer water retention times in wetlands. Dense vegetation in wetlands also encourages sedimentation by decreasing the velocity of water flowing through them (EPA 1993).
Density Separation/Flotation. Non-polar, hydrophobic substances (oil and grease) can be removed from water by trapping the floating material with baffles or other physical barriers. Oil/water separators use this coalescing mechanism to accumulate small trapped oil drops on the water surface to be removed during maintenance activities.
Filtration. Filtration involves physical trapping of suspended pollutants. Sand filters and other media filters use filtration as one treatment mechanism to remove pollutants. Vegetated facilities, such as swales, remove particulates by filtration through vegetation and other processes. Dense grasses are especially effective in these facilities. In natural and constructed wetlands, dense wetland vegetation and reduced water velocities increase removal of pollutants, including organic matter, phosphorus, bacteria, and other suspended material (U.S. EPA 1993).
Chemical Treatment Processes Chemical treatment involves changing the form of a pollutant to one that is easier to settle out and remove by physical processes, or by removing pollutants from stormwater. The following are examples of chemical treatment processes.
Chemical Precipitation. Chemical precipitation is the transformation of dissolved substances into a solid precipitate that can then settle and be removed from the water. Examples of chemical precipitation include the addition of aluminum or iron salts to precipitate phosphorus. Chemical treatment of
W a t e r R e s o u r c e s S p e c i a l i s t M a n u a l 146
stormwater by the addition of chemicals is uncommon due to high cost, complexity, and the risk of toxicity to aquatic organisms if the dosage is not accurate.
Adsorption. Adsorption is the process by which dissolved pollutants adhere to suspended particulates, bottom sediments, vegetation surfaces, or other media (such as activated carbon). Some media help remove charged pollutant particles, such as metal cations, by adsorption. Adsorption can provide effective treatment when coupled with sedimentation of suspended organic and inorganic materials, which can remove adsorbed compounds, including organic chemicals, hydrocarbons, and bacteria.
Biological Treatment Processes Biological treatment involves routing stormwater through plant-based or bacterial communities that take up pollutants, removing them from stormwater. Examples include constructed wetlands and other facilities with complex vegetative communities. Natural and constructed wetlands aid in nitrogen and phosphorus removal. A small fraction of nitrogen is removed by plants, while the rest is removed through nitrification/denitrification (i.e., conversion of nitrogen to nitrate by bacteria in aerobic substrates, then conversion of nitrate to free nitrogen in anoxic substrates by other bacteria). Biological uptake and complexing (chemical bonding) are the two major removal mechanisms for dissolved metals. Under the appropriate conditions (aerobic, warm temperatures, high soil fertility) bacterial degradation removes petroleum hydrocarbons (Minton 2005).
11.2 T ypes of T reatment B MP s
Stormwater treatment BMPs can be divided into the following three categories,:
• Infiltration BMPs – BMPs that involve discharge of stormwater to groundwater (examples: infiltration basin, bioretention, natural dispersion).
• Amended Soil Vegetated BMPs - Treatment techniques that discharge to surface waters, but incorporate filtration through amended soil and vegetation (examples: biofiltration swales, compost-amended filter strips).
• Other BMPs – Facilities that have a single, primary treatment process. The individual BMPs can be assembled into treatment trains to address the spectrum of highway runoff pollutants. These primarily use sedimentation, density separation and filtration through artificial media.
1 4 7 W a t e r R e s o u r c e s S p e c i a l i s t M a n u a l
The first two categories are considered “preferred BMPs” and meet regulatory requirements. Infiltration BMPs should be the first option considered. When “other” BMPS are used, documentation may be needed to show that water quality is being adequately protected.
L ID B MP s
LID involves planning and site design considerations and several types of treatment BMPs (see Section 11.3). , it needs to be considered early in project development. LID measures should be considered at the beginning of project development (see Chapter 2). In addition to site design considerations, some constructed stormwater BMPs are used in LID, such as:
Infiltration BMPs including:
• BioretentionBioslopesNatural Dispersion
• Infiltration Basin
• Infiltration TrenchPermeable pavementsAmended Vegetated BMPs including
• Amended Biofiltration Swale
• Compost-Amended Vegetated Filter Strip.
These BMPs should be given the greatest preference when designing stormwater management measures. The BMPs are described in the Types of Treatment BMPs section below.
Des c riptions of B MP s
The following sections provide a description of each BMP organized into the three categories of preference: 1) Infiltration BMPs, 2) Amended Vegetated BMPs, and 3) Other BMPs. A table of summary information is provided for each BMP that includes the following information:
• Target Pollutants – These are the pollutant classes/types that are effectively removed by the BMP (total suspended solids, dissolved metals, nutrients, and oil and grease).
• Type of BMP – The BMP category as defined above (infiltration, amended soil, other).
W a t e r R e s o u r c e s S p e c i a l i s t M a n u a l 148
• Pollutant Removal Mechanism – Primary mechanism used in removing target pollutants (see BMP Treatment Mechanisms – sedimentation, infiltration, sorption, media filtration, and nutrient uptake).
• Cost – Relative BMP construction cost (high, medium, low). Low cost BMPs are those that require minimal excavation beyond that required for roadway improvements because they treat dispersed runoff (vegetated filter strip; CAVFS). Medium cost BMPs are open vegetated facilities that require significant excavation. High cost BMPs are below-ground vaults or other structures, or complex surface facilities.
• Pollutant Removal Effectiveness – Qualitative measure of BMP effectiveness (high, medium, low). Those with high pollutant removal effectiveness have enhanced pollutant removal processes such as infiltration and treatment through the use of amended soil, and generally treat stormwater to a higher degree than traditional measures. Those with medium pollutant removal effectiveness are traditional BMPs (swales; ponds) that are reasonably effective at removing total suspended solids. BMPs that provide low pollutant removal effectiveness are either not designed for treatment or have poor performance based on water quality monitoring studies. Some BMPs may have high effectiveness for some pollutants, but medium or low for others.
• Site Constraints – List of common site constraints associated with roadway stormwater BMPs.
ODOT has developed a BMP Selection Tool to help designers determine the most effective treatment method for an individual project. The following section describes some of the BMPs available to designers. This information has been reviewed for consistency with ODOT’s BMP Selection Tool, but is not intended to supersede it.
Infiltration B MP s
BMPs that use infiltration of stormwater to shallow groundwater as a primary pollutant removal mechanism are preferred for ODOT projects. These BMPs include natural dispersion, bioslopes, bioinfiltration swales, bioretention, infiltration basins, infiltration trenches, and permeable pavement.
A dry well is also an infiltration BMP. However, dry wells are designed for flow control and volume control and are not intended for stormwater treatment. Dry wells are classified as Class V injection wells according to the federal UIC Program administered. If dry wells are proposed for flow control, they must be permitted, designed, and built in conformance with the requirements of DEQ’s UIC Program, which may include stormwater treatment (DEQ 2008).
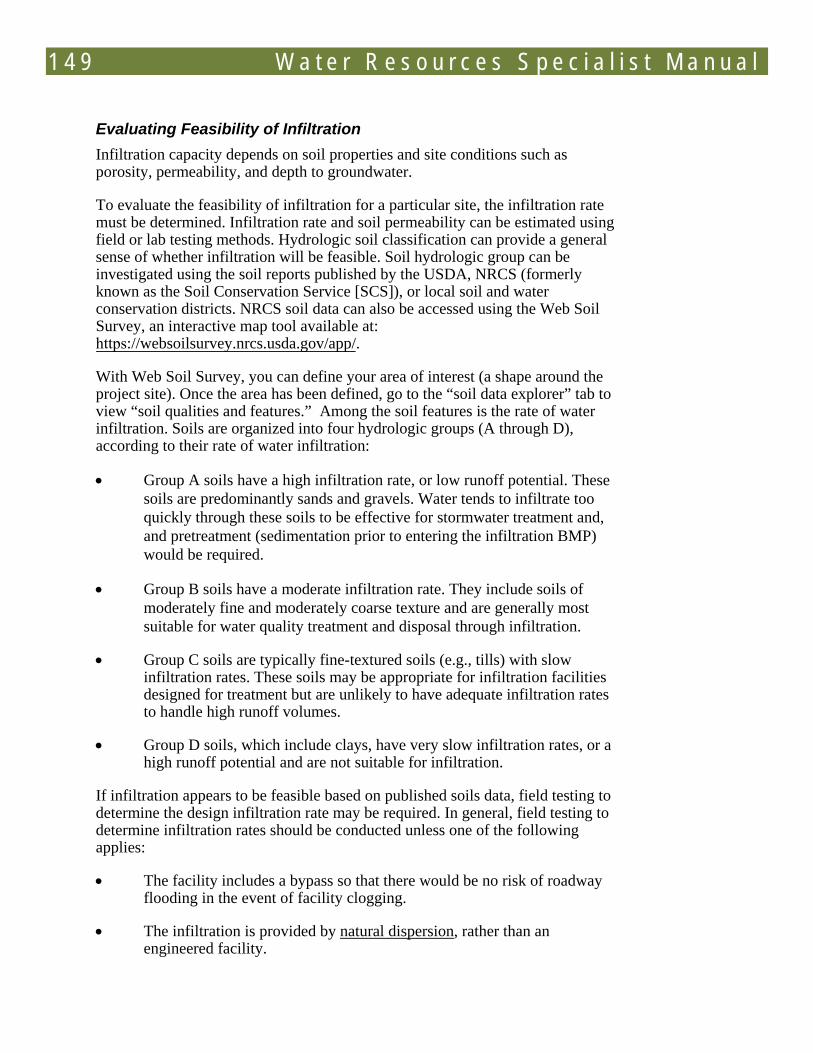
1 4 9 W a t e r R e s o u r c e s S p e c i a l i s t M a n u a l
Evaluating Feasibility of Infiltration Infiltration capacity depends on soil properties and site conditions such as porosity, permeability, and depth to groundwater.
To evaluate the feasibility of infiltration for a particular site, the infiltration rate must be determined. Infiltration rate and soil permeability can be estimated using field or lab testing methods. Hydrologic soil classification can provide a general sense of whether infiltration will be feasible. Soil hydrologic group can be investigated using the soil reports published by the USDA, NRCS (formerly known as the Soil Conservation Service [SCS]), or local soil and water conservation districts. NRCS soil data can also be accessed using the Web Soil Survey, an interactive map tool available at: https://websoilsurvey.nrcs.usda.gov/app/.
With Web Soil Survey, you can define your area of interest (a shape around the project site). Once the area has been defined, go to the “soil data explorer” tab to view “soil qualities and features.” Among the soil features is the rate of water infiltration. Soils are organized into four hydrologic groups (A through D), according to their rate of water infiltration:
• Group A soils have a high infiltration rate, or low runoff potential. Thesesoils are predominantly sands and gravels. Water tends to infiltrate tooquickly through these soils to be effective for stormwater treatment and,and pretreatment (sedimentation prior to entering the infiltration BMP)would be required.
• Group B soils have a moderate infiltration rate. They include soils ofmoderately fine and moderately coarse texture and are generally mostsuitable for water quality treatment and disposal through infiltration.
• Group C soils are typically fine-textured soils (e.g., tills) with slowinfiltration rates. These soils may be appropriate for infiltration facilitiesdesigned for treatment but are unlikely to have adequate infiltration ratesto handle high runoff volumes.
• Group D soils, which include clays, have very slow infiltration rates, or ahigh runoff potential and are not suitable for infiltration.
If infiltration appears to be feasible based on published soils data, field testing to determine the design infiltration rate may be required. In general, field testing to determine infiltration rates should be conducted unless one of the following applies:
• The facility includes a bypass so that there would be no risk of roadwayflooding in the event of facility clogging.
• The infiltration is provided by natural dispersion, rather than anengineered facility.
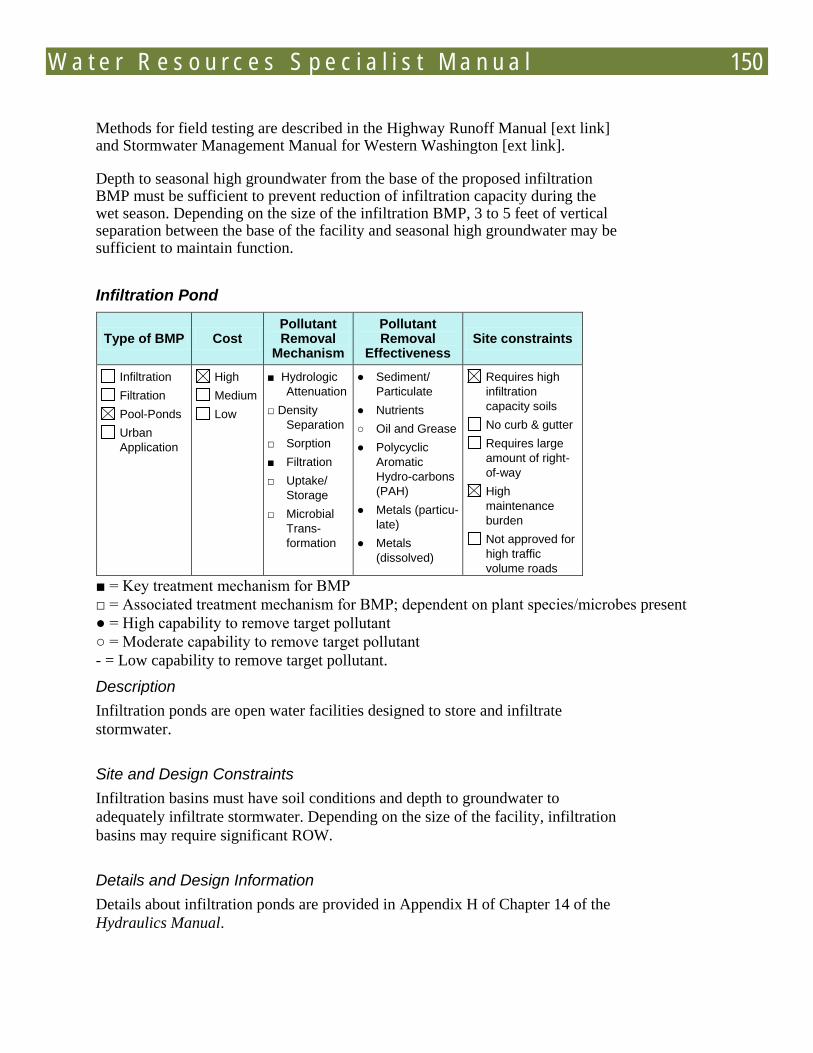
W a t e r R e s o u r c e s S p e c i a l i s t M a n u a l 150
Methods for field testing are described in the Highway Runoff Manual [ext link] and Stormwater Management Manual for Western Washington [ext link].
Depth to seasonal high groundwater from the base of the proposed infiltration BMP must be sufficient to prevent reduction of infiltration capacity during the wet season. Depending on the size of the infiltration BMP, 3 to 5 feet of vertical separation between the base of the facility and seasonal high groundwater may be sufficient to maintain function.
Infiltration Pond
Type of BMP Cost Pollutant Removal
Mechanism
Pollutant Removal
Effectiveness Site constraints
Infiltration Filtration Pool-Ponds Urban Application
High Medium Low
■ Hydrologic Attenuation
□ Density Separation
□ Sorption ■ Filtration □ Uptake/
Storage □ Microbial
Trans-formation
● Sediment/ Particulate
● Nutrients ○ Oil and Grease ● Polycyclic
Aromatic Hydro-carbons (PAH)
● Metals (particu-late)
● Metals (dissolved)
Requires high infiltration capacity soils
No curb & gutter Requires large amount of right-of-way
High maintenance burden
Not approved for high traffic volume roads
■ = Key treatment mechanism for BMP □ = Associated treatment mechanism for BMP; dependent on plant species/microbes present ● = High capability to remove target pollutant ○ = Moderate capability to remove target pollutant - = Low capability to remove target pollutant.
Description Infiltration ponds are open water facilities designed to store and infiltrate stormwater.
Site and Design Constraints Infiltration basins must have soil conditions and depth to groundwater to adequately infiltrate stormwater. Depending on the size of the facility, infiltration basins may require significant ROW.
Details and Design Information Details about infiltration ponds are provided in Appendix H of Chapter 14 of the Hydraulics Manual.

1 5 1 W a t e r R e s o u r c e s S p e c i a l i s t M a n u a l
Maintenance Considerations Maintenance requirements for infiltration basins are described in Appendix H of Chapter 14 of the Hydraulics Manual.
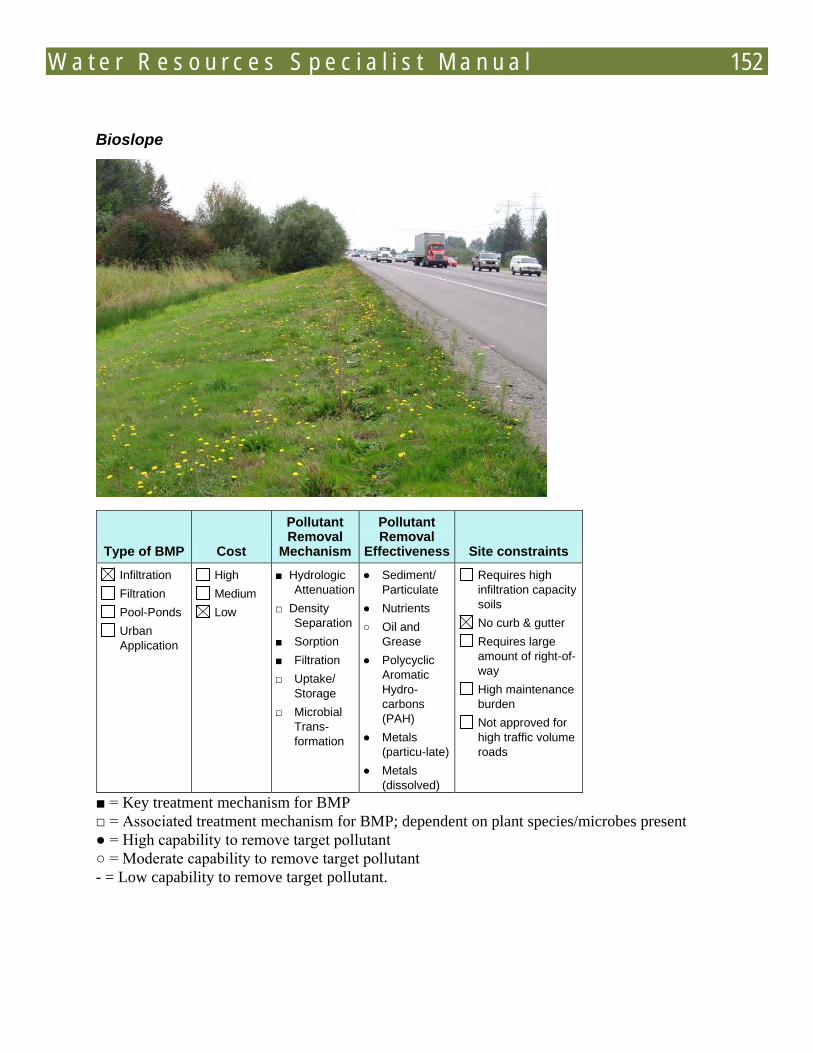
W a t e r R e s o u r c e s S p e c i a l i s t M a n u a l 152
Bioslope
Type of BMP Cost
Pollutant Removal
Mechanism
Pollutant Removal
Effectiveness Site constraints Infiltration Filtration Pool-Ponds Urban Application
High Medium Low
■ Hydrologic Attenuation
□ Density Separation
■ Sorption ■ Filtration □ Uptake/
Storage □ Microbial
Trans-formation
● Sediment/ Particulate
● Nutrients ○ Oil and
Grease ● Polycyclic
Aromatic Hydro-carbons (PAH)
● Metals (particu-late)
● Metals (dissolved)
Requires high infiltration capacity soils
No curb & gutter Requires large amount of right-of-way
High maintenance burden
Not approved for high traffic volume roads
■ = Key treatment mechanism for BMP □ = Associated treatment mechanism for BMP; dependent on plant species/microbes present ● = High capability to remove target pollutant ○ = Moderate capability to remove target pollutant - = Low capability to remove target pollutant.
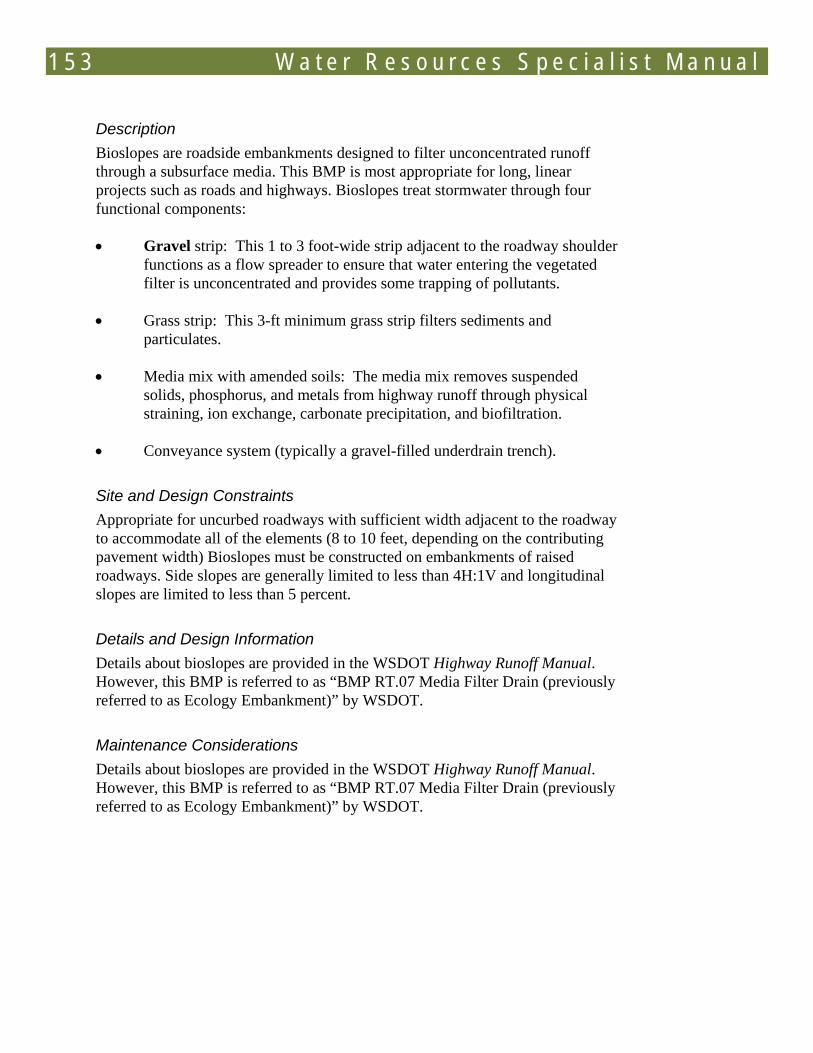
1 5 3 W a t e r R e s o u r c e s S p e c i a l i s t M a n u a l
Description Bioslopes are roadside embankments designed to filter unconcentrated runoff through a subsurface media. This BMP is most appropriate for long, linear projects such as roads and highways. Bioslopes treat stormwater through four functional components:
• Gravel strip: This 1 to 3 foot-wide strip adjacent to the roadway shoulder functions as a flow spreader to ensure that water entering the vegetated filter is unconcentrated and provides some trapping of pollutants.
• Grass strip: This 3-ft minimum grass strip filters sediments and particulates.
• Media mix with amended soils: The media mix removes suspended solids, phosphorus, and metals from highway runoff through physical straining, ion exchange, carbonate precipitation, and biofiltration.
• Conveyance system (typically a gravel-filled underdrain trench).
Site and Design Constraints Appropriate for uncurbed roadways with sufficient width adjacent to the roadway to accommodate all of the elements (8 to 10 feet, depending on the contributing pavement width) Bioslopes must be constructed on embankments of raised roadways. Side slopes are generally limited to less than 4H:1V and longitudinal slopes are limited to less than 5 percent.
Details and Design Information Details about bioslopes are provided in the WSDOT Highway Runoff Manual. However, this BMP is referred to as “BMP RT.07 Media Filter Drain (previously referred to as Ecology Embankment)” by WSDOT.
Maintenance Considerations Details about bioslopes are provided in the WSDOT Highway Runoff Manual. However, this BMP is referred to as “BMP RT.07 Media Filter Drain (previously referred to as Ecology Embankment)” by WSDOT.
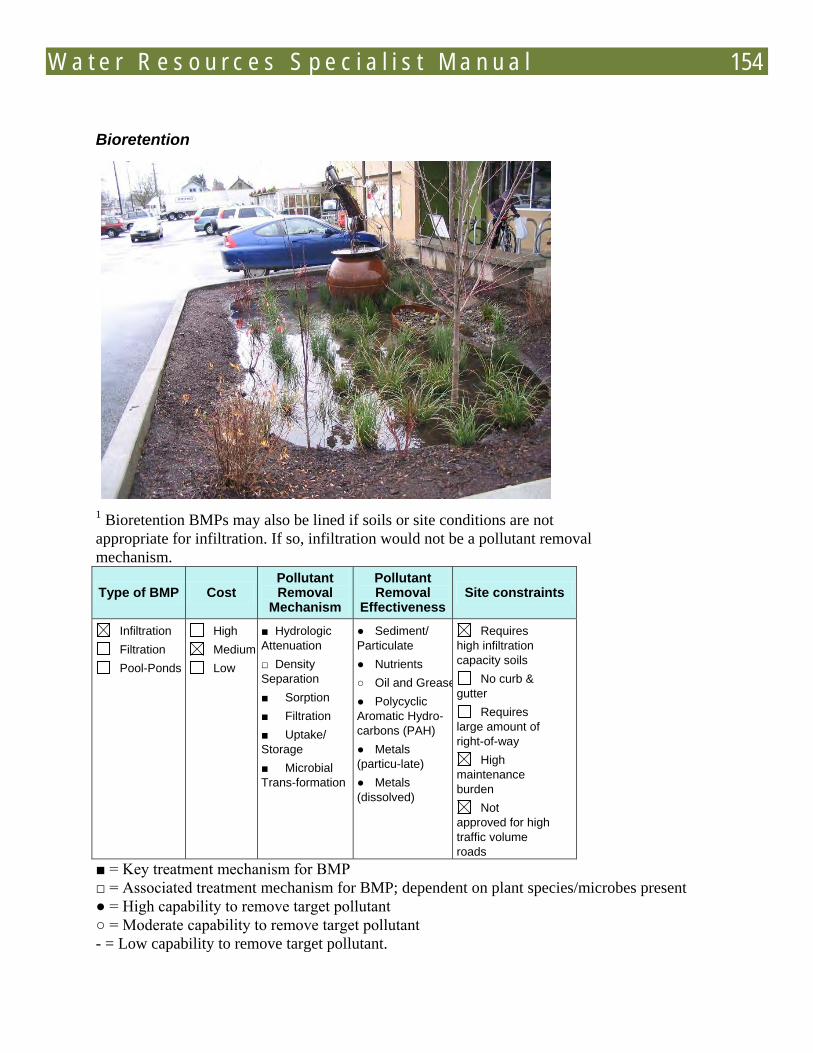
W a t e r R e s o u r c e s S p e c i a l i s t M a n u a l 154
Bioretention 1
Type of BMP
Bioretention BMPs may also be lined if soils or site conditions are not appropriate for infiltration. If so, infiltration would not be a pollutant removal mechanism.
Cost Pollutant Removal
Mechanism
Pollutant Removal
Effectiveness Site constraints
Infiltration Filtration Pool-Ponds
High Medium Low
■ Hydrologic Attenuation □ Density Separation ■ Sorption ■ Filtration ■ Uptake/ Storage ■ Microbial Trans-formation
● Sediment/ Particulate ● Nutrients ○ Oil and Grease ● Polycyclic Aromatic Hydro-carbons (PAH) ● Metals (particu-late) ● Metals (dissolved)
Requires high infiltration capacity soils
No curb & gutter
Requires large amount of right-of-way
High maintenance burden
Not approved for high traffic volume roads
■ = Key treatment mechanism for BMP □ = Associated treatment mechanism for BMP; dependent on plant species/microbes present ● = High capability to remove target pollutant ○ = Moderate capability to remove target pollutant - = Low capability to remove target pollutant.
1 5 5 W a t e r R e s o u r c e s S p e c i a l i s t M a n u a l
Description Bioretention cells/areas are used in low-impact development to manage stormwater from generally small drainage areas. Bioretention cells are typically constructed immediately adjacent to the source drainage area, usually roof downspouts and low-traffic roads/parking facilities. These BMPs use amended soils and vegetation to provide treatment, and typically infiltrate stormwater to shallow groundwater. Bioretention cells can be configured in many ways, and are referred to with many terms, including rain gardens, curb extensions, and infiltration planters.
Site and Design Constraints Bioretention facilities are appropriate for small contributing areas (up to 10,000 square feet of impervious area). With a ponded water depth of 6 to 12 inches, they must meet local jurisdictional minimum setback requirements from buildings and roads. They are most appropriate for park and ride lots, maintenance facilities, and similar facilities. Bioretention cells must have soil conditions and depth to groundwater to adequately infiltrate stormwater (unless lined as described in the table note above).
Details and Design Information The City of Portland Stormwater Management Manual (Portland Environmental Services 2008) has details on infiltration planters, curb extensions, and basins. Addition design guidance for bioretention is provided in Low Impact Development: Technical Guidance for Puget Sound (PSAT 2005).
Maintenance Considerations Details about bioretention cells/rain gardens are provided in City of Portland Stormwater Management Manual (Portland Environmental Services 2008) and Low Impact Development: Technical Guidance for Puget Sound (PSAT 2005).
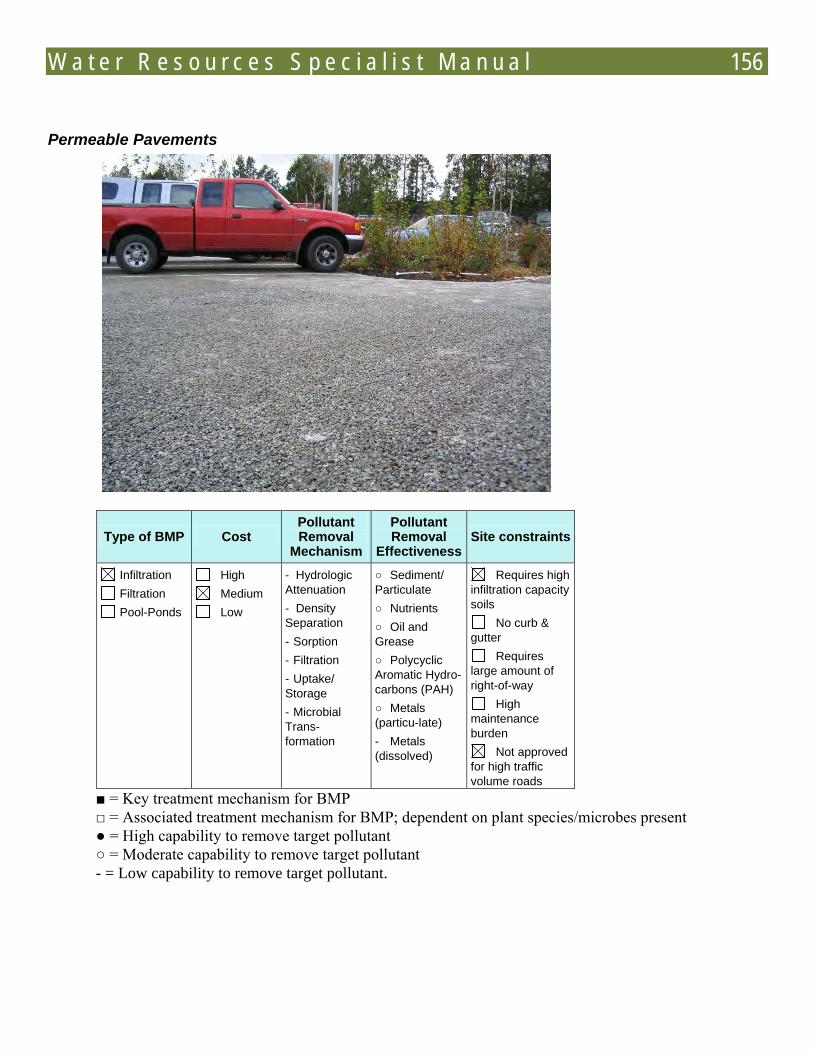
W a t e r R e s o u r c e s S p e c i a l i s t M a n u a l 156
Permeable Pavements
Type of BMP Cost Pollutant Removal
Mechanism
Pollutant Removal
Effectiveness Site constraints
Infiltration Filtration Pool-Ponds
High Medium Low
- Hydrologic Attenuation - Density Separation - Sorption - Filtration - Uptake/ Storage - Microbial Trans-formation
○ Sediment/ Particulate ○ Nutrients ○ Oil and Grease ○ Polycyclic Aromatic Hydro-carbons (PAH) ○ Metals (particu-late) - Metals (dissolved)
Requires high infiltration capacity soils
No curb & gutter
Requires large amount of right-of-way
High maintenance burden
Not approved for high traffic volume roads
■ = Key treatment mechanism for BMP □ = Associated treatment mechanism for BMP; dependent on plant species/microbes present ● = High capability to remove target pollutant ○ = Moderate capability to remove target pollutant - = Low capability to remove target pollutant.
1 5 7 W a t e r R e s o u r c e s S p e c i a l i s t M a n u a l
Description Porous Pavement is an LID technique that creates a hard driving surface yet allows stormwater to infiltrate into the soil as it would normally prior to development. This reduces the concentrated surface flow that can reach streams and other receiving waters and associated hydrologic and water quality impacts (see the Chapter 4 for more information). It also minimizes the need for other expensive stormwater controls such as curbs, gutters, pipes and ponds to collect and treat runoff.
There are four different types of permeable pavements in widespread use. All of these systems are similar in section which consists of a permeable surface and course aggregate sub-base. The four different permeable surfaces are:
• Permeable Asphalt – Typical asphalt mixture with 16 to 20 percent voids
• Permeable Concrete – Typical concrete mixture with 20 to 35 percent voids
• Permeable Pavers – Interlocking concrete blocks that are laid in such a way that voids exist between the blocks and allow water to infiltrate
• Flexible Plastic Grid Systems – Plastic grid filled with gravel or sand/grass.
Stormwater Treatment Permeable pavements provide several pollutant removal mechanisms inherent to the paving structure. These include stormwater runoff volume reduction, biological degradation, filtration, adsorption and volatilization. These factors combine to make permeable pavement just as, or more, effective for managing typical road and parking pollutants than conventional practices. Some typical stormwater pollutants from conventional pavement consist of hydrocarbons/PAH’s (oils, grease and gasoline), metals (lead, copper, zinc, cadmium) and suspended solids. The following Table 11-2 shows the comparison of average effluent pollutant concentrations between stormwater through a permeable pavement and runoff from a conventional paved road.
Flow Control The key flow control technique in permeable pavement systems is infiltration. In design for the appropriate cross section of permeable systems you must consider the amount of precipitation from the design storm event, the infiltration rate of the soil and the storage volume in the sub-base. If the infiltration rate of the underlying soils cannot handle the design storm and the needed storage volume in the sub-base becomes impractical an under drain may be placed along the bottom
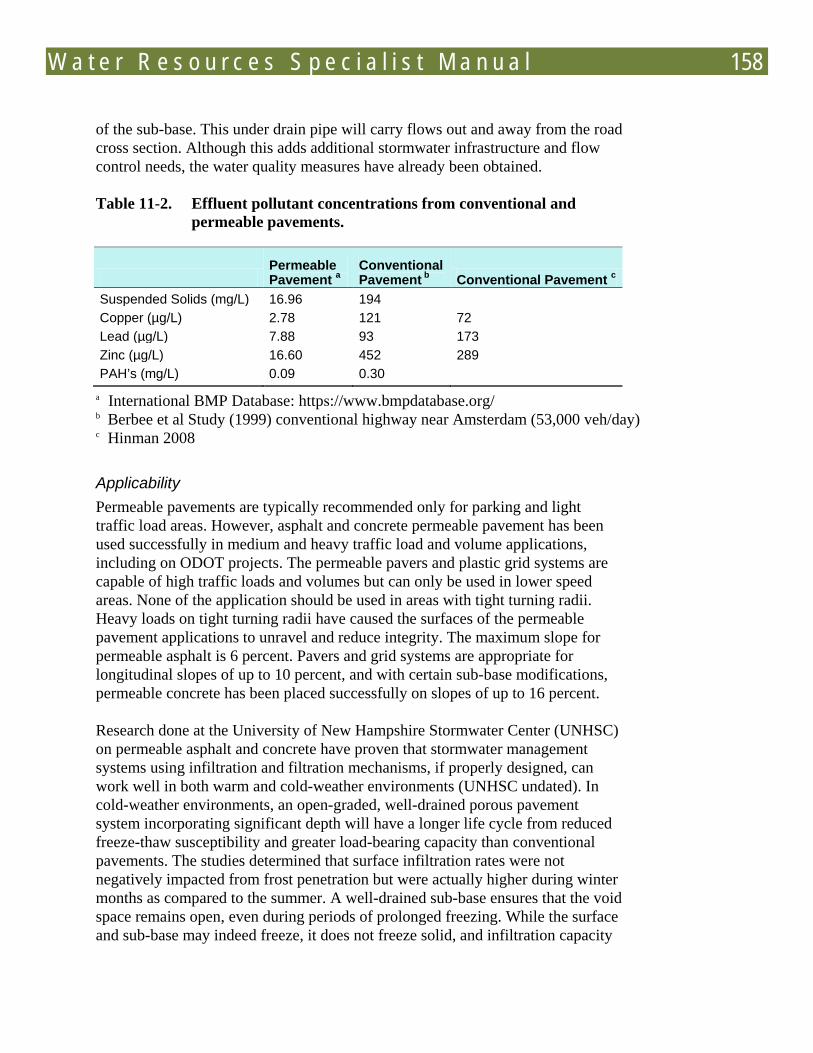
W a t e r R e s o u r c e s S p e c i a l i s t M a n u a l 158
of the sub-base. This under drain pipe will carry flows out and away from the road cross section. Although this adds additional stormwater infrastructure and flow control needs, the water quality measures have already been obtained.
Table 11-2. Effluent pollutant concentrations from conventional and permeable pavements.
Permeable Pavement
Conventional Pavementa Conventional Pavement b
Suspended Solids (mg/L)
c
16.96 194 Copper (µg/L) 2.78 121 72 Lead (µg/L) 7.88 93 173 Zinc (µg/L) 16.60 452 289 PAH’s (mg/L) 0.09 0.30
a International BMP Database: https://www.bmpdatabase.org/ b Berbee et al Study (1999) conventional highway near Amsterdam (53,000 veh/day) c Hinman 2008
Applicability Permeable pavements are typically recommended only for parking and light traffic load areas. However, asphalt and concrete permeable pavement has been used successfully in medium and heavy traffic load and volume applications, including on ODOT projects. The permeable pavers and plastic grid systems are capable of high traffic loads and volumes but can only be used in lower speed areas. None of the application should be used in areas with tight turning radii. Heavy loads on tight turning radii have caused the surfaces of the permeable pavement applications to unravel and reduce integrity. The maximum slope for permeable asphalt is 6 percent. Pavers and grid systems are appropriate for longitudinal slopes of up to 10 percent, and with certain sub-base modifications, permeable concrete has been placed successfully on slopes of up to 16 percent.
Research done at the University of New Hampshire Stormwater Center (UNHSC) on permeable asphalt and concrete have proven that stormwater management systems using infiltration and filtration mechanisms, if properly designed, can work well in both warm and cold-weather environments (UNHSC undated). In cold-weather environments, an open-graded, well-drained porous pavement system incorporating significant depth will have a longer life cycle from reduced freeze-thaw susceptibility and greater load-bearing capacity than conventional pavements. The studies determined that surface infiltration rates were not negatively impacted from frost penetration but were actually higher during winter months as compared to the summer. A well-drained sub-base ensures that the void space remains open, even during periods of prolonged freezing. While the surface and sub-base may indeed freeze, it does not freeze solid, and infiltration capacity
1 5 9 W a t e r R e s o u r c e s S p e c i a l i s t M a n u a l
is preserved. Freezing rain and snow can freeze the material at the surface, but minor salting and plowing at such times can return the surface to high infiltration.
Permeable pavement systems are typically designed to only receive direct rainfall. The sub-base can be modified to handle additional runoff volumes; however, the runoff must not contain high sediment loads that could potentially clog the permeable system.
Design Considerations The two main design considerations when using permeable pavements are 1) the underlying soil; and 2) the overall use for the system.
The underlying native soil plays a key role in specifying the most efficient and effective cross section (depth and composition of pavement and subgrade). The soil’s infiltration rate, structural capacity, susceptibility to swelling and slope stability each need to be identified prior to cross section definition. If the project appears to be suitable for permeable pavement, you should consult with a geotechnical engineer or roadway designer to determine whether soil conditions are suitable.
The end use of the system will define which type of permeable surface is applicable. The factors to consider here are the traffic volumes (ADT), type of traffic, speed of traffic, sources of contamination (i.e., soil/fines deposition associated with sanding operations during inclement weather), and maintenance.
When using permeable concrete and asphalt, another consideration is specifying a proper mix design (relative proportion of fines and aggregates). Similarly, when selecting the sub-base material, it is important to look at the structural loading requirements and the water-quality benefits.
Another consideration is making sure contractors are educated about the material and proper placement techniques so that the end result is a high-quality, durable pavement capable of lasting 20 to 40 years. The longevity of the system is also dependent on educating those who will be maintaining the system.
Color can also play a role in design, particularly in concrete and asphalt systems. Because concrete is lighter, it absorbs less heat, contributing less to the urban heat island effect. For the same reason, porous asphalt will perform better in the winter, as it will be warmer and promote greater deicing. An advantage to concrete is that less nighttime lighting will be required because the lighter-colored surface reflects more light.
W a t e r R e s o u r c e s S p e c i a l i s t M a n u a l 160
Cost Material costs for permeable pavements are approximately 20 to 25 percent more than those for traditional pavement (UNHSC undated). However, when you look at the total project cost for these systems with reduced stormwater infrastructure, it is comparable to standard pavement applications with which stormwater infrastructure is required. For redevelopment, pervious pavement systems are not as competitive or cost effective, because existing infrastructure is typically already in place, and pervious pavement requires that an appropriate sub-base be installed anew.
Studies on the life-cycle-cost of pervious pavement systems in comparison to conventional pavement systems show that pervious systems are more economical in the long run (UNHSC undated).
Maintenance Clogging of the surface and the resulting decline in infiltration rates is the main reason maintenance is required on permeable systems. The main sources of clogging are surface particulates and plant rooting. Both causes can be addressed—the first through routine cleaning approximately two to four times per year, depending on the frequency of use, and the second through appropriate planting plans, maintenance of adjacent landscaping and removal of invasive plants. Cleaning can be accomplished by the use of vacuum sweepers or pressure washing.
Maintenance on plastic grid systems that are filled with gravel consists of containing the gravel from adjacent areas and potentially adding more gravel. Plastic grid systems that are grass and sand filled will require irrigation and mowing. In both applications, grid sections that see high traffic volumes may need to be replaced.
Compared to conventional pavement systems, winter maintenance of permeable systems is greatly reduced. Melting snow and ice is able to infiltrate directly into the porous material which facilitates faster melting. This in turn requires less plowing and deicing and translates into greater safety. Sanding is not an option on permeable concrete, asphalt and paver systems for it will clog the voids.
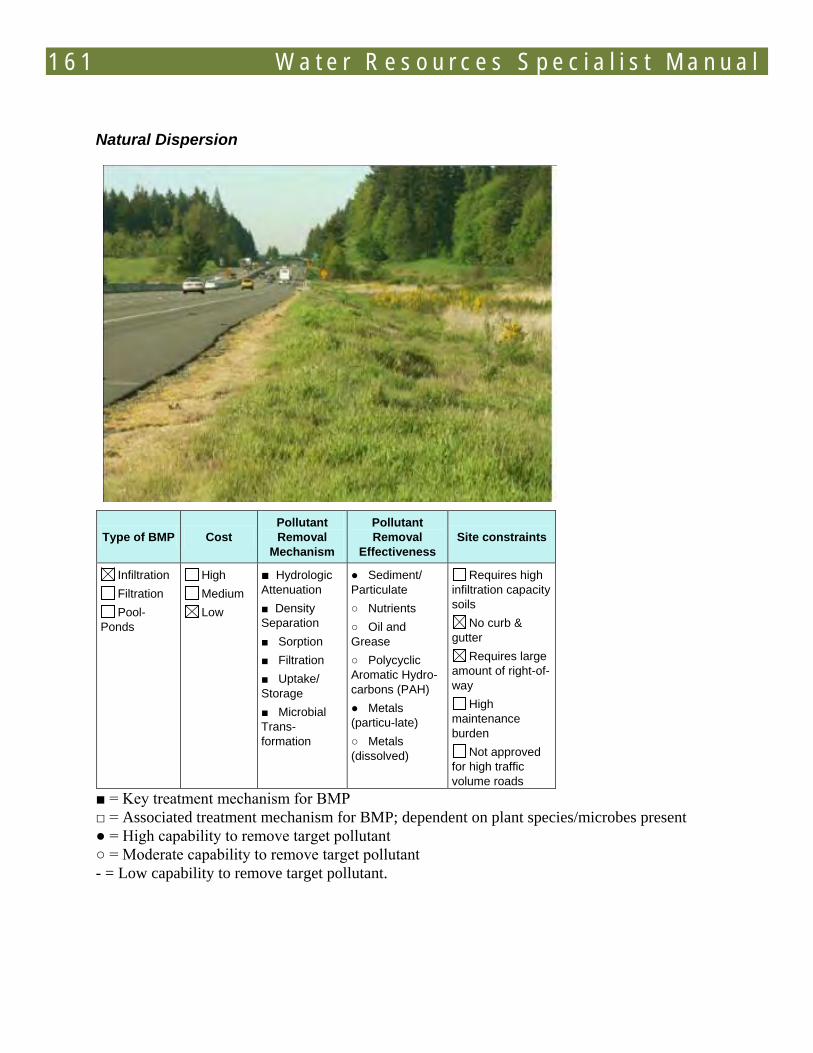
1 6 1 W a t e r R e s o u r c e s S p e c i a l i s t M a n u a l
Natural Dispersion
Type of BMP Cost Pollutant Removal
Mechanism
Pollutant Removal
Effectiveness Site constraints
Infiltration Filtration Pool-
Ponds
High Medium Low
■ Hydrologic Attenuation ■ Density Separation ■ Sorption ■ Filtration ■ Uptake/ Storage ■ Microbial Trans-formation
● Sediment/ Particulate ○ Nutrients ○ Oil and Grease ○ Polycyclic Aromatic Hydro-carbons (PAH) ● Metals (particu-late) ○ Metals (dissolved)
Requires high infiltration capacity soils
No curb & gutter
Requires large amount of right-of-way
High maintenance burden
Not approved for high traffic volume roads
■ = Key treatment mechanism for BMP □ = Associated treatment mechanism for BMP; dependent on plant species/microbes present ● = High capability to remove target pollutant ○ = Moderate capability to remove target pollutant - = Low capability to remove target pollutant.
W a t e r R e s o u r c e s S p e c i a l i s t M a n u a l 162
Description Natural dispersion is a technique used in low-impact development that is most appropriate for long, linear projects such as roads and highways. Dispersion works only where stormwater does not accumulate in a narrow area, that is, where there are no curbs. With natural dispersion, stormwater discharges as sheet flow from the pavement to a gravel strip. From the gravel strip, it drains to a vegetated shoulder that gently slopes to undisturbed areas where the stormwater infiltrates the soil.
Site and Design Constraints A natural dispersion area requires a substantial flow path length, which may require significant ROW or permanent easement acquisition. The dispersion area must be undisturbed, planted with native vegetation, and protected from development through easement or other permanent measure. There are very few road projects that will have the adjacent protected land area available for this BMP to be feasible.
Details and Design Information Details about natural dispersion systems are provided in the Washington State Department of Transportation Highway Runoff Manual.
Maintenance Considerations Details about natural dispersion systems are provided in the Washington State Department of Transportation Highway Runoff Manual.
Amended Soil Vegetated BMPs
Amended soil vegetated BMPs are also preferred BMPs, and are used where site constraints prevent full infiltration of the water quality design storm. They promote infiltration where appropriate, but the primary treatment comes from all or a substantial portion of the stormwater filtering through amended soil, with the remaining stormwater being filtered through vegetation. Amended soil vegetated BMPs discharge all or most of the water quality design storm to surface waters.
Some of the infiltration BMPs may be constructed as amended soil vegetated BMPs by the addition of underdrains where soil or other conditions make infiltration infeasible or inappropriate.
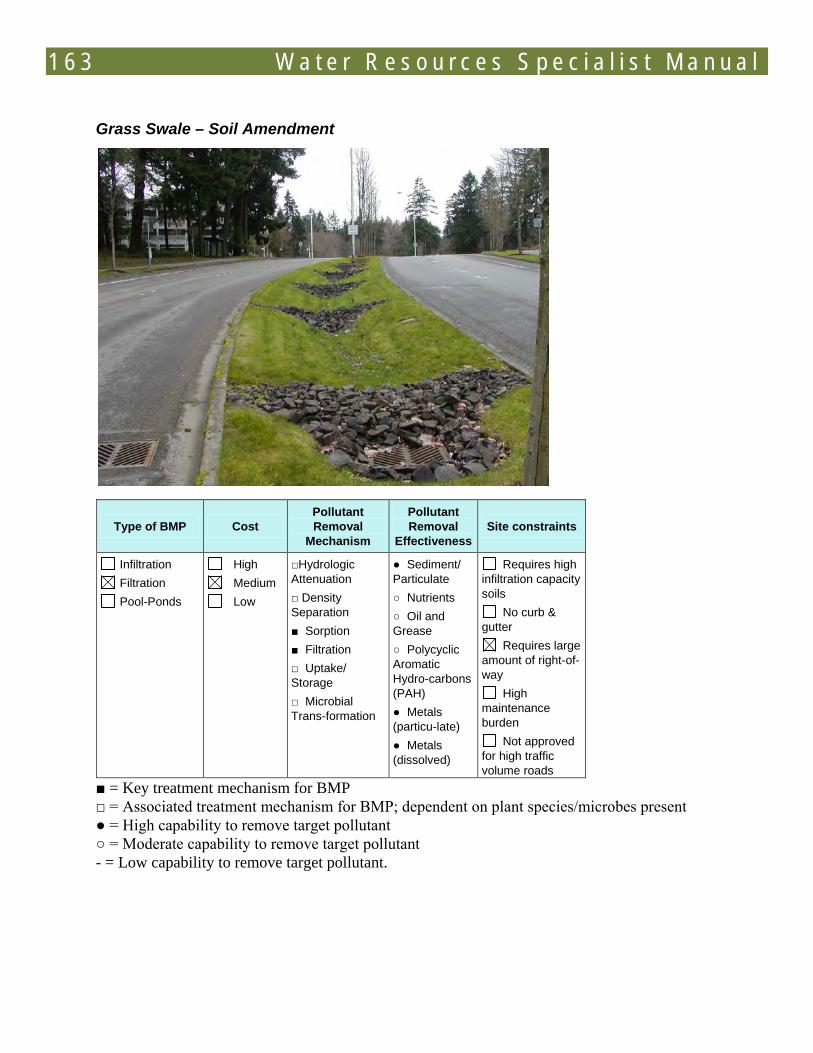
1 6 3 W a t e r R e s o u r c e s S p e c i a l i s t M a n u a l
Grass Swale – Soil Amendment
Type of BMP Cost Pollutant Removal
Mechanism
Pollutant Removal
Effectiveness Site constraints
Infiltration Filtration Pool-Ponds
High Medium Low
□Hydrologic Attenuation □ Density Separation ■ Sorption ■ Filtration □ Uptake/ Storage □ Microbial Trans-formation
● Sediment/ Particulate ○ Nutrients ○ Oil and Grease ○ Polycyclic Aromatic Hydro-carbons (PAH) ● Metals (particu-late) ● Metals (dissolved)
Requires high infiltration capacity soils
No curb & gutter
Requires large amount of right-of-way
High maintenance burden
Not approved for high traffic volume roads
■ = Key treatment mechanism for BMP □ = Associated treatment mechanism for BMP; dependent on plant species/microbes present ● = High capability to remove target pollutant ○ = Moderate capability to remove target pollutant - = Low capability to remove target pollutant.
W a t e r R e s o u r c e s S p e c i a l i s t M a n u a l 164
Description Grass swales with soil amendment may provide partial or complete infiltration of runoff. The vegetated surface is typically grass, although a selection of native drought-tolerant plants can improve pollutant removal effectiveness while reducing the maintenance burden associated with mowing. Where there is adequate space available for a vegetated surface facility and high infiltration capacity soils, grass swales with soil amendment are a good choice because they have a low construction cost and require minimal maintenance.
See the description of grass swales for information on site and design constraints, design details, and maintenance.
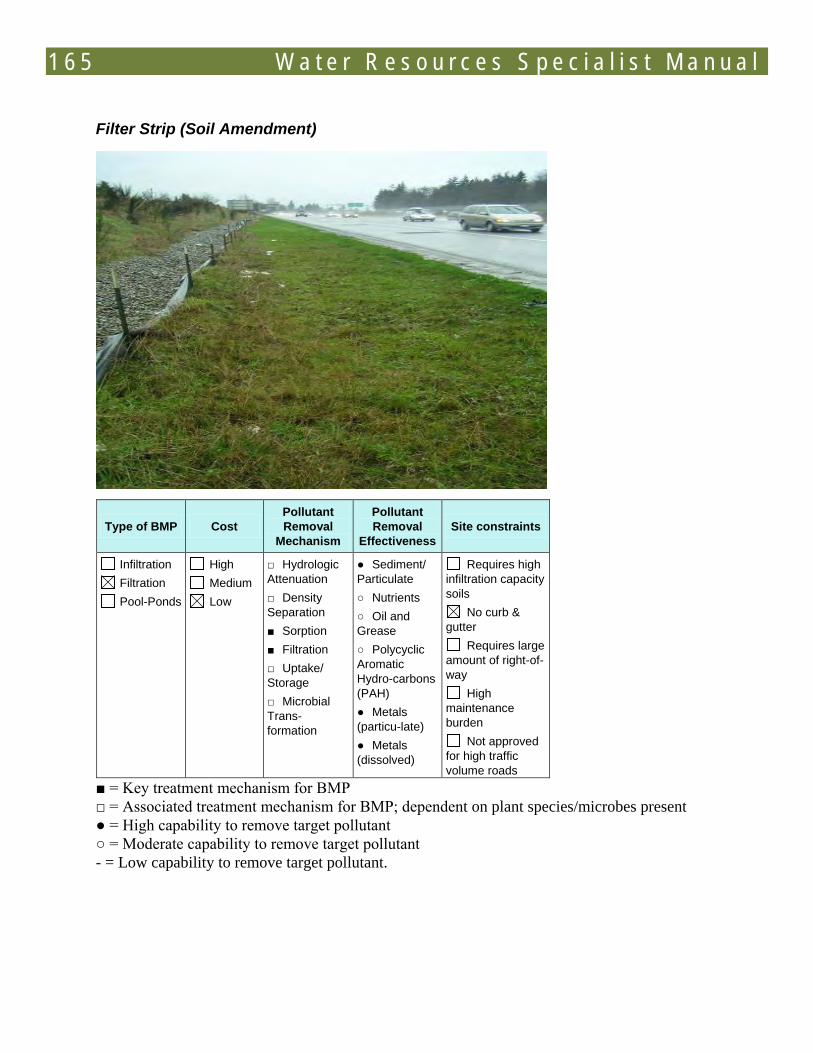
1 6 5 W a t e r R e s o u r c e s S p e c i a l i s t M a n u a l
Filter Strip (Soil Amendment)
Type of BMP Cost Pollutant Removal
Mechanism
Pollutant Removal
Effectiveness Site constraints
Infiltration Filtration Pool-Ponds
High Medium Low
□ Hydrologic Attenuation □ Density Separation ■ Sorption ■ Filtration □ Uptake/ Storage □ Microbial Trans-formation
● Sediment/ Particulate ○ Nutrients ○ Oil and Grease ○ Polycyclic Aromatic Hydro-carbons (PAH) ● Metals (particu-late) ● Metals (dissolved)
Requires high infiltration capacity soils
No curb & gutter
Requires large amount of right-of-way
High maintenance burden
Not approved for high traffic volume roads
■ = Key treatment mechanism for BMP □ = Associated treatment mechanism for BMP; dependent on plant species/microbes present ● = High capability to remove target pollutant ○ = Moderate capability to remove target pollutant - = Low capability to remove target pollutant.

W a t e r R e s o u r c e s S p e c i a l i s t M a n u a l 166
Description Filter strips are most appropriate for long, linear projects such as roads and highways. They have compost-amended soil added to enhance pollutant removal, and are used where limits on the right-of-way width or adverse soil conditions make natural dispersion inappropriate.
Site and Design Constraints See Filter Strip
Details and Design Information Details about filter strips are provided in Appendix D of Chapter 14 of the Hydraulics Manual.
Maintenance Considerations Details about filter strips are provided in Appendix D of Chapter 14 of the Hydraulics Manual.
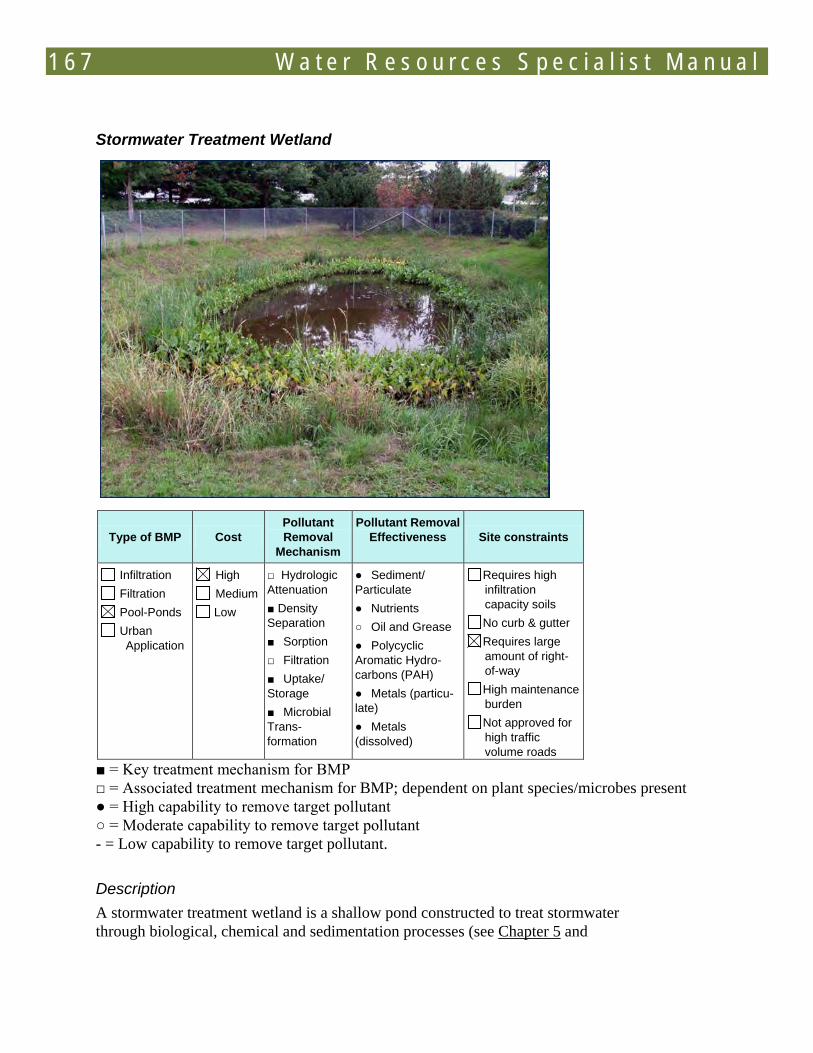
1 6 7 W a t e r R e s o u r c e s S p e c i a l i s t M a n u a l
Stormwater Treatment Wetland
Type of BMP Cost Pollutant Removal
Mechanism
Pollutant Removal Effectiveness Site constraints
Infiltration Filtration Pool-Ponds Urban
Application
High Medium Low
□ Hydrologic Attenuation ■ Density Separation ■ Sorption □ Filtration ■ Uptake/ Storage ■ Microbial Trans-formation
● Sediment/ Particulate ● Nutrients ○ Oil and Grease ● Polycyclic Aromatic Hydro-carbons (PAH) ● Metals (particu-late) ● Metals (dissolved)
Requires high infiltration capacity soils No curb & gutter Requires large amount of right-of-way High maintenance burden Not approved for high traffic volume roads
■ = Key treatment mechanism for BMP □ = Associated treatment mechanism for BMP; dependent on plant species/microbes present ● = High capability to remove target pollutant ○ = Moderate capability to remove target pollutant - = Low capability to remove target pollutant.
Description A stormwater treatment wetland is a shallow pond constructed to treat stormwater through biological, chemical and sedimentation processes (see Chapter 5 and
W a t e r R e s o u r c e s S p e c i a l i s t M a n u a l 168
Chapter 7) associated with emergent aquatic plants, mimicking the processes of naturally-occurring wetlands. Stormwater treatment wetlands are not eligible for wetland mitigation credits, and natural wetlands cannot be used for highway runoff treatment. The heavy load of pollutants can adversely affect the ecological functions of the wetland.
While treatment wetlands do not use amended soil in the same way as the other amended soil vegetated BMPs, the extended storage time with prolonged contact with the substrate and organic matter provides much the same treatment processes. Stormwater treatment wetlands are a preferred BMP.
Site and Design Constraints Stormwater treatment wetlands generally require a substantial area of ROW. Opportunities for siting wetlands include medians, interchanges, adjacent to ramps and along ROW adjacent to roads. Vector control (i.e., mosquitoes) is a concern, which may limit their acceptability in residential areas.
Plant survival and effective treatment depend on maintaining saturated conditions that will support emergent aquatic plants.
Details and Design Information Additional information regarding stormwater treatment wetlands can be found in Chapter 14 of the Hydraulics Manual.
Maintenance Considerations Maintenance considerations are provided in Chapter 14 of the Hydraulics Manual.
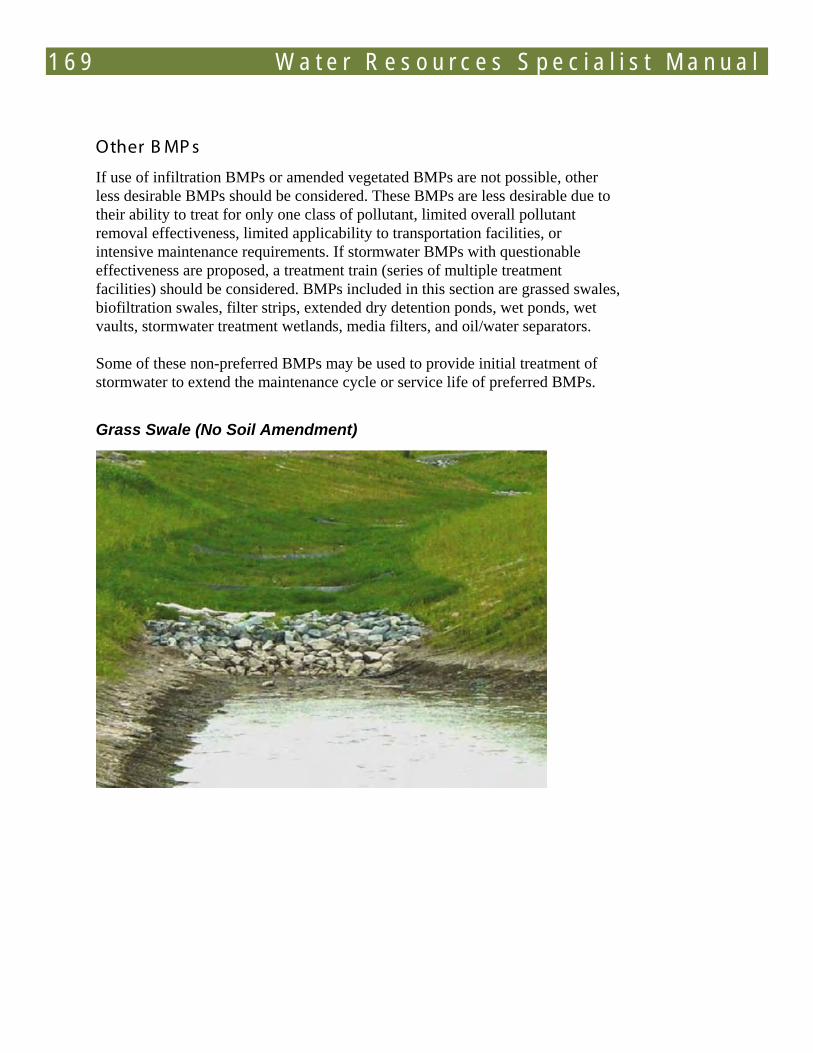
1 6 9 W a t e r R e s o u r c e s S p e c i a l i s t M a n u a l
Other B MP s
If use of infiltration BMPs or amended vegetated BMPs are not possible, other less desirable BMPs should be considered. These BMPs are less desirable due to their ability to treat for only one class of pollutant, limited overall pollutant removal effectiveness, limited applicability to transportation facilities, or intensive maintenance requirements. If stormwater BMPs with questionable effectiveness are proposed, a treatment train (series of multiple treatment facilities) should be considered. BMPs included in this section are grassed swales, biofiltration swales, filter strips, extended dry detention ponds, wet ponds, wet vaults, stormwater treatment wetlands, media filters, and oil/water separators.
Some of these non-preferred BMPs may be used to provide initial treatment of stormwater to extend the maintenance cycle or service life of preferred BMPs.
Grass Swale (No Soil Amendment)
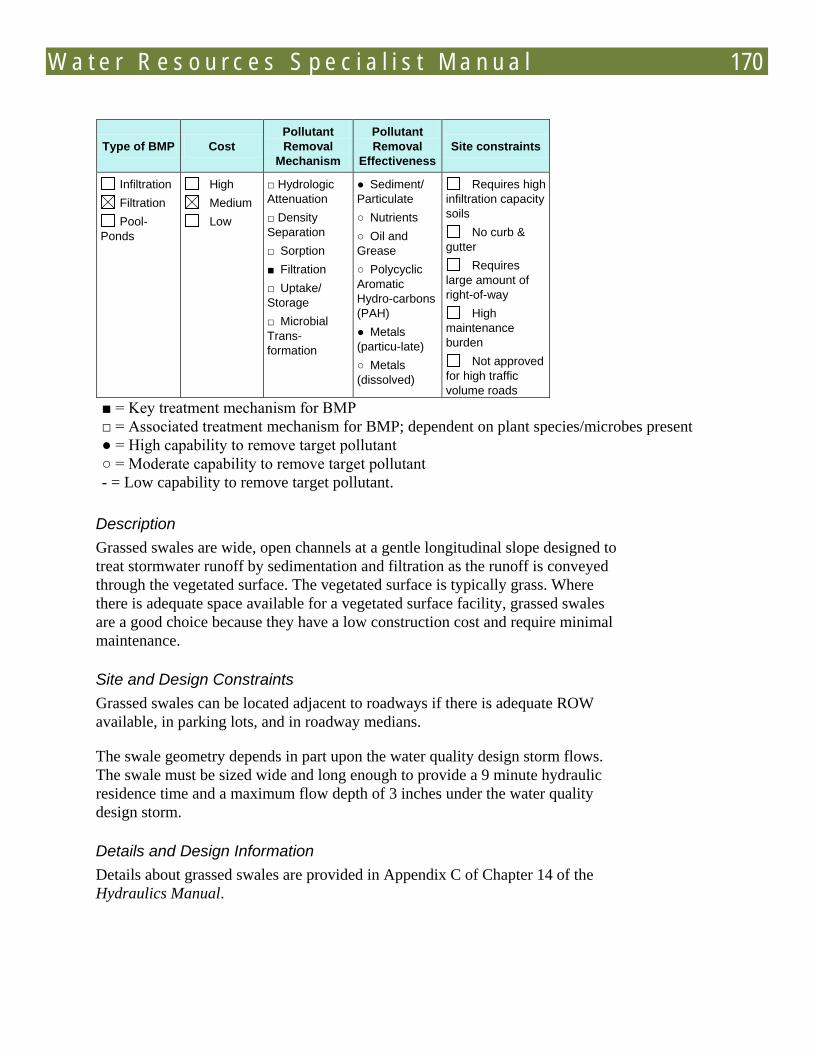
W a t e r R e s o u r c e s S p e c i a l i s t M a n u a l 170
Type of BMP Cost Pollutant Removal
Mechanism
Pollutant Removal
Effectiveness Site constraints
Infiltration Filtration Pool-
Ponds
High Medium Low
□ Hydrologic Attenuation □ Density Separation □ Sorption ■ Filtration □ Uptake/ Storage □ Microbial Trans-formation
● Sediment/ Particulate ○ Nutrients ○ Oil and Grease ○ Polycyclic Aromatic Hydro-carbons (PAH) ● Metals (particu-late) ○ Metals (dissolved)
Requires high infiltration capacity soils
No curb & gutter
Requires large amount of right-of-way
High maintenance burden
Not approved for high traffic volume roads
■ = Key treatment mechanism for BMP □ = Associated treatment mechanism for BMP; dependent on plant species/microbes present ● = High capability to remove target pollutant ○ = Moderate capability to remove target pollutant - = Low capability to remove target pollutant.
Description Grassed swales are wide, open channels at a gentle longitudinal slope designed to treat stormwater runoff by sedimentation and filtration as the runoff is conveyed through the vegetated surface. The vegetated surface is typically grass. Where there is adequate space available for a vegetated surface facility, grassed swales are a good choice because they have a low construction cost and require minimal maintenance.
Site and Design Constraints Grassed swales can be located adjacent to roadways if there is adequate ROW available, in parking lots, and in roadway medians.
The swale geometry depends in part upon the water quality design storm flows. The swale must be sized wide and long enough to provide a 9 minute hydraulic residence time and a maximum flow depth of 3 inches under the water quality design storm.
Details and Design Information Details about grassed swales are provided in Appendix C of Chapter 14 of the Hydraulics Manual.
1 7 1 W a t e r R e s o u r c e s S p e c i a l i s t M a n u a l
Maintenance Considerations Maintenance requirements, which include mowing grass and removing sediment, are described in Appendix C of Chapter 14 of the Hydraulics Manual.
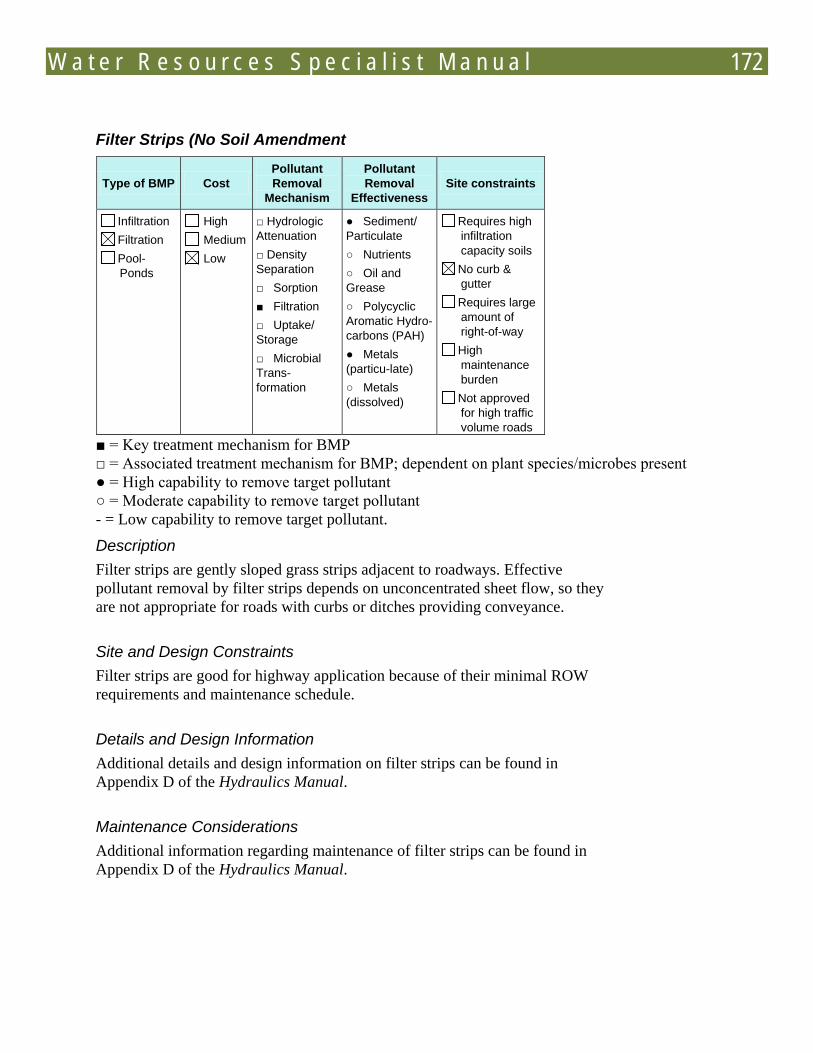
W a t e r R e s o u r c e s S p e c i a l i s t M a n u a l 172
Filter Strips (No Soil Amendment
Type of BMP Cost Pollutant Removal
Mechanism
Pollutant Removal
Effectiveness Site constraints
Infiltration Filtration Pool-Ponds
High Medium Low
□ Hydrologic Attenuation □ Density Separation □ Sorption ■ Filtration □ Uptake/ Storage □ Microbial Trans-formation
● Sediment/ Particulate ○ Nutrients ○ Oil and Grease ○ Polycyclic Aromatic Hydro-carbons (PAH) ● Metals (particu-late) ○ Metals (dissolved)
Requires high infiltration capacity soils
No curb & gutter
Requires large amount of right-of-way
High maintenance burden
Not approved for high traffic volume roads
■ = Key treatment mechanism for BMP □ = Associated treatment mechanism for BMP; dependent on plant species/microbes present ● = High capability to remove target pollutant ○ = Moderate capability to remove target pollutant - = Low capability to remove target pollutant.
Description Filter strips are gently sloped grass strips adjacent to roadways. Effective pollutant removal by filter strips depends on unconcentrated sheet flow, so they are not appropriate for roads with curbs or ditches providing conveyance.
Site and Design Constraints Filter strips are good for highway application because of their minimal ROW requirements and maintenance schedule.
Details and Design Information Additional details and design information on filter strips can be found in Appendix D of the Hydraulics Manual.
Maintenance Considerations Additional information regarding maintenance of filter strips can be found in Appendix D of the Hydraulics Manual.
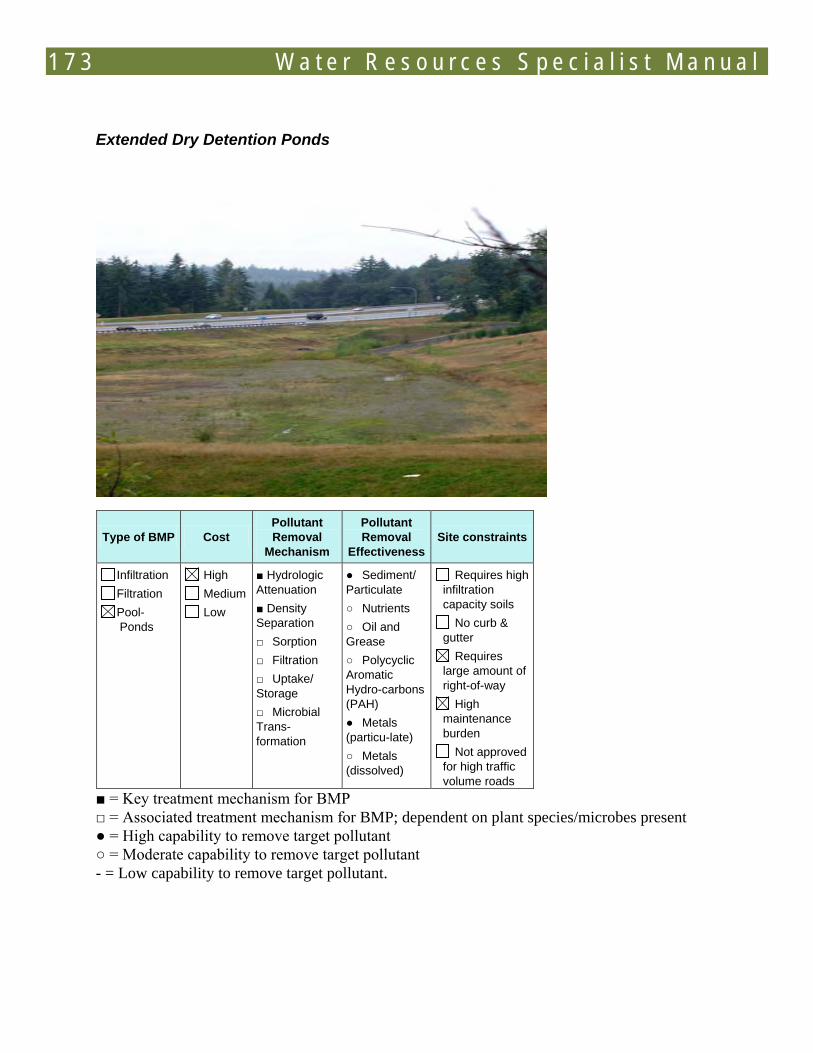
1 7 3 W a t e r R e s o u r c e s S p e c i a l i s t M a n u a l
Extended Dry Detention Ponds
Type of BMP Cost Pollutant Removal
Mechanism
Pollutant Removal
Effectiveness Site constraints
Infiltration Filtration Pool-Ponds
High Medium Low
■ Hydrologic Attenuation ■ Density Separation □ Sorption □ Filtration □ Uptake/ Storage □ Microbial Trans-formation
● Sediment/ Particulate ○ Nutrients ○ Oil and Grease ○ Polycyclic Aromatic Hydro-carbons (PAH) ● Metals (particu-late) ○ Metals (dissolved)
Requires high infiltration capacity soils
No curb & gutter
Requires large amount of right-of-way
High maintenance burden
Not approved for high traffic volume roads
■ = Key treatment mechanism for BMP □ = Associated treatment mechanism for BMP; dependent on plant species/microbes present ● = High capability to remove target pollutant ○ = Moderate capability to remove target pollutant - = Low capability to remove target pollutant.
W a t e r R e s o u r c e s S p e c i a l i s t M a n u a l 174
Description An extended detention dry pond is an above ground basin that has been designed to store stormwater runoff temporarily to allow particles and attached pollutants to settle. Extended dry ponds do not have a large permanent pool of water; instead, water that enters the pond is released over a period of time. They typically have the following facility components:
• Outlet control structure that restricts flow rate, and
• Emergency spillway if the primary outlet control structure cannot safely pass the projected high flows
Site and Design Constraints Ponds generally require a substantial area in the ROW. Opportunities for siting extended detention dry ponds include medians, interchanges, adjacent to ramps and along ROW adjacent to roads.
Details and Design Information Additional information regarding extended detention dry ponds can be found in Appendix B of the Hydraulics Manual.
Maintenance Considerations Maintenance needs for an extended dry detention pond include an access road to allow maintenance staff to periodically remove accumulated sediment and debris. Additional maintenance considerations are provided in Appendix B of the Hydraulics Manual.
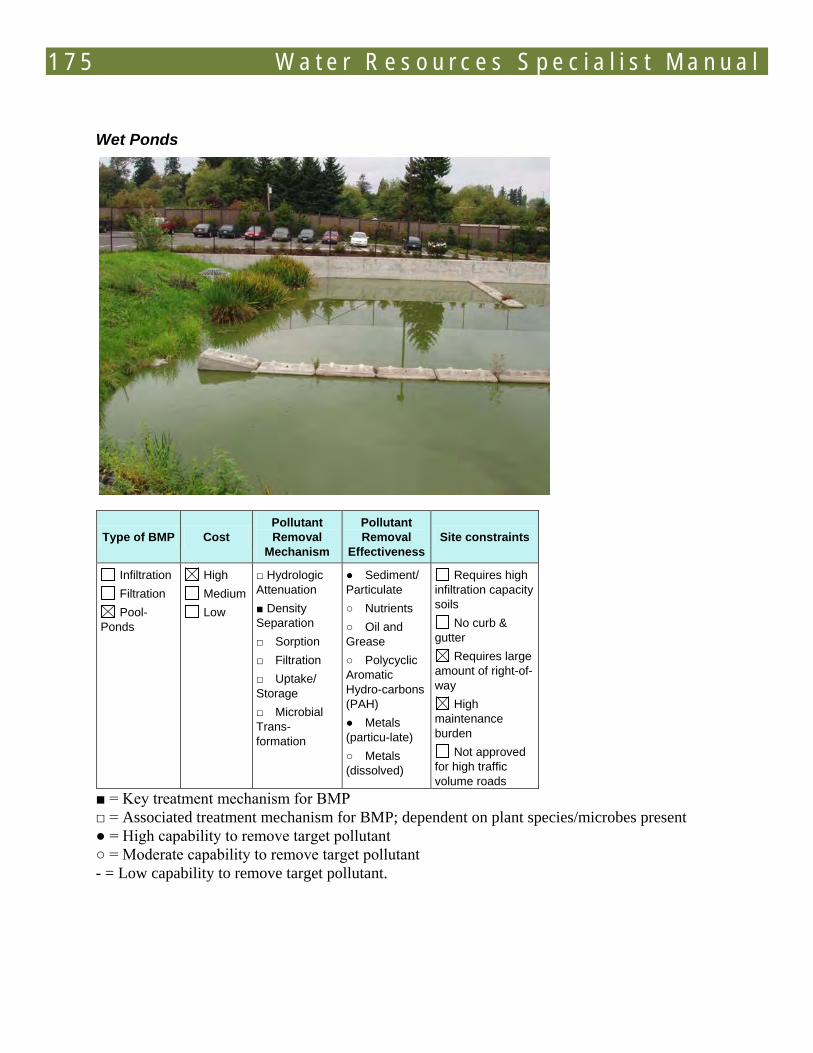
1 7 5 W a t e r R e s o u r c e s S p e c i a l i s t M a n u a l
Wet Ponds
Type of BMP Cost Pollutant Removal
Mechanism
Pollutant Removal
Effectiveness Site constraints
Infiltration Filtration Pool-
Ponds
High Medium Low
□ Hydrologic Attenuation ■ Density Separation □ Sorption □ Filtration □ Uptake/ Storage □ Microbial Trans-formation
● Sediment/ Particulate ○ Nutrients ○ Oil and Grease ○ Polycyclic Aromatic Hydro-carbons (PAH) ● Metals (particu-late) ○ Metals (dissolved)
Requires high infiltration capacity soils
No curb & gutter
Requires large amount of right-of-way
High maintenance burden
Not approved for high traffic volume roads
■ = Key treatment mechanism for BMP □ = Associated treatment mechanism for BMP; dependent on plant species/microbes present ● = High capability to remove target pollutant ○ = Moderate capability to remove target pollutant - = Low capability to remove target pollutant.
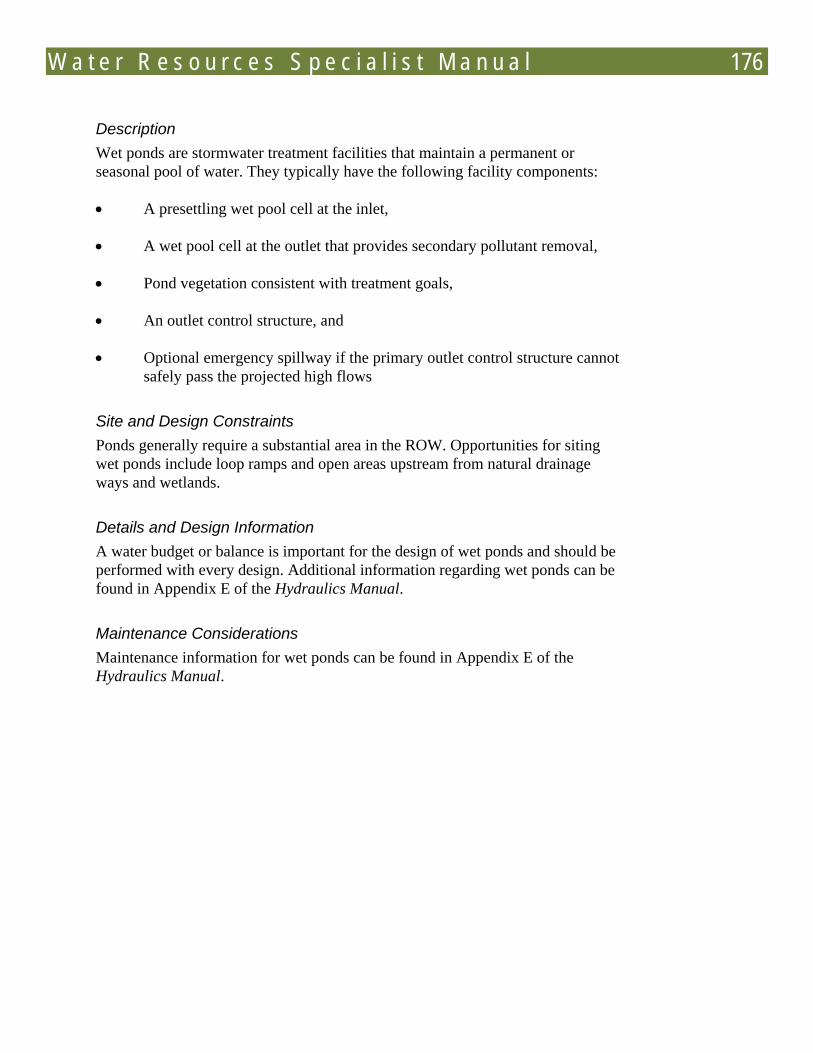
W a t e r R e s o u r c e s S p e c i a l i s t M a n u a l 176
Description Wet ponds are stormwater treatment facilities that maintain a permanent or seasonal pool of water. They typically have the following facility components:
• A presettling wet pool cell at the inlet,
• A wet pool cell at the outlet that provides secondary pollutant removal,
• Pond vegetation consistent with treatment goals,
• An outlet control structure, and
• Optional emergency spillway if the primary outlet control structure cannot safely pass the projected high flows
Site and Design Constraints Ponds generally require a substantial area in the ROW. Opportunities for siting wet ponds include loop ramps and open areas upstream from natural drainage ways and wetlands.
Details and Design Information A water budget or balance is important for the design of wet ponds and should be performed with every design. Additional information regarding wet ponds can be found in Appendix E of the Hydraulics Manual.
Maintenance Considerations Maintenance information for wet ponds can be found in Appendix E of the Hydraulics Manual.
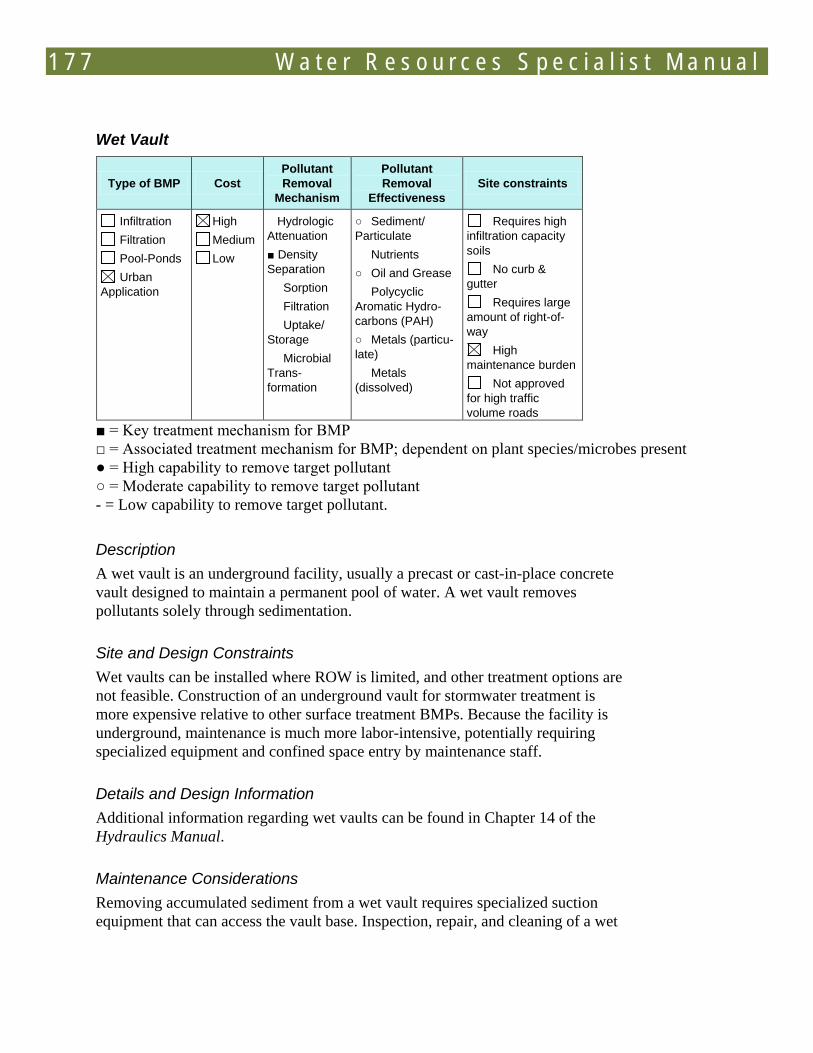
1 7 7 W a t e r R e s o u r c e s S p e c i a l i s t M a n u a l
Wet Vault
Type of BMP Cost Pollutant Removal
Mechanism
Pollutant Removal
Effectiveness Site constraints
Infiltration Filtration Pool-Ponds Urban
Application
High Medium Low
Hydrologic Attenuation ■ Density Separation Sorption Filtration Uptake/ Storage Microbial Trans-formation
○ Sediment/ Particulate Nutrients ○ Oil and Grease Polycyclic Aromatic Hydro-carbons (PAH) ○ Metals (particu-late) Metals (dissolved)
Requires high infiltration capacity soils
No curb & gutter
Requires large amount of right-of-way
High maintenance burden
Not approved for high traffic volume roads
■ = Key treatment mechanism for BMP □ = Associated treatment mechanism for BMP; dependent on plant species/microbes present ● = High capability to remove target pollutant ○ = Moderate capability to remove target pollutant - = Low capability to remove target pollutant.
Description A wet vault is an underground facility, usually a precast or cast-in-place concrete vault designed to maintain a permanent pool of water. A wet vault removes pollutants solely through sedimentation.
Site and Design Constraints Wet vaults can be installed where ROW is limited, and other treatment options are not feasible. Construction of an underground vault for stormwater treatment is more expensive relative to other surface treatment BMPs. Because the facility is underground, maintenance is much more labor-intensive, potentially requiring specialized equipment and confined space entry by maintenance staff.
Details and Design Information Additional information regarding wet vaults can be found in Chapter 14 of the Hydraulics Manual.
Maintenance Considerations Removing accumulated sediment from a wet vault requires specialized suction equipment that can access the vault base. Inspection, repair, and cleaning of a wet

W a t e r R e s o u r c e s S p e c i a l i s t M a n u a l 178
vault may also require maintenance staff to enter the vault. Additional maintenance considerations are provided in Chapter 14 of the Hydraulics Manual.
1 7 9 W a t e r R e s o u r c e s S p e c i a l i s t M a n u a l
Media Filter
Type of BMP Cost Pollutant Removal
Mechanism
Pollutant Removal
Effectiveness Site constraints
Infiltration Filtration Pool-Ponds Urban
Application
High Medium Low
Hydrologic Attenuation Density Separation □ Sorption ■ Filtration Uptake/ Storage □ Microbial Trans-formation
● Sediment/ Particulate - Nutrients ○ Oil and Grease ○ Polycyclic Aromatic Hydro-carbons (PAH) ● Metals (particu-late) ○ Metals (dissolved)
Requires high infiltration capacity soils
No curb & gutter Requires large
amount of right-of-way
High maintenance burden
Not approved for high traffic volume roads
■ = Key treatment mechanism for BMP □ = Associated treatment mechanism for BMP; dependent on plant species/microbes present ● = High capability to remove target pollutant ○ = Moderate capability to remove target pollutant - = Low capability to remove target pollutant.
Description Media filters use inert and sorptive media to remove pollutants from stormwater. Examples of these media are perlite, activated carbon, Chitosan, leaf-compost medium, sand, zeolite, and peat.
• Perlite, which is naturally occurring volcanic ash, has a porous structure and rough edges. It is used for removing total suspended solids, oil, and grease (CONTECH 2006).
• Activated carbon is used to remove organic pollutants, metals, and petroleum hydrocarbons (Minton 2005).
• Chitosan, which is produced from crab and shrimp shell waste, targets dissolved metals (Minton 2005).
• Leaf-compost medium has been found to be effective in removing soluble metals, total suspended solids, oil, and grease (CONTECH 2006). CONTECH has also developed a finer gradation of leaf compost medium known as MetalRx™ that is designed to achieve higher levels of metal removal.
W a t e r R e s o u r c e s S p e c i a l i s t M a n u a l 180
• Sand is used to remove metals and petroleum hydrocarbons. It may also be amended with calcite or iron to enhance phosphorus removal (Minton 2005).
• Zeolite, a naturally occurring mineral, is used to remove metals and ammonia (Minton 2005).
• Peat is used to remove metals and petroleum hydrocarbons. Peat may also remove phosphorus if the peat contains significant concentrations of iron or aluminum (Minton 2005).
The sand filter is an example of a nonproprietary media filter that can be constructed as an open basin or an underground vault. Details, specifications, and descriptions of media filters are provided in the BMP summary reports.
Examples of proprietary media filters are the Aqua-Filter, the StormFilter, and the Media Filtration System (MFS).
With the use of any of these nonproprietary or proprietary media filters, pretreatment is necessary to prevent the media from clogging. Proprietary media filters are most appropriate for sites with inadequate ROW for vegetated facilities, because they can be located underground. Their underground location makes them suitable for highly urban areas. On the other hand, their underground location makes maintenance on these facilities inconvenient; therefore, they are often neglected, and over time their overall effectiveness at pollutant removal declines.
Site and Design Constraints Opportunities for siting extended detention dry ponds include medians, interchanges, adjacent to ramps and along ROW adjacent to roads.
Details and Design Information Additional information regarding media filters can be found in Chapter 14 of the Hydraulics Manual.
Maintenance Considerations Maintenance needs for media filters include close monitoring of media filter hydraulic performance. The filtration rate will decrease as particulates are filtered from stormwater, and the media must be replaced when the media can no longer meet the design filtration rate. Additional maintenance considerations are provided in Chapter 14 of the Hydraulics Manual.
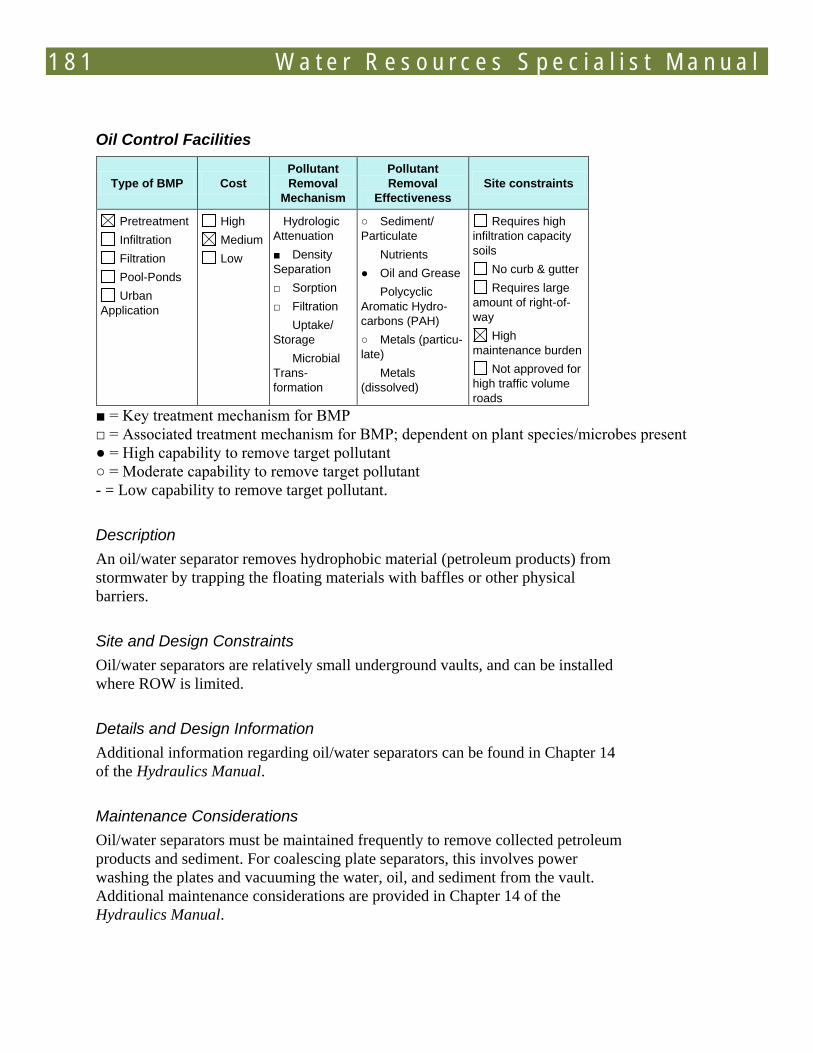
1 8 1 W a t e r R e s o u r c e s S p e c i a l i s t M a n u a l
Oil Control Facilities
Type of BMP Cost Pollutant Removal
Mechanism
Pollutant Removal
Effectiveness Site constraints
Pretreatment Infiltration Filtration Pool-Ponds Urban
Application
High Medium Low
Hydrologic Attenuation ■ Density Separation □ Sorption □ Filtration Uptake/ Storage Microbial Trans-formation
○ Sediment/ Particulate Nutrients ● Oil and Grease Polycyclic Aromatic Hydro-carbons (PAH) ○ Metals (particu-late) Metals (dissolved)
Requires high infiltration capacity soils
No curb & gutter Requires large
amount of right-of-way
High maintenance burden
Not approved for high traffic volume roads
■ = Key treatment mechanism for BMP □ = Associated treatment mechanism for BMP; dependent on plant species/microbes present ● = High capability to remove target pollutant ○ = Moderate capability to remove target pollutant - = Low capability to remove target pollutant.
Description An oil/water separator removes hydrophobic material (petroleum products) from stormwater by trapping the floating materials with baffles or other physical barriers.
Site and Design Constraints Oil/water separators are relatively small underground vaults, and can be installed where ROW is limited.
Details and Design Information Additional information regarding oil/water separators can be found in Chapter 14 of the Hydraulics Manual.
Maintenance Considerations Oil/water separators must be maintained frequently to remove collected petroleum products and sediment. For coalescing plate separators, this involves power washing the plates and vacuuming the water, oil, and sediment from the vault. Additional maintenance considerations are provided in Chapter 14 of the Hydraulics Manual.
W a t e r R e s o u r c e s S p e c i a l i s t M a n u a l 182
11.3 L ow Impact Development Des ign C ons iderations
Low impact development is a design approach intended to reduce adverse hydrologic and water quality impacts of development on receiving waters and the environment by designing sites to mimic natural processes and replicate predevelopment hydrology. “LID” is defined differently by different agencies and organizations, but typically includes measures that incorporate one or more of the following practices:
• Promoting dispersion and avoid concentrating runoff.
• Managing stormwater on site through infiltration to avoid impacting downstream receiving waters.
• Preserving and enhance native vegetation to provide a high level of stormwater treatment.
• Protecting native soils to preserve their infiltrative and treatment capacities.
• Incorporating amended soils where existing soils lack sufficient organic matter or physical properties to adsorb, filter, or otherwise remove pollutants.
• Minimizing impervious surfaces through site design techniques (reduction of lane and shoulder width is not appropriate for highways due to safety issues).
For ODOT’s purposes, LID treatment techniques are those that are put in place in the linear ROW and that provide treatment by infiltration and filtration through vegetation, amended soil or other media. UICs and proprietary treatment facilities are not usually considered LID techniques.
B enefits of L ID
Environmental Benefits LID can reduce the adverse ecological impacts associated with development. When there is less impervious area due to careful site planning and design, and native soils are protected or amended to preserve or promote infiltration, less stormwater enters streams as surface runoff. Consequently, hydrologic impacts to channels and other downstream receiving waters, such as increased peak flows or flow durations, are reduced.
1 8 3 W a t e r R e s o u r c e s S p e c i a l i s t M a n u a l
Water quality benefits of LID include reduced delivery of dissolved metals to receiving waters, which are especially threatening to endangered salmon. These pollutants are reduced by reducing the rate and volume of stormwater discharge and through treatment processes such as sorption, uptake, and microbial transformation (see Chapter 5).
Cost While some LID techniques, such as permeable pavement, can have a higher construction cost than traditional methods, incorporating methods that reduce runoff generated or manage stormwater through dispersion or infiltration can save money by reducing downstream stormwater infrastructure costs relative to traditional development methods.
Permitting Projects managing stormwater through the use of preferred BMPs are considered to have met water quality treatment goals of the resource and regulatory agencies. Most LID treatment techniques are considered preferred BMPs, so their use facilitates rapid regulatory review and permitting.
P rojec t and S ite C ons traints
To effectively incorporate LID into a project, these measures should be considered at the earliest project design stage. The Water Resources Specialist should work with roadway designers to determine which LID design options and preferred BMPs are feasible given safety and site considerations. LID will not work for all projects. This section describes some of the constraints that may limit LID options for projects.
Traffic Safety Considerations For ODOT projects, traffic safety must be the top consideration. Any LID measures proposed for a project must conform to ODOT and AASHTO safety design standards. The roadway designer is ultimately responsible for ensuring project conformance to these safety standards, but the Water Resources Specialist should be aware of the following considerations that can limit LID options.
• Clear zone: “Clear zone” refers to an unobstructed, relatively flat area beyond the edge of the traveled way that allows drivers to regain control or stop safely if the vehicle leaves the road. All road facilities, including stormwater management facilities, must comply with clear zone requirements.
Clear zone restrictions would limit planting, tree preservation, and bi or infiltration facility options adjacent to high-speed roadways; or would require use of a curb or other traffic barrier if such elements are used.
W a t e r R e s o u r c e s S p e c i a l i s t M a n u a l 184
• Are curbs necessary to meet ODOT or AASHTO safety standards? If a low gradient section of roadway can be left uncurbed and roadside vegetation, soils, and slopes are appropriate, dispersion, bioslopes, compost-amended vegetated filter strips, and other LID options are good choices.
• Sight Distance Triangle: LID facilities must be designed such that the sight distance triangle at uncontrolled intersections is maintained. This is the distance required for drivers to be able to reduce their speeds or preferably stop in the event that another vehicle is approaching. This distance includes the distance covered during perception-reaction time and breaking time. LID facilities containing large plants that would obstruct the view of drivers would not be permitted within the sight distance triangle.
• Pedestrian safety: In lower traffic urban areas where clear zone restrictions do not preclude the use of roadside LID facilities, there are a number of options for stormwater management, such as bioretention facilities. In addition to providing the environmental benefits of LID (described above), these facilities can provide a physical barrier between pedestrians and traffic and provide traffic “calming”. However, care must be taken to ensure that these facilities do not create a tripping hazard for pedestrians, particularly visually impaired pedestrians. Portland’s award-winning SW 12th Avenue Green Street Project includes landscaped stormwater planters installed adjacent to sidewalks. The design incorporated a 4-inch curb exposure at each planter to help indicate to pedestrians, including the visually impaired, that there is a drop in grade (ASLA 2006).
Soil Suitability Sufficiently permeable soils with adequate separation between the infiltration BMP and seasonal high groundwater are needed for proper function of infiltration BMPs. See Infiltration BMPs section for additional discussion.
Right-of-Way Limitations • What is the available ROW? The viability of some techniques, such as
dispersion or bioslopes, will depend in part on having adequate width available adjacent to the road to accommodate the various elements.
• What future development is planned next to the roadway? If curbs will be added in association with a proposed development within a short time frame, the LID options will be limited and the short-term benefits may be unlikely to merit the additional infrastructure cost. Alternatively, development projects with construction and permitting on a similar timeframe to the ODOT projects may offer opportunities to jointly pursue
1 8 5 W a t e r R e s o u r c e s S p e c i a l i s t M a n u a l
LID options, since commercial developments may have less space restrictions than the ODOT ROW. Such an arrangement would be subject to legal review and funding restrictions.
Restrictions Based on Types of Transportation Facilities/Projects Given these transportation-specific considerations, the LID measures and preferred BMPs available depend in part on the nature of the project. Table 11-1 provides a brief overview of some of the restrictions, based on road and transportation facility types. The roadway designer is the best resource for this information on a specific project.
• Freeways or Rural Expressways: Freeways and rural expressways are high speed, high traffic volume roads. There are no barrier curbs, but mountable curbs are permitted where necessary for safety. They are typically built on relatively flat grades, so dispersion and embankment BMPs that depend on dispersed runoff are appropriate (ODOT 2003). Where feasible, natural dispersion, bioslopes, and/or compost-amended vegetated filter strips should be used
• Urban Expressways: Urban expressways are high speed roads in urban settings, typically designed with a design speed of 55 miles per hour (ODOT 2003). Roadway designs will likely include barrier curbs, with pavement width and design decisions dictated by traffic and pedestrian safety and space limitations due to the urban setting. ODOT does not allow use of permeable pavement for the road surface, but it may be considered for shoulders, bike lanes, and sidewalks, where feasible and where approved by ODOT.
• Urban Arterials: Urban arterials are limited access, high traffic volume roads traversing urban areas designed to efficiently move traffic. These facilities offer more opportunities to incorporate LID elements than freeways and expressways, depending on the design speed, available ROW, and the willingness of the community and funding partners to consider a less traditional road design. Metro developed design guidelines for green streets (Metro 2002) that offer design guidelines appropriate for minor urban arterials. These design guidelines incorporate landscaping and design elements that enhance the environmental and pedestrian environment. Incorporating these elements may require a design exception, so they should be evaluated at the earliest stages of project planning and scoping. The City of Portland Stormwater Management Manual (Portland Environmental Services 2008) includes green street details that have been widely used in the City of Portland. bioretention (infiltration planters, curb extensions), and permeable pavement (shoulders, sidewalks and bike lanes only) should be encouraged where feasible.
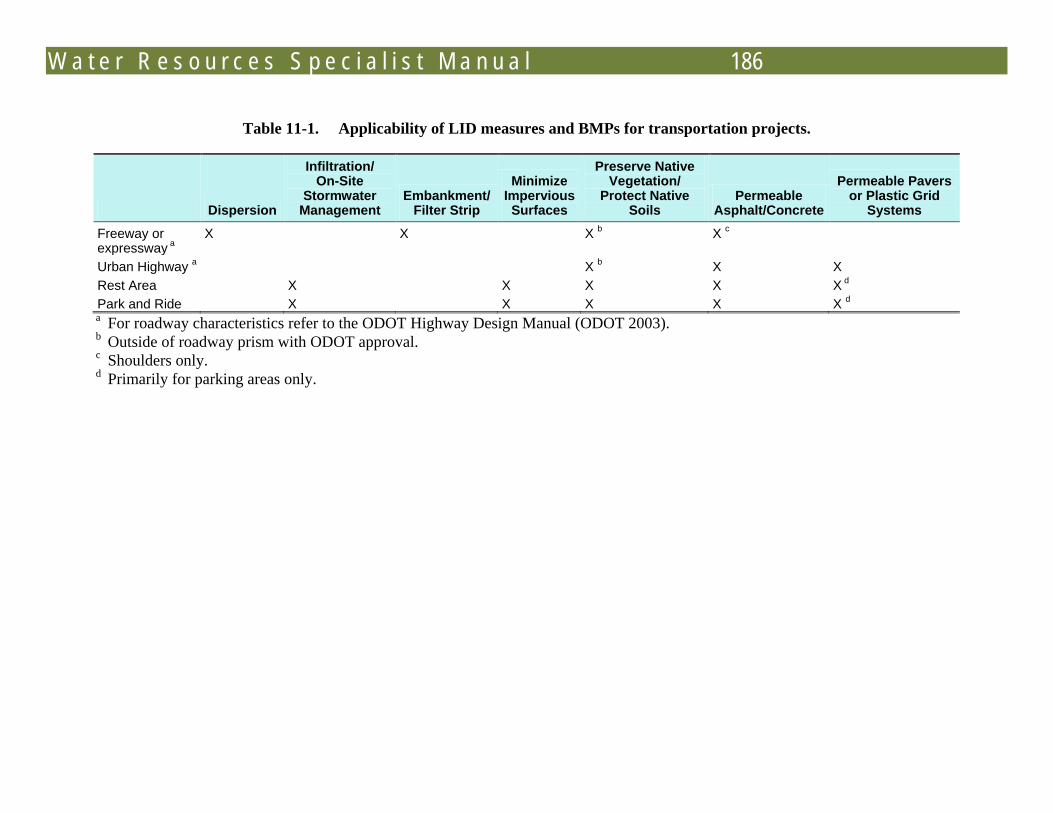
W a t e r R e s o u r c e s S p e c i a l i s t M a n u a l 186
Table 11-1. Applicability of LID measures and BMPs for transportation projects.
Dispersion
Infiltration/ On-Site
Stormwater Management
Embankment/ Filter Strip
Minimize Impervious Surfaces
Preserve Native Vegetation/
Protect Native Soils
Permeable Asphalt/Concrete
Permeable Pavers or Plastic Grid
Systems
Freeway or expressway
X a
X X X b c
Urban Highway a X X b X Rest Area X X X X XPark and Ride
d
X X X X X d
a For roadway characteristics refer to the ODOT Highway Design Manual (ODOT 2003). b Outside of roadway prism with ODOT approval. c Shoulders only. d Primarily for parking areas only.
1 8 7 W a t e r R e s o u r c e s S p e c i a l i s t M a n u a l
• Rest areas and Park and Rides: there are many resources available for LID practices appropriate for parking lots and other site development projects. Low Impact Development: Technical Guidance for Puget Sound (PSAT 2005) provides guidance on permeable pavement and site layout techniques to minimize impervious areas and avoid concentrating runoff that can be applied to parking lots and some low traffic areas. The City of Portland Stormwater Management Manual (Portland Environmental Services 2008) has details on pervious pavement, bioretention (including planters and curb extensions), and other facilities that are highly suited to rest areas and parking areas with appropriate soil and site conditions. These BMPs should be encouraged, where feasible.
11.4 B MP S election
ODOT guidance and regulatory requirements call for the use of the most effective BMPs suitable for a project. Preferred BMPs are the first choice. Other BMPs be considered only if no Preferred BMP is appropriate for a location. Every effort should be made to assemble a treatment train with treatment effectiveness comparable to a Preferred BMP. Should treatment train not be feasible, then the best BMP that will fit should be used; off-project mitigation may then be necessary.
Selection of BMPs for a project is the responsibility of the stormwater engineer or the roadway designer. The Water Resources Specialist assists the engineer by providing information on regulatory requirements, special pollutant targets, and engaging in discussions about constraints, options and what is “practicable” for a project.
Consideration of stormwater management for environmental protection must begin early in the project development process. Inability to provide sufficient treatment because it is too late to acquire enough right-of-way is not an acceptable excuse.
Projects should first be evaluated for the feasibility of LID approaches and treatment techniques. Non-LID BMPs, where the stormwater is collected and conveyed to a facility, are used when LID is not practicable or cannot provide enough treatment.
ODOT has developed a BMP Selection Tool to aid designers in determining the most effective treatment method for an individual project. The BMP Selection Tool is available at @ ftp://ftp.odot.state.or.us/techserv/Geo-Environmental/Stormwater%20Team/.
W a t e r R e s o u r c e s S p e c i a l i s t M a n u a l 188
Selection criteria consist of:
• Treatment capability: does the BMP use processes that treat for multiple pollutants, or treat for a targeted pollutant?
• Physical site suitability: does the site have the topography, size and soils to allow the BMP to be constructed in conformity to design guidance?
• Maintenance: can maintenance be performed easily, does it require special equipment, is it inexpensive, how often must maintenance be done?
• Conflicting resources: wetlands, habitat for terrestrial T&E species, archaeological or historic sites, hazardous materials
• Risk and public perception: are there vector issues, safety concerns, aesthetic concerns, could the BMP become an attractive nuisance, is there public support?
• Cost: both construction and maintenance.
Maintenanc e R equirements of P ropos ed B MP
Maintenance is vital to BMP performance and longevity. The designers of BMPs should communicate with Maintenance to ensure the BMPs are maintainable. The Water Resources Specialist may need to coordinate contact between designers and Maintenance, and must be aware of maintenance constraints that preclude the use of preferred BMPs. This information is required in Stormwater Management Plans for 401 Water Quality Certifications.
In general, the more sophisticated the BMP, the more maintenance is required to keep it functioning properly. Poorly maintained BMPs can present risks (for example, a clogged infiltration system can result in roadway flooding). Poorly maintained BMPs can also become net exporters of pollutants. For example, well-maintained vegetated facilities should have dense vegetation. If any plants are rotting, they should be removed, or the nutrients (phosphorus and nitrogen) that they have taken up could be released from the plants to receiving waters. For flow-through vegetated facilities, such as swales, grass should be mowed to ensure that it is not too long relative to the flow depth. In general, the design flow depth should be roughly two-thirds of the grass height. If grasses are not well-maintained and get too long, they can get bent over by the force of the stormwater flow and provide less vegetative filtration of stormwater.
Underground facilities can be problematic because they are hidden from view, and maintenance problems are not immediately evident.
1 8 9 W a t e r R e s o u r c e s S p e c i a l i s t M a n u a l
Recommendations for evaluating maintenance issues associated with proposed BMPs are the following:
• Make sure there is adequate access for maintenance of the facility. If underground media filters are proposed, there should be a contract with the vendor for annual or biannual maintenance, or ODOT maintenance staff should confirm that they will be able to inspect and maintain the BMP according to the recommended maintenance schedule.
• Check with ODOT maintenance staff if there are any concerns regarding ODOT’s ability to maintain proposed facilities.
Get involved in projects from the earliest stages, whenever possible. Good communication with the design team will ensure that the entire project team is aware of the preferred BMPs, and site, maintenance, and cost constraints that might limit the options available.

191 W a t e r R e s o u r c e s S p e c i a l i s t M a n u a l
C HA P T E R 12 - DE F INIT IONS
Action Area. In terms of the Endangered Species Act, the “action area” is defined as the area of largest project impact. For stormwater discharge, ODOT defines the action area as the downstream limit at which the concentration of pollutants of concern is below the analytical detection limit. This limit is estimated using the Driscoll method (see Chapter 3).
Acute. Acute effects refer to physiological effects observed following limited duration exposure to contaminants.
Adsorption. Adsorption is the process by which dissolved pollutants adhere to suspended particulates, bottom sediments, vegetation surfaces, or other media (such as activated carbon). Some filtration media help remove charged pollutant particles, such as metal cations, by adsorption.
Alluvial channel. A stream or river channel whose bed is composed of sediment mobilized and deposited by moving water.
Anadromous. Fish which are born in fresh water, spend a portion of their lives in the ocean and then return to spawn.
Anthropogenic. Human-induced effects.
Area of Potential Impact (API). The API includes all areas directly affected by the proposed project, including staging and stockpile areas, and other areas that are impacted during construction. It may be helpful to think of the API as the potential construction footprint of a project.
Armoring(ed). When the surface of the bed or ground has finer grained sediments stripped away leaving only a coarser (usually gravel or cobble) substrate
Artificial obstructions. ODFW administers the state fish passage laws (OAR 635-412-0005 through 0040).
Atmospheric deposition. Atmospheric deposition occurs when pollutants are transferred from the air to the earth's surface. Pollutants can fall to the earth in precipitation and as dry particulate matter. Gaseous pollutants also can be absorbed by water bodies.
Include dams, diversions, roads, culverts, tide gates, dikes, levees, berms, or any other human-made device placed in the waters of Oregon that may preclude or prevent the migration of native migratory fish.
W a t e r R e s o u r c e s S p e c i a l i s t M a n u a l 192
Average daily traffic (ADT). The total volume of vehicle traffic on a highway or road for a year, divided by 365 days. ADT information for ODOT projects is often provided in the Prospectus, part 3. Alternatively, it can be obtained online from the ODOT traffic counting program: (https://www.oregon.gov/ODOT/TD/TDATA/tsm/tvt.shtml).
Avulsion (avulsing). The rapid migration of the primary stream channel from its previous course, usually during flood events.
Backwater. The accumulation of water and slowing of flow behind (upstream of) an obstruction or constriction in a stream or floodplain.
Bank erosion. The carrying away or displacement of solids (sediment, soil, rock, and other particles) along a stream bank usually by the agents of streamflow or by downward or down-slope movement in response to gravity or by living organisms. Bank erosion is distinguished from weathering, which is the process of chemical or physical breakdown of the minerals in the rocks, although the two processes may be concurrent.
Baseline Report. A document that identifies and characterizes environmental issues in an area which may be impacted by a project. The Baseline Report is provided to designers and the project teams to aid them in developing project alternatives that avoid or minimize impacts to the environment.
Bed load. The portion of the total sediment load of a river or stream that is in intermittent contact with the streambed.
Bedrock. The native, contiguous, consolidated rock underlying the surface of the Earth. Above bedrock is usually an area of broken and weathered unconsolidated rock, usually called sediment. Occasionally bedrock is exposed on the surface indicating that sediment has been removed by streamflow or some other sediment transport process (e.g., landsliding).
Best Management Practice (BMP) – a physical, structural, and managerial practice that when used individually or in combination prevents or reduces pollution of water.
Bioavailable. Able to interact with an organism in a physiologically meaningful (e.g., tissue uptake, bioaccumulation in tissue, metabolism) way.
Biochemical oxygen demand. A measure of the amount of oxygen needed by aquatic organisms to break down solids and other readily degradable organic matter present in water. Also called biological oxygen demand.
1 9 3 W a t e r R e s o u r c e s S p e c i a l i s t M a n u a l
Biofiltration. The process of reducing pollutant concentrations in water by filtering the polluted water through biological materials, such as vegetation.
Bioinfiltration. The process of reducing pollutant concentrations in water by infiltrating the polluted water through grassy vegetation and soils into the ground. Biological oxygen demand. A measure of the quantity of oxygen used by microorganisms (e.g., aerobic bacteria) in the oxidation of organic matter. Frequently used as an indicator of water quality.
Bypass. An alternate flow path, such as an emergency overflow spillway, provided as part of a BMP. Designed to prevent facility failure when the primary mode of discharge is blocked.
Catch basin. A structure, typically concrete, that collects surface runoff through a metal grate. Catch basins typically include a sump where sediment can settle out.
Channel aggradation. The accumulation of sediment in a channel. It occurs when sediment supply exceeds the ability of a river to transport the sediment.
Channel incision. The deepening of the channel of a stream by erosion.
Channel migration. The movement of the horizontal position of a channel over time. Channel migration is often associated with the movement of a meander.
Chemical oxygen demand (COD). COD is a measure the amount of organic compounds in water. In natural surface waters, such as lakes and rivers, it indicates the presence of organic pollutants and is therefore a useful indicator of water quality. It is expressed in milligrams [of oxygen] per liter [of water, or other solution].
Chronic. Chronic effects refer to physiological effects observed following prolonged duration exposure to contaminants.
Colloidal. Remaining suspended without forming an ionic or dissolved solution.
Complexing. Bonding between a dissolved metal and another chemical (ligand) that keeps a dissolved metal in solution.
Composite sample. Composite samples involve a collection and mixing of multiple subsamples throughout a sampling period (usually an individual storm event) to provide water quality data that is more representative of the overall sampling period.
W a t e r R e s o u r c e s S p e c i a l i s t M a n u a l 194
Contributing impervious area (CIA). All impervious surface within the project limits, plus impervious surface owned or operated by ODOT outside the project limits, that drains to the project via direct flow or discrete conveyance.
Cut bank. An erosional feature of streams. Cut banks are found in abundance along mature or meandering streams, they are located on the outside of a stream bend, known as a meander. They are shaped much like a small cliff, and are formed by the erosion of soil as the stream collides with the river bank. As opposed to a point bar, it is an area of erosion rather than deposition.
Detention. The temporary storage of stormwater runoff in a facility (typically a pond, vault, or large pipe) which is used to control the peak discharge rates. The entire stormwater volume is ultimately released, but at a lower discharge rate.
Dispersion. Release of surface water and stormwater runoff in such a way that the flow spreads over a wide area and is located so as not to allow flow to concentrate. Dispersion areas should be gently sloped, vegetated, and with underlying soils suitable for infiltration.
Dissolution. Dissolving a solid substance into a solvent to yield a solution.
Dissolved Metals. Metals bound to another chemical (ligand) through complexing that are in solution.
Dissolved Oxygen. The amount of oxygen dissolved in water. This term also refers to a measure of the amount of oxygen available for biochemical activity in a waterbody, an indicator of water quality.
Dot grid method. A manual method of determining the area of an irregular shape, such as a delineated watershed. The user places a sheet of acetate or mylar, which has a series of dots, over the map area to be measured. The user counts the dots which fall within the area to be measured and multiplies by a factor to determine the area. The dot grid method is described in more detail at the following website: https://www.nh.nrcs.usda.gov/technical/Publications/Topowatershed.pdf
Durations. The cumulative amount of time that a receiving water experiences higher flows during and after storm events.
Emergency Overflow Spillway. An armored surface outlet from detention pond or other surface BMP to allow stormwater to discharge even in the event of outlet plugging or higher than design flows.
Erosion and sediment control (ESC) measures. Erosion control is the process of minimizing the amount of soil that runs off of a site (such as during
1 9 5 W a t e r R e s o u r c e s S p e c i a l i s t M a n u a l
construction). Sediment control is the process of retaining eroded soil on site, preventing damage to watercourses and infrastructure.
Eutrophication. A process whereby water bodies, such as lakes, estuaries, or slow-moving streams receive excess nutrients that stimulate excessive plant growth. Under eutrophic conditions, dissolved oxygen levels may be depleted by the respiring algae and by microorganisms that feed on dead algae, threatening salmon and other marine animals.
Evapotranspiration. The sum of evaporation (movement of water to the air through tree canopy interception, soil, and water bodies) and transpiration (water loss as vapor through plant activity).
Event Mean Concentration (EMC). Mean concentration of pollutants in runoff from a storm event.
Federal nexus. A project receiving federal funding (e.g., a highway construction project) is subject to federal laws and regulations. For example, ESA issues must be addressed either in a no-effect memorandum or in a BA.
Filter strip. A grassy area with gentle slopes that treats stormwater runoff from adjacent paved areas before it can concentrate into a discrete channel.
Filtration. Physical trapping of suspended pollutants.
Fish screen. A screen, bar, rack, or other barrier, including related improvements necessary to ensure its effective operation and to provide adequate protection for fish populations present at a water diversion.
Floodplain. A floodplain is an area adjacent to a river or stream channel that is usually fairly flat and experiences occasional or periodic inundation during floods. The floodplain includes the floodway and other areas sometimes referred to as the flood fringe, which are inundated during floods but do not contribute significantly to flood flow conveyance and do not experience significant flow velocities.
Floodway. A floodway is an area that includes that channel of a river, stream, or other watercourse and adjacent lands that conveys floodwaters. The floodway is composed of the active river channel and those parts of the floodplain which experience flows of significant velocity and convey flow during flood events. The floodway concept has regulatory significance, imposing boundaries on developable area.
Flow concentration. The result of large flows in association with developed (impervious surface) areas, where infiltration is prevented. In these areas, flow
W a t e r R e s o u r c e s S p e c i a l i s t M a n u a l 196
becomes concentrated and channelized much more quickly than in undeveloped settings.
Flow regime. Generally referring to type of flow present in a stream. This has impacts on the position of hydraulic control in a stream. Fast moving, or supercritical flows, are controlled from upstream conditions; while slow moving, or subcritical flows, are controlled from downstream conditions.
Flow-through. Facilities such as grass swales that convey stormwater, or store it temporarily, prior to release through surface runoff or enclosed (piped) drainage systems. Flow-through facilities are in contrast to infiltration facilities.
Grab sample. A single sample of stormwater collected for analysis. Grab samples provide a snapshot of water quality conditions, and may be useful if collected during the rising limb or at the peak of a storm hydrograph when higher concentrations might be expected.
Gutter. A depressed concrete channel that conveys stormwater along the edge of a street.
Hardness. Water hardness measures the presence of multivalent cations dissolved in water; particularly calcium and magnesium divalent cations (ions with a charge of +2).
Headcut. An active eroding bank or channel that moves further upstream as it continues to erode material.
Hydraulic gradient. Difference in hydraulic head between two or more hydraulic head measurements divided by the length of the flow path.
Hydraulic head. Measure of water pressure above a datum. Typically expressed as an elevation, in feet.
Hydrologic soil groups. A soil characteristic classification system defined by the Natural Resources Conservation Service in which a soil may be categorized into one of four soil groups (A, B, C, or D) based on infiltration rate and other properties.
Impervious surface. A hard surface area that either prevents or slows the entry of water into the ground as compared with natural conditions (prior to development), and from which water runs off at an increased rate of flow or in increased volumes. Common impervious surfaces include but are not limited to rooftops, walkways, roads, and other concrete or asphalt surfaces.
Incised, incision. See channel incision.
1 9 7 W a t e r R e s o u r c e s S p e c i a l i s t M a n u a l
Inert. Not chemically active. Inert filtration media would rely only on physical properties, rather than chemical treatment mechanisms such as sorption, for pollutant removal.
Infiltration rate. The rate, usually expressed in inches per hour, at which water moves downward (percolates) through the soil profile.
Infiltration. The downward movement of rainwater or surface water through the soil.
Inlet. A structure, typically concrete, that collects surface runoff through a metal grate. Inlets may include a sump where sediment can settle out.
Inundate. To cover with water, usually associated with flooding.
Jurisdictional wetland. A wetland that is connected to a Water of the United States (WOUS) using the Corps definition of WOUS (Section 404 Clean Water Act).
Large woody debris (LWD). The accumulation of trees and large branches that have fallen into a stream. LWD serves many purposes in a stream that are vital to life history of many native species of fish, plants and animals.
Levee. A natural or artificial slope or wall, usually earthen and often parallel to the course of a stream, to protect adjacent areas (usually development) from flooding.
Log jams. These features are large accumulations of large woody debris (LWD) in particular places along a stream bank or in the middle of a stream. Log jams have traditionally been removed from Oregon streams. However, these features have been shown to provide key hydraulic and geomorphic function necessary for a healthy stream ecosystem.
Low Impact Development (LID). LID is a stormwater management design approach that attempts to mimic a site’s predevelopment hydrology by using design practices and techniques that reduce impervious areas, and preserve native vegetation and soils. LID stormwater management techniques capture, filter, store, evaporate and infiltrate runoff near its source.
Meander(ing). A bend in a stream, also known as an oxbow loop, or simply an oxbow. A stream of any volume may assume a meandering course, alternatively eroding sediments from the outside of a bend and depositing them on the inside. The result is a “snaking” pattern as the stream meanders back and forth across its down-valley axis.
W a t e r R e s o u r c e s S p e c i a l i s t M a n u a l 198
Olfactory. Related to the sense of smell.
Outfall. Any location where concentrated stormwater runoff leaves the right ROW as concentrated runoff. Outfalls may discharge to surface waters or groundwater.
Outlet protection. A protective barrier of rock, erosion control blankets, vegetation, or sod constructed at a conveyance outlet.
Overflow Spillway. See Emergency Overflow Spillway.
Particulates. A minute separate particle, such as a granular substance or powder.
Peak flow. Maximum discharge of stormwater associated with a particular design storm, e.g. 2-year, 24-hour design storm.
Pipe cover. Vertical separation between pavement subgrade and the top of a pipe.
Planimeter. An instrument that measures the area of a plane figure as a mechanically coupled pointer traverses the perimeter of the figure.
Plug flow. A laminar flow regime where water flows as if in a full pipe, the unit that enters first, exits first and there is no mixing between different units of water, designing for this type of flow prevents “short circuiting”.
Point bar. A depositional feature of streams. Point bars are found in abundance in mature or meandering streams. They are crescent-shaped and located on the inside of a stream bend.
Pollutant load. Mass of a pollutant that a waterbody receives.
Polycyclic aromatic hydrocarbons (PAHs). PAHs are hydrocarbon compounds with multiple benzene rings. PAHs are typical components of asphalts, fuels, oils, and greases.
Pour point. The point at which smaller stream or river basins meet larger stream or river basins.
Pretreatment. The removal of material such as solids, grit, and grease from flows to improve treatability prior to biological or physical treatment processes; may include screening, settling, oil/water separation, or application of a basic treatment BMP prior to infiltration.
1 9 9 W a t e r R e s o u r c e s S p e c i a l i s t M a n u a l
Primary producer. Organisms that convert sunlight (or chemical energy) and inorganic compounds into organic material. Primary producers in aquatic environments include algae and phytoplankton.
Quality Assurance Project Plan (QAPP). A Quality Assurance Project Plan documents the planning, implementation, and assessment procedures for a particular project, and any specific quality assurance and quality control activities. It integrates all the technical and quality aspects of the project to provide a "blueprint" for obtaining the type and quality of environmental data and information needed for a specific decision or use. All work performed or funded by EPA that involves the acquisition of environmental data must have an approved Quality Assurance Project Plan.
Release rate. The design peak discharge rate, typically expressed in cubic feet per second (cfs) from a detention facility. When detention is required, design standards often stipulate that post development release rates must match pre-pre-development peak discharge rates.
Riparian. Having to do with the banks of a stream, as in riparian vegetation; i.e., vegetation along the banks of a stream.
Runoff. Rainwater or snowmelt that directly leaves an area as surface drainage.
Salinity. The dissolved salts content of a body of water.
Sand filter. A manmade depression or basin with a layer of sand that treats stormwater as it percolates through the sand and is discharged via a central collector pipe.
Saturated hydraulic conductivity. The rate of movement of water through a saturated porous medium.
Sediment supply. The amount of sediment made available to a stream from the surrounding landscape and its runoff.
Sediment transport. The movement of solid particles ("sediments") due to the movement of the fluid in which they are immersed. In streams, the particles are rocks (sand, gravel, boulders, etc.) or clay, and the fluid is water.
Sheet flow. Runoff that flows over the ground surface as a thin, even layer, not concentrated in a channel.
Short Circuiting - the passage of runoff through a BMP in less than the design treatment time.
W a t e r R e s o u r c e s S p e c i a l i s t M a n u a l 200
Side-channel inundation. Occurs when stream is in flood and flow is concentrated in channels that are normally shallow and stagnant or dry.
Soil amendments. Materials that improve soil fertility for establishing vegetation or permeability for infiltrating runoff.
Soil texture. The proportion of sand, silt and clay in a soil. Many properties of soil are heavily dependent on texture including infiltration rate, resistance to erosion, and water-holding capacity.
Sorptive. A substance capable of taking up water or dissolved compounds.
Statewide Transportation Improvement Program (STIP). The STIP is Oregon’s four-year transportation capital improvement program. It is the document that identifies the funding for, and scheduling of, transportation projects and programs. It includes projects on the federal, state, city and county transportation systems, multimodal projects (highway, passenger rail, freight, public transit, bicycle and pedestrian), and projects in the National Parks, National Forests and Indian tribal lands. From https://www.oregon.gov/ODOT/HWY/GEOENVIRONMENTAL/docs/Env_Proce dures_Manual_Vol-1.pdf, page 18 (need to cite or reword)
Stormwater Management Plan. A document that describes the condition of receiving waters including water quality issues, channel conditions, watershed size and characteristics, and climate. It also describes the proposed drainage and stormwater management systems and estimates project impacts.
Stormwater treatment BMP. A BMP specifically designed for pollutant removal.
Swale. A wide natural channel with relatively gentle side slopes, generally with flow depths less than 1 foot, used to filter runoff.
Take. As defined in the ESA (Section 3), "…to harass, harm, pursue, hunt, shoot, wound, kill, trap, capture, or collect, or to attempt to engage in any such conduct" with respect to federally listed endangered species of wildlife. Federal regulations provide the opportunity to apply take prohibitions to threatened species as would ordinarily only apply to endangered species [50 CFR 17.31(a)]. Take of a listed species includes modifying the habitat of a listed species in such a way that interferes with essential behavioral patterns including breeding, feeding or sheltering.
Talus. Broken rock that appears at the bottom of crags, mountain cliffs, bluffs or valley shoulders, forming a fixed slope of rubble.
2 0 1 W a t e r R e s o u r c e s S p e c i a l i s t M a n u a l
Tills. An unstratified, unconsolidated mass of boulders, pebbles, sand, and mud deposited by the movement or melting of a glacier.
Total Dissolved Solids. The dissolved matter found in water comprised of minerals salts and small amount of other inorganic and organic substances.
Total Kjeldahl Nitrogen. The sum of organic nitrogen and ammonia in a water body, measured in milligrams per liter (mg/L). High measurements typically result from sewage and manure discharges to water bodies.
Total Maximum Daily Load (TMDL) - the maximum amount of a pollutant that can be discharged into a water body from all sources (point and non-point) and still maintain water quality standards. Under Clean Water Act section 303(d), TMDLs must be developed for all water bodies that do not meet water quality standards after application of technology-based controls.
Total Nitrogen. A measure of all forms of nitrogen (e.g., nitrate, nitrite, ammonia-N, and organic forms) that are found in a water sample.
Total Phosphorus - the total concentration of phosphorus found in the water. Phosphorus is a nutrient and acts as a fertilizer, increasing the growth of plant life such as algae.
Total Suspended Solids (TSS) - solids suspended in water including a wide variety of material such as silt and decaying plant matter.
Toxicity. Adverse effects on living organisms resulting from chemical exposure.
Treatment train or system. The combination of several treatment facilities with unique unit processes applied in a linear progression (also called “in series”).
Turbidity. The cloudiness or haziness of a fluid caused by individual particles (suspended solids)) that are generally invisible to the naked eye. The measurement of turbidity is a key test of water quality.
Underdrain. Plastic pipes with holes drilled through the top, installed on the bottom of an infiltration facility, that are used to collect and remove excess runoff.
Underground Injection Control (UIC) - A UIC is any system, structure, or activity that is created to place fluid below the ground or sub-surface. Common stormwater UICs or activities include, but are not limited to sumps, infiltration galleries, drywells, trench drains, and drill holes.
W a t e r R e s o u r c e s S p e c i a l i s t M a n u a l 202
Unit Operations. The treatment facilities in which the unit process occurs (i.e., wet pond or swale).
Unit Process. The specific mechanism of pollutant removal (i.e., sedimentation or vegetative uptake).
Vegetated filter strip. A facility designed to provide stormwater treatment of conventional pollutants (but not nutrients) through the process of biofiltration.
Vegetative (or Biological) Uptake. The processes by which nutrients and other dissolved chemicals are taken up by plants and algae. Chemicals may be metabolized or stored in plant tissues.
Water Resources Impact Assessment. An evaluation of likely project impacts on pollutant concentrations and loadings in receiving waters, with and without treatment measures.
Waters of the state. Under Oregon´s removal-fill Law (ORS 196.795-990), defined as "natural waterways including all tidal and nontidal bays, intermittent streams, constantly flowing streams, lakes, wetlands and other bodies of water in this state, navigable and nonnavigable, including that portion of the Pacific Ocean that is in the boundaries of this state.
Watershed. A geographic region within which water drains into a particular river, stream, or body of water.
203 W a t e r R e s o u r c e s S p e c i a l i s t M a n u a l
C HA P T E R 13 - A B B R E V IA T IONS A ND A C R ONY MS
ADT Average daily traffic API Area of Potential Impact ASCE American Society of Civil Engineers BA Biological Assessment BMP Best management practice BO Biological Opinion CIA Contributing Impervious Area CMZ Channel Migration Zone Corps US Army Corps of Engineers COV Coefficient of Variation CRAT Calculated concentration ratio CWA Clean Water Act DEQ Oregon Department of Environmental
Quality DSL Oregon Department of State Lands EA Environmental Assessment EIS Environmental Impact Statement EPA US Environmental Protection Agency EPM Environmental project manager
(EPM) ESA Endangered Species Act ESC Erosion and sediment control FBFM Flood boundary and floodway map FEMA Federal Emergency Management Act FHWA Federal Highways Administration FIRM Flood insurance rate map GIS geographic information system HI-RUN Highway Runoff Dilution and
Loading model HRBD Highway-runoff database JPA Join Permit Application Lidar light detection and ranging LWD Large woody debris NOAA National Oceanic and Atmospheric
Administration NPDES National Pollutant Discharge
Elimination System NRCS Natural Resources Conservation
Service
W a t e r R e s o u r c e s S p e c i a l i s t M a n u a l 204
OAR Oregon Administrative Rule OBDP Oregon Bridge Delivery Program ODFW Oregon Department of Fish and
Wildlife ODOT Oregon Department of Transportation OHWM Ordinary High Water Mark OLCD Oregon Department of Land
Conservation and Development OPRD Oregon Parks and Recreation
Department OSU Oregon State University OWEB Oregon Watershed Enhancement
Board OWRD Oregon Water Resources Department PSP Puget Sound Partnership REC Regional Environmental Coordinator SDWA Safe drinking water act SELDM Stochastic Empirical Loading and
Dilution Model SHPO Oregon State Historic Preservation
Office SLOPES Standard Local Operating Procedures
for Endangered Species STIP Statewide transportation
improvement program SWMP Stormwater Management Plan T&E Threatened and endangered TDA Threshold discharge area TMDL Total maximum daily load TSS Total suspended solids UIC Underground Injection Control USDA US Department of Agriculture USFS US Forest Service USFWS US Fish and Wildlife Service USGS US Geological Survey WRIA Water Resources Impact Assessment WRS Water Resources Specialist WSDOT Washington State Department of
Transportation

205 W a t e r R e s o u r c e s S p e c i a l i s t M a n u a l
C HA P T E R 14 - R E F E R E NC E S
All photographs from Herrera Environmental Consultants unless noted otherwise. Photograph locations as noted.
ASLA. 2006. ASLA 2006 Professional Awards. Article downloaded on October 8, 2008, from the website: https://www.asla.org/awards/2006/06winners/341.html. American Society of Landscape Architects.
Azous, A.L., and Horner, R.R. (Eds.). 19972001. Wetlands and Urbanization, Program. Implications for the Future Lewis Publishers. Boca Raton, Florida.
Baldwin, D.H., Sandahl, J.F., Labenia, J.S., and Scholz, N.L. 2003. Sublethal effects of copper on coho salmon: impacts on nonoverlapping receptor pathways in the peripheral olfactory nervous system. Environmental Toxicity and Chemistry. 22(10): 2266-2274.
Berbee, R.P.M., Rijs, G., Brouwer, R. de and Velzen, L.van. 1999. Characterization and treatment of runoff from highways in the Netherlands. Water Environment Research, 71(2), 183-190.
Bunte, Kristin and Abt, Steven R. 2001. Sampling surface and subsurface particle-size distributions in wadable gravel- and cobble-bed streams for analysis in sediment transport, hydraulics, and streambed monitoring. U.S. Department of Agriculture. Forest Service. Rocky Mountain Research Station. General Technical Report RMRS-GTR-74. May 2001. https://www.fs.fed.us/rm/pubs/rmrs_gtr74.html
Chambers, D.B., and Leiker, T.J. 2006. A Reconnaissance for Emerging Contaminants in the South Branch Potomac River, Cacapon River, and Williams River Basins, West Virginia, April-October 2004 [Online]. https://pubs/usgs.gov/of/2006/1393.
CONTECH. 2006. Northwest City Becomes Model for Improving Water Quality. CONTECH Stormwater Solutions, Inc. Brochure obtained August 13, 2008, from company website: <https://www.contech-cpi.com/media/assets/asset/file_name/124/MK-6001_Bellingham.pdf>.
Cooper, R.M. 2005. Estimation of peak discharges for rural, unregulated streams in Western Oregon: U.S. Geological Survey Scientific Investigations Report 2005–5116.
CWP. 2000. National Pollutant Removal Performance Database for Stormwater Treatment Practices, 2nd edition. Center for Watershed Protection.
Debo, Thomas N. and Andrew J. Reese. Municipal Stormwater Management, 2nd ed. Lewis Publishers, CRC Press LLC. Boca Raton, Florida.
W a t e r R e s o u r c e s S p e c i a l i s t M a n u a l 206
DEQ. 2008. Underground Injection Control (UIC) Program. Agency website accessed August 13, 2008: <https://www.deq.state.or.us/wq/uic/uic.htm>. Oregon Department of Environmental Quality.
Djokic, Dean and Zichuan Ye. Undated. DEM Preprocessing for Efficient Watershed Delineation. ESRI, Redlands, California. Obtained August 13, 2008, from Internet at: https://gis.esri.com/library/userconf/proc99/proceed/papers/pap676/p676.htm.
Driscoll, E.D., P.E. Shelley, and E.W. Strecker. 1990. Pollutant Loadings and Impacts from Highway Stormwater Runoff. Report Number FHWA-RD-88-006. Prepared for Federal Highway Administration, McLean, Virginia by Woodward-Clyde Consultants, Oakland, California.
DSL. 2004. Just the Facts… About Wetland Functions and Assessment [Online]. https://www.oregon.gov/DSL/WETLAND/docs/fact5.pdf. Oregon Department of State Lands.
EPA. 1993. Natural Wetlands and Urban Stormwater: Potential Impacts and Management [Online]. https://www.epa.gov/owow/wetlands/pdf/stormwat.pdf.
EPA. 2001. Functions and Values of Wetlands [Online]. https://www.epa.gov/owow/wetlands/pdf/fun_val.pdf.
EPA. 2006a. Wetlands – Economics [Online]. https://www.epa.gov/owow/
EPA. 2006b. Wetlands – Water Quality and Hydrology [Online]. https://www.epa.gov/owow/wetlands/wqhydrology.html.
FEMA, 2010. Floodway. Last updated January 24, 2010. Federal Emergency Management Agency. Obtained August 5, 2010 from agency website: <https://www.fema.gov/plan/prevent/floodplain/nfipkeywords/floodway.shtm>.
FHWA. 1990. Pollutant Loading and Impacts from Highway Stormwater Runoff. Publication FHWA-RD-88-006. Federal Highway Administration Research, Development, and Technology, Turner-Fairbank Highway Research Center, Federal Highway Administration, McLean, Virginia.
FHWA. 2001. Evaluating Scour at Bridges, Fourth Edition. Publication No. FHWA NHI 01-001.
Granato, Gregory, September 10, 2008. Personal communication (email with attached flier sent to Mary Larkin, Herrera Environmental Consultants), Hydrologist, U.S. Geological Survey, MA-RI Science Center, Northborough, Massachusetts.
Heath, Alan G. 1995. Water Pollution and Fish Physiology. CRC Press, Inc., Boca Raton, Florida.
2 0 7 W a t e r R e s o u r c e s S p e c i a l i s t M a n u a l
Hinman, Curtis. June 18, 2008. Data from a 1995 FHWA study on SR 520 near Seattle, Washington included in a PowerPoint presentation at a University of Washington Engineering Professional Program course entitled “Permeable Pavements.”
Islam, MD. Rashedul. Undated. A Review on Watershed Delineation Using GIS Tools. Winnipeg, Canada. Obtained August 13, 2008, from Internet at: https://www.wrrc.dpri.kyoto-u.ac.jp/~aphw/APHW2004/proceedings/OHS/56-OHS-A558/56-OHS-A558.pdf.
Kerwin, J. and T.S. Nelson, editors. 2000. Habitat Limiting Factors and Reconnaissance Assessment Report, Green/Duwamish and Central Puget Sound Watersheds (WRIA 9 and Vashon Island). Washington State Conservation Commission and the King County Department of Natural Resources, Seattle, Washington (December 2000). 770 p.
Lane, E.W. 1955. Design of Stable Channels. Transactions of the American Society of Civil Engineers, Volume 120, pages 1-34.
Leopold, L.B., and Maddock, T. 1953. The Hydraulic Geometry of Stream Channels and some Physiographic Implications. U.S. Geological Survey Professional Paper, 252.
Mahler, B.J., P.C. van Metre, T.J. Bashara, J.T. Wilson, and D.A. Johns. 2005. Parking Lot Sealcoat: An Unrecognized Source of Urban Polycyclic Aromatic Hydrocarbons. Environ. Sci. Technol. 39, 5560-5566.
McIntyre, J.K., Baldwin, D.H., Meador, J.P., Scholz, N.L. 2008. Chemosensory Deprivation in Juvenile Coho Salmon Exposed to Dissolved Copper under Varying Water Chemistry Conditions
Minton, G. 2005. Stormwater Treatment: Biological, Chemical, and Engineering Principles. Sheridan Books, Inc., Chelsea, Michigan.
Montgomery, D.R. and Buffington, J.R. 1993. Channel Classification, prediction of channel response, and assessment of channel condition. Report TFW-SI-110-93-002 prepared for the SHAMW committee of the Washington State Timber/Fish/Wildlife Agreement
Montgomery, D.R. and Buffington, J.R. 1997. Channel-reach morphology in mountain drainage basins. GSA Bulletin. V. 109; no. 5; p596-611
NCHRP. 2004. Handbook for Predicting Stream Meander Migration. Report 533. National Cooperative Highway Research Program Transportation Research Board. Washington, D.C.
Niyogi, S., P. Couture, G. Pyle, D.G. McDonald, and C.M. Wood. 2004. Acute cadmium biotic ligand model characteristics of laboratory-reared and wild yellow perch (Perca flavescens) relative to rainbow trout (Oncorhynchus mykiss). Canadian Journal of Fisheries and Aquatic Sciences 61(6):942-953.
W a t e r R e s o u r c e s S p e c i a l i s t M a n u a l 208
Oregon Bridge Delivery Partners (OBDP). Undated. A Guide to Environmental Permitting Requirements for OBDP Projects. Spreadsheet obtained November 3, 2008, from OBDT website: https://www.obdp.org/files/partner/environmental/Guide%20to%20Permitting%20Requirements. xls.
ODOT. 2003. Highway Design Manual. Oregon Department of Transportation, Preliminary Design Unit, Salem, Oregon.
ODOT. 2005. Hydraulics Manual. Oregon Department of Transportation, Geo-Environmental Section, Engineering and Asset Management Unit. Available online at: <https://www.oregon.gov/ODOT/HWY/GEOENVIRONMENTAL/hyd_manual_info.shtml#Hydr aulics_Manual_Parts_1___2>.
ODOT. 2007. OTIA III State Bridge Delivery Program. Web page accessed on August 1, 2009, by Mary Larkin, Herrera Environmental Consultants from agency website: < https://egov.oregon.gov/ODOT/HWY/OTIA/odotbridgesee_regs.shtml>. Oregon Department of Transportation. Updated February 4, 2007.
ODOT. 2008. ODOT Traffic Manual. https://www.oregon.gov/ODOT/HWY/TRAFFIC-ROADWAY/docs/pdf/Traffic_Manual_08.pdf
Oregon Health Division and Department of Environmental Quality. 1994. Wellhead Protection Fact Sheet [Online]. https://www.oregon.gov/DHS/ph/dwp/docs/gwater/wellhead.pdf
Pacific EcoRisk. 2007. Potential Effects of Highway Runoff on Priority Fish Species in Western Washington. Prepared for Washington Department of Transportation, Olympia, Washington by Pacific EcoRisk, December 2007.
Paul, M.J. and Meyer, J.L. 2001. Streams in the Urban Landscape. Annu. Rev. Ecol. Syst. 32:333–65
Portland Environmental Services. 2008. City of Portland Stormwater Management Manual. Revision 4.
Puent, Sally. July 18, 2007. Personal communication (letter to Colonel O’Donovan, US Army Corps of Engineers regarding 401 Water Quality Certification for 2007 Nationwide Permit Program). Obtained online from: < https://www.aocweb.org/em/Portals/2/DEQ_wq_cert_2007NWP.pdf>. Oregon Department of Environmental Quality. Water Quality Manager, Northwest Region.
Rapp and Abbe. 2003. A Framework for Delineating Channel Migration Zones. Ecology Publication Number 03-06-027. Available online at: https://www.ecy.wa.gov/biblio/0306027.html. Washington State Department of Ecology. November 2003.
2 0 9 W a t e r R e s o u r c e s S p e c i a l i s t M a n u a l
Rosgen, D.L. 1994. A Classification of Natural Rivers. Catena. 22. Elsevier Science, Amsterdam
Rosgen, D.L. 1996. Applied River Morphology. Wildland Hydrology, Pagosa Springs, CO.
Sprague, J.B. 1964. Avoidance of copper-zinc solutions by young salmon in the laboratory. Journal water Pollution Control Federation 36: 990-1004.
Sullivan, K., Martin, D.J., Cardwell, R.D., Toll, J.E., Duke, S. 2000. An Analysis of the Effects of Temperature on Salmonids of the Pacific Northwest with Implications for Selecting Temperature Criteria. Sustainable Ecosystems Institute, Portland, Oregon. UNHSC. Undated. Porous Asphalt. Brochure downloaded from UNHSC website by Mary Larkin, Herrera Environmental Consultants, on October 24, 2008: https://www.unh.edu/erg/cstev/fact_sheets/pa_fact_sheet_08.pdf. University of New Hampshire Stormwater Center.
U.S. Army Corps of Engineers, 2006. Recognizing Wetlands: An Informational Pamphlet [Online]. https://www.usace.army.mil/cw/cecwo/reg/rw-bro.htm.
U.S. Army Corps of Engineers. 1987. Corps of Engineers Wetlands Delineation Manual, Technical Report Y-87-1 [Online]. https://www.usace.army.mil/cw/cecwo/reg/wlman87.pdf. U.S. Army Corps of Engineers.
USDA 1987. Oregon Engineering Handbook Hydrology Guide. Publication Number 210-VI-ORHG. United States Department of Agriculture Soil Conservation Service, Portland, Oregon.
U.S. Fish and Wildlife Service (USFWS). 1997. National List of Vascular Plant Species that Occur in Wetlands: 1996 National Summary [Online]. March 3, 1997. https://www.fws.gov/nwi/bha/downloads/1996/national.pdf.
USGS. 1983. Magnitude and Frequency of Floods in Eastern Oregon. Open-file Report 82-4078. U.S. Geological Survey.
USGS. 2006. Western Wetland Flora – field Guide to Plant Species, Species List and Identification Key. Obtained at agency website: <https://www.npwrc.usgs.gov/resource/plants/florawe/species.htm>.
Vepraskas, M.J., He, X., Lindbo, D.L., and Skaggs, R.W. 2004. Calibrating hydric soil field indicators to long-term wetland hydrology. Soil Sci. Soc. Am. J. 68:1461-1469.
Walsh, C.J, Et al. 2005. The urban stream syndrome: current knowledge and the search for a cure. J. N. Am. Benthol. Soc., 2005, 24(3):706–723.
WDFW. 2009. Compiled White Papers for Hydraulic Project Approval HCP. Obtained from agency website on August 5, 2010: https://wdfw.wa.gov/hcp/hpa_publications/white_papers/. Washington Department of Fish and Wildlife.
W a t e r R e s o u r c e s S p e c i a l i s t M a n u a l 210
WSDOT. 2005. 2005 NPDES Progress Report for the Cedar-Green, Island Snohomish, and South Puget Sound Water Quality Management Areas. Washington State Department of Transportation, Olympia, Washington.
WSDOT. 2008a. BA Writers Guidance for Preparing the Stormwater Section of Biological Assessments. Revised January 10, 2008. Washington State Department of Transportation, Olympia, Washington.
WSDOT. 2008b. Highway Runoff Manual. Publication Number 31-16.01. Washington State Department of Transportation, Environmental and Engineering Programs Design Office.

211 W a t e r R e s o u r c e s S p e c i a l i s t M a n u a l
C HA P T E R 15 - INDE X 2-year Flood Elevation, 78, 100 Abstraction, 49 Action Area, 13, 23, 36, 37, 38, 69, 114,
123, 124, 134, 135, 136, 189 Acute Effects, 72, 135, 189, 205 Adsorption, 104, 146, 157, 189 Advance Plans, 26, 27 Aggradation, 81, 84, 85, 89, 90, 191 Amended Soil Vegetated BMPs, 146, 162,
168 Area of Potential Impact
API, 14, 113, 114, 128, 189, 201 Average Annual Discharge, 116 Avulsion, 83, 190 Bacteria, 63, 67, 75, 145, 146, 191 Bacterial Degradation, 146 Bank Erosion, 73, 80, 82, 83, 84, 85, 86, 87,
122, 190 Bankfull, 48, 49, 78, 83, 99, 100, 101, 117,
121 Base Flow, 52, 69, 77, 79 Baseline Report, 8, 14, 84, 113, 116, 118,
123, 128, 190, 213 Basin Auto-delineation, 125 Biological Treatment Processes, 146 Biological Uptake, 69, 146 Bioretention, 146, 147, 148, 154, 155, 182,
183, 185 Bioslope, 147, 148, 152, 153, 182, 183 Calculating Discharges, 53 Channel Bank Overtopping Stage, 101 Channel Incision, 80, 81, 85, 87, 89, 191,
194 Channel Migration Zone
CMZ, 79, 83, 84, 122, 201, 206, 215 Channel Response, 78, 79, 81, 82, 205 Chemical and Biological Oxygen Demand
COD, BOD, 63, 66, 191 Chemical Precipitation, 145 Chronic Effects, 71, 72, 191 Clean Water Act
National Pollutant Discharge Elimination System, NPDES, 29, 33, 34, 135, 201, 208
Section 401 Water Quality Certification (DEQ), 9, 10, 21, 23, 24, 27, 29, 30, 31, 32, 35, 43, 112
Section 404, 3, 5, 10, 29, 30, 31, 32, 34, 35, 42, 111, 195
Clear Zone, 181, 182 Climate, 44, 45, 48, 54, 60, 67, 78, 117, 143,
198 Coastal Zone Certification, 41, 213 Complexing, 146, 191, 192 Conceptual Stormwater Management Plan,
9, 21 Continuous Flow Model, 53, 55 Contributing Impervious Area
CIA, 2, 3, 18, 19, 21, 42, 46, 123, 128, 129, 130, 131, 192, 201
Conveyance, 3, 5, 15, 30, 46, 50, 53, 54, 56, 57, 87, 90, 95, 120, 124, 128, 129, 153, 171, 192, 193, 196
Denitrification, 146 Density Separation, 145, 150, 152, 154, 156,
161, 163, 165, 167, 170, 171, 172, 174, 176, 177, 179
Design Acceptance, 7, 8 Design Storms, 46, 48, 53, 60 Detention, 59, 61, 172, 192 Dispersion, 60, 147, 161, 184, 192 Endangered Species Act
ESA, 13, 23, 29, 30, 36, 38, 42, 69, 112, 114, 124, 134, 135, 136, 141, 189, 193, 198, 201, 213
Environmental Classification, 13 Environmental Project Manager
EPM, 5, 22, 201 Evapotranspiration, 49, 79, 193 Extended Dry Detention Ponds, 172 FHWA Driscoll Method, 116, 133, 134,
135, 141, 142
W a t e r R e s o u r c e s S p e c i a l i s t M a n u a l 212
Filter Strip, 52, 57, 58, 146, 147, 148, 165, 166, 169, 171, 182, 183, 184, 193, 200
Filtration, 60, 104, 145, 146, 148, 150, 152, 154, 156, 157, 158, 161, 163, 165, 167, 170, 171, 172, 174, 176, 177, 178, 179, 180, 186, 189, 193, 195
First Flush, 68, 69 Flood Frequencies, 117 Flood Frequency, 78, 118, 120, 121 Flood Prone Area, 83, 121 Flood Routing, 58, 61 Floodplain, 14, 29, 30, 34, 35, 80, 81, 82,
83, 85, 87, 89, 95, 101, 120, 121, 122, 190, 193, 204, 213, 214
Floodway, 14, 30, 35, 81, 120, 121, 193, 201, 204, 213, 214
Flow Control, 2, 3, 4, 5, 9, 18, 19, 27, 42, 46, 48, 53, 55, 56, 58, 60, 101, 112, 115, 117, 119, 136, 141, 148, 157, 158
Functional Floodplain, 81, 122 Grass Swale, 163, 164, 169, 194 Ground-Truthing, 124, 128 Groundwater, 33, 49, 56, 58, 60, 61, 66, 77,
78, 79, 89, 104, 108, 114, 115, 118, 119, 120, 146, 148, 149, 150, 155, 182, 196, 213, 214
Hardness, 67, 70, 71, 194 Highway Hydrology, 44 Highway Runoff Dilution and Loading
Model HI-RUN, 133, 136, 141, 201
Hydraulics Engineer, 4, 5, 14, 26, 53, 101, 123, 124, 129, 131
Hydric Soil, 105, 107, 109, 110, 207 Hydrograph, 51, 52, 53, 55, 58, 75, 79, 194 Hydrologic Group, 149 Hydrologic Unit Code
HUC, 128 Incidental Take Permit, 39 Infiltration, 15, 16, 17, 31, 33, 49, 52, 54,
55, 57, 58, 60, 61, 79, 115, 119, 137, 142, 146, 147, 148, 149, 150, 151, 152, 154, 155, 156, 157, 158, 159, 160, 161, 162, 163, 164, 165, 167, 169, 170, 171, 172, 174, 176, 177, 179, 180, 181, 182, 183,
184, 186, 192, 193, 194, 195, 196, 198, 199
Infiltration BMPs, 17, 33, 119, 146, 147, 148, 162, 169, 182
Infiltration Pond, 150 Infiltration Rate, 149 In-water Timing, 40 Joint Permit Application
JPA, 42, 214 Lane Relationship, 79, 82 Limited License, 42 Low Impact Development Design
LID, 1, 16, 19, 52, 53, 58, 61, 144, 147, 155, 157, 180, 181, 182, 183, 184, 185, 195, 213
Maintenance, 2, 5, 15, 32, 33, 35, 42, 56, 64, 65, 66, 89, 90, 145, 150, 151, 152, 153, 154, 155, 156, 159, 160, 161, 162, 163, 164, 165, 166, 167, 168, 169, 170, 171, 172, 173, 174, 175, 176, 177, 178, 179, 186, 187
Media Filter, 145, 153, 169, 177, 178, 187 Metals, 63, 65, 67, 71, 76, 111, 146, 147,
150, 152, 153, 154, 156, 157, 161, 163, 165, 167, 170, 171, 172, 174, 176, 177, 178, 179, 181, 192 Toxicity, 67, 68, 70, 71, 146, 199, 203
Montgomery and Buffington, 98, 99 Native Migratory Fish, 39, 40, 189 Nitrification, 146 No-Rise Certification, 30, 35, 121 Nutrients, 63, 65, 66, 72, 73, 89, 97, 111,
114, 147, 148, 150, 152, 154, 156, 161, 163, 165, 167, 170, 171, 172, 174, 176, 177, 179, 186, 193, 199, 200
Ocean Shore Alteration Permit, 32, 41 Oil Control Facilities, 179 Ordinary High Water Mark
OHWM, 99, 100, 202 Organic Pollutants, 72, 177, 191 Particle-Size Distribution, 101, 203, 215 Permeability, 49, 149, 198 Permeable Pavement, 147, 148, 156, 157,
158, 159, 160, 181, 183, 185, 205 pH, 63, 67, 70, 71
2 1 3 W a t e r R e s o u r c e s S p e c i a l i s t M a n u a l
Polycyclic Aromatic Hydrocarbons PAH, 63, 66, 72, 150, 152, 154, 156, 157,
158, 161, 163, 165, 167, 170, 171, 172, 174, 176, 177, 179, 196, 205
Prospectus, Part 3, 8, 13, 114, 190 Rainfall Intensity, 46, 54 Rational Method, 53, 54, 55 Recurrence Interval, 44, 45, 48, 53, 54, 78,
100, 118, 120, 213 Regional Environmental Coordinator
REC, 5, 8, 13, 14, 20, 38, 202 Regression Equations, 116, 117 Removal-Fill Permit, 6, 30, 31, 34, 42, 112 Rivers and Harbors Act, 35, 42, 111 Rosgen, 83, 98, 99, 100, 101, 121, 207 Runoff, 2, 3, 8, 15, 16, 18, 20, 22, 23, 24,
29, 30, 33, 38, 44, 48, 49, 50, 51, 52, 54, 55, 56, 57, 58, 61, 63, 64, 65, 66, 67, 68, 69, 71, 72, 73, 74, 75, 76, 77, 78, 79, 85, 89, 110, 111, 114, 115, 119, 129, 130, 133, 134, 135, 136, 137, 138, 140, 141, 142, 143, 144, 146, 148, 149, 150, 152, 153, 157, 159, 162, 163, 168, 170, 173, 180, 181, 183, 185, 191, 192, 193, 194, 195, 196, 197, 198, 199, 201, 203, 204, 206, 208, 213, 215
Salinity, 63, 67, 68, 71, 197 Santa Barbara Urban Hydrograph
SBUH, 19, 53, 55 Scour, 80, 81, 84, 204 Sediment, 15, 24, 29, 33, 63, 64, 65, 66, 69,
70, 73, 78, 79, 80, 81, 82, 85, 87, 89, 90,
92, 98, 99, 100, 101, 109, 111, 145, 146, 150, 152, 153, 154, 156, 159, 161, 163, 165, 167, 170, 171, 172, 173, 174, 176, 177, 179, 189, 190, 191, 192, 193, 195, 197, 201, 203, 215
Sediment Supply, 79 Sedimentation, 70, 89, 104, 145, 146, 148,
149, 167, 170, 176, 200 Sight Distance Triangle, 182 SLOPES IV, 3, 42, 82 STIP, 5, 7, 8, 13, 14, 37, 198, 202 Stochastic Empirical Loading and Dilution
Model SELDM, 133, 138, 141, 202
Stormwater Management Plan, i, 9, 16, 23, 24, 130, 186, 198, 202, 214
StreamStats, 116, 117, 125, 126 Time of Concentration, 19, 50, 54 Total Maximum Daily Load
TMDL, 14, 115, 133, 135, 199, 202, 214, 215
TR-55, 53, 55 Transport, Pollutant, 68 UIC Registration, 33 Water Resource Impact Assessment
WRIA, i, 18 Water Resources Impact Assessment
WRIA, 8, 18, 19, 20, 23, 84, 113, 116, 118, 200, 202, 205
Wet Ponds, 145, 169, 174, 175, 200 Wet Vault, 169, 176 Wetland Delineation, iii, 110, 215, 216

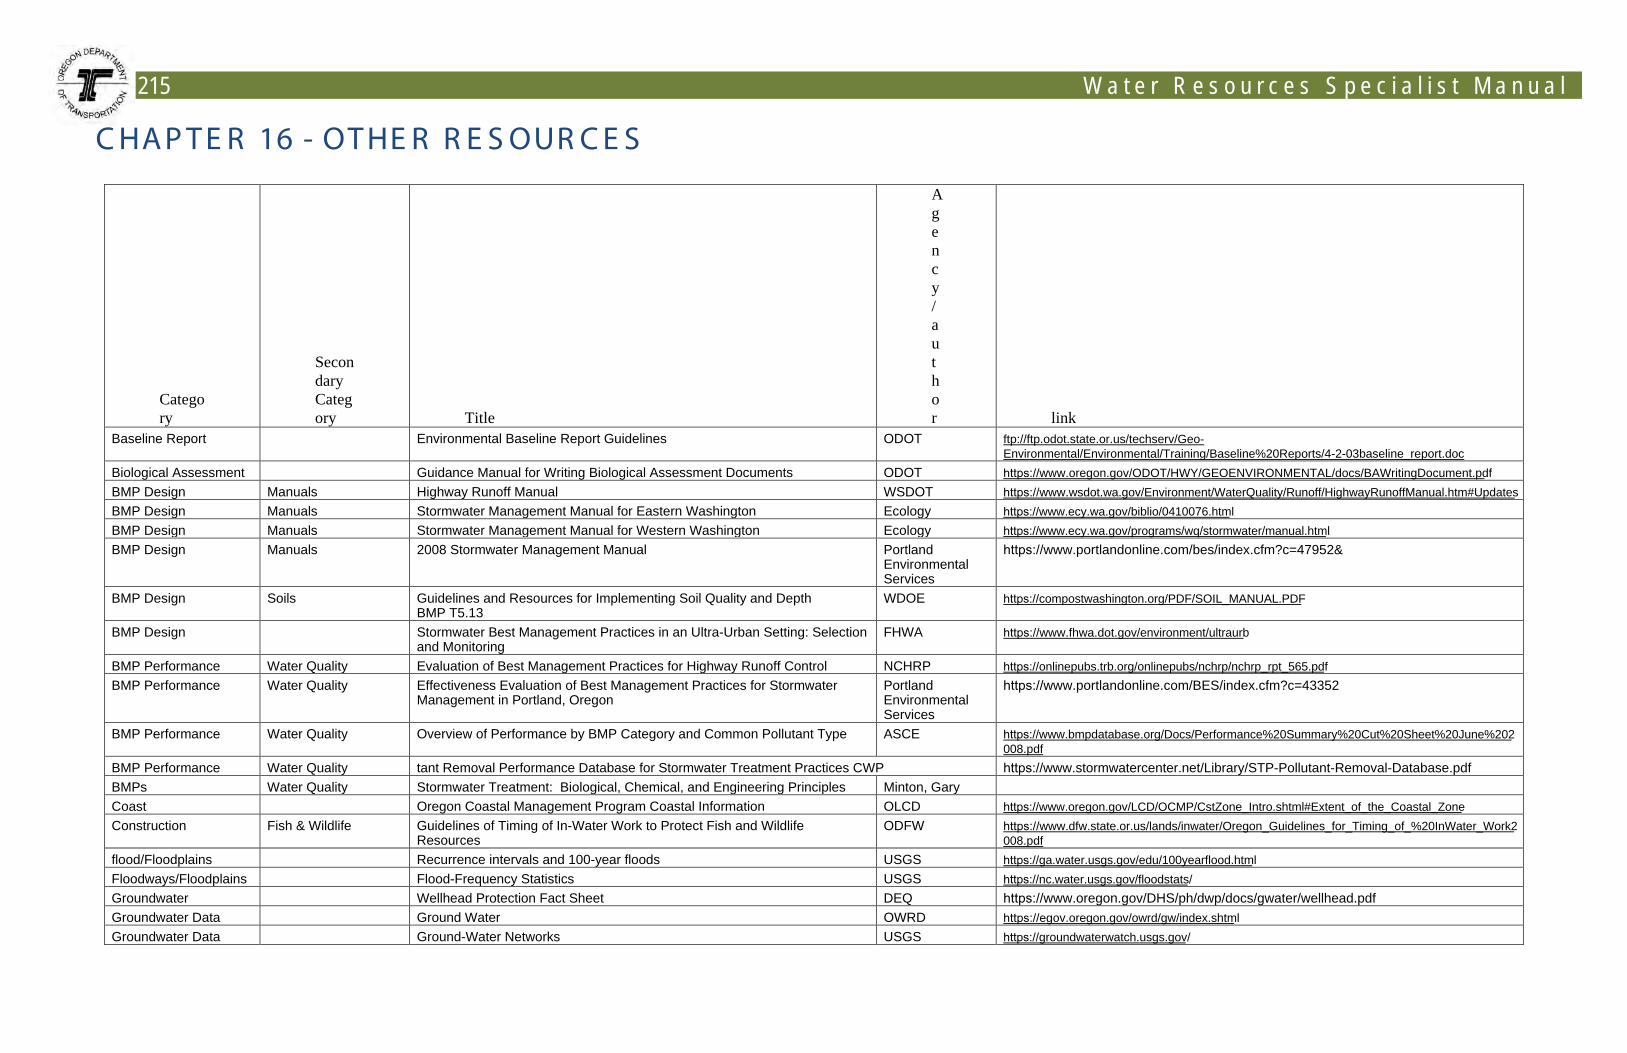
215 W a t e r R e s o u r c e s S p e c i a l i s t M a n u a l
C HA P T E R 16 - OT HE R R E S OUR C E S
Category
Secondary Category Title
Agency/author link
Baseline Report Environmental Baseline Report Guidelines ODOT ftp://ftp.odot.state.or.us/techserv/Geo-Environmental/Environmental/Training/Baseline%20Reports/4-2-03baseline_report.doc
Biological Assessment Guidance Manual for Writing Biological Assessment Documents ODOT https://www.oregon.gov/ODOT/HWY/GEOENVIRONMENTAL/docs/BAWritingDocument.pdf BMP Design Manuals Highway Runoff Manual WSDOT https://www.wsdot.wa.gov/Environment/WaterQuality/Runoff/HighwayRunoffManual.htm#Updates BMP Design Manuals Stormwater Management Manual for Eastern Washington Ecology https://www.ecy.wa.gov/biblio/0410076.html BMP Design Manuals Stormwater Management Manual for Western Washington Ecology https://www.ecy.wa.gov/programs/wq/stormwater/manual.html BMP Design Manuals 2008 Stormwater Management Manual Portland
Environmental Services
https://www.portlandonline.com/bes/index.cfm?c=47952&
BMP Design Soils Guidelines and Resources for Implementing Soil Quality and Depth BMP T5.13
WDOE https://compostwashington.org/PDF/SOIL_MANUAL.PDF
BMP Design Stormwater Best Management Practices in an Ultra-Urban Setting: Selection and Monitoring
FHWA https://www.fhwa.dot.gov/environment/ultraurb
BMP Performance Water Quality Evaluation of Best Management Practices for Highway Runoff Control NCHRP https://onlinepubs.trb.org/onlinepubs/nchrp/nchrp_rpt_565.pdf BMP Performance Water Quality Effectiveness Evaluation of Best Management Practices for Stormwater
Management in Portland, Oregon Portland Environmental Services
https://www.portlandonline.com/BES/index.cfm?c=43352
BMP Performance Water Quality Overview of Performance by BMP Category and Common Pollutant Type ASCE https://www.bmpdatabase.org/Docs/Performance%20Summary%20Cut%20Sheet%20June%202008.pdf
BMP Performance Water Quality tant Removal Performance Database for Stormwater Treatment Practices CWP https://www.stormwatercenter.net/Library/STP-Pollutant-Removal-Database.pdf BMPs Water Quality Stormwater Treatment: Biological, Chemical, and Engineering Principles Minton, Gary Coast Oregon Coastal Management Program Coastal Information OLCD https://www.oregon.gov/LCD/OCMP/CstZone_Intro.shtml#Extent_of_the_Coastal_Zone Construction Fish & Wildlife Guidelines of Timing of In-Water Work to Protect Fish and Wildlife
Resources ODFW https://www.dfw.state.or.us/lands/inwater/Oregon_Guidelines_for_Timing_of_%20InWater_Work2
008.pdfflood/Floodplains Recurrence intervals and 100-year floods USGS https://ga.water.usgs.gov/edu/100yearflood.html Floodways/Floodplains Flood-Frequency Statistics USGS https://nc.water.usgs.gov/floodstats/ Groundwater Wellhead Protection Fact Sheet DEQ https://www.oregon.gov/DHS/ph/dwp/docs/gwater/wellhead.pdf Groundwater Data Ground Water OWRD https://egov.oregon.gov/owrd/gw/index.shtml Groundwater Data Ground-Water Networks USGS https://groundwaterwatch.usgs.gov/
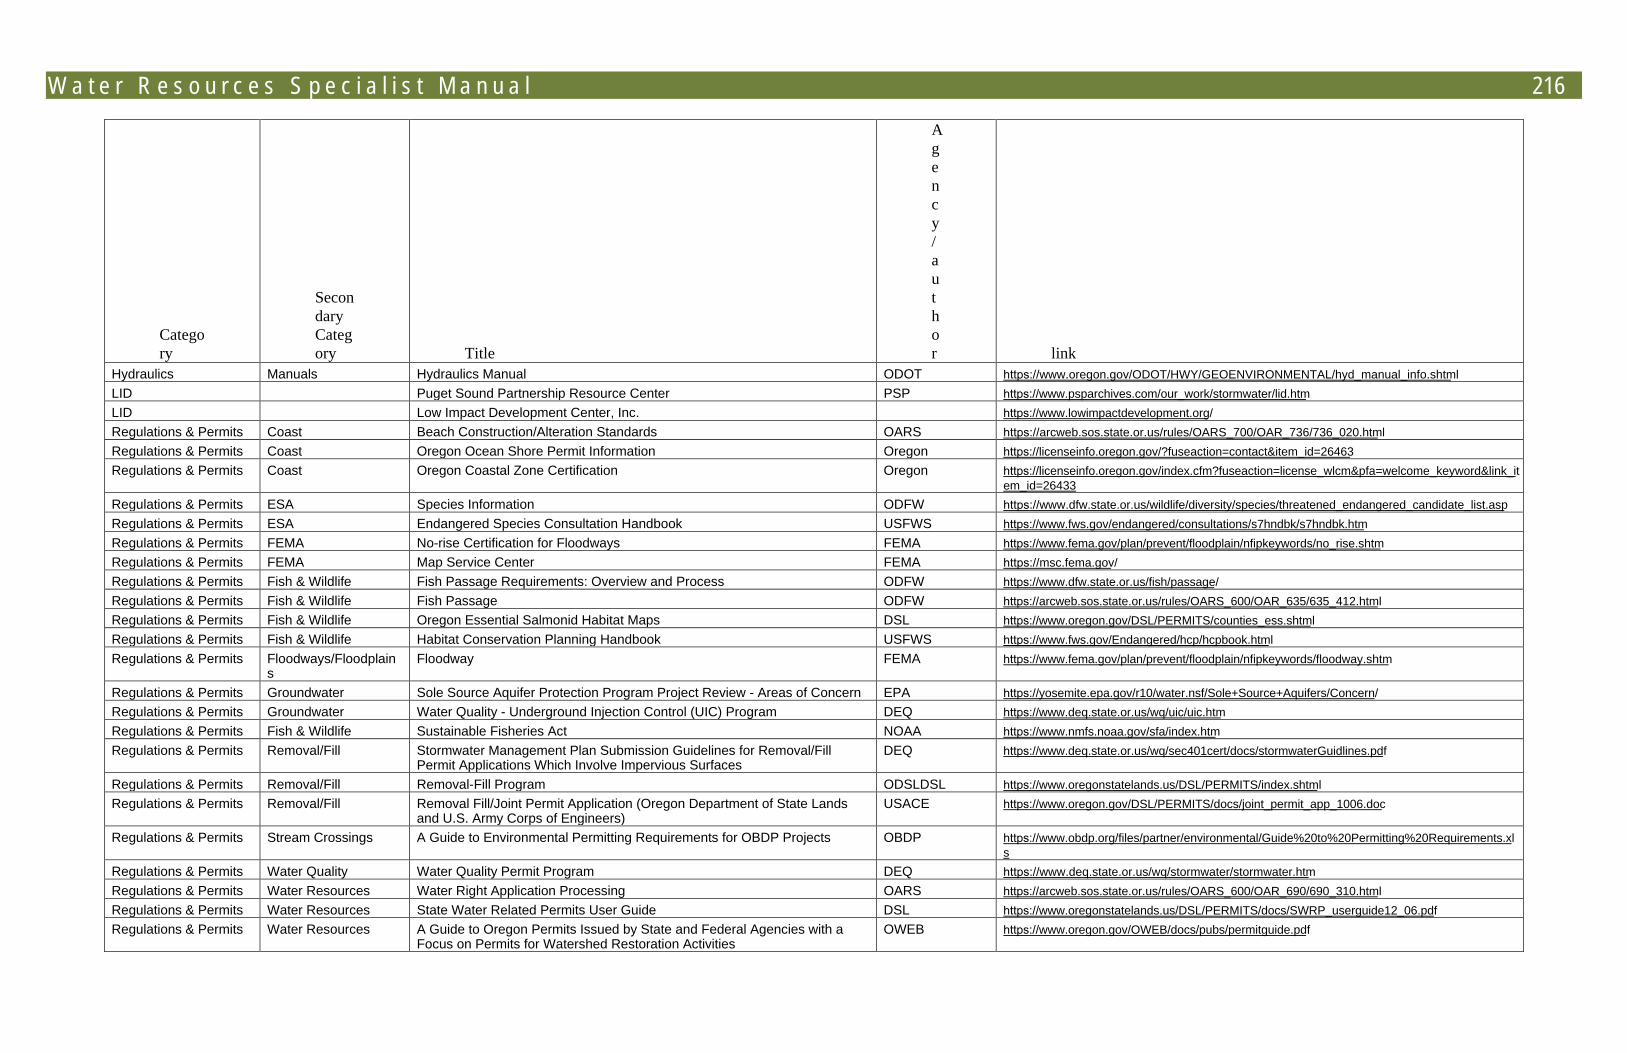
W a t e r R e s o u r c e s S p e c i a l i s t M a n u a l 216
Category
Secondary Category Title
Agency/author link
Hydraulics Manuals Hydraulics Manual ODOT https://www.oregon.gov/ODOT/HWY/GEOENVIRONMENTAL/hyd_manual_info.shtml LID Puget Sound Partnership Resource Center PSP https://www.psparchives.com/our_work/stormwater/lid.htm LID Low Impact Development Center, Inc. https://www.lowimpactdevelopment.org/ Regulations & Permits Coast Beach Construction/Alteration Standards OARS https://arcweb.sos.state.or.us/rules/OARS_700/OAR_736/736_020.html Regulations & Permits Coast Oregon Ocean Shore Permit Information Oregon https://licenseinfo.oregon.gov/?fuseaction=contact&item_id=26463 Regulations & Permits Coast Oregon Coastal Zone Certification Oregon https://licenseinfo.oregon.gov/index.cfm?fuseaction=license_wlcm&pfa=welcome_keyword&link_it
em_id=26433 Regulations & Permits ESA Species Information ODFW https://www.dfw.state.or.us/wildlife/diversity/species/threatened_endangered_candidate_list.asp Regulations & Permits ESA Endangered Species Consultation Handbook USFWS https://www.fws.gov/endangered/consultations/s7hndbk/s7hndbk.htm Regulations & Permits FEMA No-rise Certification for Floodways FEMA https://www.fema.gov/plan/prevent/floodplain/nfipkeywords/no_rise.shtm Regulations & Permits FEMA Map Service Center FEMA https://msc.fema.gov/ Regulations & Permits Fish & Wildlife Fish Passage Requirements: Overview and Process ODFW https://www.dfw.state.or.us/fish/passage/ Regulations & Permits Fish & Wildlife Fish Passage ODFW https://arcweb.sos.state.or.us/rules/OARS_600/OAR_635/635_412.html Regulations & Permits Fish & Wildlife Oregon Essential Salmonid Habitat Maps DSL https://www.oregon.gov/DSL/PERMITS/counties_ess.shtml Regulations & Permits Fish & Wildlife Habitat Conservation Planning Handbook USFWS https://www.fws.gov/Endangered/hcp/hcpbook.html Regulations & Permits Floodways/Floodplain
s Floodway FEMA https://www.fema.gov/plan/prevent/floodplain/nfipkeywords/floodway.shtm
Regulations & Permits Groundwater Sole Source Aquifer Protection Program Project Review - Areas of Concern EPA https://yosemite.epa.gov/r10/water.nsf/Sole+Source+Aquifers/Concern/ Regulations & Permits Groundwater Water Quality - Underground Injection Control (UIC) Program DEQ https://www.deq.state.or.us/wq/uic/uic.htm Regulations & Permits Fish & Wildlife Sustainable Fisheries Act NOAA https://www.nmfs.noaa.gov/sfa/index.htm Regulations & Permits Removal/Fill Stormwater Management Plan Submission Guidelines for Removal/Fill
Permit Applications Which Involve Impervious Surfaces DEQ https://www.deq.state.or.us/wq/sec401cert/docs/stormwaterGuidlines.pdf
Regulations & Permits Removal/Fill Removal-Fill Program ODSLDSL https://www.oregonstatelands.us/DSL/PERMITS/index.shtml Regulations & Permits Removal/Fill Removal Fill/Joint Permit Application (Oregon Department of State Lands
and U.S. Army Corps of Engineers) USACE https://www.oregon.gov/DSL/PERMITS/docs/joint_permit_app_1006.doc
Regulations & Permits Stream Crossings A Guide to Environmental Permitting Requirements for OBDP Projects OBDP https://www.obdp.org/files/partner/environmental/Guide%20to%20Permitting%20Requirements.xls
Regulations & Permits Water Quality Water Quality Permit Program DEQ https://www.deq.state.or.us/wq/stormwater/stormwater.htm Regulations & Permits Water Resources Water Right Application Processing OARS https://arcweb.sos.state.or.us/rules/OARS_600/OAR_690/690_310.html Regulations & Permits Water Resources State Water Related Permits User Guide DSL https://www.oregonstatelands.us/DSL/PERMITS/docs/SWRP_userguide12_06.pdf Regulations & Permits Water Resources A Guide to Oregon Permits Issued by State and Federal Agencies with a
Focus on Permits for Watershed Restoration Activities OWEB https://www.oregon.gov/OWEB/docs/pubs/permitguide.pdf
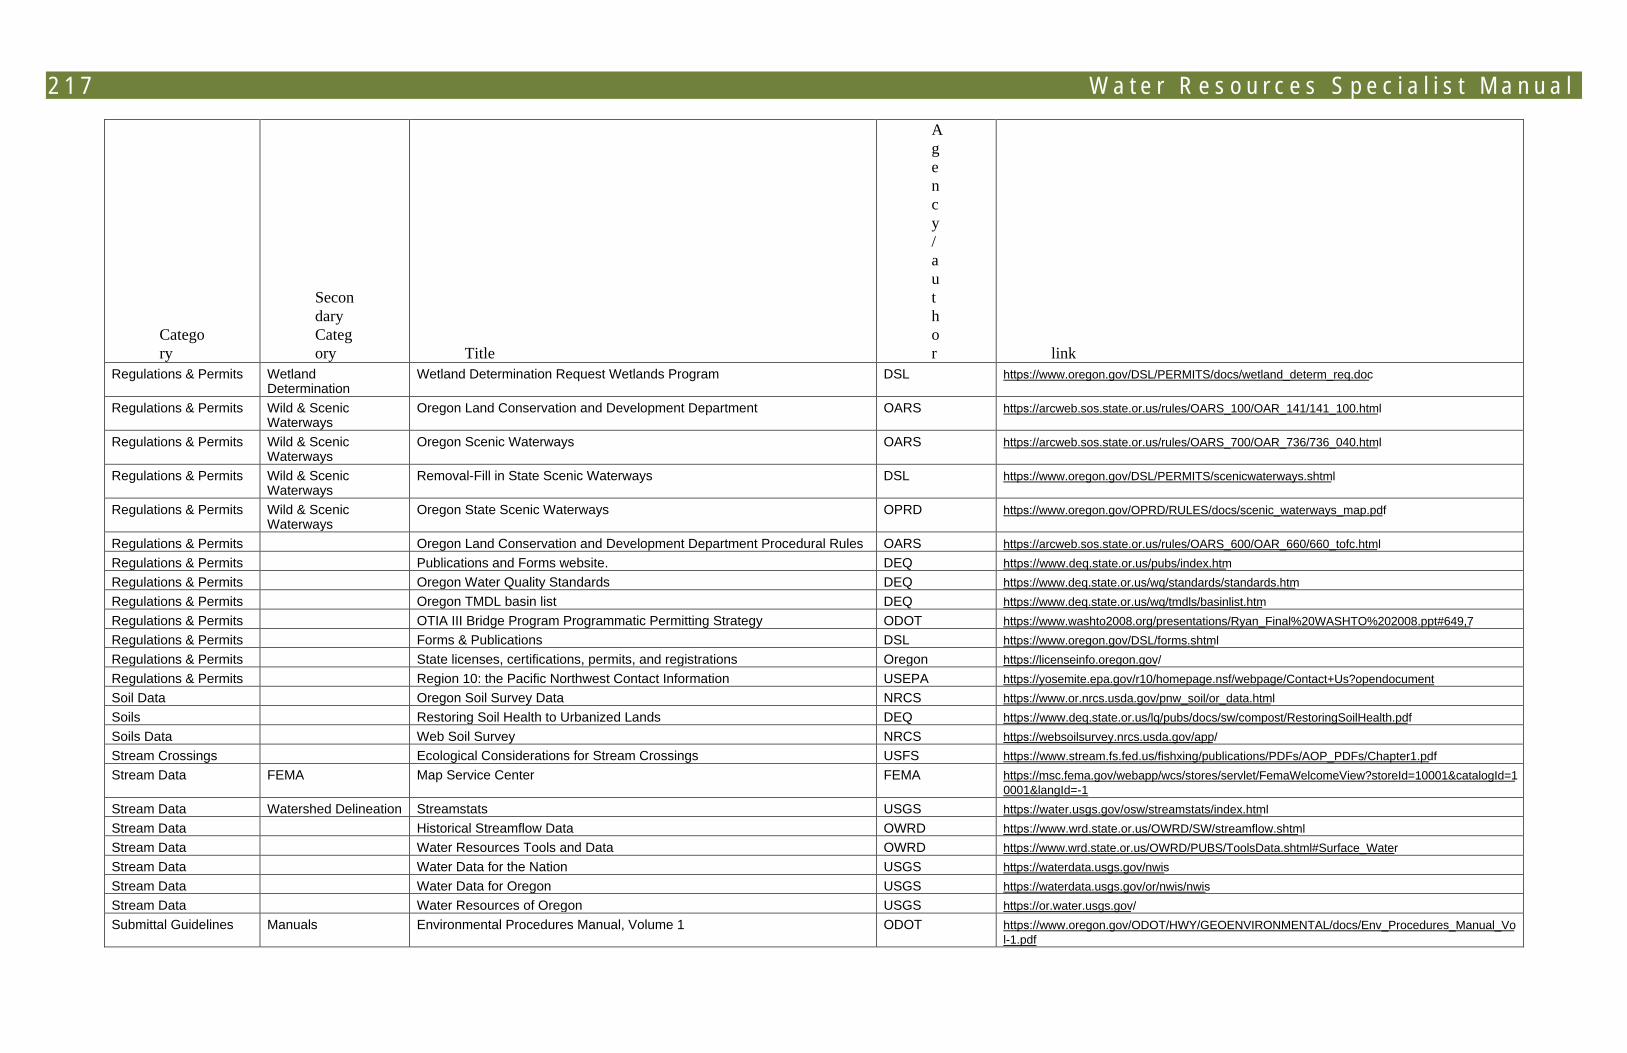
2 1 7 W a t e r R e s o u r c e s S p e c i a l i s t M a n u a l
Category
Secondary Category Title
Agency/author link
Regulations & Permits Wetland Determination
Wetland Determination Request Wetlands Program DSL https://www.oregon.gov/DSL/PERMITS/docs/wetland_determ_req.doc
Regulations & Permits Wild & Scenic Waterways
Oregon Land Conservation and Development Department OARS https://arcweb.sos.state.or.us/rules/OARS_100/OAR_141/141_100.html
Regulations & Permits Wild & Scenic Waterways
Oregon Scenic Waterways OARS https://arcweb.sos.state.or.us/rules/OARS_700/OAR_736/736_040.html
Regulations & Permits Wild & Scenic Waterways
Removal-Fill in State Scenic Waterways DSL https://www.oregon.gov/DSL/PERMITS/scenicwaterways.shtml
Regulations & Permits Wild & Scenic Waterways
Oregon State Scenic Waterways OPRD https://www.oregon.gov/OPRD/RULES/docs/scenic_waterways_map.pdf
Regulations & Permits Oregon Land Conservation and Development Department Procedural Rules OARS https://arcweb.sos.state.or.us/rules/OARS_600/OAR_660/660_tofc.html Regulations & Permits Publications and Forms website. DEQ https://www.deq.state.or.us/pubs/index.htm Regulations & Permits Oregon Water Quality Standards DEQ https://www.deq.state.or.us/wq/standards/standards.htm Regulations & Permits Oregon TMDL basin list DEQ https://www.deq.state.or.us/wq/tmdls/basinlist.htm Regulations & Permits OTIA III Bridge Program Programmatic Permitting Strategy ODOT https://www.washto2008.org/presentations/Ryan_Final%20WASHTO%202008.ppt#649,7 Regulations & Permits Forms & Publications DSL https://www.oregon.gov/DSL/forms.shtml Regulations & Permits State licenses, certifications, permits, and registrations Oregon https://licenseinfo.oregon.gov/ Regulations & Permits Region 10: the Pacific Northwest Contact Information USEPA https://yosemite.epa.gov/r10/homepage.nsf/webpage/Contact+Us?opendocument Soil Data Oregon Soil Survey Data NRCS https://www.or.nrcs.usda.gov/pnw_soil/or_data.html Soils Restoring Soil Health to Urbanized Lands DEQ https://www.deq.state.or.us/lq/pubs/docs/sw/compost/RestoringSoilHealth.pdf Soils Data Web Soil Survey NRCS https://websoilsurvey.nrcs.usda.gov/app/ Stream Crossings Ecological Considerations for Stream Crossings USFS https://www.stream.fs.fed.us/fishxing/publications/PDFs/AOP_PDFs/Chapter1.pdf Stream Data FEMA Map Service Center FEMA https://msc.fema.gov/webapp/wcs/stores/servlet/FemaWelcomeView?storeId=10001&catalogId=1
0001&langId=-1 Stream Data Watershed Delineation Streamstats USGS https://water.usgs.gov/osw/streamstats/index.html Stream Data Historical Streamflow Data OWRD https://www.wrd.state.or.us/OWRD/SW/streamflow.shtml Stream Data Water Resources Tools and Data OWRD https://www.wrd.state.or.us/OWRD/PUBS/ToolsData.shtml#Surface_Water Stream Data Water Data for the Nation USGS https://waterdata.usgs.gov/nwis Stream Data Water Data for Oregon USGS https://waterdata.usgs.gov/or/nwis/nwis Stream Data Water Resources of Oregon USGS https://or.water.usgs.gov/ Submittal Guidelines Manuals Environmental Procedures Manual, Volume 1 ODOT https://www.oregon.gov/ODOT/HWY/GEOENVIRONMENTAL/docs/Env_Procedures_Manual_Vo
l-1.pdf
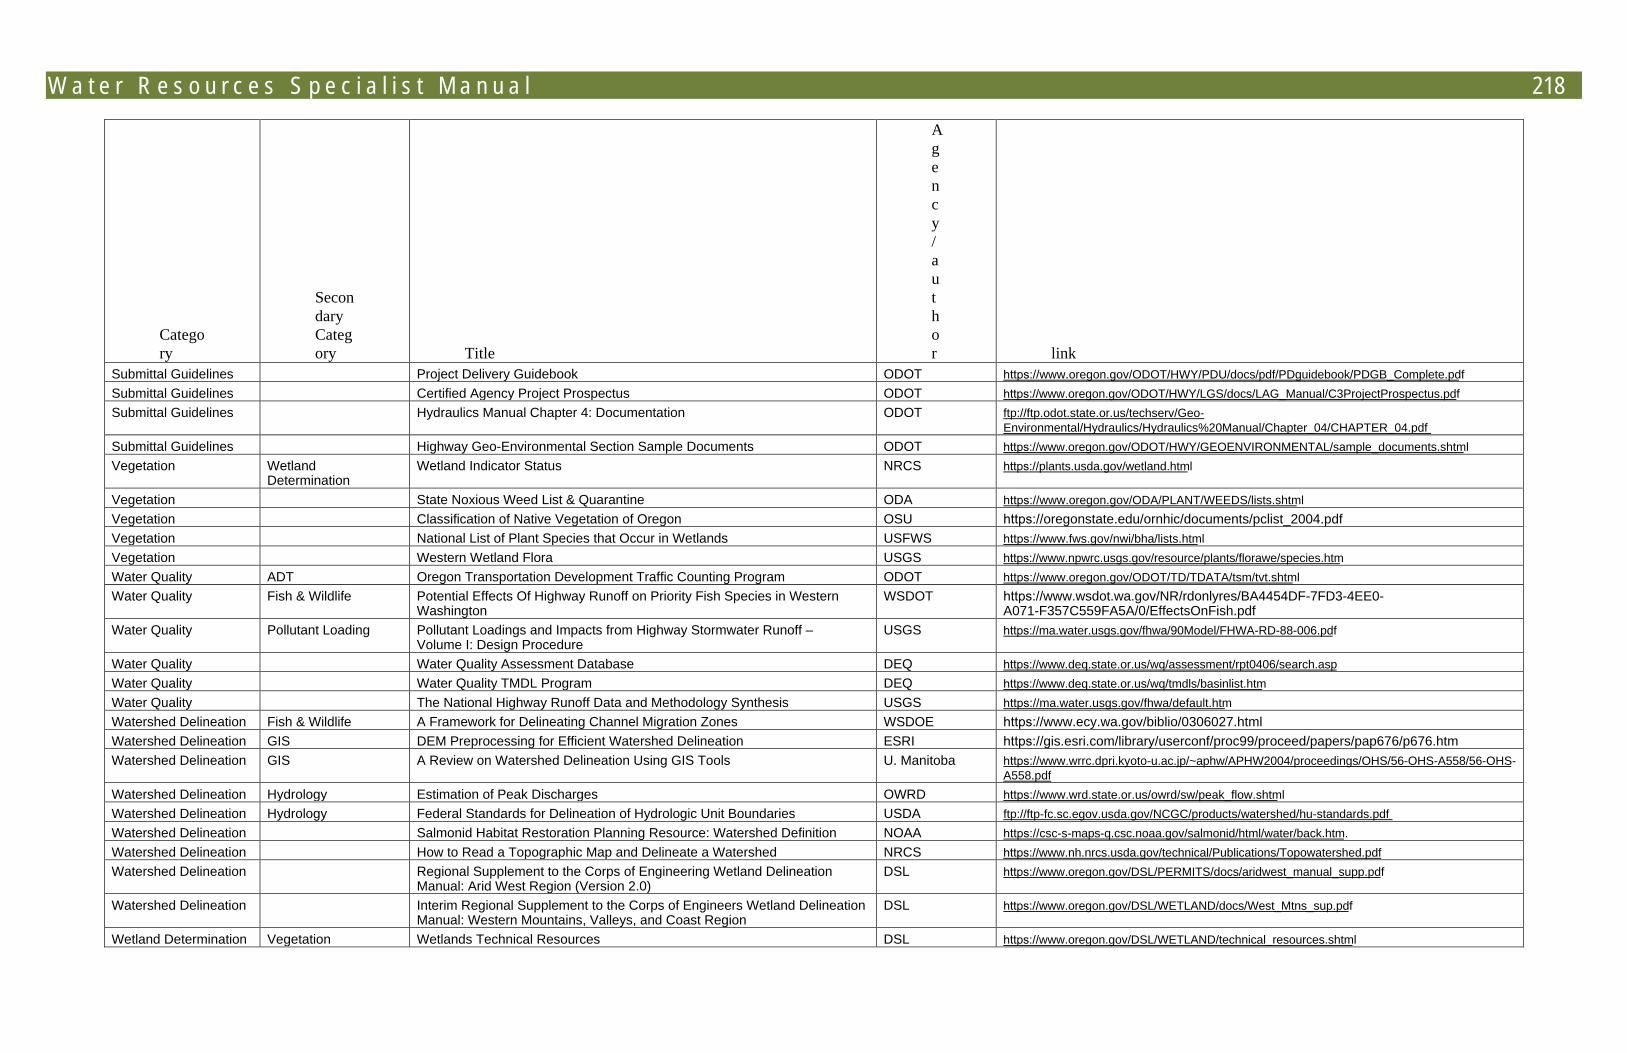
W a t e r R e s o u r c e s S p e c i a l i s t M a n u a l 218
Category
Secondary Category Title
Agency/author link
Submittal Guidelines Project Delivery Guidebook ODOT https://www.oregon.gov/ODOT/HWY/PDU/docs/pdf/PDguidebook/PDGB_Complete.pdf Submittal Guidelines Certified Agency Project Prospectus ODOT https://www.oregon.gov/ODOT/HWY/LGS/docs/LAG_Manual/C3ProjectProspectus.pdf Submittal Guidelines Hydraulics Manual Chapter 4: Documentation ODOT ftp://ftp.odot.state.or.us/techserv/Geo-
Environmental/Hydraulics/Hydraulics%20Manual/Chapter_04/CHAPTER_04.pdf Submittal Guidelines Highway Geo-Environmental Section Sample Documents ODOT https://www.oregon.gov/ODOT/HWY/GEOENVIRONMENTAL/sample_documents.shtml Vegetation Wetland
Determination Wetland Indicator Status NRCS https://plants.usda.gov/wetland.html
Vegetation State Noxious Weed List & Quarantine ODA https://www.oregon.gov/ODA/PLANT/WEEDS/lists.shtml Vegetation Classification of Native Vegetation of Oregon OSU https://oregonstate.edu/ornhic/documents/pclist_2004.pdf Vegetation National List of Plant Species that Occur in Wetlands USFWS https://www.fws.gov/nwi/bha/lists.html Vegetation Western Wetland Flora USGS https://www.npwrc.usgs.gov/resource/plants/florawe/species.htm Water Quality ADT Oregon Transportation Development Traffic Counting Program ODOT https://www.oregon.gov/ODOT/TD/TDATA/tsm/tvt.shtml Water Quality Fish & Wildlife Potential Effects Of Highway Runoff on Priority Fish Species in Western
Washington WSDOT https://www.wsdot.wa.gov/NR/rdonlyres/BA4454DF-7FD3-4EE0-
A071-F357C559FA5A/0/EffectsOnFish.pdf Water Quality Pollutant Loading Pollutant Loadings and Impacts from Highway Stormwater Runoff –
Volume I: Design Procedure USGS https://ma.water.usgs.gov/fhwa/90Model/FHWA-RD-88-006.pdf
Water Quality Water Quality Assessment Database DEQ https://www.deq.state.or.us/wq/assessment/rpt0406/search.asp Water Quality Water Quality TMDL Program DEQ https://www.deq.state.or.us/wq/tmdls/basinlist.htm Water Quality The National Highway Runoff Data and Methodology Synthesis USGS https://ma.water.usgs.gov/fhwa/default.htm Watershed Delineation Fish & Wildlife A Framework for Delineating Channel Migration Zones WSDOE https://www.ecy.wa.gov/biblio/0306027.html Watershed Delineation GIS DEM Preprocessing for Efficient Watershed Delineation ESRI https://gis.esri.com/library/userconf/proc99/proceed/papers/pap676/p676.htm Watershed Delineation GIS A Review on Watershed Delineation Using GIS Tools U. Manitoba https://www.wrrc.dpri.kyoto-u.ac.jp/~aphw/APHW2004/proceedings/OHS/56-OHS-A558/56-OHS-
A558.pdf Watershed Delineation Hydrology Estimation of Peak Discharges OWRD https://www.wrd.state.or.us/owrd/sw/peak_flow.shtml Watershed Delineation Hydrology Federal Standards for Delineation of Hydrologic Unit Boundaries USDA ftp://ftp-fc.sc.egov.usda.gov/NCGC/products/watershed/hu-standards.pdf Watershed Delineation Salmonid Habitat Restoration Planning Resource: Watershed Definition NOAA https://csc-s-maps-q.csc.noaa.gov/salmonid/html/water/back.htm. Watershed Delineation How to Read a Topographic Map and Delineate a Watershed NRCS https://www.nh.nrcs.usda.gov/technical/Publications/Topowatershed.pdf Watershed Delineation Regional Supplement to the Corps of Engineering Wetland Delineation
Manual: Arid West Region (Version 2.0) DSL https://www.oregon.gov/DSL/PERMITS/docs/aridwest_manual_supp.pdf
Watershed Delineation Interim Regional Supplement to the Corps of Engineers Wetland Delineation Manual: Western Mountains, Valleys, and Coast Region
DSL https://www.oregon.gov/DSL/WETLAND/docs/West_Mtns_sup.pdf
Wetland Determination Vegetation Wetlands Technical Resources DSL https://www.oregon.gov/DSL/WETLAND/technical_resources.shtml
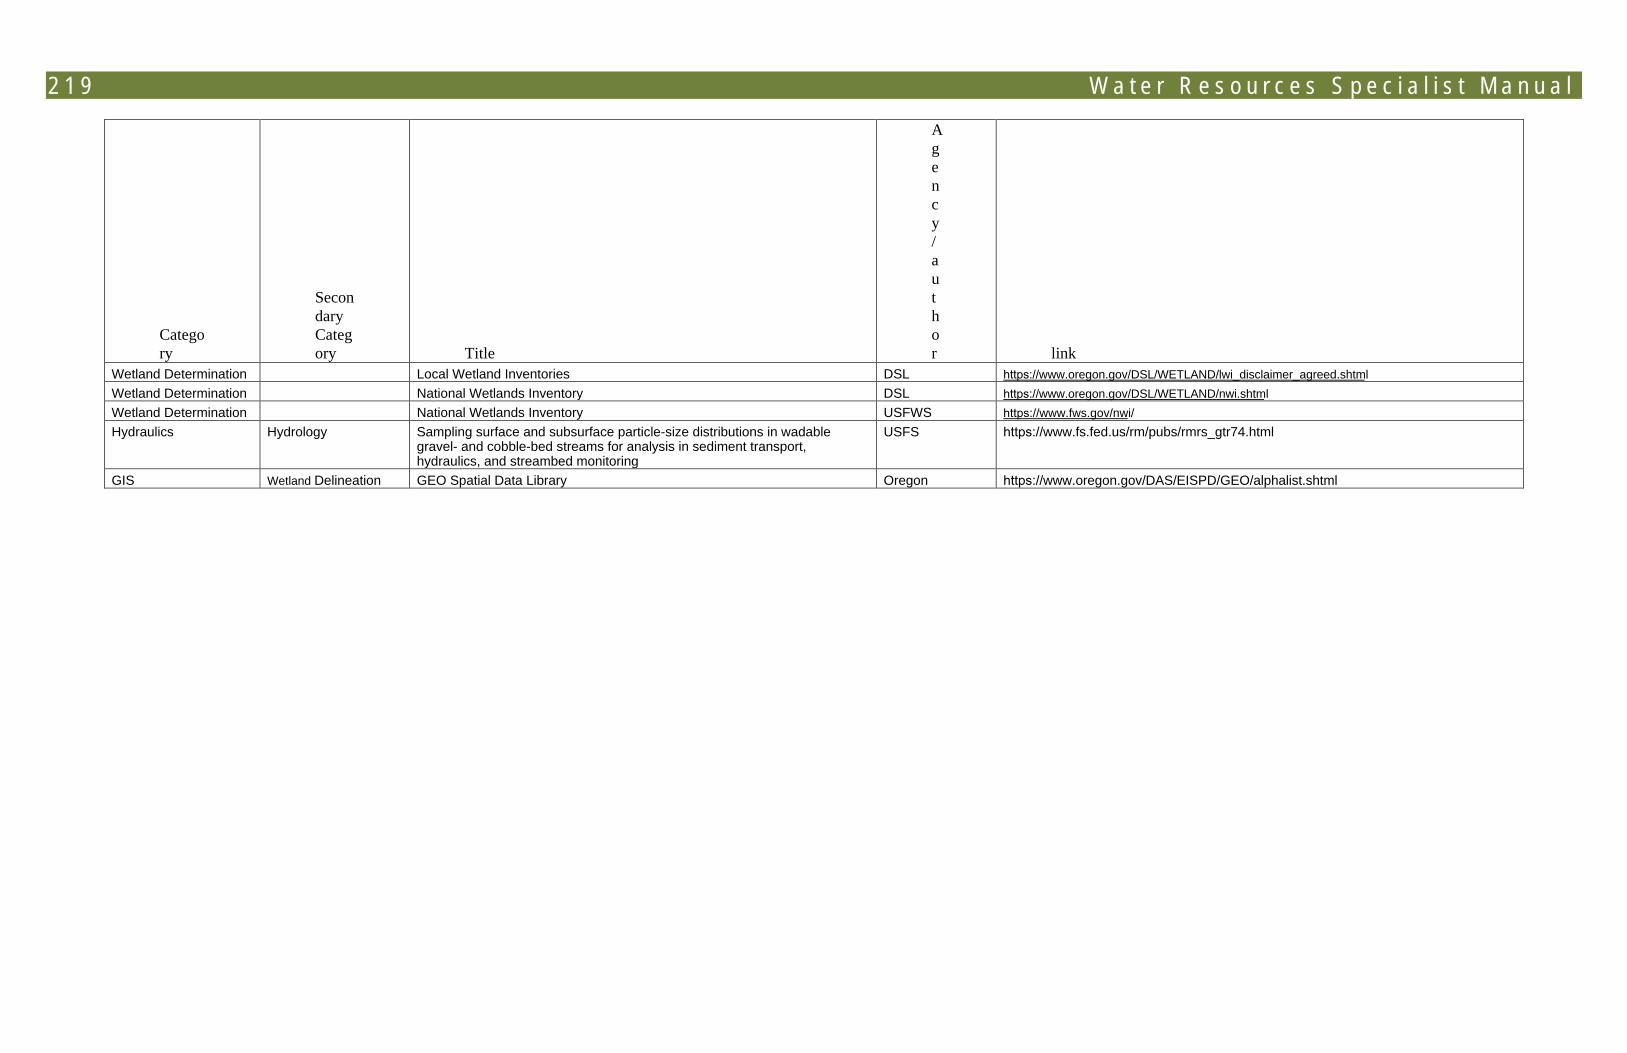
2 1 9 W a t e r R e s o u r c e s S p e c i a l i s t M a n u a l
Category
Secondary Category Title
Agency/author link
Wetland Determination Local Wetland Inventories DSL https://www.oregon.gov/DSL/WETLAND/lwi_disclaimer_agreed.shtml Wetland Determination National Wetlands Inventory DSL https://www.oregon.gov/DSL/WETLAND/nwi.shtml Wetland Determination National Wetlands Inventory USFWS https://www.fws.gov/nwi/ Hydraulics Hydrology Sampling surface and subsurface particle-size distributions in wadable
gravel- and cobble-bed streams for analysis in sediment transport, hydraulics, and streambed monitoring
USFS https://www.fs.fed.us/rm/pubs/rmrs_gtr74.html
GIS Wetland Delineation GEO Spatial Data Library Oregon https://www.oregon.gov/DAS/EISPD/GEO/alphalist.shtml